Embed Size (px)
Citation preview

Building Disaster Resilience to Natural Hazards inSub-Saharan African Regions, Countries and Communities
This project is funded by the European Union
DISASTER RISK PROFILE Flood
AngolaDrought


© CIMA Research FoundationInternational Centre on Environmental Monitoring Via Magliotto 2. 17100 Savona. ItalyAugust 2018
Africa Disaster Risk Profiles are co-financed by the EU-funded ACP-EU Natural Disaster Risk Reduction Program and the ACP-EU Africa Disaster Risk Financing Program, managed by UNISDR.
DISCLAIMERThis document is the product of work performed by CIMA Research Foundation staff. The views expressed in this publication do not necessarily reflect the views of the UNISDR or the EU. The designations employed and the presentation of the material do not imply the expression of any opinion whatsoever on the part of the UNISDR or the EU concerning the legal status of any country, territory, city or area, or of its authorities, or concerning the delineation of its frontiers or boundaries.
RIGHTS AND PERMISSIONSThe material in this work is subject to copyright. Because UNISDR and CIMA Research Foundation encourage dissemination of its knowledge, this work may be reproduced, in whole or in part, for noncommercial purposes as long as full attribution to this work is given. Citation: CIMA, UNISDR (2018). Angola Disaster Risk Profile.
Any queries on rights and licenses, including subsidiary rights, should be addressed to CIMA Research Foundation:Via Armando Magliotto, 2 - 17100 Savona - Italy; Phone: +39 019230271 - Fax: +39 01923027240 E-mail: [email protected]
Design and layout: CIMA Research FoundationPrinting: Jollygraf, ItalyVideo Production: Don’t Movie, Italy
In collaboration with:
AuthorsRoberto Rudari [1]
Sjaak Conijn [3]
Silvia De Angeli [1]
Hans de Moel [2]
Luca Ferraris [1]
Elisabetta Fiori [1]
Tatiana Ghizzoni [1]
Isabel Gomes [1]
Marco Massabò [1]
Lauro Rossi [1]
Eva Trasforini [1]
Scientific TeamNazan An [5]
Chiara Arrighi [1;4]
Valerio Basso [1]
Guido Biondi [1]
Alessandro Burastero [1]
Lorenzo Campo [1]
Fabio Castelli [1;4]
Mirko D'Andrea [1]
Fabio Delogu [1]
Giulia Ercolani[1;4]
Simone Gabellani [1]
Alessandro Masoero [1]
Ben Rutgers [3]
Franco Siccardi [1]
Francesco Silvestro [1]
Andrea Tessore [1]
Tufan Turp [5]
Marthe Wens [2]
Editing and GraphicsSilvia De Stefano [1]
Andrew Eddy, CanadaRita Visigalli [1]
Supporting TeamSimona Pozzati [1]
Luisa Colla [1]
Monica Corvarola [1]
Iain Logan [6]
Rich Parker [7]
Elisa Poggi [1]
Martino Prestini [1]
With the support of the UNISDRRegional O�ce for Africa
PROJECT TEAM
CIMA Research Foundation [1]
Vrije Universiteit Amsterdam [2]
Wageningen University & Research [3]
Università di Firenze [4]
Bogazici University [5]
GEG [6]
Training in Aid [7]
INDEX
Introduction..............................................................................................................................P.4
Probabilistic Risk Profile: Methodology......................................................P.5
Probabilistic Risk Profile: Components.......................................................P.6
Country Socio-Economic Outolook.................................................................P.7
Country Climate Outlook............................................................................................P.8
Sendai Driven Presentation..................................................................................P.10
Results Floods......................................................................................................................P.11
Results Droughts..............................................................................................................P.15
Probabilistic Risk Assessment for Risk Management...............P.19
Glossary......................................................................................................................................P.20
References...............................................................................................................................P.21

I
P.4
INTRODUCTION
Disasters are on the rise, both in terms of frequency and magnitude.From 2005-2015, more than 700 thousand people worldwide have lost their lives due to disasters that have affected over 1.5 billion people, with women, children and people in vulnerable situations disproportionately affected. The total economic loss was more than US$ 1.3 trillion. Disasters inordinately affect lower-income countries. Sub-Saharan Africa, where two-thirds of the world’s Least Developed Countries are located, is prone to recurrent disasters, largely due to natural hazards and climate change. The Sendai Framework for Disaster Risk Reduction 2015 – 2030 emphasises the need to manage risk rather than disasters, a theme already present in its predecessors the Yokohama Strategy and the Hyogo Framework for Disaster Risk Reduction. Specifically, the Sendai Framework calls for strong political leadership, commitment, and involvement of all stakeholders at all levels from local to national and international, with a view to “prevent new and reduce existing disaster risk through the implementation of integrated and inclusive economic, structural, legal, social, health, cultural, educational, environmental, technological, political, and institutional measures that prevent and reduce hazard exposure and vulnerability to disaster, increase preparedness for response and recovery, and thus strengthen resilience”. Understanding disaster risk is the Sendai Framework’s first priority for action: “policies and practices for disaster risk management should be based on an understanding of disaster risk in all its dimensions of vulnerability, capacity, exposure of persons and assets, hazard characteristics and the environment.” The outputs of disaster risk assessment should be main drivers of the disaster risk management cycle, including sustainable development strategies, climate change adaptation planning, national disaster risk reduction across all sectors, as well as emergency preparedness and response.
As part of the programme Building Disaster Resilience to Natural Hazards in Sub-Saharan African Regions, Countries and Communities, UNISDR engaged CIMA Research Foundation for the preparation of 16 Country Risk Profiles for Floods and Droughts for the following countries: Angola, Botswana, Cameroon, Equatorial Guinea, Gabon, Gambia, Ghana, Guinea Bissau, Kenya, Kingdom of Eswatini, Ivory Coast, Namibia, Rwanda, São Tomé and Príncipe, Tanzania, and Zambia.
The Country Risk Profiles provide a comprehensive view of hazard, risk and uncertainties for floods and droughts in a changing climate, with projections for the period 2050-2100. The risk assessment considers a large number of possible scenarios, their likelihood, and associated impacts. A significant amount of scientific information on hazard, exposure, and vulnerabilities has been used to simulate disaster risk.
The EU PROGRAMME “Building Disaster Resilience to Natural Hazards in Sub-Saharan African Regions, Countries and Communities”
In 2013, the European Union approved 80 million EUR financing for the programme - ‘Building Disaster Resilience to Natural Hazards in Sub-Saharan African Regions, Countries and Communities’. The programme is being implemented in Africa by four partners: the African Union Commission, the United Nations O�ce for Disaster Risk Reduction (UNISDR), the World Bank’s Global Facility for Disaster Reduction and Recovery (WB/GFDRR), and the African Development Bank’s ClimDev Special Fund (AfDB/CDSF). The programme provides analytical basis, tools and capacity, and accelerates the effective implementation of an African comprehensive disaster risk reduction and risk management framework.
ANGOLA DISASTER RISK PROFILE | INTRODUCTION
ANGOLA DISASTER RISK PROFILE

P.5
PROBABILISTIC RISK PROFILE: METHODOLOGY ANGOLA DISASTER RISK PROFILE
PROBABILISTIC RISK ASSESSMENT
Return Period [years]
Loss
[M
M$]
On average once in a decade
On average once in a lifetime
Very rareevents
100
700
1000
ANGOLA DISASTER RISK PROFILE | PROBABILISTIC RISK PROFILE
Understanding disaster risk is essential for sustainable development. Many different and complementary methods and tools are available for analyzing risk. These range from qualitative to semi-quantitative and quantitative methods: probabilistic risk analysis, deterministic or scenario analysis, historical analysis, and expert elicitation. This disaster risk profile for floods and droughts is based on probabilistic risk assessment. Awareness of possible perils that may threaten human lives, primarily derives from experience of past events. In theory, series of historical loss data long enough to be representative of all possible disastrous events that occurred in a portion of territory, would provide all necessary information for assessing future loss potential. Unfortunately, the availability of national historical information on catastrophic natural hazard events is limited, and data on the economic consequences are even less common.
A modelling approach is needed to best predict possible present and future scenarios, taking into consideration the spatial and temporal uncertainties involved in the analysed process. A realistic set of all possible hazardous events (scenarios) that may occur in a given region, including very rare, catastrophic events, is simulated. For each event, potential impacts are computed in terms of economic losses or number of people and assets affected, considering publicly available information on Hazard, Exposure, and Vulnerability. Finally statistics of losses are computed and summarized through proper quantitative economic risk metrics, such as: Annual Average Loss (AAL) and Probable Maximum Loss (PML).In computing the final metrics (PML, AAL) the uncertainties that permeate the different steps of the computations are explicitily quantified and taken into account: uncertainties in the hazard forcing, uncertainties in the exposure values and their vulnerabilities.
Average Annual Loss (AAL) is the expected loss per year, averaged over many years. While there may actually be little or no loss over a short period of time, the AAL also accounts for much larger losses that occur less frequently. As such, AAL represents the funds that would be required annually in order to cumulatively cover the average disaster loss over time. Probable Maximum Loss (PML) describes the maximum loss that could be expected corresponding to a given likelihood, expressed in terms of annual probability of exceedance or its reciprocal, the return period. For example in the figure below, the likelihood of a $US 100 million loss is on average once in a decade, a loss of $US 1 billion is considered a very rare event. Typically, PML is relevant to define the size of reserves that, for instance, insurance companies or a government should have available to manage losses.
The methodology is also used to simulate the impact of climate change (CCLM-Cosmo-Climate Limited-area Modelling, grid spacing 0.44° (about 50 km) and, future projections of population and GDP growth (SSP2, OECD Env-Growth model from IIASA SSP Database).Results are disaggregated by different sectors, using the same categories of Sendai Framework indicators: direct economic loss (C1), agricultural sector (C2), productive asset and service sector (C3), housing sector (C4), critical infrastructures and transportation (C5).
P.6
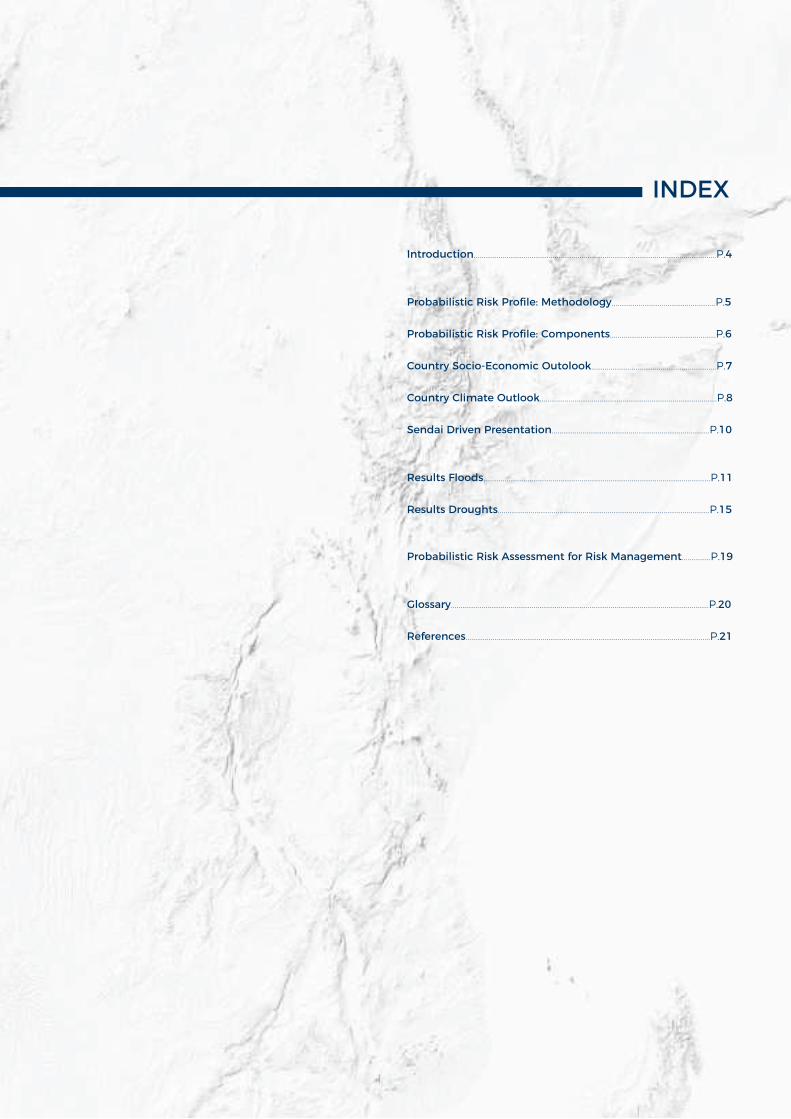
A modelling chain composed of climate, hydrological and hydraulic models using all the available information, in terms of rainfall, temperature, humidity, wind, and solar radiation, to best predict possible flood and drought scenarios. A set of mutually exclusive and collectively exhaustive possible hazard scenarios that may occur in a given region or country, including the most catastrophic ones, are generated and expressed in terms of frequency, extension of the affected area and intensity at different locations.
The direct losses on the different elements at risk are evaluated applying vulnerability functions, which link the hazard intensity to the expected loss (economic loss or number of affected people), considering also the associated uncertainty. Vulnerability functions are differentiated for each typology of exposed element and take into account local factors, such as typical constructive typologies for infrastructures or the crop seasonality for the agricultural production. For flood, vulnerability is a function of the water depth. The only exception is represented by agricultural production, for which it is a function of the season in which the flood is occurring. In the case of agricultural drought, the losses are computed in terms of lack of production for different crops from a nominal expected production. A similar approach is used for hydrological drought, when the loss of hydropower production is evaluated.
The losses caused by floods and droughts are evaluated on population, GDP and a series of critical sectors (education, health, transport, housing, and productive and agricultural sectors). The critical sectors are created clustering all the different components, which contribute to a specific function (e.g. the health sector is comprised of hospitals, clinics and dispensaries). Publicly available global and national data, properly generated, enable the location of these elements at high resolution, e.g. 90 meters or lower, for the whole country. The total number of people and the National GDP (in US$) are considered in both current (2016) and future (2050) scenarios. The critical sectors are characterized in terms of their economic value (in US$), using the most updated information available.
HAZARDprocess, phenomenon or human activity that may cause loss of life, injury or
other health impacts, property damage, social and
economic disruption or environmental degradation.
ANGOLA DISASTER RISK PROFILE | PROBABILISTIC RISK PROFILE
VULNERABILITYconditions determined by
physical, social, economic and environmental factors or
processes which increase the susceptibility of an individual,
a community, assets or systems to the impacts of
hazards.
EXPOSUREpeople, property, systems, or
other elements present in hazard zones that are thereby
subject to potential losses.
UNISDR terminology on Disaster Risk Reduction: https://www.unisdr.org/we/inform/publications/7817
PROBABILISTIC RISK PROFILE: RISK COMPONENTS ANGOLA DISASTER RISK PROFILE
Flood hazard map for 1 in a 100 years probability, the scale of blues represents different water depth values.
Exposure distribution, thedifferent colors representdifferent types of assets.

P.7
ANGOLAAREA : 1.246.700 Km2
POPULATION : 28.810.000 people
DENSITY : 23.1 people/Km2
MEDIAN AGE : 16.5 years
HDI : 0.533 (150°/188)
LIFE EXPECTANCY AT BIRTH : 62 years
MEAN YEARS OF SCHOOLING : 10 years
GDP PER CAPITA : 4.342 US$
EMPLOYMENT TO POPULATION RATIO
(AGES > 15) : 51.9%
EMPLOYMENT IN AGRICULTURE : 85%
EMPLOYMENT IN SERVICES : 15%
COUNTRY SOCIO-ECONOMIC OUTLOOK
ANGOLA DISASTER RISK PROFILE | COUNTRY SOCIO-ECONOMIC OUTLOOK
ANGOLA DISASTER RISK PROFILE
OVERVIEWSituated in Central Africa, the republic of Angola is the seventh-largest country in Africa. About 37.6 % of its population lives in urban areas and the median age is 16.5 years.Angola is making substantial economic and political progress despite massive development challenges, which include reducing its dependency on oil and diversifying its economy [1]. In fact, oil production and its supporting activities currently account for about 50% of GDP, more than 70% of government revenue, and more than 90% of the country's exports. Diamonds contribute an additional 5% to exports [2]. Lower international oil prices have hurt fiscal revenues, leading authorities to cut infrastructure expenditures by 55% between 2014 and 2017. Subsistence agriculture provides the main livelihood for most of the people, though half of the country's food is imported. The decline in foreign currency supply not only resulted in depreciation of local currency, but also constrained economic activity and job creation in import-dependent industries such as construction, manufacturing, and retail services. Economic growth slowed to 0.1% in 2016, but recovered in 2017 (an estimated 2.1%), due to strong performance in agriculture, fisheries, and energy. [3]
PROJECTIONSRecently, climate scientists and economists have built a range of new “pathways” that examine how national and global societies, demographics and economics might lead to different plausible future development scenarios over the next hundred years [4][5]. The scenarios go from the relatively optimistic trends for human development, with “substantial investments in education and health, rapid economic growth, and well-functioning institutions”[6], to more pessimistic economic and social development, with little investment in education or health in poorer countries coupled with a fast-growing population and increasing inequalities.
SOCIO-ECONOMIC PROJECTIONS USED IN THE RISK PROFILE The “middle of the road” scenario predicts that historical patterns of development are continued throughout the 21st century. The results shown in this report are referred to this scenario. Using these boundary conditions, the population of Angola in 2050 will be almost double the level of 2016 (World Bank Data), while GDP will triple.
Photo Credits: Josè Silva Pinto
Country Population (2016* - 2050) GDP(2016* - 2050)
Angola (28.813 - 43.976)million
(95.337 - 324.819) billion dollar
data from worldometers.info

P.7
OVERVIEWThe dominant climate in Angola varies from humid tropical to dry tropical. The climate is influenced by different factors such as the geographic position, the topography, the Benguela cold-water current and the movement of the convergence zone between northern and southern air masses [7]. The north-east area is the wettest region, and precipitation decreases towards the south and west. The hot and rainy season runs from September to April in the north-east, from October to April in the centre and from November to March in the south; the southern coastline does not really have a hot and rainy season. June, July, and August are the driest months, with virtually no rainfall [8].
CLIMATE TRENDSSimilarly to other Central-Southern Africa countries, temperature observations indicate that Angola has experienced a considerable increase in temperature in recent years. The analysis of climate data from 1970 to 2015[9] shows an increment of temperature of around 0.8 degree. This increase is particularly noticeable from the 1980s onward.
Precipitation does not have a clear trend as air temperatures, and is variable in time and space. Over the last 40 years, rainfall has marginally increased in Angola, with a large difference between very wet and dry years.The average annual precipitation for Angola is about 970 mm while the mean number of wet days is around 80.
The major rivers of Angola are the Cuanza, the Cuango, and the Cunene, and they all originate in the Central Plateau of Angola. The Cuanza and the Cunene empty into the Atlantic Ocean, the former just south of the national capital Luanda, and the second at the border with Namibia. The Cuango flows south-north-west. It crosses the border with the Democratic Republic of the Congo and joins the Kasai River. The Okavango river, the fourth longest river system in southern Africa, flows through Angola for 1,600 km from the central part of the country southeastward to the Kalahari Desert in northern Botswana. The Angolan hydro-network is vast and is comprised of 47 main drainage basins. It is estimated that the hydropower potential is up to 18 GW for the entire country, and is largely concentrated on the Cuanza, Longa, Queve, Catumbela, and Cunene river basins [10].
P.8
RIVERS OF ANGOLA
COUNTRY CLIMATE OUTLOOK
Photo Credits: Byman H. Hamududu, Ånund Killingtveit - Abstract - http://www.mdpi.com
ANGOLA DISASTER RISK PROFILE
Mean Annual Temperature
Average of Mean Annual Temperature
Trend Mean Annual Temperature
Annual Precipitation
Average of the Annual Precipitation
1970
197
5 19
80
1985
19
90
1995
2000
2005
2010
2015
1100
1020
940
860
780
[mm]
[year]
TEMPERATURE AND PRECIPITATION TRENDS IN CURRENT CLIMATE
1970
197
5 19
80
1985
19
90
1995
2000
2005
2010
2015
23,0
22,5
22
21,5
21,0
[C°]
[year]
ANGOLA DISASTER RISK PROFILE | COUNTRY CLIMATE OUTLOOK
P.9
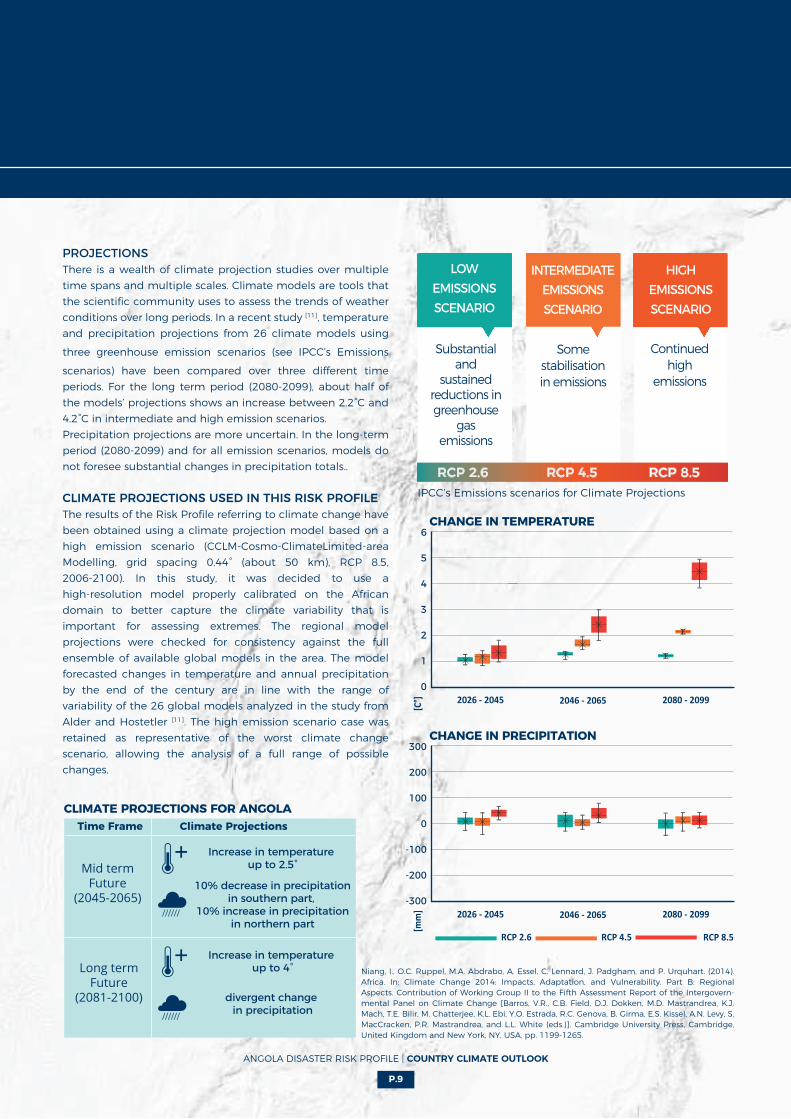
PROJECTIONSThere is a wealth of climate projection studies over multiple time spans and multiple scales. Climate models are tools that the scientific community uses to assess the trends of weather conditions over long periods. In a recent study [11], temperature and precipitation projections from 26 climate models using
three greenhouse emission scenarios (see IPCC’s Emissions
scenarios) have been compared over three different time periods. For the long term period (2080-2099), about half of the models’ projections shows an increase between 2.2°C and 4.2°C in intermediate and high emission scenarios.Precipitation projections are more uncertain. In the long-term period (2080-2099) and for all emission scenarios, models do not foresee substantial changes in precipitation totals..
CLIMATE PROJECTIONS USED IN THIS RISK PROFILEThe results of the Risk Profile referring to climate change have been obtained using a climate projection model based on a high emission scenario (CCLM-Cosmo-ClimateLimited-area Modelling, grid spacing 0.44° (about 50 km), RCP 8.5, 2006-2100). In this study, it was decided to use a high-resolution model properly calibrated on the African domain to better capture the climate variability that is important for assessing extremes. The regional model projections were checked for consistency against the full ensemble of available global models in the area. The model forecasted changes in temperature and annual precipitation by the end of the century are in line with the range of variability of the 26 global models analyzed in the study from Alder and Hostetler [11]. The high emission scenario case was retained as representative of the worst climate change scenario, allowing the analysis of a full range of possible changes.
Time Frame Climate Projections
Mid termFuture
(2045-2065)
Long termFuture
(2081-2100)
Increase in temperature up to 2.5°
Niang, I., O.C. Ruppel, M.A. Abdrabo, A. Essel, C. Lennard, J. Padgham, and P. Urquhart. (2014). Africa. In: Climate Change 2014: Impacts, Adaptation, and Vulnerability. Part B: Regional Aspects. Contribution of Working Group II to the Fifth Assessment Report of the Intergovern-mental Panel on Climate Change [Barros, V.R., C.B. Field, D.J. Dokken, M.D. Mastrandrea, K.J. Mach, T.E. Bilir, M. Chatterjee, K.L. Ebi, Y.O. Estrada, R.C. Genova, B. Girma, E.S. Kissel, A.N. Levy, S. MacCracken, P.R. Mastrandrea, and L.L. White (eds.)]. Cambridge University Press, Cambridge, United Kingdom and New York, NY, USA, pp. 1199-1265.
CLIMATE PROJECTIONS FOR ANGOLA
ANGOLA DISASTER RISK PROFILE | COUNTRY CLIMATE OUTLOOK
IPCC’s Emissions scenarios for Climate Projections
HIGHEMISSIONSSCENARIO
INTERMEDIATEEMISSIONSSCENARIO
LOWEMISSIONSSCENARIO
Continued high
emissions
Some stabilisation in emissions
Substantial and
sustained reductions in greenhouse
gas emissions
RCP 2.6 RCP 4.5 RCP 8.5
2026 - 2045 2046 - 2065 2080 - 2099
RCP 4.5 RCP 8.5RCP 2.6
-300
-200
-100
0
300
200
100
[mm
]
CHANGE IN PRECIPITATION
2026 - 2045 2046 - 2065 2080 - 2099
0
1
2
3
6
5
4
[C°]
CHANGE IN TEMPERATURE
10% decrease in precipitationin southern part,
10% increase in precipitationin northern part
Increase in temperature up to 4°
divergent change in precipitation

DIRECT ECONOMIC LOSSC1
C3
C5
C4
PRODUCTIVE ASSETS
OTHER CRITICALINFRASTRUCTURES
HOUSINGSECTOR
TRANSPORTATIONSYSTEMS
C2 AGRICULTURALSECTOR
C3 SERVICE SECTORC3
C5
SENDAI DRIVEN PRESENTATIONANGOLA DISASTER RISK PROFILE
The Sendai Framework guides the organisation of the risk profile results.
The first page of results refers to Target B: "Substantially reduce the number of affected people globally by 2030” and specifically to Sendai indicator B1: "Number of directly affected people attributed to disasters".
The second page presents indicators that contribute to increase the country knowledge on Target C: "Reduce direct disaster economic loss in relation to global gross domestic product (GDP) by 2030”. The indicator C1 "Direct economic loss attributed to disasters” is computed as a compound index of several indicators computed in a fully probabilistic manner in this study that can be reconciled to the Sendai indicators.
In the case of floods the indicators used are:• C2 Direct agricultural loss attributed to disasters (based on the main arable crops).• C3 Direct economic loss to all other damaged or destroyed productive assets attributed to disasters.• C4 Direct economic loss in the housing sector attributed to disasters.• C5 Direct economic loss resulting from damaged or destroyed critical infrastructure attributed to disasters.
In the case of droughts the indicators computed are:• C2 Direct agricultural loss attributed to disasters (based on the main arable crops).• C3 Direct economic loss to all other damaged or destroyed productive assets attributed to disasters. In these calculations only hydropower losses are assessed in the context of drought.In addition to indicators for target C, some useful indicators for Target D are also provided. Target D: "Substantially reduce disaster damage to critical infrastructure and disruption of basic services, among them health and educational facilities, including through developing their resilience by 2030”.
In the third page of results for floods the most relevant sectors for the country are selected and their AAL distribution is presented in present and future climate conditions in relation to the exposure distribution considered in the study.In the case of droughts, the spatial distribution of the main Hazard indexes is presented as they represent the main driver for risk computations. An explanation box for each drought hazard index is given in the page to help their interpretation.
For floods, in the fourth and final page the results are broken down according to different return periods and presented in terms of PML curve of the total damage across all sectors. In each range of return periods of the total damage, the contribution of the different sectors is highlighted. In the case of droughts, the result derived in economic terms for income loss due to lack of agricultural production and loss of hydropower production are broken down according to different return periods.
SE
ND
AI
IND
ICA
TO
RS
P.10
ANGOLA DISASTER RISK PROFILE | SENDAI DRIVEN PRESENTATION
C5
P.11
RESULTS | FLOODSANGOLA DISASTER RISK PROFILE
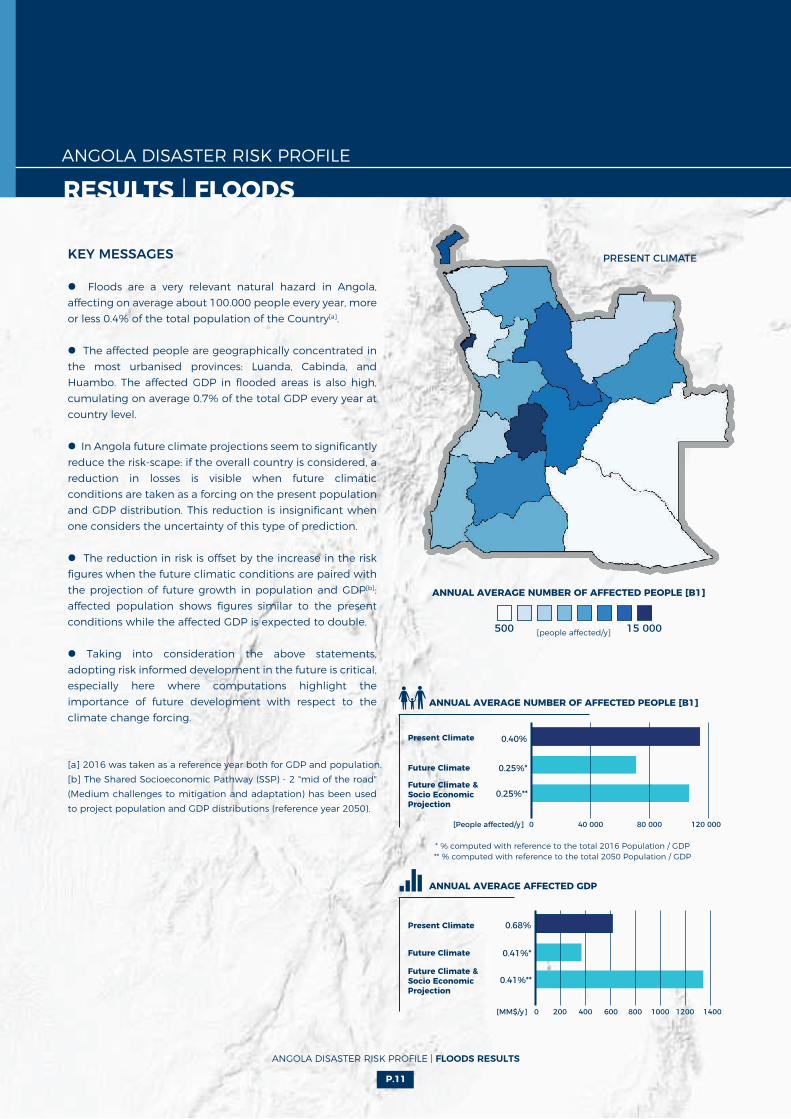
KEY MESSAGES • Floods are a very relevant natural hazard in Angola, affecting on average about 100.000 people every year, more or less 0.4% of the total population of the Country[a].
• The affected people are geographically concentrated in the most urbanised provinces: Luanda, Cabinda, and Huambo. The affected GDP in flooded areas is also high, cumulating on average 0.7% of the total GDP every year at country level.
• In Angola future climate projections seem to significantly reduce the risk-scape: if the overall country is considered, a reduction in losses is visible when future climatic conditions are taken as a forcing on the present population and GDP distribution. This reduction is insignificant when one considers the uncertainty of this type of prediction.
• The reduction in risk is offset by the increase in the risk figures when the future climatic conditions are paired with the projection of future growth in population and GDP[b]: affected population shows figures similar to the present conditions while the affected GDP is expected to double.
• Taking into consideration the above statements, adopting risk informed development in the future is critical, especially here where computations highlight the importance of future development with respect to the climate change forcing.
[a] 2016 was taken as a reference year both for GDP and population.[b] The Shared Socioeconomic Pathway (SSP) - 2 "mid of the road" (Medium challenges to mitigation and adaptation) has been used to project population and GDP distributions (reference year 2050).
15 000500
ANNUAL AVERAGE NUMBER OF AFFECTED PEOPLE [B1]
[people affected/y]
Present Climate
Future Climate
Future Climate & Socio EconomicProjection
0 40 000 80 000 120 000[People affected/y]
0 200[MM$/y] 400 600 800 1000 1200 1400
0.25%*
0.25%**
0.40%
Present Climate
Future Climate
Future Climate & Socio EconomicProjection
0.41%*
0.41%**
0.68%
ANNUAL AVERAGE NUMBER OF AFFECTED PEOPLE [B1]
ANNUAL AVERAGE AFFECTED GDP
ANGOLA DISASTER RISK PROFILE | FLOODS RESULTS
PRESENT CLIMATE
* % computed with reference to the total 2016 Population / GDP ** % computed with reference to the total 2050 Population / GDP

P.12
RESULTS | FLOODSANGOLA DISASTER RISK PROFILE
DIRECT ECONOMIC LOSS
C1
C3
C4
PRODUCTIVE ASSETS
OTHER CRITICALINFRASTRUCTURES
HOUSING SECTOR
TRANSPORTATIONSYSTEMS
Future Climate
C2 AGRICULTURALSECTOR
C3 SERVICE SECTORC3
100 200 300 4000AAL [MM$/y]
370215
[D8]TransportationSystem
SE
ND
AI
IND
ICA
TO
RS
Present climate
Future climate
Km
Km
70
0.5
[MM$/y]
500
Present Climate
[C1]
DIR
ECT
ECO
NO
MIC
LO
SSPr
esen
t A
AL
[C1]
DIR
ECT
ECO
NO
MIC
LO
SSFu
ture
AA
L
KEY MESSAGES
• The direct economic loss in Angola distributes geographically in line with the exposed values but provinces in the central part of the country are the ones that show the biggest losses in this case. The pattern changes in Future climate, where a sensible increase of losses is visible in the northern provinces, which now account for the highest losses.
• The value of direct economic losses in terms of AAL amounts to $US 490 million, or roughly 0.26% of the total exposure value in present climate. The larger portion of losses is due to the housing and critical infrastructures other than transportation (i.e. health and education), that account for about 70% of the overall loss, while the other sectors have a similar share in determining the overall direct loss.
• The proportion of the different sectors to the overall loss does not change significantly in future. The pattern of future flood hazard shows an increase in the Northern and northeastern region of Angola, while a considerable reduction is projected the southern part.
• The annual average number of km affected by floods tends to reduce in future assuming that the road and railways network would not change significantly over time. However, as already discussed for GDP and Population, the increase in the risk figures is dominated by future changes in exposure. This indicates a need for specific attention in planning future investments in infrastructures to ensure that risk does not significantly increase.
0.26%0.19%
0.46%0.39%
0.16%0.17%
0.21%0.15%
0.30%0.21%
0.25%0.18%
ANGOLA DISASTER RISK PROFILE | FLOODS RESULTS
C5
C5
0.32%0.18%
RESULTS | FLOODS
P.13
ANGOLA DISASTER RISK PROFILE
C3SERVICES
C4HOUSING
C3C5OTHER
CRIT. INFR.
C3PROD.
ASSESTS
KEY MESSAGES
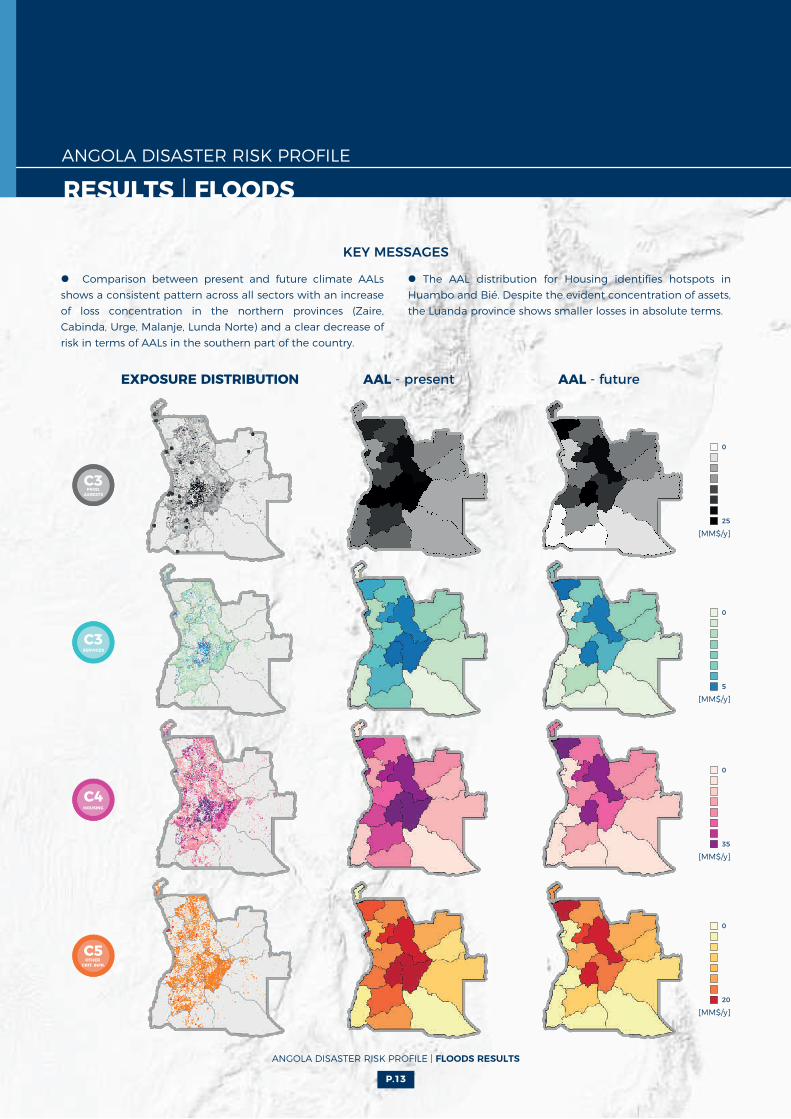
EXPOSURE DISTRIBUTION AAL - present AAL - future
25
0
[MM$/y]
• Comparison between present and future climate AALs shows a consistent pattern across all sectors with an increase of loss concentration in the northern provinces (Zaire, Cabinda, Urge, Malanje, Lunda Norte) and a clear decrease of risk in terms of AALs in the southern part of the country.
• The AAL distribution for Housing identifies hotspots in Huambo and Bié. Despite the evident concentration of assets, the Luanda province shows smaller losses in absolute terms.
5
0
[MM$/y]
35
0
[MM$/y]
20
0
[MM$/y]
ANGOLA DISASTER RISK PROFILE | FLOODS RESULTS

RESULTS | FLOODSANGOLA DISASTER RISK PROFILE
• The PML curve comparison highlights that in future climate there is a tendency to decrease the frequency of small to medium losses, while the behaviour reverts when considering losses higher than a 50-year return period.
• While this reflects less average annual losses, the country in future will be more exposed for low frequency events that cause high losses in a short amount of time, posing more severe problems in terms of resilience. In sum, Angola will be exposed to less frequent, more extreme events that will cause significant damage.
• The share of losses for the different return periods does not change, the only difference being represented by agricultural losses that represent a bigger share in the case of more frequent events.
• The PML curve rises steeply until the 100-year loss, and flattens after that. This sets an unfavourable condition for risk transfer contracts, the first part of the curve should be strategically modified with risk reduction measures before designing a risk transfer option.
Present Climate Future Climate
P.14
ANGOLA DISASTER RISK PROFILE | FLOODS RESULTS
1800
1400
800
600
1200
1000
400
200
1600
0 450200150 40035010050 300250 500
Return Period [years]
0 200 400 600 800 1000 1200
AGRICULTURAL SECTOR [C2] SERVICE SECTOR [C3] PRODUCTIVE ASSETS [C3] HOUSING SECTOR [C4] OTHER CRITICAL INFRASTRUCTURE [C5]
1400 1600 1800
<10
10-25
25-100
100-200
200-500
TRANSPORTATION SYSTEM [C5]
Future Climate
Present Climate
PROBABLE MAXIMUM LOSS CURVE (PML)C1 - DIRECT ECONOMIC LOSS
Loss [MM$]
PROBABLE MAXIMUM LOSS CURVE (PML) ACROSS ALL SECTORSC1 - DIRECT ECONOMIC LOSS
Loss [MM$]

RESULTS | DROUGHTS
P.15
ANGOLA DISASTER RISK PROFILE
KEY MESSAGES
• With respect to present conditions (1951-2000 climate), precipitation is expected to slightly decrease while a strong increase in temperature is foreseen in the future (2050-2100 climate), increasing the severity of droughts.
• The GDP exposed to droughts is expected to increase by more than a factor 6. (While presently, annually on average 4% of the GDP is exposed to droughts, this is expected to rise to 27%).
• In the future 6 times more livestock is expected to be annually exposed to droughts. (Currently, on average 4% of the livestock are annually exposed to drought conditions. In the future this is expected to be 27%).
• Currently, on average little over 1 million people (3%) per year are exposed to droughts. In the future, this number is expected to increase to 29%; (almost 13.5 million people if population growth is accounted for).
0 4 000 000 8 000 000 12 000 000[People affected/y]
0[MM$/y] 20 000 40 000 60 000 80 000
ANNUAL AVERAGE NUMBER OF AFFECTED LIVESTOCK
0[Livestock affected/y]
0
ANNUAL AVERAGE NUMBER OF LABOUR DAYS LOST
[N°of labour days lost/y] 500 000 1 000 000 1 500 000
1 000 000200 000 400 000 600 000 800 000
300 0001500 [people affected/y]
Present Climate
Future Climate
Future Climate & Socio EconomicProjection
29%*
29%**
3%
Present Climate
Future Climate
Future Climate & Socio EconomicProjection
27%*
27%**
4%
Present Climate
Future Climate 27%
4%
Present Climate
Future Climate
This map shows the average annually affected people by drought conditions under present conditions. Drought conditions are calculated using SPEI that takes into account both precipitation and evapotranspiration. Dry conditions are defined as at least three months of dry conditions.
ANGOLA DISASTER RISK PROFILE | DROUGHTS RESULTS
PRESENT CLIMATE
ANNUAL AVERAGE NUMBER OF AFFECTED PEOPLE [B1]
ANNUAL AVERAGE NUMBER OF AFFECTED PEOPLE [B1]
* % computed with reference to the total 2016 Population / GDP ** % computed with reference to the total 2050 Population / GDP
ANNUAL AVERAGE AFFECTED GDP
0.62%
0.27%

RESULTS | DROUGHTS
P.16
ANGOLA DISASTER RISK PROFILE
DIRECT ECONOMIC LOSSC1
C3 PRODUCTIVE ASSETS
Future Climate
C2 AGRICULTURALSECTOR
50 100 150 2000AAL [MM$/y]
SE
ND
AI
IND
ICA
TO
RS
Present Climate
KEY MESSAGES
• Losses in agricultural production (C2) are projected to more than double in the future. Losses in hydropower generation (C3) due to drought is even expected to increase about 4 to 5 times in future climate conditions.
• Whereas now agricultural production is the dominant part of the direct losses (roughly three quarters), in the future, hydropower will become relatively more important for the total direct economic losses (roughly one third).
• Cassava is the dominant crop in determining losses due to agricultural production in present and future climate. In future, the loss in production doubles for cassava, potato, and maize, while the losses for beans and bananas increase by a factor of 4.
AGRICULTURAL PRODUCTION LOSS
Loss
[ton
/y]
Cassava Potato Maize Bean Banana
20 000
0
40 000
60 000
80 000
100 000
120 000
140 000
160 000
Futu
re C
limat
e
Pres
ent C
limat
e
[C2]
AG
RIC
OLT
UR
AL
SECT
OR
Pr
esen
t A
AL
[C2]
AG
RIC
OLT
UR
AL
SECT
OR
Fu
ture
AA
L
20
0
[MM$/y]
The pattern of agricultural losses shows a concentration of losses in the northwestern part of the country, where the majority of the crop production is concentrated. In future, there is an overall increase that is stronger in the southern part and weaker in the northern part of the Country. The distribution map for labour days is comparable to the one for agricultural losses.
ANGOLA DISASTER RISK PROFILE | DROUGHTS RESULTS
C2 is computed considering only the direct loss suffered because of a loss of agricultural production with respect to a reference production in the present climate, C3 is computed considering only the loss in hydropower production as compared to a nominal production in present climate.
1.1%3.1%
1%2.3%
2%10%
3.1%
1.7%
5.2%3%
4.6%
2.2%
14.1
%
3.2%
4.8%
1.3%

RESULTS | DROUGHTS
P.17
ANGOLA DISASTER RISK PROFILE
This map denotes the average amount of dry months in a year for a return period of 1 in 5 years. Dry months relate to Standardized Precipitation minus Evapotranspiration Index (SPEI) values in the lowest 6%. This indicator excludes streamflow, so is particularly important for areas dependent on rainfall for their water resources. Whilst the coast and south of Angola is generally characterized by a permanent arid climate, droughts are common in the southeast and north. The central and northeastern parts may see the largest increase in drought occurrence. Overall drought probability is expected to become on average 3 times higher.
This map denotes the average amount of months per year with low flow conditions in the rivers for a return period of 1 in 5 years. Low flow relates to the Standardized Stream Flow Index (SSFI) values in lowest 6%. It is striking that particularly rivers in the south are projected to experience more drought conditions, i.e. more low river flow in comparison to the current average river flow levels in a future climate.
100
0
5
1
[months/y]
12
0
[months/y]
SPEI
(1/5
yea
rs)
Sta
ndar
dise
d Pr
ecip
itat
ion-
Evap
otra
nspi
rati
on In
dex
SSFI
Stan
dard
ised
St
ream
flow
Inde
x
ANGOLA DISASTER RISK PROFILE | DROUGHTS RESULTS
WA
TER
CR
OW
DIN
G IN
DEX
This maps shows the percentage of the population per province experiencing water Scarcity (using population data of 2016 for present conditions and population projections for 2050 for future conditions). The information is based on the water available per person per year, where less than 1000 m3/year per person is labelled as a water scarce region. Water scarcity basically indicates that a population is dependent on water resources from outside their immediate region (~85km2) for drinking water as well as productive purposes such as food production. Specifically, areas with high concentrations of people are dependent on outside water resources (in particularly in the west, such as Luanda). With climate change, also a considerable portion of the population in Lunda Sul may become more dependent on water from elsewhere as water availability per person drops below the threshold.
EXPLANATION BOX Present Future
[population %/y]

RESULTS | DROUGHTS
P.18
ANGOLA DISASTER RISK PROFILE | DROUGHTS RESULTS
ANGOLA DISASTER RISK PROFILE
• For hydropower losses (defined as the production below the average production in present climate conditions), the losses of frequent return periods (1 in 5 years) are expected to increase substantially, the very rare losses (1 in 50 or 1 in 100 years) increase relatively less.
• In the case of agricultural income losses (defined as the production below the reference production in present climate conditions), the present climate conditions present a strong increase in expected losses for return periods higher than 100 years. It is worth noting how these results might be affected by high level of uncertainties as we move into the very rare losses domain.
• In the future climate, agricultural income losses tend to increase for the more frequent events. This determines the marked increase in the AAL. However, the low frequency losses tend to reduce with respect to present; this is due, among other reasons, to a lower variability in weather conditions predicted by the climate models.
PROBABLE MAXIMUM LOSS (PML)C3 - PRODUCTIVE ASSETS (HYDROPOWER LOSS)
500
5
100 150 200 250 300 350 400
10
25
50
100
Future Climate
Present Climate
PROBABLE MAXIMUM LOSS (PML)C2 - AGRICULTURAL LOSS
2000
10
400 600 800 1000 1200
20
50
100
200
Future Climate
Present Climate
Loss [MM$]
Loss [MM$]

METRICS FOR RISK MANAGEMENT
P.19
PROBABILISTIC RISK ASSESSMENT FOR RISK MANAGEMENT
ANGOLA DISASTER RISK PROFILE | RISK MANAGEMENT
ANGOLA DISASTER RISK PROFILE
Risk information may be used to put in place a broad range of activities to reduce risk, from improving building codes and designing risk reduction measures, to carrying out macro-level assessments of the risks to prioritize investments. Risk metrics, can help discern the contributions of different external factors (such as demographic growth, climate change, urbanization expansion, etc.) and provide a net measure of progress of disaster risk reduction policies implementation.AAL can be interpreted as an opportunity cost given that resources set aside to cover disaster losses could be used for development. Monitoring AAL in relation to other country economic indicators, such as GDP, capital stock, capital investment, reserves, and social expenditure, would provide indications on country fiscal resilience, broadly defined as comprising internal and external savings to buffer against disaster shocks. Economies can be severely disrupted if there is a high ratio of AAL to the value of capital stock. Similarly, future economic growth can be compromised if there is a
high ratio of AAL to capital investment and reserves. Social development will be challenged if there is a high ratio of AAL to social expenditure. Moreover, limited ability to recover quickly may increase indirect disaster losses significantly. Countries that already have compensatory mechanisms such as effective insurance in place and that can rapidly compensate for losses will recover far more quickly than those that do not. Such mechanisms may include insurance and reinsurance, catastrophe funds, contingency financing arrangements with multilateral finance institutions, and market-based solutions such as catastrophe bonds (UNISDR, 2011 and 2013).In order to articulate a full DRR strategy, the PML curve is particularly useful. The PML curve describes the loss that can be experienced for a given return period. Knowing the different level of losses expected on a certain frequency can help to understand how to organise a strategy combining different risk reduction, mitigation, or avoidance actions.
PML CURVEThe PML curve can be subdivided into layers. Extensive Risk Layer : This layer is typically the one associated with risk reduction measures (e.g. flood defences, local vulnerability reduction interventions). Immediately after the extensive layer is the Mid Risk Layer that builds up cumulative losses from higher impact events. The losses of this layer are normally mitigated using financial funds, like contingency fund, that are normally put in place and managed by the country itself.The losses that compose the Intensive Risk Layer (severe, infrequent hazard events) are di�cult to finance at the
country level, and a mechanism of risk transfer has to be put in place (e.g. insurance and reinsurance measures). The remaining layer of the curve determines the Residual Risk (catastrophic events), which is the risk that is considered acceptable/tolerable due to the extreme rarity of the events able to determine such loss levels. Due to this rarity, there are no concrete actions to reduce risk beyond preparedness actions that tend to ease the conditions determined by the event (e.g. civil protection actions, humanitarian aid coordination).
Residual risk layer
Return Period [year]
Exp
ecte
d L
oss
[$]
Intensive risk layer
Middle risk layer
Extensive risk layer
Risk Transfer
Contingency Fund
Disaster Risk Reduction Measures

P.20
* Definition by: Vrije Universiteit Amsterdam, Wageningen University & Research
AVERAGE ANNUAL LOSS (AAL)Average Annual Loss (also Average Damage per year) is the estimated impact (in monetary terms or number of people) that a specific hazard is likely to cause, on average, in any given year. It is calculated based on losses (including zero losses) produced by all hazard occurrences over many years.
CLIMATE MODELA numerical representation of the climate system based on the physical, chemical and biological properties of its components, their interactions and feedback processes, and accounting for some of its known properties. Climate models are applied as a research tool to study and simulate the climate, and for operational purposes, including monthly, seasonal, and interannual climate predictions.
DISASTER RISKThe potential loss of life, injury, or destroyed, or damaged assets which could occur to a system, society, or a community in a specific period of time, determined probabilistically as a function of hazard, exposure, vulnerability, and capacity.
DROUGHT*Drought refers dryer than normal conditions of a specific area (i.e. variability). Not to be confused with aridity, which refers to a lack of water resources in absolute terms. In this profile drought hazard is denoted by various indicators, covering a range of the drought types. Both hydrological and agricultural drought are explicitly addressed, both in terms of hazard, exposed population and GDP, and corresponding losses related to crop production and hydropower generation. Drought hazard and risk are modelled based on distributed rainfall and a hydrological model solving the water balance (same one as used for the flood risk assessment).Dry conditions are defined as months with standardized SPEI values below -1.5, which correspond with the driest 6% of months as found in the period 1951-2000 (assessed for January, February, March, etc. separately).
FLOODFlood hazard in the risk assessment includes river (fluvial) flooding and flash flooding. This risk profile document considers mainly fluvial flooding and flash floods in the main urban centres. Fluvial flooding is estimated at a resolution of 90 m using global meteorological datasets, a global hydrological model, a global flood-routing model, and an inundation downscaling routine. Flash flooding is estimated by deriving susceptibility indicators based on topographic and land use maps. Flood loss curves are developed to define the potential damage to the various assets based on the modelled inundation depth at each specific location.
PROBABLE MAXIMUM LOSS (PML)PML is the value of the largest loss that could result from a disaster in a defined return period such as 1 in 100 years. The term PML is always accompanied by the return period associated with the loss.
RESIDUAL RISKThe disaster risk that remains in unmanaged form, even when effective disaster risk reduction measures are in place, and for which emergency response and recovery capacities must be maintained.
RESILIENCEThe ability of a system, community or society exposed to hazards to resist, absorb, accommodate, adapt to, transform, and recover from the effects of a hazard in a timely and e�cient manner, including through the preservation and restoration of its essential basic structures and functions through risk management.
RETURN PERIODAverage frequency with which a particular event is expected to occur. It is usually expressed in years, such as 1 in X number of years. This does not mean that an event will occur once every X numbers of years, but is another way of expressing the exceedance probability: a 1 in 200 years event has 0.5% chance to occur or be exceeded every year.
RISKThe combination of the probability of an event and its negative consequences. While in popular usage the emphasis is usually placed on the concept of chance or possibility, in technical terms the emphasis is on consequences, calculated in terms of “potential losses” for some particular cause, place, and period. It can be noted that people do not necessarily share the same perception of the significance and underlying causes of different risks.
RISK TRANSFERThe process of formally or informally shifting the financial consequences of particular risks from one party to another, whereby a household, community, enterprise, or State authority will obtain resources from the other party after a disaster occurs, in exchange for ongoing or compensatory social or financial benefits provided to that other party.
GLOSSARY
ANGOLA DISASTER RISK PROFILE | GLOSSARY
ANGOLA DISASTER RISK PROFILE
UNISDR terminology on Disaster Risk Reduction: https://www.unisdr.org/we/inform/publications/7817

REFERENCESANGOLA DISASTER RISK PROFILE
P.21
ANGOLA DISASTER RISK PROFILE | REFERENCES
[1] Angola overview, WorldBank, https://www.worldbank.org/en/country/angola/overview
[2] CIA, World Factbook, https://www.cia.gov/library/publications/the-world-factbook/geos/print_ao.html
[3] African Economic Outlook (AEO) 2018, https://www.afdb.org/fileadmin/uploads/afdb/Documents/Generic-Documents/country_notes/Angola_country_note.pdf
[4] Keywan Riahi et al., The Shared Socioeconomic Pathways and their energy, land use, and greenhouse gas emissions implications: An overview, Global Environmental Change, Volume 42, January 2017, Pages 153-168
[5] Richard H. Moss et al., The next generation of scenarios for climate change research and assessment, Nature volume 463, pages 747–756 (11 February 2010)
[6] Brian C. O’Neill et al., The Scenario Model Intercomparison Project (ScenarioMIP) for CMIP6, Geosci. Model Dev., 9, 3461–3482, 2016, doi:10.5194/gmd-9-3461-2016
[7] Sandra Pombo et al., Validation of remote‐sensing precipitation products for Angola, Meteorol. Appl. 22: 395–409 (2015), https://doi.org/10.1002/met.1467
[8] S. C. P. Carvalho et al., Climate change scenarios for Angola: an analysis of precipitation and temperature projections using four RCMs, Int. J. Climatol. (2016), 10.1002/joc.4925
[9] Harris, I. P. D. J., Jones, P. D., Osborn, T. J., & Lister, D. H. (2014). Updated high‐resolution grids of monthly climatic observations–the CRU TS3. 10 Dataset. International Journal of Climatology, 34(3), 623-642
[10] http://www.angolaenergia2025.com/en/conteudo/renewables-hydro
[11] Alder, J. R. and Hostetler, S. W.: Global climate simulations at 3000-year intervals for the last 21 000 years with the GENMOM coupled atmosphere–ocean model, Clim. Past, 11, 449-471, 2015, https://doi.org/10.5194/cp-11-449-2015
Bowden, JH. and Semazzi, FHM. 2007. Empirical analysis of intraseasonal climate variability over the Greater Horn of Africa. Journal of Climate 20: 5715-5731.
Flato, G., J. Marotzke, B. Abiodun, P. Braconnot, S.C. Chou, W. Collins, P. Cox, F. Driouech, S. Emori, V. Eyring, C. Forest, P. Gleckler, E. Guilyardi, C. Jakob, V. Kattsov, C. Reason and M. Rummukainen. (2013). Evaluation of Climate Models. In: Climate Change 2013: The Physical Science Basis. Contribution of Working Group I to the Fifth Assessment Report of the Intergovernmental Panel on Climate Change [Stocker, T.F., D. Qin, G.-K. Plattner, M. Tignor, S.K. Allen, J. Boschung, A. Nauels, Y. Xia, V. Bex and P.M. Midgley (eds.)]. Cambridge University Press, Cambridge, United Kingdom and New York, NY, USA.
Laprise, R., Hernández-Díaz, L., Tete, K., Sushama, L., Šeparović, L., Martynov, A., ... & Valin, M. (2013). Climate projections over CORDEX Africa domain using fifth-generation Canadian Regional Climate Model (CRCM5). Climate Dynamics, 41 (11-12), 3219-3246.
Niang, I., O.C. Ruppel, M.A. Abdrabo, A. Essel, C. Lennard, J. Padgham, and P. Urquhart. (2014). Africa. In: Climate Change 2014: Impacts, Adaptation, and Vulnerability. Part B: Regional Aspects. Contribution of Working Group II to the Fifth Assessment Report of the Intergovernmental Panel on Climate Change [Barros, V.R., C.B. Field, D.J. Dokken, M.D. Mastrandrea, K.J. Mach, T.E. Bilir, M. Chatterjee, K.L. Ebi, Y.O. Estrada, R.C. Genova, B. Girma, E.S. Kissel, A.N. Levy, S. MacCracken, P.R. Mastrandrea, and L.L. White (eds.)].Cambridge University Press, Cambridge, United Kingdom and New York, NY, USA, pp. 1199-1265.
UNISDR, Global Assessment Report (GAR), 2015, ISBN 978-92-1-132042-8


w w w . p r e v e n t i o n w e b . n e t / r e s i l i e n t - a f r i c a
w w w . u n i s d r . o r g
RISK PROFILES ARE AVAILABLE AT:
a f r i ca . c ima foundat ion .o rg
This publication has been produced with the assistance of the European Union. The contents of this publication are the sole responsibility of CIMA Research Foundation
and can in no way be taken to reflect the views of the European Union.