Embed Size (px)
Citation preview
Report Automation Using Excel
Alison Joseph, David Onder, and Billy Hutchings
NCAIR Summer Drive-in 2013
1

• 9608 students• Master’s Comprehensive• Mountain location• Residential and Distance
2
© M
LB.C
OM
Why automate?
3
• Efficiency– Time
• Mitigates problems related to staff turn-over
• Consistency– Data (same queries/criteria)– Format/design/branding
• Timeliness– Reports are ready as soon as data is available
What to automate?
4
• Same report generated throughout the year(s)– Fact Book– Census reports– Admissions reports– Facilities utilization– Class-level profiles– Grade distribution
• Same report generated at the same time for several different groups– Program/Dept. profiles– Main campus v. other teaching sites/distance– Legislative reports
What can be included?
5
• Data tables
• Graphs
• Complex graphics (e.g., maps with enrollment)
• Cover pages
• Branding/logos
Getting started
6
• Start with an end product in mind– Real data or mock-up
• Determine data source– Use of combined data files
Excel structure
7
• Data tab– All data
• Process tab– All formulas and data manipulation
• Report tab– This is the final report– No formulas – only cell references
• Why do this– Consistent/organized– Allow multiple people to work on the same document– Compartmentalize different parts
Data tab
• Where does data come from
– Access
– SQL Server
– ODBC Connection
– Analysis Services
– XML
– Text files
8
Data - Access• We use Access
• Benefits– We already have our data there– Cheap/most people already have– User friendly (Point & click)– Approachable for entry-level staffers– Transition to SQL Server is practically seamless
• Drawbacks– Slow– Limited functionality– Sometimes multiple steps needed
9
How do you connect the data?
• Build query in Access the returns the data elements that we need
• Go to Data tab in Excel
• Click “Connections” then “Add…” or “From Access”
• Browse out to your Access file, and link
• Point it to your table or query
10
Demo• Brainstorm data elements
– Race, Load, Gender for Undergraduate and Graduate levels
• View Access Database (together)– Open database, see table structure and available queries
• Hands-on Exercise 1 (together)– Connect to Access Database– Convert to table
11
Process tab
• All the work happens here
• “No” data or layout should be on this tab
12
Report tab
• Make it look great – this is your finished product
• No formulas, only cell references & graphs
13
Important Formulas• All formulas
– Frequently used:• COUNTIFS • SUMIFS• AVERAGEIFS• MAX(year)• IF
– More complex• VLOOKUP• INDEX, MATCH, and OFFSET• SUMPRODUCT (not covering today)• Array formulas (“MEDIANIFS”)
14
Important Concepts
15
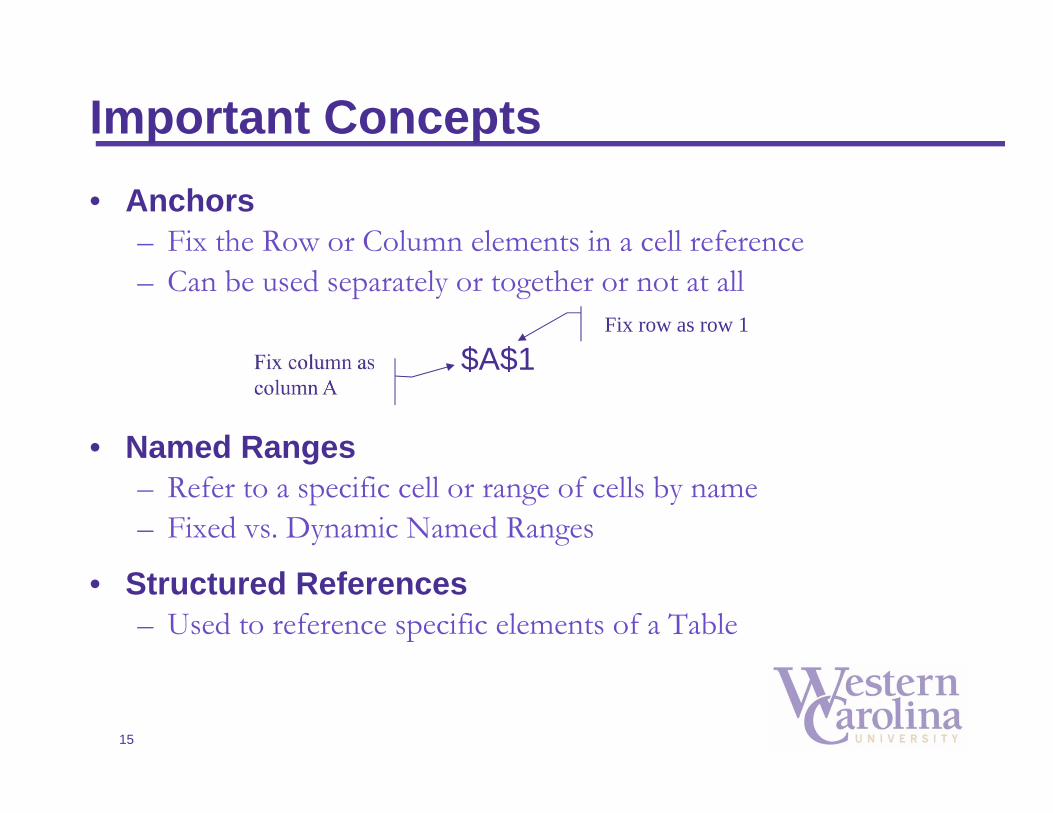
• Anchors– Fix the Row or Column elements in a cell reference– Can be used separately or together or not at all
• Named Ranges– Refer to a specific cell or range of cells by name– Fixed vs. Dynamic Named Ranges
• Structured References – Used to reference specific elements of a Table
$A$1Fix row as row 1
More Important Concepts
16
• Picture Tool– Used to show a portion of a sheet at another location in the
workbook
• Master Crosswalks
Structured References and COUNTIFS
17
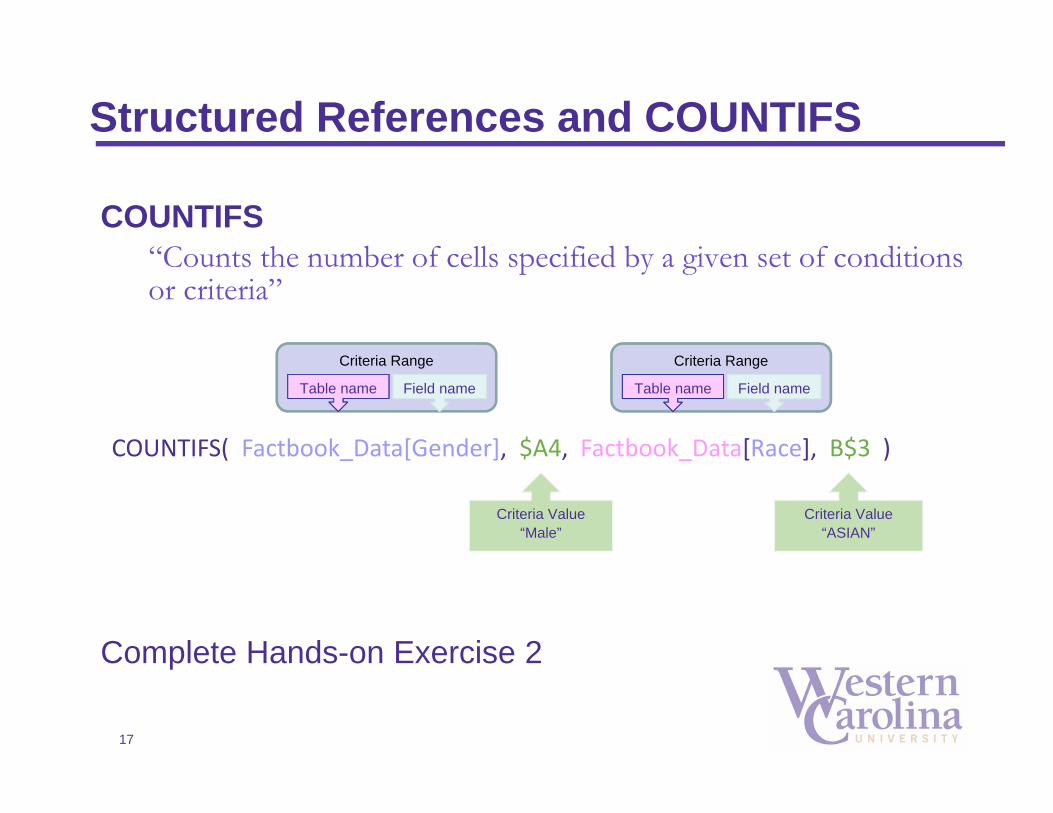
Criteria Range
Table name Field name
Criteria Value “Male”
Criteria Value “ASIAN”
COUNTIFS( Factbook_Data[Gender], $A4, Factbook_Data[Race], B$3 )
Criteria Range
Table name Field name
COUNTIFS “Counts the number of cells specified by a given set of conditions or criteria”
Complete Hands-on Exercise 2
MATCH and OFFSET
18
Lookup value
Lookup array
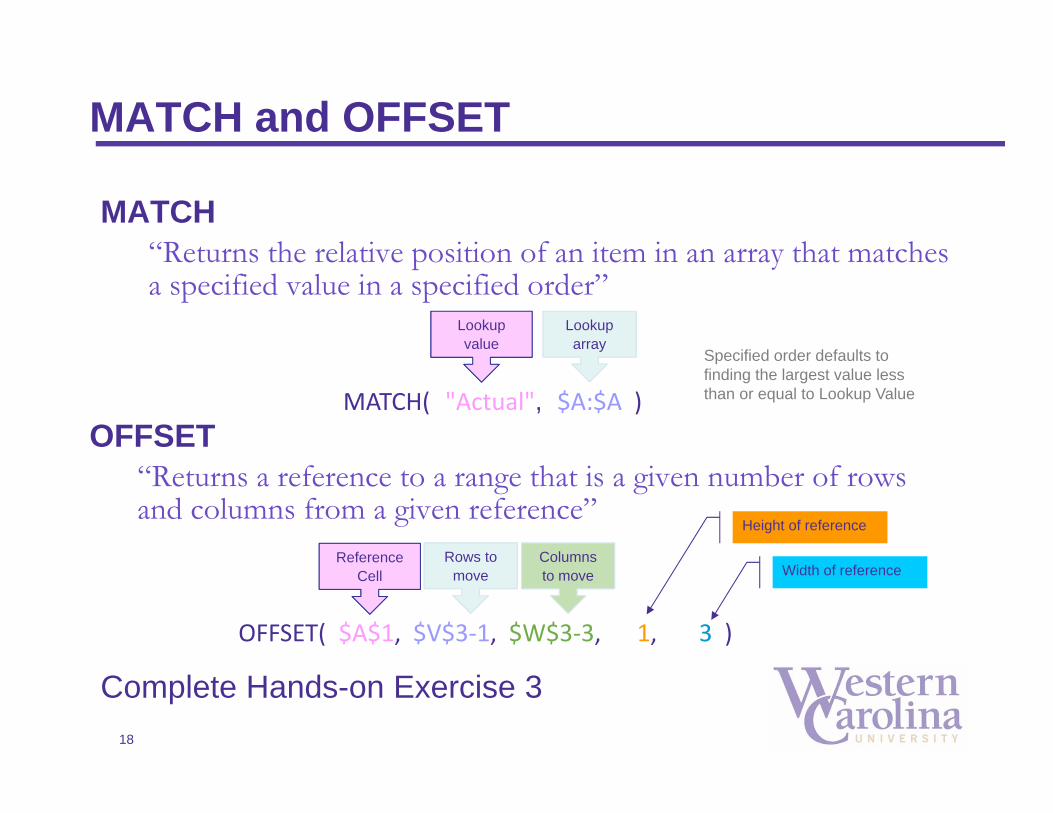
MATCH( "Actual", $A:$A )
MATCH“Returns the relative position of an item in an array that matches a specified value in a specified order”
Complete Hands-on Exercise 3
OFFSET“Returns a reference to a range that is a given number of rows and columns from a given reference”
Reference Cell
Rows to move
OFFSET( $A$1, $V$3‐1, $W$3‐3, 1, 3 )
Specified order defaults to finding the largest value less than or equal to Lookup Value
Columns to move
Height of reference
Width of reference
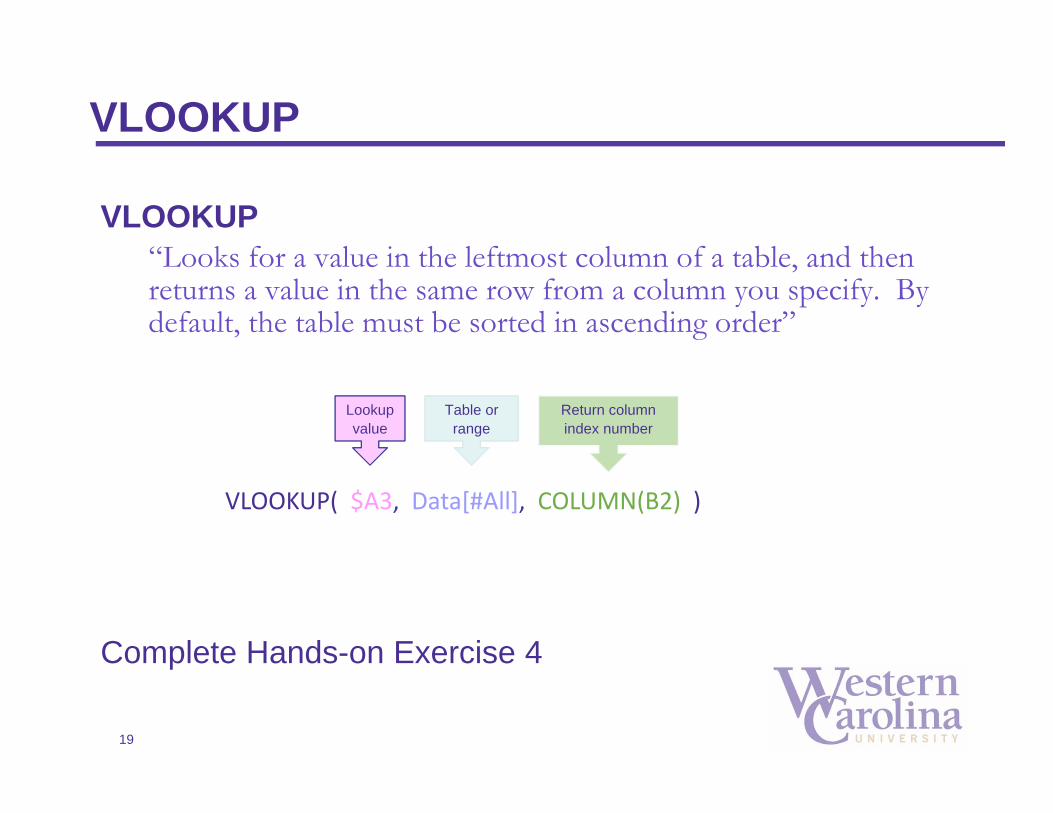
VLOOKUP
19
Lookup value
Table or range
VLOOKUP( $A3, Data[#All], COLUMN(B2) )
VLOOKUP“Looks for a value in the leftmost column of a table, and then returns a value in the same row from a column you specify. By default, the table must be sorted in ascending order”
Complete Hands-on Exercise 4
Return column index number
Getting more complicated• Program/Department Profiles
– Support for Program Prioritization process
– Several sets of data, process, & report tabs
– Results from process sheets all combined into large report
– Once formulas are written, report can be generated automatically for each program
20
Looking at the pieces• Report• Programs
– Master Crosswalk that links Program Code to other critical pieces of data. Everything is driven by program code and associated elements. Easy to change dept./college, etc.
1. Retention – Process (2), Data2. Enrollment and Degree – Process, Data (2)3. Instructional Costs – Process, Data (2)4. Gen v All FTE – Process, Data (3)5. SCH – Process, Data6. Course by Faculty Type – Process, Data (2)
21
Approach• Mock-up report, get appropriate feedback• For each metric:
– With report in mind, select data elements needed– Bring data into data tab (static if one-time, joined if annual)– Develop process sheet by dropping in final table look/feel– Write formulas in each cell to get correct results
• include appropriate anchors• think about error checking
– Drag/copy formulas out to complete the table– Using picture tool, take snapshot, and drop onto main report
22
Exercise - SUMIFS
• Make sure program code = Prog1 on report sheet
23
Complete Hands-on Exercise 5
Exercise – IF, INDEX/MATCH
• Make sure program code = Prog1 on report sheet
24
Complete Hands-on Exercise 6
“MEDIANIFS” – Intro to Array Formulas
• Array formulas– Use Excel to create your own formulas when none exist for a
particular task• We needed MEDIANIFS, turned to the web to find
documentation about building these formulas– Benefits – Powerful– Drawbacks – Complicated and hard for others to view and
understand your formulas• Other Common Examples:
– SUMIF excluding highest and lowest values in a series– AVERAGEIF exclude zeros from calculation
25
Exercise – “MEDIANIF”
• Make sure program code = Prog1 on report sheet
26
Complete Hands-on Exercise 7
Getting more complicated - VBA• Program/Department Profiles
– Report can be generated for each program
– Use a macro to:• Cycle through• Print off PDFs• Name them well• Put them into a well-structured series of folders
• Demo
27
Resources
• Purna Duggirala (http://chandoo.org/wp/ ) – Excel help
• Jon Peltier (http://peltiertech.com) – Excel templates
• Daniel Ferry (http://www.excelhero.com/)
• Edward Tufte (http://www.edwardtufte.com/) – The Visual Display of Quantitative Information, 2001
• Stephen Few (http://www.perceptualedge.com/)– Show Me the Numbers, 2004– Information Dashboard Design, 2006– Now you see it, 2009
28

Contact Information
Alison Joseph, Business and Technology Applications Analyst [email protected]
Billy Hutchings, Social Research [email protected]
Office of Institutional Planning and Effectivenessoipe.wcu.edu, (828) 227-7239
Special thanks to Stephanie Virgo (former WCU employee) and John Bradsher (student employee)
29
David Onder, Director of [email protected]