Embed Size (px)
Citation preview

W E S T V I R G I N I A H I G H E R E D U C AT I O N P O L I C Y C O M M I S S I O N | HeaLtH SC I eNCeS aNd RURaL HeaLtH
R e p o R t C a R d | 2 0 0 9

WE
ST
V
IR
GI
NI
A
HI
GH
ER
E
DU
CA
TI
ON
P
OL
IC
Y
CO
MM
IS
SI
ON
|
H
ea
Lt
H
SC
Ie
NC
eS
a
Nd
R
UR
aL
H
ea
Lt
H
Health Sciences and Rural Health Report Card 2009
West Virginia Higher Education Policy Commission
Vice Chancellor for Health Sciences
Robert B. Walker, M.D.

me
di
ca
l
ed
uc
at
io
n
r
et
en
ti
on
ru
ra
l
he
al
th
re
cr
ui
tm
en
t
TABLE OF CONTENTS
INTRODUCTION 2
HIGHLIGHTS OF 2009 4
MEDICAL SCHOOL ENROLLMENT
West Virginia University School of Medicine 5
Marshall University School of Medicine 6
West Virginia School of Osteopathic Medicine 7
MEDICAL SCHOOL GRADUATES
Performance on Medical Licensure Exams 8
Graduates Choosing Primary Care Residencies 8
RETENTION
West Virginia Medical School Graduates from 1999-2004
Practicing in West Virginia 9
West Virginia Medical School Graduates Practicing in West Virginia 10
WV Medical Graduates, 1999-2004, In All Specialties 11
WV Medical Graduates, 1999-2004, In Primary Care 11
WV Medical Graduates, 1999-2004, In Rural Areas 12
Health Sciences Graduates, 2005-2009 12
West Virginia Medical Graduates Completing West Virginia
Primary Care Residencies, 2005-2009 13
West Virginia Medical Graduates Completing Out-of-State
Primary Care Residencies, 2005-2009 13
MEDICAL STUDENT INDEBTEDNESS 14
SCHOLARSHIPS AND LOANS
Health Sciences Scholarship Participants Practicing in Rural WV 15
Medical Student Loan Program 15
WEST VIRGINIA RURAL HEALTH EDUCATION PARTNERSHIPS 16
TRAINING CONSORTIA
Infrastructure 17
Expenditures 18-19
RHEP Field Faculty, Training Sites and Rotations 20
STUDENT ROTATIONS
RHEP Rotations by Year/Discipline 21
RHEP Student Weeks by Year/Discipline 21
Rotations by School/Discipline: June 1, 2008 – May 31, 2009 22
COMMUNITY SERVICE CONTACTS
Contacts by Consortium: June 1, 2008 – May 31, 2009 23
RECRUITMENT
Health Professionals with RHEP Rotations Practicing in Rural Areas of the State 24
Recruitment Incentives for Rural Practice 24
Physicians with RHEP Rotations Practicing in Rural Areas, 1999 – 2009 25
Physicians with RHEP Rotations Practicing in Rural Areas in 2009 25

WE
ST
V
IR
GI
NI
A
HI
GH
ER
E
DU
CA
TI
ON
P
OL
IC
Y
CO
MM
IS
SI
ON
|
H
ea
Lt
H
SC
Ie
NC
eS
a
Nd
R
UR
aL
H
ea
Lt
H
2
INTRODUCTION
These are challenging times for our health care system. As we publish this report, onlythe barest outline of national health reform is available to us, and we don’t yet know the implications for West Virginia. Nevertheless, we must continue to address issues of special concern to our state, while remaining adaptable to the agenda of national policymakers. In West Virginia, we are fortunate to have high quality health professionstraining programs that can be a valuable asset in this endeavor.
Because the training of health professionals requires a large share of the state’s resources,performance expectations are high. We must provide the sons and daughters of WestVirginians with access to educational programs they will need to compete in the widerworld, but we must also be concerned with supplying the workforce that our state’shealth care system requires. Our clinical campuses must provide the day-to-day healthcare services our citizens need, but we must also use our unique insight to influence the creation of new health paradigms – delivery systems, payment mechanisms, publichealth outreach, and professional education. This could be an intimidating assignment,but by drawing on the resourcefulness for which West Virginians are justifiablyrenowned, we can have greater impact than ever before.
Over the past couple of years, we have obtained three evaluations from outside consult-ants, as well as a report from the Legislative Auditor. Our analysis of this informationleads us to the conclusion that, while aspects of the Rural Health Education Partner-ships program have been successful, we must now narrow our focus to emphasize thehealth problems and underserved areas of the state that remain largely intractable.
The upcoming year will be a transitional period. We will address the administrative issues highlighted by the Legislative Auditor’s report. In addition, we will continue our support of joint efforts by our Health Sciences Centers to address the state’s mostpressing health problems. These centers are heavily involved in an outstanding model of collaboration, the Perinatal Partnership, which has already begun to show, not justcost-savings, but clinical success, by improving pregnancy and birth outcomes across the state. Similar models of collaboration will be applied to improve rural health delivery and services for our elders.
Lastly, we will seek ways to capitalize on our investment. The ability to recruit, educate,and retain health providers for West Virginia has been limited by a stagnant number ofpost-graduate residency spots available in rural education centers. We intend to studyhow this essential part of the recruitment pipeline can be expanded, allowing us to place skilled providers in our most rural and underserved communities.
West Virginia Perinatal Partnership – a Model for Collaboration
The health agenda has become so large and complex that no single sector or organiza-tion can tackle health improvements alone. The Perinatal Partnership provides a modelfor statewide collaboration among many partners – health sciences schools, state

3m
ed
ic
al
e
du
ca
ti
on
re
te
nt
io
n
r
ur
al
h
ea
lt
h
r
ec
ru
it
me
nt
agencies, professional associations, private medical providers, corporate health care systems,and civic groups – working together to improve health outcomes. The partnership conductsstudies to identify problems, issues reports and recommendations, and develops action plansin key areas. Implementation is carried out by working committees. The major focus is thecoordination and improvement of perinatal care services. The expertise of many professionalsis focused on a common goal – providing excellent health care to women, babies, and familiesacross West Virginia.
The partnership, which is coordinated by a nonprofit organization, West Virginia Commu-nity Voices, has been funded by the Claude Worthington Benedum Foundation since 2006.Plans are underway to sustain the partnership through support from the Office of the ViceChancellor for Health Sciences in the Policy Commission.
Currently, the partnership members have been collaborating on 18 projects. A few of the ac-complishments are briefly noted:
• Developed recommendations to improve the system for emergency transport of mothers and babies, and began plans, along with the state Emergency Medical Services office, to establish a “one call” system for rural hospitals.
• Demonstrated consultation via telemedicine between a community obstetrician attending a delivery and specialists at a tertiary hospital. Partnered with CAMC Research Institute and the West Virginia Telehealth Alliance to identify the needs of maternity hospitals for bandwidth and equipment and received funding from the U.S. Department of Agriculture and the Health Care Authority to develop a perinatal telecommunication network for rural hospitals and clinics.
• Identified costly medical procedures associated with poor birth outcomes. As a result of a study of the frequency of labor induction among first-time mothers, the partner- ship worked with 15 hospitals to reduce elective deliveries prior to 39 weeks gestation. In only eight months, elective deliveries were reduced from 21.8 percent to 8.1 percent of births.
• Developed guidelines to identify and treat drug use during pregnancy, began an educational program for medical and nursing providers, and issued a tool kit to identify addicted newborns. Conducted an umbilical cord tissue study to research the extent of drug or alcohol use among pregnant women giving birth at eight hospitals. The study found the overall rate to be 19 percent of births.

WE
ST
V
IR
GI
NI
A
HI
GH
ER
E
DU
CA
TI
ON
P
OL
IC
Y
CO
MM
IS
SI
ON
|
H
ea
Lt
H
SC
Ie
NC
eS
a
Nd
R
UR
aL
H
ea
Lt
H
4
HIGHLIGHTS OF 2 009
• Expansion of medical school enrollment has resulted in a greater proportion of out-of-state students. This year, over 51% of first-year students in West Virginia medical schools were residents of other states. By school, the break- down is West Virginia University, 40%; Marshall University, 27%; and the West Virginia School of Osteopathic Medicine, 69%.
• Over 39% of West Virginia’s medical school graduates from 1999 – 2004 are practicing in the state after completing residency training. The proportion has remained steady for more than a decade; however, trends in enrollment at the state’s medical schools may affect retention adversely in future years.
• If state medical school graduates do their hospital residency training in West Virginia, retention is even higher. This year, 39 state medical graduates completed their primary care residencies in West Virginia and 34 (87%) are now practicing in the state. In comparison, 56 state medical graduates completed out-of-state primary care residencies, and only 7 (13%) are now practicing in West Virginia.
• In other health sciences fields, 33 (75%) of the dentistry graduates and 47 (64%) of the pharmacy graduates remained in the state.
• From 1991, West Virginia began developing rural training sites for health professions under the Kellogg Community Partnerships Initiative and the Rural Health Education Partnerships (RHEP) program. Since then, 1,201 graduates in health fields have been retained and are currently practicing in the state. These graduates include 300 physicians, 124 nurse practitioners, 184 physician assistants, 115 dentists, 216 pharmacists, and 262 allied health personnel. Of these graduates, 38% of the physicians, 43% of the nurse practitioners, and 29% of the physician assistants received state scholarships or loan repayment.
• This year, the RHEP training consortia reported a total of more than 75,000 contacts with rural West Virginians in providing community services and education on topics such as oral hygiene, asthma, nutrition and fitness, and osteoporosis. In addition, RHEP staff and students provide support to CARDIAC, a research project that provides screening, intervention, and health education statewide. Since 1998, the program has screened almost 61,000 fifth graders for cardiovascular risk factors and has added screening of second graders and kindergarten children in recent years.
• This year RHEP dental and dental hygiene students provided 10,417 clinical procedures and 402 outreach activities. RHEP dental sites, including dentists and students, provided over $3.9 million in uncompensated care.

5m
ed
ic
al
e
du
ca
ti
on
re
te
nt
io
n
r
ur
al
h
ea
lt
h
r
ec
ru
it
me
nt
MEDICAL SCHOOL ENROLLMENT
W e s t V i r g i n i a U n i v e r s i t y S c h o o l o f M e d i c i n e
Source: Association of American Medical Colleges.
Average scores for the Medical College Admission Test (MCAT)are reported as “means” for the multiple-choice sections and “medians” for the Writing Sample. Test scores on the multiple-choice are on a scale of 1-15 and on the Writing Sample, a scale of J-T. The national averages for students entering allopathicmedical schools in 2008-09 were the following:
Biological Sciences: 10.7
Physical Sciences: 10.3
Verbal Reasoning: 9.9
Writing Sample: P
The national mean GPA was 3.66.
2004-05 2005-06 2006-07 2007-08 2008-09
applicants
In-State 189 187 204 212 217
Out-of-State 865 933 1,629 2,454 2,545
total 1,054 1,120 1,833 2,666 2,762
acceptances Issued
In-State 90 88 94 94 86
Out-of-State 73 79 84 62 100
total 163 167 178 156 186
First Year New enrollment In-State 66 43 62 82 66
Out-of-State 35 55 48 26 44
total 101 98 110 108 110
entering Class data
Mean GPA 3.7 3.7 3.7 3.7 3.7
Mean MCAT Scores
Biology/Biological Sciences 9.2 9.6 9.8 9.9 9.9
Physics/Physical Sciences 8.7 9.2 9.2 9.5 9.5
Reading/Verbal Reasoning 8.9 9.0 9.0 9.1 9.0
Median Writing Sample N/A O O P O
total Medical Students 391 424 424 421 432

WE
ST
V
IR
GI
NI
A
HI
GH
ER
E
DU
CA
TI
ON
P
OL
IC
Y
CO
MM
IS
SI
ON
|
H
ea
Lt
H
SC
Ie
NC
eS
a
Nd
R
UR
aL
H
ea
Lt
H
6
Average scores for the Medical College Admission Test (MCAT)are reported as “means” for the multiple-choice sections and “me-dians” for the Writing Sample. Test scores on the multiple-choiceare on a scale of 1-15 and on the Writing Sample, a scale of J-T.The national averages for students entering allopathic medicalschools in 2008-09 were the following:
Biological Sciences: 10.7
Physical Sciences: 10.3
Verbal Reasoning: 9.9
Writing Sample: P
The national mean GPA was 3.66.
Source: Association of American Medical Colleges.
MEDICAL SCHOOL ENROLLMENT
M a r s h a l l U n i v e r s i t y S c h o o l o f M e d i c i n e
2004-05 2005-06 2006-07 2007-08 2008-09
applicants
In-State 180 167 198 189 209
Out-of-State 539 618 1,375 1,756 1,107
total 719 785 1,573 1,945 1,316
acceptances Issued
In-State 80 83 96 90 94
Out-of-State 16 19 27 33 34
total 96 102 123 123 128
First Year New enrollment
In-State 43 50 48 51 57
Out-of-State 9 10 16 21 21
total 52 60 64 72 78
entering Class data
Mean GPA 3.5 3.5 3.5 3.6 3.5
Mean MCAT Scores
Biology/Biological Sciences 9.2 8.9 8.7 8.9 9.3
Physics/Physical Sciences 8.4 8.2 8.3 8.7 8.3
Reading/Verbal Reasoning 9.2 9.1 8.9 8.9 8.7
Median Writing Sample M O O M Q
total Medical Students 200 211 227 246 281
7m
ed
ic
al
e
du
ca
ti
on
re
te
nt
io
n
r
ur
al
h
ea
lt
h
r
ec
ru
it
me
nt
W e s t V i r g i n i a S c h o o l o f O s t e o p a t h i c M e d i c i n e
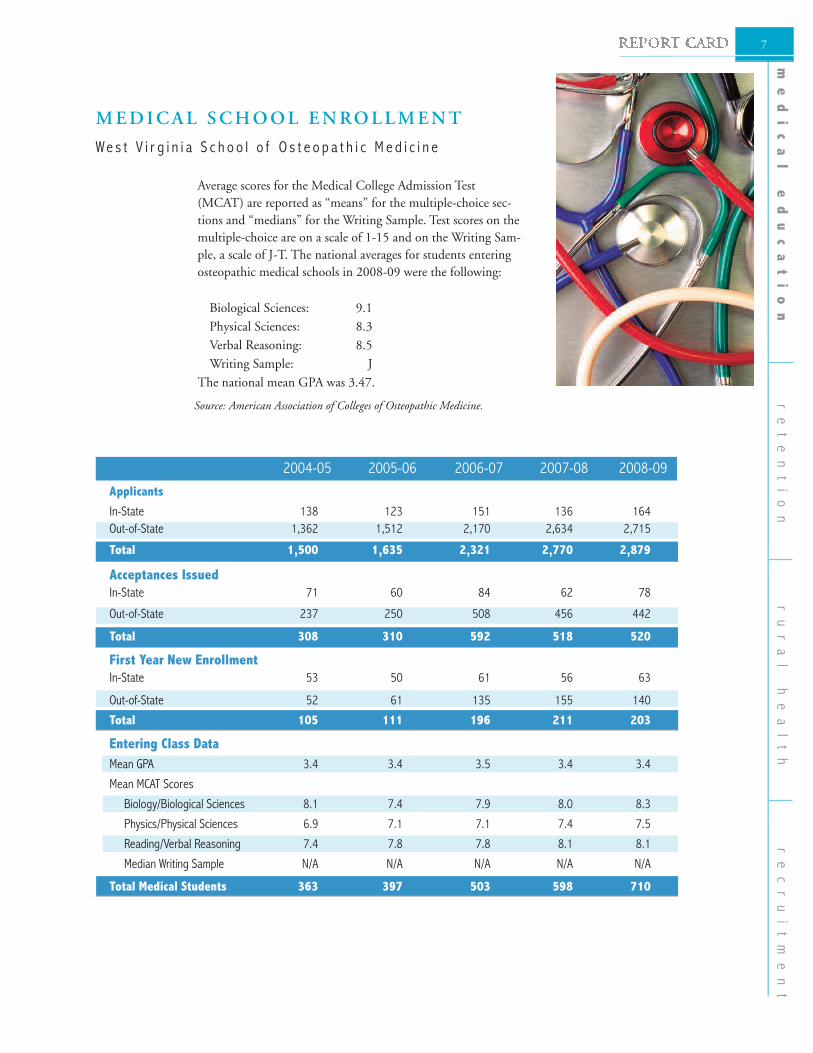
Average scores for the Medical College Admission Test(MCAT) are reported as “means” for the multiple-choice sec-tions and “medians” for the Writing Sample. Test scores on themultiple-choice are on a scale of 1-15 and on the Writing Sam-ple, a scale of J-T. The national averages for students enteringosteopathic medical schools in 2008-09 were the following:
Biological Sciences: 9.1 Physical Sciences: 8.3 Verbal Reasoning: 8.5 Writing Sample: JThe national mean GPA was 3.47.
Source: American Association of Colleges of Osteopathic Medicine.
2004-05 2005-06 2006-07 2007-08 2008-09
applicants
In-State 138 123 151 136 164
Out-of-State 1,362 1,512 2,170 2,634 2,715
total 1,500 1,635 2,321 2,770 2,879
acceptances Issued In-State 71 60 84 62 78
Out-of-State 237 250 508 456 442
total 308 310 592 518 520
First Year New enrollment In-State 53 50 61 56 63
Out-of-State 52 61 135 155 140
total 105 111 196 211 203
entering Class data
Mean GPA 3.4 3.4 3.5 3.4 3.4
Mean MCAT Scores
Biology/Biological Sciences 8.1 7.4 7.9 8.0 8.3
Physics/Physical Sciences 6.9 7.1 7.1 7.4 7.5
Reading/Verbal Reasoning 7.4 7.8 7.8 8.1 8.1
Median Writing Sample N/A N/A N/A N/A N/A
total Medical Students 363 397 503 598 710
MEDICAL SCHOOL ENROLLMENT

WE
ST
V
IR
GI
NI
A
HI
GH
ER
E
DU
CA
TI
ON
P
OL
IC
Y
CO
MM
IS
SI
ON
|
H
ea
Lt
H
SC
Ie
NC
eS
a
Nd
R
UR
aL
H
ea
Lt
H
8
MEDICAL SCHOOL GRADUATES
N u m b e r o f E x a m i n e e s / N u m b e r P a s s i n g U S M e d i c a l L i c e n s i n g E x a m , S t e p 3
2004-05 2005-06 2006-07 2007-08 2008-09
West Virginia University 69/68 (99%) 81/79 (98%) 64/63 (98%) 77/74 (96%) 88/88 (100%)
Marshall University 41/35 (85%) 44/40 (91%) 38/36 (95%) 38/38 (100%) 38/38 (100%)
All data are for first-time test takers. Data for MD students are based on the US Medical Licensing Exam (USMLE), Step 3. Data for MD students become available two years after graduation, i.e., results for 2006 graduates are shown in 2008-09. The national average for this cohort was 96%.
N u m b e r o f E x a m i n e e s / N u m b e r P a s s i n g C O M L E X - L e v e l 3
2004-05 2005-06 2006-07 2007-08 2008-09
WV School of Osteopathic 72/70 (97%) 68/58 (85%) 62/62 (100%) 64/64 (100%) 55/53 (96%)
Medicine
All data are for first-time test takers. Data for DO students are based on the Comprehensive Osteopathic Medicine Licensing
Examination (COMLEX), Level 3. Results are for year of graduation. The national average for the 2008-09 cohort was not
available for this report.
M e d i c a l S c h o o l G r a d u a t e s C h o o s i n g P r i m a r y C a r e R e s i d e n c i e s *
2004-05 2005-06 2006-07 2007-08 2008-09
West Virginia University 46 (61%) 55 (56%) 56 (53%) 43 (49%) 49 (50%)**
Marshall University 29 (66%) 28 (62%) 33 (67%) 26 (62%) 32 (62%)**
WV School of Osteopathic 36 (53%) 53 (68%) 66 (69%) 62 (66%) 69 (69%)***Medicine
totaL 101 111 136 155 150
* Primary care includes family medicine, internal medicine, pediatrics, internal medicine/pediatrics, and obstetrics/gynecology.
** In 2009, the national average for choice of primary care residencies was 46.0% for all allopathic (MD) graduates.
*** The national average for osteopathic students is not available.

9m
ed
ic
al
e
du
ca
ti
on
r
et
en
ti
on
ru
ra
l
he
al
th
re
cr
ui
tm
en
t
RETENTION
M e d i c a l S c h o o l G r a d u a t e s f r o m 1 9 9 9 - 2 0 0 4P r a c t i c i n g i n W e s t V i r g i n i a
Note: Excludes SREB contract students at WVSOM who have a contractual obligation to return to theirhome state following graduation.* Primary care is defined as family medicine, internal medicine, pediatrics, internal medicine/pediatrics, and obstetrics/gynecology.**Rural areas exclude graduates practicing in: Beckley, Charleston (including South Charleston, Dunbar, Nitro, Institute, etc.), Clarksburg, Fairmont, Huntington (including Barboursville), Hurricane, Martinsburg, Morgantown (including Star City and Westover), Parkersburg (including Vienna), Weirton, and Wheeling.
A total of 1,140 graduates of the state’s three medicalschools between 1999 and 2004 have completed residencytraining. Of these graduates, 39.2% are practicing in West Virginia, and 10.2% are practicing in rural areas. Intracking the retention of graduates, this report factors inthe additional 3 to 5 years of residency training that physi-cians complete in their specialty before beginning practice.
Graduates from 1999-2004 with Completed training
Total Number in Number in Number in
Number Practice in WV Primary Practice in
Institutions Care in WV* Rural Areas in WV**
West Virginia University 458 179 (39.0%) 89 (19.4%) 32 (6.9%)
Marshall University 281 112 (39.8%) 69 (24.5%) 20 (7.1%)
WV School of Osteopathic Medicine 401 156 (38.9%) 116 (28.9%) 65 (16.2%)
totaL 1,140 447 (39.2%) 274 (24.0%) 117 (10.2%)
WE
ST
V
IR
GI
NI
A
HI
GH
ER
E
DU
CA
TI
ON
P
OL
IC
Y
CO
MM
IS
SI
ON
|
H
ea
Lt
H
SC
Ie
NC
eS
a
Nd
R
UR
aL
H
ea
Lt
H
10
40%
20%
0%
36%40% 39% 38% 38% 39% 39% 37% 39% 39%39%
19%21% 22% 23% 24% 25% 25%26%
10% 10% 10% 11% 11% 10% 10% 11% 10%11%
28%
10%
Practicing in West Virginia Rural Areas
0
87-92 88-93 89-94 90-95 91-96 92-97 93-98 94-99 95-00 96-01 97-02 98-03
38%
24%
10%
25%26%
West Virginia Residencies Practicing in West Virginia
99-04
9
39%
24%
10%
Practicing in West Virginia All Specialties Practicing in West Virginia Primary Care Practicing in West Virginia Rural Areas
0
Practicing in West Virginia
500
400
300
200
100
0
317350 360 357 360 377 386 382
407431431
168190
206 219 227 242263 262 272285
91 90 98 99 105 101 107 119 108117
293
89
Practicing in West Virginia All Specialties Practicing in West Virginia Primary Care Practicing in West Virginia Rural Areas
0
87-92 88-93 89-94 90-95 91-96 92-97 93-98 94-99 95-00 96-01 97-02 98-03
435
280
117
West Virginia Residencies Practicing in West Virginia
99-04
447
274
117
RETENTION
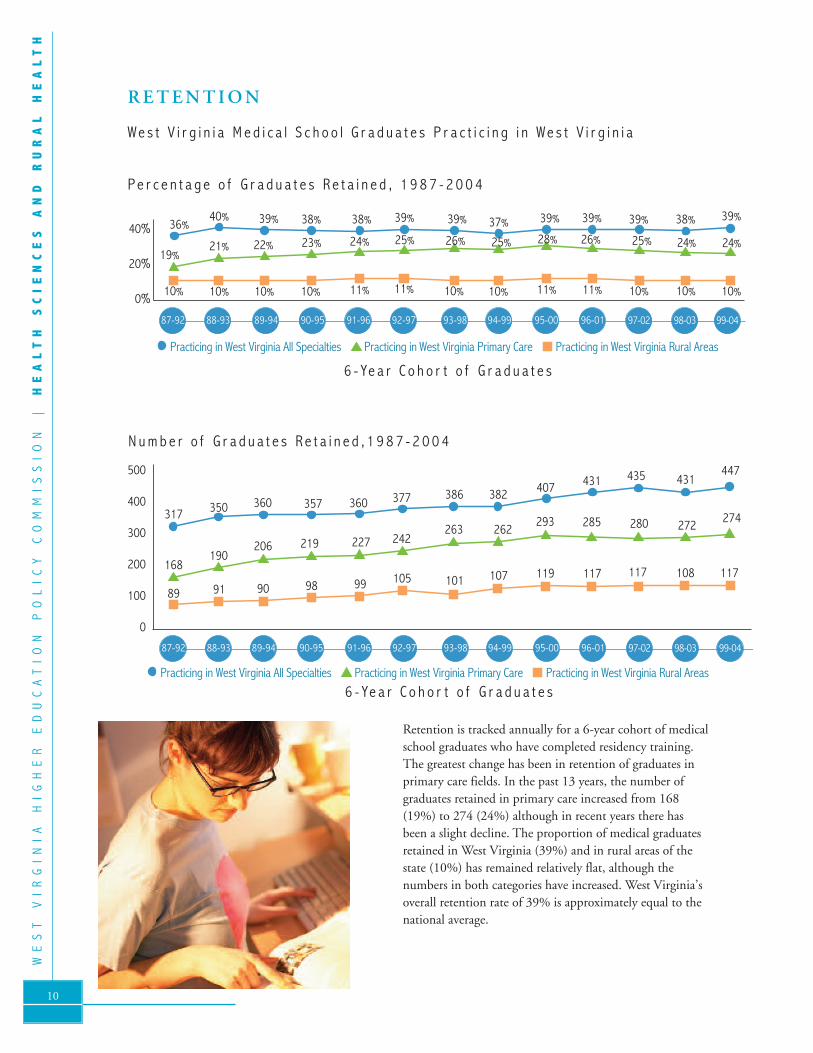
W e s t V i r g i n i a M e d i c a l S c h o o l G r a d u a t e s P r a c t i c i n g i n W e s t V i r g i n i a
N u m b e r o f G r a d u a t e s R e t a i n e d , 1 9 8 7 - 2 0 0 4
Retention is tracked annually for a 6-year cohort of medicalschool graduates who have completed residency training.The greatest change has been in retention of graduates inprimary care fields. In the past 13 years, the number ofgraduates retained in primary care increased from 168(19%) to 274 (24%) although in recent years there hasbeen a slight decline. The proportion of medical graduatesretained in West Virginia (39%) and in rural areas of thestate (10%) has remained relatively flat, although the numbers in both categories have increased. West Virginia’soverall retention rate of 39% is approximately equal to thenational average.
6 - Ye a r C o h o r t o f G r a d u a t e s
6 - Ye a r C o h o r t o f G r a d u a t e s
P e r c e n t a g e o f G r a d u a t e s R e t a i n e d , 1 9 8 7 - 2 0 0 4

11m
ed
ic
al
e
du
ca
ti
on
re
te
nt
io
nr
ur
al
h
ea
lt
h
r
ec
ru
it
me
nt
7
WETZEL
HANCOCK
BROOKE
OHIO
MARSHALL
MONONGALIA
PRESTONMARIONTYLER
PLEASANTS
HARRISONTAYLOR
DODDRIDGE
BARBOUR
WOOD
JACKSON
UPSHUR
RITCHIE
GILMER
TUCKER
ROANE
GRANT
PENDLETON
HAMPSHIREMINERAL
HARDY
RANDOLPH
LEWIS
BRAXTON
CALHOUN
WIRT
KANAWHA
WEBSTERCLAY
NICHOLAS
WYOMING
GREENBRIER
POCAHONTAS
SUMMERS
FAYETTEBOONE
LINCOLN
PUTNAM
MASON
CABELL
WAYNE
MINGO
LOGAN
RALEIGH
MERCERMCDOWELL
MONROE
MORGAN
BERKELEY
JEFFERSON
2
2
2
1
59
2
1
0
4
2
0
14
1
2
1
18
5
2
94
4
2
4
0
8
2
3
7
1
82
5
0
2
26
1
0
1
2
9
14
9
1
4
0
0
2
2
4
2
1
1
1
24
1
3
WETZEL
HANCOCK
BROOKE
OHIO
MARSHALL
MONONGALIA
PRESTONMARIONTYLER
PLEASANTS
HARRISONTAYLOR
DODDRIDGE
BARBOUR
WOOD
JACKSON
UPSHUR
RITCHIE
GILMER
TUCKER
ROANE
GRANT
PENDLETON
HAMPSHIREMINERAL
HARDY
RANDOLPH
LEWIS
BRAXTON
CALHOUN
WIRT
KANAWHA
WEBSTERCLAY
NICHOLAS
WYOMING
GREENBRIER
POCAHONTAS
SUMMERS
FAYETTEBOONE
LINCOLN
PUTNAM
MASON
CABELL
WAYNE
MINGO
LOGAN
RALEIGH
MERCERMCDOWELL
MONROE
MORGAN
BERKELEY
JEFFERSON
2
6
2
2
1
41
1
1
0
4
2
0
10
0
0
1
11
4
2
51
3
2
2
0
5
2
2
5
1
31
4
0
1
14
0
0
1
2
7
10
6
0
3
0
0
2
2
4
2
1
1
1
15
1
3
W e s t V i r g i n i a M e d i c a l G r a d u a t e s , 1 9 9 9 - 2 0 0 4 , i n A l l S p e c i a l t i e s
W e s t V i r g i n i a M e d i c a l G r a d u a t e s , 1 9 9 9 - 2 0 0 4 , i n P r i m a r y C a r e
Total Graduates from Classes of 1999-2004
Practicing by County in 2009
This map portrays retention of the most recent medicalgraduates who have completed residency training in pri-mary care fields. Primary care is defined as family medicine, internal medicine, pediatrics, internal medi-cine/pediatrics, and obstetrics/gynecology. A total of274 graduates in these fields are dispersed to 44 of the state’s 55 counties.
Total Graduates from Classes of 1999-2004Practicing in Primary Care by County in 2009
This map portrays retention of the most recentmedical graduates who have completed residencytraining. A total of 447 graduates are dispersed to48 of the state’s 55 counties. Graduates from prioryears are not shown.

WE
ST
V
IR
GI
NI
A
HI
GH
ER
E
DU
CA
TI
ON
P
OL
IC
Y
CO
MM
IS
SI
ON
|
H
ea
Lt
H
SC
Ie
NC
eS
a
Nd
R
UR
aL
H
ea
Lt
H
12
2005 2006 2007 2008 2009
West Virginia University
Dental Graduates 44 43 45 45 44
Practicing in West Virginia 22 (50%) 29 (67%) 23 (51.%) 32 (71%)
Pharmacy Graduates 72 74 81 76 73
Practicing in West Virginia 48 (67%) 41 (55%) 52 (64%) 51 (67%) 47 (64%)
Nurse Practitioner Graduates 19 22 20 29 27
Practicing in West Virginia 16 (84%) 13 (59%) 16 (80%) 19 (66%) 20 (74%)
Marshall University
Nurse Practitioner Graduates 11 16 20 24 17
Practicing in West Virginia 8 (73%) 14 (88%) 15 (75%) 19 (79%) 14 (82%)
WETZEL
HANCOCK
BROOKE
OHIO
MARSHALL
MONONGALIA
PRESTONMARIONTYLER
PLEASANTS
HARRISONTAYLOR
DODDRIDGE
BARBOUR
WOOD
JACKSON
UPSHUR
RITCHIE
GILMER
TUCKER
ROANE
GRANT
PENDLETON
HAMPSHIREMINERAL
HARDY
RANDOLPH
LEWIS
BRAXTON
CALHOUN
WIRT
KANAWHA
WEBSTERCLAY
NICHOLAS
WYOMING
GREENBRIER
POCAHONTAS
SUMMERS
FAYETTEBOONE
LINCOLN
PUTNAM
MASON
CABELL
WAYNE
MINGO
LOGAN
RALEIGH
MERCERMCDOWELL
MONROE
MORGAN
BERKELEY
JEFFERSON
2
1
2
1
1
0
2
1
0
4
2
0
14
1
0
1
6
5
2
3
4
2
4
0
0
2
3
7
1
1
5
0
2
1
1
0
1
2
1
1
9
1
3
0
0
2
2
4
2
1
1
1
1
1
3
This map portrays retention of the most recent medical graduates who have completed residency training and arepracticing in rural areas of the state. The “rural” definition excludes graduates practicing in Beckley, Charleston (including South Charleston, Dunbar, Nitro, Institute, etc.),Clarksburg, Fairmont, Huntington (including Barboursville),Hurricane, Martinsburg, Morgantown (including Star Cityand Westover), Parkersburg (including Vienna), Weirton, and Wheeling. A total of 117 graduates are dispersed to 45 of the state’s 55 counties.
Total Graduates from Classes of 1999-2004 Practicing in Rural Areas by County in 2009
RETENTION
W e s t V i r g i n i a M e d i c a l G r a d u a t e s , 1 9 9 9 - 2 0 0 4 , i n R u r a l A r e a s
H e a l t h S c i e n c e s G r a d u a t e s , 2 0 0 5 - 0 9

13m
ed
ic
al
e
du
ca
ti
on
re
te
nt
io
nr
ur
al
h
ea
lt
h
r
ec
ru
it
me
nt
Practicing in West Virginia Primary Care Practicing in West Virginia Rural Areas
0
56
7 (13%)
6267
7 (10%)
81
13 (16%)
62
12 (19%)9 (15%)
80
60
40
20
00905 06 07 08
Practicing in West Virginia
Practicing in West Virginia Primary Care Practicing in West Virginia Rural Areas
0
Completing West Virginia Residencies Practicing in West Virginia
Practicing in West Virginia Primary Care Practicing in West Virginia Rural Areas
0
Completing Out-of-State Residencies Practicing in West Virginia
Practicing in West Virginia
Medical school graduates begin practice after completing 3 to 5years of residency training in a given specialty. Two factors are important in tracking their retention: (1) specialty choice, becauseprimary care fields are generally most needed in rural West Virginia;and (2) location of the residency, because graduates who completeresidencies in West Virginia are much more likely to practice in the state. The charts below show that retention of West Virginiamedical graduates who completed in-state primary care residenciesin 2009 was 87%, compared to 13% for those who completed out-of-state residencies. Efforts are needed to make in-state primarycare residencies more attractive to medical graduates who are deciding upon residency programs.
W e s t V i r g i n i a M e d i c a l G r a d u a t e s C o m p l e t i n g O u t - o f - S t a t eP r i m a r y C a r e R e s i d e n c i e s , 2 0 0 5 - 2 0 0 9
Practicing in West Virginia Primary Care Practicing in West Virginia Rural Areas
0905 06 07 08
39
1
80
60
40
20
0
34 (87%)
4842
31 (74%) 2822 (79%)
54
38 (70%)38 (79%)
5
Practicing in West Virginia
Practicing in West Virginia
W e s t V i r g i n i a M e d i c a l G r a d u a t e s C o m p l e t i n g W e s t V i r g i n i a P r i m a r y C a r e R e s i d e n c i e s , 2 0 0 5 - 2 0 0 9

WE
ST
V
IR
GI
NI
A
HI
GH
ER
E
DU
CA
TI
ON
P
OL
IC
Y
CO
MM
IS
SI
ON
|
H
ea
Lt
H
SC
Ie
NC
eS
a
Nd
R
UR
aL
H
ea
Lt
H
14
MEDICAL STUDENT INDEBTEDNESS
2 0 0 5 – 2 0 0 9
Nurse Practitioner/Nurse Educator Physician Assistant Physical Therapist
5
$ $40,000 $80,000 $120,000 $160,000 $200,000
Marshall University West Virginia University
$199,160
$143,040
$154,541
$96,034
$132,857
$137,825
$118,962
$151,991
$152,572
$125,438
$147,902
$176,297
7
$126,739
$140,908
$167,718
08
07
06
05
09
Physician Assistant Physical Therapist
5
West Virginia School of Osteopathic Medicine Marshall University West Virginia University
This chart shows the average indebtedness of graduating medical students. As a point ofreference, the annual tuition and fees for the medical schools in 2008-09 are shown below. Resident Non-ResidentWest Virginia University $20,164 $43,960Marshall University $18,708 $44,298WV School of Osteopathic Medicine $20,426 $50,546
The difference in graduate indebtedness may be attributed in part to differences amongthe schools in the proportion of students paying non-resident tuition and fees.

15m
ed
ic
al
e
du
ca
ti
on
re
te
nt
io
nr
ur
al
h
ea
lt
h
r
ec
ru
it
me
nt
M e d i c a l S t u d e n t L o a n P r o g r a m
49
44
P Nurse Practitioner/Nurse Educator Physician Assistant Physical Therapist
5
Marshall University West Virginia University
$
7
2932
8
34 34
7
3739
7
4240
8
2 3 3
0905 06 0807
50
45
40
35
30
25
20
15
10
5
0
3
Physician Nurse Practitioner/Nurse Educator Physician Assistant Physical Therapist
5
Marshall University West Virginia University
$
The Health Sciences Scholarship Program provides an incentive for graduates to practice in underserved areas of the state. Medicalstudents receive a $20,000 award for a two-year service commit-ment. Other disciplines receive $10,000. In 2009, mental healthdisciplines - licensed independent clinical social workers and doctoral clinical psychologists – became eligible. The chart shows graduates who are fulfilling their service obligation.
The Medical Student Loan Program, which is funded from student fees, is a need-based program for state medical students. Borrowers may earn loan forgiveness of up to $10,000 per year for practicing in an underserved area or in a medical shortage field in West Virginia.Schools may award loans of up to $10,000 each year. The unexpendedfunds include loan repayments.
The “loan postponement” data show the number of borrowers who began practicing in West Virginia each fiscal year and will qualify for loan forgiveness. The “loan forgiveness” data show the number of borrowers who completed full-time practice in West Virginia each fiscal year and received loan forgiveness.
SCHOLARSHIPS AND LOANS
H e a l t h S c i e n c e s S c h o l a r s h i p P a r t i c i p a n t s P r a c t i c i n g i n R u r a l W e s t V i r g i n i a
2004-05 2005-06 2006-07 2007-08 2008-09
Loans Awarded in Fiscal Year 306 317 323 296 312
Total Amount Awarded $1,586,700 $1,023,705 $1,349,155 $1,861,456 $1,881,843
Amount of Unexpended Funds $2,609,608 $3,157,511 $3,525,991 $3,145,311 $2,642,508
Loan Postponement 20 15 20 12 22
Loan Forgiveness 50 47 37 40 47
Default Rate on Previous Awards 3.3% 3.0% 2.9% 2.8% 2.5%

WE
ST
V
IR
GI
NI
A
HI
GH
ER
E
DU
CA
TI
ON
P
OL
IC
Y
CO
MM
IS
SI
ON
|
H
ea
Lt
H
SC
Ie
NC
eS
a
Nd
R
UR
aL
H
ea
Lt
H
16
WEST VIRGINIA RURAL HEALTH EDUCATION PARTNERSHIPS
WETZEL
HANCOCK
BROOKE
OHIO
MARSHALL
MONONGALIA
PRESTONMARION
TYLERPLEASANTS
HARRISON TAYLORDODDRIDGE
BARBOUR
WOOD
JACKSON UPSHUR
RITCHIE
GILMER
TUCKER
ROANE
GRANT
PENDLETON
HAMPSHIREMINERAL
HARDY
RANDOLPH
LEWIS
BRAXTON
CALHOUN
WIRT
KANAWHA
WEBSTERCLAY
NICHOLAS
WYOMING
GREENBRIER
POCAHONTAS
SUMMERS
FAYETTEBOONE
LINCOLN
PUTNAM
MASON
CABELL
WAYNE
MINGO
LOGAN
RALEIGH
MERCERMCDOWELL
MONROE
MORGAN
BERKELEY
JEFFERSON
The West Virginia Rural Health Education Partnerships(RHEP) comprise nine training consortia statewide. Theprogram has formed a partnership with the federallyfunded West Virginia Area Health Education Centers(AHEC) to provide community-based education andtraining across the state. The AHEC grant is adminis-tered by the West Virginia University Office of RuralHealth, which also administers the RHEP program.
Northern West Virginia Rural Health Education Center Eastern West Virginia Rural Health Education CenterSoutheastern Education ConsortiumWinding Roads Health Consortium The Gorge ConnectionWestern Valley Health Education Consortium - Fort GayWestern Valley Health Education Consortium - Pt. PleasantKanawha Valley Health Consortium Southern Counties ConsortiumShared Counties
17m
ed
ic
al
e
du
ca
ti
on
re
te
nt
io
n
r
ur
al
h
ea
lt
hr
ec
ru
it
me
nt
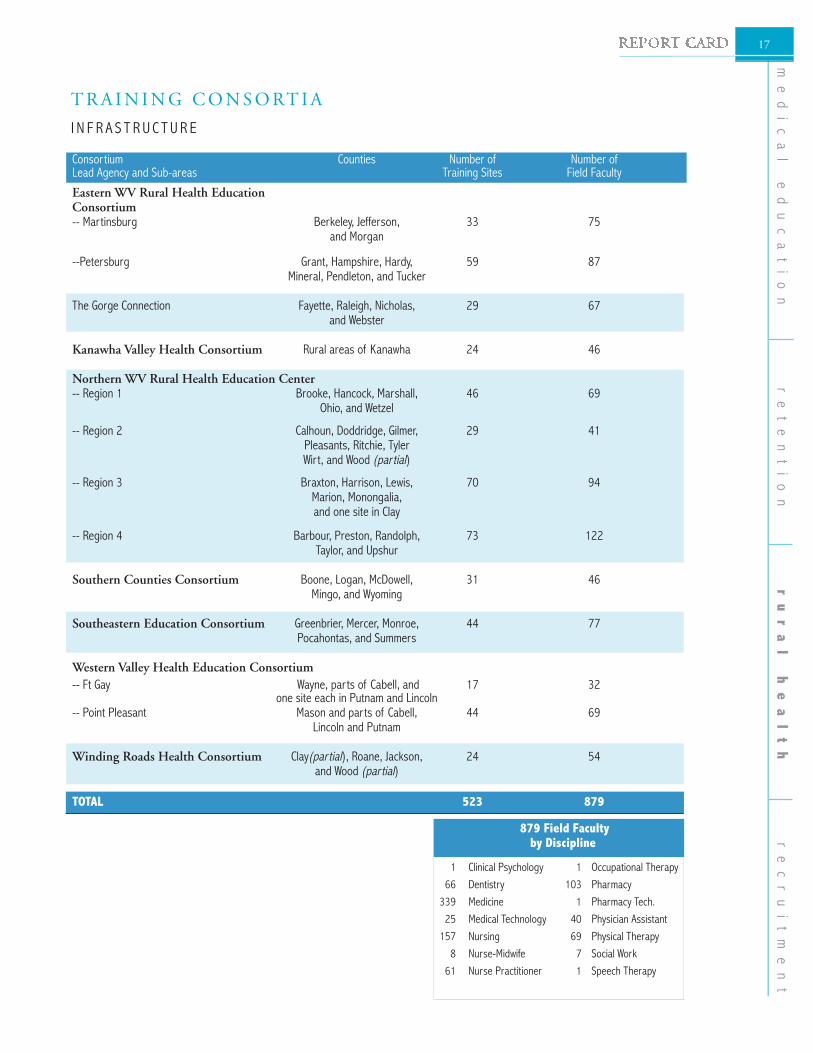
TRA IN ING CONSORTIA
I N F R A S T R U C T U R E
Consortium Counties Number of Number of Lead Agency and Sub-areas Training Sites Field Faculty
Eastern WV Rural Health Education Consortium -- Martinsburg Berkeley, Jefferson, 33 75 and Morgan
--Petersburg Grant, Hampshire, Hardy, 59 87 Mineral, Pendleton, and Tucker
The Gorge Connection Fayette, Raleigh, Nicholas, 29 67 and Webster
Kanawha Valley Health Consortium Rural areas of Kanawha 24 46
Northern WV Rural Health Education Center -- Region 1 Brooke, Hancock, Marshall, 46 69 Ohio, and Wetzel
-- Region 2 Calhoun, Doddridge, Gilmer, 29 41 Pleasants, Ritchie, Tyler Wirt, and Wood (partial)
-- Region 3 Braxton, Harrison, Lewis, 70 94 Marion, Monongalia, and one site in Clay
-- Region 4 Barbour, Preston, Randolph, 73 122 Taylor, and Upshur
Southern Counties Consortium Boone, Logan, McDowell, 31 46 Mingo, and Wyoming
Southeastern Education Consortium Greenbrier, Mercer, Monroe, 44 77 Pocahontas, and Summers
Western Valley Health Education Consortium
-- Ft Gay Wayne, parts of Cabell, and 17 32 one site each in Putnam and Lincoln-- Point Pleasant Mason and parts of Cabell, 44 69 Lincoln and Putnam
Winding Roads Health Consortium Clay(partial), Roane, Jackson, 24 54 and Wood (partial)
totaL 523 879
879 Field Faculty by discipline
1 Clinical Psychology 1 Occupational Therapy
66 Dentistry 103 Pharmacy
339 Medicine 1 Pharmacy Tech.
25 Medical Technology 40 Physician Assistant
157 Nursing 69 Physical Therapy
8 Nurse-Midwife 7 Social Work
61 Nurse Practitioner 1 Speech Therapy

WE
ST
V
IR
GI
NI
A
HI
GH
ER
E
DU
CA
TI
ON
P
OL
IC
Y
CO
MM
IS
SI
ON
|
H
ea
Lt
H
SC
Ie
NC
eS
a
Nd
R
UR
aL
H
ea
Lt
H
18
TRA IN ING CONSORTIA
E X P E N D I T U R E SJ u l y 1 , 2 0 0 8 – J u n e 3 0 , 2 0 0 9
CONSORTIALead Agency
Salaries and Benefits
On-Site Clinical Director
Operating Costs
Staff Travel and Development
Annual Honorarium
Faculty Development
Interdisciplinary Sessions
Graduate Medical Education
Recruitment and Retention
Community Service/Health Promotion
Student/Resident Housing
Property and Equipment
Administrative Cost-Lead Agency
Subtotal
SpeCIaL pRoJeCtS (Other Programs)
CARDIAC Program Expenses
WV Geriatric Education Center Grant Expenses
Oral Health Project Expenses
Tobacco Mini Grant
Subtotal
totaL pRoJeCt CoSt
LeSS otHeR INCoMe
Other RHEP Income Earned
Lead Agency Funds Contributed
CARDIAC Income
WV Geriatric Education Center Grant Income
Other Grants/Special Project Income
Oral Health Project
totaL RHep GRaNt eXpeNdItUReS
EASTERN WVRHEC Grant Memorial
Hospital
157,251
-
30,280
7,001
26,873
-
6,737
22,000
275
9,135
40,063
6,700
23,083
$329,398
4,791
7,500
-
3,580
$15,871
$345,269
(1,422)
(12)
(6,408)
(7,500)
(3,580)
(248)
$326,099
GORGE CONNECTION New River Health
Association
100,730
18,200
22,669
19,049
44,117
4,718
6,341
-
8,199
7,491
31,017
-
14,700
$277,231
-
8,383
-
2,000
$10,383
$287,614
-
-
-
(8,383)
(2,000)
-
$277,231
KANAWHA VALLEY Cabin Creek Health Center
56,134
11,040
17,834
11,022
5,603
3,189
5,969
-
1,000
9,501
738
-
9,185
$131,215
-
3,078
-
-
$3,078
$134,293
-
-
-
-
-
-
$134,293
NORTHERN WVRHEC Tri-County Health Clinic
312,678
25,000
65,155
37,795
-
2,645
30,582
9,598
1,000
17,145
85,060
1,699
55,749
$644,106
17,702
2,419
-
3,565
$23,686
$667,792
(909)
-
(13,320)
(14,345)
(4,000)
(2,792)
$632,426

19
24%
12%
11%
7%7% 6%
13%
12%
6%
2005-06 2006-07 2007-08 2008-09
6
2005-06 2006-07 2007-08 2008-09
6
E a s t e r nG o r g eK a n a w h aN o r t h e r nS o u t h e a s t e r n
SOUTHEASTERN EDUCATION
Rainelle Medical Center
104,762
34,000
41,927
18,670
23,900
1,354
1,000
-
-
5,100
43,361
-
12,000
$286,074
2,565
4,851
-
-
$7,416
$293,490
-
-
(4,740)
(8,500)
-
-
$280,250
SOUTHERN COUNTIES WVU Research Corporation
155,095
10,000
16,021
8,498
24,950
-
2,210
-
-
462
33,695
-
22,379
$273,310
3,185
-
-
-
$3,185
$276,495
-
-
(3,024)
-
-
-
$273,471
WESTERN VALLEY - FT GAY Valley Health System
65,365
22,333
2,142
1,759
20,000
1,709
8,000
1,000
-
-
7,654
-
26,341
$156,303
-
-
-
-
-
$156,303
-
-
-
-
-
-
$156,303
WINDING ROADS Jackson General Hospital
89,629
-
14,864
3,435
13,600
-
1,800
-
-
1,967
23,034
-
-
$148,329
593
4,521
-
3,700
$8,814
$157,143
-
-
(1,158)
(5,686)
(8,850)
-
$141,449
TOTALS
1,138,076
130,573
222,407
111,689
159,043
13,615
63,689
49,098
10,474
50,801
270,807
8,399
178,748
$2,407,419
34,098
30,752
-
12,845
$77,695
$2,485,114
(2,331)
(12)
(32,772)
(44,414)
(18,430)
(3040)
$2,384,115
WESTERN VALLEY -PT PLEASANT
Pleasant Valley Hospital
96,432
10,000
11,515
4,460
-
-
1,050
16,500
-
-
6,185
-
15,311
$161,453
5,262
-
-
-
$5,262
$166,715
-
-
(4,122)
-
-
-
$162,593
R H e p S tat e G R a N t e X p e N d I t U R e S$2,384,115
S o u t h e r nW e s t e r n Va l l e y - F t . G a yW e s t e r n Va l l e y - P t P l e a s a n tW i n d i n g R o a d s

WE
ST
V
IR
GI
NI
A
HI
GH
ER
E
DU
CA
TI
ON
P
OL
IC
Y
CO
MM
IS
SI
ON
|
H
ea
Lt
H
SC
Ie
NC
eS
a
Nd
R
UR
aL
H
ea
Lt
H
20
TRA IN ING CONSORTIA
879
664 682750
841
0905 06 07 08
1000
800
600
400
200
0
523
442476
498533
0905 06 07 08
600
500
400
300
200
100
0
1438
1247 1235 1234 1259
0905 06 07 08
1400
1200
1000
800
600
400
200
0
West Virginia RHEP field faculty are active rural practitioners whoalso teach students. In 2009, three regional faculty development sessions were held jointly with Area Health Education Centers toimprove teaching skills. A total of 100 field faculty, institutionalstaff, and others attended these regional meetings.
RHEP F ie ld Facu l t y
RHEP Tr a in ing S i t es
R H E P S t u d e n t R o t a t i o n s

21m
ed
ic
al
e
du
ca
ti
on
re
te
nt
io
n
r
ur
al
h
ea
lt
hr
ec
ru
it
me
nt
2005-06 2006-07 2007-08 2008-09
689700
600
500
400
300
200
100
0
611
559
498 492
201
168
211 189225
265234 238
318283
4841 48 45 46
235193 180 184
213
3
Allied HealthDentistryPharmacyNursingMedicine
2005-06 2006-07 2007-08 2008-09
6
3116
3500
3000
2500
2000
1500
1000
500
0
2759
2579
22742263
2585
2131
2422
2769
3057
1058958 923
12981164
291291 303 286 313
10941148
10701035 997
Allied HealthDentistryPharmacyNursingMedicine
2004-05 2005-06 2006-07 2007-08 2008-09
6
R H E P S t u d e n t W e e k s b y Ye a r / D i s c i p l i n e
STUDENT ROTAT IONS
2 0 0 5 - 2 0 0 9
R H E P R o t a t i o n s b y Ye a r / D i s c i p l i n e
WE
ST
V
IR
GI
NI
A
HI
GH
ER
E
DU
CA
TI
ON
P
OL
IC
Y
CO
MM
IS
SI
ON
|
H
ea
Lt
H
SC
Ie
NC
eS
a
Nd
R
UR
aL
H
ea
Lt
H
22
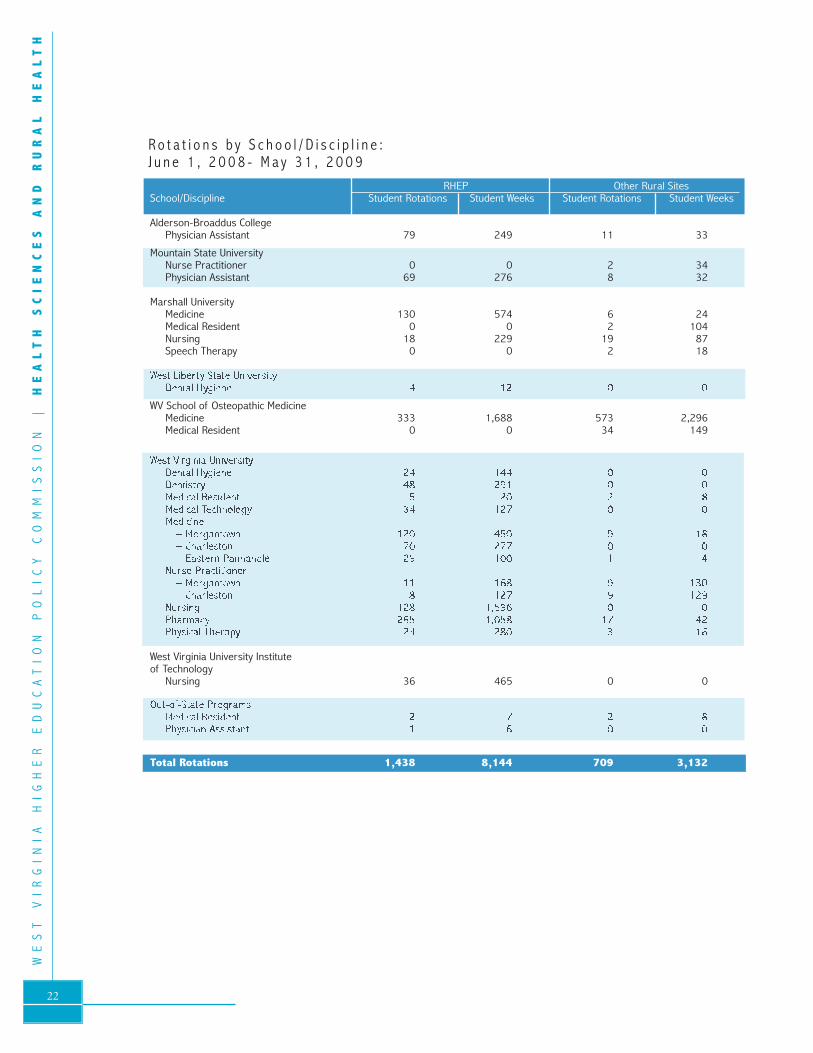
RHEP Other Rural Sites School/Discipline Student Rotations Student Weeks Student Rotations Student Weeks
Alderson-Broaddus College Physician Assistant 79 249 11 33
Mountain State University Nurse Practitioner 0 0 2 34 Physician Assistant 69 276 8 32
Marshall University Medicine 130 574 6 24 Medical Resident 0 0 2 104 Nursing 18 229 19 87 Speech Therapy 0 0 2 18
West Liberty State University Dental Hygiene 4 12 0 0
WV School of Osteopathic Medicine Medicine 333 1,688 573 2,296 Medical Resident 0 0 34 149
West Virginia University Dental Hygiene 24 144 0 0 Dentistry 48 291 0 0 Medical Resident 5 20 2 8 Medical Technology 34 127 0 0 Medicine – Morgantown 120 450 9 18 – Charleston 70 277 0 0 – Eastern Panhandle 29 100 1 4 Nurse Practitioner – Morgantown 11 168 9 130 – Charleston 8 127 9 129 Nursing 128 1,596 0 0 Pharmacy 265 1,058 17 42 Physical Therapy 24 280 3 16
West Virginia University Institute of Technology Nursing 36 465 0 0 Out-of-State Programs Medical Resident 2 7 2 8 Physician Assistant 1 6 0 0
total Rotations 1,438 8,144 709 3,132
R o t a t i o n s b y S c h o o l / D i s c i p l i n e : J u n e 1 , 2 0 0 8 - M a y 3 1 , 2 0 0 9

23m
ed
ic
al
e
du
ca
ti
on
re
te
nt
io
n
r
ur
al
h
ea
lt
hr
ec
ru
it
me
nt
COMMUNITY SERV ICE CONTACTS
J U N E 1 , 2 0 0 8 - M AY 3 1 , 2 0 0 9
Prevention and Education Prevention and Education Prevention and Education Total Consortium for General Public for Adults for Children
Eastern WV Rural Health Education Consortium
Martinsburg 603 1,128 9,340 11,071
Petersburg 857 1,069 4,997 6,923
The Gorge Connection 0 2,555 4,980 7,535
Kanawha Valley Health Consortium 430 318 2,518 3,266
Northern WV Rural Health Education Center
Region 1 264 781 5,455 6,500
Region 2 60 751 2,182 2,993
Region 3 649 2,447 6,800 9,896
Region 4 1,602 3,415 5,849 10,866
Southern Counties Consortium 881 986 3,452 5,319
Southeastern Education Consortium 585 668 2,091 3,344
Western Valley Health Education Consortium
Fort Gay 0 322 434 756
Point Pleasant 844 634 2,691 4,169
Winding Roads Health Consortium 0 981 1,673 2,654
total Community Service Contacts 6,775 16,055 52,462 75,292
RHEP provides community services and education on topics such as oral hygiene, skin care, asthma, nutrition/fitness, oral hygiene, and osteoporo-sis. The program links its prevention and education programs to the WestVirginia Healthy People 2010 objectives to ascertain where student effortsare being directed across the state. RHEP strives to provide students withservice-learning opportunities that are linked to their clinical and educa-tional learning objectives.
CARDIAC is a research project that provides cardiovascular screening, intervention, and healthy lifestyles education statewide. The project is carried out locally through RHEP and the public school system. RHEP site coordinators provide local coordination and testing supplies for thescreening, and RHEP students, under local preceptor supervision, providethe manpower. Since 1998, CARDIAC has screened almost 61,000 fifthgraders for cardiovascular risk factors. In recent years, CARDIAC hasexpanded screening to younger children. To date, more than 14,000kindergarten and 10,000 second graders have been screened for cardiovas-cular risk factors.
In 2008-09, RHEP dental and dental hygiene students provided 10,417clinical procedures. Students and faculty participated in 323 outreach activities. RHEP dental sites, including dentists and students, providedover $3.9 million in uncompensated care.

WE
ST
V
IR
GI
NI
A
HI
GH
ER
E
DU
CA
TI
ON
P
OL
IC
Y
CO
MM
IS
SI
ON
|
H
ea
Lt
H
SC
Ie
NC
eS
a
Nd
R
UR
aL
H
ea
Lt
H
24
RECRUITMENT
H e a l t h P r o f e s s i o n a l s w i t h R H E P R o t a t i o n s P r a c t i c i n gi n R u r a l A r e a s o f t h e S t a t e
Recruitment Incentives for Rural Practice
West Virginia Higher Education Policy Commission Health Sciences Scholarship Program - 103 WV Rural Health Education Partnerships SEARCH Training Stipends - 41 Community Scholarship Program - 6 Bureau for Public Health, Division of Rural Health & Recruitment Recruitment & Retention Community Project - 105 State Loan Repayment Program - 36 NHSC Loan Repayment Program - 12 TOTAL 303 Awards State scholarships and loan repayment are coordinated by the RHEP Recruitment and Retention Committee to target financial incentives to students and physician residents with rural training. Some practitioners have received awards from two or more programs. As of 2009, 225 rural practitioners have received a total of 303 awards. The agencies and programs shown above provided these awards. The National Health Service Corps (NHSC) Loan Repayment Program is included because the Bureau for Public Health assists physicians in applying to this program.
Discipline Number in Rural Practice Number who Received Financial Incentives
Physicians (1991-2006 graduates) 300 114 (38%)
Nurse Practitioners/Nurse Educators 124 53 (43%)
Nurse-Midwife 1 -
Physician Assistants 184 53 (29%)
Nurses 154 -
Dentists 115 2 (2%)
Dental Hygienists 30 -
Pharmacists 216 -
Physical Therapists 62 3 (5%)
Occupational Therapist 1 -
Medical Technologists 12 -
Masters in Public Health 1 -
Social Worker 1 -
totaL 1,201 225 (19%)
Data on physicians include graduates from 1991-2006 who have completed residency training.Data on all other disciplines include graduates from 1991-2009.

me
di
ca
l
ed
uc
at
io
n
r
et
en
ti
on
ru
ra
l
he
al
th
re
cr
ui
tm
en
t
25
300
250
200
150
100
50
0
300
92103
124
0900 01 02 03 04 05 06 07 08
142165
187213
264289
88
99
P h y s i c i a n s w i t h R H E P R o t a t i o n s P r a c t i c i n g i n R u r a l A r e a s o f W e s t V i r g i n i a , 1 9 9 9 - 2 0 0 9
P h y s i c i a n s
From 1999 to 2009, the number of physicians who completed RHEP rural rotations and are currently practicing in rural areas has increased steadily. These numbers include physicians who completed rural rotations under RHEPand the federally funded Area Health Education Program. Each of the medical(DO & MD) graduates is re-verified annually so the count each year reflectsthe loss of some rural practitioners to urban and out-of-state practice. Despitethis expected loss, the number of state medical graduates in rural practice has increased in the past 11 years at an annual rate of 13.0%.
9
WETZEL
HANCOCK
BROOKE
OHIO
MARSHALL
MONONGALIA
PRESTONMARIONTYLER
PLEASANTS
HARRISONTAYLOR
DODDRIDGE
BARBOUR
WOOD
JACKSON
UPSHUR
RITCHIE
GILMER
TUCKER
ROANE
GRANT
PENDLETON
HAMPSHIREMINERAL
HARDY
RANDOLPH
LEWIS
BRAXTON
CALHOUN
WIRT
KANAWHA
WEBSTERCLAY
NICHOLAS
WYOMING
GREENBRIER
POCAHONTAS
SUMMERS
FAYETTEBOONE
LINCOLN
PUTNAM
MASON
CABELL
WAYNE
MINGO
LOGAN
RALEIGH
MERCERMCDOWELL
MONROE
MORGAN
BERKELEY
JEFFERSON
2
3
6
2
14
1
2
1
13
3
4
29
2
0
3
1
7
10
4
6
3
11
2
0
6
7
17
5
1
5
1
8
1
2
0
5
7
7
35
16
0
4
1
1
2
3
13
4
1
1
0
2
2
5
A total of 300 physicians with RHEP rotations were practicing in rural areas of the state in 2009. They include graduates from 1991-2006. A total of 114 (38%) of these physicians received state financial incentives. Placements are counted as rural if the physician is practicing in a location that qualifies as a site for a rural rotation or if the site is a federally qualified health center (FQHC) or free clinic.
P h y s i c i a n s w i t h R H E P R o t a t i o n s P r a c t i c i n g i n R u r a l A r e a s i n 2 0 0 9
0
1 - 3
4 - 7
8 - 1 7
1 8 - 3 5

WE
ST
V
IR
GI
NI
A
HI
GH
ER
E
DU
CA
TI
ON
P
OL
IC
Y
CO
MM
IS
SI
ON
|
H
ea
Lt
H
SC
Ie
NC
eS
a
Nd
R
UR
aL
H
ea
Lt
H
West Virginia Higher education policy Commission
HeaLtH SCIeNCeS
1 0 1 8 K a n a w h a B l v d E
C h a r l e s t o n , W V 2 5 3 0 1