Embed Size (px)
Citation preview

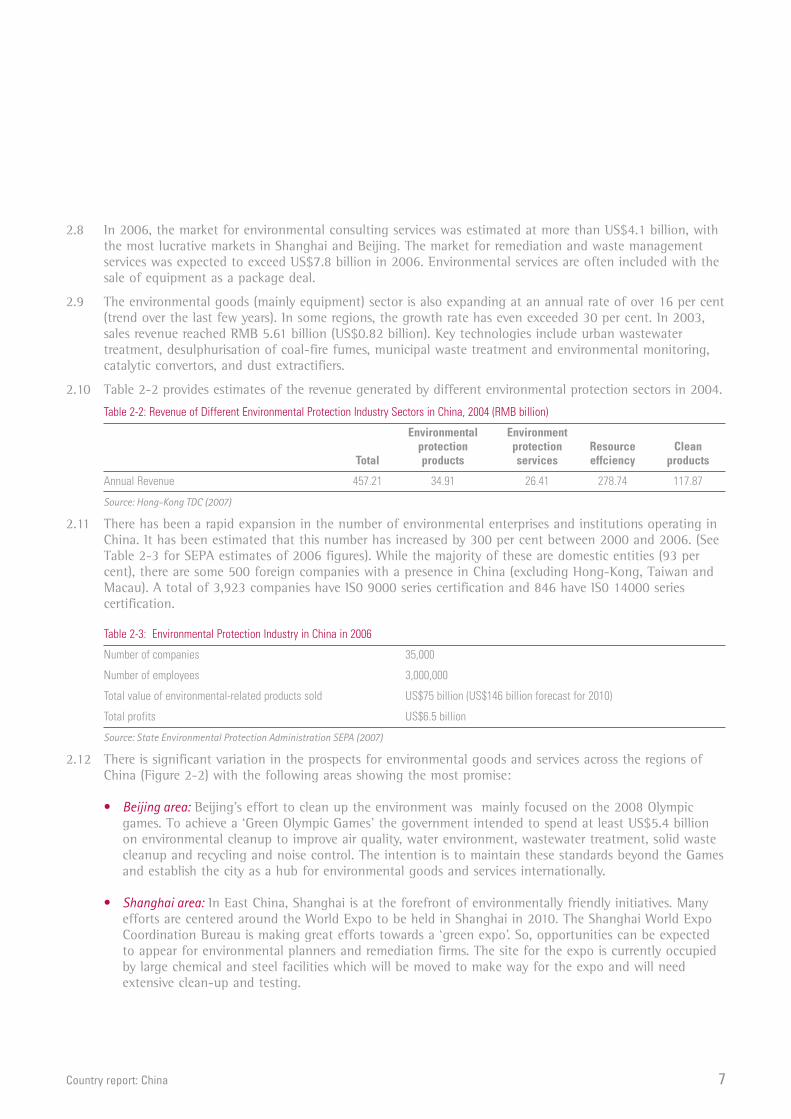
Market opportunities in environmental goods andservices, renewable energy, carbon finance and CATsCountry report: China
October 2008
Country report: China
Contents
Summary of market opportunities in environmental goods and services,renewable energy, carbon finance and CATs in China 1
1: Introducing the Chinese market 3
2: The market for environmental goods and services in China 5
3: The market for carbon abatement technologies, renewable energy and carbon finance in China 12
4: Policy and regulatory frameworks 18
Annex A: Definitions of environmental goods and services, renewable energy, carbon finance and CATs 21
Annex B: Additional information 24
Annex C: Bibliography 26
This report is one of seven on the opportunities for exports to, and direct investment and joint ventures in, themarkets for environmental goods and services (EGS), carbon abatement technologies (CATs), renewable energy andcarbon finance in selected countries (see Annex A for definitions of these sectors). It should be noted that thenuclear sector was excluded from the review. The other countries are Australia, Brazil, India, South Africa, Turkeyand the USA – representing a mix of emerging/high growth and developed overseas markets in these sectors.
The findings from the reports have been fed into an overview report which:
• provides an assessment of the UK’s competitive advantage in EGS, CATs, renewable energy and carbon finance,
• maps this onto the market opportunities as revealed from the case studies, and
• suggests the opportunities for UK exporters and direct investors by market and sector.
The report considers the general market opportunities presented in the selected countries. It is based on deskresearch that drew on the most readily available and accessible information sourced from within the countryconcerned and from international agencies.
It provides background designed to be helpful in focusing the more detailed investigations that will need to becarried out by anyone interested in selling to or investing in the relevant markets and countries.
The report does not assess specific opportunities for UK exporters and/or investors – or their appropriate route tomarket. However, it shows where there are significant market opportunities in environmental goods and services,renewable energy, carbon finance and CATs.
Country report: China 1
Summary of market opportunities inenvironmental goods and services, renewableenergy, carbon finance and CATs
Opportunities1 There are significant prospects for exporting and/or direct investment in waste management, water and
wastewater treatment, as well as in low carbon energy generation capacity and renewable energy. Carbonfinance is a key opportunity as China is the biggest player in the world in Clean Development Mechanisms(CDM), generating the largest volume of carbon credits (CERs). A map of current and future opportunitiesin the environmental and low carbon markets in China is set out below.
Sector Current opportunities* Future opportunities Policy framework (current)
Environmental Goods and Services (EGS)
Air pollution & control � ☺ Poor
Cleaner technologies � ☺
Energy management � ☺ Poor but improving
Environmental consultancy � ☺ Not developed
Environmental monitoring � ☺ Poor
Marine pollution � ☺ Poor
Noise & vibration
Land remediation � � Poor
Waste management ☺ ☺ Fair and improving
Water supply ☺ ☺ Fair
EGS overall � ☺ Fair and improving
Carbon Abatement Technologies (CAT)
CCS � ☺ Not developed
Generation technologies ☺ ☺ Fair
Low carbon fuels � ☺ Fair
Asset management � ☺ Fair
CAT overall � ☺ Fair to Good
Other opportunities
Renewable energy ☺ ☺ Good
Carbon finance ☺ ☺ Good
Key ☺Relatively large market size and activity, relatively demanding regulation, relatively high publicexpenditure in this sector and relatively liberal trade and investment regime
�Mix of modest market size and activity, modestly demanding regulation, modest publicexpenditure and liberalising but still restrictive trade and investment
�No or minimal market size and activity, no regulation, and restrictive trade and investmentregime
No or inadequate information
* The assessment of current opportunities is based on the most recent official data and information on market size and sector activity. In many casesthis can refer to 2005 figures and as such certain conclusions in this report may not capture very recent developments in some sectors orannouncements concerning the near future. A variety of sources, methods and time-frames was drawn on to assess future opportunities – coveringthe next five-ten years based on government policies and/or budget allocations and/or independent forecasts and projections.

Country report: China 2
MARKET ENTRY OPTIONS2 The trade and inward investment regime in China is reasonably liberal and favourable to the possible
market entry routes. However, there may be specific terms and conditions which the Chinese authoritiesmight expect to be met with regard to imports, inward investment and/or joint ventures in the marketsreviewed in this report. The availability of possible market entry strategies is summarised below:
Route to market Availability Comment
Export • China imports a large proportion of its needs for EGS, CAT and other low-carbongoods and services. The trading regime is gradually becoming more liberal.
Foreign direct investment (FDI) • FDI is strong and generally on an upward trend.
Joint venture (JV) • Chinese authorities strongly favour local firms and therefore setting up a countryoffice or a joint venture with a local company is useful. Local firms actively seekforeign partners for build-operate-transfer contracts.
Source: SQW Consulting
Gaps in the evidence base3 A thorough trawl of readily available reports, studies and policy statements with regard to the markets
under review and consultations with stakeholders found little evidence on the opportunities in China in thenoise and vibration market.
4 While information is abundant overall, different sources report against varying sector definitions andindicators. These have been reconciled and consistency introduced to the extent practical. More detailedand perhaps systemised information could undoubtedly be found on specific market opportunities andconstraints from specialised and technical policy statements/guidance, journals and trade press. However, itwas beyond the terms of reference for this review to investigate the opportunities in this degree of detail.
5 The report should be read as an introduction to the most significant opportunities in China. It has beendesigned to provide a focus for the more detailed investigations that will need to be carried out by anyoneinterested in selling to or investing in the specific markets.

Country report: China 3
Key facts1.1 China is now the fourth largest national economy in the world by nominal GDP (US$3.42 trillion in 2007)
and in second place according to purchasing power parity GDP. The annual average GDP growth rate of10 per cent since the 1990s has been fuelled in part by China’s export-oriented economy but it is also ahuge domestic market of an estimated 1.3 billion people, absorbing US$953 billion of imports in 2007. Theeconomy has moved from a centrally planned to a more market driven model with an expanding privatesector, dominated by some 200 large companies concentrated in utilities, heavy industry and energyresources. The country’s largest bank, the Industrial and Commercial Bank of China (ICBC) is currently theworld’s biggest (by market value).
CHINA – KEY FACTS (2001-2006)
2001 2002 2003 2004 2005 2006
GDP growth (annual %) 8.3 9.1 10 10.1 10.2 10.7
Energy intensity (BTU per (US$2,000) 6738 6788 7232 7758 7906 —
Energy imports – net (Mtoe) — — — — 100.12 —-
Carbon dioxide emissions per capita (tCO2) 2.67 2.82 3.28 3.84 — —
Imports of goods/services (% GDP) 31 31 31 35 34 34
FDI – disbursements (US$ billion) 46.9 15.1 53.5 60.6 60.3 63.0
Source: EIA (2007) and UN ( 2007)
Drivers of environmental goods and services, renewable energy, carbon finance and CATs1.2 China is facing severe environmental problems stemming from a wide variety of factors: its rapid industrial
growth; its spatially concentrated population; its consumption of natural resources (especially its heavyreliance on soft coal); outdated technology; under-priced water and energy; insufficient infrastructure; andineffective enforcement of environmental protection laws. Significant efforts are being made to addressthese factors and the sectors of environmental goods and services, renewable energy, carbon finance andCATs are growing steadily.
1.3 There is currently a stronger focus on environmental services, defined as comprising: environmentalengineering, environmental consulting, environmental monitoring, pollution control facility operation, researchand development of environmental technology and products, environmental trade and financial services(HKTDC 2007).
1.4 China’s environmental service industry dates back to the 1970s, and recorded a high annual growth rate ofapproximately 25 per cent between 1994 and 2005. This was primarily a result of the Chinese Government’sincreasing effort to clean up the polluted environment. Despite this high growth, the industry is stillrelatively underdeveloped, with a weak infrastructure, inadequate innovation, and lack of market-drivendemand.
1: Introducing the Chinese marketThis section provides background information on the Chinese economy and the drivers andinternational legal dispositions affecting the growth of the market of the environmental goodsand services, renewable energy, carbon finance and CATs.

Country report: China 4
International legal dispositions1.5 China is party to over 50 international legal dispositions in the area of the environment. Its status against
some key ones are presented below:
Table 1-1: Status of China against key international conventions relating to the environment
International convention China’s status
UN Framework Convention on Climate Change Ratified
Kyoto Protocol Ratified
Ramsar Convention Ratified
Long-range Transboundary Air Pollution Convention Ratified
Vienna Convention for the Protection of the Ozone Layer Ratified
Montreal Protocol on Substances that Deplete the Ozone Layer Ratified
Basel Convention on the Control of Transboundary Movements of Hazardous Wastes and their Disposal Ratified
Convention on Biological Diversity Ratified
Source: SQW Consulting

Country report: China 5
2: The market for environmental goods andservices in ChinaThis section describes the growth market for environmental goods and services (EGS) in Chinaand outlines the drivers of this growth. It then provides more information on those segmentspresenting significant market opportunities.
Market growth and its drivers2.1 According to China's Green National Accounting Study Report (2004), the economic loss caused by
environmental pollution was RMB 511.8 billion (US$74.9 billion)1, or 3 per cent of GDP. Of this, waterpollution accounted for RMB 286.3 billion (US$41.9 billion) (56 per cent of the total), air pollutionaccounted for RMB 219.8 billion (US$32.2 billion) (43 per cent), and solid wastes and pollution incidentscost RMB 5.74 billion (US$0.84 billion) (1 per cent). However, a New York Times report (August 2007)suggested that the Chinese authorities themselves were concerned that these estimates may be conservative.The Economist (March 2008) reported that Pan Yue, a deputy minister at the State EnvironmentalProtection Administration (SEPA), estimated that the total annual cost of environmental damage was8-13 per cent of GDP.
2.2 As documented in the World Bank/SEPA report of 2007, China faces severe environmental problems andcosts particularly with regard to air pollution and water quality and treatment. Other areas of environmentalconcern are the rising volumes of waste and land consumption caused by the pace of China’s economicgrowth. A number of ‘traditional’ environmental problems, endemic for centuries – eg drought, flooding,desertification and erosion – have been exacerbated by more recent human intrusion.
2.3 Total environmental pollution treatment expenditure in 2006 was just over a quarter of a trillion RMB(US$37 billion), equivalent to 1 per cent of GDP – a level sustained for the last five years. A range ofsectors and services are being invested in consistently, as shown in Table 2-1, but – as most commentatorspoint out – far below the actual amount required and demanded nationally.
Table 2-1: Environmental expenditure in China, 2002-2006, in RMB million
Category 2002 2003 2004 2005 2006
Environmental pollution treatment expenditure
Total 136,700 162,800 191,000 238,800 256,600
Total (as % of GDP) 1 1 1 1 1
Expenditure on environmental infrastructure and services (in descending order in 2006)
Urban Drainage 27,500 37,520 35,230 36,800 33,150
Waste Gas 6,980 9,210 14,280 21,296 23,330
District Heating 12,140 14,580 17,340 22,020 22,360
Environmental Sanitation 6,480 9,600 10,780 14,780 17,580
Urban Gasification 8,840 13,350 14,830 14,240 15,500
Wastewater Treatment 7,150 8,740 10,560 13,371 15,110
Solid Waste Management 1,610 1,620 2,260 2,742 1,830
Noise Pollution 100 100 130 306 300
Other 2,990 2,510 3,570 8,100 7,830
Total 73,790 97,230 108,980 133,655 136,990
Environmental investment by type of intervention
New Projects 23,800 22,010 32,620 46,710 58,490
Project Expansion 6,700 5,670 6,880 11,110 9,180
Technical Improvement 8,470 5,670 6,550 6,190 9,050
Total 38,970 33,350 46,050 64,010 76,720
source: National Bureau of Statistics (2007)
1 Exchange rates are valid as of 08/09/2008. This approximates to 1 US Dollar = 6.83 Chinese Yuan

Country report: China 6
2.4 The environmental protection industry has grown steadily over the last decade reaching 3.3 per cent ofGDP or RMB 604.5 billion (US$604.5 billion) in 2005 according to the Hong Kong Trade DevelopmentCouncil (see Figure 2-1). Investment in pollution control hit a record high of around US$35 billion in 2006,an increase of 7.5 per cent from the previous year and equivalent to 1.2 per cent of annual GDP.
Figure 2-1: Environmental protection activities as percentage of GDP
2.5 Growth is expected to continue due to strong political and economic drivers. Under China's 11th Five-YearPlan (2006-2010), the environmental protection industry has been designated a priority industry, with afocus on pollution control and sustainable construction. Total investment in environmental protection willamount to RMB 1,400 billion (US$200 billion), of which RMB 260 billion (US$40 billion) is to be spent onnational programmes on waste management, hazardous waste disposal, wastewater treatment anddesulphurisation of industrial facilities. Stricter legislation and enforcement efforts have resulted in anincreased demand for environmental services, which make up about 45 per cent of the Chineseenvironmental industry. Engineering services, specifically, make up 27 per cent of the total market.
2.6 The 11th Five-Year Plan set standards for nationwide environmental protection and established a range oftargets. Energy intensity of GDP was to be lowered by 20 per cent; sulphur dioxide and chemical oxygendemand emissions were to be reduced by 10 per cent by 2010; and at least 70 per cent of urbanwastewater and 60 per cent of urban waste were to be treated. SEPA announced plans to invest aroundUS$160 billion in environmental protection (focusing on air and water) from 2006-2010 and launched theRural Area Small Scale Environmental Protection Scheme across the country, with a planned investment ofRMB 24.8 billion (US$3.6 billion) during the 11th Five-Year Plan period.
2.7 Driven by this plan, the environmental service industry will see a tremendous growth in the next five years.It is estimated that the annual revenue of the Chinese environmental service industry will reach 110 billionRMB (US$16 billion) by 2010, with an annual growth rate of 15-17 per cent. China plans to invest aroundRMB 20 billion (US$3 billion) to build up its environmental service capacity even further. Nevertheless, themarket still represents huge opportunities for foreign firms.
3.50%
3.00%
2.50%
2.00%
1.50%
1.00%
0.50%
0.00%1995 1996 1997 1998 1999 2000 2001 2002 2003 2004 2005
Source: Hong Kong TDC (2007)
Country report: China 7
2.8 In 2006, the market for environmental consulting services was estimated at more than US$4.1 billion, withthe most lucrative markets in Shanghai and Beijing. The market for remediation and waste managementservices was expected to exceed US$7.8 billion in 2006. Environmental services are often included with thesale of equipment as a package deal.
2.9 The environmental goods (mainly equipment) sector is also expanding at an annual rate of over 16 per cent(trend over the last few years). In some regions, the growth rate has even exceeded 30 per cent. In 2003,sales revenue reached RMB 5.61 billion (US$0.82 billion). Key technologies include urban wastewatertreatment, desulphurisation of coal-fire fumes, municipal waste treatment and environmental monitoring,catalytic convertors, and dust extractifiers.
2.10 Table 2-2 provides estimates of the revenue generated by different environmental protection sectors in 2004.
Table 2-2: Revenue of Different Environmental Protection Industry Sectors in China, 2004 (RMB billion)
Environmental Environmentprotection protection Resource Clean
Total products services effciency products
Annual Revenue 457.21 34.91 26.41 278.74 117.87
Source: Hong-Kong TDC (2007)
2.11 There has been a rapid expansion in the number of environmental enterprises and institutions operating inChina. It has been estimated that this number has increased by 300 per cent between 2000 and 2006. (SeeTable 2-3 for SEPA estimates of 2006 figures). While the majority of these are domestic entities (93 percent), there are some 500 foreign companies with a presence in China (excluding Hong-Kong, Taiwan andMacau). A total of 3,923 companies have IS0 9000 series certification and 846 have IS0 14000 seriescertification.
Table 2-3: Environmental Protection Industry in China in 2006
Number of companies 35,000
Number of employees 3,000,000
Total value of environmental-related products sold US$75 billion (US$146 billion forecast for 2010)
Total profits US$6.5 billion
Source: State Environmental Protection Administration SEPA (2007)
2.12 There is significant variation in the prospects for environmental goods and services across the regions ofChina (Figure 2-2) with the following areas showing the most promise:
• Beijing area: Beijing’s effort to clean up the environment was mainly focused on the 2008 Olympicgames. To achieve a ‘Green Olympic Games’ the government intended to spend at least US$5.4 billionon environmental cleanup to improve air quality, water environment, wastewater treatment, solid wastecleanup and recycling and noise control. The intention is to maintain these standards beyond the Gamesand establish the city as a hub for environmental goods and services internationally.
• Shanghai area: In East China, Shanghai is at the forefront of environmentally friendly initiatives. Manyefforts are centered around the World Expo to be held in Shanghai in 2010. The Shanghai World ExpoCoordination Bureau is making great efforts towards a ‘green expo’. So, opportunities can be expectedto appear for environmental planners and remediation firms. The site for the expo is currently occupiedby large chemical and steel facilities which will be moved to make way for the expo and will needextensive clean-up and testing.

Country report: China 8
• Guangdong area: It is estimated that over 3 per cent of GDP in Guangdong Province will be invested onthe environment by 2010. According to the Environmental Protection Bureau of Guangdong, theprovince plans to allocate RMB 135.6 billion (US$19.8 billion) to fund six significant environmentalprojects that include the treatment of solid waste, desulphurisation, ecologic system protection,radioactive waste treatment, environmental monitoring systems, and sewage treatment.
• Within the next five to ten years, the construction of 163 sewage treatment plants is expected to becompleted in order to clean up the heavily contaminated Pearl River. Another 64 sewage treatmentfacilities are being planned to treat the Han River, Rong River, and Lian River in eastern Guangdong.An active major project is the Guangdong Pearl River Delta Urban Environment Project, financed by aUS$128 million loan from the World Bank and a US$10 million grant from the United States’ GlobalEnvironment Fund (GEF). This project, designed to address the environmental problems of the PearlRiver Delta and the South China Sea, is expected to be completed by December 21, 2009 with totalinvestment estimated to reach US$5.5 billion.
• Sichuan area: In the next five years, Sichuan province plans to achieve the following goals: 55 per centof the cities to exceed urban air quality Standard II; urban wastewater treatment rate to exceed 50 percent; and the rate of urban solid waste treatment to be 65 per cent. Environmental industry outputvalue will amount to 5 per cent of the provincial GDP. Currently, the provincial government strategy isto enhance environmental protection and build Sichuan as an ecological province. The three objectivesset forth in the Sichuan Provincial 11th Five-Year Plan are to enhance treatment of industrial wastewateroutlet sources, urban solid waste outlet sources, and rural pollution outlet sources.
Figure 2-2: Regions where there is particularly strong activity in environmental goods and services
Source: SQW adapted from US Commercial Service
Xinjiang
CHINA
Tibet
Qinghai
Gansu Inner Mongolia
YunanGuanxi
GuizhouHunan
Hubei
Shaanxi
Shanxi
Hebei
Liaoning
Jilin
Heilongjiang
Jiangxi
Guangdong
Fujian
Sichuan
Zhejiang
Anhui
Henan
Shandong
Tianjing
Ningxia
Jiangsu
Shanghai
Taiwan
Hainan
Beijing

Country report: China 9
2.13 China's environmental protection related industries are mainly concentrated along the eastern coastal area,along the Yangtze River and in the economically more developed areas in central China. The developmentof the environmental protection industry in a region tends to be proportionate to the degree of itseconomic development. Figures for regions with the highest levels of activity are displayed in the tablebelow:
Table 2-4: Top eight provinces/municipalities with highest revenue from environmental protection-related industries, 2004
Annual Revenue Number of Number ofRegion (RMB billion) entities employees
Jiangsu 101.7 1,555 203,913
Zhejiang 64.4 1,507 159,719
Guangdong 51.1 943 124,530
Shandong 34.5 789 161,250
Liaoning 24.6 513 66,463
Shanghai 16.6 353 32,635
Fujian 16.3 569 54,368
Henan 16.0 373 66,160
Source: Hong-Kong TDC (2007)
Market segments2.14 The main environmental goods and services where there is most current and prospective activity are related
to waste management, water supply and management, air pollution prevention and management, andmarine pollution. It is important to note that there are significant regional variations within China in thescale and growth of these activities.
2.15 Most other segments also have good prospects in the future, once the policy and market mechanisms thatneed to underpin growth are properly embedded. These sectors include environmental consulting,environmental monitoring, cleaner technologies and energy management.
OPPORTUNITIES IN ENVIRONMENTAL GOODS AND SERVICES IN CHINA
Air pollution
Poor air quality is one of China’s worst environmental problems, particularly manifested in larger cities, where smog is a permanent feature.Dust, soot, sulphur dioxide (SO2) and nitrogen oxides (NOx) are the main air pollutants. China has 16 of the 20 cities with the worst air qualityin the world. The majority of cities in China exhibit maximum-category dust pollution (according to a World Bank study) and poor urban airquality causes around 250,000 deaths each year in China (according to WHO). Two-thirds of China’s urban population live in cities with bad orvery bad air quality.
Acid rain is another serious consequence of poor air quality. Acid rain falls regularly on about one-third of the Chinese land mass affecting thesoil, flora and ground water. SEPA estimates the losses in agriculture and forestry from acid rain at around US$ 13 billion per annum.
The main cause of air pollution is the operation of obsolete coal-fired power stations and industrial facilities (cement, steel and chemicalplants), most of which lack filter technology. Only about 5 per cent of coal-burning power plants in China are equipped with desulphurisationfacilities. Most coal-fired capacity has low conversion ratios. China’s energy supply is concentrated on coal, which comprises 65-67 per cent ofthe total primary energy consumption. This is likely to remain the case with 50-60 GW new coal-based generation capacity added to the gridevery year.
However, China now requires that all power plants install flue gas desulphurisation facilities (FGD) by 2010 to reduce SO2 emissions. Toreduce the financial burden on power plants, the government offers subsidies and rebates for these facilities. There are 175 cities and 29provinces (mainly in the southwest part of the country) where land has been designated as ‘acid rain and SO2 control regions’. (ITC 2006). TheFGD market is expected to exceed US$7 billion over the next five years. The government recognises the need for foreign technologies andstrongly encourages local companies to enter into joint ventures with foreign enterprises. In 2005 alone, 91 FGD facilities were beingdeveloped.

Country report: China 10
In the cities, further air pollution arises from the growing levels of motorisation, exacerbated by the fact that most vehicles are not fitted withcatalytic converters or other filter technologies. In many regions, a large number of domestic coal-fired heating systems also dischargepollutants into the air.
Coal mine-related fires, a typical phenomenon in China, are another cause of poor air quality. About 100 million tonnes of coal is burned inthis way (and lost to the economy). Apart from ambient air pollution, such fires emit substantial quantities of CO2 and methane. Althoughinitiatives have been launched in China to extinguish coal mine fires, this is likely to take years.
There are specific opportunities for supply, installation and finance of FGD, particularly as retrofit. In future, there is a potential forestablishing an SO2 emissions market (similar to the US one). Plant decommissioning in the medium to long term will also generate significantbusiness opportunities.
Water supply and management
The shortage and pollution of water supplies is the second most severe environmental concern in China. Statistics show that between350 million (SEPA figures) and 700 million (World Bank figures) people have no access to clean drinking water and thus use contaminatedsources (Deutsche Bank Research 2006). SEPA states that about 75 per cent of the water in the country’s seven most important river systemsis of a quality unfit for human consumption. Only 7.5 per cent of the water from the inland fresh water lakes and artificial drinking waterreservoirs is of an acceptable standard. Half of the 660 statistically recorded cities in China (over 170 having more than a million inhabitants)suffer from seriously contaminated groundwater. In around 400 cities the groundwater is consumed more quickly than it is replenished,causing a steady drop in the groundwater table.
Although China significantly improved its water infrastructure with annual water supply at 549.7 billion m3 in 2002, there are still annualwater shortages of 40 billion m3. Accelerated urbanisation and high-speed economic growth in China continue to aggravate the watershortage problem.
There are considerable regional and seasonal variations in rainfall, groundwater and surface water distribution which poses significantproblems. Production losses in industry due to water shortages are increasingly more common. This is particularly acute in the drier regionswhere desertification claims around 3,000km² a year.
The South-to-North Water Diversion Project, the Three Gorges Project, the comprehensive pollution control and ecological rehabilitationproject in the Three-Rivers and Three-Lakes regions, and the National Western Development Project will account for an anticipated totalinvestment of approximately US$22 billion in water supply and wastewater treatment facilities by 2013.
Wastewater treatment
It is estimated that only a quarter of all wastewater in China is treated. Some progress has been made in recent years, but mainly withindustrial wastewater, where official figures suggest a 90 per cent treatment rate on average in urban areas. However, in most rural regions,domestic wastewater is not treated at all.
In 2003, China had only just over 500 municipal sewage treatment plants. In order to treat 50 per cent of the wastewater from domestichouseholds, 10,000 plants would be needed nationwide. Although legislation is in place requiring the construction of sewage treatment plantsfor cities with more than 500,000 inhabitants, thus far its implementation has fallen behind targets – due partly to a lack of funds. The directdischarge of wastewater into rivers and lakes is therefore the main cause of the country’s poor water quality in the first place. The situation iscompounded by over-fertilisation and excessive use of pesticides in agriculture and the leakage of industrial or domestic wastewater throughdefective sewage pipes.
To resolve the most pressing problems in the water sector (drinking water supply and wastewater removal) investment of at leastUS$200 billion is likely to be needed in the next 15 to 20 years, which is also acknowledged by the government. Implementation however ischallenging due to lack of capital and competing priorities.
Foreign capital and know-how will be needed. Foreign companies have been active in the Chinese water market for some time now. Build,operate, transfer (BOT) projects are a common model, particularly in urban areas. Co-operation agreements and joint ventures with localcompanies are other possibilities. The UK-owned China Water Company is a leading player in this sector.
Apart from the overall high demand for water treatment and supply and wastewater treatment facilities and capacity, the followingtechnology needs offer good opportunities:
• Biological denitrification and phosphorus removal technologies
• Membrane separation and manufacturing technologies and equipment
• Manufacturing technology of anaerobic biological reactors
• High-concentration organic wastewater treatment technology and equipment
• Series-standard water and wastewater treatment equipment with high efficiency
• Water-saving technologies and equipment

Country report: China 11
• Water treatment agents
• Monitoring instruments
• Natural water-body rehabilitation technology
Waste management
Waste generation is rising rapidly, in line with improvements in the standard of living, especially in urban areas. Growth of at least 10 percent per annum is forecast for the coming years. However, only 20 per cent of waste is disposed of in an environmentally compatible manner,although official statistics state higher figures for industrial waste (National Bureaus of Statistics). In many cases waste is taken tounsanctioned tips. Municipal authorities are often unable to cope with the increasing volume of waste.
China is in urgent need of modern waste incinerators and safe landfills (where no seepage into the groundwater or landfill gas occurs). Manylandfill sites receive hazardous wastes such as clinical waste, which remains untreated. Investment running into the billions is needed in thecoming years, holding out opportunities for foreign companies.
An important consideration however is the fact that charges are not generally levied on waste, which inhibits private investment in this area.It is likely that the authorities will address this issue.
Further opportunities exist in the design and construction of waste to energy plants, especially with regard to equipment supply and thedevelopment of new technologies – recycling technologies for waste electrical/electronic equipment.
Environmental consulting
The environmental protection services sector is growing but cannot meet the market demand in the fast-growing economy. There are goodmedium-term opportunities for providing environmental consultancy services such as environmental impact assessment, environmentaltraining and pollution treatment facility operation, environmental certification, environmental management, environmental technologyconsulting, environmental engineering consulting and environmental information. Some specific areas that are still weak in China include:analysis and testing involved in engineering design projects; product performance testing; and indoor environment quality and noise testing.For the time being firms have to partner with a local partner to deliver some of the above services, including design services.
Marine pollution
Specific information on marine pollution in China is limited and suggests that not much is being done to address this growing problem. Thestakeholder consultations carried out for this review confirmed this observation but indicated that, while current opportunities are limited,future prospects are promising. This stems from the government’s intentions to reinforce the regulatory framework on marine environment andthe overall drive to reduce environmental pollution particularly in highly populated areas concentrated along the coastal areas.
Source: SQW from various sources

Country report: China 12
3: The market for carbon abatement technologies,renewable energy and carbon finance in ChinaThis section summarises the readily available evidence on the market for carbon abatement technologies,renewable energy and carbon finance in China. It describes the general growth in the sectors and itsdrivers and presents information on those segments within the three sectors where there are significantopportunities.
3.1 China has an extraordinarily large energy industry which supports its fast growing economy. Sector growthis prominent across the various segments including conventional fossil fuel based capacity, industrial energyefficiency, renewable energy technologies and carbon finance.
Market growth and its drivers3.2 China’s rapid economic growth has prompted a massive increase in energy consumption which, in turn, has
given rise to an unprecedented rate of domestic fossil fuel extraction and the installation of powergeneration capacity. In 2006, electricity generation capacity reached 622 Gigawatt (GW), which produced2,870 Terra Watt Hours (TWh) – both values being second only to the USA in the world. An average of50-60 GW capacity additions annually have been observed in the recent years, a trend that is likely tocontinue. Since the 1980s, energy consumption has grown by 5.6 per cent per annum. On this basis, themarket can be estimated at around US$100 billion (applying an average installed cost of US$2,000 perMegawatt (MW) capacity across all power generation technologies).
3.3 Energy intensity in China, measured in primary energy consumption per unit of GDP, is still very highcompared with many developed countries despite considerable improvements over the last 20-30 years. It isestimated that efficiency in the energy sector, in particular, could potentially be increased by 30 to 50 percent. Industry could also adopt production methods that substantially reduce its energy consumption.
Market segments
Carbon abatement technologies
3.4 Significant opportunities are presented by the conventional power sector, which is growing and modernisingrapidly. There are specific opportunities in generation technologies and low carbon fuels.
OPPORTUNITIES IN CARBON ABATEMENT TECHNOLOGIES
Carbon capture and storage (CCS)
CCS is being considered in China for new generation capacity additions. Post combustion is the main option available. If CCS becomesrecognised for post-Kyoto abatement purposes, it will most likely become financially viable with an increase in uptake. Recent developmentsregarding CCS in China include the Near Zero Emissions Coal (NZEC) initiative, which forms part of the EU-China Partnership on ClimateChange (2005). It will aim ‘to develop and demonstrate in China and the EU advanced, near-zero emissions coal technology through carboncapture and storage’ by 2020. This establishes the vision of realising a large scale Near Zero Emissions Coal Fired Power Plant demonstrationin China.
Generation technologies
The Chinese government is actively shutting down or modernising many small and inefficient power plants in favour of medium-sized (300 to600 MW) and large (1,000 MW and above) units, which in many cases are using advanced technology. China’s 11th Five-year Plan (2006-2010)will drive the country towards increasing the share of natural gas and other cleaner technologies in the country’s energy mix. Coal will,however, remain the dominant fuel and there is a trend towards de-carbonising generation through higher efficiency plants. Clean-coaltechnology is also expected to feature prominently in future (ie CCS-ready plant).
According to a 2006 report by US Commercial Services (Department of Commerce), huge opportunities exist in engineering services,technology supply and project development. There is a particular demand for:
• 900 MW and above thermal power generating equipment, gas turbines
• 700 MW and above hydro power turbines, large-capacity pump storage units, advanced nuclear power station equipment, clean-coaltechnology power generating equipment
• 300 MW and above cogeneration and tri-generation units
• 300 MW and above circulating fluidised-bed boilers and Integrated Gasification Combined Cycle (IGCC) units.
Country report: China 13
Asset management
Specific information on generation asset management in China is limited. The consultations carried out for this review indicated that currentopportunities are available but limited due to a relatively poor access to this market by foreign companies, as well as a culture of ‘sweatingthe assets’ (exploiting assets with minimal maintenance and upgrading input).
In future, it is expected that much of the new installations will be tied into asset management contracts and foreign companies will havegreater access to these contracts as a result of further market openness and liberalisation, as well as the greater sophistication of the newlyinstalled technology.
Low-carbon transport fuels (biofuels)
Liquid biofuels for transportation have received attention in China in recent years as alternatives to oil imports. Modest quantities of ethanolare being produced from corn in some parts of the country. Nine provinces now require 10 per cent blending of ethanol with all gasoline sold.For some years, the national government has provided production subsidies of RMB 1,300 (US$170) per tonne of ethanol to selected producers(about US$0.12 per litre, similar to the subsidy given to US ethanol producers).
However, in 2007, China declared a moratorium on expanded ethanol production from corn due to concerns about competition with foodsupplies. Further production expansion will depend on dedicated plantation crops. The government plans to support sweet sorghum andcassava plantations as the main feedstocks for ethanol. Plantation crops may prove too expensive in the short-term, and there are also seriousconcerns about environmental degradation, water resources, and competition for land. Beyond such crops, the prospects for ethanol expansionin China rest on the future of cellulose-to-ethanol technology from agricultural and forest wastes and pilot plants are expected in the next fewyears.
Biodiesel can be produced from waste vegetable oils or oilseed plantations. Currently, the amount of biodiesel produced in China is small andderived mainly from waste cooking oil. There is a large potential supply of such waste oil if it can be collected and processed cheaply enough.Up to four billion litres per year of biodiesel might be produced from waste cooking oil in China. There is also potential for producing biodieselfrom oilseed crops, the cheapest of which is Jatropha. Other potential biodiesel feedstocks include soybeans, peanuts, rapeseeds, cottonseed,and sunflower, although all of these are food crops in high demand. A wide variety of pilot efforts to convert various oilseed crops to biodieselare ongoing in several provinces. Imported palm oil from Southeast Asia is another feedstock being employed by a growing number of Chinesebiodiesel producers, although this has been linked to tropical deforestation.
There are opportunities for biofuel production from cassava, sweet sorghum, and oilseed crops. The greatest promise lies with cellulosicethanol. This will require advanced bio-refinery facilities, which will be small to medium scale, given the diffuse nature of China’s ruralbiomass resources.
Source: SQW from various sources
Renewable energy
3.5 China has become a global leader in renewable energy – both in terms of investment and industrydevelopment. Investment in new renewables capacity (excluding large hydropower) exceeded US$12 billionin 2007, most of which was for wind, small hydro and solar hot water projects. China currently obtains8 per cent of its primary energy from renewable sources or 200 million metric tonnes (Mt) of coalequivalent, and 17 per cent of electricity supply is from renewables.
3.6 China’s renewable energy sector has traditionally been dominated by large hydro electric capacity and theThree Gorges Dam of 18 GW rated output will constitute a further quantum leap when it goes on-stream,probably in 2009. Biomass, solar photovoltaics, geothermal and tidal energy technologies are also becomingmore prominent.
3.7 The near-term national target for renewables is 10 per cent of primary energy supply by 2010. A 2050target has been set of at least a 30 per cent share for renewables in the total energy supply. For themedium-term China plans to develop 120,000 MW of renewables by 2020, which will take the totalrenewables capacity to 12-16 per cent of the total. This will require an investment of approximately RMB800 billion (US$120 billion) by 2020. In 2007, the National Development and Reform Commission (NDRC)issued the ‘Medium and Long Term Development Plan for Renewable Energy’ (MLTPRE), which calls for theinvestment of RMB 2 trillion (US$300 billion) by 2020 in renewable energy capacity.
3.8 The MLTPRE envisages the development of a total of 300 GW of hydropower, 30 GW of wind power,30 GW of bio-mass, 1.8 GW of solar power, 300 million m2 of solar hot water heaters, 44 billion m3/year ofmethane gas and 50 million tonnes per year (tpy) of bio-fuels.

Country report: China 14
3.9 Massive capacity expansion is expected particularly in wind energy. In 2005, wind generation capacity wasaround 764 MW, which doubled in 2006 and almost again in 2007 to currently over 4.5 GW. There are anumber of foreign subsidiary manufacturers and one major Chinese producer capturing most of the market.China is now solidly in the top-five globally in terms of annual wind power market volume, along with theUS, Germany, Spain and India.
3.10 Considerable new capacity additions are also expected from both solar thermal and solar photovoltaics (PV)energy although the current serious cost barriers will nevertheless keep the overall share of solar capacityrather low. Solar hot water capacity continues to grow at 15-20 per cent annually, involving more than1,000 manufacturers employing some 150,000 people, and China now accounts for three-quarters of theglobal market for solar hot water.
3.11 China’s solar PV manufacturing industry is booming and the country is now the third largest globalproducer, behind Japan and Germany. Its success is demonstrated by Suntech which grew from just20 employees in 2002 to having a current market value of US$6 billion.
3.12 The market opportunities in China in renewable energy are significant across the board and are consideredmore fully below.
OPPORTUNITIES IN RENEWABLE ENERGY
Wind
The ‘Medium and Long Term Development Plan for Renewable Energy’ calls for the development of six 1,000 MW wind farms by 2020. Theseare to be located in Xinjiang Province (Dabancheng), Gansu Province (Yumen), Jiangsu Province-Shanghai (along the coast), Hebei Province(Zhangbei), Jilin Province (Baicheng) and Inner Mongolia (Huitengxile).
Wind power is the fastest-growing power-generation technology in China. Capacity additions exceeded 2 GW in 2007, after a doubling to2.6 GW in 2006. In 2007, developers ordered turbines capable of generating a further 8GW for future installation, and about 200 projectdevelopment companies were actively pursuing or implementing projects. Given recent trends, the national 2010 target of 5 GW installedwind capacity is likely to be exceeded by 2-3 GW.
Wind power development has proceeded along two main routes, primarily determined by scale. Large-scale developments (over 50 MW, buttypically below 100 MW) are regulated through the government’s national Wind Concession Programme. Concessions are awarded annually ina competitive bidding process, based on the lowest feed-in tariff proposed. Both private and state-owned developers participate. Thisprogramme awarded 2.5 GW of wind capacity for development in the period 2003-2006, with the first operational projects coming on-streamonly in 2007. So far, only Chinese companies have been awarded concessions, partly because low bid prices have left little room for profits,thus discouraging foreign companies.
Smaller-scale projects (below 50 MW capacity) also follow a competitive bidding model for awarding concessions, but at a provincial level.Concessions are negotiated individually on a case-by-case basis with provincial pricing bureaus and determined by the feed-in tariff proposed.The process follows the guidelines in the 2005 Renewable Energy Law and associated regulations.
In addition, separate provincial initiatives for supporting wind power have been implemented and more are expected. Gansu Province was thefirst to enact a provincial-level bidding programme, in parallel with the national programme, with its first tender for 150 MW. Other provinceswere moving towards a form of provincial-level feed-in tariff regimes, with Guangdong the first to adopt such a regime.
In terms of sector development, there are now four Chinese commercial manufacturers of wind turbines, another six foreign subsidiarymanufacturers, and more than 40 firms developing prototypes and aspiring to produce turbines commercially. In general, Chinese firms havenot yet caught up with foreign levels of technology, in part because foreign firms are reluctant to license their latest technologies.Nevertheless, significant progress has been achieved by Chinese firms. For example, the primary domestic manufacturer, Goldwind, hasaggressively been developing new technology and expanded its share of the overall Chinese market to 33 per cent in 2006. Three otherChinese turbine manufacturers had small market shares in 2006 - Huarui (Sinovel) (6 per cent), Zhejiang Windey (1.5 per cent), and Dong Fang(0.8 per cent).
Foreign subsidiary and joint venture turbine manufacturing in China has accelerated in part due to a condition of the Wind ConcessionProgramme, whereby 70 per cent of the value of turbines to be used in awarded projects has to be from domestically manufacturedcomponents. Foreign wind manufacturers now operating in China include Vestas (Denmark with a 24 per cent market share in 2006), Acciona(Spain, market share unknown), Gamesa (Spain, 17 per cent), GE (US, 13 per cent), Nordex (Germany, 2 per cent), and Suzlon (India, 1 percent). Most have established wholly-owned subsidiaries with large investments in new production facilities. Acciona of Spain is an exception,and established a joint venture with a Chinese partner.

Country report: China 15
Challenges facing the domestic wind sector include shortages of skilled personnel and specialised engineering knowledge, and lack ofoperational experience, testing, and maintenance. It will take years to close these gaps, which on the one hand requires foreign specialists toprovide support in China, and on the other hand gives foreign manufacturers a competitive advantage.
The national target of 30 GW by 2020 is likely to be exceeded, based on recent trends, perhaps reaching 50-60 GW. Beyond that, wind powercould reach 100-200 GW by 2030 and as much as 600 GW by 2050. Key factors are the pace of domestic industry development, drivingtechnology cost down, the evolution of government policy, overall energy prices, and the prospect for offshore wind.
Solar Photovoltaics (PV)
The solar PV market is still in its infancy in China. Only 80 MW of PV capacity existed in 2006, compared with more than 7,700 MW globally.About half of China’s capacity is employed in rural off-grid applications, a market that is increasing at around 5-10 MW per year. The rest isused for communications, industry, and consumer products. Grid-connected solar PV is still marginal, at just a few megawatts. In total, China’sdomestic PV market grew by about 10 MW in 2006, which is just a fraction of the 370 MW produced by China’s solar PV manufacturers.Therefore, most of the output is for export.
A large grid-connected market is several years away. The extent to which this happens is likely to depend on the extent of reductions in thecost of solar PV and of rises in electricity prices. There is little government support in terms of financial incentives. Nevertheless, someschemes have been developed for both grid-connected and/or building-integrated systems. The Jiangsu provincial government is working onthe first phases of a 10,000-roof programme and has started to discuss a feed-in tariff policy with local utilities. The city of Shenzhen hasinstalled 1 MW of grid-connected solar PV on its World Garden Expo building. Demonstration projects were implemented for the Beijing 2008Olympics and the Shanghai 2010 World Expo.
In contrast, the solar PV manufacturing sector is very strong, with more than 15 major solar cell manufacturers employing over 20,000 peoplein 2006 and new companies appearing monthly during 2007. Production capacity increased from 350 MW in 2005 to over 1 GW in 2006 asmost companies expanded their operations. This is expected to reach 4 GW by 2010, which is higher than today’s global capacity.
Leading Chinese producers are Suntech, China Sunergy, Jiangsu Linyang, Ningbo, Baoding Tianwei-Yingli, Trina Solar, and Solarfun, all withambitious expansion plans to 2010. Total investment by just three of these companies – Suntech, China Sunergy, and Tianwei Yingli – mightexceed US$1.3 billion by 2008-2010. Suntech is already the world’s fourth-largest producer of solar cells. Another growing company is JiangxiLDK Solar, a wafer manufacturer, which aims to reach output capacity of 1 GW by 2010.
In parallel with a rapid growth of solar PV manufacturing, Chinese silicon production for PV is growing as well. From a total domestic capacityof 340 tonnes in 2006 (when demand for silicon was over 3,000 tonnes) it is expected to reach 4,000 tonnes by the end of 2008.
There are considerable differences of opinion over the future of solar PV in China, with estimates of installed capacity in 2020 rangingbetween 2 and 10 GW. The extent of the uptake of solar PV will probably depend on whether expected cost reductions in technology occur inthe coming years. Beyond that, 20-40 GW could be installed by 2030, and 500-1,000 GW by 2050. Key factors include the speed of technologycost reductions; policy and regulation on building-integrated PV and grid-connection; the general future of distributed generation and the roleof energy utilities (Worldwatch 2007).
Solar Water Heating (SWH)
China is a global leader in solar water heating (SWH) and is now the world’s largest market for SWH systems, with nearly two-thirds of totalglobal capacity (excluding swimming pool applications). There has been rapid growth from 35 million m2 of installed capacity in 2000 to100 million m2 by the end of 2006. This represents approximately 40 million systems, covering about 10 per cent of all Chinese households.Capacity additions of 20 million m2 in 2006 alone have been achieved.
Historically, uptake of SWH has been in rural areas but, recently, the number of urban installations has grown as well – on homes, apartmentand office towers, schools, and hotels – particularly in the southern provinces. By 2005, more than one-third of the market was in urban areas,and this share continues to grow. System costs have fallen dramatically over the years and solar heating is relatively affordable today, thanksto a combination of low-cost labour, cheap materials, and competition among a large number of domestic SWH companies.
The sector and market have grown without direct government support, but increasingly national and local-level authorities are involved in itspromotion. In 2007, the National Development and Reform Commission (NDRC) issued a ’National Plan on Enforcement of Utilisation of SolarEnergy Heating’ that will make SWH mandatory in new construction (expected to apply to hospitals, schools, and hotels). It is also expected torequire new construction to allow space on rooftops for future retrofitting of SWH systems and to encourage retrofits of existing publicbuildings. In 2006, a proactive southern city, Shenzhen, mandated SWH in all new residential buildings below 12 storeys. New policies andbuilding practices mean that a 20-25 per cent annual growth rate will continue and as a result domestic production is expected to reach30 million m2 per year by 2020.
However, the solar water heating industry is fragmented with only a few major players and lacks a strong technology and economicunderpinning. The largest SWH manufacturer in the world is Himin Group, located in the city of Dezhou in Shandong Province. With 50,000employees worldwide, Himin produces over one million SWH systems annually – mainly for the Chinese market, but it is also starting totarget export markets.

Country report: China 16
China could achieve 400 million m2 of SWH installed capacity by 2020 and 800 million m2 by 2030. It is likely that by then more than one-thirdof China’s households will be using SWH based on current targets and policy trends. Key factors include financial and other incentives forSWH and quality standards. There is an opportunity for investment in SWH manufacturing to supply the domestic as well as the internationalmarkets.
Biomass
China has about 2 GW of biomass power capacity, mostly in the form of combined heat and power (CHP) plants in the sugar industry, withsugar cane waste (bagasse) being the primary feedstock. Rice plantations also use waste rice husks in such plants. Biomass capacity has notchanged appreciably in recent years, though a new generation of plants is now emerging in two key areas:
• industrial-scale biogas power plants burning gas generated from industrial and animal wastes
• large-scale power plants burning a range of agricultural crop wastes
There are more than 1,600 industrial-scale biogas plants operating in China and the government expects 3 GW of power generation frombiogas by 2020. The natural resource is estimated at 400-800 million tonnes of agricultural and forest wastes per annum. The first 25 MWbiomass plant started operation in 2006 in Shandong province, burning a combination of cotton stalks, tree branches, orchard waste, andforestry waste. A few more plants began operation in 2006-2007, and the government plans 30 more plants.
Biomass has a relatively lower potential than the other renewable technologies. It will possibly grow to reach the government target of30 GW by 2020, but fuel resource limitations and supply chain complexities may constrain growth prospects. The outcome will depend on keyfactors such as the potential for developing industrial-scale biogas technology, continuation of feed-in tariffs for favourable power pricing, andnew technology development, such as biomass gasifiers.
Source: SQW Consulting from various sources
Carbon finance
3.13 Carbon finance is currently booming in China through the Clean Development Mechanisms (CDM) of theKyoto Protocol. The country is the global leader in terms of the volume of certified emission reductions(CERs) generated by registered projects. In April 2008 China had a 51 per cent share of the expected globalannual CER output (or 107 million CERs out of 210 million globally) – Figure 3-1.
3.14 China is second only to India in terms of the absolute number of registered CDM projects (198, or a19.3 per cent share) and, on average, hosts larger-scale schemes. At the then prevailing average marketprice of CERs (£10-£15/tCO2), this represents a value of over £1.5 billion annually. Over a project’sminimum seven-ten year CDM registration, the current list of projects could generate aggregate revenue ofup to £10-£15 billion by 2015 (subject to Kyoto continuing to exist post 2012).
3.15 A full list of registered CDM projects in China can be found at http://cdm.unfccc.int/Projects/index.html.
3.16 Over the medium term, the average size of CDM projects in China may decrease as the biggestopportunities are currently being looked at and developed.
3.17 The key sectors and technologies where CDM projects have been developed include:
• Wind energy – small and large scale
• Hydro energy – small scale
• Waste heat recovering in the cement and coking and other industries
• Biomass, biogas and coal mine methane
3.18 To date the UK is the most prominent player in CDM projects in China, being party to at least 80 projects.It is followed by the Netherlands (43 projects) and Japan (31 projects) and other players include Sweden,Switzerland, Austria, Spain, Germany, Italy, Denmark and Canada.
3.19 The role of foreign companies in Chinese CDM projects is as equity investors, technology suppliers, financialand engineering consultants, and carbon management service providers (eg assessors, validators, carboncredit originators and buyers).

Country report: China 17
Figure 3-1: China’s share of global CDM activity by volume of CERs (top panel) and number of projects (bottom panel), April 2008
Source: UNFCC (April 2008)
Other, 7.2%Indonesia, 1.1%
Malaysia, 1.2%Quatar, 1.2%
South Africa, 1.2%Argentina, 1.9%
Chile, 1.9%Mexico, 3.4%
R of Korea, 7.0%
Brazil, 8.6%
India, 14.3%
China, 51.0%
Other, 17.7%
Malaysia, 2.6%
Chile, 2.1%
Mexico, 10.1%
R of Korea, 1.8%
Brazil, 12.9%
India, 33.5%
China, 19.3%

Country report: China 18
4: Policy and regulatory frameworksThis section describes: a) China’s policy and regulatory regime as it relates to the treatment ofimporters, inward investment and joint ventures with overseas suppliers; b) procurement procedures;c) the extent to which environmental policies and regulation have become more demanding – and thenature of the requirements; and d) the governance institutions responsible for trade, investment andenvironmental policy and regulation.
Structural reforms – trade and direct investment4.1 Following the liberalisation of the environmental protection market in China, the demand for key
technologies and equipment for large integrated technical solutions will create excellent opportunities forforeign-funded companies. In areas where China’s own industry is constrained or underdeveloped (such ascomplex desulphurisation plants), foreign companies are expected to enter and dominate the market.
4.2 Following China's accession to the World Trade Organisation (WTO), foreign players have rapidly moved intoits market (particularly as a result of commitments to reduce taxes). Projects with significant technologycontent and higher profitability, such as environment impact assessment, environmental engineering designand implementation, and operation of pollution control facilities, have become the focus of competition forforeign investors.
4.3 Multinational companies are keen to enter the mainland market. However, as they are not familiar with themainland environmental protection market, not many of them operate in the form of wholly-ownedenterprises but through exports, technology transfer or joint ventures.
4.4 The China eco label is an important means employed by SEPA in cracking down on fake green products.Currently, China's eco label is applied to 56 major categories of products in such sectors as householdelectrical appliances, office equipment, daily necessities, textiles, and construction and decoration materials.Over 23,000 products produced by some 1,300 enterprises have been issued the China eco label. Theannual output value of products granted the eco label amounts to over RMB 100 billion (US$15 billion).
STRUCTURAL REFORMS IN TRADE AND INVESTMENT
Trade
Since joining the WTO, China has kept to its official pledges and has been gradually lowering the tariff rate on environmental protectionproducts – from an average of 13.4 per cent in 2001 to 6.9 per cent in 2008 (this schedule was completed in January 2008).
China operates a licensing system for environmental pollution control facilities, under which concerned entities must apply for an operationcertificate and comply with its conditions.
China also implements an environmental protection products certification system, the China Compulsory Certification (CCC) mark.
In 2007, the NDRC promulgated the Catalogue of Environmental Protection Industry Equipment (Products) Encouraged by the State(2007Amended). http://www.gpccc/page/aquanhuanbao/20070618/169.html
Foreign direct investment
Between 2000 and 2002 there have been more than 350,000 foreign-invested enterprises established in China, with a contractual investmenttotalling US$641.7 billion and an actual investment of over US$327.7 billion. According to the World Bank, China has attracted 6 per cent ofthe world foreign direct investment (FDI) and has become the largest recipient of FDI among developing countries since 1993. Foreigninvestment now accounts for more then 20 per cent of the fixed assets of the entire country.
Source: SQW from various sources
Public procurement, private sector procurement and joint venturing4.5 Public-private partnerships for water and wastewater treatment, especially build-operate-transfer (BOT)
contracts, are increasingly popular in China. There are a number of long-term mega-projects based on suchcontracts, which require the expertise of foreign environmental services companies.
4.6 Environmental projects are often contracted out to ‘design institutes’, ie companies with expertise inengineering and technical design services. Decisions regarding equipment, technology and services for aproject are typically made at the feasibility stage, so it is important for foreign companies to get involved atthat stage.
4.7 The information and communications technologies, pharmaceutical, petrochemical and manufacturingindustries are the main private-sector customers for foreign environmental services firms. In the publicsector, municipalities are seeking environmental services companies to form public-private partnerships tobuild and operate water and wastewater treatment, and solid-waste management facilities.

Country report: China 19
4.8 Many tenders for environmental services projects are made available through international financialinstitutions, particularly the World Bank and the Asian Development Bank.
4.9 In the future, joint ventures between foreign and Chinese companies may be the most feasible way forcompanies to enter the market, especially as the number of Chinese consulting firms increases. Either way,reputation and experience are key to establishing a presence in the market. A long-standing internationalreputation as an environmental consulting company with substantial experience will make the market entryprocess much easier. Having a local network also facilitates doing business in China, and may be vital to acompany new to the market.
4.10 As a part of China’s obligations following WTO accession, foreign firms are no longer required to establish arepresentative office in order to provide environmental consultation services in China. However, lack of aphysical presence in-country may lead to delays in implementation of short tender cycle projects if theconnection with local partners is not close.
4.11 Regarding low-carbon technologies, the power sector is dominated by six state controlled energy generationcompanies and access is mainly by way of supplying goods and services (ie exports) to them.
Environmental regulations4.12 At the same time as China is liberalising its economy and markets, it is also bringing in new regulations
relating to environmental protection and pollution prevention. Environmental legislation in China isprogressive although implementation is often less demanding than the terms of the regulations. The firstnational environmental protection law was passed as early as 1979. It has been followed by an array offurther laws with a special focus on individual areas of the environment (eg water, air, waste) and on theprotection of natural resources. These laws amount to some 375 environmental standards and more than900 local environmental regulations.
4.13 As a result, China now has a reasonably comprehensive environmental policy and institutional framework.Moreover, the range of environmental regulations and promotion regimes is widening all the time. However,while the government has shown ambition and resolve, the problems of financing, competing priorities andlocal discretion can hinder implementation and the achievement of declared intentions and targets.
4.14 The main policies and regulations covering the environmental and low carbon sectors are listed below.Additional information is provided in Annex B.
ENVIRONMENTAL REGULATIONS (in reverse chronological order)
China’s National Climate Change Programme (2007) provides Guidelines, Principles and Objectives of China to Address Climate Change. It alsodefines the impacts and challenges of climate change to China as well as setting out China's position on climate change and internationalco-operation.
The Energy Law (2007) gives guidance on the direction of energy development as well as organisation and management of energy sector.
The Renewable Energy Law (2006) aims to expand the use of renewable energy sources for generating electrical energy, reduce carbonemissions and stimulate the renewable technology industry. The Law sets a target of 10 per cent of total energy consumption to come fromrenewables by 2020. Furthermore, purchase of all generated renewable energy is subject to guarantees, attracts fixed feed-in tariffs and taxincentives. Mandatory requirements are placed on China’s utilities to produce 3 per cent of their power from non-hydro renewables by 2020,and also meet 8 per cent of their total power capacity from non-hydro renewables.
Environmental Impact Assessment Law (2003) requires that all relevant parties, including experts and the general public, to evaluate the likelyimpacts of development projects, programmes, and plans on the natural and human environments.
Water Resource Law (2002), revised, and related regulations and policies. Water tariff and wastewater treatment fees are rising to rationallevels, and public water infrastructure was opened to foreign and non-state-owned capital financing.
Air Pollution Prevention and Control Law (2000) is formulated for the purpose of preventing and controlling atmospheric pollution, protectingand improving people's environment and the ecological environment, safeguarding human health, and promoting the sustainable developmentof economy and society.
Country report: China 20
Energy Conservation Law (1998) is formulated in order to promote energy conservation by all sectors of the society, increase the efficiency inthe use of energy and its economic results, protect the environment, ensure national economic and social development, and meet the people'sneeds in everyday life.
Prevention and Control of Environmental Pollution from Solid Wastes Law (1995) authorised the government to impose solid waste dischargefees on those responsible for waste discharges that do not comply with relevant environmental laws governing the land filling of hazardouswastes.
Water and Soil Conservation Law (1991) is formulated for the purpose of the prevention and control of soil erosion, the protection and rationalutilisation of water and soil resources, the mitigation of disasters of flood, drought and sandstorm, the improvement of ecological environmentand the development of production
Environmental Protection Law (1989) is formulated for the purpose of protecting and improving people's environment and the ecologicalenvironment.
Marine Environmental Protection Law (1982) is enacted to protect and improve the marine environment, conserve marine resources, preventpollution damages, maintain ecological balance, safeguard human health and promote sustainable economic and social development.
Source: SQW Consulting from various sources
Key institutionsKEY GOVERNMENT DEPARTMENTS AND AGENCIES INVOLVED IN TRADE, INVESTMENT AND THE ENVIRONMENT
Ministry of Environmental Protection (formerly State Environmental Protection Administration (SEPA)) is the nation’s environmental protectiondepartment charged with the task of protecting China's air, water, and land from pollution and contamination. Directly under the State Council,it is empowered and required by law to implement environmental policies and enforce environmental laws and regulations. Complementing itsregulatory role, it funds and organises research and development. In addition, it also serves as China's Nuclear Safety Agency.
National Development and Reform Commission (NDRC), a macroeconomic management agency under the State Council, which studies andformulates policies for economic and social development, maintains a balance of economic aggregates and guides the restructuring of theoverall economic system. The NDRC has 26 functional departments of which the most relevant to the EGS and CAT sectors are:
• Bureau of Energy is responsible for studying energy development and utilisation both at home and abroad, and putting forward energydevelopment strategies and major policies; formulating development plans for the energy sector, and making recommendations on systemreform in the energy sector; administering oil, natural gas, coal, power and other parts of the energy sector and the national oil reserve;and formulating policy measures for energy conservation and renewable energy development
• Department of Resource Conservation and Environmental Protection is responsible for studying and resolving major problems concerning theco-ordinated development of the economy, society, the environment and resources; putting forward polices and plans for resourceconservation and comprehensive utilisation; participating in the formulation of environmental protection plans, co-ordinating work related toenvironmental protection, and promoting clean production; co-ordinating the implementation of key demonstration projects and thepopularisation of new products, new technologies, and new equipment; and undertaking the day-to-day work of the National Co-ordinationCommittee for Climate Change
• Department of International Cooperation is in charge of co-operation between the NDRC and international organisations, foreigngovernment agencies and foreign institutions. The Department is also responsible for assisting other departments to promote majorinternational co-operative projects and carrying out studies on world economy and the day-to-day foreign affairs of the Commission.
Ministry of Water Resource is responsible for the formulation of water-related policies, development strategies and medium and long-termdevelopment plans (including water conservation and demand management policies); the implementation of integrated management of waterresources.
Ministry of Construction is responsible for providing housing and regulating the state construction activities in the country.
China Council for International Cooperation on Environment and Development (CCICED), a high-level advisory body was established by theState Council of China in 1992. Its purpose is ‘to further strengthen co-operation and exchange between China and the internationalcommunity in the field of environment and development’. The CCICED is composed of about 40-50 high-profile Chinese and internationalmembers.
Source: SQW Consulting – various sources

Country report: China 21
Annex A: Definitions of environmental goodsand services, renewable energy, carbon financeand CATs
A.1 The Defra/BERR Environmental Industries Unit has defined the individual EGS sectors as follows:
Sub-sector Description Examples of types of activity
Air Pollution Control Defined as products, systems and services forthe prevention, reduction and removal ofgaseous and particulate pollutants from air
External and internal emissions and odourcontrol, filters and catalytic converters
Cleaner Technologies and Processes Defined as products, systems or services forcleaner more resource efficient technologies,processes or products which are not coveredelsewhere
Decommissioning/Decontamination ofNuclear sites
Defined as products, systems and servicesrequired for the decommissioning of existingnuclear liability sites and structures
Consultancy, decontamination, recycling andcompaction technologies, waste collectionand containment
Environmental Consultancy Defined as services to provide assessmentand advice relating to environmental issues
Environmental audits, environmental impactassessment, corporate environmentalresponsibility
Environmental Monitoring, Instrumentationand Analysis
Defined as products, systems and services formeasuring and monitoring environmentalparameters
Water, air and soil quality, meteorologicalconditions and flow rates
Energy Management/Efficiency Defined as products, systems and services forenergy management and energy efficiency
Energy consultancy/audits, building energymanagement systems, energy efficientproducts and efficiency advice
Marine Pollution Control Defined as products, systems and services forcontrolling, clean up and minimising marinepollution
Products such as oil absorbents and boomsand services such as marine pollutionpreventing techniques
Noise & Vibration Control Defined as products, systems and services formonitoring and reducing noise and vibration
Noise meters, monitoring systems, acousticbuffers, enclosures and barriers and silencers
Recovery and Recycling Defined as products, systems and services forwaste segregation, recovery and recycling
Paper, organics, metals, plastics, glass,demolition and construction wastes, vehiclesand white goods
Remediation and Reclamation of Land Defined as products, systems and services forthe identification, assessment andremediation/reclamation of land andbuildings, including prevention of contaminantdispersal
Absorbents and injection equipment,monitoring systems and proprietary treatmentprocesses and sampling/analysis and siteinvestigation/engineering
Waste Management Defined as products, systems and services forthe minimisation, collection, treatment (notrecycling) and disposal of waste
Advice on waste minimisation, landfill,mechanical and biological treatment,regulatory advice and technologies such asspecialised containment, shredders,compactors and waste management vehicles
Water Supply and Wastewater Treatment Defined as products, systems and services forthe management of the fresh waterenvironment, provision, treatment, distributionand storage of clean water and wastewaterfor industrial and domestic users
Resource development, demand management,manufacture of wastewater treatmentequipment, design, construction, installationand operation of water and wastewatertreatment facilities
TABLE A-1: CONSTITUENT SUB-SECTORS OF THE ENVIRONMENTAL GOODS AND SERVICES SECTOR
Source: DEFRA, Sustainable Consumption and Production – Development of an Evidence Base: Annex 1,UK Government Definitions of the Environmental Goods and Services Sector (Draft Review September 2006)

Country report: China 22
Sub-sector Description Examples of types of activity
Carbon Capture & Storage (CCS) Defined as a multi-stage process wherecarbon from power generation is capturedeither before or after combustion andtransported to a long-term storage ingeological formations. This approach canreduce emissions by up to 85 per centdepending on the type of non-capture plantdisplaced
The entire supply chain for CCS technologiesfrom R&D to demonstration and deployment.This includes manufacturing, as well asengineering and financial/business consultingservices across the three main stages:
• Carbon capture at plant
• Transportation to a storage
• Storage in a geological formation
Generation technologies that provide higherconversion efficiency
Defined as higher efficiency conversionprocesses, where the amount of fuel consumeand the associated emission of CO2 arereduced and the conversion processes aremade more efficient (eg emission reductionsof 10-30 per cent are possible depending onthe performance of the old and replacementplant. Even higher levels can be attained byadding co-firing with biomass (typically a5-10 per cent mix)
The entire supply chain for renewabletechnologies from R&D to demonstration anddeployment. This includes manufacturing, aswell as engineering and financial/businessconsulting services. Main technologies are:
• Supercritical boilers
• Integrated Gasification Combined Cycle(coal)
• Combined Cycle Gas Turbine (gas)
Substitution to low carbon transport fuels Defined as fuels used for transport based onthe fermentation and distillation ofreplenishable organic matter, such asagricultural crops (eg sugar cane or beet,rapeseed) or woody material. Commonlyknown as biofuels, the main commercialvarieties are bioethanol and biodiesel, wherethe former can be used as the main fuel andthe latter is typically mixed with standarddiesel in different proportions. Currently, thereare second and third generation biofuels
Production of crops and other organic matterto be converted into fuel. The design oftechnology and equipment for producingbiofuels. The production of different types oflow-carbon fuels including bioethanol andbiodiesel
Asset Management Defined as planning, procurement andmaintenance of energy generation facilities
Business planning, condition assessment,data gathering, technical maintenance
A.2 For the purposes of the study, we have taken Renewable Energy and Carbon Finance out of thedefinition of EGS and CATs and treated them as separate sectors.
A.3 Definitions for the individual CATs sectors are available from different sources including BERR’sStrategy for CATs (2005), certain trade associations and prominent market leaders.
TABLE A-2: CONSTITUENT SUB-SECTORS OF THE CARBON ABATEMENT TECHNOLOGIES SECTOR
Source: BERR, British Biogen, Energy Asset Management plc
Country report: China 23
Sub-sector Description Examples of types of activity
Renewable energy Defined as energy technologies that usenatural resources such as sunlight, wind,flowing water, tides and waves, biomass andgeothermal heat. The availability of theseresources is either unaffected by energycapacity installed (eg solar and wind energy)or can be replenished in the short-term (eghydro and biomass)
The entire supply chain for renewabletechnologies from R&D to demonstration anddeployment. This includes manufacturing, aswell as engineering and financial/businessconsulting services. Main technologies are:
• Wind (onshore and offshore)
• Solar (thermal and electric)
• Hydro (smaller scale)
• Biomass (heat and power)
• Geothermal
• Marine (wave and tidal)
A.4 Renewable energy is defined broadly in all sources consulted and a generic definition is as follows:
TABLE A-3: RENEWABLE ENERGY
Source: various sources
Sub-sector Description Examples of types of activity
Carbon finance Defines as the investments in greenhouse gasemission reduction projects, the creation(origination) of tradable commodities on the‘carbon market’, and the provision of financialand business services associated with all ofthe above
Trade in carbon commodities and derivativeson different markets and exchanges, such asCERs, EAUs, VERs and others
CDM and JI project assessment, registration,finance and development
A.4 Carbon Finance is also a term which is not standardised across the literature and a definitionreflecting the content attributed to it by several sources is as follows.
TABLE A-4: CARBON FINANCE
Source: various sources
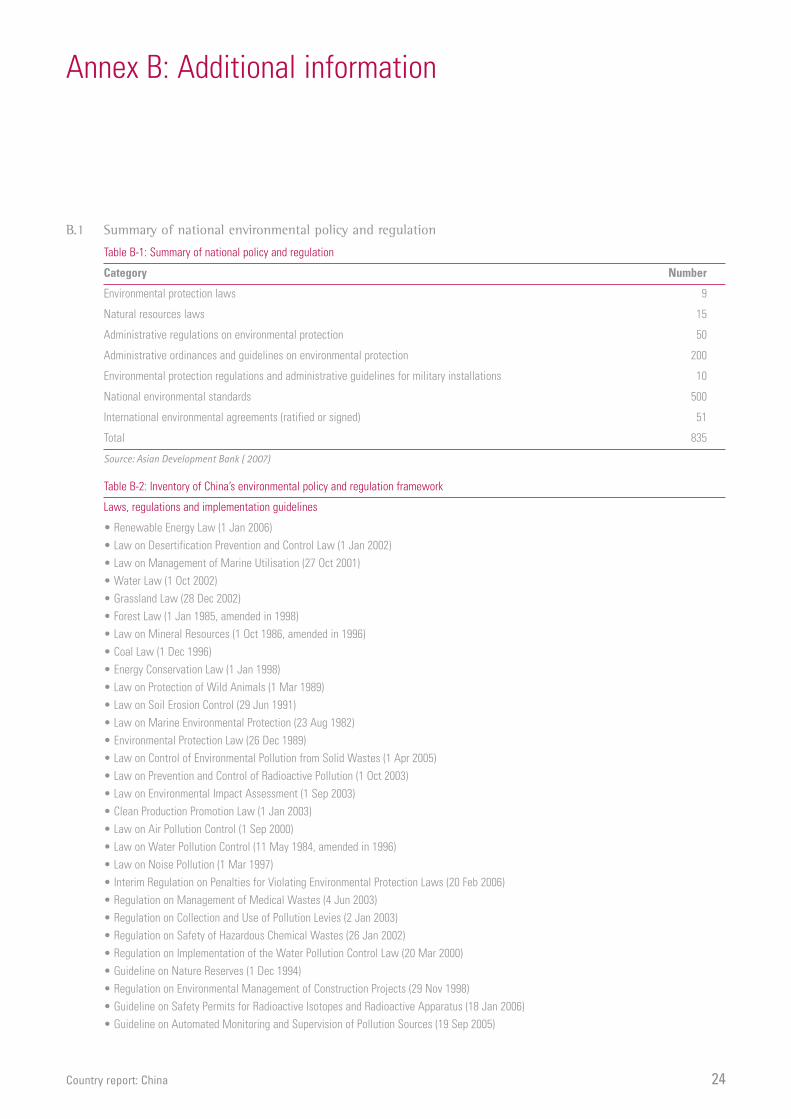
Country report: China 24
Annex B: Additional information
B.1 Summary of national environmental policy and regulation
Table B-1: Summary of national policy and regulation
Category Number
Environmental protection laws 9
Natural resources laws 15
Administrative regulations on environmental protection 50
Administrative ordinances and guidelines on environmental protection 200
Environmental protection regulations and administrative guidelines for military installations 10
National environmental standards 500
International environmental agreements (ratified or signed) 51
Total 835
Source: Asian Development Bank ( 2007)
Table B-2: Inventory of China’s environmental policy and regulation framework
Laws, regulations and implementation guidelines
• Renewable Energy Law (1 Jan 2006)• Law on Desertification Prevention and Control Law (1 Jan 2002)• Law on Management of Marine Utilisation (27 Oct 2001)• Water Law (1 Oct 2002)• Grassland Law (28 Dec 2002)• Forest Law (1 Jan 1985, amended in 1998)• Law on Mineral Resources (1 Oct 1986, amended in 1996)• Coal Law (1 Dec 1996)• Energy Conservation Law (1 Jan 1998)• Law on Protection of Wild Animals (1 Mar 1989)• Law on Soil Erosion Control (29 Jun 1991)• Law on Marine Environmental Protection (23 Aug 1982)• Environmental Protection Law (26 Dec 1989)• Law on Control of Environmental Pollution from Solid Wastes (1 Apr 2005)• Law on Prevention and Control of Radioactive Pollution (1 Oct 2003)• Law on Environmental Impact Assessment (1 Sep 2003)• Clean Production Promotion Law (1 Jan 2003)• Law on Air Pollution Control (1 Sep 2000)• Law on Water Pollution Control (11 May 1984, amended in 1996)• Law on Noise Pollution (1 Mar 1997)• Interim Regulation on Penalties for Violating Environmental Protection Laws (20 Feb 2006)• Regulation on Management of Medical Wastes (4 Jun 2003)• Regulation on Collection and Use of Pollution Levies (2 Jan 2003)• Regulation on Safety of Hazardous Chemical Wastes (26 Jan 2002)• Regulation on Implementation of the Water Pollution Control Law (20 Mar 2000)• Guideline on Nature Reserves (1 Dec 1994)• Regulation on Environmental Management of Construction Projects (29 Nov 1998)• Guideline on Safety Permits for Radioactive Isotopes and Radioactive Apparatus (18 Jan 2006)• Guideline on Automated Monitoring and Supervision of Pollution Sources (19 Sep 2005)

Country report: China 25
• Guideline on Prevention and Control of Pollution from Hazardous Wastes (30 Aug 2005)• Guideline on Procedure for Formulation of Environmental Protection Regulations (15 Apr 2005)• Guideline on Filing Requirements for Local Environmental Quality Standards and Pollutant Discharge Standards (11 Nov 2004)• Guideline on Qualification and Permission for Operation of Environmental Pollution Control Facilities (8 Nov 2004)• Interim Guideline on Verification of Cleaner Production (16 Aug 2004)• Interim Guideline on Public Hearing for Administrative Permission in Environmental Protection (23 Jun 2004)• Guideline on Administrative Penalties on Management of Medical Wastes (2 Jun 2004)• Guideline on Review of Environmental Impact Statements for Specialised Plans (8 Oct 2003)• Guideline on Management of New Chemicals (12 Sep 2003)• Guideline on EIA Expert Database (17 Jun 2003)• Guideline on Collection and Use of Environmental Pollution Levies (20 Mar 2003)• Guideline on Standards for Environmental Pollution Levies (28 Feb 2003)• Guideline on Classified Review and Approval of EIA Documents (1 Nov 2002)• Guideline on Registration of Hazardous Chemicals (2002-10-08)• Guideline on Completion Verification of Environmental Protection for Capital Construction Projects (27 Dec 2001)• Guideline on Certification of Organic Foods (19 Jun 2001)• Guideline on Pollution Prevention and Control for Poultry and Animal Husbandry (8 May 2001)• Guideline on Registration of Achievements in Environmental Science and Technology (20 Dec 2000)• Guidelines for Environmental Protection of Capital Construction Projects (29 Nov 1998)
Source: Asia Development Ban (2007)

Country report: China 26
Annex C: Bibliography
Asian Development Bank (2007) Country Environmental Analysis for the People’s Republic of China
Australian Trade Commission (2008) Environmental technologies to China – Trends and Opportunities
British Columbia Environment Industry Association (2008) China: Solid and Hazardous Waste Management
China Environmental Protection Industry (CEPI) – annual reports and other publications
China Environmental Protection Industry (CEPI) (2004) Green National Accounting Study Report
China Strategies, LLC (2008) China: Renewable Energy Development
China Strategies, LLC (2007) China’s Renewable Energy Market
China Strategies, LLC (2006) China: Renewable Energy and Sustainable Development
The Economist (March 2008) China’s quest for resources – a large black cloud
Defra (2007) Environmental Protection: Working with developing countries – China
Deutsche Bank Research (2006) Environmental sector China – from major building site to growth market
Energy Information Administration (2007) China Energy Profile
Globe-Net (2005) China: Water supply and Wastewater Treatment
Government of China (2006) The 11th Five-year Plan
Hong Kong Trade Development Council (HKTDC) (2007) China's Environmental Protection Market
IISD (2002) Task Force on WTO and Environment – China Council for International Cooperation on Environmentand Development: Challenges and Opportunities for China as a WTO Member
Information Office of the State Council of the People’s Republic of China (2007) China’s Energy Conditions andPolicies
International Energy Agency (IEA) (2006) China’s Power Sector Reforms: Where to Next?
International Trade Canada (ITC) (2006) China: the Environmental Services Market
Ministry of Environmental Protection of China (2007) China Environmental Statistical Yearbook 2006
Ministry of Environmental Protection of China (2008) Various articles, policies and communiqués (www.sepa.gov.cn)
National Bureau of Statistics of China (www.stats.gov.cn)
National Development and Reform Commission (NDRC); People’s Republic of China (2007) China’s National ClimateChange Programme
NDRC (2008) Various articles and communiqués (www.ndrc.gov.cn)
New York Times (August 2007) As China Roars, Pollution Reaches Deadly Extremes
OECD (2005) Environmental Goods and Services – A Synthesis of Country Reports
Office of National Climate Change Coordination Committee (2008) Clean Development Mechanism in China
State Environmental Protection Administration of China (SEPA) and the National Bureau of Statistics of China(NBS) (2004) China Green National Accounting Study Report
UKTI (2007) ‘China Markets’, Environmental/Water Sector Newsletter
UN Statistics Division (2007) China
UNFCCC (2004) The People’s Republic of China – Initial National Communication on Climate Change
UNFCCC (2008) http://cdm.unfccc.int/Projects/index.html

Country report: China 27
US Commercial Service(2006) China: Environmental Services
World Bank (2007) China key economic statistics
World Bank and State Environmental Protection Administration (2007) The cost of pollution in China
Worldwatch (2007) Powering China’s Development: The Role of Renewable Energy (special report)

Country report: China 28


Whereas every effort has been made to ensure thatthe information given in this document is accurate,neither UK Trade & Investment nor its parentDepartments (the Department for Business, Enterprise& Regulatory Reform, and the Foreign &Commonwealth Office), accept liability for any errors,omissions or misleading statements, and no warrantyis given or responsibility accepted as to the standingof any individual, firm, company or otherorganisation mentioned.
Published October 2008 by UK Trade & Investment© Crown CopyrightURN 08/1339
UK Trade & Investment is the Governmentorganisation that helps UK-based companies succeedin an increasingly global economy. Its range of expertservices are tailored to the needs of individualbusinesses to maximise their international success.We provide companies with knowledge, advice andpractical support.
UK Trade & Investment also helps overseas companiesbring high quality investment to the UK’s vibranteconomy – acknowledged as Europe’s best place fromwhich to succeed in global business. We providesupport and advice to investors at all stages of theirbusiness decision making.
UK Trade & Investment offers expertise and contactsthrough a network of international specialiststhroughout the UK, and in British Embassies andother diplomatic offices around the world.
For further information please visitwww.uktradeinvest.gov.uk or telephone+44 (0)20 7215 8000.