Embed Size (px)
Citation preview
Reportby the Comptroller and Auditor General
Department for Communities and Local Government
Financial sustainability of fire and rescue services
HC 491 SESSION 2015-16 23 NOVEMBER 2015
Our vision is to help the nation spend wisely.
Our public audit perspective helps Parliament hold government to account and improve public services.
The National Audit Office scrutinises public spending for Parliament and is independent of government. The Comptroller and Auditor General (C&AG), Sir Amyas Morse KCB, is an Officer of the House of Commons and leads the NAO, which employs some 810 people. The C&AG certifies the accounts of all government departments and many other public sector bodies. He has statutory authority to examine and report to Parliament on whether departments and the bodies they fund have used their resources efficiently, effectively, and with economy. Our studies evaluate the value for money of public spending, nationally and locally. Our recommendations and reports on good practice help government improve public services, and our work led to audited savings of £1.15 billion in 2014.
Report by the Comptroller and Auditor General
Ordered by the House of Commons to be printed on 23 November 2015
This report has been prepared under Section 6 of the National Audit Act 1983 for presentation to the House of Commons in accordance with Section 9 of the Act
Sir Amyas Morse KCB Comptroller and Auditor General National Audit Office
2 November 2015
HC 491 | £10.00
Department for Communities and Local Government
Financial sustainability of fire and rescue services
This report examines evidence of the impact of funding reductions and the Department’s actions to inform itself of the likely impact on financial and service sustainability of fire and rescue authorities.
© National Audit Office 2015
The material featured in this document is subject to National Audit Office (NAO) copyright. The material may be copied or reproduced for non-commercial purposes only, namely reproduction for research, private study or for limited internal circulation within an organisation for the purpose of review.
Copying for non-commercial purposes is subject to the material being accompanied by a sufficient acknowledgement, reproduced accurately, and not being used in a misleading context. To reproduce NAO copyright material for any other use, you must contact [email protected]. Please tell us who you are, the organisation you represent (if any) and how and why you wish to use our material. Please include your full contact details: name, address, telephone number and email.
Please note that the material featured in this document may not be reproduced for commercial gain without the NAO’s express and direct permission and that the NAO reserves its right to pursue copyright infringement proceedings against individuals or companies who reproduce material for commercial gain without our permission.
Links to external websites were valid at the time of publication of this report. The National Audit Office is not responsible for the future validity of the links.
10819 11/15 NAO
The National Audit Office study team consisted of: Alex Burfitt, Mark Burkett, Richard Douglas, Robindra Neogi, Cameron Paton, Chris Porter and David Timmins, under the direction of Aileen Murphie.
This report can be found on the National Audit Office website at www.nao.org.uk
For further information about the National Audit Office please contact:
National Audit Office Press Office 157–197 Buckingham Palace Road Victoria London SW1W 9SP
Tel: 020 7798 7400
Enquiries: www.nao.org.uk/contact-us
Website: www.nao.org.uk
Twitter: @NAOorguk
Contents
Key facts 4
Summary 5
Part OneImpacts of funding reductions on financial sustainability 12
Part TwoThe Department’s oversight of funding reductions 24
Part ThreePreventing financial and service failures 33
Appendix OneOur audit approach 41
Appendix TwoOur evidence base 43
4 Key facts Financial sustainability of fire and rescue services
Key facts
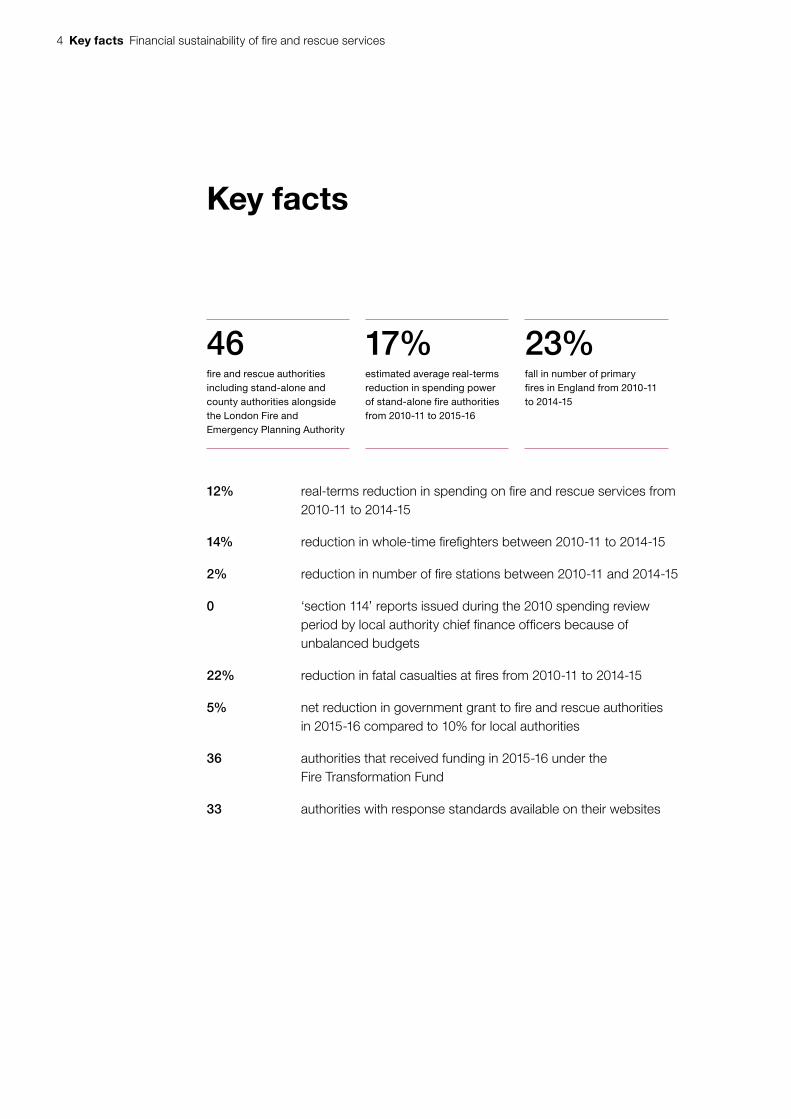
46fi re and rescue authorities including stand-alone and county authorities alongside the London Fire and Emergency Planning Authority
17%estimated average real-terms reduction in spending power of stand-alone fi re authorities from 2010-11 to 2015-16
23%fall in number of primary fi res in England from 2010-11 to 2014-15
12% real-terms reduction in spending on fi re and rescue services from 2010-11 to 2014-15
14% reduction in whole-time fi refi ghters between 2010-11 to 2014-15
2% reduction in number of fi re stations between 2010-11 and 2014-15
0 ‘section 114’ reports issued during the 2010 spending review period by local authority chief fi nance offi cers because of unbalanced budgets
22% reduction in fatal casualties at fi res from 2010-11 to 2014-15
5% net reduction in government grant to fi re and rescue authorities in 2015-16 compared to 10% for local authorities
36 authorities that received funding in 2015-16 under the Fire Transformation Fund
33 authorities with response standards available on their websites
Financial sustainability of fire and rescue services Summary 5
Summary
1 The Department for Communities and Local Government (the Department) is responsible for ensuring the public is adequately protected from fires and other emergencies. It does this by providing financial resources to fire and rescue authorities, enabling them to raise their own income, and establishing a statutory framework within which they must operate.
2 Fire and rescue authorities carry out a range of duties, notably:
• responding to fires, road traffic accidents, and other emergencies;
• contributing to national resilience: collectively being able to respond to up to 4 simultaneous national-level emergencies;
• undertaking preventative activities to reduce the risks of fire; and
• carrying out safety inspections of business premises.
3 There are 46 fire and rescue authorities in England, comprising:
• 6 metropolitan authorities: stand-alone authorities, serving the communities of groupings of metropolitan district councils.
• 24 combined authorities: stand-alone authorities, serving the communities of combined county council and unitary authority areas.
• 15 county authorities: integrated within an individual county council or unitary authority.
• London Fire and Emergency Planning Authority (LFEPA): a body of the Greater London Authority.
4 Over the last Parliament, the Department reduced funding for fire and rescue authorities. Under localism it also provided authorities with greater control over their spending decisions and withdrew some of the detailed frameworks for monitoring spending and performance. The Department is clear that fire and rescue authorities are responsible for organising their own services, and being accountable to local communities.
5 This report examines whether the Department understands the impact of funding reductions on the financial and service sustainability of fire and rescue services. We do not think it is contrary to the policy of localism to assess whether the Department has enough information to understand the impacts of its funding decisions on its objectives for the sector and duties it has set for fire and rescue authorities.
6 Summary Financial sustainability of fire and rescue services
Our report
6 This report complements others we have published on the government’s oversight of local services during a period of funding reduction.1 This report has three parts:
• Part One summarises the impact of funding reductions on fire and rescue authorities.
• Part Two assesses the extent to which the Department has taken an informed approach to implementing funding reductions, as well as how it has assisted fire and rescue authorities to manage reductions.
• Part Three examines the effectiveness of the Department’s system for providing assurance on the sector’s financial health and service standards.
7 This report complements The impact of funding reductions on fire and rescue authorities, our companion report that analyses in detail the impact of funding reductions on these bodies.2
Key findings
Impact of funding reductions on financial sustainability
8 Funding for fire and rescue authorities has fallen significantly between 2010‑11 and 2015‑16. Funding for stand-alone authorities fell on average by 28% in real terms. Once council tax and other income is taken into account, stand-alone authorities received an average reduction in total income (‘spending power’) of 17% in real terms (paragraphs 1.6 to 1.7).
9 The sector has coped well with financial challenges to date. There have been no financial failures, either a fire and rescue authority failing to set a balanced budget or being unable to finance expenditure in-year. The sector as a whole has increased financial reserves. However, there are some potential signs of low-level stress in a number of authorities including local auditors and peer challenge teams raising concerns in a small number of authorities. While authorities drawing on their reserves are still few, numbers have grown steadily since 2010-11. However, while this may indicate financial stress, use of reserves can also form part of a robust financial strategy (paragraphs 1.13, and 1.22 to 1.25).
1 This includes reports both on local authorities, police, NHS trusts, and further education colleges. For example, Comptroller and Auditor General, Financial sustainability of police forces in England and Wales, Session 2015-16, HC 78, National Audit Office, June 2015; and Comptroller and Auditor General, Financial sustainability of local authorities 2014, Session 2014-15, HC 783, National Audit Office, November 2014.
2 Comptroller and Auditor General, The impact of funding reductions on local authorities, National Audit Office, November 2015.
Financial sustainability of fire and rescue services Summary 7
10 Savings have come predominantly from reducing staff costs. Fire and rescue authorities have a duty to make provision to respond to emergencies, informed by their assessment of local risk. In this context, authorities have protected appliances and fire stations but reduced numbers of firefighters. Authorities have largely maintained appliances and stations as they are key to maintaining response standards and valued by the public. Fire control, non-uniform and senior firefighter managerial posts have seen the largest reductions in numbers, but numbers of non-managerial whole-time firefighters have reduced by around 14% from 2010-11 to 2014-15 nonetheless (paragraphs 1.16 to 1.20).
11 Fire and rescue authorities have changed the scope of their emergency response services and the scale of their prevention and protection services since 2010‑11. In general, fire authorities have not changed their emergency response standards as a result of budget cuts, but sometimes changed the type of appliance that attends and the weight of crewing. At the same time, prevention and protection services such as audits and inspections, and fire risk checks have reduced since 2010-11. However factors in addition to funding reductions, such as greater targeting, could also underlie these changes (paragraphs 1.30 to 1.33).
12 Despite reductions in funding, and reductions in the number of firefighters authorities are sending to certain incidents, the number of fires and casualties have continued their long‑term downward trend. Numbers of fires and casualties have fallen substantially since 2000-01. These trends have continued. Primary and secondary fires fell by 23.2% and 38.8% respectively between 2010-11 and 2014-15. Fatal and non-fatal casualties fell by 22.1% and 26.0% respectively over the same period. Health and safety statistics for firefighters also continued to improve overall (paragraphs 1.34 to 1.35).
13 Some fire authorities have indicated that their capacity to respond to major incidents might be compromised by further funding reductions. Fire authorities are risk-based organisations meaning their services are designed to provide resilience against major events, rather than to meet average demand. While average demand has continued to fall, this does not mean that the risk of serious incidents has fallen. However, data from the Department indicate that the number of fires attended by 5 or more vehicles fell by 31.5% from 2010-11 to 2014-15. This may indicate that the frequency of peaks in demand faced by fire authorities is reducing. However, it does not mean that the severity of those remaining peaks has declined. Further analysis of the Department’s data would be required to confirm this (paragraphs 1.38 to 1.39).
8 Summary Financial sustainability of fire and rescue services
The Department’s oversight of funding reductions
14 The Department’s understanding of the underlying costs of providing fire and rescue services is limited. The Department commissioned analysis which found there were “inexplicable” differences in spending across the sector, implying sizeable scope for increasing efficiency. Our analysis found that a substantial proportion of the differences could be explained, for example by local risk factors such as the presence of industrial facilities which tend to make fire services inherently more expensive. This suggests the Department needs to improve its understanding of the potential for further efficiency savings. A better understanding of which authorities are more efficient than others ought to lead to deeper insight into how less efficient authorities can make further savings (paragraphs 2.3 to 2.5).
15 There are some gaps in the Department’s understanding of changes to fire and rescue authorities’ service activities and standards. The Department focuses primarily on data on outcomes to the public for its understanding of impacts of funding reductions on services. This means service failings would emerge only once they have occurred. While it has some awareness of the measures some authorities are taking to reduce costs, it does not have an overview of the progress of the implementation of key elements of its efficiency proposals nor the impact on service provision (paragraphs 2.6 to 2.9).
16 While protecting the sector relative to local authorities overall, the Department has reduced funding most to fire and rescue authorities with the highest levels of need. The Department gave the sector smaller funding reductions than local authorities at both Spending Review 2010 and Spending Round 2013. At the same time, fire authorities with greater needs as defined by the social and demographic factors within the fire and rescue relative needs formula also received the largest funding reductions. Following changes to the funding system in 2013-14, in which change in funding is now driven by levels of local growth rather than change in fire risk, the distribution of funding may diverge increasingly from need (paragraphs 1.9 to 1.12, and 2.15 to 2.16).
17 The Department is supporting the sector to implement efficiency and transformation programmes, but some projects are focused on adding wider value to other sectors rather than reducing long‑term costs of fire and rescue. The Department provided the sector with a £75 million Fire Transformation Fund in 2015-16 to help the sector make long-term cost reductions. A significant element of the sector’s approach, however, aims as much at adding value to other sectors (such as adult social care or youth services) as reducing its own costs. The Knight Review raised questions about the value for money of some of these approaches and the extent to which they were being used to maintain existing levels of latent capacity, as opposed to making productive use of the latent capacity needed to provide sufficient fire cover (paragraphs 2.17 to 2.23).
Financial sustainability of fire and rescue services Summary 9
Preventing financial and service failure
18 Fire and rescue authorities are subject to legal controls that make it difficult for them to fail financially. As with local authorities, fire and rescue authorities have a statutory duty to set balanced budgets, and are thus legally prevented from running a deficit. A consequence of this is that any pressures resulting from funding reductions would be more likely to be manifested in service changes than financial failure (paragraphs 3.5, and 3.8).
19 The Department’s understanding of fire and rescue authorities’ financial sustainability could be improved. The Department relies primarily on authorities to self-assess whether they have sufficient funding to maintain their duties, and to raise concerns about their financial sustainability with the Department themselves. While the Department gains intelligence on the concerns of senior fire officers through extensive contacts, it has not to date sought to carry out its own assessments of authorities’ financial sustainability. The Department is currently increasing the robustness of its financial oversight and considering how to enhance its understanding of risks to authorities’ financial resilience. These additional efforts should be kept under review (paragraphs 3.6 to 3.8).
20 The Department’s assurance over national resilience – the ability of fire and rescue authorities to respond to national incidents – is robust, but stronger in some areas than others. The Department retains strategic responsibility for national resilience. It has a well-developed assurance system and oversight provided by a strategic resilience board. It oversees an annual audit programme which focuses most on specialised teams and equipment. Some authorities have expressed concern that ongoing funding reductions would, by reducing their wider operational capacity, impair their ability to contribute to national resilience. However, the Department has given authorities a duty to alert it to any gaps in their national resilience capacity, and established that any such gaps would be considered by the strategic resilience board (paragraphs 3.12 to 3.13).
10 Summary Financial sustainability of fire and rescue services
21 The Department has largely devolved assurance over the running of fire and rescue authorities to a local level, but there are gaps in this localised system. The fire sector is different from other emergency services in not having an external inspectorate. The Department relies on local scrutiny (from peers within the sector, elected councillors, and the general public) to safeguard service standards, governance, and value for money of each authority. While this is in keeping with its policy of localism, the Department has not attempted to test the effectiveness of the local systems to which it has delegated accountability. There are shortcomings in some of these local arrangements; for example, some authorities think that peer challenges are not always rigorous and independent. Meanwhile, councillors generally lack independent technical support, and an absence of standardised information on response standards makes it hard to compare performance across different authorities. The Department has not reviewed the effectiveness of peer challenges, but is aware of ongoing efforts within the sector to strengthen the way they are conducted. However, weaknesses remain which undermine the assurance the Department can obtain for itself or provide to Parliament, and create risks to local value for money (paragraphs 3.14 to 3.24).
22 The Secretary of State has a statutory duty to assure Parliament on the standards of fire and rescue authorities, but the Department’s evidence to support these statements is limited. In the last assurance statement to Parliament, the then Secretary of State confirmed he was satisfied that all fire and rescue authorities had complied with their mandated duties. The underlying work carried out by the Department, however, relied almost entirely on the duty on authorities to self-certify their compliance. The Department’s actions were mostly limited to verifying that authorities had published documents on their websites and that these had been signed off by authority chairs. While the Department’s position is that authorities are required to manage their own risks and be locally accountable, it is not making its own assessment of how effectively they are doing so. Its approach meant it did not reflect concerns raised by the Knight Review about the effectiveness of local scrutiny in the evidence supporting the last assurance statement to Parliament (paragraphs 3.25 to 3.28).
Conclusion on value for money
23 Fire and rescue authorities have managed funding reductions since 2010 well: numbers of fires and casualties have continued to fall and there have been no financial failures. To ensure the continued financial and service sustainability of the sector in the context of ongoing funding reductions, we would expect the Department to have a fuller understanding of the appropriate funding level necessary to support services. Equally it should oversee an accountability system capable of providing robust assurance that authorities are maintaining service standards and delivering value for money locally. The Department needs to improve on both criteria to ensure that it is well-placed to deliver value for money in the future. In particular, it has weak assurance over the effectiveness of the local accountability system for fire and rescue, and this needs to be strengthened.
Financial sustainability of fire and rescue services Summary 11
Recommendations
Delivering further savings
a The Department should improve its understanding of the capacity of the sector to deliver further savings and the likely implications of funding reductions by:
• assessing the potential for different authorities to make further efficiency savings by examining underlying costs and assessing efficiency measures they have taken; and
• analysing the factors behind the long‑term downward trend in fires and casualties, seeking in particular to identify the contributions made by the preventative and response activities of fire and rescue authorities.
Supporting transformation
b The Department should assess the likely impacts of different types of service transformation on cost reduction and service improvement. In particular it should work with the sector to assess the value for money of activities which primarily add value for other sectors and the extent to which these activities are able to address the sector’s own financial challenges over the current Parliament.
Strengthening assurance
c The Department should strengthen its assurance on the operational performance of the sector by:
• widening the scope of national resilience assurance, to include an assessment of whether authorities’ local operational capacity is adequate simultaneously to contribute at major incidents and maintain local service levels;
• consulting the sector on ways in which the peer challenge system could be further strengthened, potentially by involving the Chief Fire and Rescue Adviser;
• encouraging authorities to standardise the format of operational targets and performance reporting; and
• gathering substantive evidence to support the Secretary of State’s assurance to Parliament.
12 Part One Financial sustainability of fire and rescue services
Part One
Impacts of funding reductions on financial sustainability
1.1 Since 2010-11, government funding for fire and rescue services has changed in both scale and structure. This part examines the:
• structure of the fire and rescue sector;
• financial challenges faced by the sector;
• response of the sector to funding reductions; and
• impacts of financial pressure on financial and service sustainability.
Structure of fire and rescue sector
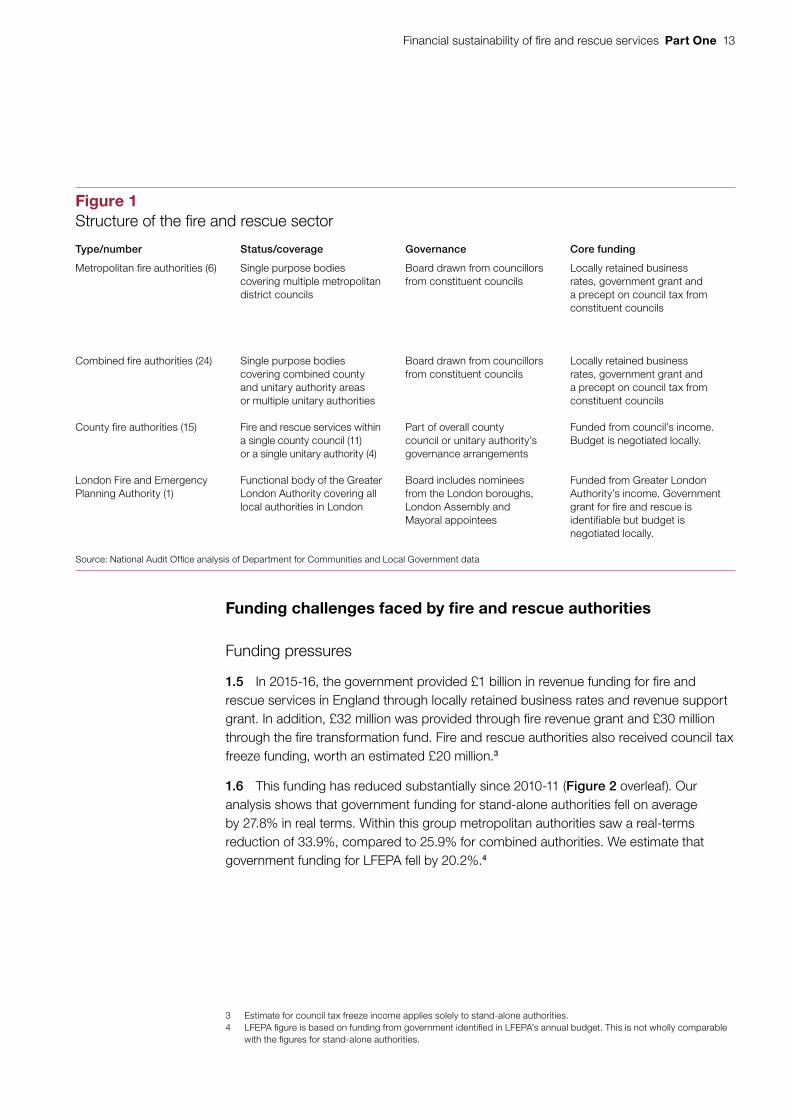
1.2 Fire and rescue services are delivered through a range of different bodies with varying governance and funding arrangements (Figure 1). These differences have implications in relation to the potential impacts of funding reductions on the service.
1.3 As part of broader organisations, county fire authorities and the London Fire and Emergency Planning Authority (LFEPA) can access the wider resources and reserves of the broader corporate body. Equally, fire and rescue service budgets can be used to support alternative corporate objectives.
1.4 As single purpose bodies, metropolitan and combined authorities do not have direct access to alternative resources and have no means of moderating reductions in government grant other than the reserves they hold directly.
Financial sustainability of fire and rescue services Part One 13
Funding challenges faced by fire and rescue authorities
Funding pressures
1.5 In 2015-16, the government provided £1 billion in revenue funding for fire and rescue services in England through locally retained business rates and revenue support grant. In addition, £32 million was provided through fire revenue grant and £30 million through the fire transformation fund. Fire and rescue authorities also received council tax freeze funding, worth an estimated £20 million.3
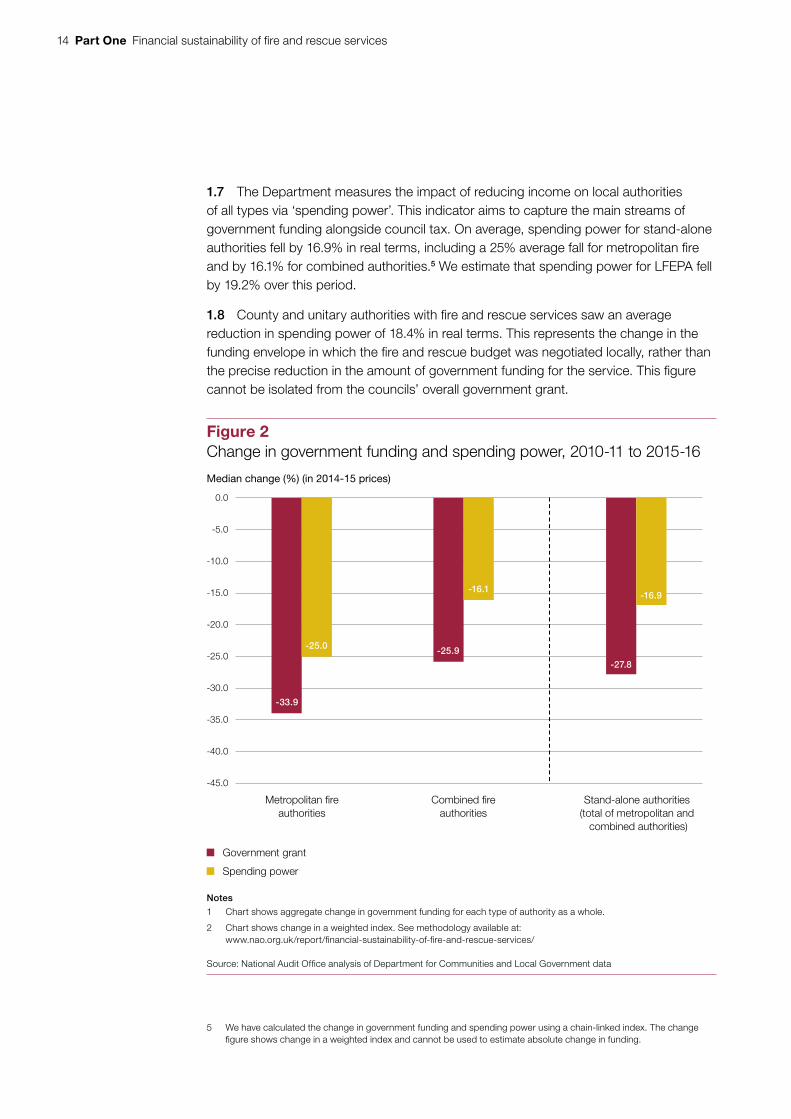
1.6 This funding has reduced substantially since 2010-11 (Figure 2 overleaf). Our analysis shows that government funding for stand-alone authorities fell on average by 27.8% in real terms. Within this group metropolitan authorities saw a real-terms reduction of 33.9%, compared to 25.9% for combined authorities. We estimate that government funding for LFEPA fell by 20.2%.4
3 Estimate for council tax freeze income applies solely to stand-alone authorities.4 LFEPA figure is based on funding from government identified in LFEPA’s annual budget. This is not wholly comparable
with the figures for stand-alone authorities.
Figure 1Structure of the fi re and rescue sector
Type/number Status/coverage Governance Core funding
Metropolitan fire authorities (6) Single purpose bodies covering multiple metropolitan district councils
Board drawn from councillors from constituent councils
Locally retained business rates, government grant and a precept on council tax from constituent councils
Combined fire authorities (24) Single purpose bodies covering combined county and unitary authority areas or multiple unitary authorities
Board drawn from councillors from constituent councils
Locally retained business rates, government grant and a precept on council tax from constituent councils
County fire authorities (15) Fire and rescue services within a single county council (11) or a single unitary authority (4)
Part of overall county council or unitary authority’s governance arrangements
Funded from council’s income. Budget is negotiated locally.
London Fire and Emergency Planning Authority (1)
Functional body of the Greater London Authority covering all local authorities in London
Board includes nominees from the London boroughs, London Assembly and Mayoral appointees
Funded from Greater London Authority’s income. Government grant for fire and rescue is identifiable but budget is negotiated locally.
Source: National Audit Offi ce analysis of Department for Communities and Local Government data
14 Part One Financial sustainability of fire and rescue services
1.7 The Department measures the impact of reducing income on local authorities of all types via ‘spending power’. This indicator aims to capture the main streams of government funding alongside council tax. On average, spending power for stand-alone authorities fell by 16.9% in real terms, including a 25% average fall for metropolitan fire and by 16.1% for combined authorities.5 We estimate that spending power for LFEPA fell by 19.2% over this period.
1.8 County and unitary authorities with fire and rescue services saw an average reduction in spending power of 18.4% in real terms. This represents the change in the funding envelope in which the fire and rescue budget was negotiated locally, rather than the precise reduction in the amount of government funding for the service. This figure cannot be isolated from the councils’ overall government grant.
5 We have calculated the change in government funding and spending power using a chain-linked index. The change figure shows change in a weighted index and cannot be used to estimate absolute change in funding.
-33.9
-25.9
-27.8
-25.0
-16.1-16.9
-45.0
-40.0
-35.0
-30.0
-25.0
-20.0
-15.0
-10.0
-5.0
0.0
Figure 2Change in government funding and spending power, 2010-11 to 2015-16
Median change (%) (in 2014-15 prices)
Notes
1 Chart shows aggregate change in government funding for each type of authority as a whole.
2 Chart shows change in a weighted index. See methodology available at: www.nao.org.uk/report/financial-sustainability-of-fire-and-rescue-services/
Source: National Audit Office analysis of Department for Communities and Local Government data
Metropolitan fireauthorities
Combined fireauthorities
Stand-alone authorities(total of metropolitan and
combined authorities)
Government grant
Spending power
Financial sustainability of fire and rescue services Part One 15
Spending power and need
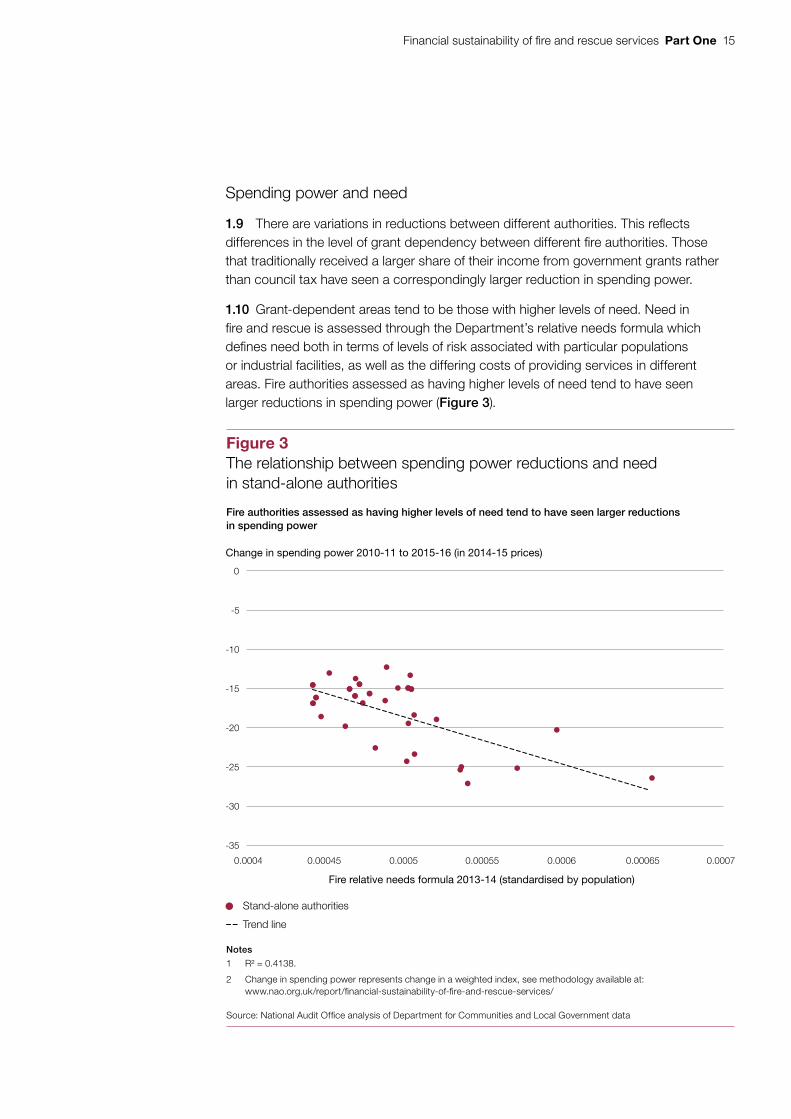
1.9 There are variations in reductions between different authorities. This reflects differences in the level of grant dependency between different fire authorities. Those that traditionally received a larger share of their income from government grants rather than council tax have seen a correspondingly larger reduction in spending power.
1.10 Grant-dependent areas tend to be those with higher levels of need. Need in fire and rescue is assessed through the Department’s relative needs formula which defines need both in terms of levels of risk associated with particular populations or industrial facilities, as well as the differing costs of providing services in different areas. Fire authorities assessed as having higher levels of need tend to have seen larger reductions in spending power (Figure 3).
-35
-30
-25
-20
-15
-10
-5
0
0.0004 0.00045 0.0005 0.00055 0.0006 0.00065 0.0007
Stand-alone authorities
Trend line
Figure 3The relationship between spending power reductions and need in stand-alone authorities
Change in spending power 2010-11 to 2015-16 (in 2014-15 prices)
Notes
1 R² = 0.4138.
2 Change in spending power represents change in a weighted index, see methodology available at: www.nao.org.uk/report/financial-sustainability-of-fire-and-rescue-services/
Source: National Audit Office analysis of Department for Communities and Local Government data
Fire authorities assessed as having higher levels of need tend to have seen larger reductions in spending power
Fire relative needs formula 2013-14 (standardised by population)
16 Part One Financial sustainability of fire and rescue services
The weakening of need in the funding system
1.11 In 2013-14 the Department introduced the business rates retention scheme, under which funding for local government has been partly localised. The Department intends this to incentivise local authorities to pursue economic growth. While acknowledging fire and rescue authorities have little or no influence over growth, the Department included them in the scheme.
1.12 Under the previous funding arrangement, need formed an important element of the funding system. The level of need in 2013-14 was built into the baseline funding for the new system but the needs formula is no longer updated. Local variation in grant allocations is now driven by levels of local growth rather than change in need.
Fire and rescue authorities’ responses
Raising additional income
1.13 Fire and rescue authorities have not been able to offset reductions in government funding by using income from other sources:
• Income from council tax, once adjusted to account for the localisation of council tax support, grew by 2.6% on average in real terms from 2010-11 to 2014-15 for stand-alone fire authorities and fell by 0.1% for county fire authorities.
• Income from sales fees and charges for the sector as a whole fell by 21.9% in real terms from 2010-11 to 2014-15 to £33 million.
• In general, fire and rescue authorities have not used reserves to offset reductions in funding. Between 2010-11 and 2014-15, stand-alone fire and rescue authorities increased their total reserves by 66.6% in real terms.
Reducing spending
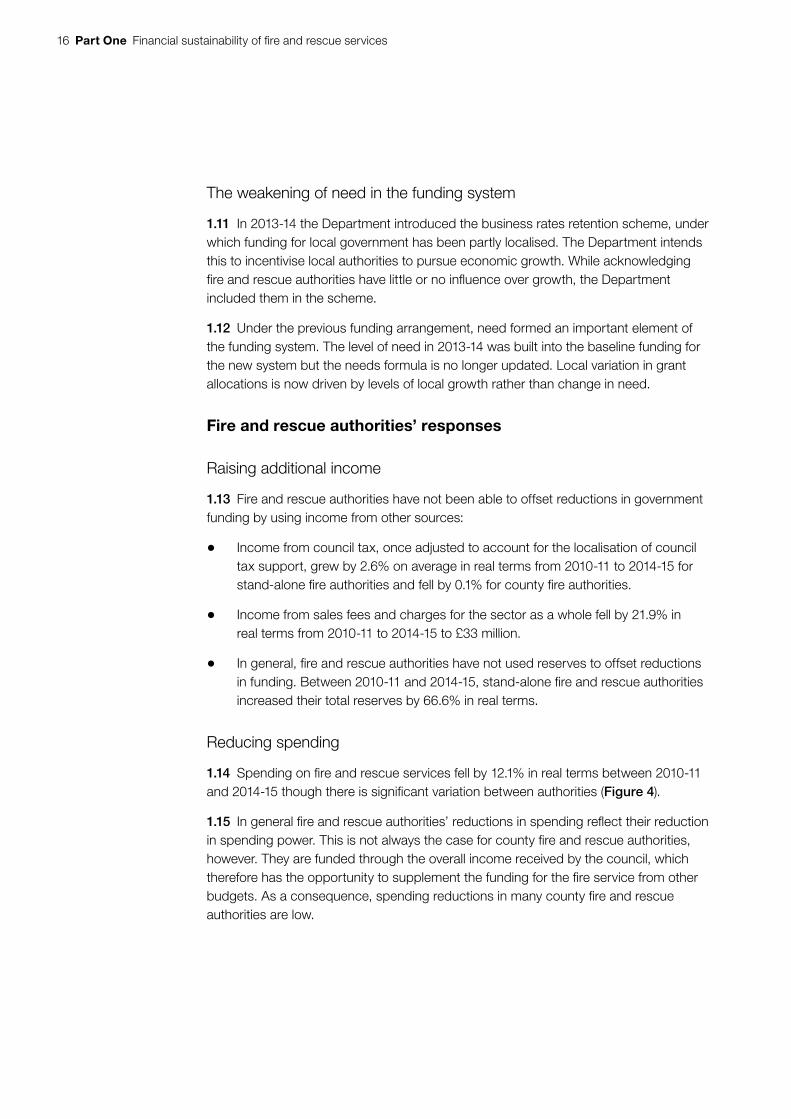
1.14 Spending on fire and rescue services fell by 12.1% in real terms between 2010-11 and 2014-15 though there is significant variation between authorities (Figure 4).
1.15 In general fire and rescue authorities’ reductions in spending reflect their reduction in spending power. This is not always the case for county fire and rescue authorities, however. They are funded through the overall income received by the council, which therefore has the opportunity to supplement the funding for the fire service from other budgets. As a consequence, spending reductions in many county fire and rescue authorities are low.
Financial sustainability of fire and rescue services Part One 17
Delivering savings
Reducing staffing costs
1.16 Net savings to date have come exclusively from reductions in staffing costs. Total spending on employees fell by 14.9% in real terms between 2010-11 and 2014-15. Spending on running costs, which includes expenditure on transport, premises, support services and outsourcing grew by 2.1%.
1.17 Partly this reflects the structure of the cost base of fire and rescue authorities. As a direct provider of services, 77% of their cost base in 2011-12 comprised pay and pensions. In contrast other services provided by councils have commissioning based service models where savings come from re-tendering or renegotiating contracts.
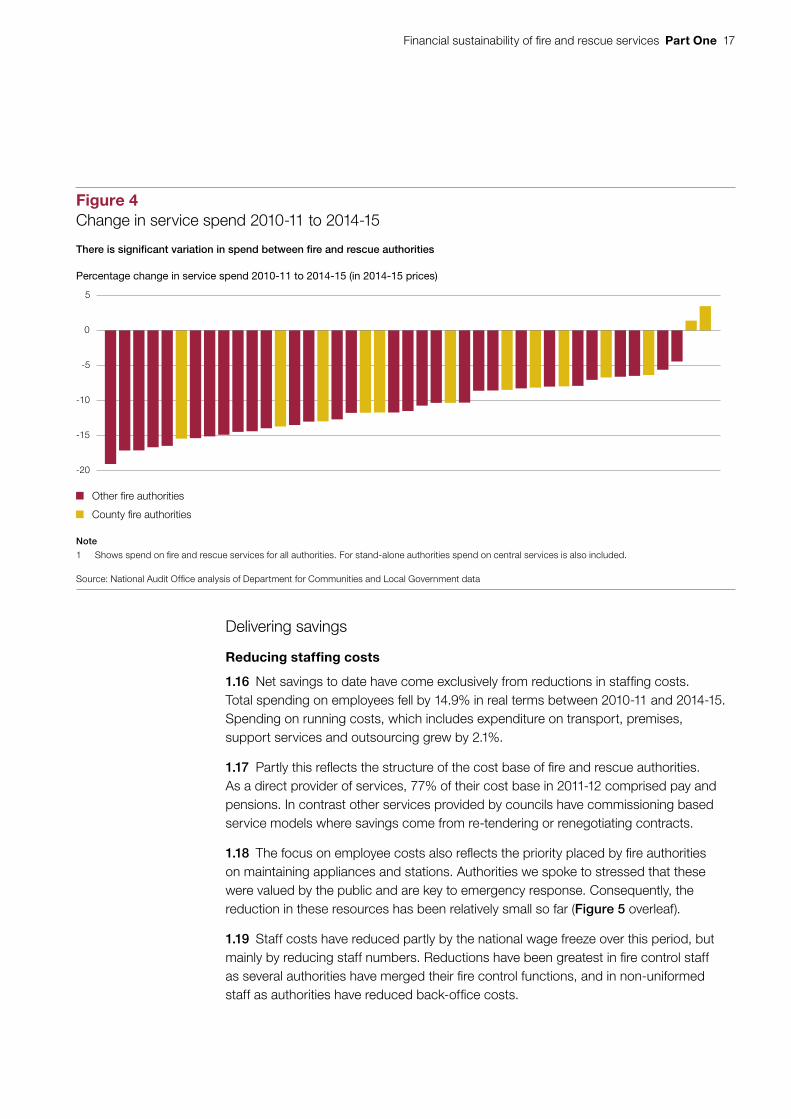
1.18 The focus on employee costs also reflects the priority placed by fire authorities on maintaining appliances and stations. Authorities we spoke to stressed that these were valued by the public and are key to emergency response. Consequently, the reduction in these resources has been relatively small so far (Figure 5 overleaf).
1.19 Staff costs have reduced partly by the national wage freeze over this period, but mainly by reducing staff numbers. Reductions have been greatest in fire control staff as several authorities have merged their fire control functions, and in non-uniformed staff as authorities have reduced back-office costs.
Figure 4Change in service spend 2010-11 to 2014-15
Percentage change in service spend 2010-11 to 2014-15 (in 2014-15 prices)
There is significant variation in spend between fire and rescue authorities
Note
1 Shows spend on fire and rescue services for all authorities. For stand-alone authorities spend on central services is also included.
Source: National Audit Office analysis of Department for Communities and Local Government data
Other fire authorities
County fire authorities
-20
-15
-10
-5
0
5
18 Part One Financial sustainability of fire and rescue services
1.20 Whole-time and part-time (retained) firefighter numbers have also fallen. Among whole-time firefighters, senior posts have seen the larger reductions (17.1%), relative to other managerial (11.9%) and non-managerial (14.2%) posts. All reductions in firefighter posts have come via ‘natural wastage’ (eg retirement) or voluntary redundancy.
Collaboration and integration
1.21 There is some evidence that fire authorities have sought to integrate and collaborate with other authorities in pursuit of savings:
• Mergers of fire authorities – Dorset and Wiltshire will merge from April 2016. This will be the only full merger to have taken place in the context of austerity.
• Operational collaboration between fire authorities – most strongly in relation to fire control. However, much activity is based on Departmental funding after the failed national FireControl programme in 2010.
• Organisational collaboration with other public bodies – some authorities with strong links to other local bodies, such as in Greater Manchester, are starting to introduce shared service schemes.
• ‘Blue light’ collaboration – growing multiple forms of collaboration, including shared stations, with ambulance, public health and police sectors.
The scale of savings to date, or potentially available in the future is not clear.
Figure 5Change in staffing levels, appliances and fire stations
Percentage change 2010-11 to 2014-15
Fire authorities have prioritised maintaining their number of appliances and fire stations and made larger reductions in staffing
Source: National Audit Office analysis of Department for Communities and Local Government data
-35
-30
-25
-20
-15
-10
-5
0
Fire Controlstaff
Non-uniform Whole-timefirefighters
Retained dutyfirefighters
Number ofpumping
appliances
Number offire stations
-30.3
-15.1-13.5
-10.8
-4.4 -2.0
Financial sustainability of fire and rescue services Part One 19
Impacts on financial and service sustainability
Financial sustainability
Stand-alone authorities
1.22 While reserves among stand-alone authorities have grown overall, an increasing number of authorities have more recently begun drawing on their reserves. This is not necessarily a sign of financial stress, as drawing on reserves can form part of a robust financial strategy. However, it is notable that while no stand-alone authorities drew on reserves in 2010-11, over a fifth (21.4%) did so in 2014-15.
1.23 Other potential indicators of financial stress suggest that the sector has coped well. There have been no section 114 reports produced for fire authorities which are necessary if an authority were unable to balance its books. Equally, no fire authorities have had their accounts qualified.
1.24 However, underlying these high-level indicators there are some potential signs of stress. Annual governance returns show that auditors raised concerns over aspects of the financial health of 5 stand-alone authorities in 2013-14. Peer challenges of fire and rescue authorities, which do not focus on financial sustainability, nonetheless highlighted financial concerns in 2 stand-alone authorities. There were 10 stand-alone fire authorities (out of 30) that had either used reserves in 2014-15 or had some indication of financial pressure in either their most recent annual governance report or peer challenge.
County authorities and LFEPA
1.25 Assessing the financial health of county fire authorities and LFEPA is more complex as there is less financial information available. For instance, county fire services do not hold identifiable reserves, while LFEPA’s reserves are under the ultimate control of the Greater London Authority. All these bodies have had peer challenges and 2 made specific reference to financial concerns. One raised questions about the long-term sustainability of the service in its current configuration given the financial pressure facing the county council.
Service impacts
1.26 As with local authorities, the legal imperative on fire and rescue authorities to balance their books means that financial pressures are likely to be passed through into services. Currently fire and rescue authorities provide two principal services: emergency response and fire prevention and protection.
Impacts on emergency response
1.27 The defining feature of the emergency response service provided by an authority is its response standard: the time in which it aims to reach each incident. We have been able to identify 33 sets of standards from 46 fire authorities. Several have changed since 2010-11, but only 1 authority has linked the change to budget pressures.
20 Part One Financial sustainability of fire and rescue services
1.28 Case study authorities indicated that they have changed aspects of their response. This includes:
• Sometimes responding with smaller appliances that have reduced crew levels, for example to less serious incidents.
• Reducing crewing levels on standard pumps.
• Changing crewing arrangements for specialist appliances.
1.29 Core emergency response service remains largely the same in that fire authorities plan to reach incidents in the same time, but the nature of the resource that they send to each incident could have changed.
Impacts on prevention and protection
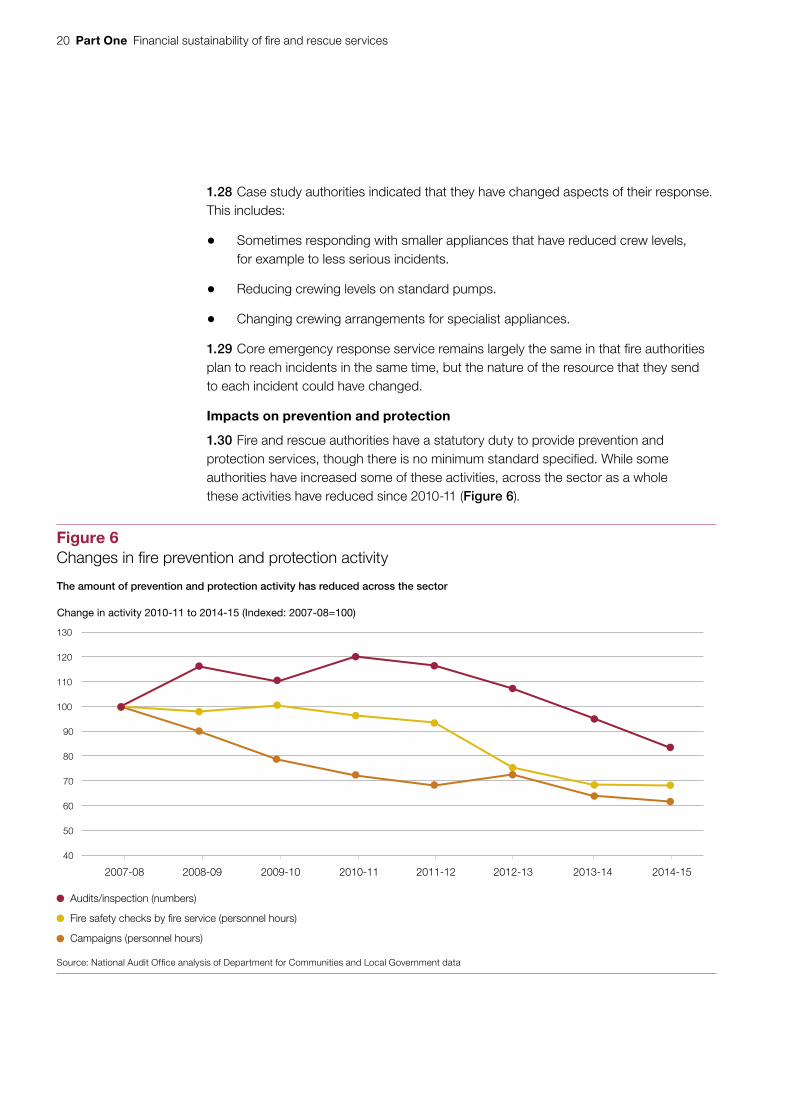
1.30 Fire and rescue authorities have a statutory duty to provide prevention and protection services, though there is no minimum standard specified. While some authorities have increased some of these activities, across the sector as a whole these activities have reduced since 2010-11 (Figure 6).
40
50
60
70
80
90
100
110
120
130
2007-08 2008-09 2009-10 2010-11 2011-12 2012-13 2013-14 2014-15
Figure 6Changes in fire prevention and protection activity
Change in activity 2010-11 to 2014-15 (Indexed: 2007-08=100)
Audits/inspection (numbers)
Fire safety checks by fire service (personnel hours)
Campaigns (personnel hours)
Source: National Audit Office analysis of Department for Communities and Local Government data
The amount of prevention and protection activity has reduced across the sector
Financial sustainability of fire and rescue services Part One 21
1.31 There may be factors in addition to funding reductions behind some of these changes, however. Time spent on campaigns, for instance, was falling before 2010-11. The Department believe that these reductions have been driven by greater targeting of activity on high risk groups.
1.32 The most noticeable reductions in fire safety check activity have taken place since 2010-11. Nonetheless, the Department argues that this may also be partly explained by authorities targeting their activity; time spent on checks at properties where the householder is disabled increased by 29.7% from 2010-11 to 2014-15. It also points to the fact that a higher percentage of homes now have smoke alarms.
1.33 Evidence from our case studies suggests that some, but not all, authorities had reduced their prevention and protection work in response to funding reductions. The West Midlands and the London Fire Brigade, in particular, mentioned the potential impact of staff reductions on delivering their protection work. However, London Fire Brigade has made productivity improvements, such as the introduction of new ways of working, that it feels have offset reductions in staffing to date. London Fire Brigade has also avoided making further reductions in this front-line service area.
Service outcomes
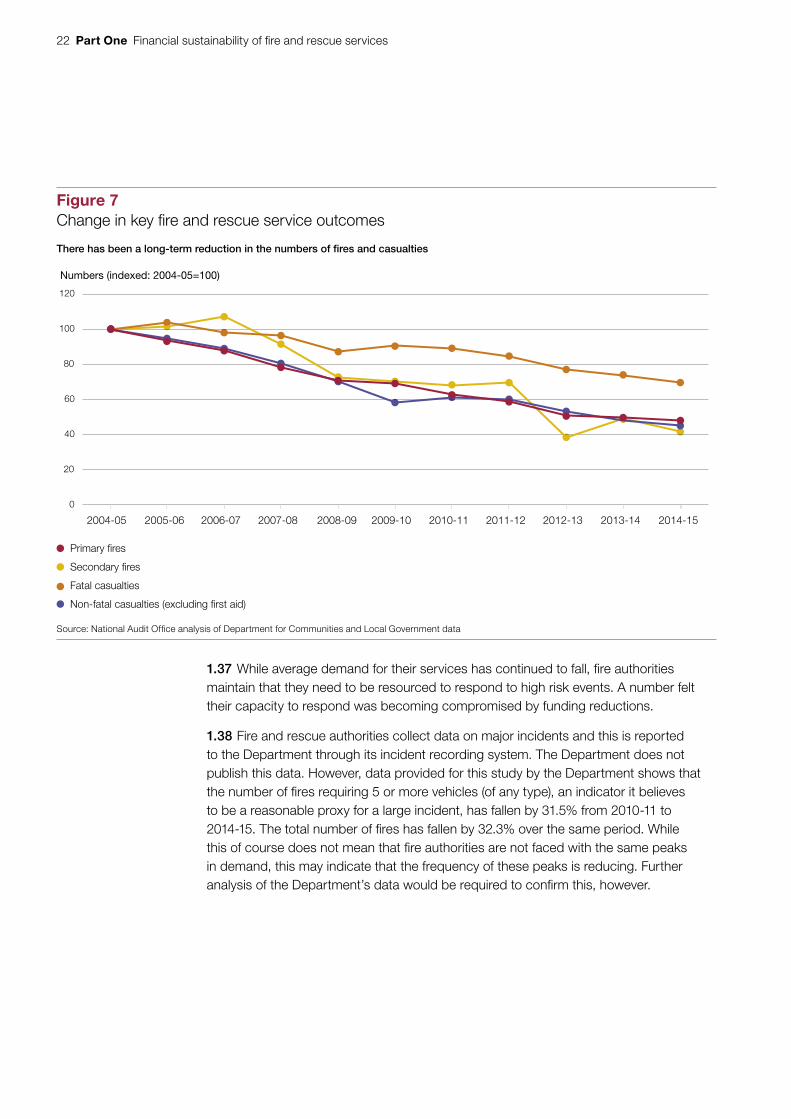
1.34 While some fire authorities have changed the nature of their services since 2010-11, it does not appear that there have been adverse implications for service outcomes. Average response times have increased slightly over this period from 8 minutes 16 seconds in 2010-11 to 8 minutes 24 seconds in 2013-14, but the main outcomes in terms of fires and casualties have continued their long-term pattern of improvement – Figure 7 overleaf.
1.35 Health and safety statistics for firefighters have also continued to improve. The total number of firefighters injured between 2010-11 and 2014-15 fell at a comparable rate to the preceding five-year period. Injuries at special service incidents such as road traffic accidents and floods increased by 10.1%, however.
Risk and resilience
1.36 Fire authorities we spoke to stressed that they were risk-based organisations designed to provide resilience against major events or multiple simultaneous incidents, rather than meet average demand. For example:
• Over the last 5 years the West Midlands fire and rescue service have had an average of between 2 and 5 appliances in use in any 5 minute period. However, its maximum utilisation rate over this period ranges from 20 to 40 appliances.
• Lincolnshire fire and rescue service had an average mobilisation rate measured over a day of between 22 to 28 appliances since April 2010.6 This includes four peaks when 50 appliances were mobilised and one where 80 appliances were involved.
6 Averages calculated over full years from April to March for 2010-11 to 2014-15, and for the part-year April to August 2015.
22 Part One Financial sustainability of fire and rescue services
1.37 While average demand for their services has continued to fall, fire authorities maintain that they need to be resourced to respond to high risk events. A number felt their capacity to respond was becoming compromised by funding reductions.
1.38 Fire and rescue authorities collect data on major incidents and this is reported to the Department through its incident recording system. The Department does not publish this data. However, data provided for this study by the Department shows that the number of fires requiring 5 or more vehicles (of any type), an indicator it believes to be a reasonable proxy for a large incident, has fallen by 31.5% from 2010-11 to 2014-15. The total number of fires has fallen by 32.3% over the same period. While this of course does not mean that fire authorities are not faced with the same peaks in demand, this may indicate that the frequency of these peaks is reducing. Further analysis of the Department’s data would be required to confirm this, however.
Figure 7Change in key fire and rescue service outcomes
Numbers (indexed: 2004-05=100)
Primary fires
Secondary fires
Fatal casualties
Non-fatal casualties (excluding first aid)
Source: National Audit Office analysis of Department for Communities and Local Government data
There has been a long-term reduction in the numbers of fires and casualties
0
20
40
60
80
100
120
2004-05 2005-06 2006-07 2007-08 2008-09 2009-10 2010-11 2011-12 2012-13 2013-14 2014-15

Financial sustainability of fire and rescue services Part One 23
Future sustainability
1.39 Case study authorities we spoke to indicated that they expect significant funding reductions to continue and that they will meet their legal obligations and balance their books. However, given the savings made to date, a number anticipate that further savings will only be possible via further reductions in firefighters. Some authorities were concerned that this may potentially degrade the overall service offer, as falling staff numbers may lead to fewer appliances and stations. One authority was also concerned that further firefighter reductions might increase risks to firefighter safety. Another was concerned that staff reductions would prompt industrial action.
1.40 These fears may not be realised and the performance of the sector over the last five years has been strong. Furthermore, not all authorities have introduced key proposals endorsed by the Department such as changes in shift patterns, higher levels of collaboration and an increase in retained firefighters. However, given the cost base of the sector, finding year-on-year savings while protecting firefighter levels will be increasingly difficult.
24 Part Two Financial sustainability of fire and rescue services
Part Two
The Department’s oversight of funding reductions
2.1 In this part we examine the Department’s role in overseeing funding of fire and rescue authorities. In carrying out this role, we would expect the Department to:
• take informed funding decisions and monitor the impacts of these decisions; and
• support fire and rescue authorities to manage funding reductions.
Understanding impacts
Understanding costs
2.2 In 2012, the Department commissioned Sir Ken Knight, then Chief Fire and Rescue Adviser, to review the potential of the sector to find efficiencies. This report forms the core of the Department’s understanding of the potential of the sector to realise efficiency savings. The Department responded to the Knight Review in a statement to Parliament, identifying a number of findings it wanted to build on, though it did not publish a formal response which addressed all of Sir Ken’s points.7
2.3 Reporting in 2013, the Knight Review found there were “inexplicable differences in the expenditure of different fire and rescue authorities”.8 The implication was that some authorities were simply more efficient than others. The Knight Review concluded as a result that there was significant scope for the sector to increase efficiency. It stated that if all those spending more than the average per resident were able to reduce to the average there would be an overall saving of £196 million annually.9
7 Hansard HC, 15 July 2014, cols 48-49WS.8 Sir Ken Knight, Facing the Future: Findings from a review of the efficiency and operations of fire and rescue authorities
in England, Department for Communities and Local Government, 2013, pp 7, 16.9 Sir Ken Knight, Facing the Future, 2013, p 22.
Financial sustainability of fire and rescue services Part Two 25
2.4 We performed our own analysis of the differences in spending across fire authorities, using a more sophisticated model than that used in the Knight Review.10 Our analysis indicates that a substantial proportion of variation in spend per capita can be explained. We found 48% of variation in spend could be explained by local factors which are outside of the control of authorities. This includes, for example, the presence of particular social groups or industrial facilities, and higher underlying costs of service provision in different places. This suggests that to some degree, therefore, difference in spending levels reflects intrinsic differences in the underlying costs of providing services in different areas. We also found, however, that a further 14% of variation in spend could be attributed to factors within the control of authorities, ie local decisions about staffing models and pay.
2.5 Our analysis does not invalidate the Knight Review’s conclusion that there is scope for the sector as a whole to improve efficiency. It does, however, highlight that the Department’s understanding of the costs of providing fire and rescue services in different areas could be improved. Otherwise, there is a risk the Department will simply view higher spending authorities as being inefficient and lower spending authorities as efficient. With a more sophisticated understanding of which authorities were more efficient, the Department could better understand the potential size of savings available across the sector. It might also be able to better target its efforts to assist the sector to make savings.
Savings measures and impacts on services
2.6 The Department collects activity and operational data, enabling it to observe trends in staffing and activities. The Chief Fire and Rescue Adviser has, when requested, successfully obtained snapshots of the operational capacity (ie numbers of appliances crewed and available to respond to incidents) in every fire and rescue service.
10 The full methodology and results from our analysis are available at: www.nao.org.uk/report/financial-sustainability-of-fire-and-rescue-services/
26 Part Two Financial sustainability of fire and rescue services
2.7 At the same time there are gaps in the Department’s understanding of the impacts of its funding reductions at a local level:
• The Department is aware – for example, through regular contact with chief fire officers – of some fire authorities implementing some of the measures suggested by the Knight Review. However, it does not see its role as being to monitor this systematically. It relies on fire and rescue authorities to manage their own budgets, and does not it review how they are planning to reduce costs within medium-term financial strategies, nor whether auditors are raising concerns about their ability to deliver savings. The Department therefore lacks its own detailed overview of how far advanced authorities are in implementing cost reduction strategies.
• The Department does not analyse the capacity of individual authorities to achieve cost savings. Some authorities we spoke to described barriers to implementing measures suggested by the Knight Review. For example, rural authorities such as Lincolnshire, Wiltshire and Dorset already have high proportions of on-call firefighters. This makes it more challenging to reduce whole-time firefighters and limits their scope for more flexible shift patterns and crewing arrangements. The Department has not said how it expects such authorities to make future cost savings from staffing.
• The Department knows some authorities are altering response standards, but does not hold response standard data for the sector as a whole. It is thus poorly placed to assess whether funding reductions are leading to a weakening of these standards.
Assessing impacts on outcomes for the public
Understanding outcomes
2.8 The Department’s primary approach to monitoring the impacts of funding reductions is to focus on outcomes. The Department has adopted fire-related casualties as a key indicator of the impacts of funding reductions. These figures have followed a long-term downward trend. The Department says this reflects high numbers of smoke alarms and fire safety advice provided by fire and rescue authorities.11 The Knight Review also pointed to additional factors, such as government regulations on flame-retardant furniture.12
2.9 However, while the Department knows that different factors have contributed to improved outcomes in recent years, it does not have a detailed understanding of the contributions made by different factors to this declining trend. In particular it does not have a clear view of the contribution made by fire and rescue authorities as a whole or the different services they provide. It is not, therefore, well-placed to assess the potential impacts on fire outcomes of reductions in fire and rescue authorities’ preventative activities, or their broader response activities.
11 Available at: http://dclgapps.communities.gov.uk/indicators/fire-related-casualties-per-100000.html12 Sir Ken Knight, Facing the Future, 2013, pp 38, 71.
Financial sustainability of fire and rescue services Part Two 27
Understanding risk
2.10 Core responsibility for understanding risk lies with the fire authorities. Since 2003 they have been required to assess all foreseeable fire and rescue related risks to their communities and reflect these in an integrated risk management plan. Our case study authorities contained strong evidence of the use of local risk data such as variation in demand by time of day, location or property type to shape local services. For instance, West Midlands has carried out detailed work, using commissioned academic research, on different aspects of fire risk to life in domestic properties. This supported the design of its response arrangements.
2.11 In contrast, the Department has taken an outcomes-based rather than a risk-based approach to its oversight of the sector. This makes it more difficult to detect in advance where service reductions could be reducing risk cover. The Department might only become aware that some authorities had made imprudent service reductions after the fact.
Assessing proposed reductions at Spending Round 2013
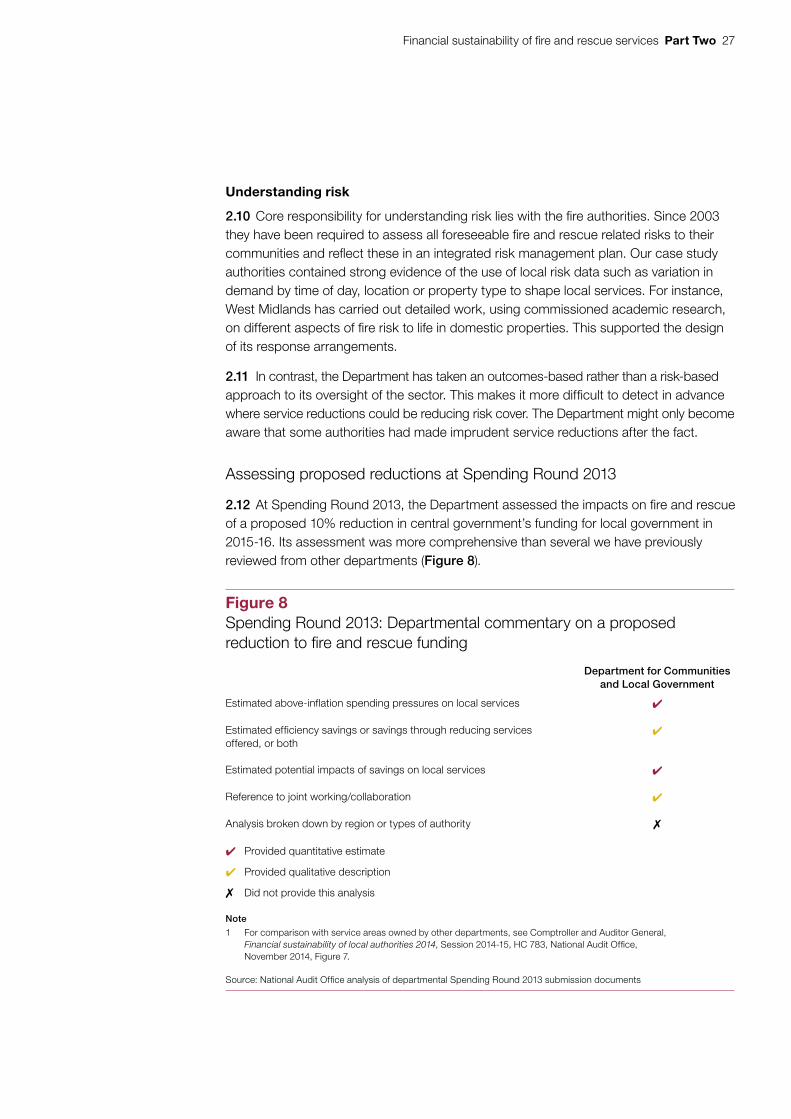
2.12 At Spending Round 2013, the Department assessed the impacts on fire and rescue of a proposed 10% reduction in central government’s funding for local government in 2015-16. Its assessment was more comprehensive than several we have previously reviewed from other departments (Figure 8).
Figure 8Spending Round 2013: Departmental commentary on a proposed reduction to fi re and rescue funding
Department for Communities and Local Government
Estimated above-inflation spending pressures on local services
Estimated efficiency savings or savings through reducing services offered, or both
Estimated potential impacts of savings on local services
Reference to joint working/collaboration
Analysis broken down by region or types of authority
Provided quantitative estimate
Provided qualitative description
Did not provide this analysis
Note
1 For comparison with service areas owned by other departments, see Comptroller and Auditor General, Financial sustainability of local authorities 2014, Session 2014-15, HC 783, National Audit Offi ce, November 2014, Figure 7.
Source: National Audit Offi ce analysis of departmental Spending Round 2013 submission documents
28 Part Two Financial sustainability of fire and rescue services
2.13 At the same time, the methodology underpinning its assessments was relatively crude. Assuming that fire and rescue authorities would have all but exhausted their scope to make short-term efficiency savings by 2015, it translated proposed funding reductions directly into a loss of firefighter posts and increases in risks of service cuts and disruption.
2.14 It used this analysis to argue that fire and rescue authorities should be relatively protected, with their reduction in government funding capped at 7.5%. In addition, it secured extra funding to assist authorities to invest in measures to reduce costs long term. This additional funding went towards the Fire Transformation Fund (paragraph 2.17), which while awarded for specific projects was un-ringfenced. The effect of this funding was to limit the sector’s funding reduction to 5% in net terms.
Supporting the sector
Changes to the funding system
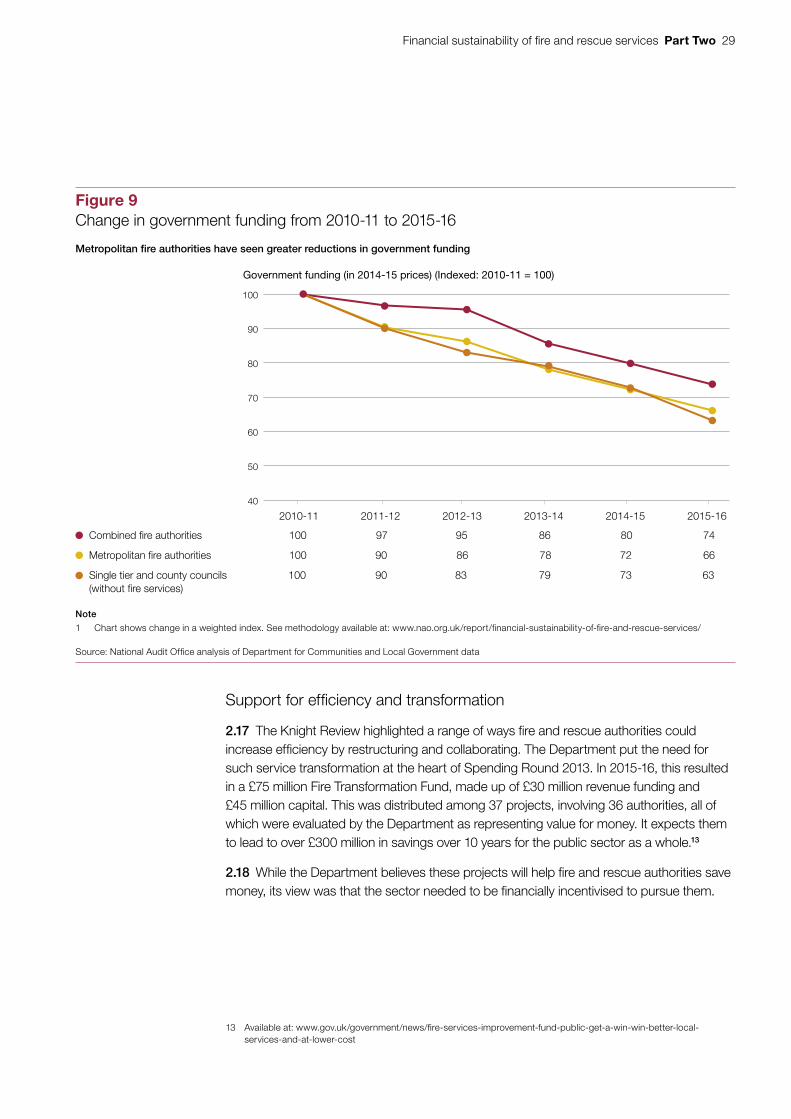
2.15 The Department has sought to support the sector in managing funding reductions by moderating the scale of reductions. At Spending Review 2010, covering the period 2011-12 to 2014-15, the Department reduced funding to the sector less relative to local authorities, as fire is an emergency service. Additionally, it made the reductions less steep in earlier years to give authorities more time to adapt. However, this ‘back-loading’ appeared to apply to combined authorities but not to metropolitan authorities, where funding reductions have been in line with local authorities without fire and rescue services (Figure 9). In the Department’s view this reflected the inclusion of updated data in the fire needs formula in 2011-12 which indicated that need in metropolitan fire authorities had fallen relative to combined authorities.
2.16 The Department has also provided other measures of protection:
• Business rates: In 2013-14, the Department introduced the business rates retention scheme, under which local authorities and fire and rescue authorities retain around half of the business rates they raise locally. In including them within the scheme, it protected them by designating them all ‘top-up’ authorities. This means their local share of business rates income is topped-up each year to protect against volatility in business rates returns.
• Council tax: Since 2012-13, the Department has set annual limits on the increases that can be made to council tax without holding local a referendum. Responding to representations from the sector, in 2012-13 it allowed fire authorities with the lowest council tax rates to increase their council tax precept by up to £5 if this yielded a greater sum than the limit of 2%.
• Formula grant: In 2011-12, the Department altered its funding formula to include new need factors such as population density. Ultimately, however, the outcome was that fire authorities assessed as having higher levels of relative needs received greater funding reductions relative to those with lower need, some of whom saw funding increases in 2011-12 and 2012-13.
Financial sustainability of fire and rescue services Part Two 29
Support for efficiency and transformation
2.17 The Knight Review highlighted a range of ways fire and rescue authorities could increase efficiency by restructuring and collaborating. The Department put the need for such service transformation at the heart of Spending Round 2013. In 2015-16, this resulted in a £75 million Fire Transformation Fund, made up of £30 million revenue funding and £45 million capital. This was distributed among 37 projects, involving 36 authorities, all of which were evaluated by the Department as representing value for money. It expects them to lead to over £300 million in savings over 10 years for the public sector as a whole.13
2.18 While the Department believes these projects will help fire and rescue authorities save money, its view was that the sector needed to be financially incentivised to pursue them.
13 Available at: www.gov.uk/government/news/fire-services-improvement-fund-public-get-a-win-win-better-local-services-and-at-lower-cost
40
50
60
70
80
90
100
2010-11 2011-12 2012-13 2013-14 2014-15 2015-16
Figure 9Change in government funding from 2010-11 to 2015-16
Government funding (in 2014-15 prices) (Indexed: 2010-11 = 100)
Combined fire authorities 100 97 95 86 80 74
Metropolitan fire authorities 100 90 86 78 72 66
Single tier and county councils 100 90 83 79 73 63 (without fire services)
Note
1 Chart shows change in a weighted index. See methodology available at: www.nao.org.uk/report/financial-sustainability-of-fire-and-rescue-services/
Source: National Audit Office analysis of Department for Communities and Local Government data
Metropolitan fire authorities have seen greater reductions in government funding
30 Part Two Financial sustainability of fire and rescue services
Realising benefits of transformation
2.19 Unlike many other local government and emergency services, demand is falling in the fire sector. However, as fire and rescue authorities are risk-based, designed to provide resilience against major events rather than meet average demand, authorities are reluctant to reduce operational resources in line with demand. Consequently many transformation projects concentrate on using latent capacity in the sector that has increased as average demand has fallen faster than operational resources.14
2.20 Many authorities have addressed latent capacity directly by reducing staffing. Others have focused on making it more productive by adding value to other sectors, including ambulance services, social care, and youth services. Providing benefits to other sectors is the opposite to our recent findings on police services where a number of forces stated that financial pressures in health and local government were generating additional unfunded demand for police services.15
2.21 Examples of initiatives by fire and rescue authorities focused on latent capacity include:
• Working with vulnerable adults: Cleveland Fire Authority uses its home safety visits to reduce both fire risk and demands on the NHS. When visiting elderly residents, firefighters address hazards which might lead to slips, trips and falls, and provide health advice.
• Working with disadvantaged youths: Drawing on the positive image of the fire service, Greater Manchester Fire and Rescue Authority has established hubs in deprived areas to engage with young people. It provides apprenticeships, a cadet service, and Prince’s Trust activities. In one fire station it has built a climbing wall, while others host boxing clubs. It has also developed a joint service with Salford City Council to support troubled families.
• Co‑responding: For 15 years Lincolnshire Fire and Rescue Service retained firefighters have co-responded to medical emergencies with East Midlands Ambulance Service and Lincolnshire Integrated Voluntary Emergency Service. Utilising retained duty staff and the geographical spread of its fire stations, the service is often able to arrive at an incident first, where firefighters can apply first aid and support a patient until an ambulance arrives. The service receives around 50% of the costs from the local Health and Wellbeing Board. Recently it has built on this service to acquire 3 fire-ambulances, driven by firefighters, in a pilot programme supported by a one-year grant of £0.49 million from the Department.
14 Sir Ken Knight, Facing the Future, pp 42-43. 15 Comptroller and Auditor General, Financial sustainability of police forces in England and Wales, Session 2015-16,
HC 78, National Audit Office, June 2015, para 2.27.
Financial sustainability of fire and rescue services Part Two 31
2.22 The Knight Review questioned the value for money of some of these types of approaches. Sir Ken suggested authorities should consider the extent to which such approaches were being used to maintain existing levels of latent capacity, as opposed to making most productive use of the latent capacity they had to maintain. He also suggested that where fire authorities sought additional funding for such work, partner bodies would need to evaluate whether this represented better value for money than using other staff.16 The Department did not address these questions in its response to the Knight Review.
2.23 A number of our case study authorities placed great emphasis on the potential benefits to the public sector as a whole of this broader role for fire and rescue authorities. The Chief Fire Officers Association has been working with the public health sector to attempt to quantify the benefits of firefighters’ home safety visits, and has published a Consensus Statement with partners on how the fire service can improve health and wellbeing. This includes expanding the scope of home safety visits to tackle health risks, including identifying frailty among the elderly and fitting home improvements to reduce risks of trips and falls.17 In general, however, there is a lack of evidence to assess whether firefighters are the most appropriate people to carry out wider duties. Under the Fire Transformation Fund the Department has approved a number of projects designed to make use of latent capacity. It has asked the authorities in receipt of funding to provide periodic self-evaluations of these projects, and has said it plans to carry out its own evaluation. It has not clarified to date if it will continue to offer such funding, a decision that is likely to be dependent on the outcome of future spending reviews, and there is a lack of clarity in the sector as to how the sector can fund these approaches itself.
On-call firefighters
2.24 On-call firefighters are part-timers who typically do other jobs in the local area, and mobilise when their station receives an emergency call. Generally they are paid a retainer equal to 10% of a whole-time salary, plus a fee for attending training and incidents. Traditionally they have been used most in more rural areas. In 2014-15 they made up 30% of total firefighters. The Knight Review suggested if this were increased to 40% this could result in savings of up to £123 million. On-call firefighters declined though by 10.8% from 2010-11 to 2014-15.
16 Sir Ken Knight, Facing the Future, 2013, p 43.17 Chief Fire Officers Association, Consensus Statement on Improving Health and Wellbeing, October 2015,
available at: www.cfoa.org.uk/20354
32 Part Two Financial sustainability of fire and rescue services
2.25 Several authorities with a tradition of using retained firefighters told us that maintaining on-call firefighter numbers was challenging: the decline in incidents makes the role less remunerative and fulfilling. Declining availability of on-call firefighters increases risks of fire stations becoming non-operational at times if numbers available for duty fall below minimum levels. Some authorities have been seeking to bolster their numbers by adopting co-responding to medical emergencies to provide increased job satisfaction and payments for retained firefighters. Another approach, which Wiltshire is piloting, is to introduce a salary scheme for on-call firefighters.
2.26 Among those authorities we spoke to that did not already make extensive use of on-call firefighters, Cleveland had embarked on a major recruitment programme for on-call firefighters while reducing the number of whole-time firefighters as part of its efficiency measures. Others did not feel this was realistic, citing concerns about recruitment and retention, the ability of on-call firefighters to keep up with training and impacts on the operational resilience of their service. Through the Fire Transformation Fund, the Department has provided assistance to 11 authorities, including Cleveland, to recruit on-call firefighters. It is unclear whether this will increase the proportion of on-call firefighters nationally.
Financial sustainability of fire and rescue services Part Three 33
Part Three
Preventing financial and service failures
3.1 In this part we examine the system the Department has put in place to obtain assurance that fire authorities will:
• remain financially sustainable; and
• be able to maintain their services.
Accountability system for fire and rescue
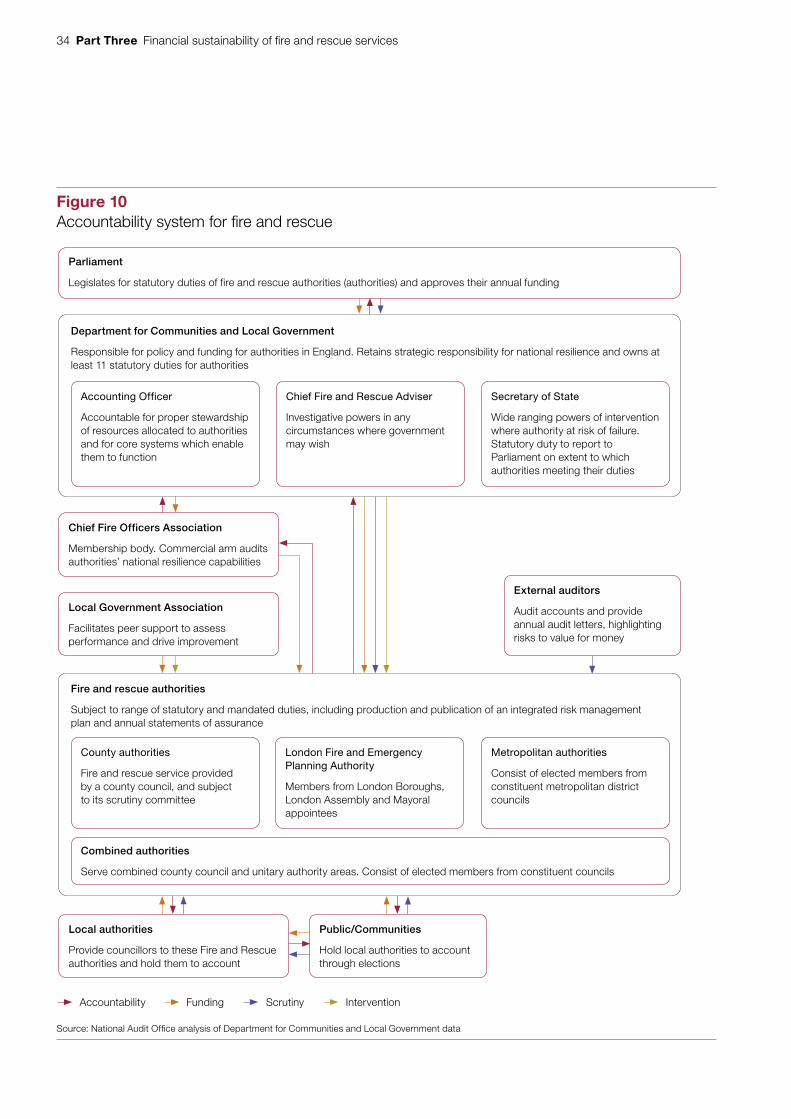
3.2 The Department’s accounting officer is accountable to Parliament for the stewardship of the resources given to fire authorities.18 The Department publishes an accountability system statement, setting out the network of duties and reporting relationships on which it relies to obtain assurance (Figure 10 overleaf).
3.3 There are some similarities with the accountability system for local government.19 Key features include:
• Legal duties for fire authorities to set balanced budgets and ensure they have adequate reserves.
• Local democratic accountability, with authorities being made up of locally-elected councillors.
• Emphasis on the sector to provide peer support in the event of poor performance, but with legal powers for the Department to intervene where serious risk of failure occurs.
18 Department for Communities and Local Government, Accountability System Statement for Local Government and for Fire and Rescue Authorities, 2015, p 21.
19 Comptroller and Auditor General, Financial sustainability of local authorities 2014, Session 2014-15, HC 783, National Audit Office, November 2014, paragraphs 3.2-3.
34 Part Three Financial sustainability of fire and rescue services
Figure 10Accountability system for fi re and rescue
Source: National Audit Offi ce analysis of Department for Communities and Local Government data
ScrutinyAccountability Intervention
Chief Fire Officers Association
Membership body. Commercial arm audits authorities’ national resilience capabilities
Local Government Association
Facilitates peer support to assess performance and drive improvement
Local authorities
Provide councillors to these Fire and Rescue authorities and hold them to account
Public/Communities
Hold local authorities to account through elections
External auditors
Audit accounts and provide annual audit letters, highlighting risks to value for money
Parliament
Legislates for statutory duties of fire and rescue authorities (authorities) and approves their annual funding
Accounting Officer
Accountable for proper stewardship of resources allocated to authorities and for core systems which enable them to function
Chief Fire and Rescue Adviser
Investigative powers in any circumstances where government may wish
Secretary of State
Wide ranging powers of intervention where authority at risk of failure. Statutory duty to report to Parliament on extent to which authorities meeting their duties
Department for Communities and Local Government
Responsible for policy and funding for authorities in England. Retains strategic responsibility for national resilience and owns at least 11 statutory duties for authorities
County authorities
Fire and rescue service provided by a county council, and subject to its scrutiny committee
Combined authorities
Serve combined county council and unitary authority areas. Consist of elected members from constituent councils
London Fire and Emergency Planning Authority
Members from London Boroughs, London Assembly and Mayoral appointees
Metropolitan authorities
Consist of elected members from constituent metropolitan district councils
Fire and rescue authorities
Subject to range of statutory and mandated duties, including production and publication of an integrated risk management plan and annual statements of assurance
Funding
Financial sustainability of fire and rescue services Part Three 35
3.4 There are also unique features of the system for fire and rescue:
• The Department maintains a Fire and Rescue National Framework for England, (the Framework) setting out the government’s objectives for fire authorities.20
• Under the Framework, authorities must assess how their operations will address local risks, in integrated risk management plans. They must also publish annual statements of assurance, covering financial, governance, and operational matters.
• The Secretary of State has a statutory duty to report to Parliament every two years on the extent to which authorities are acting in accordance with the Framework.21
• The Department retains strategic responsibility for national resilience. It commissions annual audits of authorities’ national resilience capabilities, and chairs a Strategic Resilience Board which brings together authorities, departments, and other partners.
• The Chief Fire and Rescue Adviser, an official within the Department but appointed by the Queen, has statutory powers to obtain information on the manner in which fire and rescue authorities are discharging their functions.22
Preventing financial failures
Assurance on financial sustainability
3.5 As with local authorities, legal restrictions on running deficits mean in effect that fire and rescue authorities cannot become insolvent. We have recognised the effectiveness of the accountability system for local government in preventing financial failure. At the same time, we criticised its weaknesses in highlighting the extent of financial pressures that may be building up within local authorities, and for failing to assess the extent to which funding pressures are passed through to services.23
3.6 The Department has begun trialling a review of a sample of annual accounts, in order to highlight themes in the financial challenges affecting both local authorities and fire and rescue authorities. However, the Department does not conduct annual reviews of the effectiveness of the accountability system for fire and rescue, in contrast to that for local authorities.
3.7 The Department has an extensive network of contacts with senior officers throughout the sector, and meets with them frequently. It also has quarterly meetings with the Local Government Association and Chief Fire Officers Association (CFOA). It uses these contacts to gain intelligence on concerns within the sector, although these contacts are not designed systematically to analyse authorities’ financial health.
20 Department for Communities and Local Government, Fire and Rescue National Framework for England, July 2012.21 Fire And Rescue Act 2004, section 25.22 Department for Communities and Local Government, Accountability System Statement, 2015, p 25.23 Comptroller and Auditor General, Financial sustainability of local authorities 2014, Session 2014-15, HC 783,
National Audit Office, November 2014, paragraphs 3.6-11.
36 Part Three Financial sustainability of fire and rescue services
3.8 The Department is considering how to enhance its understanding of the financial health of both local authorities and fire authorities by using the financial data it already collects to assess the inherent risks to their financial resilience. The Department recognises, however, that financial pressures are more likely to manifest themselves in service rather than financial failure due to the strength of the financial accountability system.
Assurance that funding levels are adequate
3.9 The Department has accepted that it is important that fire authorities have the right resources to do their job effectively,24 and that the accountability system (including the funding that flows within it) provides them with the necessary powers, flexibilities, and controls.25 Primarily, the Department relies on fire authorities themselves for assurance that the system is providing sufficient financial resources. For example, it places reliance on authorities’ integrated risk management plans and accountability to local communities.
3.10 The Department says it would expect authorities which felt their funding was inadequate to raise this themselves, and says they have an opportunity in response to the Department’s annual consultation on the funding settlement for the following year. The Department regards the relative lack of responses to these consultations as evidence of robust financial health in the sector. These consultations, however, are usually on technical details relating to specific issues in individual settlements.
Preventing service failures
3.11 The government takes overall responsibility for ensuring the public is adequately protected.26 In addition, the Department has set fire and rescue authorities a number of statutory duties and published a number of actions which they must take under the Framework.
National resilience
3.12 The Department retains strategic responsibility for national resilience.27 To enhance fire authorities’ capabilities the government has provided specialist equipment. The Department also provides a small amount of funding annually for crewing and maintenance.28 The Department has awarded a contract to CFOA National Resilience (a commercial arm of the Chief Fire Officers Association) to audit these capabilities (though not putting this out to competitive tender). The Department requires CFOA National Resilience to provide an annual statement of assurance that fire authorities’ national resilience capabilities are fit for purpose and able to respond to four simultaneous national-level incidents.
24 Department for Communities and Local Government, “2010 to 2015 government policy: fire prevention and rescue”, 8 May 2015.
25 Department for Communities and Local Government, Accountability System Statement, p 23.26 Department for Communities and Local Government, National Fire Framework, p 7.27 Department for Communities and Local Government, National Fire Framework, p 8.28 We reported on the initial provision of this specialist capability in: Comptroller and Auditor General, New Dimensions
– Enhancing the Fire and Rescue Services’ capacity to respond to terrorist and other large-scale incidents, Session 2007-08, HC 1050, National Audit Office, October 2008.
Financial sustainability of fire and rescue services Part Three 37
3.13 While the robustness of such audits were praised, we heard concerns from some authorities that they focused exclusively on specialist teams and equipment, and did not assess the role played by wider operational capacity. Some expressed concerns that, by reducing such wider operational capacity, ongoing funding reductions could reduce their ability to contribute to national resilience needs in the future. However, the Department has given authorities a duty to alert it to any gaps in their national resilience capacity, and established that any such gaps would be considered by the strategic resilience board.
Peer challenges
3.14 In 2010, the Audit Commission ceased inspections of fire and rescue authorities, following the Department’s announcement of its abolition.29 The Department did not carry out a formal assessment of the impact on the fire and rescue sector. With no inspectorate, fire stands apart from other emergency services. For example, from 2014-15, the Home Office has granted HM Inspectorate of Constabulary additional funding for enhanced assessments of police forces. Recently, we concluded that the accountability system for policing is more complete than that for local government.30 Even in the case of local authorities, the Department still places reliance on the Care Quality Commission and Ofsted to provide assurance on the quality and sustainability of key services.
3.15 The former system of external inspection used to play an important role in triggering use of the Department’s intervention powers. The Department says a system of peer challenge now provides support to fire and rescue authorities to assess performance and drive improvement. The Department says that, in addition to the programme of peer challenges organised by authorities themselves, if it became aware of an issue with the running of an authority it would ask the LGA and CFOA to organise an exceptional peer challenge to focus on it. It does not, however, routinely monitor the regular programme of peer challenges as a source of information about each authority.
3.16 Some representatives from the sector we spoke to valued the peer challenge process and its contribution to performance improvement. At the same time, some had expectations about assurance which were not met, with a number saying either that peer challenges needed to be more rigorous or that they should be supplemented by an additional independent process. Several also noted that it is possible for a chief fire officer to influence the composition of the team and specify which areas they should examine. In addition, the outcomes of challenges are not always made public. We could not find 9 authorities’ peer challenge reports online.31
29 Formerly, inspections were carried out by HM Fire Services Inspectorate. Its inspection functions were transferred to the Audit Commission in 2003, and it was abolished in 2007.
30 Comptroller and Auditor General, Financial sustainability of police forces in England and Wales, Session 2015-16, HC 78, National Audit Office, June 2015, paragraphs 3.24-25.
31 This excludes 2 reviews that have only recently completed.
38 Part Three Financial sustainability of fire and rescue services
3.17 The Department relies on the sector to ensure the robustness of the peer challenge system. In 2013, the LGA commissioned an independent review of the system. This found it was highly valued within the sector to provide independent challenge and well-informed feedback on how a service could improve. The review made a number of recommendations to further strengthen the system. In March 2015, the LGA and CFOA launched a revised version of the fire peer challenge process, with the first such peer challenge being carried out after our fieldwork.
3.18 In 2013, the Knight Review suggested that authorities should not be able to choose their reviewers, and that the peer challenge reports should always be published together with an action plan.32 The Department did not address this issue in its response to the Knight Review. It has not reviewed the effectiveness of peer challenges, but is aware of ongoing efforts by the sector to strengthen the system.
Local scrutiny of operational performance
Independent technical challenge
3.19 Chief fire officers are accountable to fire and rescue authorities, made up of elected councillors, accountable to their electorates. The Department places considerable emphasis on this local scrutiny and accountability.33 However, it was apparent in a number of our case studies that members lacked independent technical support in delivering their scrutiny function.
3.20 The Department says authority members will want to take advice from their chief fire officer, and receive briefings from the services’ senior managers. While this will provide them with technical information, it may not give them an independent technical basis on which to assess it. Elected members need technical support to enable them to make independent judgements on the strategies and performance of their service.
Comparable information
3.21 A further potential weakness in the system of local scrutiny and accountability stems from the lack of comparable operational standards. The Framework states that: “To hold fire and rescue authorities to account, communities need to be able to access information in a way that enables them to compare the performance of their fire and rescue authority with others”.34 Authorities set their own standards – ie for emergency response times – through local integrated risk management plans.
32 Sir Ken Knight, Facing the Future, 2013, p 65.33 For example, the three headline priorities set out in the National Framework (to assess local risk and assess how to
address it; work with the local community and other partners to deliver the local service; and be accountable to the local community) all relate to local responsibilities.
34 Department for Communities and Local Government, National Framework, p 16.
Financial sustainability of fire and rescue services Part Three 39
3.22 Our analysis showed that authorities use three fundamentally different and non-comparable types of targets including:
• Severity‑based targets that vary based on the ‘critical’ nature of the incident, eg if it involves a life-threatening situation.
• Risk‑based targets that vary based on the risk associated with the location of the incident.
• General targets set irrespective of type of fire or risk level.
3.23 Many authorities use different combinations and versions of these approaches and often include a range of sub-categories.
3.24 The Department does not prescribe a format for local standards. Thus it is difficult to assess whether one authority’s performance against its own standard is better or worse than another’s. Also, finding information on response standards in the first place is difficult: we found information for only 33 out of 46 authorities.
Secretary of State’s assurance to Parliament
3.25 Under section 25 of the Fire and Rescue Services Act 2004, the Secretary of State has a statutory duty to report to Parliament, every two years, on the extent to which authorities are acting in accordance with the Framework. Introducing this legislation, the then Fire Minister said this duty was “fundamental to ensuring effective national provision of safety through the fire service.”35
3.26 In the last ‘section 25 report’, in 2014, the Secretary of State’s conclusion was that he was satisfied that fire authorities had acted in accordance with the Framework.36 He told Parliament that: “Compliance with the Framework demonstrates that the government’s high-level expectations are being fully met.”37
3.27 The Department’s approach to evidencing these section 25 reports relies almost entirely on the duties placed on authorities, under the Framework, to self-certify their own compliance through annual statements of assurance and integrated risk management plans. In practice, the verification carried out by the Department for its last report was limited to checking these documents were available on authorities’ websites and had been signed off by authority chairs. The Department did not evaluate their content or use, and thus did not seek to form its own view of whether authorities were complying in substance with all the requirements in the Framework.
35 Hansard HC, Stg Co Deb, Standing Committee G, Fire and Rescue Services Bill, 10 February 2004, col 004.36 Department for Communities and Local Government, Report by the Secretary of State on Fire and Rescue Authorities’
progress with the Fire and Rescue National Framework for England, July 2014.37 Hansard HC, 15 July 2014, cols 48-49WS.
40 Part Three Financial sustainability of fire and rescue services
3.28 While the Framework places requirements on authorities to manage their own risks and be held to account locally, the Department does not seek to provide assurance that this localised system is working effectively. We would expect the Department to look at a sample of authorities, drawing on a range of evidence to assure itself on the extent to which these authorities were meeting at least a sample of their Framework requirements. In doing so, it would be able to provide some independent assurance on the system of self-certification. For transparency in its section 25 reports to Parliament, we would expect it to evidence its assessment of compliance with all the requirements in the Framework, and set out the methodology it has followed. As it is, the Department is aware of criticism that local accountability lacks rigour in places, but did not reflect this in its last section 25 report. For example, in 2013, the Knight Review reported that the “Framework requires that fire and rescue authorities must hold their senior officer to account […]. The evidence that this is happening was patchy.”38 The Department’s approach meant it did not take this into account in the evidence supporting the Secretary of State’s 2014 assurance statement.
Health and safety assurance
3.29 The Department relies on the Health and Safety Executive (HSE) to assist in safeguarding firefighter safety. Following a serious or fatal incident the HSE will carry out an investigation of an authority. The HSE may also perform an audit where identified trends or failures are worthy of further investigation. After fatal incidents, a coroner may also issue a ‘section 43 letter’, drawing the attention of relevant authorities to lessons to be learned.
3.30 During 2015, the Chief Fire and Rescue Adviser has been discussing with the HSE about improving the sharing of information among fire and rescue authorities, especially about injuries and ‘near miss’ incidents. It expects to introduce new protocols for sharing information in autumn 2015.
38 Sir Ken Knight, Facing the Future, 2013, p 63.
Financial sustainability of fire and rescue services Appendix One 41
Appendix One
Our audit approach
1 This study examined whether:
• Funding reductions have affected fire and rescue authorities’ financial and service sustainability to date the Department for Communities and Local Government;
• is informing itself about the impacts of its funding reductions and reforms on fire and rescue authorities;
• is supporting fire and rescue authorities effectively to manage the impacts of funding reductions and reforms; and
• is managing the accountability system so that it acts effectively to prevent financial and service failure among fire and rescue authorities.
2 There were three main elements to our work:
• We gathered information from fire and rescue authorities, the Department and key stakeholders.
• We analysed how fire and rescue authorities are responding to their budget cuts, and what they are doing to guarantee continuity of their statutory services.
• We reviewed what information the Department has to understand the impact of the reforms, fire and rescue authorities’ financial sustainability and the effectiveness of the local accountability system.
3 Our audit approach is summarised in Figure 11 overleaf. Our evidence base is described in Appendix Two.
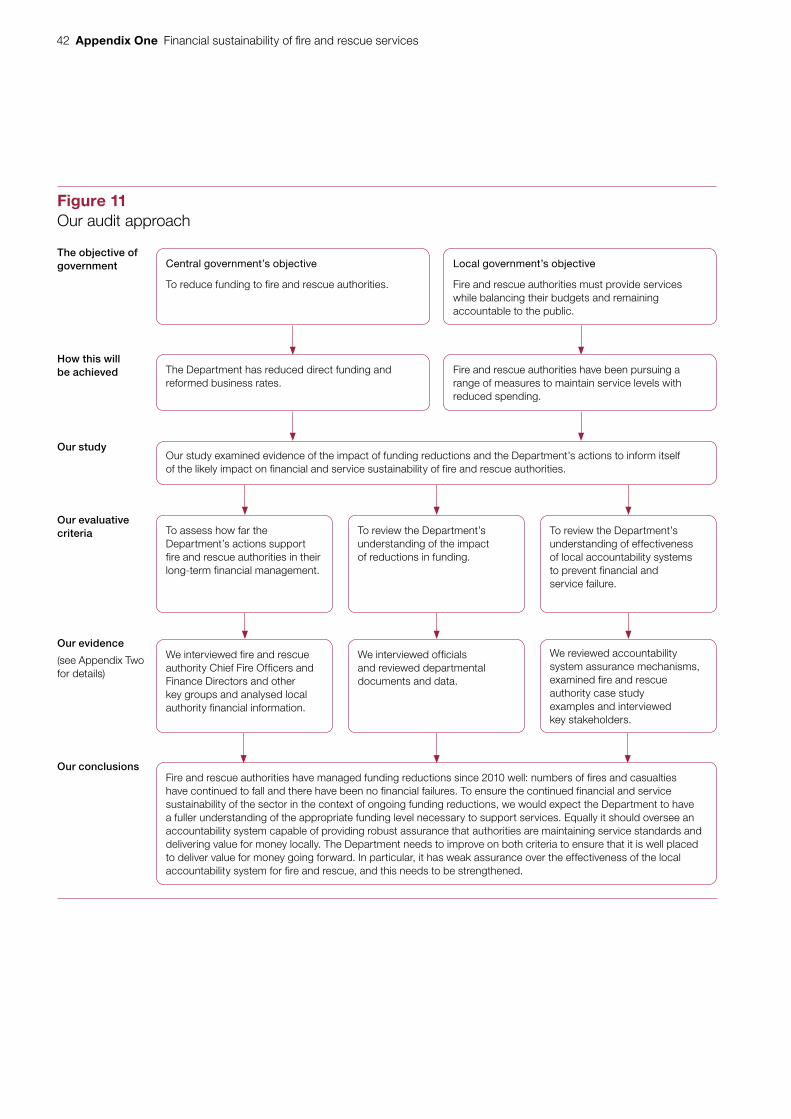
42 Appendix One Financial sustainability of fire and rescue services
Figure 11Our audit approach
The objective of government
How this will be achieved
Our study
Our evaluative criteria
Our evidence
(see Appendix Two for details)
Our conclusions
We interviewed fire and rescue authority Chief Fire Officers and Finance Directors and other key groups and analysed local authority financial information.
We reviewed accountability system assurance mechanisms, examined fire and rescue authority case study examples and interviewed key stakeholders.
To assess how far the Department’s actions support fire and rescue authorities in their long-term financial management.
To review the Department’s understanding of effectiveness of local accountability systems to prevent financial and service failure.
To review the Department’s understanding of the impact of reductions in funding.
We interviewed officials and reviewed departmental documents and data.
Central government’s objective
To reduce funding to fire and rescue authorities.
Local government’s objective
Fire and rescue authorities must provide services while balancing their budgets and remaining accountable to the public.
The Department has reduced direct funding and reformed business rates.
Fire and rescue authorities have been pursuing a range of measures to maintain service levels with reduced spending.
Our study examined evidence of the impact of funding reductions and the Department’s actions to inform itself of the likely impact on financial and service sustainability of fire and rescue authorities.
Fire and rescue authorities have managed funding reductions since 2010 well: numbers of fires and casualties have continued to fall and there have been no financial failures. To ensure the continued financial and service sustainability of the sector in the context of ongoing funding reductions, we would expect the Department to have a fuller understanding of the appropriate funding level necessary to support services. Equally it should oversee an accountability system capable of providing robust assurance that authorities are maintaining service standards and delivering value for money locally. The Department needs to improve on both criteria to ensure that it is well placed to deliver value for money going forward. In particular, it has weak assurance over the effectiveness of the local accountability system for fire and rescue, and this needs to be strengthened.
Financial sustainability of fire and rescue services Appendix Two 43
Appendix Two
Our evidence base
1 We reached our independent conclusions on the value-for-money risks of reducing fire and rescue authority funding after analysing evidence collected between March and August 2015. Our audit approach is outlined in Appendix One.
2 We interviewed officials from the Department for Communities and Local Government. We designed these interviews to focus on how the Department:
• informs itself of the impact of funding changes on fire and rescue authorities’ finances and services; and
• assures itself that fire and rescue authorities are financially sustainable.
3 We visited case study authorities. We spoke to Chief Fire Officers, Finance Directors and Councillors across eight authorities: Cleveland Fire Authority, West Midlands Fire and Rescue Authority, Lincolnshire County Council, West Sussex County Council, Greater Manchester Fire and Rescue Authority, London Fire and Emergency Planning Authority, Dorset Fire Authority, Wiltshire and Swindon Fire Authority. We selected these in order to compare the different types of authority (county, Combined and Metropolitan) across different regions and facing different funding pressures. We used these visits to gain insight into the financial challenges the sector is experiencing, approaches some authorities are taking to managing reductions in funding, and the way some authorities are planning for the medium-term future.
4 We analysed quantitative data on fire and rescue authority income, spending and service activity. A separate methodology setting out our approach to our quantitative analysis in detail is available at: www.nao.org.uk/report/financial-sustainability-of-fire-and-rescue-services/
5 We conducted a statistical modelling exercise to look for factors underlying differences in spend per capita between fire and rescue authorities. A note setting out our methodology and findings is available at: www.nao.org.uk/report/financial-sustainability-of-fire-and-rescue-services/
44 Appendix Two Financial sustainability of fire and rescue services
6 We reviewed fire authority documents. This included a review of the documents by which authorities are held accountable to their communities as well as government on the service they provide.
7 We carried out a review of our own research and external literature. We focused on our recent research, which covered financial sustainability of local authorities as a whole. We also examined reports published by stakeholder groups on the reported impact of funding reductions on services and financial sustainability and on the efficiency of fire and rescue service provision.
8 We reviewed the Department’s submission relating to the Spending Round 2013.

This report has been printed on Evolution Digital Satin and contains material sourced from responsibly managed and sustainable forests certified in accordance with the FSC (Forest Stewardship Council).
The wood pulp is totally recyclable and acid-free. Our printers also have full ISO 14001 environmental accreditation, which ensures that they have effective procedures in place to manage waste and practices that may affect the environment.

£10.00
9 781786 040114
ISBN 978-1-78604-011-4
Design and Production by NAO Communications DP Ref: 10819-001