Embed Size (px)
Citation preview
Report February 2013
Understanding the Truck Driver Supply and Demand Gap
and Its Implications for the Canadian Economy
EnErgy, EnvironmEnt and transportation policy

PrefaceCanada is facing a challenge as a result of its aging
workforce. This challenge is particularly acute for the
for-hire trucking industry, as workers in its key occu-
pation—truck drivers—are aging significantly more
rapidly than the rest of the workforce.
This challenge is affecting, and will continue to affect,
other industries since all of the goods that we produce
and consume in Canada are delivered in part by truck.
This report quantifies the expected gap between the
supply and demand for truck drivers in the for-hire
trucking industry and puts this into the context of the
economic importance of the trucking industry.
Understanding the Truck Driver Supply and Demand Gap and Its Implications for the Canadian Economy
by Vijay Gill and Alicia Macdonald
About The Conference Board of CanadaWe are:
� The foremost independent, not-for-profit, applied
research organization in Canada.
� Objective and non-partisan. We do not lobby
for specific interests.
� Funded exclusively through the fees we charge
for services to the private and public sectors.
� Experts in running conferences but also at con-
ducting, publishing, and disseminating research;
helping people network; developing individual
leadership skills; and building organizational
capacity.
� Specialists in economic trends, as well
as organizational performance and public
policy issues.
� Not a government department or agency,
although we are often hired to provide
services for all levels of government.
� Independent from, but affiliated with, The
Conference Board, Inc. of New York, which
serves nearly 2,000 companies in 60 nations
and has offices in Brussels and Hong Kong.
©2013 the conference Board of canada*Published in Canada • All rights reservedAgreement No. 40063028*Incorporated as AERIC Inc.
Forecasts and research often involve numerous assumptions and data sources, and are subject to inherent risks and uncertainties. This information is not intended as specific investment, accounting, legal, or tax advice.
contEnts
Executive summary . . . . . . . . . . . . . . . . . . . . . . . . . . . . . . . . . . . . . . . . . . . . . . . . . . . . . . . . . . . . . . . . i
chapter 1—Introduction . . . . . . . . . . . . . . . . . . . . . . . . . . . . . . . . . . . . . . . . . . . . . . . . . . . . . . . . . . . . . . . . . . . . . . 1Purpose of the Report . . . . . . . . . . . . . . . . . . . . . . . . . . . . . . . . . . . . . . . . . . . . . . . . . . . . . . . . . . . . . . . . . . . . . . . . 2
chapter 2—Summary of Truck Driver Population Demographics in Canada . . . . . . . . . . . . . . . . . . . . . . . . . . . . . . . 3Truck Driver Age Compared With Total Labour Force. . . . . . . . . . . . . . . . . . . . . . . . . . . . . . . . . . . . . . . . . . . . . . . 4
Aging of the Truck Driver Population . . . . . . . . . . . . . . . . . . . . . . . . . . . . . . . . . . . . . . . . . . . . . . . . . . . . . . . . . . . 5
Truck Driver Formal Education. . . . . . . . . . . . . . . . . . . . . . . . . . . . . . . . . . . . . . . . . . . . . . . . . . . . . . . . . . . . . . . . . 6
Truck Driver Industry Distribution and Immigrant Status . . . . . . . . . . . . . . . . . . . . . . . . . . . . . . . . . . . . . . . . . . . . 6
Driver Wages . . . . . . . . . . . . . . . . . . . . . . . . . . . . . . . . . . . . . . . . . . . . . . . . . . . . . . . . . . . . . . . . . . . . . . . . . . . . . . . 8
chapter 3—The Supply and Demand of Truck Drivers. . . . . . . . . . . . . . . . . . . . . . . . . . . . . . . . . . . . . . . . . . . . . . . 10Outlook for Supply of Truck Drivers in Canada . . . . . . . . . . . . . . . . . . . . . . . . . . . . . . . . . . . . . . . . . . . . . . . . . . . 11
Outlook for Truck Driver Demand . . . . . . . . . . . . . . . . . . . . . . . . . . . . . . . . . . . . . . . . . . . . . . . . . . . . . . . . . . . . . 13
The Driver Supply and Demand Gap . . . . . . . . . . . . . . . . . . . . . . . . . . . . . . . . . . . . . . . . . . . . . . . . . . . . . . . . . . . 15
chapter 4—Surveying the Industry and Industry Stakeholders . . . . . . . . . . . . . . . . . . . . . . . . . . . . . . . . . . . . . . . . 17General Results and Observations From Industry Consultations . . . . . . . . . . . . . . . . . . . . . . . . . . . . . . . . . . . . . . 20
chapter 5—The Economic Importance of the Trucking Industry . . . . . . . . . . . . . . . . . . . . . . . . . . . . . . . . . . . . . . . 24Economic Impact Analysis . . . . . . . . . . . . . . . . . . . . . . . . . . . . . . . . . . . . . . . . . . . . . . . . . . . . . . . . . . . . . . . . . . . 24
The Benefits of a Healthy Trucking Industry . . . . . . . . . . . . . . . . . . . . . . . . . . . . . . . . . . . . . . . . . . . . . . . . . . . . . 27
Taken For Granted—Until It’s Taken Away . . . . . . . . . . . . . . . . . . . . . . . . . . . . . . . . . . . . . . . . . . . . . . . . . . . . . . 29
chapter 6—Conclusion . . . . . . . . . . . . . . . . . . . . . . . . . . . . . . . . . . . . . . . . . . . . . . . . . . . . . . . . . . . . . . . . . . . . . . 32
appendix a—Detailed Economic Footprint Results . . . . . . . . . . . . . . . . . . . . . . . . . . . . . . . . . . . . . . . . . . . . . . . . . 34
appendix B—High and Low Driver Demand Scenarios . . . . . . . . . . . . . . . . . . . . . . . . . . . . . . . . . . . . . . . . . . . . . . 36Scenario 1 . . . . . . . . . . . . . . . . . . . . . . . . . . . . . . . . . . . . . . . . . . . . . . . . . . . . . . . . . . . . . . . . . . . . . . . . . . . . . . . . 36
Scenario 2 . . . . . . . . . . . . . . . . . . . . . . . . . . . . . . . . . . . . . . . . . . . . . . . . . . . . . . . . . . . . . . . . . . . . . . . . . . . . . . . . 36
appendix c—Bibliography . . . . . . . . . . . . . . . . . . . . . . . . . . . . . . . . . . . . . . . . . . . . . . . . . . . . . . . . . . . . . . . . . . . . 38

acknowledgementsThe authors would like to offer special thanks to Ron Lennox and David Bradley of the Canadian Trucking Alliance for their valuable comments and suggestions. The authors would also like to thank Louis-Paul Tardif, Paul Guevremont, and Lloyd Ash for their comments and review of an earlier draft. Finally, the authors would like to thank Pedro Antunes, Maxim Armstrong, Ross Prusakowski, and David Stewart-Patterson of The Conference Board of Canada for their research support.
The Conference Board would like to thank the Canadian Trucking Alliance for financially supporting this research. In keeping with Conference Board guidelines for financed research, the design and method of research as well as the content of this study were determined solely by the Conference Board. The Conference Board of Canada alone is responsible for the report’s methodology, scope, and findings, including any errors and omissions.
Find this report and other Conference Board research at www.e-library.ca
Improvements in the movement of goods will have
a direct impact on the well-being of individuals.
Given that trucks play a part in delivering most
of the food that we eat, the leisure goods that we enjoy,
and the roofs under which we live, the current challen-
ges faced by the trucking industry are a concern for
all Canadians.
Like many industries, the trucking industry is facing
growing challenges due to the aging population. However,
the magnitude of the demand for goods movement, the
resulting demand for truck drivers, and the unfavourable
demographic profile of truck drivers all mean that
the impact on the trucking industry is particularly acute.
Moreover, the sheer number of drivers required to move
our goods makes it all the more difficult to find an adequate
supply. There are over 300,000 truck drivers in Canada
today, which includes both drivers in the for-hire truck-
ing industry and those drivers engaged in private trucking
activity (trucking services that are carried out in-house
by companies in other industries). This means that nearly
1 per cent of the Canadian population and over 1.5 per
cent of the labour force are employed as truck drivers.
The main purpose of this report is to quantify the truck
driver supply requirements and the resulting pressure
that the for-hire trucking industry will face to attract
new drivers. In a business-as-usual scenario where the
trucking industry continues to have difficulty in attract-
ing younger workers to long-haul trucking occupations
in particular, we find that the driver supply will remain
relatively stagnant until 2020. Yet a significant portion
of those industries in Canada that are in a growth stage
depends on services from the for-hire trucking industry
for sourcing materials, delivering goods to and from
distribution centres, and delivering their final products
to customers. As these industries continue to grow, so
too will their demand for trucking services, which will
result in a need for an increased supply of drivers.
If we assume ongoing labour productivity increases of
two-thirds of 1 per cent per year for the for-hire trucking
industry, the resulting supply and demand gap for truck
drivers will be nearly 25,000 drivers—or about 14 per
Understanding the Truck Driver Supply and Demand Gap and Its Implications for the Canadian Economy
ExEcutivE summary
at a glance � The age of the average truck driver has
increased more rapidly than the age of the average worker due to fewer young workers entering the industry.
� Meanwhile, the demand for truck drivers will increase as industries that rely on trucking services continue to grow. By 2020, the gap between the supply and demand of drivers is expected to be 25,000. This number could exceed 33,000, assuming a lower rate of productivity growth.
� This is cause for concern, not just for the trucking industry, but for its customers, the Canadian economy, and, ultimately, consumers.
ii | Understanding the Truck Driver Supply and Demand Gap and Its Implications for the Canadian Economy—February 2013
Find this report and other Conference Board research at www.e-library.ca
cent of the driver population required to meet demand
by 2020. While past estimates indicate that the industry’s
productivity performance has been strong, the industry
faces significant challenges in the future. Congestion,
changes in hours-of-service rules in the United States,
restrictions on size and weight regulations, and other
challenges will all affect the industry’s ability to main-
tain productivity gains in the coming years. A sensitiv-
ity analysis conducted for this study suggests that if an
improvement in labour productivity is lower than antici-
pated, the gap could exceed 33,000 drivers. This is due in
large part to the tens of thousands of drivers approaching
retirement age and the very small number of young driv-
ers taking their place. (If we were to include the driver
requirements for private trucking activity, the gap would
be even larger.)
approximately 87 per cent of productivity gains by the for-hire trucking industry since 1986 have flowed through to customers in the form of lower prices .
In the face of increasing demographic pressures, a
number of factors could help to match the supply
and demand for truck drivers. These include:
� a contraction of the trucking industry relative
to the forecast;
� a smaller- or larger-than-expected increase in
trucking industry productivity;
� a significant improvement in industry working
conditions or wages, marketing of the truck driving
occupation, and driver training/licensing;
� a reorganization of trucking activity and supply
chains in order to reduce the demand for long-haul
drivers; and
� a change in policy to allow the truck driving
occupation to be recognized as a skilled trade.
In the past, productivity gains in the for-hire trucking
industry have been quickly passed on to customers. In
fact, approximately 87 per cent of productivity gains by
the for-hire trucking industry since 1986 have flowed
through to customers in the form of lower prices. This
demonstrates that shippers have a direct interest in improv-
ing trucking industry productivity and addressing labour
challenges, as the resulting benefits are subsequently
passed on to shippers in the form of lower prices. For
example, small changes at receiving points that mini-
mize the amount of time drivers spend waiting helps
to improve carriers’ productivity. Such productivity
improvements flow back to the shipper.
With $17 billion in annual gross domestic product
(GDP) and as an employer of nearly 300,000 workers,
the for-hire trucking industry’s impact on the Canadian
economy is large. This impact is even larger when the
indirect and induced impacts are considered.
More importantly, however, efficient and effective
trucking services—along with efficient supply chain
logistics—shrink distances between firms and people,
and make markets work better. Conversely, a weakening
of transportation systems does the opposite: When the
distance between firms and people is increased, the cost
of doing business increases.
Ultimately, efficient freight transportation improves export
competitiveness and results in more goods being available
at lower prices for consumers. This makes the health of
the trucking industry freight transportation networks an
issue of importance for Canadian competitiveness.
It will be up to the trucking industry to address its own
labour challenges, and make the industry more attractive
to potential drivers. However, industry leaders believe
that there is also an important role for government to
play in developing policies and regulatory frameworks
that establish national occupational, training, and licens-
ing standards that recognize truck driving as a skilled
occupation. Furthermore, any policy support that enhan-
ces the industry’s productivity will help to mitigate the
impact that results from the lack of available drivers.
It will also be important to convince customers of the
need to address this situation now and to work with them
to develop strategies that will make the best use of drivers’
time. After all, the trucking industry’s long track record
in sharing the benefit of its own productivity gains pro-
vides a direct incentive for its customers to collaborate
on strategies.
Find this report and other Conference Board research at www.e-library.ca
When the general public thinks about invest-
ments in transportation infrastructure, they
often think about passenger transportation
only. This is because improvements or deteriorations in
passenger transportation services are very visible and
therefore immediately felt by individuals.
Improvements in goods movement also have a direct
impact on our well-being—perhaps even to a greater
degree. However, this impact is not always at top of
mind for individuals.
The challenges faced by the trucking industry generally
do not make the front page news. Yet, the industry pro-
vides services that are crucial to our daily lives—almost
all of the food that we eat, the leisure items that we enjoy,
and the roofs under which we live have been delivered
at least in part by trucks. The trucking industry is also
a major employer in Canada, with close to 1 per cent
of all Canadians and 1.5 per cent of the labour force
employed as truck drivers.
More than ever, the industry is finding it increasingly
difficult to attract an adequate supply of quality drivers.
It is certainly not the only industry facing this difficulty.
In fact, the country as a whole has labour challenges.
The Conference Board of Canada recently described
this challenge as a “demographic tsunami” that will
have a profound impact on our society.1
However, the magnitude of the demand for goods move-
ment, the resulting demand for truck drivers, and the
particularly unfavourable demographic profile of truck
drivers mean that the trucking industry will be the first to
feel the effects of this demographic tsunami. For example,
1 Hodgson, Slow-Motion Demographic Tsunami.
Introduction
chaptEr 1
chapter summary � Improvements in the movement of goods
have a direct impact on the well-being of indi-viduals. They lower the prices of consumer goods and provide us with a wider variety.
� Almost all goods are delivered at least in part by trucks. Naturally, this trucking activity depends on the availability of a large number of truck drivers. But there is a growing diffi-culty in attracting an adequate supply of drivers in Canada.
� This difficulty is cause for concern—for the trucking industry, for its customers, and for consumers.
� This report quantifies the magnitude of the truck driver supply requirements and the resulting pressure that the trucking industry will face in attracting new talent.
2 | Understanding the Truck Driver Supply and Demand Gap and Its Implications for the Canadian Economy—February 2013
Find this report and other Conference Board research at www.e-library.ca
The Canadian Chamber of Commerce highlighted skills
issues in a number of industries and included the grow-
ing demand for truck drivers, which has been forecasted
by other organizations such as the Canadian Trucking
Human Resources Council (CTHRC).2 Meanwhile, an
estimate of critical supply chain labour requirements for
Alberta and British Columbia projected that most supply
chain occupations would be under-supplied by 2020.
While the truck driving occupation was found to be
more or less in balance overall, it was noted that the
level of aggregation in the data obscured the significant
challenges found in recruiting long-haul drivers.3
2 The Canadian Chamber of Commerce, Canada’s Skills Crisis, 6.
3 Calgary Logistics Council, The Accelerator Project, 22.
The challenges faced by the industry in terms of attracting
drivers are not new. Past research has shown that drivers
have been aging more rapidly than the labour force in
general, in part due to the long hours and irregular
schedules faced by long-haul drivers.4 Other research
has shown that the occupation is prone to high turnover
due to inadequate pay and quality-of-life issues.5 In
many respects, these challenges persist today.
purposE of thE rEport
The primary purpose of this report is to quantify the
magnitude of the truck driver supply requirements and
the resulting pressure that the industry will face in its
ability to attract new talent. We provide a brief overview
of the profile of the current driver population in Canada
using census and Labour Force Survey data. We focus
primarily on the for-hire trucking industry and use the
terms “trucking industry” and “for-hire trucking industry”
interchangeably. (For a list of terms and their meanings,
see box “Terminology.”) In addition to the for-hire indus-
try, there are truck drivers employed by non-trucking
companies, such as retailers, for the purpose of moving
their own goods. In general, it is more difficult to measure
the level of this “private trucking” activity given that it
is dispersed among a wide range of other industries.
Next, we provide a demographic forecast of the supply of
drivers out to 2020 using a business-as-usual scenario.
This is contrasted with an independent forecast of the
demand for drivers, which is derived from the expected
demand for trucking services from other industries.
The quantitative work is complemented by qualitative
findings from a survey of trucking industry executives
and shippers who rely on trucking services to move
their products. These findings are followed by an esti-
mate of the economic impact of the trucking industry
and a discussion of the economic benefits of a healthy
trucking industry.
4 Dubé and Pilon, On the Road Again.
5 Chow, Labour Standard Issues in the Inter-Provincial Canadian Trucking Industry.
terminology
trucking industry/for-hire trucking industry: This refers to the “for-hire” truck-ing industry, which is classified as subsector 484 in the North American Industry Classification System (NAICS). This includes companies that provide truck transportation services to other companies.
private trucking: In addition to for-hire carriers, there is a significant amount of “private trucking” activity—trucking services that are carried out in-house by companies for the purpose of moving their own goods. More often than not, private trucking activity is more local (intra-city) in nature.
long-haul trucking: Intercity trucking services where the length of haul is typically 500 kilometres or more.
short-haul trucking: Local trucking services that are typically intra-city or where the length of haul is less than 500 kilometres.
truckload (tl) services: Trucking services that move full or close to full loads of freight.
less-than-truckload (ltl) services: Trucking services that move smaller quanti-ties of freight, making use of centralized terminals in order to consolidate shipments.
owner-operator: A truck driver who supplies his or her own truck.
labour force survey (lfs): This monthly survey, conducted by Statistics Canada, provides estimates of employment and unemployment. These data are collected more frequently than data captured by the census, but rely on a much smaller sample size.
Sources: Statistics Canada; Stephens.com; The Conference Board of Canada.

Find this report and other Conference Board research at www.e-library.ca
Before assessing the supply and eventual
demand for truck drivers in Canada, we first
provide a summary of the truck driver popula-
tion in Canada. Primary data sources for the summary
are the 2006 Census and the Statistics Canada Labour
Force Survey (LFS). The two data sets provide different
estimates of the truck driver (and other occupation) data.
Later charts normalize the LFS data to the 2006 Census
year. Other data based on the census are projected to
2011, and beyond, using the LFS data and our labour
supply model.
Other sources such as previous analysis conducted for
CTHRC1 and Transport Canada2 provide estimates of
the trucking workforce population. It is important to
note some of the differences in the definitions that con-
tribute to different totals. For example, Transport Canada
provides an estimate of the total employment in the for-
hire trucking industry.3 Its estimate places employment
in the industry at just over 300,000. Of this total, over
60 per cent were employed as drivers.
According to the 2006 Census, there were 304,890 truck
drivers in the labour force (this includes both the for-hire
trucking industry and private trucking).4 Approximately
180,000 of these drivers were employed in the for-hire
trucking industry (corresponding to the 60 per cent
mentioned above).
1 Canadian Trucking Human Resources Council, Labour Market Information.
2 Transport Canada, Statistical Addendum 2011.
3 Transport Canada, Statistical Addendum 2011, Table EC32.
4 According to the LFS data for the same year, the total was 281,600 in 2006, growing to 310,500 in 2011. For the truck-ing industry specifically, the LFS total for 2006 and 2011 were 161,600 and 173,100, respectively. For the purpose of describing driver demographics, we rely primarily on the census data. In the next chapter where we project driver supply and demand for the industry, we rely on the more recent LFS data.
Summary of Truck Driver Population Demographics in Canada
chaptEr 2
chapter summary � Many Canadians make their living driving a
truck. There are about 180,000 truck driv-ers in the for-hire trucking industry and over 300,000 truck drivers across all industries.
� While the overall labour force in Canada is aging, the truck driver population has aged more rapidly. The average age of the truck driver has increased from 40 years in 1996 to over 44 years in 2006.
� There are also relatively few truck drivers under the age of 30. While a quarter of cour-ier and delivery drivers, who are not included as truck drivers, are under the age of 30, only 12 per cent of truck drivers are under 30. The difficulty in attracting younger drivers poses a problem for the industry, especially as older drivers retire.
4 | Understanding the Truck Driver Supply and Demand Gap and Its Implications for the Canadian Economy—February 2013
Find this report and other Conference Board research at www.e-library.ca
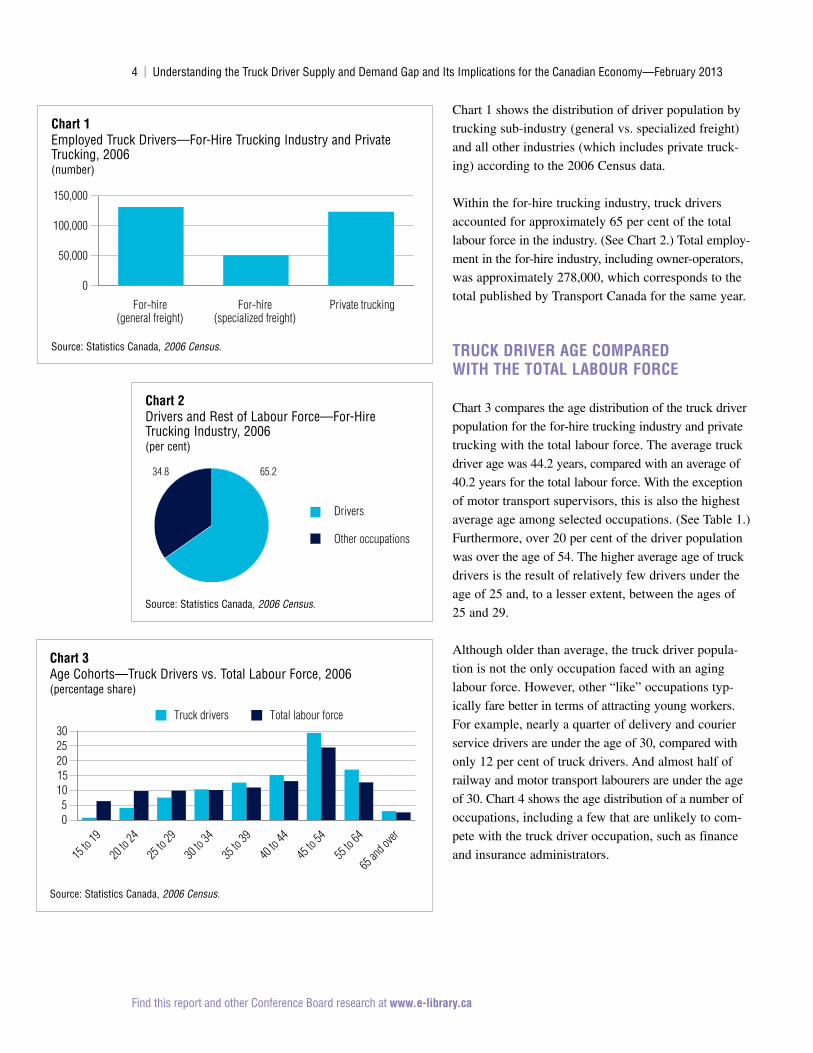
Chart 1 shows the distribution of driver population by
trucking sub-industry (general vs. specialized freight)
and all other industries (which includes private truck-
ing) according to the 2006 Census data.
Within the for-hire trucking industry, truck drivers
accounted for approximately 65 per cent of the total
labour force in the industry. (See Chart 2.) Total employ-
ment in the for-hire industry, including owner-operators,
was approximately 278,000, which corresponds to the
total published by Transport Canada for the same year.
truck drivEr agE comparEd With thE total laBour forcE
Chart 3 compares the age distribution of the truck driver
population for the for-hire trucking industry and private
trucking with the total labour force. The average truck
driver age was 44.2 years, compared with an average of
40.2 years for the total labour force. With the exception
of motor transport supervisors, this is also the highest
average age among selected occupations. (See Table 1.)
Furthermore, over 20 per cent of the driver population
was over the age of 54. The higher average age of truck
drivers is the result of relatively few drivers under the
age of 25 and, to a lesser extent, between the ages of
25 and 29.
Although older than average, the truck driver popula-
tion is not the only occupation faced with an aging
labour force. However, other “like” occupations typ-
ically fare better in terms of attracting young workers.
For example, nearly a quarter of delivery and courier
service drivers are under the age of 30, compared with
only 12 per cent of truck drivers. And almost half of
railway and motor transport labourers are under the age
of 30. Chart 4 shows the age distribution of a number of
occupations, including a few that are unlikely to com-
pete with the truck driver occupation, such as finance
and insurance administrators.
chart 1Employed Truck Drivers—For-Hire Trucking Industry and Private Trucking, 2006(number)
Source: Statistics Canada, 2006 Census.
For-hire(general freight)
For-hire(specialized freight)
Private trucking
0
50,000
100,000
150,000
chart 2Drivers and Rest of Labour Force—For-Hire Trucking Industry, 2006(per cent)
Source: Statistics Canada, 2006 Census.
65.234.8
Drivers
Other occupations
chart 3Age Cohorts—Truck Drivers vs. Total Labour Force, 2006(percentage share)
Source: Statistics Canada, 2006 Census.
15 to
19
20 to
24
25 to
29
30 to
34
35 to
39
40 to
44
45 to
54
55 to
64
65 an
d over
05
1015202530
Truck drivers Total labour force
The Conference Board of Canada | 5
Find this report and other Conference Board research at www.e-library.ca
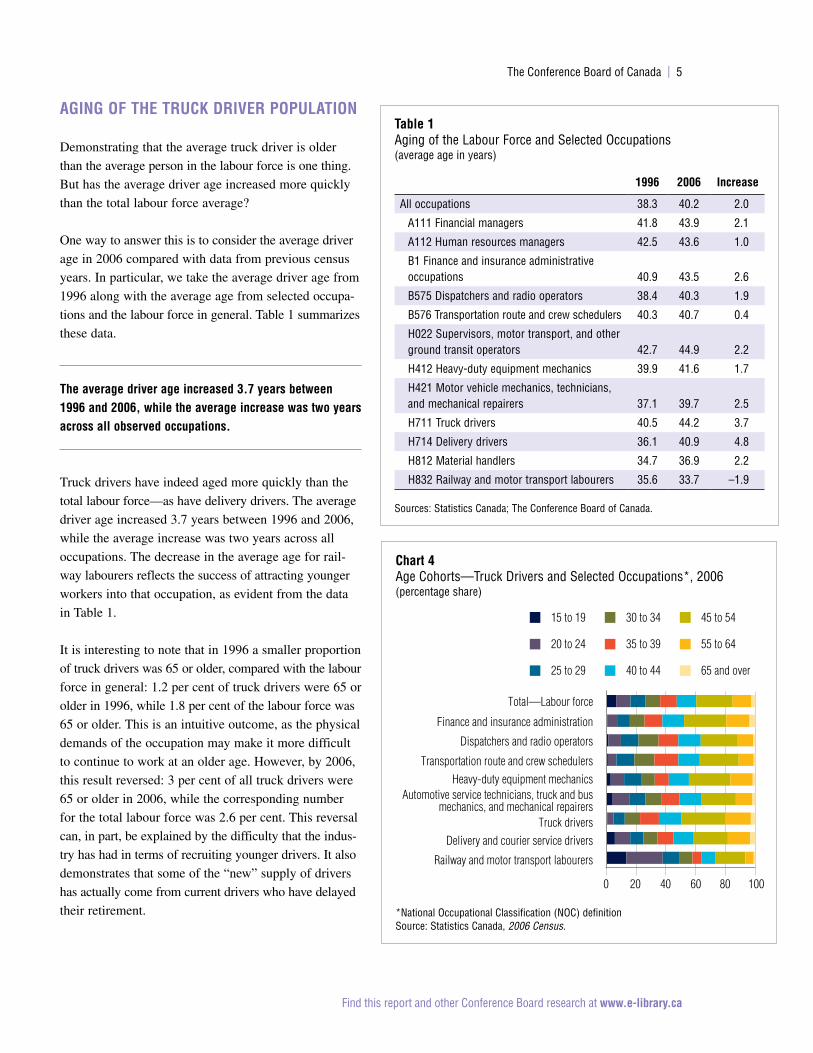
aging of thE truck drivEr population
Demonstrating that the average truck driver is older
than the average person in the labour force is one thing.
But has the average driver age increased more quickly
than the total labour force average?
One way to answer this is to consider the average driver
age in 2006 compared with data from previous census
years. In particular, we take the average driver age from
1996 along with the average age from selected occupa-
tions and the labour force in general. Table 1 summarizes
these data.
the average driver age increased 3 .7 years between 1996 and 2006, while the average increase was two years across all observed occupations .
Truck drivers have indeed aged more quickly than the
total labour force—as have delivery drivers. The average
driver age increased 3.7 years between 1996 and 2006,
while the average increase was two years across all
occupations. The decrease in the average age for rail-
way labourers reflects the success of attracting younger
workers into that occupation, as evident from the data
in Table 1.
It is interesting to note that in 1996 a smaller proportion
of truck drivers was 65 or older, compared with the labour
force in general: 1.2 per cent of truck drivers were 65 or
older in 1996, while 1.8 per cent of the labour force was
65 or older. This is an intuitive outcome, as the physical
demands of the occupation may make it more difficult
to continue to work at an older age. However, by 2006,
this result reversed: 3 per cent of all truck drivers were
65 or older in 2006, while the corresponding number
for the total labour force was 2.6 per cent. This reversal
can, in part, be explained by the difficulty that the indus-
try has had in terms of recruiting younger drivers. It also
demonstrates that some of the “new” supply of drivers
has actually come from current drivers who have delayed
their retirement.
table 1Aging of the Labour Force and Selected Occupations(average age in years)
1996 2006 increase
All occupations 38.3 40.2 2.0
A111 Financial managers 41.8 43.9 2.1
A112 Human resources managers 42.5 43.6 1.0
B1 Finance and insurance administrative occupations 40.9 43.5 2.6
B575 Dispatchers and radio operators 38.4 40.3 1.9
B576 Transportation route and crew schedulers 40.3 40.7 0.4
H022 Supervisors, motor transport, and other ground transit operators 42.7 44.9 2.2
H412 Heavy-duty equipment mechanics 39.9 41.6 1.7
H421 Motor vehicle mechanics, technicians, and mechanical repairers 37.1 39.7 2.5
H711 Truck drivers 40.5 44.2 3.7
H714 Delivery drivers 36.1 40.9 4.8
H812 Material handlers 34.7 36.9 2.2
H832 Railway and motor transport labourers 35.6 33.7 –1.9
Sources: Statistics Canada; The Conference Board of Canada.
chart 4Age Cohorts—Truck Drivers and Selected Occupations*, 2006(percentage share)
*National Occupational Classification (NOC) definitionSource: Statistics Canada, 2006 Census.
Railway and motor transport labourers
Delivery and courier service driversTruck drivers
Automotive service technicians, truck and busmechanics, and mechanical repairers
Heavy-duty equipment mechanicsTransportation route and crew schedulers
Dispatchers and radio operators
Finance and insurance administration
Total—Labour force
100806040200
15 to 19
20 to 24
25 to 29
30 to 34
35 to 39
40 to 44
45 to 54
55 to 64
65 and over
6 | Understanding the Truck Driver Supply and Demand Gap and Its Implications for the Canadian Economy—February 2013
Find this report and other Conference Board research at www.e-library.ca
As part of our industry consultations (see Chapter 4),
we asked carriers if they tracked the average age of
their drivers and if the average age has increased over
time. While it was a small sample, it is interesting to
note that the average driver age reported ranged from
44 to 51 years, and that this average age continues to
increase—indicating that the current driver age may, in
fact, be higher than reported in the 2006 Census data.
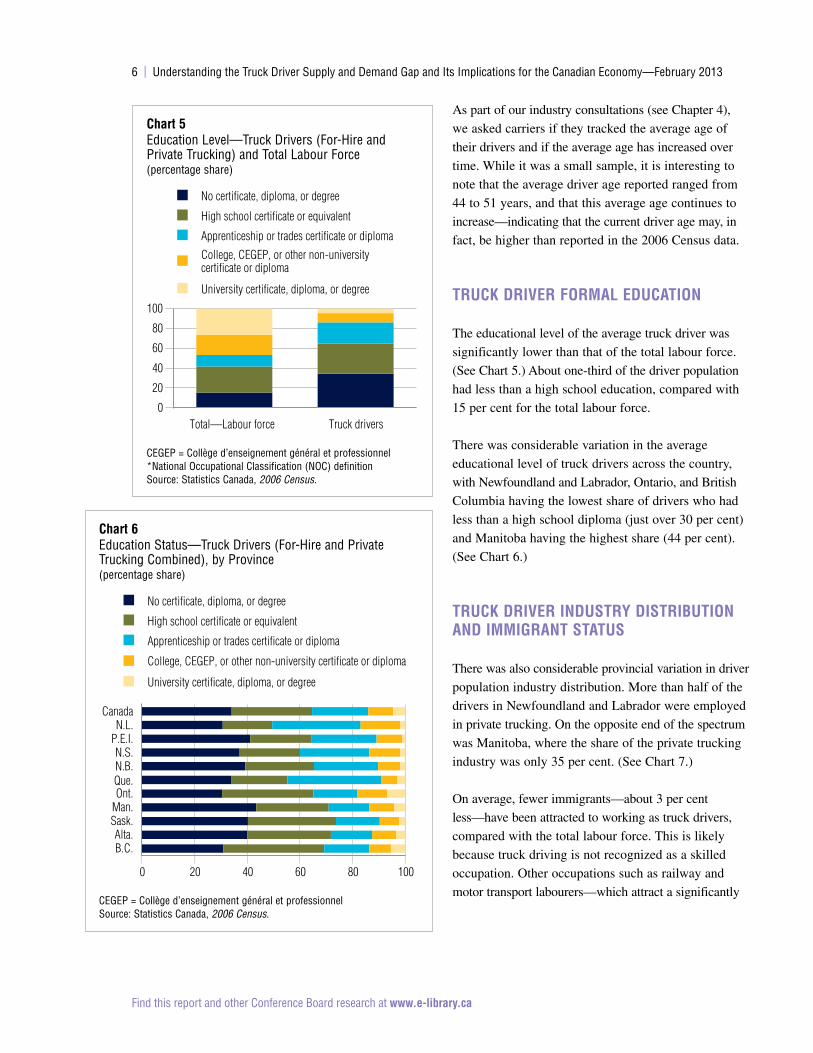
truck drivEr formal Education
The educational level of the average truck driver was
significantly lower than that of the total labour force.
(See Chart 5.) About one-third of the driver population
had less than a high school education, compared with
15 per cent for the total labour force.
There was considerable variation in the average
educational level of truck drivers across the country,
with Newfoundland and Labrador, Ontario, and British
Columbia having the lowest share of drivers who had
less than a high school diploma (just over 30 per cent)
and Manitoba having the highest share (44 per cent).
(See Chart 6.)
truck drivEr industry distriBution and immigrant status
There was also considerable provincial variation in driver
population industry distribution. More than half of the
drivers in Newfoundland and Labrador were employed
in private trucking. On the opposite end of the spectrum
was Manitoba, where the share of the private trucking
industry was only 35 per cent. (See Chart 7.)
On average, fewer immigrants—about 3 per cent
less—have been attracted to working as truck drivers,
compared with the total labour force. This is likely
because truck driving is not recognized as a skilled
occupation. Other occupations such as railway and
motor transport labourers—which attract a significantly
chart 5Education Level—Truck Drivers (For-Hire and Private Trucking) and Total Labour Force (percentage share)
CEGEP = Collège d’enseignement général et professionnel*National Occupational Classification (NOC) definitionSource: Statistics Canada, 2006 Census.
Truck driversTotal—Labour force0
20
40
60
80
100
No certificate, diploma, or degree
High school certificate or equivalent
Apprenticeship or trades certificate or diploma
College, CEGEP, or other non-universitycertificate or diploma
University certificate, diploma, or degree
chart 6Education Status—Truck Drivers (For-Hire and Private Trucking Combined), by Province (percentage share)
CEGEP = Collège d’enseignement général et professionnelSource: Statistics Canada, 2006 Census.
B.C.Alta.
Sask.Man.Ont.Que.N.B.N.S.
P.E.I.N.L.
Canada
0 20 40 60 80 100
No certificate, diploma, or degree
High school certificate or equivalent
Apprenticeship or trades certificate or diploma
College, CEGEP, or other non-university certificate or diploma
University certificate, diploma, or degree
The Conference Board of Canada | 7
Find this report and other Conference Board research at www.e-library.ca
younger population—and heavy-duty equipment mech-
anics have significantly lower immigrant shares, at less
than 10 per cent. (See Chart 8.)
The following charts provide data based on the Labour
Force Survey (LFS), which show a smaller driver popu-
lation. However, since the LFS is conducted regularly,
it makes it possible to observe the growth in the driver
occupation population over time. (See Chart 9 for the
growth of the truck driver population by industry.) While
the overall trend indicates that the driver population has
increased from 281,000 drivers in 2006 to 310,000 drivers
in 2011, the number of drivers employed in the for-hire
trucking industry has decreased, with private trucking
making up for the decline. This is a small reversal of the
general trend in previous years to outsource trucking
activity. Currently, the share of truck driver employment
in the trucking industry stands at 56 per cent.
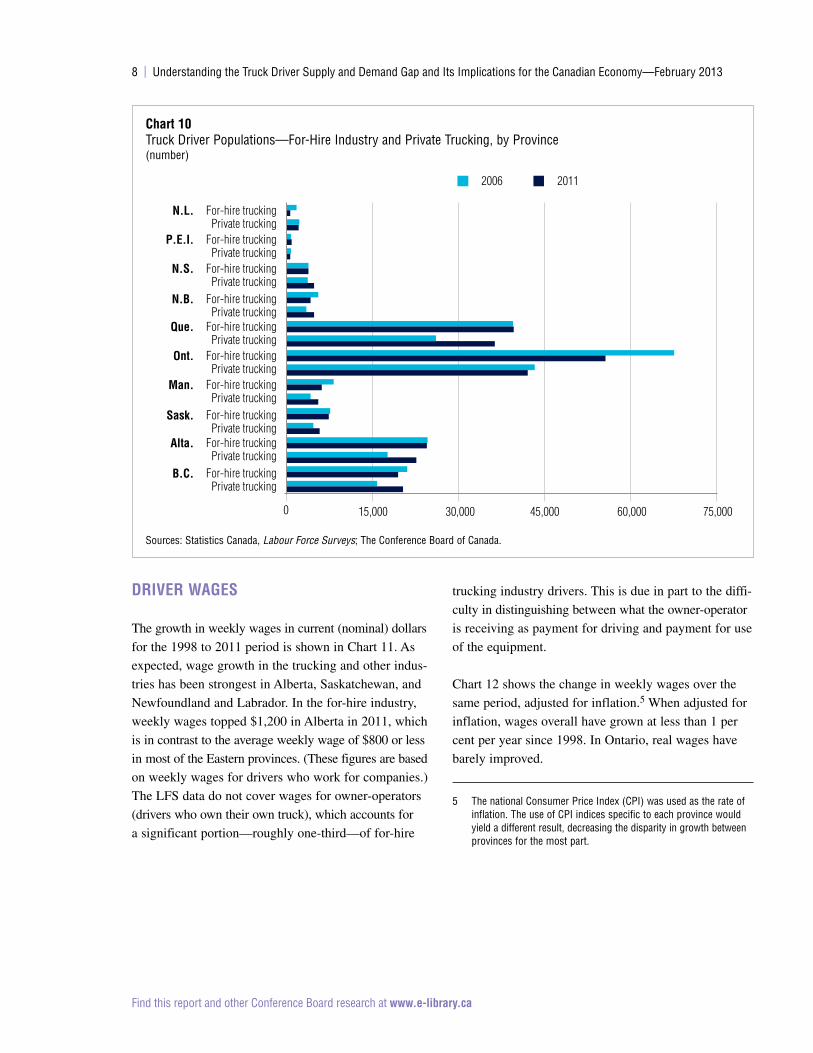
Chart 10 shows the growth of the driver population
(for-hire and private trucking) from 2006 to 2011. In
Ontario, growth has been relatively flat, although the
distribution changed slightly in favour of the trucking
industry. The strong employment growth in the trucking
and other industries in Quebec, Alberta, and British
Columbia may be an indication of the strength of
the resource industries in those provinces.
chart 7Driver Population Industry Distribution, by Province (percentage share)
Source: Statistics Canada, 2006 Census.
B.C.Alta.
Sask.Man.Ont.Que.N.B.N.S.
P.E.I.N.L.
Canada
0 20 40 60 80 100
For-hire (general freight)
For-hire (specialized freight)
Private trucking
chart 8Immigrant Status—Truck Drivers and Selected Occupations*(percentage share)
*National Occupational Classification (NOC) definitionSource: Statistics Canada, 2006 Census.
Railway and motor transport labourers
Truck drivers
Automotive service technicians, truck and busmechanics, and mechanical repairers
Heavy-duty equipment mechanicsTransportation route and crew schedulers
Finance and insurance administrationFinancial managers
Total—Labour force
100806040200
Non-immigrants
Immigrants or non-permanent residents
chart 9Truck Driver Population—For-Hire Trucking and Private Trucking, 1998–2011(number; per cent)
Sources: Statistics Canada, Labour Force Surveys; The Conference Board of Canada.
1998 99 00 01 02 03 04 05 06 07 08 09 10 110
50,000
100,000
150,000
200,000
50
53
56
59
62
For-hire trucking (left)
Private trucking (left)
For-hire share (right)
8 | Understanding the Truck Driver Supply and Demand Gap and Its Implications for the Canadian Economy—February 2013
Find this report and other Conference Board research at www.e-library.ca
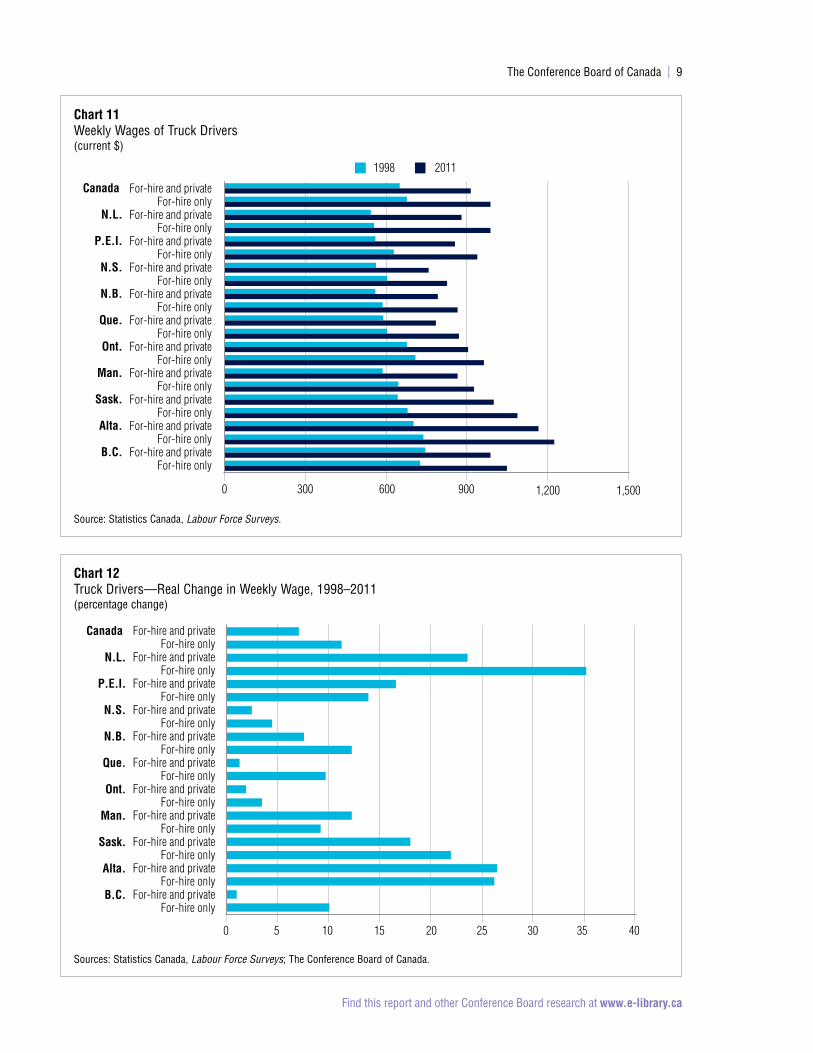
drivEr WagEs
The growth in weekly wages in current (nominal) dollars
for the 1998 to 2011 period is shown in Chart 11. As
expected, wage growth in the trucking and other indus-
tries has been strongest in Alberta, Saskatchewan, and
Newfoundland and Labrador. In the for-hire industry,
weekly wages topped $1,200 in Alberta in 2011, which
is in contrast to the average weekly wage of $800 or less
in most of the Eastern provinces. (These figures are based
on weekly wages for drivers who work for companies.)
The LFS data do not cover wages for owner-operators
(drivers who own their own truck), which accounts for
a significant portion—roughly one-third—of for-hire
trucking industry drivers. This is due in part to the diffi-
culty in distinguishing between what the owner-operator
is receiving as payment for driving and payment for use
of the equipment.
Chart 12 shows the change in weekly wages over the
same period, adjusted for inflation.5 When adjusted for
inflation, wages overall have grown at less than 1 per
cent per year since 1998. In Ontario, real wages have
barely improved.
5 The national Consumer Price Index (CPI) was used as the rate of inflation. The use of CPI indices specific to each province would yield a different result, decreasing the disparity in growth between provinces for the most part.
chart 10Truck Driver Populations—For-Hire Industry and Private Trucking, by Province(number)
Sources: Statistics Canada, Labour Force Surveys; The Conference Board of Canada.
0 15,000 30,000 45,000 60,000 75,000
2006 2011
For-hire trucking
For-hire trucking
For-hire trucking
For-hire trucking
For-hire trucking
For-hire trucking
For-hire trucking
For-hire trucking
For-hire trucking
For-hire truckingPrivate trucking
Private trucking
Private trucking
Private trucking
Private trucking
Private trucking
Private trucking
Private trucking
Private trucking
Private trucking
N.L.
P.E.I.
N.S.
N.B.
Que.
Ont.
Man.
Sask.
Alta.
B.C.
The Conference Board of Canada | 9
Find this report and other Conference Board research at www.e-library.ca
chart 11Weekly Wages of Truck Drivers(current $)
Source: Statistics Canada, Labour Force Surveys.
For-hire and private
For-hire and private
For-hire and private
For-hire and private
For-hire and private
For-hire and private
For-hire and private
For-hire and private
For-hire and private
For-hire and privateFor-hire only
For-hire only
For-hire only
For-hire only
For-hire only
For-hire only
For-hire only
For-hire only
For-hire only
For-hire only
For-hire only
For-hire and private
0 300 600 900 1,200 1,500
1998 2011
Canada
N.L.
P.E.I.
N.S.
N.B.
Que.
Ont.
Man.
Sask.
Alta.
B.C.
chart 12Truck Drivers—Real Change in Weekly Wage, 1998–2011(percentage change)
Sources: Statistics Canada, Labour Force Surveys; The Conference Board of Canada.
1050 15 20 25 30 35 40
For-hire and private
For-hire and private
For-hire and private
For-hire and private
For-hire and private
For-hire and private
For-hire and private
For-hire and private
For-hire and private
For-hire and privateFor-hire only
For-hire only
For-hire only
For-hire only
For-hire only
For-hire only
For-hire only
For-hire only
For-hire only
For-hire only
For-hire only
For-hire and privateCanada
N.L.
P.E.I.
N.S.
N.B.
Que.
Ont.
Man.
Sask.
Alta.
B.C.
Find this report and other Conference Board research at www.e-library.ca
Businesses across the country are facing labour
challenges. These challenges are expected to
become more prominent in the near future as
the population ages.
According to The Conference Board of Canada’s
Canadian Outlook Summer 2012,1 labour force partici-
pation, or the share of the population that is available to
work, is declining, and will continue to decline primar-
ily as a function of the aging boomer population. This
decline is offset to some extent by the echo generation
(the children of the boomers) and by immigration.
Meanwhile, the participation of young cohorts, particu-
larly those between the ages of 15 and 24, has dropped
off significantly over the past decade. This may be due
in part to the frustration with job searches—resulting in
many young people giving up their job searches and
dropping out of the labour force.
While labour supply problems have not been as acute in
recent times due to the effects of the recession, over the
medium term we expect labour to be in relatively short
supply overall due to a steady recovery and the aging
1 The Conference Board of Canada, Canadian Outlook Summer 2012.
The Supply and Demand of Truck Drivers
chaptEr 3
chapter summary � Labour force participation in Canada has been
declining and will continue to decline due to the aging boomer population. This decline will be offset to some extent by the echo genera-tion, but labour force participation by those in the younger age cohorts has been dropping off due to a frustration with job searches.
� Due in large part to the aging workforce, the supply of truck drivers in the business-as-usual scenario is not expected to increase significantly over the next few years. However, even if we assume that industry productivity will increase steadily, a growing demand for trucking services will continue to result in greater demand for truck drivers.
� This demand is expected to result in a supply and demand gap of nearly 25,000 drivers—about 14 per cent of the anticipated driver population—for the for-hire trucking industry by 2020, if productivity increases by 0.67 per cent per year during this period. If the improve-ment in labour productivity is lower, the gap could exceed 30,000 drivers.
� Since this scenario does not factor in any requirements that the private trucking industry may have, the overall supply and demand gap for truck drivers in the country will be higher.

The Conference Board of Canada | 11
Find this report and other Conference Board research at www.e-library.ca
workforce. The Conference Board’s Index of Business
Confidence from the third quarter of 20122 found that
24 per cent of firms reported a shortage of qualified staff.
The Conference Board’s Compensation Planning Outlook
for 2013 cites a particularly tight labour market in Western
Canada and in the natural resources sector in general.
As a result, Alberta and Saskatchewan are expected to
see the highest base pay increases in 2013.3
the participation of young people, particularly those between the ages of 15 and 24, has dropped off significantly over the past decade .
Due mainly to the overall older demographics of the
driver population, along with the virtual non-existent
presence of younger truck drivers, we would intuitively
expect the potential labour supply for the trucking indus-
try would grow even less quickly compared with the
total labour force.
outlook for supply of truck drivErs in canada
Chapter 2 provided some insight on the driver popula-
tion in terms of how it has aged and the related lack of
younger people who have entered the occupation. We
developed a model in order to estimate how the supply
of truck drivers available to the trucking industry will
develop in the near- to mid-term, out to 2020. The
model leverages data from Statistics Canada’s Labour
Force Survey (LFS) and Census of Population. (For
brief details on the supply model methodology, see box
“Driver Supply Model Methodology.”)
The primary function of the model is to estimate annual
exits from the occupation due to retirements, compared
with annual entries from new entrants into the labour force
(primarily those leaving school and new immigrants).
The model also considers entrants from and exits to
2 The Conference Board of Canada, Index of Business Confidence: Autumn 2012.
3 Stewart, Compensation Planning Outlook, i–ii.
other occupations. However, in our base scenario, we
assume these to be equal. As a result, we can consider
the base scenario to be a “pure” scenario that is based
primarily on demographics, in order to give a sense of
the increase or decrease in pressure that the industry
will ultimately face in terms of attracting drivers from
other sources.
supply of truck drivErs for thE for-hirE trucking industry in canadaWe focus here on the supply of truck drivers for the for-
hire trucking industry, rather than the supply of drivers
available to all industries that employ truck drivers, as it
is more likely that these drivers are engaged in the less
desirable long-haul (particularly unscheduled) activity.
Conversely, private trucking fleets are more likely to
focus on shorter, more regular intra-city movements,
which allow drivers to be on a fixed schedule and,
most importantly, be home every night.
driver supply model methodology
In the model, the available supply of truck drivers in a given year is the supply available in the previous year, plus new entries of drivers and minus the exits of drivers. The number of truck drivers who enter the labour pool in a given year is composed of a couple of distinct groups: international immigrants and entrants from the domestic labour force.
Our methodology incorporates the relative mobility of truck drivers in the fore-cast. For example, if it is an occupation where people have historically been less, or more, likely to move to work for, it will continue to display the same characteristic.
To forecast domestic entry into the truck driver labour force, the Conference Board estimated the number of school leavers who enter the truck driving occu-pation. To complete this forecast, the Board examined the educational attainment of workers between the ages of 25 and 34 years to establish an educational pro-file for the occupation. This profile varied across regions. A separate “occupation ratio” was created to capture the attractiveness of the occupation to school leav-ers. These variables were then applied to the Conference Board’s forecast of population at the relevant age to develop the forecast for school leavers.
At the provincial level, we considered both interprovincial immigration and emigration. To establish the number of truck drivers entering the province from other provinces, we applied the ratio of truck drivers to the total labour force from the 2006 Census to provincial immigration. Lastly, we adjusted for employment growth of truck drivers in the province, compared with Canada as a whole. If one particular occupation had especially strong growth in the prov-ince, it was expected that more people would be coming in and fewer would be leaving the occupation.
Source: The Conference Board of Canada.
12 | Understanding the Truck Driver Supply and Demand Gap and Its Implications for the Canadian Economy—February 2013
Find this report and other Conference Board research at www.e-library.ca
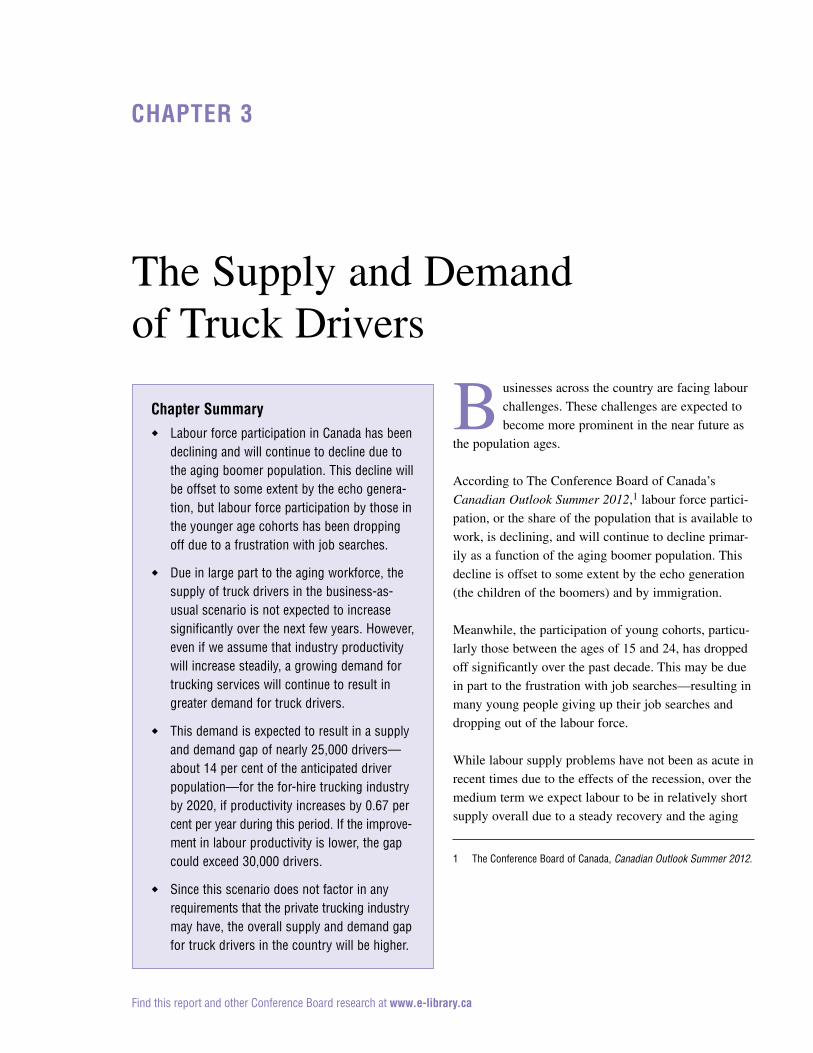
Our baseline truck driver population for modelling pur-
poses is based on the 2011 LFS. While the census data
offer greater accuracy due to the much larger sample size,
for this purpose we used the LFS data because of their
timeliness. According to these data, the total number of
drivers employed in the trucking industry in 2011 was
173,100. What is important is to retain a consistent def-
inition (both on the supply and demand sides) when
making use of the data in order to assess the potential
supply and demand gap in the future.
Chart 13 summarizes the baseline result of driver supply
for the trucking industry at the national level. Due to the
relatively weak economic conditions that continued to
prevail in 2011, we assumed a 2 per cent oversupply of
drivers (above and beyond those who would be unem-
ployed for frictional and structural reasons). Therefore,
the base supply of drivers in 2011 was approximately
176,600. Given that the driver supply increases only
slightly—from 176,600 to 178,000 drivers—by 2020, the
eventual impact of the aging driver population is clear.
This slight increase demonstrates the potential impact of
the demographic cliff that is facing the industry. Without
additional entries into the driver occupation from new
workforce entrants (young people), increased levels of
immigration, or other occupations, the growing pending
retirements will barely be replaced by the number of
new entrants.
As mentioned, another potential “new” source of supply
is for current truck drivers to delay their retirement. Our
baseline projection assumes an average retirement age of
approximately 63.8 years, which is slightly older than the
average current retirement age in Canada, at 63 years.4
Factors such as growing incentives for older drivers
(increased wages, greater flexibility, better working
conditions, etc.) and household finances could induce
retirement postponements. It is worth noting that over
this period, the recent announcement of age of eligibil-
ity changes to the Old Age Security (OAS) benefit will
not have an effect, as those changes will not begin to
take effect until 2023.5
given that the driver supply increases only slightly—from 176,600 to 178,000 drivers—by 2020, the eventual impact of the aging driver population is clear .
High and low scenarios for the supply forecast based on
different assumptions occupational attractiveness ratios
and retirement ages are included in Appendix B.
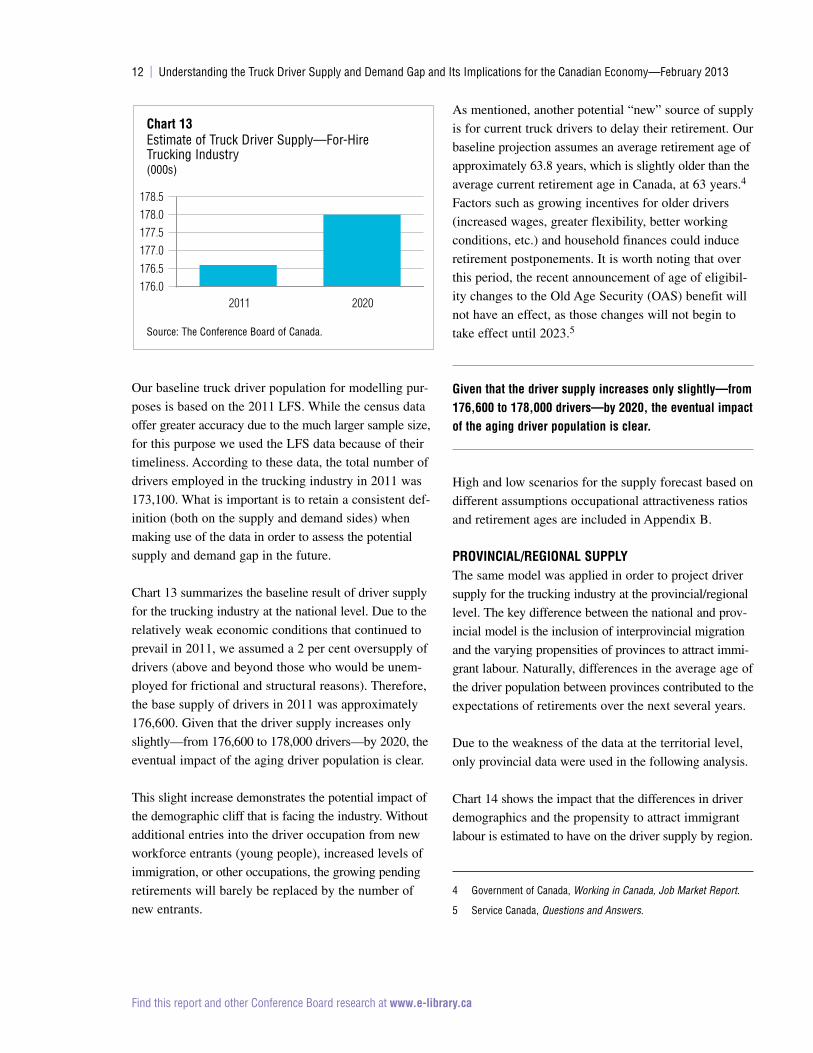
provincial/rEgional supplyThe same model was applied in order to project driver
supply for the trucking industry at the provincial/regional
level. The key difference between the national and prov-
incial model is the inclusion of interprovincial migration
and the varying propensities of provinces to attract immi-
grant labour. Naturally, differences in the average age of
the driver population between provinces contributed to the
expectations of retirements over the next several years.
Due to the weakness of the data at the territorial level,
only provincial data were used in the following analysis.
Chart 14 shows the impact that the differences in driver
demographics and the propensity to attract immigrant
labour is estimated to have on the driver supply by region.
4 Government of Canada, Working in Canada, Job Market Report.
5 Service Canada, Questions and Answers.
chart 13Estimate of Truck Driver Supply—For-Hire Trucking Industry (000s)
Source: The Conference Board of Canada.
2011 2020176.0176.5177.0177.5178.0178.5
The Conference Board of Canada | 13
Find this report and other Conference Board research at www.e-library.ca
Of note is the contrast in the projected supply between
Quebec and Ontario. While the supply is projected to
increase in Ontario, it is projected to decline in Quebec.
This is not explained by driver demographics, as the
average driver age and number of drivers near retire-
ment age (55 and over) are similar. Rather, stronger
immigrant entry and interprovincial migration account
for the more level projection in Ontario.
Manitoba and Saskatchewan have the highest proportion
of drivers reaching retirement age. However, relatively
strong immigration levels are expected to help relieve that
burden to an extent, so the driver population is at least
maintained. Meanwhile, Alberta has an average level of
pending retirements but a slightly smaller number of
school-leavers relative to its population, as it has experi-
enced a slight increase in its natural population growth.
outlook for truck drivEr dEmand
The Conference Board of Canada’s short-term (5-year)
and long-term (20-year) national and provincial economic
forecasts were utilized in order to produce a forecast for
trucking industry demand out to the year 2020. Demand
for trucking services is largely a function of general
economic activity. Given that about 90 per cent of final
goods—products that individuals buy and consume—
are delivered by truck, it is difficult to imagine signifi-
cant economic growth without corresponding growth
in trucking activity.
Our forecast for industry driver demand begins with a
brief overview of the general economic outlook. This is
followed by the demand forecast for the trucking indus-
try. From this forecast, we derive the estimate for the
number of truck drivers that will be required to allow
for the projected growth of the trucking industry at the
national and regional levels.
gEnEral Economic outlookAccording to the Conference Board’s 2012 national
outlook, GDP is expected to grow approximately 2.7 per
cent per year on average from 2012 to 2016. This pro-
vides an immediate expectation for the growth in demand
for trucking services, as more economic activity gener-
ally means more goods being shipped from producers
and to consumers. Over a longer period of time, this
relationship is expected to be tempered slightly due to
the fact that as the population ages, household expendi-
ture patterns are expected to shift toward services.6
Nonetheless, a growing economy will mean growing
demand for goods movement.
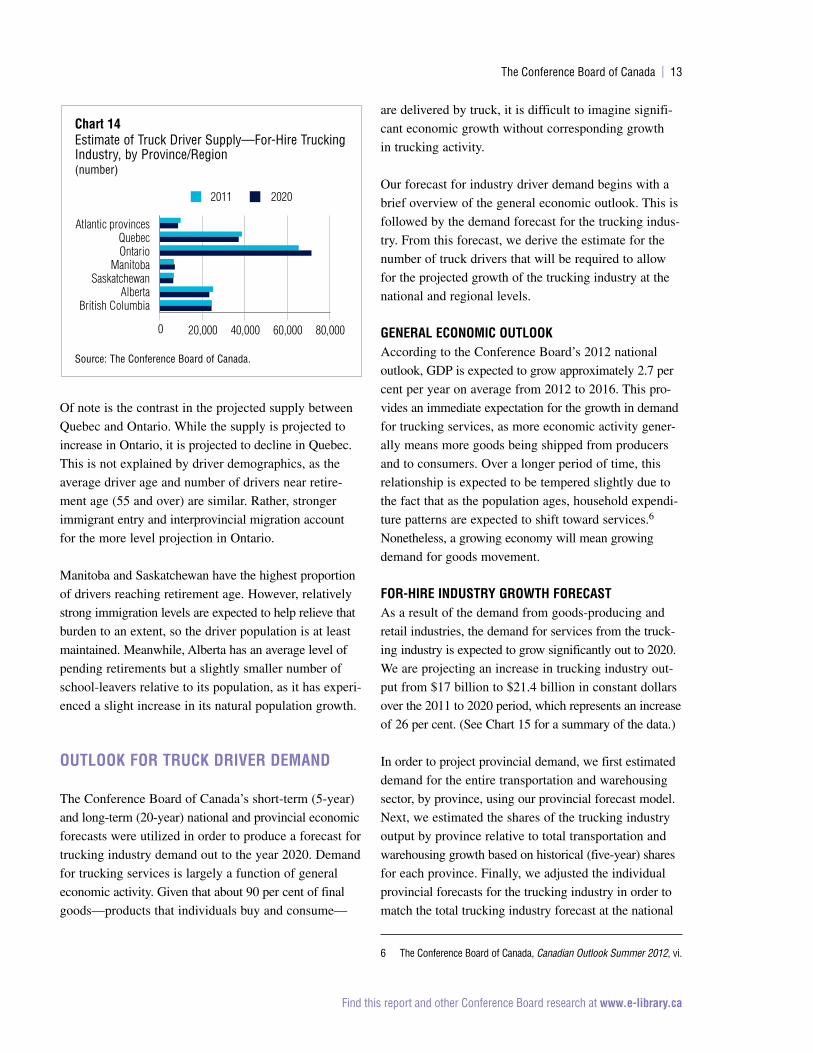
for-hirE industry groWth forEcastAs a result of the demand from goods-producing and
retail industries, the demand for services from the truck-
ing industry is expected to grow significantly out to 2020.
We are projecting an increase in trucking industry out-
put from $17 billion to $21.4 billion in constant dollars
over the 2011 to 2020 period, which represents an increase
of 26 per cent. (See Chart 15 for a summary of the data.)
In order to project provincial demand, we first estimated
demand for the entire transportation and warehousing
sector, by province, using our provincial forecast model.
Next, we estimated the shares of the trucking industry
output by province relative to total transportation and
warehousing growth based on historical (five-year) shares
for each province. Finally, we adjusted the individual
provincial forecasts for the trucking industry in order to
match the total trucking industry forecast at the national
6 The Conference Board of Canada, Canadian Outlook Summer 2012, vi.
chart 14Estimate of Truck Driver Supply—For-Hire Trucking Industry, by Province/Region(number)
Source: The Conference Board of Canada.
British ColumbiaAlberta
SaskatchewanManitoba
OntarioQuebec
Atlantic provinces
0 20,000 40,000 60,000 80,000
2011 2020
14 | Understanding the Truck Driver Supply and Demand Gap and Its Implications for the Canadian Economy—February 2013
Find this report and other Conference Board research at www.e-library.ca
level. Chart 16 provides the trucking industry output
forecasts by province/region. As with the driver supply
data, due to the quality of the data, we omitted territor-
ial data.
Not surprisingly, trucking industry output is largest in
Ontario, and is expected to continue to be so from now
through 2020. However, the 28 percentage rate of growth
expected in Ontario may come as a surprise. Despite
the difficulties faced by the province’s manufacturing
sector, the sector is still expected to drive demand for
trucking services—as will the retail sector, which serves
the largest population base in the country.
going from industry dEmand to drivEr dEmandNaturally, an increase in the demand for trucking servi-
ces will mean an increase in the number of truck drivers
required. However, this is not necessarily a 1:1 relation-
ship. The main reason for a divergence from a 1:1 rela-
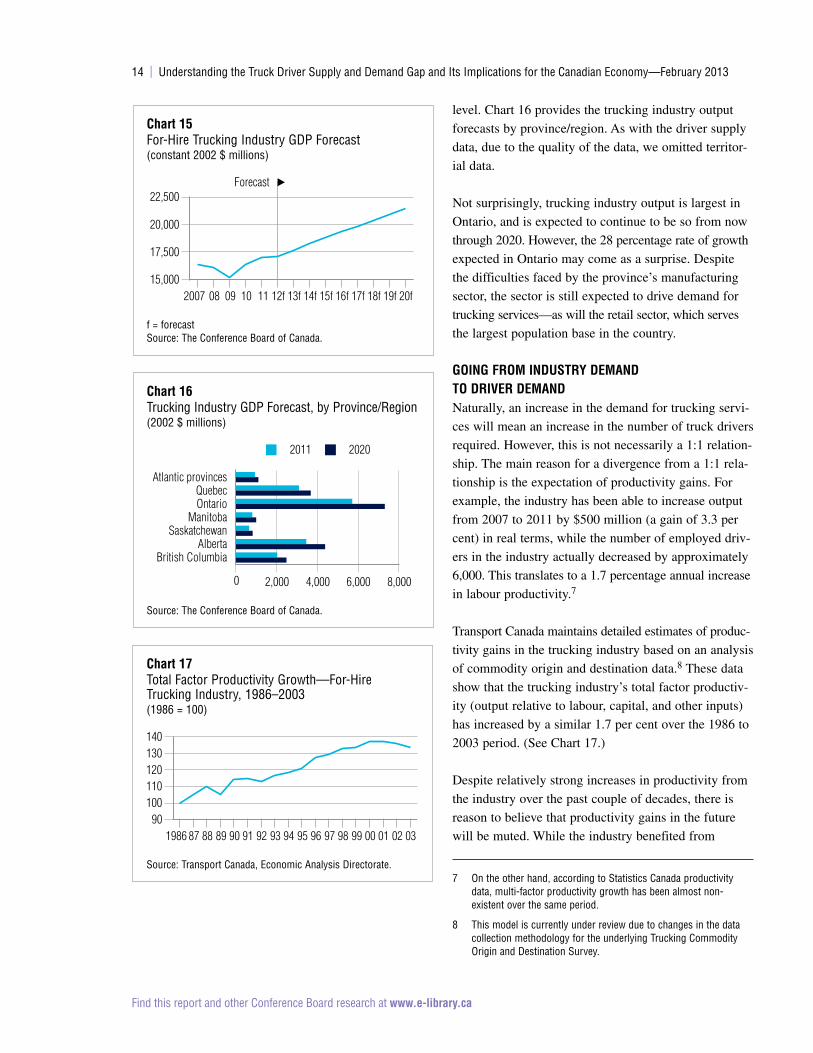
tionship is the expectation of productivity gains. For
example, the industry has been able to increase output
from 2007 to 2011 by $500 million (a gain of 3.3 per
cent) in real terms, while the number of employed driv-
ers in the industry actually decreased by approximately
6,000. This translates to a 1.7 percentage annual increase
in labour productivity.7
Transport Canada maintains detailed estimates of produc-
tivity gains in the trucking industry based on an analysis
of commodity origin and destination data.8 These data
show that the trucking industry’s total factor productiv-
ity (output relative to labour, capital, and other inputs)
has increased by a similar 1.7 per cent over the 1986 to
2003 period. (See Chart 17.)
Despite relatively strong increases in productivity from
the industry over the past couple of decades, there is
reason to believe that productivity gains in the future
will be muted. While the industry benefited from
7 On the other hand, according to Statistics Canada productivity data, multi-factor productivity growth has been almost non- existent over the same period.
8 This model is currently under review due to changes in the data collection methodology for the underlying Trucking Commodity Origin and Destination Survey.
chart 15For-Hire Trucking Industry GDP Forecast(constant 2002 $ millions)
f = forecastSource: The Conference Board of Canada.
2007 08 09 10 11 12f 13f 14f 15f 16f 17f 18f 19f 20f15,000
17,500
20,000
22,500Forecast
chart 16Trucking Industry GDP Forecast, by Province/Region(2002 $ millions)
Source: The Conference Board of Canada.
British ColumbiaAlberta
SaskatchewanManitoba
OntarioQuebec
Atlantic provinces
0 2,000 4,000 6,000 8,000
2011 2020
chart 17Total Factor Productivity Growth—For-Hire Trucking Industry, 1986–2003(1986 = 100)
Source: Transport Canada, Economic Analysis Directorate.
1986 87 88 89 90 91 92 93 94 95 96 97 98 99 00 01 02 0390
100110120130140
The Conference Board of Canada | 15
Find this report and other Conference Board research at www.e-library.ca
deregulation and the opening of trade in the 1980s and
1990s, and while significant increases in size and weight
regulations during this time allowed for the greater haul
of goods per truck and driver, it is unlikely that we will
see similar increases in the years to come. Initiatives like
the controlled expansion of long-combination vehicles in
Ontario and in Eastern Canada, where these vehicles have
not historically been permitted to operate, will improve
productivity, but these gains will likely be modest given
the controlled nature of their use. Moreover, expected
changes to U.S. hours-of-service rules could have a
negative impact on productivity.
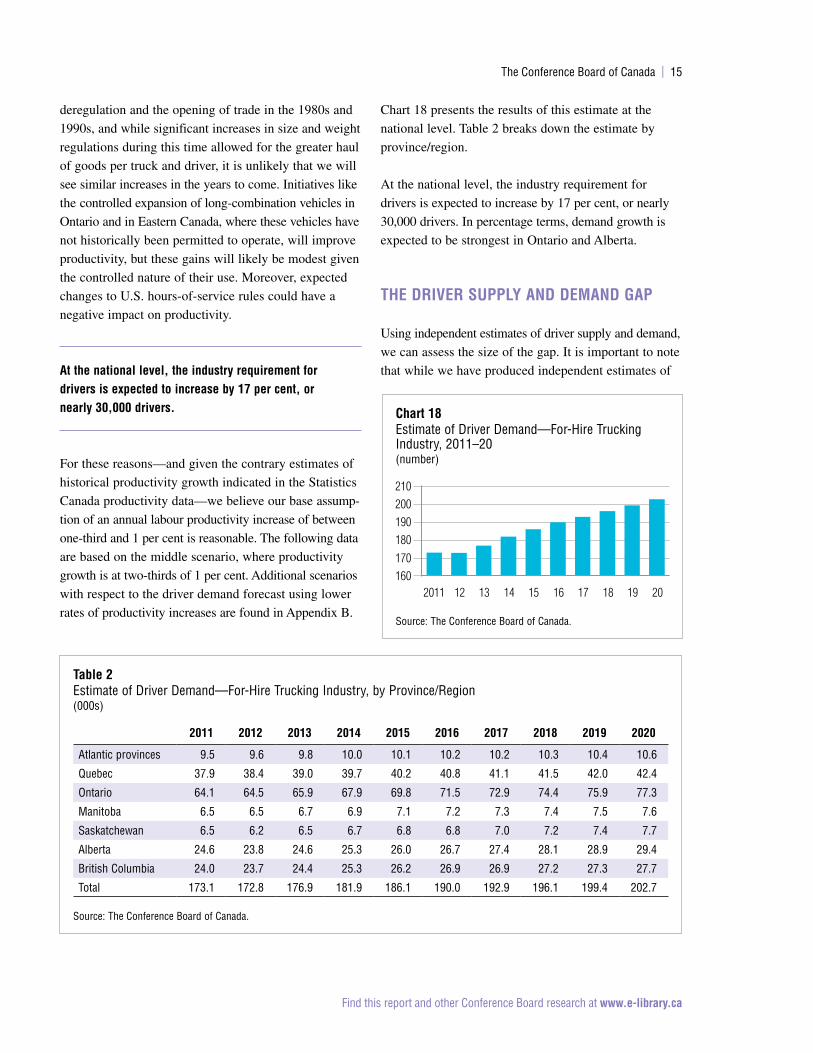
at the national level, the industry requirement for drivers is expected to increase by 17 per cent, or nearly 30,000 drivers .
For these reasons—and given the contrary estimates of
historical productivity growth indicated in the Statistics
Canada productivity data—we believe our base assump-
tion of an annual labour productivity increase of between
one-third and 1 per cent is reasonable. The following data
are based on the middle scenario, where productivity
growth is at two-thirds of 1 per cent. Additional scenarios
with respect to the driver demand forecast using lower
rates of productivity increases are found in Appendix B.
Chart 18 presents the results of this estimate at the
national level. Table 2 breaks down the estimate by
province/region.
At the national level, the industry requirement for
drivers is expected to increase by 17 per cent, or nearly
30,000 drivers. In percentage terms, demand growth is
expected to be strongest in Ontario and Alberta.
thE drivEr supply and dEmand gap
Using independent estimates of driver supply and demand,
we can assess the size of the gap. It is important to note
that while we have produced independent estimates of
chart 18Estimate of Driver Demand—For-Hire Trucking Industry, 2011–20(number)
Source: The Conference Board of Canada.
2011 12 13 14 15 16 17 18 19 20160170180190200210
table 2Estimate of Driver Demand—For-Hire Trucking Industry, by Province/Region(000s)
2011 2012 2013 2014 2015 2016 2017 2018 2019 2020
Atlantic provinces 9.5 9.6 9.8 10.0 10.1 10.2 10.2 10.3 10.4 10.6
Quebec 37.9 38.4 39.0 39.7 40.2 40.8 41.1 41.5 42.0 42.4
Ontario 64.1 64.5 65.9 67.9 69.8 71.5 72.9 74.4 75.9 77.3
Manitoba 6.5 6.5 6.7 6.9 7.1 7.2 7.3 7.4 7.5 7.6
Saskatchewan 6.5 6.2 6.5 6.7 6.8 6.8 7.0 7.2 7.4 7.7
Alberta 24.6 23.8 24.6 25.3 26.0 26.7 27.4 28.1 28.9 29.4
British Columbia 24.0 23.7 24.4 25.3 26.2 26.9 26.9 27.2 27.3 27.7
Total 173.1 172.8 176.9 181.9 186.1 190.0 192.9 196.1 199.4 202.7
Source: The Conference Board of Canada.
16 | Understanding the Truck Driver Supply and Demand Gap and Its Implications for the Canadian Economy—February 2013
Find this report and other Conference Board research at www.e-library.ca
supply and demand, the supply and demand for drivers
will adjust on an ongoing basis. Our assessment of the
gap for 2020 is an indication of the pressure that the
industry—and its customers—will face as a result of
the extrapolation of the current trend in driver demo-
graphics. How that pressure is ultimately managed
is another question, and is briefly discussed in the
following chapter.
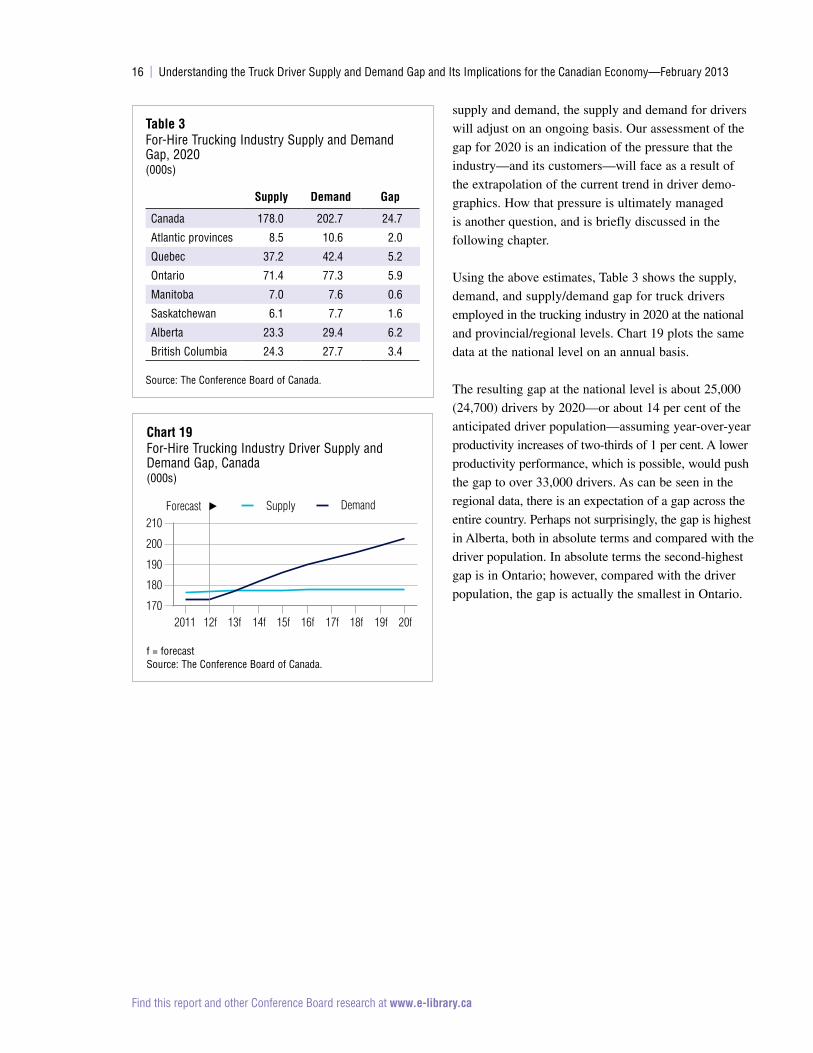
Using the above estimates, Table 3 shows the supply,
demand, and supply/demand gap for truck drivers
employed in the trucking industry in 2020 at the national
and provincial/regional levels. Chart 19 plots the same
data at the national level on an annual basis.
The resulting gap at the national level is about 25,000
(24,700) drivers by 2020—or about 14 per cent of the
anticipated driver population—assuming year-over-year
productivity increases of two-thirds of 1 per cent. A lower
productivity performance, which is possible, would push
the gap to over 33,000 drivers. As can be seen in the
regional data, there is an expectation of a gap across the
entire country. Perhaps not surprisingly, the gap is highest
in Alberta, both in absolute terms and compared with the
driver population. In absolute terms the second-highest
gap is in Ontario; however, compared with the driver
population, the gap is actually the smallest in Ontario.
table 3For-Hire Trucking Industry Supply and Demand Gap, 2020(000s)
supply demand gap
Canada 178.0 202.7 24.7
Atlantic provinces 8.5 10.6 2.0
Quebec 37.2 42.4 5.2
Ontario 71.4 77.3 5.9
Manitoba 7.0 7.6 0.6
Saskatchewan 6.1 7.7 1.6
Alberta 23.3 29.4 6.2
British Columbia 24.3 27.7 3.4
Source: The Conference Board of Canada.
chart 19For-Hire Trucking Industry Driver Supply and Demand Gap, Canada(000s)
f = forecast Source: The Conference Board of Canada.
2011 12f 13f 14f 15f 16f 17f 18f 19f 20f170
180
190
200
210Supply DemandForecast

Find this report and other Conference Board research at www.e-library.ca
The results from Chapter 3 suggest that the
trucking industry will face increasing pressure
to attract drivers in order to meet the expected
level of demand over the next 5 to 10 years. Ultimately,
supply and demand for drivers will adjust according to
conditions. For example, productivity of the industry may
increase or decrease at a different pace as the capital to
labour cost ratio changes as a result of labour supply
constraints. Or, the industry could simply contract or
not grow as expected, thereby potentially taking growth
potential from downstream industries with it. What hap-
pens will be up to the trucking industry itself, its cus-
tomers, and policy-makers.
A number of other factors can also help to match the
supply and demand for truck drivers in the face of
increasing demographic pressures. These include:
� a weaker-than-expected demand for services from
the trucking industry;
� a smaller- or larger-than-expected increase in trucking
industry productivity;
� a significant improvement in industry working con-
ditions, marketing of the truck driving occupation,
and driver training/licensing;
� a significant increase in driver wages; and
� a change in policy that recognizes the truck
driving occupation as a skilled trade.
Let’s look at these factors in more detail.
a weaker-than-expected demand for services from the trucking industry Other modes such as rail may be able to pick up some
of the slack, but unlikely a large amount. For example,
an extensive review of rail traffic conducted in the early
2000s as part of the Canadian Transportation Act
Surveying the Industry and Industry Stakeholders
chaptEr 4
chapter summary � A number of factors can contribute to the
supply and demand for truck drivers in the future. This includes an industry contraction due to difficulty in attracting labour, smaller- or larger-than-expected productivity gains, or an improvement in the attractiveness of the truck driving occupation.
� Most of the productivity gains that have been achieved by the for-hire trucking industry have been swiftly competed away in the form of lower prices to their customers. While there has been some consolidation in the industry, there is no reason to believe that this trend will not continue.
� Industry leaders have observed an increasing difficulty in recruiting drivers over the past several years and see this trend continuing in the future. Long-haul trucking is generally more difficult to recruit for, particularly when the routes are unscheduled.
18 | Understanding the Truck Driver Supply and Demand Gap and Its Implications for the Canadian Economy—February 2013
Find this report and other Conference Board research at www.e-library.ca
Review found that direct intermodal competition
between rail freight and trucking services was limited.1
In addition, a shift in favour of rail for long-haul traffic
still requires a transfer to truck on at least one end of
the movement.
Shippers may be able to make other adjustments (at a
cost) such as shifting from less-than-truckload (LTL) to
truckload (TL) services or building in more lead time
for shipments and holding more inventory as a conse-
quence, or reducing stock-keeping units (SKU).
shippers may be able to make other adjustments (at a cost) such as shifting from less-than-truckload (ltl) to truckload (tl) services .
Another potential consequence is that marginal (the
least lucrative) traffic will decline. Due to peaks and
troughs for trucking services, carriers can vary their
prices in order to ensure best utilization of their fleets.
The more that supply is constrained, the less likely that
this sort of discounting will happen. Shippers who have
typically less time-sensitive freight to move and as a
result can take advantage of the discounting will be
most affected, with a reduction of their own output
being the consequence.
a smaller- or larger-than-expected increase in trucking industry productivityThe expanded allowance and use of long-combination
vehicles in Ontario and in the Atlantic provinces is an
example for the potential to increase the amount of goods
moved per driver. However, given the controlled growth
in the number of vehicles permitted in the grand scheme
of things, it (or any other improvement) will likely bring
with it only incremental productivity improvement at
best. Moreover, the additional productivity that initia-
tives like this bring could be more than offset by chan-
ges to the U.S. hours-of-service regulation, for example.
1 Government of Canada, Vision and Balance: Report of the Canada Transportation Act Review Panel.
The industry has had difficulty improving its fuel pro-
ductivity, in part due to the equipment required in order
to meet emissions standards, which often comes with a
fuel consumption penalty. In addition, the increased
level of service and the need to drive in congested con-
ditions may have also hurt fuel-efficient performance.
However, there is potential for reducing fuel consump-
tion in the near term through the increasing use of such
things as trailer side skirts, better tractor aerodynamics,
low rolling resistant tires, and auxiliary power units.
Other factors can work against the industry in terms of
improving productivity. For example, congested road
conditions not only affect fuel efficiency but the cost
of delivering goods in general.
a significant improvement in industry working conditions, marketing of the truck driving occupation, and driver training/licensingThe Canadian Trucking Human Resources Council
has cited barriers that the industry faces when recruiting
drivers, such as designation of the occupation as a low
skill trade for immigration purposes2 and poor public
perception of the industry.
Having the occupation recognized as a skilled trade
would increase the potential to access immigrant labour.
To accomplish this, the Canadian Trucking Alliance is
recommending that governments mandate a minimum
level of entry-level training, ongoing professional develop-
ment, and enhanced licensing standards. This will also
help to improve the image of both the industry and the
occupation, which could make it more desirable for
younger workers in particular. Providing access to stu-
dent loans for adults to take a recognized driver training
course could make training more accessible. As well,
improving access to credit for immigrants who wish to
purchase a truck and become an owner-operator would
make entry more accessible. And lastly, a graduated
licensing scheme could help to reduce the learning
curve for new drivers.
2 Canadian Trucking Human Resources Council, Closing the Gap, 3.
The Conference Board of Canada | 19
Find this report and other Conference Board research at www.e-library.ca
a significant increase in driver wagesCarriers have long indicated the difficulty of passing on
the cost of an increase in driver wages. However, if car-
riers can find cost savings elsewhere (this is related to
the productivity gains point mentioned above), they
may be able to offset the wage increase with those
cost savings.
The potential of compressed or Liquefied Natural Gas
(LNG) as an alternative fuel source in light of persis-
tently low natural gas prices is an example of an oppor-
tunity to reduce trucking fuel costs, but there are high
upfront capital costs to purchase LNG trucks, along with
other obstacles involved.3 Consequently, there has been
little take-up of this potential in Canada so far, although
there has been slightly more activity south of the border.
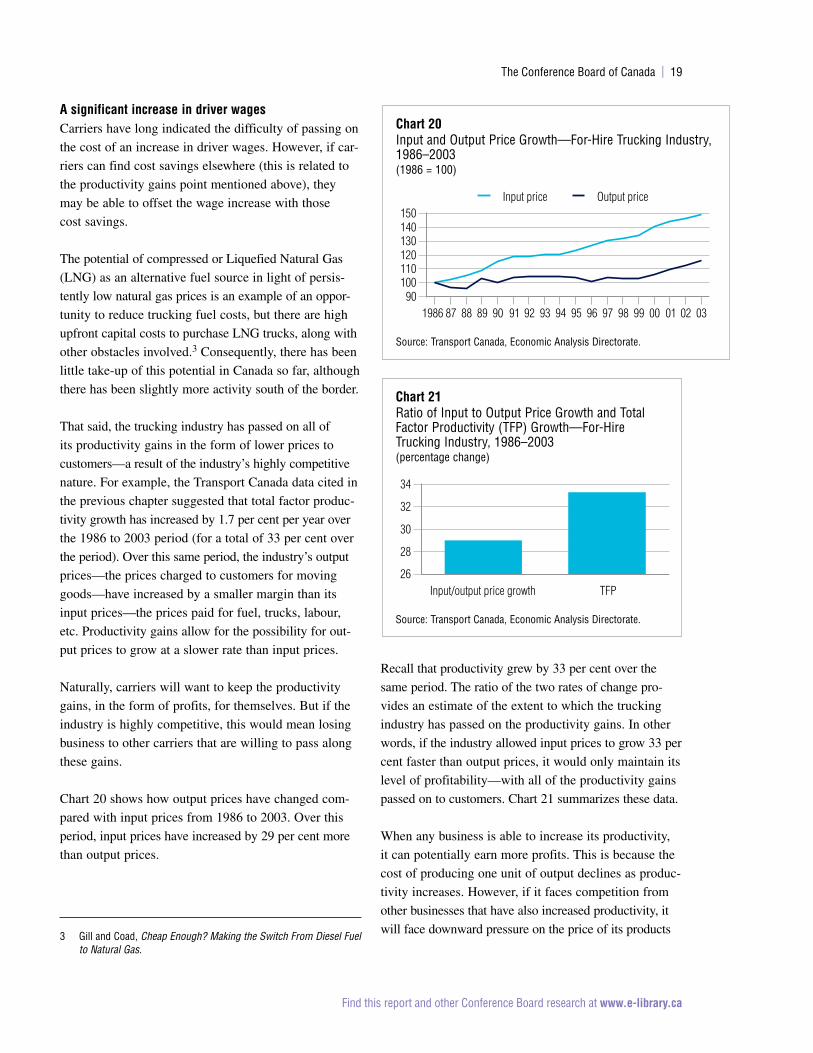
That said, the trucking industry has passed on all of
its productivity gains in the form of lower prices to
customers—a result of the industry’s highly competitive
nature. For example, the Transport Canada data cited in
the previous chapter suggested that total factor produc-
tivity growth has increased by 1.7 per cent per year over
the 1986 to 2003 period (for a total of 33 per cent over
the period). Over this same period, the industry’s output
prices—the prices charged to customers for moving
goods—have increased by a smaller margin than its
input prices—the prices paid for fuel, trucks, labour,
etc. Productivity gains allow for the possibility for out-
put prices to grow at a slower rate than input prices.
Naturally, carriers will want to keep the productivity
gains, in the form of profits, for themselves. But if the
industry is highly competitive, this would mean losing
business to other carriers that are willing to pass along
these gains.
Chart 20 shows how output prices have changed com-
pared with input prices from 1986 to 2003. Over this
period, input prices have increased by 29 per cent more
than output prices.
3 Gill and Coad, Cheap Enough? Making the Switch From Diesel Fuel to Natural Gas.
Recall that productivity grew by 33 per cent over the
same period. The ratio of the two rates of change pro-
vides an estimate of the extent to which the trucking
industry has passed on the productivity gains. In other
words, if the industry allowed input prices to grow 33 per
cent faster than output prices, it would only maintain its
level of profitability—with all of the productivity gains
passed on to customers. Chart 21 summarizes these data.
When any business is able to increase its productivity,
it can potentially earn more profits. This is because the
cost of producing one unit of output declines as produc-
tivity increases. However, if it faces competition from
other businesses that have also increased productivity, it
will face downward pressure on the price of its products
chart 20Input and Output Price Growth—For-Hire Trucking Industry, 1986–2003(1986 = 100)
Source: Transport Canada, Economic Analysis Directorate.
1986 87 88 89 90 91 92 93 94 95 96 97 98 99 00 01 02 0390
100110120130140150
Input price Output price
chart 21Ratio of Input to Output Price Growth and Total Factor Productivity (TFP) Growth—For-Hire Trucking Industry, 1986–2003(percentage change)
Source: Transport Canada, Economic Analysis Directorate.
Input/output price growth TFP26
28
30
32
34
20 | Understanding the Truck Driver Supply and Demand Gap and Its Implications for the Canadian Economy—February 2013
Find this report and other Conference Board research at www.e-library.ca
or services. This is due to the fact that the competing
business may use the productivity gains to decrease
prices in order to capture market share.
Since input prices actually grew 29 per cent faster than
output prices, we estimate that 87 per cent of productiv-
ity gains have flown through to customers.4 Put another
way, 87 per cent of productivity gains have been used to
hold down output prices in the face of rising fuel, capital,
labour, and other costs, rather than to increase profit. The
key takeaway is that when the trucking industry is able
to cut costs due to productivity gains, these savings are
usually lost through competition relatively quickly.
the truck driver industry is intensely competitive, and there is little reason to expect a variation in the degree of competition in the future .
This result speaks to the intensely competitive nature of
the industry. And while this result may not bode well
for those in the industry, it is of huge benefit to custom-
ers and, ultimately, consumers. Moreover, there is little
reason to expect a variation in the degree of competition
in the future. Despite the fact that we have seen some
consolidation in the industry, and can expect to see more,
the industry will continue to exhibit relatively low bar-
riers to entry and be home to a large number of small-
to medium-sized firms. As a result, any time we begin
to see significant increases in industry profits, we can
expect to see new entrants and downward pressure on
freight prices as a result.
a change in policy that recognizes the truck driving occupation as a skilled tradeTruck driving is not considered a skilled trade. As a
result, it is nearly impossible for qualified foreign truck
drivers to enter the country in order to continue their
4 Technically, returns from productivity gains can also go to labour in addition to capital (through profits). Given the number of carriers and the competitive nature of the industry, as well as the absence of any rapid growth in wages over the period, the analysis assumes wages to be strictly an input cost.
careers beyond perhaps being allowed in on a tempor-
ary basis. This puts the occupation at a disadvantage
when competing for immigrant labour compared with
other occupations that are recognized as skilled trades.
Provincial nominee programs, which have been intro-
duced on an ad hoc basis, allow temporary workers to
enter the country to work as truck drivers. However,
since the programs are geared toward attracting workers
on a temporary basis, they are often little more than a
band-aid solution.
gEnEral rEsults and oBsErvations from industry consultations
To get a better perspective on the difficulty in attracting
drivers to the industry along with the potential conse-
quences, we conducted a series of interviews with about
15 industry leaders and some of the industry’s customers.
The following is a summary of some of the questions
that we asked and the answers that we received.
� To what extent has it become more or less difficult
to recruit truck drivers over the past 5 to 10 years?
Any specific reasons why you believe that it has
become more or less difficult?
– All respondents indicated that it has become
more difficult to recruit drivers.
– The aging demographic of the current driver
population was generally cited as contributing
to the difficulty.
– More drivers are objecting to the lifestyle of the
long-haul driver in particular. In the past, there
were those who sought out the type of “cowboy”
lifestyle that long-haul driving brought along
with it. For whatever reason, fewer younger
people are willing to embrace a lifestyle where
they have to be away from home for days or
even weeks at a time.
– There is a generally inaccurate view of the life of a
driver and an unfair stigma of the “typical” driver.
The Conference Board of Canada | 21
Find this report and other Conference Board research at www.e-library.ca
– The more stringent quality standards have had
some impact. The more established carriers in
particular have become more proactive in creating
higher level of professionalism.
– Over time, carriers required drivers to be over
25 and to have several years of experience before
hiring them, which of course makes it more diffi-
cult to enter the occupation as a young driver.
– Wages are often not competitive enough with
alternative occupations. In addition, pay is often
not consistent from month to month, as it varies
with the volume of work.
� Do you expect that recruiting drivers will become
more difficult over the next few years? If so, why?
– The demographics of the current driver population
were often cited as a reason why it will continue
to be difficult or become increasingly difficult.
– In the past, the industry would get applicants
who had worked on farms and were used to being
around equipment and the demands of physical
labour. With family farms disappearing, this will
continue to add to the difficulty.
– Related to the above, it used to be sufficient to
place an advertisement in the local newspaper or
on a radio station in order to attract applicants.
This is no longer an effective tool, as the search
for drivers has gone far beyond the local level.
– Companies that were experiencing and targeting
significant growth cited driver recruitment as their
greatest hurdle.
� Has it been more difficult to attract drivers in certain
geographic locations? If so, where?
– Many respondents suggested that it was particu-
larly difficult to find quality drivers in Alberta.
While wages have increased there, it has been
difficult to keep pace with the wage rate increases
and the sheer volume of labour demanded by the
resource sector.
– With that said, there were varied responses overall.
Many respondents suggested that the difficulty
persists across the country, despite the focus that
is often placed on the West. This is in part due
to the fact that many potential drivers are, in fact,
migrating from the East to the West. Some cited
more difficulty in Quebec, where there appears
to be less supply from immigrant populations.
� Which areas of business have been most affected
(truckload, LTL, refrigerated trucking, dangerous
goods, etc.)?
– Long-haul trucking was overwhelmingly cited as
the biggest problem. In particular, unscheduled
long-haul/LTL was difficult to recruit for, although
it was mentioned that in some cases drivers like
to vary their destinations.
– Some respondents suggested that long-haul was
not as much of a problem as long as the schedule
and routes were regular, as it allows the driver to
plan his or her family life around the days he or
she would be away from home. However, others
suggested that being away from home as well as
the physical demands were a problem.
– Hauling dangerous goods into the U.S. requires
FAST certification, which shuts the door to driv-
ers with less than clean legal records, even if they
made a mistake decades in the past. This is making
the available pool of potential drivers even smaller.
– Some respondents indicated that any type of work
that requires more than just driving, such as increased
customer interaction, driving equipment off of trail-
ers, and actively monitoring temperatures, adds to
the difficulty. However, others said that as long as
the drivers are trained properly, that is not much
of an issue.
– Business that serves construction industries tends
to be more seasonal and more difficult to recruit
for as a result. Unlike those in the construction
industry, it is difficult for drivers to work fewer
hours in the less-busy winter months and make
up the time by working more hours in the sum-
mer months, due to hours-of-service regulations.
� Do you feel that it is more difficult to attract drivers
to the for-hire industry compared with attracting
drivers for private fleets?
– Many private fleets are used solely for local and/
or regularly scheduled runs. As a result, the con-
trast between for-hire and private fleets is some-
what analogous to the contrast between long-haul
and local trucking, by default making it more
difficult for the for-hire industry. However, this
response was not entirely unanimous, as some
suggested that it was difficult to hire for private/
local fleets as well.
22 | Understanding the Truck Driver Supply and Demand Gap and Its Implications for the Canadian Economy—February 2013
Find this report and other Conference Board research at www.e-library.ca
� What is/will be the result of not being able to recruit
enough drivers to meet demand?
– Respondents were split on the wage issue. Some
were adamant that wages would have to go up
and in fact would have by now, but the increased
value in the Canadian dollar and the slack in the
economy in general has delayed this from hap-
pening. Others suggest that wage increases would
have to result in increased prices for customers,
which would not be tolerated. As a consequence,
other solutions would have to be found.
– Shippers that rely on the spot market in general
(rather than buying capacity ahead of time) will
find that market dried up. These shippers are
often sending inexpensive/least time-sensitive
freight. For these goods, transportation costs are
a higher share of the final price of the good. Less
competitive or available transportation services in
general will contribute to their exit from the indus-
try. Some of these companies have already dis-
appeared all together (such as the textile and
shoe-producing companies in central Canada),
although relative labour costs between Canada
and competing countries have certainly played
a large role in this.
– There is still some opportunity to shift more
freight to rail. But shippers are already taking
advantage of rail where they can, so the overall
opportunity is somewhat limited. With that said,
some respondents suggested that east–west long-
distance trucking will eventually be a thing of the
past, as the majority will go by rail. Shippers that
prefer the level of service provided by truck trans-
portation will have to live with the level of service
provided by rail.
– Several respondents cited the use of a relay net-
work in order to reduce the number of long-haul
drivers required to move freight over a long haul.
This involves a network of drivers in different geo-
graphic locations who would hand off freight as
set points along frequently travelled routes. Each
driver only drives a distance that allows him or
her to be home every night. Naturally, this comes
at a cost. However, some companies have already
set up such networks in certain places and as long-
haul labour becomes scarce, the cost of setting up
such a network relative to the benefit of doing so
will decrease. Given the fact that many or most
trucking companies are regionally based, this would
likely mean more consolidation in the industry.
� Have you experienced any difficulty in obtaining
timely or adequate trucking services (for-hire or
otherwise) that may be a result of the lack of drivers?
– Capacity issues seem to come up later in the
week, such as Friday afternoon in particular. In
those cases, it becomes more time-consuming
and/or more costly to secure a delivery.
– In general, it was easier during the recession due to
the slack in capacity. As the economy has recovered,
it has become more difficult at times. However,
shippers who regularly work with the same carri-
ers and maintained relationships through the good
and bad times are likely to get better service.
� Are you concerned with the potential impact that the
driver recruitment issue (if you feel that there is an
issue) will have on your own operations? Or do you
feel that you will be able to adjust to whatever the
conditions may be (through supply chain reorganiz-
ation, modal shift, etc.)?
– This issue manifests itself in the quality of ser-
vice at times. There are drivers with little experi-
ence and/or poor communications skills, which is
required despite the perception of the occupation.
– For shippers, receiving real-time communication
is extremely important, and carriers rely on their
drivers to provide this. Shippers are at the mercy
of their own customers, who are in turn becoming
more demanding due to their own competitive
pressures. For example, in the food retail sector,
it is not uncommon to face penalties in the vicin-
ity of $1,000 per hour for a late delivery. With
real-time communication, shippers can make
attempts at alternative arrangements when later
delivery is anticipated.
� If you feel that there is a recruitment problem that
will continue to grow, what do you feel are some of
the remedies?
– The relay network (switch network) was cited
as one method of carrying the same amount of
freight over the long haul but with fewer long-
haul drivers. This requires upfront investment in
technological solutions to optimize scheduling,
which can also help to make shifts more predict-
able for drivers in general.
The Conference Board of Canada | 23
Find this report and other Conference Board research at www.e-library.ca
– Introducing initiatives that facilitate interlining
between Canadian, U.S., and Mexican fleets could
help to reduce the number of empty loads on trans-
border traffic.
– The expansion of long combination vehicle (LCV)
permits in Ontario was cited as having the poten-
tial for moving more goods with fewer drivers. For
freight that cubes out (rather than weighs out) in
particular, LCVs effectively allow twice the freight
to be carried with the same number of drivers and
power units. At the moment, there are only a lim-
ited number of LCV permits allowed (four per
company). In addition, Highway 185 in Quebec
near the New Brunswick border limits the poten-
tial of LCVs in the Eastern corridor, as most of
it is not twinned.
– Road congestion has exacerbated the problem
of moving freight both for short and long hauls.
Alleviating congestion has major potential, as it
reduces the number of hours required to move a
given distance. Perhaps more importantly, less
congestion makes planning easier. Policies that
tackle road congestion could help to reduce
recruitment pressures.
– Sophisticated shippers and carriers have invested
in the technology necessary that allows them to
communicate information between them fluidly.
Continued investment is required in order to maxi-
mize efficiency and therefore labour productivity.
– Recognizing the occupation as a skilled trade
will help to recruit immigrant drivers. Interviewees
suggested that if hairstylists and tile-setters qual-
ify as skilled trades, then truck driving certainly
should, particularly given the fact that they are
regularly responsible for millions of dollars worth
of goods and equipment. At the same time, this
would heighten the importance and emphasis on
high-quality training schools.
– There is always some level of unemployment, often
at a level that is above the natural rate of employ-
ment. While this does not seem to be intuitive given
that the industry is having trouble attracting labour,
this may relate to the misperception of the occu-
pation, which results in even those who are persis-
tently unemployed from entering this occupation.
There is a need for increased awareness and edu-
cation about the benefits of the occupation.
– While the industry is regulated at the provincial
level, municipal regulations and policies regarding
noise and other restrictions have a major impact
on when and where goods can be delivered and,
ultimately, on the efficiency of goods movement
in general. This provides an opportunity to further
enhance the productivity of the industry and make
better use of drivers’ time.
– While the emphasis on experience when hiring
new drivers is understandable, some carriers have
recognized that they have to be more proactive in
terms of training. As a result, more carriers have
taken and will likely continue to take high-quality
applicants with little experience into in-house
training programs.
– Anything that shippers can do to use up less driver
time would allow drivers to spend more time on the
road and be more efficient as a result. However,
there may be resistance to doing this as it requires
out-of-pocket costs for the shipper and shippers
do not see an immediate payback. (However, as
evidenced earlier in this chapter, most trucking
industry productivity gains are swiftly passed on to
customers, so they should expect to see a payback.)
– Government subsidization of training was cited as
a potential method to make driver training more
accessible, with the subsidy perhaps being funded
through fuel taxes or other fees on the industry.
Although this may drive up carrier costs, as long
as the subsidy is on a level playing field, the abil-
ity to pass on costs should be uniform, whereas in-
house training that is provided directly by a carrier
always runs the risk of losing the driver to another
carrier after the training has been provided.
Find this report and other Conference Board research at www.e-library.ca
In this chapter we consider the economic import-
ance of the trucking industry, in part to demonstrate
why the health of the industry is of importance to
more than just the industry itself. First, we quantify the
economic footprint of the for-hire trucking industry using
The Conference Board of Canada’s national forecast
model. Second, we review the downstream benefits of
the industry in terms of its role as an economic enabler.
Economic impact analysis
historical rEviEWActivity in the for-hire trucking industry consists of
moving general or specialized freight locally or over
long distances. Gross domestic product in the for-hire
trucking industry measures only the activity of for-hire
trucking services and does not capture the value-added
from own-account trucking (which are trucking services
that occur within a firm such as trucks operated by retail
businesses). Trucking is the largest transportation seg-
ment, accounting for an estimated 33 per cent of real
GDP in the transportation sector. Trucks move 90 per
cent of all consumer products and foodstuffs within
Canada and about 60 per cent, by value, of our trade
with the U.S., our largest trading partner. The fortunes
of the trucking sector are tied to the domestic economy,
with performance in the manufacturing and retail and
wholesale trade industries being the key driver of
demand for truck transport services.
Given Canada’s relatively robust economic performance
from 1999 to 2011, truck transportation has posted the
strongest annual GDP growth among transportation seg-
ments. From 1999 to 2011, average annual compound
growth in truck transportation GDP was 3.3 per cent,
The Economic Importance of the Trucking Industry
chaptEr 5
chapter summary � The for-hire trucking industry itself is large,
with industry GDP of $17 billion in 2011. This does not include the output of private trucking activity. The economic footprint of the for-hire trucking industry, including direct, indirect, and induced impacts, is over twice this size.
� The true benefits of the trucking industry lie in the value that its services have in terms of contributing to more competitive goods mar-kets, greater specialization in production, and greater concentration in economic activity. In other words, efficient trucking services make markets work better.
� For shippers, it is not just the freight rate that matters, but the speed and reliability of deliv-ery. Without these last two components, ship-pers are unable to manage their inventories or plan their production. For consumers, this means higher prices and a lower selection of goods.
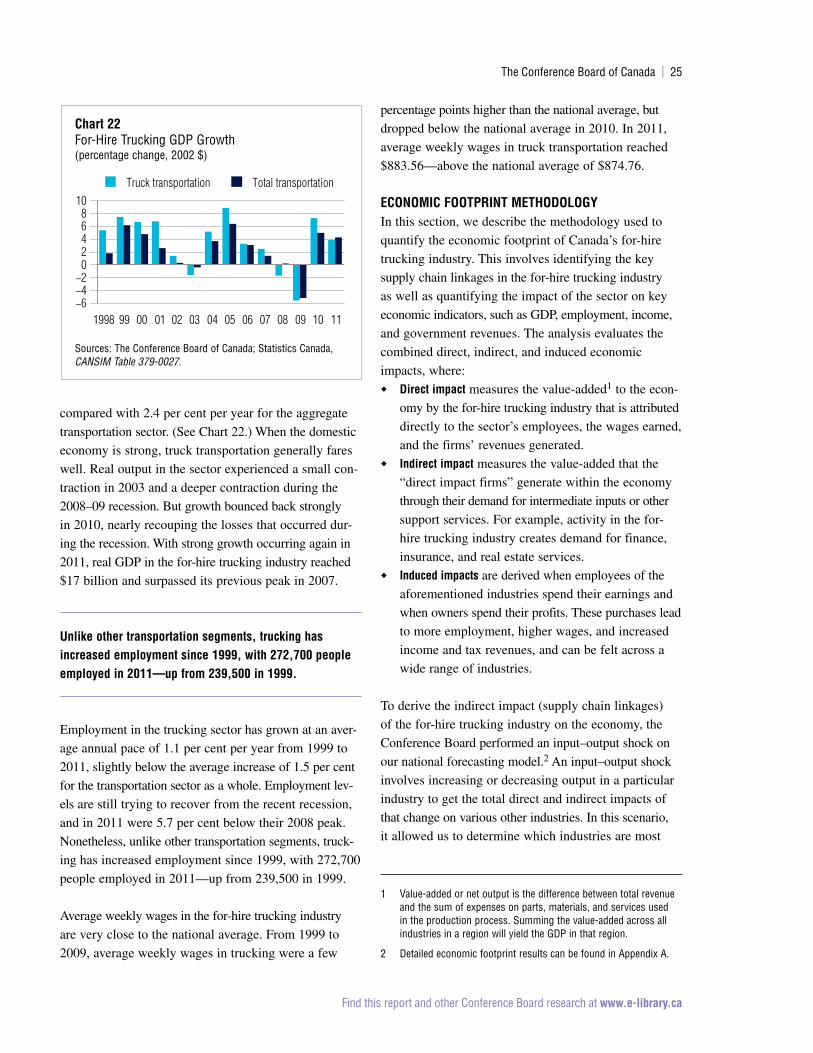
The Conference Board of Canada | 25
Find this report and other Conference Board research at www.e-library.ca
compared with 2.4 per cent per year for the aggregate
transportation sector. (See Chart 22.) When the domestic
economy is strong, truck transportation generally fares
well. Real output in the sector experienced a small con-
traction in 2003 and a deeper contraction during the
2008–09 recession. But growth bounced back strongly
in 2010, nearly recouping the losses that occurred dur-
ing the recession. With strong growth occurring again in
2011, real GDP in the for-hire trucking industry reached
$17 billion and surpassed its previous peak in 2007.
unlike other transportation segments, trucking has increased employment since 1999, with 272,700 people employed in 2011—up from 239,500 in 1999 .
Employment in the trucking sector has grown at an aver-
age annual pace of 1.1 per cent per year from 1999 to
2011, slightly below the average increase of 1.5 per cent
for the transportation sector as a whole. Employment lev-
els are still trying to recover from the recent recession,
and in 2011 were 5.7 per cent below their 2008 peak.
Nonetheless, unlike other transportation segments, truck-
ing has increased employment since 1999, with 272,700
people employed in 2011—up from 239,500 in 1999.
Average weekly wages in the for-hire trucking industry
are very close to the national average. From 1999 to
2009, average weekly wages in trucking were a few
percentage points higher than the national average, but
dropped below the national average in 2010. In 2011,
average weekly wages in truck transportation reached
$883.56—above the national average of $874.76.
Economic footprint mEthodologyIn this section, we describe the methodology used to
quantify the economic footprint of Canada’s for-hire
trucking industry. This involves identifying the key
supply chain linkages in the for-hire trucking industry
as well as quantifying the impact of the sector on key
economic indicators, such as GDP, employment, income,
and government revenues. The analysis evaluates the
combined direct, indirect, and induced economic
impacts, where:
� direct impact measures the value-added1 to the econ-
omy by the for-hire trucking industry that is attributed
directly to the sector’s employees, the wages earned,
and the firms’ revenues generated.
� indirect impact measures the value-added that the
“direct impact firms” generate within the economy
through their demand for intermediate inputs or other
support services. For example, activity in the for-
hire trucking industry creates demand for finance,
insurance, and real estate services.
� induced impacts are derived when employees of the
aforementioned industries spend their earnings and
when owners spend their profits. These purchases lead
to more employment, higher wages, and increased
income and tax revenues, and can be felt across a
wide range of industries.
To derive the indirect impact (supply chain linkages)
of the for-hire trucking industry on the economy, the
Conference Board performed an input–output shock on
our national forecasting model.2 An input–output shock
involves increasing or decreasing output in a particular
industry to get the total direct and indirect impacts of
that change on various other industries. In this scenario,
it allowed us to determine which industries are most
1 Value-added or net output is the difference between total revenue and the sum of expenses on parts, materials, and services used in the production process. Summing the value-added across all industries in a region will yield the GDP in that region.
2 Detailed economic footprint results can be found in Appendix A.
chart 22For-Hire Trucking GDP Growth(percentage change, 2002 $)
Sources: The Conference Board of Canada; Statistics Canada, CANSIM Table 379-0027.
1998 99 00 01 02 03 04 05 06 07 08 09 10 11−6−4−202468
10Truck transportation Total transportation
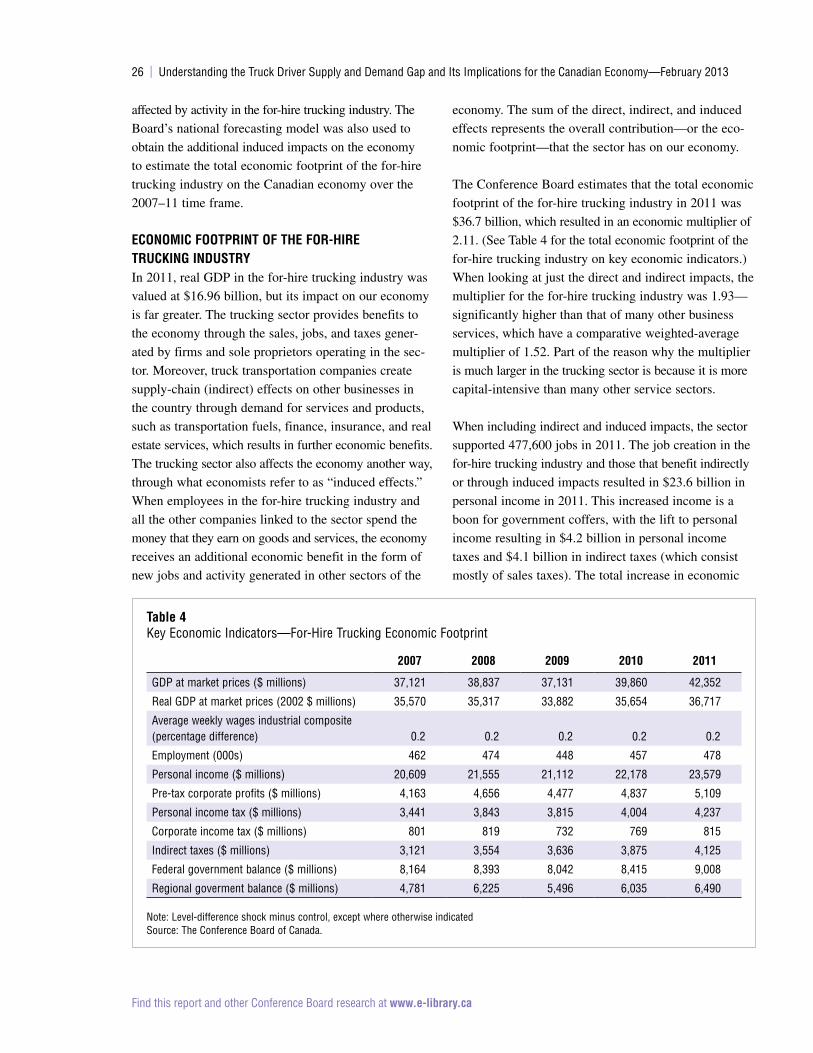
26 | Understanding the Truck Driver Supply and Demand Gap and Its Implications for the Canadian Economy—February 2013
Find this report and other Conference Board research at www.e-library.ca
affected by activity in the for-hire trucking industry. The
Board’s national forecasting model was also used to
obtain the additional induced impacts on the economy
to estimate the total economic footprint of the for-hire
trucking industry on the Canadian economy over the
2007–11 time frame.
Economic footprint of thE for-hirE trucking industryIn 2011, real GDP in the for-hire trucking industry was
valued at $16.96 billion, but its impact on our economy
is far greater. The trucking sector provides benefits to
the economy through the sales, jobs, and taxes gener-
ated by firms and sole proprietors operating in the sec-
tor. Moreover, truck transportation companies create
supply-chain (indirect) effects on other businesses in
the country through demand for services and products,
such as transportation fuels, finance, insurance, and real
estate services, which results in further economic benefits.
The trucking sector also affects the economy another way,
through what economists refer to as “induced effects.”
When employees in the for-hire trucking industry and
all the other companies linked to the sector spend the
money that they earn on goods and services, the economy
receives an additional economic benefit in the form of
new jobs and activity generated in other sectors of the
economy. The sum of the direct, indirect, and induced
effects represents the overall contribution—or the eco-
nomic footprint—that the sector has on our economy.
The Conference Board estimates that the total economic
footprint of the for-hire trucking industry in 2011 was
$36.7 billion, which resulted in an economic multiplier of
2.11. (See Table 4 for the total economic footprint of the
for-hire trucking industry on key economic indicators.)
When looking at just the direct and indirect impacts, the
multiplier for the for-hire trucking industry was 1.93—
significantly higher than that of many other business
services, which have a comparative weighted-average
multiplier of 1.52. Part of the reason why the multiplier
is much larger in the trucking sector is because it is more
capital-intensive than many other service sectors.
When including indirect and induced impacts, the sector
supported 477,600 jobs in 2011. The job creation in the
for-hire trucking industry and those that benefit indirectly
or through induced impacts resulted in $23.6 billion in
personal income in 2011. This increased income is a
boon for government coffers, with the lift to personal
income resulting in $4.2 billion in personal income
taxes and $4.1 billion in indirect taxes (which consist
mostly of sales taxes). The total increase in economic
table 4Key Economic Indicators—For-Hire Trucking Economic Footprint
2007 2008 2009 2010 2011
GDP at market prices ($ millions) 37,121 38,837 37,131 39,860 42,352
Real GDP at market prices (2002 $ millions) 35,570 35,317 33,882 35,654 36,717
Average weekly wages industrial composite (percentage difference) 0.2 0.2 0.2 0.2 0.2
Employment (000s) 462 474 448 457 478
Personal income ($ millions) 20,609 21,555 21,112 22,178 23,579
Pre-tax corporate profits ($ millions) 4,163 4,656 4,477 4,837 5,109
Personal income tax ($ millions) 3,441 3,843 3,815 4,004 4,237
Corporate income tax ($ millions) 801 819 732 769 815
Indirect taxes ($ millions) 3,121 3,554 3,636 3,875 4,125
Federal government balance ($ millions) 8,164 8,393 8,042 8,415 9,008
Regional goverment balance ($ millions) 4,781 6,225 5,496 6,035 6,490
Note: Level-difference shock minus control, except where otherwise indicatedSource: The Conference Board of Canada.
The Conference Board of Canada | 27
Find this report and other Conference Board research at www.e-library.ca
activity generated by the for-hire trucking industry sup-
ported $5.1 billion in pre-tax corporate profits, which
led to a collection of $815 million in corporate income
taxes. The federal government balance benefited from
the increased economic activity by $9 billion in 2011,
while the aggregate provincial/territorial governments’
balance improved by $6.5 billion.
A number of industries benefit from the demand that
the for-hire trucking industry creates for the goods and
services required to support its operation. Given the fuel
intensity of the trucking sector, it creates demand for
refined petroleum products and for the oil and gas extrac-
tion sector. In 2011, demand from the for-hire trucking
industry supported real output of $3.2 billion in the min-
ing sector. (Full shock results for the footprint on real
GDP by sector are provided in Table 1 in Appendix A.)
The finance, insurance, real estate, and rental and leas-
ing (FIREL) sector also benefited from the indirect and
induced economic impacts of the trucking sector—to the
tune of $2.9 billion in 2011. The FIREL sector benefits
from the demand that the sector creates to insure all the
vehicles that operate in the industry, as well as the demand
for legal and accounting services required for some oper-
ations. Other notable increases occurred in manufacturing,
in particular transportation equipment and petroleum
and coal product manufacturing ($2.2 billion); other
business services, which include categories such as
travel and accommodation ($2 billion); and wholesale
and retail trade ($1.9 billion).
As mentioned earlier, the for-hire trucking industry sup-
ported 477,600 jobs in 2011. Most of these jobs are in
the transportation and warehousing sector3: including
direct employment in the sector, 277,300 jobs are sup-
ported by the trucking sector. (Full shock results for
the footprint on employment by sector can be found in
Table 2 in Appendix A.) Additional jobs supported
by the demand created by the trucking sector include
82,400 in other commercial services, 33,800 in whole-
sale and retail trade, and 18,800 in the primary sector,
which includes mining as well as oil and gas.
3 The transportation employment data in our model is aggregated into transportation and warehousing and, as a result, includes all transportation segments, as well as the postal service and couriers and messengers, and the warehousing and storage sectors.
thE BEnEfits of a hEalthy trucking industry
The previous section estimated the economic impact
of the for-hire trucking industry by estimating the value
added directly by motor carriers and the impact of the
demand for goods and services from motor carriers.
However, the true benefits of a healthy trucking industry
result from the services that the motor carriers provide to
their customers and the eventual impact on consumers.
researchers and policy-makers have become more interested in measuring the benefits of transportation investments, primarily for the purpose of evaluating potential transportation infrastructure investments .
Researchers and policy-makers have become more
interested in measuring the benefits of transportation
investments, primarily for the purpose of evaluating
potential transportation infrastructure investments.
Traditional transportation infrastructure investment
appraisals have generally worked on the assumption
that a cost–benefit analysis from the user’s perspective
will capture all of the economic benefits of the proposed
investment. However, this approach ignores the inter-
actions between transportation activities and all the other
activities that make use of transportation services.4
For example, users of freight transportation services bene-
fit directly from improvements that result in more timely
and reliable delivery times. As a result of this direct bene-
fit, they are willing to pay an amount for the service
that is equivalent to the value of the benefit derived.
However, in addition to this direct benefit, there are
wider benefits that are not directly captured by users.
As a result, users are not willing, or able, to pay dir-
ectly for these benefits.
4 Organisation for Economic Co-operation and Development/International Transport Forum, The Wider Economic Benefits, 34.
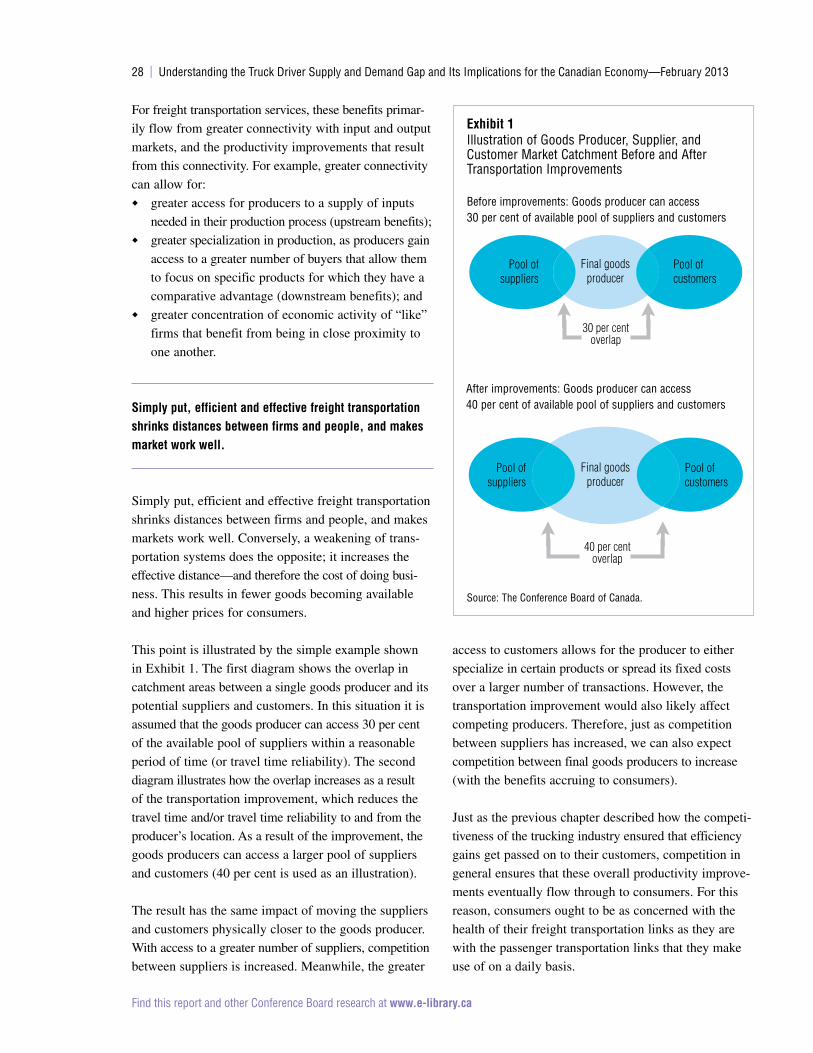
28 | Understanding the Truck Driver Supply and Demand Gap and Its Implications for the Canadian Economy—February 2013
Find this report and other Conference Board research at www.e-library.ca
For freight transportation services, these benefits primar-
ily flow from greater connectivity with input and output
markets, and the productivity improvements that result
from this connectivity. For example, greater connectivity
can allow for:
� greater access for producers to a supply of inputs
needed in their production process (upstream benefits);
� greater specialization in production, as producers gain
access to a greater number of buyers that allow them
to focus on specific products for which they have a
comparative advantage (downstream benefits); and
� greater concentration of economic activity of “like”
firms that benefit from being in close proximity to
one another.
simply put, efficient and effective freight transportation shrinks distances between firms and people, and makes market work well .
Simply put, efficient and effective freight transportation
shrinks distances between firms and people, and makes
markets work well. Conversely, a weakening of trans-
portation systems does the opposite; it increases the
effective distance—and therefore the cost of doing busi-
ness. This results in fewer goods becoming available
and higher prices for consumers.
This point is illustrated by the simple example shown
in Exhibit 1. The first diagram shows the overlap in
catchment areas between a single goods producer and its
potential suppliers and customers. In this situation it is
assumed that the goods producer can access 30 per cent
of the available pool of suppliers within a reasonable
period of time (or travel time reliability). The second
diagram illustrates how the overlap increases as a result
of the transportation improvement, which reduces the
travel time and/or travel time reliability to and from the
producer’s location. As a result of the improvement, the
goods producers can access a larger pool of suppliers
and customers (40 per cent is used as an illustration).
The result has the same impact of moving the suppliers
and customers physically closer to the goods producer.
With access to a greater number of suppliers, competition
between suppliers is increased. Meanwhile, the greater
access to customers allows for the producer to either
specialize in certain products or spread its fixed costs
over a larger number of transactions. However, the
transportation improvement would also likely affect
competing producers. Therefore, just as competition
between suppliers has increased, we can also expect
competition between final goods producers to increase
(with the benefits accruing to consumers).
Just as the previous chapter described how the competi-
tiveness of the trucking industry ensured that efficiency
gains get passed on to their customers, competition in
general ensures that these overall productivity improve-
ments eventually flow through to consumers. For this
reason, consumers ought to be as concerned with the
health of their freight transportation links as they are
with the passenger transportation links that they make
use of on a daily basis.
Exhibit 1Illustration of Goods Producer, Supplier, and Customer Market Catchment Before and After Transportation Improvements
Before improvements: Goods producer can access 30 per cent of available pool of suppliers and customers
Source: The Conference Board of Canada.
Pool of suppliers
Pool of customers
30 per cent overlap
Final goods producer
40 per cent overlap
Pool of suppliers
Pool of customers
Final goods producer
After improvements: Goods producer can access 40 per cent of available pool of suppliers and customers
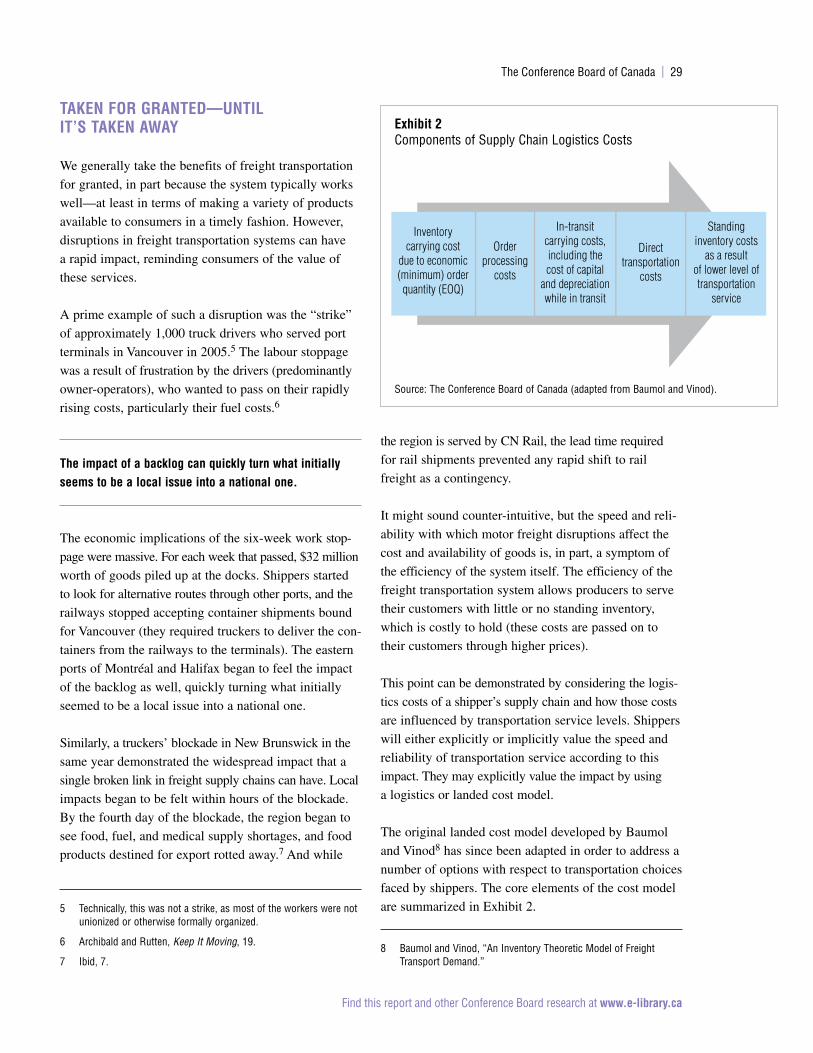
The Conference Board of Canada | 29
Find this report and other Conference Board research at www.e-library.ca
takEn for grantEd—until it’s takEn aWay
We generally take the benefits of freight transportation
for granted, in part because the system typically works
well—at least in terms of making a variety of products
available to consumers in a timely fashion. However,
disruptions in freight transportation systems can have
a rapid impact, reminding consumers of the value of
these services.
A prime example of such a disruption was the “strike”
of approximately 1,000 truck drivers who served port
terminals in Vancouver in 2005.5 The labour stoppage
was a result of frustration by the drivers (predominantly
owner-operators), who wanted to pass on their rapidly
rising costs, particularly their fuel costs.6
the impact of a backlog can quickly turn what initially seems to be a local issue into a national one .
The economic implications of the six-week work stop-
page were massive. For each week that passed, $32 million
worth of goods piled up at the docks. Shippers started
to look for alternative routes through other ports, and the
railways stopped accepting container shipments bound
for Vancouver (they required truckers to deliver the con-
tainers from the railways to the terminals). The eastern
ports of Montréal and Halifax began to feel the impact
of the backlog as well, quickly turning what initially
seemed to be a local issue into a national one.
Similarly, a truckers’ blockade in New Brunswick in the
same year demonstrated the widespread impact that a
single broken link in freight supply chains can have. Local
impacts began to be felt within hours of the blockade.
By the fourth day of the blockade, the region began to
see food, fuel, and medical supply shortages, and food
products destined for export rotted away.7 And while
5 Technically, this was not a strike, as most of the workers were not unionized or otherwise formally organized.
6 Archibald and Rutten, Keep It Moving, 19.
7 Ibid, 7.
the region is served by CN Rail, the lead time required
for rail shipments prevented any rapid shift to rail
freight as a contingency.
It might sound counter-intuitive, but the speed and reli-
ability with which motor freight disruptions affect the
cost and availability of goods is, in part, a symptom of
the efficiency of the system itself. The efficiency of the
freight transportation system allows producers to serve
their customers with little or no standing inventory,
which is costly to hold (these costs are passed on to
their customers through higher prices).
This point can be demonstrated by considering the logis-
tics costs of a shipper’s supply chain and how those costs
are influenced by transportation service levels. Shippers
will either explicitly or implicitly value the speed and
reliability of transportation service according to this
impact. They may explicitly value the impact by using
a logistics or landed cost model.
The original landed cost model developed by Baumol
and Vinod8 has since been adapted in order to address a
number of options with respect to transportation choices
faced by shippers. The core elements of the cost model
are summarized in Exhibit 2.
8 Baumol and Vinod, “An Inventory Theoretic Model of Freight Transport Demand.”
Exhibit 2Components of Supply Chain Logistics Costs
Source: The Conference Board of Canada (adapted from Baumol and Vinod).
Inventory carrying cost
due to economic (minimum) order quantity (EOQ)
Order processing
costs
In-transit carrying costs, including the cost of capital
and depreciation while in transit
Direct transportation
costs
Standing inventory costs
as a result of lower level of transportation
service
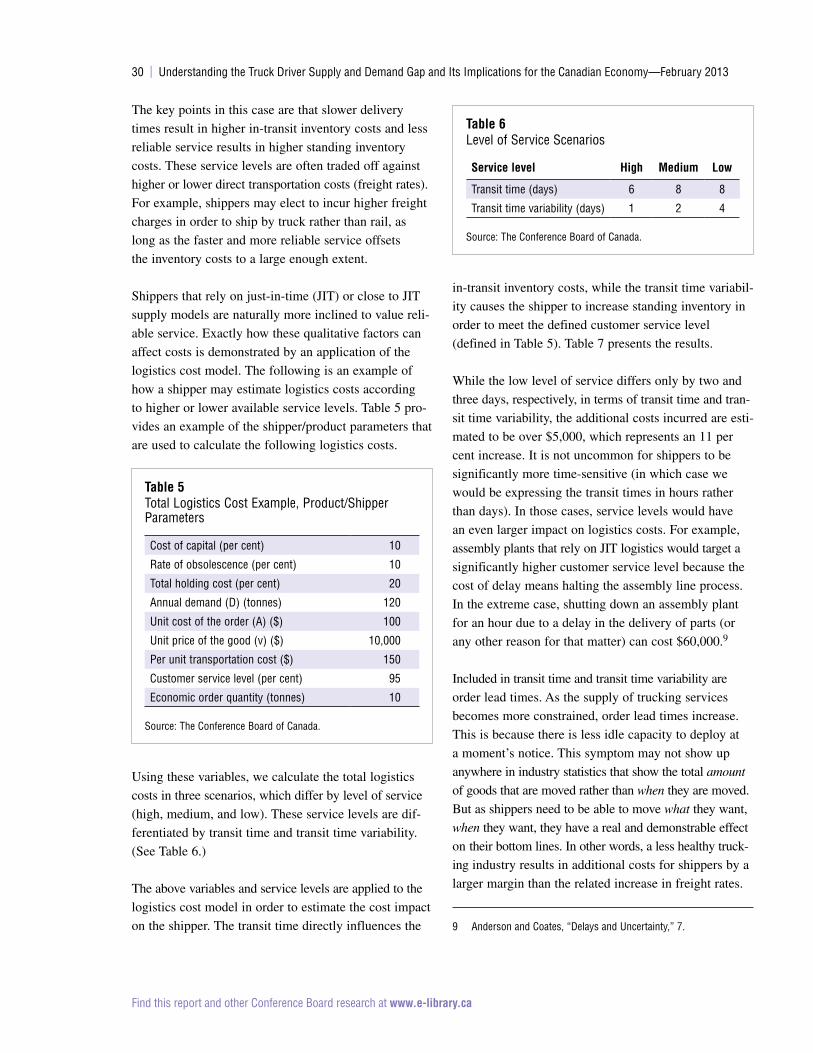
30 | Understanding the Truck Driver Supply and Demand Gap and Its Implications for the Canadian Economy—February 2013
Find this report and other Conference Board research at www.e-library.ca
The key points in this case are that slower delivery
times result in higher in-transit inventory costs and less
reliable service results in higher standing inventory
costs. These service levels are often traded off against
higher or lower direct transportation costs (freight rates).
For example, shippers may elect to incur higher freight
charges in order to ship by truck rather than rail, as
long as the faster and more reliable service offsets
the inventory costs to a large enough extent.
Shippers that rely on just-in-time (JIT) or close to JIT
supply models are naturally more inclined to value reli-
able service. Exactly how these qualitative factors can
affect costs is demonstrated by an application of the
logistics cost model. The following is an example of
how a shipper may estimate logistics costs according
to higher or lower available service levels. Table 5 pro-
vides an example of the shipper/product parameters that
are used to calculate the following logistics costs.
Using these variables, we calculate the total logistics
costs in three scenarios, which differ by level of service
(high, medium, and low). These service levels are dif-
ferentiated by transit time and transit time variability.
(See Table 6.)
The above variables and service levels are applied to the
logistics cost model in order to estimate the cost impact
on the shipper. The transit time directly influences the
in-transit inventory costs, while the transit time variabil-
ity causes the shipper to increase standing inventory in
order to meet the defined customer service level
(defined in Table 5). Table 7 presents the results.
While the low level of service differs only by two and
three days, respectively, in terms of transit time and tran-
sit time variability, the additional costs incurred are esti-
mated to be over $5,000, which represents an 11 per
cent increase. It is not uncommon for shippers to be
significantly more time-sensitive (in which case we
would be expressing the transit times in hours rather
than days). In those cases, service levels would have
an even larger impact on logistics costs. For example,
assembly plants that rely on JIT logistics would target a
significantly higher customer service level because the
cost of delay means halting the assembly line process.
In the extreme case, shutting down an assembly plant
for an hour due to a delay in the delivery of parts (or
any other reason for that matter) can cost $60,000.9
Included in transit time and transit time variability are
order lead times. As the supply of trucking services
becomes more constrained, order lead times increase.
This is because there is less idle capacity to deploy at
a moment’s notice. This symptom may not show up
anywhere in industry statistics that show the total amount
of goods that are moved rather than when they are moved.
But as shippers need to be able to move what they want,
when they want, they have a real and demonstrable effect
on their bottom lines. In other words, a less healthy truck-
ing industry results in additional costs for shippers by a
larger margin than the related increase in freight rates.
9 Anderson and Coates, “Delays and Uncertainty,” 7.
table 5 Total Logistics Cost Example, Product/Shipper Parameters
Cost of capital (per cent) 10
Rate of obsolescence (per cent) 10
Total holding cost (per cent) 20
Annual demand (D) (tonnes) 120
Unit cost of the order (A) ($) 100
Unit price of the good (v) ($) 10,000
Per unit transportation cost ($) 150
Customer service level (per cent) 95
Economic order quantity (tonnes) 10
Source: The Conference Board of Canada.
table 6Level of Service Scenarios
service level high medium low
Transit time (days) 6 8 8
Transit time variability (days) 1 2 4
Source: The Conference Board of Canada.
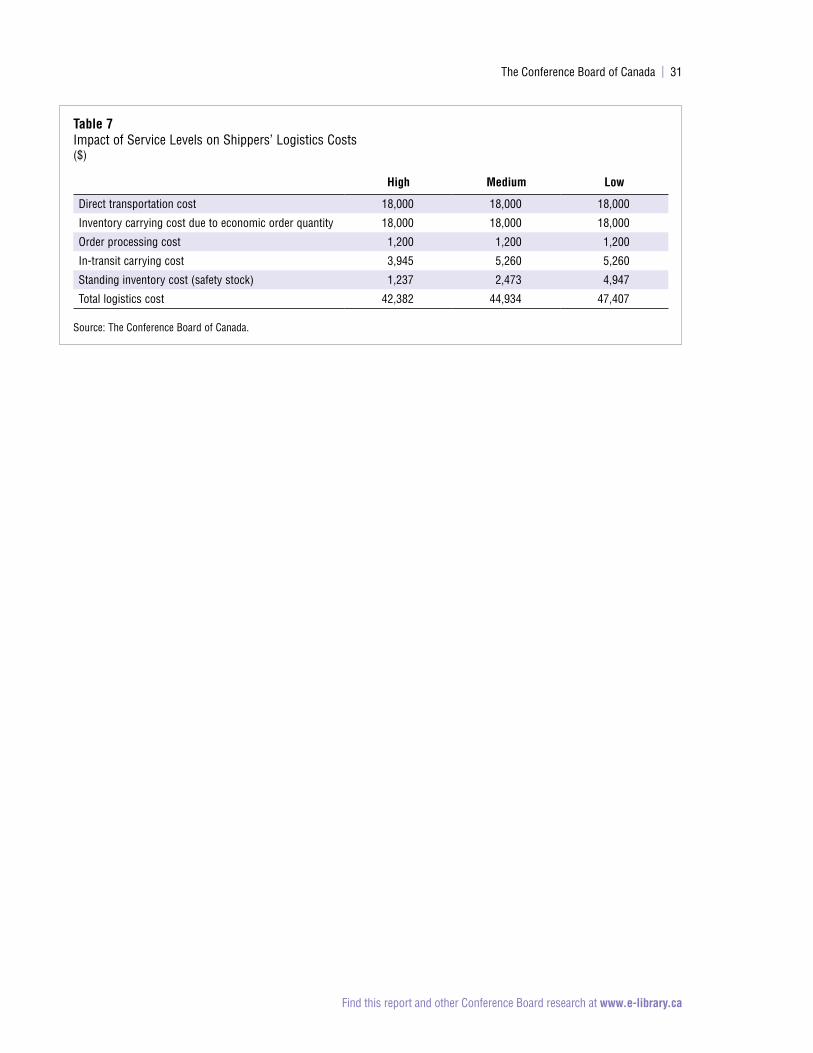
The Conference Board of Canada | 31
Find this report and other Conference Board research at www.e-library.ca
table 7Impact of Service Levels on Shippers’ Logistics Costs($)
high medium low
Direct transportation cost 18,000 18,000 18,000
Inventory carrying cost due to economic order quantity 18,000 18,000 18,000
Order processing cost 1,200 1,200 1,200
In-transit carrying cost 3,945 5,260 5,260
Standing inventory cost (safety stock) 1,237 2,473 4,947
Total logistics cost 42,382 44,934 47,407
Source: The Conference Board of Canada.
Find this report and other Conference Board research at www.e-library.ca
There is no doubt that employers across the
country will continue to deal with the chal-
lenge of an aging population. For the trucking
industry and for the truck driver occupation in particular,
this challenge is particularly acute. Our research shows
that the for-hire trucking industry can expect to face a
driver gap of 25,000 drivers (or about 14 per cent of the
anticipated driver population) by 2020 in a business-as-
usual scenario. This is due in large part to the tens of
thousands of drivers approaching retirement age and to
the miniscule number of young drivers who are taking
their place. While the industry’s productivity performance
has been strong in the past, it faces significant challenges
in maintaining these productivity gains in the future.
Sensitivity analysis conducted for this study suggests
that if the improvement in labour productivity is lower
during the period, the gap could exceed 33,000 drivers.
Furthermore, if we include the number of drivers required
for private trucking activity, the number could be
even larger.
At $17 billion in annual contribution to Canada’s
GDP—by far the largest of any of the freight transpor-
tation modes—the size of the for-hire trucking industry
itself is huge. But the potential implications for this go
beyond the trucking industry itself. Consumers do not
generally buy the services of the industry directly; never-
theless, the cost and efficiency of the industry have a
direct impact on the products that consumers buy—and,
ultimately, on their quality of life. While there is some
Conclusion
chaptEr 6
chapter summary � As a result of aging driver demographics and a
growing demand for trucking services, the for-hire trucking industry can expect to face a driver supply and demand gap of nearly 25,000 drivers by 2020 in a business-as-usual scenario.
� While the industry’s productivity performance has been strong in the past, it faces significant challenges in maintaining these productivity gains in the future. Sensitivity analysis con-ducted for this study suggests that if the improve-ment in labour productivity is lower, the gap could exceed 33,000 drivers.
� While this will affect the fortunes of the truck-ing industry, it will also have an impact on the ability of its customers to do business and, ultimately, consumers in the prices they pay for goods.
� Policies and strategies that will help to make the truck driving occupation more attractive and enhance the productivity of the industry could help to reduce the size of the supply/demand gap.
� It will also be important to convince customers of the need to address the situation now and to work with them in order to develop strat-egies to make the best use of drivers’ time.
The Conference Board of Canada | 33
Find this report and other Conference Board research at www.e-library.ca
potential to rearrange supply chains or shift to other
modes of transportation, lower availability and higher
prices of trucking services will mean lower availability
and higher prices for the goods that consumers buy on
a daily basis.
industry leaders believe there is an important role for government to play in developing licensing standards that recognize truck driving as a skilled occupation .
Conversely, an enhancement to the availability and effi-
ciency of the industry increases product market compe-
tition, lowers the cost for goods-producing businesses,
and lowers the prices of consumer goods. This is in part
thanks to the intensely competitive nature of the indus-
try, which forces carriers to pass on efficiency gains (or
lose business). However, this preoccupation with day-
to-day competition may also hurt the industry by pre-
venting longer-term strategic thinking that would allow
the industry (and its customers) to cope with mounting
demographic and other challenges.
While it will largely be up to the trucking industry to
address the labour challenges it faces in order to make
the industry more attractive to potential drivers, industry
leaders believe there is also an important role for gov-
ernment to play in developing policies and regulatory
frameworks in order to establish national occupational,
training, and licensing standards that recognize truck
driving as a skilled occupation. Any policy support that
enhances productivity will help to mitigate the impact
of the lack of available drivers.
It will also be important to convince customers of the
need to address the situation now and to work with them
to develop strategies that make the best use of drivers’
time. After all, the long track record that the trucking
industry has had in terms of sharing the benefit of its
own productivity gains provides a direct incentive for
customers to collaborate on these strategies.
> Tell us how we’re doing—rate this publication.
www.conferenceboard.ca/e-Library/abstract.aspx?did=5345
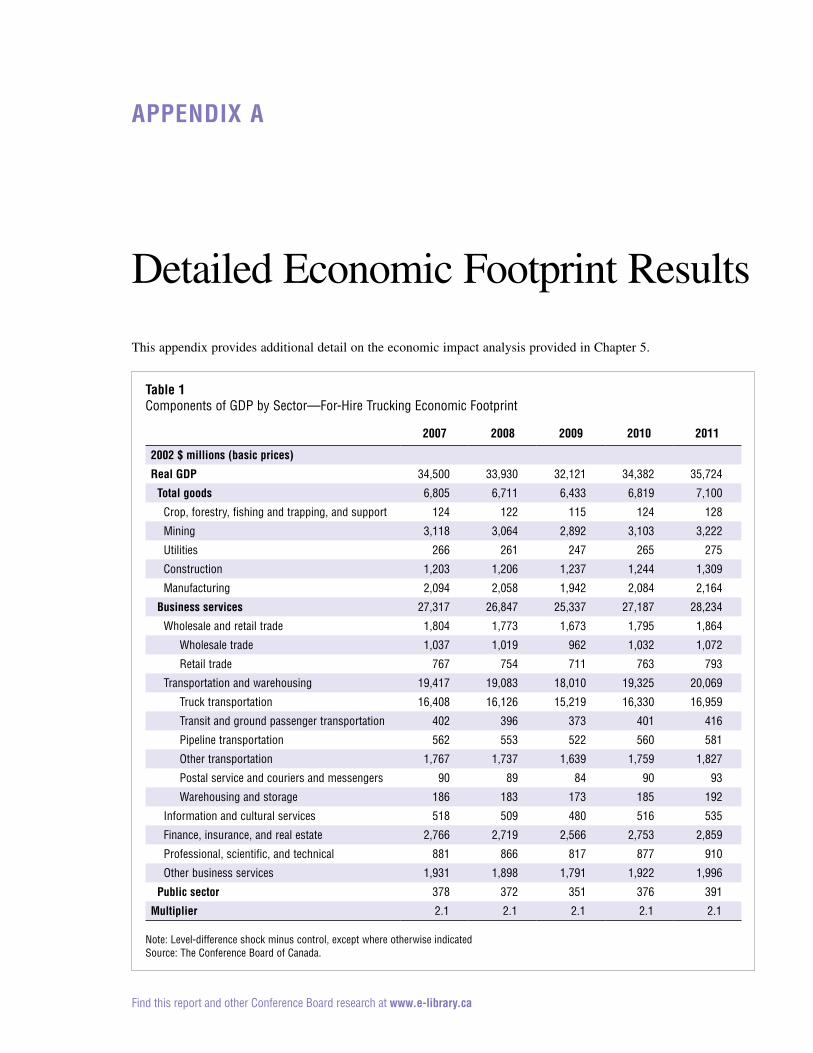
Find this report and other Conference Board research at www.e-library.ca
appEndix a
Detailed Economic Footprint Results
This appendix provides additional detail on the economic impact analysis provided in Chapter 5.
table 1Components of GDP by Sector—For-Hire Trucking Economic Footprint
2007 2008 2009 2010 2011
2002 $ millions (basic prices)
real gdp 34,500 33,930 32,121 34,382 35,724
total goods 6,805 6,711 6,433 6,819 7,100
Crop, forestry, fishing and trapping, and support 124 122 115 124 128
Mining 3,118 3,064 2,892 3,103 3,222
Utilities 266 261 247 265 275
Construction 1,203 1,206 1,237 1,244 1,309
Manufacturing 2,094 2,058 1,942 2,084 2,164
Business services 27,317 26,847 25,337 27,187 28,234
Wholesale and retail trade 1,804 1,773 1,673 1,795 1,864
Wholesale trade 1,037 1,019 962 1,032 1,072
Retail trade 767 754 711 763 793
Transportation and warehousing 19,417 19,083 18,010 19,325 20,069
Truck transportation 16,408 16,126 15,219 16,330 16,959
Transit and ground passenger transportation 402 396 373 401 416
Pipeline transportation 562 553 522 560 581
Other transportation 1,767 1,737 1,639 1,759 1,827
Postal service and couriers and messengers 90 89 84 90 93
Warehousing and storage 186 183 173 185 192
Information and cultural services 518 509 480 516 535
Finance, insurance, and real estate 2,766 2,719 2,566 2,753 2,859
Professional, scientific, and technical 881 866 817 877 910
Other business services 1,931 1,898 1,791 1,922 1,996
public sector 378 372 351 376 391
multiplier 2.1 2.1 2.1 2.1 2.1
Note: Level-difference shock minus control, except where otherwise indicated Source: The Conference Board of Canada.
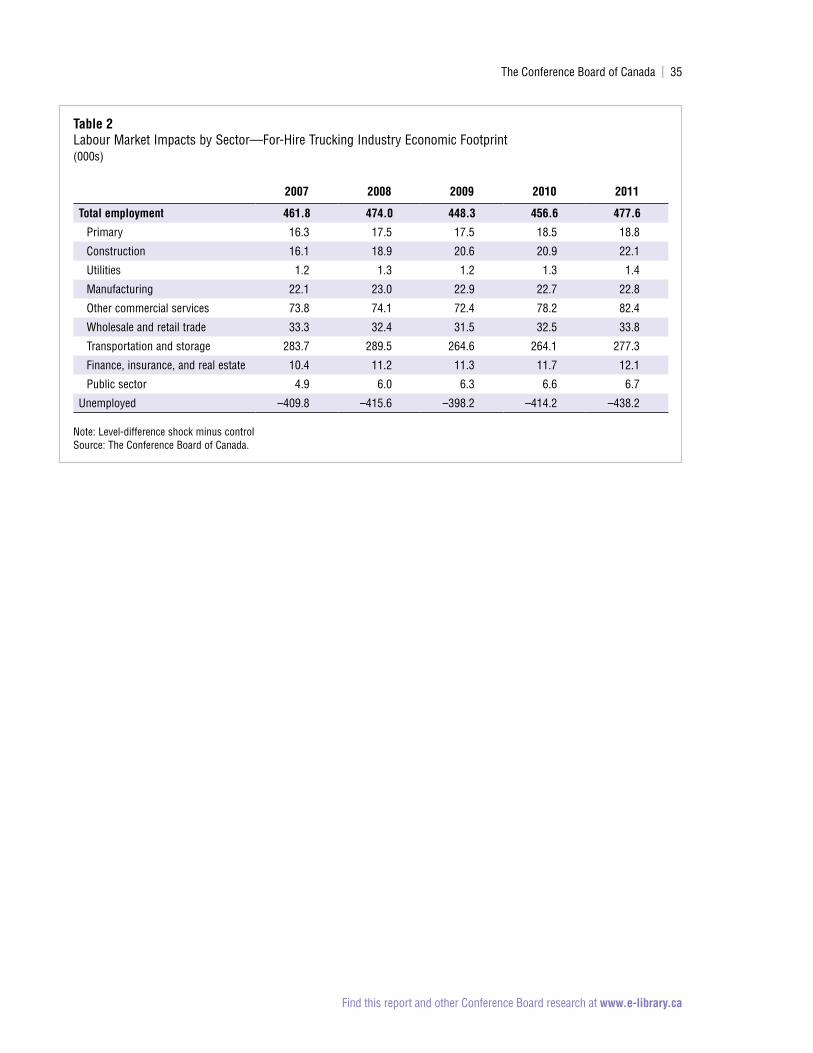
The Conference Board of Canada | 35
Find this report and other Conference Board research at www.e-library.ca
table 2Labour Market Impacts by Sector—For-Hire Trucking Industry Economic Footprint(000s)
2007 2008 2009 2010 2011
total employment 461 .8 474 .0 448 .3 456 .6 477 .6
Primary 16.3 17.5 17.5 18.5 18.8
Construction 16.1 18.9 20.6 20.9 22.1
Utilities 1.2 1.3 1.2 1.3 1.4
Manufacturing 22.1 23.0 22.9 22.7 22.8
Other commercial services 73.8 74.1 72.4 78.2 82.4
Wholesale and retail trade 33.3 32.4 31.5 32.5 33.8
Transportation and storage 283.7 289.5 264.6 264.1 277.3
Finance, insurance, and real estate 10.4 11.2 11.3 11.7 12.1
Public sector 4.9 6.0 6.3 6.6 6.7
Unemployed –409.8 –415.6 –398.2 –414.2 –438.2
Note: Level-difference shock minus control Source: The Conference Board of Canada.
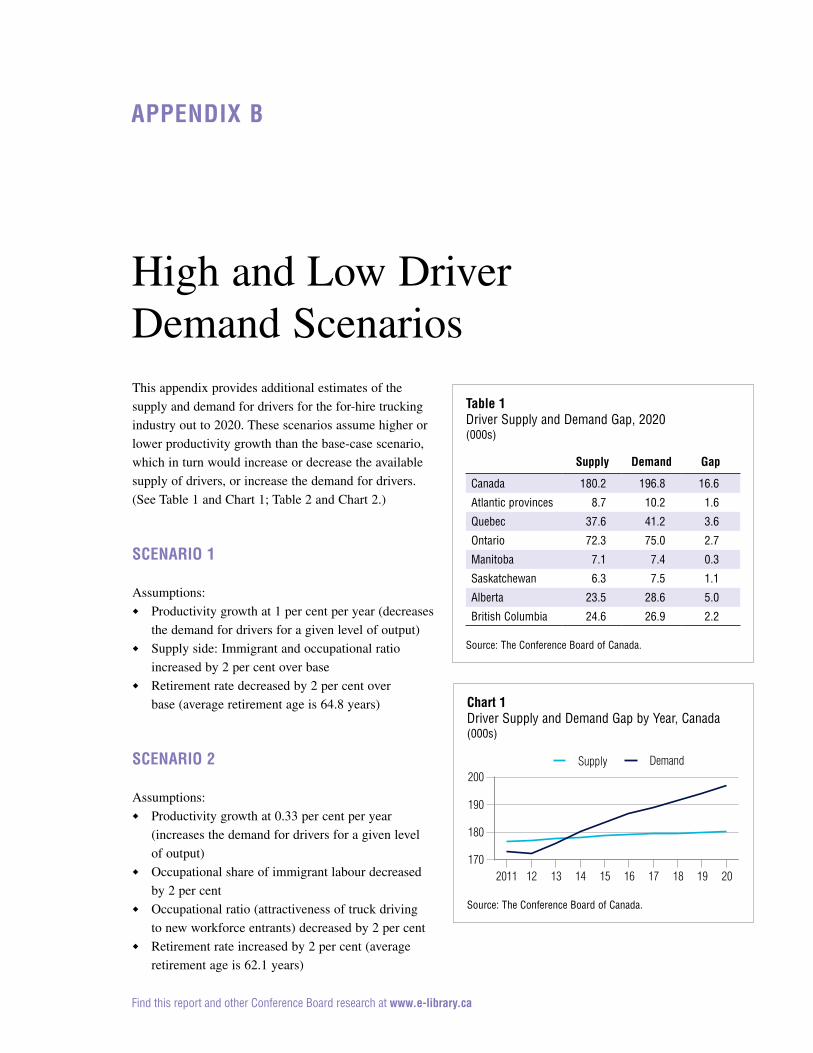
Find this report and other Conference Board research at www.e-library.ca
This appendix provides additional estimates of the
supply and demand for drivers for the for-hire trucking
industry out to 2020. These scenarios assume higher or
lower productivity growth than the base-case scenario,
which in turn would increase or decrease the available
supply of drivers, or increase the demand for drivers.
(See Table 1 and Chart 1; Table 2 and Chart 2.)
scEnario 1
Assumptions:
� Productivity growth at 1 per cent per year (decreases
the demand for drivers for a given level of output)
� Supply side: Immigrant and occupational ratio
increased by 2 per cent over base
� Retirement rate decreased by 2 per cent over
base (average retirement age is 64.8 years)
scEnario 2
Assumptions:
� Productivity growth at 0.33 per cent per year
(increases the demand for drivers for a given level
of output)
� Occupational share of immigrant labour decreased
by 2 per cent
� Occupational ratio (attractiveness of truck driving
to new workforce entrants) decreased by 2 per cent
� Retirement rate increased by 2 per cent (average
retirement age is 62.1 years)
High and Low Driver Demand Scenarios
appEndix B
table 1Driver Supply and Demand Gap, 2020(000s)
supply demand gap
Canada 180.2 196.8 16.6
Atlantic provinces 8.7 10.2 1.6
Quebec 37.6 41.2 3.6
Ontario 72.3 75.0 2.7
Manitoba 7.1 7.4 0.3
Saskatchewan 6.3 7.5 1.1
Alberta 23.5 28.6 5.0
British Columbia 24.6 26.9 2.2
Source: The Conference Board of Canada.
chart 1Driver Supply and Demand Gap by Year, Canada(000s)
Source: The Conference Board of Canada.
2011 12 13 14 15 16 17 18 19 20170
180
190
200Supply Demand
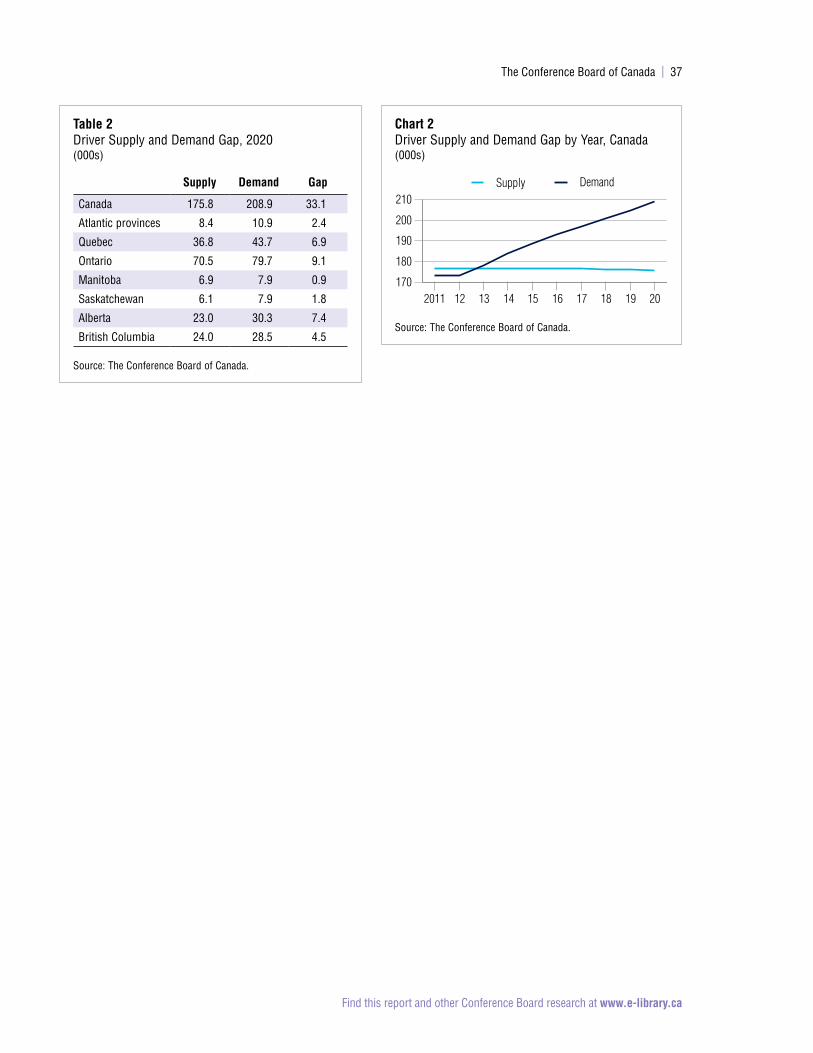
The Conference Board of Canada | 37
Find this report and other Conference Board research at www.e-library.ca
table 2Driver Supply and Demand Gap, 2020(000s)
supply demand gap
Canada 175.8 208.9 33.1
Atlantic provinces 8.4 10.9 2.4
Quebec 36.8 43.7 6.9
Ontario 70.5 79.7 9.1
Manitoba 6.9 7.9 0.9
Saskatchewan 6.1 7.9 1.8
Alberta 23.0 30.3 7.4
British Columbia 24.0 28.5 4.5
Source: The Conference Board of Canada.
chart 2Driver Supply and Demand Gap by Year, Canada(000s)
Source: The Conference Board of Canada.
2011 12 13 14 15 16 17 18 19 20170
180
190
200
210Supply Demand

Find this report and other Conference Board research at www.e-library.ca
Anderson, William P., and Andrew Coates. “Delays
and Uncertainty in Freight Movements at Canada–US
Border Crossings.” Canadian Transportation Research
Forum: Proceedings of the 45th Annual Conference.
Toronto: Canadian Transportation Research Forum,
2010. 129–43.
Archibald, Andrew, and Bjorn Rutten. Keep It Moving:
Improving the Resiliency of Global Supply Chains.
Ottawa: The Conference Board of Canada, 2010.
Baumol, W.J. and H.D. Vinod. “An Inventory Theoretic
Model of Freight Transport Demand.” Journal of
Management Science 16, no. 7 (1970): 413–21.
Calgary Logistics Council. The Accelerator Project: A
Call to Action. Calgary: Calgary Logistics Council, 2012.
Canadian Trucking Human Resources Council. Closing
the Gap: Canada’s Professional Driving Force. Ottawa:
Canadian Trucking Human Resources Council, 2006.
—. Labour Market Information. September 22, 2012.
www.cthrc.com/en/content/labour-market-information
(accessed July 10, 2012).
Chow, Garland. Labour Standard Issues in the Inter-
Provincial Canadian Trucking Industry. Ottawa: Human
Resources and Skills Development Canada, 2006.
Dubé, Vincent, and Denis Pilon. On the Road Again.
Ottawa: Statistics Canada, 2006.
Gill, Vijay, and Len Coad. Cheap Enough? Making the
Switch From Diesel Fuel to Natural Gas. Ottawa: The
Conference Board of Canada, April 2012.
Government of Canada. Working in Canada, Job
Market Report. Ottawa: Government of Canada, 2012.
www.workingincanada.gc.ca/report-eng.do?area=27278
&lang=eng&noc=7411&action=final&ln=n&s=2&sour
ce=3#outlook (accessed July 22, 2012).
—. Vision and Balance, Report of the Canada
Transportation Act Review Panel. Ottawa: Government
of Canada, 2001. http://publications.gc.ca/site/eng/
416556/publication.html (accessed June 20, 2012).
Hodgson, Glen. Slow-Motion Demographic Tsunami
About to Hit Canada’s Economy. Ottawa: The
Conference Board of Canada, July 10, 2012.
Organisation for Economic Co-operation and
Development/International Transport Forum. The Wider
Economic Benefits of Transport: Macro-, Meso- and
Micro-Economic Transport Planning and Investment
Tools / Roundtable 140. OECD, 2008.
Service Canada. Questions and Answers Regarding the
Changes to the Age Old Security Act. Ottawa: Service
Canada, 2012. www.servicecanada.gc.ca/eng/isp/oas/
changes/faq.shtml (accessed June 20, 2012).
Bibliography
appEndix c
The Conference Board of Canada | 39
Find this report and other Conference Board research at www.e-library.ca
Statistics Canada. 2006 Census of Population. Ottawa:
Statistics Canada, May 16, 2006. www12.statcan.gc.ca/
census-recensement/2006/index-eng.cfm (accessed
June 20, 2012).
—. Gross Domestic Product (GDP) at Basic Prices,
by North American Industry Classification (NAICS).
Ottawa: Statistics Canada, December 20, 2012.
www5.statcan.gc.ca/cansim/pick-choisir?lang=eng&
p2=33&id=3790027 (accessed January 18, 2013).
—. Labour Force Surveys, 1998–2011. Ottawa: Statistics
Canada, 1998–2011. www23.statcan.gc.ca/imdb/p2SV.
pl?Function=getSurvey&SDDS=3701&lang=en&db=
imdb&adm=8&dis=2 (accessed June 20, 2012).
—. North American Industry Classification System 2007,
Labour Force Survey. Ottawa: Statistics Canada, 2007.
Stephens.com. Transportation: Trucking & Less Than
Truckload. www.stephens.com/research/industries__
companies/transportation/trucking_tl_and_ltl.aspx
(accessed July 10, 2012).
Stewart, Nicole. Compensation Planning Outlook 2013.
Ottawa: The Conference Board of Canada, 2012.
The Canadian Chamber of Commerce. Canada’s
Skills Crisis: What We Heard. Ottawa: The Canadian
Chamber of Commerce, 2012.
The Conference Board of Canada. Canadian Outlook
Summer 2012. Ottawa: The Conference Board of
Canada, 2012.
—. Index of Business Confidence: Autumn 2012.
Ottawa: The Conference Board of Canada, 2012.
www.conferenceboard.ca/economics/hot_eco_topics/
default/12-07-10/slow-motion_demographic_
tsunami_about_to_hit_canada_s_economy.aspx
(accessed January 18, 2012).
Transport Canada. Statistical Addendum 2011.
Ottawa: Transport Canada, 2012. www.tc.gc.ca/eng/
policy/anre-menu-3045.htm (accessed July 15, 2012).
—. Statistical Addendum 2011, Table EC32. Ottawa:
Transport Canada, 2012. www.tc.gc.ca/eng/policy/
anre-menu-3034.htm (accessed July 15, 2012).
—. Transportation in Canada 2011. Ottawa: Transport
Canada, 2012. www.tc.gc.ca/eng/policy/anre-menu.htm
(accessed July 10, 2012).

conferenceboard.ca
Publ
icat
ion
13-2
41E-
copy
: Com
plim
enta
ry
255 Smyth Road, Ottawa ON K1H 8M7 Canada Tel. 613-526-3280 • Fax 613-526-4857 • Inquiries 1-866-711-2262
the conference Board, inc . 845 Third Avenue, New York NY 10022-6679 USA Tel. 212-759-0900 • Fax 212-980-7014 • www.conference-board.org the conference Board Europe Chaussée de La Hulpe 130, Box 11, B-1000 Brussels, Belgium Tel. +32 2 675 54 05 • Fax +32 2 675 03 95
the conference Board asia-pacific 2802 Admiralty Centre, Tower 1, 18 Harcourt Road, Admiralty Hong Kong SAR Tel. +852 2511 1630 • Fax +852 2869 1403