Embed Size (px)
Citation preview

July 2013 - CONFIDENTIAL
vo
lu
me
3
16/HIGH LEVEL GEOTECHNICAL INPUT FISHERMANS BEND DEVELOPMENT (GOLDER ASSOCIATES)
28 June 2012
FISHERMANS BEND PRECINCT
HIGH LEVEL GEOTECHNICAL INPUT FISHERMANS BEND DEVELOPMENT
COMMERCIAL IN CONFIDENCE
REP
OR
TReport Number. 127613038-003-R-Rev0Distribution:1 Copy - Places Victoria1 Copy - Golder Associates Pty Ltd
Submitted to:Places Victoria710 Collins StreetDocklands Vic 3008

Fishermans Bend - Final ReportFishermans Bend - Final Report - Background Documents
HIGH LEVEL GEOTECHNICAL INPUT FISHERMANS BEND DEVELOPMENT
28 June 2012Report No. 127613038-003-R-Rev0 i
Table of Contents
1.0 INTRODUCTION........................................................................................................................................................ 1
2.0 SCOPE OF SERVICES.............................................................................................................................................. 1
3.0 CONCEPTUAL GEOLOGICAL MODEL ................................................................................................................... 1
4.0 PRELIMINARY GROUNDWATER LEVELS.............................................................................................................. 2
5.0 GEOTECHNICAL ISSUES AND CONSTRAINTS..................................................................................................... 3
6.0 FOOTING OPTIONS.................................................................................................................................................. 4
7.0 INDICATIVE PILE FOUNDATION COSTS................................................................................................................ 6
8.0 GEOTHERMAL CONSIDERATIONS ........................................................................................................................ 7
9.0 RECOMMENDATIONS FOR FUTURE WORK ......................................................................................................... 7
10.0 LIMITATIONS ............................................................................................................................................................ 7
TABLES
Table 1 : Typical Foundation Options Zones 1 to 7Table 2 : Other Foundation Considerations Zones 1 to 7Table 3 : Indicative 2012 Precast Concrete Piling CostsTable 4 : Indicative 2012 CFA Piling CostsTable 5 : Indicative 2012 Bored Piling Costs
FIGURES
Figure 1 : Regional Geology and Cross Section LocationsFigure 2 : Cross Sections A and B from Neilson 1996Figure 3 : Cross Sections E and F from Neilson 1996Figure 4 : Preliminary Elevation Contours for the Top of Silurian (Sud)Figure 5 : Preliminary Elevation Contours for the Top of the Older Volcanics (Tov) Figure 6 : Preliminary Elevation Contours for the Base of the Moray Street Gravels (Qm)Figure 7 : Preliminary Elevation Contours for the Base of the Coode Island Silt (Qc)Figure 8 : Inferred Subsurface Stratigraphy Zones For Potential Footing OptionsFigure 9 : Typical Foundation Options Zones 1 to 7
APPENDICES APPENDIX A Rules of Thumb to Estimate Approximate Piling Requirements
APPENDIX B Additional Information on Energy Piles
APPENDIX C Limitations

July 2013 - CONFIDENTIAL
vo
lu
me
3
HIGH LEVEL GEOTECHNICAL INPUT FISHERMANS BEND DEVELOPMENT
28 June 2012Report No. 127613038-003-R-Rev0 2
Brighton Group (Tb) – dense to very dense sands and hard clays in varying proportion of fluvial and shallow marine origin.
Moray Street Gravels (Qm) – dense to very dense sands with some gravel of fluvial origin.
Fishermens Bend Silt (Qf) – firm to stiff, weathered, silty clays of marine origin.
Coode Island Silt (Qc) – soft to firm highly compressible clay or silty clay with occasional sand lenses. Organic rich and known to contain gas pockets within the unit.
Port Melbourne Sand (Qp) – loose to medium dense clean sands of marine origin.
Fill – highly variable properties which typically contains varying proportions of waste materials.
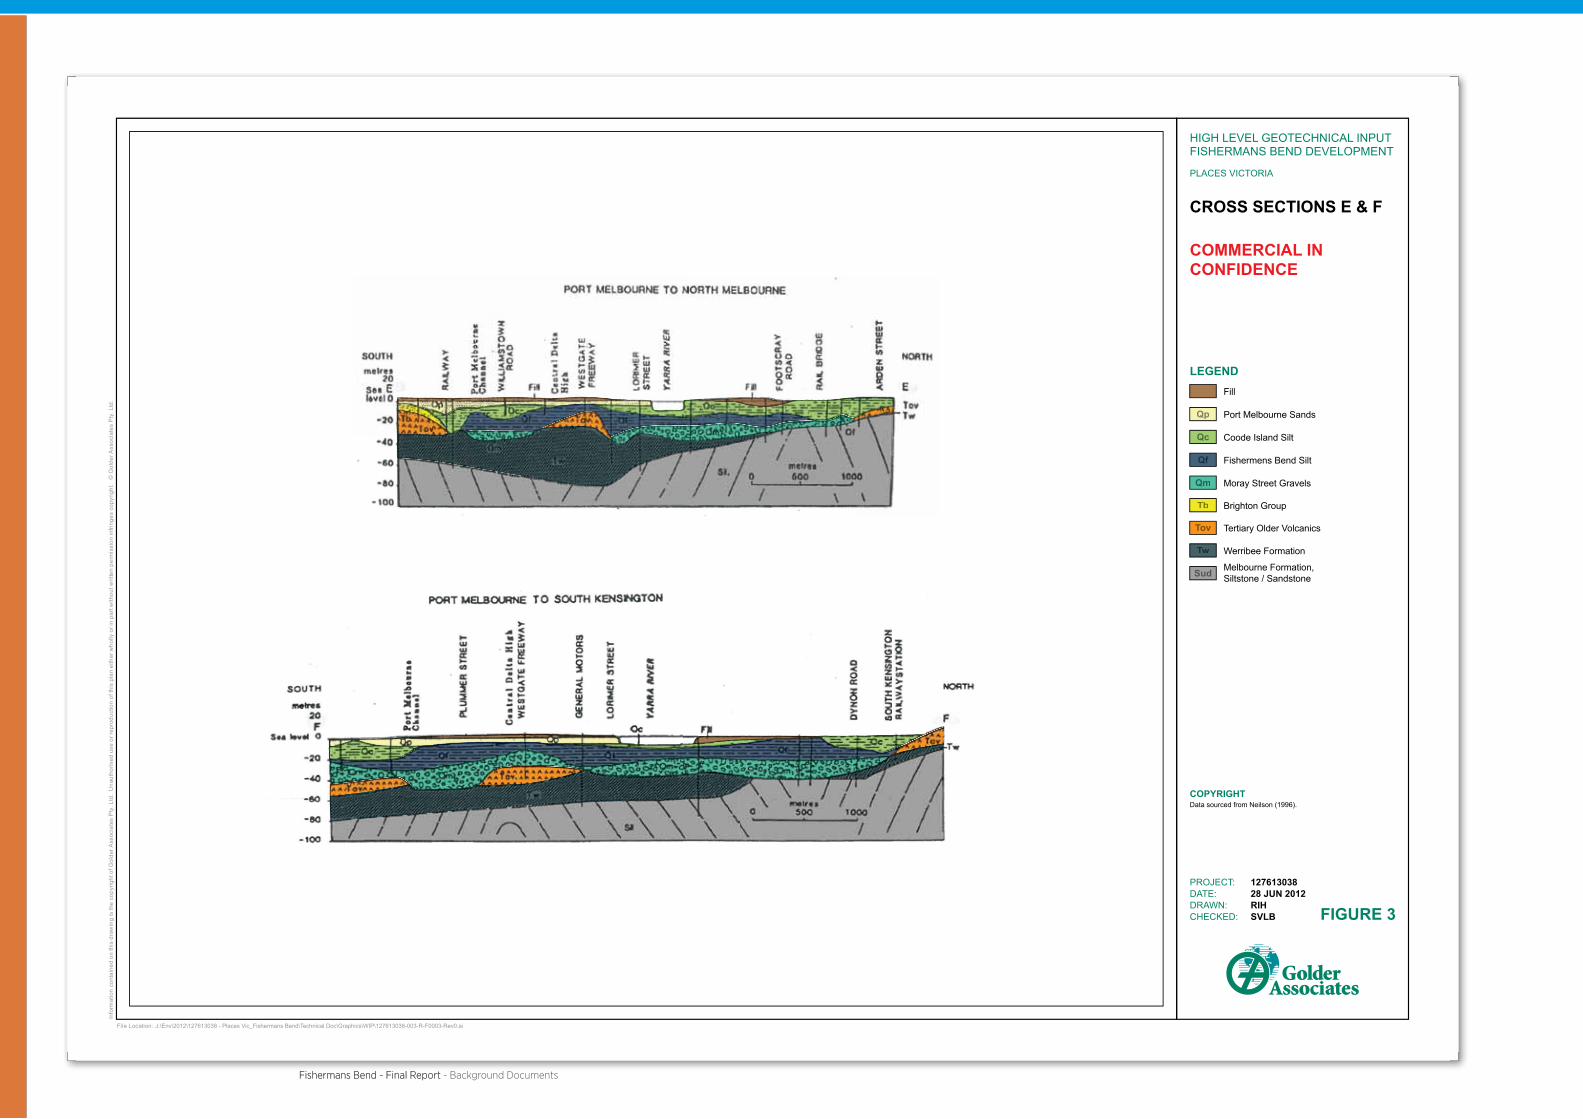
The near surface stratigraphy for each of the four precincts is anticipated to consist of the Port Melbourne Sand and Coode Island Silt as indicated on the Melbourne map sheet, capped by a layer of fill over much of the area. The surface and sub-surface distribution of the Yarra Delta deposits beneath the fill is anticipated to be variable and relatively complex over the Study Area. Neilson (1996) has attempted to map each of these units using historical borehole information, as outcrops of these units are limited. The Silurian aged Melbourne Formation forms the bedrock beneath each of the four precincts. Relevant sections from this paper are reproduced as Figures 2 and 3, with the section locations shown in plan on Figure 1.
The ancient landscape on which the Yarra Delta Group was deposited had considerable influence on the distribution of the oldest formation of the group (the Moray Street Gravels), which is confined to the lower levels of this landscape and is thickest where depressions in the landscape were the deepest. The thicknesses of the overlying units (the Fishermens Bend Silt and Coode Island Silt) were also subsequently influenced by this buried topography. Fill thicknesses throughout the four precincts is anticipated to be highly variable but typically will range from 0.5 m to 2.0 m. In areas where historical sand quarries and landfills have been in-filled, the depth of fill however could be considerably greater.
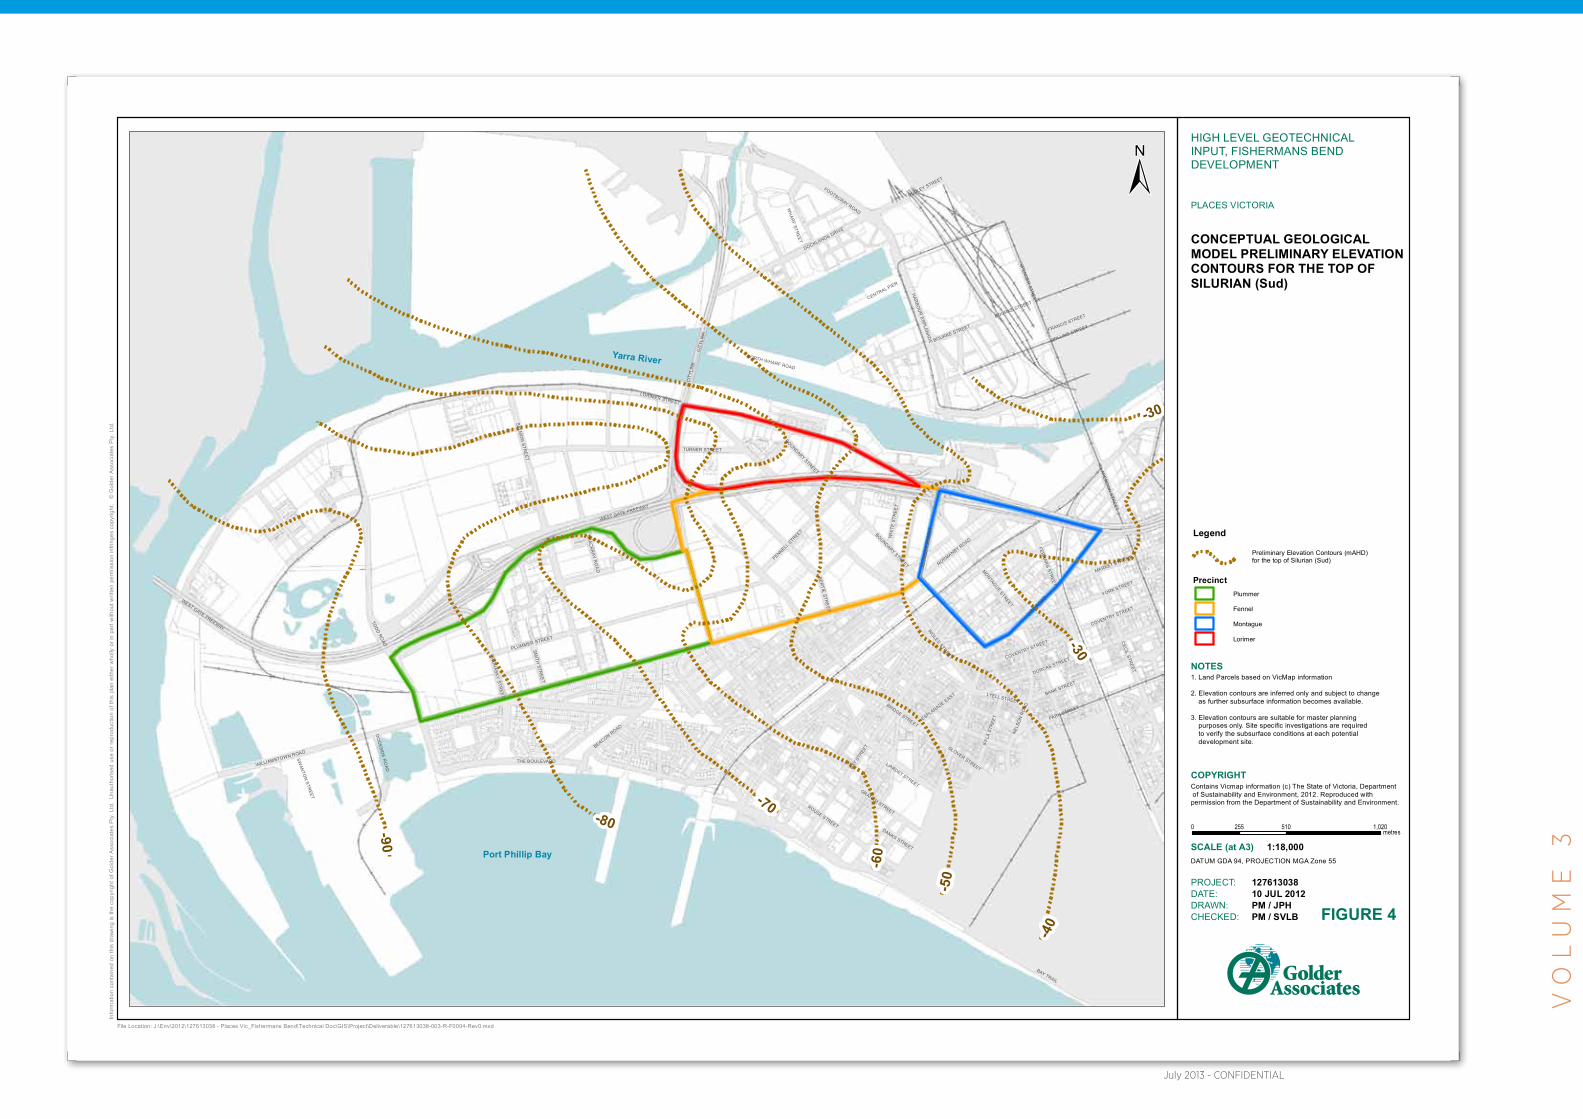
Preliminary contour maps for the top of the Silurian and Tertiary Older Volcanics, as well as the base of the Coode Island Silt and Moray Street Gravels are provided in Figures 4, 5, 6 and 7. These maps are based on a review of existing geological maps, published papers and geotechnical reports in Golder Associates project archives to develop the contours. Because of the variability of the data quality and density across the study area, these contour maps should be considered as preliminary and suitable for master planning purposes only. Going forward, a phased series of geotechnical investigations should be undertaken to refine these maps and start developing more detailed geological models within each precinct as the overall development strategy become clearer.
4.0 PRELIMINARY GROUNDWATER LEVELSA preliminary review of groundwater levels was completed as part of the Preliminary Land Contamination Study for the Fishermans Bend Development (Golder Ref: 127613038-002-R-RevA). This review was basedon publically available Statutory Environmental Audit reports within and adjacent to the study area, which indicated that groundwater levels generally range from 1 m to 3 m below ground level (mbgl) across the four precincts.
To build upon this work and assess if it would be possible to develop a preliminary contour map of ground water levels across the four precincts further searches of Golder Associates project archives have been undertaken. Based on the limited amount of groundwater measurements from 2011 which has been found for the Port Melbourne aquifer it appears that the near surface groundwater levels across the four precincts are relatively consistent and generally range from elevation RL 0 m AHD to -1 m AHD. However, based on this search there is insufficient information at present to produce a more detailed contour map indicating current groundwater levels and potential flow directions in each precinct.
It should also be noted that groundwater levels near surface can vary with time and in this area are likely influenced by changes in rainfall infiltration levels, tidal variations and local building and infrastructure developments. It is also possible that perched water tables may exist locally within the fill materials. To
HIGH LEVEL GEOTECHNICAL INPUT FISHERMANS BEND DEVELOPMENT
28 June 2012Report No. 127613038-003-R-Rev0 1
1.0 INTRODUCTIONGolder Associates Pty Ltd (Golder Associates) has been commissioned by Places Victoria to provide high level geotechnical input to support the master planning process for the proposed Fishermans Bend Development. The Fishermans Bend site is approximately 240 hectares and has been sub-divided into four precincts (Plummer, Fennel, Montague and Lorimer) for preliminary planning purposes. Historically the area has been occupied by heavy industry and it is proposed to redevelop the land over time into a mixed-use development.
2.0 SCOPE OF SERVICESTo facilitate the master planning process, Places Victoria has requested the following work be undertaken to assist with assessing the geotechnical issues and constraints which will be associated with developing the four precincts:
Prepare a series of preliminary geotechnical overlay maps which show the approximate depth to the base of the Coode Island Silt and Moray Street Gravels and top of Older Vocanics and Silurian aged Siltstone and Sandstone as an input to assist in understanding potential piling depths across the four precincts;
Provide a preliminary contour map showing the approximate depth to the water table across the four precincts and indicate potential ground water flow directions;
Develop a colour coded map which indicates the different foundation solutions that may apply in each precinct for a range of development types (1 to 3, 5 to 8, 8 to 12, 15 to 18 and 30+ stories); and
Provide an indicative pile foundation cost per square metre of floor area that may apply to the above building height ranges.
This report summarises the work which has been undertaken in each of these areas and provides recommendations for future geotechnical work to be undertaken as the master planning process develops.The geotechnical information provided is based on a desktop assessment, and as such, should be considered to be preliminary in nature and used for master planning purposes only.
The scope of work was set out in our proposal to Places Victoria dated 20 April 2012 (Golder Ref: P27613059 002 L Rev0). Written authorisation to proceed was provided by Places Victoria in an email from Geoff Ward to Stephen Barrett dated 1 May 2012.
3.0 CONCEPTUAL GEOLOGICAL MODELThe four precincts are situated within the Yarra Delta in an area of Quaternary aged (< 2 million years old) sedimentation at the head of Port Phillip Bay. The Yarra Delta consists of several flat lying geological formations, which were formed at the mouth of the Yarra River and together are known as the Yarra Delta Group. The Yarra Delta Group rests on a south-westerly dipping erosion surface which has been cut into the Tertiary and Silurian aged formations which underlie the area. This ancient landscape consisted of an irregular basin of valleys and hills, which was cut by the ancestral Yarra-Maribyrnong river system when sea levels were considerably lower than present (Neilson, 1996).
A review of the Melbourne 1:63,360 geological map (Figure 1) and accompanying sections published by the Geological Survey of Victoria (GSV, 1974) indicates the four proposed development precincts are underlain by the following geological units from oldest to youngest:
Melbourne Formation (Sud) – Siltstone interbedded with Sandstone.
Werribee Formation (Tw) – dense sand and hard clay in varying proportion of fluvial origin.
Older Volcanics (Tov) – typically weathered, closely jointed basalt flows interbedded with pyroclastic deposits such as tuffs.

Fishermans Bend - Final ReportFishermans Bend - Final Report - Background Documents
HIGH LEVEL GEOTECHNICAL INPUT FISHERMANS BEND DEVELOPMENT
28 June 2012Report No. 127613038-003-R-Rev0 4
6.0 FOOTING OPTIONSThe footing solution for a particular structure will depend on the type of structure, the loads imposed on the footings by the structure, the subsurface ground conditions and the allowable total and differential settlements for the structure. Footing solutions that have been historically utilised in this area of Melbourne or within the Docklands area with similar subsurface stratigraphy include:
Shallow footings founding in Port Melbourne Sand for low rise (1 or 2 level), settlement tolerant structures;
Driven timber piles for settlement tolerant structures (including low rise and port facilities);
Driven square precast concrete piles (250 mm, 350 mm and 400 mm) founding in the Moray Street Gravels, Tertiary age Older Volcanics, Werribee Formation or Melbourne Formation for non-settlement tolerant structures (including low rise), podium structures, seawalls and high rise structures;
Continuous Flight Auger (CFA) piles (600 mm, 750 mm, 900 mm, 1200 mm diameter) founding in the Tertiary Tertiary Older Volcanics or Melbourne Formation for high rise structures;
Large diameter bored piles (1000 mm to 1800 mm diameter) founding in the Tertiary age OlderVolcanics or Melbourne Formation for high rise structures and bridges;
Driven steel tubes or H-piles founding in Werribee Formation or Melbourne Formation for bridges and high rise structures.
In general, piles will be required to penetrate through any Coode Island Silt or Fishermens Bend Silt to more competent underlying units (founding stratum) such as the Moray Street Gravel, Tertiary age Older Volcanics, Werribee Formations and Melbourne Formation. The required penetration of piles into the founding stratum will depend on pile size and load and the properties and thickness of the founding stratum.
We have used the contour maps of inferred subsurface stratigraphy shown in Figures 4, 5, 6 and 7 to subdivide the proposed development area into seven different zones (Zone 1 to Zone 7) as shown in Figure 8. Each of these zones has a different inferred subsurface stratigraphy and therefore will require different footing solutions. The boundaries for each zone are preliminary and indicative only. Potentialfooting solutions at locations near zone boundaries should consider the preliminary footing recommendations for both zones.
The designated zones, corresponding inferred subsurface stratigraphy and potential footing solutions for a range of development options are set out below and in further detail in Table 1. A generic cross-section showing the types and potential founding level of the various footing options are shown in Figure 9.
Zone 1: The inferred subsurface stratigraphy in Zone 1 is differentiated from Zones 2 to 6 due to the absence of Coode Island Silt, making shallow footings a potential solution for most low level structures (in areas where uncontrolled fill is relatively thin). The inferred subsurface stratigraphy typically comprises a thin layer of uncontrolled fill overlying Port Melbourne Sand, over Fishermens Bend Silt, over Moray Street Gravels and/or Tertiary age Older Volcanics, over Werribbee Formation and then Melbourne Formation.
In the old sand quarry areas identified in the contaminated land assessment (Golder Report: 127613038-002-R-Rev0), the Port Melbourne Sand has been excavated and likely replaced by waste and uncontrolled fill. We recommend against the use of shallow footings founding in deep uncontrolled fill and hence for those areas where the Port Melbourne Sand has been excavated, piles may be required. Steel screw piles founding in the Fishermens Bend Silt may be an option for low rise buildings in these circumstances.
Medium to high rise structures will require piled footings. Driven precast concrete piles may typically found in the top 5 m or thereabouts of the Moray Street Gravels or Tertiary age Older Volcanics at a
HIGH LEVEL GEOTECHNICAL INPUT FISHERMANS BEND DEVELOPMENT
28 June 2012Report No. 127613038-003-R-Rev0 3
develop a preliminary contour map which would be sufficiently detailed to assess groundwater flow directions, it would therefore be necessary to install a network of groundwater monitoring wells within each precinct and monitor the groundwater levels within them over time. The range of groundwater levels indicated above confirm that high groundwater levels should be anticipated across the study area.
5.0 GEOTECHNICAL ISSUES AND CONSTRAINTSBased on our understanding of the geology of the study area, the key geotechnical issues and constraints which will need to be considered in the master planning process are as follows:
The variable strength, quality and thickness of the fill soils in the four precincts.
The weak nature of the near surface soils in the four precincts.
The considerable depth to suitable founding strata for piles over much of the four precincts.
Variable levels of differential settlement caused by the ongoing secondary consolidation of the Coode Island Silt.
The design requirements for service connections to piled buildings.
Differential settlement of services and the subsequent need to allow generous falls for gravity flow structures.
The potential to trigger consolidation of the Coode Island Silt if the groundwater table is lowered during the construction of basement excavations or deep utility trenches.
The potential for gas (methane and hydrogen sulphide) to build up in basement excavations within the Coode Island Silt.
Given the above constraints, suitable foundation solutions for the proposed mixed use developments are likely to be as follows:
Shallow spread footings or raft foundations for settlement tolerant buildings ranging in height from one to two storeys.
Piled foundations for all non-settlement tolerant structures. Note that piled foundations may be required for single or two level buildings depending on the plan dimensions of the building and a particular structure’s tolerance for differential settlement.
Constructing shallow basements for parking or avoiding basement construction by placing parkinglevels above ground.
Limiting fill placement to less than 0.5 m depth (but preferably less) unless used as a temporary surcharge for ground improvement works.
A major geotechnical risk associated with low rise structures on the Coode Island Silt is their ongoing creep settlement caused by secondary consolidation. This occurs in the absence of development and can be exacerbated by development, filling or lowering of the groundwater level. While stand alone, settlement tolerant low rise buildings of small plan dimensions such as 15 m x 15 m, supported on appropriately designed raft slabs may perform satisfactorily, this may not be the case for structures which are not settlement tolerant and/or are of larger plan dimensions. This is due to differential settlement potentially resulting in tilt and cracking of buildings, as well as breakage of services.

July 2013 - CONFIDENTIAL
vo
lu
me
3
HIGH LEVEL GEOTECHNICAL INPUT FISHERMANS BEND DEVELOPMENT
28 June 2012Report No. 127613038-003-R-Rev0 6
Zone 6: The inferred subsurface stratigraphy typically comprises a thin layer of uncontrolled fill overlying deep Coode Island Silt, over Werribee Formation and then Melbourne Formation at about 32 mbgl.
In general pile foundations will likely be required for most structures. Driven concrete precast piles founding in the Werribee Formation at a depth of about 30 mbgl is a practical piling solution for buildings up to about 30 levels. For structures higher than about 30 levels, practical piling options are provided by CFA piles or bored piles founding in the Melbourne Formation at about 40 mbgl.
Zone 7: There is very little data available for Zone 7; however based on the available information either no or only thin layers of Coode Island Silt are anticipated to be overlying relatively competent founding materials at shallow depth. The inferred subsurface stratigraphy typically comprises Port Melbourne Sand overlying Brighton Group, over Tertiary age Older Volcanics over Werribee Formation. The depth to the Melbourne Formation is not known but would be expected to be at no more than about 35 mbgl. If Coode Island Silit is not present, shallow footings founding in the Port Melbourne Sand will be suitable for buildings up to about three levels. Piled footings will likely be required for buildings taller than about three levels. Driven concrete precast piles founding in the Tertiary age Older Volcanics at about 10 mbgl is a practical piling solution for buildings up to about 30 levels. For structures higher than about 30 levels, practical piling options may be provided by CFA piles or bored piles founding in Tertiary age Older Volcanics at about15 mbgl. This will rely on the Werribee Formation being relatively dense and without a significant thickness of clay. If the Werribee Formation contains a significant thickness of clay then piles supporting structures taller than about 30 stories may need to be founded in the Melbourne Formation.
Because of the variability of the data quality and density across the study area, the zoning shown on Figure 8 should be considered as preliminary and suitable for master planning purposes only. Actual pile depths may vary in relatively small horizontal distances and will depend on the weathering profile of the rock (if encountered) and the density of the underlying soils.
Table 1 indicates the typical foundation requirements for specific building heights relevant to the seven zones described above. Other considerations such as underground services, landscaping and filling, basement construction, spoil disposal and the need for working platforms for heavy plant and equipment have also been considered and are summarised in Table 2.
7.0 INDICATIVE PILE FOUNDATION COSTSIndicative 2012 piled foundation costs for the range of building options and the expected subsurface profiles described above are presented in Tables 3 to 5. The cost of the footing is expressed as dollars per square metre of the footprint of the building. Costs are for preliminary estimate purposes only and exclude contractor mobilisation and associated costs. The cost estimates are based on a typical building layout and assumesthe following:
8 m by 8 m column layout (i.e. 64 square metres of area per level of building supported on one footing)
Approximate total load per floor of 1 tonne per square metre (10 kPa).
Floor load supported by one column of 64 tonnes (640 kN) per floor.
An example of how to estimate typical building piling requirements is also provided in Appendix A to assist with assessing site specific costs.
HIGH LEVEL GEOTECHNICAL INPUT FISHERMANS BEND DEVELOPMENT
28 June 2012Report No. 127613038-003-R-Rev0 5
depth of about 25 mbgl (metres below ground level). Larger diameter CFA piles may typically found in the Tertiary age Older Volcanics (assumed pile depth of 25 mbgl) or Werribee Formation where Tertiary age Older Volcanics is not present (assumed pile depth of 70 mbgl). The required pile penetration into the Tertiary Age Older Volcanics and Werribee Formation will depend on pile diameter and load. The Melbourne Formation is typically at a depth greater than can be achieved practically with CFA piling, and towards the limit of what can be practically achieved with bored piling.
Zone 2: The inferred subsurface stratigraphy typically comprises a thin layer of uncontrolled fill overlying deep Coode Island Silt, over Fishermens Bend Silt, Moray Street Gravels then Melbourne Formation at about 40 to 60 mbgl.
In general pile foundations will likely be required for most structures. Some low level, light weight structures of small plan area may be able to be supported on stiffened rafts founding within the fill. Driven precast concrete piles founding in the top 5 m or thereabouts of the Moray Street Gravels at depths of about 30 mbgl is a practical piling solution for buildings up to about 30 levels. For structures higher than about 30 levels practical piling options are provided by CFA piles or bored piles founding in the Melbourne Formation at about 50 to 70 mbgl (depending on depth to the siltstone). However CFA piles will be limited to a maximum depth of about 50 mbgl.
Zone 3: The inferred subsurface stratigraphy typically comprises a thin layer of uncontrolled fill overlying about 5 m of Port Melbourne Sand over deep Coode Island Silt, over Fishermens Bend Silt, Moray Street Gravels, Tertiary age Older Volcanics, Werribee Formation and then Melbourne Formation at about 80 mbgl.
In the backfilled old sand quarry areas we again recommend against the use of shallow footings, as piles will likely be required. The piles will need to penetrate the fill and Coode Island Silt and found in the Moray Street Gravels.
In general pile foundations will likely be required for most structures. Some low level, light weight structures of small plan area may be able to be supported on stiffened rafts and/or screw piles founding within the Port Melbourne Sand (if present). Driven concrete precast piles founding in the top 5 m or thereabouts of the Moray Street Gravels at a depth of about 30 mbgl is a practical piling solution for buildings up to about 30 levels. For structures higher than about 30 levels, practical piling options are provided by CFA piles or bored piles founding in the Tertiary Older Volcanics at about 50 mbgl.
Zone 4: The inferred subsurface stratigraphy and footing recommendations are similar to Zone 3 except that the depth to the shallowest competent founding layer (Moray Street Gravels) for piles is slightly deeper than in Zone 3, typically about 35 mbgl. Therefore, for buildings up to about 30 levels, driven concrete precast piles are expected to found in the Moray Street Gravels at about 35 mbgl. All other preliminary footing recommendations are the same as for Zone 3.
Zone 5: The inferred subsurface stratigraphy typically comprises a thin layer of uncontrolled fill overlying about 5 m of Coode Island Silt, over Fishermens Bend Silt, Tertiary age Older Volcanics, Werribee Formation and then Melbourne Formation at about 35 mbgl.
In general, pile foundations will likely be required for most structures. Some low level, light weight structures of small plan area may be able to be supported on stiffened rafts and/or screw piles founding within the Fishermens Bend Silt. As the Coode Island Silt is relatively thin, surcharging of the area prior to development may be a practical option for reducing settlement, in order to allow more low level buildings to be supported on shallow footings. Driven concrete precast piles founding in the Tertiary age Older Volcanics or Werribee Formation at a depth of about 25 mbgl is a practical piling solution for buildings up to about 30 levels. For structures higher than about 30 levels, practical piling options are provided by CFA piles or bored piles founding in the Melbourne Formation at about 40 mbgl.

Fishermans Bend - Final ReportFishermans Bend - Final Report - Background Documents
HIGH LEVEL GEOTECHNICAL INPUT FISHERMANS BEND DEVELOPMENT
28 June 2012Report No. 127613038-003-R-Rev0
Report Signature Page
GOLDER ASSOCIATES PTY LTD
Stephen BarrettPrincipal
SVLB/CMH/svlb
A.B.N. 64 006 107 857
Golder, Golder Associates and the GA globe design are trademarks of Golder Associates Corporation.
j:\env\2012\127613038 - places vic_fishermans bend\correspondence out\127613038-003-r-rev0\127613038-003-r-rev0.docx
HIGH LEVEL GEOTECHNICAL INPUT FISHERMANS BEND DEVELOPMENT
28 June 2012Report No. 127613038-003-R-Rev0 7
8.0 GEOTHERMAL CONSIDERATIONSThe ground at a shallow depth can provide a heat source or sink for the heating and cooling of buildings. Because the temperature of the ground is more stable than that of the air, shallow geothermal energy exchange systems can be an energy efficient alternative to conventional heating and cooling systems. Heat can be extracted from or rejected into the ground by circulating a heat transfer fluid (usually water) through a closed-loop of pipe embedded in the ground. A heat pump is typically used to efficiently transfer heat between the circulating fluid and the building to be heated or cooled.
Pipe loops can be installed in any structure that is in contact with the ground (i.e. boreholes, trenches or building foundations). When considering suitable footing options for the proposed mixed used developments, consideration should also be given to the potential to use the proposed pile foundations to extract geothermal energy. Linking the geothermal systems with the piles could result in a small additional construction cost, but result in a major benefit, through the potential to offset a significant portion of each building’s energy needs. This concept would align well with Places Victoria’s overall sustainable management objectives and provide an opportunity to showcase what can be achieved by also considering energy requirements as part of the overall master planning process. Further information on the energy pile concept is included in Appendix B in the form of a paper by one of the leading international practitioners in this area. We have also included a report in Appendix B on the Geoscience Australia building in Canberra, to provide an example of how this technology has been locally applied.
9.0 RECOMMENDATIONS FOR FUTURE WORKGoing forward it is recommended that a series of phased geotechnical investigations be conducted across each of the four precincts to provide site specific information to support the master planning process and verify and refine the geotechnical zones identified in this report. These investigations should also be planned in conjunction with the hydrogeological and environmental investigations in order to achieve maximum value from each borehole. It is suggested that the scope of work for the initial investigation be developed once further planning work has been undertaken and the potential development options and staging priorities for each precinct become clearer.
10.0 LIMITATIONSYour attention is drawn to the document “Limitations”, which is included in Appendix C of this report. The statements presented in this document are intended to advise you of what your realistic expectations of this report should be. The document is not intended to reduce the level of responsibility accepted by Golder Associates, but rather to ensure that all parties who may rely on this report are aware of the responsibilities each assumes in so doing.

July 2013 - CONFIDENTIAL
vo
lu
me
3
HIGH LEVEL GEOTECHNICAL INPUT - FISHERMANS BEND DEVELOPMENT
20 June 2012No. 127613038 003 L Rev0
TABLE 1: TYPICAL FOUNDATION OPTIONS ZONES 1 TO 7
Structure Type Typical Foundation Solution (Generic to South Melbourne)
Zone 1: No Coode Island Silt present. A thin layer of uncontrolled fill typically overlies Port Melbourne Sand, over Fishermans Bend Silt,over Moray Street Gravels and/or Tertiary Older Volcanics, over Werribee Formation and then Melbourne Formation at depths generally greater than 60 mbgl. Some areas (shown to be non hatched) of the Port Melbourne Sand are indicated to be excavated.
Zone 2: A thin layer of uncontrolled Fill typically overlies deep Coode Island Silt, over Fishermans Bend Silt, over Moray Street Gravels and then Melbourne Formation at depths of about 40 to 60 mbgl.
Zone 3: A thin layer of uncontrolled Fill typically overlies about 5 m of Port Melbourne Sand, over deep Coode Island Silt, over Fishermans Bend Silt, Moray Street Gravels, Tertiary older Volcanics, Werribee Formation and then Melbourne Formation at a depth of about 80 mbgl.
Zone 4: Similar to Zone 3 except the Moray Street Gravels are about 5 m deeper than those in Zone 3
One to two storeys (non-settlement sensitive)
Shallow footings (strips, pads and rafts) founding in Port Melbourne Sand.
Shallow stiffened rafts founding in uncontrolled fill -average bearing pressure no greater than 20 kPa. Expect immediate settlement up to 25 mm, long term creep settlement of up to 8 mm per year.
Shallow stiffened rafts founding in uncontrolled fill -average bearing pressure no greater than 20 kPa. Expect immediate settlement up to 25 mm, long term creep settlement of up to 8 mm per year.
Shallow stiffened rafts founding in uncontrolled fill -average bearing pressure no greater than 20 kPa. Expect immediate settlement up to 25 mm, long term creep settlement of up to 8 mm per year.
One to two storeys (settlement sensitive)
Shallow footings (strips, pads and rafts) founding in Port Melbourne Sand.
Rigid, detached, small plan area structures (up to about 10 m x 10 m) can be founded on stiffened rafts founding in uncontrolled fill - average bearing pressure no greater than 20 kPa. Expect immediate settlement up to 25 mm, long term creep settlement of up to 8 mm per year. Alternative, precast pile footings (founding in MSG)under columns with suspended slabs - settlement less than 10 mm - no ongoing settlement of building but surrounds continue to creep at up to 8 mm per year.
Rigid, detached, small plan area structures (up to about 10 m x 10 m) can be founded on stiffened rafts founding in uncontrolled fill - average bearing pressure no greater than 20 kPa. Expect immediate settlement up to 25 mm, long term creep settlement of up to 8 mm per year. Alternative, precast pile footings (founding in MSG)under columns with suspended slabs - settlement less than 10 mm - noongoing settlement of building but surrounds continue to creep at up to 8 mm per year.
Rigid, detached, small plan area structures (up to about 10 m x 10 m) can be founded on stiffened rafts founding in uncontrolled fill - average bearing pressure no greater than 20 kPa. Expect immediate settlement up to 25 mm, longterm creep settlement of up to 8 mm per year. Alternative, precast pile footings (founding in MSG)under columns with suspended slabs - settlement less than 10 mm - noongoing settlement of building but surrounds continue to creep at up to 8 mm per year.
Three to eighteen storeys
Driven concrete precast piles founding in Moray Street Gravels or Tertiray Older Volcanics (typical pile length 25 m), slab on ground.
Driven concrete precast piles founding in Moray Street Gravels (typical pile length 30 m), suspended slab.
Driven concrete precast piles founding in Moray Street Gravels (typical pile length 30 m), suspended slab.
Driven concrete precast piles founding in Moray Street Gravels (typical pile length 35 m), suspended slab.
30+ storeys
Larger diameter CFA piles founding in Tertiary Older Volcanics (typical pile length 25 mbgl) or bored piles founding in Werribee Formation where Tertiary Older Volcanics are not present (typical pile length 70 m bgl). The Melbourne Formation is typically at a depth greater than can be achieved with CFA and bored piling rigs.
Larger diameter CFA or bored piles founding in the Melbourne Formation (typical pile length between 50 to 70 mbgl depending on the depth to the Melbourne Formation). CFA piles will be limited to a maximum depth of about 50 mbgl.
Larger diameter CFA or bored piles founding inTertiary Older Volcanics (typical pile length 50 mbgl)
Larger diameter CFA or bored piles founding in Tertiary Older Volcanics (typical pile length 50 mbgl)

Fishermans Bend - Final ReportFishermans Bend - Final Report - Background Documents
HIGH LEVEL GEOTECHNICAL INPUT - FISHERMANS BEND DEVELOPMENT
20 June 2012No. 127613038 003 L Rev0
TABLE 1: TYPICAL FOUNDATION OPTIONS ZONES 1 TO 7 (CONTINUED)
Structure TypeTypical Foundation Solution (Generic to South Melbourne)
Zone 5: A thin layer of uncontrolled Filltypically overlies about 5 m of Coode Island Silt, over Fishermans Bend Silt, Tertiary Older Volcanics, Werribee Formation and then Melbourne Formation at a depth of about 40 mbgl.
Zone 6: A thin layer of uncontrolled Fill typically overlies deep Coode Island Silt, over Werribee Formation and then Melbourne Formation a depth of about 32 mbgl.
Zone 7: A thin layer of uncontrolled Fill typically overlies about 5 m of Port Melbourne Sand, over Brighton Group, Tertiary Older Volcanics and then Werribee Formation. The depth to Melbourne Formation is unknown but would not be expected to be more than about 35 mbgl,
One to two storeys (non-settlement sensitive)
Shallow stiffened rafts founding in uncontrolled fill – average bearing pressure no greater than 20 kPa. Expect immediate settlement up to 25 mm, long term creep settlement of up to 8 mm per year. Settlment could be reduced by surcharging.
Shallow stiffened rafts founding in uncontrolled fill -average bearing pressure no greater than 20 kPa. Expect immediate settlement up to 25 mm, long term creep settlement of up to 8 mm per year.
Shallow footings (strips, pads and rafts) founding in Port Melbourne Sand. Expect immediate settlement up to 20 mm.
One to two storeys (settlement sensitive)
Rigid, detached, small plan area structures (up to about 10 m x 10 m) can be founded on stiffened rafts founding in uncontrolled fill - average bearing pressure no greater than 20 kPa. Expect immediate settlement up to 25 mm, long term creep settlement of up to 8 mm per year. Alternative, precast pile footings (founding in MSG)under columns with suspended slabs -settlement less than 10 mm - no ongoing settlement of building but surrounds continue to creep at up to 8 mm per year. Settlement could be decreased by surcharging.
Rigid, detached, small plan area structures (up to about 10 m x 10 m) can be founded on stiffened rafts founding in uncontrolled fill - average bearing pressure no greater than 20 kPa. Expect immediate settlement up to 25 mm, long term creep settlement of up to 8 mm per year. Alternative, precast pile footings (founding in MSG)under columns with suspended slabs - settlement less than 10 mm - no ongoing settlement of building but surrounds continue to creep at up to 8 mm per year.
Shallow footings (strips, pads and rafts) founding in Port Melbourne Sand. Expect immediate settlement up to 20 mm.
Three to eighteen storeys
Driven concrete precast piles founding in Tertiary Older Volcanics or Werribee Formation (typical pile length 25 m) with suspended slabs.
Driven concrete precast piles founding in Werribee Formation (typical pile length 25 m) with suspended slabs.
Driven concrete precast piles founding in TertiaryOlder Volcanics (typical pile length 10 m) with suspended slabs.
30+ storeys Larger diameter CFA or bored piles founding the Melbourne Formation (typical pile length 40 mbgl)
Larger diameter CFA or bored piles founding in Melbourne Formation (typical pile length 40 mbgl)
Larger diameter CFA or bored piles founding in Tertiary Older Volcanics (typical pile length 15 mbgl)

July 2013 - CONFIDENTIAL
vo
lu
me
3
HIGH LEVEL GEOTECHNICAL INPUT - FISHERMANS BEND DEVELOPMENT
20 June 2012No. 127613038 003 L Rev0
TABLE 2: OTHER FOUNDATION CONDIDERATION ZONES 1 TO 7
Structure Type Typical Foundation Solution (Generic to South Melbourne)
Zone 1: No Coode Island Silt present. A thin layer of uncontrolled fill typically overlies Port Melbourne Sand, over Fishermans Bend Silt, over Moray Street Gravels and/or Tertiary Older Volcanics, over Werribee Formation and then Melbourne Formation at depths generally greater than 60 mbgl. Some areas (shown to be non hatched) of the Port Melbourne Sand are indicated to be excavated.
Zone 2: A thin layer of uncontrolled Fill typically overlies deep Coode Island Silt, over Fishermans Bend Silt, over Moray Street Gravels and then Melbourne Formation at depths of about 40 to 60 mbgl.
Zone 3: A thin layer of uncontrolled Fill typically overlies about 5 m of Port Melbourne Sand, over deep Coode Island Silt, over Fishermans Bend Silt, Moray Street Gravels, Tertiary older Volcanics, Werribee Formation and then Melbourne Formation at a depth of about 80 mbgl.
Zone 4: Similar to Zone 3 except the Moray Street Gravels are about 5 m deeper than those in Zone 3
Services No significant issues - use good practiceFor piled footings do not attach services to underside of building slab. Keep services shallow and use flexible couplings and generous grades
For piled footings do not attach services to underside of building slab. Keep services shallow and use flexible couplings and generous grades
For piled footings do not attach services to underside of building slab. Keep services shallow and use flexible couplings and generous grades
Landscaping No significant issues - use good practiceDont use straight lines, pavements will differentially settle and require maintenance. Use generous grades and run-on slabs
Dont use straight lines, pavements will differentially settle and require maintenance. Use generous grades and run-on slabs
Don’t use straight lines, pavements will differentially settle and require maintenance. Use generous grades and run-on slabs
Filling No significant issues - use good practiceMinimal generally less than 1 m. Significant immediate and creep settlement can result from addition of greater than 0.5 m to 1 m fill.
Minimal generally less than 1 m. Significant immediate and creep settlement can result from addition of greater than 0.5 m to 1 m fill.
Minimal generally less than 1 m. Significant immediate and creep settlement can result from addition of greater than 0.5 m to 1 m fill.
BasementsUp to two level basements may be practical but likely require diaphragm or secant pile walls with fully sealed basement systems if below groundwater level.
Only if sufficiently above ground water level (about RL 0 m to RL 0.5 m). Half basement may be practical.
Only if sufficiently above ground water level (about RL 0 m to RL 0.5 m). Half basement may be practical.
Only if sufficiently above ground water level (about RL 0 m to RL 0.5 m). Half basement may be practical.
Spoil (piling and excavations) Fill may be contaminated Fill may be contaminated. CIS is potentially acid
sulphate producing and requires appropriate disposalFill may be contaminated. CIS is potentially acid sulphate producing and requires appropriate disposal
Fill may be contaminated. CIS is potentially acid sulphate producing and requires appropriate disposal
Working platforms Probably not required May be required for piling rigs and cranes May be required for piling rigs and cranes May be required for piling rigs and cranes

Fishermans Bend - Final ReportFishermans Bend - Final Report - Background Documents
HIGH LEVEL GEOTECHNICAL INPUT - FISHERMANS BEND DEVELOPMENT
20 June 2012No. 127613038 003 L Rev0
TABLE 2: OTHER FOUNDATION CONDIDERATION ZONES 1 TO 7 (CONTINUED)
Structure Type Typical Foundation Solution (Generic to South Melbourne)
Zone 5: A thin layer of uncontrolled Filltypically overlies about 5 m of Coode Island Silt, over Fishermans Bend Silt, Tertiary Older Volcanics, Werribee Formation and then Melbourne Formation at a depth of about 40 mbgl.
Zone 6: A thin layer of uncontrolled Fill typically overlies deep Coode Island Silt, over Werribee Formation and then Melbourne Formation a depth of about 32 mbgl.
Zone 7: A thin layer of uncontrolled Fill typically overlies about 5 m of Port Melbourne Sand, over Brighton Group, Tertiary Older Volcanics and then Werribee Formation. The depth to Melbourne Formation is unknown but would not be expected to be more than about 35 mbgl,
ServicesFor piled footings do not attach services to underside of building slab. Keep services shallow and use flexible couplings and generous grades
For piled footings do not attach services to underside of building slab. Keep services shallow and use flexible couplings and generous grades
No significant issues - use good practice
LandscapingDont use straight lines, pavements will differentially settle and require maintenance. Use generous grades and run-on slabs
Dont use straight lines, pavements will differentially settle and require maintenance. Use generous grades and run-on slabs
No significant issues - use good practice
FillingMinimal generally less than 1 m. Significant immediate and creep settlement can result from addition of greater than 0.5 m to 1 m fill.
Minimal generally less than 1 m. Significant immediate and creep settlement can result from addition of greater than 0.5 m to 1 m fill.
No significant issues - use good practice
BasementsOnly if sufficiently above ground water level (about RL 0 m to RL 0.5 m). Half basement may be practical.
Only if sufficiently above ground water level (about RL 0 m to RL 0.5 m). Half basement may be practical.
Up to two level basements may be practical but likely require sealed basement system if below groundwater level in Port Melbourne Sand.
Spoil (piling and excavations)
Fill may be contaminated. CIS is potentially acid sulphate producing and requires appropriate disposal
Fill may be contaminated. CIS is potentially acid sulphate producing and requires appropriate disposal Fill may be contaminated
Working platforms May be required for piling rigs and cranes May be required for piling rigs and cranes Probably not required
j:\env\2012\127613038 - places vic_fishermans bend\correspondence out\127613038-003-l-reva\127613038-003-l-reva - tables 1-2.docx

July 2013 - CONFIDENTIAL
vo
lu
me
3
Table 3: Indicative 2012 Precast Concrete Piling Costs (assumes 35 m long piles - large project - excludes mobilisation)
Pile size (mm) Cost $/m SWL (Tonne) $ per Tonne
235 x 235 $120 50 $84275 x 275 $135 100 $47300 x 300 $145 140 $36350 x 350 $165 180 $32400 x 400 $185 210 $31
Table 4: Indicative 2012 CFA Piling Costs (assumes 45 m long piles - large project - excludes mobilisation)
Pile diameter (mm) Cost $/m SWL (Tonne) $ per Tonne
600 $300 280 $47750 $450 440 $47900 $650 620 $471200 $1150 1130 $47
Table 5: Indicative 2012 Bored Piling Costs (assumes 50 m long piles - large project - excludes mobilisation)
Pile diameter (mm) Cost $/m SWL (Tonne) $ per Tonne
750 $540 440 $61900 $780 620 $611200 $1380 1130 $611500 $2120 1770 $61

Fishermans Bend - Final ReportFishermans Bend - Final Report - Background Documents
Info
rmat
ion
cont
aine
d on
this
dra
win
g is
the
copy
right
of G
olde
r Ass
ocia
tes
Pty
. Ltd
. U
naut
horis
ed u
se o
r rep
rodu
ctio
n of
this
pla
n ei
ther
who
lly o
r in
part
with
out w
ritte
n pe
rmis
sion
infri
nges
cop
yrig
ht.
© G
olde
r Ass
ocia
tes
Pty
. Ltd
.
File Location: J:\Env\2012\127613038 - Places Vic_Fishermans Bend\Technical Doc\GIS\Project\Deliverable\127613038-003-R-F0001-Rev0.mxd
DATUM GDA 94, PROJECTION MGA Zone 55
1:35,000SCALE (at A3)
Geology Data copyright Geological Survey of Victoria sourced from 1:63,000 Melbourne Geology Mapsheet
COPYRIGHT
REGIONAL GEOLOGY AND CROSS SECTION LOCATIONS
PLACES VICTORIA
HIGH LEVEL GEOTECHNICALINPUT, FISHERMANS BENDDEVELOPMENT
0 750 1,500375metres
FIGURE 1
PROJECT:
CHECKED:
DATE:DRAWN:
PM / SVLBKRM10 JUL 2012127613038
A
A
EF
B
B
F
E
±
LegendNeilson Cross Section Locations
Study ZonePlummer Precinct
Fennell Precinct
Montague Precinct
Lorimer Precinct
#
#
#
#
#
#
#
#

July 2013 - CONFIDENTIAL
vo
lu
me
3
Info
rmat
ion
cont
aine
d on
this
dra
win
g is
the
copy
right
of G
olde
r Ass
ocia
tes
Pty
. Ltd
. U
naut
horis
ed u
se o
r rep
rodu
ctio
n of
this
pla
n ei
ther
who
lly o
r in
part
with
out w
ritte
n pe
rmis
sion
infri
nges
cop
yrig
ht.
© G
olde
r Ass
ocia
tes
Pty
. Ltd
.
File Location: J:\Env\2012\127613038 - Places Vic_Fishermans Bend\Technical Doc\Graphics\WIP\127613038-003-R-F0002-Rev0.ai
PROJECT:
CHECKED:
DATE:DRAWN:
SVLBRIH28 JUN 2012127613038
Data sourced from Neilson (1996).COPYRIGHT
COMMERCIAL INCONFIDENCE
CROSS SECTIONS A & B
PLACES VICTORIA
HIGH LEVEL GEOTECHNICAL INPUTFISHERMANS BEND DEVELOPMENT
FIGURE 2
Devonian GraniteDg
LEGEND
Fishermens Bend SiltQf
Fill
Coode Island SiltQc
Moray Street GravelsQm
Werribee FormationTw
Melbourne Formation,Siltstone / SandstoneSud
Tertiary Older VolcanicsTov
Unnamed Swamp and Alluvial SedimentsQs
Port Melbourne SandsQp
Tertiary Newer VolcanicsTnv
Tertiary Lorimer Street GravelsTl
Brighton GroupTb
Tertiary Newport FormationTn
Altona Coal MeasuresTac
Fishermans Bend - Final ReportFishermans Bend - Final Report - Background Documents
Info
rmat
ion
cont
aine
d on
this
dra
win
g is
the
copy
right
of G
olde
r Ass
ocia
tes
Pty
. Ltd
. U
naut
horis
ed u
se o
r rep
rodu
ctio
n of
this
pla
n ei
ther
who
lly o
r in
part
with
out w
ritte
n pe
rmis
sion
infri
nges
cop
yrig
ht.
© G
olde
r Ass
ocia
tes
Pty
. Ltd
.
File Location: J:\Env\2012\127613038 - Places Vic_Fishermans Bend\Technical Doc\Graphics\WIP\127613038-003-R-F0003-Rev0.ai
PROJECT:
CHECKED:
DATE:DRAWN:
SVLBRIH28 JUN 2012127613038
Data sourced from Neilson (1996).COPYRIGHT
COMMERCIAL INCONFIDENCE
CROSS SECTIONS E & F
PLACES VICTORIA
HIGH LEVEL GEOTECHNICAL INPUTFISHERMANS BEND DEVELOPMENT
FIGURE 3
LEGEND
Fishermens Bend SiltQf
Fill
Coode Island SiltQc
Moray Street GravelsQm
Werribee FormationTw
Melbourne Formation,Siltstone / SandstoneSud
Tertiary Older VolcanicsTov
Port Melbourne SandsQp
Brighton GroupTb
July 2013 - CONFIDENTIAL
vo
lu
me
3
Info
rmat
ion
cont
aine
d on
this
dra
win
g is
the
copy
right
of G
olde
r Ass
ocia
tes
Pty
. Ltd
. U
naut
horis
ed u
se o
r rep
rodu
ctio
n of
this
pla
n ei
ther
who
lly o
r in
part
with
out w
ritte
n pe
rmis
sion
infri
nges
cop
yrig
ht.
© G
olde
r Ass
ocia
tes
Pty
. Ltd
.
File Location: J:\Env\2012\127613038 - Places Vic_Fishermans Bend\Technical Doc\GIS\Project\Deliverable\127613038-003-R-F0004-Rev0.mxd
DATUM GDA 94, PROJECTION MGA Zone 55
1:18,000SCALE (at A3)
Contains Vicmap information (c) The State of Victoria, Department of Sustainability and Environment, 2012. Reproduced with permission from the Department of Sustainability and Environment.
COPYRIGHT
1. Land Parcels based on VicMap information
2. Elevation contours are inferred only and subject to change as further subsurface information becomes available.
3. Elevation contours are suitable for master planning purposes only. Site specific investigations are required to verify the subsurface conditions at each potential development site.
NOTES
PLACES VICTORIA
HIGH LEVEL GEOTECHNICALINPUT, FISHERMANS BENDDEVELOPMENT
0 510 1,020255metres
FIGURE 4
PROJECT:
CHECKED:
DATE:DRAWN:
PM / SVLBPM / JPH10 JUL 2012127613038
Port Phillip Bay
Yarra River
-40
-50
-90
BAY TRAIL
LORIMER STREET
WILLIAMSTOWN ROAD
WEST GATE FREEWAY
INGLES STREET
TODD RO
AD
GRAHAM STREET
BAY
STREE
T
CIT
YLIN
K
SALMO
N STR
EET
PLUMMER STREET CEC
IL STREET
TURNER STREET
COLLINS STREET
DORCAS STREET
FERR
ARS STR
EET
PARK STREET
ESPLANADE EAST
SPENC
ER STR
EET
YORK STREET
ROUSE STREET
BANK STREET
BERTIE STRE
ET
CITY ROAD
DOCKLANDS DRIVE
SMITH
STREE
T
NORMANBY ROAD
BEACON ROAD
LIARDET STREET
NORTH WHARF ROAD
DO
CKSID
E R
OAD
BRIDGE STREET
IFFL
A ST
REE
T
FOOTSCRAY ROAD
HAR
BOU
R ESPLAN
ADE
MONTAGUE STREET
THE BOULEVARD
CLAR
END
ON
STREET
MARKET STREET
NEL
SON
RO
AD
COVENTRY STREET
CENTRAL PIER
PRO
HASKY STR
EET
FENNELL S
TREET
JOH
NS
ON
STR
EE
T
BOURKE STREET
WH
ITE
STR
EE
T
LYELL STREET
DUDLEY STREET
WH
ARF STR
EET
SWAN
TON
STR
EET
FRANCIS STREET
THAC
KRAY R
OA
D
BOUNDARY STREET
DANKS STREET
GLOVER STREET
COVENTRY STREET
WEST GATE FREEWAY
CIT
YLIN
K
BOURKE STREET
BOUNDARY STREET
-60
-70-80
-30
-30
±
Legend
Preliminary Elevation Contours (mAHD) for the top of Silurian (Sud)
PrecinctPlummer
Fennel
Montague
Lorimer
CONCEPTUAL GEOLOGICALMODEL PRELIMINARY ELEVATION CONTOURS FOR THE TOP OF SILURIAN (Sud)

Fishermans Bend - Final ReportFishermans Bend - Final Report - Background Documents
Info
rmat
ion
cont
aine
d on
this
dra
win
g is
the
copy
right
of G
olde
r Ass
ocia
tes
Pty
. Ltd
. U
naut
horis
ed u
se o
r rep
rodu
ctio
n of
this
pla
n ei
ther
who
lly o
r in
part
with
out w
ritte
n pe
rmis
sion
infri
nges
cop
yrig
ht.
© G
olde
r Ass
ocia
tes
Pty
. Ltd
.
File Location: J:\Env\2012\127613038 - Places Vic_Fishermans Bend\Technical Doc\GIS\Project\Deliverable\127613038-003-R-F0005-Rev0.mxd
DATUM GDA 94, PROJECTION MGA Zone 55
1:18,000SCALE (at A3)
Contains Vicmap information (c) The State of Victoria, Department of Sustainability and Environment, 2012. Reproduced with permission from the Department of Sustainability and Environment.
COPYRIGHT
1. Land Parcels based on VicMap information
2. Elevation contours are inferred only and subject to change as further subsurface information becomes available.
3. Elevation contours are suitable for master planning purposes only. Site specific investigations are required to verify the subsurface conditions at each potential development site.
NOTES
PLACES VICTORIA
HIGH LEVEL GEOTECHNICALINPUT, FISHERMANS BENDDEVELOPMENT
0 250 500 750 1,000125metres
FIGURE 5
PROJECT:
CHECKED:
DATE:DRAWN:
PM / ELCJPH10 JUL 2012127613038
Port Phillip Bay
Yarra River
-10
-50
-30
-40
-20
BAY TRAIL
LORIMER STREET
WILLIAMSTOWN ROAD
WEST GATE FREEWAY
INGLES STREET
TODD RO
AD
GR
AHAM
STREET
BAY
STREE
T
CIT
YLIN
K
SALMO
N STR
EET
PLUMMER STREET
TURNER STREET
COLLINS STREET
FERR
ARS STR
EET
CEC
IL STREET
DORCAS STREET
ESPLANADE EAST
SPENC
ER STR
EET
PARK STREET
ROUSE STREET
YORK STREET
BANK STREET
BERTIE STRE
ET
CITY ROAD
DOCKLANDS DRIVE
SMITH
STREE
T
BEACON ROAD
LIARDET STREET
NORTH WHARF ROAD
DOCKSIDE RO
AD
BRIDGE STREET
IFFL
A ST
REE
T
HAR
BOU
R ESPLAN
ADE
MONTAGUE STREET
THE BOULEVARD
CLAR
END
ON
STREET
MARKET STREET
NEL
SON
RO
AD
FOOTSCRAY ROAD
COVENTRY STREET
CENTRAL PIER
PRO
HASKY STR
EET
FENNELL S
TREET
JOH
NS
ON
STR
EE
T
BOURKE STREET
WH
ITE
STR
EE
T
LYELL STREET
DUDLEY STREET
NORMANBY ROAD
WH
ARF STR
EET
SWAN
TON
STR
EET
FRANCIS STREET
THAC
KRAY R
OA
D
BOUNDARY STREET
DANKS STREET
GLOVER STREET
BOUNDARY STREET
CIT
YLIN
K
BOURKE STREET
WEST GATE FREEWAY COVENTRY STREET
-10-10
-10-10
-50
-20
-20
0
-30
-40
-50
-20
±
LegendPreliminary Elevation Contour (mAHD)for the top of Older Volcanics (Tov)
Potential of Older Volcanics Extent
Precinct Plummer
Fennel
Montague
Lorimer
CONCEPTUAL GEOLOGICAL MODEL PRELIMINARY ELEVATION CONTOURS FOR THE TOP OF OLDER VOLCANICS (Tov)

July 2013 - CONFIDENTIAL
vo
lu
me
3
Info
rmat
ion
cont
aine
d on
this
dra
win
g is
the
copy
right
of G
olde
r Ass
ocia
tes
Pty
. Ltd
. U
naut
horis
ed u
se o
r rep
rodu
ctio
n of
this
pla
n ei
ther
who
lly o
r in
part
with
out w
ritte
n pe
rmis
sion
infri
nges
cop
yrig
ht.
© G
olde
r Ass
ocia
tes
Pty
. Ltd
.
File Location: J:\Env\2012\127613038 - Places Vic_Fishermans Bend\Technical Doc\GIS\Project\Deliverable\127613038-003-R-F0006-Rev0.mxd
DATUM GDA 94, PROJECTION MGA Zone 55
1:18,000SCALE (at A3)
Contains Vicmap information (c) The State of Victoria, Department of Sustainability and Environment, 2012. Reproduced with permission from the Department of Sustainability and Environment.
COPYRIGHT
1. Land Parcels based on VicMap information
2. Elevation contours are inferred only and subject to change as further subsurface information becomes available.
3. Elevation contours are suitable for master planning purposes only. Site specific investigations are required to verify the subsurface conditions at each potential development site.
NOTES
PLACES VICTORIA
HIGH LEVEL GEOTECHNICALINPUT, FISHERMANS BENDDEVELOPMENT
0 250 500 750 1,000125metres
FIGURE 6
PROJECT:
CHECKED:
DATE:DRAWN:
PM / ELCJPH10 JUL 2012127613038
Port Phillip Bay
Yarra River
-50
-30
-50
BAY TRAIL
LORIMER STREET
WILLIAMSTOWN ROAD
WEST GATE FREEWAY
INGLES STREET
TODD RO
AD
GR
AHAM
STREET
BAY
STREE
T
CIT
YLIN
K
SALMO
N STR
EET
PLUMMER STREET
TURNER STREET
COLLINS STREET
FERR
ARS STR
EET
CEC
IL STREET
DORCAS STREET
ESPLANADE EAST
SPENC
ER STR
EET
PARK STREET
ROUSE STREET
YORK STREET
BANK STREET
BERTIE STRE
ET
CITY ROAD
DOCKLANDS DRIVE
SMITH
STREE
T
BEACON ROAD
LIARDET STREET
NORTH WHARF ROAD
DOCKSIDE RO
AD
BRIDGE STREET
IFFL
A ST
REE
T
HAR
BOU
R ESPLAN
ADE
MONTAGUE STREET
THE BOULEVARD
CLAR
END
ON
STREET
MARKET STREET
NEL
SON
RO
AD
FOOTSCRAY ROAD
COVENTRY STREET
CENTRAL PIER
PRO
HASKY STR
EET
FENNELL S
TREET
JOH
NS
ON
STR
EE
T
BOURKE STREET
WH
ITE
STR
EE
T
LYELL STREET
DUDLEY STREET
NORMANBY ROAD
WH
ARF STR
EET
SWAN
TON
STR
EET
FRANCIS STREET
THAC
KRAY R
OA
D
BOUNDARY STREET
DANKS STREET
GLOVER STREET
WEST GATE FREEWAY
BOUNDARY STREET
CIT
YLIN
K
COVENTRY STREET
BOURKE STREET
-30
-30-50
-40
-40
-40
±
Legend
Potential Extent of Moray Street Gravels (Qm)
Preliminary Elevation Contours (mAHD) for the base of Moray Street Gravels (Qm)
Precinct
Plummer
Fennel
Montague
Lorimer
CONCEPTUAL GEOLOGICALMODEL PRELIMINARY ELEVATION CONTOURS FOR THE BASE OF THE MORAY STREET GRAVELS (Qm)

Fishermans Bend - Final ReportFishermans Bend - Final Report - Background Documents
Info
rmat
ion
cont
aine
d on
this
dra
win
g is
the
copy
right
of G
olde
r Ass
ocia
tes
Pty
. Ltd
. U
naut
horis
ed u
se o
r rep
rodu
ctio
n of
this
pla
n ei
ther
who
lly o
r in
part
with
out w
ritte
n pe
rmis
sion
infri
nges
cop
yrig
ht.
© G
olde
r Ass
ocia
tes
Pty
. Ltd
.
File Location: J:\Env\2012\127613038 - Places Vic_Fishermans Bend\Technical Doc\GIS\Project\Deliverable\127613038-003-R-F0007-Rev0.mxd
DATUM GDA 94, PROJECTION MGA Zone 55
1:18,000SCALE (at A3)
Contains Vicmap information (c) The State of Victoria, Department of Sustainability and Environment, 2012. Reproduced with permission from the Department of Sustainability and Environment.
COPYRIGHT
1. Land Parcels based on VicMap information
2. Elevation contours and unit extent boundaries are inferred only and subject to change as further subsurface information becomes available.
3. Elevation contours are suitable for master planning purposes only. Site specific investigations are required to verify the subsurface conditions at each potential development site,
NOTES
PLACES VICTORIA
HIGH LEVEL GEOTECHNICALINPUT, FISHERMANS BENDDEVELOPMENT
0 510 1,020255metres
FIGURE 7
PROJECT:
CHECKED:
DATE:DRAWN:
SVLBPM10 JUL 2012127613038
Port Phillip Bay
Yarra River-10-20
-30
-30
-20-10
-20
-30
BAY TRAIL
LORIMER STREET
WILLIAMSTOWN ROAD
WEST GATE FREEWAY
INGLES STREET
TODD RO
AD
GRAHAM STREET
BAY
STREE
T
CIT
YLIN
K
SALMO
N STR
EET
PLUMMER STREET CEC
IL STREET
TURNER STREET
COLLINS STREET
DORCAS STREET
FERR
ARS STR
EET
PARK STREET
ESPLANADE EAST
SPENC
ER STR
EET
YORK STREET
ROUSE STREET
BANK STREET
BERTIE STRE
ET
CITY ROAD
DOCKLANDS DRIVE
SMITH
STREE
T
NORMANBY ROAD
BEACON ROAD
LIARDET STREET
NORTH WHARF ROAD
DOCKSIDE RO
AD
BRIDGE STREET
IFFL
A ST
REE
T
FOOTSCRAY ROAD
HAR
BOU
R ESPLAN
ADE
MONTAGUE STREET
THE BOULEVARD
CLAR
END
ON
STREET
MARKET STREET
NEL
SON
RO
AD
COVENTRY STREET
CENTRAL PIER
PRO
HASKY STR
EET
FENNELL S
TREET
JOH
NS
ON
STR
EE
T
BOURKE STREET
WH
ITE
STR
EE
T
LYELL STREET
DUDLEY STREET
WH
ARF STR
EET
SWAN
TON
STR
EET
FRANCIS STREET
THAC
KRAY R
OA
D
BOUNDARY STREET
DANKS STREET
GLOVER STREET
COVENTRY STREET
WEST GATE FREEWAY
CIT
YLIN
K
BOURKE STREET
BOUNDARY STREET
-20
-20
-20-10
-10
-10
-10
-30
±
Legend
Preliminary Elevation Contours (mAHD) for the base of Coode Island Silt (Qc)
Potential extentof Coode Island Silt (Qc)
PrecinctPlummer
Fennel
Montague
Lorimer
CONCEPTUAL GEOLOGICAL MODELPRELIMINARY ELEVATION CONTOURS FOR THE BASE OF COODE ISLAND SILT (QC)

July 2013 - CONFIDENTIAL
vo
lu
me
3
Info
rmat
ion
cont
aine
d on
this
dra
win
g is
the
copy
right
of G
olde
r Ass
ocia
tes
Pty
. Ltd
. U
naut
horis
ed u
se o
r rep
rodu
ctio
n of
this
pla
n ei
ther
who
lly o
r in
part
with
out w
ritte
n pe
rmis
sion
infri
nges
cop
yrig
ht.
© G
olde
r Ass
ocia
tes
Pty
. Ltd
.
File Location: J:\Env\2012\127613038 - Places Vic_Fishermans Bend\Technical Doc\GIS\Project\Deliverable\127613038-003-R-F0008-Rev0.mxd
DATUM GDA 94, PROJECTION MGA Zone 55
1:18,000SCALE (at A3)
Contains Vicmap information (c) The State of Victoria, Department of Sustainability and Environment, 2012. Reproduced with permission from the Department of Sustainability and Environment.
COPYRIGHT
1. Land Parcels based on VicMap information.NOTES
PLACES VICTORIA
HIGH LEVEL GEOTECHNICALINPUT, FISHERMANS BENDDEVELOPMENT
0 510 1,020255metres
FIGURE 8
PROJECT:
CHECKED:
DATE:DRAWN:
PM / SVLBJPH10 JUL 2012127613038
Port Phillip Bay
Yarra River
Historical Sand Quarries
Z2
Z1
Z3
Z5
Z6
Z4
Z7
Z5
Z1
BAY TRAIL
LORIMER STREET
WILLIAMSTOWN ROAD
WEST GATE FREEWAY
INGLES STREET
TOD
D R
OAD
GR
AHAM
STREET
BAY
STREE
T
BEACH STREET
CIT
YLIN
K
CAPITA
L CITY TR
AIL
NOTT
STR
EET
SALMO
N STR
EET
COOK STREET
PLUMMER STREET
CEC
IL STREET
TURNER STREET
EVANS STREET
STATION STREETROSS STREET
COLLINS STREET
DORCAS STREET
FERR
ARS STR
EET
PARK STREET
ESPLANADE EAST
SPENC
ER STR
EET
YORK STREET
ROUSE STREET
BANK STREET
DOW
STR
EET
BERTIE STREET
CITY ROAD
DOCKLANDS DRIVE
SMIT
H S
TREE
T
NORMANBY ROAD
BEACON ROAD
LIARDET STREET
DUNSTAN PARADE
WHARF ROAD
HOWE PARADE
NORTH WHARF ROAD
PRINCES STREET
RAGLAN STREET
DOCKSIDE RO
AD
BRIDGE STREET
CLARK STREET
KIN
GS
WAY
IFFL
A ST
REE
T
HEATH
STR
EET
FOOTSCRAY ROAD
ALBERT STREET
HAR
BOU
R ESPLAN
ADE
MONTAGUE STREET
LYONS
STREE
T
PEARL R
IVER R
OAD
THE BOULEVARD
SWAL
LOW
STR
EET
CLAR
END
ON
STREET
MARKET STREETMUNRO STREET
BRADY STREET
LA TROBE STREET
BARAK ROAD
VICTORIA HARBOUR PROMENADE
AURORA LANE
SABRE DRIVE
WHIT
EMAN STREET
PIC
KLES
STR
EET
HAIG S
TREET
NEL
SON
RO
AD
COVENTRY STREET
CRICHTON AVENUE
THE BEND
EDWARDS AVENUE
HAIG LA
NEBAYSID
E AVEN
UE
VILLAGE STREET
CENTRAL PIER
YARRA PROMENADE
MO
ON
EE
PO
ND
S C
RE
EK
TR
AIL
ESPLANADE WEST
HA
LL S
TR
EE
T
STOKES
STR
EET
POOLMAN STREET
BATMANS HILL DRIVE
CLAR
KE STREET
DOUGLAS STREET
WURUNDJERI WAY
JOH
NS
ON
STR
EE
T
WATER
FRO
NT W
AY
CRUIKSHAN
K STR
EET
BUTCHERS LANEDERHAM STREET
GO
VE
RN
OR
RO
AD
BOURKE STREET
WH
ITE
STR
EE
T
NAV
IGATIO
N D
RIV
E
LITT
LE B
OU
ND
ARY
STR
EET
SIDDELEY STREET
POOL STREET
RIVER ESPLANADE
DUDLEY STREET
JOHNST
ON STR
EET
WH
ARF STR
EET
STAR C
RE
SCEN
T
ALFRED STREET
GLADSTONE LANE
HORNET DRIV
E
WOOLBOARD ROAD
GELLIBRAND ROAD
WALTER STREET
CARAVEL LANE
SOUTH WHARF DRIVE
SWAN
TON
STR
EET
ADDERLEY STREET
WOODGATE STREET
ME
RC
HAN
T STREET
FRANCIS STREET
WESTSID
E AVEN
UE
ROCKLEA DRIVE
LITTLE DERHAM STREET
CANBERRA STREET
THE CRESCENT
MCCO
RMACK
STREE
T
WIRRAWAY DRIVE
BOUNDARY STREET
DOCK STREET
DRAPER STREET
LITT
LE S
WAL
LOW
STR
EET
FARRELL STREET
WOODRUFF S
TREET
MIRAGE W
AY
NORMANBY STREET
BALLANTYNE STREET
CANBE
RRA PA
RADE
HA
RT
LEY
STR
EE
T
LIND
AVENU
E
CHURCH STR
EET
PHILLIP COURT
CROCKFORD STREETGARTON STREET
CE
NTR
E A
VE
NU
E
BYRNE STREET
WEBB ROAD
PARK
SQUARE
WAR
D S
TREET
PALM
YRA
WAY
GIT
TUS
ST
RE
ET
UN
ION
STREET
MAISIE LANE
MO
RR
IS STREET
HO
THAM
STR
EET
LEGON S
TREE
T
HENDERSON STREET
CH
ARLES STR
EET
IMPO
RT LAN
E
DUKES WALK
DORCAS LANE
PYE STREET
BAUDIN LANE
FOR
D S
TRE
ET
LEVEN AVENUE
LITTLE BOURKE STREET
ANN STREET
LITTLE IFFLA STREET
AUGUSTA AVENUE
ROW
ANS
LANE
BOUNDARY STREET
PRIN
CES ST
REET
BOURKE STREET
WEST GATE FREEWAY
STOKES
STR
EET
GR
AH
AM
ST
RE
ET
CIT
YLIN
K
BRIDGE STREET
MO
NTAG
UE STR
EET
±
LegendStudy Zones
Plummer
Fennel
Montague
Lorimer
Subsurface Zones
Port Melbourne Sand Present
Zone 1
Zone 2
Zone 3
Zone 4
Zone 5
Zone 6
Zone 7
INFERRED SUBSURFACESTRATIGRAPHY ZONES FOR POTENTIAL FOOTING OPTIONS
Z1
Z2
Z3
Z4
Z5
Z6
Z7

Fishermans Bend - Final ReportFishermans Bend - Final Report - Background Documents
DRAWING TITLE
PROJECTCLIENT
SCALE
A3SHEET SIZE PROJECT No FIGURE No REVISIONDOC No DOC TYPE
DRAWN BY
CHECKED BY
DATE
DATE
Plot Date: 11 July 2012 Time:11:57:00 AM By: Triffett, Dean Path: J:\Env\2012\127613038 - Places Vic_Fishermans Bend\Technical Doc\CADD\FIGURES - File Name:127613038-003-R-F009-REV0.dwg
CG
OLD
ER A
SSO
CIA
TES
PTY.
LTD
. IN
FOR
MAT
ION
CO
NTA
INED
ON
TH
IS D
RAW
ING
IS T
HE
CO
PYR
IGH
T O
F G
OLD
ER A
SSO
CIA
TES
PTY.
LTD
. UN
AUTH
OR
ISED
USE
OR
REP
RO
DU
CTI
ON
OF
THIS
PLA
N E
ITH
ER W
HO
LLY
OR
IN P
ART
WIT
HO
UT
WR
ITTE
N P
ERM
ISSI
ON
INFR
ING
ES C
OPY
RIG
HT.
Xref: GAP_LOGO-A3.dwg;
www.golder.comGOLDER ASSOCIATES PTY. LTD.
PLACES VICTORIA FISHERMANS BEND
TYPICAL FOUNDATION OPTIONS FOR ZONES 1-7
127613038 003 R F009 0 FIGURE 9
DJT 21.06.12
DWB 21.06.12
NOT TO SCALE

July 2013 - CONFIDENTIAL
vo
lu
me
3
Rules of Thumb to Estimate Approximate Piling Requirements Typical column grid = 8 m x 8 m
Floor area supported by one column (per floor) = 8 x 8 = 64 sq m
Approximate total load per floor = 1 tonne/sq m
Floor load supported by one column = 64 x 1 = 64 tonnes per floor
Column load per 3 floors = 64 x 3 = 192 tonnes (per column)
Safe working load (SWL) for one 350 mm square precast concrete pile = 180 tonne
Therefore 1 No. 350 mm square precast pile under each column can support 3 floors
For 9 floors, the column load is approximately 576 tonnes (9 x 64) and the column could typically be supported on either:
i. 3 No. 350 mm square precast piles ii. 1 No. 900 mm diameter CFA pile
For 20 floors, the column load is approximately 1280 tonnes (20 x 64) and the column could be supported on either:
i. 7 No. 350 mm square precast piles (in a pile cap with piles at about 900 mm centres) ii. 3 No. 750 mm diameter CFA piles in a cluster (e.g. piles touching each other) or pile cap
(with piles at 1500 mm centres) iii. 5 No. 600 mm diameter CFA piles in a cluster (or pile cap with piles at 1500 mm centres) iv. 2 No. 900 mm diameter CFA piles in a cluster (or pile cap with piles at 2400 mm centres) v. 1 No. 1200 mm diameter bored pile
HIGH LEVEL GEOTECHNICAL INPUT FISHERMANS BEND DEVELOPMENT
10 July 2012Report No. 127613038-003-R-Rev0
APPENDIX ARules of Thumb to Estimate Approximate Piling Requirements

Fishermans Bend - Final ReportFishermans Bend - Final Report - Background Documents
Keynote lecture 4: Energy pile concepts
© 2009 Taylor & Francis Group, London, UK
HIGH LEVEL GEOTECHNICAL INPUT FISHERMANS BEND DEVELOPMENT
10 July 2012Report No. 127613038-003-R-Rev0
APPENDIX BAdditional Information on Energy Piles

July 2013 - CONFIDENTIAL
vo
lu
me
3
78
high groundwater level, whereby concepts combined with energy piles have proved suitable in many cases (Fig. 2).
The dominating ground-sourced elements are energy foundations, but energy tunnels, energy wells, retaining structures etc. are also used. Energy foun-dations may comprise base slabs, piles barrettes, slurry trench systems (single elements or continuous diaphragm walls), concrete columns, and grouted stone columns. Combinations with near-surface earth collectors and retaining structures are also possible. Thermo-active ground structures or wells can be used for heating and/or cooling buildings of all sizes, as well as for road pavements, bridge decks, etc.
A seasonal operation with an energy balance of heating and cooling has proved to be most economi-cal and environmentally friendly. This would also cor-respond to changing energy consumption of houses since the 1970s. According to Fig. 3 the required energy for heating has decreased significantly, but on the other hand the energy for cooling is increasing, mainly due to large glass facades and permanently closed windows of modern architecture.
Comparative investigations have disclosed that for a life-time of more than 50 years the operation costs
of houses (especially for residential and office build-ings, shopping centres) are significantly higher than the construction costs. Therefore, optimised energy concepts are of greatest importance, also with regard to environmental aspects.
2 THERMO-ACTIVE CIRCUITS FOR ENERGY FOUNDATIONS
A thermo-active system consists of the primary cir-cuit below ground and the secondary circuit in the building (Fig. 2).
The primary circuit contains closed pipework in earth-contact concrete elements (piles, barrettes, dia-phragm walls, columns, base slabs, and wells) through which a heat carrier fluid is pumped that exchanges energy from the building with the ground. The heat carrier fluid is a heat transfer medium of either water, water with antifreeze (glycol) or a saline solution. Glycol–water mixtures have proved most suitable, containing also additives to prevent corrosion in the header block, valves, the heat pump, etc. Once cast, the pipings within the underground-contact concrete elements are individually joined to a header and manifold block. They are joined by connecting pipes which, in the case of energy foundations, are nor-mally laid within the blinding beneath the base slab. The secondary circuit is a closed fluid-based build-ing heating or cooling network (secondary pipework) embedded in the floors and walls of the structure or in bridge decks, road structures, platforms, etc.
Commonly, primary and secondary circuits are connected via a heat pump that increases the tempera-ture level, typically from 10–15°C to a level between 25°C and 35°C (Fig. 4).
All that is required for this process is a low appli-cation of electrical energy for raising the originally non-usable heat resources to a higher, usable tem-perature. The principle of a heat pump is similar to
Figure 2. Cross section through an Arts Centre with geo-thermal cooling and heating: energy diaphragm walls and piled raft (with energy piles).
Figure 3. Required energy for the heating of houses in Austria. Improvements since the 1970s.
© 2009 Taylor & Francis Group, London, UK
77
Deep Foundations on Bored and Auger Piles – Van Impe & Van Impe (eds)© 2009 Taylor & Francis Group, London, ISBN 978-0-415-47556-3
Energy piles concepts
H. BrandlVienna University of Technology, Vienna, Austria
ABSTRACT: Energy foundations, especially energy piles contribute increasingly to environmental protection and provide substantial long-term cost savings and minimised maintenance. The paper deals with thermo-active circuits and design aspects of energy foundations focusing on energy piles. Theoretical aspects refer to the heat transfer between absorber fluid, pile concrete and soil. Case histories and recommendations for absorber pipe installation in energy piles bridge the gap between theory and practice. Furthermore, the benefits of energy foundations are summarised and hints for promoting geothermal energy utilisation are given, gained from 25 years of experience with thermo-active ground structures (energy piles, etc.).
1 INTRODUCTION
At the BAP III-Seminar 1998 the author delivered the Keynote lecture “Energy piles and diaphragm walls for heat transfer from and into the ground”. Dur-ing the past 10 years since then this technology has developed extremely well spreading to many coun-tries Austria has still a pioneering role as indicated in Fig. 1, showing the increase of energy piles between
1984 and 2004. Since the year 2005 more than 6000 energy piles have been installed per year resulting in a total number of presently more than 50 000 energy piles. Moreover, “Energy diaphragm walls” (slurry trench walls) have become a frequently used alterna-tive to energy piles in Austria. Numerous buildings with deep basements and metro lines, e.g. all new sta-tions of the Vienna Metro have “Energy diaphragm walls”. They dominate especially in areas with a
Figure 1. Number of energy piles installed in Austria; since 2005 more than 6000 energy piles per year.
© 2009 Taylor & Francis Group, London, UK

Fishermans Bend - Final ReportFishermans Bend - Final Report - Background Documents
80
the year, hence heating in winter (i.e. heat extraction from the ground) and cooling in summer (i.e. heat sinking/recharging into the ground). In this case low-permeability ground and groundwater with only low hydraulic gradients are favourable.
There is no limitation to the depth of piles as far as the installation of energy absorber systems is con-cerned. The energy potential increases with depth: hence deeper ground-sourced energy systems are advantageous. The economically minimum length of piles, barrettes or diaphragm wall panels is about 6 m. Energy wells should reach deeper, because they have a lower heat transfer capacity.
3 DESIGN ASPECTS OF ENERGY FOUNDATIONS
Early ecological energy planning for building can often prevent costly refurbishment and renovation in the future. High-quality energy design involves not only heating and cooling (rooms, water) but also light-ing, and it requires a multi-objective optimisation.
An optimised energetic-thermal design should also consider the seasonal heat loss from (un-)insu-lated slab-on grade floors or basement walls. Far more energy and costs are expended in running an inefficiently laid out building than in constructing an efficient one. A proper design should consider the efficiency of the overall building process, including the sustainability of all elements.
For general feasibility studies and pre-design of energy foundations the following assumptions can be made regarding the energy volume that can be extracted from thermo-active energy foundations:
• Pile foundations with piles D = 0.3 to 0.5 m: 40 to 60 W/m run
• Pile foundations with piles D � 0,6 m: 35 W/m² earth-contact area
• Diaphragm walls, pile walls (fully embedding the soil): 30 W/m² earth-contact area
• Base slabs: 10 to 30 W/m².
Dry soil makes deeper piles and a larger area of the heat exchanger necessary. Moreover, a seasonal energy balance is required.
The heat that can be extracted from or fed into/stored in the ground depends on the maximum pos-sible heat flux density in the absorber pipe system. There, the heat transport occurs by forced convection of the fluid (usually an antifreeze—water mixture). In order to optimise the absorber pipe system the follow-ing parameters have to be considered:
• Diameter and length of pipes;• Properties of pipe wall (roughness);
• Heat conductivity, specific heat capacity, den-sity and viscosity of fluid circulating in absorber pipes;
• Flow velocity and flow conditions (laminar-turbulent) within absorber pipes.
Figure 5 gives a schematic overview of the heat transport within a thermo-active system consisting of energy piles. It illustrates that the heat flux Q prim transported by heat carrier fluid in the primary circuit is given by the specific heat capacity cprim, the mass flow m prim and the temperature difference Tprim.
Complex ground properties and pile groups require numerical modelling of the geothermal heating/cool-ing system. Fig. 6 shows for example the daily mean temperatures in Vienna for the year 2001. Such data are needed to design a heating–cooling system whereby it is assumed that heating typically starts at external temperatures lower than 12 C. This provides the heating period for the unsteady numerical models. The seasonal course of the air temperature is simu-lated by a sinusoidal curve according to the following equation
T T TP
tGS m out out t= + −( )⎡⎣⎢
⎤⎦⎥, cosΔ 2π ε (3)
where TGS(t) is the ground surface temperature, t is time, Tm,out is the average yearly temperature, ΔTout is the temperature amplitude, P is the duration period, and εt is the phase displacement.
In the end, the monthly heating and cooling demands have to be compared with the available out-put, as indicated in Fig. 7.
Moreover, the seasonal course of the absorber fluid temperature (heat carrier fluid temperature) should be predicted.
Usually, a numerical simulation of the geothermal system is recommended for buildings with a heating and cooling demand of more than 50 kW. This rough value decreases to about 20 kW for buildings where rooms have to be cooled throughout the year. Geo-metric simplification may lead to significant errors in heat calculation. Therefore three-dimensional analyses should be conducted. The simulation should comprise the expected inflow and outflow tempera-tures at the energy foundations and the temperature distribution in the ground. Numerical models and computer programs should be reliably calibrated, that is on the basis of longterm measurements and expe-rience from other sites, and on physical plausibility. Otherwise wrong results may be gained, even from well-known suppliers. Experience has shown that the results are very sensitive to even small changes in the finite element mesh. Consequently, the importance of numerical simulations lies rather in parametric studies
© 2009 Taylor & Francis Group, London, UK
79
that of a reverse refrigerator. In the case of the heat pump, however, both the heat absorption in the evapo-rator and the heat emission in the condenser occur at a higher temperature, whereby the heating and not the cooling effect is utilised.
The coefficient of performance, COP, of a heat pump is a device parameter and defined by
COPenergy output after heating pump kW
energy input for operatio= [ ]
nn kW[ ] (1)
The value of COP = 4 means that from one por-tion of electrical energy and three portions of envi-ronmental energy from the ground four portions of usable energy are derived (Fig. 4).
The efficiency of a heat pump is strongly influ-enced by the difference between extracted and actu-ally used temperature. A high user temperature (inflow temperature to the heating system of the secondary circuit) and a low extraction temperature (due to insufficient return-flow temperature) in the heat exchanger (primary circuit) reduce its efficiency. For economic reasons a value of COP = 4 should be achieved. Therefore, the usable temperature in the
secondary circuit should not exceed 35–45°C, and the extraction temperature in the absorber pipes should not fall below 0–5°C. Consequently, this technology tends to be limited to low temperature heating (and cooling).
The seasonal performance factor (SPF) of a thermo-active system with a heat pump is the ratio of the usable energy output of the system to the energy input required to obtain it. Therefore SPF includes not only the heat pump but also other energy-consuming elements (e.g. circulation pumps). At present, values of SPF = 3.8–4.3 are achieved with standard electric heat pumps. Special devices with direct vaporisation increase SPF by 10–15%.
SPFu energy output of e s kWh
energy= [ ]seable the nergy ystem
iinput of e s kWh the nergy ystem [ ] (2)
If only heating or only cooling is performed, high-permeability ground and goundwater with a high hydraulic gradient are of advantage. However, the most economical and environmentally friendly is a seasonal operation with an energy balance throughout
Figure 4. Scheme of a geothermal energy plant with energy piles and an energy flux for COP = 4 of the heat pump. COP = coefficient of performance defining the heat pump efficiency.
© 2009 Taylor & Francis Group, London, UK
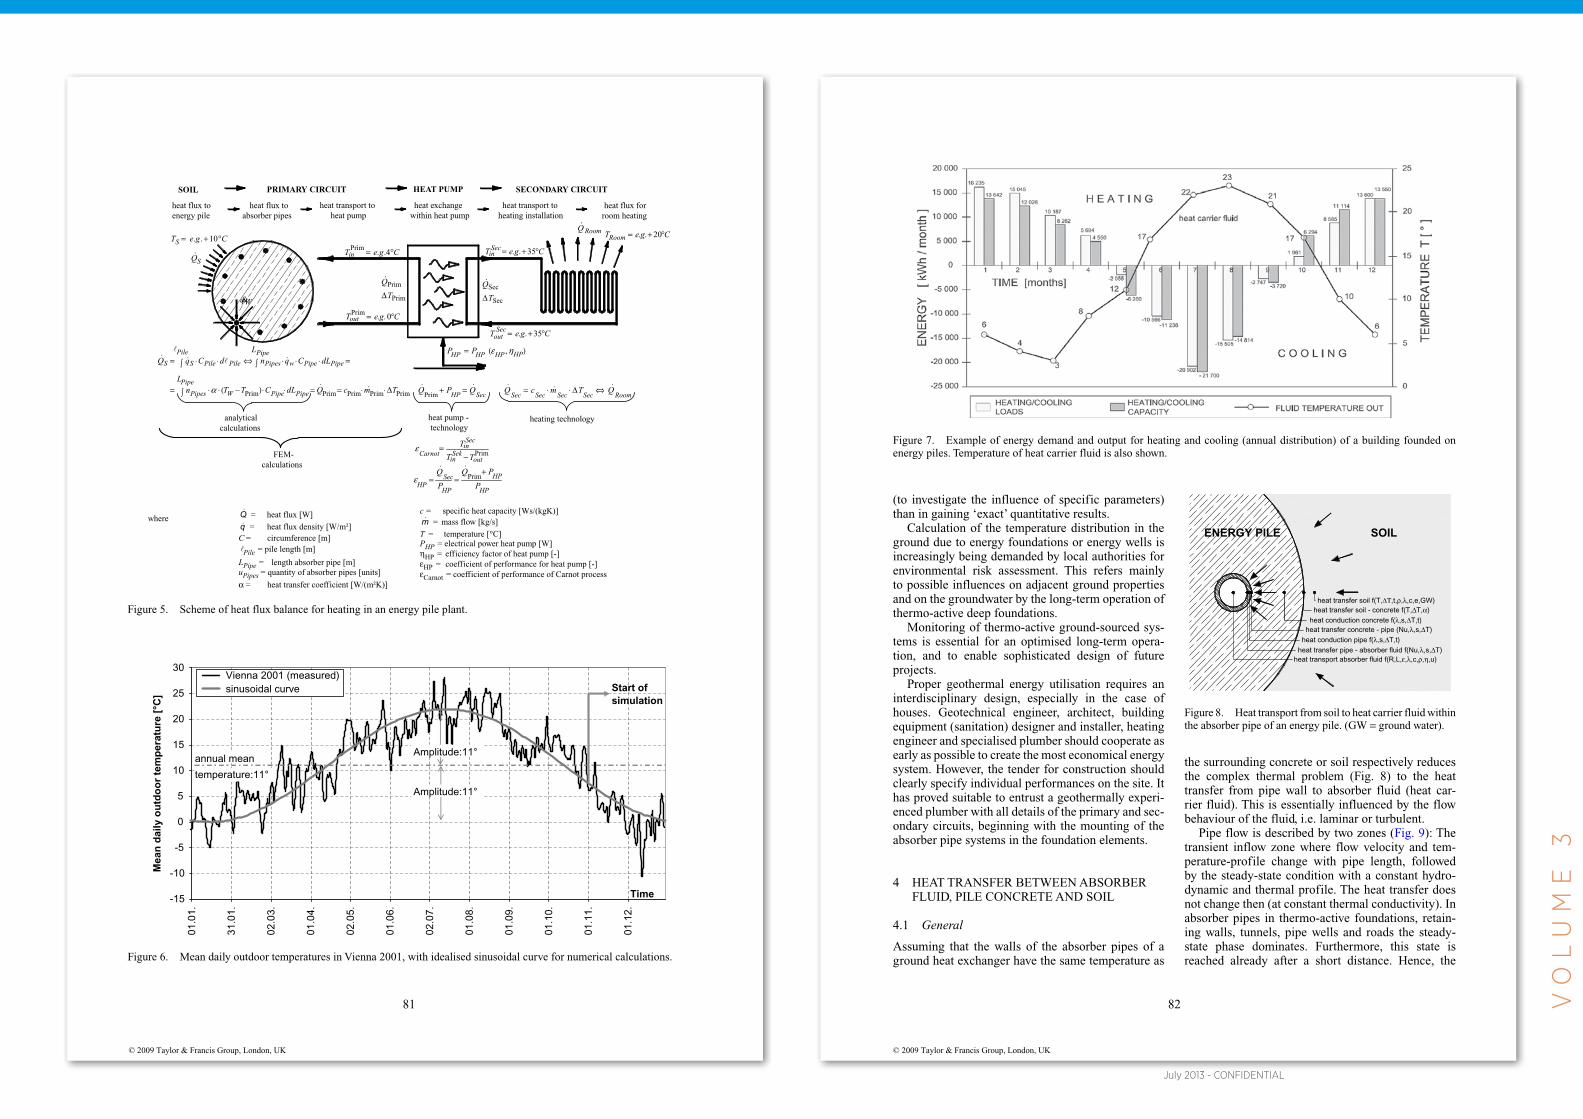
July 2013 - CONFIDENTIAL
vo
lu
me
3
82
(to investigate the influence of specific parameters) than in gaining ‘exact’ quantitative results.
Calculation of the temperature distribution in the ground due to energy foundations or energy wells is increasingly being demanded by local authorities for environmental risk assessment. This refers mainly to possible influences on adjacent ground properties and on the groundwater by the long-term operation of thermo-active deep foundations.
Monitoring of thermo-active ground-sourced sys-tems is essential for an optimised long-term opera-tion, and to enable sophisticated design of future projects.
Proper geothermal energy utilisation requires an interdisciplinary design, especially in the case of houses. Geotechnical engineer, architect, building equipment (sanitation) designer and installer, heating engineer and specialised plumber should cooperate as early as possible to create the most economical energy system. However, the tender for construction should clearly specify individual performances on the site. It has proved suitable to entrust a geothermally experi-enced plumber with all details of the primary and sec-ondary circuits, beginning with the mounting of the absorber pipe systems in the foundation elements.
4 HEAT TRANSFER BETWEEN ABSORBER FLUID, PILE CONCRETE AND SOIL
4.1 General
Assuming that the walls of the absorber pipes of a ground heat exchanger have the same temperature as
the surrounding concrete or soil respectively reduces the complex thermal problem (Fig. 8) to the heat transfer from pipe wall to absorber fluid (heat car-rier fluid). This is essentially influenced by the flow behaviour of the fluid, i.e. laminar or turbulent.
Pipe flow is described by two zones (Fig. 9): The transient inflow zone where flow velocity and tem-perature-profile change with pipe length, followed by the steady-state condition with a constant hydro-dynamic and thermal profile. The heat transfer does not change then (at constant thermal conductivity). In absorber pipes in thermo-active foundations, retain-ing walls, tunnels, pipe wells and roads the steady-state phase dominates. Furthermore, this state is reached already after a short distance. Hence, the
Figure 7. Example of energy demand and output for heating and cooling (annual distribution) of a building founded on energy piles. Temperature of heat carrier fluid is also shown.
Figure 8. Heat transport from soil to heat carrier fluid within the absorber pipe of an energy pile. (GW = ground water).
heat conduction pipe f(λ,s,ΔT,t)heat transfer pipe - absorber fluid f(Nu,λ,s,ΔT)
heat transfer soil f(T,ΔΤ,t,ρ,λ,c,e,GW)heat transfer soil - concrete f(T,ΔT,α)
ENERGY PILE
heat conduction concrete f(λ,s,ΔT,t)heat transfer concrete - pipe (Nu,λ,s,ΔT)
heat transport absorber fluid f(R,L,ε,λ,c,ρ,η,u)
SOIL
© 2009 Taylor & Francis Group, London, UK
81
Figure 5. Scheme of heat flux balance for heating in an energy pile plant.
where Q = heat flux [W]
q = heat flux density [W/m²] C = circumference [m]
Pile = pile length [m]
LPipe = length absorber pipe [m] uPipes = quantity of absorber pipes [units]
α = heat transfer coefficient [W/(m²K)]
c = specific heat capacity [Ws/(kgK)] m = mass flow [kg/s]
T = temperature [°C] PHP = electrical power heat pump [W] ηHP = efficiency factor of heat pump [-] εHP = coefficient of performance for heat pump [-] εCarnot = coefficient of performance of Carnot process
FEM-calculations
analyticalcalculations
heat pump -technology
heating technology
SECONDARY CIRCUITPRIMARY CIRCUIT HEAT PUMPSOIL
heat flux to energy pile
heat transport to heat pump
heat flux to absorber pipes
heat exchange within heat pump
heat transport to heating installation
heat flux for room heating
( ) PrimPrimPrimPrimPrim TmcQdLCTTn
dLCqndCqQ
Pipe
Pile
L
PipePipeWPipes
LPipe
PipePipewPipesPilePileSS
Δ⋅⋅==⋅⋅−⋅⋅=
=⋅⋅⋅⇔⋅⋅⋅
⋅ ⋅ ⋅ ⋅ ⋅⋅⋅
⋅
⋅
⋅ ⋅=
∫
∫∫
αSecHP
QPQ =+Prim
⋅Q
Prim
RoomSecSecSecSecQTmcQ
⋅Sec
Q
⇔Δ⋅⋅=
CgeTS = °+10..
QS
.
Prim
Prim
T
Q
Δ
.
Sec
Sec
T
Q
Δ
.
RoomQ.
Wq&
Carnot −=ε
HP
HP
HPHP P
P
P
+==ε
CgeTin °= 4..Prim
CgeTRoom °+= 20..
CgeTout °= 0..Prim
( )HPHPHPHP PP ηε ,=
CgeT Secin
T Secin
T Sekin
°+= 35..
CgeT Secout °+= 35..
ToutPrim
⋅
Figure 6. Mean daily outdoor temperatures in Vienna 2001, with idealised sinusoidal curve for numerical calculations.
-15
-10
-5
0
5
10
15
20
25
30
01.0
1.
31.0
1.
02.0
3.
01.0
4.
02.0
5.
01.0
6.
02.0
7.
01.0
8.
01.0
9.
01.1
0.
01.1
1.
01.1
2.
Mea
n d
aily
ou
tdo
or
tem
per
atu
re [
°C]
Vienna 2001 (measured)sinusoidal curve
annual mean Amplitude:11°
Start of simulation
Amplitude:11°
Time
temperature:11°
© 2009 Taylor & Francis Group, London, UK

Fishermans Bend - Final ReportFishermans Bend - Final Report - Background Documents
84
The heat transfer between pipe wall and the fluid can be described by the heat transfer coefficient α
αλ
=−
=− ∂
∂⎛⎝⎜
⎞⎠⎟�q
T T
TrT
w
wall fluid
wall
Δ (8)
and by Nusselt’s number Nu which is defined as follows:
Nud
TrTd
= =− ∂
∂⎛⎝⎜
⎞⎠⎟α
λwall
Δ (9)
Under turbulent conditions the heat transfer velocity depends not only on the self-velocity of the energy car-rier (heat carrier fluid) but also on that of the turbulent fluctuations which is connected to the average flow velocity of the absorber fluid. Consequently, the heat transfer depends also on the flow velocity, and the heat transfer coefficient α is a function of material prop-erties, geometric dimensions, length of heat transfer occurrence, and flow velocity of absorber fluid.
Calculation of the temperature gradient (∂T/∂r)wall at the pipe wall is only possible as long as equation (6) is valid in each point of the absorber fluid. But this applies only to laminar flow without friction or to motionless media. For turbulence, equation (6) is valid only for the pipe wall (according to equation (7)) but not for the interior of the flowing medium. Hitherto, no exact the-ory exists for this thermal problem; it can be solved only by equations based on experimental data (VDI, 1977).
4.3 Heat transfer by forced convection
The absorber pipes of a heat exchanger are part of a closed circuit (primary circuit in Fig. 4) where the flow is created by a pump. Therefore it is called forced convection. Commonly, the calculation is based on steady-state conditions, whereby the flow velocities should not be too low.
The flow velocity u(r) within a circuit is different at each point of a cross section. Consequently, the period t for which individual fluid particles remain within a certain absorber pipe section differs. According to equation (12) in (Brandl, 2006) one-dimensional conditions can be described by
ρ λcT
t
T
r
∂∂
= ∂∂
2
2 (10)
where þ is the densityc is the specific heat capacityλ is the thermal conductivity
of the flowing medium. The different time periods of the fluid absorber staying in particular sections are t = x/u(r) with the radial distance r according to Fig. 11. This leads to
ρ λcu rT
x r rr
T
r( )
∂∂
= ∂∂
∂∂
⎛⎝⎜
⎞⎠⎟
1 (11)
Furthermore, another dimensionless coefficient is used for parametric studies: the Prandtl number Pr as a material-dependent value which is defined as
Pr = =νλa
cνρ (12)
For Pr → 0 the velocity profile along a flow path x, where the heat is transferred, is equivalent to the pro-file of a piston flow. In the case of Pr → ∞ the velocity profile corresponds to the Hagen-Poiseulle flow (Fig. 11). Common absorber fluids exhibit a value of about
Pr = 7 clean water close to the freezing pointPr = 70 viscous fluid, such as water-glycol mix-
ture as anti-freeze medium
Commonly, the heat transfer from concrete or soil to the absorber fluid occurs at a widely constant pipe wall temperature (Tw) along the entire pipe length, if laminar flow conditions prevail. For a mean fluid temperature Tm the molecular heat transfer can be described then be equation (14) and Fig. 12 (left).
∂∂
= −−
T
x
T T
T T
dT
dxW
W m
m (13)
ρ λcu rT T
T T
dT
dx r rr
T
rW
W m
m( )−−
⎛⎝⎜
⎞⎠⎟
= ∂∂
∂∂
⎛⎝⎜
⎞⎠⎟
1 (14)
In the case of constant heat flux density q w = α (Tw – Tm) the heat transfer coefficient α is constant:
α λ=−
= ∂
∂⎛⎝⎜
⎞⎠⎟
−−
⎛⎝⎜
⎞⎠⎟
⎛
⎝
⎜⎜⎜
⎞
⎠
⎟⎟⎟
q
T T R zR
T T
T TW
W m
W
W m
wall
(15)
Figure 11. Flow velocity distribution in pipes (Hagen-Poiseuille’s parabola).
© 2009 Taylor & Francis Group, London, UK
83
following theoretical considerations are limited to the steady-state flow and heat transfer problem (Adam & Markiewicz, 2002).
Laminar flow in a pipe is based on flow paths with different velocities u and interface friction t that is proportional to the velocity gradient du/dx per-pendicular to the flow direction. The coefficient of proportionality is the viscosity η that increases with temperature. Figure 10 shows an example of a typi-cal absorber fluid for energy foundations (an anti-freeze—water mixture). For this purpose Newton’s friction law can be applied:
τ η= du
dx (4)
The mean velocity of laminar flow is umean = 0.5 umax, and for turbulent flow umean = 0.80 to 0.85 umax. The transition from laminar to turbulent flow condition is described by Reynolds’ number
Re = =ud
νν η
ρwith (5)
whereu = mean velocity [m/s]d = pipe diameter [m]υ = cinematic viscosity [m²/s]η = dynamic viscosity [kg/ms]ρ = density [kg/m³]
Below the critical Reynolds’ number Re = 2300 laminar flow occurs, and above Re > 104 full turbu-lence exists. Between these boundary values transient conditions occur. Turbulence increases the diffusive transfer of energy, impulse and mass. This effect increases with flow velocity.
4.2 Heat transfer by convection
Heat transfer through contact is based on Fourier’s law of molecular heat transport which can be written for one-dimensional problems
�qT
x= − ∂
∂⎛⎝⎜
⎞⎠⎟λ (6)
where q = heat flux density [W/m²]λ = thermal conductivity of the flowing medium
[W/(m K)]T = temperaturex = local coordinate
Heat transfer between masses not moving relative to each other occurs by conduction. Heat transfer by con-vection is based on differential movements. The latter occur between pipe wall and absorber fluid, whereby molecular heat transfer takes place at the interface:
�qT
rW = − ∂∂
⎛⎝⎜
⎞⎠⎟λ
wall
(7)
where q w is the heat flux density at the pipe wall [W/m²].
Figure 9. Flow velocity and temperature distribution in absorber pipes filled with heat carrier fluid.
Figure 10. Kinematic viscosity versus temperature for dif-ferent mixtures of water and Antifrogen L.
© 2009 Taylor & Francis Group, London, UK

July 2013 - CONFIDENTIAL
vo
lu
me
3
86
The velocity ratio u'/uc is then substituted by 12.7 ξ / ,8 which represents a suitable approach. Further sophistications are based on experimental data leading finally to a formula that also considers the length of the pipe system (Oertel, 2001):
Nu fm T,
Re Pr
, Pr
=−( )
+ −( )
ξ
ξ8
1000
1 12 78
123 (23)
with
fd
L= + ⎛
⎝⎜⎞⎠⎟1
2
3 (24)
for 0.5 < Pr < 104 and 2300 < Re <106, and for 0 < d/L < 1
Figure 14 considers laminar and turbulent flow conditions depending on the dimension-less numbers of Reynolds, Nusselt and Prandtl. When determin-ing these parameters a possible temperature depend-ence of the material properties has to be taken into account, whereby in practice only the dynamicviscos-ity is influenced by temperature changes in a relevant way. Thus the Nusselt number becomes
Nu Numm
w
=⎛⎝⎜
⎞⎠⎟
ηη
0 14,
(25)
where ηm is the dynamic viscosity at a caloric mean temperature Tm,
ηw is the dynamic viscosity at a wall temperature of Tw.
4.4 Summarising remarks
The material properties should be related to a mean temperature of Tm = (Tinflow + Treturnflow)/2 which con-siders the inflow and return flow of the absorber fluid into/from the primary circuit.
The heat transfer coefficient α depends on the pipe diameter d, the pipe length L, the flow velocity u, the viscosity η, the density ρ, and the specific heat capacity c or thermal conductivity λ respectively. For laminar flow it can be determined theoretically; turbu-lence, however, requires experimental data. The heat transfer coefficient of turbulent flow is always higher than that of laminar flow: α laminar ≤ f ( u ) whereas α turbulent = f(u3/4), if equal boundary conditions are assumed. The flow velocity is not only a criterion for the contact period but also for the intensity of a tur-bulent mixing.
The Nusselt number Nu is a valuable criterion to describe the heat transfer intensity from the absorber fluid to a particular section of the absorber pipe. But it does not describe the overall heat extraction (or storage) Q of the entire absorber system. For that vari-able the time period that an absorber fluid circulates within the heat exchanger has also to be considered.
Some guidelines for geothermal energy utilisation recommend creation of turbulent flow in the absorber pipes. However, this should not be generalised. In the case of longer heat extraction (or storage) the critical point is not the heat transfer but the quantity of heat energy economically extracted from or stored in the surrounding soil. High performance pumps, required to create turbulent conditions would therefore reduce
Figure 14. Heat transfer from absorber pipe wall to heat carrier fluid for different conditions.
© 2009 Taylor & Francis Group, London, UK
85
In this case the temperature difference Tw–Tm is also constant leading to
∂∂
= =T
x
dT
dx
dT
dxW m (16)
This finally gives a molecular heat transfer accord-ing to equation (17) and Fig. 12 (right).
ρ λcu rdT
dx r rr
T
rm( ) = ∂
∂∂∂
⎛⎝⎜
⎞⎠⎟
1 (17)
Turbulent flow conditions in the absorber pipe include a laminar zone close to the pipe wall where the local flow velocity is finally zero (Fig. 13). Equa-tion (4) is then valid only along the pipe wall but not within the core of the flux. The shear stress τw along the wall is
τ ηε
ξ ρWl
c
uu= − ′ =
82 (18)
where uc is the flow velocity in the core of the fluidu' is the flow velocity along the laminar (viscous) edge zoneξ is the coefficient of flow pressure loss within the pipe systemεl is the thickness of the laminar (viscous) edge zone.
Energy and impulse transfer within this core is achieved by so-called turbulence balls continually entering and leaving the laminar edge zone, thus undergoing an average velocity change from ucore to u' and vice versa. These oscillating balls have a mass flux density of m r, and the shear stress τ' along εl is
τ ′ = − ′( )�m u ur c (19)
In a similar way the heat flux density q transferred by these turbulence balls can be expressed by
� �′ = ′ −( )q m c T Tr c (20)
The temperature profile in a cross section is simi-lar to the flow velocity profile (Fig. 13). Thus, the heat flux density q w at the pipe wall becomes
��
qT
Tq
T TWl
cW
W c
= − ′ = =−
λε
α αor (21)
where Tc is the temperature in the core of the fluid,T' is the temperature at the laminar (viscous) edge zoneTw is the temperature on the wallεl is the thickness of the laminar (viscous) edge zone
Equations (18) to (21) lead to Prandtl’s basic equa-tion for the relationship between heat transfer and flow resistance:
Nuuuc
RePr Pr=
+ −( ) ′ξ8
1
1 1 (22)
Figure 12. Heat conditions for constant temperature (left) and constant heat flux density (right) at the wall of an absorber pipe.
constW =
constW =
Wq
mT
WTconst
T
x
W
Wq. .
q.
constTW =
constTW =
mT
T
xq.
q.
Figure 13. Turbulent flow conditions with a laminar flow area along the wall of an absorber pipe.
© 2009 Taylor & Francis Group, London, UK

Fishermans Bend - Final ReportFishermans Bend - Final Report - Background Documents
88
CREEPING SLOPE
Figure 16. Ground plan of the rehabilitation centre Bad Schallerbach/Austria with energy piles and energy transfer system.
Figure 17. Outdoor temperature near the rehabilitation centre and temperature within energy pile (one of the “measuring piles” in Fig. 16). Strong heat wave in summer 2003; more normal temperature distribution in 2004; cold summer and warm autumn in 2005.
-10
-5
0
5
10
15
20
25
30
Feb
.03
Mar
.03
Apr
.03
May
.03
Jun.
03
Jul.0
3
Aug
.03
Sep
.03
Oct
.03
Nov
.03
Dec
.03
Jan.
04
Feb
.04
Mar
.04
Apr
.04
May
.04
Jun.
04
Jul.0
4
Aug
.04
Sep
.04
Oct
.04
Nov
.04
Dec
.04
Jan.
05
Feb
.05
Mar
.05
Apr
.05
TE
MP
ER
AT
UR
E T
[°C
]
0.0
2.5
4.5
6.5
9.0
outdoor (daily average)
outdoor (singular)
0
T 2,5
T 4,5
T 6,5
T 9,0
Pile temperatureat depth [m]
were installed as retaining structure and as founda-tion elements of a rehabilitation centre situated in a creeping slope. 143 piles are fitted with heat exchang-ers and hence act as energy piles for heating and cooling.
Since autumn 1997 the energy piles have been under full operation without any problem. Long-term monitoring revealed typical seasonal tempera-ture fluctuations with relatively large amplitudes of maximum and minimum pile temperatures in sum-
© 2009 Taylor & Francis Group, London, UK
87
the seasonal performance factor (SPF) of the overall geothermal system.
Figure 15 illustrates the performance balance of soil and absorber (heat exchanger) per metre run of an energy pile under steady-state conditions. The heat flux density q of the soil is compared with that of the absorber, q w, whereby the geometric conditions (circumference of pile Cpile, circumference absorber pipe Cpipe) and the number of absorber pipes has to be considered:
� �qC q C (T T )Cpile w pipe w m pipe↔ =n nα − (26)
where n is the number of absorber pipes filled with heat carrier fluid.
Equation (26) does not include the heat transfer through the concrete cover and the pipe wall. This can only be simulated numerically.
4.5 Numerical simulations
In order to investigate the influence of individual parameters and their interaction comprehensive com-parative studies were conducted (Markiewicz, 2004).
Heat transfer under laminar flow conditions depends on how long the fluid stays in the absorber pipes, on the pipe diameter, and on the density and thermal parameters of the absorber fluid.
When laminar and turbulent flow conditions are compared directly, the following conclusions can be drawn:
• Heat transfer under turbulent conditions depends significantly more on the input parameters. Under laminar conditions Nusselt’s number is rather con-stant for all parameters.
• Increasing the concentration of the water-glycol mixture increases the laminar zone, hence reduces the turbulent zone and therefore worsens heat transfer. If pure water is used as absorber fluid, turbulence occurs in nearly all cases, and Nus-selt’s number is about 15 times higher than for a water-glycol mixture. Nevertheless, in most cases an anti-freeze is unavoidable, because tempera-tures below 0°C are possible during operation. It should be considered that—when using a heat pump—the fluid temperature at the vaporizer is still about 2°C lower than the inflow temperature. This involves the danger of freezing/icing in the heat pump.
• Under laminar conditions the flow velocity is inde-pendent of the pipe diameter. It only depends on pump performance, pump efficiency, pipe length and on the flow parameters (kinematic viscosity and density). Furthermore, it increases with the operating temperature, whereas under turbulent conditions the flow velocity is rather independent of the temperature.
• Under laminar conditions the pipe diameter does not influence the residence period of the heat carrier fluid within the ground heat exchanger (absorber pipes), whereas under turbulence this duration increases with pipe diameter.
• In small-diameter pipes and at low operating tem-peratures laminar flow occurs practically in all cases.
• If small-diameter pipes are used Nusselt’s number can hardly be increased by increasing the pump performance. Hence, installing pumps with higher capacity is then of no use. However, in the case of large-diameter pipes turbulent flow condi-tions can be achieved rapidly by increasing the pump performance. This also increases the heat transfer from absorber pipe wall to absorber fluid.
• With decreasing pipe diameter the total flow resistance that has to be overcome by the pump increases, as pipe wall friction related to the diam-eter increases. For diameters of d = 2 to 4 cm the pressure remains nearly constant, but for smaller diameters it increases over-proportionally. Fur-thermore, the pressure increases with low operat-ing temperature because the viscosity of the fluid increases.
5 CASE HISTORIES
5.1 Heating and cooling of a rehabilitation centre
Figure 16 shows the ground plan of a case historythat was already presented during the BAP III-Seminar (Brandl, 1998). 175 bored piles (D = 1.2 m)
Figure 15. Heat volume balance for an energy pile. C = circumference of pile or pipe; q· = heat flux density.
n absorber pipes
pileC
pipeCq
Wq.
.
© 2009 Taylor & Francis Group, London, UK

July 2013 - CONFIDENTIAL
vo
lu
me
3
90
gas which is equivalent to an environmental relief of 73 tons CO2.
In the same region a 43 m high Spa Hotel with geothermal heating and cooling was built. The core of the Spa centre comprises four floors with 6,500 m² of spa and fitness zones, and a 2,000 m² bath and sauna world. The energy foundation consists of 357 auger piles, 30 m long and includes 69,000 m of plastic pipes. Groundwater temperature is constant at 12°C. Primary and secondary energy circuits are con-nected by a 400 kW heat pump. In winter 1.6 GWh are extracted from the ground, corresponding to the energy demand of about 160 modern one-family houses. About the same heat volume is then sunk back into the ground when cooling the building in summer.
In 2007 Austria’s first low-energy shopping centre was opened using its pile foundation for heating and cooling. 650 piles of in total 800 bored piles (diam-eter D = 0.9 m, some piles with D = 1.2 m; depth = 50 m) are equipped with absorber pipes. The subsoil consists of 3 to 5 m sandy gravel underlain by soft sandy-clayey silt (banded) down to 40 m, and finally sand to gravel. The groundwater level lies about 3 m below surface. Thus a significant magnitude of con-ventional energy can be saved: 4.1 GWh/a of fossil fuel, 61 MWh/a of electrical energy. Furthermore, the energy piles instead of conventional heating/cool-ing systems save nearly 550 tons of CO2. Temporary surplus of geothermal energy is fed into the public district energy supply line.
5.3 Energy tunnels using pile walls
A tunnel may activate a significantly larger quantity of useable geothermal heat than deep foundations.
The energy can be used for heating and/or cool-ing railway stations, administration and residential buildings, and for keeping platforms, bridges, pas-sages etc. free from ice in winter. Consequently, shallow tunnels (especially in cut and cover) make a wider application possible than deep-seated tunnels, because the heat transfer between source and user is easier.
The first thermo-active traffic tunnel (“Energy tunnel”) was finished in 2003 running through the northern Vienna woods. The 12.8 km long tube was constructed in several sections and after different methods:
• “Cut and cover”, consisting of large diameter bored piles, reinforced concrete base slab and roof. In this part “Energy piles” were installed.
• “New Austrian Tunnelling Method” (NATM) with a primary support of reinforced shotcrete, rock bolts and anchors, and a secondary lining of rein-forced concrete. In this part “Energy geocompos-ites” were installed.
• Additionally, “Energy wells” were used to locally reduce the groundwater level.
Along the cut and cover tunnel the primary side-wall lining of the tunnel consists of bored piles, whereby each third pile is used as an energy pile
Figure 20. Schematic cross section of an energy plant as thermo-active tunnel (“energy tunnel”). One side wall of cut-and-cover tunnel used as energy wall. Bored pile walls (south-middle-north).
© 2009 Taylor & Francis Group, London, UK
89
mer and winter—as intended for this pilot project. Consequently, the pile temperatures in the subsequent winter were somewhat higher than in the quasi-steady state before. Moreover, Fig. 17 reveals that daily outdoor mean values are needed for a reliable inter-pretation. Only singular outdoor temperature meas-urements parallel to pile temperature measurements are not sufficient (indicated in the diagram from April 2004 to April 2005).
In Fig. 18 some temperature curves are selected as examples of heating and cooling periods in rel-evant years. Immediately after commencing continu-ous operation of the geothermal system started (with excessive heating); the year 2003 had a very high cooling demand, and there was quasi-steady state in the year 2004/2005.
5.2 Heating and cooling of a Multi-purpose Hall, of a Spa Hotel, and of a Low-energy Shopping Centre
A multi-purpose hall with a capacity of 8,000 persons was designed for exhibitions, fairs, and as a sports hall, especially as an ice rink. The latter required intensive cooling and temporary heating. The complex energy management could be solved with energy piles, because piles were already needed for a deep founda-tion of the structure resting on weak clays (Fig.19). The deep foundation comprises 320 cast in situ con-crete piles (bored piles, D = 0.5 m) of 18 m length. The piles contain in total about 65 km absorber pipes (HDPE; d = 25 mm). This cooling/heating system provides an annual saving of 85,000 m3 of natural
Figure 18. Temperature within energy pile against pile depth; data from long-term operation illustrating the seasonal fluctuation.
TEMPERATURE [°C]
-9
-8
-7
-6
-5
-4
-3
-2
-1
0
0 5 10 15 20
DE
PT
H [
m]
09.02.199825.08.200301.02.200414.06.200409.08.200424.08.200418.10.200407.02.2005
intensive heating
long period of intensive cooling
Figure 19. Energy piles for heating and cooling a multi-purpose hall.
© 2009 Taylor & Francis Group, London, UK

Fishermans Bend - Final ReportFishermans Bend - Final Report - Background Documents
92
mechanical and thermal effects, as can be clearly seen from the seasonal differences. The tempera-ture-induced deformations are significantly smaller than those caused by earth pressure, and the natural fluctuation of the tunnel temperature has a greater influence than the temperature changes due to energy extraction/storage in the energy piles. Energy opera-tion even creates a more uniform temperature in the piles, that is, smaller temperature differences between pile head/toe and inner/outer side. This thermal bal-ancing-out reduces the temperature-induced statical moments in the energy piles.
Of course, the energy operation causes a stronger cooling or heating of the piles. But this occurs uni-
formly, hence causing a volumetric deformation with-out constraints, and therefore no additional load on the structure.
6 INSTALLATION OF ABSORBER PIPES IN DEEP ENERGY FOUNDATIONS
Experience with energy piles since 25 years and with energy diaphragm walls since 12 years has disclosed that a proper installation of absorber pipes is essential for the long-term behaviour of the thermo-active sys-tem. Failures after this construction period are largely negligible.
Installing reinforcement cages fitted with absorber pipes into bored or auger piles, barrettes or diaphragm walls requires the following measures:
• Protection from mechanical damaging, especially in the case of cut by machine and non-deburred reinforcement bars.
• Protection from thermal damaging (during rein-forcement welding).
• Exact positioning of the reinforcement cages (ori-entation of the connecting box).
• Constructing stiff reinforcement cages for deep foundations (e.g. welding of helical reinforcement to vertical rebars of deep piles, barrettes etc.).
• Lifting long reinforcement cages at both ends to pre-vent damage to the pressurised absorber pipe loops.
• Use of full tremie pipes to place concrete in pile bores; also for dry rotary-bored piles, where com-monly self-compacting concrete is placed via a short tremie pipe from the ground surface.
Figure 22. To Figs. 20, 21. Photo taken with a heat camera, showing (equally spaced) colder areas of the inner tunnel lining caused by energy piles.
Figure 23. Relative strain along inner and outer (earth-) side and along centre line of an energy pile (S-07–20 in Fig.21).
© 2009 Taylor & Francis Group, London, UK
91
collecting pipes. The manometers allow a detailed watertightness check of all absorber pipes. A mani-fold with a diameter of 150 mm connects the col-lectors/distributors with heat pumps in an adjacent school in order to heat the building. Table 1 gives the relevant technical data.
Preliminary calculations yielded an extractable thermal power of about 150 kW in the long term. In one heating period an energy amount of 214 MWh can be gained. Furthermore, the benefits of this new energy concept are both, environmentally friendly and economical: The reduction of natural gas of 34,000 m3 per year leads to a decrease of annual CO2-emissions of 30 t. Furthermore, annual savings in operation costs of about 10,000 € are achieved—compared to the old natural gas heating system of the school building.
The plant was constructed as a demonstrating project in the context of a major research initiative by the Austrian Government. Due to this scientific background, the plant is intensively instrumented with measurement devices. Six energy piles are fit-ted with 18 temperature gauges in different lev-els; additionally, one pile is fitted with combined strain-temperature gauges in five levels for measur-ing strains and temperature. The aim of this measur-ing system is to investigate the effects of temperature changes within an energy pile on its bearing capacity and the temperature fluctuation in the energy piles during operation. Moreover, heat carrier fluid pas-sage, total extracted heat, and temperatures in the manifold are monitored. The groundwater tempera-ture surrounding the energy plant is also registered (at different distances). Temperature differences between energy piles (thermo-active and bearing function) and standard piles (only bearing function) have been checked by heat picture photographs. The differences can be registered even after the placement of the secondary lining, i.e. the reinforced concrete cover (Fig. 22).
The operation of the energy plant started in Febru-ary 2004, and during the first testing phase initial data were obtained which could be used to optimise the absorber system. About 40 MWh of heating energy could be extracted from the energy piles during the first six weeks of operation. Since autumn 2004 the energy system runs permanently for a school near the tunnel. The external air temperature (“outdoor temperature”) is used as criterion for regulating the energy system. Down to –5°C the school building can be fully heated with ground source energy. At lower temperatures the existing gas boiler furnace is added.
Figure 23 shows for example the specific strain in the measuring pile S-7–20 at different times plot-ted for the inner and outer side and the central axis. The zero-reading was before soil excavation in front of the pile wall. Therefore, the curves include both
Table 1. Technical data of the energy plant “LT24—Hadersdorf-Weidlingau”.
Annual heating output: MWh 214Energy piles 59 pilesMean length: m 17.1Heating capacity: kW 150Required antifreeze passage: m3/h 51.6Absorber pipes HDPE. do = 25 mm di = 20 mm Absorber circuits 80 unitsAbsorber pipes in piles — total length: m 9,709Connecting lines — total length: m 13,754
Figure 21. Detail to Fig. 20: Longitudinal section through the energy tunnel wall. The primary lining consists of bored piles with jet-grouted columns in between and is connected to the watertight secondary lining by dowels. Every third pile is equipped with absorber pipes that are situated behind reinforcement bars and thus protected from damage through dowel installation for the inner lining (reinforced concrete panels). Also shown is the location of measurement instru-ments in pile S-07 – 20.
(Figs. 20, 21). Thus, the energy plant comprises 59 bored piles with a diameter of 1.2 m and an average pile length of about 17.1 m. The intermittent pile wall exhibits jet-grouting columns between the piles.
Pile excavation (by grab) was supported by cas-ings using rotating equipment. The energy piles are equipped with absorber pipes connected to collec-tors/distributors which are located at a central point of the tunnel. The pipes leading from the piles to the collectors/distributors are placed alongside the cover of the tunnel. The connecting pipes are leading into a collector/distributor room that is easily accessible on top of the cut and cover tunnel and contains the header block with the collector/distributor for all
© 2009 Taylor & Francis Group, London, UK

July 2013 - CONFIDENTIAL
vo
lu
me
3
94
8 PROMOTION OF GEOTHERMAL ENERGY UTILISATION
An early ecological energy planning for buildings can in many cases prevent costly refurbishment and renovation in the future. High-quality energy design involves not only heating and cooling (rooms, water) but also lighting.
Building biology (including building ecology) gains increasing importance in the fight against glo-bal warming, depletion of the ozone layer and exploi-tation of material resources. Building biology has become (or should become!) a multi-disciplinary sci-ence combining architecture, civil and geotechnical engineering, physics and chemistry, installation engi-neering, medicine and related sciences. It considers not only interactions of buildings and human health, but also energy concepts, the life cycle of building materials, sustainability, etc.
Geothermal geotechnics offers a promising alter-native to conventional heating/cooling systems, pro-viding solutions to the challenges of today’s energy policies.
The targets for renewable energy and for energy buildings can be reached generally only by political measures:
• High taxes on fossil fuels are the most important prerequisite for energy saving and promotion of renewable energy sources.
• In order to promote the installation of thermo-active systems or/and other heating-cooling sys-tems based on renewable energy, the economic incentives for private investors, house owners, companies, but also for public administrators to invest in renewable energy systems should be improved in many countries. A strong support by European Union policy is necessary.
• Legislation.• Public grants.
Since January 2004 each person who wants to build a family house in Austria receives financial support by the local government only if they present a so-called “energy performance certificate” with low energy number. This number describes the energy consumption (provided heating energy minus heating losses) and is expressed in kWh/m2 and year. Promo-tion by public funds is granted only if this energy number is smaller than 50 kWh/m2 for each floor. At values less than 40, 30, 25, 20, 15 kWh/m2 the grant increases step by step.
However, if a building is heated/cooled by means of clean, renewable energy, e.g. by geothermal sys-tems, the allowable limit value for energy consump-tion may be increased. The target of multi-disciplinary innovations should approach heat-and-light systems
combined with ground-sourced or solar residual heating/cooling.
Thermo-active structures (including energy foun-dations) are therefore very helpful in reaching this low energy number. Their installation is widely sup-ported by politicians and media. Consequently, nearly 1000 buildings with energy foundations or retaining/basement walls already exist in Austria.
This “philosophy” is fully supported by the Direc-tive 2002/91/EC of the European Parliament and of the Council on the energy performance of buildings. Thus an energy performance certificate has to be presented if a building with more than 500 m² is sold or rented.
9 CONCLUSIONS
25 years of experience with energy piles has dis-closed that such environmentally friendly systems for heating and cooling of buildings have significant advantages over conventional technologies (fossil fuels etc.) and enable sustainable and clean energy consumption. Local climate and ground properties, technological level, the specific use of a building, seasonal fluctuations, environmental conditions and actual energy prices are the main influence param-eters of an optimised integral design.
Energy systems based on earth-contact structural elements (energy piles, energy diaphragm walls, etc.) have a double function, and they work most effi-ciently if the thermo-active elements are in contact with groundwater. Nevertheless, a sufficient seasonal performance factor of the system is achievable even without groundwater, especially for seasonal opera-tion, i.e. heating in winter and cooling in summer. Energy balance is the ideal form of heating/cool-ing. Moreover, the smaller the temperature differ-ence between ground source energy and used energy, the higher is the seasonal performance factor, hence the efficiency of the thermo-active system. Usually, a temperature difference of only ΔT = 2°C between absorber fluid inflow and return flow from the pri-mary circuit is sufficient for an economical operation of the energy system. Consequently, such geothermal systems represent low-temperature systems. Experi-ence has shown, that the electricity required for oper-ating the entire system commonly varies between 20 to 30% of the total energy output. If no heat pump is necessary (e.g. for free cooling) this value drops to 1 to 3% for merely operating a circulation pump.
Despite overlapping integral design aspects there should be always a clear interface between energy foundations and building (household etc.) regard-ing responsibility of construction, quality control and assurance. It has proven suitable to consider this already in the tender design.
© 2009 Taylor & Francis Group, London, UK
93
• Upon the completion of the pipe work fixing on the reinforcement cage, a visual check on the final location of the pipes is imperative to ensure that the floor of the wet pile concrete though the reinforce-ment cage would not be impaired. The pipe ends near the bottom of the cage should be placed at dif-ferent levels to help this.
• Very long reinforcement cages fitted with absorber pipes have to be installed in sections which should be coupled by screwing and not welding. The pipes are extended/coupled by electrically welded sleeves. Welding of the reinforcement sections is only unavoidable if a lightening protection element is attached. In such cases the absorber pipes have to be protected during welding by welding mats.
• Cautious insertion and withdrawal of the tremie pipes.• Protection from torsion and heave of the rein-
forcement cage during concreting and steel pipe withdrawal.
• Sufficient distance of the absorber pipes from the reinforcement on head and toe of the piles, bar-rettes, or diaphragm wall panels.
• Special precautions have to be taken for energy piles or diaphragm walls used for cut and cover tunnels or retaining walls if they are covered by a second-ary lining. In order to avoid damage of the absorber pipes when installing the connecting nails or dow-els, the pipes should be protected by twin bars.
The absorber pipes in the foundation elements shall be kept under pressure in all construction stages. This enables prompt localisation of possible defects and repair in time. The collectors or distributors respec-tively of the absorber pipes should be fitted with opti-cal flow meters for long-term monitoring of the fluid circulation in the geothermal system.
Special emphasis should be lain on the interface between energy piles and building (Fig. 24). For instance, joints caused by complex construction sequence require detailed planning and most care-ful execution when situated below the groundwater
Figure 24. Interface between primary and secondary cir-cuits (header block).
level. Consequently, it has proved suitable to collect the absorber pipes leading away from the pile heads to the header block in special boxes in order to minimise the openings through foundation rafts. Sealing with resin is also required then.
7 BENEFITS OF ENERGY FOUNDATIONS
The benefits of energy foundations and other thermo-active earth-contact structures may be summarised as follows:
• Environmentally friendly (non-polluting, sustain-able energy).
• Reduction of fossil energy demand, hence of CO2-emissions.
• Promoting the compliance with international environ-ment obligations (Kyoto- and Toronto-targets, etc.).
• Economical, at least in the long term.• Although thermo-active earth-contact struc-
tures commonly require similar or slightly higher investment costs, they have lower running costs, hence lower life-cycle costs than conventional systems.
• Low maintenance and long lifetime.• Geothermal energy systems run fully automated.• Thanks to the low temperature and pressure in the
heat carrier circuits geothermal heating/cooling systems can be operated without risk.
• Closed primary heat carrier circuit embedded in concrete prevents damage of pipework or ground-water pollution.
• Increase of personal comfort in buildings (indoor rooms). The temperature personally felt there—the ambience experienced—consists of air and radiation temperature, which are influenced by wall and floor temperatures. Comfort is enhanced by low-temperature heating of walls and floors exhibiting a large heat-radiating surface.
• Optimal hygrothermal behaviour of buildings (e.g. for museums and arts centres).
• No storage of fossil fuel, no stove and chimney, no visible radiators are needed.
• Geothermal cooling may replace conventional air conditioning which is frequently felt to be loud and unhygienic.
• Geothermal energy may be easily combined with other energy systems.
• Unlike hydroelectricity, geothermal energy is not vulnerable to droughts.
• The cost of geothermal energy is not prone to unpredictable price fluctuations.
• Reduction of energy imports, hence lower dependency on external economical or political situations.
• Positive public image, and in several regions is sup-ported by government grants.
© 2009 Taylor & Francis Group, London, UK

Fishermans Bend - Final ReportFishermans Bend - Final Report - Background Documents
Geoscience Australia Building, Canberra
Geothermal Air Conditioning: 10 Year Review
95
Proper operation of thermo-active foundation sys-tems does not affect the load capacity of piles or dia-phragm walls during geothermal cycles (as already stated in Brandl, 1998). Hence, temperature-induced settlement or heave of buildings with such energy foundations is negligible in relation to displacements caused by static loads.
Commonly, the groundwater temperature is changed by more than ±1°C only within a distance of less than 5 to 10 m to the earth-contact structural elements. These values could be found even for rather large thermo-active ground structures.
The drop out rate of properly installed energy piles is negligible and occurs practically only dur-ing construction. In Austria the failure rate usually is less than 2% of the required usable energy output of the entire energy system. If it is more, the construc-tion firms have to pay for reduced quality. However, for safety reasons the energy foundations are com-monly designed as if an energy loss of 10 % might occur. This over-design covers failures during the construction period that cannot be repaired and pos-sible long-term failures or losses in the primary and secondary circuit of the energy system. Long-term failures within energy piles can be excluded if they are operated properly. Once, energy piles have passed positively the acceptance tests, no long-term failures could be observed until now.
Proper geothermal energy utilisation requires an inter-disciplinary design, especially in the case of houses. The geotechnical engineer, structural engineer, architect, building services designer and installer, heating engineer and specialised plumber should cooperate as early as possible to create a most economical energy system. In the first phase of oper-ation precise adjustment is recommended to optimise the performance of the engineering system. Further-more, some operation rules have to be considered (Brandl, 1998, 2006).
REFERENCES
Abu-Hamdeh, N., Khadair, A. & Reeder, R. (2001). A com-parison of two methods used to evaluate thermal conduc-tivity for some soils. Int. Journal of Heat Mass Transfer 44, No. 14, pp. 1073–1078.
Adam, D. & Markiewicz, R. (2002). Nutzung der geother-mischen Energie mittels erdberührter Bauwerke. Öster. Ingenieur- und Architekten-Zeitschrift, Vienna Vol. 147, No. 4, 5 and 6.
Brandl, H. (2006). Energy foundations and other thermo-active ground structures. (Rankine-Lecture). Géotech-nique, Vol. LVI No. 2, pp. 81–122.
Brandl, H. (1998). Energy piles and diaphragm walls for heat transfer from and into ground. 3rd Int. Geotechni-cal Seminar, Deep Foundations and Auger Piles (BAP III). University of Ghent. W.F.Van Impe (ed.). Proc.: A.A. Balkema, Rotterdam, pp. 37–60.
Enercretnägele (2004). Thermoaktive Fundamente. Nägele-Reports, Röthis, Austria.
Markiewicz, R. (2004). Numerische und experimentelle Untersuchungen zur Nutzung von geothermischer Ener-gie mittels erdberührter Bauteile und Neuentwicklungen für den Tunnelbau. Doctoral Thesis. Institute for Soil Mechanics and Geotechnical Engineering, Vienna Uni-versity of Technology.
Oertel, H. jr. (Hrsg.) (2001). Prandtl—Führer durch die Strömungslehre. Friedr. Vieweg & Sohn Verlagsges.mbH, Braunschweig, Germany.
Rees, S.W., Adjali, M.H., Zhou, Z., Davies, M. & Thomas, H.R. (2000). Ground heat transfer effects on the thermal performance of earth-contact structures. Renewable and Sustainable Energy Reviews 4, pp. 213–265.
Sanger, F.J. (1979). Degree-days and heat conduction in soils. Proc. 1st Int. Conf. Permafrost, pp. 253–262.
Sauty, J.P. (1980). An analysis of hydrodispersive transfer in aquifers. Water Resource Res. Vol. 18, No. 2, pp. 253–265.
Unterberger, W. et al. (2008). Praktische Erfahrungen beim Bau einer Erdwärmeanlage am Beispiel des Bauloses U2/2. Betontag 2008, Proc. Österreich. Vereinigung für Beton- und Bautechnik, Wien.
Verein Deutscher Ingenieure (1997). VDI-Wärmeatlas. Springer-Verlag Berlin Heidelberg.
© 2009 Taylor & Francis Group, London, UK

July 2013 - CONFIDENTIAL
vo
lu
me
3
Geothermal Air Conditioning: 10 Year Review
Contents:
Executive Summary .....................................................................................................2
About Geoscience Australia.........................................................................................4
Original Design Development & Research...................................................................4
Installed Geothermal System Operation ......................................................................5
Maintenance.................................................................................................................7
Benchmark Performance .............................................................................................8
Ongoing Performance and Review ..............................................................................9
Conclusion ...................................................................................................................9
Further Information.......................................................................................................9
Footnote .....................................................................................................................10
Geoscience Australia: Geothermal Air Conditioning 10 Year Review Page: 3
Executive Summary
The Geoscience Australia building located in Symonston, ACT utilises one of the largest Ground Source Heat Pump (GSHP) systems in the southern hemisphere.The GSHP system utilises the very stable nature of the earth’s temperature at depthwhich remains at around 17 degrees throughout the year. This is a valuableresource – especially when considering the large range in temperatures experienced in Canberra from lows of minus 4° through to highs above 35°. This constant temperature is used as a source of heating or cooling depending on the requirements of the building.
The system is based on a series of 210 geothermal heat pumps throughout the general office area of the building, which carry water through loops of pipe buried in 352 bore holes each 100 metres deep, to exchange heat with the earth.
The system is the largest of its type in Australia and the cost model developed at design projected energy savings of over $1 M over the anticipated 25 year life of the plant.
With the building having now been in operation for 10 years, it is an opportune time to revisit original design assumptions and decisions.
Authors:This report was prepared by Peter Dickinson (TAC LiveDATA) with assistance from Stephen Read (Geoscience Australia), Leyden Deer (Efficient Energy Systems) and Sally Petersons (Skilled Engineering).
Publication Date:August 2007
Geoscience Australia: Geothermal Air Conditioning 10 Year Review Page: 2
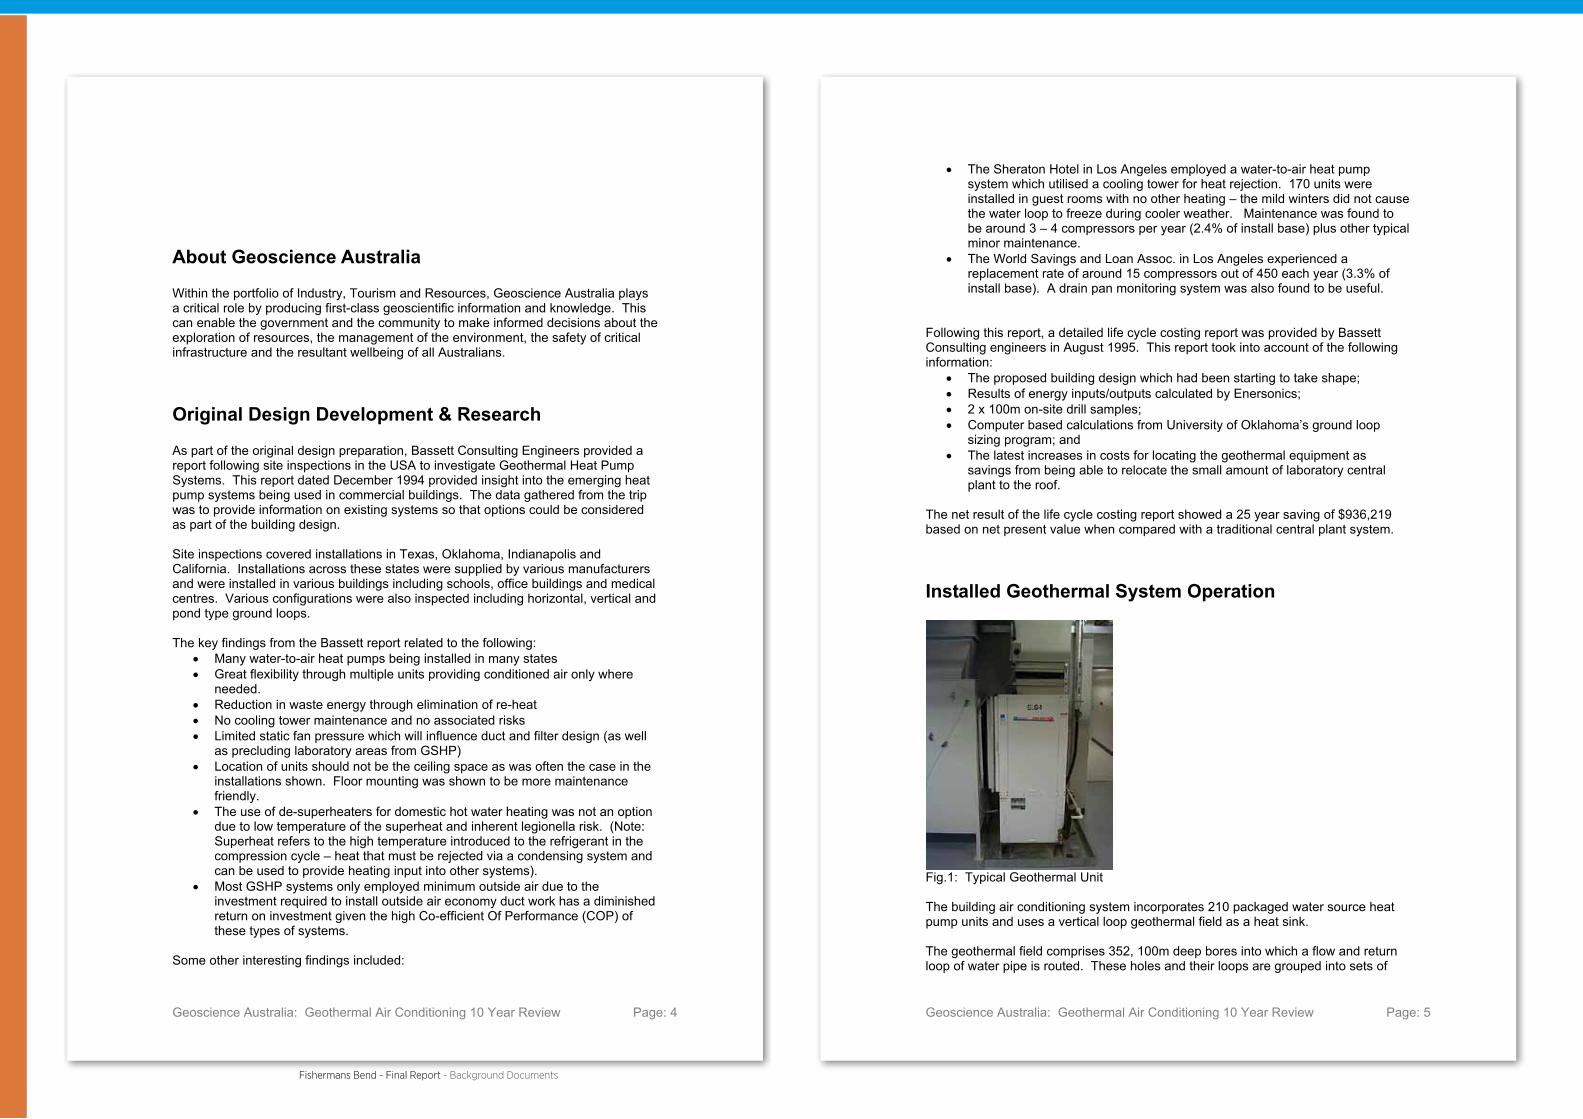
Fishermans Bend - Final ReportFishermans Bend - Final Report - Background Documents
Geoscience Australia: Geothermal Air Conditioning 10 Year Review Page: 5
• The Sheraton Hotel in Los Angeles employed a water-to-air heat pump system which utilised a cooling tower for heat rejection. 170 units were installed in guest rooms with no other heating – the mild winters did not cause the water loop to freeze during cooler weather. Maintenance was found to be around 3 – 4 compressors per year (2.4% of install base) plus other typical minor maintenance.
• The World Savings and Loan Assoc. in Los Angeles experienced a replacement rate of around 15 compressors out of 450 each year (3.3% of install base). A drain pan monitoring system was also found to be useful.
Following this report, a detailed life cycle costing report was provided by Bassett Consulting engineers in August 1995. This report took into account of the following information:
• The proposed building design which had been starting to take shape; • Results of energy inputs/outputs calculated by Enersonics; • 2 x 100m on-site drill samples; • Computer based calculations from University of Oklahoma’s ground loop
sizing program; and • The latest increases in costs for locating the geothermal equipment as
savings from being able to relocate the small amount of laboratory central plant to the roof.
The net result of the life cycle costing report showed a 25 year saving of $936,219 based on net present value when compared with a traditional central plant system.
Installed Geothermal System Operation
Fig.1: Typical Geothermal Unit
The building air conditioning system incorporates 210 packaged water source heat pump units and uses a vertical loop geothermal field as a heat sink.
The geothermal field comprises 352, 100m deep bores into which a flow and return loop of water pipe is routed. These holes and their loops are grouped into sets of
Geoscience Australia: Geothermal Air Conditioning 10 Year Review Page: 4
About Geoscience Australia
Within the portfolio of Industry, Tourism and Resources, Geoscience Australia plays a critical role by producing first-class geoscientific information and knowledge. This can enable the government and the community to make informed decisions about the exploration of resources, the management of the environment, the safety of critical infrastructure and the resultant wellbeing of all Australians.
Original Design Development & Research
As part of the original design preparation, Bassett Consulting Engineers provided a report following site inspections in the USA to investigate Geothermal Heat Pump Systems. This report dated December 1994 provided insight into the emerging heat pump systems being used in commercial buildings. The data gathered from the trip was to provide information on existing systems so that options could be considered as part of the building design.
Site inspections covered installations in Texas, Oklahoma, Indianapolis and California. Installations across these states were supplied by various manufacturers and were installed in various buildings including schools, office buildings and medical centres. Various configurations were also inspected including horizontal, vertical and pond type ground loops.
The key findings from the Bassett report related to the following: • Many water-to-air heat pumps being installed in many states • Great flexibility through multiple units providing conditioned air only where
needed.• Reduction in waste energy through elimination of re-heat • No cooling tower maintenance and no associated risks • Limited static fan pressure which will influence duct and filter design (as well
as precluding laboratory areas from GSHP) • Location of units should not be the ceiling space as was often the case in the
installations shown. Floor mounting was shown to be more maintenance friendly.
• The use of de-superheaters for domestic hot water heating was not an option due to low temperature of the superheat and inherent legionella risk. (Note: Superheat refers to the high temperature introduced to the refrigerant in the compression cycle – heat that must be rejected via a condensing system and can be used to provide heating input into other systems).
• Most GSHP systems only employed minimum outside air due to the investment required to install outside air economy duct work has a diminished return on investment given the high Co-efficient Of Performance (COP) of these types of systems.
Some other interesting findings included:

July 2013 - CONFIDENTIAL
vo
lu
me
3
Geoscience Australia: Geothermal Air Conditioning 10 Year Review Page: 7
The selected water flow rate through the geothermal units typically is at the highest figure recommended in the manufacturer’s data for each unit. These flow rates are around double the minimum allowable flow rates but do contribute to a slightly better unit coefficient of performance. At full load, the overall energy consumption of the unit and pump combination is slightly less at the highest flow but at low load, this relationship reverses and the overall energy consumption is higher at the highest flow rates. This is because at low loads, the pump power is a more significant relative to total power requirements.
A few calculations done on a model ATV028 unit (the most common with around 45 installed) indicate that at full load the pump power is around 25% of total power and at 25% load, the pump power is around 40% of total power. This is borne out by the load profile of the geothermal system shown below:
Fig.3: Example daily load
This shows a minimum demand of around 90kW, which represents the demand of the pumps plus maybe one or two units rising to around 470kW at start-up when most units would be operating near full load and then dropping to around 180kW at the end of the day when most units are operating at low load.
Maintenance
Scheduled maintenance is performed via the site’s comprehensive Facilities Management (Building Services) contract provider Skilled Group. Routine maintenance predominantly includes the following:
• 1 Monthly: Water quality check and treatment if required • 3 monthly: Filters inspected/cleaned • 6 monthly: Controls checked for correct operation
Geoscience Australia: Geothermal Air Conditioning 10 Year Review Page: 6
eight and are connected in reverse return configuration via horizontal, larger diameter, flow and return pipes to the headers in the geothermal plant room. This means that there are 44 pairs of pipes connecting the plant room to the geothermal field.
Each flow and return header has 11 pipes connected to it so that there are four sets of flow and return headers in the plant room, each with its own associated primary geothermal pump. A fifth pump provides manual standby capability for any of the four main pumps.
Fig.2: Header System
The Ground Loop Heat Exchanger is based on the following Parameters:- • Maximum Water Temp Entering Ground Loop - 35.5°C over 25 years. • Fluid Type - Pure Water • Average Density Rock • Undisturbed Ground Temp 18.2°C• Bore Hole Spacing 4.5 m. • Future Spare Capacity 10%
In operation, each primary pump circulates water from the primary header, to its associated flow header, through the 11 flow pipes, the 88 vertical loops, the 11 return pipes and the return header back to the primary header.
Effectively, there are four separate geothermal fields, each with its own pumps. The fields are brought into operation sequentially in accordance with the schedule below. The order in which each pump comes on is determined by the control system and is adjusted regularly. Secondary Loop Return Water Temp (°C)
No of Operating Primary Pumps
<4 4 4-5 3 5-6 2 6-8 1 8-18 - 18-22 1 22-27 2 27-33 3 >33 4

Fishermans Bend - Final ReportFishermans Bend - Final Report - Background Documents
Geoscience Australia: Geothermal Air Conditioning 10 Year Review Page: 9
These figures Udo notU include added cost savings derived from cooling tower maintenance and monitoring as well as traditional chiller plant servicing.
Ongoing Performance and Review Geoscience Australia energy performance is constantly reviewed and further improvements to performance of the geothermal system is expected with work being undertaken in the following areas:
• The Building Controls Management System (BCMS) supported by Honeywell is being upgraded with completion due by February 2008. This includes software upgrade and replacement of controls and sensors for all geothermal heat pumps, set point adjustments for seasonal change including function for local temperature controls, trending and reporting capabilities. Interface between the geothermal system and Honeywell controls will be supported by Bacnet logic;
• Ongoing energy reviews include geothermal pump circulation flow rates and energy use. Consulting engineers engaged to review performance, loads and air balances to optimise performance.
Conclusion
When comparing energy performance in the annual ‘Energy Use in the Australian Government Operations’ reports, the GA Building has maintained energy performance and targets that would normally be contributed to a general office administration building. This is significant given the requirements to provide additional fresh air to laboratories and 24/7 temperature control to special storage areas. This can be contributed to the geothermal system and the other Ecologically Sustainable Development design principles used in the building.
Moving forward, there is scope for additional system improvements. These are possible predominantly with regard to the pumping arrangement as this represents the largest ‘controllable’ component of the geothermal system.
Further Information
The following web pages provide further information on Geoscience Australia and geothermal energy:
HUwww.ga.gov.auUH (Geoscience Australia Home Page)
HUwww.ga.gov.au/about/building/UH (GA building design features)
HUwww.ga.gov.au/minerals/research/national/geothermal/index.jspUH
(GA Scientific research program on geothermal energy)
HUwww.geoexchange.com.au UH
(geothermal system installations – GA Building Contractor)
Geoscience Australia: Geothermal Air Conditioning 10 Year Review Page: 8
Given the age of system, 2 compressor breakdowns per year are expected at the site representing a failure rate of around 1%.
Other than compressor failures, the units need very little maintenance other than occasional rectification of leaks at the units during the change of season.
As the ground loop is utilised for heat rejection, there is no need to utilise cooling towers or air cooled condensers. This further reduces energy and maintenance related expenses as well as the risks associated with cooling towers.
Benchmark Performance
The Geoscience Australia Building incorporates a number of Ecological Sustainable Development (ESD) design features. With its large footprint and specific operational requirements including laboratories and special storage areas, it is difficult to provide a definitive comparison of building performance. As no ‘like for like’ comparison is available, the typical energy performance of a selection of buildings within the ACT have been used to give some typical energy consumption figures.
The selected comparison buildings are all of an “office/administration” type function whereas the Geoscience Australia office space also includes the following:
• Public education and display areas; • Open layout and project areas; • Foyer and internal garden space and voids; • High intensity ‘IT’ areas such as the Australian Tsunami Warning System
(24/7 operation), server rooms and graphics labs
Benchmark Data Geoscience Australia Typical Annual Electricity Use (MWh) – mechanical plant only (no light and power)
1,800 MWh PA
Typical Annual Gas Use (GJ) - mechanical only (no light and power)
6,200 GJ PA
Floor area (GA office space) 30,700mP
2P
Energy Intensity: Local Benchmark MJ Per Square Meter
440 - 500 MJ/mP
2P
Energy Intensity: MJ Per Square Meter 413 MJ/mP
2P
(~15% less than comparison)
Indicative Savings:A saving of 15% would equate to approximately $27,000 PA in electricity savings and $13,000 PA in gas savings. Thus, the indicated savings above represent energy cost savings of approximately $40,000 PA.
Over the past ten years, this represents a cumulative energy cost saving of around $400,000. In future years, this annual cost saving Uwill grow U with energy costs set to increase by up to 30 – 40% over coming years. In effect, the geothermal heat pump system provides some mitigation of the risks associated with these cost increases.

July 2013 - CONFIDENTIAL
vo
lu
me
3
HIGH LEVEL GEOTECHNICAL INPUT FISHERMANS BEND DEVELOPMENT
10 July 2012Report No. 127613038-003-R-Rev0
APPENDIX CLimitations
Footnote
Geoscience Australia has in place an Energy and Environmental Management System (EMS) Plan and Policy. Tour Andover Controls (TAC) is engaged on a consultancy service as part of the Comprehensive Facilities Management contract to provide energy management services in support of the plan. This includes live data analysis and energy use monitoring, exception reporting, monthly energy consumption reports, annual energy reporting for Commonwealth Agencies (OSCAR), bi-annual energy audits to AS/NZS 3598:2000 and EMS implementationand support. For further information on these services, please contact PeterDickinson on (02) 6202 2100, [email protected] or www.tac.com .
Stephen Read Property ManagerGeoscience Australia
Geoscience Australia: Geothermal Air Conditioning 10 Year Review Page: 10

Fishermans Bend - Final ReportFishermans Bend - Final Report - Background Documents
Golder Associates Pty LtdBuilding 7, Botanicca Corporate Park570 – 588 Swan StreetRichmond, Victoria 3121AustraliaT: +61 3 8862 3500
Caption Text
LIMITATIONS
This Document has been provided by Golder Associates Pty Ltd (“Golder”) subject to the following limitations:
This Document has been prepared for the particular purpose outlined in Golder’s proposal and no responsibility is accepted for the use of this Document, in whole or in part, in other contexts or for any other purpose.
The scope and the period of Golder’s Services are as described in Golder’s proposal, and are subject to restrictions and limitations. Golder did not perform a complete assessment of all possible conditions or circumstances that may exist at the site referenced in the Document. If a service is not expressly indicated, do not assume it has been provided. If a matter is not addressed, do not assume that any determination has been made by Golder in regards to it.
Conditions may exist which were undetectable given the limited nature of the enquiry Golder was retained to undertake with respect to the site. Variations in conditions may occur between investigatory locations, and there may be special conditions pertaining to the site which have not been revealed by the investigation and which have not therefore been taken into account in the Document. Accordingly, additional studies and actions may be required.
In addition, it is recognised that the passage of time affects the information and assessment provided in this Document. Golder’s opinions are based upon information that existed at the time of the production of the Document. It is understood that the Services provided allowed Golder to form no more than an opinion of the actual conditions of the site at the time the site was visited and cannot be used to assess the effect of any subsequent changes in the quality of the site, or its surroundings, or any laws or regulations.
Any assessments made in this Document are based on the conditions indicated from published sources and the investigation described. No warranty is included, either express or implied, that the actual conditions will conform exactly to the assessments contained in this Document.
Where data supplied by the client or other external sources, including previous site investigation data, have been used, it has been assumed that the information is correct unless otherwise stated. No responsibility is accepted by Golder for incomplete or inaccurate data supplied by others.
Golder may have retained subconsultants affiliated with Golder to provide Services for the benefit of Golder. To the maximum extent allowed by law, the Client acknowledges and agrees it will not have any direct legal recourse to, and waives any claim, demand, or cause of action against, Golder’s affiliated companies, and their employees, officers and directors.
This Document is provided for sole use by the Client and is confidential to it and its professional advisers. No responsibility whatsoever for the contents of this Document will be accepted to any person other than the Client. Any use which a third party makes of this Document, or any reliance on or decisions to be made based on it, is the responsibility of such third parties. Golder accepts no responsibility for damages, if any, suffered by any third party as a result of decisions made or actions based on this Document.
GOLDER ASSOCIATES PTY LTD GAP Form No. LEG 04 RL 1