Embed Size (px)
Citation preview
wwwpresciencepointcom
2
Disclaimer
This research presentation report expresses our research opinions which we have based upon certain facts all of which are based upon publicly available information and all of which are set out in this research presentation report Any investmentinvolves substantial risks including complete loss of capital Any forecasts or estimates are for illustrative purpose only and should not be taken as limitations of the maximum possible loss or gain Any information contained in this report may include forward looking statements expectations and projections You should assume these types of statements expectations and projections may turn out to be incorrect for reasons beyond Prescience Point LLCrsquos control This is not investment advice nor should it be construed as such Use of Prescience Point LLCrsquos research is at your own risk You shoulddo your own research and due diligence before making any investment decision with respect to securities covered herein
You should assume that as of the publication date of any presentation report or letter Prescience Point LLC (possibly alongwith or through our members partners affiliates employees andor consultants) along with our clients andor investors hasa short position in all stocks (andor are long putsshort call options of the stock) covered herein including without limitation LKQ Corporation Inc (ldquoLKQrdquo) and therefore stands to realize significant gains in the event that the price of its stock declines Following publication of any presentation report or letter we intend to continue transacting in the securitiescovered therein and we may be long short or neutral at any time hereafter regardless of our initial recommendation
This is not an offer to sell or a solicitation of an offer to buy any security nor shall any security be offered or sold to anyperson in any jurisdiction in which such offer would be unlawful under the securities laws of such jurisdiction PresciencePoint LLC is not registered as an investment advisor
To the best of our ability and belief as of the date hereof all information contained herein is accurate and reliable and doesnot omit to state material facts necessary to make the statements herein not misleading and all information has been obtained from public sources we believe to be accurate and reliable and who are not insiders or connected persons of the stock covered herein or who may otherwise owe any fiduciary duty or duty of confidentiality to the issuer or to any other person or entity that was breached by the transmission of information to Prescience Point LLC However Prescience Point LLC recognizes that there may be non-public information in the possession of LKQ Corporation Inc or other insiders of LKQ Corporation Inc that has not been publicly disclosed by LKQ Corporation Inc Therefore such information contained herein is presented ldquoas isrdquo without warranty of any kind ndash whether express or implied Prescience Point LLC makes no other representations express or implied as to the accuracy timeliness or completeness of any such information or with regard to the results to be obtained from its use
Report Highlights
00
100
200
300
400
500
600
700
800
900
1000
$000
$500
$1000
$1500
$2000
$2500
$3000
$3500
$4000
1062003 1062005 1062007 1062009 1062011 1062013
Penny s tock promoter RedChipini tiates coverage
Acquires Keystone Auto
for $811m
Co-CEO role created mgmt comp increases Di rector of IR resigns
CFO Mark Spears Resigns
Acquires Euro Car Parts for $347m
Code of Ethics pol icy updated
Acquires Sator issues $600m
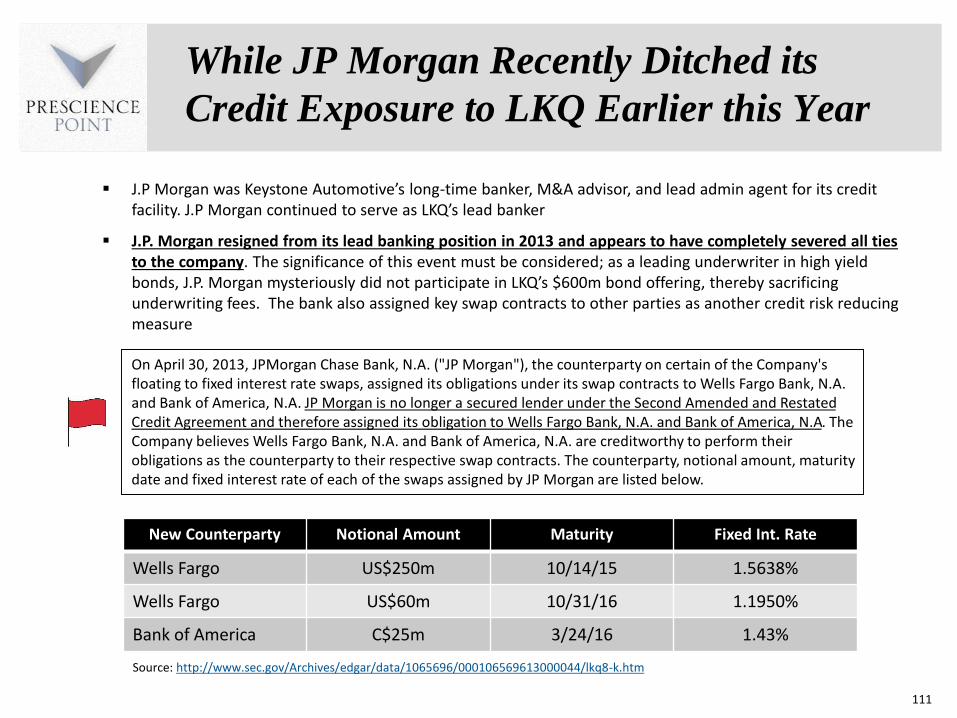
HY bonds JP Morgan resigns
as lead banker
Control ler and Chief Accountant Resigns
Reverses Couse Back to US Targets Acquires Keystone Auto Industries for $450m
4
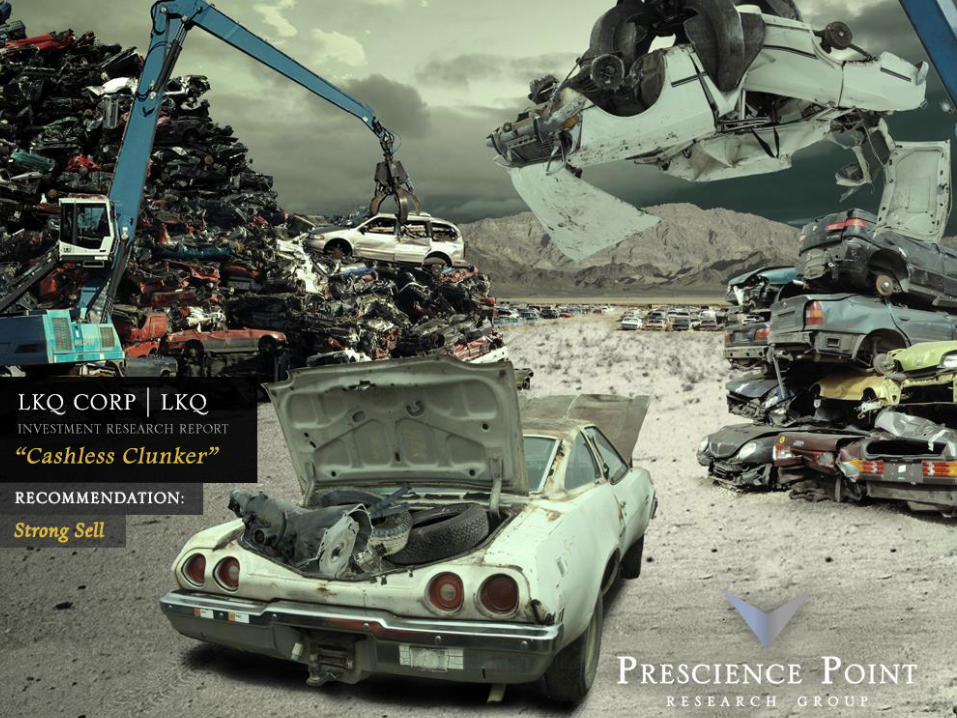
From Penny Stock Promoter to $10bn+
Wall Street Darling The Story of LKQ
5
Prescience Point Believes
Caught in a Massive Margin Squeeze Gross Margins Are In Persistent Decline and Inventory Accounting Methods Are Likely Blunting the True Problems North American Organic Growth Very Likely To Be Overstated and Not Reconcilable to Our Research
1
2
3Problems With the New Growth Story To Divert Attention from its North American Problems LKQ Bolted to Europe in Hopes of Spinning a New Growth Story Our Research Suggests LKQ is Already Facing Problems and Quickly Scrambling to Cover
4
Previous Accounting Fraud and Failures at Waste MgmtDiscovery Zone Associated With Numerous Members of the Management Team Have Cost Shareholders Billions of Lost $rsquos in Aggressive Roll-up Strategies
5
Price Target $10 - $15 per share gtgtgt 50 ndash 70 Downside
Dramatic Overvaluation to Aftermarket Auto Recycling and Industrial Distributors and Supported by Sell-Side Analystsrsquo Failing to Question Assumptions and Not Considering the Fundamental Problems Facing the Company
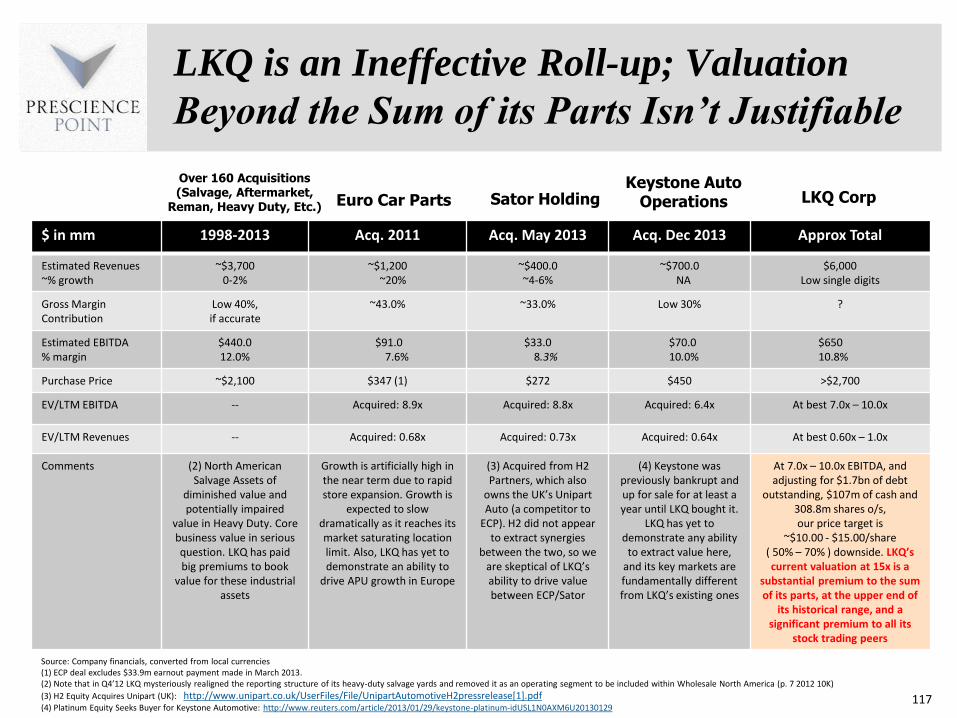
LKQ Is An Ineffective Roll-up The Company Has Generated No Cumulative Free Cash Flow Adjusted for Acquisitions and Becoming Increasingly Dependent on External Capital to Perpetuate the Illusion of GAAP Profits LKQ Will Need Larger and Larger Targets to Keep the Growth Game Alive
6
Report Highlights (contrsquod)
High-Level Indications of Fabricated GAAP Profits Unsustainable Business Model LKQ is a classic roll-up fueling growth through acquisitions Roll-up business models provide management with a significant amount of discretion in presenting financial results Roll-ups tend to exhibit strong earnings CFO and earnings quality metrics due to the inherent financial statement mechanics of paying for growth through acquisition outflows which do not affect earnings or CFO Because of this free cash flow after acquisitions is an important metric for analyzing roll-ups it presents a better picture of the businessrsquos economics LKQrsquos free cash flow after acquisitions has been negative in 8 of the last 9 years
Furthermore our analysis indicates LKQ is an ineffective rollup ndash wealth creation from years of acquisitions has been nil Since 2007 LKQ has reported cumulative Earnings and EBIT of $122B and $215B respectively Meanwhile it has burned cumulative free cash flow after acquisitions of -$162B and raised cumulative net capital of $163B suggesting it has never earned a cash-on-cash return on invested capital Put another way the immense wealth generation represented by LKQrsquos historical GAAP profits is not observable in the companyrsquos cash flows ndash it appears to be lsquopaperrsquo wealth generated by accounting gimmickry
In light of this and a broad array of other red flags discussed in this report we are forced to look through managementrsquos representations We believe the credibility of LKQrsquos financial statements is questionable and that LKQ bears a heightened risk of a crippling inventory andor goodwill write-down or financial restatement
Reported Organic Growth for LKQrsquos North America Business Appears Overstated LKQrsquos aggressive roll-up strategy also gives it a high level of flexibility to inflate revenue growth LKQ reported organic revenue growth averaging ~65 from 2008 ndash 2012 and ~6 for its North America (NA) Parts amp Services (PampS) business (~75 of PampS revenue) with far less variability vs comps and not a single quarter of negative growth LKQ does not provide clarity around the calculation or the impact on earnings making it difficult for investors to confirm its validity However based on our research LKQrsquos reported organic growth rate does not appear reconcilable with trends in the primary fundamental factors that drive it We believe it is overstated We believe LKQrsquos NA growth rate normalized for a 2013 spike in collision frequency more likely measures in the range of 0-2
From 2008 to 2012 annual insurance claims paid for repairable accident claims have been flat according to industry consultant The Romans Group LLC Additionally from 2010 to 2012 growth in Alternative Parts Usage (ldquoAPUrdquo) (ie market share of alternative auto parts which LKQ sells relative to OEM parts) which had risen steadily for 3 decades and was a primary driver of LKQrsquos historical organic growth has flat-lined going forward CCC Information Services ndash provider of the industryrsquos dominant estimate writing platform and LKQrsquos source for APU data ndash expects it to taper or reverse Based on industry data sources and our conversations with industry sources this is resulting from a recent expansion in OEM price-matching programs they have become more aggressive in pursuit of retaking lost market share by undercutting alternative parts prices thereby negating LKQrsquos value proposition Internal dealer documents we have obtained indicate the OEMs are increasingly subsidizing dealers to sell parts at levels 33 below aftermarket list prices (ie LKQrsquos price) making them whole on the loss and paying them an additional 14 profit on the cost for the part (Refer to dealer source document on page 12) As a result for the first time ndash according to Mitchell International ndash parts prices in general deflated in 2012 LKQ management tells investors APU rose 100bp in 2012 however their own data source and LKQrsquos SEC filings refute their claim
7
Report Highlights (contrsquod)
Short-Term Thinking Pervades Decision-Making Signals Desperation to Keep Financials Inflated amp Meet Targets With NA growth waning LKQ looked to Europe for acquisition candidates In Q4rsquo2011 it made its 2nd largest acquisition ever acquiring UK-based Euro Car Parts (ECP) a distributor of mechanical aftermarket parts operating out of 89 branchstore locations As LKQ pitched investors on the open-ended growth opportunity provided by buying ECP to our knowledge it never publicly disclosed that the UK aftermarket parts industry was in significant contraction (2011E -58 according to Datamonitor) or that it is projected to continue contracting but LKQ touted ECPrsquos 30+ lsquoorganicrsquo revenue growth rate from 2009-2011
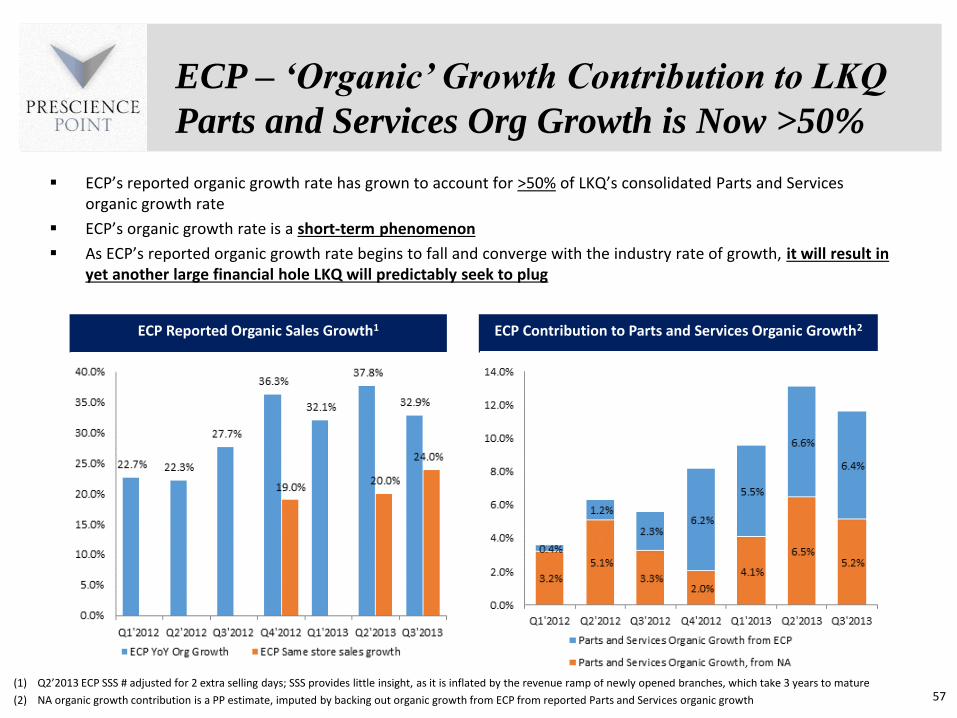
Now 2 years separated from the date of acquisition and with its industry still weak LKQ continues to report 30 organic growth rates for ECP which would seem to defy logic It shouldnrsquot LKQ does not define ECPrsquos lsquoorganic growthrsquo in the way investors might expect for a business characterized by storefronts (ie as same store sales growth) it defines it to include both SSS and revenue generated by newly opened ECP stores As such LKQrsquos reported organic growth rate is fueled by opening new ECP branches the more new ECP stores LKQ opens in a given period the more it can inflate its consolidated organic growth rate
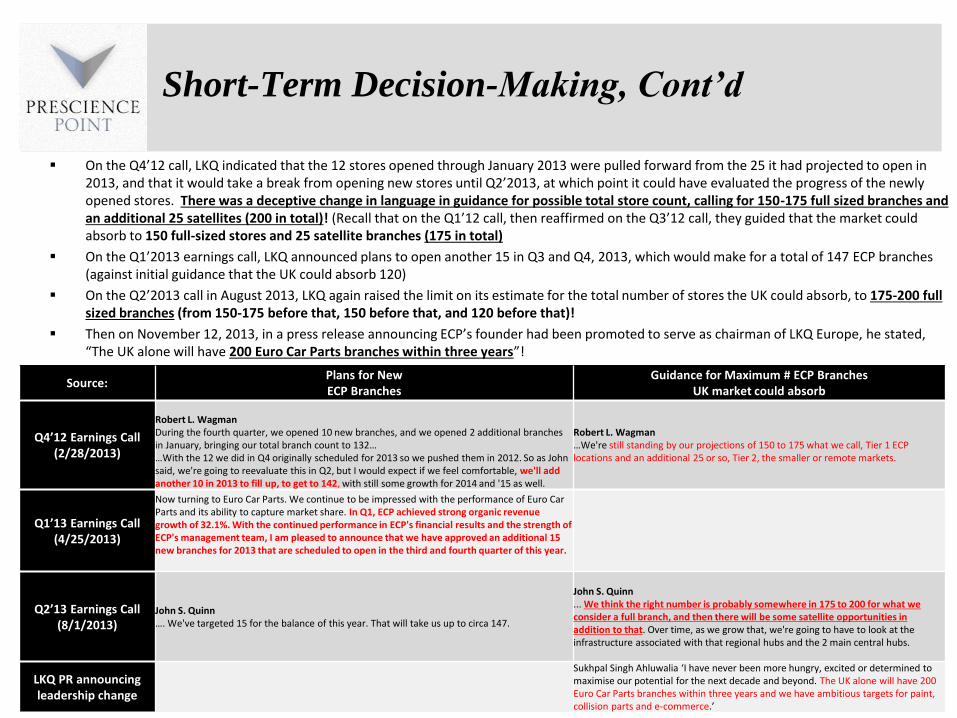
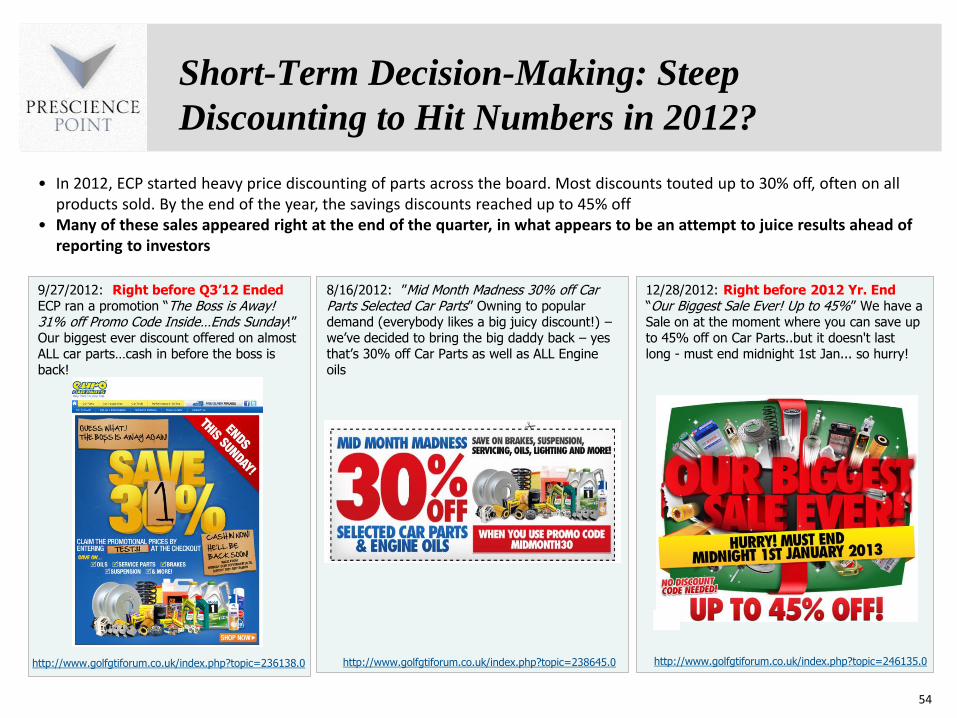
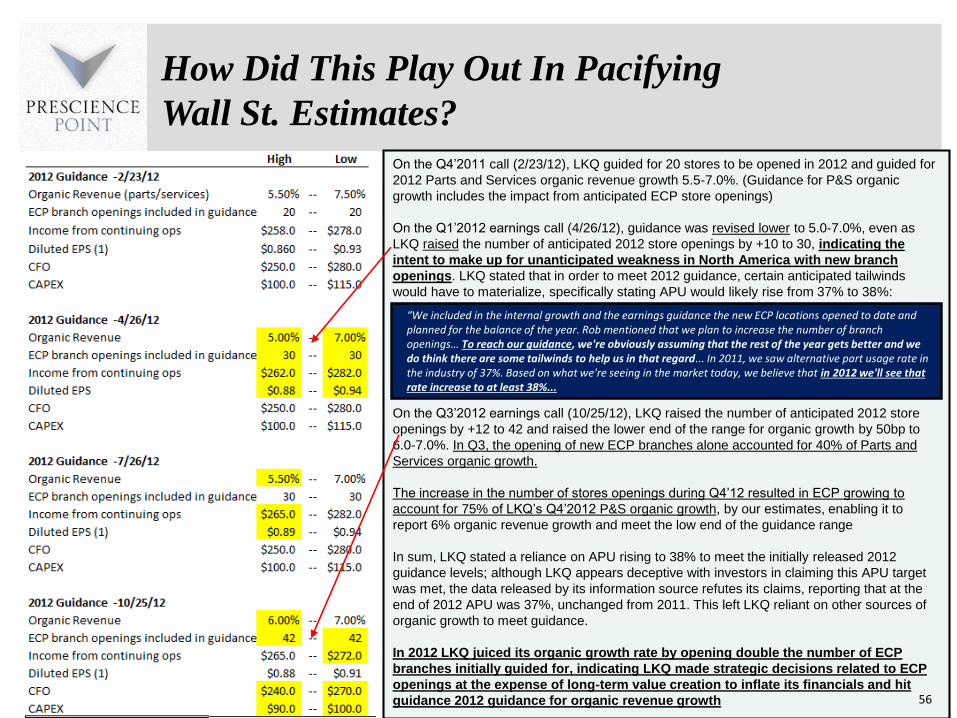
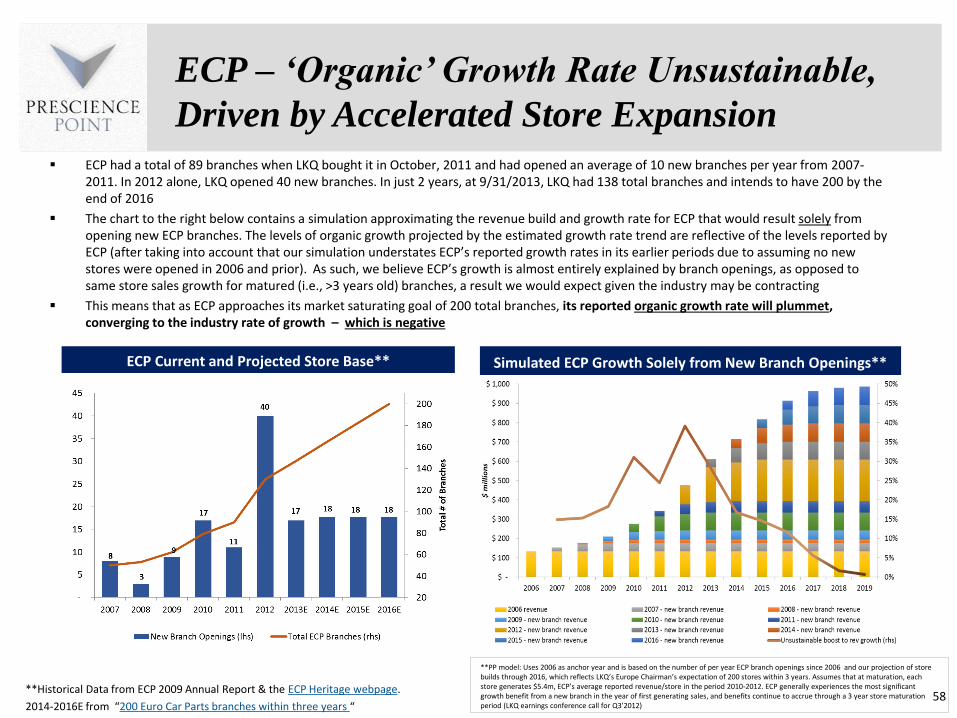
Rapidly expanding the number of ECP branches was not an LKQ priority when it announced the acquisition evident in guidance issued on LKQrsquos ECP MampA call (held on 10411) ldquowe have a plan to grow 10 to 12 branches per year for the next few yearshellip to complete out the major UK marketsrdquo Within just a few months ndash apparently a direct response to NA growth weakening and the threat of a guidance miss ndash LKQ abandoned its plan throughout 2012 it repeatedly raised its guidance for the number of stores to be opened in 2012 from 20 to 30 and finally to 42 By Q4rsquo2012 based on our estimates ECP accounted for a full 75 of consolidated PampS organic growth up from ~4 only one year prior In 2012 ECP also started running periodic steep online sales promotions (30-45 discounts) of parts across the board ndash with many promotions implemented right at the end of the quarter just ahead of reporting to investors indicating an obsessive desire to meet financial estimates The combination of a ramp-up in branch openings and steep discounting juiced LKQrsquos organic growth rate just enough for it to hit the low end of guidance for 2012 PampS organic growth
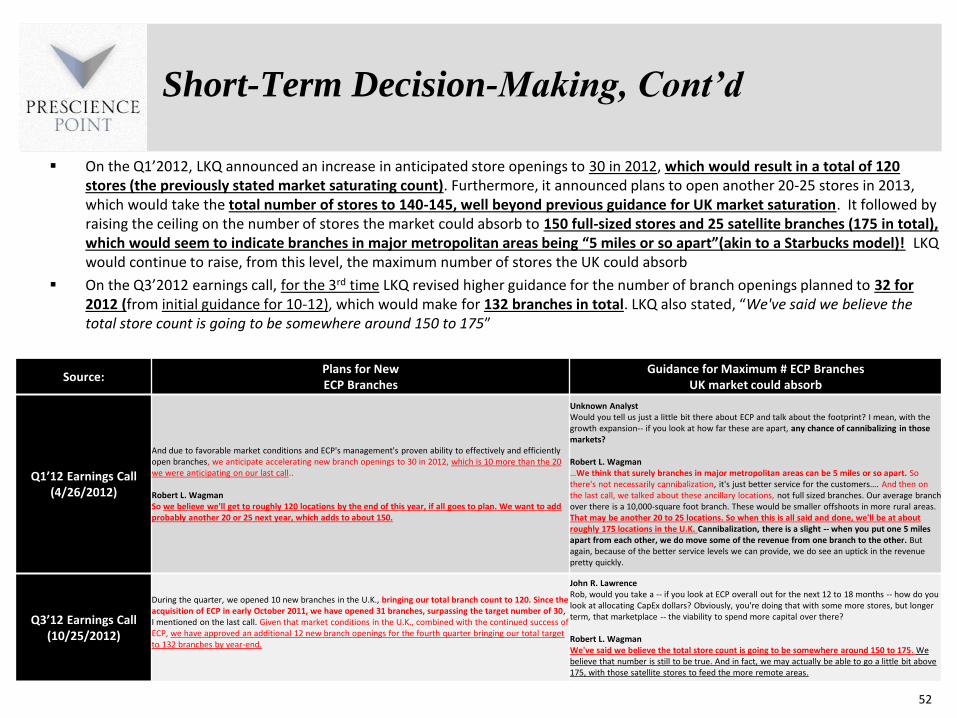
LKQ has also repeatedly raised guidance for the maximum number of full-sized ECP branches the UK market can absorb from 120 to 150 to 175 to 200 giving it further room to continue ramping the number of branch locations At YErsquo2012 LKQ operated 130 branches in only one year surpassing the store count it initially guided would result in saturation of the UK market 120 On the Q1rsquo2012 earnings call LKQ CEO Wagman raised his projection for the market-saturating branch count to 150 stating that at that number ldquobranches in major metropolitan areas can be 5 miles or so apartrdquo and that ldquotheres not necessarily cannibalizationrdquo should they be LKQ has since raised the ceiling on the maximum branch count to 200 hinting of desperation
LKQ appears to operate ECP with the primary intent of unsustainably inflating its financials and meeting guidance targets at the long term shareholder expense of entrenchment in a contracting market Inevitably as ECP reaches its market saturating location capacity we expect ndash and we believe management has anticipated ndash its reported organic growth rate to plummet and converge to the industry average
8
Report Highlights (contrsquod)
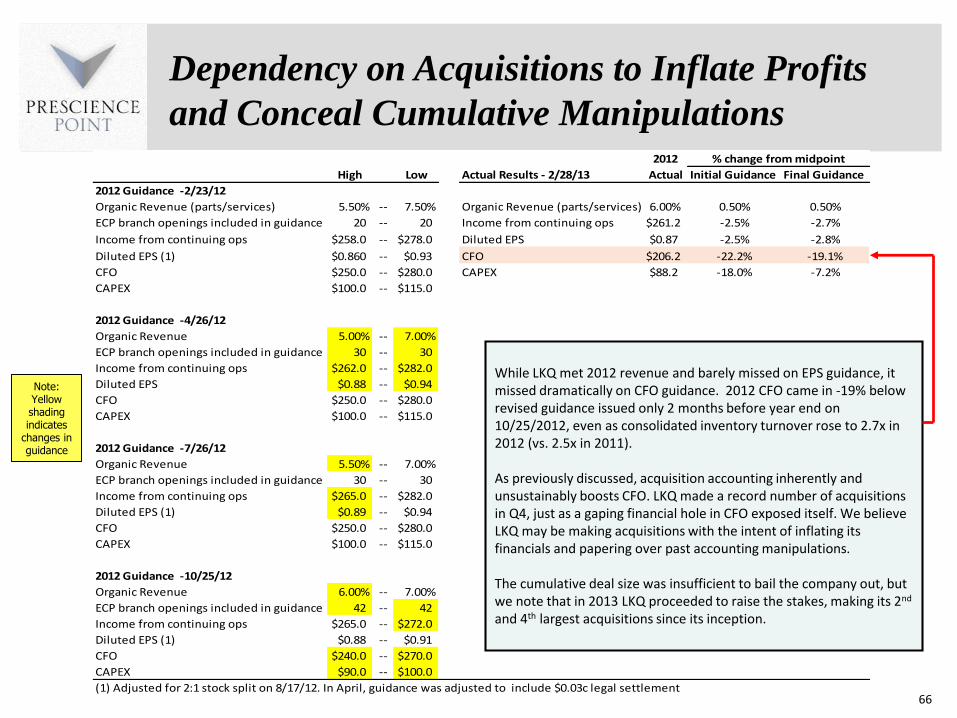
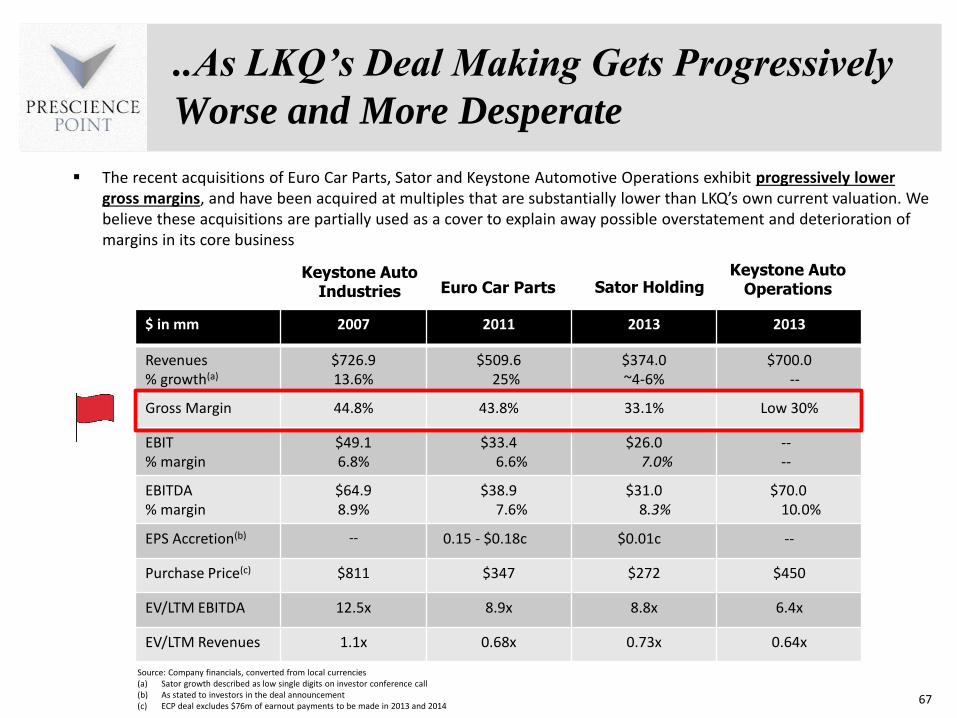
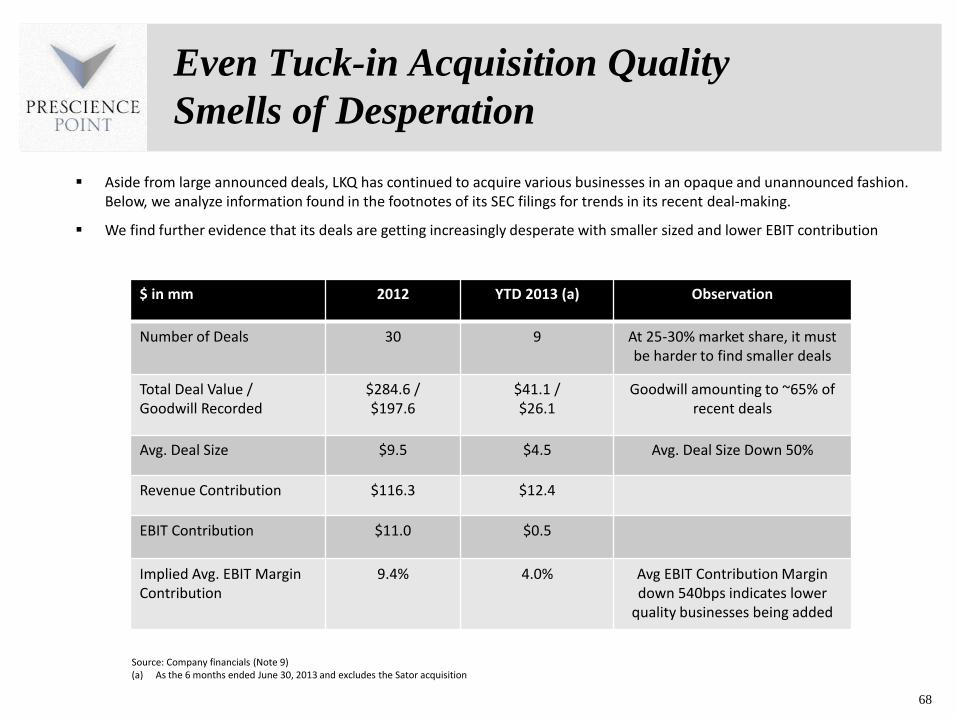
Increasing Dependency on Acquisitions to Inflate Financials Conceal Cumulative Manipulations LKQrsquos gross margins have been in persistent decline contracting from 471 to 41 from FY 2005 to the LTM period ended 9302013 We believe the decline is in part the result of the reversal of cumulative past accounting manipulations while at the same time competitive and pricing pressures are intensifying it appears that over time LKQrsquos is growing increasingly dependent on ever larger acquisitions to prevent an unraveling of its financials As previously mentioned due to the inherent mechanics of acquisition accounting acquisitions have a flattering but unsustainable effect on earnings and CFO that has nothing to do with the performance of the business When the benefit expires a hole is left to be filled in its place just to maintain the status quo
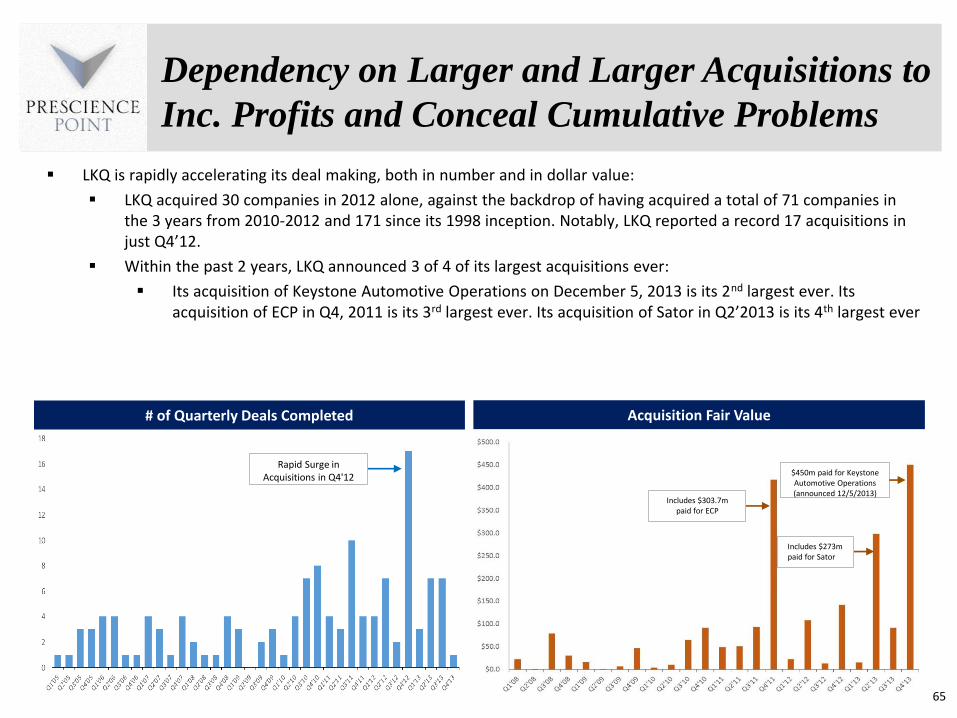
LKQ has been rapidly accelerating its deal making both in quantity of deals and in dollar value Within the past 2 years LKQ has made 3 of 4 of its largest acquisitions ever LKQ acquired 30 companies in 2012 alone against the backdrop of having acquired a total of 71 companies in the 3 years from 2010-2012 and over 170 since its 1998 inception Notably LKQ reported a record 17 acquisitions in just Q4rsquo12
Yet despite this LKQ missed dramatically on 2012 CFO guidance which came in 19 below revised guidance issued on 10252012 only 2 months before year end Making the most acquisitions it has ever made in a quarter a gaping hole in CFO exposed itself indicates LKQ may be making acquisitions as we believe in order to inflate its financials and paper over past accounting manipulations Management justified the miss as primarily attributable to an investment in inventory that wasnrsquot exactly anticipated An alternative explanation is that the cumulative deal size was insufficient to bail the company out
We believe LKQ entered Europe in search of a fresh pool of large-scale acquisition targets After purchasing ECP ndash its 2nd largest purchase ever at the time ndashin Q4rsquo2011 LKQ began unsustainably juicing its organic revenue growth rate via the rabid opening of ECP stores something completely outside of its plans for the company when it acquired the company Because of these openings ECP currently accounts for ~50 of LKQrsquos organic revenue growth We believe as ECP branch openings slow and new stores mature its reported organic growth rate will plummet from current levels converging to the negative industry rate of growth and resulting in a new hole LKQ will predictably seek to plug with more acquisitions Operating ECP as it has with seemingly little regard for building long term value may be an indication of desperation to keep its financials together as it searched for a larger target
LKQ moved quickly buying mainland European company Sator in April 2013 amounting to its 3rd largest purchase ever at the time As a result its European reporting segment now includes both ECP and Sator This new reporting will obscure future financial deterioration at ECP
In December 2013 it acquired Keystone Automotive Operations a company distributing a fundamentally different type of automotive product from that of its core business The acquisition was LKQrsquos 2nd largest ever
We believe managementrsquos short-term focus on managing the business to hit financial guidance is unsustainable LKQrsquos increased pace of deal making as gross margins deteriorate are supportive of questioning the companyrsquos motives
9
Report Highlights (contrsquod)
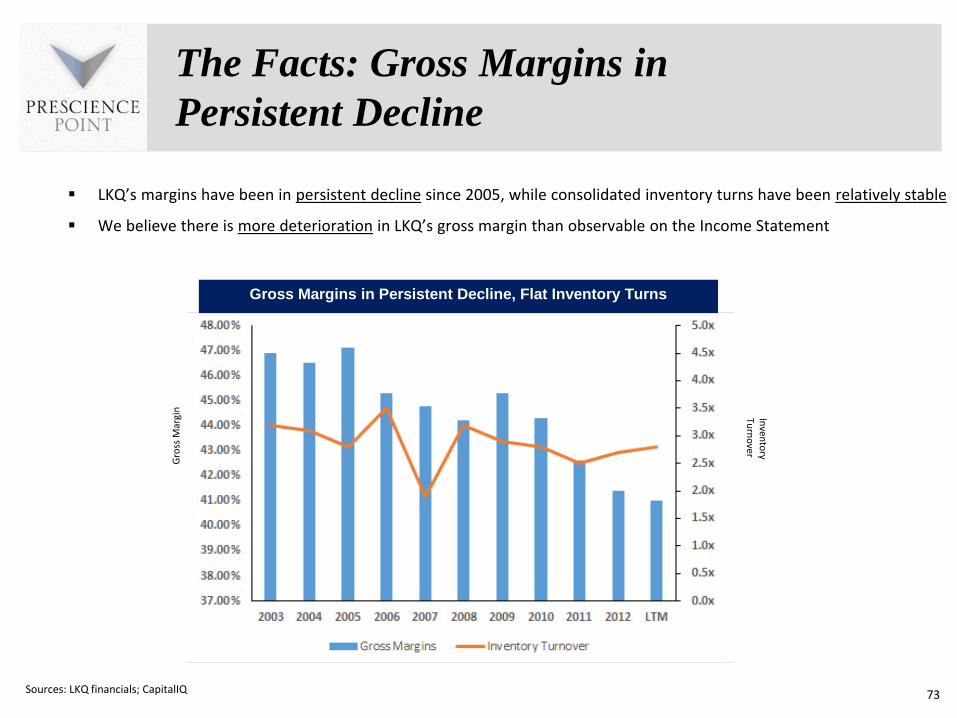
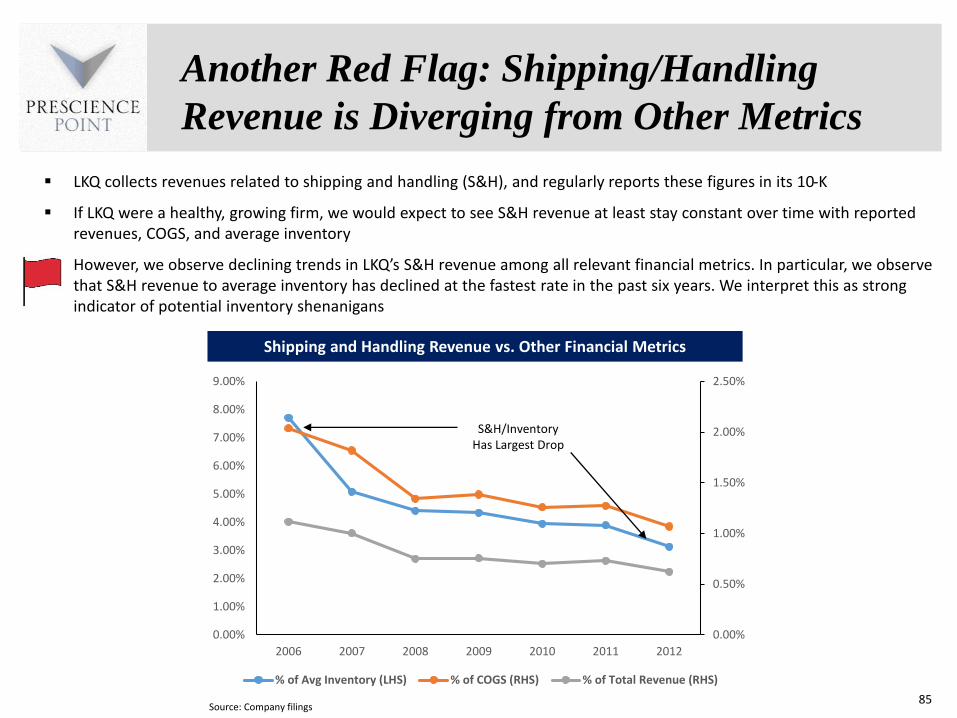
Gross Margins (GMs) Appear Inflated as Inventory Turnover is Stable Caught in a massive margin squeeze with used auto parts prices deflating and salvage vehicles rising LKQrsquos GMs have been in persistent decline since 2005 down 590bps while consolidated inventory turns have been relatively stable We believe there is more deterioration in LKQrsquos GMs than observable on the Income Statement We believe LKQ may pull 2 primary accounting levers to manipulate GMs and inventory turns
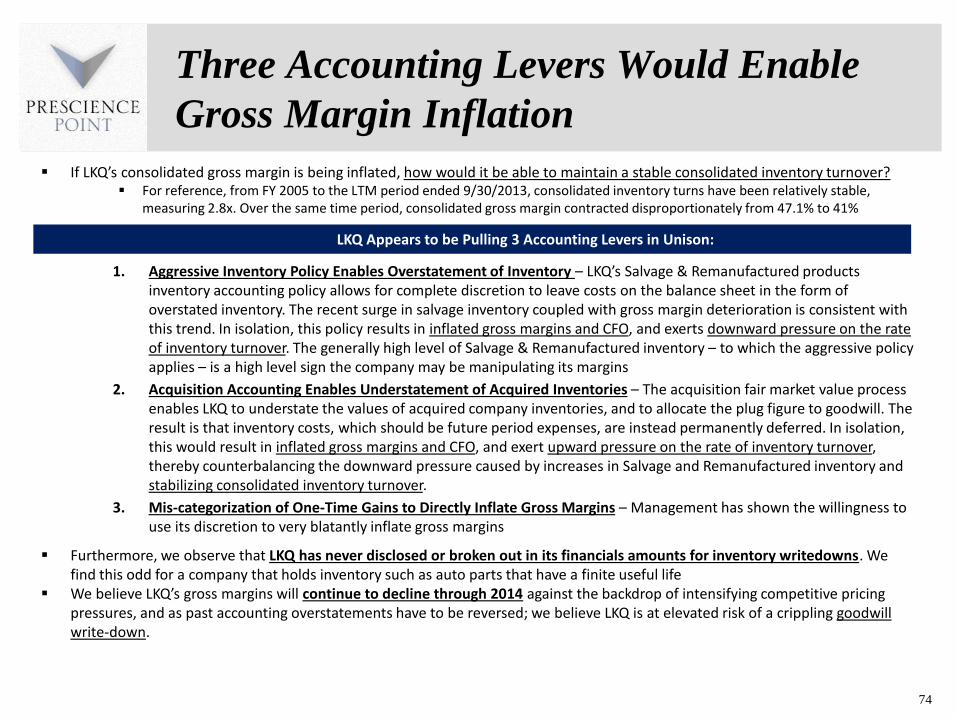
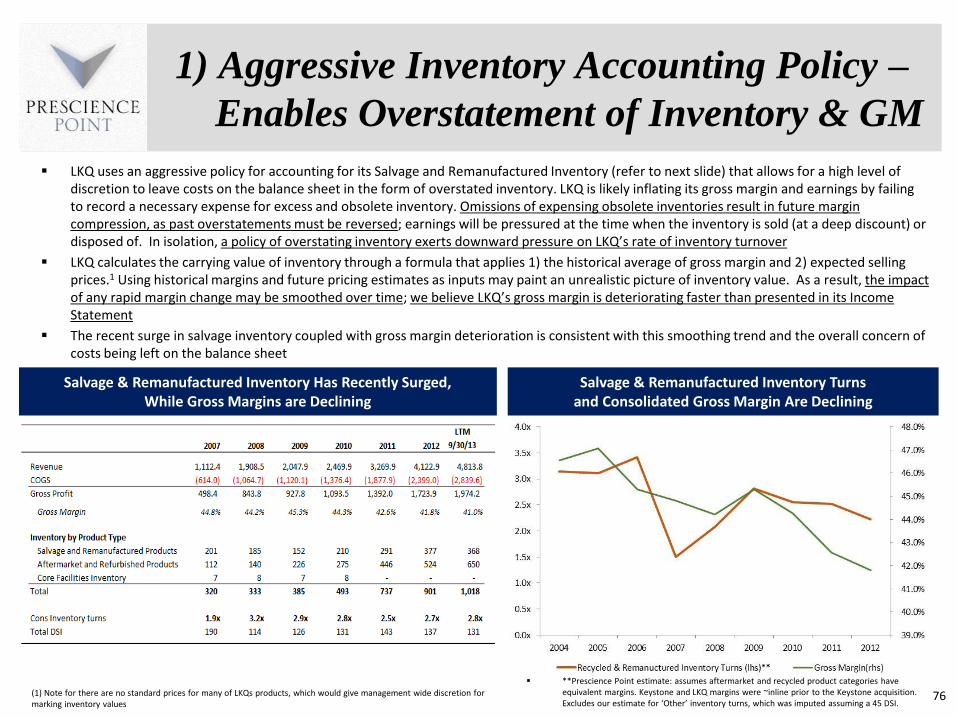
1 Aggressive Inventory Policy Enables Overstatement of Inventory ndash LKQ uses an aggressive policy for accounting for its Salvage and Remanufactured Inventory that allows for a high level of discretion which management can use to inflate gross margin by leaving costs on the balance sheet in the form of overstated inventory The recent surge in LKQrsquos salvage inventory coupled with gross margin deterioration is consistent with this trend and the overall concern of costs being left on the balance sheet In isolation this policy results in inflated gross margins and CFO and exerts downward pressure on the rate of inventory turnover The generally high level of Salvage amp Remanufactured inventory ndash to which the aggressive policy applies ndash is a high level sign the company may be manipulating its margins We believe LKQ is likely inflating its gross margin and earnings by failing to record a necessary expense for excess and obsolete inventory Omissions of expensing obsolete inventories result in future margin compression
But the surge in Salvage amp Remanufactured inventory the account subject to the aggressive inventory accounting policy serves as a higher level sign that margins and CFO may be manipulated How would LKQ be able to keep consolidated inventory turns from declining in the face of GM manipulation
2 Acquisition Accounting Enables Understatement of Acquired Inventories ndash The acquisition fair market value process enables LKQ to understate the values of acquired company inventories and to allocate the plug figure to goodwill The result is that inventory costs which should be future period expenses can be instead permanently deferred Based on conversations with a recycled auto consultant who consults recycled parts distributors that are selling to LKQ we estimate acquired inventory values make up 33-67 of the acquisition purchase price (adjusted for real estate) From 2003-2012 LKQ has allocated only 227 of the cumulative acquisition purchase price (ex PPampE) to inventory which would be consistent with utilizing this policy In isolation this would result in inflated gross margins and CFO and exert upward pressure on the rate of inventory turnover thereby counterbalancing the downward pressure caused by increases in Salvage and Remanufactured inventory and stabilizing consolidated inventory turnover
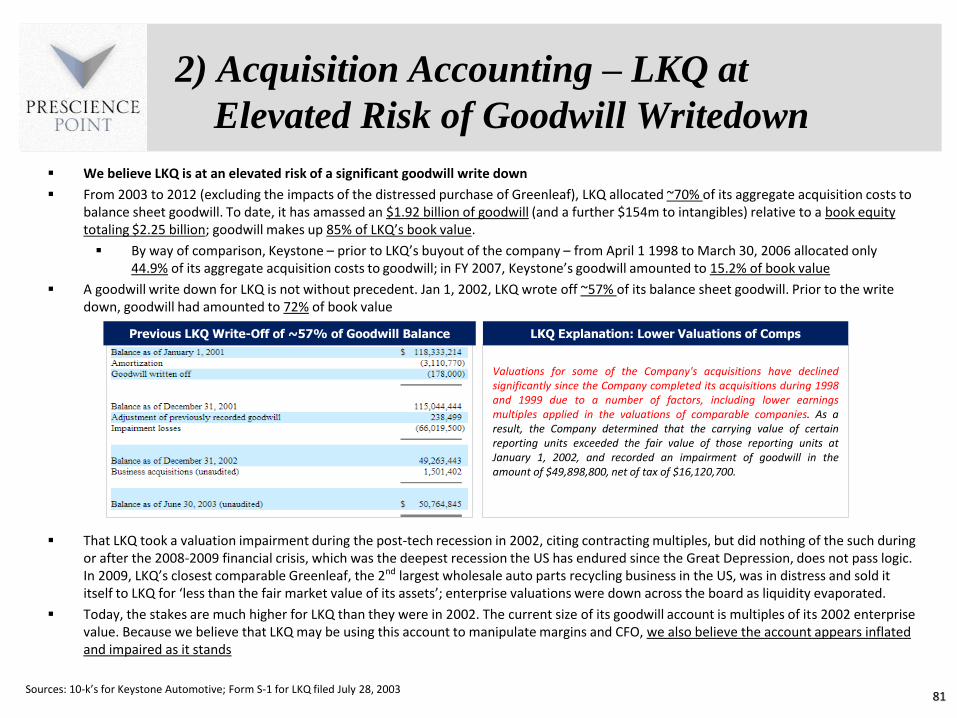
We believe LKQrsquos GMs will continue to decline through 2014 against the backdrop of intensifying pricing pressures and as past accounting overstatements have to be reversed we believe LKQ is at elevated risk of a crippling goodwill write-down As of 93013 LKQ carries $21bn of goodwill + intangibles on its balance sheet (47 of Assets 92 of Book Equity) for a collection of industrial assets that would ordinarily sell for little premium to book value We note that LKQ attempts to explain GMs declining as a function of rising costs to acquire salvage vehicles However the Manheim Index peaked in 2011 and has already started to decline When asked for guidance on a sustainable gross margin target LKQ still cannot give investors any clear guidance on the matter and now cites the move into Europe as a complicating factor for the decline
10
Report Highlights (contrsquod)
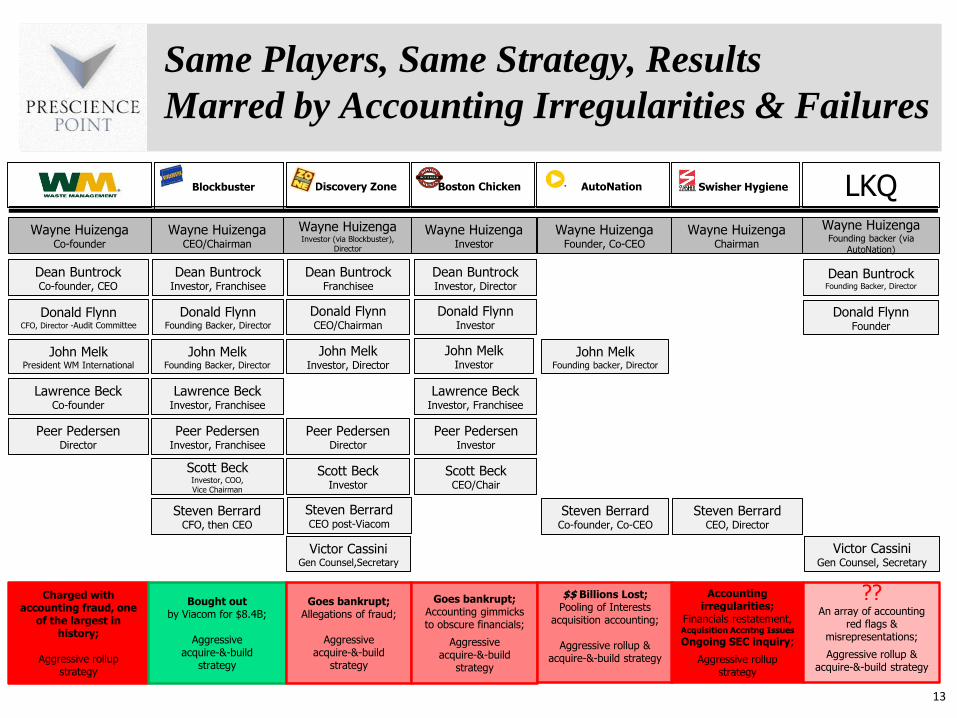
LKQrsquos Business Strategy and Trajectory Right out of the Waste Management Playbook LKQ was founded in 1998 by Donald Flynn with the financial backing of Dean Buntrock and AutoNation Inc led by Wayne Huizenga Flynn Buntrock and Huizenga were all previously executives of Waste Management Inc (WM) a company notorious for having perpetrated a massive multi-year financial fraud resulting in the largest restatement in corporate history at the time
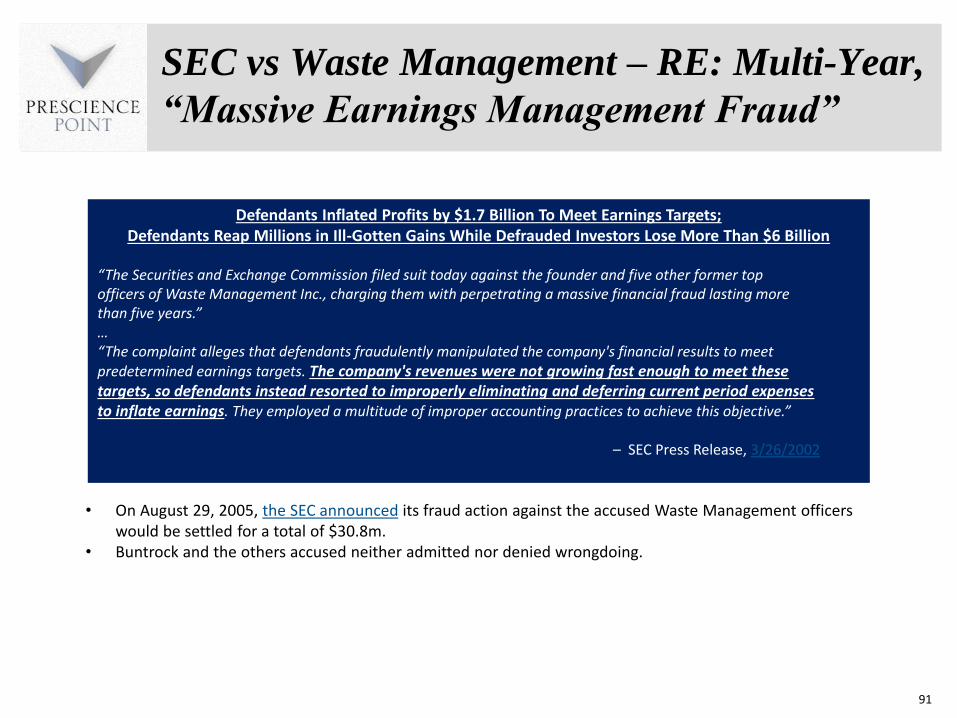
Following a board-led probe of the companyrsquos accounting practices in 1997 WM was forced to restate its financial statements for the period 1992 ndashQ3rsquo1997 acknowledging that it had misstated its pre-tax earnings by approximately $17 billion and took a $35 billion charge The SEC charged certain executives with financial fraud According to the SEC complaint ldquodefendants fraudulently manipulated the companys financial results to meet predetermined earnings targets The companys revenues were not growing fast enough to meet these targets so defendants instead resorted to improperly eliminating and deferring current period expenses to inflate earningsrdquobull Donald Flynn (LKQrsquos founder) was a Waste Management Audit Committee member from 1994 until 1997 ndash a period at the heart of the perpetuation
of the fraud ndashand also served as Audit Committee Chairman during a period coinciding with the fraud He was previously WMrsquos CFO from 1972 ndash1989
bull Dean Buntrock (an LKQ founding backer amp former director) co-founded WM with Wayne Huizenga (LKQ founding backer) Buntrock was WMrsquos CEO during the period of the fraud and according to the SEC complaint ldquothe driving force behind the fraudrdquo
Waste Managementrsquos aggressive rollup strategy gave its management a high level of flexibility to inflate revenue growth and margins and to conceal doing so for years Many individuals previously associated with Waste Management would go on to build businesses using the WM playbook Specifically a closely-knit group of WM alumni and associates (including LKQrsquos founders) have repeatedly co-invested in and built several companies with each company replicating WMrsquos aggressive roll-up or an acquire-and-build strategy either setting out to consolidating a fragmented industry or flooding an industry with store openings in an effort to build a dominant market position as quickly as possible Some of these companies include Blockbuster Video Discovery Zone Boston Chicken AutoNation Swisher Hygiene and LKQ
Many of these companies have either failed to deliver on their sales pitches to investors failed outright or were tarred by allegations of fraud manipulative accounting andor unjust management enrichment Based on our analysis in the majority of cases these WM alums and associates built businesses with the intent to create the illusion of growth as opposed to focusing on creating value through operational excellence resulting in little to no lasting value
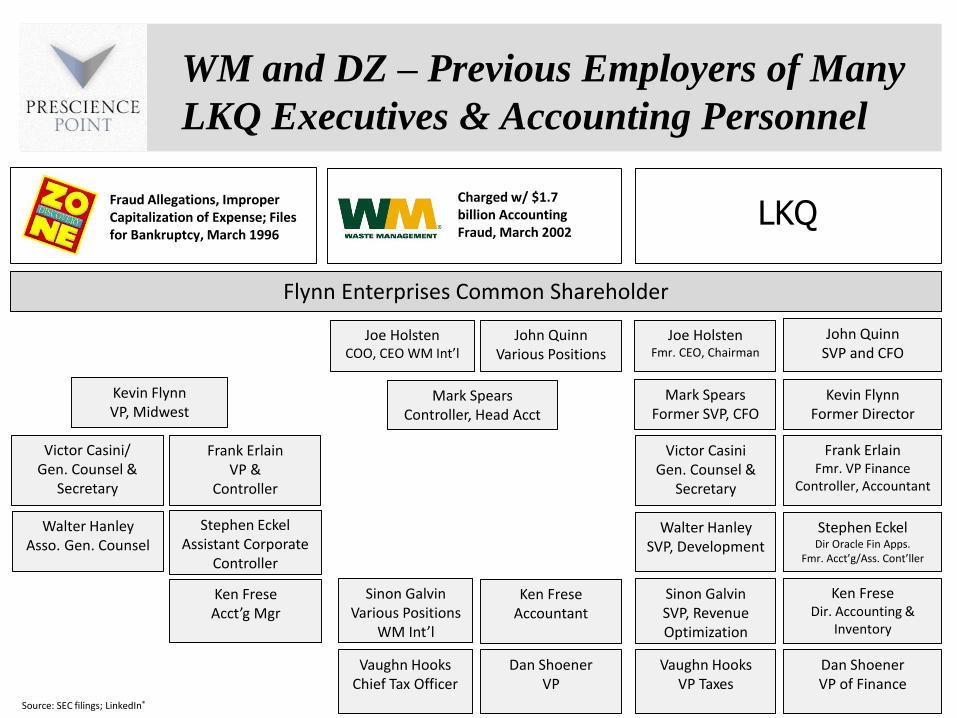
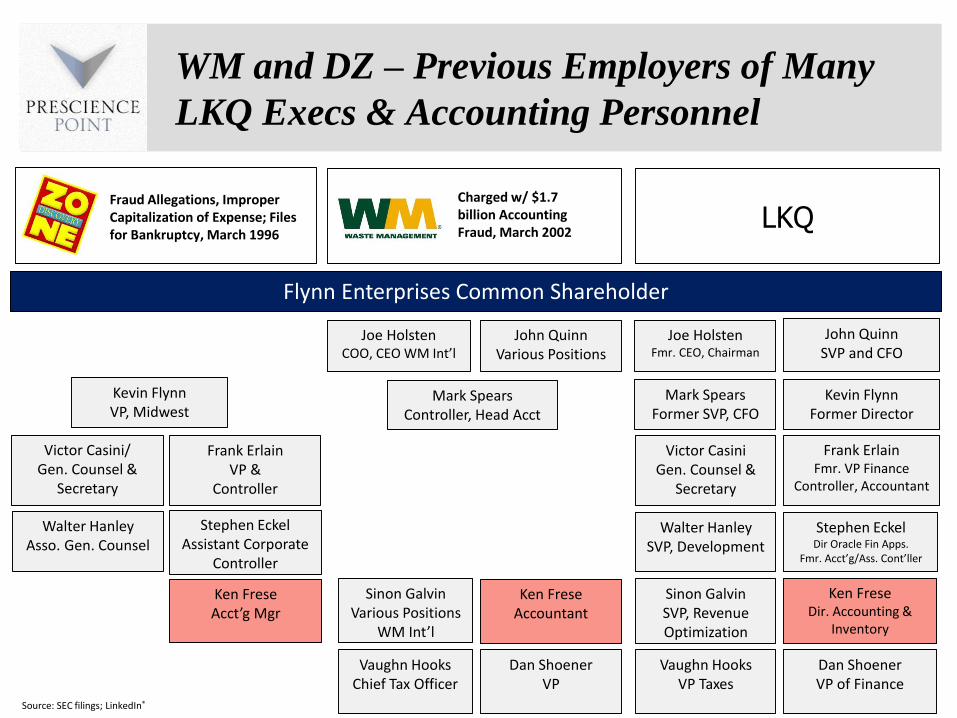
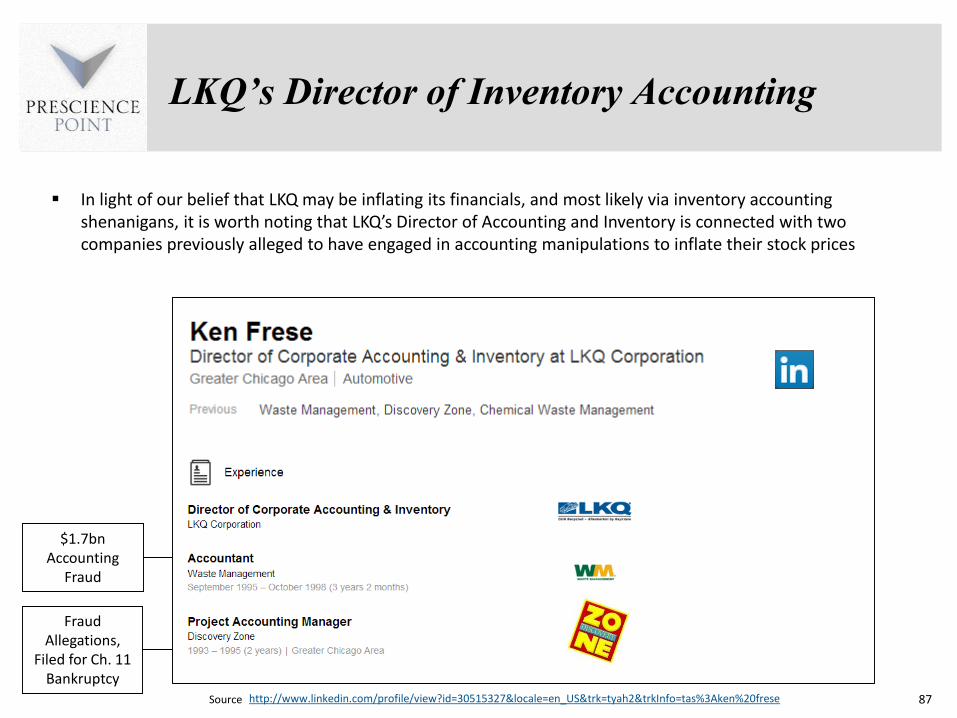
In light of our belief that LKQ is inflating its financials it is worth noting that Discovery Zone another company previously founded by LKQ founder Donald Flynn ndash and in which Dean Buntrock Wayne Huizenga and several other WM alums were associated -- similarly utilized an acquire-and-build strategy It ended up in bankruptcy and was alleged to have engaged in accounting manipulations Many current and former officers ndash notably accounting officers ndash from both WM and Discovery Zone are current and former accounting officers with LKQ (refer to page 13) We also note that in light of our opinion that LKQ may be engaging in inventory accounting shenanigans LKQrsquos Director of Accounting and Inventory was previously employed by both WM and Discovery Zone
11
Report Highlights (contrsquod)
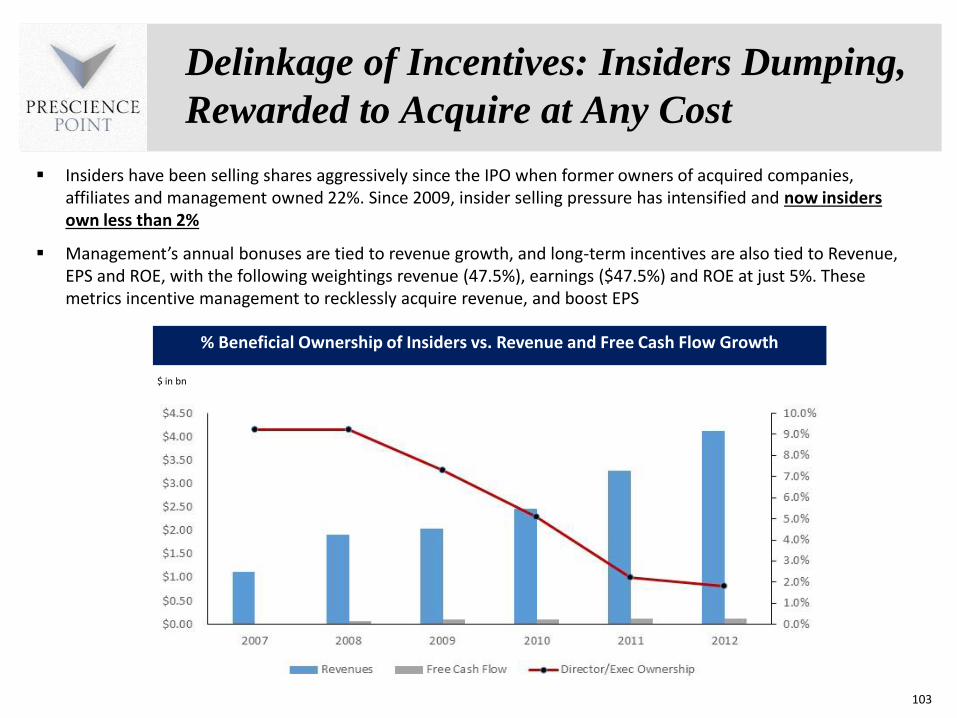
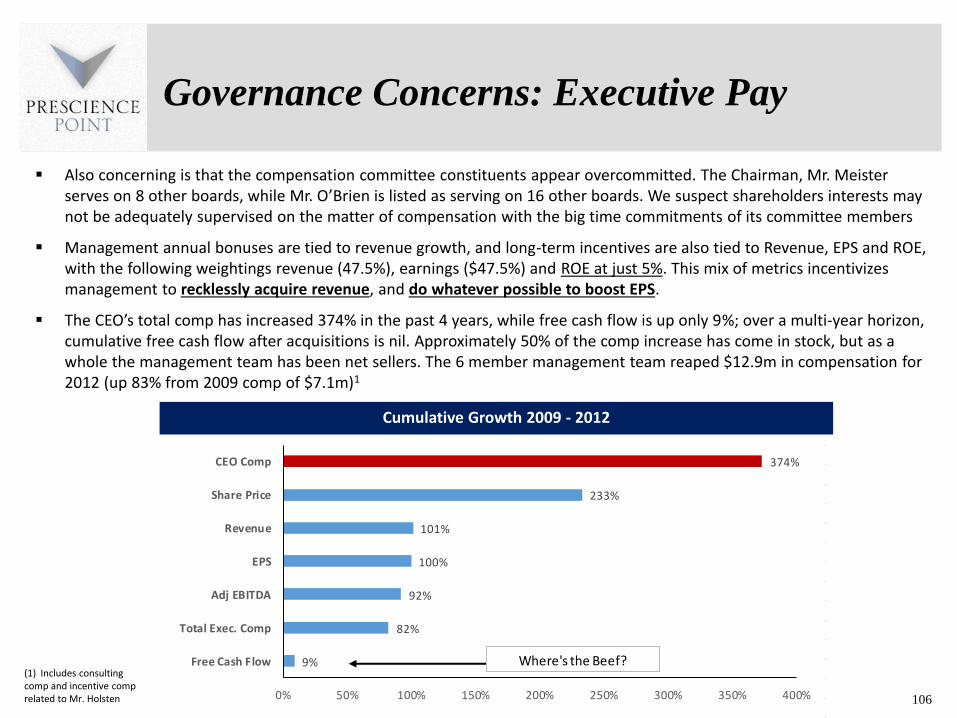
Flawed Corporate Governance Rewards Bad Practice We believe that managementrsquos incentive structure is at the foundation of its failed capital allocation record Management is rewarded by the roll-up strategy with annual bonuses and incentives incentivizing empire-building at any cost Annual bonuses are tied to revenue growth and long-term incentives are tied to Revenue EPS and ROE with the following weightings revenue (475) earnings (475) and ROE (5) There are no stipulations that revenue has to be organic and therefore the management team is perfectly incentivized to acquire and overpay for revenue and game the accounting to inflate profits
The CEOrsquos total comp has increased 374 in the past 4 years while free cash flow is up only 9 in the same period Approximately 50 of the comp increase has come in stock but as a whole the management team has been net sellers of stock Insiders have sold shares aggressively since the IPO when former owners of acquired companies affiliates and management owned 22 Since 2009 insider selling pressure has intensified with insiders currently owning less than 2 Insiders even sold stock recently in Dec 2013 just days after touting the merits of the Keystone deal There is now an almost complete break in the linkage between shareholder interests and executive wealth
In another cautionary sign in an 8-K filing during April LKQ revealed that JP Morgan was no longer a secured lender under its credit agreement JP Morgan had supported both Keystone and LKQ for a number of years While we do not know the why the relationship was severed when a bulge bracket investment bank turns away from a fee generating client of LKQrsquos size there is risk of smoke before fire
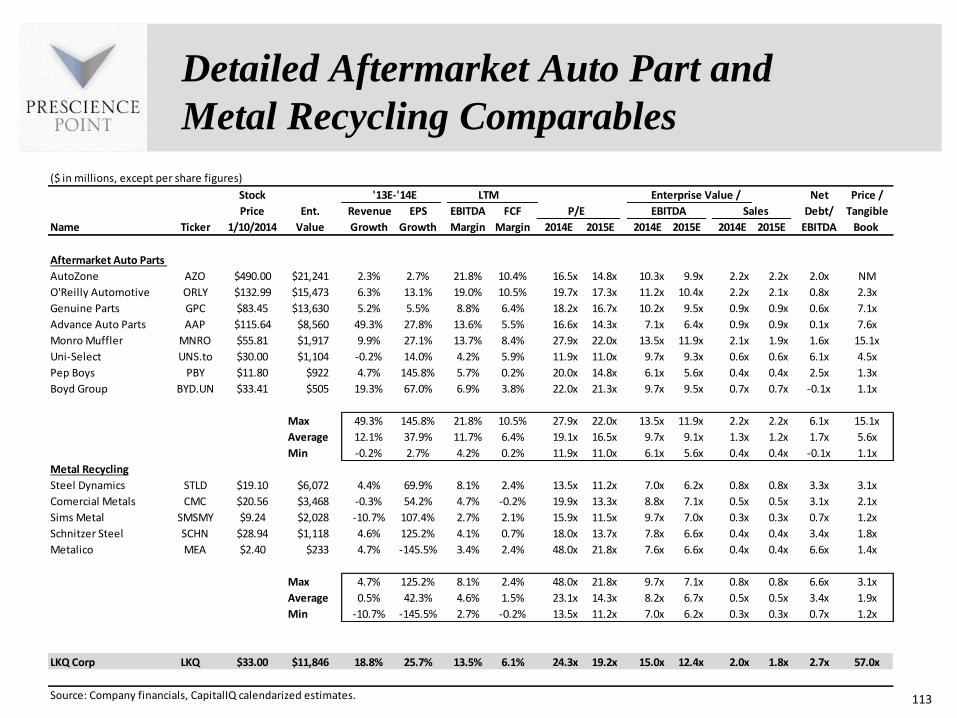
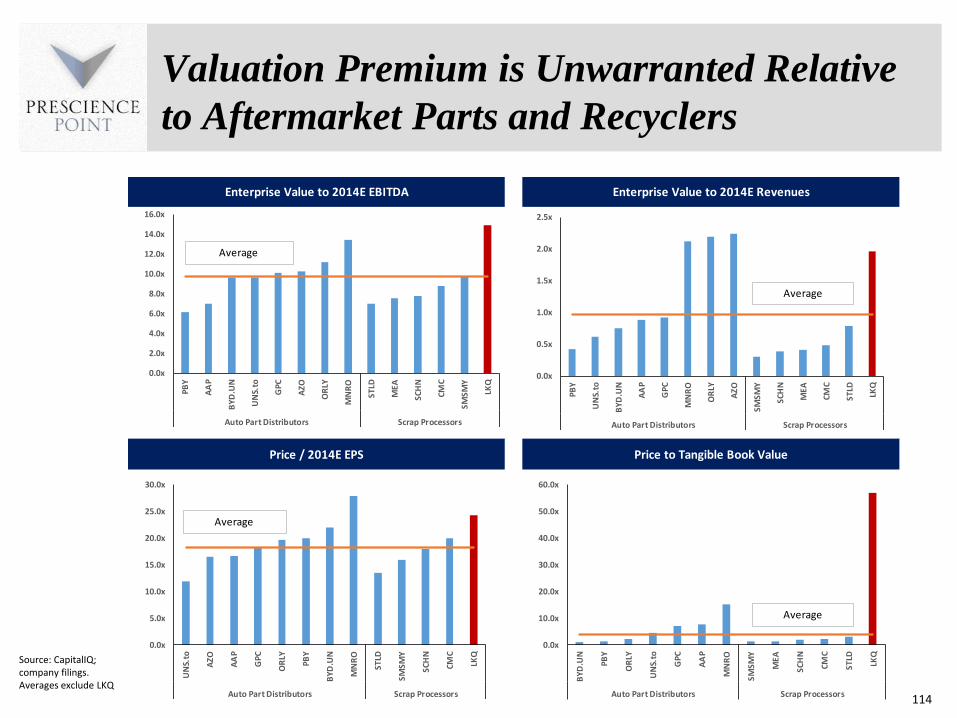
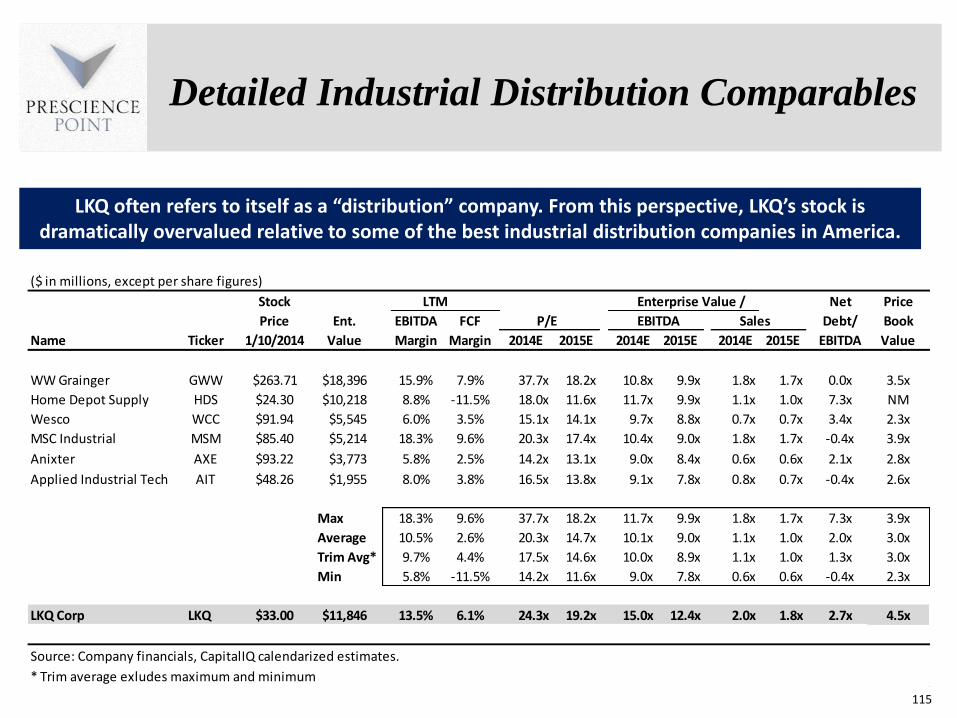
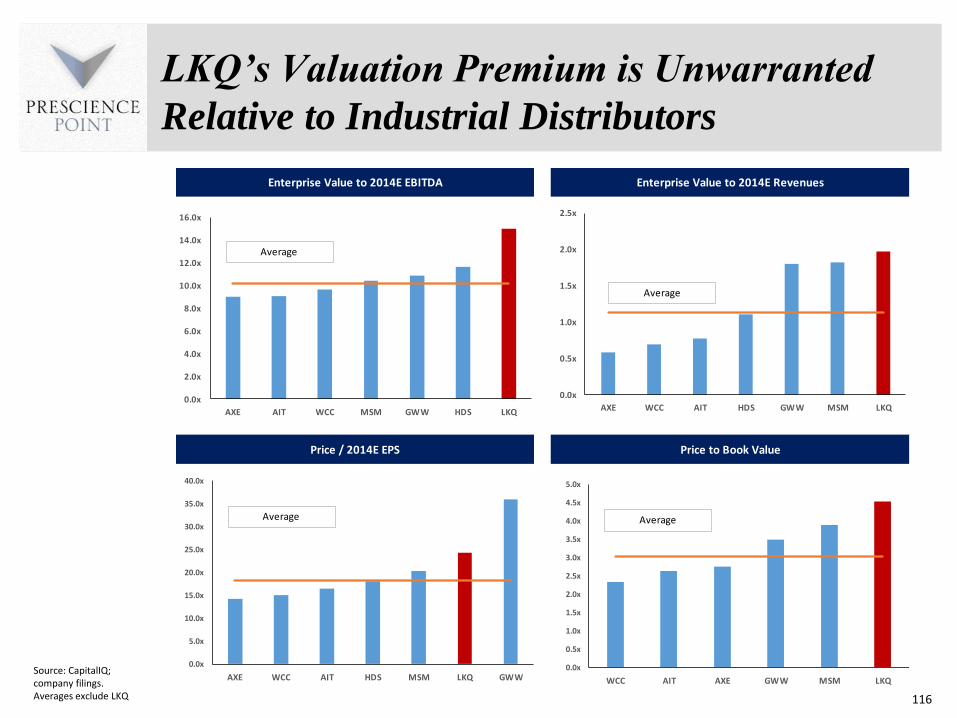
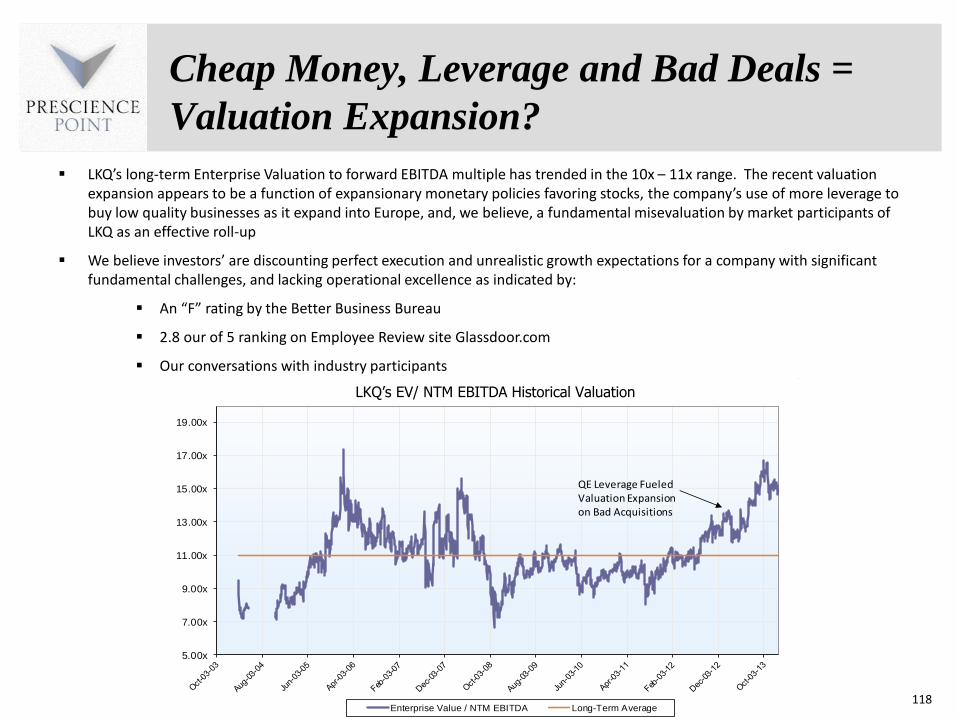
Valuation as a ldquoPremium Midcap Growth Storyrdquo is Unwarranted We believe The Streetrsquos view of LKQ as a proven acquirer with an ldquoopen-endedrdquo growth opportunity does not stand the test of logic Trading at 2x 15x and 25x 2014E sales EBITDA and EPS respectively LKQrsquos stock is priced at an unjustified premium to Aftermarket Auto Metal Recyclers and Industrial Distribution peers and fails to reflect few if any of the serious issues our research highlights Specifically our analysis indicates LKQ appears to be engaging in aggressive deal-making and accounting to manufacture GAAP profits and appears to make bad economic business decisions in order to meet predetermined financial targets We believe that management has taken to masking the companyrsquos weakening growth prospects by gaming the accounting to inflate organic growth and that it is dependent on ever-larger acquisitions to keep the growth story alive while insiders cash out As a result of our concerns over the integrity of its financial reporting we believe LKQ is at high risk of having to restate its historical financial results We believe the growth story management has spun to investors is a bill of goods Given concerns about the reliability of its financial statements we believe the company has an intrinsic value of $10 ndash $15 per share close to its book value representing 50-70 downside from the current price
12
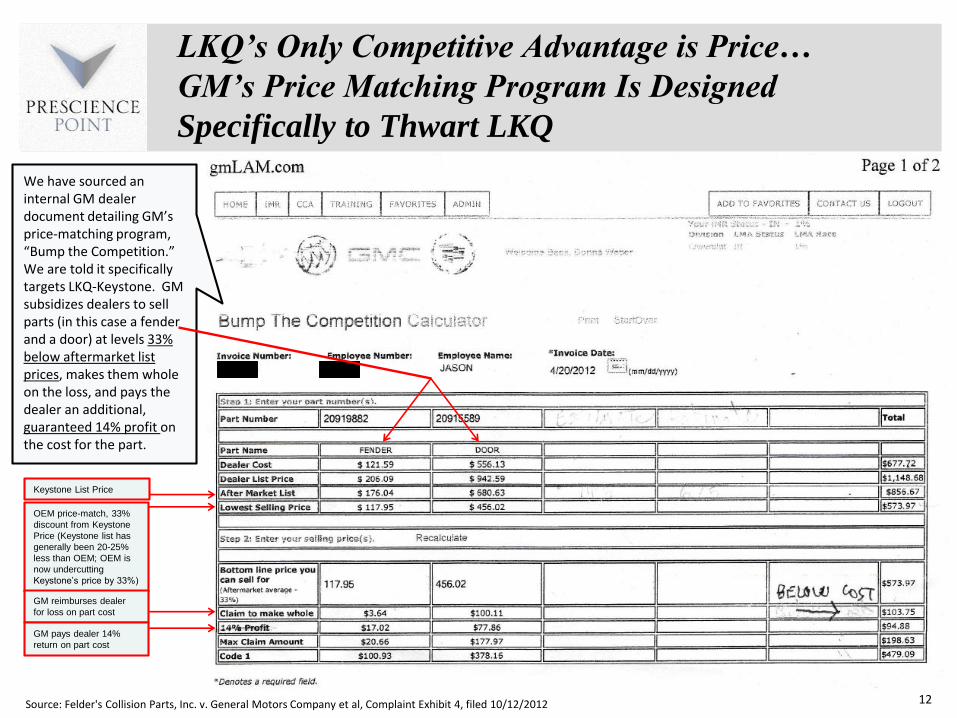
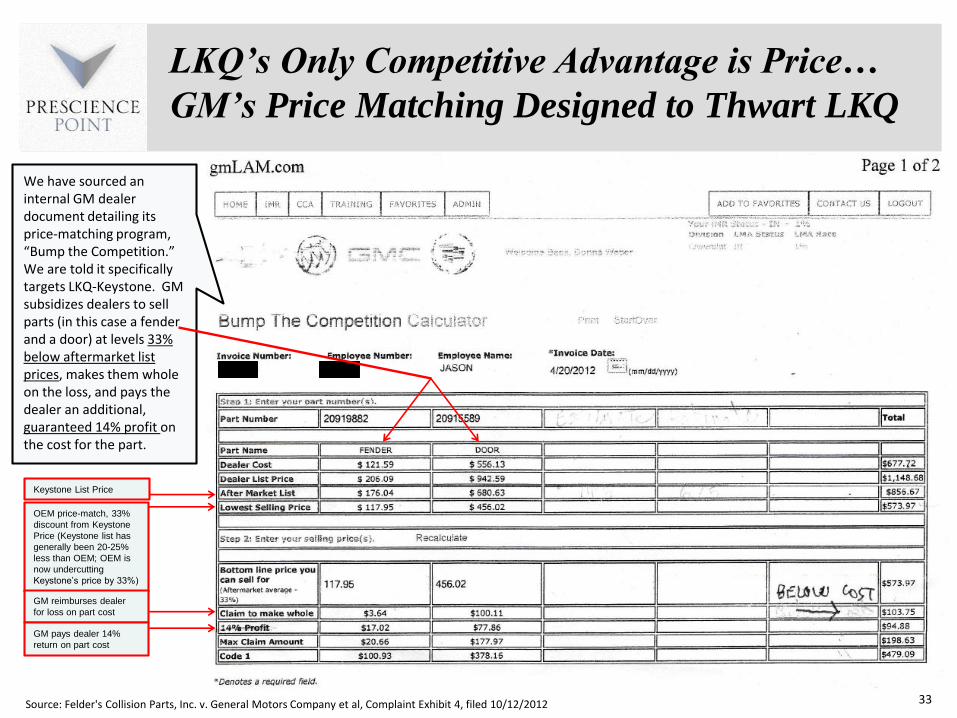
LKQrsquos Only Competitive Advantage is Pricehellip
GMrsquos Price Matching Program Is Designed
Specifically to Thwart LKQ
Keystone List Price
OEM price-match 33
discount from Keystone
Price (Keystone list has
generally been 20-25
less than OEM OEM is
now undercutting
Keystonersquos price by 33)
GM reimburses dealer
for loss on part cost
GM pays dealer 14
return on part cost
We have sourced an internal GM dealer document detailing GMrsquos price-matching program ldquoBump the Competitionrdquo We are told it specifically targets LKQ-Keystone GM subsidizes dealers to sell parts (in this case a fender and a door) at levels 33 below aftermarket list prices makes them whole on the loss and pays the dealer an additional guaranteed 14 profit on the cost for the part
Source Felders Collision Parts Inc v General Motors Company et al Complaint Exhibit 4 filed 10122012
Same Players Same Strategy Results
Marred by Accounting Irregularities amp Failures
13
John MelkInvestor
Charged with accounting fraud one
of the largest in history
Aggressive rollup strategy
Discovery ZoneBlockbuster Boston Chicken AutoNation Swisher Hygiene
Dean BuntrockCo-founder CEO
Dean BuntrockInvestor Franchisee
Dean Buntrock Founding Backer Director
Dean BuntrockInvestor Director
Donald FlynnCFO Director -Audit Committee
Donald FlynnInvestor
Donald FlynnFounding Backer Director
Donald Flynn Founder
Donald FlynnCEOChairman
John MelkPresident WM International
John MelkFounding Backer Director
John MelkFounding backer Director
John MelkInvestor Director
Lawrence BeckCo-founder
Lawrence BeckInvestor Franchisee
Lawrence BeckInvestor Franchisee
Peer PedersenDirector
Peer PedersenInvestor Franchisee
Peer PedersenDirector
Peer PedersenInvestor
Scott BeckInvestor COO Vice Chairman
Scott BeckInvestor
Scott BeckCEOChair
Steven BerrardCFO then CEO
Steven BerrardCo-founder Co-CEO
Steven BerrardCEO Director
Victor CassiniGen CounselSecretary
Victor CassiniGen Counsel Secretary
Wayne HuizengaCo-founder
Wayne HuizengaCEOChairman
Wayne HuizengaInvestor (via Blockbuster)
Director
Wayne HuizengaInvestor
Wayne HuizengaFounder Co-CEO
Wayne HuizengaChairman
Wayne HuizengaFounding backer (via
AutoNation)
Bought out by Viacom for $84B
Aggressive acquire-amp-build
strategy
Goes bankrupt Allegations of fraud
Aggressive acquire-amp-build
strategy
Goes bankrupt Accounting gimmicks to obscure financials
Aggressive acquire-amp-build
strategy
$$ Billions Lost Pooling of Interests
acquisition accounting
Aggressive rollup amp acquire-amp-build strategy
Accounting irregularities
Financials restatementAcquisition Accntng Issues
Ongoing SEC inquiry
Aggressive rollup strategy
An array of accounting
red flags amp misrepresentations
Aggressive rollup amp acquire-amp-build strategy
Dean BuntrockFranchisee
Steven BerrardCEO post-Viacom
LKQ
14
WM and DZ ndash Previous Employers of Many
LKQ Executives amp Accounting Personnel
Flynn Enterprises Common Shareholder
John QuinnVarious Positions
John QuinnSVP and CFO
Mark SpearsController Head Acct
Mark SpearsFormer SVP CFO
Frank ErlainFmr VP Finance
Controller Accountant
Victor CasiniGen Counsel amp
Secretary
Walter HanleyAsso Gen Counsel
Walter HanleySVP Development
Victor CasiniGen Counsel amp
Secretary
Ken FreseAcctrsquog Mgr
Ken FreseAccountant
Ken FreseDir Accounting amp
Inventory
Joe HolstenCOO CEO WM Intrsquol
Joe HolstenFmr CEO Chairman
Frank ErlainVP amp
Controller
Sinon GalvinSVP Revenue Optimization
Sinon GalvinVarious Positions
WM Intrsquol
Fraud Allegations Improper Capitalization of Expense Files for Bankruptcy March 1996
Charged w $17 billion Accounting Fraud March 2002
Stephen EckelDir Oracle Fin Apps
Fmr AcctrsquogAss Contrsquoller
Stephen EckelAssistant Corporate
Controller
Source SEC filings LinkedInreg
Kevin FlynnFormer Director
Kevin FlynnVP Midwest
Vaughn HooksChief Tax Officer
Vaughn HooksVP Taxes
Dan ShoenerVP
Dan ShoenerVP of Finance
LKQ
15
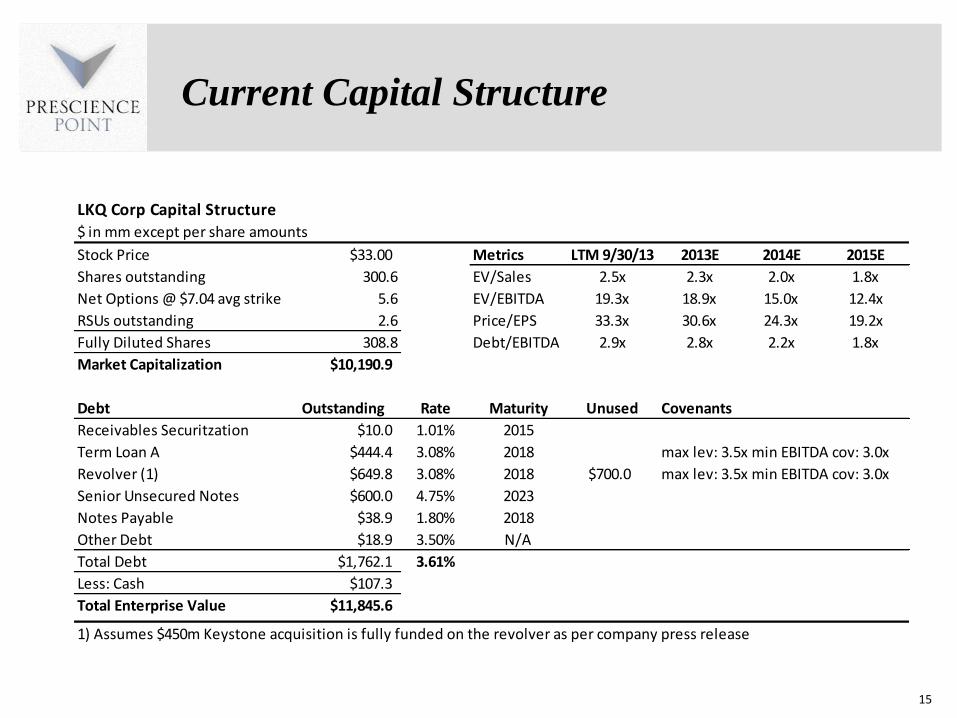
Current Capital Structure
LKQ Corp Capital Structure
$ in mm except per share amounts
Stock Price $3300 Metrics LTM 93013 2013E 2014E 2015E
Shares outstanding 3006 EVSales 25x 23x 20x 18x
Net Options $704 avg strike 56 EVEBITDA 193x 189x 150x 124x
RSUs outstanding 26 PriceEPS 333x 306x 243x 192x
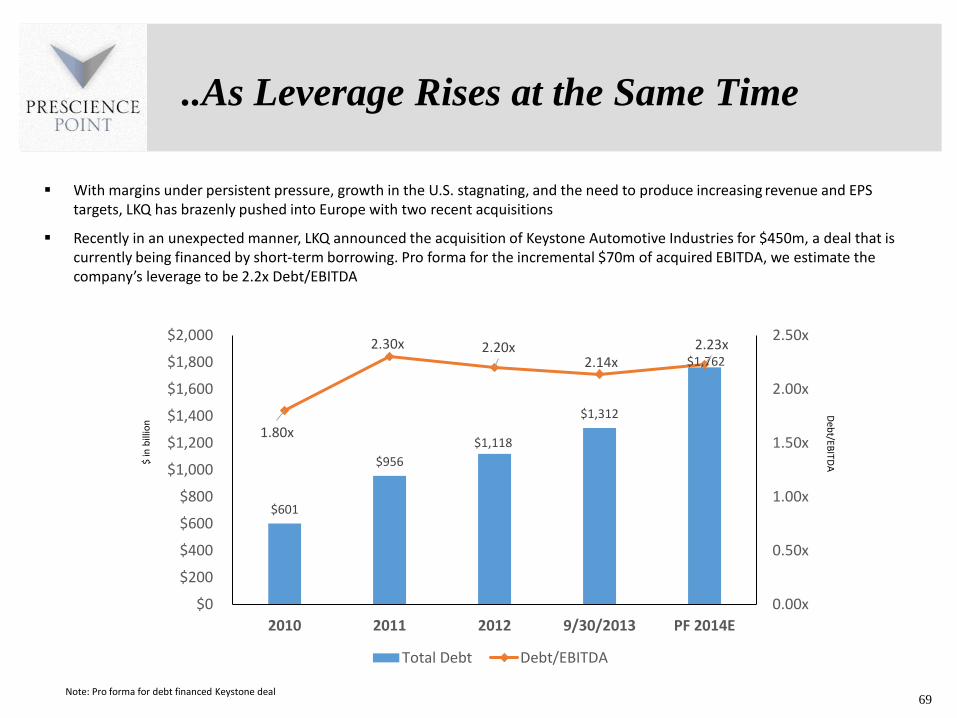
Fully Diluted Shares 3088 DebtEBITDA 29x 28x 22x 18x
Market Capitalization $101909
Debt Outstanding Rate Maturity Unused Covenants
Receivables Securitzation $100 101 2015
Term Loan A $4444 308 2018 max lev 35x min EBITDA cov 30x
Revolver (1) $6498 308 2018 $7000 max lev 35x min EBITDA cov 30x
Senior Unsecured Notes $6000 475 2023
Notes Payable $389 180 2018
Other Debt $189 350 NA
Total Debt $17621 361
Less Cash $1073
Total Enterprise Value $118456
1) Assumes $450m Keystone acquisition is fully funded on the revolver as per company press release
Background and Business
Background ndash LKQ Corp
LKQ Corporation (LKQ) a wholesale replacement auto parts distributor was founded in 1998 by Donald Flynn and with the financial backing of Dean Buntrock and AutoNation Inc the automobile retailer founded and led at the time by Wayne Huizenga Flynn would recruit Joseph Holsten to serve as LKQrsquos CEO1 Flynn Buntrock Huizenga and Holsten are all former executives of Waste Management Inc (WM)
LKQ has set out to consolidate the fragmented wholesale alternative auto parts industry by implementing an aggressive roll-up strategy fueling growth through acquisitions Since 1998 LKQ has grown through over 171 acquisitions primarily in the US and Canada becoming the largest provider of aftermarket amp recycled collision auto parts in North America
In May 2006 the company acquired Keystone Automotive Industries Inc (Nasdaq KEYS) a provider of aftermarket vehicle collision replacement parts for $4800 per share in cash or $811m in total enterprise value The deal was the largest in the companyrsquos history
In October 2011 LKQ expanded into foreign markets with the acquisition of UK-based Euro Car Parts Limited this was followed by the April 2013 acquisition of Netherlands-based Sator Holding Using an acquire-and-build strategy to grow in Europe LKQ has become one of the largest European suppliers of mechanical aftermarket auto parts LKQ generated $41B of revenue in 2012 split 7232 between North America and Europe
LKQrsquos business strategy ndash and as later discussed the strategies of numerous other companies founded by the aforementioned and other former Waste Management executives ndash appears taken right out of WMrsquos old playbook The following slide provides a brief elaboration of Waste Managementrsquos strategy and significant events in relation to LKQrsquos founders
(1) International Directory of Company Histories Vol 71 St James Press 2005 17
18
Background ndash
Waste Management Inc 1968-1998
In 1968 Dean Buntrock and Wayne Huizenga (both LKQ founding backers) along with Lawrence Beck founded Waste Management (WM) In 1972 Donald Flynn (LKQrsquos founder) joined WM as CFO WM set out to consolidate the highly fragmented garbage hauling industry via an aggressive roll-up strategy By the time WM went public in 1971 it had acquired 133 garbage haulers and was generating gt$10m in revenue In the first 9 months of 1972 it had acquired another 133 firmsand generated FY 1972 revenue of $72m From 1971 to 1980 WMrsquos revenue grew at a rate of 48 per year reaching $656m in revenue in 1980 By 1986 WM had become the largest waste disposal firm in the world
Donald Flynn was given credit as the ldquofinancial geniusrdquo behind Waste Managementrsquos extraordinary growth from the 1970s to the early 1990s in a 1993 corporate history commissioned by the company
By the late 1980rsquos and early 1990rsquos WM had undertaken a botched international expansion in a push to become the worldrsquos first global lsquoenvironmental servicesrsquo company ldquoThat ambition led Waste Management to acquire a range of profit-draining businesses The eventual result was angry shareholders turmoil in the board room and a disruptive series of management purges and sudden resignations followed by revelations (in late 1997) of accounting irregularitiesrdquo
Buntrock remained as CEO until 1996 and Flynn as CFO amp director until 1989 amp 1997 respectively
From 1994 until 1997 a period at the heart of the perpetration of the fraud Donald Flynn was a Waste Management Audit Committee member the panel responsible for overseeing accounting policies and procedures and also served as Audit Committee Chairman during a period coinciding with the fraud
According to the SEC former WM CEO Dean Buntrock was ldquothe driving force behind the fraudrdquo and that ldquoHe was the primary beneficiary of the fraud and reaped more than $169 million in ill-gotten gains from among other things performance-based bonuses retirement benefits charitable giving and selling company stock while the fraud was ongoingrdquo
Additional source httpwwwsecgovnewsheadlineswastemgmt6htm
In 1997 a new CEO ordered a review of WMrsquos accounting practices The probe turned up a massive financial fraud that went undetected from 1992ndash1997 The fraud involved inflated asset values and profitability resulting in a $35B charge in 1998 and the largest financials restatement in history at that time SEC charges ensued
Background ndash LKQ Corporate Evolution
LKQ began in 1998 to roll-up wholesale recycled auto parts distributors (ie salvage yards) establishing a network of such businesses and serving the collision repair industry By 2003 it had become the largest provider in the fragmented recycled products market in the US
LKQ soon began diversifying through acquisitions of aftermarket recycled refurbished and remanufactured product suppliers and manufacturers and self service retail businesses
In October 2007 LKQ made a transformative acquisition in buying Keystone Automotive Industries Inc becoming the industryrsquos dominant distributor of both recycled and aftermarket products in the US Keystone is LKQrsquos largest acquisition to date costing $811m Keystone generated ~$730m in revenue in 2007 As a result of the acquisition LKQrsquos Parts and Services revenue split shifted from 7129 to 3961 recycled products vs aftermarket products
In 2008 LKQ entered the heavy-duty truck parts recycling industry through various acquisitions The heavy-duty truck parts recycling industry has operating and sales functions that are similar to the auto recycled parts business
In October 2011 LKQ made its third largest purchase in its history expanding to the United Kingdom with the acquisition of Euro Car Parts Holdings Limited (ECP) ECPs product offerings are primarily focused on wholesale automotive aftermarket mechanical products LKQ purchased ECP for a total consideration (including earnouts) of $432m ECP generated $5096m in revenue in 2011 and had grown revenue at a CAGR of 33 from 2009-2011 As of October 2013 ECP operated out of 138 branches supported by a national distribution center
In May 2013 LKQ made its second significant acquisition in Europe buying Sator Holding an automotive aftermarket parts distribution company based in the Netherlands with operations in the Netherlands Belgium Luxembourg and Northern France LKQ bought Sator for $272m (EUR 210m) Sator generated $374m in revenue in 2012 The acquisition expanded LKQrsquos geographic presence in the European automotive aftermarket products market into continental Europe
Sources LKQ 10-K for 2012 10-Q for Q2rsquo2013 2007 Investor Presentation httpwwwlkqcorpcomusenabout-usaspx 19
Acquisition of Keystone Automotive Results in Dominant Competitive Position as a US Aftermarket Parts Distributor
Recent International Expansion with 2 Large-Scale Acquisitions European Aftermarket Parts Distributors
Background ndash LKQ Business Overview
LKQ provides alternative auto parts used for vehicle repairs Alternative auto parts can be used in vehicle repairs in place of new branded auto parts made by vehicle manufacturers or ldquoOEMsrdquo
To be clear buyers of replacement auto parts have 5 options to choose when repairing their vehicles
1 New OEM parts ndash branded auto parts produced by vehicle manufacturers (ie ldquoOEMrdquo)
2 Aftermarket parts ndash new generic parts that were not produced by the OEMs LKQ sources the majority of the aftermarket parts it sells in North America from Taiwan and other Asian countries
3 Recycled products ndash used parts that were originally produced by OEMs LKQ sources its recycled inventories by buying salvaged vehicles at auction then disassembling them at its salvagejunk yards
4 Refurbished parts ndash used products that have been refurbished LKQ processes these from cores obtained from salvage vehicles
5 Remanufactured parts ndash used products that have been remanufactured LKQ processes them from cores obtained from its salvage operations
The value in using alternative parts in place of new OEM parts is that they have traditionally been less expensive
Source LKQ 10-K for 2009 and 2012 20
or any of the below alternative auto parts all of which LKQ provides
For example if you get into an accident and need to replace the vehicle bumper you have 3 options
1 Replace it with a new branded bumper manufactured by General Motors (ie a new OEM part)
2 Get a new generic bumper that was made in Taiwan (ie an ldquoaftermarket partrdquo)
3 Get a bumper from the junkyard (ie a ldquorecycled partrdquo)
Options 2 and 3 are examples of alternative parts There are others discussed below
According to its filings ldquoWe compete with the OEMs primarily on price and to a lesser extent on service and
qualityrdquo In essence LKQ sells nothing more than commodity products which we will show has a diminishing
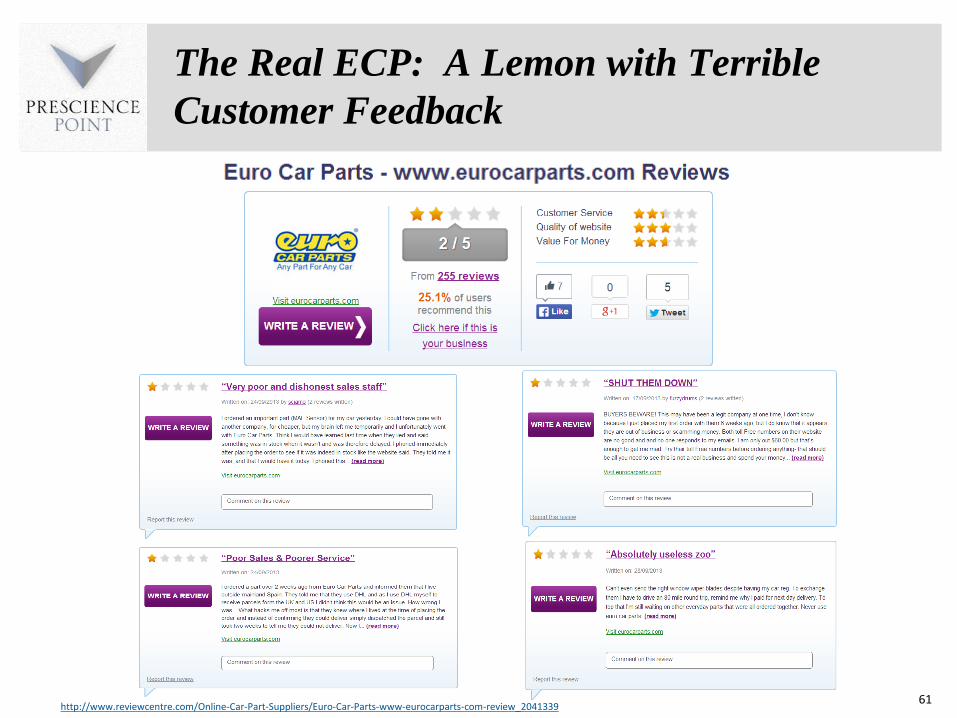
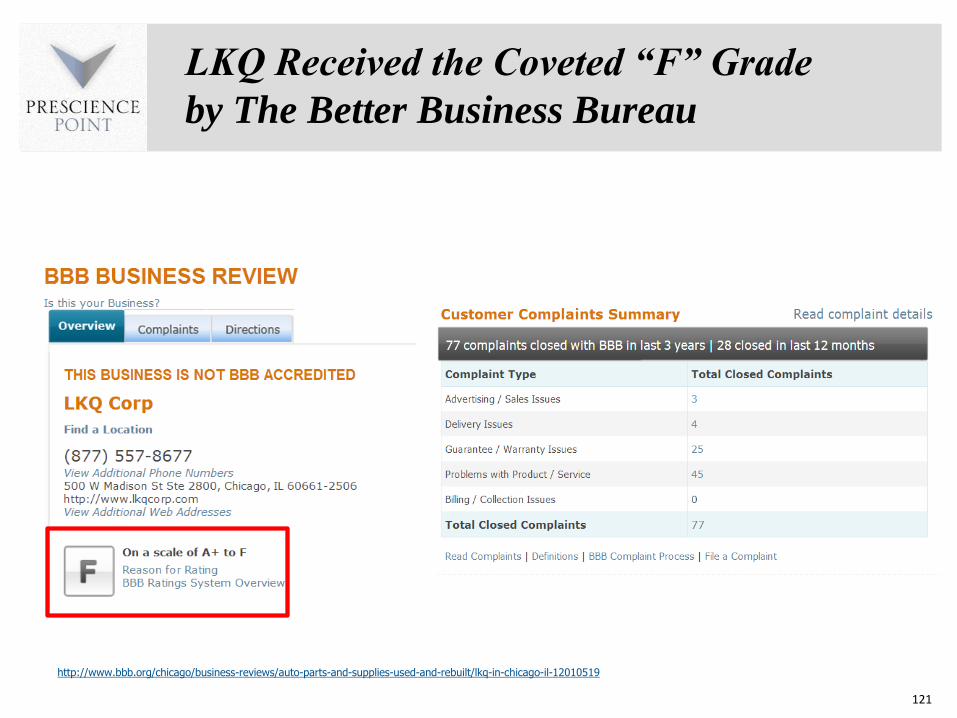
competitive price value proposition Furthermore numerous customer complaints and an ldquoFrdquo Rating from the
Better Business Bureau (see Appendix) severely calls into question its service and quality performance
21
Background ndash LKQ Revenue Growth
Driven by APU
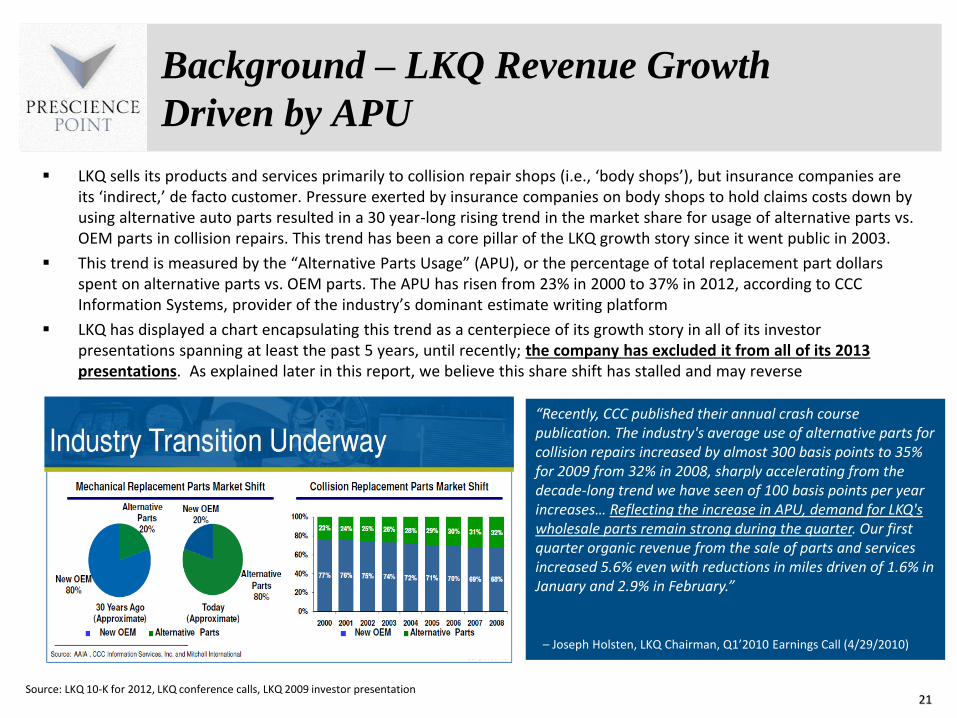
LKQ sells its products and services primarily to collision repair shops (ie lsquobody shopsrsquo) but insurance companies are its lsquoindirectrsquo de facto customer Pressure exerted by insurance companies on body shops to hold claims costs down by using alternative auto parts resulted in a 30 year-long rising trend in the market share for usage of alternative parts vs OEM parts in collision repairs This trend has been a core pillar of the LKQ growth story since it went public in 2003
This trend is measured by the ldquoAlternative Parts Usagerdquo (APU) or the percentage of total replacement part dollars spent on alternative parts vs OEM parts The APU has risen from 23 in 2000 to 37 in 2012 according to CCC Information Systems provider of the industryrsquos dominant estimate writing platform
LKQ has displayed a chart encapsulating this trend as a centerpiece of its growth story in all of its investor presentations spanning at least the past 5 years until recently the company has excluded it from all of its 2013 presentations As explained later in this report we believe this share shift has stalled and may reverse
Source LKQ 10-K for 2012 LKQ conference calls LKQ 2009 investor presentation
ldquoRecently CCC published their annual crash course publication The industrys average use of alternative parts for collision repairs increased by almost 300 basis points to 35 for 2009 from 32 in 2008 sharply accelerating from the decade-long trend we have seen of 100 basis points per year increaseshellip Reflecting the increase in APU demand for LKQs wholesale parts remain strong during the quarter Our first quarter organic revenue from the sale of parts and services increased 56 even with reductions in miles driven of 16 in January and 29 in Februaryrdquo
ndash Joseph Holsten LKQ Chairman Q1rsquo2010 Earnings Call (4292010)
European Business Growing as a
Percent of Consolidated Revenue
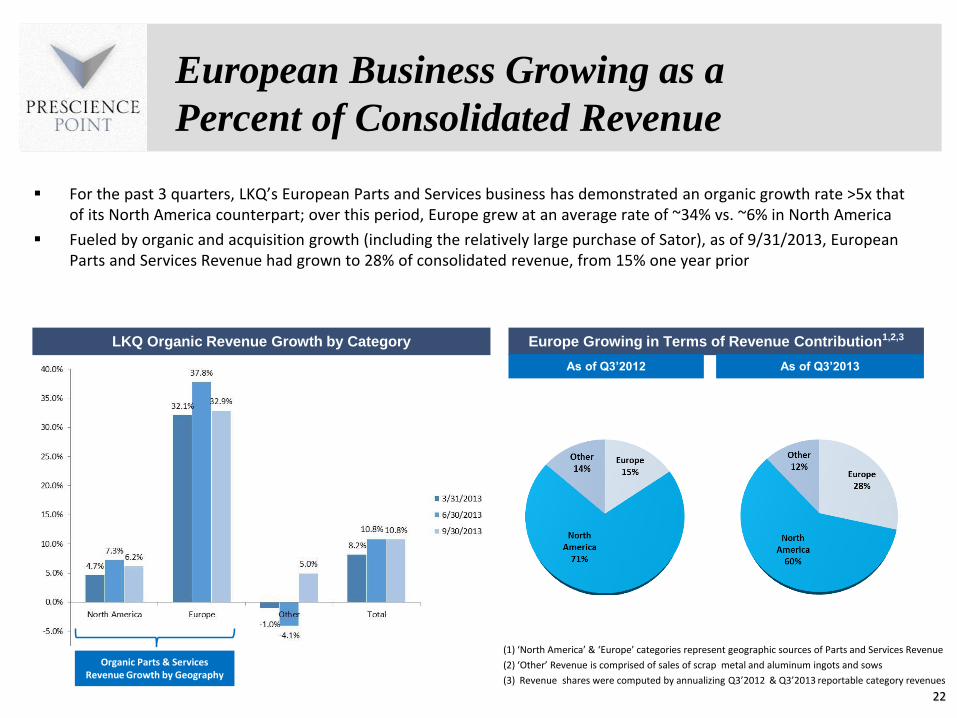
For the past 3 quarters LKQrsquos European Parts and Services business has demonstrated an organic growth rate gt5x that of its North America counterpart over this period Europe grew at an average rate of ~34 vs ~6 in North America
Fueled by organic and acquisition growth (including the relatively large purchase of Sator) as of 9312013 European Parts and Services Revenue had grown to 28 of consolidated revenue from 15 one year prior
(1) lsquoNorth Americarsquo amp lsquoEuropersquo categories represent geographic sources of Parts and Services Revenue
(2) lsquoOtherrsquo Revenue is comprised of sales of scrap metal and aluminum ingots and sows
(3) Revenue shares were computed by annualizing Q3rsquo2012 amp Q3rsquo2013 reportable category revenues
22
LKQ Organic Revenue Growth by Category Europe Growing in Terms of Revenue Contribution123
As of Q3rsquo2012 As of Q3rsquo2013
Organic Parts amp Services Revenue Growth by Geography
High-Level Indications of Fabricated
GAAP Profits Unsustainable Business
Model
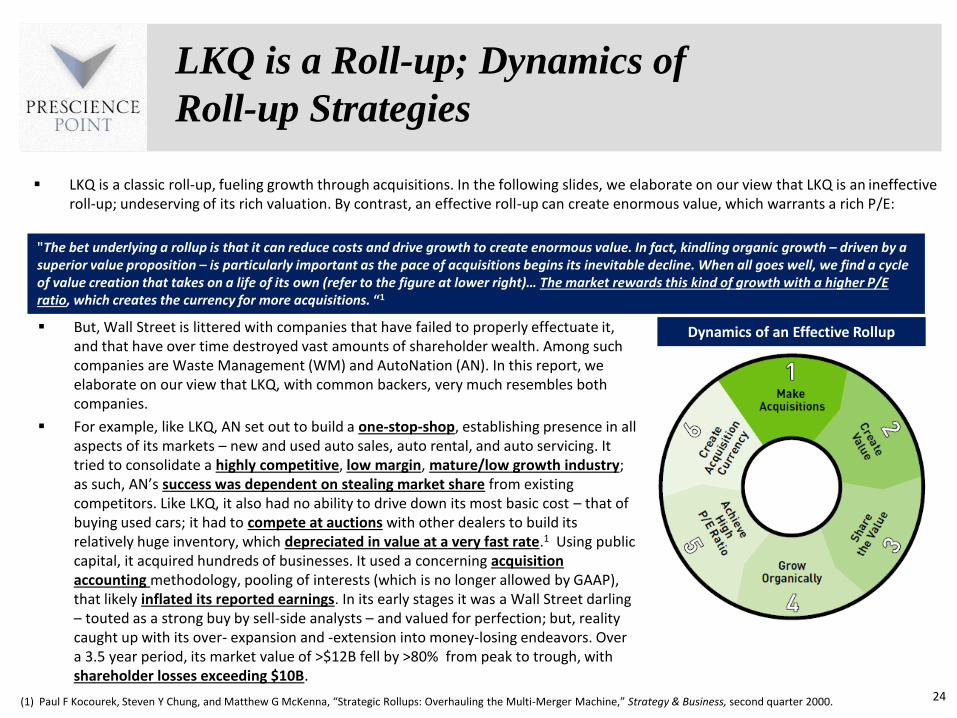
LKQ is a classic roll-up fueling growth through acquisitions In the following slides we elaborate on our view that LKQ is an ineffective roll-up undeserving of its rich valuation By contrast an effective roll-up can create enormous value which warrants a rich PE
24
LKQ is a Roll-up Dynamics of
Roll-up Strategies
(1) Paul F Kocourek Steven Y Chung and Matthew G McKenna ldquoStrategic Rollups Overhauling the Multi-Merger Machinerdquo Strategy amp Business second quarter 2000
The bet underlying a rollup is that it can reduce costs and drive growth to create enormous value In fact kindling organic growth ndash driven by a superior value proposition ndash is particularly important as the pace of acquisitions begins its inevitable decline When all goes well we find a cycle of value creation that takes on a life of its own (refer to the figure at lower right)hellip The market rewards this kind of growth with a higher PE ratio which creates the currency for more acquisitions ldquo1
But Wall Street is littered with companies that have failed to properly effectuate it and that have over time destroyed vast amounts of shareholder wealth Among such companies are Waste Management (WM) and AutoNation (AN) In this report we elaborate on our view that LKQ with common backers very much resembles both companies
For example like LKQ AN set out to build a one-stop-shop establishing presence in all aspects of its markets ndash new and used auto sales auto rental and auto servicing It tried to consolidate a highly competitive low margin maturelow growth industry as such ANrsquos success was dependent on stealing market share from existing competitors Like LKQ it also had no ability to drive down its most basic cost ndash that of buying used cars it had to compete at auctions with other dealers to build its relatively huge inventory which depreciated in value at a very fast rate1 Using public capital it acquired hundreds of businesses It used a concerning acquisition accounting methodology pooling of interests (which is no longer allowed by GAAP) that likely inflated its reported earnings In its early stages it was a Wall Street darling ndash touted as a strong buy by sell-side analysts ndash and valued for perfection but reality caught up with its over- expansion and -extension into money-losing endeavors Over a 35 year period its market value of gt$12B fell by gt80 from peak to trough with shareholder losses exceeding $10B
Dynamics of an Effective Rollup
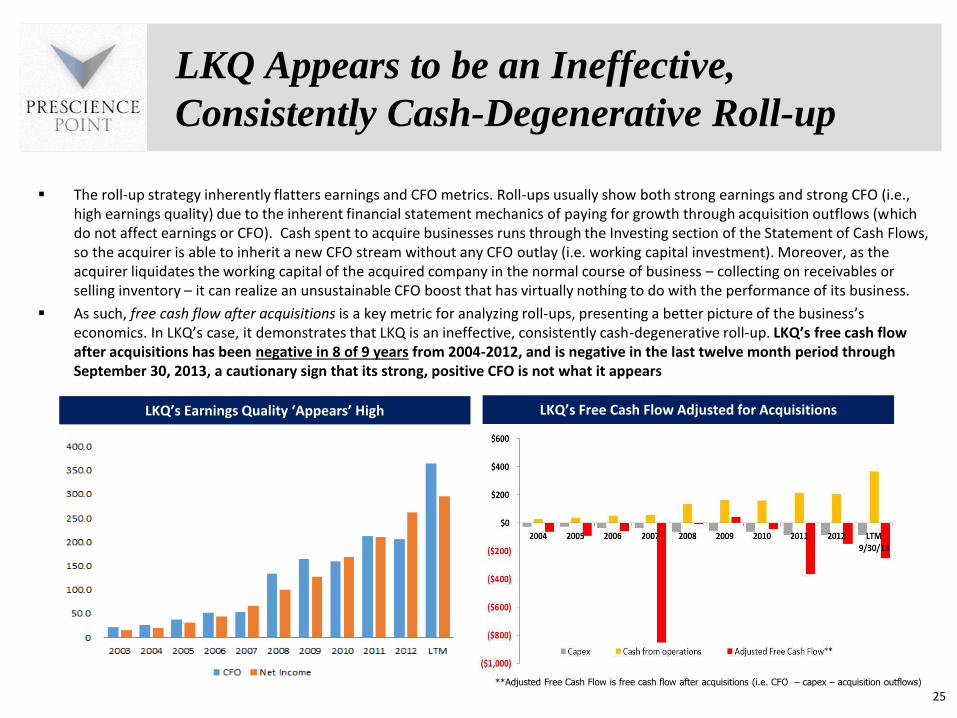
The roll-up strategy inherently flatters earnings and CFO metrics Roll-ups usually show both strong earnings and strong CFO (ie high earnings quality) due to the inherent financial statement mechanics of paying for growth through acquisition outflows (which do not affect earnings or CFO) Cash spent to acquire businesses runs through the Investing section of the Statement of Cash Flows so the acquirer is able to inherit a new CFO stream without any CFO outlay (ie working capital investment) Moreover as the acquirer liquidates the working capital of the acquired company in the normal course of business ndash collecting on receivables or selling inventory ndash it can realize an unsustainable CFO boost that has virtually nothing to do with the performance of its business
As such free cash flow after acquisitions is a key metric for analyzing roll-ups presenting a better picture of the businessrsquos economics In LKQrsquos case it demonstrates that LKQ is an ineffective consistently cash-degenerative roll-up LKQrsquos free cash flow after acquisitions has been negative in 8 of 9 years from 2004-2012 and is negative in the last twelve month period through September 30 2013 a cautionary sign that its strong positive CFO is not what it appears
25
LKQ Appears to be an Ineffective
Consistently Cash-Degenerative Roll-up
Adjusted Free Cash Flow is free cash flow after acquisitions (ie CFO ndash capex ndash acquisition outflows)
LKQrsquos Free Cash Flow Adjusted for Acquisitions LKQrsquos Earnings Quality lsquoAppearsrsquo High
26
High-Level Indications of Fabricated GAAP
Profits Unsustainable Business Model
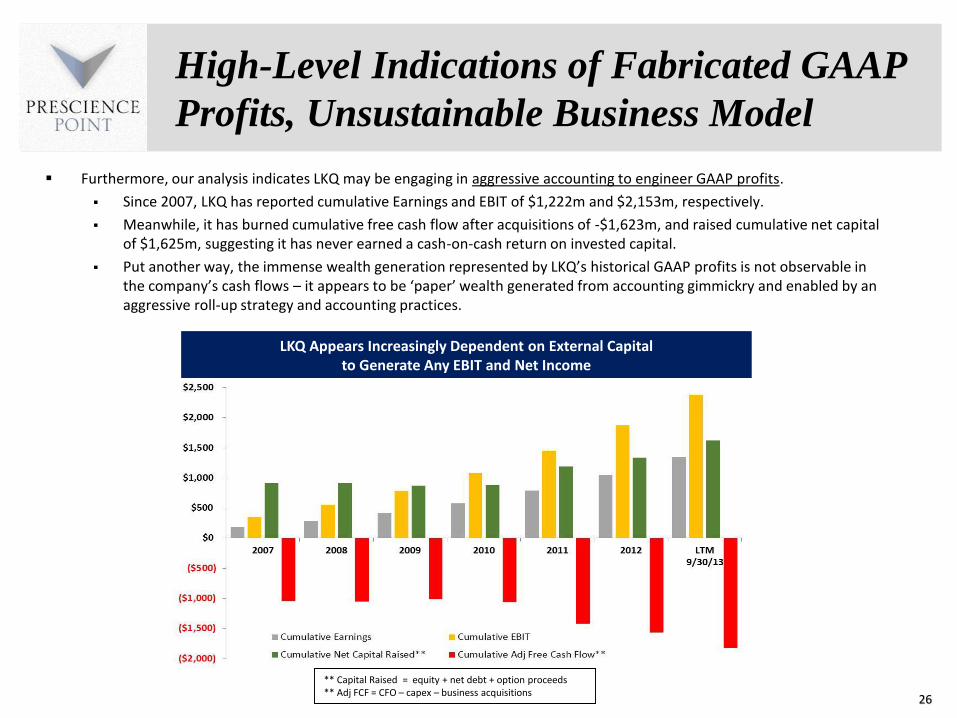
Furthermore our analysis indicates LKQ may be engaging in aggressive accounting to engineer GAAP profits
Since 2007 LKQ has reported cumulative Earnings and EBIT of $1222m and $2153m respectively
Meanwhile it has burned cumulative free cash flow after acquisitions of -$1623m and raised cumulative net capital of $1625m suggesting it has never earned a cash-on-cash return on invested capital
Put another way the immense wealth generation represented by LKQrsquos historical GAAP profits is not observable in the companyrsquos cash flows ndash it appears to be lsquopaperrsquo wealth generated from accounting gimmickry and enabled by an aggressive roll-up strategy and accounting practices
Capital Raised = equity + net debt + option proceeds Adj FCF = CFO ndash capex ndash business acquisitions
LKQ Appears Increasingly Dependent on External Capital to Generate Any EBIT and Net Income
Reported North America Parts amp Services
Organic Revenue Growth Appears
Overstated Pricing Pressures Intensifying
28
North America (NA) Organic Growth
Appears Overstated
LKQ reported organic revenue growth averaging ~65 from 2008 ndash 2012 and ~6 in the 9 months ended 9302013 for its North America Parts and Services (PampS) business which accounts for ~75 of consolidated PampS revenue These growth rates do not appear reconcilable with trends in its primary driving fundamental factors or representative of LKQrsquos sustainable North America organic growth rate which we believe likely falls in the range of 0-2
Data for insurance claims paid for repairable accidents indicates no growth
Growth in market share of alternative auto parts relative to OEM parts (ie APU) which has risen for 3 decades and served as a primary driver of LKQrsquos organic growth flat-lined from 2010 ndash 2012 and may taper or reverse
For the first time replacement auto parts prices deflated in 2012 as competitive pressures intensified
Market share gains from alternative parts competitors are limited by LKQrsquos market dominance already owning 25-30 of the market market share is LKQrsquos to lose
LKQrsquos North American PampS organic growth rate also appears unhinged from growth rates reported by dominant companies in its primary end market For example the Boyd Group (TSX BYDUN) a large publicly traded multi-service operator in the North American collision repair industry has reported average same store sale growth of just 2 over the same period LKQ has reported organic growth of 65 While Boydrsquos results have shown significant cyclicality LKQrsquos results have been highly consistent and steadily positive ndash such patterns in an otherwise cyclical business are often a hallmark of companies over-concerned with meeting Wall Street estimates and financial transgressions
NA Organic Growth ndash Insurance Collision
Claim Payouts Are Not Growing
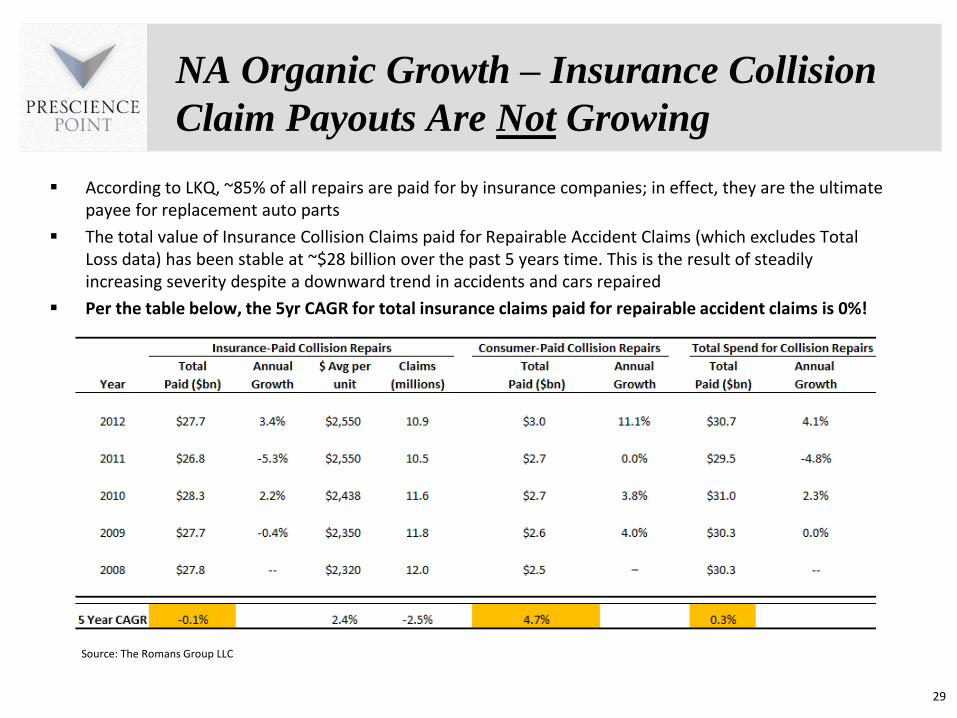
According to LKQ ~85 of all repairs are paid for by insurance companies in effect they are the ultimate payee for replacement auto parts
The total value of Insurance Collision Claims paid for Repairable Accident Claims (which excludes Total Loss data) has been stable at ~$28 billion over the past 5 years time This is the result of steadily increasing severity despite a downward trend in accidents and cars repaired
Per the table below the 5yr CAGR for total insurance claims paid for repairable accident claims is 0
29
Source The Romans Group LLC
30
OEM Price-Matching Programs Also Forcing
Aftermarket Auto Part Price Deflation
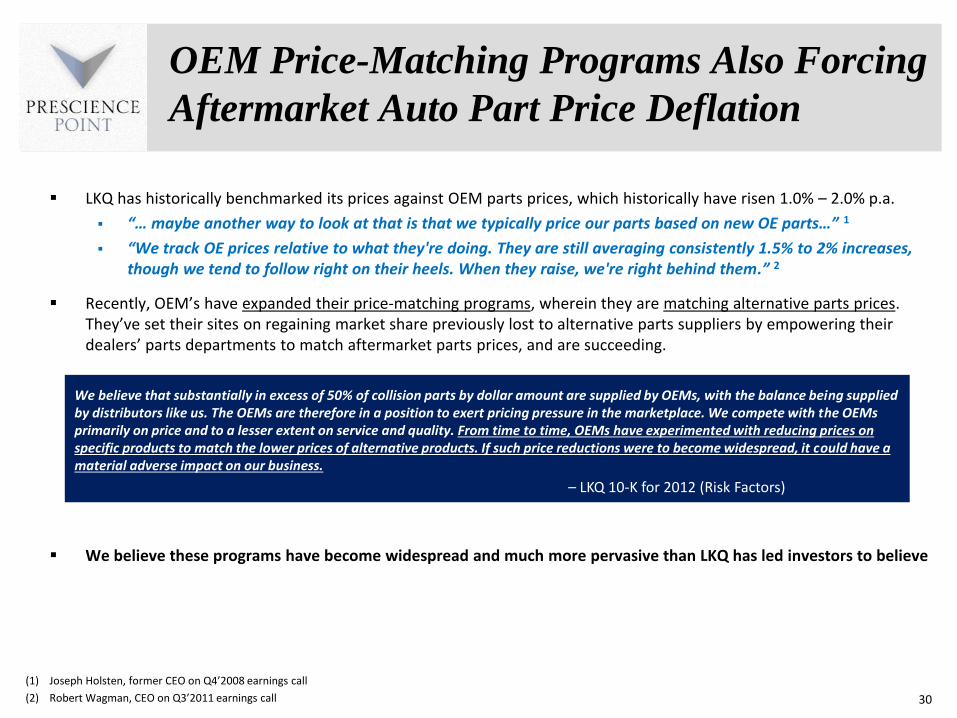
LKQ has historically benchmarked its prices against OEM parts prices which historically have risen 10 ndash 20 pa
ldquohellip maybe another way to look at that is that we typically price our parts based on new OE partshelliprdquo 1
ldquoWe track OE prices relative to what theyre doing They are still averaging consistently 15 to 2 increases though we tend to follow right on their heels When they raise were right behind themrdquo 2
Recently OEMrsquos have expanded their price-matching programs wherein they are matching alternative parts prices Theyrsquove set their sites on regaining market share previously lost to alternative parts suppliers by empowering their dealersrsquo parts departments to match aftermarket parts prices and are succeeding
We believe these programs have become widespread and much more pervasive than LKQ has led investors to believe
(1) Joseph Holsten former CEO on Q4rsquo2008 earnings call
(2) Robert Wagman CEO on Q3rsquo2011 earnings call
We believe that substantially in excess of 50 of collision parts by dollar amount are supplied by OEMs with the balance being supplied by distributors like us The OEMs are therefore in a position to exert pricing pressure in the marketplace We compete with the OEMs primarily on price and to a lesser extent on service and quality From time to time OEMs have experimented with reducing prices on specific products to match the lower prices of alternative products If such price reductions were to become widespread it could have a material adverse impact on our business
ndash LKQ 10-K for 2012 (Risk Factors)
31
NA Organic Growth ndash OEM Price Matching
Interview With Aftermarket Distributor
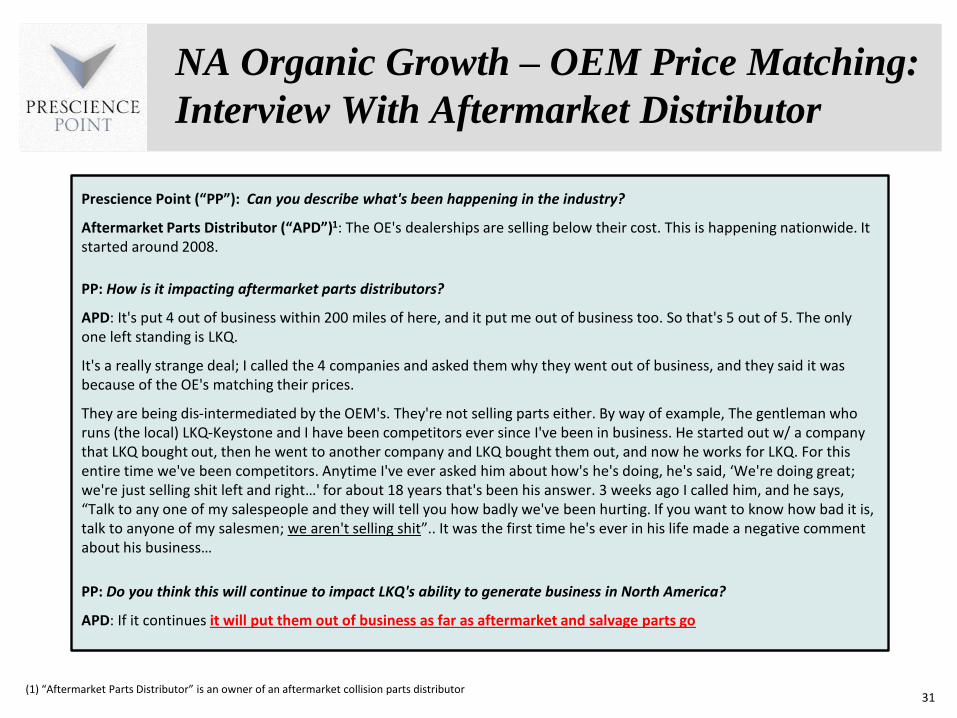
Prescience Point (ldquoPPrdquo) Can you describe whats been happening in the industry
Aftermarket Parts Distributor (ldquoAPDrdquo)1 The OEs dealerships are selling below their cost This is happening nationwide It started around 2008
PP How is it impacting aftermarket parts distributors
APD Its put 4 out of business within 200 miles of here and it put me out of business too So thats 5 out of 5 The only one left standing is LKQ
Its a really strange deal I called the 4 companies and asked them why they went out of business and they said it was because of the OEs matching their prices
They are being dis-intermediated by the OEMs Theyre not selling parts either By way of example The gentleman who runs (the local) LKQ-Keystone and I have been competitors ever since Ive been in business He started out w a company that LKQ bought out then he went to another company and LKQ bought them out and now he works for LKQ For this entire time weve been competitors Anytime Ive ever asked him about hows hes doing hes said lsquoWere doing great were just selling shit left and righthellip for about 18 years thats been his answer 3 weeks ago I called him and he says ldquoTalk to any one of my salespeople and they will tell you how badly weve been hurting If you want to know how bad it is talk to anyone of my salesmen we arent selling shitrdquo It was the first time hes ever in his life made a negative comment about his businesshellip
PP Do you think this will continue to impact LKQs ability to generate business in North America
APD If it continues it will put them out of business as far as aftermarket and salvage parts go
(1) ldquoAftermarket Parts Distributorrdquo is an owner of an aftermarket collision parts distributor
OEM Price Matching Interview With
Aftermarket Distributor (Contrsquod)
32
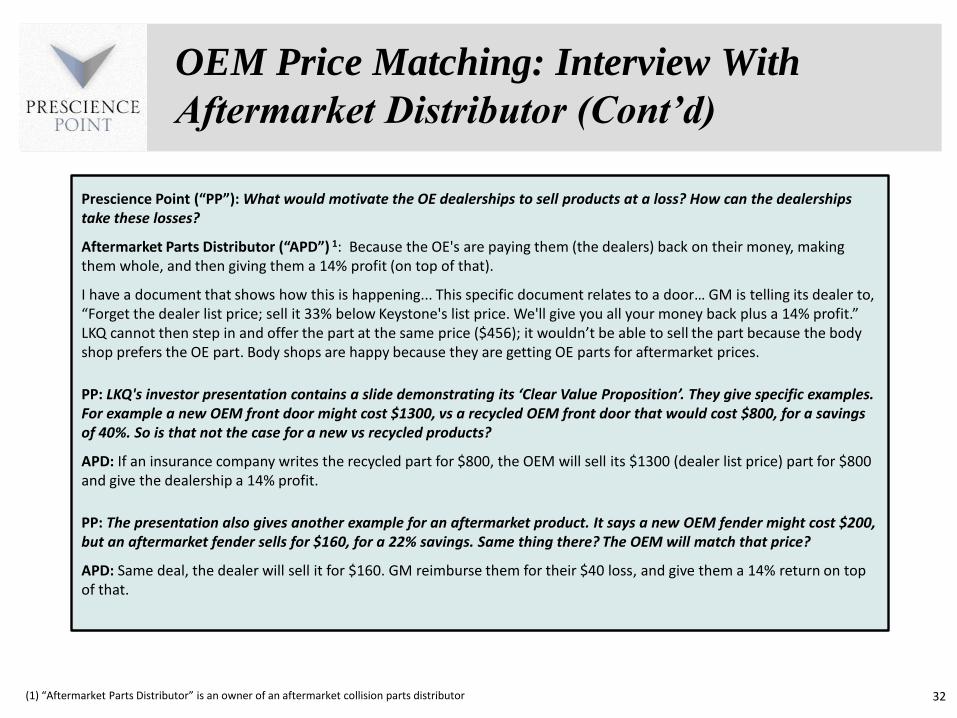
Prescience Point (ldquoPPrdquo) What would motivate the OE dealerships to sell products at a loss How can the dealerships take these losses
Aftermarket Parts Distributor (ldquoAPDrdquo) 1 Because the OEs are paying them (the dealers) back on their money making them whole and then giving them a 14 profit (on top of that)
I have a document that shows how this is happening This specific document relates to a doorhellip GM is telling its dealer to ldquoForget the dealer list price sell it 33 below Keystones list price Well give you all your money back plus a 14 profitrdquo LKQ cannot then step in and offer the part at the same price ($456) it wouldnrsquot be able to sell the part because the body shop prefers the OE part Body shops are happy because they are getting OE parts for aftermarket prices
PP LKQs investor presentation contains a slide demonstrating its lsquoClear Value Propositionrsquo They give specific examples For example a new OEM front door might cost $1300 vs a recycled OEM front door that would cost $800 for a savings of 40 So is that not the case for a new vs recycled products
APD If an insurance company writes the recycled part for $800 the OEM will sell its $1300 (dealer list price) part for $800 and give the dealership a 14 profit
PP The presentation also gives another example for an aftermarket product It says a new OEM fender might cost $200 but an aftermarket fender sells for $160 for a 22 savings Same thing there The OEM will match that price
APD Same deal the dealer will sell it for $160 GM reimburse them for their $40 loss and give them a 14 return on top of that
(1) ldquoAftermarket Parts Distributorrdquo is an owner of an aftermarket collision parts distributor
33
LKQrsquos Only Competitive Advantage is Pricehellip
GMrsquos Price Matching Designed to Thwart LKQ
Keystone List Price
OEM price-match 33
discount from Keystone
Price (Keystone list has
generally been 20-25
less than OEM OEM is
now undercutting
Keystonersquos price by 33)
GM reimburses dealer
for loss on part cost
GM pays dealer 14
return on part cost
We have sourced an internal GM dealer document detailing its price-matching program ldquoBump the Competitionrdquo We are told it specifically targets LKQ-Keystone GM subsidizes dealers to sell parts (in this case a fender and a door) at levels 33 below aftermarket list prices makes them whole on the loss and pays the dealer an additional guaranteed 14 profit on the cost for the part
Source Felders Collision Parts Inc v General Motors Company et al Complaint Exhibit 4 filed 10122012
34
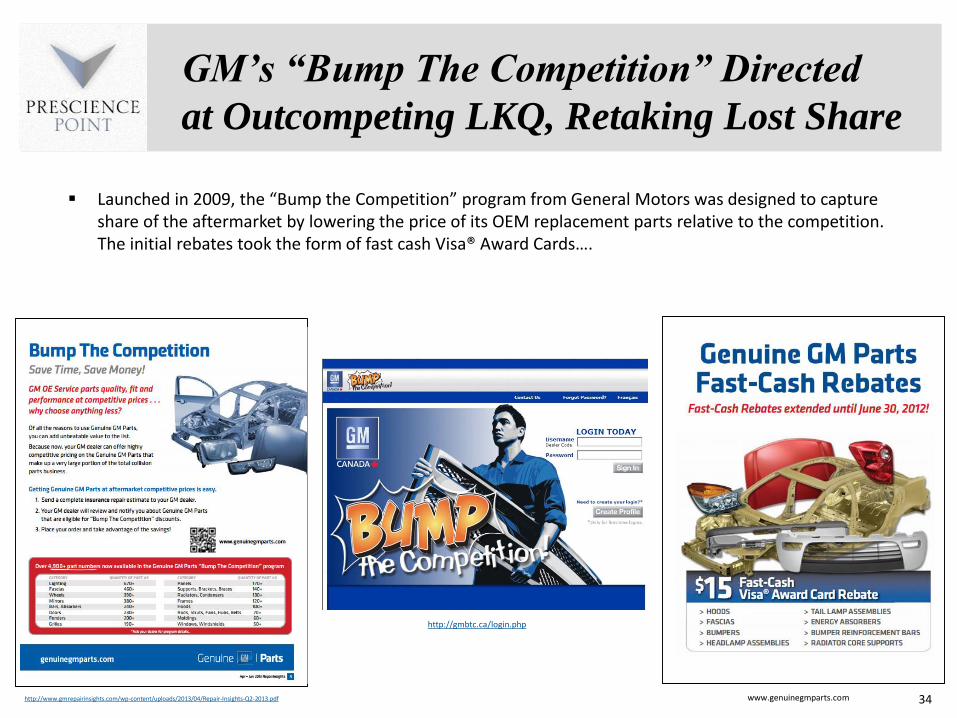
GMrsquos ldquoBump The Competitionrdquo Directed
at Outcompeting LKQ Retaking Lost Share
Launched in 2009 the ldquoBump the Competitionrdquo program from General Motors was designed to capture share of the aftermarket by lowering the price of its OEM replacement parts relative to the competition The initial rebates took the form of fast cash Visareg Award Cardshellip
httpwwwgmrepairinsightscomwp-contentuploads201304Repair-Insights-Q2-2013pdf
httpgmbtccaloginphp
wwwgenuinegmpartscom
35
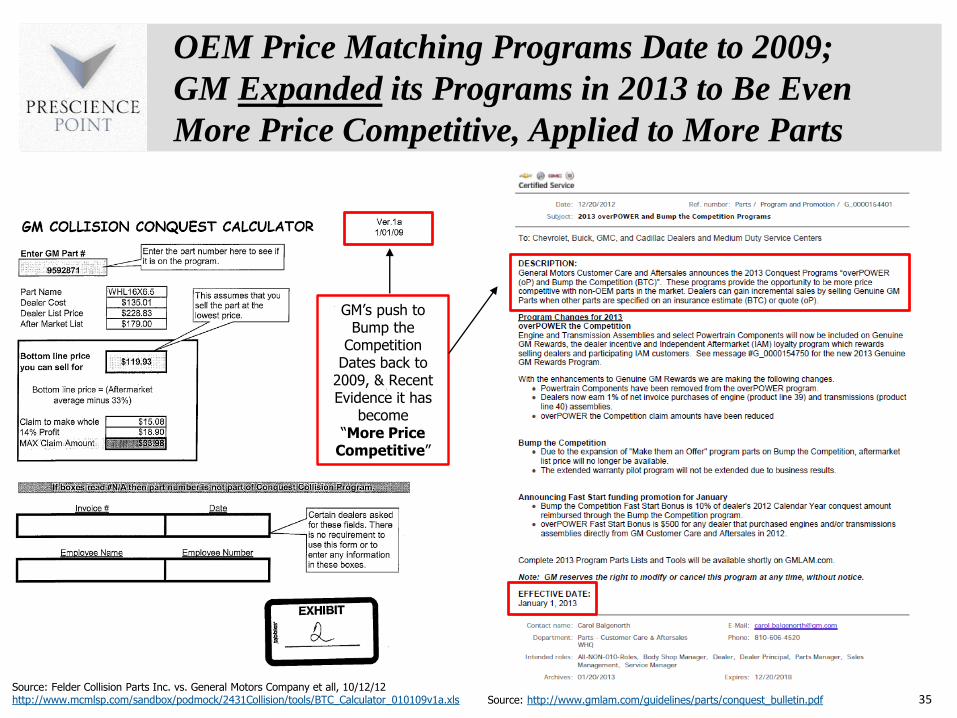
OEM Price Matching Programs Date to 2009
GM Expanded its Programs in 2013 to Be Even
More Price Competitive Applied to More Parts
Source httpwwwgmlamcomguidelinespartsconquest_bulletinpdfSource Felder Collision Parts Inc vs General Motors Company et all 101212httpwwwmcmlspcomsandboxpodmock2431CollisiontoolsBTC_Calculator_010109v1axls
GMrsquos push to Bump the
Competition Dates back to
2009 amp Recent Evidence it has
become ldquoMore Price
Competitiverdquo
36
Mazdarsquos ldquoCollision Parts AdvantageTMrdquo
Program Also Directed at Displacing LKQ
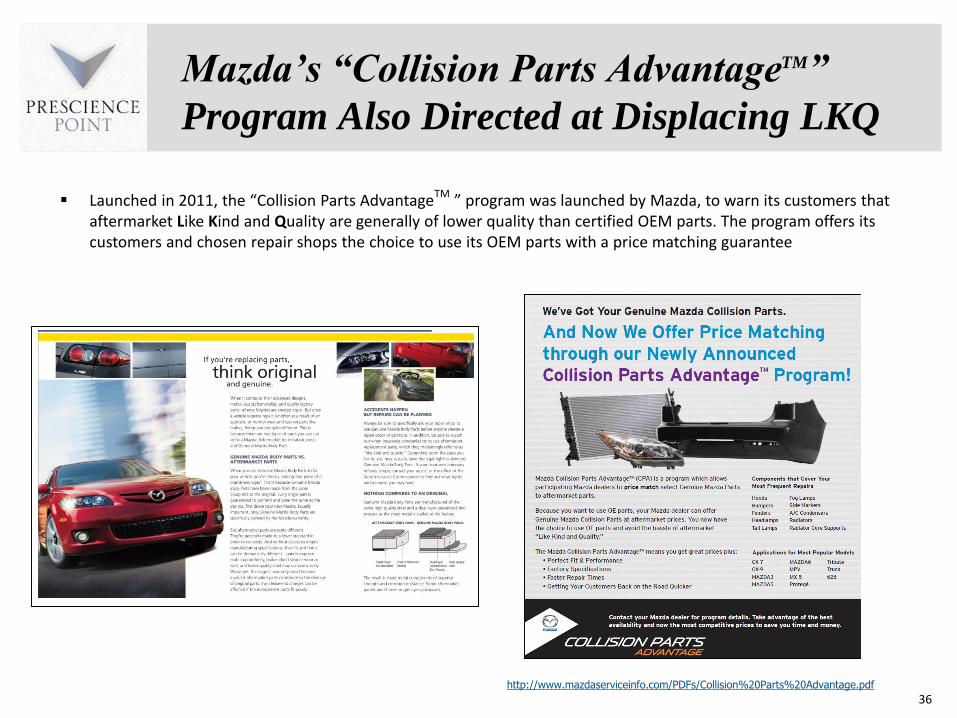
Launched in 2011 the ldquoCollision Parts AdvantageTM rdquo program was launched by Mazda to warn its customers that aftermarket Like Kind and Quality are generally of lower quality than certified OEM parts The program offers its customers and chosen repair shops the choice to use its OEM parts with a price matching guarantee
httpwwwmazdaserviceinfocomPDFsCollision20Parts20Advantagepdf
OEM Price-Matching
APU Has Flat-Lined Likely to TaperDecline
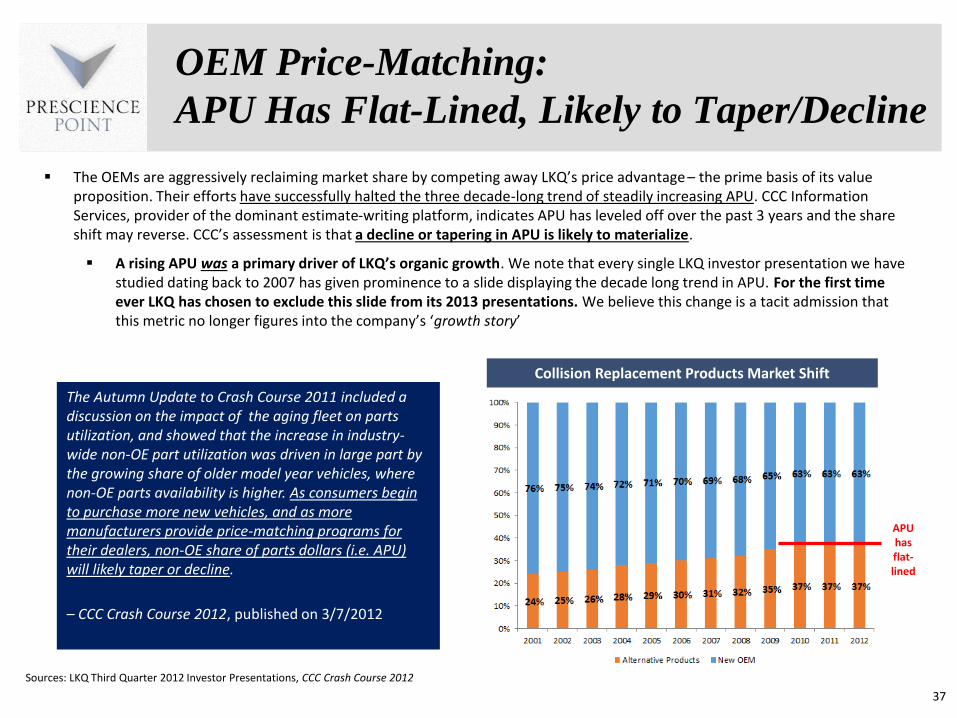
The OEMs are aggressively reclaiming market share by competing away LKQrsquos price advantage ndash the prime basis of its value proposition Their efforts have successfully halted the three decade-long trend of steadily increasing APU CCC Information Services provider of the dominant estimate-writing platform indicates APU has leveled off over the past 3 years and the share shift may reverse CCCrsquos assessment is that a decline or tapering in APU is likely to materialize
A rising APU was a primary driver of LKQrsquos organic growth We note that every single LKQ investor presentation we have studied dating back to 2007 has given prominence to a slide displaying the decade long trend in APU For the first time ever LKQ has chosen to exclude this slide from its 2013 presentations We believe this change is a tacit admission that this metric no longer figures into the companyrsquos lsquogrowth storyrsquo
Sources LKQ Third Quarter 2012 Investor Presentations CCC Crash Course 2012
37
Collision Replacement Products Market Shift
APU has flat-lined
The Autumn Update to Crash Course 2011 included a discussion on the impact of the aging fleet on parts utilization and showed that the increase in industry-wide non-OE part utilization was driven in large part by the growing share of older model year vehicles where non-OE parts availability is higher As consumers begin to purchase more new vehicles and as more manufacturers provide price-matching programs for their dealers non-OE share of parts dollars (ie APU) will likely taper or decline
ndash CCC Crash Course 2012 published on 372012
38
LKQ Appears To Be Deceiving Investors
About the Current APU Problems
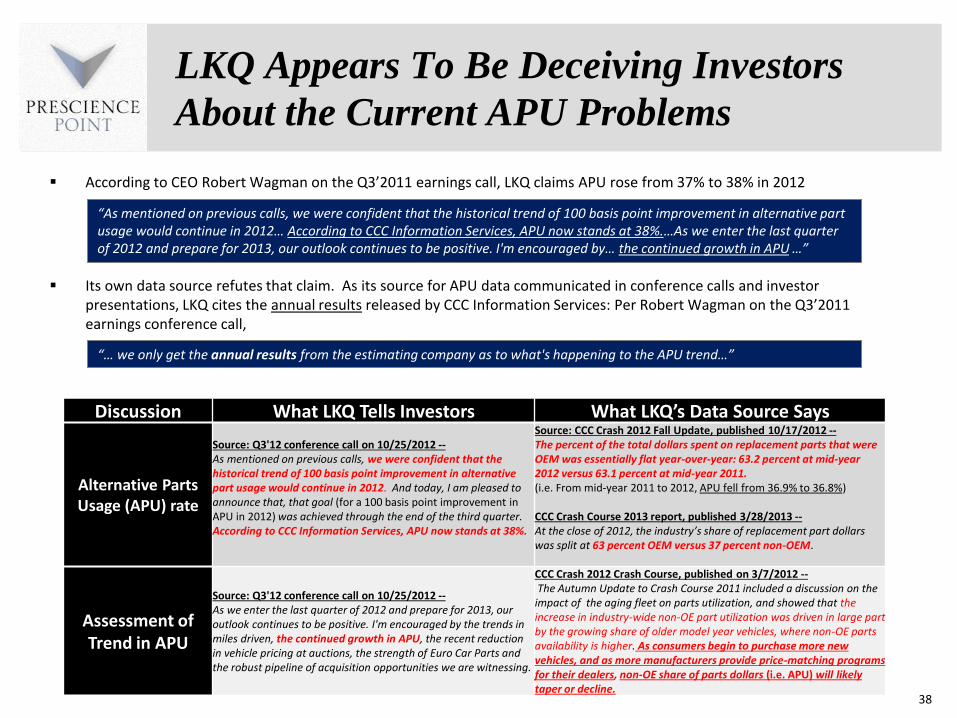
According to CEO Robert Wagman on the Q3rsquo2011 earnings call LKQ claims APU rose from 37 to 38 in 2012
Its own data source refutes that claim As its source for APU data communicated in conference calls and investor presentations LKQ cites the annual results released by CCC Information Services Per Robert Wagman on the Q3rsquo2011 earnings conference call
Discussion What LKQ Tells Investors What LKQrsquos Data Source Says
Alternative Parts Usage (APU) rate
Source Q312 conference call on 10252012 --As mentioned on previous calls we were confident that the historical trend of 100 basis point improvement in alternative part usage would continue in 2012 And today I am pleased to announce that that goal (for a 100 basis point improvement in APU in 2012) was achieved through the end of the third quarter According to CCC Information Services APU now stands at 38
Source CCC Crash 2012 Fall Update published 10172012 --The percent of the total dollars spent on replacement parts that were OEM was essentially flat year-over-year 632 percent at mid-year 2012 versus 631 percent at mid-year 2011(ie From mid-year 2011 to 2012 APU fell from 369 to 368)
CCC Crash Course 2013 report published 3282013 --At the close of 2012 the industryrsquos share of replacement part dollars was split at 63 percent OEM versus 37 percent non-OEM
Assessment of Trend in APU
Source Q312 conference call on 10252012 --As we enter the last quarter of 2012 and prepare for 2013 our outlook continues to be positive Im encouraged by the trends in miles driven the continued growth in APU the recent reduction in vehicle pricing at auctions the strength of Euro Car Parts and the robust pipeline of acquisition opportunities we are witnessing
CCC Crash 2012 Crash Course published on 372012 --The Autumn Update to Crash Course 2011 included a discussion on the
impact of the aging fleet on parts utilization and showed that the increase in industry-wide non-OE part utilization was driven in large part by the growing share of older model year vehicles where non-OE parts availability is higher As consumers begin to purchase more new vehicles and as more manufacturers provide price-matching programs for their dealers non-OE share of parts dollars (ie APU) will likely taper or decline
ldquoAs mentioned on previous calls we were confident that the historical trend of 100 basis point improvement in alternative part usage would continue in 2012hellip According to CCC Information Services APU now stands at 38hellipAs we enter the last quarter of 2012 and prepare for 2013 our outlook continues to be positive Im encouraged byhellip the continued growth in APU helliprdquo
ldquohellip we only get the annual results from the estimating company as to whats happening to the APU trendhelliprdquo
NA Organic Growth ndash APU
LKQ Appears to have Deceived Investors
What LKQ Tells Investors
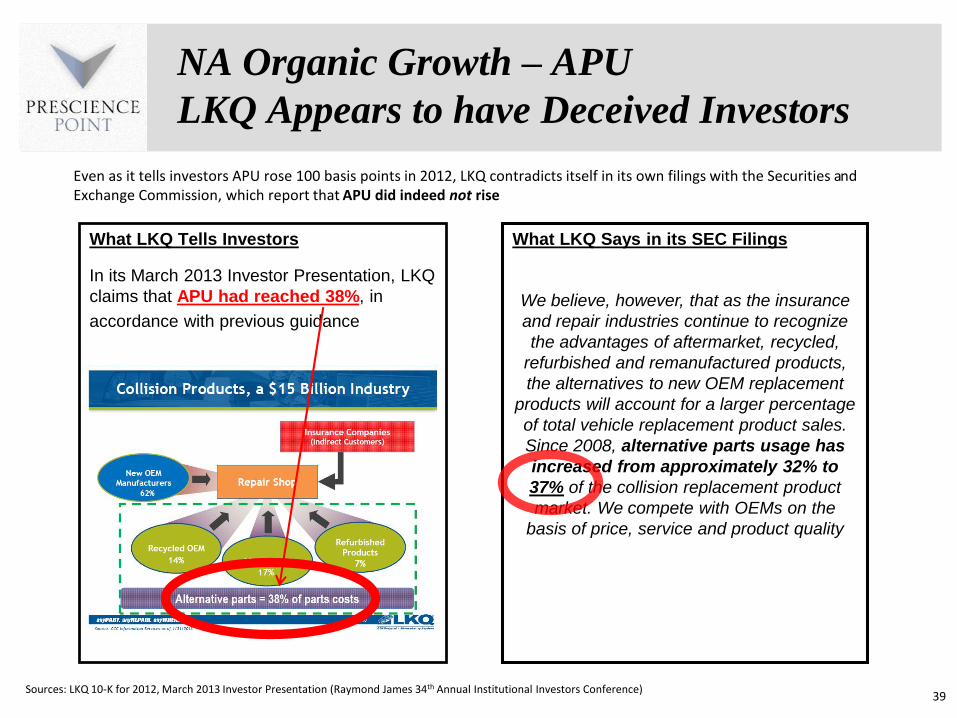
In its March 2013 Investor Presentation LKQ
claims that APU had reached 38 in
accordance with previous guidance
Sources LKQ 10-K for 2012 March 2013 Investor Presentation (Raymond James 34th Annual Institutional Investors Conference)39
What LKQ Says in its SEC Filings
We believe however that as the insurance
and repair industries continue to recognize
the advantages of aftermarket recycled
refurbished and remanufactured products
the alternatives to new OEM replacement
products will account for a larger percentage
of total vehicle replacement product sales
Since 2008 alternative parts usage has
increased from approximately 32 to
37 of the collision replacement product
market We compete with OEMs on the
basis of price service and product quality
Even as it tells investors APU rose 100 basis points in 2012 LKQ contradicts itself in its own filings with the Securities and Exchange Commission which report that APU did indeed not rise
40
OEM Price-Matching
Parts Price Deflation Began in 2Hrsquo2012
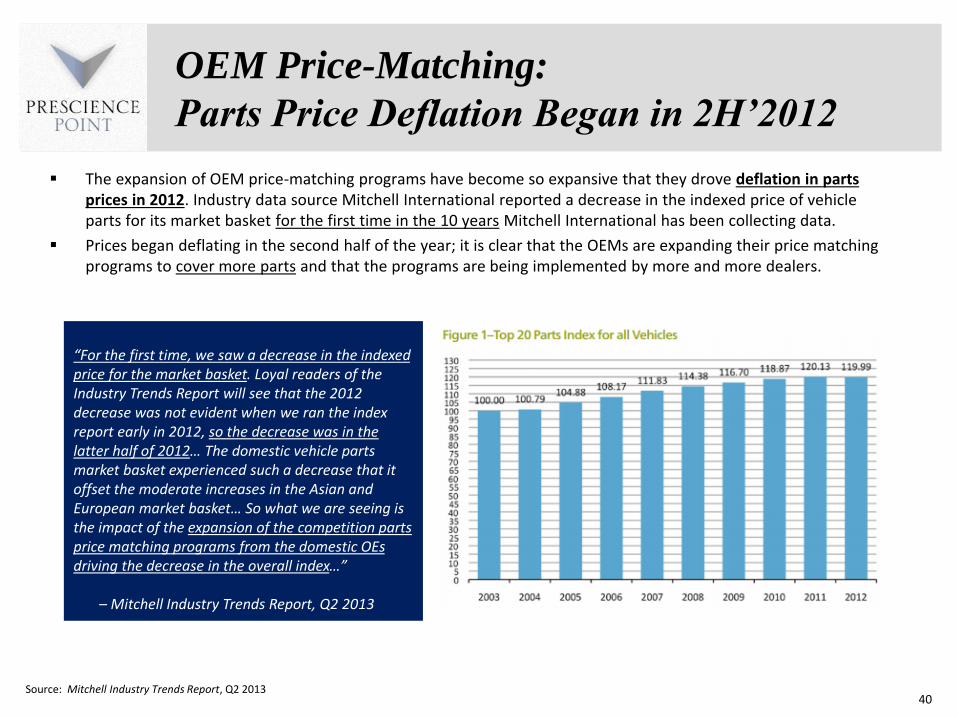
The expansion of OEM price-matching programs have become so expansive that they drove deflation in parts prices in 2012 Industry data source Mitchell International reported a decrease in the indexed price of vehicle parts for its market basket for the first time in the 10 years Mitchell International has been collecting data
Prices began deflating in the second half of the year it is clear that the OEMs are expanding their price matching programs to cover more parts and that the programs are being implemented by more and more dealers
Source Mitchell Industry Trends Report Q2 2013
ldquoFor the first time we saw a decrease in the indexed price for the market basket Loyal readers of the Industry Trends Report will see that the 2012 decrease was not evident when we ran the index report early in 2012 so the decrease was in the latter half of 2012hellip The domestic vehicle parts market basket experienced such a decrease that it offset the moderate increases in the Asian and European market baskethellip So what we are seeing is the impact of the expansion of the competition parts price matching programs from the domestic OEs driving the decrease in the overall indexhelliprdquo
ndash Mitchell Industry Trends Report Q2 2013
41
OEM Price-Matching (Contrsquod)
Parts Price Deflation Began in 2Hrsquo2012
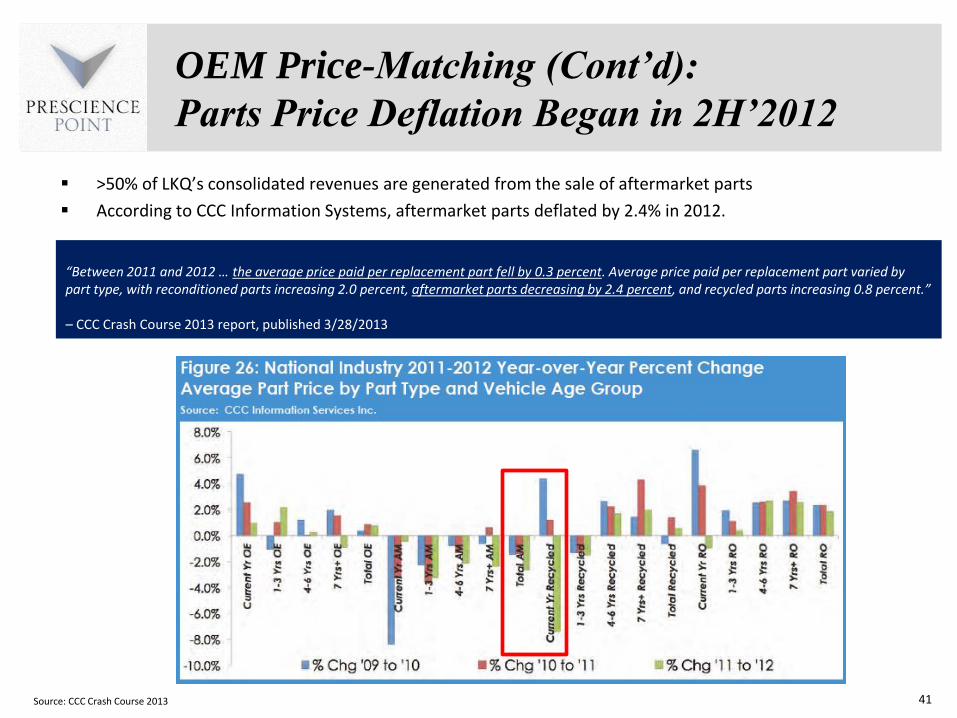
gt50 of LKQrsquos consolidated revenues are generated from the sale of aftermarket parts
According to CCC Information Systems aftermarket parts deflated by 24 in 2012
ldquoBetween 2011 and 2012 hellip the average price paid per replacement part fell by 03 percent Average price paid per replacement part varied by part type with reconditioned parts increasing 20 percent aftermarket parts decreasing by 24 percent and recycled parts increasing 08 percentrdquo
ndash CCC Crash Course 2013 report published 3282013
Source CCC Crash Course 2013
42
State Farm Insurancersquos New PartsTrader
Platform to Drive Even More Pricing Pressure
wwwpartstraderuscom
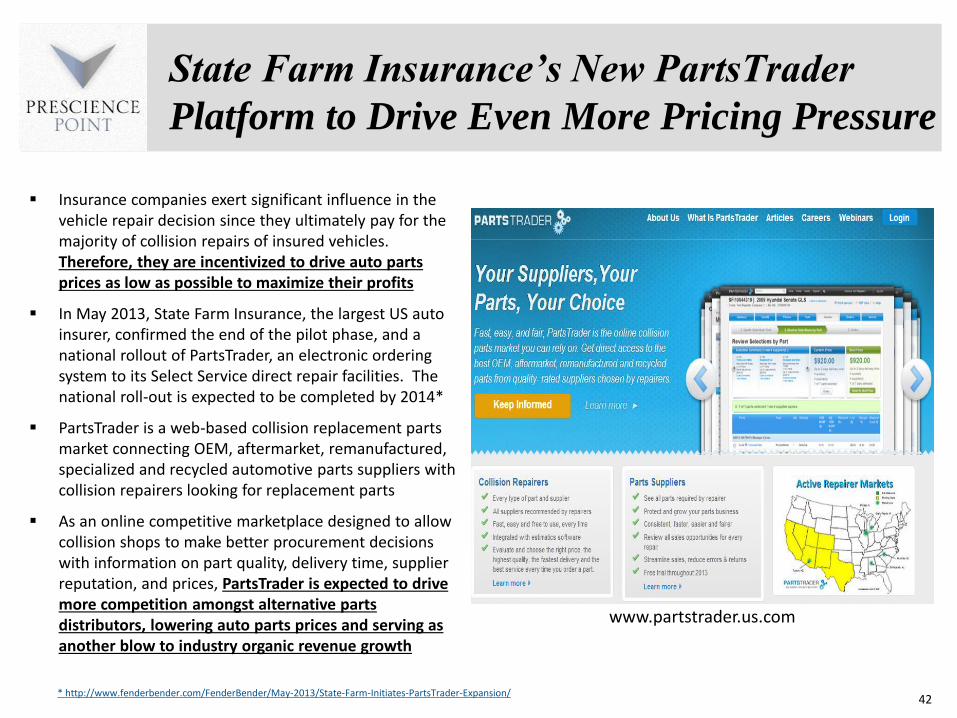
Insurance companies exert significant influence in the vehicle repair decision since they ultimately pay for the majority of collision repairs of insured vehicles Therefore they are incentivized to drive auto parts prices as low as possible to maximize their profits
In May 2013 State Farm Insurance the largest US auto insurer confirmed the end of the pilot phase and a national rollout of PartsTrader an electronic ordering system to its Select Service direct repair facilities The national roll-out is expected to be completed by 2014
PartsTrader is a web-based collision replacement parts market connecting OEM aftermarket remanufactured specialized and recycled automotive parts suppliers with collision repairers looking for replacement parts
As an online competitive marketplace designed to allow collision shops to make better procurement decisions with information on part quality delivery time supplier reputation and prices PartsTrader is expected to drive more competition amongst alternative parts distributors lowering auto parts prices and serving as another blow to industry organic revenue growth
httpwwwfenderbendercomFenderBenderMay-2013State-Farm-Initiates-PartsTrader-Expansion
43
NA Organic Growth ndash
Not Reconcilable w End Market Growth
LKQrsquos reported NA Parts and Services organic growth rate also appears unhinged from the growth rates reported by companies in its primary North American end market collision repair shops
For example Boyd Group (TSX BYDUN) is a Canada-based company that is consolidating the USCanada collision repair industry as a multi-service operator (MSO) Boyd has 228 locations in five Canadian provinces and 14 US states
According to the Romans Group LLC Boyd is a player in the fastest growing segment of the collision repair industry and is outperforming its peers in that segment1 Specifically
Boyd is a part of ldquothe $20+ million US collision repair segment (which) continues to grow market share and brand relatively faster than other segments of the collision repair industryrdquo and
Boyd has significantly grown its market share relative to the other top $20mm+ operators since 2006
(1) A Profile of the Evolving Collision Repair Marketplace Parts 1 amp 2 The Romans Group 2012
LKQrsquos NA Organic Growth is Too Predictably
Positive and Smooth in a Cyclical Industry
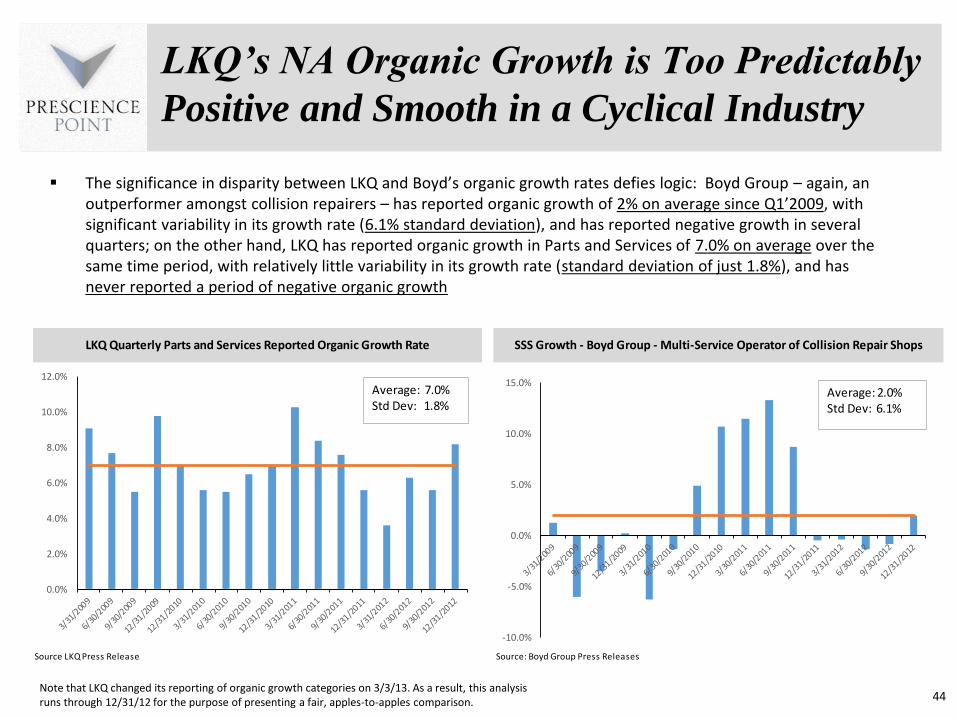
The significance in disparity between LKQ and Boydrsquos organic growth rates defies logic Boyd Group ndash again an outperformer amongst collision repairers ndash has reported organic growth of 2 on average since Q1rsquo2009 with significant variability in its growth rate (61 standard deviation) and has reported negative growth in several quarters on the other hand LKQ has reported organic growth in Parts and Services of 70 on average over the same time period with relatively little variability in its growth rate (standard deviation of just 18) and has never reported a period of negative organic growth
Note that LKQ changed its reporting of organic growth categories on 3313 As a result this analysis runs through 123112 for the purpose of presenting a fair apples-to-apples comparison 44
Source LKQ Press Release Source Boyd Group Press Releases
LKQ Quarterly Parts and Services Reported Organic Growth Rate SSS Growth - Boyd Group - Multi-Service Operator of Collision Repair Shops
00
20
40
60
80
100
120
-100
-50
00
50
100
150Average 20Std Dev 61
Average 70Std Dev 18
The European ldquoGrowth Fantasyrdquo ndash
Short-Term Decision-Making Signals
Desperation to Keep Financials Inflated amp
Meet Guidance Targets
Euro Car Parts ndash
LKQrsquos Largest Contributor to Organic Growth
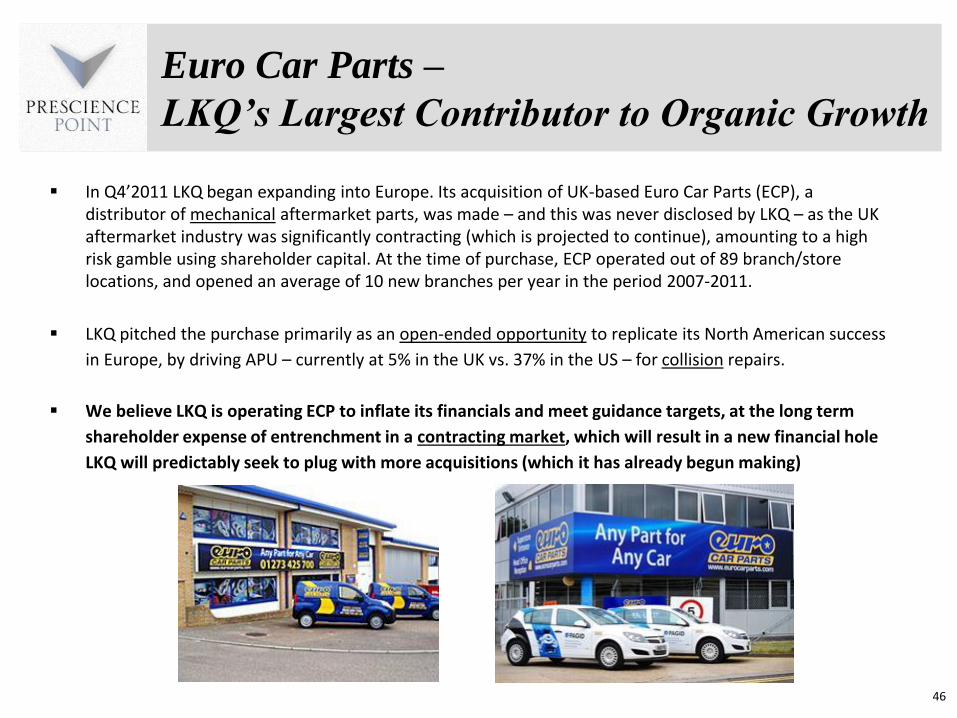
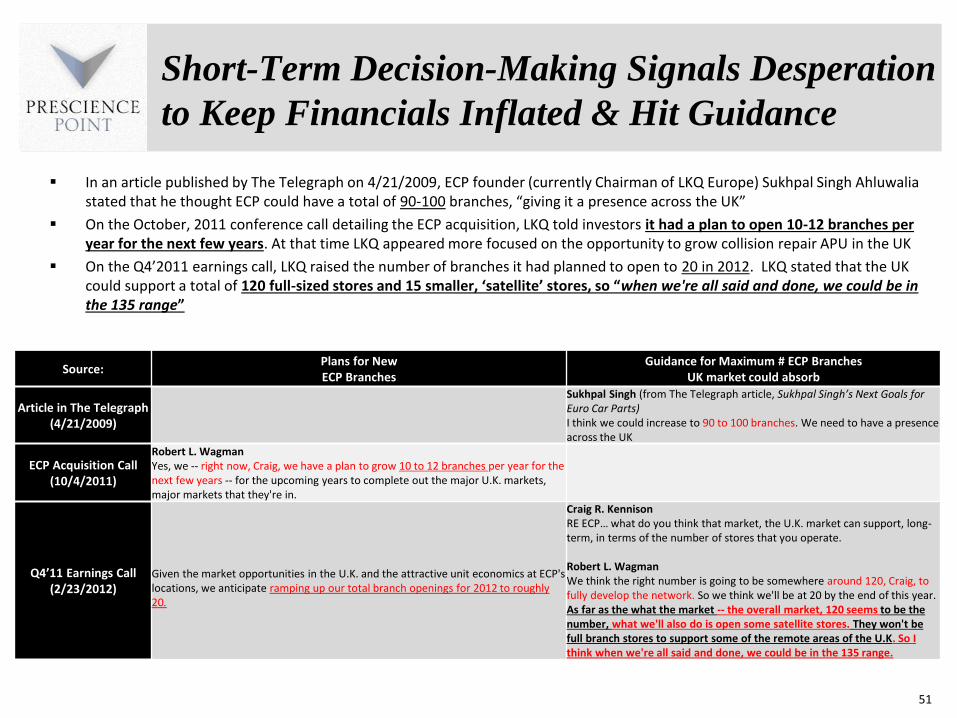
In Q4rsquo2011 LKQ began expanding into Europe Its acquisition of UK-based Euro Car Parts (ECP) a distributor of mechanical aftermarket parts was made ndash and this was never disclosed by LKQ ndash as the UK aftermarket industry was significantly contracting (which is projected to continue) amounting to a high risk gamble using shareholder capital At the time of purchase ECP operated out of 89 branchstore locations and opened an average of 10 new branches per year in the period 2007-2011
LKQ pitched the purchase primarily as an open-ended opportunity to replicate its North American success
in Europe by driving APU ndash currently at 5 in the UK vs 37 in the US ndash for collision repairs
We believe LKQ is operating ECP to inflate its financials and meet guidance targets at the long term
shareholder expense of entrenchment in a contracting market which will result in a new financial hole
LKQ will predictably seek to plug with more acquisitions (which it has already begun making)
46
Euro Car Parts ndash
LKQrsquos Largest Contributor to Organic Growth
History of Acquisition In October 2011 LKQ acquired Euro Car Parts (ECP) a leading distributor of mechanicalaftermarket parts in the UK for a total of ~$432m (including the paid in full performance-based contingent component) ECP was founded by Sukhpal Singh Ahluwalia who today serves as Chairman of LKQ Europe
LKQ reported that ECP had grown revenue at a CAGR of 30+ from 2009-2011 it generated 2011 revenue of $523m equating to ~15 of LKQ sales
At the time of purchase ECP operated 89 branch locations and opened an average of 10 new branches per year in the period 2007-2011
LKQ pitched the acquisition as
a) an opportunity to continue expanding ECPrsquos branch network and
b) an open-ended opportunity to drive alternative part usage (APU) for collision repairs in the UK ndashwhere APU is ~5 (vs 37 in the US) ndash by educating insurers about the value proposition of alternative parts Per Chairman Joseph Holsten on the October 4 2011 ECP acquisition call
ECP is LKQrsquos single largest driver of reported organic growth LKQ reported ECPrsquos organic growth rate to be 30+ beginning in Q4rsquo2012 and in each quarter since
47
ldquohellip the opportunity is that whereas APU in the United States has moved from really even a sub-20 level when we first formed LKQ to 37 last year the UK market today stands at 3-7 APU utilization raterdquo
ECP ndash 30+ Organic Growth in a
Contracting Industry
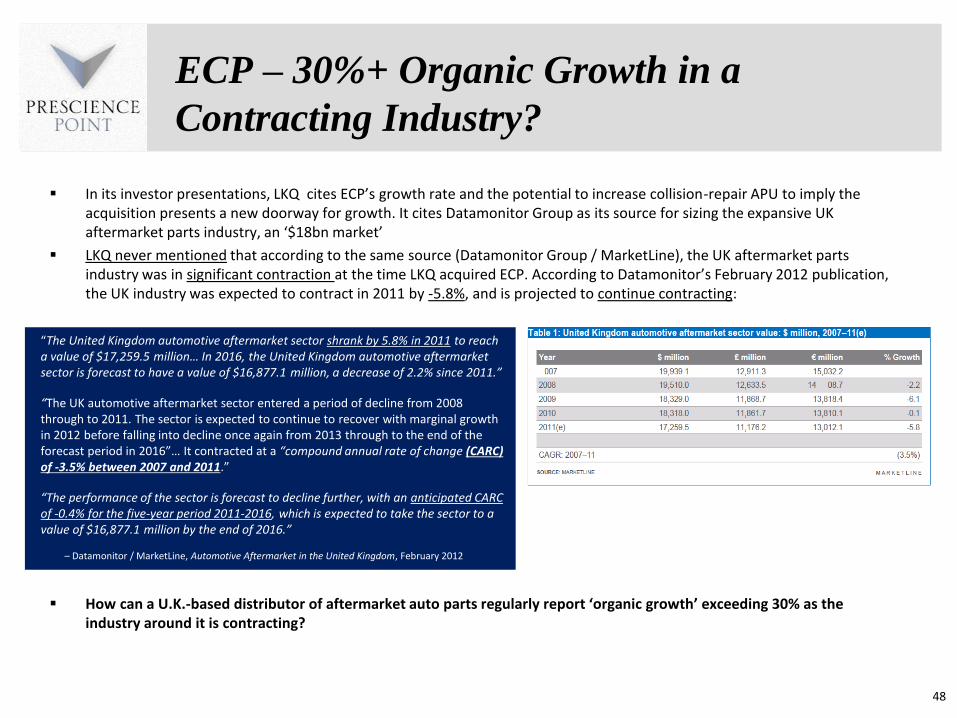
In its investor presentations LKQ cites ECPrsquos growth rate and the potential to increase collision-repair APU to imply the acquisition presents a new doorway for growth It cites Datamonitor Group as its source for sizing the expansive UK aftermarket parts industry an lsquo$18bn marketrsquo
LKQ never mentioned that according to the same source (Datamonitor Group MarketLine) the UK aftermarket parts industry was in significant contraction at the time LKQ acquired ECP According to Datamonitorrsquos February 2012 publication the UK industry was expected to contract in 2011 by -58 and is projected to continue contracting
How can a UK-based distributor of aftermarket auto parts regularly report lsquoorganic growthrsquo exceeding 30 as the industry around it is contracting
48
ldquoThe United Kingdom automotive aftermarket sector shrank by 58 in 2011 to reach a value of $172595 millionhellip In 2016 the United Kingdom automotive aftermarket sector is forecast to have a value of $168771 million a decrease of 22 since 2011rdquo
ldquoThe UK automotive aftermarket sector entered a period of decline from 2008 through to 2011 The sector is expected to continue to recover with marginal growth in 2012 before falling into decline once again from 2013 through to the end of the forecast period in 2016rdquohellip It contracted at a ldquocompound annual rate of change (CARC) of -35 between 2007 and 2011rdquo
ldquoThe performance of the sector is forecast to decline further with an anticipated CARC of -04 for the five-year period 2011-2016 which is expected to take the sector to a value of $168771 million by the end of 2016rdquo
ndash Datamonitor MarketLine Automotive Aftermarket in the United Kingdom February 2012
ECP ndash
lsquoOrganic Growthrsquo That Isnrsquot Really lsquoOrganicrsquo
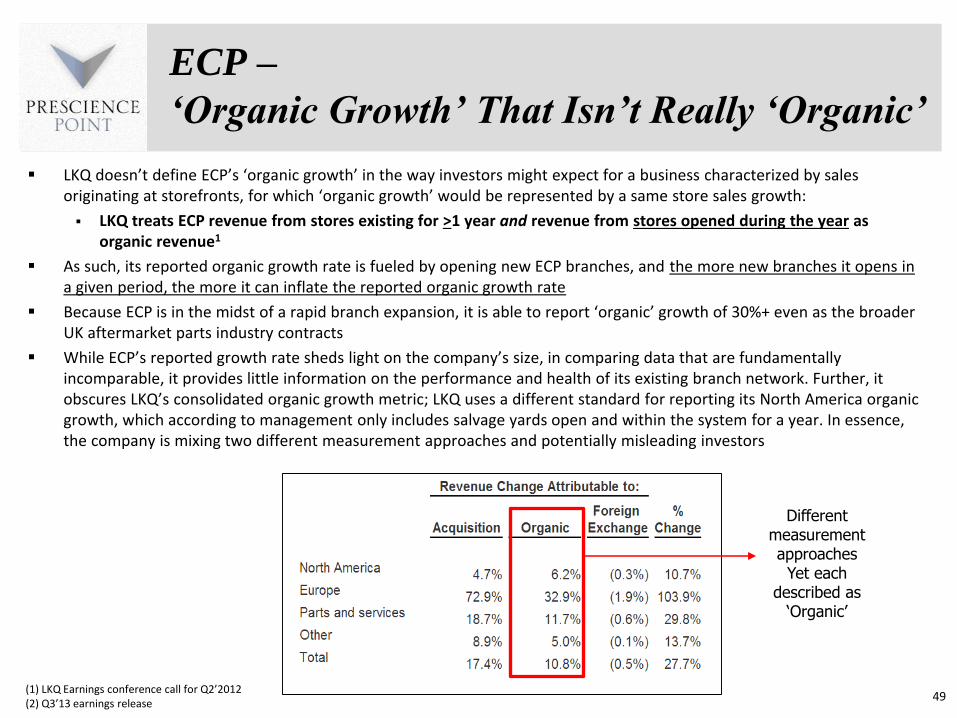
LKQ doesnrsquot define ECPrsquos lsquoorganic growthrsquo in the way investors might expect for a business characterized by sales originating at storefronts for which lsquoorganic growthrsquo would be represented by a same store sales growth
LKQ treats ECP revenue from stores existing for gt1 year and revenue from stores opened during the year as organic revenue1
As such its reported organic growth rate is fueled by opening new ECP branches and the more new branches it opens in a given period the more it can inflate the reported organic growth rate
Because ECP is in the midst of a rapid branch expansion it is able to report lsquoorganicrsquo growth of 30+ even as the broader UK aftermarket parts industry contracts
While ECPrsquos reported growth rate sheds light on the companyrsquos size in comparing data that are fundamentally incomparable it provides little information on the performance and health of its existing branch network Further it obscures LKQrsquos consolidated organic growth metric LKQ uses a different standard for reporting its North America organic growth which according to management only includes salvage yards open and within the system for a year In essence the company is mixing two different measurement approaches and potentially misleading investors
(1) LKQ Earnings conference call for Q2rsquo2012(2) Q3rsquo13 earnings release
49
2
Different measurement approaches
Yet each described as
lsquoOrganicrsquo
50
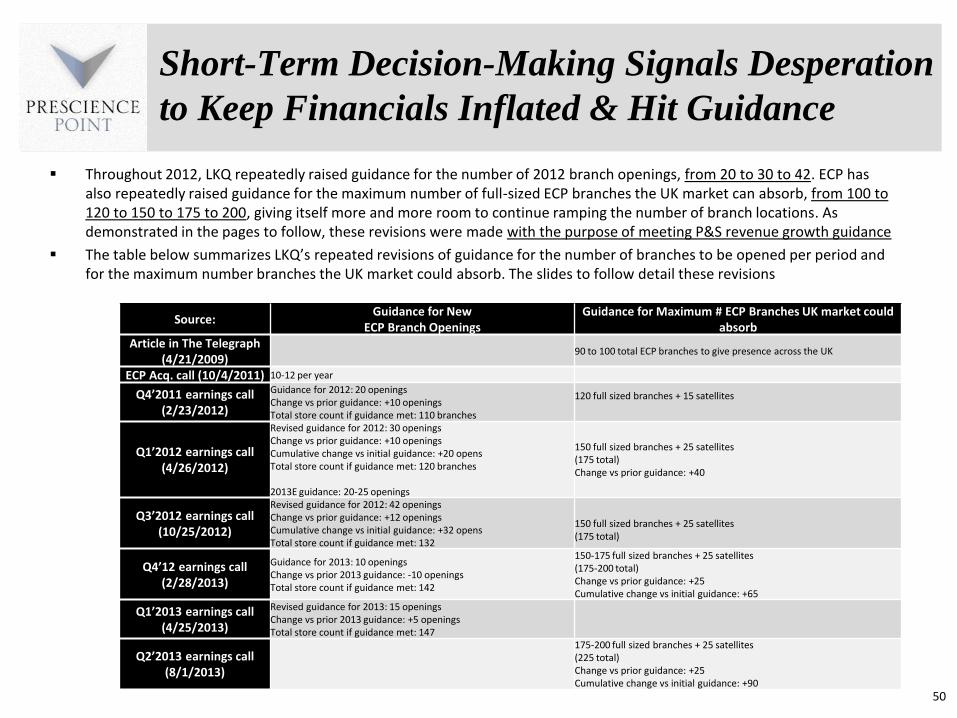
Throughout 2012 LKQ repeatedly raised guidance for the number of 2012 branch openings from 20 to 30 to 42 ECP has also repeatedly raised guidance for the maximum number of full-sized ECP branches the UK market can absorb from 100 to 120 to 150 to 175 to 200 giving itself more and more room to continue ramping the number of branch locations As demonstrated in the pages to follow these revisions were made with the purpose of meeting PampS revenue growth guidance
The table below summarizes LKQrsquos repeated revisions of guidance for the number of branches to be opened per period and for the maximum number branches the UK market could absorb The slides to follow detail these revisions
SourceGuidance for New
ECP Branch OpeningsGuidance for Maximum ECP Branches UK market could
absorbArticle in The Telegraph
(4212009)90 to 100 total ECP branches to give presence across the UK
ECP Acq call (1042011) 10-12 per year
Q4rsquo2011 earnings call (2232012)
Guidance for 2012 20 openingsChange vs prior guidance +10 openingsTotal store count if guidance met 110 branches
120 full sized branches + 15 satellites
Q1rsquo2012 earnings call (4262012)
Revised guidance for 2012 30 openingsChange vs prior guidance +10 openingsCumulative change vs initial guidance +20 opensTotal store count if guidance met 120 branches
2013E guidance 20-25 openings
150 full sized branches + 25 satellites(175 total)Change vs prior guidance +40
Q3rsquo2012 earnings call (10252012)
Revised guidance for 2012 42 openingsChange vs prior guidance +12 openingsCumulative change vs initial guidance +32 opensTotal store count if guidance met 132
150 full sized branches + 25 satellites(175 total)
Q4rsquo12 earnings call(2282013)
Guidance for 2013 10 openings Change vs prior 2013 guidance -10 openings Total store count if guidance met 142
150-175 full sized branches + 25 satellites(175-200 total)Change vs prior guidance +25Cumulative change vs initial guidance +65
Q1rsquo2013 earnings call(4252013)
Revised guidance for 2013 15 openings Change vs prior 2013 guidance +5 openingsTotal store count if guidance met 147
Q2rsquo2013 earnings call(812013)
175-200 full sized branches + 25 satellites(225 total)Change vs prior guidance +25Cumulative change vs initial guidance +90
Short-Term Decision-Making Signals Desperation
to Keep Financials Inflated amp Hit Guidance
51
In an article published by The Telegraph on 4212009 ECP founder (currently Chairman of LKQ Europe) Sukhpal Singh Ahluwaliastated that he thought ECP could have a total of 90-100 branches ldquogiving it a presence across the UKrdquo
On the October 2011 conference call detailing the ECP acquisition LKQ told investors it had a plan to open 10-12 branches per year for the next few years At that time LKQ appeared more focused on the opportunity to grow collision repair APU in the UK
On the Q4rsquo2011 earnings call LKQ raised the number of branches it had planned to open to 20 in 2012 LKQ stated that the UK could support a total of 120 full-sized stores and 15 smaller lsquosatellitersquo stores so ldquowhen were all said and done we could be in the 135 rangerdquo
SourcePlans for New ECP Branches
Guidance for Maximum ECP Branches UK market could absorb
Article in The Telegraph (4212009)
Sukhpal Singh (from The Telegraph article Sukhpal Singhrsquos Next Goals for Euro Car Parts)I think we could increase to 90 to 100 branches We need to have a presence across the UK
ECP Acquisition Call (1042011)
Robert L WagmanYes we -- right now Craig we have a plan to grow 10 to 12 branches per year for the next few years -- for the upcoming years to complete out the major UK markets major markets that theyre in
Q4rsquo11 Earnings Call(2232012)
Given the market opportunities in the UK and the attractive unit economics at ECPs locations we anticipate ramping up our total branch openings for 2012 to roughly 20
Craig R KennisonRE ECPhellip what do you think that market the UK market can support long-term in terms of the number of stores that you operate
Robert L WagmanWe think the right number is going to be somewhere around 120 Craig to fully develop the network So we think well be at 20 by the end of this year As far as the what the market -- the overall market 120 seems to be the number what well also do is open some satellite stores They wont be full branch stores to support some of the remote areas of the UK So I think when were all said and done we could be in the 135 range
Short-Term Decision-Making Signals Desperation
to Keep Financials Inflated amp Hit Guidance
52
On the Q1rsquo2012 LKQ announced an increase in anticipated store openings to 30 in 2012 which would result in a total of 120 stores (the previously stated market saturating count) Furthermore it announced plans to open another 20-25 stores in 2013 which would take the total number of stores to 140-145 well beyond previous guidance for UK market saturation It followed by raising the ceiling on the number of stores the market could absorb to 150 full-sized stores and 25 satellite branches (175 in total) which would seem to indicate branches in major metropolitan areas being ldquo5 miles or so apartrdquo(akin to a Starbucks model) LKQ would continue to raise from this level the maximum number of stores the UK could absorb
On the Q3rsquo2012 earnings call for the 3rd time LKQ revised higher guidance for the number of branch openings planned to 32 for 2012 (from initial guidance for 10-12) which would make for 132 branches in total LKQ also stated ldquoWeve said we believe the total store count is going to be somewhere around 150 to 175rdquo
SourcePlans for New ECP Branches
Guidance for Maximum ECP Branches UK market could absorb
Q1rsquo12 Earnings Call(4262012)
And due to favorable market conditions and ECPs managements proven ability to effectively and efficiently open branches we anticipate accelerating new branch openings to 30 in 2012 which is 10 more than the 20 we were anticipating on our last call
Robert L WagmanSo we believe well get to roughly 120 locations by the end of this year if all goes to plan We want to add probably another 20 or 25 next year which adds to about 150
Unknown AnalystWould you tell us just a little bit there about ECP and talk about the footprint I mean with the growth expansion-- if you look at how far these are apart any chance of cannibalizing in those markets
Robert L WagmanhellipWe think that surely branches in major metropolitan areas can be 5 miles or so apart So theres not necessarily cannibalization its just better service for the customershellip And then on the last call we talked about these ancillary locations not full sized branches Our average branch over there is a 10000-square foot branch These would be smaller offshoots in more rural areas That may be another 20 to 25 locations So when this is all said and done well be at about roughly 175 locations in the UK Cannibalization there is a slight -- when you put one 5 miles apart from each other we do move some of the revenue from one branch to the other Butagain because of the better service levels we can provide we do see an uptick in the revenue pretty quickly
Q3rsquo12 Earnings Call (10252012)
During the quarter we opened 10 new branches in the UK bringing our total branch count to 120 Since the acquisition of ECP in early October 2011 we have opened 31 branches surpassing the target number of 30 I mentioned on the last call Given that market conditions in the UK combined with the continued success of ECP we have approved an additional 12 new branch openings for the fourth quarter bringing our total target to 132 branches by year-end
John R LawrenceRob would you take a -- if you look at ECP overall out for the next 12 to 18 months -- how do you look at allocating CapEx dollars Obviously youre doing that with some more stores but longer term that marketplace -- the viability to spend more capital over there
Robert L WagmanWeve said we believe the total store count is going to be somewhere around 150 to 175 We believe that number is still to be true And in fact we may actually be able to go a little bit above 175 with those satellite stores to feed the more remote areas
Short-Term Decision-Making Contrsquod
53
On the Q4rsquo12 call LKQ indicated that the 12 stores opened through January 2013 were pulled forward from the 25 it had projected to open in 2013 and that it would take a break from opening new stores until Q2rsquo2013 at which point it could have evaluated the progress of the newly opened stores There was a deceptive change in language in guidance for possible total store count calling for 150-175 full sized branches andan additional 25 satellites (200 in total) (Recall that on the Q1rsquo12 call then reaffirmed on the Q3rsquo12 call they guided that the market could absorb to 150 full-sized stores and 25 satellite branches (175 in total)
On the Q1rsquo2013 earnings call LKQ announced plans to open another 15 in Q3 and Q4 2013 which would make for a total of 147 ECP branches (against initial guidance that the UK could absorb 120)
On the Q2rsquo2013 call in August 2013 LKQ again raised the limit on its estimate for the total number of stores the UK could absorb to 175-200 full sized branches (from 150-175 before that 150 before that and 120 before that)
Then on November 12 2013 in a press release announcing ECPrsquos founder had been promoted to serve as chairman of LKQ Europe he stated ldquoThe UK alone will have 200 Euro Car Parts branches within three yearsrdquo
SourcePlans for New ECP Branches
Guidance for Maximum ECP Branches UK market could absorb
Q4rsquo12 Earnings Call(2282013)
Robert L WagmanDuring the fourth quarter we opened 10 new branches and we opened 2 additional branches in January bringing our total branch count to 132hellip hellipWith the 12 we did in Q4 originally scheduled for 2013 so we pushed them in 2012 So as John said were going to reevaluate this in Q2 but I would expect if we feel comfortable well add another 10 in 2013 to fill up to get to 142 with still some growth for 2014 and 15 as well
Robert L WagmanhellipWere still standing by our projections of 150 to 175 what we call Tier 1 ECP locations and an additional 25 or so Tier 2 the smaller or remote markets
Q1rsquo13 Earnings Call (4252013)
Now turning to Euro Car Parts We continue to be impressed with the performance of Euro Car Parts and its ability to capture market share In Q1 ECP achieved strong organic revenue growth of 321 With the continued performance in ECPs financial results and the strength of ECPs management team I am pleased to announce that we have approved an additional 15 new branches for 2013 that are scheduled to open in the third and fourth quarter of this year
Q2rsquo13 Earnings Call(812013)
John S Quinnhellip Weve targeted 15 for the balance of this year That will take us up to circa 147
John S Quinn We think the right number is probably somewhere in 175 to 200 for what we consider a full branch and then there will be some satellite opportunities in addition to that Over time as we grow that were going to have to look at the infrastructure associated with that regional hubs and the 2 main central hubs
LKQ PR announcing leadership change
Sukhpal Singh Ahluwalia lsquoI have never been more hungry excited or determined to maximise our potential for the next decade and beyond The UK alone will have 200 Euro Car Parts branches within three years and we have ambitious targets for paint collision parts and e-commercersquo
Short-Term Decision-Making Contrsquod
12282012 Right before 2012 Yr End ldquoOur Biggest Sale Ever Up to 45rdquo We have a Sale on at the moment where you can save up to 45 off on Car Partsbut it doesnt last long - must end midnight 1st Jan so hurry
8162012 rdquoMid Month Madness 30 off Car Parts Selected Car Partsrdquo Owning to popular demand (everybody likes a big juicy discount) ndashwersquove decided to bring the big daddy back ndash yes thatrsquos 30 off Car Parts as well as ALL Engine oils
9272012 Right before Q3rsquo12 Ended ECP ran a promotion ldquoThe Boss is Away 31 off Promo Code InsidehellipEnds Sundayrdquo Our biggest ever discount offered on almost ALL car partshellipcash in before the boss is back
bull In 2012 ECP started heavy price discounting of parts across the board Most discounts touted up to 30 off often on all products sold By the end of the year the savings discounts reached up to 45 off
bull Many of these sales appeared right at the end of the quarter in what appears to be an attempt to juice results ahead of reporting to investors
httpwwwgolfgtiforumcoukindexphptopic=2361380 httpwwwgolfgtiforumcoukindexphptopic=2386450 httpwwwgolfgtiforumcoukindexphptopic=2461350
Short-Term Decision-Making Steep
Discounting to Hit Numbers in 2012
54
5242013 ndashrdquoThe Online Bank Holiday Sale Up to 50 Off Everythingrdquo
ldquoItrsquos BACK again ndash Up to 50 OFF EVERYTHING No promo code required Must End Midnight Monday 27th Mayhelliprdquo
9272013 Before the end of Q3rsquo13
ldquoEnd of Summer Clearance up to 50 off Everything Onlinerdquoand you donrsquot need a promo code as current prices reflect the discount by defaultrdquo
3282013 Before the end of Q1rsquo13
ldquoOur Biggest Ever Sale ndash Up to 50 off Everythingrdquo
55
httpwwwgolfgtiforumcoukindexphpPHPSESSID=rffknoatjiinf0n2nuhh828uv6amptopic=2512620
httpwwwgolfgtiforumcoukindexphpPHPSESSID=rffknoatjiinf0n2nuhh828uv6amptopic=2542750
httpwwwgolfgtiforumcoukindexphpPHPSESSID=rffknoatjiinf0n2nuhh828uv6amptopic=2598690
In 2013 discounts increased noticeably from 30 to upwards of 50 off Each promotion is touted as its ldquobiggest sale everrdquo ECP has continued its practice of running promotions right towards the end of the quarter
Not one time has LKQ attributed such discounts as a driver of its persistently declining gross margin
With Even Bigger Promotions in 2013
On the Q4rsquo2011 call (22312) LKQ guided for 20 stores to be opened in 2012 and guided for
2012 Parts and Services organic revenue growth 55-70 (Guidance for PampS organic
growth includes the impact from anticipated ECP store openings)
On the Q1rsquo2012 earnings call (42612) guidance was revised lower to 50-70 even as
LKQ raised the number of anticipated 2012 store openings by +10 to 30 indicating the
intent to make up for unanticipated weakness in North America with new branch
openings LKQ stated that in order to meet 2012 guidance certain anticipated tailwinds
would have to materialize specifically stating APU would likely rise from 37 to 38
On the Q3rsquo2012 earnings call (102512) LKQ raised the number of anticipated 2012 store
openings by +12 to 42 and raised the lower end of the range for organic growth by 50bp to
60-70 In Q3 the opening of new ECP branches alone accounted for 40 of Parts and
Services organic growth
The increase in the number of stores openings during Q4rsquo12 resulted in ECP growing to
account for 75 of LKQrsquos Q4rsquo2012 PampS organic growth by our estimates enabling it to
report 6 organic revenue growth and meet the low end of the guidance range
In sum LKQ stated a reliance on APU rising to 38 to meet the initially released 2012
guidance levels although LKQ appears deceptive with investors in claiming this APU target
was met the data released by its information source refutes its claims reporting that at the
end of 2012 APU was 37 unchanged from 2011 This left LKQ reliant on other sources of
organic growth to meet guidance
In 2012 LKQ juiced its organic growth rate by opening double the number of ECP
branches initially guided for indicating LKQ made strategic decisions related to ECP
openings at the expense of long-term value creation to inflate its financials and hit
guidance 2012 guidance for organic revenue growth 56
ldquoWe included in the internal growth and the earnings guidance the new ECP locations opened to date and planned for the balance of the year Rob mentioned that we plan to increase the number of branch openingshellip To reach our guidance were obviously assuming that the rest of the year gets better and we do think there are some tailwinds to help us in that regard In 2011 we saw alternative part usage rate in the industry of 37 Based on what were seeing in the market today we believe that in 2012 well see that rate increase to at least 38
How Did This Play Out In Pacifying
Wall St Estimates
ECP ndash lsquoOrganicrsquo Growth Contribution to LKQ
Parts and Services Org Growth is Now gt50
ECPrsquos reported organic growth rate has grown to account for gt50 of LKQrsquos consolidated Parts and Services organic growth rate
ECPrsquos organic growth rate is a short-term phenomenon
As ECPrsquos reported organic growth rate begins to fall and converge with the industry rate of growth it will result in yet another large financial hole LKQ will predictably seek to plug
(1) Q2rsquo2013 ECP SSS adjusted for 2 extra selling days SSS provides little insight as it is inflated by the revenue ramp of newly opened branches which take 3 years to mature
(2) NA organic growth contribution is a PP estimate imputed by backing out organic growth from ECP from reported Parts and Services organic growth 57
ECP Reported Organic Sales Growth1 ECP Contribution to Parts and Services Organic Growth2
PP model Uses 2006 as anchor year and is based on the number of per year ECP branch openings since 2006 and our projection of store builds through 2016 which reflects LKQrsquos Europe Chairmanrsquos expectation of 200 stores within 3 years Assumes that at maturation each store generates $54m ECPrsquos average reported revenuestore in the period 2010-2012 ECP generally experiences the most significant growth benefit from a new branch in the year of first generating sales and benefits continue to accrue through a 3 year store maturation period (LKQ earnings conference call for Q3rsquo2012)
ECP ndash lsquoOrganicrsquo Growth Rate Unsustainable
Driven by Accelerated Store Expansion
ECP had a total of 89 branches when LKQ bought it in October 2011 and had opened an average of 10 new branches per year from 2007-2011 In 2012 alone LKQ opened 40 new branches In just 2 years at 9312013 LKQ had 138 total branches and intends to have 200 by the end of 2016
The chart to the right below contains a simulation approximating the revenue build and growth rate for ECP that would result solely from opening new ECP branches The levels of organic growth projected by the estimated growth rate trend are reflective of the levels reported by ECP (after taking into account that our simulation understates ECPrsquos reported growth rates in its earlier periods due to assuming no new stores were opened in 2006 and prior) As such we believe ECPrsquos growth is almost entirely explained by branch openings as opposed to same store sales growth for matured (ie gt3 years old) branches a result we would expect given the industry may be contracting
This means that as ECP approaches its market saturating goal of 200 total branches its reported organic growth rate will plummet converging to the industry rate of growth ndash which is negative
58Historical Data from ECP 2009 Annual Report amp the ECP Heritage webpage
2014-2016E from ldquo200 Euro Car Parts branches within three years ldquo
ECP Current and Projected Store Base Simulated ECP Growth Solely from New Branch Openings
LKQ appears to operate ECP with the primary intent of unsustainably inflating its financials and meeting guidance targets at the long term shareholder expense of entrenchment in a contracting market We believe the result is predictable A new financial hole will be left in the wake of a slowdown of in ECP branch openings that LKQ will seek to plug with more acquisitions (which have already begun taking place)
Growing ECP branches was not an LKQ priority when it justified the acquisition and this is evident by its initial plan to open only 10-12 stores per year On the ECP Acquisition call (1142012) LKQ stated that it had a strategic ldquoplan to grow 10 to 12 branches per year for the next few yearsrdquo It broke from that lsquoplanrsquo just one quarter later and following repeated revisions branch store openings opened 40 branches in 2012 Coincidentally growth in North America was weakening Based on our estimates by Q4rsquo2012 ECP accounted for a full 75 of consolidated PampS organic growth and enabling LKQ to hit guidance
LKQ has repeatedly raised the ceiling for the maximum number of ECP branches the UK market can absorb On the Q1rsquo2012 earnings call LKQ stated in another revision that the UK could absorb a maximum of 150 full-sized ECP branches and indicated that at that level ldquobranches in major metropolitan areas can be 5 miles or so apartrdquo which would clearly result in cannibalization LKQ has since raised the ceiling on the maximum branch count to 200
As of 9302013 LKQ had a total of 138 stores (and growing) and plans to have 147 by YE2013 exceeding by 27 branches its initial guidance for the maximum number of stores the UK market could absorb (120 full-sized stores) which was likely the most credible number it has espoused given that it preceded the repeated store ramp-up and apparent quest to meet guidance It may have already saturated the UK market yet LKQ continues to invest shareholder capital into building new branches
LKQ appears to be juicing ECP sales with heavy discounting of parts with many such promotions offered right at the end of LKQrsquos fiscal quarters
Inevitably as ECP reaches its market saturating location capacity we expect ndash and we believe management has anticipated ndash its reported organic growth rate to plummet and converge to the industry average LKQ moved quickly to buy Sator in April 2013 amounting to its 3nd largest purchase ever at the time As a result its European reporting segment now includes both ECP and Sator This new reporting will obscure future financial deterioration at ECP
59
LKQrsquos Short-Termism Results in Increasing
Dependency on Acquisitions to Stay Afloat
60
Other Red Flags ECPrsquos Receivables
Growing 2x Faster Than Revenues
The recent acquisition of Sator appears designed to hide the problems occurring at Euro Car Parts By removing Satorrsquos Q2 2013 revenue and accounts receivable contribution we find that ECPrsquos receivables grew at 2x faster than reported revenues This is a major red flag for investors to consider
Source Company financial filings
European Segment Quarterly Operating Results$ in millions
Euro Car Parts Results Only SatorECP Pro Forma
3m Ended 3m Ended 3m Ended 3m Ended 3m Ended 3m Ended 3m Ended Sator ECP Only
Dec 2011 March 2012 June 2012 Sept 2012 Dec 2012 March 2013 June 2013 Contribution(1) June 2013
Revenue $1385 $1607 $1652 $1813 $1888 $2126 $2978 $688 $2290
QoQ growth -- 160 28 97 41 126 401 -- 77
YoY growth -- -- -- -- 363 323 803 -- 386
Accts Receivables Net $509 $590 $600 $689 $702 $787 $1437 $531 $906
QoQ growth -- 160 17 148 18 121 827 -- 152
YoY growth -- -- -- -- 379 333 1393 -- 509
(1) LKQ Quarterly filing Note 9
61
The Real ECP A Lemon with Terrible
Customer Feedback
httpwwwreviewcentrecomOnline-Car-Part-SuppliersEuro-Car-Parts-www-eurocarparts-com-review_2041339
Increasing Dependency on Acquisitions to
Inflate Financials Conceal Cumulative
Manipulations
Apparent Dependency on Acquisitions to Inflate
Profits and Conceal Cumulative Manipulations
LKQrsquos move to expand internationally beginning with its acquisition of ECP was reminiscent of another chapter from the Waste Management Story ndash the final chapter that ended with fraud and failure
On the October 4 2011 ECP Acquisition conference call LKQ Chairman (and former President of Waste Management International) Joseph Holsten unprompted assured shareholders that LKQ would not repeat Waste Managementrsquos international expansion mistakes
The ensuing realities however have reflected little in the form of caution
63
Now a few of us in LKQ have kind of been down a similar road before in the waste business when we founded Waste Management International in the early 90s And we ran down the road kind of fast and probably got into markets that were not good markets to be in And as I go out -- you will see it from this management team Itrsquos a team that learns from that lesson and will be more cautious in its market entries in Europe We have a very strong commitment to our board that job one is to make sure that the deal in the UK is functioning and functioning extremely well before we move into further markets
We believe LKQ entered Europe in search of a fresh pool of large-scale acquisition targets and that it is dependent on acquisitions to continue inflating its organic growth rate and GAAP profits while papering over cumulative past misstatements
LKQ entered the UK market with the express primary purpose of driving APU for collision repairs and has made very little progress in doing so to date
Despite Chairman Holstenrsquos pledge of caution LKQ has invested shareholder capital to aggressively ramp the ECP branch countwhile the industry around it contracts
Furthermore just a year and a half following the ECP acquisition ndash again not having yet proven ldquothe deal in the UK is functioning extremely wellrdquo when measured against its stated core purpose ndash LKQ acquired Netherlands-based Sator Holding a distributor of spare parts to the automotive aftermarket industry in Belgium the Netherlands and Luxembourg for a total of $273m Sator was LKQrsquos 3rd largest acquisition ever at the time LKQ pitched the acquisition as an opportunity to ldquoachieve significant synergies and ultimately in the coming years use Sator in our highly successful Euro car parts operations as platforms for further expansion into collision parts or other revenue and profit streams in Europerdquo In the same way that it did ECP ndash as an open-ended opportunity of driving APU for collision repairs currently at 7 in Western Europe vs 37 in the US
In commenting about the acquisition founder and President of ECP Sukhpal Singh Ahluwalia appears to have had its sites set more on acquisitions than on expanding collision-repair APU
In a November 12 2013 LKQ press release announcing that Sukhpal Singh Ahluwalia would be promoted to serve as Chairman of LKQ Europe Singh stated
With time Holstenrsquos assurances of caution and LKQrsquos pitches for open-ended opportunities to drive collision European collision APU have been exposed to be diversions 64
ldquohellip Our goal is also to use this transaction as a springboard for further acquisitions in Europerdquo
ldquohellip Under my Chairmanship we will continue to hunt for new acquisitions maintain relationships with our key suppliers and push
forward to access new markets My vision is to develop a group of European aftermarket companies exceeding $5bn in
annualised revenue within five years The UK alone will have 200 Euro Car Parts branches within three years and we have
ambitious targets for paint collision parts and e-commercersquordquo
Dependency on Acquisitions to Inflate Profits
and Conceal Possible Cumulative Manipulations
LKQ is rapidly accelerating its deal making both in number and in dollar value
LKQ acquired 30 companies in 2012 alone against the backdrop of having acquired a total of 71 companies in the 3 years from 2010-2012 and 171 since its 1998 inception Notably LKQ reported a record 17 acquisitions in just Q4rsquo12
Within the past 2 years LKQ announced 3 of 4 of its largest acquisitions ever
Its acquisition of Keystone Automotive Operations on December 5 2013 is its 2nd largest ever Its acquisition of ECP in Q4 2011 is its 3rd largest ever Its acquisition of Sator in Q2rsquo2013 is its 4th largest ever
65
of Quarterly Deals Completed
Rapid Surge in Acquisitions in Q412
Acquisition Fair Value
Includes $3037m paid for ECP
Includes $273m paid for Sator
$450m paid for Keystone Automotive Operations (announced 1252013)
Dependency on Larger and Larger Acquisitions to
Inc Profits and Conceal Cumulative Problems
2012 change from midpoint
High Low Actual Results - 22813 Actual Initial Guidance Final Guidance
2012 Guidance -22312
Organic Revenue (partsservices) 550 -- 750 Organic Revenue (partsservices) 600 050 050
ECP branch openings included in guidance 20 -- 20 Income from continuing ops $2612 -25 -27
Income from continuing ops $2580 -- $2780 Diluted EPS $087 -25 -28
Diluted EPS (1) $0860 -- $093 CFO $2062 -222 -191
CFO $2500 -- $2800 CAPEX $882 -180 -72
CAPEX $1000 -- $1150
2012 Guidance -42612
Organic Revenue 500 -- 700
ECP branch openings included in guidance 30 -- 30
Income from continuing ops $2620 -- $2820
Diluted EPS $088 -- $094
CFO $2500 -- $2800
CAPEX $1000 -- $1150
2012 Guidance -72612
Organic Revenue 550 -- 700
ECP branch openings included in guidance 30 -- 30
Income from continuing ops $2650 -- $2820
Diluted EPS (1) $089 -- $094
CFO $2500 -- $2800
CAPEX $1000 -- $1150
2012 Guidance -102512
Organic Revenue 600 -- 700
ECP branch openings included in guidance 42 -- 42
Income from continuing ops $2650 -- $2720
Diluted EPS (1) $088 -- $091
CFO $2400 -- $2700
CAPEX $900 -- $1000
(1) Adjusted for 21 stock split on 81712 In April guidance was adjusted to include $003c legal settlement
While LKQ met 2012 revenue and barely missed on EPS guidance it missed dramatically on CFO guidance 2012 CFO came in -19 below revised guidance issued only 2 months before year end on 10252012 even as consolidated inventory turnover rose to 27x in 2012 (vs 25x in 2011)
As previously discussed acquisition accounting inherently and unsustainably boosts CFO LKQ made a record number of acquisitions in Q4 just as a gaping financial hole in CFO exposed itself We believe LKQ may be making acquisitions with the intent of inflating its financials and papering over past accounting manipulations
The cumulative deal size was insufficient to bail the company out but we note that in 2013 LKQ proceeded to raise the stakes making its 2nd
and 4th largest acquisitions since its inception
66
Dependency on Acquisitions to Inflate Profits
and Conceal Cumulative Manipulations
Note Yellow shading indicates
changes in guidance
67
As LKQrsquos Deal Making Gets Progressively
Worse and More Desperate
The recent acquisitions of Euro Car Parts Sator and Keystone Automotive Operations exhibit progressively lower gross margins and have been acquired at multiples that are substantially lower than LKQrsquos own current valuation We believe these acquisitions are partially used as a cover to explain away possible overstatement and deterioration of margins in its core business
$ in mm 2007 2011 2013 2013
Revenues growth(a)
$7269136
$509625
$3740~4-6
$7000--
Gross Margin 448 438 331 Low 30
EBIT margin
$49168
$33466
$26070
----
EBITDA margin
$64989
$38976
$31083
$700100
EPS Accretion(b) -- 015 - $018c $001c --
Purchase Price(c) $811 $347 $272 $450
EVLTM EBITDA 125x 89x 88x 64x
EVLTM Revenues 11x 068x 073x 064x
Source Company financials converted from local currencies(a) Sator growth described as low single digits on investor conference call(b) As stated to investors in the deal announcement(c) ECP deal excludes $76m of earnout payments to be made in 2013 and 2014
Euro Car Parts Sator HoldingKeystone Auto
OperationsKeystone Auto
Industries
68
Even Tuck-in Acquisition Quality
Smells of Desperation
Aside from large announced deals LKQ has continued to acquire various businesses in an opaque and unannounced fashion Below we analyze information found in the footnotes of its SEC filings for trends in its recent deal-making
We find further evidence that its deals are getting increasingly desperate with smaller sized and lower EBIT contribution
$ in mm 2012 YTD 2013 (a) Observation
Number of Deals 30 9 At 25-30 market share it must be harder to find smaller deals
Total Deal Value Goodwill Recorded
$2846 $1976
$411 $261
Goodwill amounting to ~65 of recent deals
Avg Deal Size $95 $45 Avg Deal Size Down 50
Revenue Contribution $1163 $124
EBIT Contribution $110 $05
Implied Avg EBIT MarginContribution
94 40 Avg EBIT Contribution Margin down 540bps indicates lower
quality businesses being added
Source Company financials (Note 9)(a) As the 6 months ended June 30 2013 and excludes the Sator acquisition
69
As Leverage Rises at the Same Time
With margins under persistent pressure growth in the US stagnating and the need to produce increasing revenue and EPS targets LKQ has brazenly pushed into Europe with two recent acquisitions
Recently in an unexpected manner LKQ announced the acquisition of Keystone Automotive Industries for $450m a deal that is currently being financed by short-term borrowing Pro forma for the incremental $70m of acquired EBITDA we estimate the companyrsquos leverage to be 22x DebtEBITDA
$ in
bill
ion
Note Pro forma for debt financed Keystone deal
$601
$956
$1118
$1312
$1762
180x
230x 220x214x
223x
000x
050x
100x
150x
200x
250x
$0
$200
$400
$600
$800
$1000
$1200
$1400
$1600
$1800
$2000
2010 2011 2012 9302013 PF 2014E
Total Debt DebtEBITDA
Deb
tEBITD
A
Inventory Accounting
Is Creative Accounting Inflating Gross
Margins
71
The Art of Inventory Accounting
Inventory Chicanery Tempts More Firms Fools More Auditors Wall St Journal Dec 14 1992
When companies are desperate to stay afloat inventory fraud is the easiest way to produce instant profits and dress up the balance sheet says Felix Pomerantz director of Florida International Universitys Center for Accounting Auditing and Tax Studies in Miamildquo Even auditors at the top accounting firms are often fooled because they usually still count inventory the old-fashioned way that is by taking a very small sample of the goods and raw materials in stock and comparing the count with managements tallies In addition Mr Pomerantz says outside auditors can fail to catch inventory scams because they either trust management too much or fear they will lose clients by being tougherldquo
72
No One Knows What LKQrsquos Sustainable Gross
Margin Rate is Potentially Even Management
httpseekingalphacomarticle1595912-lkq-management-discusses-q2-2013-results-earnings-call-transcriptpage=6ampp=qandaampl=last
Craig Kennison Robert W Baird amp Co Incorporated Research Division
And lastly on gross margin John it fell a little bit year-over-year Im guessing thats largely mix and a little bit of the scrap issue But what do you think the sustainable margin rate would be at the gross levelJohn S QuinnJohn Quinn LKQ Chief Financial Officer and Executive Vice President
Craig I think weve talked in the past that our view is excluding the seasonality that unless something changes things tend to stay the way they are in the short term And we probably did get a little bit negative impact in Q2 because of falling scrap prices We did see a little bit of benefit coming through in the car costs on the domestic side As I had mentioned the demand obviously went down Rob mentioned were buying a little bit better year-over-year so we are trying to see that theory if you will evidence of it coming through in the financials Then we do have a downtick coming with Sator in the short run because theyll be fully consolidated next quarter fourth quarter and so on And we only had them for 2 months So I would expect it to see a little sequential decline as a result of having them onboard to the full quarter (ECP) will as I mentioned earlier just anniversaried now so I dont anticipate any impact from that And you get a little bit sequential impact at having the absence of a decline in the scrap prices Itll help us a little bit in the next quarter
Q2 2013 Earnings Call Aug 01 2013
LKQ Does Not Guide on Gross Margins But When Recently Asked About LKQrsquos Sustainable Margin Rate the CFO
Seemed to Theorize Gross Margins to be Driven by 5 Different Factors and Evaded the Question Wholly
12
3
4
5
The Facts Gross Margins in
Persistent Decline
LKQrsquos margins have been in persistent decline since 2005 while consolidated inventory turns have been relatively stable
We believe there is more deterioration in LKQrsquos gross margin than observable on the Income Statement
Sources LKQ financials CapitalIQ 73
Gross Margins in Persistent Decline Flat Inventory Turns
Gro
ss M
argi
n
Inven
tory
Turn
over
74
Three Accounting Levers Would Enable
Gross Margin Inflation
If LKQrsquos consolidated gross margin is being inflated how would it be able to maintain a stable consolidated inventory turnover For reference from FY 2005 to the LTM period ended 9302013 consolidated inventory turns have been relatively stable
measuring 28x Over the same time period consolidated gross margin contracted disproportionately from 471 to 41
1 Aggressive Inventory Policy Enables Overstatement of Inventory ndash LKQrsquos Salvage amp Remanufactured products inventory accounting policy allows for complete discretion to leave costs on the balance sheet in the form of overstated inventory The recent surge in salvage inventory coupled with gross margin deterioration is consistent with this trend In isolation this policy results in inflated gross margins and CFO and exerts downward pressure on the rate of inventory turnover The generally high level of Salvage amp Remanufactured inventory ndash to which the aggressive policy applies ndash is a high level sign the company may be manipulating its margins
2 Acquisition Accounting Enables Understatement of Acquired Inventories ndash The acquisition fair market value process enables LKQ to understate the values of acquired company inventories and to allocate the plug figure to goodwill The result is that inventory costs which should be future period expenses are instead permanently deferred In isolation this would result in inflated gross margins and CFO and exert upward pressure on the rate of inventory turnover thereby counterbalancing the downward pressure caused by increases in Salvage and Remanufactured inventory and stabilizing consolidated inventory turnover
3 Mis-categorization of One-Time Gains to Directly Inflate Gross Margins ndash Management has shown the willingness to use its discretion to very blatantly inflate gross margins
Furthermore we observe that LKQ has never disclosed or broken out in its financials amounts for inventory writedowns We find this odd for a company that holds inventory such as auto parts that have a finite useful life
We believe LKQrsquos gross margins will continue to decline through 2014 against the backdrop of intensifying competitive pricing pressures and as past accounting overstatements have to be reversed we believe LKQ is at elevated risk of a crippling goodwill write-down
LKQ Appears to be Pulling 3 Accounting Levers in Unison
1) Inflated Profitability Focus on Inventory
ndash Interview w Recycled Parts Distributor
(1) ldquoRecycled Parts Distributorrdquo is an owner of large independent auto parts recyclers75
Prescience Point (ldquoPPrdquo) LKQ reports a 10-11 profit margin Is that the standard for a recycled parts distributor in general
Recycled Parts Distributor (ldquoRPDrdquo) 1 I cant hit those numbers Im not even sure theyre making any money on the recycled business Im in the business its hard to make a profithellip It is very competitive
Prescience Point (ldquoPPrdquo) Do you have some skepticism as to whether LKQ is as profitable as it indicates
RPD Well the first thing I would look at is their (recycled parts) inventories Because theyre easy to manipulate There is no way to take an accurate inventory on recycled parts There is no way to get the right value You can do some estimating How they value their inventory is crucial as inventory gets older its almost worthless
LKQ uses an aggressive policy for accounting for its Salvage and Remanufactured Inventory (refer to next slide) that allows for a high level of discretion to leave costs on the balance sheet in the form of overstated inventory LKQ is likely inflating its gross margin and earnings by failing to record a necessary expense for excess and obsolete inventory Omissions of expensing obsolete inventories result in future margin compression as past overstatements must be reversed earnings will be pressured at the time when the inventory is sold (at a deep discount) or disposed of In isolation a policy of overstating inventory exerts downward pressure on LKQrsquos rate of inventory turnover
LKQ calculates the carrying value of inventory through a formula that applies 1) the historical average of gross margin and 2) expected selling prices1 Using historical margins and future pricing estimates as inputs may paint an unrealistic picture of inventory value As a result the impact of any rapid margin change may be smoothed over time we believe LKQrsquos gross margin is deteriorating faster than presented in its Income Statement
The recent surge in salvage inventory coupled with gross margin deterioration is consistent with this smoothing trend and the overall concern of costs being left on the balance sheet
76
1) Aggressive Inventory Accounting Policy ndash
Enables Overstatement of Inventory amp GM
Prescience Point estimate assumes aftermarket and recycled product categories have equivalent margins Keystone and LKQ margins were ~inline prior to the Keystone acquisition Excludes our estimate for lsquoOtherrsquo inventory turns which was imputed assuming a 45 DSI
Salvage amp Remanufactured Inventory Turns and Consolidated Gross Margin Are Declining
Salvage amp Remanufactured Inventory Has Recently Surged While Gross Margins are Declining
(1) Note for there are no standard prices for many of LKQs products which would give management wide discretion for marking inventory values
Aftermarket and Refurbished Product Inventory Our aftermarket inventory cost is established based on the average price we pay for parts and includes expenses incurred for freight and overhead costs For items purchased from foreign companies import fees and duties and transportation insurance are also included Refurbished inventory cost is based on the average price we pay for cores and also includes expenses incurred for freight labor and other overhead
Salvage and Remanufactured Inventory Our salvage inventory cost is established based upon the price we pay for a vehicle including auction storage and towing fees as well as expenditures for buying and dismantling Inventory carrying value is determined using the average cost to sales percentage at each of our facilities and applying that percentage to the facilitys inventory at expected selling prices The average cost to sales percentage is derived from each facilitys historical vehicle profitability for salvage vehicles purchased at auction or from contracted rates for salvage vehicles acquired under certain direct procurement arrangements Remanufactured inventory cost is based upon the price paid for cores and also includes expenses incurred for freight direct manufacturing costs and overhead
The companyrsquos policy sounds like the Gross Margin or Gross Profit (GP) method used by many retailers for estimating inventories for interim financial statements The GP method is not an acceptable method for determining the year-end inventory balance since it only estimates what the ending inventory balance may be GAAP requires companies that use the GM method to conduct an annual physical inventory count to determine the actual value of inventory at year end as inventory values and physical quantities can decrease over time even if they are not sold Failing to identify and reflect such shrinkage would undermine the reliability and accuracy of a companyrsquos financial statements
Although LKQ does not call its policy the GP method its description indicates the two policies are close to if not identical LKQ may be violating GAAP at every year-end as GAAP mandates taking an annual physical inventory count If we are correct that LKQ could have gotten away with calculating inventory based on these estimates is surprising Like any retailer LKQ is not immune to shrinkage (refer to Thieves Steal Dozens of Car Parts from Local Shop) which undermines the credibility of financial statements in which inventory is based on estimates
Source httpwnepcom20130604thieves-steal-dozens-of-car-parts-from-local-shop 77
1) Aggressive Inventory Accounting Policy ndash
Enables Overstatement of Inventory Balance
LKQrsquos Salvage and Remanufactured Inventory Accounting Policy
78
2) Acquisition Accounting ndash Enables
Understatement of Acquired Inventories
Because LKQ is a serial acquirer that does not disclose specifics of the vast majority of its acquisitions such as deal terms or consistencies of target company balance sheets analyzing its accounting irregularities with precision and across periods is difficult But the surge in Salvage amp Remanufactured inventory the account subject to the aggressive inventory accounting policy serves as a higher level sign that margins and CFO may be manipulated
LKQrsquos acquisition policy gives it a lot of discretion when it comes to accounting manipulations We believe LKQ may be using acquisition accounting to understate values of acquired inventories further inflating its gross margin In isolation this policy would exert upward pressure on LKQrsquos rate of inventory turnover
At the time of any acquisition the acquirer is required by GAAP to present the fair value ndash or present a current value ndash of all the assets and liabilities on the balance sheet When LKQ acquires a company it is required to mark at fair value the inventory acquired undervaluing the inventory would enable the company to counterbalance the rises in Salvage and Remanufactured inventory (previously discussed) keeping consolidated inventory turns flat and inflate gross margins and CFO
As Tyco demonstrated when its frauds were exposed there is plenty of room for manipulation in the fair value process (Refer to paragraph 4 in the SEC settlement announcement)
The strategy would entail marking the value of tangible assets ndash that would otherwise result in future expenses down (eg inventory and PPampE) ndash as low as possible in the name of conservatism and to allocate the balance to goodwill In effect the policy moves future period expenses to the balance sheet as goodwill where they are permanently deferred
To demonstrate at the extreme if the Company books the entire value of acquired inventory as goodwill (implying that it has marked acquired inventory down to a $0 value) then sells that inventory the revenue will flow right down to its bottom line Because there is no cost associated with that inventory the Companyrsquos gross margin on the sale is inflated in this case equating to 100
How would LKQ be able to keep consolidated inventory turns from declining in the face of GM manipulation
Tyco
2) Acquisition Accounting ndash
Interview with Salvage Auto Consultant
We believe it is exactly this lsquocookie jar accountingrsquo the consultant refers to that LKQ is using to inflate GM and CFO and to manage stability in its inventory turns which inherently lends to the appearance of a high quality earnings stream
(1) Salvage Yard Recycled Auto Consultant ndash consults for salvage yards consults for some through the process of being acquired by LKQ79
Prescience Point (ldquoPPrdquo) When people sell to LKQ what prices is LKQ paying What metrics are they using and what are they buying a yard at
Salvage Auto Consultant (ldquoSACrdquo) 1 I do some consulting for people that are selling to LKQhellip If the business meets their (LKQrsquos) criteria it would be rare for them to pay more than 06x sales These days thats the most I have seen them pay 60 of annual sales so they are probably paying less than that and only that amount if profitability is above 10 net capex has been maintained and it fits their customer mix ndash they will not buy a yard unless it sells late model collisionhellip
PP So if a yard sells at 06x sales what is the typical value of inventory being bought
SAC Lets back up and triangulate this Lets take a yard that does $5m and that sells to LKQ for 60 of sales or $3mhellip Understand that this revenue multiple does not include real estate it applies only to the business Letrsquos assume that 80 of the yardrsquos sales are used parts which is typical for the industry so it has $5m in annual sales 80 from used parts implying that $4m of their sales come from used part sales which is $350k per month The inventory values that are sustainable on the balance sheet for an IRS audit are between 2-3 months saleshellip At 3 months sales which I think is more sustainable (than 2 monthsrsquo sales) but probably more than that is needed actuallyhellip but I donrsquot think the IRS would give a yard trouble with 3 monthsrsquo sales in inventory ndash theyrsquod kinda look at it and go on because it implies 4 turns to COGS So 3 x $350k = $10m of inventory That would imply that of the $3m purchase price LKQ paid the inventory purchase component of that is at least $1m
PP OK so they buy a yard for $3m and that yard would typically have $1m in inventory
SAC Id say $1m to $15m is what theyre bringing it in at I think theyre being thoughtful about that number by the way I donrsquot think theyrsquore just applying some percentage method to it I think theyre looking at the reports the turns the gross margins and making some assumptions on how valuable that inventory truly is and how much obsolescence there truly is And theyre bringing it in at a value to avoid taking writedowns later And it may mean they may do some cookie jar accounting on the front end and amortize or replace some of it with goodwill because theyrsquod bake off over a long time
2) Acquisition Accounting ndash Enables
Understatement of Acquired Inventories
According to the lsquoSalvage Auto Consultantrsquo interview on the previous slide LKQ buys recycled auto distributors at a maximum of 60 of annual sales a valuation that applies solely to the operation and excludes the value of real estate Based on his experience LKQ targets companies generating 10 profit margins If we assume the purchase price ranges from 40-60 of sales this would imply
LKQ is paying 4xndash6x net earnings for recycled auto parts distributors
Acquired inventory values make up 33 ndash 67 of the purchase price
From 2003 to 2012 (excluding the impacts of the distressed purchase of Greenleaf) LKQ spent $23 billion on acquisitions If we assume for conservatism that the purchase price allocations to PPampE were all related to real estate buys and back the cumulative PPampE allocation out from the cumulative purchase price we are left with $21 billion spent to acquire the businesses Over the same period $482m of the cumulative purchase price was allocated to inventory or only 227 of the cumulative purchase price ex PPampE
We believe LKQrsquos purchase price allocations are consistent with a policy of having used acquisition accounting to systematically understate acquisition inventory values thereby inflating its financials and successfully stabilizing its inventory turnover
80
2) Acquisition Accounting ndash LKQ at
Elevated Risk of Goodwill Writedown
We believe LKQ is at an elevated risk of a significant goodwill write down
From 2003 to 2012 (excluding the impacts of the distressed purchase of Greenleaf) LKQ allocated ~70 of its aggregate acquisition costs to balance sheet goodwill To date it has amassed an $192 billion of goodwill (and a further $154m to intangibles) relative to a book equity totaling $225 billion goodwill makes up 85 of LKQrsquos book value
By way of comparison Keystone ndash prior to LKQrsquos buyout of the company ndash from April 1 1998 to March 30 2006 allocated only 449 of its aggregate acquisition costs to goodwill in FY 2007 Keystonersquos goodwill amounted to 152 of book value
A goodwill write down for LKQ is not without precedent Jan 1 2002 LKQ wrote off ~57 of its balance sheet goodwill Prior to the write down goodwill had amounted to 72 of book value
That LKQ took a valuation impairment during the post-tech recession in 2002 citing contracting multiples but did nothing of the such during or after the 2008-2009 financial crisis which was the deepest recession the US has endured since the Great Depression does not pass logic In 2009 LKQrsquos closest comparable Greenleaf the 2nd largest wholesale auto parts recycling business in the US was in distress and sold it itself to LKQ for lsquoless than the fair market value of its assetsrsquo enterprise valuations were down across the board as liquidity evaporated
Today the stakes are much higher for LKQ than they were in 2002 The current size of its goodwill account is multiples of its 2002 enterprise value Because we believe that LKQ may be using this account to manipulate margins and CFO we also believe the account appears inflated and impaired as it stands
Sources 10-krsquos for Keystone Automotive Form S-1 for LKQ filed July 28 200381
Previous LKQ Write-Off of ~57 of Goodwill Balance
Valuations for some of the Companys acquisitions have declinedsignificantly since the Company completed its acquisitions during 1998and 1999 due to a number of factors including lower earningsmultiples applied in the valuations of comparable companies As aresult the Company determined that the carrying value of certainreporting units exceeded the fair value of those reporting units atJanuary 1 2002 and recorded an impairment of goodwill in theamount of $49898800 net of tax of $16120700
LKQ Explanation Lower Valuations of Comps
82
3) One-Time Gains to Inflate Gross Margins
We believe LKQ was manipulative in how it booked gains in 2012 from legal settlements awarded in a class action suit against several aftermarket suppliers The awards were booked as two legal settlement gains of $83m and $84m in Q112 and Q212 respectively
The gain classification artificially inflated gross margins The gains were booked as reductions of COGS significantly propping up and blunting a multi-year decline in gross margins In 2012 these gains elevated gross margins from 4095 to 4138 which helped to mask the significant drop from 4257 in 2011
The settlement gains had nothing to do with ongoing COGS While the original source of the lawsuit may have originated from issues related to LKQrsquos inventory account receiving a one-time settlement gain is irrelevant to current period operations and should be treated as one-time non-operating gains in nature In our judgment LKQrsquos classification is exceedingly aggressive
In light of our belief that games are likely being played in LKQrsquos accounting for inventories the nature of managementrsquos choice in this case underscores the potential severity of other manipulations exposed or not
Management also inflated its earnings prospects by including the legal settlement gains in its EPS guidance The Company chose to factor these one-time legal settlement benefits into guidance even while explicitly excluding other one-time gainslosses from guidance
In Q1rsquo12 management raised 2012 EPS guidance due to inclusion of the first legal settlement gain in its revision The entire value of the positive differential over prior guidance was attributable to the one time legal gain
Based on its Q1 10-Q (excerpted below) management knew that an additional settlement gain of near-equivalent value would be recognized sometime in 2012 Even though it also expected to recognize this second gain management chose not to also include it in the 2012 guidance revision that included the first gainhellip
Instead in Q22012 management booked the remaining previously expected settlement gain in the amount of $84m equating to+$04 EPS When they reported Q2rsquo2012 results (issued 7262012) management AGAIN raised its 2012 guidance to $265ndash$282m and $177 ndash $188 And again the positive differential from the prior guidance resulted from including the 2nd previously anticipated gain offset by a fall in scrap prices in the revised numbers In other words guidance would likely have been lowered had LKQ included the 2nd gain in the original guidance revision This seems to indicate they kept it in their back pocket to ensure the next revision to guidance would be a raise
83
Contrsquod
3) One-Time Gains to Inflate Gross Margins
ldquoWe are a plaintiff in a class action lawsuit against several aftermarket product suppliers Our recovery is expected to be approximately $16 million in the aggregate In January 2012 we reached a settlement agreement with certain of the defendants under which we recognized a gain of $83 million which was recorded in Cost of Goods Sold during the three month period ended March 31 2012hellip
We expect to recognize an additional $8 million gain related to settlements with certain other defendants in this lawsuit in the last nine months of 2012rdquo
ndash LKQ Q1rsquo2012 10-Q
84
On the Q2rsquo2012 earnings conference call CFO John Quinn was asked by an alert analyst whether hersquod expected the 2nd settlement gain when guidance had been issued in Q1 he completely dodged the question
But per the previous slide itrsquos written in black and white in the Q1rsquo2012 10-Q Of course he expected it
Craig R Kennison (Robert W Baird amp Co Incorporated Research Division)
ldquoJust to finalize on the guidance In the second quarter you had a $004 legal benefit which is being included in your guidance Did you expect that when you initially gave guidance after last quarterrdquo
John S Quinn
ldquoIt was not included in the guidance last quarterrdquo
ndash LKQ Q2rsquo2012 Earnings Conference call QampA 7282012
Contrsquod
3) One-Time Gains to Inflate Gross Margins
85
Another Red Flag ShippingHandling
Revenue is Diverging from Other Metrics
Source Company filings
LKQ collects revenues related to shipping and handling (SampH) and regularly reports these figures in its 10-K
If LKQ were a healthy growing firm we would expect to see SampH revenue at least stay constant over time with reported revenues COGS and average inventory
However we observe declining trends in LKQrsquos SampH revenue among all relevant financial metrics In particular we observe that SampH revenue to average inventory has declined at the fastest rate in the past six years We interpret this as strong indicator of potential inventory shenanigans
Shipping and Handling Revenue vs Other Financial Metrics
000
050
100
150
200
250
000
100
200
300
400
500
600
700
800
900
2006 2007 2008 2009 2010 2011 2012
of Avg Inventory (LHS) of COGS (RHS) of Total Revenue (RHS)
SampHInventory Has Largest Drop
86
WM and DZ ndash Previous Employers of Many
LKQ Execs amp Accounting Personnel
Flynn Enterprises Common Shareholder
John QuinnVarious Positions
John QuinnSVP and CFO
Mark SpearsController Head Acct
Mark SpearsFormer SVP CFO
Frank ErlainFmr VP Finance
Controller Accountant
Victor CasiniGen Counsel amp
Secretary
Walter HanleyAsso Gen Counsel
Walter HanleySVP Development
Victor CasiniGen Counsel amp
Secretary
Ken FreseAcctrsquog Mgr
Ken FreseAccountant
Ken FreseDir Accounting amp
Inventory
Joe HolstenCOO CEO WM Intrsquol
Joe HolstenFmr CEO Chairman
Frank ErlainVP amp
Controller
Sinon GalvinSVP Revenue Optimization
Sinon GalvinVarious Positions
WM Intrsquol
Fraud Allegations Improper Capitalization of Expense Files for Bankruptcy March 1996
Charged w $17 billion Accounting Fraud March 2002
Stephen EckelDir Oracle Fin Apps
Fmr AcctrsquogAss Contrsquoller
Stephen EckelAssistant Corporate
Controller
Source SEC filings LinkedInreg
Kevin FlynnFormer Director
Kevin FlynnVP Midwest
Vaughn HooksChief Tax Officer
Vaughn HooksVP Taxes
Dan ShoenerVP
Dan ShoenerVP of Finance
LKQ
87
LKQrsquos Director of Inventory Accounting
$17bn Accounting
Fraud
Fraud Allegations
Filed for Ch 11 Bankruptcy
httpwwwlinkedincomprofileviewid=30515327amplocale=en_USamptrk=tyah2amptrkInfo=tas3Aken20freseSource
In light of our belief that LKQ may be inflating its financials and most likely via inventory accounting shenanigans it is worth noting that LKQrsquos Director of Accounting and Inventory is connected with two companies previously alleged to have engaged in accounting manipulations to inflate their stock prices
The Waste Management
Playbook for Paper lsquoProfitabilityrsquo
Used Over and Over Again
89
Waste Management ndash Aggressive Roll-up
Strategy Replicated by LKQ amp Many Others
In 1968 Dean Buntrock Wayne Huizenga (both LKQ founding backers) and Lawrence Beck founded Waste Management (WM) In 1972 Donald Flynn (LKQrsquos founder) joined WM as CFO WM set out to consolidate the highly fragmented garbage hauling industry via an aggressive roll-up strategy Its growth would benefit from the tailwinds of recently issued EPA regulations that posed challenges for mom and pop operators
By the time WM went public in 1971 it had acquired 133 garbage haulers and was generating gt$10m in revenue In the first 9 months of 1972 it had acquired another 133 firms and by the end of the year had generated $72m in revenue From 1971 to 1980 WMrsquos revenue grew at a rate of 48 per year and in 1980 it generated $656m in revenue By 1986 WM had become the largest waste disposal firm in the world
Donald Flynn was given credit as the ldquofinancial geniusrdquo behind Waste Managementrsquos extraordinary growth from the 1970s to the early 1990s in a 1993 corporate history commissioned by the company
In 1976 the SEC alleged that WM founder Huizenga was involved in disguising unlawful political contributions that Waste Managementwas skimming dump fees and using the proceeds to create an illegal slush fund to be used for political contributions Huizenga signed a consent decree barring him and WM from using corporate money for unlawful political contributions and from filing materially false and misleading financial statements There was no admission of wrongdoing
In 1984 WM co-founder Huizenga and John Melk President of WM International sold their stakes in the company and would go on to invest in Blockbuster Entertainment Buntrock remained as CEO until 1996 and Flynn as CFO amp director until 1989 amp 1997 respectively
By the late 1980rsquos and early 1990rsquos WM had undertaken a botched international expansion in a push to become the worldrsquos first global lsquoenvironmental servicesrsquo company ldquoThat ambition led Waste Management to acquire a range of profit-draining businesses The eventual result was angry shareholders turmoil in the board room and a disruptive series of management purges and sudden resignations followed by revelations (in late 1997) of accounting irregularitiesrdquo
In 1998 the troubled company merged with USA Waste Services Inc
In 1997 a WM board-led probe turned up a massive financial fraud that went undetected from 1992ndash1997 involving the inflation of asset values and pre-tax earnings resulting in a $35B charge in 1998 and the largest financial restatement in history at that time The SEC charged WM with perpetrating a massive financial fraud
90
SEC vs Waste Management
In mid-July 1997 a new CEO ordered a review of WMrsquos accounting practices That review ultimately led to the restatement of the Companys financial statements for 1992 through the third quarter of 1997 When the Company filed its restated financial statements in February 1998 it acknowledged that it had misstated its pre-tax earnings by approximately $17 billion and took a $35 billion charge At the time the restatement was the largest in corporate history
From 1994 until 1997 a period at the heart of the perpetuation of the fraud Donald Flynn (LKQrsquos founder) was a Waste Management Audit Committee member and also served as Audit Committee Chairman during a period coinciding with the fraud
According to the SEC former WM CEO Dean Buntrock who would later be LKQrsquos founding backer amp director was ldquothe driving force behind the fraudrdquo and that ldquoHe was the primary beneficiary of the fraud and reaped more than $169 million in ill-gotten gains from among other things performance-based bonuses retirement benefits charitable giving and selling company stock while the fraud was ongoingrdquo
httpwwwsecgovnewsheadlineswastemgmt6htmWaste Management Founder Five Others Sued for Massive Fraud
91
SEC vs Waste Management ndash RE Multi-Year
ldquoMassive Earnings Management Fraudrdquo
Defendants Inflated Profits by $17 Billion To Meet Earnings Targets Defendants Reap Millions in Ill-Gotten Gains While Defrauded Investors Lose More Than $6 Billion
ldquoThe Securities and Exchange Commission filed suit today against the founder and five other former topofficers of Waste Management Inc charging them with perpetrating a massive financial fraud lasting more than five yearsrdquohellipldquoThe complaint alleges that defendants fraudulently manipulated the companys financial results to meet predetermined earnings targets The companys revenues were not growing fast enough to meet these targets so defendants instead resorted to improperly eliminating and deferring current period expenses to inflate earnings They employed a multitude of improper accounting practices to achieve this objectiverdquo
ndash SEC Press Release 3262002
bull On August 29 2005 the SEC announced its fraud action against the accused Waste Management officers would be settled for a total of $308m
bull Buntrock and the others accused neither admitted nor denied wrongdoing
WM Alumni Borrowing from the Old WM
Playbook Over and Over Again
Waste Managementrsquos aggressive rollup strategy gave its management a high level of flexibility to inflate revenue growth and margins and to conceal doing so
A closely-knit group of WM alumni and associates (including LKQrsquos founders) have repeatedly co-invested in and built several companies with each company replicating WMrsquos aggressive roll-up or an acquire-and-build strategy in either case either consolidating or flooding an industry with store openings in an effort to claim the dominant position as fast as possible Some of these companies include Blockbuster Video Discovery Zone Boston Chicken AutoNation Swisher Hygiene and LKQ Many of these companies have either failed to deliver on their sales pitches to investors failed outright or were tarred by allegations of fraud manipulative accounting andor unjust management enrichment
Based on our analysis in the majority of cases these WM alums and associates build businesses with the intent to create the illusion of growth as opposed to focusing on creating value through operational excellence This has prompted some critics to claim that they build companies that have little lasting value
Many involved seem to have learned to begin cashing out just before and soon after building a roll-up large enough to sell to the public at inflated valuations and have gotten very rich in the process
Billionaire Wayne Huizenga (LKQ founding backer and WM co-founder) has been involved in all of the above mentioned companies either as a backer or as an executive or both As he is quoted as saying (regarding some of the roll-ups that went on to fail after he cashed out)
We left these companies in great shape and to be blamed for their problems years after I left is ridiculous
92
Same Players Same Strategy Results
Marred by Accounting Irregularities amp Failures
93
John MelkInvestor
Charged with accounting fraud one
of the largest in history
Aggressive rollup strategy
Discovery ZoneBlockbuster Boston Chicken AutoNation Swisher Hygiene
Dean BuntrockCo-founder CEO
Dean BuntrockInvestor Franchisee
Dean Buntrock Founding Backer Director
Dean BuntrockInvestor Director
Donald FlynnCFO Director -Audit Committee
Donald FlynnInvestor
Donald FlynnFounding Backer Director
Donald Flynn Founder
Donald FlynnCEOChairman
John MelkPresident WM International
John MelkFounding Backer Director
John MelkFounding backer Director
John MelkInvestor Director
Lawrence BeckCo-founder
Lawrence BeckInvestor Franchisee
Lawrence BeckInvestor Franchisee
Peer PedersenDirector
Peer PedersenInvestor Franchisee
Peer PedersenDirector
Peer PedersenInvestor
Scott BeckInvestor COO Vice Chairman
Scott BeckInvestor
Scott BeckCEOChair
Steven BerrardCFO then CEO
Steven BerrardCo-founder Co-CEO
Steven BerrardCEO Director
Victor CassiniGen CounselSecretary
Victor CassiniGen Counsel Secretary
Wayne HuizengaCo-founder
Wayne HuizengaCEOChairman
Wayne HuizengaInvestor (via Blockbuster)
Director
Wayne HuizengaInvestor
Wayne HuizengaFounder Co-CEO
Wayne HuizengaChairman
Wayne HuizengaFounding backer (via
AutoNation)
Bought out by Viacom for $84B
Aggressive acquire-amp-build
strategy
Goes bankrupt Allegations of fraud
Aggressive acquire-amp-build
strategy
Goes bankrupt Accounting gimmicks to obscure financials
Aggressive acquire-amp-build
strategy
$$ Billions Lost Pooling of Interests
acquisition accounting
Aggressive rollup amp acquire-amp-build strategy
Accounting irregularities
Financials restatementAcquisition Accntng Issues
Ongoing SEC inquiry
Aggressive rollup strategy
An array of accounting
red flags amp misrepresentations
Aggressive rollup amp acquire-amp-build strategy
Dean BuntrockFranchisee
Steven BerrardCEO post-Viacom
LKQ
Blockbuster Entertainment
Blockbuster Entertainment proved to be Huizenga and his associatesrsquo most lucrative endeavor and its success would become a core aspect of their pitch to sell investors on subsequent endeavors employing the same strategy (with little success) We believeBlockbuster worked primarily because it operated in a relatively nascent quickly growing space ndash it had the wind at its back allowing for a comfortable margin for error Additionally by executing an extremely aggressive acquire-and-build strategy the companyrsquos key financial metrics were inherently blessed Lastly it was bought out by Viacom prior to falling apart as the result of fundamental forces The associatesrsquo subsequent endeavors however evidence that absent high luck rapid expansion strategies that depend on external capital are customarily near-impossible to manage and that managers are seduced by flexibility in accounting policies
In 1987 Donald Flynn Wayne Huizenga and John Melk (former President WM International) bought a controlling interest in Blockbuster Entertainment Company Blockbuster set out to consolidate the highly fragmented video rental field which was already growing in the double-digit range when Blockbuster came into the picture ndash via the implementation of a rabid buy-and-build strategy
Huizenga who assumed the role of CEO and Chairman built the company in accordance with his modus operandi ndash at a furious pace and with a buy-and-build strategy purchasing smaller chains and constructing new outlets When Huizenga and his associates invested in 1987 Blockbuster owned 15 stores and franchised 20 others From that point on Huizenga opened a Blockbuster store every 17 hours on average for seven years by the time of its 1994 takeout by Viacom Blockbuster had expanded the store count to 3700
Worries that the video rental industry was reaching a saturation point cast doubts on Blockbusters ability to keep opening stores indefinitely One response to this concern was to look to markets outside the United States for growth
In April 1993 Blockbuster supported Donald Flynn by injecting equity capital into his new venture Discovery Zone (DZ) buying a 20 stake (with the option to buy 499) Huizenga and other Blockbuster executives joined the DZ board
In September 1994 Viacom Inc acquired Blockbuster for $84 billion
94
Discovery Zone - Reckless Buy-and-Build
Fraud Allegations Bankruptcy
In July 1992 Donald Flynn (LKQrsquos founder) bought a controlling interest in and assumed the role of CEOChairman of the Discovery Zone an ownerfranchiser of indoor kidsrsquo playgrounds using proceeds from his success with Blockbuster DZ set out to build a leading market position in its space via a reckless acquire-amp-build strategy Unfortunately in its rush to accelerate revenue growth it incurred substantial debts and lost control of its costs landing it in bankruptcy Viacom later sued Flynn in 1997 claiming he was responsible for inflating DZrsquos earnings and misrepresented its financials to secure the sale of his stock to Viacom in 1995 shortly before DZ declared bankruptcy The suit was settled for an undisclosed cash sum
In April 1993 Blockbuster Entertainment injected equity capital into DZ to finance Flynnrsquos expansion plans buying a 20 stake (with the option to buy 499) In June 1993 DZ IPOed
DZ used public capital to expand rapidly Between 1991 and 1995 DZ expanded from 28 locations to 336 locations In September 1994 DZ bought 60 franchised DZ units operated by Blockbuster Blockbuster simultaneously increased its equity ownership in DZ to 499 by exercising its option to purchase additional equity directly from the Flynn family (through DKB Investments LP) on September 29 1994 Viacom acquired Blockbuster
November 1994-March 1995 ndash 3 lawsuits which were later consolidated were filed against DZ as it reported substantial operating losses in Q3rsquo04 and subsequent periods The claims allege DZ and certain directors amp officers including Flynn engaged in fraud intended to inflate DZrsquos stock price such as improperly capitalized preopening expenses failing to timely make public the change in the method of accounting for preopening expenses etc The consolidated complaint was dismissed as a result of DZrsquos Ch11 filing
On February 1 1996 DZ warned shareholders that it may seek bankruptcy protection after January sales fell below expectations the stock collapsed by gt60 on Feb 27 1996 Flynn resigned as DZrsquos Chairman On March 25 1996 DZ filed for Ch11 protection
In 1997 Viacom sued Donald Flynn and his sons claiming they inflated earnings through improper accounting adjustments and misrepresented the companyrsquos financial statements to secure a $25m sale of their personal stock to Viacom and to meet Wall Street Expectations for profitability According to Kevin Forde Donald Flynns attorney following settlement of the matter in 2004 There was a payment of a certain sum for dismissal of all claims and our clients were very satisfied with the settlement
95
This is a question of a company that grew too quickly without the infrastructure to do orderly and profitable growth
ndash Robert Mead Discovery Zone spokesman commenting just after the company files for Ch 11 (March 26 1996)
Boston Chicken ndash Reckless Buy-and-Build
Accounting Gimmickry Bankruptcy
In 1992 Scott Beck and a partner bought a controlling interest in Boston Chicken (BC) a rotisserie-style chicken restaurant with the $120m he made from selling his stake in Blockbuster Video franchise stores back to Blockbuster Entertainment The foundation of BCrsquos business strategy was based on reckless acquire-amp-build strategy This reckless expansion program however would prove to be the root cause of BCrsquos financial demise pushing the company into bankruptcy BC would likely have ended up in bankruptcy much sooner given its cash-degenerative store unit economics had gimmicky accounting not concealed signs of its deteriorating business
6 months after taking over Boston Chicken Beck was overseeing a chain of 53 restaurants in ten states By the end of 1992 Boston Chicken had 83 stores In 1993 Boston Chicken went public accumulating external capital for even more growth In 1993 BC wentpublic the chain nearly tripled in size to 217 stores By the end of 1994 it had 534 stores Management announced its intent to grow the chain at a rate of more than 325 stores annually at least through the end of the decade
Problems surfaced during the summer of 1997 Poor employee training high operating expenses and its lending policy to developer-franchisees had started to take their toll on company finances In 1998 Beck resigned Stores sales continued to falter and by July losses had reached $4371 million
On October 5 1998 BC filed for bankruptcyhellip A noted short-seller commented ldquoThe Chicken has been plucked due to deteriorating store-level economics management turmoil and an outsized amount of debt due to an aggressive expansion plan that had once impressed Wall Street but perhaps never made financial sense
(1) Howard Schilit Financial Shenanigans How to Detect Accounting Gimmicks amp Frauds in Financial Reports (New York Mcgraw-Hill2010) 103-10496
They have the most aggressive expansion program ever undertaken in the restaurant industryldquo
ndash Restaurant Analyst Mike Mueller in Restaurant Business (4101994)
Deceptive Accounting at Boston Chicken Discussed in Financial Shenanigans By Howard Schilit (Excerpts Below)1
Swisher Hygiene ndash Reckless Roll-Up
Financials Restatement SEC Inquiry
In 2004 Wayne Huizenga and Steven Berrard bought and took private public company Swisher International an industrial cleaning business In August 2010 they took Swisher public through a reverse merger renaming the successor entity Swisher Hygiene Swisher was set on consolidating its industry via an aggressive and reckless roll-up strategy Eventually the company announced that previously-issued financials could not be relied upon and that its profitability had been overstated Swisherrsquos Audit Committee is currently probing the companyrsquos acquisition accounting policies as the company contends with ongoing SEC and US Attorney inquiries
Based on an August 2010 Bloomberg News article Huizenga planned ldquoto build Swisher much the same way as he grew Waste Management Blockbuster and AutoNationrdquo and according to Huizenga
Swisher began raising capital and in approximately one year had bought 55 companies an average of more than one per week The Wall Street Journal named Swisher the ldquomost acquisitiverdquo business in North America in 2011 after its buying spree
By March 2012 Swishers Audit Committee announced its 2011 interim financials could not be relied upon and that it would delay the filing of its annual report due to an ongoing internal investigation primarily relating to possible adjustments to (1) the accounting for business acquisitions and (2) the calculation of the allowance of doubtful accounts receivable It concluded that previously issued interim financial statements could not be relied upon and that earnings were inflated for the affected periods According to its most recent 10-Q the SEC and the US Attorneys Office have requested more information from the company and the company faces federal shareholder lawsuits that allege the company artificially inflated its stock price (which collapsed as a result of the announcement)
Further disclosure in a corresponding 8-k shows that Swisher is focusing on its accounting for acquisitions which we believe LKQ may be using to manipulate its accounting as a source of its accounting irregularities
Huizenga resigned from Swishers board in May 2013 Berrard resigned as CEO in August 2012
97
This is another opportunity to build a company that will growhellip Now wersquoll have public capital to do acquisitions helliphelliphelliphelliphellip
You go to a guy and you say lsquoDo you want to sellrsquo If they think they can be a part of something thatrsquos going to grow -- you give them some cash and some stock -- theyrsquoll say rsquoyeshellip They want the stock because theyrsquoll think lsquoOh boy you guys are going to grow this business and Irsquom going to watch my stock growrsquo
During the course of its independent review and due in part to the significant number of acquisitions made by the Company the Audit Committee determined it would be in the best interest of the Company and its stockholders to review the accounting entries relating to each of the 63 acquisitions made by the Company during the year ended December 31 2011
AutoNation ndash Reckless Buy-and-Build
Billions Lost Most Comparable to LKQ
The case study of AutonNation Inc and its predecessor entity Republic Industries (collectively AN) we believe bears many parallels to how LKQs will develop AN tried to consolidate a highly competitive low margin maturelow growth industry but lacked a fundamentally superior way of making money Using public capital it over- expanded and -extended itself losing focus and eventually resulting in billions of dollars of shareholder losses
AN was led by Wayne Huizenga and Steve Berrard as co-CEOrsquos from 1996 ndash 1999 Using an aggressive acquire-amp-build strategy fueled by company shares they set out to consolidate the automotive business by building a one-stop-shop involved in every stage of selling renting and servicing new and used cars They built an empire of new car dealerships car rental agencies and used car megastores selling investors the vision that each one would feed the other to enable the company to generate profits on a vehicle throughout its lifetime
In 1996 amp 1997 it acquired hundreds of businesses mostly relying on the controversial pooling of interests acquisition accounting practice with its earnings likely inflated as a result In less than 2 years time AN was the largest auto retailer in the US with a market cap of gt$12B
They continuously reminded investors of the successes they achieved with Waste Management Inc (Huizenga sold out of WM in 1984) and Blockbuster Inc Per ANrsquos 1995 annual report We want to build a brand just like we did at Blockbuster Wall Street bought into the vision that Huizenga could replicate those successes in consolidating the autos market
The association would prove misleading the growth of WM and Blockbuster were supported by strong secular tailwinds WMs growth was supported by regulatory changes that made it almost impossible for mom and pops to compete Blockbusters growth benefited from a video-rental industry that was growing in the double digit range Like LKQrsquos ANrsquos end markets on the other hand were already mature growing at a very low single digit growth rates ndash ANrsquos success was dependent on stealing market share from existing competitors Similar to LKQ it also lacked the ability to drive down its most basic costs
With high fixed costs and inventory values that depreciated with each passing moment ANs used car business lost significant sums of money and led to investor disappointment its share price fell by gt80 from peak to trough representing a cumulative value of gt$10B
In 1999 Huizenga and Berrard stepped down New CEO Michael Jackson would dismantle the empire via asset sales and spin-offs in an effort to focus the enterprise and improve margins He spun off the rental car business and closed the money-losing used car business resulting in a pre-tax charge of gt$400m He announced AN would suspend further purchases of new-car dealerships and concentrate instead on reducing costs at existing dealerships and announced an increased its stock buyback program by $500m
(1) Paul F Kocourek Steven Y Chung and Matthew G McKenna ldquoStrategic Rollups Overhauling the Multi-Merger Machinerdquo Strategy amp Business second quarter 200098
ldquohellipit found it had no way to drive down the basic cost of the business mdash buying cars Unlike new-car dealers that accept many used vehicles as trade-ins often on favorable terms AutoNation had to compete at auctions with other dealers to build its inventory With relatively high fixed costs a huge inventory
that depreciated in value with every passing week and no sign of improvement AutoNation bailed out and exited the used-car business in late 1999 ldquo1
AutoNation ndash Reckless Buy-and-Build
the Build-Out of an Empire Destined to Fail In May 1995 Huizenga and a relative invested $31m in Republic Industries a public waste disposal company that would allow him to raise public
capital for his next venture Huizenga was appointed CEO and Chairman of the company
The next year Steven Berrard joined him as co-CEO and director Under their leadership the company announced plans to aggressively grow into a completely unrelated industry setting out to build a one-stop-shop for consumers automotive needs via consolidating the fragmented automotive retail and rental markets According to a New York Times article Huizenga said that Republic would cater to anybody who wants to rent lease or buy a car that is brand new or used
Republic expanded aggressively purchasing hundreds of franchised amp used car dealerships and car rental companies with the vision of assembling an empire that would reap economies of scale by involving itself in every stage of selling renting and servicing new and used cars It grew from only one franchised vehicle dealership at the end of 1996 to more than 270 franchised dealerships owned or under contract by the end of 1997 becoming Americarsquos largest automotive retailer in 1 years time
Amongst Republicrsquos major acquisitions was AutoNation USA (ldquoAN USArdquo) a developmental-stage private company owned by Huizenga and Berrard The two co-founded the company in September 1995 intending to grow it into a nationwide chain of used car megastores each of which would offer up to 1000 reconditioned late model low mileage vehicles When Republics intent to acquire AN was announced AN had not yet opened a single megastore and from inception to September 29 1996 AN USA had lost $214m on revenues of $92m with shareholders equity of $307m Republic paid 175m shares of stock for AN USA equating to $250m at its intent to acquire was announced on March 29 1996 but according to a class action complaint filed in January 1997 due to a rise in Republics share price prior to its close the deal was consummated for $643m
In 1996 and 1997 Republic also bought several vehicle rental companies including Alamo Rent-A-Car and National Car Rental System becoming one of the leading vehicle rental companies in the world
In 1998 Republic generated revenue of $16bn up from $56bn in 1996 But when the dust began to settle from a slowdown in its acquisition binge the economics of its business model did not pan out as promised Republic struggled as a car dealership with high overhead low profits and a strategy based on synergies that didnrsquot materialize The AutoNation USA business was a money-losing business operation
Furthermore Republic may have been relying on the acquisition accounting practice known as pooling of interests to inflate its earnings Republic applied this approach for more than half of its deals in 1996 amp 1997 without having used it its thin margins may have been in the red
Republic stock had risen from a split-adjusted $2 when Huizenga bought in to a peak of ~$44 in January 1997 by June 1997 shares had declined ~50 and would continue their descent each year until hitting a low of $5 in December 2000 Its market cap fell from a peak exceeding $12bn by gt80 representing ~$10bn in lost shareholder value
(1) Machan Dyan Crime Garbage and Billboards Forbes November 20 1995 vol 156 issue99
We were looking for a shell [company] and this happened to come up he says It could have been in anythinghellip1
When they think of transportation he said we want them to think about us
AutoNation ndash Reckless Buy-and-Build
New Profit-Focused CEO Dismantles Empire At Republics May 1998 shareholder meeting Huizenga expressed his disappointment about the companys stagnant share price according to an Sun
Sentinel article describing the event he told investors about how the matrix of car dealerships and rental car agencies was going to simultaneously grow sales to perhaps as much as $60 billion in three to five yearslsquo and that costs would be cut to boost profits
Notwithstanding the mounting pressures to remain focused in July 1998 AutoNation invested in Huizengas close associate Donald Flynns new endeavor LKQ Corp (It would cash out of this investment in 2003)
In 1999 under pressure from shareholders and a falling share price Republic began to unwind what it had built over the preceding 4 years streamlining its operations and undergoing management changes
In April 1999 Republic spun off its waste disposal segment and subsequently changed its name to Autonation Inc (ldquoANrdquo)
On September 24 1999 Huizenga and Berrard stepped down from their co-CEO positions Michael Jackson former CEO of Mercedes Benz USA was named new CEO
On September 30 6 days after Jackson was hired Autonation announced the spin-off of the car rental business to focus exclusively on the automotive retail business
On December 13 1999 3 months after taking the helm Jackson killed the concept of used-car megastores announcing the immediate closure of the money-losing chain and the expectation of a pre-tax loss of between $430 ndash $490m Of its 29 megastores 23 would be closed and 6 integrated with new vehicle franchises
According to a December 14 1999 New York Times article
AN also announced it would suspend further acquisitions of new car dealerships instead concentrating on reducing costs at existing dealerships and announced an increased its stock buyback program by $500m In the press release Jackson emphasized his focus on improving profitability and the sustainability of the AN business model
Jacksonrsquos initiatives tremendously benefited the companys efficiency tremendously A 2001 study for USA Today showed that AutoNation increased revenue per employee 82 percent from 1998 to 2002 a greater increase in efficiency than any other large public company in the country
100
ldquoMr Jacksonhellip said that the used car superstores (ie AN USA) were high-cost operations with no chance of ever generating profits proportionate to their risk Even if AutoNation had been willing to invest heavily devote a lot of management time and wait for years he said the cost structure in those stores
would still have been very high leading to marginal operations
Our focus now is on improving our operating margins and on creating a unique and branded customer experience in our new vehicle franchises which are now AutoNations sole business focus By closing the megastores and implementing SGampA reductions we have taken the necessary steps to ensure
the long-term success of AutoNation
LKQ Governance Concerns
102
Key Management Changes Start in
2009-2010 Just As Business is Improving
We believe LKQrsquos core business began slowing in the 2009-2010 which coincided with the APU rate stalling and a stagnation in insurance paid collision repairs Beginning in this period we also observe various changes to key management positions
LKQrsquos CFO Mark Spears also the former Principal Accountant at Waste Management mysteriously resigned in May 2009 despite a record year for the Company Spearsrsquo departure came ~1 year after the SEC issued a comment letter questioning numerous aspects of their business and further comment letters would follow
Subsequent changes have included a new CEO and the departure of the Head of IR and Chief Acctrsquog Officer
Date Executive Role Note
52109 Mark Spears CFO Resigns Press Release
12610 Rob Wagman Promotion from SVP Ops to Co-CEO
Press Release
12610 Joe Holsten Resign CEO joins the Board Press Release
Dec 2010 Sarah Lewensohn Director of Investor Relations
No longer listed as IR contact in PR
22811 Frank Erlain Long time VP Finance Chief Acctrsquog Officer Retires
8K filing
3512 Victor Casini SVP General Counsel resigns from the Board
8K filing
Comment Letters httpwwwsecgovArchivesedgardata1065696000000000008014694filename1pdfhttpwwwsecgovArchivesedgardata1065696000000000010023419filename1pdf
103
Delinkage of Incentives Insiders Dumping
Rewarded to Acquire at Any Cost
Insiders have been selling shares aggressively since the IPO when former owners of acquired companies affiliates and management owned 22 Since 2009 insider selling pressure has intensified and now insiders own less than 2
Managementrsquos annual bonuses are tied to revenue growth and long-term incentives are also tied to Revenue EPS and ROE with the following weightings revenue (475) earnings ($475) and ROE at just 5 These metrics incentive management to recklessly acquire revenue and boost EPS
Beneficial Ownership of Insiders vs Revenue and Free Cash Flow Growth
$ in bn
104
And Sell Stock Shortly After Trumpeting the
Merits and Growth Opportunities at Keystone
SEC Form 4 filings show that key members of the management team made timely open market sales shortly after announcing the acquisition of Keystone Automotive Operations Inc on December 5 2013
These sales directly call into question why management would announce one of the largest deals in company history that ldquosignificantly expands its addressable marketrdquo and then abruptly unload stock Our take is that therersquos an increasing disconnect between shareholdersrsquo best interest and managerial incentives
Executive Role Date Shares Wtd Avg Price Type
Wagman PresidentCEO 12102013 25000 $3371 Open Market
Quinn CFO 1292013 15000 $3362 Open Market
12102013 5000 $3431 Open Market
Holsten Chairman 12112013 6025 $3350 Open Market
of the Board 12132013 25975 $3355 Open Market
Greenspan SVP Operations 12132013 20000 $3388 Open Market
Source SEC Form 4 filings
105
Board Lacking Relevant Experience and
Necessary Focus for Adequate Oversight
LKQrsquos Board is comprised of accomplished business executives but only one non-executive member Mr Foster appears to have relevant experience in the auto parts business
Furthermore no other Board members appear to have experience in the scrap metal or related industrial sectors that would be of value to shareholders
Mr Meister and Mr OrsquoBrien both serve on the compensation committee and serve on a combined 24 other Boards which makes us question there focus and commitment to LKQ
Committee Service Current
Director Age Role Main Background Comp Audit Govern Govt Affairs Other Boards
A Clinton Allen 69 Lead Independent Lab Testing x x 3
Kevin Flynn (1) 45 Seed InvestorDiscovery Zone x Chair 1
Ronald Foster 71 Fmr Chairman of Keystone x x 1
Joe Holsten 60 Chairman Waste Management 1
Blyth McGarvie 56 Consumer Products Chair x 2
Paul Meister 60 HealthcareLife Sciences Chair x 8
John OBrien 69 Insurance x Chair 16
Guhan Subramanian 42 AcademicNo Board Exp x x 0
Robert Wagman 48 President and CEO Auto Products 0
William Webster 55 Payday Lending x x 2
(1) Recently deceased in August 2013 and yet to be replaced
Source Company and public information CapitalIQ
106
Governance Concerns Executive Pay
Also concerning is that the compensation committee constituents appear overcommitted The Chairman Mr Meister serves on 8 other boards while Mr OrsquoBrien is listed as serving on 16 other boards We suspect shareholders interests may not be adequately supervised on the matter of compensation with the big time commitments of its committee members
Management annual bonuses are tied to revenue growth and long-term incentives are also tied to Revenue EPS and ROE with the following weightings revenue (475) earnings ($475) and ROE at just 5 This mix of metrics incentivizes management to recklessly acquire revenue and do whatever possible to boost EPS
The CEOrsquos total comp has increased 374 in the past 4 years while free cash flow is up only 9 over a multi-year horizon cumulative free cash flow after acquisitions is nil Approximately 50 of the comp increase has come in stock but as a whole the management team has been net sellers The 6 member management team reaped $129m in compensation for 2012 (up 83 from 2009 comp of $71m)1
(1) Includes consulting comp and incentive comp related to Mr Holsten
9
82
92
100
101
233
374
0 50 100 150 200 250 300 350 400
Free Cash Flow
Total Exec Comp
Adj EBITDA
EPS
Revenue
Share Price
CEO Comp
Wheres the Beef
Cumulative Growth 2009 - 2012
The Misguided Analyst Community
108
LKQ Enlists Firm Associated with Stock
Pumps for Research Coverage Initiation
ldquoOccasionally we find a critic of RedChip who in a fury of madness mistakenly throws us into the ldquopump and dumprdquo category of investor relations firmsrdquo ndashDave Gentry Founder of Redchip1
(1) httpwwwredchipcomblogindexphpredchippresidentpump-and-dump-is-a-pejorative-term-and-rightly-soUZ05RrW1E0w
httpphxcorporate-irnetphoenixzhtmlc=147311ampp=irol-newsArticleampID=933038amphighlight=Photo Source httpwwwredchipcomaboutaboutmainasppage=management
RedChip a firm commonly associated with having promoted speculative and in many previous instances fraudulent companies was among the first to provide research coverage on LKQ
109
RedChip Denounced by the Investing Public
for Promotion of Frauds
CNBC Faceoff Heat Over Chinese Reverse MergersJan 11 2011
Chinese reverse mergers are continuing to make headlines causing investors to take notice and as a result these special types of mergers have come under increased scrutiny
Tuesday on The Strategy Session David Gentry president and CEO of RedChip Companies a business that promotes small-cap companies including Chinese reverse mergers fired back
CNBCs David Faber and partner continue their discussion about Chinese reverse mergers with Dave Gentry president of RedChip a company that promotes these products
Source httpwwwcnbccomid41024808 Source httpglobenewswirecomnews-
release2013010451458410017068enRedChip-Announces-Exit-From-China-Small-Cap-Sectorhtml
RedChip Announces Exit From China Small-Cap SectorJan 3 2013
RedChip Companies Inc (RedChip) an international small-cap research investor relations and media company today announced that it has exited the China small-cap sector and terminated its contracts with its three Chinese clients We made a decision to close our Beijing office months ago and wind down our China operations stated Dave Gentry President and CEO of RedChip Wall Street has for the most part lost confidence in the financial reporting of US-listed Chinese companies We are concerned that Big Four accounting firms were unable to detect financial fraud in companies like Sino-Forest and Longtop Financialldquo Mr Gentry continued When multi-billion dollar funds like Paulson amp Co and The Carlyle Group with their unlimited resources are unable to detect fraud in their Chinese-based portfolio companies when top-tier investment banks like Goldman Sachs are unable to detect fraud in their Chinese-client companies then I think reasonable investors must take a step back and seriously consider whether the potential rewards outweigh the downside risks of investing in US-listed Chinese companies We simply are not willing to take the risk
Prescience Point was on the forefront of identifying Chinese investment scams and has been wary of paid-for research conducted by RedChip
110
LKQ Has Worked Hard to Garner Broader
Analyst Support as a Wall St Darling
Broker Rating Price Target
Barrington Market Perform $3300
BBampT Outperform $3500
BofaML Neutral $3200
CL King Buy $3200
Deutsche Hold $2700
Great Lakes Hold $3300
Stifel Nicolaus Buy $3300
Ray James Outperform $3200
Baird Outperform $3800
Sidoti Buy $3900
Stephens Overweight $3500
FBR Outperform $4000
William Blair Outperform --
Average Price $3420
Date Conferences Presented
52213 BBampT Stephens William Blair
21213 Raymond James Sidoti BofAML
8112 BBampT
52312 Stephens William Blair Deutsche Bank
41712 Baird Barrington
31512 BofA Merrill Lynch
21512 Raymond James Sidoti
82511 CL King ThinkEquity
71211 Jefferies Canaccord Genuity BBampT
41211 Baird Barrington
3711 Raymond James
2010 Raymond James CLK King BofAML Morgan Keegan Gabelli Deutsche Bank
2009 BBampT RBC CL King Morgan Keegan Deutsche JPM
The chorus of analysts are singing buy buy buy The one independent analyst at WellingtonGreat Lakes Research recently downgraded the stock to Hold
111
While JP Morgan Recently Ditched its
Credit Exposure to LKQ Earlier this Year
JP Morgan was Keystone Automotiversquos long-time banker MampA advisor and lead admin agent for its credit facility JP Morgan continued to serve as LKQrsquos lead banker
JP Morgan resigned from its lead banking position in 2013 and appears to have completely severed all ties to the company The significance of this event must be considered as a leading underwriter in high yield bonds JP Morgan mysteriously did not participate in LKQrsquos $600m bond offering thereby sacrificing underwriting fees The bank also assigned key swap contracts to other parties as another credit risk reducing measure
New Counterparty Notional Amount Maturity Fixed Int Rate
Wells Fargo US$250m 101415 15638
Wells Fargo US$60m 103116 11950
Bank of America C$25m 32416 143
Source httpwwwsecgovArchivesedgardata1065696000106569613000044lkq8-khtm
On April 30 2013 JPMorgan Chase Bank NA (JP Morgan) the counterparty on certain of the Companys floating to fixed interest rate swaps assigned its obligations under its swap contracts to Wells Fargo Bank NA and Bank of America NA JP Morgan is no longer a secured lender under the Second Amended and Restated Credit Agreement and therefore assigned its obligation to Wells Fargo Bank NA and Bank of America NA The Company believes Wells Fargo Bank NA and Bank of America NA are creditworthy to perform their obligations as the counterparty to their respective swap contracts The counterparty notional amount maturity date and fixed interest rate of each of the swaps assigned by JP Morgan are listed below
112
Analystsrsquo Views on the Growth Story
are Completely Wrong
Wall St Analyst Views of LKQ
ldquoOpen Ended Growth Story with the Collision Strategy Just Beginning to Unfold LKQ Can Grow Revenues Organically 5-7 and Earnings 15-20 in the Next Several Yearsrdquo
ldquoSecular growth drivers for LKQ include the annual shift to alternative parts versus OEM parts that continues at a rate of 50-100 basis points annuallyrdquo
ldquoLKQ brings professional processes and technology to an under-managed industryrdquo
ldquoLKQs is a preferred partner for insurance companies small auto recyclers seeking a partnerexit strategy and repair shops
ldquoLKQ is a Premium Mid-cap Growth Storyrdquo
Prescience Point View
Sustainable organic growth is likely overstated and closer to 0 ndash 2 in North America European expansion is fraught with problems and a mature and competitive marketplace Earnings growth appears highly engineered with opaque acquisitions and levers for multiple accounting shenanigans being pulled Adjusted free cash flow after acquisitions is the appropriate yardstick to evaluate LKQ
Share shift has stalled and may reverse OEMs with large balance sheets are subsidizing price matching programs and vehicle fleet age has likely peaked
Early mover advantages have eroded auto recycling is now a global business Rampant customer serviceemployee complaints suggest that LKQ is acquiring just to manage earnings and not build a world class operation
Our research suggests not many want to do business with LKQ but rather they have to Insurance companies are introducing new programs such as PartsTrader that will force price compression
LKQ is a poorly constructed roll-up and should not trade at a premium to leading after market auto recycling or industrial distributors
113
Detailed Aftermarket Auto Part and
Metal Recycling Comparables
($ in millions except per share figures)
Stock 13E-14E LTM Enterprise Value Net Price
Price Ent Revenue EPS EBITDA FCF PE EBITDA Sales Debt Tangible
Name Ticker 1102014 Value Growth Growth Margin Margin 2014E 2015E 2014E 2015E 2014E 2015E EBITDA Book
Aftermarket Auto Parts
AutoZone AZO $49000 $21241 23 27 218 104 165x 148x 103x 99x 22x 22x 20x NM
OReilly Automotive ORLY $13299 $15473 63 131 190 105 197x 173x 112x 104x 22x 21x 08x 23x
Genuine Parts GPC $8345 $13630 52 55 88 64 182x 167x 102x 95x 09x 09x 06x 71x
Advance Auto Parts AAP $11564 $8560 493 278 136 55 166x 143x 71x 64x 09x 09x 01x 76x
Monro Muffler MNRO $5581 $1917 99 271 137 84 279x 220x 135x 119x 21x 19x 16x 151x
Uni-Select UNSto $3000 $1104 -02 140 42 59 119x 110x 97x 93x 06x 06x 61x 45x
Pep Boys PBY $1180 $922 47 1458 57 02 200x 148x 61x 56x 04x 04x 25x 13x
Boyd Group BYDUN $3341 $505 193 670 69 38 220x 213x 97x 95x 07x 07x -01x 11x
Max 493 1458 218 105 279x 220x 135x 119x 22x 22x 61x 151x
Average 121 379 117 64 191x 165x 97x 91x 13x 12x 17x 56x
Min -02 27 42 02 119x 110x 61x 56x 04x 04x -01x 11x
Metal Recycling
Steel Dynamics STLD $1910 $6072 44 699 81 24 135x 112x 70x 62x 08x 08x 33x 31x
Comercial Metals CMC $2056 $3468 -03 542 47 -02 199x 133x 88x 71x 05x 05x 31x 21x
Sims Metal SMSMY $924 $2028 -107 1074 27 21 159x 115x 97x 70x 03x 03x 07x 12x
Schnitzer Steel SCHN $2894 $1118 46 1252 41 07 180x 137x 78x 66x 04x 04x 34x 18x
Metalico MEA $240 $233 47 -1455 34 24 480x 218x 76x 66x 04x 04x 66x 14x
Max 47 1252 81 24 480x 218x 97x 71x 08x 08x 66x 31x
Average 05 423 46 15 231x 143x 82x 67x 05x 05x 34x 19x
Min -107 -1455 27 -02 135x 112x 70x 62x 03x 03x 07x 12x
LKQ Corp LKQ $3300 $11846 188 257 135 61 243x 192x 150x 124x 20x 18x 27x 570x
Source Company financials CapitalIQ calendarized estimates
114
Valuation Premium is Unwarranted Relative
to Aftermarket Parts and Recyclers
Source CapitalIQ company filings Averages exclude LKQ
Price 2014E EPS Price to Tangible Book Value
Enterprise Value to 2014E EBITDA Enterprise Value to 2014E Revenues
00x
20x
40x
60x
80x
100x
120x
140x
160x
PB
Y
AA
P
BY
DU
N
UN
Sto
GP
C
AZ
O
OR
LY
MN
RO
ST
LD
ME
A
SC
HN
CM
C
SM
SM
Y
LKQ
Auto Part Distributors Scrap Processors
Average
00x
05x
10x
15x
20x
25x
PB
Y
UN
Sto
BY
DU
N
AA
P
GP
C
MN
RO
OR
LY
AZ
O
SM
SM
Y
SC
HN
ME
A
CM
C
ST
LD
LKQ
Auto Part Distributors Scrap Processors
Average
00x
50x
100x
150x
200x
250x
300x
UN
Sto
AZ
O
AA
P
GP
C
OR
LY
PB
Y
BY
DU
N
MN
RO
ST
LD
SM
SM
Y
SC
HN
CM
C
LKQ
Auto Part Distributors Scrap Processors
Average
00x
100x
200x
300x
400x
500x
600x
BY
DU
N
PB
Y
OR
LY
UN
Sto
GP
C
AA
P
MN
RO
SM
SM
Y
ME
A
SC
HN
CM
C
ST
LD
LKQ
Auto Part Distributors Scrap Processors
Average
115
Detailed Industrial Distribution Comparables
LKQ often refers to itself as a ldquodistributionrdquo company From this perspective LKQrsquos stock is dramatically overvalued relative to some of the best industrial distribution companies in America
($ in millions except per share figures)
Stock LTM Enterprise Value Net Price
Price Ent EBITDA FCF PE EBITDA Sales Debt Book
Name Ticker 1102014 Value Margin Margin 2014E 2015E 2014E 2015E 2014E 2015E EBITDA Value
WW Grainger GWW $26371 $18396 159 79 377x 182x 108x 99x 18x 17x 00x 35x
Home Depot Supply HDS $2430 $10218 88 -115 180x 116x 117x 99x 11x 10x 73x NM
Wesco WCC $9194 $5545 60 35 151x 141x 97x 88x 07x 07x 34x 23x
MSC Industrial MSM $8540 $5214 183 96 203x 174x 104x 90x 18x 17x -04x 39x
Anixter AXE $9322 $3773 58 25 142x 131x 90x 84x 06x 06x 21x 28x
Applied Industrial Tech AIT $4826 $1955 80 38 165x 138x 91x 78x 08x 07x -04x 26x
Max 183 96 377x 182x 117x 99x 18x 17x 73x 39x
Average 105 26 203x 147x 101x 90x 11x 10x 20x 30x
Trim Avg 97 44 175x 146x 100x 89x 11x 10x 13x 30x
Min 58 -115 142x 116x 90x 78x 06x 06x -04x 23x
LKQ Corp LKQ $3300 $11846 135 61 243x 192x 150x 124x 20x 18x 27x 45x
Source Company financials CapitalIQ calendarized estimates
Trim average exludes maximum and minimum
116
LKQrsquos Valuation Premium is Unwarranted
Relative to Industrial Distributors
Source CapitalIQ company filings Averages exclude LKQ
Enterprise Value to 2014E EBITDA Enterprise Value to 2014E Revenues
Price 2014E EPS Price to Book Value
00x
20x
40x
60x
80x
100x
120x
140x
160x
AXE AIT WCC MSM GWW HDS LKQ
Average
00x
05x
10x
15x
20x
25x
AXE WCC AIT HDS GWW MSM LKQ
Average
00x
50x
100x
150x
200x
250x
300x
350x
400x
AXE WCC AIT HDS MSM LKQ GWW
Average
00x
05x
10x
15x
20x
25x
30x
35x
40x
45x
50x
WCC AIT AXE GWW MSM LKQ
Average
117
LKQ is an Ineffective Roll-up Valuation
Beyond the Sum of its Parts Isnrsquot Justifiable
$ in mm 1998-2013 Acq 2011 Acq May 2013 Acq Dec 2013 Approx Total
Estimated Revenues~ growth
~$37000-2
~$1200~20
~$4000~4-6
~$7000NA
$6000Low single digits
Gross MarginContribution
Low 40 if accurate
~430 ~330 Low 30
Estimated EBITDA margin
$4400120
$91076
$33083
$700100
$650108
Purchase Price ~$2100 $347 (1) $272 $450 gt$2700
EVLTM EBITDA -- Acquired 89x Acquired 88x Acquired 64x At best 70x ndash 100x
EVLTM Revenues -- Acquired 068x Acquired 073x Acquired 064x At best 060x ndash 10x
Comments (2) North American Salvage Assets of
diminished value and potentially impaired
value in Heavy Duty Core business value in serious question LKQ has paid big premiums to book
value for these industrial assets
Growth is artificially high in the near term due to rapid store expansion Growth is
expected to slow dramatically as it reaches its market saturating location limit Also LKQ has yet to demonstrate an ability to
drive APU growth in Europe
(3) Acquired from H2 Partners which also
owns the UKrsquos Unipart Auto (a competitor to
ECP) H2 did not appear to extract synergies
between the two so we are skeptical of LKQrsquos ability to drive value between ECPSator
(4) Keystone was previously bankrupt and up for sale for at least a year until LKQ bought it
LKQ has yet to demonstrate any ability
to extract value here and its key markets are fundamentally different from LKQrsquos existing ones
At 70x ndash 100x EBITDA and adjusting for $17bn of debt
outstanding $107m of cash and 3088m shares os our price target is
~$1000 - $1500share( 50 ndash 70 ) downside LKQrsquos current valuation at 15x is a
substantial premium to the sum of its parts at the upper end of
its historical range and a significant premium to all its
stock trading peers
Source Company financials converted from local currencies(1) ECP deal excludes $339m earnout payment made in March 2013(2) Note that in Q4rsquo12 LKQ mysteriously realigned the reporting structure of its heavy-duty salvage yards and removed it as an operating segment to be included within Wholesale North America (p 7 2012 10K)
(3) H2 Equity Acquires Unipart (UK) httpwwwunipartcoukUserFilesFileUnipartAutomotiveH2pressrelease[1]pdf(4) Platinum Equity Seeks Buyer for Keystone Automotive httpwwwreuterscomarticle20130129keystone-platinum-idUSL1N0AXM6U20130129
Over 160 Acquisitions (Salvage Aftermarket
Reman Heavy Duty Etc) Euro Car Parts Sator HoldingKeystone Auto
Operations LKQ Corp
118
Cheap Money Leverage and Bad Deals =
Valuation Expansion
LKQrsquos long-term Enterprise Valuation to forward EBITDA multiple has trended in the 10x ndash 11x range The recent valuation expansion appears to be a function of expansionary monetary policies favoring stocks the companyrsquos use of more leverage to buy low quality businesses as it expand into Europe and we believe a fundamental misevaluation by market participants of LKQ as an effective roll-up
We believe investorsrsquo are discounting perfect execution and unrealistic growth expectations for a company with significant fundamental challenges and lacking operational excellence as indicated by
An ldquoFrdquo rating by the Better Business Bureau
28 our of 5 ranking on Employee Review site Glassdoorcom
Our conversations with industry participants
500x
700x
900x
1100x
1300x
1500x
1700x
1900x
Enterprise Value NTM EBITDA Long-Term Average
QE Leverage Fueled Valuation Expansion on Bad Acquisitions
LKQrsquos EV NTM EBITDA Historical Valuation
Appendix
120
Does LKQ Have Too Cozy a Relationship
with its Auditors
According to the SEC at the onset of the WM fraud the Company capped Arthur Andersens audit fees However WM advised AA it could earn additional fees for special work mdash eg consulting services Over the succeeding years AAs corporate audit fees remained flat while the fees for special work multiplied
Despite enormous revenue growth and international geographic expansion LKQrsquos audit and total fees paid to auditors have barely increased Oddly enough tax planning fees have fallen at the fastest pace despite LKQ having reported progressively growing international earnings and cash flow
$ in millions
2008 2009 2010 2011 2012 CAGR
Audit Fees $182 $160 $170 $197 $204 29
Audit-Related $005 $009 $030 $028 $012 211
Tax Fees $063 $075 $062 $032 $035 -140
All Other Fees $012 $000 $000 $000 $000 -1000
Total Fees $263 $244 $261 $257 $251 -12
Annual Growth
revenues 694 73 206 324 261 212
employees 55 42 200 492 134 162
Sales by Geography
US 1000 1000 1000 1000 831 78 (1)
Europe 00 00 00 00 169 22(1)
(1) as of LTM 93113 Source Company filings
121
LKQ Received the Coveted ldquoFrdquo Grade
by The Better Business Bureau
httpwwwbbborgchicagobusiness-reviewsauto-parts-and-supplies-used-and-rebuiltlkq-in-chicago-il-12010519
122
Insider Views from Glassdoor
Source httpwwwglassdoorcomReviewsLKQ-Reviews-E20395htmsortsortType=RDampsortascending=false
2
Disclaimer
This research presentation report expresses our research opinions which we have based upon certain facts all of which are based upon publicly available information and all of which are set out in this research presentation report Any investmentinvolves substantial risks including complete loss of capital Any forecasts or estimates are for illustrative purpose only and should not be taken as limitations of the maximum possible loss or gain Any information contained in this report may include forward looking statements expectations and projections You should assume these types of statements expectations and projections may turn out to be incorrect for reasons beyond Prescience Point LLCrsquos control This is not investment advice nor should it be construed as such Use of Prescience Point LLCrsquos research is at your own risk You shoulddo your own research and due diligence before making any investment decision with respect to securities covered herein
You should assume that as of the publication date of any presentation report or letter Prescience Point LLC (possibly alongwith or through our members partners affiliates employees andor consultants) along with our clients andor investors hasa short position in all stocks (andor are long putsshort call options of the stock) covered herein including without limitation LKQ Corporation Inc (ldquoLKQrdquo) and therefore stands to realize significant gains in the event that the price of its stock declines Following publication of any presentation report or letter we intend to continue transacting in the securitiescovered therein and we may be long short or neutral at any time hereafter regardless of our initial recommendation
This is not an offer to sell or a solicitation of an offer to buy any security nor shall any security be offered or sold to anyperson in any jurisdiction in which such offer would be unlawful under the securities laws of such jurisdiction PresciencePoint LLC is not registered as an investment advisor
To the best of our ability and belief as of the date hereof all information contained herein is accurate and reliable and doesnot omit to state material facts necessary to make the statements herein not misleading and all information has been obtained from public sources we believe to be accurate and reliable and who are not insiders or connected persons of the stock covered herein or who may otherwise owe any fiduciary duty or duty of confidentiality to the issuer or to any other person or entity that was breached by the transmission of information to Prescience Point LLC However Prescience Point LLC recognizes that there may be non-public information in the possession of LKQ Corporation Inc or other insiders of LKQ Corporation Inc that has not been publicly disclosed by LKQ Corporation Inc Therefore such information contained herein is presented ldquoas isrdquo without warranty of any kind ndash whether express or implied Prescience Point LLC makes no other representations express or implied as to the accuracy timeliness or completeness of any such information or with regard to the results to be obtained from its use
Report Highlights
00
100
200
300
400
500
600
700
800
900
1000
$000
$500
$1000
$1500
$2000
$2500
$3000
$3500
$4000
1062003 1062005 1062007 1062009 1062011 1062013
Penny s tock promoter RedChipini tiates coverage
Acquires Keystone Auto
for $811m
Co-CEO role created mgmt comp increases Di rector of IR resigns
CFO Mark Spears Resigns
Acquires Euro Car Parts for $347m
Code of Ethics pol icy updated
Acquires Sator issues $600m
HY bonds JP Morgan resigns
as lead banker
Control ler and Chief Accountant Resigns
Reverses Couse Back to US Targets Acquires Keystone Auto Industries for $450m
4
From Penny Stock Promoter to $10bn+
Wall Street Darling The Story of LKQ
5
Prescience Point Believes
Caught in a Massive Margin Squeeze Gross Margins Are In Persistent Decline and Inventory Accounting Methods Are Likely Blunting the True Problems North American Organic Growth Very Likely To Be Overstated and Not Reconcilable to Our Research
1
2
3Problems With the New Growth Story To Divert Attention from its North American Problems LKQ Bolted to Europe in Hopes of Spinning a New Growth Story Our Research Suggests LKQ is Already Facing Problems and Quickly Scrambling to Cover
4
Previous Accounting Fraud and Failures at Waste MgmtDiscovery Zone Associated With Numerous Members of the Management Team Have Cost Shareholders Billions of Lost $rsquos in Aggressive Roll-up Strategies
5
Price Target $10 - $15 per share gtgtgt 50 ndash 70 Downside
Dramatic Overvaluation to Aftermarket Auto Recycling and Industrial Distributors and Supported by Sell-Side Analystsrsquo Failing to Question Assumptions and Not Considering the Fundamental Problems Facing the Company
LKQ Is An Ineffective Roll-up The Company Has Generated No Cumulative Free Cash Flow Adjusted for Acquisitions and Becoming Increasingly Dependent on External Capital to Perpetuate the Illusion of GAAP Profits LKQ Will Need Larger and Larger Targets to Keep the Growth Game Alive
6
Report Highlights (contrsquod)
High-Level Indications of Fabricated GAAP Profits Unsustainable Business Model LKQ is a classic roll-up fueling growth through acquisitions Roll-up business models provide management with a significant amount of discretion in presenting financial results Roll-ups tend to exhibit strong earnings CFO and earnings quality metrics due to the inherent financial statement mechanics of paying for growth through acquisition outflows which do not affect earnings or CFO Because of this free cash flow after acquisitions is an important metric for analyzing roll-ups it presents a better picture of the businessrsquos economics LKQrsquos free cash flow after acquisitions has been negative in 8 of the last 9 years
Furthermore our analysis indicates LKQ is an ineffective rollup ndash wealth creation from years of acquisitions has been nil Since 2007 LKQ has reported cumulative Earnings and EBIT of $122B and $215B respectively Meanwhile it has burned cumulative free cash flow after acquisitions of -$162B and raised cumulative net capital of $163B suggesting it has never earned a cash-on-cash return on invested capital Put another way the immense wealth generation represented by LKQrsquos historical GAAP profits is not observable in the companyrsquos cash flows ndash it appears to be lsquopaperrsquo wealth generated by accounting gimmickry
In light of this and a broad array of other red flags discussed in this report we are forced to look through managementrsquos representations We believe the credibility of LKQrsquos financial statements is questionable and that LKQ bears a heightened risk of a crippling inventory andor goodwill write-down or financial restatement
Reported Organic Growth for LKQrsquos North America Business Appears Overstated LKQrsquos aggressive roll-up strategy also gives it a high level of flexibility to inflate revenue growth LKQ reported organic revenue growth averaging ~65 from 2008 ndash 2012 and ~6 for its North America (NA) Parts amp Services (PampS) business (~75 of PampS revenue) with far less variability vs comps and not a single quarter of negative growth LKQ does not provide clarity around the calculation or the impact on earnings making it difficult for investors to confirm its validity However based on our research LKQrsquos reported organic growth rate does not appear reconcilable with trends in the primary fundamental factors that drive it We believe it is overstated We believe LKQrsquos NA growth rate normalized for a 2013 spike in collision frequency more likely measures in the range of 0-2
From 2008 to 2012 annual insurance claims paid for repairable accident claims have been flat according to industry consultant The Romans Group LLC Additionally from 2010 to 2012 growth in Alternative Parts Usage (ldquoAPUrdquo) (ie market share of alternative auto parts which LKQ sells relative to OEM parts) which had risen steadily for 3 decades and was a primary driver of LKQrsquos historical organic growth has flat-lined going forward CCC Information Services ndash provider of the industryrsquos dominant estimate writing platform and LKQrsquos source for APU data ndash expects it to taper or reverse Based on industry data sources and our conversations with industry sources this is resulting from a recent expansion in OEM price-matching programs they have become more aggressive in pursuit of retaking lost market share by undercutting alternative parts prices thereby negating LKQrsquos value proposition Internal dealer documents we have obtained indicate the OEMs are increasingly subsidizing dealers to sell parts at levels 33 below aftermarket list prices (ie LKQrsquos price) making them whole on the loss and paying them an additional 14 profit on the cost for the part (Refer to dealer source document on page 12) As a result for the first time ndash according to Mitchell International ndash parts prices in general deflated in 2012 LKQ management tells investors APU rose 100bp in 2012 however their own data source and LKQrsquos SEC filings refute their claim
7
Report Highlights (contrsquod)
Short-Term Thinking Pervades Decision-Making Signals Desperation to Keep Financials Inflated amp Meet Targets With NA growth waning LKQ looked to Europe for acquisition candidates In Q4rsquo2011 it made its 2nd largest acquisition ever acquiring UK-based Euro Car Parts (ECP) a distributor of mechanical aftermarket parts operating out of 89 branchstore locations As LKQ pitched investors on the open-ended growth opportunity provided by buying ECP to our knowledge it never publicly disclosed that the UK aftermarket parts industry was in significant contraction (2011E -58 according to Datamonitor) or that it is projected to continue contracting but LKQ touted ECPrsquos 30+ lsquoorganicrsquo revenue growth rate from 2009-2011
Now 2 years separated from the date of acquisition and with its industry still weak LKQ continues to report 30 organic growth rates for ECP which would seem to defy logic It shouldnrsquot LKQ does not define ECPrsquos lsquoorganic growthrsquo in the way investors might expect for a business characterized by storefronts (ie as same store sales growth) it defines it to include both SSS and revenue generated by newly opened ECP stores As such LKQrsquos reported organic growth rate is fueled by opening new ECP branches the more new ECP stores LKQ opens in a given period the more it can inflate its consolidated organic growth rate
Rapidly expanding the number of ECP branches was not an LKQ priority when it announced the acquisition evident in guidance issued on LKQrsquos ECP MampA call (held on 10411) ldquowe have a plan to grow 10 to 12 branches per year for the next few yearshellip to complete out the major UK marketsrdquo Within just a few months ndash apparently a direct response to NA growth weakening and the threat of a guidance miss ndash LKQ abandoned its plan throughout 2012 it repeatedly raised its guidance for the number of stores to be opened in 2012 from 20 to 30 and finally to 42 By Q4rsquo2012 based on our estimates ECP accounted for a full 75 of consolidated PampS organic growth up from ~4 only one year prior In 2012 ECP also started running periodic steep online sales promotions (30-45 discounts) of parts across the board ndash with many promotions implemented right at the end of the quarter just ahead of reporting to investors indicating an obsessive desire to meet financial estimates The combination of a ramp-up in branch openings and steep discounting juiced LKQrsquos organic growth rate just enough for it to hit the low end of guidance for 2012 PampS organic growth
LKQ has also repeatedly raised guidance for the maximum number of full-sized ECP branches the UK market can absorb from 120 to 150 to 175 to 200 giving it further room to continue ramping the number of branch locations At YErsquo2012 LKQ operated 130 branches in only one year surpassing the store count it initially guided would result in saturation of the UK market 120 On the Q1rsquo2012 earnings call LKQ CEO Wagman raised his projection for the market-saturating branch count to 150 stating that at that number ldquobranches in major metropolitan areas can be 5 miles or so apartrdquo and that ldquotheres not necessarily cannibalizationrdquo should they be LKQ has since raised the ceiling on the maximum branch count to 200 hinting of desperation
LKQ appears to operate ECP with the primary intent of unsustainably inflating its financials and meeting guidance targets at the long term shareholder expense of entrenchment in a contracting market Inevitably as ECP reaches its market saturating location capacity we expect ndash and we believe management has anticipated ndash its reported organic growth rate to plummet and converge to the industry average
8
Report Highlights (contrsquod)
Increasing Dependency on Acquisitions to Inflate Financials Conceal Cumulative Manipulations LKQrsquos gross margins have been in persistent decline contracting from 471 to 41 from FY 2005 to the LTM period ended 9302013 We believe the decline is in part the result of the reversal of cumulative past accounting manipulations while at the same time competitive and pricing pressures are intensifying it appears that over time LKQrsquos is growing increasingly dependent on ever larger acquisitions to prevent an unraveling of its financials As previously mentioned due to the inherent mechanics of acquisition accounting acquisitions have a flattering but unsustainable effect on earnings and CFO that has nothing to do with the performance of the business When the benefit expires a hole is left to be filled in its place just to maintain the status quo
LKQ has been rapidly accelerating its deal making both in quantity of deals and in dollar value Within the past 2 years LKQ has made 3 of 4 of its largest acquisitions ever LKQ acquired 30 companies in 2012 alone against the backdrop of having acquired a total of 71 companies in the 3 years from 2010-2012 and over 170 since its 1998 inception Notably LKQ reported a record 17 acquisitions in just Q4rsquo12
Yet despite this LKQ missed dramatically on 2012 CFO guidance which came in 19 below revised guidance issued on 10252012 only 2 months before year end Making the most acquisitions it has ever made in a quarter a gaping hole in CFO exposed itself indicates LKQ may be making acquisitions as we believe in order to inflate its financials and paper over past accounting manipulations Management justified the miss as primarily attributable to an investment in inventory that wasnrsquot exactly anticipated An alternative explanation is that the cumulative deal size was insufficient to bail the company out
We believe LKQ entered Europe in search of a fresh pool of large-scale acquisition targets After purchasing ECP ndash its 2nd largest purchase ever at the time ndashin Q4rsquo2011 LKQ began unsustainably juicing its organic revenue growth rate via the rabid opening of ECP stores something completely outside of its plans for the company when it acquired the company Because of these openings ECP currently accounts for ~50 of LKQrsquos organic revenue growth We believe as ECP branch openings slow and new stores mature its reported organic growth rate will plummet from current levels converging to the negative industry rate of growth and resulting in a new hole LKQ will predictably seek to plug with more acquisitions Operating ECP as it has with seemingly little regard for building long term value may be an indication of desperation to keep its financials together as it searched for a larger target
LKQ moved quickly buying mainland European company Sator in April 2013 amounting to its 3rd largest purchase ever at the time As a result its European reporting segment now includes both ECP and Sator This new reporting will obscure future financial deterioration at ECP
In December 2013 it acquired Keystone Automotive Operations a company distributing a fundamentally different type of automotive product from that of its core business The acquisition was LKQrsquos 2nd largest ever
We believe managementrsquos short-term focus on managing the business to hit financial guidance is unsustainable LKQrsquos increased pace of deal making as gross margins deteriorate are supportive of questioning the companyrsquos motives
9
Report Highlights (contrsquod)
Gross Margins (GMs) Appear Inflated as Inventory Turnover is Stable Caught in a massive margin squeeze with used auto parts prices deflating and salvage vehicles rising LKQrsquos GMs have been in persistent decline since 2005 down 590bps while consolidated inventory turns have been relatively stable We believe there is more deterioration in LKQrsquos GMs than observable on the Income Statement We believe LKQ may pull 2 primary accounting levers to manipulate GMs and inventory turns
1 Aggressive Inventory Policy Enables Overstatement of Inventory ndash LKQ uses an aggressive policy for accounting for its Salvage and Remanufactured Inventory that allows for a high level of discretion which management can use to inflate gross margin by leaving costs on the balance sheet in the form of overstated inventory The recent surge in LKQrsquos salvage inventory coupled with gross margin deterioration is consistent with this trend and the overall concern of costs being left on the balance sheet In isolation this policy results in inflated gross margins and CFO and exerts downward pressure on the rate of inventory turnover The generally high level of Salvage amp Remanufactured inventory ndash to which the aggressive policy applies ndash is a high level sign the company may be manipulating its margins We believe LKQ is likely inflating its gross margin and earnings by failing to record a necessary expense for excess and obsolete inventory Omissions of expensing obsolete inventories result in future margin compression
But the surge in Salvage amp Remanufactured inventory the account subject to the aggressive inventory accounting policy serves as a higher level sign that margins and CFO may be manipulated How would LKQ be able to keep consolidated inventory turns from declining in the face of GM manipulation
2 Acquisition Accounting Enables Understatement of Acquired Inventories ndash The acquisition fair market value process enables LKQ to understate the values of acquired company inventories and to allocate the plug figure to goodwill The result is that inventory costs which should be future period expenses can be instead permanently deferred Based on conversations with a recycled auto consultant who consults recycled parts distributors that are selling to LKQ we estimate acquired inventory values make up 33-67 of the acquisition purchase price (adjusted for real estate) From 2003-2012 LKQ has allocated only 227 of the cumulative acquisition purchase price (ex PPampE) to inventory which would be consistent with utilizing this policy In isolation this would result in inflated gross margins and CFO and exert upward pressure on the rate of inventory turnover thereby counterbalancing the downward pressure caused by increases in Salvage and Remanufactured inventory and stabilizing consolidated inventory turnover
We believe LKQrsquos GMs will continue to decline through 2014 against the backdrop of intensifying pricing pressures and as past accounting overstatements have to be reversed we believe LKQ is at elevated risk of a crippling goodwill write-down As of 93013 LKQ carries $21bn of goodwill + intangibles on its balance sheet (47 of Assets 92 of Book Equity) for a collection of industrial assets that would ordinarily sell for little premium to book value We note that LKQ attempts to explain GMs declining as a function of rising costs to acquire salvage vehicles However the Manheim Index peaked in 2011 and has already started to decline When asked for guidance on a sustainable gross margin target LKQ still cannot give investors any clear guidance on the matter and now cites the move into Europe as a complicating factor for the decline
10
Report Highlights (contrsquod)
LKQrsquos Business Strategy and Trajectory Right out of the Waste Management Playbook LKQ was founded in 1998 by Donald Flynn with the financial backing of Dean Buntrock and AutoNation Inc led by Wayne Huizenga Flynn Buntrock and Huizenga were all previously executives of Waste Management Inc (WM) a company notorious for having perpetrated a massive multi-year financial fraud resulting in the largest restatement in corporate history at the time
Following a board-led probe of the companyrsquos accounting practices in 1997 WM was forced to restate its financial statements for the period 1992 ndashQ3rsquo1997 acknowledging that it had misstated its pre-tax earnings by approximately $17 billion and took a $35 billion charge The SEC charged certain executives with financial fraud According to the SEC complaint ldquodefendants fraudulently manipulated the companys financial results to meet predetermined earnings targets The companys revenues were not growing fast enough to meet these targets so defendants instead resorted to improperly eliminating and deferring current period expenses to inflate earningsrdquobull Donald Flynn (LKQrsquos founder) was a Waste Management Audit Committee member from 1994 until 1997 ndash a period at the heart of the perpetuation
of the fraud ndashand also served as Audit Committee Chairman during a period coinciding with the fraud He was previously WMrsquos CFO from 1972 ndash1989
bull Dean Buntrock (an LKQ founding backer amp former director) co-founded WM with Wayne Huizenga (LKQ founding backer) Buntrock was WMrsquos CEO during the period of the fraud and according to the SEC complaint ldquothe driving force behind the fraudrdquo
Waste Managementrsquos aggressive rollup strategy gave its management a high level of flexibility to inflate revenue growth and margins and to conceal doing so for years Many individuals previously associated with Waste Management would go on to build businesses using the WM playbook Specifically a closely-knit group of WM alumni and associates (including LKQrsquos founders) have repeatedly co-invested in and built several companies with each company replicating WMrsquos aggressive roll-up or an acquire-and-build strategy either setting out to consolidating a fragmented industry or flooding an industry with store openings in an effort to build a dominant market position as quickly as possible Some of these companies include Blockbuster Video Discovery Zone Boston Chicken AutoNation Swisher Hygiene and LKQ
Many of these companies have either failed to deliver on their sales pitches to investors failed outright or were tarred by allegations of fraud manipulative accounting andor unjust management enrichment Based on our analysis in the majority of cases these WM alums and associates built businesses with the intent to create the illusion of growth as opposed to focusing on creating value through operational excellence resulting in little to no lasting value
In light of our belief that LKQ is inflating its financials it is worth noting that Discovery Zone another company previously founded by LKQ founder Donald Flynn ndash and in which Dean Buntrock Wayne Huizenga and several other WM alums were associated -- similarly utilized an acquire-and-build strategy It ended up in bankruptcy and was alleged to have engaged in accounting manipulations Many current and former officers ndash notably accounting officers ndash from both WM and Discovery Zone are current and former accounting officers with LKQ (refer to page 13) We also note that in light of our opinion that LKQ may be engaging in inventory accounting shenanigans LKQrsquos Director of Accounting and Inventory was previously employed by both WM and Discovery Zone
11
Report Highlights (contrsquod)
Flawed Corporate Governance Rewards Bad Practice We believe that managementrsquos incentive structure is at the foundation of its failed capital allocation record Management is rewarded by the roll-up strategy with annual bonuses and incentives incentivizing empire-building at any cost Annual bonuses are tied to revenue growth and long-term incentives are tied to Revenue EPS and ROE with the following weightings revenue (475) earnings (475) and ROE (5) There are no stipulations that revenue has to be organic and therefore the management team is perfectly incentivized to acquire and overpay for revenue and game the accounting to inflate profits
The CEOrsquos total comp has increased 374 in the past 4 years while free cash flow is up only 9 in the same period Approximately 50 of the comp increase has come in stock but as a whole the management team has been net sellers of stock Insiders have sold shares aggressively since the IPO when former owners of acquired companies affiliates and management owned 22 Since 2009 insider selling pressure has intensified with insiders currently owning less than 2 Insiders even sold stock recently in Dec 2013 just days after touting the merits of the Keystone deal There is now an almost complete break in the linkage between shareholder interests and executive wealth
In another cautionary sign in an 8-K filing during April LKQ revealed that JP Morgan was no longer a secured lender under its credit agreement JP Morgan had supported both Keystone and LKQ for a number of years While we do not know the why the relationship was severed when a bulge bracket investment bank turns away from a fee generating client of LKQrsquos size there is risk of smoke before fire
Valuation as a ldquoPremium Midcap Growth Storyrdquo is Unwarranted We believe The Streetrsquos view of LKQ as a proven acquirer with an ldquoopen-endedrdquo growth opportunity does not stand the test of logic Trading at 2x 15x and 25x 2014E sales EBITDA and EPS respectively LKQrsquos stock is priced at an unjustified premium to Aftermarket Auto Metal Recyclers and Industrial Distribution peers and fails to reflect few if any of the serious issues our research highlights Specifically our analysis indicates LKQ appears to be engaging in aggressive deal-making and accounting to manufacture GAAP profits and appears to make bad economic business decisions in order to meet predetermined financial targets We believe that management has taken to masking the companyrsquos weakening growth prospects by gaming the accounting to inflate organic growth and that it is dependent on ever-larger acquisitions to keep the growth story alive while insiders cash out As a result of our concerns over the integrity of its financial reporting we believe LKQ is at high risk of having to restate its historical financial results We believe the growth story management has spun to investors is a bill of goods Given concerns about the reliability of its financial statements we believe the company has an intrinsic value of $10 ndash $15 per share close to its book value representing 50-70 downside from the current price
12
LKQrsquos Only Competitive Advantage is Pricehellip
GMrsquos Price Matching Program Is Designed
Specifically to Thwart LKQ
Keystone List Price
OEM price-match 33
discount from Keystone
Price (Keystone list has
generally been 20-25
less than OEM OEM is
now undercutting
Keystonersquos price by 33)
GM reimburses dealer
for loss on part cost
GM pays dealer 14
return on part cost
We have sourced an internal GM dealer document detailing GMrsquos price-matching program ldquoBump the Competitionrdquo We are told it specifically targets LKQ-Keystone GM subsidizes dealers to sell parts (in this case a fender and a door) at levels 33 below aftermarket list prices makes them whole on the loss and pays the dealer an additional guaranteed 14 profit on the cost for the part
Source Felders Collision Parts Inc v General Motors Company et al Complaint Exhibit 4 filed 10122012
Same Players Same Strategy Results
Marred by Accounting Irregularities amp Failures
13
John MelkInvestor
Charged with accounting fraud one
of the largest in history
Aggressive rollup strategy
Discovery ZoneBlockbuster Boston Chicken AutoNation Swisher Hygiene
Dean BuntrockCo-founder CEO
Dean BuntrockInvestor Franchisee
Dean Buntrock Founding Backer Director
Dean BuntrockInvestor Director
Donald FlynnCFO Director -Audit Committee
Donald FlynnInvestor
Donald FlynnFounding Backer Director
Donald Flynn Founder
Donald FlynnCEOChairman
John MelkPresident WM International
John MelkFounding Backer Director
John MelkFounding backer Director
John MelkInvestor Director
Lawrence BeckCo-founder
Lawrence BeckInvestor Franchisee
Lawrence BeckInvestor Franchisee
Peer PedersenDirector
Peer PedersenInvestor Franchisee
Peer PedersenDirector
Peer PedersenInvestor
Scott BeckInvestor COO Vice Chairman
Scott BeckInvestor
Scott BeckCEOChair
Steven BerrardCFO then CEO
Steven BerrardCo-founder Co-CEO
Steven BerrardCEO Director
Victor CassiniGen CounselSecretary
Victor CassiniGen Counsel Secretary
Wayne HuizengaCo-founder
Wayne HuizengaCEOChairman
Wayne HuizengaInvestor (via Blockbuster)
Director
Wayne HuizengaInvestor
Wayne HuizengaFounder Co-CEO
Wayne HuizengaChairman
Wayne HuizengaFounding backer (via
AutoNation)
Bought out by Viacom for $84B
Aggressive acquire-amp-build
strategy
Goes bankrupt Allegations of fraud
Aggressive acquire-amp-build
strategy
Goes bankrupt Accounting gimmicks to obscure financials
Aggressive acquire-amp-build
strategy
$$ Billions Lost Pooling of Interests
acquisition accounting
Aggressive rollup amp acquire-amp-build strategy
Accounting irregularities
Financials restatementAcquisition Accntng Issues
Ongoing SEC inquiry
Aggressive rollup strategy
An array of accounting
red flags amp misrepresentations
Aggressive rollup amp acquire-amp-build strategy
Dean BuntrockFranchisee
Steven BerrardCEO post-Viacom
LKQ
14
WM and DZ ndash Previous Employers of Many
LKQ Executives amp Accounting Personnel
Flynn Enterprises Common Shareholder
John QuinnVarious Positions
John QuinnSVP and CFO
Mark SpearsController Head Acct
Mark SpearsFormer SVP CFO
Frank ErlainFmr VP Finance
Controller Accountant
Victor CasiniGen Counsel amp
Secretary
Walter HanleyAsso Gen Counsel
Walter HanleySVP Development
Victor CasiniGen Counsel amp
Secretary
Ken FreseAcctrsquog Mgr
Ken FreseAccountant
Ken FreseDir Accounting amp
Inventory
Joe HolstenCOO CEO WM Intrsquol
Joe HolstenFmr CEO Chairman
Frank ErlainVP amp
Controller
Sinon GalvinSVP Revenue Optimization
Sinon GalvinVarious Positions
WM Intrsquol
Fraud Allegations Improper Capitalization of Expense Files for Bankruptcy March 1996
Charged w $17 billion Accounting Fraud March 2002
Stephen EckelDir Oracle Fin Apps
Fmr AcctrsquogAss Contrsquoller
Stephen EckelAssistant Corporate
Controller
Source SEC filings LinkedInreg
Kevin FlynnFormer Director
Kevin FlynnVP Midwest
Vaughn HooksChief Tax Officer
Vaughn HooksVP Taxes
Dan ShoenerVP
Dan ShoenerVP of Finance
LKQ
15
Current Capital Structure
LKQ Corp Capital Structure
$ in mm except per share amounts
Stock Price $3300 Metrics LTM 93013 2013E 2014E 2015E
Shares outstanding 3006 EVSales 25x 23x 20x 18x
Net Options $704 avg strike 56 EVEBITDA 193x 189x 150x 124x
RSUs outstanding 26 PriceEPS 333x 306x 243x 192x
Fully Diluted Shares 3088 DebtEBITDA 29x 28x 22x 18x
Market Capitalization $101909
Debt Outstanding Rate Maturity Unused Covenants
Receivables Securitzation $100 101 2015
Term Loan A $4444 308 2018 max lev 35x min EBITDA cov 30x
Revolver (1) $6498 308 2018 $7000 max lev 35x min EBITDA cov 30x
Senior Unsecured Notes $6000 475 2023
Notes Payable $389 180 2018
Other Debt $189 350 NA
Total Debt $17621 361
Less Cash $1073
Total Enterprise Value $118456
1) Assumes $450m Keystone acquisition is fully funded on the revolver as per company press release
Background and Business
Background ndash LKQ Corp
LKQ Corporation (LKQ) a wholesale replacement auto parts distributor was founded in 1998 by Donald Flynn and with the financial backing of Dean Buntrock and AutoNation Inc the automobile retailer founded and led at the time by Wayne Huizenga Flynn would recruit Joseph Holsten to serve as LKQrsquos CEO1 Flynn Buntrock Huizenga and Holsten are all former executives of Waste Management Inc (WM)
LKQ has set out to consolidate the fragmented wholesale alternative auto parts industry by implementing an aggressive roll-up strategy fueling growth through acquisitions Since 1998 LKQ has grown through over 171 acquisitions primarily in the US and Canada becoming the largest provider of aftermarket amp recycled collision auto parts in North America
In May 2006 the company acquired Keystone Automotive Industries Inc (Nasdaq KEYS) a provider of aftermarket vehicle collision replacement parts for $4800 per share in cash or $811m in total enterprise value The deal was the largest in the companyrsquos history
In October 2011 LKQ expanded into foreign markets with the acquisition of UK-based Euro Car Parts Limited this was followed by the April 2013 acquisition of Netherlands-based Sator Holding Using an acquire-and-build strategy to grow in Europe LKQ has become one of the largest European suppliers of mechanical aftermarket auto parts LKQ generated $41B of revenue in 2012 split 7232 between North America and Europe
LKQrsquos business strategy ndash and as later discussed the strategies of numerous other companies founded by the aforementioned and other former Waste Management executives ndash appears taken right out of WMrsquos old playbook The following slide provides a brief elaboration of Waste Managementrsquos strategy and significant events in relation to LKQrsquos founders
(1) International Directory of Company Histories Vol 71 St James Press 2005 17
18
Background ndash
Waste Management Inc 1968-1998
In 1968 Dean Buntrock and Wayne Huizenga (both LKQ founding backers) along with Lawrence Beck founded Waste Management (WM) In 1972 Donald Flynn (LKQrsquos founder) joined WM as CFO WM set out to consolidate the highly fragmented garbage hauling industry via an aggressive roll-up strategy By the time WM went public in 1971 it had acquired 133 garbage haulers and was generating gt$10m in revenue In the first 9 months of 1972 it had acquired another 133 firmsand generated FY 1972 revenue of $72m From 1971 to 1980 WMrsquos revenue grew at a rate of 48 per year reaching $656m in revenue in 1980 By 1986 WM had become the largest waste disposal firm in the world
Donald Flynn was given credit as the ldquofinancial geniusrdquo behind Waste Managementrsquos extraordinary growth from the 1970s to the early 1990s in a 1993 corporate history commissioned by the company
By the late 1980rsquos and early 1990rsquos WM had undertaken a botched international expansion in a push to become the worldrsquos first global lsquoenvironmental servicesrsquo company ldquoThat ambition led Waste Management to acquire a range of profit-draining businesses The eventual result was angry shareholders turmoil in the board room and a disruptive series of management purges and sudden resignations followed by revelations (in late 1997) of accounting irregularitiesrdquo
Buntrock remained as CEO until 1996 and Flynn as CFO amp director until 1989 amp 1997 respectively
From 1994 until 1997 a period at the heart of the perpetration of the fraud Donald Flynn was a Waste Management Audit Committee member the panel responsible for overseeing accounting policies and procedures and also served as Audit Committee Chairman during a period coinciding with the fraud
According to the SEC former WM CEO Dean Buntrock was ldquothe driving force behind the fraudrdquo and that ldquoHe was the primary beneficiary of the fraud and reaped more than $169 million in ill-gotten gains from among other things performance-based bonuses retirement benefits charitable giving and selling company stock while the fraud was ongoingrdquo
Additional source httpwwwsecgovnewsheadlineswastemgmt6htm
In 1997 a new CEO ordered a review of WMrsquos accounting practices The probe turned up a massive financial fraud that went undetected from 1992ndash1997 The fraud involved inflated asset values and profitability resulting in a $35B charge in 1998 and the largest financials restatement in history at that time SEC charges ensued
Background ndash LKQ Corporate Evolution
LKQ began in 1998 to roll-up wholesale recycled auto parts distributors (ie salvage yards) establishing a network of such businesses and serving the collision repair industry By 2003 it had become the largest provider in the fragmented recycled products market in the US
LKQ soon began diversifying through acquisitions of aftermarket recycled refurbished and remanufactured product suppliers and manufacturers and self service retail businesses
In October 2007 LKQ made a transformative acquisition in buying Keystone Automotive Industries Inc becoming the industryrsquos dominant distributor of both recycled and aftermarket products in the US Keystone is LKQrsquos largest acquisition to date costing $811m Keystone generated ~$730m in revenue in 2007 As a result of the acquisition LKQrsquos Parts and Services revenue split shifted from 7129 to 3961 recycled products vs aftermarket products
In 2008 LKQ entered the heavy-duty truck parts recycling industry through various acquisitions The heavy-duty truck parts recycling industry has operating and sales functions that are similar to the auto recycled parts business
In October 2011 LKQ made its third largest purchase in its history expanding to the United Kingdom with the acquisition of Euro Car Parts Holdings Limited (ECP) ECPs product offerings are primarily focused on wholesale automotive aftermarket mechanical products LKQ purchased ECP for a total consideration (including earnouts) of $432m ECP generated $5096m in revenue in 2011 and had grown revenue at a CAGR of 33 from 2009-2011 As of October 2013 ECP operated out of 138 branches supported by a national distribution center
In May 2013 LKQ made its second significant acquisition in Europe buying Sator Holding an automotive aftermarket parts distribution company based in the Netherlands with operations in the Netherlands Belgium Luxembourg and Northern France LKQ bought Sator for $272m (EUR 210m) Sator generated $374m in revenue in 2012 The acquisition expanded LKQrsquos geographic presence in the European automotive aftermarket products market into continental Europe
Sources LKQ 10-K for 2012 10-Q for Q2rsquo2013 2007 Investor Presentation httpwwwlkqcorpcomusenabout-usaspx 19
Acquisition of Keystone Automotive Results in Dominant Competitive Position as a US Aftermarket Parts Distributor
Recent International Expansion with 2 Large-Scale Acquisitions European Aftermarket Parts Distributors
Background ndash LKQ Business Overview
LKQ provides alternative auto parts used for vehicle repairs Alternative auto parts can be used in vehicle repairs in place of new branded auto parts made by vehicle manufacturers or ldquoOEMsrdquo
To be clear buyers of replacement auto parts have 5 options to choose when repairing their vehicles
1 New OEM parts ndash branded auto parts produced by vehicle manufacturers (ie ldquoOEMrdquo)
2 Aftermarket parts ndash new generic parts that were not produced by the OEMs LKQ sources the majority of the aftermarket parts it sells in North America from Taiwan and other Asian countries
3 Recycled products ndash used parts that were originally produced by OEMs LKQ sources its recycled inventories by buying salvaged vehicles at auction then disassembling them at its salvagejunk yards
4 Refurbished parts ndash used products that have been refurbished LKQ processes these from cores obtained from salvage vehicles
5 Remanufactured parts ndash used products that have been remanufactured LKQ processes them from cores obtained from its salvage operations
The value in using alternative parts in place of new OEM parts is that they have traditionally been less expensive
Source LKQ 10-K for 2009 and 2012 20
or any of the below alternative auto parts all of which LKQ provides
For example if you get into an accident and need to replace the vehicle bumper you have 3 options
1 Replace it with a new branded bumper manufactured by General Motors (ie a new OEM part)
2 Get a new generic bumper that was made in Taiwan (ie an ldquoaftermarket partrdquo)
3 Get a bumper from the junkyard (ie a ldquorecycled partrdquo)
Options 2 and 3 are examples of alternative parts There are others discussed below
According to its filings ldquoWe compete with the OEMs primarily on price and to a lesser extent on service and
qualityrdquo In essence LKQ sells nothing more than commodity products which we will show has a diminishing
competitive price value proposition Furthermore numerous customer complaints and an ldquoFrdquo Rating from the
Better Business Bureau (see Appendix) severely calls into question its service and quality performance
21
Background ndash LKQ Revenue Growth
Driven by APU
LKQ sells its products and services primarily to collision repair shops (ie lsquobody shopsrsquo) but insurance companies are its lsquoindirectrsquo de facto customer Pressure exerted by insurance companies on body shops to hold claims costs down by using alternative auto parts resulted in a 30 year-long rising trend in the market share for usage of alternative parts vs OEM parts in collision repairs This trend has been a core pillar of the LKQ growth story since it went public in 2003
This trend is measured by the ldquoAlternative Parts Usagerdquo (APU) or the percentage of total replacement part dollars spent on alternative parts vs OEM parts The APU has risen from 23 in 2000 to 37 in 2012 according to CCC Information Systems provider of the industryrsquos dominant estimate writing platform
LKQ has displayed a chart encapsulating this trend as a centerpiece of its growth story in all of its investor presentations spanning at least the past 5 years until recently the company has excluded it from all of its 2013 presentations As explained later in this report we believe this share shift has stalled and may reverse
Source LKQ 10-K for 2012 LKQ conference calls LKQ 2009 investor presentation
ldquoRecently CCC published their annual crash course publication The industrys average use of alternative parts for collision repairs increased by almost 300 basis points to 35 for 2009 from 32 in 2008 sharply accelerating from the decade-long trend we have seen of 100 basis points per year increaseshellip Reflecting the increase in APU demand for LKQs wholesale parts remain strong during the quarter Our first quarter organic revenue from the sale of parts and services increased 56 even with reductions in miles driven of 16 in January and 29 in Februaryrdquo
ndash Joseph Holsten LKQ Chairman Q1rsquo2010 Earnings Call (4292010)
European Business Growing as a
Percent of Consolidated Revenue
For the past 3 quarters LKQrsquos European Parts and Services business has demonstrated an organic growth rate gt5x that of its North America counterpart over this period Europe grew at an average rate of ~34 vs ~6 in North America
Fueled by organic and acquisition growth (including the relatively large purchase of Sator) as of 9312013 European Parts and Services Revenue had grown to 28 of consolidated revenue from 15 one year prior
(1) lsquoNorth Americarsquo amp lsquoEuropersquo categories represent geographic sources of Parts and Services Revenue
(2) lsquoOtherrsquo Revenue is comprised of sales of scrap metal and aluminum ingots and sows
(3) Revenue shares were computed by annualizing Q3rsquo2012 amp Q3rsquo2013 reportable category revenues
22
LKQ Organic Revenue Growth by Category Europe Growing in Terms of Revenue Contribution123
As of Q3rsquo2012 As of Q3rsquo2013
Organic Parts amp Services Revenue Growth by Geography
High-Level Indications of Fabricated
GAAP Profits Unsustainable Business
Model
LKQ is a classic roll-up fueling growth through acquisitions In the following slides we elaborate on our view that LKQ is an ineffective roll-up undeserving of its rich valuation By contrast an effective roll-up can create enormous value which warrants a rich PE
24
LKQ is a Roll-up Dynamics of
Roll-up Strategies
(1) Paul F Kocourek Steven Y Chung and Matthew G McKenna ldquoStrategic Rollups Overhauling the Multi-Merger Machinerdquo Strategy amp Business second quarter 2000
The bet underlying a rollup is that it can reduce costs and drive growth to create enormous value In fact kindling organic growth ndash driven by a superior value proposition ndash is particularly important as the pace of acquisitions begins its inevitable decline When all goes well we find a cycle of value creation that takes on a life of its own (refer to the figure at lower right)hellip The market rewards this kind of growth with a higher PE ratio which creates the currency for more acquisitions ldquo1
But Wall Street is littered with companies that have failed to properly effectuate it and that have over time destroyed vast amounts of shareholder wealth Among such companies are Waste Management (WM) and AutoNation (AN) In this report we elaborate on our view that LKQ with common backers very much resembles both companies
For example like LKQ AN set out to build a one-stop-shop establishing presence in all aspects of its markets ndash new and used auto sales auto rental and auto servicing It tried to consolidate a highly competitive low margin maturelow growth industry as such ANrsquos success was dependent on stealing market share from existing competitors Like LKQ it also had no ability to drive down its most basic cost ndash that of buying used cars it had to compete at auctions with other dealers to build its relatively huge inventory which depreciated in value at a very fast rate1 Using public capital it acquired hundreds of businesses It used a concerning acquisition accounting methodology pooling of interests (which is no longer allowed by GAAP) that likely inflated its reported earnings In its early stages it was a Wall Street darling ndash touted as a strong buy by sell-side analysts ndash and valued for perfection but reality caught up with its over- expansion and -extension into money-losing endeavors Over a 35 year period its market value of gt$12B fell by gt80 from peak to trough with shareholder losses exceeding $10B
Dynamics of an Effective Rollup
The roll-up strategy inherently flatters earnings and CFO metrics Roll-ups usually show both strong earnings and strong CFO (ie high earnings quality) due to the inherent financial statement mechanics of paying for growth through acquisition outflows (which do not affect earnings or CFO) Cash spent to acquire businesses runs through the Investing section of the Statement of Cash Flows so the acquirer is able to inherit a new CFO stream without any CFO outlay (ie working capital investment) Moreover as the acquirer liquidates the working capital of the acquired company in the normal course of business ndash collecting on receivables or selling inventory ndash it can realize an unsustainable CFO boost that has virtually nothing to do with the performance of its business
As such free cash flow after acquisitions is a key metric for analyzing roll-ups presenting a better picture of the businessrsquos economics In LKQrsquos case it demonstrates that LKQ is an ineffective consistently cash-degenerative roll-up LKQrsquos free cash flow after acquisitions has been negative in 8 of 9 years from 2004-2012 and is negative in the last twelve month period through September 30 2013 a cautionary sign that its strong positive CFO is not what it appears
25
LKQ Appears to be an Ineffective
Consistently Cash-Degenerative Roll-up
Adjusted Free Cash Flow is free cash flow after acquisitions (ie CFO ndash capex ndash acquisition outflows)
LKQrsquos Free Cash Flow Adjusted for Acquisitions LKQrsquos Earnings Quality lsquoAppearsrsquo High
26
High-Level Indications of Fabricated GAAP
Profits Unsustainable Business Model
Furthermore our analysis indicates LKQ may be engaging in aggressive accounting to engineer GAAP profits
Since 2007 LKQ has reported cumulative Earnings and EBIT of $1222m and $2153m respectively
Meanwhile it has burned cumulative free cash flow after acquisitions of -$1623m and raised cumulative net capital of $1625m suggesting it has never earned a cash-on-cash return on invested capital
Put another way the immense wealth generation represented by LKQrsquos historical GAAP profits is not observable in the companyrsquos cash flows ndash it appears to be lsquopaperrsquo wealth generated from accounting gimmickry and enabled by an aggressive roll-up strategy and accounting practices
Capital Raised = equity + net debt + option proceeds Adj FCF = CFO ndash capex ndash business acquisitions
LKQ Appears Increasingly Dependent on External Capital to Generate Any EBIT and Net Income
Reported North America Parts amp Services
Organic Revenue Growth Appears
Overstated Pricing Pressures Intensifying
28
North America (NA) Organic Growth
Appears Overstated
LKQ reported organic revenue growth averaging ~65 from 2008 ndash 2012 and ~6 in the 9 months ended 9302013 for its North America Parts and Services (PampS) business which accounts for ~75 of consolidated PampS revenue These growth rates do not appear reconcilable with trends in its primary driving fundamental factors or representative of LKQrsquos sustainable North America organic growth rate which we believe likely falls in the range of 0-2
Data for insurance claims paid for repairable accidents indicates no growth
Growth in market share of alternative auto parts relative to OEM parts (ie APU) which has risen for 3 decades and served as a primary driver of LKQrsquos organic growth flat-lined from 2010 ndash 2012 and may taper or reverse
For the first time replacement auto parts prices deflated in 2012 as competitive pressures intensified
Market share gains from alternative parts competitors are limited by LKQrsquos market dominance already owning 25-30 of the market market share is LKQrsquos to lose
LKQrsquos North American PampS organic growth rate also appears unhinged from growth rates reported by dominant companies in its primary end market For example the Boyd Group (TSX BYDUN) a large publicly traded multi-service operator in the North American collision repair industry has reported average same store sale growth of just 2 over the same period LKQ has reported organic growth of 65 While Boydrsquos results have shown significant cyclicality LKQrsquos results have been highly consistent and steadily positive ndash such patterns in an otherwise cyclical business are often a hallmark of companies over-concerned with meeting Wall Street estimates and financial transgressions
NA Organic Growth ndash Insurance Collision
Claim Payouts Are Not Growing
According to LKQ ~85 of all repairs are paid for by insurance companies in effect they are the ultimate payee for replacement auto parts
The total value of Insurance Collision Claims paid for Repairable Accident Claims (which excludes Total Loss data) has been stable at ~$28 billion over the past 5 years time This is the result of steadily increasing severity despite a downward trend in accidents and cars repaired
Per the table below the 5yr CAGR for total insurance claims paid for repairable accident claims is 0
29
Source The Romans Group LLC
30
OEM Price-Matching Programs Also Forcing
Aftermarket Auto Part Price Deflation
LKQ has historically benchmarked its prices against OEM parts prices which historically have risen 10 ndash 20 pa
ldquohellip maybe another way to look at that is that we typically price our parts based on new OE partshelliprdquo 1
ldquoWe track OE prices relative to what theyre doing They are still averaging consistently 15 to 2 increases though we tend to follow right on their heels When they raise were right behind themrdquo 2
Recently OEMrsquos have expanded their price-matching programs wherein they are matching alternative parts prices Theyrsquove set their sites on regaining market share previously lost to alternative parts suppliers by empowering their dealersrsquo parts departments to match aftermarket parts prices and are succeeding
We believe these programs have become widespread and much more pervasive than LKQ has led investors to believe
(1) Joseph Holsten former CEO on Q4rsquo2008 earnings call
(2) Robert Wagman CEO on Q3rsquo2011 earnings call
We believe that substantially in excess of 50 of collision parts by dollar amount are supplied by OEMs with the balance being supplied by distributors like us The OEMs are therefore in a position to exert pricing pressure in the marketplace We compete with the OEMs primarily on price and to a lesser extent on service and quality From time to time OEMs have experimented with reducing prices on specific products to match the lower prices of alternative products If such price reductions were to become widespread it could have a material adverse impact on our business
ndash LKQ 10-K for 2012 (Risk Factors)
31
NA Organic Growth ndash OEM Price Matching
Interview With Aftermarket Distributor
Prescience Point (ldquoPPrdquo) Can you describe whats been happening in the industry
Aftermarket Parts Distributor (ldquoAPDrdquo)1 The OEs dealerships are selling below their cost This is happening nationwide It started around 2008
PP How is it impacting aftermarket parts distributors
APD Its put 4 out of business within 200 miles of here and it put me out of business too So thats 5 out of 5 The only one left standing is LKQ
Its a really strange deal I called the 4 companies and asked them why they went out of business and they said it was because of the OEs matching their prices
They are being dis-intermediated by the OEMs Theyre not selling parts either By way of example The gentleman who runs (the local) LKQ-Keystone and I have been competitors ever since Ive been in business He started out w a company that LKQ bought out then he went to another company and LKQ bought them out and now he works for LKQ For this entire time weve been competitors Anytime Ive ever asked him about hows hes doing hes said lsquoWere doing great were just selling shit left and righthellip for about 18 years thats been his answer 3 weeks ago I called him and he says ldquoTalk to any one of my salespeople and they will tell you how badly weve been hurting If you want to know how bad it is talk to anyone of my salesmen we arent selling shitrdquo It was the first time hes ever in his life made a negative comment about his businesshellip
PP Do you think this will continue to impact LKQs ability to generate business in North America
APD If it continues it will put them out of business as far as aftermarket and salvage parts go
(1) ldquoAftermarket Parts Distributorrdquo is an owner of an aftermarket collision parts distributor
OEM Price Matching Interview With
Aftermarket Distributor (Contrsquod)
32
Prescience Point (ldquoPPrdquo) What would motivate the OE dealerships to sell products at a loss How can the dealerships take these losses
Aftermarket Parts Distributor (ldquoAPDrdquo) 1 Because the OEs are paying them (the dealers) back on their money making them whole and then giving them a 14 profit (on top of that)
I have a document that shows how this is happening This specific document relates to a doorhellip GM is telling its dealer to ldquoForget the dealer list price sell it 33 below Keystones list price Well give you all your money back plus a 14 profitrdquo LKQ cannot then step in and offer the part at the same price ($456) it wouldnrsquot be able to sell the part because the body shop prefers the OE part Body shops are happy because they are getting OE parts for aftermarket prices
PP LKQs investor presentation contains a slide demonstrating its lsquoClear Value Propositionrsquo They give specific examples For example a new OEM front door might cost $1300 vs a recycled OEM front door that would cost $800 for a savings of 40 So is that not the case for a new vs recycled products
APD If an insurance company writes the recycled part for $800 the OEM will sell its $1300 (dealer list price) part for $800 and give the dealership a 14 profit
PP The presentation also gives another example for an aftermarket product It says a new OEM fender might cost $200 but an aftermarket fender sells for $160 for a 22 savings Same thing there The OEM will match that price
APD Same deal the dealer will sell it for $160 GM reimburse them for their $40 loss and give them a 14 return on top of that
(1) ldquoAftermarket Parts Distributorrdquo is an owner of an aftermarket collision parts distributor
33
LKQrsquos Only Competitive Advantage is Pricehellip
GMrsquos Price Matching Designed to Thwart LKQ
Keystone List Price
OEM price-match 33
discount from Keystone
Price (Keystone list has
generally been 20-25
less than OEM OEM is
now undercutting
Keystonersquos price by 33)
GM reimburses dealer
for loss on part cost
GM pays dealer 14
return on part cost
We have sourced an internal GM dealer document detailing its price-matching program ldquoBump the Competitionrdquo We are told it specifically targets LKQ-Keystone GM subsidizes dealers to sell parts (in this case a fender and a door) at levels 33 below aftermarket list prices makes them whole on the loss and pays the dealer an additional guaranteed 14 profit on the cost for the part
Source Felders Collision Parts Inc v General Motors Company et al Complaint Exhibit 4 filed 10122012
34
GMrsquos ldquoBump The Competitionrdquo Directed
at Outcompeting LKQ Retaking Lost Share
Launched in 2009 the ldquoBump the Competitionrdquo program from General Motors was designed to capture share of the aftermarket by lowering the price of its OEM replacement parts relative to the competition The initial rebates took the form of fast cash Visareg Award Cardshellip
httpwwwgmrepairinsightscomwp-contentuploads201304Repair-Insights-Q2-2013pdf
httpgmbtccaloginphp
wwwgenuinegmpartscom
35
OEM Price Matching Programs Date to 2009
GM Expanded its Programs in 2013 to Be Even
More Price Competitive Applied to More Parts
Source httpwwwgmlamcomguidelinespartsconquest_bulletinpdfSource Felder Collision Parts Inc vs General Motors Company et all 101212httpwwwmcmlspcomsandboxpodmock2431CollisiontoolsBTC_Calculator_010109v1axls
GMrsquos push to Bump the
Competition Dates back to
2009 amp Recent Evidence it has
become ldquoMore Price
Competitiverdquo
36
Mazdarsquos ldquoCollision Parts AdvantageTMrdquo
Program Also Directed at Displacing LKQ
Launched in 2011 the ldquoCollision Parts AdvantageTM rdquo program was launched by Mazda to warn its customers that aftermarket Like Kind and Quality are generally of lower quality than certified OEM parts The program offers its customers and chosen repair shops the choice to use its OEM parts with a price matching guarantee
httpwwwmazdaserviceinfocomPDFsCollision20Parts20Advantagepdf
OEM Price-Matching
APU Has Flat-Lined Likely to TaperDecline
The OEMs are aggressively reclaiming market share by competing away LKQrsquos price advantage ndash the prime basis of its value proposition Their efforts have successfully halted the three decade-long trend of steadily increasing APU CCC Information Services provider of the dominant estimate-writing platform indicates APU has leveled off over the past 3 years and the share shift may reverse CCCrsquos assessment is that a decline or tapering in APU is likely to materialize
A rising APU was a primary driver of LKQrsquos organic growth We note that every single LKQ investor presentation we have studied dating back to 2007 has given prominence to a slide displaying the decade long trend in APU For the first time ever LKQ has chosen to exclude this slide from its 2013 presentations We believe this change is a tacit admission that this metric no longer figures into the companyrsquos lsquogrowth storyrsquo
Sources LKQ Third Quarter 2012 Investor Presentations CCC Crash Course 2012
37
Collision Replacement Products Market Shift
APU has flat-lined
The Autumn Update to Crash Course 2011 included a discussion on the impact of the aging fleet on parts utilization and showed that the increase in industry-wide non-OE part utilization was driven in large part by the growing share of older model year vehicles where non-OE parts availability is higher As consumers begin to purchase more new vehicles and as more manufacturers provide price-matching programs for their dealers non-OE share of parts dollars (ie APU) will likely taper or decline
ndash CCC Crash Course 2012 published on 372012
38
LKQ Appears To Be Deceiving Investors
About the Current APU Problems
According to CEO Robert Wagman on the Q3rsquo2011 earnings call LKQ claims APU rose from 37 to 38 in 2012
Its own data source refutes that claim As its source for APU data communicated in conference calls and investor presentations LKQ cites the annual results released by CCC Information Services Per Robert Wagman on the Q3rsquo2011 earnings conference call
Discussion What LKQ Tells Investors What LKQrsquos Data Source Says
Alternative Parts Usage (APU) rate
Source Q312 conference call on 10252012 --As mentioned on previous calls we were confident that the historical trend of 100 basis point improvement in alternative part usage would continue in 2012 And today I am pleased to announce that that goal (for a 100 basis point improvement in APU in 2012) was achieved through the end of the third quarter According to CCC Information Services APU now stands at 38
Source CCC Crash 2012 Fall Update published 10172012 --The percent of the total dollars spent on replacement parts that were OEM was essentially flat year-over-year 632 percent at mid-year 2012 versus 631 percent at mid-year 2011(ie From mid-year 2011 to 2012 APU fell from 369 to 368)
CCC Crash Course 2013 report published 3282013 --At the close of 2012 the industryrsquos share of replacement part dollars was split at 63 percent OEM versus 37 percent non-OEM
Assessment of Trend in APU
Source Q312 conference call on 10252012 --As we enter the last quarter of 2012 and prepare for 2013 our outlook continues to be positive Im encouraged by the trends in miles driven the continued growth in APU the recent reduction in vehicle pricing at auctions the strength of Euro Car Parts and the robust pipeline of acquisition opportunities we are witnessing
CCC Crash 2012 Crash Course published on 372012 --The Autumn Update to Crash Course 2011 included a discussion on the
impact of the aging fleet on parts utilization and showed that the increase in industry-wide non-OE part utilization was driven in large part by the growing share of older model year vehicles where non-OE parts availability is higher As consumers begin to purchase more new vehicles and as more manufacturers provide price-matching programs for their dealers non-OE share of parts dollars (ie APU) will likely taper or decline
ldquoAs mentioned on previous calls we were confident that the historical trend of 100 basis point improvement in alternative part usage would continue in 2012hellip According to CCC Information Services APU now stands at 38hellipAs we enter the last quarter of 2012 and prepare for 2013 our outlook continues to be positive Im encouraged byhellip the continued growth in APU helliprdquo
ldquohellip we only get the annual results from the estimating company as to whats happening to the APU trendhelliprdquo
NA Organic Growth ndash APU
LKQ Appears to have Deceived Investors
What LKQ Tells Investors
In its March 2013 Investor Presentation LKQ
claims that APU had reached 38 in
accordance with previous guidance
Sources LKQ 10-K for 2012 March 2013 Investor Presentation (Raymond James 34th Annual Institutional Investors Conference)39
What LKQ Says in its SEC Filings
We believe however that as the insurance
and repair industries continue to recognize
the advantages of aftermarket recycled
refurbished and remanufactured products
the alternatives to new OEM replacement
products will account for a larger percentage
of total vehicle replacement product sales
Since 2008 alternative parts usage has
increased from approximately 32 to
37 of the collision replacement product
market We compete with OEMs on the
basis of price service and product quality
Even as it tells investors APU rose 100 basis points in 2012 LKQ contradicts itself in its own filings with the Securities and Exchange Commission which report that APU did indeed not rise
40
OEM Price-Matching
Parts Price Deflation Began in 2Hrsquo2012
The expansion of OEM price-matching programs have become so expansive that they drove deflation in parts prices in 2012 Industry data source Mitchell International reported a decrease in the indexed price of vehicle parts for its market basket for the first time in the 10 years Mitchell International has been collecting data
Prices began deflating in the second half of the year it is clear that the OEMs are expanding their price matching programs to cover more parts and that the programs are being implemented by more and more dealers
Source Mitchell Industry Trends Report Q2 2013
ldquoFor the first time we saw a decrease in the indexed price for the market basket Loyal readers of the Industry Trends Report will see that the 2012 decrease was not evident when we ran the index report early in 2012 so the decrease was in the latter half of 2012hellip The domestic vehicle parts market basket experienced such a decrease that it offset the moderate increases in the Asian and European market baskethellip So what we are seeing is the impact of the expansion of the competition parts price matching programs from the domestic OEs driving the decrease in the overall indexhelliprdquo
ndash Mitchell Industry Trends Report Q2 2013
41
OEM Price-Matching (Contrsquod)
Parts Price Deflation Began in 2Hrsquo2012
gt50 of LKQrsquos consolidated revenues are generated from the sale of aftermarket parts
According to CCC Information Systems aftermarket parts deflated by 24 in 2012
ldquoBetween 2011 and 2012 hellip the average price paid per replacement part fell by 03 percent Average price paid per replacement part varied by part type with reconditioned parts increasing 20 percent aftermarket parts decreasing by 24 percent and recycled parts increasing 08 percentrdquo
ndash CCC Crash Course 2013 report published 3282013
Source CCC Crash Course 2013
42
State Farm Insurancersquos New PartsTrader
Platform to Drive Even More Pricing Pressure
wwwpartstraderuscom
Insurance companies exert significant influence in the vehicle repair decision since they ultimately pay for the majority of collision repairs of insured vehicles Therefore they are incentivized to drive auto parts prices as low as possible to maximize their profits
In May 2013 State Farm Insurance the largest US auto insurer confirmed the end of the pilot phase and a national rollout of PartsTrader an electronic ordering system to its Select Service direct repair facilities The national roll-out is expected to be completed by 2014
PartsTrader is a web-based collision replacement parts market connecting OEM aftermarket remanufactured specialized and recycled automotive parts suppliers with collision repairers looking for replacement parts
As an online competitive marketplace designed to allow collision shops to make better procurement decisions with information on part quality delivery time supplier reputation and prices PartsTrader is expected to drive more competition amongst alternative parts distributors lowering auto parts prices and serving as another blow to industry organic revenue growth
httpwwwfenderbendercomFenderBenderMay-2013State-Farm-Initiates-PartsTrader-Expansion
43
NA Organic Growth ndash
Not Reconcilable w End Market Growth
LKQrsquos reported NA Parts and Services organic growth rate also appears unhinged from the growth rates reported by companies in its primary North American end market collision repair shops
For example Boyd Group (TSX BYDUN) is a Canada-based company that is consolidating the USCanada collision repair industry as a multi-service operator (MSO) Boyd has 228 locations in five Canadian provinces and 14 US states
According to the Romans Group LLC Boyd is a player in the fastest growing segment of the collision repair industry and is outperforming its peers in that segment1 Specifically
Boyd is a part of ldquothe $20+ million US collision repair segment (which) continues to grow market share and brand relatively faster than other segments of the collision repair industryrdquo and
Boyd has significantly grown its market share relative to the other top $20mm+ operators since 2006
(1) A Profile of the Evolving Collision Repair Marketplace Parts 1 amp 2 The Romans Group 2012
LKQrsquos NA Organic Growth is Too Predictably
Positive and Smooth in a Cyclical Industry
The significance in disparity between LKQ and Boydrsquos organic growth rates defies logic Boyd Group ndash again an outperformer amongst collision repairers ndash has reported organic growth of 2 on average since Q1rsquo2009 with significant variability in its growth rate (61 standard deviation) and has reported negative growth in several quarters on the other hand LKQ has reported organic growth in Parts and Services of 70 on average over the same time period with relatively little variability in its growth rate (standard deviation of just 18) and has never reported a period of negative organic growth
Note that LKQ changed its reporting of organic growth categories on 3313 As a result this analysis runs through 123112 for the purpose of presenting a fair apples-to-apples comparison 44
Source LKQ Press Release Source Boyd Group Press Releases
LKQ Quarterly Parts and Services Reported Organic Growth Rate SSS Growth - Boyd Group - Multi-Service Operator of Collision Repair Shops
00
20
40
60
80
100
120
-100
-50
00
50
100
150Average 20Std Dev 61
Average 70Std Dev 18
The European ldquoGrowth Fantasyrdquo ndash
Short-Term Decision-Making Signals
Desperation to Keep Financials Inflated amp
Meet Guidance Targets
Euro Car Parts ndash
LKQrsquos Largest Contributor to Organic Growth
In Q4rsquo2011 LKQ began expanding into Europe Its acquisition of UK-based Euro Car Parts (ECP) a distributor of mechanical aftermarket parts was made ndash and this was never disclosed by LKQ ndash as the UK aftermarket industry was significantly contracting (which is projected to continue) amounting to a high risk gamble using shareholder capital At the time of purchase ECP operated out of 89 branchstore locations and opened an average of 10 new branches per year in the period 2007-2011
LKQ pitched the purchase primarily as an open-ended opportunity to replicate its North American success
in Europe by driving APU ndash currently at 5 in the UK vs 37 in the US ndash for collision repairs
We believe LKQ is operating ECP to inflate its financials and meet guidance targets at the long term
shareholder expense of entrenchment in a contracting market which will result in a new financial hole
LKQ will predictably seek to plug with more acquisitions (which it has already begun making)
46
Euro Car Parts ndash
LKQrsquos Largest Contributor to Organic Growth
History of Acquisition In October 2011 LKQ acquired Euro Car Parts (ECP) a leading distributor of mechanicalaftermarket parts in the UK for a total of ~$432m (including the paid in full performance-based contingent component) ECP was founded by Sukhpal Singh Ahluwalia who today serves as Chairman of LKQ Europe
LKQ reported that ECP had grown revenue at a CAGR of 30+ from 2009-2011 it generated 2011 revenue of $523m equating to ~15 of LKQ sales
At the time of purchase ECP operated 89 branch locations and opened an average of 10 new branches per year in the period 2007-2011
LKQ pitched the acquisition as
a) an opportunity to continue expanding ECPrsquos branch network and
b) an open-ended opportunity to drive alternative part usage (APU) for collision repairs in the UK ndashwhere APU is ~5 (vs 37 in the US) ndash by educating insurers about the value proposition of alternative parts Per Chairman Joseph Holsten on the October 4 2011 ECP acquisition call
ECP is LKQrsquos single largest driver of reported organic growth LKQ reported ECPrsquos organic growth rate to be 30+ beginning in Q4rsquo2012 and in each quarter since
47
ldquohellip the opportunity is that whereas APU in the United States has moved from really even a sub-20 level when we first formed LKQ to 37 last year the UK market today stands at 3-7 APU utilization raterdquo
ECP ndash 30+ Organic Growth in a
Contracting Industry
In its investor presentations LKQ cites ECPrsquos growth rate and the potential to increase collision-repair APU to imply the acquisition presents a new doorway for growth It cites Datamonitor Group as its source for sizing the expansive UK aftermarket parts industry an lsquo$18bn marketrsquo
LKQ never mentioned that according to the same source (Datamonitor Group MarketLine) the UK aftermarket parts industry was in significant contraction at the time LKQ acquired ECP According to Datamonitorrsquos February 2012 publication the UK industry was expected to contract in 2011 by -58 and is projected to continue contracting
How can a UK-based distributor of aftermarket auto parts regularly report lsquoorganic growthrsquo exceeding 30 as the industry around it is contracting
48
ldquoThe United Kingdom automotive aftermarket sector shrank by 58 in 2011 to reach a value of $172595 millionhellip In 2016 the United Kingdom automotive aftermarket sector is forecast to have a value of $168771 million a decrease of 22 since 2011rdquo
ldquoThe UK automotive aftermarket sector entered a period of decline from 2008 through to 2011 The sector is expected to continue to recover with marginal growth in 2012 before falling into decline once again from 2013 through to the end of the forecast period in 2016rdquohellip It contracted at a ldquocompound annual rate of change (CARC) of -35 between 2007 and 2011rdquo
ldquoThe performance of the sector is forecast to decline further with an anticipated CARC of -04 for the five-year period 2011-2016 which is expected to take the sector to a value of $168771 million by the end of 2016rdquo
ndash Datamonitor MarketLine Automotive Aftermarket in the United Kingdom February 2012
ECP ndash
lsquoOrganic Growthrsquo That Isnrsquot Really lsquoOrganicrsquo
LKQ doesnrsquot define ECPrsquos lsquoorganic growthrsquo in the way investors might expect for a business characterized by sales originating at storefronts for which lsquoorganic growthrsquo would be represented by a same store sales growth
LKQ treats ECP revenue from stores existing for gt1 year and revenue from stores opened during the year as organic revenue1
As such its reported organic growth rate is fueled by opening new ECP branches and the more new branches it opens in a given period the more it can inflate the reported organic growth rate
Because ECP is in the midst of a rapid branch expansion it is able to report lsquoorganicrsquo growth of 30+ even as the broader UK aftermarket parts industry contracts
While ECPrsquos reported growth rate sheds light on the companyrsquos size in comparing data that are fundamentally incomparable it provides little information on the performance and health of its existing branch network Further it obscures LKQrsquos consolidated organic growth metric LKQ uses a different standard for reporting its North America organic growth which according to management only includes salvage yards open and within the system for a year In essence the company is mixing two different measurement approaches and potentially misleading investors
(1) LKQ Earnings conference call for Q2rsquo2012(2) Q3rsquo13 earnings release
49
2
Different measurement approaches
Yet each described as
lsquoOrganicrsquo
50
Throughout 2012 LKQ repeatedly raised guidance for the number of 2012 branch openings from 20 to 30 to 42 ECP has also repeatedly raised guidance for the maximum number of full-sized ECP branches the UK market can absorb from 100 to 120 to 150 to 175 to 200 giving itself more and more room to continue ramping the number of branch locations As demonstrated in the pages to follow these revisions were made with the purpose of meeting PampS revenue growth guidance
The table below summarizes LKQrsquos repeated revisions of guidance for the number of branches to be opened per period and for the maximum number branches the UK market could absorb The slides to follow detail these revisions
SourceGuidance for New
ECP Branch OpeningsGuidance for Maximum ECP Branches UK market could
absorbArticle in The Telegraph
(4212009)90 to 100 total ECP branches to give presence across the UK
ECP Acq call (1042011) 10-12 per year
Q4rsquo2011 earnings call (2232012)
Guidance for 2012 20 openingsChange vs prior guidance +10 openingsTotal store count if guidance met 110 branches
120 full sized branches + 15 satellites
Q1rsquo2012 earnings call (4262012)
Revised guidance for 2012 30 openingsChange vs prior guidance +10 openingsCumulative change vs initial guidance +20 opensTotal store count if guidance met 120 branches
2013E guidance 20-25 openings
150 full sized branches + 25 satellites(175 total)Change vs prior guidance +40
Q3rsquo2012 earnings call (10252012)
Revised guidance for 2012 42 openingsChange vs prior guidance +12 openingsCumulative change vs initial guidance +32 opensTotal store count if guidance met 132
150 full sized branches + 25 satellites(175 total)
Q4rsquo12 earnings call(2282013)
Guidance for 2013 10 openings Change vs prior 2013 guidance -10 openings Total store count if guidance met 142
150-175 full sized branches + 25 satellites(175-200 total)Change vs prior guidance +25Cumulative change vs initial guidance +65
Q1rsquo2013 earnings call(4252013)
Revised guidance for 2013 15 openings Change vs prior 2013 guidance +5 openingsTotal store count if guidance met 147
Q2rsquo2013 earnings call(812013)
175-200 full sized branches + 25 satellites(225 total)Change vs prior guidance +25Cumulative change vs initial guidance +90
Short-Term Decision-Making Signals Desperation
to Keep Financials Inflated amp Hit Guidance
51
In an article published by The Telegraph on 4212009 ECP founder (currently Chairman of LKQ Europe) Sukhpal Singh Ahluwaliastated that he thought ECP could have a total of 90-100 branches ldquogiving it a presence across the UKrdquo
On the October 2011 conference call detailing the ECP acquisition LKQ told investors it had a plan to open 10-12 branches per year for the next few years At that time LKQ appeared more focused on the opportunity to grow collision repair APU in the UK
On the Q4rsquo2011 earnings call LKQ raised the number of branches it had planned to open to 20 in 2012 LKQ stated that the UK could support a total of 120 full-sized stores and 15 smaller lsquosatellitersquo stores so ldquowhen were all said and done we could be in the 135 rangerdquo
SourcePlans for New ECP Branches
Guidance for Maximum ECP Branches UK market could absorb
Article in The Telegraph (4212009)
Sukhpal Singh (from The Telegraph article Sukhpal Singhrsquos Next Goals for Euro Car Parts)I think we could increase to 90 to 100 branches We need to have a presence across the UK
ECP Acquisition Call (1042011)
Robert L WagmanYes we -- right now Craig we have a plan to grow 10 to 12 branches per year for the next few years -- for the upcoming years to complete out the major UK markets major markets that theyre in
Q4rsquo11 Earnings Call(2232012)
Given the market opportunities in the UK and the attractive unit economics at ECPs locations we anticipate ramping up our total branch openings for 2012 to roughly 20
Craig R KennisonRE ECPhellip what do you think that market the UK market can support long-term in terms of the number of stores that you operate
Robert L WagmanWe think the right number is going to be somewhere around 120 Craig to fully develop the network So we think well be at 20 by the end of this year As far as the what the market -- the overall market 120 seems to be the number what well also do is open some satellite stores They wont be full branch stores to support some of the remote areas of the UK So I think when were all said and done we could be in the 135 range
Short-Term Decision-Making Signals Desperation
to Keep Financials Inflated amp Hit Guidance
52
On the Q1rsquo2012 LKQ announced an increase in anticipated store openings to 30 in 2012 which would result in a total of 120 stores (the previously stated market saturating count) Furthermore it announced plans to open another 20-25 stores in 2013 which would take the total number of stores to 140-145 well beyond previous guidance for UK market saturation It followed by raising the ceiling on the number of stores the market could absorb to 150 full-sized stores and 25 satellite branches (175 in total) which would seem to indicate branches in major metropolitan areas being ldquo5 miles or so apartrdquo(akin to a Starbucks model) LKQ would continue to raise from this level the maximum number of stores the UK could absorb
On the Q3rsquo2012 earnings call for the 3rd time LKQ revised higher guidance for the number of branch openings planned to 32 for 2012 (from initial guidance for 10-12) which would make for 132 branches in total LKQ also stated ldquoWeve said we believe the total store count is going to be somewhere around 150 to 175rdquo
SourcePlans for New ECP Branches
Guidance for Maximum ECP Branches UK market could absorb
Q1rsquo12 Earnings Call(4262012)
And due to favorable market conditions and ECPs managements proven ability to effectively and efficiently open branches we anticipate accelerating new branch openings to 30 in 2012 which is 10 more than the 20 we were anticipating on our last call
Robert L WagmanSo we believe well get to roughly 120 locations by the end of this year if all goes to plan We want to add probably another 20 or 25 next year which adds to about 150
Unknown AnalystWould you tell us just a little bit there about ECP and talk about the footprint I mean with the growth expansion-- if you look at how far these are apart any chance of cannibalizing in those markets
Robert L WagmanhellipWe think that surely branches in major metropolitan areas can be 5 miles or so apart So theres not necessarily cannibalization its just better service for the customershellip And then on the last call we talked about these ancillary locations not full sized branches Our average branch over there is a 10000-square foot branch These would be smaller offshoots in more rural areas That may be another 20 to 25 locations So when this is all said and done well be at about roughly 175 locations in the UK Cannibalization there is a slight -- when you put one 5 miles apart from each other we do move some of the revenue from one branch to the other Butagain because of the better service levels we can provide we do see an uptick in the revenue pretty quickly
Q3rsquo12 Earnings Call (10252012)
During the quarter we opened 10 new branches in the UK bringing our total branch count to 120 Since the acquisition of ECP in early October 2011 we have opened 31 branches surpassing the target number of 30 I mentioned on the last call Given that market conditions in the UK combined with the continued success of ECP we have approved an additional 12 new branch openings for the fourth quarter bringing our total target to 132 branches by year-end
John R LawrenceRob would you take a -- if you look at ECP overall out for the next 12 to 18 months -- how do you look at allocating CapEx dollars Obviously youre doing that with some more stores but longer term that marketplace -- the viability to spend more capital over there
Robert L WagmanWeve said we believe the total store count is going to be somewhere around 150 to 175 We believe that number is still to be true And in fact we may actually be able to go a little bit above 175 with those satellite stores to feed the more remote areas
Short-Term Decision-Making Contrsquod
53
On the Q4rsquo12 call LKQ indicated that the 12 stores opened through January 2013 were pulled forward from the 25 it had projected to open in 2013 and that it would take a break from opening new stores until Q2rsquo2013 at which point it could have evaluated the progress of the newly opened stores There was a deceptive change in language in guidance for possible total store count calling for 150-175 full sized branches andan additional 25 satellites (200 in total) (Recall that on the Q1rsquo12 call then reaffirmed on the Q3rsquo12 call they guided that the market could absorb to 150 full-sized stores and 25 satellite branches (175 in total)
On the Q1rsquo2013 earnings call LKQ announced plans to open another 15 in Q3 and Q4 2013 which would make for a total of 147 ECP branches (against initial guidance that the UK could absorb 120)
On the Q2rsquo2013 call in August 2013 LKQ again raised the limit on its estimate for the total number of stores the UK could absorb to 175-200 full sized branches (from 150-175 before that 150 before that and 120 before that)
Then on November 12 2013 in a press release announcing ECPrsquos founder had been promoted to serve as chairman of LKQ Europe he stated ldquoThe UK alone will have 200 Euro Car Parts branches within three yearsrdquo
SourcePlans for New ECP Branches
Guidance for Maximum ECP Branches UK market could absorb
Q4rsquo12 Earnings Call(2282013)
Robert L WagmanDuring the fourth quarter we opened 10 new branches and we opened 2 additional branches in January bringing our total branch count to 132hellip hellipWith the 12 we did in Q4 originally scheduled for 2013 so we pushed them in 2012 So as John said were going to reevaluate this in Q2 but I would expect if we feel comfortable well add another 10 in 2013 to fill up to get to 142 with still some growth for 2014 and 15 as well
Robert L WagmanhellipWere still standing by our projections of 150 to 175 what we call Tier 1 ECP locations and an additional 25 or so Tier 2 the smaller or remote markets
Q1rsquo13 Earnings Call (4252013)
Now turning to Euro Car Parts We continue to be impressed with the performance of Euro Car Parts and its ability to capture market share In Q1 ECP achieved strong organic revenue growth of 321 With the continued performance in ECPs financial results and the strength of ECPs management team I am pleased to announce that we have approved an additional 15 new branches for 2013 that are scheduled to open in the third and fourth quarter of this year
Q2rsquo13 Earnings Call(812013)
John S Quinnhellip Weve targeted 15 for the balance of this year That will take us up to circa 147
John S Quinn We think the right number is probably somewhere in 175 to 200 for what we consider a full branch and then there will be some satellite opportunities in addition to that Over time as we grow that were going to have to look at the infrastructure associated with that regional hubs and the 2 main central hubs
LKQ PR announcing leadership change
Sukhpal Singh Ahluwalia lsquoI have never been more hungry excited or determined to maximise our potential for the next decade and beyond The UK alone will have 200 Euro Car Parts branches within three years and we have ambitious targets for paint collision parts and e-commercersquo
Short-Term Decision-Making Contrsquod
12282012 Right before 2012 Yr End ldquoOur Biggest Sale Ever Up to 45rdquo We have a Sale on at the moment where you can save up to 45 off on Car Partsbut it doesnt last long - must end midnight 1st Jan so hurry
8162012 rdquoMid Month Madness 30 off Car Parts Selected Car Partsrdquo Owning to popular demand (everybody likes a big juicy discount) ndashwersquove decided to bring the big daddy back ndash yes thatrsquos 30 off Car Parts as well as ALL Engine oils
9272012 Right before Q3rsquo12 Ended ECP ran a promotion ldquoThe Boss is Away 31 off Promo Code InsidehellipEnds Sundayrdquo Our biggest ever discount offered on almost ALL car partshellipcash in before the boss is back
bull In 2012 ECP started heavy price discounting of parts across the board Most discounts touted up to 30 off often on all products sold By the end of the year the savings discounts reached up to 45 off
bull Many of these sales appeared right at the end of the quarter in what appears to be an attempt to juice results ahead of reporting to investors
httpwwwgolfgtiforumcoukindexphptopic=2361380 httpwwwgolfgtiforumcoukindexphptopic=2386450 httpwwwgolfgtiforumcoukindexphptopic=2461350
Short-Term Decision-Making Steep
Discounting to Hit Numbers in 2012
54
5242013 ndashrdquoThe Online Bank Holiday Sale Up to 50 Off Everythingrdquo
ldquoItrsquos BACK again ndash Up to 50 OFF EVERYTHING No promo code required Must End Midnight Monday 27th Mayhelliprdquo
9272013 Before the end of Q3rsquo13
ldquoEnd of Summer Clearance up to 50 off Everything Onlinerdquoand you donrsquot need a promo code as current prices reflect the discount by defaultrdquo
3282013 Before the end of Q1rsquo13
ldquoOur Biggest Ever Sale ndash Up to 50 off Everythingrdquo
55
httpwwwgolfgtiforumcoukindexphpPHPSESSID=rffknoatjiinf0n2nuhh828uv6amptopic=2512620
httpwwwgolfgtiforumcoukindexphpPHPSESSID=rffknoatjiinf0n2nuhh828uv6amptopic=2542750
httpwwwgolfgtiforumcoukindexphpPHPSESSID=rffknoatjiinf0n2nuhh828uv6amptopic=2598690
In 2013 discounts increased noticeably from 30 to upwards of 50 off Each promotion is touted as its ldquobiggest sale everrdquo ECP has continued its practice of running promotions right towards the end of the quarter
Not one time has LKQ attributed such discounts as a driver of its persistently declining gross margin
With Even Bigger Promotions in 2013
On the Q4rsquo2011 call (22312) LKQ guided for 20 stores to be opened in 2012 and guided for
2012 Parts and Services organic revenue growth 55-70 (Guidance for PampS organic
growth includes the impact from anticipated ECP store openings)
On the Q1rsquo2012 earnings call (42612) guidance was revised lower to 50-70 even as
LKQ raised the number of anticipated 2012 store openings by +10 to 30 indicating the
intent to make up for unanticipated weakness in North America with new branch
openings LKQ stated that in order to meet 2012 guidance certain anticipated tailwinds
would have to materialize specifically stating APU would likely rise from 37 to 38
On the Q3rsquo2012 earnings call (102512) LKQ raised the number of anticipated 2012 store
openings by +12 to 42 and raised the lower end of the range for organic growth by 50bp to
60-70 In Q3 the opening of new ECP branches alone accounted for 40 of Parts and
Services organic growth
The increase in the number of stores openings during Q4rsquo12 resulted in ECP growing to
account for 75 of LKQrsquos Q4rsquo2012 PampS organic growth by our estimates enabling it to
report 6 organic revenue growth and meet the low end of the guidance range
In sum LKQ stated a reliance on APU rising to 38 to meet the initially released 2012
guidance levels although LKQ appears deceptive with investors in claiming this APU target
was met the data released by its information source refutes its claims reporting that at the
end of 2012 APU was 37 unchanged from 2011 This left LKQ reliant on other sources of
organic growth to meet guidance
In 2012 LKQ juiced its organic growth rate by opening double the number of ECP
branches initially guided for indicating LKQ made strategic decisions related to ECP
openings at the expense of long-term value creation to inflate its financials and hit
guidance 2012 guidance for organic revenue growth 56
ldquoWe included in the internal growth and the earnings guidance the new ECP locations opened to date and planned for the balance of the year Rob mentioned that we plan to increase the number of branch openingshellip To reach our guidance were obviously assuming that the rest of the year gets better and we do think there are some tailwinds to help us in that regard In 2011 we saw alternative part usage rate in the industry of 37 Based on what were seeing in the market today we believe that in 2012 well see that rate increase to at least 38
How Did This Play Out In Pacifying
Wall St Estimates
ECP ndash lsquoOrganicrsquo Growth Contribution to LKQ
Parts and Services Org Growth is Now gt50
ECPrsquos reported organic growth rate has grown to account for gt50 of LKQrsquos consolidated Parts and Services organic growth rate
ECPrsquos organic growth rate is a short-term phenomenon
As ECPrsquos reported organic growth rate begins to fall and converge with the industry rate of growth it will result in yet another large financial hole LKQ will predictably seek to plug
(1) Q2rsquo2013 ECP SSS adjusted for 2 extra selling days SSS provides little insight as it is inflated by the revenue ramp of newly opened branches which take 3 years to mature
(2) NA organic growth contribution is a PP estimate imputed by backing out organic growth from ECP from reported Parts and Services organic growth 57
ECP Reported Organic Sales Growth1 ECP Contribution to Parts and Services Organic Growth2
PP model Uses 2006 as anchor year and is based on the number of per year ECP branch openings since 2006 and our projection of store builds through 2016 which reflects LKQrsquos Europe Chairmanrsquos expectation of 200 stores within 3 years Assumes that at maturation each store generates $54m ECPrsquos average reported revenuestore in the period 2010-2012 ECP generally experiences the most significant growth benefit from a new branch in the year of first generating sales and benefits continue to accrue through a 3 year store maturation period (LKQ earnings conference call for Q3rsquo2012)
ECP ndash lsquoOrganicrsquo Growth Rate Unsustainable
Driven by Accelerated Store Expansion
ECP had a total of 89 branches when LKQ bought it in October 2011 and had opened an average of 10 new branches per year from 2007-2011 In 2012 alone LKQ opened 40 new branches In just 2 years at 9312013 LKQ had 138 total branches and intends to have 200 by the end of 2016
The chart to the right below contains a simulation approximating the revenue build and growth rate for ECP that would result solely from opening new ECP branches The levels of organic growth projected by the estimated growth rate trend are reflective of the levels reported by ECP (after taking into account that our simulation understates ECPrsquos reported growth rates in its earlier periods due to assuming no new stores were opened in 2006 and prior) As such we believe ECPrsquos growth is almost entirely explained by branch openings as opposed to same store sales growth for matured (ie gt3 years old) branches a result we would expect given the industry may be contracting
This means that as ECP approaches its market saturating goal of 200 total branches its reported organic growth rate will plummet converging to the industry rate of growth ndash which is negative
58Historical Data from ECP 2009 Annual Report amp the ECP Heritage webpage
2014-2016E from ldquo200 Euro Car Parts branches within three years ldquo
ECP Current and Projected Store Base Simulated ECP Growth Solely from New Branch Openings
LKQ appears to operate ECP with the primary intent of unsustainably inflating its financials and meeting guidance targets at the long term shareholder expense of entrenchment in a contracting market We believe the result is predictable A new financial hole will be left in the wake of a slowdown of in ECP branch openings that LKQ will seek to plug with more acquisitions (which have already begun taking place)
Growing ECP branches was not an LKQ priority when it justified the acquisition and this is evident by its initial plan to open only 10-12 stores per year On the ECP Acquisition call (1142012) LKQ stated that it had a strategic ldquoplan to grow 10 to 12 branches per year for the next few yearsrdquo It broke from that lsquoplanrsquo just one quarter later and following repeated revisions branch store openings opened 40 branches in 2012 Coincidentally growth in North America was weakening Based on our estimates by Q4rsquo2012 ECP accounted for a full 75 of consolidated PampS organic growth and enabling LKQ to hit guidance
LKQ has repeatedly raised the ceiling for the maximum number of ECP branches the UK market can absorb On the Q1rsquo2012 earnings call LKQ stated in another revision that the UK could absorb a maximum of 150 full-sized ECP branches and indicated that at that level ldquobranches in major metropolitan areas can be 5 miles or so apartrdquo which would clearly result in cannibalization LKQ has since raised the ceiling on the maximum branch count to 200
As of 9302013 LKQ had a total of 138 stores (and growing) and plans to have 147 by YE2013 exceeding by 27 branches its initial guidance for the maximum number of stores the UK market could absorb (120 full-sized stores) which was likely the most credible number it has espoused given that it preceded the repeated store ramp-up and apparent quest to meet guidance It may have already saturated the UK market yet LKQ continues to invest shareholder capital into building new branches
LKQ appears to be juicing ECP sales with heavy discounting of parts with many such promotions offered right at the end of LKQrsquos fiscal quarters
Inevitably as ECP reaches its market saturating location capacity we expect ndash and we believe management has anticipated ndash its reported organic growth rate to plummet and converge to the industry average LKQ moved quickly to buy Sator in April 2013 amounting to its 3nd largest purchase ever at the time As a result its European reporting segment now includes both ECP and Sator This new reporting will obscure future financial deterioration at ECP
59
LKQrsquos Short-Termism Results in Increasing
Dependency on Acquisitions to Stay Afloat
60
Other Red Flags ECPrsquos Receivables
Growing 2x Faster Than Revenues
The recent acquisition of Sator appears designed to hide the problems occurring at Euro Car Parts By removing Satorrsquos Q2 2013 revenue and accounts receivable contribution we find that ECPrsquos receivables grew at 2x faster than reported revenues This is a major red flag for investors to consider
Source Company financial filings
European Segment Quarterly Operating Results$ in millions
Euro Car Parts Results Only SatorECP Pro Forma
3m Ended 3m Ended 3m Ended 3m Ended 3m Ended 3m Ended 3m Ended Sator ECP Only
Dec 2011 March 2012 June 2012 Sept 2012 Dec 2012 March 2013 June 2013 Contribution(1) June 2013
Revenue $1385 $1607 $1652 $1813 $1888 $2126 $2978 $688 $2290
QoQ growth -- 160 28 97 41 126 401 -- 77
YoY growth -- -- -- -- 363 323 803 -- 386
Accts Receivables Net $509 $590 $600 $689 $702 $787 $1437 $531 $906
QoQ growth -- 160 17 148 18 121 827 -- 152
YoY growth -- -- -- -- 379 333 1393 -- 509
(1) LKQ Quarterly filing Note 9
61
The Real ECP A Lemon with Terrible
Customer Feedback
httpwwwreviewcentrecomOnline-Car-Part-SuppliersEuro-Car-Parts-www-eurocarparts-com-review_2041339
Increasing Dependency on Acquisitions to
Inflate Financials Conceal Cumulative
Manipulations
Apparent Dependency on Acquisitions to Inflate
Profits and Conceal Cumulative Manipulations
LKQrsquos move to expand internationally beginning with its acquisition of ECP was reminiscent of another chapter from the Waste Management Story ndash the final chapter that ended with fraud and failure
On the October 4 2011 ECP Acquisition conference call LKQ Chairman (and former President of Waste Management International) Joseph Holsten unprompted assured shareholders that LKQ would not repeat Waste Managementrsquos international expansion mistakes
The ensuing realities however have reflected little in the form of caution
63
Now a few of us in LKQ have kind of been down a similar road before in the waste business when we founded Waste Management International in the early 90s And we ran down the road kind of fast and probably got into markets that were not good markets to be in And as I go out -- you will see it from this management team Itrsquos a team that learns from that lesson and will be more cautious in its market entries in Europe We have a very strong commitment to our board that job one is to make sure that the deal in the UK is functioning and functioning extremely well before we move into further markets
We believe LKQ entered Europe in search of a fresh pool of large-scale acquisition targets and that it is dependent on acquisitions to continue inflating its organic growth rate and GAAP profits while papering over cumulative past misstatements
LKQ entered the UK market with the express primary purpose of driving APU for collision repairs and has made very little progress in doing so to date
Despite Chairman Holstenrsquos pledge of caution LKQ has invested shareholder capital to aggressively ramp the ECP branch countwhile the industry around it contracts
Furthermore just a year and a half following the ECP acquisition ndash again not having yet proven ldquothe deal in the UK is functioning extremely wellrdquo when measured against its stated core purpose ndash LKQ acquired Netherlands-based Sator Holding a distributor of spare parts to the automotive aftermarket industry in Belgium the Netherlands and Luxembourg for a total of $273m Sator was LKQrsquos 3rd largest acquisition ever at the time LKQ pitched the acquisition as an opportunity to ldquoachieve significant synergies and ultimately in the coming years use Sator in our highly successful Euro car parts operations as platforms for further expansion into collision parts or other revenue and profit streams in Europerdquo In the same way that it did ECP ndash as an open-ended opportunity of driving APU for collision repairs currently at 7 in Western Europe vs 37 in the US
In commenting about the acquisition founder and President of ECP Sukhpal Singh Ahluwalia appears to have had its sites set more on acquisitions than on expanding collision-repair APU
In a November 12 2013 LKQ press release announcing that Sukhpal Singh Ahluwalia would be promoted to serve as Chairman of LKQ Europe Singh stated
With time Holstenrsquos assurances of caution and LKQrsquos pitches for open-ended opportunities to drive collision European collision APU have been exposed to be diversions 64
ldquohellip Our goal is also to use this transaction as a springboard for further acquisitions in Europerdquo
ldquohellip Under my Chairmanship we will continue to hunt for new acquisitions maintain relationships with our key suppliers and push
forward to access new markets My vision is to develop a group of European aftermarket companies exceeding $5bn in
annualised revenue within five years The UK alone will have 200 Euro Car Parts branches within three years and we have
ambitious targets for paint collision parts and e-commercersquordquo
Dependency on Acquisitions to Inflate Profits
and Conceal Possible Cumulative Manipulations
LKQ is rapidly accelerating its deal making both in number and in dollar value
LKQ acquired 30 companies in 2012 alone against the backdrop of having acquired a total of 71 companies in the 3 years from 2010-2012 and 171 since its 1998 inception Notably LKQ reported a record 17 acquisitions in just Q4rsquo12
Within the past 2 years LKQ announced 3 of 4 of its largest acquisitions ever
Its acquisition of Keystone Automotive Operations on December 5 2013 is its 2nd largest ever Its acquisition of ECP in Q4 2011 is its 3rd largest ever Its acquisition of Sator in Q2rsquo2013 is its 4th largest ever
65
of Quarterly Deals Completed
Rapid Surge in Acquisitions in Q412
Acquisition Fair Value
Includes $3037m paid for ECP
Includes $273m paid for Sator
$450m paid for Keystone Automotive Operations (announced 1252013)
Dependency on Larger and Larger Acquisitions to
Inc Profits and Conceal Cumulative Problems
2012 change from midpoint
High Low Actual Results - 22813 Actual Initial Guidance Final Guidance
2012 Guidance -22312
Organic Revenue (partsservices) 550 -- 750 Organic Revenue (partsservices) 600 050 050
ECP branch openings included in guidance 20 -- 20 Income from continuing ops $2612 -25 -27
Income from continuing ops $2580 -- $2780 Diluted EPS $087 -25 -28
Diluted EPS (1) $0860 -- $093 CFO $2062 -222 -191
CFO $2500 -- $2800 CAPEX $882 -180 -72
CAPEX $1000 -- $1150
2012 Guidance -42612
Organic Revenue 500 -- 700
ECP branch openings included in guidance 30 -- 30
Income from continuing ops $2620 -- $2820
Diluted EPS $088 -- $094
CFO $2500 -- $2800
CAPEX $1000 -- $1150
2012 Guidance -72612
Organic Revenue 550 -- 700
ECP branch openings included in guidance 30 -- 30
Income from continuing ops $2650 -- $2820
Diluted EPS (1) $089 -- $094
CFO $2500 -- $2800
CAPEX $1000 -- $1150
2012 Guidance -102512
Organic Revenue 600 -- 700
ECP branch openings included in guidance 42 -- 42
Income from continuing ops $2650 -- $2720
Diluted EPS (1) $088 -- $091
CFO $2400 -- $2700
CAPEX $900 -- $1000
(1) Adjusted for 21 stock split on 81712 In April guidance was adjusted to include $003c legal settlement
While LKQ met 2012 revenue and barely missed on EPS guidance it missed dramatically on CFO guidance 2012 CFO came in -19 below revised guidance issued only 2 months before year end on 10252012 even as consolidated inventory turnover rose to 27x in 2012 (vs 25x in 2011)
As previously discussed acquisition accounting inherently and unsustainably boosts CFO LKQ made a record number of acquisitions in Q4 just as a gaping financial hole in CFO exposed itself We believe LKQ may be making acquisitions with the intent of inflating its financials and papering over past accounting manipulations
The cumulative deal size was insufficient to bail the company out but we note that in 2013 LKQ proceeded to raise the stakes making its 2nd
and 4th largest acquisitions since its inception
66
Dependency on Acquisitions to Inflate Profits
and Conceal Cumulative Manipulations
Note Yellow shading indicates
changes in guidance
67
As LKQrsquos Deal Making Gets Progressively
Worse and More Desperate
The recent acquisitions of Euro Car Parts Sator and Keystone Automotive Operations exhibit progressively lower gross margins and have been acquired at multiples that are substantially lower than LKQrsquos own current valuation We believe these acquisitions are partially used as a cover to explain away possible overstatement and deterioration of margins in its core business
$ in mm 2007 2011 2013 2013
Revenues growth(a)
$7269136
$509625
$3740~4-6
$7000--
Gross Margin 448 438 331 Low 30
EBIT margin
$49168
$33466
$26070
----
EBITDA margin
$64989
$38976
$31083
$700100
EPS Accretion(b) -- 015 - $018c $001c --
Purchase Price(c) $811 $347 $272 $450
EVLTM EBITDA 125x 89x 88x 64x
EVLTM Revenues 11x 068x 073x 064x
Source Company financials converted from local currencies(a) Sator growth described as low single digits on investor conference call(b) As stated to investors in the deal announcement(c) ECP deal excludes $76m of earnout payments to be made in 2013 and 2014
Euro Car Parts Sator HoldingKeystone Auto
OperationsKeystone Auto
Industries
68
Even Tuck-in Acquisition Quality
Smells of Desperation
Aside from large announced deals LKQ has continued to acquire various businesses in an opaque and unannounced fashion Below we analyze information found in the footnotes of its SEC filings for trends in its recent deal-making
We find further evidence that its deals are getting increasingly desperate with smaller sized and lower EBIT contribution
$ in mm 2012 YTD 2013 (a) Observation
Number of Deals 30 9 At 25-30 market share it must be harder to find smaller deals
Total Deal Value Goodwill Recorded
$2846 $1976
$411 $261
Goodwill amounting to ~65 of recent deals
Avg Deal Size $95 $45 Avg Deal Size Down 50
Revenue Contribution $1163 $124
EBIT Contribution $110 $05
Implied Avg EBIT MarginContribution
94 40 Avg EBIT Contribution Margin down 540bps indicates lower
quality businesses being added
Source Company financials (Note 9)(a) As the 6 months ended June 30 2013 and excludes the Sator acquisition
69
As Leverage Rises at the Same Time
With margins under persistent pressure growth in the US stagnating and the need to produce increasing revenue and EPS targets LKQ has brazenly pushed into Europe with two recent acquisitions
Recently in an unexpected manner LKQ announced the acquisition of Keystone Automotive Industries for $450m a deal that is currently being financed by short-term borrowing Pro forma for the incremental $70m of acquired EBITDA we estimate the companyrsquos leverage to be 22x DebtEBITDA
$ in
bill
ion
Note Pro forma for debt financed Keystone deal
$601
$956
$1118
$1312
$1762
180x
230x 220x214x
223x
000x
050x
100x
150x
200x
250x
$0
$200
$400
$600
$800
$1000
$1200
$1400
$1600
$1800
$2000
2010 2011 2012 9302013 PF 2014E
Total Debt DebtEBITDA
Deb
tEBITD
A
Inventory Accounting
Is Creative Accounting Inflating Gross
Margins
71
The Art of Inventory Accounting
Inventory Chicanery Tempts More Firms Fools More Auditors Wall St Journal Dec 14 1992
When companies are desperate to stay afloat inventory fraud is the easiest way to produce instant profits and dress up the balance sheet says Felix Pomerantz director of Florida International Universitys Center for Accounting Auditing and Tax Studies in Miamildquo Even auditors at the top accounting firms are often fooled because they usually still count inventory the old-fashioned way that is by taking a very small sample of the goods and raw materials in stock and comparing the count with managements tallies In addition Mr Pomerantz says outside auditors can fail to catch inventory scams because they either trust management too much or fear they will lose clients by being tougherldquo
72
No One Knows What LKQrsquos Sustainable Gross
Margin Rate is Potentially Even Management
httpseekingalphacomarticle1595912-lkq-management-discusses-q2-2013-results-earnings-call-transcriptpage=6ampp=qandaampl=last
Craig Kennison Robert W Baird amp Co Incorporated Research Division
And lastly on gross margin John it fell a little bit year-over-year Im guessing thats largely mix and a little bit of the scrap issue But what do you think the sustainable margin rate would be at the gross levelJohn S QuinnJohn Quinn LKQ Chief Financial Officer and Executive Vice President
Craig I think weve talked in the past that our view is excluding the seasonality that unless something changes things tend to stay the way they are in the short term And we probably did get a little bit negative impact in Q2 because of falling scrap prices We did see a little bit of benefit coming through in the car costs on the domestic side As I had mentioned the demand obviously went down Rob mentioned were buying a little bit better year-over-year so we are trying to see that theory if you will evidence of it coming through in the financials Then we do have a downtick coming with Sator in the short run because theyll be fully consolidated next quarter fourth quarter and so on And we only had them for 2 months So I would expect it to see a little sequential decline as a result of having them onboard to the full quarter (ECP) will as I mentioned earlier just anniversaried now so I dont anticipate any impact from that And you get a little bit sequential impact at having the absence of a decline in the scrap prices Itll help us a little bit in the next quarter
Q2 2013 Earnings Call Aug 01 2013
LKQ Does Not Guide on Gross Margins But When Recently Asked About LKQrsquos Sustainable Margin Rate the CFO
Seemed to Theorize Gross Margins to be Driven by 5 Different Factors and Evaded the Question Wholly
12
3
4
5
The Facts Gross Margins in
Persistent Decline
LKQrsquos margins have been in persistent decline since 2005 while consolidated inventory turns have been relatively stable
We believe there is more deterioration in LKQrsquos gross margin than observable on the Income Statement
Sources LKQ financials CapitalIQ 73
Gross Margins in Persistent Decline Flat Inventory Turns
Gro
ss M
argi
n
Inven
tory
Turn
over
74
Three Accounting Levers Would Enable
Gross Margin Inflation
If LKQrsquos consolidated gross margin is being inflated how would it be able to maintain a stable consolidated inventory turnover For reference from FY 2005 to the LTM period ended 9302013 consolidated inventory turns have been relatively stable
measuring 28x Over the same time period consolidated gross margin contracted disproportionately from 471 to 41
1 Aggressive Inventory Policy Enables Overstatement of Inventory ndash LKQrsquos Salvage amp Remanufactured products inventory accounting policy allows for complete discretion to leave costs on the balance sheet in the form of overstated inventory The recent surge in salvage inventory coupled with gross margin deterioration is consistent with this trend In isolation this policy results in inflated gross margins and CFO and exerts downward pressure on the rate of inventory turnover The generally high level of Salvage amp Remanufactured inventory ndash to which the aggressive policy applies ndash is a high level sign the company may be manipulating its margins
2 Acquisition Accounting Enables Understatement of Acquired Inventories ndash The acquisition fair market value process enables LKQ to understate the values of acquired company inventories and to allocate the plug figure to goodwill The result is that inventory costs which should be future period expenses are instead permanently deferred In isolation this would result in inflated gross margins and CFO and exert upward pressure on the rate of inventory turnover thereby counterbalancing the downward pressure caused by increases in Salvage and Remanufactured inventory and stabilizing consolidated inventory turnover
3 Mis-categorization of One-Time Gains to Directly Inflate Gross Margins ndash Management has shown the willingness to use its discretion to very blatantly inflate gross margins
Furthermore we observe that LKQ has never disclosed or broken out in its financials amounts for inventory writedowns We find this odd for a company that holds inventory such as auto parts that have a finite useful life
We believe LKQrsquos gross margins will continue to decline through 2014 against the backdrop of intensifying competitive pricing pressures and as past accounting overstatements have to be reversed we believe LKQ is at elevated risk of a crippling goodwill write-down
LKQ Appears to be Pulling 3 Accounting Levers in Unison
1) Inflated Profitability Focus on Inventory
ndash Interview w Recycled Parts Distributor
(1) ldquoRecycled Parts Distributorrdquo is an owner of large independent auto parts recyclers75
Prescience Point (ldquoPPrdquo) LKQ reports a 10-11 profit margin Is that the standard for a recycled parts distributor in general
Recycled Parts Distributor (ldquoRPDrdquo) 1 I cant hit those numbers Im not even sure theyre making any money on the recycled business Im in the business its hard to make a profithellip It is very competitive
Prescience Point (ldquoPPrdquo) Do you have some skepticism as to whether LKQ is as profitable as it indicates
RPD Well the first thing I would look at is their (recycled parts) inventories Because theyre easy to manipulate There is no way to take an accurate inventory on recycled parts There is no way to get the right value You can do some estimating How they value their inventory is crucial as inventory gets older its almost worthless
LKQ uses an aggressive policy for accounting for its Salvage and Remanufactured Inventory (refer to next slide) that allows for a high level of discretion to leave costs on the balance sheet in the form of overstated inventory LKQ is likely inflating its gross margin and earnings by failing to record a necessary expense for excess and obsolete inventory Omissions of expensing obsolete inventories result in future margin compression as past overstatements must be reversed earnings will be pressured at the time when the inventory is sold (at a deep discount) or disposed of In isolation a policy of overstating inventory exerts downward pressure on LKQrsquos rate of inventory turnover
LKQ calculates the carrying value of inventory through a formula that applies 1) the historical average of gross margin and 2) expected selling prices1 Using historical margins and future pricing estimates as inputs may paint an unrealistic picture of inventory value As a result the impact of any rapid margin change may be smoothed over time we believe LKQrsquos gross margin is deteriorating faster than presented in its Income Statement
The recent surge in salvage inventory coupled with gross margin deterioration is consistent with this smoothing trend and the overall concern of costs being left on the balance sheet
76
1) Aggressive Inventory Accounting Policy ndash
Enables Overstatement of Inventory amp GM
Prescience Point estimate assumes aftermarket and recycled product categories have equivalent margins Keystone and LKQ margins were ~inline prior to the Keystone acquisition Excludes our estimate for lsquoOtherrsquo inventory turns which was imputed assuming a 45 DSI
Salvage amp Remanufactured Inventory Turns and Consolidated Gross Margin Are Declining
Salvage amp Remanufactured Inventory Has Recently Surged While Gross Margins are Declining
(1) Note for there are no standard prices for many of LKQs products which would give management wide discretion for marking inventory values
Aftermarket and Refurbished Product Inventory Our aftermarket inventory cost is established based on the average price we pay for parts and includes expenses incurred for freight and overhead costs For items purchased from foreign companies import fees and duties and transportation insurance are also included Refurbished inventory cost is based on the average price we pay for cores and also includes expenses incurred for freight labor and other overhead
Salvage and Remanufactured Inventory Our salvage inventory cost is established based upon the price we pay for a vehicle including auction storage and towing fees as well as expenditures for buying and dismantling Inventory carrying value is determined using the average cost to sales percentage at each of our facilities and applying that percentage to the facilitys inventory at expected selling prices The average cost to sales percentage is derived from each facilitys historical vehicle profitability for salvage vehicles purchased at auction or from contracted rates for salvage vehicles acquired under certain direct procurement arrangements Remanufactured inventory cost is based upon the price paid for cores and also includes expenses incurred for freight direct manufacturing costs and overhead
The companyrsquos policy sounds like the Gross Margin or Gross Profit (GP) method used by many retailers for estimating inventories for interim financial statements The GP method is not an acceptable method for determining the year-end inventory balance since it only estimates what the ending inventory balance may be GAAP requires companies that use the GM method to conduct an annual physical inventory count to determine the actual value of inventory at year end as inventory values and physical quantities can decrease over time even if they are not sold Failing to identify and reflect such shrinkage would undermine the reliability and accuracy of a companyrsquos financial statements
Although LKQ does not call its policy the GP method its description indicates the two policies are close to if not identical LKQ may be violating GAAP at every year-end as GAAP mandates taking an annual physical inventory count If we are correct that LKQ could have gotten away with calculating inventory based on these estimates is surprising Like any retailer LKQ is not immune to shrinkage (refer to Thieves Steal Dozens of Car Parts from Local Shop) which undermines the credibility of financial statements in which inventory is based on estimates
Source httpwnepcom20130604thieves-steal-dozens-of-car-parts-from-local-shop 77
1) Aggressive Inventory Accounting Policy ndash
Enables Overstatement of Inventory Balance
LKQrsquos Salvage and Remanufactured Inventory Accounting Policy
78
2) Acquisition Accounting ndash Enables
Understatement of Acquired Inventories
Because LKQ is a serial acquirer that does not disclose specifics of the vast majority of its acquisitions such as deal terms or consistencies of target company balance sheets analyzing its accounting irregularities with precision and across periods is difficult But the surge in Salvage amp Remanufactured inventory the account subject to the aggressive inventory accounting policy serves as a higher level sign that margins and CFO may be manipulated
LKQrsquos acquisition policy gives it a lot of discretion when it comes to accounting manipulations We believe LKQ may be using acquisition accounting to understate values of acquired inventories further inflating its gross margin In isolation this policy would exert upward pressure on LKQrsquos rate of inventory turnover
At the time of any acquisition the acquirer is required by GAAP to present the fair value ndash or present a current value ndash of all the assets and liabilities on the balance sheet When LKQ acquires a company it is required to mark at fair value the inventory acquired undervaluing the inventory would enable the company to counterbalance the rises in Salvage and Remanufactured inventory (previously discussed) keeping consolidated inventory turns flat and inflate gross margins and CFO
As Tyco demonstrated when its frauds were exposed there is plenty of room for manipulation in the fair value process (Refer to paragraph 4 in the SEC settlement announcement)
The strategy would entail marking the value of tangible assets ndash that would otherwise result in future expenses down (eg inventory and PPampE) ndash as low as possible in the name of conservatism and to allocate the balance to goodwill In effect the policy moves future period expenses to the balance sheet as goodwill where they are permanently deferred
To demonstrate at the extreme if the Company books the entire value of acquired inventory as goodwill (implying that it has marked acquired inventory down to a $0 value) then sells that inventory the revenue will flow right down to its bottom line Because there is no cost associated with that inventory the Companyrsquos gross margin on the sale is inflated in this case equating to 100
How would LKQ be able to keep consolidated inventory turns from declining in the face of GM manipulation
Tyco
2) Acquisition Accounting ndash
Interview with Salvage Auto Consultant
We believe it is exactly this lsquocookie jar accountingrsquo the consultant refers to that LKQ is using to inflate GM and CFO and to manage stability in its inventory turns which inherently lends to the appearance of a high quality earnings stream
(1) Salvage Yard Recycled Auto Consultant ndash consults for salvage yards consults for some through the process of being acquired by LKQ79
Prescience Point (ldquoPPrdquo) When people sell to LKQ what prices is LKQ paying What metrics are they using and what are they buying a yard at
Salvage Auto Consultant (ldquoSACrdquo) 1 I do some consulting for people that are selling to LKQhellip If the business meets their (LKQrsquos) criteria it would be rare for them to pay more than 06x sales These days thats the most I have seen them pay 60 of annual sales so they are probably paying less than that and only that amount if profitability is above 10 net capex has been maintained and it fits their customer mix ndash they will not buy a yard unless it sells late model collisionhellip
PP So if a yard sells at 06x sales what is the typical value of inventory being bought
SAC Lets back up and triangulate this Lets take a yard that does $5m and that sells to LKQ for 60 of sales or $3mhellip Understand that this revenue multiple does not include real estate it applies only to the business Letrsquos assume that 80 of the yardrsquos sales are used parts which is typical for the industry so it has $5m in annual sales 80 from used parts implying that $4m of their sales come from used part sales which is $350k per month The inventory values that are sustainable on the balance sheet for an IRS audit are between 2-3 months saleshellip At 3 months sales which I think is more sustainable (than 2 monthsrsquo sales) but probably more than that is needed actuallyhellip but I donrsquot think the IRS would give a yard trouble with 3 monthsrsquo sales in inventory ndash theyrsquod kinda look at it and go on because it implies 4 turns to COGS So 3 x $350k = $10m of inventory That would imply that of the $3m purchase price LKQ paid the inventory purchase component of that is at least $1m
PP OK so they buy a yard for $3m and that yard would typically have $1m in inventory
SAC Id say $1m to $15m is what theyre bringing it in at I think theyre being thoughtful about that number by the way I donrsquot think theyrsquore just applying some percentage method to it I think theyre looking at the reports the turns the gross margins and making some assumptions on how valuable that inventory truly is and how much obsolescence there truly is And theyre bringing it in at a value to avoid taking writedowns later And it may mean they may do some cookie jar accounting on the front end and amortize or replace some of it with goodwill because theyrsquod bake off over a long time
2) Acquisition Accounting ndash Enables
Understatement of Acquired Inventories
According to the lsquoSalvage Auto Consultantrsquo interview on the previous slide LKQ buys recycled auto distributors at a maximum of 60 of annual sales a valuation that applies solely to the operation and excludes the value of real estate Based on his experience LKQ targets companies generating 10 profit margins If we assume the purchase price ranges from 40-60 of sales this would imply
LKQ is paying 4xndash6x net earnings for recycled auto parts distributors
Acquired inventory values make up 33 ndash 67 of the purchase price
From 2003 to 2012 (excluding the impacts of the distressed purchase of Greenleaf) LKQ spent $23 billion on acquisitions If we assume for conservatism that the purchase price allocations to PPampE were all related to real estate buys and back the cumulative PPampE allocation out from the cumulative purchase price we are left with $21 billion spent to acquire the businesses Over the same period $482m of the cumulative purchase price was allocated to inventory or only 227 of the cumulative purchase price ex PPampE
We believe LKQrsquos purchase price allocations are consistent with a policy of having used acquisition accounting to systematically understate acquisition inventory values thereby inflating its financials and successfully stabilizing its inventory turnover
80
2) Acquisition Accounting ndash LKQ at
Elevated Risk of Goodwill Writedown
We believe LKQ is at an elevated risk of a significant goodwill write down
From 2003 to 2012 (excluding the impacts of the distressed purchase of Greenleaf) LKQ allocated ~70 of its aggregate acquisition costs to balance sheet goodwill To date it has amassed an $192 billion of goodwill (and a further $154m to intangibles) relative to a book equity totaling $225 billion goodwill makes up 85 of LKQrsquos book value
By way of comparison Keystone ndash prior to LKQrsquos buyout of the company ndash from April 1 1998 to March 30 2006 allocated only 449 of its aggregate acquisition costs to goodwill in FY 2007 Keystonersquos goodwill amounted to 152 of book value
A goodwill write down for LKQ is not without precedent Jan 1 2002 LKQ wrote off ~57 of its balance sheet goodwill Prior to the write down goodwill had amounted to 72 of book value
That LKQ took a valuation impairment during the post-tech recession in 2002 citing contracting multiples but did nothing of the such during or after the 2008-2009 financial crisis which was the deepest recession the US has endured since the Great Depression does not pass logic In 2009 LKQrsquos closest comparable Greenleaf the 2nd largest wholesale auto parts recycling business in the US was in distress and sold it itself to LKQ for lsquoless than the fair market value of its assetsrsquo enterprise valuations were down across the board as liquidity evaporated
Today the stakes are much higher for LKQ than they were in 2002 The current size of its goodwill account is multiples of its 2002 enterprise value Because we believe that LKQ may be using this account to manipulate margins and CFO we also believe the account appears inflated and impaired as it stands
Sources 10-krsquos for Keystone Automotive Form S-1 for LKQ filed July 28 200381
Previous LKQ Write-Off of ~57 of Goodwill Balance
Valuations for some of the Companys acquisitions have declinedsignificantly since the Company completed its acquisitions during 1998and 1999 due to a number of factors including lower earningsmultiples applied in the valuations of comparable companies As aresult the Company determined that the carrying value of certainreporting units exceeded the fair value of those reporting units atJanuary 1 2002 and recorded an impairment of goodwill in theamount of $49898800 net of tax of $16120700
LKQ Explanation Lower Valuations of Comps
82
3) One-Time Gains to Inflate Gross Margins
We believe LKQ was manipulative in how it booked gains in 2012 from legal settlements awarded in a class action suit against several aftermarket suppliers The awards were booked as two legal settlement gains of $83m and $84m in Q112 and Q212 respectively
The gain classification artificially inflated gross margins The gains were booked as reductions of COGS significantly propping up and blunting a multi-year decline in gross margins In 2012 these gains elevated gross margins from 4095 to 4138 which helped to mask the significant drop from 4257 in 2011
The settlement gains had nothing to do with ongoing COGS While the original source of the lawsuit may have originated from issues related to LKQrsquos inventory account receiving a one-time settlement gain is irrelevant to current period operations and should be treated as one-time non-operating gains in nature In our judgment LKQrsquos classification is exceedingly aggressive
In light of our belief that games are likely being played in LKQrsquos accounting for inventories the nature of managementrsquos choice in this case underscores the potential severity of other manipulations exposed or not
Management also inflated its earnings prospects by including the legal settlement gains in its EPS guidance The Company chose to factor these one-time legal settlement benefits into guidance even while explicitly excluding other one-time gainslosses from guidance
In Q1rsquo12 management raised 2012 EPS guidance due to inclusion of the first legal settlement gain in its revision The entire value of the positive differential over prior guidance was attributable to the one time legal gain
Based on its Q1 10-Q (excerpted below) management knew that an additional settlement gain of near-equivalent value would be recognized sometime in 2012 Even though it also expected to recognize this second gain management chose not to also include it in the 2012 guidance revision that included the first gainhellip
Instead in Q22012 management booked the remaining previously expected settlement gain in the amount of $84m equating to+$04 EPS When they reported Q2rsquo2012 results (issued 7262012) management AGAIN raised its 2012 guidance to $265ndash$282m and $177 ndash $188 And again the positive differential from the prior guidance resulted from including the 2nd previously anticipated gain offset by a fall in scrap prices in the revised numbers In other words guidance would likely have been lowered had LKQ included the 2nd gain in the original guidance revision This seems to indicate they kept it in their back pocket to ensure the next revision to guidance would be a raise
83
Contrsquod
3) One-Time Gains to Inflate Gross Margins
ldquoWe are a plaintiff in a class action lawsuit against several aftermarket product suppliers Our recovery is expected to be approximately $16 million in the aggregate In January 2012 we reached a settlement agreement with certain of the defendants under which we recognized a gain of $83 million which was recorded in Cost of Goods Sold during the three month period ended March 31 2012hellip
We expect to recognize an additional $8 million gain related to settlements with certain other defendants in this lawsuit in the last nine months of 2012rdquo
ndash LKQ Q1rsquo2012 10-Q
84
On the Q2rsquo2012 earnings conference call CFO John Quinn was asked by an alert analyst whether hersquod expected the 2nd settlement gain when guidance had been issued in Q1 he completely dodged the question
But per the previous slide itrsquos written in black and white in the Q1rsquo2012 10-Q Of course he expected it
Craig R Kennison (Robert W Baird amp Co Incorporated Research Division)
ldquoJust to finalize on the guidance In the second quarter you had a $004 legal benefit which is being included in your guidance Did you expect that when you initially gave guidance after last quarterrdquo
John S Quinn
ldquoIt was not included in the guidance last quarterrdquo
ndash LKQ Q2rsquo2012 Earnings Conference call QampA 7282012
Contrsquod
3) One-Time Gains to Inflate Gross Margins
85
Another Red Flag ShippingHandling
Revenue is Diverging from Other Metrics
Source Company filings
LKQ collects revenues related to shipping and handling (SampH) and regularly reports these figures in its 10-K
If LKQ were a healthy growing firm we would expect to see SampH revenue at least stay constant over time with reported revenues COGS and average inventory
However we observe declining trends in LKQrsquos SampH revenue among all relevant financial metrics In particular we observe that SampH revenue to average inventory has declined at the fastest rate in the past six years We interpret this as strong indicator of potential inventory shenanigans
Shipping and Handling Revenue vs Other Financial Metrics
000
050
100
150
200
250
000
100
200
300
400
500
600
700
800
900
2006 2007 2008 2009 2010 2011 2012
of Avg Inventory (LHS) of COGS (RHS) of Total Revenue (RHS)
SampHInventory Has Largest Drop
86
WM and DZ ndash Previous Employers of Many
LKQ Execs amp Accounting Personnel
Flynn Enterprises Common Shareholder
John QuinnVarious Positions
John QuinnSVP and CFO
Mark SpearsController Head Acct
Mark SpearsFormer SVP CFO
Frank ErlainFmr VP Finance
Controller Accountant
Victor CasiniGen Counsel amp
Secretary
Walter HanleyAsso Gen Counsel
Walter HanleySVP Development
Victor CasiniGen Counsel amp
Secretary
Ken FreseAcctrsquog Mgr
Ken FreseAccountant
Ken FreseDir Accounting amp
Inventory
Joe HolstenCOO CEO WM Intrsquol
Joe HolstenFmr CEO Chairman
Frank ErlainVP amp
Controller
Sinon GalvinSVP Revenue Optimization
Sinon GalvinVarious Positions
WM Intrsquol
Fraud Allegations Improper Capitalization of Expense Files for Bankruptcy March 1996
Charged w $17 billion Accounting Fraud March 2002
Stephen EckelDir Oracle Fin Apps
Fmr AcctrsquogAss Contrsquoller
Stephen EckelAssistant Corporate
Controller
Source SEC filings LinkedInreg
Kevin FlynnFormer Director
Kevin FlynnVP Midwest
Vaughn HooksChief Tax Officer
Vaughn HooksVP Taxes
Dan ShoenerVP
Dan ShoenerVP of Finance
LKQ
87
LKQrsquos Director of Inventory Accounting
$17bn Accounting
Fraud
Fraud Allegations
Filed for Ch 11 Bankruptcy
httpwwwlinkedincomprofileviewid=30515327amplocale=en_USamptrk=tyah2amptrkInfo=tas3Aken20freseSource
In light of our belief that LKQ may be inflating its financials and most likely via inventory accounting shenanigans it is worth noting that LKQrsquos Director of Accounting and Inventory is connected with two companies previously alleged to have engaged in accounting manipulations to inflate their stock prices
The Waste Management
Playbook for Paper lsquoProfitabilityrsquo
Used Over and Over Again
89
Waste Management ndash Aggressive Roll-up
Strategy Replicated by LKQ amp Many Others
In 1968 Dean Buntrock Wayne Huizenga (both LKQ founding backers) and Lawrence Beck founded Waste Management (WM) In 1972 Donald Flynn (LKQrsquos founder) joined WM as CFO WM set out to consolidate the highly fragmented garbage hauling industry via an aggressive roll-up strategy Its growth would benefit from the tailwinds of recently issued EPA regulations that posed challenges for mom and pop operators
By the time WM went public in 1971 it had acquired 133 garbage haulers and was generating gt$10m in revenue In the first 9 months of 1972 it had acquired another 133 firms and by the end of the year had generated $72m in revenue From 1971 to 1980 WMrsquos revenue grew at a rate of 48 per year and in 1980 it generated $656m in revenue By 1986 WM had become the largest waste disposal firm in the world
Donald Flynn was given credit as the ldquofinancial geniusrdquo behind Waste Managementrsquos extraordinary growth from the 1970s to the early 1990s in a 1993 corporate history commissioned by the company
In 1976 the SEC alleged that WM founder Huizenga was involved in disguising unlawful political contributions that Waste Managementwas skimming dump fees and using the proceeds to create an illegal slush fund to be used for political contributions Huizenga signed a consent decree barring him and WM from using corporate money for unlawful political contributions and from filing materially false and misleading financial statements There was no admission of wrongdoing
In 1984 WM co-founder Huizenga and John Melk President of WM International sold their stakes in the company and would go on to invest in Blockbuster Entertainment Buntrock remained as CEO until 1996 and Flynn as CFO amp director until 1989 amp 1997 respectively
By the late 1980rsquos and early 1990rsquos WM had undertaken a botched international expansion in a push to become the worldrsquos first global lsquoenvironmental servicesrsquo company ldquoThat ambition led Waste Management to acquire a range of profit-draining businesses The eventual result was angry shareholders turmoil in the board room and a disruptive series of management purges and sudden resignations followed by revelations (in late 1997) of accounting irregularitiesrdquo
In 1998 the troubled company merged with USA Waste Services Inc
In 1997 a WM board-led probe turned up a massive financial fraud that went undetected from 1992ndash1997 involving the inflation of asset values and pre-tax earnings resulting in a $35B charge in 1998 and the largest financial restatement in history at that time The SEC charged WM with perpetrating a massive financial fraud
90
SEC vs Waste Management
In mid-July 1997 a new CEO ordered a review of WMrsquos accounting practices That review ultimately led to the restatement of the Companys financial statements for 1992 through the third quarter of 1997 When the Company filed its restated financial statements in February 1998 it acknowledged that it had misstated its pre-tax earnings by approximately $17 billion and took a $35 billion charge At the time the restatement was the largest in corporate history
From 1994 until 1997 a period at the heart of the perpetuation of the fraud Donald Flynn (LKQrsquos founder) was a Waste Management Audit Committee member and also served as Audit Committee Chairman during a period coinciding with the fraud
According to the SEC former WM CEO Dean Buntrock who would later be LKQrsquos founding backer amp director was ldquothe driving force behind the fraudrdquo and that ldquoHe was the primary beneficiary of the fraud and reaped more than $169 million in ill-gotten gains from among other things performance-based bonuses retirement benefits charitable giving and selling company stock while the fraud was ongoingrdquo
httpwwwsecgovnewsheadlineswastemgmt6htmWaste Management Founder Five Others Sued for Massive Fraud
91
SEC vs Waste Management ndash RE Multi-Year
ldquoMassive Earnings Management Fraudrdquo
Defendants Inflated Profits by $17 Billion To Meet Earnings Targets Defendants Reap Millions in Ill-Gotten Gains While Defrauded Investors Lose More Than $6 Billion
ldquoThe Securities and Exchange Commission filed suit today against the founder and five other former topofficers of Waste Management Inc charging them with perpetrating a massive financial fraud lasting more than five yearsrdquohellipldquoThe complaint alleges that defendants fraudulently manipulated the companys financial results to meet predetermined earnings targets The companys revenues were not growing fast enough to meet these targets so defendants instead resorted to improperly eliminating and deferring current period expenses to inflate earnings They employed a multitude of improper accounting practices to achieve this objectiverdquo
ndash SEC Press Release 3262002
bull On August 29 2005 the SEC announced its fraud action against the accused Waste Management officers would be settled for a total of $308m
bull Buntrock and the others accused neither admitted nor denied wrongdoing
WM Alumni Borrowing from the Old WM
Playbook Over and Over Again
Waste Managementrsquos aggressive rollup strategy gave its management a high level of flexibility to inflate revenue growth and margins and to conceal doing so
A closely-knit group of WM alumni and associates (including LKQrsquos founders) have repeatedly co-invested in and built several companies with each company replicating WMrsquos aggressive roll-up or an acquire-and-build strategy in either case either consolidating or flooding an industry with store openings in an effort to claim the dominant position as fast as possible Some of these companies include Blockbuster Video Discovery Zone Boston Chicken AutoNation Swisher Hygiene and LKQ Many of these companies have either failed to deliver on their sales pitches to investors failed outright or were tarred by allegations of fraud manipulative accounting andor unjust management enrichment
Based on our analysis in the majority of cases these WM alums and associates build businesses with the intent to create the illusion of growth as opposed to focusing on creating value through operational excellence This has prompted some critics to claim that they build companies that have little lasting value
Many involved seem to have learned to begin cashing out just before and soon after building a roll-up large enough to sell to the public at inflated valuations and have gotten very rich in the process
Billionaire Wayne Huizenga (LKQ founding backer and WM co-founder) has been involved in all of the above mentioned companies either as a backer or as an executive or both As he is quoted as saying (regarding some of the roll-ups that went on to fail after he cashed out)
We left these companies in great shape and to be blamed for their problems years after I left is ridiculous
92
Same Players Same Strategy Results
Marred by Accounting Irregularities amp Failures
93
John MelkInvestor
Charged with accounting fraud one
of the largest in history
Aggressive rollup strategy
Discovery ZoneBlockbuster Boston Chicken AutoNation Swisher Hygiene
Dean BuntrockCo-founder CEO
Dean BuntrockInvestor Franchisee
Dean Buntrock Founding Backer Director
Dean BuntrockInvestor Director
Donald FlynnCFO Director -Audit Committee
Donald FlynnInvestor
Donald FlynnFounding Backer Director
Donald Flynn Founder
Donald FlynnCEOChairman
John MelkPresident WM International
John MelkFounding Backer Director
John MelkFounding backer Director
John MelkInvestor Director
Lawrence BeckCo-founder
Lawrence BeckInvestor Franchisee
Lawrence BeckInvestor Franchisee
Peer PedersenDirector
Peer PedersenInvestor Franchisee
Peer PedersenDirector
Peer PedersenInvestor
Scott BeckInvestor COO Vice Chairman
Scott BeckInvestor
Scott BeckCEOChair
Steven BerrardCFO then CEO
Steven BerrardCo-founder Co-CEO
Steven BerrardCEO Director
Victor CassiniGen CounselSecretary
Victor CassiniGen Counsel Secretary
Wayne HuizengaCo-founder
Wayne HuizengaCEOChairman
Wayne HuizengaInvestor (via Blockbuster)
Director
Wayne HuizengaInvestor
Wayne HuizengaFounder Co-CEO
Wayne HuizengaChairman
Wayne HuizengaFounding backer (via
AutoNation)
Bought out by Viacom for $84B
Aggressive acquire-amp-build
strategy
Goes bankrupt Allegations of fraud
Aggressive acquire-amp-build
strategy
Goes bankrupt Accounting gimmicks to obscure financials
Aggressive acquire-amp-build
strategy
$$ Billions Lost Pooling of Interests
acquisition accounting
Aggressive rollup amp acquire-amp-build strategy
Accounting irregularities
Financials restatementAcquisition Accntng Issues
Ongoing SEC inquiry
Aggressive rollup strategy
An array of accounting
red flags amp misrepresentations
Aggressive rollup amp acquire-amp-build strategy
Dean BuntrockFranchisee
Steven BerrardCEO post-Viacom
LKQ
Blockbuster Entertainment
Blockbuster Entertainment proved to be Huizenga and his associatesrsquo most lucrative endeavor and its success would become a core aspect of their pitch to sell investors on subsequent endeavors employing the same strategy (with little success) We believeBlockbuster worked primarily because it operated in a relatively nascent quickly growing space ndash it had the wind at its back allowing for a comfortable margin for error Additionally by executing an extremely aggressive acquire-and-build strategy the companyrsquos key financial metrics were inherently blessed Lastly it was bought out by Viacom prior to falling apart as the result of fundamental forces The associatesrsquo subsequent endeavors however evidence that absent high luck rapid expansion strategies that depend on external capital are customarily near-impossible to manage and that managers are seduced by flexibility in accounting policies
In 1987 Donald Flynn Wayne Huizenga and John Melk (former President WM International) bought a controlling interest in Blockbuster Entertainment Company Blockbuster set out to consolidate the highly fragmented video rental field which was already growing in the double-digit range when Blockbuster came into the picture ndash via the implementation of a rabid buy-and-build strategy
Huizenga who assumed the role of CEO and Chairman built the company in accordance with his modus operandi ndash at a furious pace and with a buy-and-build strategy purchasing smaller chains and constructing new outlets When Huizenga and his associates invested in 1987 Blockbuster owned 15 stores and franchised 20 others From that point on Huizenga opened a Blockbuster store every 17 hours on average for seven years by the time of its 1994 takeout by Viacom Blockbuster had expanded the store count to 3700
Worries that the video rental industry was reaching a saturation point cast doubts on Blockbusters ability to keep opening stores indefinitely One response to this concern was to look to markets outside the United States for growth
In April 1993 Blockbuster supported Donald Flynn by injecting equity capital into his new venture Discovery Zone (DZ) buying a 20 stake (with the option to buy 499) Huizenga and other Blockbuster executives joined the DZ board
In September 1994 Viacom Inc acquired Blockbuster for $84 billion
94
Discovery Zone - Reckless Buy-and-Build
Fraud Allegations Bankruptcy
In July 1992 Donald Flynn (LKQrsquos founder) bought a controlling interest in and assumed the role of CEOChairman of the Discovery Zone an ownerfranchiser of indoor kidsrsquo playgrounds using proceeds from his success with Blockbuster DZ set out to build a leading market position in its space via a reckless acquire-amp-build strategy Unfortunately in its rush to accelerate revenue growth it incurred substantial debts and lost control of its costs landing it in bankruptcy Viacom later sued Flynn in 1997 claiming he was responsible for inflating DZrsquos earnings and misrepresented its financials to secure the sale of his stock to Viacom in 1995 shortly before DZ declared bankruptcy The suit was settled for an undisclosed cash sum
In April 1993 Blockbuster Entertainment injected equity capital into DZ to finance Flynnrsquos expansion plans buying a 20 stake (with the option to buy 499) In June 1993 DZ IPOed
DZ used public capital to expand rapidly Between 1991 and 1995 DZ expanded from 28 locations to 336 locations In September 1994 DZ bought 60 franchised DZ units operated by Blockbuster Blockbuster simultaneously increased its equity ownership in DZ to 499 by exercising its option to purchase additional equity directly from the Flynn family (through DKB Investments LP) on September 29 1994 Viacom acquired Blockbuster
November 1994-March 1995 ndash 3 lawsuits which were later consolidated were filed against DZ as it reported substantial operating losses in Q3rsquo04 and subsequent periods The claims allege DZ and certain directors amp officers including Flynn engaged in fraud intended to inflate DZrsquos stock price such as improperly capitalized preopening expenses failing to timely make public the change in the method of accounting for preopening expenses etc The consolidated complaint was dismissed as a result of DZrsquos Ch11 filing
On February 1 1996 DZ warned shareholders that it may seek bankruptcy protection after January sales fell below expectations the stock collapsed by gt60 on Feb 27 1996 Flynn resigned as DZrsquos Chairman On March 25 1996 DZ filed for Ch11 protection
In 1997 Viacom sued Donald Flynn and his sons claiming they inflated earnings through improper accounting adjustments and misrepresented the companyrsquos financial statements to secure a $25m sale of their personal stock to Viacom and to meet Wall Street Expectations for profitability According to Kevin Forde Donald Flynns attorney following settlement of the matter in 2004 There was a payment of a certain sum for dismissal of all claims and our clients were very satisfied with the settlement
95
This is a question of a company that grew too quickly without the infrastructure to do orderly and profitable growth
ndash Robert Mead Discovery Zone spokesman commenting just after the company files for Ch 11 (March 26 1996)
Boston Chicken ndash Reckless Buy-and-Build
Accounting Gimmickry Bankruptcy
In 1992 Scott Beck and a partner bought a controlling interest in Boston Chicken (BC) a rotisserie-style chicken restaurant with the $120m he made from selling his stake in Blockbuster Video franchise stores back to Blockbuster Entertainment The foundation of BCrsquos business strategy was based on reckless acquire-amp-build strategy This reckless expansion program however would prove to be the root cause of BCrsquos financial demise pushing the company into bankruptcy BC would likely have ended up in bankruptcy much sooner given its cash-degenerative store unit economics had gimmicky accounting not concealed signs of its deteriorating business
6 months after taking over Boston Chicken Beck was overseeing a chain of 53 restaurants in ten states By the end of 1992 Boston Chicken had 83 stores In 1993 Boston Chicken went public accumulating external capital for even more growth In 1993 BC wentpublic the chain nearly tripled in size to 217 stores By the end of 1994 it had 534 stores Management announced its intent to grow the chain at a rate of more than 325 stores annually at least through the end of the decade
Problems surfaced during the summer of 1997 Poor employee training high operating expenses and its lending policy to developer-franchisees had started to take their toll on company finances In 1998 Beck resigned Stores sales continued to falter and by July losses had reached $4371 million
On October 5 1998 BC filed for bankruptcyhellip A noted short-seller commented ldquoThe Chicken has been plucked due to deteriorating store-level economics management turmoil and an outsized amount of debt due to an aggressive expansion plan that had once impressed Wall Street but perhaps never made financial sense
(1) Howard Schilit Financial Shenanigans How to Detect Accounting Gimmicks amp Frauds in Financial Reports (New York Mcgraw-Hill2010) 103-10496
They have the most aggressive expansion program ever undertaken in the restaurant industryldquo
ndash Restaurant Analyst Mike Mueller in Restaurant Business (4101994)
Deceptive Accounting at Boston Chicken Discussed in Financial Shenanigans By Howard Schilit (Excerpts Below)1
Swisher Hygiene ndash Reckless Roll-Up
Financials Restatement SEC Inquiry
In 2004 Wayne Huizenga and Steven Berrard bought and took private public company Swisher International an industrial cleaning business In August 2010 they took Swisher public through a reverse merger renaming the successor entity Swisher Hygiene Swisher was set on consolidating its industry via an aggressive and reckless roll-up strategy Eventually the company announced that previously-issued financials could not be relied upon and that its profitability had been overstated Swisherrsquos Audit Committee is currently probing the companyrsquos acquisition accounting policies as the company contends with ongoing SEC and US Attorney inquiries
Based on an August 2010 Bloomberg News article Huizenga planned ldquoto build Swisher much the same way as he grew Waste Management Blockbuster and AutoNationrdquo and according to Huizenga
Swisher began raising capital and in approximately one year had bought 55 companies an average of more than one per week The Wall Street Journal named Swisher the ldquomost acquisitiverdquo business in North America in 2011 after its buying spree
By March 2012 Swishers Audit Committee announced its 2011 interim financials could not be relied upon and that it would delay the filing of its annual report due to an ongoing internal investigation primarily relating to possible adjustments to (1) the accounting for business acquisitions and (2) the calculation of the allowance of doubtful accounts receivable It concluded that previously issued interim financial statements could not be relied upon and that earnings were inflated for the affected periods According to its most recent 10-Q the SEC and the US Attorneys Office have requested more information from the company and the company faces federal shareholder lawsuits that allege the company artificially inflated its stock price (which collapsed as a result of the announcement)
Further disclosure in a corresponding 8-k shows that Swisher is focusing on its accounting for acquisitions which we believe LKQ may be using to manipulate its accounting as a source of its accounting irregularities
Huizenga resigned from Swishers board in May 2013 Berrard resigned as CEO in August 2012
97
This is another opportunity to build a company that will growhellip Now wersquoll have public capital to do acquisitions helliphelliphelliphelliphellip
You go to a guy and you say lsquoDo you want to sellrsquo If they think they can be a part of something thatrsquos going to grow -- you give them some cash and some stock -- theyrsquoll say rsquoyeshellip They want the stock because theyrsquoll think lsquoOh boy you guys are going to grow this business and Irsquom going to watch my stock growrsquo
During the course of its independent review and due in part to the significant number of acquisitions made by the Company the Audit Committee determined it would be in the best interest of the Company and its stockholders to review the accounting entries relating to each of the 63 acquisitions made by the Company during the year ended December 31 2011
AutoNation ndash Reckless Buy-and-Build
Billions Lost Most Comparable to LKQ
The case study of AutonNation Inc and its predecessor entity Republic Industries (collectively AN) we believe bears many parallels to how LKQs will develop AN tried to consolidate a highly competitive low margin maturelow growth industry but lacked a fundamentally superior way of making money Using public capital it over- expanded and -extended itself losing focus and eventually resulting in billions of dollars of shareholder losses
AN was led by Wayne Huizenga and Steve Berrard as co-CEOrsquos from 1996 ndash 1999 Using an aggressive acquire-amp-build strategy fueled by company shares they set out to consolidate the automotive business by building a one-stop-shop involved in every stage of selling renting and servicing new and used cars They built an empire of new car dealerships car rental agencies and used car megastores selling investors the vision that each one would feed the other to enable the company to generate profits on a vehicle throughout its lifetime
In 1996 amp 1997 it acquired hundreds of businesses mostly relying on the controversial pooling of interests acquisition accounting practice with its earnings likely inflated as a result In less than 2 years time AN was the largest auto retailer in the US with a market cap of gt$12B
They continuously reminded investors of the successes they achieved with Waste Management Inc (Huizenga sold out of WM in 1984) and Blockbuster Inc Per ANrsquos 1995 annual report We want to build a brand just like we did at Blockbuster Wall Street bought into the vision that Huizenga could replicate those successes in consolidating the autos market
The association would prove misleading the growth of WM and Blockbuster were supported by strong secular tailwinds WMs growth was supported by regulatory changes that made it almost impossible for mom and pops to compete Blockbusters growth benefited from a video-rental industry that was growing in the double digit range Like LKQrsquos ANrsquos end markets on the other hand were already mature growing at a very low single digit growth rates ndash ANrsquos success was dependent on stealing market share from existing competitors Similar to LKQ it also lacked the ability to drive down its most basic costs
With high fixed costs and inventory values that depreciated with each passing moment ANs used car business lost significant sums of money and led to investor disappointment its share price fell by gt80 from peak to trough representing a cumulative value of gt$10B
In 1999 Huizenga and Berrard stepped down New CEO Michael Jackson would dismantle the empire via asset sales and spin-offs in an effort to focus the enterprise and improve margins He spun off the rental car business and closed the money-losing used car business resulting in a pre-tax charge of gt$400m He announced AN would suspend further purchases of new-car dealerships and concentrate instead on reducing costs at existing dealerships and announced an increased its stock buyback program by $500m
(1) Paul F Kocourek Steven Y Chung and Matthew G McKenna ldquoStrategic Rollups Overhauling the Multi-Merger Machinerdquo Strategy amp Business second quarter 200098
ldquohellipit found it had no way to drive down the basic cost of the business mdash buying cars Unlike new-car dealers that accept many used vehicles as trade-ins often on favorable terms AutoNation had to compete at auctions with other dealers to build its inventory With relatively high fixed costs a huge inventory
that depreciated in value with every passing week and no sign of improvement AutoNation bailed out and exited the used-car business in late 1999 ldquo1
AutoNation ndash Reckless Buy-and-Build
the Build-Out of an Empire Destined to Fail In May 1995 Huizenga and a relative invested $31m in Republic Industries a public waste disposal company that would allow him to raise public
capital for his next venture Huizenga was appointed CEO and Chairman of the company
The next year Steven Berrard joined him as co-CEO and director Under their leadership the company announced plans to aggressively grow into a completely unrelated industry setting out to build a one-stop-shop for consumers automotive needs via consolidating the fragmented automotive retail and rental markets According to a New York Times article Huizenga said that Republic would cater to anybody who wants to rent lease or buy a car that is brand new or used
Republic expanded aggressively purchasing hundreds of franchised amp used car dealerships and car rental companies with the vision of assembling an empire that would reap economies of scale by involving itself in every stage of selling renting and servicing new and used cars It grew from only one franchised vehicle dealership at the end of 1996 to more than 270 franchised dealerships owned or under contract by the end of 1997 becoming Americarsquos largest automotive retailer in 1 years time
Amongst Republicrsquos major acquisitions was AutoNation USA (ldquoAN USArdquo) a developmental-stage private company owned by Huizenga and Berrard The two co-founded the company in September 1995 intending to grow it into a nationwide chain of used car megastores each of which would offer up to 1000 reconditioned late model low mileage vehicles When Republics intent to acquire AN was announced AN had not yet opened a single megastore and from inception to September 29 1996 AN USA had lost $214m on revenues of $92m with shareholders equity of $307m Republic paid 175m shares of stock for AN USA equating to $250m at its intent to acquire was announced on March 29 1996 but according to a class action complaint filed in January 1997 due to a rise in Republics share price prior to its close the deal was consummated for $643m
In 1996 and 1997 Republic also bought several vehicle rental companies including Alamo Rent-A-Car and National Car Rental System becoming one of the leading vehicle rental companies in the world
In 1998 Republic generated revenue of $16bn up from $56bn in 1996 But when the dust began to settle from a slowdown in its acquisition binge the economics of its business model did not pan out as promised Republic struggled as a car dealership with high overhead low profits and a strategy based on synergies that didnrsquot materialize The AutoNation USA business was a money-losing business operation
Furthermore Republic may have been relying on the acquisition accounting practice known as pooling of interests to inflate its earnings Republic applied this approach for more than half of its deals in 1996 amp 1997 without having used it its thin margins may have been in the red
Republic stock had risen from a split-adjusted $2 when Huizenga bought in to a peak of ~$44 in January 1997 by June 1997 shares had declined ~50 and would continue their descent each year until hitting a low of $5 in December 2000 Its market cap fell from a peak exceeding $12bn by gt80 representing ~$10bn in lost shareholder value
(1) Machan Dyan Crime Garbage and Billboards Forbes November 20 1995 vol 156 issue99
We were looking for a shell [company] and this happened to come up he says It could have been in anythinghellip1
When they think of transportation he said we want them to think about us
AutoNation ndash Reckless Buy-and-Build
New Profit-Focused CEO Dismantles Empire At Republics May 1998 shareholder meeting Huizenga expressed his disappointment about the companys stagnant share price according to an Sun
Sentinel article describing the event he told investors about how the matrix of car dealerships and rental car agencies was going to simultaneously grow sales to perhaps as much as $60 billion in three to five yearslsquo and that costs would be cut to boost profits
Notwithstanding the mounting pressures to remain focused in July 1998 AutoNation invested in Huizengas close associate Donald Flynns new endeavor LKQ Corp (It would cash out of this investment in 2003)
In 1999 under pressure from shareholders and a falling share price Republic began to unwind what it had built over the preceding 4 years streamlining its operations and undergoing management changes
In April 1999 Republic spun off its waste disposal segment and subsequently changed its name to Autonation Inc (ldquoANrdquo)
On September 24 1999 Huizenga and Berrard stepped down from their co-CEO positions Michael Jackson former CEO of Mercedes Benz USA was named new CEO
On September 30 6 days after Jackson was hired Autonation announced the spin-off of the car rental business to focus exclusively on the automotive retail business
On December 13 1999 3 months after taking the helm Jackson killed the concept of used-car megastores announcing the immediate closure of the money-losing chain and the expectation of a pre-tax loss of between $430 ndash $490m Of its 29 megastores 23 would be closed and 6 integrated with new vehicle franchises
According to a December 14 1999 New York Times article
AN also announced it would suspend further acquisitions of new car dealerships instead concentrating on reducing costs at existing dealerships and announced an increased its stock buyback program by $500m In the press release Jackson emphasized his focus on improving profitability and the sustainability of the AN business model
Jacksonrsquos initiatives tremendously benefited the companys efficiency tremendously A 2001 study for USA Today showed that AutoNation increased revenue per employee 82 percent from 1998 to 2002 a greater increase in efficiency than any other large public company in the country
100
ldquoMr Jacksonhellip said that the used car superstores (ie AN USA) were high-cost operations with no chance of ever generating profits proportionate to their risk Even if AutoNation had been willing to invest heavily devote a lot of management time and wait for years he said the cost structure in those stores
would still have been very high leading to marginal operations
Our focus now is on improving our operating margins and on creating a unique and branded customer experience in our new vehicle franchises which are now AutoNations sole business focus By closing the megastores and implementing SGampA reductions we have taken the necessary steps to ensure
the long-term success of AutoNation
LKQ Governance Concerns
102
Key Management Changes Start in
2009-2010 Just As Business is Improving
We believe LKQrsquos core business began slowing in the 2009-2010 which coincided with the APU rate stalling and a stagnation in insurance paid collision repairs Beginning in this period we also observe various changes to key management positions
LKQrsquos CFO Mark Spears also the former Principal Accountant at Waste Management mysteriously resigned in May 2009 despite a record year for the Company Spearsrsquo departure came ~1 year after the SEC issued a comment letter questioning numerous aspects of their business and further comment letters would follow
Subsequent changes have included a new CEO and the departure of the Head of IR and Chief Acctrsquog Officer
Date Executive Role Note
52109 Mark Spears CFO Resigns Press Release
12610 Rob Wagman Promotion from SVP Ops to Co-CEO
Press Release
12610 Joe Holsten Resign CEO joins the Board Press Release
Dec 2010 Sarah Lewensohn Director of Investor Relations
No longer listed as IR contact in PR
22811 Frank Erlain Long time VP Finance Chief Acctrsquog Officer Retires
8K filing
3512 Victor Casini SVP General Counsel resigns from the Board
8K filing
Comment Letters httpwwwsecgovArchivesedgardata1065696000000000008014694filename1pdfhttpwwwsecgovArchivesedgardata1065696000000000010023419filename1pdf
103
Delinkage of Incentives Insiders Dumping
Rewarded to Acquire at Any Cost
Insiders have been selling shares aggressively since the IPO when former owners of acquired companies affiliates and management owned 22 Since 2009 insider selling pressure has intensified and now insiders own less than 2
Managementrsquos annual bonuses are tied to revenue growth and long-term incentives are also tied to Revenue EPS and ROE with the following weightings revenue (475) earnings ($475) and ROE at just 5 These metrics incentive management to recklessly acquire revenue and boost EPS
Beneficial Ownership of Insiders vs Revenue and Free Cash Flow Growth
$ in bn
104
And Sell Stock Shortly After Trumpeting the
Merits and Growth Opportunities at Keystone
SEC Form 4 filings show that key members of the management team made timely open market sales shortly after announcing the acquisition of Keystone Automotive Operations Inc on December 5 2013
These sales directly call into question why management would announce one of the largest deals in company history that ldquosignificantly expands its addressable marketrdquo and then abruptly unload stock Our take is that therersquos an increasing disconnect between shareholdersrsquo best interest and managerial incentives
Executive Role Date Shares Wtd Avg Price Type
Wagman PresidentCEO 12102013 25000 $3371 Open Market
Quinn CFO 1292013 15000 $3362 Open Market
12102013 5000 $3431 Open Market
Holsten Chairman 12112013 6025 $3350 Open Market
of the Board 12132013 25975 $3355 Open Market
Greenspan SVP Operations 12132013 20000 $3388 Open Market
Source SEC Form 4 filings
105
Board Lacking Relevant Experience and
Necessary Focus for Adequate Oversight
LKQrsquos Board is comprised of accomplished business executives but only one non-executive member Mr Foster appears to have relevant experience in the auto parts business
Furthermore no other Board members appear to have experience in the scrap metal or related industrial sectors that would be of value to shareholders
Mr Meister and Mr OrsquoBrien both serve on the compensation committee and serve on a combined 24 other Boards which makes us question there focus and commitment to LKQ
Committee Service Current
Director Age Role Main Background Comp Audit Govern Govt Affairs Other Boards
A Clinton Allen 69 Lead Independent Lab Testing x x 3
Kevin Flynn (1) 45 Seed InvestorDiscovery Zone x Chair 1
Ronald Foster 71 Fmr Chairman of Keystone x x 1
Joe Holsten 60 Chairman Waste Management 1
Blyth McGarvie 56 Consumer Products Chair x 2
Paul Meister 60 HealthcareLife Sciences Chair x 8
John OBrien 69 Insurance x Chair 16
Guhan Subramanian 42 AcademicNo Board Exp x x 0
Robert Wagman 48 President and CEO Auto Products 0
William Webster 55 Payday Lending x x 2
(1) Recently deceased in August 2013 and yet to be replaced
Source Company and public information CapitalIQ
106
Governance Concerns Executive Pay
Also concerning is that the compensation committee constituents appear overcommitted The Chairman Mr Meister serves on 8 other boards while Mr OrsquoBrien is listed as serving on 16 other boards We suspect shareholders interests may not be adequately supervised on the matter of compensation with the big time commitments of its committee members
Management annual bonuses are tied to revenue growth and long-term incentives are also tied to Revenue EPS and ROE with the following weightings revenue (475) earnings ($475) and ROE at just 5 This mix of metrics incentivizes management to recklessly acquire revenue and do whatever possible to boost EPS
The CEOrsquos total comp has increased 374 in the past 4 years while free cash flow is up only 9 over a multi-year horizon cumulative free cash flow after acquisitions is nil Approximately 50 of the comp increase has come in stock but as a whole the management team has been net sellers The 6 member management team reaped $129m in compensation for 2012 (up 83 from 2009 comp of $71m)1
(1) Includes consulting comp and incentive comp related to Mr Holsten
9
82
92
100
101
233
374
0 50 100 150 200 250 300 350 400
Free Cash Flow
Total Exec Comp
Adj EBITDA
EPS
Revenue
Share Price
CEO Comp
Wheres the Beef
Cumulative Growth 2009 - 2012
The Misguided Analyst Community
108
LKQ Enlists Firm Associated with Stock
Pumps for Research Coverage Initiation
ldquoOccasionally we find a critic of RedChip who in a fury of madness mistakenly throws us into the ldquopump and dumprdquo category of investor relations firmsrdquo ndashDave Gentry Founder of Redchip1
(1) httpwwwredchipcomblogindexphpredchippresidentpump-and-dump-is-a-pejorative-term-and-rightly-soUZ05RrW1E0w
httpphxcorporate-irnetphoenixzhtmlc=147311ampp=irol-newsArticleampID=933038amphighlight=Photo Source httpwwwredchipcomaboutaboutmainasppage=management
RedChip a firm commonly associated with having promoted speculative and in many previous instances fraudulent companies was among the first to provide research coverage on LKQ
109
RedChip Denounced by the Investing Public
for Promotion of Frauds
CNBC Faceoff Heat Over Chinese Reverse MergersJan 11 2011
Chinese reverse mergers are continuing to make headlines causing investors to take notice and as a result these special types of mergers have come under increased scrutiny
Tuesday on The Strategy Session David Gentry president and CEO of RedChip Companies a business that promotes small-cap companies including Chinese reverse mergers fired back
CNBCs David Faber and partner continue their discussion about Chinese reverse mergers with Dave Gentry president of RedChip a company that promotes these products
Source httpwwwcnbccomid41024808 Source httpglobenewswirecomnews-
release2013010451458410017068enRedChip-Announces-Exit-From-China-Small-Cap-Sectorhtml
RedChip Announces Exit From China Small-Cap SectorJan 3 2013
RedChip Companies Inc (RedChip) an international small-cap research investor relations and media company today announced that it has exited the China small-cap sector and terminated its contracts with its three Chinese clients We made a decision to close our Beijing office months ago and wind down our China operations stated Dave Gentry President and CEO of RedChip Wall Street has for the most part lost confidence in the financial reporting of US-listed Chinese companies We are concerned that Big Four accounting firms were unable to detect financial fraud in companies like Sino-Forest and Longtop Financialldquo Mr Gentry continued When multi-billion dollar funds like Paulson amp Co and The Carlyle Group with their unlimited resources are unable to detect fraud in their Chinese-based portfolio companies when top-tier investment banks like Goldman Sachs are unable to detect fraud in their Chinese-client companies then I think reasonable investors must take a step back and seriously consider whether the potential rewards outweigh the downside risks of investing in US-listed Chinese companies We simply are not willing to take the risk
Prescience Point was on the forefront of identifying Chinese investment scams and has been wary of paid-for research conducted by RedChip
110
LKQ Has Worked Hard to Garner Broader
Analyst Support as a Wall St Darling
Broker Rating Price Target
Barrington Market Perform $3300
BBampT Outperform $3500
BofaML Neutral $3200
CL King Buy $3200
Deutsche Hold $2700
Great Lakes Hold $3300
Stifel Nicolaus Buy $3300
Ray James Outperform $3200
Baird Outperform $3800
Sidoti Buy $3900
Stephens Overweight $3500
FBR Outperform $4000
William Blair Outperform --
Average Price $3420
Date Conferences Presented
52213 BBampT Stephens William Blair
21213 Raymond James Sidoti BofAML
8112 BBampT
52312 Stephens William Blair Deutsche Bank
41712 Baird Barrington
31512 BofA Merrill Lynch
21512 Raymond James Sidoti
82511 CL King ThinkEquity
71211 Jefferies Canaccord Genuity BBampT
41211 Baird Barrington
3711 Raymond James
2010 Raymond James CLK King BofAML Morgan Keegan Gabelli Deutsche Bank
2009 BBampT RBC CL King Morgan Keegan Deutsche JPM
The chorus of analysts are singing buy buy buy The one independent analyst at WellingtonGreat Lakes Research recently downgraded the stock to Hold
111
While JP Morgan Recently Ditched its
Credit Exposure to LKQ Earlier this Year
JP Morgan was Keystone Automotiversquos long-time banker MampA advisor and lead admin agent for its credit facility JP Morgan continued to serve as LKQrsquos lead banker
JP Morgan resigned from its lead banking position in 2013 and appears to have completely severed all ties to the company The significance of this event must be considered as a leading underwriter in high yield bonds JP Morgan mysteriously did not participate in LKQrsquos $600m bond offering thereby sacrificing underwriting fees The bank also assigned key swap contracts to other parties as another credit risk reducing measure
New Counterparty Notional Amount Maturity Fixed Int Rate
Wells Fargo US$250m 101415 15638
Wells Fargo US$60m 103116 11950
Bank of America C$25m 32416 143
Source httpwwwsecgovArchivesedgardata1065696000106569613000044lkq8-khtm
On April 30 2013 JPMorgan Chase Bank NA (JP Morgan) the counterparty on certain of the Companys floating to fixed interest rate swaps assigned its obligations under its swap contracts to Wells Fargo Bank NA and Bank of America NA JP Morgan is no longer a secured lender under the Second Amended and Restated Credit Agreement and therefore assigned its obligation to Wells Fargo Bank NA and Bank of America NA The Company believes Wells Fargo Bank NA and Bank of America NA are creditworthy to perform their obligations as the counterparty to their respective swap contracts The counterparty notional amount maturity date and fixed interest rate of each of the swaps assigned by JP Morgan are listed below
112
Analystsrsquo Views on the Growth Story
are Completely Wrong
Wall St Analyst Views of LKQ
ldquoOpen Ended Growth Story with the Collision Strategy Just Beginning to Unfold LKQ Can Grow Revenues Organically 5-7 and Earnings 15-20 in the Next Several Yearsrdquo
ldquoSecular growth drivers for LKQ include the annual shift to alternative parts versus OEM parts that continues at a rate of 50-100 basis points annuallyrdquo
ldquoLKQ brings professional processes and technology to an under-managed industryrdquo
ldquoLKQs is a preferred partner for insurance companies small auto recyclers seeking a partnerexit strategy and repair shops
ldquoLKQ is a Premium Mid-cap Growth Storyrdquo
Prescience Point View
Sustainable organic growth is likely overstated and closer to 0 ndash 2 in North America European expansion is fraught with problems and a mature and competitive marketplace Earnings growth appears highly engineered with opaque acquisitions and levers for multiple accounting shenanigans being pulled Adjusted free cash flow after acquisitions is the appropriate yardstick to evaluate LKQ
Share shift has stalled and may reverse OEMs with large balance sheets are subsidizing price matching programs and vehicle fleet age has likely peaked
Early mover advantages have eroded auto recycling is now a global business Rampant customer serviceemployee complaints suggest that LKQ is acquiring just to manage earnings and not build a world class operation
Our research suggests not many want to do business with LKQ but rather they have to Insurance companies are introducing new programs such as PartsTrader that will force price compression
LKQ is a poorly constructed roll-up and should not trade at a premium to leading after market auto recycling or industrial distributors
113
Detailed Aftermarket Auto Part and
Metal Recycling Comparables
($ in millions except per share figures)
Stock 13E-14E LTM Enterprise Value Net Price
Price Ent Revenue EPS EBITDA FCF PE EBITDA Sales Debt Tangible
Name Ticker 1102014 Value Growth Growth Margin Margin 2014E 2015E 2014E 2015E 2014E 2015E EBITDA Book
Aftermarket Auto Parts
AutoZone AZO $49000 $21241 23 27 218 104 165x 148x 103x 99x 22x 22x 20x NM
OReilly Automotive ORLY $13299 $15473 63 131 190 105 197x 173x 112x 104x 22x 21x 08x 23x
Genuine Parts GPC $8345 $13630 52 55 88 64 182x 167x 102x 95x 09x 09x 06x 71x
Advance Auto Parts AAP $11564 $8560 493 278 136 55 166x 143x 71x 64x 09x 09x 01x 76x
Monro Muffler MNRO $5581 $1917 99 271 137 84 279x 220x 135x 119x 21x 19x 16x 151x
Uni-Select UNSto $3000 $1104 -02 140 42 59 119x 110x 97x 93x 06x 06x 61x 45x
Pep Boys PBY $1180 $922 47 1458 57 02 200x 148x 61x 56x 04x 04x 25x 13x
Boyd Group BYDUN $3341 $505 193 670 69 38 220x 213x 97x 95x 07x 07x -01x 11x
Max 493 1458 218 105 279x 220x 135x 119x 22x 22x 61x 151x
Average 121 379 117 64 191x 165x 97x 91x 13x 12x 17x 56x
Min -02 27 42 02 119x 110x 61x 56x 04x 04x -01x 11x
Metal Recycling
Steel Dynamics STLD $1910 $6072 44 699 81 24 135x 112x 70x 62x 08x 08x 33x 31x
Comercial Metals CMC $2056 $3468 -03 542 47 -02 199x 133x 88x 71x 05x 05x 31x 21x
Sims Metal SMSMY $924 $2028 -107 1074 27 21 159x 115x 97x 70x 03x 03x 07x 12x
Schnitzer Steel SCHN $2894 $1118 46 1252 41 07 180x 137x 78x 66x 04x 04x 34x 18x
Metalico MEA $240 $233 47 -1455 34 24 480x 218x 76x 66x 04x 04x 66x 14x
Max 47 1252 81 24 480x 218x 97x 71x 08x 08x 66x 31x
Average 05 423 46 15 231x 143x 82x 67x 05x 05x 34x 19x
Min -107 -1455 27 -02 135x 112x 70x 62x 03x 03x 07x 12x
LKQ Corp LKQ $3300 $11846 188 257 135 61 243x 192x 150x 124x 20x 18x 27x 570x
Source Company financials CapitalIQ calendarized estimates
114
Valuation Premium is Unwarranted Relative
to Aftermarket Parts and Recyclers
Source CapitalIQ company filings Averages exclude LKQ
Price 2014E EPS Price to Tangible Book Value
Enterprise Value to 2014E EBITDA Enterprise Value to 2014E Revenues
00x
20x
40x
60x
80x
100x
120x
140x
160x
PB
Y
AA
P
BY
DU
N
UN
Sto
GP
C
AZ
O
OR
LY
MN
RO
ST
LD
ME
A
SC
HN
CM
C
SM
SM
Y
LKQ
Auto Part Distributors Scrap Processors
Average
00x
05x
10x
15x
20x
25x
PB
Y
UN
Sto
BY
DU
N
AA
P
GP
C
MN
RO
OR
LY
AZ
O
SM
SM
Y
SC
HN
ME
A
CM
C
ST
LD
LKQ
Auto Part Distributors Scrap Processors
Average
00x
50x
100x
150x
200x
250x
300x
UN
Sto
AZ
O
AA
P
GP
C
OR
LY
PB
Y
BY
DU
N
MN
RO
ST
LD
SM
SM
Y
SC
HN
CM
C
LKQ
Auto Part Distributors Scrap Processors
Average
00x
100x
200x
300x
400x
500x
600x
BY
DU
N
PB
Y
OR
LY
UN
Sto
GP
C
AA
P
MN
RO
SM
SM
Y
ME
A
SC
HN
CM
C
ST
LD
LKQ
Auto Part Distributors Scrap Processors
Average
115
Detailed Industrial Distribution Comparables
LKQ often refers to itself as a ldquodistributionrdquo company From this perspective LKQrsquos stock is dramatically overvalued relative to some of the best industrial distribution companies in America
($ in millions except per share figures)
Stock LTM Enterprise Value Net Price
Price Ent EBITDA FCF PE EBITDA Sales Debt Book
Name Ticker 1102014 Value Margin Margin 2014E 2015E 2014E 2015E 2014E 2015E EBITDA Value
WW Grainger GWW $26371 $18396 159 79 377x 182x 108x 99x 18x 17x 00x 35x
Home Depot Supply HDS $2430 $10218 88 -115 180x 116x 117x 99x 11x 10x 73x NM
Wesco WCC $9194 $5545 60 35 151x 141x 97x 88x 07x 07x 34x 23x
MSC Industrial MSM $8540 $5214 183 96 203x 174x 104x 90x 18x 17x -04x 39x
Anixter AXE $9322 $3773 58 25 142x 131x 90x 84x 06x 06x 21x 28x
Applied Industrial Tech AIT $4826 $1955 80 38 165x 138x 91x 78x 08x 07x -04x 26x
Max 183 96 377x 182x 117x 99x 18x 17x 73x 39x
Average 105 26 203x 147x 101x 90x 11x 10x 20x 30x
Trim Avg 97 44 175x 146x 100x 89x 11x 10x 13x 30x
Min 58 -115 142x 116x 90x 78x 06x 06x -04x 23x
LKQ Corp LKQ $3300 $11846 135 61 243x 192x 150x 124x 20x 18x 27x 45x
Source Company financials CapitalIQ calendarized estimates
Trim average exludes maximum and minimum
116
LKQrsquos Valuation Premium is Unwarranted
Relative to Industrial Distributors
Source CapitalIQ company filings Averages exclude LKQ
Enterprise Value to 2014E EBITDA Enterprise Value to 2014E Revenues
Price 2014E EPS Price to Book Value
00x
20x
40x
60x
80x
100x
120x
140x
160x
AXE AIT WCC MSM GWW HDS LKQ
Average
00x
05x
10x
15x
20x
25x
AXE WCC AIT HDS GWW MSM LKQ
Average
00x
50x
100x
150x
200x
250x
300x
350x
400x
AXE WCC AIT HDS MSM LKQ GWW
Average
00x
05x
10x
15x
20x
25x
30x
35x
40x
45x
50x
WCC AIT AXE GWW MSM LKQ
Average
117
LKQ is an Ineffective Roll-up Valuation
Beyond the Sum of its Parts Isnrsquot Justifiable
$ in mm 1998-2013 Acq 2011 Acq May 2013 Acq Dec 2013 Approx Total
Estimated Revenues~ growth
~$37000-2
~$1200~20
~$4000~4-6
~$7000NA
$6000Low single digits
Gross MarginContribution
Low 40 if accurate
~430 ~330 Low 30
Estimated EBITDA margin
$4400120
$91076
$33083
$700100
$650108
Purchase Price ~$2100 $347 (1) $272 $450 gt$2700
EVLTM EBITDA -- Acquired 89x Acquired 88x Acquired 64x At best 70x ndash 100x
EVLTM Revenues -- Acquired 068x Acquired 073x Acquired 064x At best 060x ndash 10x
Comments (2) North American Salvage Assets of
diminished value and potentially impaired
value in Heavy Duty Core business value in serious question LKQ has paid big premiums to book
value for these industrial assets
Growth is artificially high in the near term due to rapid store expansion Growth is
expected to slow dramatically as it reaches its market saturating location limit Also LKQ has yet to demonstrate an ability to
drive APU growth in Europe
(3) Acquired from H2 Partners which also
owns the UKrsquos Unipart Auto (a competitor to
ECP) H2 did not appear to extract synergies
between the two so we are skeptical of LKQrsquos ability to drive value between ECPSator
(4) Keystone was previously bankrupt and up for sale for at least a year until LKQ bought it
LKQ has yet to demonstrate any ability
to extract value here and its key markets are fundamentally different from LKQrsquos existing ones
At 70x ndash 100x EBITDA and adjusting for $17bn of debt
outstanding $107m of cash and 3088m shares os our price target is
~$1000 - $1500share( 50 ndash 70 ) downside LKQrsquos current valuation at 15x is a
substantial premium to the sum of its parts at the upper end of
its historical range and a significant premium to all its
stock trading peers
Source Company financials converted from local currencies(1) ECP deal excludes $339m earnout payment made in March 2013(2) Note that in Q4rsquo12 LKQ mysteriously realigned the reporting structure of its heavy-duty salvage yards and removed it as an operating segment to be included within Wholesale North America (p 7 2012 10K)
(3) H2 Equity Acquires Unipart (UK) httpwwwunipartcoukUserFilesFileUnipartAutomotiveH2pressrelease[1]pdf(4) Platinum Equity Seeks Buyer for Keystone Automotive httpwwwreuterscomarticle20130129keystone-platinum-idUSL1N0AXM6U20130129
Over 160 Acquisitions (Salvage Aftermarket
Reman Heavy Duty Etc) Euro Car Parts Sator HoldingKeystone Auto
Operations LKQ Corp
118
Cheap Money Leverage and Bad Deals =
Valuation Expansion
LKQrsquos long-term Enterprise Valuation to forward EBITDA multiple has trended in the 10x ndash 11x range The recent valuation expansion appears to be a function of expansionary monetary policies favoring stocks the companyrsquos use of more leverage to buy low quality businesses as it expand into Europe and we believe a fundamental misevaluation by market participants of LKQ as an effective roll-up
We believe investorsrsquo are discounting perfect execution and unrealistic growth expectations for a company with significant fundamental challenges and lacking operational excellence as indicated by
An ldquoFrdquo rating by the Better Business Bureau
28 our of 5 ranking on Employee Review site Glassdoorcom
Our conversations with industry participants
500x
700x
900x
1100x
1300x
1500x
1700x
1900x
Enterprise Value NTM EBITDA Long-Term Average
QE Leverage Fueled Valuation Expansion on Bad Acquisitions
LKQrsquos EV NTM EBITDA Historical Valuation
Appendix
120
Does LKQ Have Too Cozy a Relationship
with its Auditors
According to the SEC at the onset of the WM fraud the Company capped Arthur Andersens audit fees However WM advised AA it could earn additional fees for special work mdash eg consulting services Over the succeeding years AAs corporate audit fees remained flat while the fees for special work multiplied
Despite enormous revenue growth and international geographic expansion LKQrsquos audit and total fees paid to auditors have barely increased Oddly enough tax planning fees have fallen at the fastest pace despite LKQ having reported progressively growing international earnings and cash flow
$ in millions
2008 2009 2010 2011 2012 CAGR
Audit Fees $182 $160 $170 $197 $204 29
Audit-Related $005 $009 $030 $028 $012 211
Tax Fees $063 $075 $062 $032 $035 -140
All Other Fees $012 $000 $000 $000 $000 -1000
Total Fees $263 $244 $261 $257 $251 -12
Annual Growth
revenues 694 73 206 324 261 212
employees 55 42 200 492 134 162
Sales by Geography
US 1000 1000 1000 1000 831 78 (1)
Europe 00 00 00 00 169 22(1)
(1) as of LTM 93113 Source Company filings
121
LKQ Received the Coveted ldquoFrdquo Grade
by The Better Business Bureau
httpwwwbbborgchicagobusiness-reviewsauto-parts-and-supplies-used-and-rebuiltlkq-in-chicago-il-12010519
122
Insider Views from Glassdoor
Source httpwwwglassdoorcomReviewsLKQ-Reviews-E20395htmsortsortType=RDampsortascending=false
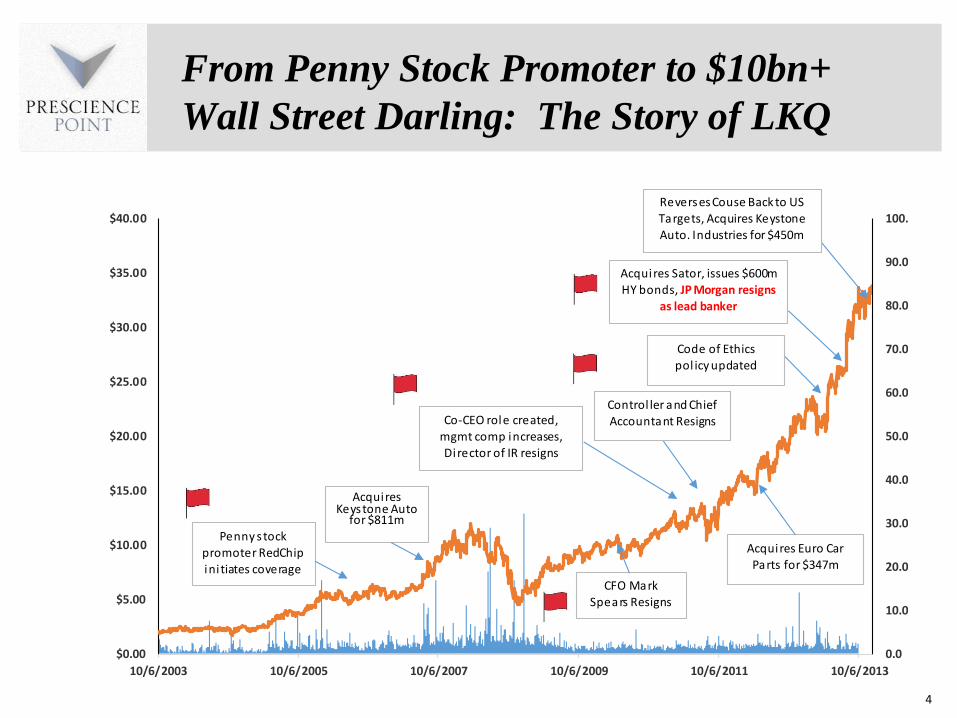
00
100
200
300
400
500
600
700
800
900
1000
$000
$500
$1000
$1500
$2000
$2500
$3000
$3500
$4000
1062003 1062005 1062007 1062009 1062011 1062013
Penny s tock promoter RedChipini tiates coverage
Acquires Keystone Auto
for $811m
Co-CEO role created mgmt comp increases Di rector of IR resigns
CFO Mark Spears Resigns
Acquires Euro Car Parts for $347m
Code of Ethics pol icy updated
Acquires Sator issues $600m
HY bonds JP Morgan resigns
as lead banker
Control ler and Chief Accountant Resigns
Reverses Couse Back to US Targets Acquires Keystone Auto Industries for $450m
4
From Penny Stock Promoter to $10bn+
Wall Street Darling The Story of LKQ
5
Prescience Point Believes
Caught in a Massive Margin Squeeze Gross Margins Are In Persistent Decline and Inventory Accounting Methods Are Likely Blunting the True Problems North American Organic Growth Very Likely To Be Overstated and Not Reconcilable to Our Research
1
2
3Problems With the New Growth Story To Divert Attention from its North American Problems LKQ Bolted to Europe in Hopes of Spinning a New Growth Story Our Research Suggests LKQ is Already Facing Problems and Quickly Scrambling to Cover
4
Previous Accounting Fraud and Failures at Waste MgmtDiscovery Zone Associated With Numerous Members of the Management Team Have Cost Shareholders Billions of Lost $rsquos in Aggressive Roll-up Strategies
5
Price Target $10 - $15 per share gtgtgt 50 ndash 70 Downside
Dramatic Overvaluation to Aftermarket Auto Recycling and Industrial Distributors and Supported by Sell-Side Analystsrsquo Failing to Question Assumptions and Not Considering the Fundamental Problems Facing the Company
LKQ Is An Ineffective Roll-up The Company Has Generated No Cumulative Free Cash Flow Adjusted for Acquisitions and Becoming Increasingly Dependent on External Capital to Perpetuate the Illusion of GAAP Profits LKQ Will Need Larger and Larger Targets to Keep the Growth Game Alive
6
Report Highlights (contrsquod)
High-Level Indications of Fabricated GAAP Profits Unsustainable Business Model LKQ is a classic roll-up fueling growth through acquisitions Roll-up business models provide management with a significant amount of discretion in presenting financial results Roll-ups tend to exhibit strong earnings CFO and earnings quality metrics due to the inherent financial statement mechanics of paying for growth through acquisition outflows which do not affect earnings or CFO Because of this free cash flow after acquisitions is an important metric for analyzing roll-ups it presents a better picture of the businessrsquos economics LKQrsquos free cash flow after acquisitions has been negative in 8 of the last 9 years
Furthermore our analysis indicates LKQ is an ineffective rollup ndash wealth creation from years of acquisitions has been nil Since 2007 LKQ has reported cumulative Earnings and EBIT of $122B and $215B respectively Meanwhile it has burned cumulative free cash flow after acquisitions of -$162B and raised cumulative net capital of $163B suggesting it has never earned a cash-on-cash return on invested capital Put another way the immense wealth generation represented by LKQrsquos historical GAAP profits is not observable in the companyrsquos cash flows ndash it appears to be lsquopaperrsquo wealth generated by accounting gimmickry
In light of this and a broad array of other red flags discussed in this report we are forced to look through managementrsquos representations We believe the credibility of LKQrsquos financial statements is questionable and that LKQ bears a heightened risk of a crippling inventory andor goodwill write-down or financial restatement
Reported Organic Growth for LKQrsquos North America Business Appears Overstated LKQrsquos aggressive roll-up strategy also gives it a high level of flexibility to inflate revenue growth LKQ reported organic revenue growth averaging ~65 from 2008 ndash 2012 and ~6 for its North America (NA) Parts amp Services (PampS) business (~75 of PampS revenue) with far less variability vs comps and not a single quarter of negative growth LKQ does not provide clarity around the calculation or the impact on earnings making it difficult for investors to confirm its validity However based on our research LKQrsquos reported organic growth rate does not appear reconcilable with trends in the primary fundamental factors that drive it We believe it is overstated We believe LKQrsquos NA growth rate normalized for a 2013 spike in collision frequency more likely measures in the range of 0-2
From 2008 to 2012 annual insurance claims paid for repairable accident claims have been flat according to industry consultant The Romans Group LLC Additionally from 2010 to 2012 growth in Alternative Parts Usage (ldquoAPUrdquo) (ie market share of alternative auto parts which LKQ sells relative to OEM parts) which had risen steadily for 3 decades and was a primary driver of LKQrsquos historical organic growth has flat-lined going forward CCC Information Services ndash provider of the industryrsquos dominant estimate writing platform and LKQrsquos source for APU data ndash expects it to taper or reverse Based on industry data sources and our conversations with industry sources this is resulting from a recent expansion in OEM price-matching programs they have become more aggressive in pursuit of retaking lost market share by undercutting alternative parts prices thereby negating LKQrsquos value proposition Internal dealer documents we have obtained indicate the OEMs are increasingly subsidizing dealers to sell parts at levels 33 below aftermarket list prices (ie LKQrsquos price) making them whole on the loss and paying them an additional 14 profit on the cost for the part (Refer to dealer source document on page 12) As a result for the first time ndash according to Mitchell International ndash parts prices in general deflated in 2012 LKQ management tells investors APU rose 100bp in 2012 however their own data source and LKQrsquos SEC filings refute their claim
7
Report Highlights (contrsquod)
Short-Term Thinking Pervades Decision-Making Signals Desperation to Keep Financials Inflated amp Meet Targets With NA growth waning LKQ looked to Europe for acquisition candidates In Q4rsquo2011 it made its 2nd largest acquisition ever acquiring UK-based Euro Car Parts (ECP) a distributor of mechanical aftermarket parts operating out of 89 branchstore locations As LKQ pitched investors on the open-ended growth opportunity provided by buying ECP to our knowledge it never publicly disclosed that the UK aftermarket parts industry was in significant contraction (2011E -58 according to Datamonitor) or that it is projected to continue contracting but LKQ touted ECPrsquos 30+ lsquoorganicrsquo revenue growth rate from 2009-2011
Now 2 years separated from the date of acquisition and with its industry still weak LKQ continues to report 30 organic growth rates for ECP which would seem to defy logic It shouldnrsquot LKQ does not define ECPrsquos lsquoorganic growthrsquo in the way investors might expect for a business characterized by storefronts (ie as same store sales growth) it defines it to include both SSS and revenue generated by newly opened ECP stores As such LKQrsquos reported organic growth rate is fueled by opening new ECP branches the more new ECP stores LKQ opens in a given period the more it can inflate its consolidated organic growth rate
Rapidly expanding the number of ECP branches was not an LKQ priority when it announced the acquisition evident in guidance issued on LKQrsquos ECP MampA call (held on 10411) ldquowe have a plan to grow 10 to 12 branches per year for the next few yearshellip to complete out the major UK marketsrdquo Within just a few months ndash apparently a direct response to NA growth weakening and the threat of a guidance miss ndash LKQ abandoned its plan throughout 2012 it repeatedly raised its guidance for the number of stores to be opened in 2012 from 20 to 30 and finally to 42 By Q4rsquo2012 based on our estimates ECP accounted for a full 75 of consolidated PampS organic growth up from ~4 only one year prior In 2012 ECP also started running periodic steep online sales promotions (30-45 discounts) of parts across the board ndash with many promotions implemented right at the end of the quarter just ahead of reporting to investors indicating an obsessive desire to meet financial estimates The combination of a ramp-up in branch openings and steep discounting juiced LKQrsquos organic growth rate just enough for it to hit the low end of guidance for 2012 PampS organic growth
LKQ has also repeatedly raised guidance for the maximum number of full-sized ECP branches the UK market can absorb from 120 to 150 to 175 to 200 giving it further room to continue ramping the number of branch locations At YErsquo2012 LKQ operated 130 branches in only one year surpassing the store count it initially guided would result in saturation of the UK market 120 On the Q1rsquo2012 earnings call LKQ CEO Wagman raised his projection for the market-saturating branch count to 150 stating that at that number ldquobranches in major metropolitan areas can be 5 miles or so apartrdquo and that ldquotheres not necessarily cannibalizationrdquo should they be LKQ has since raised the ceiling on the maximum branch count to 200 hinting of desperation
LKQ appears to operate ECP with the primary intent of unsustainably inflating its financials and meeting guidance targets at the long term shareholder expense of entrenchment in a contracting market Inevitably as ECP reaches its market saturating location capacity we expect ndash and we believe management has anticipated ndash its reported organic growth rate to plummet and converge to the industry average
8
Report Highlights (contrsquod)
Increasing Dependency on Acquisitions to Inflate Financials Conceal Cumulative Manipulations LKQrsquos gross margins have been in persistent decline contracting from 471 to 41 from FY 2005 to the LTM period ended 9302013 We believe the decline is in part the result of the reversal of cumulative past accounting manipulations while at the same time competitive and pricing pressures are intensifying it appears that over time LKQrsquos is growing increasingly dependent on ever larger acquisitions to prevent an unraveling of its financials As previously mentioned due to the inherent mechanics of acquisition accounting acquisitions have a flattering but unsustainable effect on earnings and CFO that has nothing to do with the performance of the business When the benefit expires a hole is left to be filled in its place just to maintain the status quo
LKQ has been rapidly accelerating its deal making both in quantity of deals and in dollar value Within the past 2 years LKQ has made 3 of 4 of its largest acquisitions ever LKQ acquired 30 companies in 2012 alone against the backdrop of having acquired a total of 71 companies in the 3 years from 2010-2012 and over 170 since its 1998 inception Notably LKQ reported a record 17 acquisitions in just Q4rsquo12
Yet despite this LKQ missed dramatically on 2012 CFO guidance which came in 19 below revised guidance issued on 10252012 only 2 months before year end Making the most acquisitions it has ever made in a quarter a gaping hole in CFO exposed itself indicates LKQ may be making acquisitions as we believe in order to inflate its financials and paper over past accounting manipulations Management justified the miss as primarily attributable to an investment in inventory that wasnrsquot exactly anticipated An alternative explanation is that the cumulative deal size was insufficient to bail the company out
We believe LKQ entered Europe in search of a fresh pool of large-scale acquisition targets After purchasing ECP ndash its 2nd largest purchase ever at the time ndashin Q4rsquo2011 LKQ began unsustainably juicing its organic revenue growth rate via the rabid opening of ECP stores something completely outside of its plans for the company when it acquired the company Because of these openings ECP currently accounts for ~50 of LKQrsquos organic revenue growth We believe as ECP branch openings slow and new stores mature its reported organic growth rate will plummet from current levels converging to the negative industry rate of growth and resulting in a new hole LKQ will predictably seek to plug with more acquisitions Operating ECP as it has with seemingly little regard for building long term value may be an indication of desperation to keep its financials together as it searched for a larger target
LKQ moved quickly buying mainland European company Sator in April 2013 amounting to its 3rd largest purchase ever at the time As a result its European reporting segment now includes both ECP and Sator This new reporting will obscure future financial deterioration at ECP
In December 2013 it acquired Keystone Automotive Operations a company distributing a fundamentally different type of automotive product from that of its core business The acquisition was LKQrsquos 2nd largest ever
We believe managementrsquos short-term focus on managing the business to hit financial guidance is unsustainable LKQrsquos increased pace of deal making as gross margins deteriorate are supportive of questioning the companyrsquos motives
9
Report Highlights (contrsquod)
Gross Margins (GMs) Appear Inflated as Inventory Turnover is Stable Caught in a massive margin squeeze with used auto parts prices deflating and salvage vehicles rising LKQrsquos GMs have been in persistent decline since 2005 down 590bps while consolidated inventory turns have been relatively stable We believe there is more deterioration in LKQrsquos GMs than observable on the Income Statement We believe LKQ may pull 2 primary accounting levers to manipulate GMs and inventory turns
1 Aggressive Inventory Policy Enables Overstatement of Inventory ndash LKQ uses an aggressive policy for accounting for its Salvage and Remanufactured Inventory that allows for a high level of discretion which management can use to inflate gross margin by leaving costs on the balance sheet in the form of overstated inventory The recent surge in LKQrsquos salvage inventory coupled with gross margin deterioration is consistent with this trend and the overall concern of costs being left on the balance sheet In isolation this policy results in inflated gross margins and CFO and exerts downward pressure on the rate of inventory turnover The generally high level of Salvage amp Remanufactured inventory ndash to which the aggressive policy applies ndash is a high level sign the company may be manipulating its margins We believe LKQ is likely inflating its gross margin and earnings by failing to record a necessary expense for excess and obsolete inventory Omissions of expensing obsolete inventories result in future margin compression
But the surge in Salvage amp Remanufactured inventory the account subject to the aggressive inventory accounting policy serves as a higher level sign that margins and CFO may be manipulated How would LKQ be able to keep consolidated inventory turns from declining in the face of GM manipulation
2 Acquisition Accounting Enables Understatement of Acquired Inventories ndash The acquisition fair market value process enables LKQ to understate the values of acquired company inventories and to allocate the plug figure to goodwill The result is that inventory costs which should be future period expenses can be instead permanently deferred Based on conversations with a recycled auto consultant who consults recycled parts distributors that are selling to LKQ we estimate acquired inventory values make up 33-67 of the acquisition purchase price (adjusted for real estate) From 2003-2012 LKQ has allocated only 227 of the cumulative acquisition purchase price (ex PPampE) to inventory which would be consistent with utilizing this policy In isolation this would result in inflated gross margins and CFO and exert upward pressure on the rate of inventory turnover thereby counterbalancing the downward pressure caused by increases in Salvage and Remanufactured inventory and stabilizing consolidated inventory turnover
We believe LKQrsquos GMs will continue to decline through 2014 against the backdrop of intensifying pricing pressures and as past accounting overstatements have to be reversed we believe LKQ is at elevated risk of a crippling goodwill write-down As of 93013 LKQ carries $21bn of goodwill + intangibles on its balance sheet (47 of Assets 92 of Book Equity) for a collection of industrial assets that would ordinarily sell for little premium to book value We note that LKQ attempts to explain GMs declining as a function of rising costs to acquire salvage vehicles However the Manheim Index peaked in 2011 and has already started to decline When asked for guidance on a sustainable gross margin target LKQ still cannot give investors any clear guidance on the matter and now cites the move into Europe as a complicating factor for the decline
10
Report Highlights (contrsquod)
LKQrsquos Business Strategy and Trajectory Right out of the Waste Management Playbook LKQ was founded in 1998 by Donald Flynn with the financial backing of Dean Buntrock and AutoNation Inc led by Wayne Huizenga Flynn Buntrock and Huizenga were all previously executives of Waste Management Inc (WM) a company notorious for having perpetrated a massive multi-year financial fraud resulting in the largest restatement in corporate history at the time
Following a board-led probe of the companyrsquos accounting practices in 1997 WM was forced to restate its financial statements for the period 1992 ndashQ3rsquo1997 acknowledging that it had misstated its pre-tax earnings by approximately $17 billion and took a $35 billion charge The SEC charged certain executives with financial fraud According to the SEC complaint ldquodefendants fraudulently manipulated the companys financial results to meet predetermined earnings targets The companys revenues were not growing fast enough to meet these targets so defendants instead resorted to improperly eliminating and deferring current period expenses to inflate earningsrdquobull Donald Flynn (LKQrsquos founder) was a Waste Management Audit Committee member from 1994 until 1997 ndash a period at the heart of the perpetuation
of the fraud ndashand also served as Audit Committee Chairman during a period coinciding with the fraud He was previously WMrsquos CFO from 1972 ndash1989
bull Dean Buntrock (an LKQ founding backer amp former director) co-founded WM with Wayne Huizenga (LKQ founding backer) Buntrock was WMrsquos CEO during the period of the fraud and according to the SEC complaint ldquothe driving force behind the fraudrdquo
Waste Managementrsquos aggressive rollup strategy gave its management a high level of flexibility to inflate revenue growth and margins and to conceal doing so for years Many individuals previously associated with Waste Management would go on to build businesses using the WM playbook Specifically a closely-knit group of WM alumni and associates (including LKQrsquos founders) have repeatedly co-invested in and built several companies with each company replicating WMrsquos aggressive roll-up or an acquire-and-build strategy either setting out to consolidating a fragmented industry or flooding an industry with store openings in an effort to build a dominant market position as quickly as possible Some of these companies include Blockbuster Video Discovery Zone Boston Chicken AutoNation Swisher Hygiene and LKQ
Many of these companies have either failed to deliver on their sales pitches to investors failed outright or were tarred by allegations of fraud manipulative accounting andor unjust management enrichment Based on our analysis in the majority of cases these WM alums and associates built businesses with the intent to create the illusion of growth as opposed to focusing on creating value through operational excellence resulting in little to no lasting value
In light of our belief that LKQ is inflating its financials it is worth noting that Discovery Zone another company previously founded by LKQ founder Donald Flynn ndash and in which Dean Buntrock Wayne Huizenga and several other WM alums were associated -- similarly utilized an acquire-and-build strategy It ended up in bankruptcy and was alleged to have engaged in accounting manipulations Many current and former officers ndash notably accounting officers ndash from both WM and Discovery Zone are current and former accounting officers with LKQ (refer to page 13) We also note that in light of our opinion that LKQ may be engaging in inventory accounting shenanigans LKQrsquos Director of Accounting and Inventory was previously employed by both WM and Discovery Zone
11
Report Highlights (contrsquod)
Flawed Corporate Governance Rewards Bad Practice We believe that managementrsquos incentive structure is at the foundation of its failed capital allocation record Management is rewarded by the roll-up strategy with annual bonuses and incentives incentivizing empire-building at any cost Annual bonuses are tied to revenue growth and long-term incentives are tied to Revenue EPS and ROE with the following weightings revenue (475) earnings (475) and ROE (5) There are no stipulations that revenue has to be organic and therefore the management team is perfectly incentivized to acquire and overpay for revenue and game the accounting to inflate profits
The CEOrsquos total comp has increased 374 in the past 4 years while free cash flow is up only 9 in the same period Approximately 50 of the comp increase has come in stock but as a whole the management team has been net sellers of stock Insiders have sold shares aggressively since the IPO when former owners of acquired companies affiliates and management owned 22 Since 2009 insider selling pressure has intensified with insiders currently owning less than 2 Insiders even sold stock recently in Dec 2013 just days after touting the merits of the Keystone deal There is now an almost complete break in the linkage between shareholder interests and executive wealth
In another cautionary sign in an 8-K filing during April LKQ revealed that JP Morgan was no longer a secured lender under its credit agreement JP Morgan had supported both Keystone and LKQ for a number of years While we do not know the why the relationship was severed when a bulge bracket investment bank turns away from a fee generating client of LKQrsquos size there is risk of smoke before fire
Valuation as a ldquoPremium Midcap Growth Storyrdquo is Unwarranted We believe The Streetrsquos view of LKQ as a proven acquirer with an ldquoopen-endedrdquo growth opportunity does not stand the test of logic Trading at 2x 15x and 25x 2014E sales EBITDA and EPS respectively LKQrsquos stock is priced at an unjustified premium to Aftermarket Auto Metal Recyclers and Industrial Distribution peers and fails to reflect few if any of the serious issues our research highlights Specifically our analysis indicates LKQ appears to be engaging in aggressive deal-making and accounting to manufacture GAAP profits and appears to make bad economic business decisions in order to meet predetermined financial targets We believe that management has taken to masking the companyrsquos weakening growth prospects by gaming the accounting to inflate organic growth and that it is dependent on ever-larger acquisitions to keep the growth story alive while insiders cash out As a result of our concerns over the integrity of its financial reporting we believe LKQ is at high risk of having to restate its historical financial results We believe the growth story management has spun to investors is a bill of goods Given concerns about the reliability of its financial statements we believe the company has an intrinsic value of $10 ndash $15 per share close to its book value representing 50-70 downside from the current price
12
LKQrsquos Only Competitive Advantage is Pricehellip
GMrsquos Price Matching Program Is Designed
Specifically to Thwart LKQ
Keystone List Price
OEM price-match 33
discount from Keystone
Price (Keystone list has
generally been 20-25
less than OEM OEM is
now undercutting
Keystonersquos price by 33)
GM reimburses dealer
for loss on part cost
GM pays dealer 14
return on part cost
We have sourced an internal GM dealer document detailing GMrsquos price-matching program ldquoBump the Competitionrdquo We are told it specifically targets LKQ-Keystone GM subsidizes dealers to sell parts (in this case a fender and a door) at levels 33 below aftermarket list prices makes them whole on the loss and pays the dealer an additional guaranteed 14 profit on the cost for the part
Source Felders Collision Parts Inc v General Motors Company et al Complaint Exhibit 4 filed 10122012
Same Players Same Strategy Results
Marred by Accounting Irregularities amp Failures
13
John MelkInvestor
Charged with accounting fraud one
of the largest in history
Aggressive rollup strategy
Discovery ZoneBlockbuster Boston Chicken AutoNation Swisher Hygiene
Dean BuntrockCo-founder CEO
Dean BuntrockInvestor Franchisee
Dean Buntrock Founding Backer Director
Dean BuntrockInvestor Director
Donald FlynnCFO Director -Audit Committee
Donald FlynnInvestor
Donald FlynnFounding Backer Director
Donald Flynn Founder
Donald FlynnCEOChairman
John MelkPresident WM International
John MelkFounding Backer Director
John MelkFounding backer Director
John MelkInvestor Director
Lawrence BeckCo-founder
Lawrence BeckInvestor Franchisee
Lawrence BeckInvestor Franchisee
Peer PedersenDirector
Peer PedersenInvestor Franchisee
Peer PedersenDirector
Peer PedersenInvestor
Scott BeckInvestor COO Vice Chairman
Scott BeckInvestor
Scott BeckCEOChair
Steven BerrardCFO then CEO
Steven BerrardCo-founder Co-CEO
Steven BerrardCEO Director
Victor CassiniGen CounselSecretary
Victor CassiniGen Counsel Secretary
Wayne HuizengaCo-founder
Wayne HuizengaCEOChairman
Wayne HuizengaInvestor (via Blockbuster)
Director
Wayne HuizengaInvestor
Wayne HuizengaFounder Co-CEO
Wayne HuizengaChairman
Wayne HuizengaFounding backer (via
AutoNation)
Bought out by Viacom for $84B
Aggressive acquire-amp-build
strategy
Goes bankrupt Allegations of fraud
Aggressive acquire-amp-build
strategy
Goes bankrupt Accounting gimmicks to obscure financials
Aggressive acquire-amp-build
strategy
$$ Billions Lost Pooling of Interests
acquisition accounting
Aggressive rollup amp acquire-amp-build strategy
Accounting irregularities
Financials restatementAcquisition Accntng Issues
Ongoing SEC inquiry
Aggressive rollup strategy
An array of accounting
red flags amp misrepresentations
Aggressive rollup amp acquire-amp-build strategy
Dean BuntrockFranchisee
Steven BerrardCEO post-Viacom
LKQ
14
WM and DZ ndash Previous Employers of Many
LKQ Executives amp Accounting Personnel
Flynn Enterprises Common Shareholder
John QuinnVarious Positions
John QuinnSVP and CFO
Mark SpearsController Head Acct
Mark SpearsFormer SVP CFO
Frank ErlainFmr VP Finance
Controller Accountant
Victor CasiniGen Counsel amp
Secretary
Walter HanleyAsso Gen Counsel
Walter HanleySVP Development
Victor CasiniGen Counsel amp
Secretary
Ken FreseAcctrsquog Mgr
Ken FreseAccountant
Ken FreseDir Accounting amp
Inventory
Joe HolstenCOO CEO WM Intrsquol
Joe HolstenFmr CEO Chairman
Frank ErlainVP amp
Controller
Sinon GalvinSVP Revenue Optimization
Sinon GalvinVarious Positions
WM Intrsquol
Fraud Allegations Improper Capitalization of Expense Files for Bankruptcy March 1996
Charged w $17 billion Accounting Fraud March 2002
Stephen EckelDir Oracle Fin Apps
Fmr AcctrsquogAss Contrsquoller
Stephen EckelAssistant Corporate
Controller
Source SEC filings LinkedInreg
Kevin FlynnFormer Director
Kevin FlynnVP Midwest
Vaughn HooksChief Tax Officer
Vaughn HooksVP Taxes
Dan ShoenerVP
Dan ShoenerVP of Finance
LKQ
15
Current Capital Structure
LKQ Corp Capital Structure
$ in mm except per share amounts
Stock Price $3300 Metrics LTM 93013 2013E 2014E 2015E
Shares outstanding 3006 EVSales 25x 23x 20x 18x
Net Options $704 avg strike 56 EVEBITDA 193x 189x 150x 124x
RSUs outstanding 26 PriceEPS 333x 306x 243x 192x
Fully Diluted Shares 3088 DebtEBITDA 29x 28x 22x 18x
Market Capitalization $101909
Debt Outstanding Rate Maturity Unused Covenants
Receivables Securitzation $100 101 2015
Term Loan A $4444 308 2018 max lev 35x min EBITDA cov 30x
Revolver (1) $6498 308 2018 $7000 max lev 35x min EBITDA cov 30x
Senior Unsecured Notes $6000 475 2023
Notes Payable $389 180 2018
Other Debt $189 350 NA
Total Debt $17621 361
Less Cash $1073
Total Enterprise Value $118456
1) Assumes $450m Keystone acquisition is fully funded on the revolver as per company press release
Background and Business
Background ndash LKQ Corp
LKQ Corporation (LKQ) a wholesale replacement auto parts distributor was founded in 1998 by Donald Flynn and with the financial backing of Dean Buntrock and AutoNation Inc the automobile retailer founded and led at the time by Wayne Huizenga Flynn would recruit Joseph Holsten to serve as LKQrsquos CEO1 Flynn Buntrock Huizenga and Holsten are all former executives of Waste Management Inc (WM)
LKQ has set out to consolidate the fragmented wholesale alternative auto parts industry by implementing an aggressive roll-up strategy fueling growth through acquisitions Since 1998 LKQ has grown through over 171 acquisitions primarily in the US and Canada becoming the largest provider of aftermarket amp recycled collision auto parts in North America
In May 2006 the company acquired Keystone Automotive Industries Inc (Nasdaq KEYS) a provider of aftermarket vehicle collision replacement parts for $4800 per share in cash or $811m in total enterprise value The deal was the largest in the companyrsquos history
In October 2011 LKQ expanded into foreign markets with the acquisition of UK-based Euro Car Parts Limited this was followed by the April 2013 acquisition of Netherlands-based Sator Holding Using an acquire-and-build strategy to grow in Europe LKQ has become one of the largest European suppliers of mechanical aftermarket auto parts LKQ generated $41B of revenue in 2012 split 7232 between North America and Europe
LKQrsquos business strategy ndash and as later discussed the strategies of numerous other companies founded by the aforementioned and other former Waste Management executives ndash appears taken right out of WMrsquos old playbook The following slide provides a brief elaboration of Waste Managementrsquos strategy and significant events in relation to LKQrsquos founders
(1) International Directory of Company Histories Vol 71 St James Press 2005 17
18
Background ndash
Waste Management Inc 1968-1998
In 1968 Dean Buntrock and Wayne Huizenga (both LKQ founding backers) along with Lawrence Beck founded Waste Management (WM) In 1972 Donald Flynn (LKQrsquos founder) joined WM as CFO WM set out to consolidate the highly fragmented garbage hauling industry via an aggressive roll-up strategy By the time WM went public in 1971 it had acquired 133 garbage haulers and was generating gt$10m in revenue In the first 9 months of 1972 it had acquired another 133 firmsand generated FY 1972 revenue of $72m From 1971 to 1980 WMrsquos revenue grew at a rate of 48 per year reaching $656m in revenue in 1980 By 1986 WM had become the largest waste disposal firm in the world
Donald Flynn was given credit as the ldquofinancial geniusrdquo behind Waste Managementrsquos extraordinary growth from the 1970s to the early 1990s in a 1993 corporate history commissioned by the company
By the late 1980rsquos and early 1990rsquos WM had undertaken a botched international expansion in a push to become the worldrsquos first global lsquoenvironmental servicesrsquo company ldquoThat ambition led Waste Management to acquire a range of profit-draining businesses The eventual result was angry shareholders turmoil in the board room and a disruptive series of management purges and sudden resignations followed by revelations (in late 1997) of accounting irregularitiesrdquo
Buntrock remained as CEO until 1996 and Flynn as CFO amp director until 1989 amp 1997 respectively
From 1994 until 1997 a period at the heart of the perpetration of the fraud Donald Flynn was a Waste Management Audit Committee member the panel responsible for overseeing accounting policies and procedures and also served as Audit Committee Chairman during a period coinciding with the fraud
According to the SEC former WM CEO Dean Buntrock was ldquothe driving force behind the fraudrdquo and that ldquoHe was the primary beneficiary of the fraud and reaped more than $169 million in ill-gotten gains from among other things performance-based bonuses retirement benefits charitable giving and selling company stock while the fraud was ongoingrdquo
Additional source httpwwwsecgovnewsheadlineswastemgmt6htm
In 1997 a new CEO ordered a review of WMrsquos accounting practices The probe turned up a massive financial fraud that went undetected from 1992ndash1997 The fraud involved inflated asset values and profitability resulting in a $35B charge in 1998 and the largest financials restatement in history at that time SEC charges ensued
Background ndash LKQ Corporate Evolution
LKQ began in 1998 to roll-up wholesale recycled auto parts distributors (ie salvage yards) establishing a network of such businesses and serving the collision repair industry By 2003 it had become the largest provider in the fragmented recycled products market in the US
LKQ soon began diversifying through acquisitions of aftermarket recycled refurbished and remanufactured product suppliers and manufacturers and self service retail businesses
In October 2007 LKQ made a transformative acquisition in buying Keystone Automotive Industries Inc becoming the industryrsquos dominant distributor of both recycled and aftermarket products in the US Keystone is LKQrsquos largest acquisition to date costing $811m Keystone generated ~$730m in revenue in 2007 As a result of the acquisition LKQrsquos Parts and Services revenue split shifted from 7129 to 3961 recycled products vs aftermarket products
In 2008 LKQ entered the heavy-duty truck parts recycling industry through various acquisitions The heavy-duty truck parts recycling industry has operating and sales functions that are similar to the auto recycled parts business
In October 2011 LKQ made its third largest purchase in its history expanding to the United Kingdom with the acquisition of Euro Car Parts Holdings Limited (ECP) ECPs product offerings are primarily focused on wholesale automotive aftermarket mechanical products LKQ purchased ECP for a total consideration (including earnouts) of $432m ECP generated $5096m in revenue in 2011 and had grown revenue at a CAGR of 33 from 2009-2011 As of October 2013 ECP operated out of 138 branches supported by a national distribution center
In May 2013 LKQ made its second significant acquisition in Europe buying Sator Holding an automotive aftermarket parts distribution company based in the Netherlands with operations in the Netherlands Belgium Luxembourg and Northern France LKQ bought Sator for $272m (EUR 210m) Sator generated $374m in revenue in 2012 The acquisition expanded LKQrsquos geographic presence in the European automotive aftermarket products market into continental Europe
Sources LKQ 10-K for 2012 10-Q for Q2rsquo2013 2007 Investor Presentation httpwwwlkqcorpcomusenabout-usaspx 19
Acquisition of Keystone Automotive Results in Dominant Competitive Position as a US Aftermarket Parts Distributor
Recent International Expansion with 2 Large-Scale Acquisitions European Aftermarket Parts Distributors
Background ndash LKQ Business Overview
LKQ provides alternative auto parts used for vehicle repairs Alternative auto parts can be used in vehicle repairs in place of new branded auto parts made by vehicle manufacturers or ldquoOEMsrdquo
To be clear buyers of replacement auto parts have 5 options to choose when repairing their vehicles
1 New OEM parts ndash branded auto parts produced by vehicle manufacturers (ie ldquoOEMrdquo)
2 Aftermarket parts ndash new generic parts that were not produced by the OEMs LKQ sources the majority of the aftermarket parts it sells in North America from Taiwan and other Asian countries
3 Recycled products ndash used parts that were originally produced by OEMs LKQ sources its recycled inventories by buying salvaged vehicles at auction then disassembling them at its salvagejunk yards
4 Refurbished parts ndash used products that have been refurbished LKQ processes these from cores obtained from salvage vehicles
5 Remanufactured parts ndash used products that have been remanufactured LKQ processes them from cores obtained from its salvage operations
The value in using alternative parts in place of new OEM parts is that they have traditionally been less expensive
Source LKQ 10-K for 2009 and 2012 20
or any of the below alternative auto parts all of which LKQ provides
For example if you get into an accident and need to replace the vehicle bumper you have 3 options
1 Replace it with a new branded bumper manufactured by General Motors (ie a new OEM part)
2 Get a new generic bumper that was made in Taiwan (ie an ldquoaftermarket partrdquo)
3 Get a bumper from the junkyard (ie a ldquorecycled partrdquo)
Options 2 and 3 are examples of alternative parts There are others discussed below
According to its filings ldquoWe compete with the OEMs primarily on price and to a lesser extent on service and
qualityrdquo In essence LKQ sells nothing more than commodity products which we will show has a diminishing
competitive price value proposition Furthermore numerous customer complaints and an ldquoFrdquo Rating from the
Better Business Bureau (see Appendix) severely calls into question its service and quality performance
21
Background ndash LKQ Revenue Growth
Driven by APU
LKQ sells its products and services primarily to collision repair shops (ie lsquobody shopsrsquo) but insurance companies are its lsquoindirectrsquo de facto customer Pressure exerted by insurance companies on body shops to hold claims costs down by using alternative auto parts resulted in a 30 year-long rising trend in the market share for usage of alternative parts vs OEM parts in collision repairs This trend has been a core pillar of the LKQ growth story since it went public in 2003
This trend is measured by the ldquoAlternative Parts Usagerdquo (APU) or the percentage of total replacement part dollars spent on alternative parts vs OEM parts The APU has risen from 23 in 2000 to 37 in 2012 according to CCC Information Systems provider of the industryrsquos dominant estimate writing platform
LKQ has displayed a chart encapsulating this trend as a centerpiece of its growth story in all of its investor presentations spanning at least the past 5 years until recently the company has excluded it from all of its 2013 presentations As explained later in this report we believe this share shift has stalled and may reverse
Source LKQ 10-K for 2012 LKQ conference calls LKQ 2009 investor presentation
ldquoRecently CCC published their annual crash course publication The industrys average use of alternative parts for collision repairs increased by almost 300 basis points to 35 for 2009 from 32 in 2008 sharply accelerating from the decade-long trend we have seen of 100 basis points per year increaseshellip Reflecting the increase in APU demand for LKQs wholesale parts remain strong during the quarter Our first quarter organic revenue from the sale of parts and services increased 56 even with reductions in miles driven of 16 in January and 29 in Februaryrdquo
ndash Joseph Holsten LKQ Chairman Q1rsquo2010 Earnings Call (4292010)
European Business Growing as a
Percent of Consolidated Revenue
For the past 3 quarters LKQrsquos European Parts and Services business has demonstrated an organic growth rate gt5x that of its North America counterpart over this period Europe grew at an average rate of ~34 vs ~6 in North America
Fueled by organic and acquisition growth (including the relatively large purchase of Sator) as of 9312013 European Parts and Services Revenue had grown to 28 of consolidated revenue from 15 one year prior
(1) lsquoNorth Americarsquo amp lsquoEuropersquo categories represent geographic sources of Parts and Services Revenue
(2) lsquoOtherrsquo Revenue is comprised of sales of scrap metal and aluminum ingots and sows
(3) Revenue shares were computed by annualizing Q3rsquo2012 amp Q3rsquo2013 reportable category revenues
22
LKQ Organic Revenue Growth by Category Europe Growing in Terms of Revenue Contribution123
As of Q3rsquo2012 As of Q3rsquo2013
Organic Parts amp Services Revenue Growth by Geography
High-Level Indications of Fabricated
GAAP Profits Unsustainable Business
Model
LKQ is a classic roll-up fueling growth through acquisitions In the following slides we elaborate on our view that LKQ is an ineffective roll-up undeserving of its rich valuation By contrast an effective roll-up can create enormous value which warrants a rich PE
24
LKQ is a Roll-up Dynamics of
Roll-up Strategies
(1) Paul F Kocourek Steven Y Chung and Matthew G McKenna ldquoStrategic Rollups Overhauling the Multi-Merger Machinerdquo Strategy amp Business second quarter 2000
The bet underlying a rollup is that it can reduce costs and drive growth to create enormous value In fact kindling organic growth ndash driven by a superior value proposition ndash is particularly important as the pace of acquisitions begins its inevitable decline When all goes well we find a cycle of value creation that takes on a life of its own (refer to the figure at lower right)hellip The market rewards this kind of growth with a higher PE ratio which creates the currency for more acquisitions ldquo1
But Wall Street is littered with companies that have failed to properly effectuate it and that have over time destroyed vast amounts of shareholder wealth Among such companies are Waste Management (WM) and AutoNation (AN) In this report we elaborate on our view that LKQ with common backers very much resembles both companies
For example like LKQ AN set out to build a one-stop-shop establishing presence in all aspects of its markets ndash new and used auto sales auto rental and auto servicing It tried to consolidate a highly competitive low margin maturelow growth industry as such ANrsquos success was dependent on stealing market share from existing competitors Like LKQ it also had no ability to drive down its most basic cost ndash that of buying used cars it had to compete at auctions with other dealers to build its relatively huge inventory which depreciated in value at a very fast rate1 Using public capital it acquired hundreds of businesses It used a concerning acquisition accounting methodology pooling of interests (which is no longer allowed by GAAP) that likely inflated its reported earnings In its early stages it was a Wall Street darling ndash touted as a strong buy by sell-side analysts ndash and valued for perfection but reality caught up with its over- expansion and -extension into money-losing endeavors Over a 35 year period its market value of gt$12B fell by gt80 from peak to trough with shareholder losses exceeding $10B
Dynamics of an Effective Rollup
The roll-up strategy inherently flatters earnings and CFO metrics Roll-ups usually show both strong earnings and strong CFO (ie high earnings quality) due to the inherent financial statement mechanics of paying for growth through acquisition outflows (which do not affect earnings or CFO) Cash spent to acquire businesses runs through the Investing section of the Statement of Cash Flows so the acquirer is able to inherit a new CFO stream without any CFO outlay (ie working capital investment) Moreover as the acquirer liquidates the working capital of the acquired company in the normal course of business ndash collecting on receivables or selling inventory ndash it can realize an unsustainable CFO boost that has virtually nothing to do with the performance of its business
As such free cash flow after acquisitions is a key metric for analyzing roll-ups presenting a better picture of the businessrsquos economics In LKQrsquos case it demonstrates that LKQ is an ineffective consistently cash-degenerative roll-up LKQrsquos free cash flow after acquisitions has been negative in 8 of 9 years from 2004-2012 and is negative in the last twelve month period through September 30 2013 a cautionary sign that its strong positive CFO is not what it appears
25
LKQ Appears to be an Ineffective
Consistently Cash-Degenerative Roll-up
Adjusted Free Cash Flow is free cash flow after acquisitions (ie CFO ndash capex ndash acquisition outflows)
LKQrsquos Free Cash Flow Adjusted for Acquisitions LKQrsquos Earnings Quality lsquoAppearsrsquo High
26
High-Level Indications of Fabricated GAAP
Profits Unsustainable Business Model
Furthermore our analysis indicates LKQ may be engaging in aggressive accounting to engineer GAAP profits
Since 2007 LKQ has reported cumulative Earnings and EBIT of $1222m and $2153m respectively
Meanwhile it has burned cumulative free cash flow after acquisitions of -$1623m and raised cumulative net capital of $1625m suggesting it has never earned a cash-on-cash return on invested capital
Put another way the immense wealth generation represented by LKQrsquos historical GAAP profits is not observable in the companyrsquos cash flows ndash it appears to be lsquopaperrsquo wealth generated from accounting gimmickry and enabled by an aggressive roll-up strategy and accounting practices
Capital Raised = equity + net debt + option proceeds Adj FCF = CFO ndash capex ndash business acquisitions
LKQ Appears Increasingly Dependent on External Capital to Generate Any EBIT and Net Income
Reported North America Parts amp Services
Organic Revenue Growth Appears
Overstated Pricing Pressures Intensifying
28
North America (NA) Organic Growth
Appears Overstated
LKQ reported organic revenue growth averaging ~65 from 2008 ndash 2012 and ~6 in the 9 months ended 9302013 for its North America Parts and Services (PampS) business which accounts for ~75 of consolidated PampS revenue These growth rates do not appear reconcilable with trends in its primary driving fundamental factors or representative of LKQrsquos sustainable North America organic growth rate which we believe likely falls in the range of 0-2
Data for insurance claims paid for repairable accidents indicates no growth
Growth in market share of alternative auto parts relative to OEM parts (ie APU) which has risen for 3 decades and served as a primary driver of LKQrsquos organic growth flat-lined from 2010 ndash 2012 and may taper or reverse
For the first time replacement auto parts prices deflated in 2012 as competitive pressures intensified
Market share gains from alternative parts competitors are limited by LKQrsquos market dominance already owning 25-30 of the market market share is LKQrsquos to lose
LKQrsquos North American PampS organic growth rate also appears unhinged from growth rates reported by dominant companies in its primary end market For example the Boyd Group (TSX BYDUN) a large publicly traded multi-service operator in the North American collision repair industry has reported average same store sale growth of just 2 over the same period LKQ has reported organic growth of 65 While Boydrsquos results have shown significant cyclicality LKQrsquos results have been highly consistent and steadily positive ndash such patterns in an otherwise cyclical business are often a hallmark of companies over-concerned with meeting Wall Street estimates and financial transgressions
NA Organic Growth ndash Insurance Collision
Claim Payouts Are Not Growing
According to LKQ ~85 of all repairs are paid for by insurance companies in effect they are the ultimate payee for replacement auto parts
The total value of Insurance Collision Claims paid for Repairable Accident Claims (which excludes Total Loss data) has been stable at ~$28 billion over the past 5 years time This is the result of steadily increasing severity despite a downward trend in accidents and cars repaired
Per the table below the 5yr CAGR for total insurance claims paid for repairable accident claims is 0
29
Source The Romans Group LLC
30
OEM Price-Matching Programs Also Forcing
Aftermarket Auto Part Price Deflation
LKQ has historically benchmarked its prices against OEM parts prices which historically have risen 10 ndash 20 pa
ldquohellip maybe another way to look at that is that we typically price our parts based on new OE partshelliprdquo 1
ldquoWe track OE prices relative to what theyre doing They are still averaging consistently 15 to 2 increases though we tend to follow right on their heels When they raise were right behind themrdquo 2
Recently OEMrsquos have expanded their price-matching programs wherein they are matching alternative parts prices Theyrsquove set their sites on regaining market share previously lost to alternative parts suppliers by empowering their dealersrsquo parts departments to match aftermarket parts prices and are succeeding
We believe these programs have become widespread and much more pervasive than LKQ has led investors to believe
(1) Joseph Holsten former CEO on Q4rsquo2008 earnings call
(2) Robert Wagman CEO on Q3rsquo2011 earnings call
We believe that substantially in excess of 50 of collision parts by dollar amount are supplied by OEMs with the balance being supplied by distributors like us The OEMs are therefore in a position to exert pricing pressure in the marketplace We compete with the OEMs primarily on price and to a lesser extent on service and quality From time to time OEMs have experimented with reducing prices on specific products to match the lower prices of alternative products If such price reductions were to become widespread it could have a material adverse impact on our business
ndash LKQ 10-K for 2012 (Risk Factors)
31
NA Organic Growth ndash OEM Price Matching
Interview With Aftermarket Distributor
Prescience Point (ldquoPPrdquo) Can you describe whats been happening in the industry
Aftermarket Parts Distributor (ldquoAPDrdquo)1 The OEs dealerships are selling below their cost This is happening nationwide It started around 2008
PP How is it impacting aftermarket parts distributors
APD Its put 4 out of business within 200 miles of here and it put me out of business too So thats 5 out of 5 The only one left standing is LKQ
Its a really strange deal I called the 4 companies and asked them why they went out of business and they said it was because of the OEs matching their prices
They are being dis-intermediated by the OEMs Theyre not selling parts either By way of example The gentleman who runs (the local) LKQ-Keystone and I have been competitors ever since Ive been in business He started out w a company that LKQ bought out then he went to another company and LKQ bought them out and now he works for LKQ For this entire time weve been competitors Anytime Ive ever asked him about hows hes doing hes said lsquoWere doing great were just selling shit left and righthellip for about 18 years thats been his answer 3 weeks ago I called him and he says ldquoTalk to any one of my salespeople and they will tell you how badly weve been hurting If you want to know how bad it is talk to anyone of my salesmen we arent selling shitrdquo It was the first time hes ever in his life made a negative comment about his businesshellip
PP Do you think this will continue to impact LKQs ability to generate business in North America
APD If it continues it will put them out of business as far as aftermarket and salvage parts go
(1) ldquoAftermarket Parts Distributorrdquo is an owner of an aftermarket collision parts distributor
OEM Price Matching Interview With
Aftermarket Distributor (Contrsquod)
32
Prescience Point (ldquoPPrdquo) What would motivate the OE dealerships to sell products at a loss How can the dealerships take these losses
Aftermarket Parts Distributor (ldquoAPDrdquo) 1 Because the OEs are paying them (the dealers) back on their money making them whole and then giving them a 14 profit (on top of that)
I have a document that shows how this is happening This specific document relates to a doorhellip GM is telling its dealer to ldquoForget the dealer list price sell it 33 below Keystones list price Well give you all your money back plus a 14 profitrdquo LKQ cannot then step in and offer the part at the same price ($456) it wouldnrsquot be able to sell the part because the body shop prefers the OE part Body shops are happy because they are getting OE parts for aftermarket prices
PP LKQs investor presentation contains a slide demonstrating its lsquoClear Value Propositionrsquo They give specific examples For example a new OEM front door might cost $1300 vs a recycled OEM front door that would cost $800 for a savings of 40 So is that not the case for a new vs recycled products
APD If an insurance company writes the recycled part for $800 the OEM will sell its $1300 (dealer list price) part for $800 and give the dealership a 14 profit
PP The presentation also gives another example for an aftermarket product It says a new OEM fender might cost $200 but an aftermarket fender sells for $160 for a 22 savings Same thing there The OEM will match that price
APD Same deal the dealer will sell it for $160 GM reimburse them for their $40 loss and give them a 14 return on top of that
(1) ldquoAftermarket Parts Distributorrdquo is an owner of an aftermarket collision parts distributor
33
LKQrsquos Only Competitive Advantage is Pricehellip
GMrsquos Price Matching Designed to Thwart LKQ
Keystone List Price
OEM price-match 33
discount from Keystone
Price (Keystone list has
generally been 20-25
less than OEM OEM is
now undercutting
Keystonersquos price by 33)
GM reimburses dealer
for loss on part cost
GM pays dealer 14
return on part cost
We have sourced an internal GM dealer document detailing its price-matching program ldquoBump the Competitionrdquo We are told it specifically targets LKQ-Keystone GM subsidizes dealers to sell parts (in this case a fender and a door) at levels 33 below aftermarket list prices makes them whole on the loss and pays the dealer an additional guaranteed 14 profit on the cost for the part
Source Felders Collision Parts Inc v General Motors Company et al Complaint Exhibit 4 filed 10122012
34
GMrsquos ldquoBump The Competitionrdquo Directed
at Outcompeting LKQ Retaking Lost Share
Launched in 2009 the ldquoBump the Competitionrdquo program from General Motors was designed to capture share of the aftermarket by lowering the price of its OEM replacement parts relative to the competition The initial rebates took the form of fast cash Visareg Award Cardshellip
httpwwwgmrepairinsightscomwp-contentuploads201304Repair-Insights-Q2-2013pdf
httpgmbtccaloginphp
wwwgenuinegmpartscom
35
OEM Price Matching Programs Date to 2009
GM Expanded its Programs in 2013 to Be Even
More Price Competitive Applied to More Parts
Source httpwwwgmlamcomguidelinespartsconquest_bulletinpdfSource Felder Collision Parts Inc vs General Motors Company et all 101212httpwwwmcmlspcomsandboxpodmock2431CollisiontoolsBTC_Calculator_010109v1axls
GMrsquos push to Bump the
Competition Dates back to
2009 amp Recent Evidence it has
become ldquoMore Price
Competitiverdquo
36
Mazdarsquos ldquoCollision Parts AdvantageTMrdquo
Program Also Directed at Displacing LKQ
Launched in 2011 the ldquoCollision Parts AdvantageTM rdquo program was launched by Mazda to warn its customers that aftermarket Like Kind and Quality are generally of lower quality than certified OEM parts The program offers its customers and chosen repair shops the choice to use its OEM parts with a price matching guarantee
httpwwwmazdaserviceinfocomPDFsCollision20Parts20Advantagepdf
OEM Price-Matching
APU Has Flat-Lined Likely to TaperDecline
The OEMs are aggressively reclaiming market share by competing away LKQrsquos price advantage ndash the prime basis of its value proposition Their efforts have successfully halted the three decade-long trend of steadily increasing APU CCC Information Services provider of the dominant estimate-writing platform indicates APU has leveled off over the past 3 years and the share shift may reverse CCCrsquos assessment is that a decline or tapering in APU is likely to materialize
A rising APU was a primary driver of LKQrsquos organic growth We note that every single LKQ investor presentation we have studied dating back to 2007 has given prominence to a slide displaying the decade long trend in APU For the first time ever LKQ has chosen to exclude this slide from its 2013 presentations We believe this change is a tacit admission that this metric no longer figures into the companyrsquos lsquogrowth storyrsquo
Sources LKQ Third Quarter 2012 Investor Presentations CCC Crash Course 2012
37
Collision Replacement Products Market Shift
APU has flat-lined
The Autumn Update to Crash Course 2011 included a discussion on the impact of the aging fleet on parts utilization and showed that the increase in industry-wide non-OE part utilization was driven in large part by the growing share of older model year vehicles where non-OE parts availability is higher As consumers begin to purchase more new vehicles and as more manufacturers provide price-matching programs for their dealers non-OE share of parts dollars (ie APU) will likely taper or decline
ndash CCC Crash Course 2012 published on 372012
38
LKQ Appears To Be Deceiving Investors
About the Current APU Problems
According to CEO Robert Wagman on the Q3rsquo2011 earnings call LKQ claims APU rose from 37 to 38 in 2012
Its own data source refutes that claim As its source for APU data communicated in conference calls and investor presentations LKQ cites the annual results released by CCC Information Services Per Robert Wagman on the Q3rsquo2011 earnings conference call
Discussion What LKQ Tells Investors What LKQrsquos Data Source Says
Alternative Parts Usage (APU) rate
Source Q312 conference call on 10252012 --As mentioned on previous calls we were confident that the historical trend of 100 basis point improvement in alternative part usage would continue in 2012 And today I am pleased to announce that that goal (for a 100 basis point improvement in APU in 2012) was achieved through the end of the third quarter According to CCC Information Services APU now stands at 38
Source CCC Crash 2012 Fall Update published 10172012 --The percent of the total dollars spent on replacement parts that were OEM was essentially flat year-over-year 632 percent at mid-year 2012 versus 631 percent at mid-year 2011(ie From mid-year 2011 to 2012 APU fell from 369 to 368)
CCC Crash Course 2013 report published 3282013 --At the close of 2012 the industryrsquos share of replacement part dollars was split at 63 percent OEM versus 37 percent non-OEM
Assessment of Trend in APU
Source Q312 conference call on 10252012 --As we enter the last quarter of 2012 and prepare for 2013 our outlook continues to be positive Im encouraged by the trends in miles driven the continued growth in APU the recent reduction in vehicle pricing at auctions the strength of Euro Car Parts and the robust pipeline of acquisition opportunities we are witnessing
CCC Crash 2012 Crash Course published on 372012 --The Autumn Update to Crash Course 2011 included a discussion on the
impact of the aging fleet on parts utilization and showed that the increase in industry-wide non-OE part utilization was driven in large part by the growing share of older model year vehicles where non-OE parts availability is higher As consumers begin to purchase more new vehicles and as more manufacturers provide price-matching programs for their dealers non-OE share of parts dollars (ie APU) will likely taper or decline
ldquoAs mentioned on previous calls we were confident that the historical trend of 100 basis point improvement in alternative part usage would continue in 2012hellip According to CCC Information Services APU now stands at 38hellipAs we enter the last quarter of 2012 and prepare for 2013 our outlook continues to be positive Im encouraged byhellip the continued growth in APU helliprdquo
ldquohellip we only get the annual results from the estimating company as to whats happening to the APU trendhelliprdquo
NA Organic Growth ndash APU
LKQ Appears to have Deceived Investors
What LKQ Tells Investors
In its March 2013 Investor Presentation LKQ
claims that APU had reached 38 in
accordance with previous guidance
Sources LKQ 10-K for 2012 March 2013 Investor Presentation (Raymond James 34th Annual Institutional Investors Conference)39
What LKQ Says in its SEC Filings
We believe however that as the insurance
and repair industries continue to recognize
the advantages of aftermarket recycled
refurbished and remanufactured products
the alternatives to new OEM replacement
products will account for a larger percentage
of total vehicle replacement product sales
Since 2008 alternative parts usage has
increased from approximately 32 to
37 of the collision replacement product
market We compete with OEMs on the
basis of price service and product quality
Even as it tells investors APU rose 100 basis points in 2012 LKQ contradicts itself in its own filings with the Securities and Exchange Commission which report that APU did indeed not rise
40
OEM Price-Matching
Parts Price Deflation Began in 2Hrsquo2012
The expansion of OEM price-matching programs have become so expansive that they drove deflation in parts prices in 2012 Industry data source Mitchell International reported a decrease in the indexed price of vehicle parts for its market basket for the first time in the 10 years Mitchell International has been collecting data
Prices began deflating in the second half of the year it is clear that the OEMs are expanding their price matching programs to cover more parts and that the programs are being implemented by more and more dealers
Source Mitchell Industry Trends Report Q2 2013
ldquoFor the first time we saw a decrease in the indexed price for the market basket Loyal readers of the Industry Trends Report will see that the 2012 decrease was not evident when we ran the index report early in 2012 so the decrease was in the latter half of 2012hellip The domestic vehicle parts market basket experienced such a decrease that it offset the moderate increases in the Asian and European market baskethellip So what we are seeing is the impact of the expansion of the competition parts price matching programs from the domestic OEs driving the decrease in the overall indexhelliprdquo
ndash Mitchell Industry Trends Report Q2 2013
41
OEM Price-Matching (Contrsquod)
Parts Price Deflation Began in 2Hrsquo2012
gt50 of LKQrsquos consolidated revenues are generated from the sale of aftermarket parts
According to CCC Information Systems aftermarket parts deflated by 24 in 2012
ldquoBetween 2011 and 2012 hellip the average price paid per replacement part fell by 03 percent Average price paid per replacement part varied by part type with reconditioned parts increasing 20 percent aftermarket parts decreasing by 24 percent and recycled parts increasing 08 percentrdquo
ndash CCC Crash Course 2013 report published 3282013
Source CCC Crash Course 2013
42
State Farm Insurancersquos New PartsTrader
Platform to Drive Even More Pricing Pressure
wwwpartstraderuscom
Insurance companies exert significant influence in the vehicle repair decision since they ultimately pay for the majority of collision repairs of insured vehicles Therefore they are incentivized to drive auto parts prices as low as possible to maximize their profits
In May 2013 State Farm Insurance the largest US auto insurer confirmed the end of the pilot phase and a national rollout of PartsTrader an electronic ordering system to its Select Service direct repair facilities The national roll-out is expected to be completed by 2014
PartsTrader is a web-based collision replacement parts market connecting OEM aftermarket remanufactured specialized and recycled automotive parts suppliers with collision repairers looking for replacement parts
As an online competitive marketplace designed to allow collision shops to make better procurement decisions with information on part quality delivery time supplier reputation and prices PartsTrader is expected to drive more competition amongst alternative parts distributors lowering auto parts prices and serving as another blow to industry organic revenue growth
httpwwwfenderbendercomFenderBenderMay-2013State-Farm-Initiates-PartsTrader-Expansion
43
NA Organic Growth ndash
Not Reconcilable w End Market Growth
LKQrsquos reported NA Parts and Services organic growth rate also appears unhinged from the growth rates reported by companies in its primary North American end market collision repair shops
For example Boyd Group (TSX BYDUN) is a Canada-based company that is consolidating the USCanada collision repair industry as a multi-service operator (MSO) Boyd has 228 locations in five Canadian provinces and 14 US states
According to the Romans Group LLC Boyd is a player in the fastest growing segment of the collision repair industry and is outperforming its peers in that segment1 Specifically
Boyd is a part of ldquothe $20+ million US collision repair segment (which) continues to grow market share and brand relatively faster than other segments of the collision repair industryrdquo and
Boyd has significantly grown its market share relative to the other top $20mm+ operators since 2006
(1) A Profile of the Evolving Collision Repair Marketplace Parts 1 amp 2 The Romans Group 2012
LKQrsquos NA Organic Growth is Too Predictably
Positive and Smooth in a Cyclical Industry
The significance in disparity between LKQ and Boydrsquos organic growth rates defies logic Boyd Group ndash again an outperformer amongst collision repairers ndash has reported organic growth of 2 on average since Q1rsquo2009 with significant variability in its growth rate (61 standard deviation) and has reported negative growth in several quarters on the other hand LKQ has reported organic growth in Parts and Services of 70 on average over the same time period with relatively little variability in its growth rate (standard deviation of just 18) and has never reported a period of negative organic growth
Note that LKQ changed its reporting of organic growth categories on 3313 As a result this analysis runs through 123112 for the purpose of presenting a fair apples-to-apples comparison 44
Source LKQ Press Release Source Boyd Group Press Releases
LKQ Quarterly Parts and Services Reported Organic Growth Rate SSS Growth - Boyd Group - Multi-Service Operator of Collision Repair Shops
00
20
40
60
80
100
120
-100
-50
00
50
100
150Average 20Std Dev 61
Average 70Std Dev 18
The European ldquoGrowth Fantasyrdquo ndash
Short-Term Decision-Making Signals
Desperation to Keep Financials Inflated amp
Meet Guidance Targets
Euro Car Parts ndash
LKQrsquos Largest Contributor to Organic Growth
In Q4rsquo2011 LKQ began expanding into Europe Its acquisition of UK-based Euro Car Parts (ECP) a distributor of mechanical aftermarket parts was made ndash and this was never disclosed by LKQ ndash as the UK aftermarket industry was significantly contracting (which is projected to continue) amounting to a high risk gamble using shareholder capital At the time of purchase ECP operated out of 89 branchstore locations and opened an average of 10 new branches per year in the period 2007-2011
LKQ pitched the purchase primarily as an open-ended opportunity to replicate its North American success
in Europe by driving APU ndash currently at 5 in the UK vs 37 in the US ndash for collision repairs
We believe LKQ is operating ECP to inflate its financials and meet guidance targets at the long term
shareholder expense of entrenchment in a contracting market which will result in a new financial hole
LKQ will predictably seek to plug with more acquisitions (which it has already begun making)
46
Euro Car Parts ndash
LKQrsquos Largest Contributor to Organic Growth
History of Acquisition In October 2011 LKQ acquired Euro Car Parts (ECP) a leading distributor of mechanicalaftermarket parts in the UK for a total of ~$432m (including the paid in full performance-based contingent component) ECP was founded by Sukhpal Singh Ahluwalia who today serves as Chairman of LKQ Europe
LKQ reported that ECP had grown revenue at a CAGR of 30+ from 2009-2011 it generated 2011 revenue of $523m equating to ~15 of LKQ sales
At the time of purchase ECP operated 89 branch locations and opened an average of 10 new branches per year in the period 2007-2011
LKQ pitched the acquisition as
a) an opportunity to continue expanding ECPrsquos branch network and
b) an open-ended opportunity to drive alternative part usage (APU) for collision repairs in the UK ndashwhere APU is ~5 (vs 37 in the US) ndash by educating insurers about the value proposition of alternative parts Per Chairman Joseph Holsten on the October 4 2011 ECP acquisition call
ECP is LKQrsquos single largest driver of reported organic growth LKQ reported ECPrsquos organic growth rate to be 30+ beginning in Q4rsquo2012 and in each quarter since
47
ldquohellip the opportunity is that whereas APU in the United States has moved from really even a sub-20 level when we first formed LKQ to 37 last year the UK market today stands at 3-7 APU utilization raterdquo
ECP ndash 30+ Organic Growth in a
Contracting Industry
In its investor presentations LKQ cites ECPrsquos growth rate and the potential to increase collision-repair APU to imply the acquisition presents a new doorway for growth It cites Datamonitor Group as its source for sizing the expansive UK aftermarket parts industry an lsquo$18bn marketrsquo
LKQ never mentioned that according to the same source (Datamonitor Group MarketLine) the UK aftermarket parts industry was in significant contraction at the time LKQ acquired ECP According to Datamonitorrsquos February 2012 publication the UK industry was expected to contract in 2011 by -58 and is projected to continue contracting
How can a UK-based distributor of aftermarket auto parts regularly report lsquoorganic growthrsquo exceeding 30 as the industry around it is contracting
48
ldquoThe United Kingdom automotive aftermarket sector shrank by 58 in 2011 to reach a value of $172595 millionhellip In 2016 the United Kingdom automotive aftermarket sector is forecast to have a value of $168771 million a decrease of 22 since 2011rdquo
ldquoThe UK automotive aftermarket sector entered a period of decline from 2008 through to 2011 The sector is expected to continue to recover with marginal growth in 2012 before falling into decline once again from 2013 through to the end of the forecast period in 2016rdquohellip It contracted at a ldquocompound annual rate of change (CARC) of -35 between 2007 and 2011rdquo
ldquoThe performance of the sector is forecast to decline further with an anticipated CARC of -04 for the five-year period 2011-2016 which is expected to take the sector to a value of $168771 million by the end of 2016rdquo
ndash Datamonitor MarketLine Automotive Aftermarket in the United Kingdom February 2012
ECP ndash
lsquoOrganic Growthrsquo That Isnrsquot Really lsquoOrganicrsquo
LKQ doesnrsquot define ECPrsquos lsquoorganic growthrsquo in the way investors might expect for a business characterized by sales originating at storefronts for which lsquoorganic growthrsquo would be represented by a same store sales growth
LKQ treats ECP revenue from stores existing for gt1 year and revenue from stores opened during the year as organic revenue1
As such its reported organic growth rate is fueled by opening new ECP branches and the more new branches it opens in a given period the more it can inflate the reported organic growth rate
Because ECP is in the midst of a rapid branch expansion it is able to report lsquoorganicrsquo growth of 30+ even as the broader UK aftermarket parts industry contracts
While ECPrsquos reported growth rate sheds light on the companyrsquos size in comparing data that are fundamentally incomparable it provides little information on the performance and health of its existing branch network Further it obscures LKQrsquos consolidated organic growth metric LKQ uses a different standard for reporting its North America organic growth which according to management only includes salvage yards open and within the system for a year In essence the company is mixing two different measurement approaches and potentially misleading investors
(1) LKQ Earnings conference call for Q2rsquo2012(2) Q3rsquo13 earnings release
49
2
Different measurement approaches
Yet each described as
lsquoOrganicrsquo
50
Throughout 2012 LKQ repeatedly raised guidance for the number of 2012 branch openings from 20 to 30 to 42 ECP has also repeatedly raised guidance for the maximum number of full-sized ECP branches the UK market can absorb from 100 to 120 to 150 to 175 to 200 giving itself more and more room to continue ramping the number of branch locations As demonstrated in the pages to follow these revisions were made with the purpose of meeting PampS revenue growth guidance
The table below summarizes LKQrsquos repeated revisions of guidance for the number of branches to be opened per period and for the maximum number branches the UK market could absorb The slides to follow detail these revisions
SourceGuidance for New
ECP Branch OpeningsGuidance for Maximum ECP Branches UK market could
absorbArticle in The Telegraph
(4212009)90 to 100 total ECP branches to give presence across the UK
ECP Acq call (1042011) 10-12 per year
Q4rsquo2011 earnings call (2232012)
Guidance for 2012 20 openingsChange vs prior guidance +10 openingsTotal store count if guidance met 110 branches
120 full sized branches + 15 satellites
Q1rsquo2012 earnings call (4262012)
Revised guidance for 2012 30 openingsChange vs prior guidance +10 openingsCumulative change vs initial guidance +20 opensTotal store count if guidance met 120 branches
2013E guidance 20-25 openings
150 full sized branches + 25 satellites(175 total)Change vs prior guidance +40
Q3rsquo2012 earnings call (10252012)
Revised guidance for 2012 42 openingsChange vs prior guidance +12 openingsCumulative change vs initial guidance +32 opensTotal store count if guidance met 132
150 full sized branches + 25 satellites(175 total)
Q4rsquo12 earnings call(2282013)
Guidance for 2013 10 openings Change vs prior 2013 guidance -10 openings Total store count if guidance met 142
150-175 full sized branches + 25 satellites(175-200 total)Change vs prior guidance +25Cumulative change vs initial guidance +65
Q1rsquo2013 earnings call(4252013)
Revised guidance for 2013 15 openings Change vs prior 2013 guidance +5 openingsTotal store count if guidance met 147
Q2rsquo2013 earnings call(812013)
175-200 full sized branches + 25 satellites(225 total)Change vs prior guidance +25Cumulative change vs initial guidance +90
Short-Term Decision-Making Signals Desperation
to Keep Financials Inflated amp Hit Guidance
51
In an article published by The Telegraph on 4212009 ECP founder (currently Chairman of LKQ Europe) Sukhpal Singh Ahluwaliastated that he thought ECP could have a total of 90-100 branches ldquogiving it a presence across the UKrdquo
On the October 2011 conference call detailing the ECP acquisition LKQ told investors it had a plan to open 10-12 branches per year for the next few years At that time LKQ appeared more focused on the opportunity to grow collision repair APU in the UK
On the Q4rsquo2011 earnings call LKQ raised the number of branches it had planned to open to 20 in 2012 LKQ stated that the UK could support a total of 120 full-sized stores and 15 smaller lsquosatellitersquo stores so ldquowhen were all said and done we could be in the 135 rangerdquo
SourcePlans for New ECP Branches
Guidance for Maximum ECP Branches UK market could absorb
Article in The Telegraph (4212009)
Sukhpal Singh (from The Telegraph article Sukhpal Singhrsquos Next Goals for Euro Car Parts)I think we could increase to 90 to 100 branches We need to have a presence across the UK
ECP Acquisition Call (1042011)
Robert L WagmanYes we -- right now Craig we have a plan to grow 10 to 12 branches per year for the next few years -- for the upcoming years to complete out the major UK markets major markets that theyre in
Q4rsquo11 Earnings Call(2232012)
Given the market opportunities in the UK and the attractive unit economics at ECPs locations we anticipate ramping up our total branch openings for 2012 to roughly 20
Craig R KennisonRE ECPhellip what do you think that market the UK market can support long-term in terms of the number of stores that you operate
Robert L WagmanWe think the right number is going to be somewhere around 120 Craig to fully develop the network So we think well be at 20 by the end of this year As far as the what the market -- the overall market 120 seems to be the number what well also do is open some satellite stores They wont be full branch stores to support some of the remote areas of the UK So I think when were all said and done we could be in the 135 range
Short-Term Decision-Making Signals Desperation
to Keep Financials Inflated amp Hit Guidance
52
On the Q1rsquo2012 LKQ announced an increase in anticipated store openings to 30 in 2012 which would result in a total of 120 stores (the previously stated market saturating count) Furthermore it announced plans to open another 20-25 stores in 2013 which would take the total number of stores to 140-145 well beyond previous guidance for UK market saturation It followed by raising the ceiling on the number of stores the market could absorb to 150 full-sized stores and 25 satellite branches (175 in total) which would seem to indicate branches in major metropolitan areas being ldquo5 miles or so apartrdquo(akin to a Starbucks model) LKQ would continue to raise from this level the maximum number of stores the UK could absorb
On the Q3rsquo2012 earnings call for the 3rd time LKQ revised higher guidance for the number of branch openings planned to 32 for 2012 (from initial guidance for 10-12) which would make for 132 branches in total LKQ also stated ldquoWeve said we believe the total store count is going to be somewhere around 150 to 175rdquo
SourcePlans for New ECP Branches
Guidance for Maximum ECP Branches UK market could absorb
Q1rsquo12 Earnings Call(4262012)
And due to favorable market conditions and ECPs managements proven ability to effectively and efficiently open branches we anticipate accelerating new branch openings to 30 in 2012 which is 10 more than the 20 we were anticipating on our last call
Robert L WagmanSo we believe well get to roughly 120 locations by the end of this year if all goes to plan We want to add probably another 20 or 25 next year which adds to about 150
Unknown AnalystWould you tell us just a little bit there about ECP and talk about the footprint I mean with the growth expansion-- if you look at how far these are apart any chance of cannibalizing in those markets
Robert L WagmanhellipWe think that surely branches in major metropolitan areas can be 5 miles or so apart So theres not necessarily cannibalization its just better service for the customershellip And then on the last call we talked about these ancillary locations not full sized branches Our average branch over there is a 10000-square foot branch These would be smaller offshoots in more rural areas That may be another 20 to 25 locations So when this is all said and done well be at about roughly 175 locations in the UK Cannibalization there is a slight -- when you put one 5 miles apart from each other we do move some of the revenue from one branch to the other Butagain because of the better service levels we can provide we do see an uptick in the revenue pretty quickly
Q3rsquo12 Earnings Call (10252012)
During the quarter we opened 10 new branches in the UK bringing our total branch count to 120 Since the acquisition of ECP in early October 2011 we have opened 31 branches surpassing the target number of 30 I mentioned on the last call Given that market conditions in the UK combined with the continued success of ECP we have approved an additional 12 new branch openings for the fourth quarter bringing our total target to 132 branches by year-end
John R LawrenceRob would you take a -- if you look at ECP overall out for the next 12 to 18 months -- how do you look at allocating CapEx dollars Obviously youre doing that with some more stores but longer term that marketplace -- the viability to spend more capital over there
Robert L WagmanWeve said we believe the total store count is going to be somewhere around 150 to 175 We believe that number is still to be true And in fact we may actually be able to go a little bit above 175 with those satellite stores to feed the more remote areas
Short-Term Decision-Making Contrsquod
53
On the Q4rsquo12 call LKQ indicated that the 12 stores opened through January 2013 were pulled forward from the 25 it had projected to open in 2013 and that it would take a break from opening new stores until Q2rsquo2013 at which point it could have evaluated the progress of the newly opened stores There was a deceptive change in language in guidance for possible total store count calling for 150-175 full sized branches andan additional 25 satellites (200 in total) (Recall that on the Q1rsquo12 call then reaffirmed on the Q3rsquo12 call they guided that the market could absorb to 150 full-sized stores and 25 satellite branches (175 in total)
On the Q1rsquo2013 earnings call LKQ announced plans to open another 15 in Q3 and Q4 2013 which would make for a total of 147 ECP branches (against initial guidance that the UK could absorb 120)
On the Q2rsquo2013 call in August 2013 LKQ again raised the limit on its estimate for the total number of stores the UK could absorb to 175-200 full sized branches (from 150-175 before that 150 before that and 120 before that)
Then on November 12 2013 in a press release announcing ECPrsquos founder had been promoted to serve as chairman of LKQ Europe he stated ldquoThe UK alone will have 200 Euro Car Parts branches within three yearsrdquo
SourcePlans for New ECP Branches
Guidance for Maximum ECP Branches UK market could absorb
Q4rsquo12 Earnings Call(2282013)
Robert L WagmanDuring the fourth quarter we opened 10 new branches and we opened 2 additional branches in January bringing our total branch count to 132hellip hellipWith the 12 we did in Q4 originally scheduled for 2013 so we pushed them in 2012 So as John said were going to reevaluate this in Q2 but I would expect if we feel comfortable well add another 10 in 2013 to fill up to get to 142 with still some growth for 2014 and 15 as well
Robert L WagmanhellipWere still standing by our projections of 150 to 175 what we call Tier 1 ECP locations and an additional 25 or so Tier 2 the smaller or remote markets
Q1rsquo13 Earnings Call (4252013)
Now turning to Euro Car Parts We continue to be impressed with the performance of Euro Car Parts and its ability to capture market share In Q1 ECP achieved strong organic revenue growth of 321 With the continued performance in ECPs financial results and the strength of ECPs management team I am pleased to announce that we have approved an additional 15 new branches for 2013 that are scheduled to open in the third and fourth quarter of this year
Q2rsquo13 Earnings Call(812013)
John S Quinnhellip Weve targeted 15 for the balance of this year That will take us up to circa 147
John S Quinn We think the right number is probably somewhere in 175 to 200 for what we consider a full branch and then there will be some satellite opportunities in addition to that Over time as we grow that were going to have to look at the infrastructure associated with that regional hubs and the 2 main central hubs
LKQ PR announcing leadership change
Sukhpal Singh Ahluwalia lsquoI have never been more hungry excited or determined to maximise our potential for the next decade and beyond The UK alone will have 200 Euro Car Parts branches within three years and we have ambitious targets for paint collision parts and e-commercersquo
Short-Term Decision-Making Contrsquod
12282012 Right before 2012 Yr End ldquoOur Biggest Sale Ever Up to 45rdquo We have a Sale on at the moment where you can save up to 45 off on Car Partsbut it doesnt last long - must end midnight 1st Jan so hurry
8162012 rdquoMid Month Madness 30 off Car Parts Selected Car Partsrdquo Owning to popular demand (everybody likes a big juicy discount) ndashwersquove decided to bring the big daddy back ndash yes thatrsquos 30 off Car Parts as well as ALL Engine oils
9272012 Right before Q3rsquo12 Ended ECP ran a promotion ldquoThe Boss is Away 31 off Promo Code InsidehellipEnds Sundayrdquo Our biggest ever discount offered on almost ALL car partshellipcash in before the boss is back
bull In 2012 ECP started heavy price discounting of parts across the board Most discounts touted up to 30 off often on all products sold By the end of the year the savings discounts reached up to 45 off
bull Many of these sales appeared right at the end of the quarter in what appears to be an attempt to juice results ahead of reporting to investors
httpwwwgolfgtiforumcoukindexphptopic=2361380 httpwwwgolfgtiforumcoukindexphptopic=2386450 httpwwwgolfgtiforumcoukindexphptopic=2461350
Short-Term Decision-Making Steep
Discounting to Hit Numbers in 2012
54
5242013 ndashrdquoThe Online Bank Holiday Sale Up to 50 Off Everythingrdquo
ldquoItrsquos BACK again ndash Up to 50 OFF EVERYTHING No promo code required Must End Midnight Monday 27th Mayhelliprdquo
9272013 Before the end of Q3rsquo13
ldquoEnd of Summer Clearance up to 50 off Everything Onlinerdquoand you donrsquot need a promo code as current prices reflect the discount by defaultrdquo
3282013 Before the end of Q1rsquo13
ldquoOur Biggest Ever Sale ndash Up to 50 off Everythingrdquo
55
httpwwwgolfgtiforumcoukindexphpPHPSESSID=rffknoatjiinf0n2nuhh828uv6amptopic=2512620
httpwwwgolfgtiforumcoukindexphpPHPSESSID=rffknoatjiinf0n2nuhh828uv6amptopic=2542750
httpwwwgolfgtiforumcoukindexphpPHPSESSID=rffknoatjiinf0n2nuhh828uv6amptopic=2598690
In 2013 discounts increased noticeably from 30 to upwards of 50 off Each promotion is touted as its ldquobiggest sale everrdquo ECP has continued its practice of running promotions right towards the end of the quarter
Not one time has LKQ attributed such discounts as a driver of its persistently declining gross margin
With Even Bigger Promotions in 2013
On the Q4rsquo2011 call (22312) LKQ guided for 20 stores to be opened in 2012 and guided for
2012 Parts and Services organic revenue growth 55-70 (Guidance for PampS organic
growth includes the impact from anticipated ECP store openings)
On the Q1rsquo2012 earnings call (42612) guidance was revised lower to 50-70 even as
LKQ raised the number of anticipated 2012 store openings by +10 to 30 indicating the
intent to make up for unanticipated weakness in North America with new branch
openings LKQ stated that in order to meet 2012 guidance certain anticipated tailwinds
would have to materialize specifically stating APU would likely rise from 37 to 38
On the Q3rsquo2012 earnings call (102512) LKQ raised the number of anticipated 2012 store
openings by +12 to 42 and raised the lower end of the range for organic growth by 50bp to
60-70 In Q3 the opening of new ECP branches alone accounted for 40 of Parts and
Services organic growth
The increase in the number of stores openings during Q4rsquo12 resulted in ECP growing to
account for 75 of LKQrsquos Q4rsquo2012 PampS organic growth by our estimates enabling it to
report 6 organic revenue growth and meet the low end of the guidance range
In sum LKQ stated a reliance on APU rising to 38 to meet the initially released 2012
guidance levels although LKQ appears deceptive with investors in claiming this APU target
was met the data released by its information source refutes its claims reporting that at the
end of 2012 APU was 37 unchanged from 2011 This left LKQ reliant on other sources of
organic growth to meet guidance
In 2012 LKQ juiced its organic growth rate by opening double the number of ECP
branches initially guided for indicating LKQ made strategic decisions related to ECP
openings at the expense of long-term value creation to inflate its financials and hit
guidance 2012 guidance for organic revenue growth 56
ldquoWe included in the internal growth and the earnings guidance the new ECP locations opened to date and planned for the balance of the year Rob mentioned that we plan to increase the number of branch openingshellip To reach our guidance were obviously assuming that the rest of the year gets better and we do think there are some tailwinds to help us in that regard In 2011 we saw alternative part usage rate in the industry of 37 Based on what were seeing in the market today we believe that in 2012 well see that rate increase to at least 38
How Did This Play Out In Pacifying
Wall St Estimates
ECP ndash lsquoOrganicrsquo Growth Contribution to LKQ
Parts and Services Org Growth is Now gt50
ECPrsquos reported organic growth rate has grown to account for gt50 of LKQrsquos consolidated Parts and Services organic growth rate
ECPrsquos organic growth rate is a short-term phenomenon
As ECPrsquos reported organic growth rate begins to fall and converge with the industry rate of growth it will result in yet another large financial hole LKQ will predictably seek to plug
(1) Q2rsquo2013 ECP SSS adjusted for 2 extra selling days SSS provides little insight as it is inflated by the revenue ramp of newly opened branches which take 3 years to mature
(2) NA organic growth contribution is a PP estimate imputed by backing out organic growth from ECP from reported Parts and Services organic growth 57
ECP Reported Organic Sales Growth1 ECP Contribution to Parts and Services Organic Growth2
PP model Uses 2006 as anchor year and is based on the number of per year ECP branch openings since 2006 and our projection of store builds through 2016 which reflects LKQrsquos Europe Chairmanrsquos expectation of 200 stores within 3 years Assumes that at maturation each store generates $54m ECPrsquos average reported revenuestore in the period 2010-2012 ECP generally experiences the most significant growth benefit from a new branch in the year of first generating sales and benefits continue to accrue through a 3 year store maturation period (LKQ earnings conference call for Q3rsquo2012)
ECP ndash lsquoOrganicrsquo Growth Rate Unsustainable
Driven by Accelerated Store Expansion
ECP had a total of 89 branches when LKQ bought it in October 2011 and had opened an average of 10 new branches per year from 2007-2011 In 2012 alone LKQ opened 40 new branches In just 2 years at 9312013 LKQ had 138 total branches and intends to have 200 by the end of 2016
The chart to the right below contains a simulation approximating the revenue build and growth rate for ECP that would result solely from opening new ECP branches The levels of organic growth projected by the estimated growth rate trend are reflective of the levels reported by ECP (after taking into account that our simulation understates ECPrsquos reported growth rates in its earlier periods due to assuming no new stores were opened in 2006 and prior) As such we believe ECPrsquos growth is almost entirely explained by branch openings as opposed to same store sales growth for matured (ie gt3 years old) branches a result we would expect given the industry may be contracting
This means that as ECP approaches its market saturating goal of 200 total branches its reported organic growth rate will plummet converging to the industry rate of growth ndash which is negative
58Historical Data from ECP 2009 Annual Report amp the ECP Heritage webpage
2014-2016E from ldquo200 Euro Car Parts branches within three years ldquo
ECP Current and Projected Store Base Simulated ECP Growth Solely from New Branch Openings
LKQ appears to operate ECP with the primary intent of unsustainably inflating its financials and meeting guidance targets at the long term shareholder expense of entrenchment in a contracting market We believe the result is predictable A new financial hole will be left in the wake of a slowdown of in ECP branch openings that LKQ will seek to plug with more acquisitions (which have already begun taking place)
Growing ECP branches was not an LKQ priority when it justified the acquisition and this is evident by its initial plan to open only 10-12 stores per year On the ECP Acquisition call (1142012) LKQ stated that it had a strategic ldquoplan to grow 10 to 12 branches per year for the next few yearsrdquo It broke from that lsquoplanrsquo just one quarter later and following repeated revisions branch store openings opened 40 branches in 2012 Coincidentally growth in North America was weakening Based on our estimates by Q4rsquo2012 ECP accounted for a full 75 of consolidated PampS organic growth and enabling LKQ to hit guidance
LKQ has repeatedly raised the ceiling for the maximum number of ECP branches the UK market can absorb On the Q1rsquo2012 earnings call LKQ stated in another revision that the UK could absorb a maximum of 150 full-sized ECP branches and indicated that at that level ldquobranches in major metropolitan areas can be 5 miles or so apartrdquo which would clearly result in cannibalization LKQ has since raised the ceiling on the maximum branch count to 200
As of 9302013 LKQ had a total of 138 stores (and growing) and plans to have 147 by YE2013 exceeding by 27 branches its initial guidance for the maximum number of stores the UK market could absorb (120 full-sized stores) which was likely the most credible number it has espoused given that it preceded the repeated store ramp-up and apparent quest to meet guidance It may have already saturated the UK market yet LKQ continues to invest shareholder capital into building new branches
LKQ appears to be juicing ECP sales with heavy discounting of parts with many such promotions offered right at the end of LKQrsquos fiscal quarters
Inevitably as ECP reaches its market saturating location capacity we expect ndash and we believe management has anticipated ndash its reported organic growth rate to plummet and converge to the industry average LKQ moved quickly to buy Sator in April 2013 amounting to its 3nd largest purchase ever at the time As a result its European reporting segment now includes both ECP and Sator This new reporting will obscure future financial deterioration at ECP
59
LKQrsquos Short-Termism Results in Increasing
Dependency on Acquisitions to Stay Afloat
60
Other Red Flags ECPrsquos Receivables
Growing 2x Faster Than Revenues
The recent acquisition of Sator appears designed to hide the problems occurring at Euro Car Parts By removing Satorrsquos Q2 2013 revenue and accounts receivable contribution we find that ECPrsquos receivables grew at 2x faster than reported revenues This is a major red flag for investors to consider
Source Company financial filings
European Segment Quarterly Operating Results$ in millions
Euro Car Parts Results Only SatorECP Pro Forma
3m Ended 3m Ended 3m Ended 3m Ended 3m Ended 3m Ended 3m Ended Sator ECP Only
Dec 2011 March 2012 June 2012 Sept 2012 Dec 2012 March 2013 June 2013 Contribution(1) June 2013
Revenue $1385 $1607 $1652 $1813 $1888 $2126 $2978 $688 $2290
QoQ growth -- 160 28 97 41 126 401 -- 77
YoY growth -- -- -- -- 363 323 803 -- 386
Accts Receivables Net $509 $590 $600 $689 $702 $787 $1437 $531 $906
QoQ growth -- 160 17 148 18 121 827 -- 152
YoY growth -- -- -- -- 379 333 1393 -- 509
(1) LKQ Quarterly filing Note 9
61
The Real ECP A Lemon with Terrible
Customer Feedback
httpwwwreviewcentrecomOnline-Car-Part-SuppliersEuro-Car-Parts-www-eurocarparts-com-review_2041339
Increasing Dependency on Acquisitions to
Inflate Financials Conceal Cumulative
Manipulations
Apparent Dependency on Acquisitions to Inflate
Profits and Conceal Cumulative Manipulations
LKQrsquos move to expand internationally beginning with its acquisition of ECP was reminiscent of another chapter from the Waste Management Story ndash the final chapter that ended with fraud and failure
On the October 4 2011 ECP Acquisition conference call LKQ Chairman (and former President of Waste Management International) Joseph Holsten unprompted assured shareholders that LKQ would not repeat Waste Managementrsquos international expansion mistakes
The ensuing realities however have reflected little in the form of caution
63
Now a few of us in LKQ have kind of been down a similar road before in the waste business when we founded Waste Management International in the early 90s And we ran down the road kind of fast and probably got into markets that were not good markets to be in And as I go out -- you will see it from this management team Itrsquos a team that learns from that lesson and will be more cautious in its market entries in Europe We have a very strong commitment to our board that job one is to make sure that the deal in the UK is functioning and functioning extremely well before we move into further markets
We believe LKQ entered Europe in search of a fresh pool of large-scale acquisition targets and that it is dependent on acquisitions to continue inflating its organic growth rate and GAAP profits while papering over cumulative past misstatements
LKQ entered the UK market with the express primary purpose of driving APU for collision repairs and has made very little progress in doing so to date
Despite Chairman Holstenrsquos pledge of caution LKQ has invested shareholder capital to aggressively ramp the ECP branch countwhile the industry around it contracts
Furthermore just a year and a half following the ECP acquisition ndash again not having yet proven ldquothe deal in the UK is functioning extremely wellrdquo when measured against its stated core purpose ndash LKQ acquired Netherlands-based Sator Holding a distributor of spare parts to the automotive aftermarket industry in Belgium the Netherlands and Luxembourg for a total of $273m Sator was LKQrsquos 3rd largest acquisition ever at the time LKQ pitched the acquisition as an opportunity to ldquoachieve significant synergies and ultimately in the coming years use Sator in our highly successful Euro car parts operations as platforms for further expansion into collision parts or other revenue and profit streams in Europerdquo In the same way that it did ECP ndash as an open-ended opportunity of driving APU for collision repairs currently at 7 in Western Europe vs 37 in the US
In commenting about the acquisition founder and President of ECP Sukhpal Singh Ahluwalia appears to have had its sites set more on acquisitions than on expanding collision-repair APU
In a November 12 2013 LKQ press release announcing that Sukhpal Singh Ahluwalia would be promoted to serve as Chairman of LKQ Europe Singh stated
With time Holstenrsquos assurances of caution and LKQrsquos pitches for open-ended opportunities to drive collision European collision APU have been exposed to be diversions 64
ldquohellip Our goal is also to use this transaction as a springboard for further acquisitions in Europerdquo
ldquohellip Under my Chairmanship we will continue to hunt for new acquisitions maintain relationships with our key suppliers and push
forward to access new markets My vision is to develop a group of European aftermarket companies exceeding $5bn in
annualised revenue within five years The UK alone will have 200 Euro Car Parts branches within three years and we have
ambitious targets for paint collision parts and e-commercersquordquo
Dependency on Acquisitions to Inflate Profits
and Conceal Possible Cumulative Manipulations
LKQ is rapidly accelerating its deal making both in number and in dollar value
LKQ acquired 30 companies in 2012 alone against the backdrop of having acquired a total of 71 companies in the 3 years from 2010-2012 and 171 since its 1998 inception Notably LKQ reported a record 17 acquisitions in just Q4rsquo12
Within the past 2 years LKQ announced 3 of 4 of its largest acquisitions ever
Its acquisition of Keystone Automotive Operations on December 5 2013 is its 2nd largest ever Its acquisition of ECP in Q4 2011 is its 3rd largest ever Its acquisition of Sator in Q2rsquo2013 is its 4th largest ever
65
of Quarterly Deals Completed
Rapid Surge in Acquisitions in Q412
Acquisition Fair Value
Includes $3037m paid for ECP
Includes $273m paid for Sator
$450m paid for Keystone Automotive Operations (announced 1252013)
Dependency on Larger and Larger Acquisitions to
Inc Profits and Conceal Cumulative Problems
2012 change from midpoint
High Low Actual Results - 22813 Actual Initial Guidance Final Guidance
2012 Guidance -22312
Organic Revenue (partsservices) 550 -- 750 Organic Revenue (partsservices) 600 050 050
ECP branch openings included in guidance 20 -- 20 Income from continuing ops $2612 -25 -27
Income from continuing ops $2580 -- $2780 Diluted EPS $087 -25 -28
Diluted EPS (1) $0860 -- $093 CFO $2062 -222 -191
CFO $2500 -- $2800 CAPEX $882 -180 -72
CAPEX $1000 -- $1150
2012 Guidance -42612
Organic Revenue 500 -- 700
ECP branch openings included in guidance 30 -- 30
Income from continuing ops $2620 -- $2820
Diluted EPS $088 -- $094
CFO $2500 -- $2800
CAPEX $1000 -- $1150
2012 Guidance -72612
Organic Revenue 550 -- 700
ECP branch openings included in guidance 30 -- 30
Income from continuing ops $2650 -- $2820
Diluted EPS (1) $089 -- $094
CFO $2500 -- $2800
CAPEX $1000 -- $1150
2012 Guidance -102512
Organic Revenue 600 -- 700
ECP branch openings included in guidance 42 -- 42
Income from continuing ops $2650 -- $2720
Diluted EPS (1) $088 -- $091
CFO $2400 -- $2700
CAPEX $900 -- $1000
(1) Adjusted for 21 stock split on 81712 In April guidance was adjusted to include $003c legal settlement
While LKQ met 2012 revenue and barely missed on EPS guidance it missed dramatically on CFO guidance 2012 CFO came in -19 below revised guidance issued only 2 months before year end on 10252012 even as consolidated inventory turnover rose to 27x in 2012 (vs 25x in 2011)
As previously discussed acquisition accounting inherently and unsustainably boosts CFO LKQ made a record number of acquisitions in Q4 just as a gaping financial hole in CFO exposed itself We believe LKQ may be making acquisitions with the intent of inflating its financials and papering over past accounting manipulations
The cumulative deal size was insufficient to bail the company out but we note that in 2013 LKQ proceeded to raise the stakes making its 2nd
and 4th largest acquisitions since its inception
66
Dependency on Acquisitions to Inflate Profits
and Conceal Cumulative Manipulations
Note Yellow shading indicates
changes in guidance
67
As LKQrsquos Deal Making Gets Progressively
Worse and More Desperate
The recent acquisitions of Euro Car Parts Sator and Keystone Automotive Operations exhibit progressively lower gross margins and have been acquired at multiples that are substantially lower than LKQrsquos own current valuation We believe these acquisitions are partially used as a cover to explain away possible overstatement and deterioration of margins in its core business
$ in mm 2007 2011 2013 2013
Revenues growth(a)
$7269136
$509625
$3740~4-6
$7000--
Gross Margin 448 438 331 Low 30
EBIT margin
$49168
$33466
$26070
----
EBITDA margin
$64989
$38976
$31083
$700100
EPS Accretion(b) -- 015 - $018c $001c --
Purchase Price(c) $811 $347 $272 $450
EVLTM EBITDA 125x 89x 88x 64x
EVLTM Revenues 11x 068x 073x 064x
Source Company financials converted from local currencies(a) Sator growth described as low single digits on investor conference call(b) As stated to investors in the deal announcement(c) ECP deal excludes $76m of earnout payments to be made in 2013 and 2014
Euro Car Parts Sator HoldingKeystone Auto
OperationsKeystone Auto
Industries
68
Even Tuck-in Acquisition Quality
Smells of Desperation
Aside from large announced deals LKQ has continued to acquire various businesses in an opaque and unannounced fashion Below we analyze information found in the footnotes of its SEC filings for trends in its recent deal-making
We find further evidence that its deals are getting increasingly desperate with smaller sized and lower EBIT contribution
$ in mm 2012 YTD 2013 (a) Observation
Number of Deals 30 9 At 25-30 market share it must be harder to find smaller deals
Total Deal Value Goodwill Recorded
$2846 $1976
$411 $261
Goodwill amounting to ~65 of recent deals
Avg Deal Size $95 $45 Avg Deal Size Down 50
Revenue Contribution $1163 $124
EBIT Contribution $110 $05
Implied Avg EBIT MarginContribution
94 40 Avg EBIT Contribution Margin down 540bps indicates lower
quality businesses being added
Source Company financials (Note 9)(a) As the 6 months ended June 30 2013 and excludes the Sator acquisition
69
As Leverage Rises at the Same Time
With margins under persistent pressure growth in the US stagnating and the need to produce increasing revenue and EPS targets LKQ has brazenly pushed into Europe with two recent acquisitions
Recently in an unexpected manner LKQ announced the acquisition of Keystone Automotive Industries for $450m a deal that is currently being financed by short-term borrowing Pro forma for the incremental $70m of acquired EBITDA we estimate the companyrsquos leverage to be 22x DebtEBITDA
$ in
bill
ion
Note Pro forma for debt financed Keystone deal
$601
$956
$1118
$1312
$1762
180x
230x 220x214x
223x
000x
050x
100x
150x
200x
250x
$0
$200
$400
$600
$800
$1000
$1200
$1400
$1600
$1800
$2000
2010 2011 2012 9302013 PF 2014E
Total Debt DebtEBITDA
Deb
tEBITD
A
Inventory Accounting
Is Creative Accounting Inflating Gross
Margins
71
The Art of Inventory Accounting
Inventory Chicanery Tempts More Firms Fools More Auditors Wall St Journal Dec 14 1992
When companies are desperate to stay afloat inventory fraud is the easiest way to produce instant profits and dress up the balance sheet says Felix Pomerantz director of Florida International Universitys Center for Accounting Auditing and Tax Studies in Miamildquo Even auditors at the top accounting firms are often fooled because they usually still count inventory the old-fashioned way that is by taking a very small sample of the goods and raw materials in stock and comparing the count with managements tallies In addition Mr Pomerantz says outside auditors can fail to catch inventory scams because they either trust management too much or fear they will lose clients by being tougherldquo
72
No One Knows What LKQrsquos Sustainable Gross
Margin Rate is Potentially Even Management
httpseekingalphacomarticle1595912-lkq-management-discusses-q2-2013-results-earnings-call-transcriptpage=6ampp=qandaampl=last
Craig Kennison Robert W Baird amp Co Incorporated Research Division
And lastly on gross margin John it fell a little bit year-over-year Im guessing thats largely mix and a little bit of the scrap issue But what do you think the sustainable margin rate would be at the gross levelJohn S QuinnJohn Quinn LKQ Chief Financial Officer and Executive Vice President
Craig I think weve talked in the past that our view is excluding the seasonality that unless something changes things tend to stay the way they are in the short term And we probably did get a little bit negative impact in Q2 because of falling scrap prices We did see a little bit of benefit coming through in the car costs on the domestic side As I had mentioned the demand obviously went down Rob mentioned were buying a little bit better year-over-year so we are trying to see that theory if you will evidence of it coming through in the financials Then we do have a downtick coming with Sator in the short run because theyll be fully consolidated next quarter fourth quarter and so on And we only had them for 2 months So I would expect it to see a little sequential decline as a result of having them onboard to the full quarter (ECP) will as I mentioned earlier just anniversaried now so I dont anticipate any impact from that And you get a little bit sequential impact at having the absence of a decline in the scrap prices Itll help us a little bit in the next quarter
Q2 2013 Earnings Call Aug 01 2013
LKQ Does Not Guide on Gross Margins But When Recently Asked About LKQrsquos Sustainable Margin Rate the CFO
Seemed to Theorize Gross Margins to be Driven by 5 Different Factors and Evaded the Question Wholly
12
3
4
5
The Facts Gross Margins in
Persistent Decline
LKQrsquos margins have been in persistent decline since 2005 while consolidated inventory turns have been relatively stable
We believe there is more deterioration in LKQrsquos gross margin than observable on the Income Statement
Sources LKQ financials CapitalIQ 73
Gross Margins in Persistent Decline Flat Inventory Turns
Gro
ss M
argi
n
Inven
tory
Turn
over
74
Three Accounting Levers Would Enable
Gross Margin Inflation
If LKQrsquos consolidated gross margin is being inflated how would it be able to maintain a stable consolidated inventory turnover For reference from FY 2005 to the LTM period ended 9302013 consolidated inventory turns have been relatively stable
measuring 28x Over the same time period consolidated gross margin contracted disproportionately from 471 to 41
1 Aggressive Inventory Policy Enables Overstatement of Inventory ndash LKQrsquos Salvage amp Remanufactured products inventory accounting policy allows for complete discretion to leave costs on the balance sheet in the form of overstated inventory The recent surge in salvage inventory coupled with gross margin deterioration is consistent with this trend In isolation this policy results in inflated gross margins and CFO and exerts downward pressure on the rate of inventory turnover The generally high level of Salvage amp Remanufactured inventory ndash to which the aggressive policy applies ndash is a high level sign the company may be manipulating its margins
2 Acquisition Accounting Enables Understatement of Acquired Inventories ndash The acquisition fair market value process enables LKQ to understate the values of acquired company inventories and to allocate the plug figure to goodwill The result is that inventory costs which should be future period expenses are instead permanently deferred In isolation this would result in inflated gross margins and CFO and exert upward pressure on the rate of inventory turnover thereby counterbalancing the downward pressure caused by increases in Salvage and Remanufactured inventory and stabilizing consolidated inventory turnover
3 Mis-categorization of One-Time Gains to Directly Inflate Gross Margins ndash Management has shown the willingness to use its discretion to very blatantly inflate gross margins
Furthermore we observe that LKQ has never disclosed or broken out in its financials amounts for inventory writedowns We find this odd for a company that holds inventory such as auto parts that have a finite useful life
We believe LKQrsquos gross margins will continue to decline through 2014 against the backdrop of intensifying competitive pricing pressures and as past accounting overstatements have to be reversed we believe LKQ is at elevated risk of a crippling goodwill write-down
LKQ Appears to be Pulling 3 Accounting Levers in Unison
1) Inflated Profitability Focus on Inventory
ndash Interview w Recycled Parts Distributor
(1) ldquoRecycled Parts Distributorrdquo is an owner of large independent auto parts recyclers75
Prescience Point (ldquoPPrdquo) LKQ reports a 10-11 profit margin Is that the standard for a recycled parts distributor in general
Recycled Parts Distributor (ldquoRPDrdquo) 1 I cant hit those numbers Im not even sure theyre making any money on the recycled business Im in the business its hard to make a profithellip It is very competitive
Prescience Point (ldquoPPrdquo) Do you have some skepticism as to whether LKQ is as profitable as it indicates
RPD Well the first thing I would look at is their (recycled parts) inventories Because theyre easy to manipulate There is no way to take an accurate inventory on recycled parts There is no way to get the right value You can do some estimating How they value their inventory is crucial as inventory gets older its almost worthless
LKQ uses an aggressive policy for accounting for its Salvage and Remanufactured Inventory (refer to next slide) that allows for a high level of discretion to leave costs on the balance sheet in the form of overstated inventory LKQ is likely inflating its gross margin and earnings by failing to record a necessary expense for excess and obsolete inventory Omissions of expensing obsolete inventories result in future margin compression as past overstatements must be reversed earnings will be pressured at the time when the inventory is sold (at a deep discount) or disposed of In isolation a policy of overstating inventory exerts downward pressure on LKQrsquos rate of inventory turnover
LKQ calculates the carrying value of inventory through a formula that applies 1) the historical average of gross margin and 2) expected selling prices1 Using historical margins and future pricing estimates as inputs may paint an unrealistic picture of inventory value As a result the impact of any rapid margin change may be smoothed over time we believe LKQrsquos gross margin is deteriorating faster than presented in its Income Statement
The recent surge in salvage inventory coupled with gross margin deterioration is consistent with this smoothing trend and the overall concern of costs being left on the balance sheet
76
1) Aggressive Inventory Accounting Policy ndash
Enables Overstatement of Inventory amp GM
Prescience Point estimate assumes aftermarket and recycled product categories have equivalent margins Keystone and LKQ margins were ~inline prior to the Keystone acquisition Excludes our estimate for lsquoOtherrsquo inventory turns which was imputed assuming a 45 DSI
Salvage amp Remanufactured Inventory Turns and Consolidated Gross Margin Are Declining
Salvage amp Remanufactured Inventory Has Recently Surged While Gross Margins are Declining
(1) Note for there are no standard prices for many of LKQs products which would give management wide discretion for marking inventory values
Aftermarket and Refurbished Product Inventory Our aftermarket inventory cost is established based on the average price we pay for parts and includes expenses incurred for freight and overhead costs For items purchased from foreign companies import fees and duties and transportation insurance are also included Refurbished inventory cost is based on the average price we pay for cores and also includes expenses incurred for freight labor and other overhead
Salvage and Remanufactured Inventory Our salvage inventory cost is established based upon the price we pay for a vehicle including auction storage and towing fees as well as expenditures for buying and dismantling Inventory carrying value is determined using the average cost to sales percentage at each of our facilities and applying that percentage to the facilitys inventory at expected selling prices The average cost to sales percentage is derived from each facilitys historical vehicle profitability for salvage vehicles purchased at auction or from contracted rates for salvage vehicles acquired under certain direct procurement arrangements Remanufactured inventory cost is based upon the price paid for cores and also includes expenses incurred for freight direct manufacturing costs and overhead
The companyrsquos policy sounds like the Gross Margin or Gross Profit (GP) method used by many retailers for estimating inventories for interim financial statements The GP method is not an acceptable method for determining the year-end inventory balance since it only estimates what the ending inventory balance may be GAAP requires companies that use the GM method to conduct an annual physical inventory count to determine the actual value of inventory at year end as inventory values and physical quantities can decrease over time even if they are not sold Failing to identify and reflect such shrinkage would undermine the reliability and accuracy of a companyrsquos financial statements
Although LKQ does not call its policy the GP method its description indicates the two policies are close to if not identical LKQ may be violating GAAP at every year-end as GAAP mandates taking an annual physical inventory count If we are correct that LKQ could have gotten away with calculating inventory based on these estimates is surprising Like any retailer LKQ is not immune to shrinkage (refer to Thieves Steal Dozens of Car Parts from Local Shop) which undermines the credibility of financial statements in which inventory is based on estimates
Source httpwnepcom20130604thieves-steal-dozens-of-car-parts-from-local-shop 77
1) Aggressive Inventory Accounting Policy ndash
Enables Overstatement of Inventory Balance
LKQrsquos Salvage and Remanufactured Inventory Accounting Policy
78
2) Acquisition Accounting ndash Enables
Understatement of Acquired Inventories
Because LKQ is a serial acquirer that does not disclose specifics of the vast majority of its acquisitions such as deal terms or consistencies of target company balance sheets analyzing its accounting irregularities with precision and across periods is difficult But the surge in Salvage amp Remanufactured inventory the account subject to the aggressive inventory accounting policy serves as a higher level sign that margins and CFO may be manipulated
LKQrsquos acquisition policy gives it a lot of discretion when it comes to accounting manipulations We believe LKQ may be using acquisition accounting to understate values of acquired inventories further inflating its gross margin In isolation this policy would exert upward pressure on LKQrsquos rate of inventory turnover
At the time of any acquisition the acquirer is required by GAAP to present the fair value ndash or present a current value ndash of all the assets and liabilities on the balance sheet When LKQ acquires a company it is required to mark at fair value the inventory acquired undervaluing the inventory would enable the company to counterbalance the rises in Salvage and Remanufactured inventory (previously discussed) keeping consolidated inventory turns flat and inflate gross margins and CFO
As Tyco demonstrated when its frauds were exposed there is plenty of room for manipulation in the fair value process (Refer to paragraph 4 in the SEC settlement announcement)
The strategy would entail marking the value of tangible assets ndash that would otherwise result in future expenses down (eg inventory and PPampE) ndash as low as possible in the name of conservatism and to allocate the balance to goodwill In effect the policy moves future period expenses to the balance sheet as goodwill where they are permanently deferred
To demonstrate at the extreme if the Company books the entire value of acquired inventory as goodwill (implying that it has marked acquired inventory down to a $0 value) then sells that inventory the revenue will flow right down to its bottom line Because there is no cost associated with that inventory the Companyrsquos gross margin on the sale is inflated in this case equating to 100
How would LKQ be able to keep consolidated inventory turns from declining in the face of GM manipulation
Tyco
2) Acquisition Accounting ndash
Interview with Salvage Auto Consultant
We believe it is exactly this lsquocookie jar accountingrsquo the consultant refers to that LKQ is using to inflate GM and CFO and to manage stability in its inventory turns which inherently lends to the appearance of a high quality earnings stream
(1) Salvage Yard Recycled Auto Consultant ndash consults for salvage yards consults for some through the process of being acquired by LKQ79
Prescience Point (ldquoPPrdquo) When people sell to LKQ what prices is LKQ paying What metrics are they using and what are they buying a yard at
Salvage Auto Consultant (ldquoSACrdquo) 1 I do some consulting for people that are selling to LKQhellip If the business meets their (LKQrsquos) criteria it would be rare for them to pay more than 06x sales These days thats the most I have seen them pay 60 of annual sales so they are probably paying less than that and only that amount if profitability is above 10 net capex has been maintained and it fits their customer mix ndash they will not buy a yard unless it sells late model collisionhellip
PP So if a yard sells at 06x sales what is the typical value of inventory being bought
SAC Lets back up and triangulate this Lets take a yard that does $5m and that sells to LKQ for 60 of sales or $3mhellip Understand that this revenue multiple does not include real estate it applies only to the business Letrsquos assume that 80 of the yardrsquos sales are used parts which is typical for the industry so it has $5m in annual sales 80 from used parts implying that $4m of their sales come from used part sales which is $350k per month The inventory values that are sustainable on the balance sheet for an IRS audit are between 2-3 months saleshellip At 3 months sales which I think is more sustainable (than 2 monthsrsquo sales) but probably more than that is needed actuallyhellip but I donrsquot think the IRS would give a yard trouble with 3 monthsrsquo sales in inventory ndash theyrsquod kinda look at it and go on because it implies 4 turns to COGS So 3 x $350k = $10m of inventory That would imply that of the $3m purchase price LKQ paid the inventory purchase component of that is at least $1m
PP OK so they buy a yard for $3m and that yard would typically have $1m in inventory
SAC Id say $1m to $15m is what theyre bringing it in at I think theyre being thoughtful about that number by the way I donrsquot think theyrsquore just applying some percentage method to it I think theyre looking at the reports the turns the gross margins and making some assumptions on how valuable that inventory truly is and how much obsolescence there truly is And theyre bringing it in at a value to avoid taking writedowns later And it may mean they may do some cookie jar accounting on the front end and amortize or replace some of it with goodwill because theyrsquod bake off over a long time
2) Acquisition Accounting ndash Enables
Understatement of Acquired Inventories
According to the lsquoSalvage Auto Consultantrsquo interview on the previous slide LKQ buys recycled auto distributors at a maximum of 60 of annual sales a valuation that applies solely to the operation and excludes the value of real estate Based on his experience LKQ targets companies generating 10 profit margins If we assume the purchase price ranges from 40-60 of sales this would imply
LKQ is paying 4xndash6x net earnings for recycled auto parts distributors
Acquired inventory values make up 33 ndash 67 of the purchase price
From 2003 to 2012 (excluding the impacts of the distressed purchase of Greenleaf) LKQ spent $23 billion on acquisitions If we assume for conservatism that the purchase price allocations to PPampE were all related to real estate buys and back the cumulative PPampE allocation out from the cumulative purchase price we are left with $21 billion spent to acquire the businesses Over the same period $482m of the cumulative purchase price was allocated to inventory or only 227 of the cumulative purchase price ex PPampE
We believe LKQrsquos purchase price allocations are consistent with a policy of having used acquisition accounting to systematically understate acquisition inventory values thereby inflating its financials and successfully stabilizing its inventory turnover
80
2) Acquisition Accounting ndash LKQ at
Elevated Risk of Goodwill Writedown
We believe LKQ is at an elevated risk of a significant goodwill write down
From 2003 to 2012 (excluding the impacts of the distressed purchase of Greenleaf) LKQ allocated ~70 of its aggregate acquisition costs to balance sheet goodwill To date it has amassed an $192 billion of goodwill (and a further $154m to intangibles) relative to a book equity totaling $225 billion goodwill makes up 85 of LKQrsquos book value
By way of comparison Keystone ndash prior to LKQrsquos buyout of the company ndash from April 1 1998 to March 30 2006 allocated only 449 of its aggregate acquisition costs to goodwill in FY 2007 Keystonersquos goodwill amounted to 152 of book value
A goodwill write down for LKQ is not without precedent Jan 1 2002 LKQ wrote off ~57 of its balance sheet goodwill Prior to the write down goodwill had amounted to 72 of book value
That LKQ took a valuation impairment during the post-tech recession in 2002 citing contracting multiples but did nothing of the such during or after the 2008-2009 financial crisis which was the deepest recession the US has endured since the Great Depression does not pass logic In 2009 LKQrsquos closest comparable Greenleaf the 2nd largest wholesale auto parts recycling business in the US was in distress and sold it itself to LKQ for lsquoless than the fair market value of its assetsrsquo enterprise valuations were down across the board as liquidity evaporated
Today the stakes are much higher for LKQ than they were in 2002 The current size of its goodwill account is multiples of its 2002 enterprise value Because we believe that LKQ may be using this account to manipulate margins and CFO we also believe the account appears inflated and impaired as it stands
Sources 10-krsquos for Keystone Automotive Form S-1 for LKQ filed July 28 200381
Previous LKQ Write-Off of ~57 of Goodwill Balance
Valuations for some of the Companys acquisitions have declinedsignificantly since the Company completed its acquisitions during 1998and 1999 due to a number of factors including lower earningsmultiples applied in the valuations of comparable companies As aresult the Company determined that the carrying value of certainreporting units exceeded the fair value of those reporting units atJanuary 1 2002 and recorded an impairment of goodwill in theamount of $49898800 net of tax of $16120700
LKQ Explanation Lower Valuations of Comps
82
3) One-Time Gains to Inflate Gross Margins
We believe LKQ was manipulative in how it booked gains in 2012 from legal settlements awarded in a class action suit against several aftermarket suppliers The awards were booked as two legal settlement gains of $83m and $84m in Q112 and Q212 respectively
The gain classification artificially inflated gross margins The gains were booked as reductions of COGS significantly propping up and blunting a multi-year decline in gross margins In 2012 these gains elevated gross margins from 4095 to 4138 which helped to mask the significant drop from 4257 in 2011
The settlement gains had nothing to do with ongoing COGS While the original source of the lawsuit may have originated from issues related to LKQrsquos inventory account receiving a one-time settlement gain is irrelevant to current period operations and should be treated as one-time non-operating gains in nature In our judgment LKQrsquos classification is exceedingly aggressive
In light of our belief that games are likely being played in LKQrsquos accounting for inventories the nature of managementrsquos choice in this case underscores the potential severity of other manipulations exposed or not
Management also inflated its earnings prospects by including the legal settlement gains in its EPS guidance The Company chose to factor these one-time legal settlement benefits into guidance even while explicitly excluding other one-time gainslosses from guidance
In Q1rsquo12 management raised 2012 EPS guidance due to inclusion of the first legal settlement gain in its revision The entire value of the positive differential over prior guidance was attributable to the one time legal gain
Based on its Q1 10-Q (excerpted below) management knew that an additional settlement gain of near-equivalent value would be recognized sometime in 2012 Even though it also expected to recognize this second gain management chose not to also include it in the 2012 guidance revision that included the first gainhellip
Instead in Q22012 management booked the remaining previously expected settlement gain in the amount of $84m equating to+$04 EPS When they reported Q2rsquo2012 results (issued 7262012) management AGAIN raised its 2012 guidance to $265ndash$282m and $177 ndash $188 And again the positive differential from the prior guidance resulted from including the 2nd previously anticipated gain offset by a fall in scrap prices in the revised numbers In other words guidance would likely have been lowered had LKQ included the 2nd gain in the original guidance revision This seems to indicate they kept it in their back pocket to ensure the next revision to guidance would be a raise
83
Contrsquod
3) One-Time Gains to Inflate Gross Margins
ldquoWe are a plaintiff in a class action lawsuit against several aftermarket product suppliers Our recovery is expected to be approximately $16 million in the aggregate In January 2012 we reached a settlement agreement with certain of the defendants under which we recognized a gain of $83 million which was recorded in Cost of Goods Sold during the three month period ended March 31 2012hellip
We expect to recognize an additional $8 million gain related to settlements with certain other defendants in this lawsuit in the last nine months of 2012rdquo
ndash LKQ Q1rsquo2012 10-Q
84
On the Q2rsquo2012 earnings conference call CFO John Quinn was asked by an alert analyst whether hersquod expected the 2nd settlement gain when guidance had been issued in Q1 he completely dodged the question
But per the previous slide itrsquos written in black and white in the Q1rsquo2012 10-Q Of course he expected it
Craig R Kennison (Robert W Baird amp Co Incorporated Research Division)
ldquoJust to finalize on the guidance In the second quarter you had a $004 legal benefit which is being included in your guidance Did you expect that when you initially gave guidance after last quarterrdquo
John S Quinn
ldquoIt was not included in the guidance last quarterrdquo
ndash LKQ Q2rsquo2012 Earnings Conference call QampA 7282012
Contrsquod
3) One-Time Gains to Inflate Gross Margins
85
Another Red Flag ShippingHandling
Revenue is Diverging from Other Metrics
Source Company filings
LKQ collects revenues related to shipping and handling (SampH) and regularly reports these figures in its 10-K
If LKQ were a healthy growing firm we would expect to see SampH revenue at least stay constant over time with reported revenues COGS and average inventory
However we observe declining trends in LKQrsquos SampH revenue among all relevant financial metrics In particular we observe that SampH revenue to average inventory has declined at the fastest rate in the past six years We interpret this as strong indicator of potential inventory shenanigans
Shipping and Handling Revenue vs Other Financial Metrics
000
050
100
150
200
250
000
100
200
300
400
500
600
700
800
900
2006 2007 2008 2009 2010 2011 2012
of Avg Inventory (LHS) of COGS (RHS) of Total Revenue (RHS)
SampHInventory Has Largest Drop
86
WM and DZ ndash Previous Employers of Many
LKQ Execs amp Accounting Personnel
Flynn Enterprises Common Shareholder
John QuinnVarious Positions
John QuinnSVP and CFO
Mark SpearsController Head Acct
Mark SpearsFormer SVP CFO
Frank ErlainFmr VP Finance
Controller Accountant
Victor CasiniGen Counsel amp
Secretary
Walter HanleyAsso Gen Counsel
Walter HanleySVP Development
Victor CasiniGen Counsel amp
Secretary
Ken FreseAcctrsquog Mgr
Ken FreseAccountant
Ken FreseDir Accounting amp
Inventory
Joe HolstenCOO CEO WM Intrsquol
Joe HolstenFmr CEO Chairman
Frank ErlainVP amp
Controller
Sinon GalvinSVP Revenue Optimization
Sinon GalvinVarious Positions
WM Intrsquol
Fraud Allegations Improper Capitalization of Expense Files for Bankruptcy March 1996
Charged w $17 billion Accounting Fraud March 2002
Stephen EckelDir Oracle Fin Apps
Fmr AcctrsquogAss Contrsquoller
Stephen EckelAssistant Corporate
Controller
Source SEC filings LinkedInreg
Kevin FlynnFormer Director
Kevin FlynnVP Midwest
Vaughn HooksChief Tax Officer
Vaughn HooksVP Taxes
Dan ShoenerVP
Dan ShoenerVP of Finance
LKQ
87
LKQrsquos Director of Inventory Accounting
$17bn Accounting
Fraud
Fraud Allegations
Filed for Ch 11 Bankruptcy
httpwwwlinkedincomprofileviewid=30515327amplocale=en_USamptrk=tyah2amptrkInfo=tas3Aken20freseSource
In light of our belief that LKQ may be inflating its financials and most likely via inventory accounting shenanigans it is worth noting that LKQrsquos Director of Accounting and Inventory is connected with two companies previously alleged to have engaged in accounting manipulations to inflate their stock prices
The Waste Management
Playbook for Paper lsquoProfitabilityrsquo
Used Over and Over Again
89
Waste Management ndash Aggressive Roll-up
Strategy Replicated by LKQ amp Many Others
In 1968 Dean Buntrock Wayne Huizenga (both LKQ founding backers) and Lawrence Beck founded Waste Management (WM) In 1972 Donald Flynn (LKQrsquos founder) joined WM as CFO WM set out to consolidate the highly fragmented garbage hauling industry via an aggressive roll-up strategy Its growth would benefit from the tailwinds of recently issued EPA regulations that posed challenges for mom and pop operators
By the time WM went public in 1971 it had acquired 133 garbage haulers and was generating gt$10m in revenue In the first 9 months of 1972 it had acquired another 133 firms and by the end of the year had generated $72m in revenue From 1971 to 1980 WMrsquos revenue grew at a rate of 48 per year and in 1980 it generated $656m in revenue By 1986 WM had become the largest waste disposal firm in the world
Donald Flynn was given credit as the ldquofinancial geniusrdquo behind Waste Managementrsquos extraordinary growth from the 1970s to the early 1990s in a 1993 corporate history commissioned by the company
In 1976 the SEC alleged that WM founder Huizenga was involved in disguising unlawful political contributions that Waste Managementwas skimming dump fees and using the proceeds to create an illegal slush fund to be used for political contributions Huizenga signed a consent decree barring him and WM from using corporate money for unlawful political contributions and from filing materially false and misleading financial statements There was no admission of wrongdoing
In 1984 WM co-founder Huizenga and John Melk President of WM International sold their stakes in the company and would go on to invest in Blockbuster Entertainment Buntrock remained as CEO until 1996 and Flynn as CFO amp director until 1989 amp 1997 respectively
By the late 1980rsquos and early 1990rsquos WM had undertaken a botched international expansion in a push to become the worldrsquos first global lsquoenvironmental servicesrsquo company ldquoThat ambition led Waste Management to acquire a range of profit-draining businesses The eventual result was angry shareholders turmoil in the board room and a disruptive series of management purges and sudden resignations followed by revelations (in late 1997) of accounting irregularitiesrdquo
In 1998 the troubled company merged with USA Waste Services Inc
In 1997 a WM board-led probe turned up a massive financial fraud that went undetected from 1992ndash1997 involving the inflation of asset values and pre-tax earnings resulting in a $35B charge in 1998 and the largest financial restatement in history at that time The SEC charged WM with perpetrating a massive financial fraud
90
SEC vs Waste Management
In mid-July 1997 a new CEO ordered a review of WMrsquos accounting practices That review ultimately led to the restatement of the Companys financial statements for 1992 through the third quarter of 1997 When the Company filed its restated financial statements in February 1998 it acknowledged that it had misstated its pre-tax earnings by approximately $17 billion and took a $35 billion charge At the time the restatement was the largest in corporate history
From 1994 until 1997 a period at the heart of the perpetuation of the fraud Donald Flynn (LKQrsquos founder) was a Waste Management Audit Committee member and also served as Audit Committee Chairman during a period coinciding with the fraud
According to the SEC former WM CEO Dean Buntrock who would later be LKQrsquos founding backer amp director was ldquothe driving force behind the fraudrdquo and that ldquoHe was the primary beneficiary of the fraud and reaped more than $169 million in ill-gotten gains from among other things performance-based bonuses retirement benefits charitable giving and selling company stock while the fraud was ongoingrdquo
httpwwwsecgovnewsheadlineswastemgmt6htmWaste Management Founder Five Others Sued for Massive Fraud
91
SEC vs Waste Management ndash RE Multi-Year
ldquoMassive Earnings Management Fraudrdquo
Defendants Inflated Profits by $17 Billion To Meet Earnings Targets Defendants Reap Millions in Ill-Gotten Gains While Defrauded Investors Lose More Than $6 Billion
ldquoThe Securities and Exchange Commission filed suit today against the founder and five other former topofficers of Waste Management Inc charging them with perpetrating a massive financial fraud lasting more than five yearsrdquohellipldquoThe complaint alleges that defendants fraudulently manipulated the companys financial results to meet predetermined earnings targets The companys revenues were not growing fast enough to meet these targets so defendants instead resorted to improperly eliminating and deferring current period expenses to inflate earnings They employed a multitude of improper accounting practices to achieve this objectiverdquo
ndash SEC Press Release 3262002
bull On August 29 2005 the SEC announced its fraud action against the accused Waste Management officers would be settled for a total of $308m
bull Buntrock and the others accused neither admitted nor denied wrongdoing
WM Alumni Borrowing from the Old WM
Playbook Over and Over Again
Waste Managementrsquos aggressive rollup strategy gave its management a high level of flexibility to inflate revenue growth and margins and to conceal doing so
A closely-knit group of WM alumni and associates (including LKQrsquos founders) have repeatedly co-invested in and built several companies with each company replicating WMrsquos aggressive roll-up or an acquire-and-build strategy in either case either consolidating or flooding an industry with store openings in an effort to claim the dominant position as fast as possible Some of these companies include Blockbuster Video Discovery Zone Boston Chicken AutoNation Swisher Hygiene and LKQ Many of these companies have either failed to deliver on their sales pitches to investors failed outright or were tarred by allegations of fraud manipulative accounting andor unjust management enrichment
Based on our analysis in the majority of cases these WM alums and associates build businesses with the intent to create the illusion of growth as opposed to focusing on creating value through operational excellence This has prompted some critics to claim that they build companies that have little lasting value
Many involved seem to have learned to begin cashing out just before and soon after building a roll-up large enough to sell to the public at inflated valuations and have gotten very rich in the process
Billionaire Wayne Huizenga (LKQ founding backer and WM co-founder) has been involved in all of the above mentioned companies either as a backer or as an executive or both As he is quoted as saying (regarding some of the roll-ups that went on to fail after he cashed out)
We left these companies in great shape and to be blamed for their problems years after I left is ridiculous
92
Same Players Same Strategy Results
Marred by Accounting Irregularities amp Failures
93
John MelkInvestor
Charged with accounting fraud one
of the largest in history
Aggressive rollup strategy
Discovery ZoneBlockbuster Boston Chicken AutoNation Swisher Hygiene
Dean BuntrockCo-founder CEO
Dean BuntrockInvestor Franchisee
Dean Buntrock Founding Backer Director
Dean BuntrockInvestor Director
Donald FlynnCFO Director -Audit Committee
Donald FlynnInvestor
Donald FlynnFounding Backer Director
Donald Flynn Founder
Donald FlynnCEOChairman
John MelkPresident WM International
John MelkFounding Backer Director
John MelkFounding backer Director
John MelkInvestor Director
Lawrence BeckCo-founder
Lawrence BeckInvestor Franchisee
Lawrence BeckInvestor Franchisee
Peer PedersenDirector
Peer PedersenInvestor Franchisee
Peer PedersenDirector
Peer PedersenInvestor
Scott BeckInvestor COO Vice Chairman
Scott BeckInvestor
Scott BeckCEOChair
Steven BerrardCFO then CEO
Steven BerrardCo-founder Co-CEO
Steven BerrardCEO Director
Victor CassiniGen CounselSecretary
Victor CassiniGen Counsel Secretary
Wayne HuizengaCo-founder
Wayne HuizengaCEOChairman
Wayne HuizengaInvestor (via Blockbuster)
Director
Wayne HuizengaInvestor
Wayne HuizengaFounder Co-CEO
Wayne HuizengaChairman
Wayne HuizengaFounding backer (via
AutoNation)
Bought out by Viacom for $84B
Aggressive acquire-amp-build
strategy
Goes bankrupt Allegations of fraud
Aggressive acquire-amp-build
strategy
Goes bankrupt Accounting gimmicks to obscure financials
Aggressive acquire-amp-build
strategy
$$ Billions Lost Pooling of Interests
acquisition accounting
Aggressive rollup amp acquire-amp-build strategy
Accounting irregularities
Financials restatementAcquisition Accntng Issues
Ongoing SEC inquiry
Aggressive rollup strategy
An array of accounting
red flags amp misrepresentations
Aggressive rollup amp acquire-amp-build strategy
Dean BuntrockFranchisee
Steven BerrardCEO post-Viacom
LKQ
Blockbuster Entertainment
Blockbuster Entertainment proved to be Huizenga and his associatesrsquo most lucrative endeavor and its success would become a core aspect of their pitch to sell investors on subsequent endeavors employing the same strategy (with little success) We believeBlockbuster worked primarily because it operated in a relatively nascent quickly growing space ndash it had the wind at its back allowing for a comfortable margin for error Additionally by executing an extremely aggressive acquire-and-build strategy the companyrsquos key financial metrics were inherently blessed Lastly it was bought out by Viacom prior to falling apart as the result of fundamental forces The associatesrsquo subsequent endeavors however evidence that absent high luck rapid expansion strategies that depend on external capital are customarily near-impossible to manage and that managers are seduced by flexibility in accounting policies
In 1987 Donald Flynn Wayne Huizenga and John Melk (former President WM International) bought a controlling interest in Blockbuster Entertainment Company Blockbuster set out to consolidate the highly fragmented video rental field which was already growing in the double-digit range when Blockbuster came into the picture ndash via the implementation of a rabid buy-and-build strategy
Huizenga who assumed the role of CEO and Chairman built the company in accordance with his modus operandi ndash at a furious pace and with a buy-and-build strategy purchasing smaller chains and constructing new outlets When Huizenga and his associates invested in 1987 Blockbuster owned 15 stores and franchised 20 others From that point on Huizenga opened a Blockbuster store every 17 hours on average for seven years by the time of its 1994 takeout by Viacom Blockbuster had expanded the store count to 3700
Worries that the video rental industry was reaching a saturation point cast doubts on Blockbusters ability to keep opening stores indefinitely One response to this concern was to look to markets outside the United States for growth
In April 1993 Blockbuster supported Donald Flynn by injecting equity capital into his new venture Discovery Zone (DZ) buying a 20 stake (with the option to buy 499) Huizenga and other Blockbuster executives joined the DZ board
In September 1994 Viacom Inc acquired Blockbuster for $84 billion
94
Discovery Zone - Reckless Buy-and-Build
Fraud Allegations Bankruptcy
In July 1992 Donald Flynn (LKQrsquos founder) bought a controlling interest in and assumed the role of CEOChairman of the Discovery Zone an ownerfranchiser of indoor kidsrsquo playgrounds using proceeds from his success with Blockbuster DZ set out to build a leading market position in its space via a reckless acquire-amp-build strategy Unfortunately in its rush to accelerate revenue growth it incurred substantial debts and lost control of its costs landing it in bankruptcy Viacom later sued Flynn in 1997 claiming he was responsible for inflating DZrsquos earnings and misrepresented its financials to secure the sale of his stock to Viacom in 1995 shortly before DZ declared bankruptcy The suit was settled for an undisclosed cash sum
In April 1993 Blockbuster Entertainment injected equity capital into DZ to finance Flynnrsquos expansion plans buying a 20 stake (with the option to buy 499) In June 1993 DZ IPOed
DZ used public capital to expand rapidly Between 1991 and 1995 DZ expanded from 28 locations to 336 locations In September 1994 DZ bought 60 franchised DZ units operated by Blockbuster Blockbuster simultaneously increased its equity ownership in DZ to 499 by exercising its option to purchase additional equity directly from the Flynn family (through DKB Investments LP) on September 29 1994 Viacom acquired Blockbuster
November 1994-March 1995 ndash 3 lawsuits which were later consolidated were filed against DZ as it reported substantial operating losses in Q3rsquo04 and subsequent periods The claims allege DZ and certain directors amp officers including Flynn engaged in fraud intended to inflate DZrsquos stock price such as improperly capitalized preopening expenses failing to timely make public the change in the method of accounting for preopening expenses etc The consolidated complaint was dismissed as a result of DZrsquos Ch11 filing
On February 1 1996 DZ warned shareholders that it may seek bankruptcy protection after January sales fell below expectations the stock collapsed by gt60 on Feb 27 1996 Flynn resigned as DZrsquos Chairman On March 25 1996 DZ filed for Ch11 protection
In 1997 Viacom sued Donald Flynn and his sons claiming they inflated earnings through improper accounting adjustments and misrepresented the companyrsquos financial statements to secure a $25m sale of their personal stock to Viacom and to meet Wall Street Expectations for profitability According to Kevin Forde Donald Flynns attorney following settlement of the matter in 2004 There was a payment of a certain sum for dismissal of all claims and our clients were very satisfied with the settlement
95
This is a question of a company that grew too quickly without the infrastructure to do orderly and profitable growth
ndash Robert Mead Discovery Zone spokesman commenting just after the company files for Ch 11 (March 26 1996)
Boston Chicken ndash Reckless Buy-and-Build
Accounting Gimmickry Bankruptcy
In 1992 Scott Beck and a partner bought a controlling interest in Boston Chicken (BC) a rotisserie-style chicken restaurant with the $120m he made from selling his stake in Blockbuster Video franchise stores back to Blockbuster Entertainment The foundation of BCrsquos business strategy was based on reckless acquire-amp-build strategy This reckless expansion program however would prove to be the root cause of BCrsquos financial demise pushing the company into bankruptcy BC would likely have ended up in bankruptcy much sooner given its cash-degenerative store unit economics had gimmicky accounting not concealed signs of its deteriorating business
6 months after taking over Boston Chicken Beck was overseeing a chain of 53 restaurants in ten states By the end of 1992 Boston Chicken had 83 stores In 1993 Boston Chicken went public accumulating external capital for even more growth In 1993 BC wentpublic the chain nearly tripled in size to 217 stores By the end of 1994 it had 534 stores Management announced its intent to grow the chain at a rate of more than 325 stores annually at least through the end of the decade
Problems surfaced during the summer of 1997 Poor employee training high operating expenses and its lending policy to developer-franchisees had started to take their toll on company finances In 1998 Beck resigned Stores sales continued to falter and by July losses had reached $4371 million
On October 5 1998 BC filed for bankruptcyhellip A noted short-seller commented ldquoThe Chicken has been plucked due to deteriorating store-level economics management turmoil and an outsized amount of debt due to an aggressive expansion plan that had once impressed Wall Street but perhaps never made financial sense
(1) Howard Schilit Financial Shenanigans How to Detect Accounting Gimmicks amp Frauds in Financial Reports (New York Mcgraw-Hill2010) 103-10496
They have the most aggressive expansion program ever undertaken in the restaurant industryldquo
ndash Restaurant Analyst Mike Mueller in Restaurant Business (4101994)
Deceptive Accounting at Boston Chicken Discussed in Financial Shenanigans By Howard Schilit (Excerpts Below)1
Swisher Hygiene ndash Reckless Roll-Up
Financials Restatement SEC Inquiry
In 2004 Wayne Huizenga and Steven Berrard bought and took private public company Swisher International an industrial cleaning business In August 2010 they took Swisher public through a reverse merger renaming the successor entity Swisher Hygiene Swisher was set on consolidating its industry via an aggressive and reckless roll-up strategy Eventually the company announced that previously-issued financials could not be relied upon and that its profitability had been overstated Swisherrsquos Audit Committee is currently probing the companyrsquos acquisition accounting policies as the company contends with ongoing SEC and US Attorney inquiries
Based on an August 2010 Bloomberg News article Huizenga planned ldquoto build Swisher much the same way as he grew Waste Management Blockbuster and AutoNationrdquo and according to Huizenga
Swisher began raising capital and in approximately one year had bought 55 companies an average of more than one per week The Wall Street Journal named Swisher the ldquomost acquisitiverdquo business in North America in 2011 after its buying spree
By March 2012 Swishers Audit Committee announced its 2011 interim financials could not be relied upon and that it would delay the filing of its annual report due to an ongoing internal investigation primarily relating to possible adjustments to (1) the accounting for business acquisitions and (2) the calculation of the allowance of doubtful accounts receivable It concluded that previously issued interim financial statements could not be relied upon and that earnings were inflated for the affected periods According to its most recent 10-Q the SEC and the US Attorneys Office have requested more information from the company and the company faces federal shareholder lawsuits that allege the company artificially inflated its stock price (which collapsed as a result of the announcement)
Further disclosure in a corresponding 8-k shows that Swisher is focusing on its accounting for acquisitions which we believe LKQ may be using to manipulate its accounting as a source of its accounting irregularities
Huizenga resigned from Swishers board in May 2013 Berrard resigned as CEO in August 2012
97
This is another opportunity to build a company that will growhellip Now wersquoll have public capital to do acquisitions helliphelliphelliphelliphellip
You go to a guy and you say lsquoDo you want to sellrsquo If they think they can be a part of something thatrsquos going to grow -- you give them some cash and some stock -- theyrsquoll say rsquoyeshellip They want the stock because theyrsquoll think lsquoOh boy you guys are going to grow this business and Irsquom going to watch my stock growrsquo
During the course of its independent review and due in part to the significant number of acquisitions made by the Company the Audit Committee determined it would be in the best interest of the Company and its stockholders to review the accounting entries relating to each of the 63 acquisitions made by the Company during the year ended December 31 2011
AutoNation ndash Reckless Buy-and-Build
Billions Lost Most Comparable to LKQ
The case study of AutonNation Inc and its predecessor entity Republic Industries (collectively AN) we believe bears many parallels to how LKQs will develop AN tried to consolidate a highly competitive low margin maturelow growth industry but lacked a fundamentally superior way of making money Using public capital it over- expanded and -extended itself losing focus and eventually resulting in billions of dollars of shareholder losses
AN was led by Wayne Huizenga and Steve Berrard as co-CEOrsquos from 1996 ndash 1999 Using an aggressive acquire-amp-build strategy fueled by company shares they set out to consolidate the automotive business by building a one-stop-shop involved in every stage of selling renting and servicing new and used cars They built an empire of new car dealerships car rental agencies and used car megastores selling investors the vision that each one would feed the other to enable the company to generate profits on a vehicle throughout its lifetime
In 1996 amp 1997 it acquired hundreds of businesses mostly relying on the controversial pooling of interests acquisition accounting practice with its earnings likely inflated as a result In less than 2 years time AN was the largest auto retailer in the US with a market cap of gt$12B
They continuously reminded investors of the successes they achieved with Waste Management Inc (Huizenga sold out of WM in 1984) and Blockbuster Inc Per ANrsquos 1995 annual report We want to build a brand just like we did at Blockbuster Wall Street bought into the vision that Huizenga could replicate those successes in consolidating the autos market
The association would prove misleading the growth of WM and Blockbuster were supported by strong secular tailwinds WMs growth was supported by regulatory changes that made it almost impossible for mom and pops to compete Blockbusters growth benefited from a video-rental industry that was growing in the double digit range Like LKQrsquos ANrsquos end markets on the other hand were already mature growing at a very low single digit growth rates ndash ANrsquos success was dependent on stealing market share from existing competitors Similar to LKQ it also lacked the ability to drive down its most basic costs
With high fixed costs and inventory values that depreciated with each passing moment ANs used car business lost significant sums of money and led to investor disappointment its share price fell by gt80 from peak to trough representing a cumulative value of gt$10B
In 1999 Huizenga and Berrard stepped down New CEO Michael Jackson would dismantle the empire via asset sales and spin-offs in an effort to focus the enterprise and improve margins He spun off the rental car business and closed the money-losing used car business resulting in a pre-tax charge of gt$400m He announced AN would suspend further purchases of new-car dealerships and concentrate instead on reducing costs at existing dealerships and announced an increased its stock buyback program by $500m
(1) Paul F Kocourek Steven Y Chung and Matthew G McKenna ldquoStrategic Rollups Overhauling the Multi-Merger Machinerdquo Strategy amp Business second quarter 200098
ldquohellipit found it had no way to drive down the basic cost of the business mdash buying cars Unlike new-car dealers that accept many used vehicles as trade-ins often on favorable terms AutoNation had to compete at auctions with other dealers to build its inventory With relatively high fixed costs a huge inventory
that depreciated in value with every passing week and no sign of improvement AutoNation bailed out and exited the used-car business in late 1999 ldquo1
AutoNation ndash Reckless Buy-and-Build
the Build-Out of an Empire Destined to Fail In May 1995 Huizenga and a relative invested $31m in Republic Industries a public waste disposal company that would allow him to raise public
capital for his next venture Huizenga was appointed CEO and Chairman of the company
The next year Steven Berrard joined him as co-CEO and director Under their leadership the company announced plans to aggressively grow into a completely unrelated industry setting out to build a one-stop-shop for consumers automotive needs via consolidating the fragmented automotive retail and rental markets According to a New York Times article Huizenga said that Republic would cater to anybody who wants to rent lease or buy a car that is brand new or used
Republic expanded aggressively purchasing hundreds of franchised amp used car dealerships and car rental companies with the vision of assembling an empire that would reap economies of scale by involving itself in every stage of selling renting and servicing new and used cars It grew from only one franchised vehicle dealership at the end of 1996 to more than 270 franchised dealerships owned or under contract by the end of 1997 becoming Americarsquos largest automotive retailer in 1 years time
Amongst Republicrsquos major acquisitions was AutoNation USA (ldquoAN USArdquo) a developmental-stage private company owned by Huizenga and Berrard The two co-founded the company in September 1995 intending to grow it into a nationwide chain of used car megastores each of which would offer up to 1000 reconditioned late model low mileage vehicles When Republics intent to acquire AN was announced AN had not yet opened a single megastore and from inception to September 29 1996 AN USA had lost $214m on revenues of $92m with shareholders equity of $307m Republic paid 175m shares of stock for AN USA equating to $250m at its intent to acquire was announced on March 29 1996 but according to a class action complaint filed in January 1997 due to a rise in Republics share price prior to its close the deal was consummated for $643m
In 1996 and 1997 Republic also bought several vehicle rental companies including Alamo Rent-A-Car and National Car Rental System becoming one of the leading vehicle rental companies in the world
In 1998 Republic generated revenue of $16bn up from $56bn in 1996 But when the dust began to settle from a slowdown in its acquisition binge the economics of its business model did not pan out as promised Republic struggled as a car dealership with high overhead low profits and a strategy based on synergies that didnrsquot materialize The AutoNation USA business was a money-losing business operation
Furthermore Republic may have been relying on the acquisition accounting practice known as pooling of interests to inflate its earnings Republic applied this approach for more than half of its deals in 1996 amp 1997 without having used it its thin margins may have been in the red
Republic stock had risen from a split-adjusted $2 when Huizenga bought in to a peak of ~$44 in January 1997 by June 1997 shares had declined ~50 and would continue their descent each year until hitting a low of $5 in December 2000 Its market cap fell from a peak exceeding $12bn by gt80 representing ~$10bn in lost shareholder value
(1) Machan Dyan Crime Garbage and Billboards Forbes November 20 1995 vol 156 issue99
We were looking for a shell [company] and this happened to come up he says It could have been in anythinghellip1
When they think of transportation he said we want them to think about us
AutoNation ndash Reckless Buy-and-Build
New Profit-Focused CEO Dismantles Empire At Republics May 1998 shareholder meeting Huizenga expressed his disappointment about the companys stagnant share price according to an Sun
Sentinel article describing the event he told investors about how the matrix of car dealerships and rental car agencies was going to simultaneously grow sales to perhaps as much as $60 billion in three to five yearslsquo and that costs would be cut to boost profits
Notwithstanding the mounting pressures to remain focused in July 1998 AutoNation invested in Huizengas close associate Donald Flynns new endeavor LKQ Corp (It would cash out of this investment in 2003)
In 1999 under pressure from shareholders and a falling share price Republic began to unwind what it had built over the preceding 4 years streamlining its operations and undergoing management changes
In April 1999 Republic spun off its waste disposal segment and subsequently changed its name to Autonation Inc (ldquoANrdquo)
On September 24 1999 Huizenga and Berrard stepped down from their co-CEO positions Michael Jackson former CEO of Mercedes Benz USA was named new CEO
On September 30 6 days after Jackson was hired Autonation announced the spin-off of the car rental business to focus exclusively on the automotive retail business
On December 13 1999 3 months after taking the helm Jackson killed the concept of used-car megastores announcing the immediate closure of the money-losing chain and the expectation of a pre-tax loss of between $430 ndash $490m Of its 29 megastores 23 would be closed and 6 integrated with new vehicle franchises
According to a December 14 1999 New York Times article
AN also announced it would suspend further acquisitions of new car dealerships instead concentrating on reducing costs at existing dealerships and announced an increased its stock buyback program by $500m In the press release Jackson emphasized his focus on improving profitability and the sustainability of the AN business model
Jacksonrsquos initiatives tremendously benefited the companys efficiency tremendously A 2001 study for USA Today showed that AutoNation increased revenue per employee 82 percent from 1998 to 2002 a greater increase in efficiency than any other large public company in the country
100
ldquoMr Jacksonhellip said that the used car superstores (ie AN USA) were high-cost operations with no chance of ever generating profits proportionate to their risk Even if AutoNation had been willing to invest heavily devote a lot of management time and wait for years he said the cost structure in those stores
would still have been very high leading to marginal operations
Our focus now is on improving our operating margins and on creating a unique and branded customer experience in our new vehicle franchises which are now AutoNations sole business focus By closing the megastores and implementing SGampA reductions we have taken the necessary steps to ensure
the long-term success of AutoNation
LKQ Governance Concerns
102
Key Management Changes Start in
2009-2010 Just As Business is Improving
We believe LKQrsquos core business began slowing in the 2009-2010 which coincided with the APU rate stalling and a stagnation in insurance paid collision repairs Beginning in this period we also observe various changes to key management positions
LKQrsquos CFO Mark Spears also the former Principal Accountant at Waste Management mysteriously resigned in May 2009 despite a record year for the Company Spearsrsquo departure came ~1 year after the SEC issued a comment letter questioning numerous aspects of their business and further comment letters would follow
Subsequent changes have included a new CEO and the departure of the Head of IR and Chief Acctrsquog Officer
Date Executive Role Note
52109 Mark Spears CFO Resigns Press Release
12610 Rob Wagman Promotion from SVP Ops to Co-CEO
Press Release
12610 Joe Holsten Resign CEO joins the Board Press Release
Dec 2010 Sarah Lewensohn Director of Investor Relations
No longer listed as IR contact in PR
22811 Frank Erlain Long time VP Finance Chief Acctrsquog Officer Retires
8K filing
3512 Victor Casini SVP General Counsel resigns from the Board
8K filing
Comment Letters httpwwwsecgovArchivesedgardata1065696000000000008014694filename1pdfhttpwwwsecgovArchivesedgardata1065696000000000010023419filename1pdf
103
Delinkage of Incentives Insiders Dumping
Rewarded to Acquire at Any Cost
Insiders have been selling shares aggressively since the IPO when former owners of acquired companies affiliates and management owned 22 Since 2009 insider selling pressure has intensified and now insiders own less than 2
Managementrsquos annual bonuses are tied to revenue growth and long-term incentives are also tied to Revenue EPS and ROE with the following weightings revenue (475) earnings ($475) and ROE at just 5 These metrics incentive management to recklessly acquire revenue and boost EPS
Beneficial Ownership of Insiders vs Revenue and Free Cash Flow Growth
$ in bn
104
And Sell Stock Shortly After Trumpeting the
Merits and Growth Opportunities at Keystone
SEC Form 4 filings show that key members of the management team made timely open market sales shortly after announcing the acquisition of Keystone Automotive Operations Inc on December 5 2013
These sales directly call into question why management would announce one of the largest deals in company history that ldquosignificantly expands its addressable marketrdquo and then abruptly unload stock Our take is that therersquos an increasing disconnect between shareholdersrsquo best interest and managerial incentives
Executive Role Date Shares Wtd Avg Price Type
Wagman PresidentCEO 12102013 25000 $3371 Open Market
Quinn CFO 1292013 15000 $3362 Open Market
12102013 5000 $3431 Open Market
Holsten Chairman 12112013 6025 $3350 Open Market
of the Board 12132013 25975 $3355 Open Market
Greenspan SVP Operations 12132013 20000 $3388 Open Market
Source SEC Form 4 filings
105
Board Lacking Relevant Experience and
Necessary Focus for Adequate Oversight
LKQrsquos Board is comprised of accomplished business executives but only one non-executive member Mr Foster appears to have relevant experience in the auto parts business
Furthermore no other Board members appear to have experience in the scrap metal or related industrial sectors that would be of value to shareholders
Mr Meister and Mr OrsquoBrien both serve on the compensation committee and serve on a combined 24 other Boards which makes us question there focus and commitment to LKQ
Committee Service Current
Director Age Role Main Background Comp Audit Govern Govt Affairs Other Boards
A Clinton Allen 69 Lead Independent Lab Testing x x 3
Kevin Flynn (1) 45 Seed InvestorDiscovery Zone x Chair 1
Ronald Foster 71 Fmr Chairman of Keystone x x 1
Joe Holsten 60 Chairman Waste Management 1
Blyth McGarvie 56 Consumer Products Chair x 2
Paul Meister 60 HealthcareLife Sciences Chair x 8
John OBrien 69 Insurance x Chair 16
Guhan Subramanian 42 AcademicNo Board Exp x x 0
Robert Wagman 48 President and CEO Auto Products 0
William Webster 55 Payday Lending x x 2
(1) Recently deceased in August 2013 and yet to be replaced
Source Company and public information CapitalIQ
106
Governance Concerns Executive Pay
Also concerning is that the compensation committee constituents appear overcommitted The Chairman Mr Meister serves on 8 other boards while Mr OrsquoBrien is listed as serving on 16 other boards We suspect shareholders interests may not be adequately supervised on the matter of compensation with the big time commitments of its committee members
Management annual bonuses are tied to revenue growth and long-term incentives are also tied to Revenue EPS and ROE with the following weightings revenue (475) earnings ($475) and ROE at just 5 This mix of metrics incentivizes management to recklessly acquire revenue and do whatever possible to boost EPS
The CEOrsquos total comp has increased 374 in the past 4 years while free cash flow is up only 9 over a multi-year horizon cumulative free cash flow after acquisitions is nil Approximately 50 of the comp increase has come in stock but as a whole the management team has been net sellers The 6 member management team reaped $129m in compensation for 2012 (up 83 from 2009 comp of $71m)1
(1) Includes consulting comp and incentive comp related to Mr Holsten
9
82
92
100
101
233
374
0 50 100 150 200 250 300 350 400
Free Cash Flow
Total Exec Comp
Adj EBITDA
EPS
Revenue
Share Price
CEO Comp
Wheres the Beef
Cumulative Growth 2009 - 2012
The Misguided Analyst Community
108
LKQ Enlists Firm Associated with Stock
Pumps for Research Coverage Initiation
ldquoOccasionally we find a critic of RedChip who in a fury of madness mistakenly throws us into the ldquopump and dumprdquo category of investor relations firmsrdquo ndashDave Gentry Founder of Redchip1
(1) httpwwwredchipcomblogindexphpredchippresidentpump-and-dump-is-a-pejorative-term-and-rightly-soUZ05RrW1E0w
httpphxcorporate-irnetphoenixzhtmlc=147311ampp=irol-newsArticleampID=933038amphighlight=Photo Source httpwwwredchipcomaboutaboutmainasppage=management
RedChip a firm commonly associated with having promoted speculative and in many previous instances fraudulent companies was among the first to provide research coverage on LKQ
109
RedChip Denounced by the Investing Public
for Promotion of Frauds
CNBC Faceoff Heat Over Chinese Reverse MergersJan 11 2011
Chinese reverse mergers are continuing to make headlines causing investors to take notice and as a result these special types of mergers have come under increased scrutiny
Tuesday on The Strategy Session David Gentry president and CEO of RedChip Companies a business that promotes small-cap companies including Chinese reverse mergers fired back
CNBCs David Faber and partner continue their discussion about Chinese reverse mergers with Dave Gentry president of RedChip a company that promotes these products
Source httpwwwcnbccomid41024808 Source httpglobenewswirecomnews-
release2013010451458410017068enRedChip-Announces-Exit-From-China-Small-Cap-Sectorhtml
RedChip Announces Exit From China Small-Cap SectorJan 3 2013
RedChip Companies Inc (RedChip) an international small-cap research investor relations and media company today announced that it has exited the China small-cap sector and terminated its contracts with its three Chinese clients We made a decision to close our Beijing office months ago and wind down our China operations stated Dave Gentry President and CEO of RedChip Wall Street has for the most part lost confidence in the financial reporting of US-listed Chinese companies We are concerned that Big Four accounting firms were unable to detect financial fraud in companies like Sino-Forest and Longtop Financialldquo Mr Gentry continued When multi-billion dollar funds like Paulson amp Co and The Carlyle Group with their unlimited resources are unable to detect fraud in their Chinese-based portfolio companies when top-tier investment banks like Goldman Sachs are unable to detect fraud in their Chinese-client companies then I think reasonable investors must take a step back and seriously consider whether the potential rewards outweigh the downside risks of investing in US-listed Chinese companies We simply are not willing to take the risk
Prescience Point was on the forefront of identifying Chinese investment scams and has been wary of paid-for research conducted by RedChip
110
LKQ Has Worked Hard to Garner Broader
Analyst Support as a Wall St Darling
Broker Rating Price Target
Barrington Market Perform $3300
BBampT Outperform $3500
BofaML Neutral $3200
CL King Buy $3200
Deutsche Hold $2700
Great Lakes Hold $3300
Stifel Nicolaus Buy $3300
Ray James Outperform $3200
Baird Outperform $3800
Sidoti Buy $3900
Stephens Overweight $3500
FBR Outperform $4000
William Blair Outperform --
Average Price $3420
Date Conferences Presented
52213 BBampT Stephens William Blair
21213 Raymond James Sidoti BofAML
8112 BBampT
52312 Stephens William Blair Deutsche Bank
41712 Baird Barrington
31512 BofA Merrill Lynch
21512 Raymond James Sidoti
82511 CL King ThinkEquity
71211 Jefferies Canaccord Genuity BBampT
41211 Baird Barrington
3711 Raymond James
2010 Raymond James CLK King BofAML Morgan Keegan Gabelli Deutsche Bank
2009 BBampT RBC CL King Morgan Keegan Deutsche JPM
The chorus of analysts are singing buy buy buy The one independent analyst at WellingtonGreat Lakes Research recently downgraded the stock to Hold
111
While JP Morgan Recently Ditched its
Credit Exposure to LKQ Earlier this Year
JP Morgan was Keystone Automotiversquos long-time banker MampA advisor and lead admin agent for its credit facility JP Morgan continued to serve as LKQrsquos lead banker
JP Morgan resigned from its lead banking position in 2013 and appears to have completely severed all ties to the company The significance of this event must be considered as a leading underwriter in high yield bonds JP Morgan mysteriously did not participate in LKQrsquos $600m bond offering thereby sacrificing underwriting fees The bank also assigned key swap contracts to other parties as another credit risk reducing measure
New Counterparty Notional Amount Maturity Fixed Int Rate
Wells Fargo US$250m 101415 15638
Wells Fargo US$60m 103116 11950
Bank of America C$25m 32416 143
Source httpwwwsecgovArchivesedgardata1065696000106569613000044lkq8-khtm
On April 30 2013 JPMorgan Chase Bank NA (JP Morgan) the counterparty on certain of the Companys floating to fixed interest rate swaps assigned its obligations under its swap contracts to Wells Fargo Bank NA and Bank of America NA JP Morgan is no longer a secured lender under the Second Amended and Restated Credit Agreement and therefore assigned its obligation to Wells Fargo Bank NA and Bank of America NA The Company believes Wells Fargo Bank NA and Bank of America NA are creditworthy to perform their obligations as the counterparty to their respective swap contracts The counterparty notional amount maturity date and fixed interest rate of each of the swaps assigned by JP Morgan are listed below
112
Analystsrsquo Views on the Growth Story
are Completely Wrong
Wall St Analyst Views of LKQ
ldquoOpen Ended Growth Story with the Collision Strategy Just Beginning to Unfold LKQ Can Grow Revenues Organically 5-7 and Earnings 15-20 in the Next Several Yearsrdquo
ldquoSecular growth drivers for LKQ include the annual shift to alternative parts versus OEM parts that continues at a rate of 50-100 basis points annuallyrdquo
ldquoLKQ brings professional processes and technology to an under-managed industryrdquo
ldquoLKQs is a preferred partner for insurance companies small auto recyclers seeking a partnerexit strategy and repair shops
ldquoLKQ is a Premium Mid-cap Growth Storyrdquo
Prescience Point View
Sustainable organic growth is likely overstated and closer to 0 ndash 2 in North America European expansion is fraught with problems and a mature and competitive marketplace Earnings growth appears highly engineered with opaque acquisitions and levers for multiple accounting shenanigans being pulled Adjusted free cash flow after acquisitions is the appropriate yardstick to evaluate LKQ
Share shift has stalled and may reverse OEMs with large balance sheets are subsidizing price matching programs and vehicle fleet age has likely peaked
Early mover advantages have eroded auto recycling is now a global business Rampant customer serviceemployee complaints suggest that LKQ is acquiring just to manage earnings and not build a world class operation
Our research suggests not many want to do business with LKQ but rather they have to Insurance companies are introducing new programs such as PartsTrader that will force price compression
LKQ is a poorly constructed roll-up and should not trade at a premium to leading after market auto recycling or industrial distributors
113
Detailed Aftermarket Auto Part and
Metal Recycling Comparables
($ in millions except per share figures)
Stock 13E-14E LTM Enterprise Value Net Price
Price Ent Revenue EPS EBITDA FCF PE EBITDA Sales Debt Tangible
Name Ticker 1102014 Value Growth Growth Margin Margin 2014E 2015E 2014E 2015E 2014E 2015E EBITDA Book
Aftermarket Auto Parts
AutoZone AZO $49000 $21241 23 27 218 104 165x 148x 103x 99x 22x 22x 20x NM
OReilly Automotive ORLY $13299 $15473 63 131 190 105 197x 173x 112x 104x 22x 21x 08x 23x
Genuine Parts GPC $8345 $13630 52 55 88 64 182x 167x 102x 95x 09x 09x 06x 71x
Advance Auto Parts AAP $11564 $8560 493 278 136 55 166x 143x 71x 64x 09x 09x 01x 76x
Monro Muffler MNRO $5581 $1917 99 271 137 84 279x 220x 135x 119x 21x 19x 16x 151x
Uni-Select UNSto $3000 $1104 -02 140 42 59 119x 110x 97x 93x 06x 06x 61x 45x
Pep Boys PBY $1180 $922 47 1458 57 02 200x 148x 61x 56x 04x 04x 25x 13x
Boyd Group BYDUN $3341 $505 193 670 69 38 220x 213x 97x 95x 07x 07x -01x 11x
Max 493 1458 218 105 279x 220x 135x 119x 22x 22x 61x 151x
Average 121 379 117 64 191x 165x 97x 91x 13x 12x 17x 56x
Min -02 27 42 02 119x 110x 61x 56x 04x 04x -01x 11x
Metal Recycling
Steel Dynamics STLD $1910 $6072 44 699 81 24 135x 112x 70x 62x 08x 08x 33x 31x
Comercial Metals CMC $2056 $3468 -03 542 47 -02 199x 133x 88x 71x 05x 05x 31x 21x
Sims Metal SMSMY $924 $2028 -107 1074 27 21 159x 115x 97x 70x 03x 03x 07x 12x
Schnitzer Steel SCHN $2894 $1118 46 1252 41 07 180x 137x 78x 66x 04x 04x 34x 18x
Metalico MEA $240 $233 47 -1455 34 24 480x 218x 76x 66x 04x 04x 66x 14x
Max 47 1252 81 24 480x 218x 97x 71x 08x 08x 66x 31x
Average 05 423 46 15 231x 143x 82x 67x 05x 05x 34x 19x
Min -107 -1455 27 -02 135x 112x 70x 62x 03x 03x 07x 12x
LKQ Corp LKQ $3300 $11846 188 257 135 61 243x 192x 150x 124x 20x 18x 27x 570x
Source Company financials CapitalIQ calendarized estimates
114
Valuation Premium is Unwarranted Relative
to Aftermarket Parts and Recyclers
Source CapitalIQ company filings Averages exclude LKQ
Price 2014E EPS Price to Tangible Book Value
Enterprise Value to 2014E EBITDA Enterprise Value to 2014E Revenues
00x
20x
40x
60x
80x
100x
120x
140x
160x
PB
Y
AA
P
BY
DU
N
UN
Sto
GP
C
AZ
O
OR
LY
MN
RO
ST
LD
ME
A
SC
HN
CM
C
SM
SM
Y
LKQ
Auto Part Distributors Scrap Processors
Average
00x
05x
10x
15x
20x
25x
PB
Y
UN
Sto
BY
DU
N
AA
P
GP
C
MN
RO
OR
LY
AZ
O
SM
SM
Y
SC
HN
ME
A
CM
C
ST
LD
LKQ
Auto Part Distributors Scrap Processors
Average
00x
50x
100x
150x
200x
250x
300x
UN
Sto
AZ
O
AA
P
GP
C
OR
LY
PB
Y
BY
DU
N
MN
RO
ST
LD
SM
SM
Y
SC
HN
CM
C
LKQ
Auto Part Distributors Scrap Processors
Average
00x
100x
200x
300x
400x
500x
600x
BY
DU
N
PB
Y
OR
LY
UN
Sto
GP
C
AA
P
MN
RO
SM
SM
Y
ME
A
SC
HN
CM
C
ST
LD
LKQ
Auto Part Distributors Scrap Processors
Average
115
Detailed Industrial Distribution Comparables
LKQ often refers to itself as a ldquodistributionrdquo company From this perspective LKQrsquos stock is dramatically overvalued relative to some of the best industrial distribution companies in America
($ in millions except per share figures)
Stock LTM Enterprise Value Net Price
Price Ent EBITDA FCF PE EBITDA Sales Debt Book
Name Ticker 1102014 Value Margin Margin 2014E 2015E 2014E 2015E 2014E 2015E EBITDA Value
WW Grainger GWW $26371 $18396 159 79 377x 182x 108x 99x 18x 17x 00x 35x
Home Depot Supply HDS $2430 $10218 88 -115 180x 116x 117x 99x 11x 10x 73x NM
Wesco WCC $9194 $5545 60 35 151x 141x 97x 88x 07x 07x 34x 23x
MSC Industrial MSM $8540 $5214 183 96 203x 174x 104x 90x 18x 17x -04x 39x
Anixter AXE $9322 $3773 58 25 142x 131x 90x 84x 06x 06x 21x 28x
Applied Industrial Tech AIT $4826 $1955 80 38 165x 138x 91x 78x 08x 07x -04x 26x
Max 183 96 377x 182x 117x 99x 18x 17x 73x 39x
Average 105 26 203x 147x 101x 90x 11x 10x 20x 30x
Trim Avg 97 44 175x 146x 100x 89x 11x 10x 13x 30x
Min 58 -115 142x 116x 90x 78x 06x 06x -04x 23x
LKQ Corp LKQ $3300 $11846 135 61 243x 192x 150x 124x 20x 18x 27x 45x
Source Company financials CapitalIQ calendarized estimates
Trim average exludes maximum and minimum
116
LKQrsquos Valuation Premium is Unwarranted
Relative to Industrial Distributors
Source CapitalIQ company filings Averages exclude LKQ
Enterprise Value to 2014E EBITDA Enterprise Value to 2014E Revenues
Price 2014E EPS Price to Book Value
00x
20x
40x
60x
80x
100x
120x
140x
160x
AXE AIT WCC MSM GWW HDS LKQ
Average
00x
05x
10x
15x
20x
25x
AXE WCC AIT HDS GWW MSM LKQ
Average
00x
50x
100x
150x
200x
250x
300x
350x
400x
AXE WCC AIT HDS MSM LKQ GWW
Average
00x
05x
10x
15x
20x
25x
30x
35x
40x
45x
50x
WCC AIT AXE GWW MSM LKQ
Average
117
LKQ is an Ineffective Roll-up Valuation
Beyond the Sum of its Parts Isnrsquot Justifiable
$ in mm 1998-2013 Acq 2011 Acq May 2013 Acq Dec 2013 Approx Total
Estimated Revenues~ growth
~$37000-2
~$1200~20
~$4000~4-6
~$7000NA
$6000Low single digits
Gross MarginContribution
Low 40 if accurate
~430 ~330 Low 30
Estimated EBITDA margin
$4400120
$91076
$33083
$700100
$650108
Purchase Price ~$2100 $347 (1) $272 $450 gt$2700
EVLTM EBITDA -- Acquired 89x Acquired 88x Acquired 64x At best 70x ndash 100x
EVLTM Revenues -- Acquired 068x Acquired 073x Acquired 064x At best 060x ndash 10x
Comments (2) North American Salvage Assets of
diminished value and potentially impaired
value in Heavy Duty Core business value in serious question LKQ has paid big premiums to book
value for these industrial assets
Growth is artificially high in the near term due to rapid store expansion Growth is
expected to slow dramatically as it reaches its market saturating location limit Also LKQ has yet to demonstrate an ability to
drive APU growth in Europe
(3) Acquired from H2 Partners which also
owns the UKrsquos Unipart Auto (a competitor to
ECP) H2 did not appear to extract synergies
between the two so we are skeptical of LKQrsquos ability to drive value between ECPSator
(4) Keystone was previously bankrupt and up for sale for at least a year until LKQ bought it
LKQ has yet to demonstrate any ability
to extract value here and its key markets are fundamentally different from LKQrsquos existing ones
At 70x ndash 100x EBITDA and adjusting for $17bn of debt
outstanding $107m of cash and 3088m shares os our price target is
~$1000 - $1500share( 50 ndash 70 ) downside LKQrsquos current valuation at 15x is a
substantial premium to the sum of its parts at the upper end of
its historical range and a significant premium to all its
stock trading peers
Source Company financials converted from local currencies(1) ECP deal excludes $339m earnout payment made in March 2013(2) Note that in Q4rsquo12 LKQ mysteriously realigned the reporting structure of its heavy-duty salvage yards and removed it as an operating segment to be included within Wholesale North America (p 7 2012 10K)
(3) H2 Equity Acquires Unipart (UK) httpwwwunipartcoukUserFilesFileUnipartAutomotiveH2pressrelease[1]pdf(4) Platinum Equity Seeks Buyer for Keystone Automotive httpwwwreuterscomarticle20130129keystone-platinum-idUSL1N0AXM6U20130129
Over 160 Acquisitions (Salvage Aftermarket
Reman Heavy Duty Etc) Euro Car Parts Sator HoldingKeystone Auto
Operations LKQ Corp
118
Cheap Money Leverage and Bad Deals =
Valuation Expansion
LKQrsquos long-term Enterprise Valuation to forward EBITDA multiple has trended in the 10x ndash 11x range The recent valuation expansion appears to be a function of expansionary monetary policies favoring stocks the companyrsquos use of more leverage to buy low quality businesses as it expand into Europe and we believe a fundamental misevaluation by market participants of LKQ as an effective roll-up
We believe investorsrsquo are discounting perfect execution and unrealistic growth expectations for a company with significant fundamental challenges and lacking operational excellence as indicated by
An ldquoFrdquo rating by the Better Business Bureau
28 our of 5 ranking on Employee Review site Glassdoorcom
Our conversations with industry participants
500x
700x
900x
1100x
1300x
1500x
1700x
1900x
Enterprise Value NTM EBITDA Long-Term Average
QE Leverage Fueled Valuation Expansion on Bad Acquisitions
LKQrsquos EV NTM EBITDA Historical Valuation
Appendix
120
Does LKQ Have Too Cozy a Relationship
with its Auditors
According to the SEC at the onset of the WM fraud the Company capped Arthur Andersens audit fees However WM advised AA it could earn additional fees for special work mdash eg consulting services Over the succeeding years AAs corporate audit fees remained flat while the fees for special work multiplied
Despite enormous revenue growth and international geographic expansion LKQrsquos audit and total fees paid to auditors have barely increased Oddly enough tax planning fees have fallen at the fastest pace despite LKQ having reported progressively growing international earnings and cash flow
$ in millions
2008 2009 2010 2011 2012 CAGR
Audit Fees $182 $160 $170 $197 $204 29
Audit-Related $005 $009 $030 $028 $012 211
Tax Fees $063 $075 $062 $032 $035 -140
All Other Fees $012 $000 $000 $000 $000 -1000
Total Fees $263 $244 $261 $257 $251 -12
Annual Growth
revenues 694 73 206 324 261 212
employees 55 42 200 492 134 162
Sales by Geography
US 1000 1000 1000 1000 831 78 (1)
Europe 00 00 00 00 169 22(1)
(1) as of LTM 93113 Source Company filings
121
LKQ Received the Coveted ldquoFrdquo Grade
by The Better Business Bureau
httpwwwbbborgchicagobusiness-reviewsauto-parts-and-supplies-used-and-rebuiltlkq-in-chicago-il-12010519
122
Insider Views from Glassdoor
Source httpwwwglassdoorcomReviewsLKQ-Reviews-E20395htmsortsortType=RDampsortascending=false
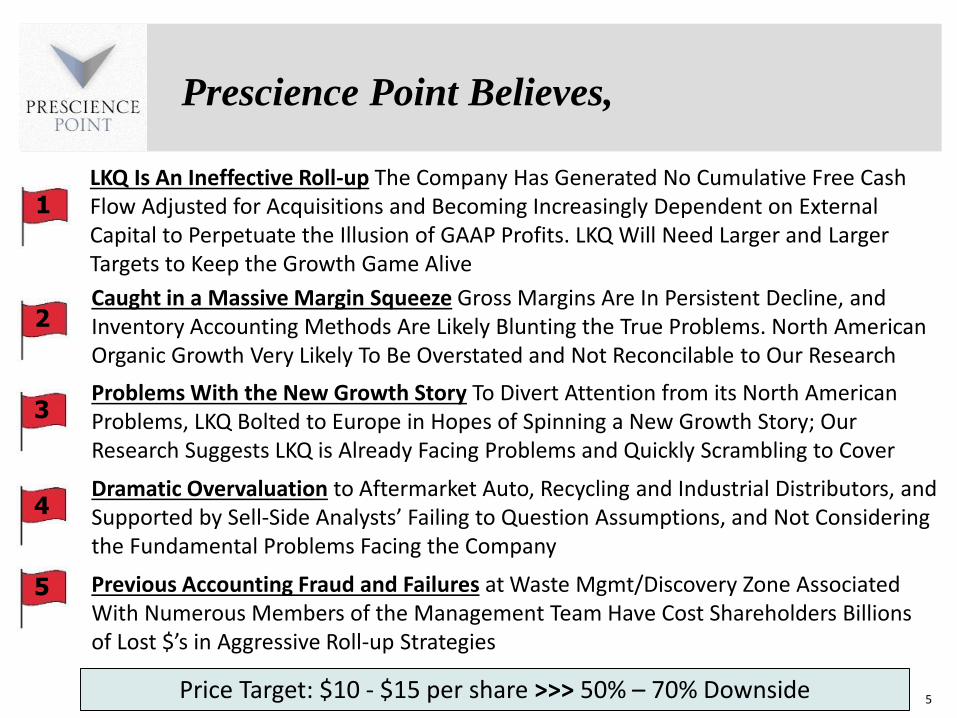
5
Prescience Point Believes
Caught in a Massive Margin Squeeze Gross Margins Are In Persistent Decline and Inventory Accounting Methods Are Likely Blunting the True Problems North American Organic Growth Very Likely To Be Overstated and Not Reconcilable to Our Research
1
2
3Problems With the New Growth Story To Divert Attention from its North American Problems LKQ Bolted to Europe in Hopes of Spinning a New Growth Story Our Research Suggests LKQ is Already Facing Problems and Quickly Scrambling to Cover
4
Previous Accounting Fraud and Failures at Waste MgmtDiscovery Zone Associated With Numerous Members of the Management Team Have Cost Shareholders Billions of Lost $rsquos in Aggressive Roll-up Strategies
5
Price Target $10 - $15 per share gtgtgt 50 ndash 70 Downside
Dramatic Overvaluation to Aftermarket Auto Recycling and Industrial Distributors and Supported by Sell-Side Analystsrsquo Failing to Question Assumptions and Not Considering the Fundamental Problems Facing the Company
LKQ Is An Ineffective Roll-up The Company Has Generated No Cumulative Free Cash Flow Adjusted for Acquisitions and Becoming Increasingly Dependent on External Capital to Perpetuate the Illusion of GAAP Profits LKQ Will Need Larger and Larger Targets to Keep the Growth Game Alive
6
Report Highlights (contrsquod)
High-Level Indications of Fabricated GAAP Profits Unsustainable Business Model LKQ is a classic roll-up fueling growth through acquisitions Roll-up business models provide management with a significant amount of discretion in presenting financial results Roll-ups tend to exhibit strong earnings CFO and earnings quality metrics due to the inherent financial statement mechanics of paying for growth through acquisition outflows which do not affect earnings or CFO Because of this free cash flow after acquisitions is an important metric for analyzing roll-ups it presents a better picture of the businessrsquos economics LKQrsquos free cash flow after acquisitions has been negative in 8 of the last 9 years
Furthermore our analysis indicates LKQ is an ineffective rollup ndash wealth creation from years of acquisitions has been nil Since 2007 LKQ has reported cumulative Earnings and EBIT of $122B and $215B respectively Meanwhile it has burned cumulative free cash flow after acquisitions of -$162B and raised cumulative net capital of $163B suggesting it has never earned a cash-on-cash return on invested capital Put another way the immense wealth generation represented by LKQrsquos historical GAAP profits is not observable in the companyrsquos cash flows ndash it appears to be lsquopaperrsquo wealth generated by accounting gimmickry
In light of this and a broad array of other red flags discussed in this report we are forced to look through managementrsquos representations We believe the credibility of LKQrsquos financial statements is questionable and that LKQ bears a heightened risk of a crippling inventory andor goodwill write-down or financial restatement
Reported Organic Growth for LKQrsquos North America Business Appears Overstated LKQrsquos aggressive roll-up strategy also gives it a high level of flexibility to inflate revenue growth LKQ reported organic revenue growth averaging ~65 from 2008 ndash 2012 and ~6 for its North America (NA) Parts amp Services (PampS) business (~75 of PampS revenue) with far less variability vs comps and not a single quarter of negative growth LKQ does not provide clarity around the calculation or the impact on earnings making it difficult for investors to confirm its validity However based on our research LKQrsquos reported organic growth rate does not appear reconcilable with trends in the primary fundamental factors that drive it We believe it is overstated We believe LKQrsquos NA growth rate normalized for a 2013 spike in collision frequency more likely measures in the range of 0-2
From 2008 to 2012 annual insurance claims paid for repairable accident claims have been flat according to industry consultant The Romans Group LLC Additionally from 2010 to 2012 growth in Alternative Parts Usage (ldquoAPUrdquo) (ie market share of alternative auto parts which LKQ sells relative to OEM parts) which had risen steadily for 3 decades and was a primary driver of LKQrsquos historical organic growth has flat-lined going forward CCC Information Services ndash provider of the industryrsquos dominant estimate writing platform and LKQrsquos source for APU data ndash expects it to taper or reverse Based on industry data sources and our conversations with industry sources this is resulting from a recent expansion in OEM price-matching programs they have become more aggressive in pursuit of retaking lost market share by undercutting alternative parts prices thereby negating LKQrsquos value proposition Internal dealer documents we have obtained indicate the OEMs are increasingly subsidizing dealers to sell parts at levels 33 below aftermarket list prices (ie LKQrsquos price) making them whole on the loss and paying them an additional 14 profit on the cost for the part (Refer to dealer source document on page 12) As a result for the first time ndash according to Mitchell International ndash parts prices in general deflated in 2012 LKQ management tells investors APU rose 100bp in 2012 however their own data source and LKQrsquos SEC filings refute their claim
7
Report Highlights (contrsquod)
Short-Term Thinking Pervades Decision-Making Signals Desperation to Keep Financials Inflated amp Meet Targets With NA growth waning LKQ looked to Europe for acquisition candidates In Q4rsquo2011 it made its 2nd largest acquisition ever acquiring UK-based Euro Car Parts (ECP) a distributor of mechanical aftermarket parts operating out of 89 branchstore locations As LKQ pitched investors on the open-ended growth opportunity provided by buying ECP to our knowledge it never publicly disclosed that the UK aftermarket parts industry was in significant contraction (2011E -58 according to Datamonitor) or that it is projected to continue contracting but LKQ touted ECPrsquos 30+ lsquoorganicrsquo revenue growth rate from 2009-2011
Now 2 years separated from the date of acquisition and with its industry still weak LKQ continues to report 30 organic growth rates for ECP which would seem to defy logic It shouldnrsquot LKQ does not define ECPrsquos lsquoorganic growthrsquo in the way investors might expect for a business characterized by storefronts (ie as same store sales growth) it defines it to include both SSS and revenue generated by newly opened ECP stores As such LKQrsquos reported organic growth rate is fueled by opening new ECP branches the more new ECP stores LKQ opens in a given period the more it can inflate its consolidated organic growth rate
Rapidly expanding the number of ECP branches was not an LKQ priority when it announced the acquisition evident in guidance issued on LKQrsquos ECP MampA call (held on 10411) ldquowe have a plan to grow 10 to 12 branches per year for the next few yearshellip to complete out the major UK marketsrdquo Within just a few months ndash apparently a direct response to NA growth weakening and the threat of a guidance miss ndash LKQ abandoned its plan throughout 2012 it repeatedly raised its guidance for the number of stores to be opened in 2012 from 20 to 30 and finally to 42 By Q4rsquo2012 based on our estimates ECP accounted for a full 75 of consolidated PampS organic growth up from ~4 only one year prior In 2012 ECP also started running periodic steep online sales promotions (30-45 discounts) of parts across the board ndash with many promotions implemented right at the end of the quarter just ahead of reporting to investors indicating an obsessive desire to meet financial estimates The combination of a ramp-up in branch openings and steep discounting juiced LKQrsquos organic growth rate just enough for it to hit the low end of guidance for 2012 PampS organic growth
LKQ has also repeatedly raised guidance for the maximum number of full-sized ECP branches the UK market can absorb from 120 to 150 to 175 to 200 giving it further room to continue ramping the number of branch locations At YErsquo2012 LKQ operated 130 branches in only one year surpassing the store count it initially guided would result in saturation of the UK market 120 On the Q1rsquo2012 earnings call LKQ CEO Wagman raised his projection for the market-saturating branch count to 150 stating that at that number ldquobranches in major metropolitan areas can be 5 miles or so apartrdquo and that ldquotheres not necessarily cannibalizationrdquo should they be LKQ has since raised the ceiling on the maximum branch count to 200 hinting of desperation
LKQ appears to operate ECP with the primary intent of unsustainably inflating its financials and meeting guidance targets at the long term shareholder expense of entrenchment in a contracting market Inevitably as ECP reaches its market saturating location capacity we expect ndash and we believe management has anticipated ndash its reported organic growth rate to plummet and converge to the industry average
8
Report Highlights (contrsquod)
Increasing Dependency on Acquisitions to Inflate Financials Conceal Cumulative Manipulations LKQrsquos gross margins have been in persistent decline contracting from 471 to 41 from FY 2005 to the LTM period ended 9302013 We believe the decline is in part the result of the reversal of cumulative past accounting manipulations while at the same time competitive and pricing pressures are intensifying it appears that over time LKQrsquos is growing increasingly dependent on ever larger acquisitions to prevent an unraveling of its financials As previously mentioned due to the inherent mechanics of acquisition accounting acquisitions have a flattering but unsustainable effect on earnings and CFO that has nothing to do with the performance of the business When the benefit expires a hole is left to be filled in its place just to maintain the status quo
LKQ has been rapidly accelerating its deal making both in quantity of deals and in dollar value Within the past 2 years LKQ has made 3 of 4 of its largest acquisitions ever LKQ acquired 30 companies in 2012 alone against the backdrop of having acquired a total of 71 companies in the 3 years from 2010-2012 and over 170 since its 1998 inception Notably LKQ reported a record 17 acquisitions in just Q4rsquo12
Yet despite this LKQ missed dramatically on 2012 CFO guidance which came in 19 below revised guidance issued on 10252012 only 2 months before year end Making the most acquisitions it has ever made in a quarter a gaping hole in CFO exposed itself indicates LKQ may be making acquisitions as we believe in order to inflate its financials and paper over past accounting manipulations Management justified the miss as primarily attributable to an investment in inventory that wasnrsquot exactly anticipated An alternative explanation is that the cumulative deal size was insufficient to bail the company out
We believe LKQ entered Europe in search of a fresh pool of large-scale acquisition targets After purchasing ECP ndash its 2nd largest purchase ever at the time ndashin Q4rsquo2011 LKQ began unsustainably juicing its organic revenue growth rate via the rabid opening of ECP stores something completely outside of its plans for the company when it acquired the company Because of these openings ECP currently accounts for ~50 of LKQrsquos organic revenue growth We believe as ECP branch openings slow and new stores mature its reported organic growth rate will plummet from current levels converging to the negative industry rate of growth and resulting in a new hole LKQ will predictably seek to plug with more acquisitions Operating ECP as it has with seemingly little regard for building long term value may be an indication of desperation to keep its financials together as it searched for a larger target
LKQ moved quickly buying mainland European company Sator in April 2013 amounting to its 3rd largest purchase ever at the time As a result its European reporting segment now includes both ECP and Sator This new reporting will obscure future financial deterioration at ECP
In December 2013 it acquired Keystone Automotive Operations a company distributing a fundamentally different type of automotive product from that of its core business The acquisition was LKQrsquos 2nd largest ever
We believe managementrsquos short-term focus on managing the business to hit financial guidance is unsustainable LKQrsquos increased pace of deal making as gross margins deteriorate are supportive of questioning the companyrsquos motives
9
Report Highlights (contrsquod)
Gross Margins (GMs) Appear Inflated as Inventory Turnover is Stable Caught in a massive margin squeeze with used auto parts prices deflating and salvage vehicles rising LKQrsquos GMs have been in persistent decline since 2005 down 590bps while consolidated inventory turns have been relatively stable We believe there is more deterioration in LKQrsquos GMs than observable on the Income Statement We believe LKQ may pull 2 primary accounting levers to manipulate GMs and inventory turns
1 Aggressive Inventory Policy Enables Overstatement of Inventory ndash LKQ uses an aggressive policy for accounting for its Salvage and Remanufactured Inventory that allows for a high level of discretion which management can use to inflate gross margin by leaving costs on the balance sheet in the form of overstated inventory The recent surge in LKQrsquos salvage inventory coupled with gross margin deterioration is consistent with this trend and the overall concern of costs being left on the balance sheet In isolation this policy results in inflated gross margins and CFO and exerts downward pressure on the rate of inventory turnover The generally high level of Salvage amp Remanufactured inventory ndash to which the aggressive policy applies ndash is a high level sign the company may be manipulating its margins We believe LKQ is likely inflating its gross margin and earnings by failing to record a necessary expense for excess and obsolete inventory Omissions of expensing obsolete inventories result in future margin compression
But the surge in Salvage amp Remanufactured inventory the account subject to the aggressive inventory accounting policy serves as a higher level sign that margins and CFO may be manipulated How would LKQ be able to keep consolidated inventory turns from declining in the face of GM manipulation
2 Acquisition Accounting Enables Understatement of Acquired Inventories ndash The acquisition fair market value process enables LKQ to understate the values of acquired company inventories and to allocate the plug figure to goodwill The result is that inventory costs which should be future period expenses can be instead permanently deferred Based on conversations with a recycled auto consultant who consults recycled parts distributors that are selling to LKQ we estimate acquired inventory values make up 33-67 of the acquisition purchase price (adjusted for real estate) From 2003-2012 LKQ has allocated only 227 of the cumulative acquisition purchase price (ex PPampE) to inventory which would be consistent with utilizing this policy In isolation this would result in inflated gross margins and CFO and exert upward pressure on the rate of inventory turnover thereby counterbalancing the downward pressure caused by increases in Salvage and Remanufactured inventory and stabilizing consolidated inventory turnover
We believe LKQrsquos GMs will continue to decline through 2014 against the backdrop of intensifying pricing pressures and as past accounting overstatements have to be reversed we believe LKQ is at elevated risk of a crippling goodwill write-down As of 93013 LKQ carries $21bn of goodwill + intangibles on its balance sheet (47 of Assets 92 of Book Equity) for a collection of industrial assets that would ordinarily sell for little premium to book value We note that LKQ attempts to explain GMs declining as a function of rising costs to acquire salvage vehicles However the Manheim Index peaked in 2011 and has already started to decline When asked for guidance on a sustainable gross margin target LKQ still cannot give investors any clear guidance on the matter and now cites the move into Europe as a complicating factor for the decline
10
Report Highlights (contrsquod)
LKQrsquos Business Strategy and Trajectory Right out of the Waste Management Playbook LKQ was founded in 1998 by Donald Flynn with the financial backing of Dean Buntrock and AutoNation Inc led by Wayne Huizenga Flynn Buntrock and Huizenga were all previously executives of Waste Management Inc (WM) a company notorious for having perpetrated a massive multi-year financial fraud resulting in the largest restatement in corporate history at the time
Following a board-led probe of the companyrsquos accounting practices in 1997 WM was forced to restate its financial statements for the period 1992 ndashQ3rsquo1997 acknowledging that it had misstated its pre-tax earnings by approximately $17 billion and took a $35 billion charge The SEC charged certain executives with financial fraud According to the SEC complaint ldquodefendants fraudulently manipulated the companys financial results to meet predetermined earnings targets The companys revenues were not growing fast enough to meet these targets so defendants instead resorted to improperly eliminating and deferring current period expenses to inflate earningsrdquobull Donald Flynn (LKQrsquos founder) was a Waste Management Audit Committee member from 1994 until 1997 ndash a period at the heart of the perpetuation
of the fraud ndashand also served as Audit Committee Chairman during a period coinciding with the fraud He was previously WMrsquos CFO from 1972 ndash1989
bull Dean Buntrock (an LKQ founding backer amp former director) co-founded WM with Wayne Huizenga (LKQ founding backer) Buntrock was WMrsquos CEO during the period of the fraud and according to the SEC complaint ldquothe driving force behind the fraudrdquo
Waste Managementrsquos aggressive rollup strategy gave its management a high level of flexibility to inflate revenue growth and margins and to conceal doing so for years Many individuals previously associated with Waste Management would go on to build businesses using the WM playbook Specifically a closely-knit group of WM alumni and associates (including LKQrsquos founders) have repeatedly co-invested in and built several companies with each company replicating WMrsquos aggressive roll-up or an acquire-and-build strategy either setting out to consolidating a fragmented industry or flooding an industry with store openings in an effort to build a dominant market position as quickly as possible Some of these companies include Blockbuster Video Discovery Zone Boston Chicken AutoNation Swisher Hygiene and LKQ
Many of these companies have either failed to deliver on their sales pitches to investors failed outright or were tarred by allegations of fraud manipulative accounting andor unjust management enrichment Based on our analysis in the majority of cases these WM alums and associates built businesses with the intent to create the illusion of growth as opposed to focusing on creating value through operational excellence resulting in little to no lasting value
In light of our belief that LKQ is inflating its financials it is worth noting that Discovery Zone another company previously founded by LKQ founder Donald Flynn ndash and in which Dean Buntrock Wayne Huizenga and several other WM alums were associated -- similarly utilized an acquire-and-build strategy It ended up in bankruptcy and was alleged to have engaged in accounting manipulations Many current and former officers ndash notably accounting officers ndash from both WM and Discovery Zone are current and former accounting officers with LKQ (refer to page 13) We also note that in light of our opinion that LKQ may be engaging in inventory accounting shenanigans LKQrsquos Director of Accounting and Inventory was previously employed by both WM and Discovery Zone
11
Report Highlights (contrsquod)
Flawed Corporate Governance Rewards Bad Practice We believe that managementrsquos incentive structure is at the foundation of its failed capital allocation record Management is rewarded by the roll-up strategy with annual bonuses and incentives incentivizing empire-building at any cost Annual bonuses are tied to revenue growth and long-term incentives are tied to Revenue EPS and ROE with the following weightings revenue (475) earnings (475) and ROE (5) There are no stipulations that revenue has to be organic and therefore the management team is perfectly incentivized to acquire and overpay for revenue and game the accounting to inflate profits
The CEOrsquos total comp has increased 374 in the past 4 years while free cash flow is up only 9 in the same period Approximately 50 of the comp increase has come in stock but as a whole the management team has been net sellers of stock Insiders have sold shares aggressively since the IPO when former owners of acquired companies affiliates and management owned 22 Since 2009 insider selling pressure has intensified with insiders currently owning less than 2 Insiders even sold stock recently in Dec 2013 just days after touting the merits of the Keystone deal There is now an almost complete break in the linkage between shareholder interests and executive wealth
In another cautionary sign in an 8-K filing during April LKQ revealed that JP Morgan was no longer a secured lender under its credit agreement JP Morgan had supported both Keystone and LKQ for a number of years While we do not know the why the relationship was severed when a bulge bracket investment bank turns away from a fee generating client of LKQrsquos size there is risk of smoke before fire
Valuation as a ldquoPremium Midcap Growth Storyrdquo is Unwarranted We believe The Streetrsquos view of LKQ as a proven acquirer with an ldquoopen-endedrdquo growth opportunity does not stand the test of logic Trading at 2x 15x and 25x 2014E sales EBITDA and EPS respectively LKQrsquos stock is priced at an unjustified premium to Aftermarket Auto Metal Recyclers and Industrial Distribution peers and fails to reflect few if any of the serious issues our research highlights Specifically our analysis indicates LKQ appears to be engaging in aggressive deal-making and accounting to manufacture GAAP profits and appears to make bad economic business decisions in order to meet predetermined financial targets We believe that management has taken to masking the companyrsquos weakening growth prospects by gaming the accounting to inflate organic growth and that it is dependent on ever-larger acquisitions to keep the growth story alive while insiders cash out As a result of our concerns over the integrity of its financial reporting we believe LKQ is at high risk of having to restate its historical financial results We believe the growth story management has spun to investors is a bill of goods Given concerns about the reliability of its financial statements we believe the company has an intrinsic value of $10 ndash $15 per share close to its book value representing 50-70 downside from the current price
12
LKQrsquos Only Competitive Advantage is Pricehellip
GMrsquos Price Matching Program Is Designed
Specifically to Thwart LKQ
Keystone List Price
OEM price-match 33
discount from Keystone
Price (Keystone list has
generally been 20-25
less than OEM OEM is
now undercutting
Keystonersquos price by 33)
GM reimburses dealer
for loss on part cost
GM pays dealer 14
return on part cost
We have sourced an internal GM dealer document detailing GMrsquos price-matching program ldquoBump the Competitionrdquo We are told it specifically targets LKQ-Keystone GM subsidizes dealers to sell parts (in this case a fender and a door) at levels 33 below aftermarket list prices makes them whole on the loss and pays the dealer an additional guaranteed 14 profit on the cost for the part
Source Felders Collision Parts Inc v General Motors Company et al Complaint Exhibit 4 filed 10122012
Same Players Same Strategy Results
Marred by Accounting Irregularities amp Failures
13
John MelkInvestor
Charged with accounting fraud one
of the largest in history
Aggressive rollup strategy
Discovery ZoneBlockbuster Boston Chicken AutoNation Swisher Hygiene
Dean BuntrockCo-founder CEO
Dean BuntrockInvestor Franchisee
Dean Buntrock Founding Backer Director
Dean BuntrockInvestor Director
Donald FlynnCFO Director -Audit Committee
Donald FlynnInvestor
Donald FlynnFounding Backer Director
Donald Flynn Founder
Donald FlynnCEOChairman
John MelkPresident WM International
John MelkFounding Backer Director
John MelkFounding backer Director
John MelkInvestor Director
Lawrence BeckCo-founder
Lawrence BeckInvestor Franchisee
Lawrence BeckInvestor Franchisee
Peer PedersenDirector
Peer PedersenInvestor Franchisee
Peer PedersenDirector
Peer PedersenInvestor
Scott BeckInvestor COO Vice Chairman
Scott BeckInvestor
Scott BeckCEOChair
Steven BerrardCFO then CEO
Steven BerrardCo-founder Co-CEO
Steven BerrardCEO Director
Victor CassiniGen CounselSecretary
Victor CassiniGen Counsel Secretary
Wayne HuizengaCo-founder
Wayne HuizengaCEOChairman
Wayne HuizengaInvestor (via Blockbuster)
Director
Wayne HuizengaInvestor
Wayne HuizengaFounder Co-CEO
Wayne HuizengaChairman
Wayne HuizengaFounding backer (via
AutoNation)
Bought out by Viacom for $84B
Aggressive acquire-amp-build
strategy
Goes bankrupt Allegations of fraud
Aggressive acquire-amp-build
strategy
Goes bankrupt Accounting gimmicks to obscure financials
Aggressive acquire-amp-build
strategy
$$ Billions Lost Pooling of Interests
acquisition accounting
Aggressive rollup amp acquire-amp-build strategy
Accounting irregularities
Financials restatementAcquisition Accntng Issues
Ongoing SEC inquiry
Aggressive rollup strategy
An array of accounting
red flags amp misrepresentations
Aggressive rollup amp acquire-amp-build strategy
Dean BuntrockFranchisee
Steven BerrardCEO post-Viacom
LKQ
14
WM and DZ ndash Previous Employers of Many
LKQ Executives amp Accounting Personnel
Flynn Enterprises Common Shareholder
John QuinnVarious Positions
John QuinnSVP and CFO
Mark SpearsController Head Acct
Mark SpearsFormer SVP CFO
Frank ErlainFmr VP Finance
Controller Accountant
Victor CasiniGen Counsel amp
Secretary
Walter HanleyAsso Gen Counsel
Walter HanleySVP Development
Victor CasiniGen Counsel amp
Secretary
Ken FreseAcctrsquog Mgr
Ken FreseAccountant
Ken FreseDir Accounting amp
Inventory
Joe HolstenCOO CEO WM Intrsquol
Joe HolstenFmr CEO Chairman
Frank ErlainVP amp
Controller
Sinon GalvinSVP Revenue Optimization
Sinon GalvinVarious Positions
WM Intrsquol
Fraud Allegations Improper Capitalization of Expense Files for Bankruptcy March 1996
Charged w $17 billion Accounting Fraud March 2002
Stephen EckelDir Oracle Fin Apps
Fmr AcctrsquogAss Contrsquoller
Stephen EckelAssistant Corporate
Controller
Source SEC filings LinkedInreg
Kevin FlynnFormer Director
Kevin FlynnVP Midwest
Vaughn HooksChief Tax Officer
Vaughn HooksVP Taxes
Dan ShoenerVP
Dan ShoenerVP of Finance
LKQ
15
Current Capital Structure
LKQ Corp Capital Structure
$ in mm except per share amounts
Stock Price $3300 Metrics LTM 93013 2013E 2014E 2015E
Shares outstanding 3006 EVSales 25x 23x 20x 18x
Net Options $704 avg strike 56 EVEBITDA 193x 189x 150x 124x
RSUs outstanding 26 PriceEPS 333x 306x 243x 192x
Fully Diluted Shares 3088 DebtEBITDA 29x 28x 22x 18x
Market Capitalization $101909
Debt Outstanding Rate Maturity Unused Covenants
Receivables Securitzation $100 101 2015
Term Loan A $4444 308 2018 max lev 35x min EBITDA cov 30x
Revolver (1) $6498 308 2018 $7000 max lev 35x min EBITDA cov 30x
Senior Unsecured Notes $6000 475 2023
Notes Payable $389 180 2018
Other Debt $189 350 NA
Total Debt $17621 361
Less Cash $1073
Total Enterprise Value $118456
1) Assumes $450m Keystone acquisition is fully funded on the revolver as per company press release
Background and Business
Background ndash LKQ Corp
LKQ Corporation (LKQ) a wholesale replacement auto parts distributor was founded in 1998 by Donald Flynn and with the financial backing of Dean Buntrock and AutoNation Inc the automobile retailer founded and led at the time by Wayne Huizenga Flynn would recruit Joseph Holsten to serve as LKQrsquos CEO1 Flynn Buntrock Huizenga and Holsten are all former executives of Waste Management Inc (WM)
LKQ has set out to consolidate the fragmented wholesale alternative auto parts industry by implementing an aggressive roll-up strategy fueling growth through acquisitions Since 1998 LKQ has grown through over 171 acquisitions primarily in the US and Canada becoming the largest provider of aftermarket amp recycled collision auto parts in North America
In May 2006 the company acquired Keystone Automotive Industries Inc (Nasdaq KEYS) a provider of aftermarket vehicle collision replacement parts for $4800 per share in cash or $811m in total enterprise value The deal was the largest in the companyrsquos history
In October 2011 LKQ expanded into foreign markets with the acquisition of UK-based Euro Car Parts Limited this was followed by the April 2013 acquisition of Netherlands-based Sator Holding Using an acquire-and-build strategy to grow in Europe LKQ has become one of the largest European suppliers of mechanical aftermarket auto parts LKQ generated $41B of revenue in 2012 split 7232 between North America and Europe
LKQrsquos business strategy ndash and as later discussed the strategies of numerous other companies founded by the aforementioned and other former Waste Management executives ndash appears taken right out of WMrsquos old playbook The following slide provides a brief elaboration of Waste Managementrsquos strategy and significant events in relation to LKQrsquos founders
(1) International Directory of Company Histories Vol 71 St James Press 2005 17
18
Background ndash
Waste Management Inc 1968-1998
In 1968 Dean Buntrock and Wayne Huizenga (both LKQ founding backers) along with Lawrence Beck founded Waste Management (WM) In 1972 Donald Flynn (LKQrsquos founder) joined WM as CFO WM set out to consolidate the highly fragmented garbage hauling industry via an aggressive roll-up strategy By the time WM went public in 1971 it had acquired 133 garbage haulers and was generating gt$10m in revenue In the first 9 months of 1972 it had acquired another 133 firmsand generated FY 1972 revenue of $72m From 1971 to 1980 WMrsquos revenue grew at a rate of 48 per year reaching $656m in revenue in 1980 By 1986 WM had become the largest waste disposal firm in the world
Donald Flynn was given credit as the ldquofinancial geniusrdquo behind Waste Managementrsquos extraordinary growth from the 1970s to the early 1990s in a 1993 corporate history commissioned by the company
By the late 1980rsquos and early 1990rsquos WM had undertaken a botched international expansion in a push to become the worldrsquos first global lsquoenvironmental servicesrsquo company ldquoThat ambition led Waste Management to acquire a range of profit-draining businesses The eventual result was angry shareholders turmoil in the board room and a disruptive series of management purges and sudden resignations followed by revelations (in late 1997) of accounting irregularitiesrdquo
Buntrock remained as CEO until 1996 and Flynn as CFO amp director until 1989 amp 1997 respectively
From 1994 until 1997 a period at the heart of the perpetration of the fraud Donald Flynn was a Waste Management Audit Committee member the panel responsible for overseeing accounting policies and procedures and also served as Audit Committee Chairman during a period coinciding with the fraud
According to the SEC former WM CEO Dean Buntrock was ldquothe driving force behind the fraudrdquo and that ldquoHe was the primary beneficiary of the fraud and reaped more than $169 million in ill-gotten gains from among other things performance-based bonuses retirement benefits charitable giving and selling company stock while the fraud was ongoingrdquo
Additional source httpwwwsecgovnewsheadlineswastemgmt6htm
In 1997 a new CEO ordered a review of WMrsquos accounting practices The probe turned up a massive financial fraud that went undetected from 1992ndash1997 The fraud involved inflated asset values and profitability resulting in a $35B charge in 1998 and the largest financials restatement in history at that time SEC charges ensued
Background ndash LKQ Corporate Evolution
LKQ began in 1998 to roll-up wholesale recycled auto parts distributors (ie salvage yards) establishing a network of such businesses and serving the collision repair industry By 2003 it had become the largest provider in the fragmented recycled products market in the US
LKQ soon began diversifying through acquisitions of aftermarket recycled refurbished and remanufactured product suppliers and manufacturers and self service retail businesses
In October 2007 LKQ made a transformative acquisition in buying Keystone Automotive Industries Inc becoming the industryrsquos dominant distributor of both recycled and aftermarket products in the US Keystone is LKQrsquos largest acquisition to date costing $811m Keystone generated ~$730m in revenue in 2007 As a result of the acquisition LKQrsquos Parts and Services revenue split shifted from 7129 to 3961 recycled products vs aftermarket products
In 2008 LKQ entered the heavy-duty truck parts recycling industry through various acquisitions The heavy-duty truck parts recycling industry has operating and sales functions that are similar to the auto recycled parts business
In October 2011 LKQ made its third largest purchase in its history expanding to the United Kingdom with the acquisition of Euro Car Parts Holdings Limited (ECP) ECPs product offerings are primarily focused on wholesale automotive aftermarket mechanical products LKQ purchased ECP for a total consideration (including earnouts) of $432m ECP generated $5096m in revenue in 2011 and had grown revenue at a CAGR of 33 from 2009-2011 As of October 2013 ECP operated out of 138 branches supported by a national distribution center
In May 2013 LKQ made its second significant acquisition in Europe buying Sator Holding an automotive aftermarket parts distribution company based in the Netherlands with operations in the Netherlands Belgium Luxembourg and Northern France LKQ bought Sator for $272m (EUR 210m) Sator generated $374m in revenue in 2012 The acquisition expanded LKQrsquos geographic presence in the European automotive aftermarket products market into continental Europe
Sources LKQ 10-K for 2012 10-Q for Q2rsquo2013 2007 Investor Presentation httpwwwlkqcorpcomusenabout-usaspx 19
Acquisition of Keystone Automotive Results in Dominant Competitive Position as a US Aftermarket Parts Distributor
Recent International Expansion with 2 Large-Scale Acquisitions European Aftermarket Parts Distributors
Background ndash LKQ Business Overview
LKQ provides alternative auto parts used for vehicle repairs Alternative auto parts can be used in vehicle repairs in place of new branded auto parts made by vehicle manufacturers or ldquoOEMsrdquo
To be clear buyers of replacement auto parts have 5 options to choose when repairing their vehicles
1 New OEM parts ndash branded auto parts produced by vehicle manufacturers (ie ldquoOEMrdquo)
2 Aftermarket parts ndash new generic parts that were not produced by the OEMs LKQ sources the majority of the aftermarket parts it sells in North America from Taiwan and other Asian countries
3 Recycled products ndash used parts that were originally produced by OEMs LKQ sources its recycled inventories by buying salvaged vehicles at auction then disassembling them at its salvagejunk yards
4 Refurbished parts ndash used products that have been refurbished LKQ processes these from cores obtained from salvage vehicles
5 Remanufactured parts ndash used products that have been remanufactured LKQ processes them from cores obtained from its salvage operations
The value in using alternative parts in place of new OEM parts is that they have traditionally been less expensive
Source LKQ 10-K for 2009 and 2012 20
or any of the below alternative auto parts all of which LKQ provides
For example if you get into an accident and need to replace the vehicle bumper you have 3 options
1 Replace it with a new branded bumper manufactured by General Motors (ie a new OEM part)
2 Get a new generic bumper that was made in Taiwan (ie an ldquoaftermarket partrdquo)
3 Get a bumper from the junkyard (ie a ldquorecycled partrdquo)
Options 2 and 3 are examples of alternative parts There are others discussed below
According to its filings ldquoWe compete with the OEMs primarily on price and to a lesser extent on service and
qualityrdquo In essence LKQ sells nothing more than commodity products which we will show has a diminishing
competitive price value proposition Furthermore numerous customer complaints and an ldquoFrdquo Rating from the
Better Business Bureau (see Appendix) severely calls into question its service and quality performance
21
Background ndash LKQ Revenue Growth
Driven by APU
LKQ sells its products and services primarily to collision repair shops (ie lsquobody shopsrsquo) but insurance companies are its lsquoindirectrsquo de facto customer Pressure exerted by insurance companies on body shops to hold claims costs down by using alternative auto parts resulted in a 30 year-long rising trend in the market share for usage of alternative parts vs OEM parts in collision repairs This trend has been a core pillar of the LKQ growth story since it went public in 2003
This trend is measured by the ldquoAlternative Parts Usagerdquo (APU) or the percentage of total replacement part dollars spent on alternative parts vs OEM parts The APU has risen from 23 in 2000 to 37 in 2012 according to CCC Information Systems provider of the industryrsquos dominant estimate writing platform
LKQ has displayed a chart encapsulating this trend as a centerpiece of its growth story in all of its investor presentations spanning at least the past 5 years until recently the company has excluded it from all of its 2013 presentations As explained later in this report we believe this share shift has stalled and may reverse
Source LKQ 10-K for 2012 LKQ conference calls LKQ 2009 investor presentation
ldquoRecently CCC published their annual crash course publication The industrys average use of alternative parts for collision repairs increased by almost 300 basis points to 35 for 2009 from 32 in 2008 sharply accelerating from the decade-long trend we have seen of 100 basis points per year increaseshellip Reflecting the increase in APU demand for LKQs wholesale parts remain strong during the quarter Our first quarter organic revenue from the sale of parts and services increased 56 even with reductions in miles driven of 16 in January and 29 in Februaryrdquo
ndash Joseph Holsten LKQ Chairman Q1rsquo2010 Earnings Call (4292010)
European Business Growing as a
Percent of Consolidated Revenue
For the past 3 quarters LKQrsquos European Parts and Services business has demonstrated an organic growth rate gt5x that of its North America counterpart over this period Europe grew at an average rate of ~34 vs ~6 in North America
Fueled by organic and acquisition growth (including the relatively large purchase of Sator) as of 9312013 European Parts and Services Revenue had grown to 28 of consolidated revenue from 15 one year prior
(1) lsquoNorth Americarsquo amp lsquoEuropersquo categories represent geographic sources of Parts and Services Revenue
(2) lsquoOtherrsquo Revenue is comprised of sales of scrap metal and aluminum ingots and sows
(3) Revenue shares were computed by annualizing Q3rsquo2012 amp Q3rsquo2013 reportable category revenues
22
LKQ Organic Revenue Growth by Category Europe Growing in Terms of Revenue Contribution123
As of Q3rsquo2012 As of Q3rsquo2013
Organic Parts amp Services Revenue Growth by Geography
High-Level Indications of Fabricated
GAAP Profits Unsustainable Business
Model
LKQ is a classic roll-up fueling growth through acquisitions In the following slides we elaborate on our view that LKQ is an ineffective roll-up undeserving of its rich valuation By contrast an effective roll-up can create enormous value which warrants a rich PE
24
LKQ is a Roll-up Dynamics of
Roll-up Strategies
(1) Paul F Kocourek Steven Y Chung and Matthew G McKenna ldquoStrategic Rollups Overhauling the Multi-Merger Machinerdquo Strategy amp Business second quarter 2000
The bet underlying a rollup is that it can reduce costs and drive growth to create enormous value In fact kindling organic growth ndash driven by a superior value proposition ndash is particularly important as the pace of acquisitions begins its inevitable decline When all goes well we find a cycle of value creation that takes on a life of its own (refer to the figure at lower right)hellip The market rewards this kind of growth with a higher PE ratio which creates the currency for more acquisitions ldquo1
But Wall Street is littered with companies that have failed to properly effectuate it and that have over time destroyed vast amounts of shareholder wealth Among such companies are Waste Management (WM) and AutoNation (AN) In this report we elaborate on our view that LKQ with common backers very much resembles both companies
For example like LKQ AN set out to build a one-stop-shop establishing presence in all aspects of its markets ndash new and used auto sales auto rental and auto servicing It tried to consolidate a highly competitive low margin maturelow growth industry as such ANrsquos success was dependent on stealing market share from existing competitors Like LKQ it also had no ability to drive down its most basic cost ndash that of buying used cars it had to compete at auctions with other dealers to build its relatively huge inventory which depreciated in value at a very fast rate1 Using public capital it acquired hundreds of businesses It used a concerning acquisition accounting methodology pooling of interests (which is no longer allowed by GAAP) that likely inflated its reported earnings In its early stages it was a Wall Street darling ndash touted as a strong buy by sell-side analysts ndash and valued for perfection but reality caught up with its over- expansion and -extension into money-losing endeavors Over a 35 year period its market value of gt$12B fell by gt80 from peak to trough with shareholder losses exceeding $10B
Dynamics of an Effective Rollup
The roll-up strategy inherently flatters earnings and CFO metrics Roll-ups usually show both strong earnings and strong CFO (ie high earnings quality) due to the inherent financial statement mechanics of paying for growth through acquisition outflows (which do not affect earnings or CFO) Cash spent to acquire businesses runs through the Investing section of the Statement of Cash Flows so the acquirer is able to inherit a new CFO stream without any CFO outlay (ie working capital investment) Moreover as the acquirer liquidates the working capital of the acquired company in the normal course of business ndash collecting on receivables or selling inventory ndash it can realize an unsustainable CFO boost that has virtually nothing to do with the performance of its business
As such free cash flow after acquisitions is a key metric for analyzing roll-ups presenting a better picture of the businessrsquos economics In LKQrsquos case it demonstrates that LKQ is an ineffective consistently cash-degenerative roll-up LKQrsquos free cash flow after acquisitions has been negative in 8 of 9 years from 2004-2012 and is negative in the last twelve month period through September 30 2013 a cautionary sign that its strong positive CFO is not what it appears
25
LKQ Appears to be an Ineffective
Consistently Cash-Degenerative Roll-up
Adjusted Free Cash Flow is free cash flow after acquisitions (ie CFO ndash capex ndash acquisition outflows)
LKQrsquos Free Cash Flow Adjusted for Acquisitions LKQrsquos Earnings Quality lsquoAppearsrsquo High
26
High-Level Indications of Fabricated GAAP
Profits Unsustainable Business Model
Furthermore our analysis indicates LKQ may be engaging in aggressive accounting to engineer GAAP profits
Since 2007 LKQ has reported cumulative Earnings and EBIT of $1222m and $2153m respectively
Meanwhile it has burned cumulative free cash flow after acquisitions of -$1623m and raised cumulative net capital of $1625m suggesting it has never earned a cash-on-cash return on invested capital
Put another way the immense wealth generation represented by LKQrsquos historical GAAP profits is not observable in the companyrsquos cash flows ndash it appears to be lsquopaperrsquo wealth generated from accounting gimmickry and enabled by an aggressive roll-up strategy and accounting practices
Capital Raised = equity + net debt + option proceeds Adj FCF = CFO ndash capex ndash business acquisitions
LKQ Appears Increasingly Dependent on External Capital to Generate Any EBIT and Net Income
Reported North America Parts amp Services
Organic Revenue Growth Appears
Overstated Pricing Pressures Intensifying
28
North America (NA) Organic Growth
Appears Overstated
LKQ reported organic revenue growth averaging ~65 from 2008 ndash 2012 and ~6 in the 9 months ended 9302013 for its North America Parts and Services (PampS) business which accounts for ~75 of consolidated PampS revenue These growth rates do not appear reconcilable with trends in its primary driving fundamental factors or representative of LKQrsquos sustainable North America organic growth rate which we believe likely falls in the range of 0-2
Data for insurance claims paid for repairable accidents indicates no growth
Growth in market share of alternative auto parts relative to OEM parts (ie APU) which has risen for 3 decades and served as a primary driver of LKQrsquos organic growth flat-lined from 2010 ndash 2012 and may taper or reverse
For the first time replacement auto parts prices deflated in 2012 as competitive pressures intensified
Market share gains from alternative parts competitors are limited by LKQrsquos market dominance already owning 25-30 of the market market share is LKQrsquos to lose
LKQrsquos North American PampS organic growth rate also appears unhinged from growth rates reported by dominant companies in its primary end market For example the Boyd Group (TSX BYDUN) a large publicly traded multi-service operator in the North American collision repair industry has reported average same store sale growth of just 2 over the same period LKQ has reported organic growth of 65 While Boydrsquos results have shown significant cyclicality LKQrsquos results have been highly consistent and steadily positive ndash such patterns in an otherwise cyclical business are often a hallmark of companies over-concerned with meeting Wall Street estimates and financial transgressions
NA Organic Growth ndash Insurance Collision
Claim Payouts Are Not Growing
According to LKQ ~85 of all repairs are paid for by insurance companies in effect they are the ultimate payee for replacement auto parts
The total value of Insurance Collision Claims paid for Repairable Accident Claims (which excludes Total Loss data) has been stable at ~$28 billion over the past 5 years time This is the result of steadily increasing severity despite a downward trend in accidents and cars repaired
Per the table below the 5yr CAGR for total insurance claims paid for repairable accident claims is 0
29
Source The Romans Group LLC
30
OEM Price-Matching Programs Also Forcing
Aftermarket Auto Part Price Deflation
LKQ has historically benchmarked its prices against OEM parts prices which historically have risen 10 ndash 20 pa
ldquohellip maybe another way to look at that is that we typically price our parts based on new OE partshelliprdquo 1
ldquoWe track OE prices relative to what theyre doing They are still averaging consistently 15 to 2 increases though we tend to follow right on their heels When they raise were right behind themrdquo 2
Recently OEMrsquos have expanded their price-matching programs wherein they are matching alternative parts prices Theyrsquove set their sites on regaining market share previously lost to alternative parts suppliers by empowering their dealersrsquo parts departments to match aftermarket parts prices and are succeeding
We believe these programs have become widespread and much more pervasive than LKQ has led investors to believe
(1) Joseph Holsten former CEO on Q4rsquo2008 earnings call
(2) Robert Wagman CEO on Q3rsquo2011 earnings call
We believe that substantially in excess of 50 of collision parts by dollar amount are supplied by OEMs with the balance being supplied by distributors like us The OEMs are therefore in a position to exert pricing pressure in the marketplace We compete with the OEMs primarily on price and to a lesser extent on service and quality From time to time OEMs have experimented with reducing prices on specific products to match the lower prices of alternative products If such price reductions were to become widespread it could have a material adverse impact on our business
ndash LKQ 10-K for 2012 (Risk Factors)
31
NA Organic Growth ndash OEM Price Matching
Interview With Aftermarket Distributor
Prescience Point (ldquoPPrdquo) Can you describe whats been happening in the industry
Aftermarket Parts Distributor (ldquoAPDrdquo)1 The OEs dealerships are selling below their cost This is happening nationwide It started around 2008
PP How is it impacting aftermarket parts distributors
APD Its put 4 out of business within 200 miles of here and it put me out of business too So thats 5 out of 5 The only one left standing is LKQ
Its a really strange deal I called the 4 companies and asked them why they went out of business and they said it was because of the OEs matching their prices
They are being dis-intermediated by the OEMs Theyre not selling parts either By way of example The gentleman who runs (the local) LKQ-Keystone and I have been competitors ever since Ive been in business He started out w a company that LKQ bought out then he went to another company and LKQ bought them out and now he works for LKQ For this entire time weve been competitors Anytime Ive ever asked him about hows hes doing hes said lsquoWere doing great were just selling shit left and righthellip for about 18 years thats been his answer 3 weeks ago I called him and he says ldquoTalk to any one of my salespeople and they will tell you how badly weve been hurting If you want to know how bad it is talk to anyone of my salesmen we arent selling shitrdquo It was the first time hes ever in his life made a negative comment about his businesshellip
PP Do you think this will continue to impact LKQs ability to generate business in North America
APD If it continues it will put them out of business as far as aftermarket and salvage parts go
(1) ldquoAftermarket Parts Distributorrdquo is an owner of an aftermarket collision parts distributor
OEM Price Matching Interview With
Aftermarket Distributor (Contrsquod)
32
Prescience Point (ldquoPPrdquo) What would motivate the OE dealerships to sell products at a loss How can the dealerships take these losses
Aftermarket Parts Distributor (ldquoAPDrdquo) 1 Because the OEs are paying them (the dealers) back on their money making them whole and then giving them a 14 profit (on top of that)
I have a document that shows how this is happening This specific document relates to a doorhellip GM is telling its dealer to ldquoForget the dealer list price sell it 33 below Keystones list price Well give you all your money back plus a 14 profitrdquo LKQ cannot then step in and offer the part at the same price ($456) it wouldnrsquot be able to sell the part because the body shop prefers the OE part Body shops are happy because they are getting OE parts for aftermarket prices
PP LKQs investor presentation contains a slide demonstrating its lsquoClear Value Propositionrsquo They give specific examples For example a new OEM front door might cost $1300 vs a recycled OEM front door that would cost $800 for a savings of 40 So is that not the case for a new vs recycled products
APD If an insurance company writes the recycled part for $800 the OEM will sell its $1300 (dealer list price) part for $800 and give the dealership a 14 profit
PP The presentation also gives another example for an aftermarket product It says a new OEM fender might cost $200 but an aftermarket fender sells for $160 for a 22 savings Same thing there The OEM will match that price
APD Same deal the dealer will sell it for $160 GM reimburse them for their $40 loss and give them a 14 return on top of that
(1) ldquoAftermarket Parts Distributorrdquo is an owner of an aftermarket collision parts distributor
33
LKQrsquos Only Competitive Advantage is Pricehellip
GMrsquos Price Matching Designed to Thwart LKQ
Keystone List Price
OEM price-match 33
discount from Keystone
Price (Keystone list has
generally been 20-25
less than OEM OEM is
now undercutting
Keystonersquos price by 33)
GM reimburses dealer
for loss on part cost
GM pays dealer 14
return on part cost
We have sourced an internal GM dealer document detailing its price-matching program ldquoBump the Competitionrdquo We are told it specifically targets LKQ-Keystone GM subsidizes dealers to sell parts (in this case a fender and a door) at levels 33 below aftermarket list prices makes them whole on the loss and pays the dealer an additional guaranteed 14 profit on the cost for the part
Source Felders Collision Parts Inc v General Motors Company et al Complaint Exhibit 4 filed 10122012
34
GMrsquos ldquoBump The Competitionrdquo Directed
at Outcompeting LKQ Retaking Lost Share
Launched in 2009 the ldquoBump the Competitionrdquo program from General Motors was designed to capture share of the aftermarket by lowering the price of its OEM replacement parts relative to the competition The initial rebates took the form of fast cash Visareg Award Cardshellip
httpwwwgmrepairinsightscomwp-contentuploads201304Repair-Insights-Q2-2013pdf
httpgmbtccaloginphp
wwwgenuinegmpartscom
35
OEM Price Matching Programs Date to 2009
GM Expanded its Programs in 2013 to Be Even
More Price Competitive Applied to More Parts
Source httpwwwgmlamcomguidelinespartsconquest_bulletinpdfSource Felder Collision Parts Inc vs General Motors Company et all 101212httpwwwmcmlspcomsandboxpodmock2431CollisiontoolsBTC_Calculator_010109v1axls
GMrsquos push to Bump the
Competition Dates back to
2009 amp Recent Evidence it has
become ldquoMore Price
Competitiverdquo
36
Mazdarsquos ldquoCollision Parts AdvantageTMrdquo
Program Also Directed at Displacing LKQ
Launched in 2011 the ldquoCollision Parts AdvantageTM rdquo program was launched by Mazda to warn its customers that aftermarket Like Kind and Quality are generally of lower quality than certified OEM parts The program offers its customers and chosen repair shops the choice to use its OEM parts with a price matching guarantee
httpwwwmazdaserviceinfocomPDFsCollision20Parts20Advantagepdf
OEM Price-Matching
APU Has Flat-Lined Likely to TaperDecline
The OEMs are aggressively reclaiming market share by competing away LKQrsquos price advantage ndash the prime basis of its value proposition Their efforts have successfully halted the three decade-long trend of steadily increasing APU CCC Information Services provider of the dominant estimate-writing platform indicates APU has leveled off over the past 3 years and the share shift may reverse CCCrsquos assessment is that a decline or tapering in APU is likely to materialize
A rising APU was a primary driver of LKQrsquos organic growth We note that every single LKQ investor presentation we have studied dating back to 2007 has given prominence to a slide displaying the decade long trend in APU For the first time ever LKQ has chosen to exclude this slide from its 2013 presentations We believe this change is a tacit admission that this metric no longer figures into the companyrsquos lsquogrowth storyrsquo
Sources LKQ Third Quarter 2012 Investor Presentations CCC Crash Course 2012
37
Collision Replacement Products Market Shift
APU has flat-lined
The Autumn Update to Crash Course 2011 included a discussion on the impact of the aging fleet on parts utilization and showed that the increase in industry-wide non-OE part utilization was driven in large part by the growing share of older model year vehicles where non-OE parts availability is higher As consumers begin to purchase more new vehicles and as more manufacturers provide price-matching programs for their dealers non-OE share of parts dollars (ie APU) will likely taper or decline
ndash CCC Crash Course 2012 published on 372012
38
LKQ Appears To Be Deceiving Investors
About the Current APU Problems
According to CEO Robert Wagman on the Q3rsquo2011 earnings call LKQ claims APU rose from 37 to 38 in 2012
Its own data source refutes that claim As its source for APU data communicated in conference calls and investor presentations LKQ cites the annual results released by CCC Information Services Per Robert Wagman on the Q3rsquo2011 earnings conference call
Discussion What LKQ Tells Investors What LKQrsquos Data Source Says
Alternative Parts Usage (APU) rate
Source Q312 conference call on 10252012 --As mentioned on previous calls we were confident that the historical trend of 100 basis point improvement in alternative part usage would continue in 2012 And today I am pleased to announce that that goal (for a 100 basis point improvement in APU in 2012) was achieved through the end of the third quarter According to CCC Information Services APU now stands at 38
Source CCC Crash 2012 Fall Update published 10172012 --The percent of the total dollars spent on replacement parts that were OEM was essentially flat year-over-year 632 percent at mid-year 2012 versus 631 percent at mid-year 2011(ie From mid-year 2011 to 2012 APU fell from 369 to 368)
CCC Crash Course 2013 report published 3282013 --At the close of 2012 the industryrsquos share of replacement part dollars was split at 63 percent OEM versus 37 percent non-OEM
Assessment of Trend in APU
Source Q312 conference call on 10252012 --As we enter the last quarter of 2012 and prepare for 2013 our outlook continues to be positive Im encouraged by the trends in miles driven the continued growth in APU the recent reduction in vehicle pricing at auctions the strength of Euro Car Parts and the robust pipeline of acquisition opportunities we are witnessing
CCC Crash 2012 Crash Course published on 372012 --The Autumn Update to Crash Course 2011 included a discussion on the
impact of the aging fleet on parts utilization and showed that the increase in industry-wide non-OE part utilization was driven in large part by the growing share of older model year vehicles where non-OE parts availability is higher As consumers begin to purchase more new vehicles and as more manufacturers provide price-matching programs for their dealers non-OE share of parts dollars (ie APU) will likely taper or decline
ldquoAs mentioned on previous calls we were confident that the historical trend of 100 basis point improvement in alternative part usage would continue in 2012hellip According to CCC Information Services APU now stands at 38hellipAs we enter the last quarter of 2012 and prepare for 2013 our outlook continues to be positive Im encouraged byhellip the continued growth in APU helliprdquo
ldquohellip we only get the annual results from the estimating company as to whats happening to the APU trendhelliprdquo
NA Organic Growth ndash APU
LKQ Appears to have Deceived Investors
What LKQ Tells Investors
In its March 2013 Investor Presentation LKQ
claims that APU had reached 38 in
accordance with previous guidance
Sources LKQ 10-K for 2012 March 2013 Investor Presentation (Raymond James 34th Annual Institutional Investors Conference)39
What LKQ Says in its SEC Filings
We believe however that as the insurance
and repair industries continue to recognize
the advantages of aftermarket recycled
refurbished and remanufactured products
the alternatives to new OEM replacement
products will account for a larger percentage
of total vehicle replacement product sales
Since 2008 alternative parts usage has
increased from approximately 32 to
37 of the collision replacement product
market We compete with OEMs on the
basis of price service and product quality
Even as it tells investors APU rose 100 basis points in 2012 LKQ contradicts itself in its own filings with the Securities and Exchange Commission which report that APU did indeed not rise
40
OEM Price-Matching
Parts Price Deflation Began in 2Hrsquo2012
The expansion of OEM price-matching programs have become so expansive that they drove deflation in parts prices in 2012 Industry data source Mitchell International reported a decrease in the indexed price of vehicle parts for its market basket for the first time in the 10 years Mitchell International has been collecting data
Prices began deflating in the second half of the year it is clear that the OEMs are expanding their price matching programs to cover more parts and that the programs are being implemented by more and more dealers
Source Mitchell Industry Trends Report Q2 2013
ldquoFor the first time we saw a decrease in the indexed price for the market basket Loyal readers of the Industry Trends Report will see that the 2012 decrease was not evident when we ran the index report early in 2012 so the decrease was in the latter half of 2012hellip The domestic vehicle parts market basket experienced such a decrease that it offset the moderate increases in the Asian and European market baskethellip So what we are seeing is the impact of the expansion of the competition parts price matching programs from the domestic OEs driving the decrease in the overall indexhelliprdquo
ndash Mitchell Industry Trends Report Q2 2013
41
OEM Price-Matching (Contrsquod)
Parts Price Deflation Began in 2Hrsquo2012
gt50 of LKQrsquos consolidated revenues are generated from the sale of aftermarket parts
According to CCC Information Systems aftermarket parts deflated by 24 in 2012
ldquoBetween 2011 and 2012 hellip the average price paid per replacement part fell by 03 percent Average price paid per replacement part varied by part type with reconditioned parts increasing 20 percent aftermarket parts decreasing by 24 percent and recycled parts increasing 08 percentrdquo
ndash CCC Crash Course 2013 report published 3282013
Source CCC Crash Course 2013
42
State Farm Insurancersquos New PartsTrader
Platform to Drive Even More Pricing Pressure
wwwpartstraderuscom
Insurance companies exert significant influence in the vehicle repair decision since they ultimately pay for the majority of collision repairs of insured vehicles Therefore they are incentivized to drive auto parts prices as low as possible to maximize their profits
In May 2013 State Farm Insurance the largest US auto insurer confirmed the end of the pilot phase and a national rollout of PartsTrader an electronic ordering system to its Select Service direct repair facilities The national roll-out is expected to be completed by 2014
PartsTrader is a web-based collision replacement parts market connecting OEM aftermarket remanufactured specialized and recycled automotive parts suppliers with collision repairers looking for replacement parts
As an online competitive marketplace designed to allow collision shops to make better procurement decisions with information on part quality delivery time supplier reputation and prices PartsTrader is expected to drive more competition amongst alternative parts distributors lowering auto parts prices and serving as another blow to industry organic revenue growth
httpwwwfenderbendercomFenderBenderMay-2013State-Farm-Initiates-PartsTrader-Expansion
43
NA Organic Growth ndash
Not Reconcilable w End Market Growth
LKQrsquos reported NA Parts and Services organic growth rate also appears unhinged from the growth rates reported by companies in its primary North American end market collision repair shops
For example Boyd Group (TSX BYDUN) is a Canada-based company that is consolidating the USCanada collision repair industry as a multi-service operator (MSO) Boyd has 228 locations in five Canadian provinces and 14 US states
According to the Romans Group LLC Boyd is a player in the fastest growing segment of the collision repair industry and is outperforming its peers in that segment1 Specifically
Boyd is a part of ldquothe $20+ million US collision repair segment (which) continues to grow market share and brand relatively faster than other segments of the collision repair industryrdquo and
Boyd has significantly grown its market share relative to the other top $20mm+ operators since 2006
(1) A Profile of the Evolving Collision Repair Marketplace Parts 1 amp 2 The Romans Group 2012
LKQrsquos NA Organic Growth is Too Predictably
Positive and Smooth in a Cyclical Industry
The significance in disparity between LKQ and Boydrsquos organic growth rates defies logic Boyd Group ndash again an outperformer amongst collision repairers ndash has reported organic growth of 2 on average since Q1rsquo2009 with significant variability in its growth rate (61 standard deviation) and has reported negative growth in several quarters on the other hand LKQ has reported organic growth in Parts and Services of 70 on average over the same time period with relatively little variability in its growth rate (standard deviation of just 18) and has never reported a period of negative organic growth
Note that LKQ changed its reporting of organic growth categories on 3313 As a result this analysis runs through 123112 for the purpose of presenting a fair apples-to-apples comparison 44
Source LKQ Press Release Source Boyd Group Press Releases
LKQ Quarterly Parts and Services Reported Organic Growth Rate SSS Growth - Boyd Group - Multi-Service Operator of Collision Repair Shops
00
20
40
60
80
100
120
-100
-50
00
50
100
150Average 20Std Dev 61
Average 70Std Dev 18
The European ldquoGrowth Fantasyrdquo ndash
Short-Term Decision-Making Signals
Desperation to Keep Financials Inflated amp
Meet Guidance Targets
Euro Car Parts ndash
LKQrsquos Largest Contributor to Organic Growth
In Q4rsquo2011 LKQ began expanding into Europe Its acquisition of UK-based Euro Car Parts (ECP) a distributor of mechanical aftermarket parts was made ndash and this was never disclosed by LKQ ndash as the UK aftermarket industry was significantly contracting (which is projected to continue) amounting to a high risk gamble using shareholder capital At the time of purchase ECP operated out of 89 branchstore locations and opened an average of 10 new branches per year in the period 2007-2011
LKQ pitched the purchase primarily as an open-ended opportunity to replicate its North American success
in Europe by driving APU ndash currently at 5 in the UK vs 37 in the US ndash for collision repairs
We believe LKQ is operating ECP to inflate its financials and meet guidance targets at the long term
shareholder expense of entrenchment in a contracting market which will result in a new financial hole
LKQ will predictably seek to plug with more acquisitions (which it has already begun making)
46
Euro Car Parts ndash
LKQrsquos Largest Contributor to Organic Growth
History of Acquisition In October 2011 LKQ acquired Euro Car Parts (ECP) a leading distributor of mechanicalaftermarket parts in the UK for a total of ~$432m (including the paid in full performance-based contingent component) ECP was founded by Sukhpal Singh Ahluwalia who today serves as Chairman of LKQ Europe
LKQ reported that ECP had grown revenue at a CAGR of 30+ from 2009-2011 it generated 2011 revenue of $523m equating to ~15 of LKQ sales
At the time of purchase ECP operated 89 branch locations and opened an average of 10 new branches per year in the period 2007-2011
LKQ pitched the acquisition as
a) an opportunity to continue expanding ECPrsquos branch network and
b) an open-ended opportunity to drive alternative part usage (APU) for collision repairs in the UK ndashwhere APU is ~5 (vs 37 in the US) ndash by educating insurers about the value proposition of alternative parts Per Chairman Joseph Holsten on the October 4 2011 ECP acquisition call
ECP is LKQrsquos single largest driver of reported organic growth LKQ reported ECPrsquos organic growth rate to be 30+ beginning in Q4rsquo2012 and in each quarter since
47
ldquohellip the opportunity is that whereas APU in the United States has moved from really even a sub-20 level when we first formed LKQ to 37 last year the UK market today stands at 3-7 APU utilization raterdquo
ECP ndash 30+ Organic Growth in a
Contracting Industry
In its investor presentations LKQ cites ECPrsquos growth rate and the potential to increase collision-repair APU to imply the acquisition presents a new doorway for growth It cites Datamonitor Group as its source for sizing the expansive UK aftermarket parts industry an lsquo$18bn marketrsquo
LKQ never mentioned that according to the same source (Datamonitor Group MarketLine) the UK aftermarket parts industry was in significant contraction at the time LKQ acquired ECP According to Datamonitorrsquos February 2012 publication the UK industry was expected to contract in 2011 by -58 and is projected to continue contracting
How can a UK-based distributor of aftermarket auto parts regularly report lsquoorganic growthrsquo exceeding 30 as the industry around it is contracting
48
ldquoThe United Kingdom automotive aftermarket sector shrank by 58 in 2011 to reach a value of $172595 millionhellip In 2016 the United Kingdom automotive aftermarket sector is forecast to have a value of $168771 million a decrease of 22 since 2011rdquo
ldquoThe UK automotive aftermarket sector entered a period of decline from 2008 through to 2011 The sector is expected to continue to recover with marginal growth in 2012 before falling into decline once again from 2013 through to the end of the forecast period in 2016rdquohellip It contracted at a ldquocompound annual rate of change (CARC) of -35 between 2007 and 2011rdquo
ldquoThe performance of the sector is forecast to decline further with an anticipated CARC of -04 for the five-year period 2011-2016 which is expected to take the sector to a value of $168771 million by the end of 2016rdquo
ndash Datamonitor MarketLine Automotive Aftermarket in the United Kingdom February 2012
ECP ndash
lsquoOrganic Growthrsquo That Isnrsquot Really lsquoOrganicrsquo
LKQ doesnrsquot define ECPrsquos lsquoorganic growthrsquo in the way investors might expect for a business characterized by sales originating at storefronts for which lsquoorganic growthrsquo would be represented by a same store sales growth
LKQ treats ECP revenue from stores existing for gt1 year and revenue from stores opened during the year as organic revenue1
As such its reported organic growth rate is fueled by opening new ECP branches and the more new branches it opens in a given period the more it can inflate the reported organic growth rate
Because ECP is in the midst of a rapid branch expansion it is able to report lsquoorganicrsquo growth of 30+ even as the broader UK aftermarket parts industry contracts
While ECPrsquos reported growth rate sheds light on the companyrsquos size in comparing data that are fundamentally incomparable it provides little information on the performance and health of its existing branch network Further it obscures LKQrsquos consolidated organic growth metric LKQ uses a different standard for reporting its North America organic growth which according to management only includes salvage yards open and within the system for a year In essence the company is mixing two different measurement approaches and potentially misleading investors
(1) LKQ Earnings conference call for Q2rsquo2012(2) Q3rsquo13 earnings release
49
2
Different measurement approaches
Yet each described as
lsquoOrganicrsquo
50
Throughout 2012 LKQ repeatedly raised guidance for the number of 2012 branch openings from 20 to 30 to 42 ECP has also repeatedly raised guidance for the maximum number of full-sized ECP branches the UK market can absorb from 100 to 120 to 150 to 175 to 200 giving itself more and more room to continue ramping the number of branch locations As demonstrated in the pages to follow these revisions were made with the purpose of meeting PampS revenue growth guidance
The table below summarizes LKQrsquos repeated revisions of guidance for the number of branches to be opened per period and for the maximum number branches the UK market could absorb The slides to follow detail these revisions
SourceGuidance for New
ECP Branch OpeningsGuidance for Maximum ECP Branches UK market could
absorbArticle in The Telegraph
(4212009)90 to 100 total ECP branches to give presence across the UK
ECP Acq call (1042011) 10-12 per year
Q4rsquo2011 earnings call (2232012)
Guidance for 2012 20 openingsChange vs prior guidance +10 openingsTotal store count if guidance met 110 branches
120 full sized branches + 15 satellites
Q1rsquo2012 earnings call (4262012)
Revised guidance for 2012 30 openingsChange vs prior guidance +10 openingsCumulative change vs initial guidance +20 opensTotal store count if guidance met 120 branches
2013E guidance 20-25 openings
150 full sized branches + 25 satellites(175 total)Change vs prior guidance +40
Q3rsquo2012 earnings call (10252012)
Revised guidance for 2012 42 openingsChange vs prior guidance +12 openingsCumulative change vs initial guidance +32 opensTotal store count if guidance met 132
150 full sized branches + 25 satellites(175 total)
Q4rsquo12 earnings call(2282013)
Guidance for 2013 10 openings Change vs prior 2013 guidance -10 openings Total store count if guidance met 142
150-175 full sized branches + 25 satellites(175-200 total)Change vs prior guidance +25Cumulative change vs initial guidance +65
Q1rsquo2013 earnings call(4252013)
Revised guidance for 2013 15 openings Change vs prior 2013 guidance +5 openingsTotal store count if guidance met 147
Q2rsquo2013 earnings call(812013)
175-200 full sized branches + 25 satellites(225 total)Change vs prior guidance +25Cumulative change vs initial guidance +90
Short-Term Decision-Making Signals Desperation
to Keep Financials Inflated amp Hit Guidance
51
In an article published by The Telegraph on 4212009 ECP founder (currently Chairman of LKQ Europe) Sukhpal Singh Ahluwaliastated that he thought ECP could have a total of 90-100 branches ldquogiving it a presence across the UKrdquo
On the October 2011 conference call detailing the ECP acquisition LKQ told investors it had a plan to open 10-12 branches per year for the next few years At that time LKQ appeared more focused on the opportunity to grow collision repair APU in the UK
On the Q4rsquo2011 earnings call LKQ raised the number of branches it had planned to open to 20 in 2012 LKQ stated that the UK could support a total of 120 full-sized stores and 15 smaller lsquosatellitersquo stores so ldquowhen were all said and done we could be in the 135 rangerdquo
SourcePlans for New ECP Branches
Guidance for Maximum ECP Branches UK market could absorb
Article in The Telegraph (4212009)
Sukhpal Singh (from The Telegraph article Sukhpal Singhrsquos Next Goals for Euro Car Parts)I think we could increase to 90 to 100 branches We need to have a presence across the UK
ECP Acquisition Call (1042011)
Robert L WagmanYes we -- right now Craig we have a plan to grow 10 to 12 branches per year for the next few years -- for the upcoming years to complete out the major UK markets major markets that theyre in
Q4rsquo11 Earnings Call(2232012)
Given the market opportunities in the UK and the attractive unit economics at ECPs locations we anticipate ramping up our total branch openings for 2012 to roughly 20
Craig R KennisonRE ECPhellip what do you think that market the UK market can support long-term in terms of the number of stores that you operate
Robert L WagmanWe think the right number is going to be somewhere around 120 Craig to fully develop the network So we think well be at 20 by the end of this year As far as the what the market -- the overall market 120 seems to be the number what well also do is open some satellite stores They wont be full branch stores to support some of the remote areas of the UK So I think when were all said and done we could be in the 135 range
Short-Term Decision-Making Signals Desperation
to Keep Financials Inflated amp Hit Guidance
52
On the Q1rsquo2012 LKQ announced an increase in anticipated store openings to 30 in 2012 which would result in a total of 120 stores (the previously stated market saturating count) Furthermore it announced plans to open another 20-25 stores in 2013 which would take the total number of stores to 140-145 well beyond previous guidance for UK market saturation It followed by raising the ceiling on the number of stores the market could absorb to 150 full-sized stores and 25 satellite branches (175 in total) which would seem to indicate branches in major metropolitan areas being ldquo5 miles or so apartrdquo(akin to a Starbucks model) LKQ would continue to raise from this level the maximum number of stores the UK could absorb
On the Q3rsquo2012 earnings call for the 3rd time LKQ revised higher guidance for the number of branch openings planned to 32 for 2012 (from initial guidance for 10-12) which would make for 132 branches in total LKQ also stated ldquoWeve said we believe the total store count is going to be somewhere around 150 to 175rdquo
SourcePlans for New ECP Branches
Guidance for Maximum ECP Branches UK market could absorb
Q1rsquo12 Earnings Call(4262012)
And due to favorable market conditions and ECPs managements proven ability to effectively and efficiently open branches we anticipate accelerating new branch openings to 30 in 2012 which is 10 more than the 20 we were anticipating on our last call
Robert L WagmanSo we believe well get to roughly 120 locations by the end of this year if all goes to plan We want to add probably another 20 or 25 next year which adds to about 150
Unknown AnalystWould you tell us just a little bit there about ECP and talk about the footprint I mean with the growth expansion-- if you look at how far these are apart any chance of cannibalizing in those markets
Robert L WagmanhellipWe think that surely branches in major metropolitan areas can be 5 miles or so apart So theres not necessarily cannibalization its just better service for the customershellip And then on the last call we talked about these ancillary locations not full sized branches Our average branch over there is a 10000-square foot branch These would be smaller offshoots in more rural areas That may be another 20 to 25 locations So when this is all said and done well be at about roughly 175 locations in the UK Cannibalization there is a slight -- when you put one 5 miles apart from each other we do move some of the revenue from one branch to the other Butagain because of the better service levels we can provide we do see an uptick in the revenue pretty quickly
Q3rsquo12 Earnings Call (10252012)
During the quarter we opened 10 new branches in the UK bringing our total branch count to 120 Since the acquisition of ECP in early October 2011 we have opened 31 branches surpassing the target number of 30 I mentioned on the last call Given that market conditions in the UK combined with the continued success of ECP we have approved an additional 12 new branch openings for the fourth quarter bringing our total target to 132 branches by year-end
John R LawrenceRob would you take a -- if you look at ECP overall out for the next 12 to 18 months -- how do you look at allocating CapEx dollars Obviously youre doing that with some more stores but longer term that marketplace -- the viability to spend more capital over there
Robert L WagmanWeve said we believe the total store count is going to be somewhere around 150 to 175 We believe that number is still to be true And in fact we may actually be able to go a little bit above 175 with those satellite stores to feed the more remote areas
Short-Term Decision-Making Contrsquod
53
On the Q4rsquo12 call LKQ indicated that the 12 stores opened through January 2013 were pulled forward from the 25 it had projected to open in 2013 and that it would take a break from opening new stores until Q2rsquo2013 at which point it could have evaluated the progress of the newly opened stores There was a deceptive change in language in guidance for possible total store count calling for 150-175 full sized branches andan additional 25 satellites (200 in total) (Recall that on the Q1rsquo12 call then reaffirmed on the Q3rsquo12 call they guided that the market could absorb to 150 full-sized stores and 25 satellite branches (175 in total)
On the Q1rsquo2013 earnings call LKQ announced plans to open another 15 in Q3 and Q4 2013 which would make for a total of 147 ECP branches (against initial guidance that the UK could absorb 120)
On the Q2rsquo2013 call in August 2013 LKQ again raised the limit on its estimate for the total number of stores the UK could absorb to 175-200 full sized branches (from 150-175 before that 150 before that and 120 before that)
Then on November 12 2013 in a press release announcing ECPrsquos founder had been promoted to serve as chairman of LKQ Europe he stated ldquoThe UK alone will have 200 Euro Car Parts branches within three yearsrdquo
SourcePlans for New ECP Branches
Guidance for Maximum ECP Branches UK market could absorb
Q4rsquo12 Earnings Call(2282013)
Robert L WagmanDuring the fourth quarter we opened 10 new branches and we opened 2 additional branches in January bringing our total branch count to 132hellip hellipWith the 12 we did in Q4 originally scheduled for 2013 so we pushed them in 2012 So as John said were going to reevaluate this in Q2 but I would expect if we feel comfortable well add another 10 in 2013 to fill up to get to 142 with still some growth for 2014 and 15 as well
Robert L WagmanhellipWere still standing by our projections of 150 to 175 what we call Tier 1 ECP locations and an additional 25 or so Tier 2 the smaller or remote markets
Q1rsquo13 Earnings Call (4252013)
Now turning to Euro Car Parts We continue to be impressed with the performance of Euro Car Parts and its ability to capture market share In Q1 ECP achieved strong organic revenue growth of 321 With the continued performance in ECPs financial results and the strength of ECPs management team I am pleased to announce that we have approved an additional 15 new branches for 2013 that are scheduled to open in the third and fourth quarter of this year
Q2rsquo13 Earnings Call(812013)
John S Quinnhellip Weve targeted 15 for the balance of this year That will take us up to circa 147
John S Quinn We think the right number is probably somewhere in 175 to 200 for what we consider a full branch and then there will be some satellite opportunities in addition to that Over time as we grow that were going to have to look at the infrastructure associated with that regional hubs and the 2 main central hubs
LKQ PR announcing leadership change
Sukhpal Singh Ahluwalia lsquoI have never been more hungry excited or determined to maximise our potential for the next decade and beyond The UK alone will have 200 Euro Car Parts branches within three years and we have ambitious targets for paint collision parts and e-commercersquo
Short-Term Decision-Making Contrsquod
12282012 Right before 2012 Yr End ldquoOur Biggest Sale Ever Up to 45rdquo We have a Sale on at the moment where you can save up to 45 off on Car Partsbut it doesnt last long - must end midnight 1st Jan so hurry
8162012 rdquoMid Month Madness 30 off Car Parts Selected Car Partsrdquo Owning to popular demand (everybody likes a big juicy discount) ndashwersquove decided to bring the big daddy back ndash yes thatrsquos 30 off Car Parts as well as ALL Engine oils
9272012 Right before Q3rsquo12 Ended ECP ran a promotion ldquoThe Boss is Away 31 off Promo Code InsidehellipEnds Sundayrdquo Our biggest ever discount offered on almost ALL car partshellipcash in before the boss is back
bull In 2012 ECP started heavy price discounting of parts across the board Most discounts touted up to 30 off often on all products sold By the end of the year the savings discounts reached up to 45 off
bull Many of these sales appeared right at the end of the quarter in what appears to be an attempt to juice results ahead of reporting to investors
httpwwwgolfgtiforumcoukindexphptopic=2361380 httpwwwgolfgtiforumcoukindexphptopic=2386450 httpwwwgolfgtiforumcoukindexphptopic=2461350
Short-Term Decision-Making Steep
Discounting to Hit Numbers in 2012
54
5242013 ndashrdquoThe Online Bank Holiday Sale Up to 50 Off Everythingrdquo
ldquoItrsquos BACK again ndash Up to 50 OFF EVERYTHING No promo code required Must End Midnight Monday 27th Mayhelliprdquo
9272013 Before the end of Q3rsquo13
ldquoEnd of Summer Clearance up to 50 off Everything Onlinerdquoand you donrsquot need a promo code as current prices reflect the discount by defaultrdquo
3282013 Before the end of Q1rsquo13
ldquoOur Biggest Ever Sale ndash Up to 50 off Everythingrdquo
55
httpwwwgolfgtiforumcoukindexphpPHPSESSID=rffknoatjiinf0n2nuhh828uv6amptopic=2512620
httpwwwgolfgtiforumcoukindexphpPHPSESSID=rffknoatjiinf0n2nuhh828uv6amptopic=2542750
httpwwwgolfgtiforumcoukindexphpPHPSESSID=rffknoatjiinf0n2nuhh828uv6amptopic=2598690
In 2013 discounts increased noticeably from 30 to upwards of 50 off Each promotion is touted as its ldquobiggest sale everrdquo ECP has continued its practice of running promotions right towards the end of the quarter
Not one time has LKQ attributed such discounts as a driver of its persistently declining gross margin
With Even Bigger Promotions in 2013
On the Q4rsquo2011 call (22312) LKQ guided for 20 stores to be opened in 2012 and guided for
2012 Parts and Services organic revenue growth 55-70 (Guidance for PampS organic
growth includes the impact from anticipated ECP store openings)
On the Q1rsquo2012 earnings call (42612) guidance was revised lower to 50-70 even as
LKQ raised the number of anticipated 2012 store openings by +10 to 30 indicating the
intent to make up for unanticipated weakness in North America with new branch
openings LKQ stated that in order to meet 2012 guidance certain anticipated tailwinds
would have to materialize specifically stating APU would likely rise from 37 to 38
On the Q3rsquo2012 earnings call (102512) LKQ raised the number of anticipated 2012 store
openings by +12 to 42 and raised the lower end of the range for organic growth by 50bp to
60-70 In Q3 the opening of new ECP branches alone accounted for 40 of Parts and
Services organic growth
The increase in the number of stores openings during Q4rsquo12 resulted in ECP growing to
account for 75 of LKQrsquos Q4rsquo2012 PampS organic growth by our estimates enabling it to
report 6 organic revenue growth and meet the low end of the guidance range
In sum LKQ stated a reliance on APU rising to 38 to meet the initially released 2012
guidance levels although LKQ appears deceptive with investors in claiming this APU target
was met the data released by its information source refutes its claims reporting that at the
end of 2012 APU was 37 unchanged from 2011 This left LKQ reliant on other sources of
organic growth to meet guidance
In 2012 LKQ juiced its organic growth rate by opening double the number of ECP
branches initially guided for indicating LKQ made strategic decisions related to ECP
openings at the expense of long-term value creation to inflate its financials and hit
guidance 2012 guidance for organic revenue growth 56
ldquoWe included in the internal growth and the earnings guidance the new ECP locations opened to date and planned for the balance of the year Rob mentioned that we plan to increase the number of branch openingshellip To reach our guidance were obviously assuming that the rest of the year gets better and we do think there are some tailwinds to help us in that regard In 2011 we saw alternative part usage rate in the industry of 37 Based on what were seeing in the market today we believe that in 2012 well see that rate increase to at least 38
How Did This Play Out In Pacifying
Wall St Estimates
ECP ndash lsquoOrganicrsquo Growth Contribution to LKQ
Parts and Services Org Growth is Now gt50
ECPrsquos reported organic growth rate has grown to account for gt50 of LKQrsquos consolidated Parts and Services organic growth rate
ECPrsquos organic growth rate is a short-term phenomenon
As ECPrsquos reported organic growth rate begins to fall and converge with the industry rate of growth it will result in yet another large financial hole LKQ will predictably seek to plug
(1) Q2rsquo2013 ECP SSS adjusted for 2 extra selling days SSS provides little insight as it is inflated by the revenue ramp of newly opened branches which take 3 years to mature
(2) NA organic growth contribution is a PP estimate imputed by backing out organic growth from ECP from reported Parts and Services organic growth 57
ECP Reported Organic Sales Growth1 ECP Contribution to Parts and Services Organic Growth2
PP model Uses 2006 as anchor year and is based on the number of per year ECP branch openings since 2006 and our projection of store builds through 2016 which reflects LKQrsquos Europe Chairmanrsquos expectation of 200 stores within 3 years Assumes that at maturation each store generates $54m ECPrsquos average reported revenuestore in the period 2010-2012 ECP generally experiences the most significant growth benefit from a new branch in the year of first generating sales and benefits continue to accrue through a 3 year store maturation period (LKQ earnings conference call for Q3rsquo2012)
ECP ndash lsquoOrganicrsquo Growth Rate Unsustainable
Driven by Accelerated Store Expansion
ECP had a total of 89 branches when LKQ bought it in October 2011 and had opened an average of 10 new branches per year from 2007-2011 In 2012 alone LKQ opened 40 new branches In just 2 years at 9312013 LKQ had 138 total branches and intends to have 200 by the end of 2016
The chart to the right below contains a simulation approximating the revenue build and growth rate for ECP that would result solely from opening new ECP branches The levels of organic growth projected by the estimated growth rate trend are reflective of the levels reported by ECP (after taking into account that our simulation understates ECPrsquos reported growth rates in its earlier periods due to assuming no new stores were opened in 2006 and prior) As such we believe ECPrsquos growth is almost entirely explained by branch openings as opposed to same store sales growth for matured (ie gt3 years old) branches a result we would expect given the industry may be contracting
This means that as ECP approaches its market saturating goal of 200 total branches its reported organic growth rate will plummet converging to the industry rate of growth ndash which is negative
58Historical Data from ECP 2009 Annual Report amp the ECP Heritage webpage
2014-2016E from ldquo200 Euro Car Parts branches within three years ldquo
ECP Current and Projected Store Base Simulated ECP Growth Solely from New Branch Openings
LKQ appears to operate ECP with the primary intent of unsustainably inflating its financials and meeting guidance targets at the long term shareholder expense of entrenchment in a contracting market We believe the result is predictable A new financial hole will be left in the wake of a slowdown of in ECP branch openings that LKQ will seek to plug with more acquisitions (which have already begun taking place)
Growing ECP branches was not an LKQ priority when it justified the acquisition and this is evident by its initial plan to open only 10-12 stores per year On the ECP Acquisition call (1142012) LKQ stated that it had a strategic ldquoplan to grow 10 to 12 branches per year for the next few yearsrdquo It broke from that lsquoplanrsquo just one quarter later and following repeated revisions branch store openings opened 40 branches in 2012 Coincidentally growth in North America was weakening Based on our estimates by Q4rsquo2012 ECP accounted for a full 75 of consolidated PampS organic growth and enabling LKQ to hit guidance
LKQ has repeatedly raised the ceiling for the maximum number of ECP branches the UK market can absorb On the Q1rsquo2012 earnings call LKQ stated in another revision that the UK could absorb a maximum of 150 full-sized ECP branches and indicated that at that level ldquobranches in major metropolitan areas can be 5 miles or so apartrdquo which would clearly result in cannibalization LKQ has since raised the ceiling on the maximum branch count to 200
As of 9302013 LKQ had a total of 138 stores (and growing) and plans to have 147 by YE2013 exceeding by 27 branches its initial guidance for the maximum number of stores the UK market could absorb (120 full-sized stores) which was likely the most credible number it has espoused given that it preceded the repeated store ramp-up and apparent quest to meet guidance It may have already saturated the UK market yet LKQ continues to invest shareholder capital into building new branches
LKQ appears to be juicing ECP sales with heavy discounting of parts with many such promotions offered right at the end of LKQrsquos fiscal quarters
Inevitably as ECP reaches its market saturating location capacity we expect ndash and we believe management has anticipated ndash its reported organic growth rate to plummet and converge to the industry average LKQ moved quickly to buy Sator in April 2013 amounting to its 3nd largest purchase ever at the time As a result its European reporting segment now includes both ECP and Sator This new reporting will obscure future financial deterioration at ECP
59
LKQrsquos Short-Termism Results in Increasing
Dependency on Acquisitions to Stay Afloat
60
Other Red Flags ECPrsquos Receivables
Growing 2x Faster Than Revenues
The recent acquisition of Sator appears designed to hide the problems occurring at Euro Car Parts By removing Satorrsquos Q2 2013 revenue and accounts receivable contribution we find that ECPrsquos receivables grew at 2x faster than reported revenues This is a major red flag for investors to consider
Source Company financial filings
European Segment Quarterly Operating Results$ in millions
Euro Car Parts Results Only SatorECP Pro Forma
3m Ended 3m Ended 3m Ended 3m Ended 3m Ended 3m Ended 3m Ended Sator ECP Only
Dec 2011 March 2012 June 2012 Sept 2012 Dec 2012 March 2013 June 2013 Contribution(1) June 2013
Revenue $1385 $1607 $1652 $1813 $1888 $2126 $2978 $688 $2290
QoQ growth -- 160 28 97 41 126 401 -- 77
YoY growth -- -- -- -- 363 323 803 -- 386
Accts Receivables Net $509 $590 $600 $689 $702 $787 $1437 $531 $906
QoQ growth -- 160 17 148 18 121 827 -- 152
YoY growth -- -- -- -- 379 333 1393 -- 509
(1) LKQ Quarterly filing Note 9
61
The Real ECP A Lemon with Terrible
Customer Feedback
httpwwwreviewcentrecomOnline-Car-Part-SuppliersEuro-Car-Parts-www-eurocarparts-com-review_2041339
Increasing Dependency on Acquisitions to
Inflate Financials Conceal Cumulative
Manipulations
Apparent Dependency on Acquisitions to Inflate
Profits and Conceal Cumulative Manipulations
LKQrsquos move to expand internationally beginning with its acquisition of ECP was reminiscent of another chapter from the Waste Management Story ndash the final chapter that ended with fraud and failure
On the October 4 2011 ECP Acquisition conference call LKQ Chairman (and former President of Waste Management International) Joseph Holsten unprompted assured shareholders that LKQ would not repeat Waste Managementrsquos international expansion mistakes
The ensuing realities however have reflected little in the form of caution
63
Now a few of us in LKQ have kind of been down a similar road before in the waste business when we founded Waste Management International in the early 90s And we ran down the road kind of fast and probably got into markets that were not good markets to be in And as I go out -- you will see it from this management team Itrsquos a team that learns from that lesson and will be more cautious in its market entries in Europe We have a very strong commitment to our board that job one is to make sure that the deal in the UK is functioning and functioning extremely well before we move into further markets
We believe LKQ entered Europe in search of a fresh pool of large-scale acquisition targets and that it is dependent on acquisitions to continue inflating its organic growth rate and GAAP profits while papering over cumulative past misstatements
LKQ entered the UK market with the express primary purpose of driving APU for collision repairs and has made very little progress in doing so to date
Despite Chairman Holstenrsquos pledge of caution LKQ has invested shareholder capital to aggressively ramp the ECP branch countwhile the industry around it contracts
Furthermore just a year and a half following the ECP acquisition ndash again not having yet proven ldquothe deal in the UK is functioning extremely wellrdquo when measured against its stated core purpose ndash LKQ acquired Netherlands-based Sator Holding a distributor of spare parts to the automotive aftermarket industry in Belgium the Netherlands and Luxembourg for a total of $273m Sator was LKQrsquos 3rd largest acquisition ever at the time LKQ pitched the acquisition as an opportunity to ldquoachieve significant synergies and ultimately in the coming years use Sator in our highly successful Euro car parts operations as platforms for further expansion into collision parts or other revenue and profit streams in Europerdquo In the same way that it did ECP ndash as an open-ended opportunity of driving APU for collision repairs currently at 7 in Western Europe vs 37 in the US
In commenting about the acquisition founder and President of ECP Sukhpal Singh Ahluwalia appears to have had its sites set more on acquisitions than on expanding collision-repair APU
In a November 12 2013 LKQ press release announcing that Sukhpal Singh Ahluwalia would be promoted to serve as Chairman of LKQ Europe Singh stated
With time Holstenrsquos assurances of caution and LKQrsquos pitches for open-ended opportunities to drive collision European collision APU have been exposed to be diversions 64
ldquohellip Our goal is also to use this transaction as a springboard for further acquisitions in Europerdquo
ldquohellip Under my Chairmanship we will continue to hunt for new acquisitions maintain relationships with our key suppliers and push
forward to access new markets My vision is to develop a group of European aftermarket companies exceeding $5bn in
annualised revenue within five years The UK alone will have 200 Euro Car Parts branches within three years and we have
ambitious targets for paint collision parts and e-commercersquordquo
Dependency on Acquisitions to Inflate Profits
and Conceal Possible Cumulative Manipulations
LKQ is rapidly accelerating its deal making both in number and in dollar value
LKQ acquired 30 companies in 2012 alone against the backdrop of having acquired a total of 71 companies in the 3 years from 2010-2012 and 171 since its 1998 inception Notably LKQ reported a record 17 acquisitions in just Q4rsquo12
Within the past 2 years LKQ announced 3 of 4 of its largest acquisitions ever
Its acquisition of Keystone Automotive Operations on December 5 2013 is its 2nd largest ever Its acquisition of ECP in Q4 2011 is its 3rd largest ever Its acquisition of Sator in Q2rsquo2013 is its 4th largest ever
65
of Quarterly Deals Completed
Rapid Surge in Acquisitions in Q412
Acquisition Fair Value
Includes $3037m paid for ECP
Includes $273m paid for Sator
$450m paid for Keystone Automotive Operations (announced 1252013)
Dependency on Larger and Larger Acquisitions to
Inc Profits and Conceal Cumulative Problems
2012 change from midpoint
High Low Actual Results - 22813 Actual Initial Guidance Final Guidance
2012 Guidance -22312
Organic Revenue (partsservices) 550 -- 750 Organic Revenue (partsservices) 600 050 050
ECP branch openings included in guidance 20 -- 20 Income from continuing ops $2612 -25 -27
Income from continuing ops $2580 -- $2780 Diluted EPS $087 -25 -28
Diluted EPS (1) $0860 -- $093 CFO $2062 -222 -191
CFO $2500 -- $2800 CAPEX $882 -180 -72
CAPEX $1000 -- $1150
2012 Guidance -42612
Organic Revenue 500 -- 700
ECP branch openings included in guidance 30 -- 30
Income from continuing ops $2620 -- $2820
Diluted EPS $088 -- $094
CFO $2500 -- $2800
CAPEX $1000 -- $1150
2012 Guidance -72612
Organic Revenue 550 -- 700
ECP branch openings included in guidance 30 -- 30
Income from continuing ops $2650 -- $2820
Diluted EPS (1) $089 -- $094
CFO $2500 -- $2800
CAPEX $1000 -- $1150
2012 Guidance -102512
Organic Revenue 600 -- 700
ECP branch openings included in guidance 42 -- 42
Income from continuing ops $2650 -- $2720
Diluted EPS (1) $088 -- $091
CFO $2400 -- $2700
CAPEX $900 -- $1000
(1) Adjusted for 21 stock split on 81712 In April guidance was adjusted to include $003c legal settlement
While LKQ met 2012 revenue and barely missed on EPS guidance it missed dramatically on CFO guidance 2012 CFO came in -19 below revised guidance issued only 2 months before year end on 10252012 even as consolidated inventory turnover rose to 27x in 2012 (vs 25x in 2011)
As previously discussed acquisition accounting inherently and unsustainably boosts CFO LKQ made a record number of acquisitions in Q4 just as a gaping financial hole in CFO exposed itself We believe LKQ may be making acquisitions with the intent of inflating its financials and papering over past accounting manipulations
The cumulative deal size was insufficient to bail the company out but we note that in 2013 LKQ proceeded to raise the stakes making its 2nd
and 4th largest acquisitions since its inception
66
Dependency on Acquisitions to Inflate Profits
and Conceal Cumulative Manipulations
Note Yellow shading indicates
changes in guidance
67
As LKQrsquos Deal Making Gets Progressively
Worse and More Desperate
The recent acquisitions of Euro Car Parts Sator and Keystone Automotive Operations exhibit progressively lower gross margins and have been acquired at multiples that are substantially lower than LKQrsquos own current valuation We believe these acquisitions are partially used as a cover to explain away possible overstatement and deterioration of margins in its core business
$ in mm 2007 2011 2013 2013
Revenues growth(a)
$7269136
$509625
$3740~4-6
$7000--
Gross Margin 448 438 331 Low 30
EBIT margin
$49168
$33466
$26070
----
EBITDA margin
$64989
$38976
$31083
$700100
EPS Accretion(b) -- 015 - $018c $001c --
Purchase Price(c) $811 $347 $272 $450
EVLTM EBITDA 125x 89x 88x 64x
EVLTM Revenues 11x 068x 073x 064x
Source Company financials converted from local currencies(a) Sator growth described as low single digits on investor conference call(b) As stated to investors in the deal announcement(c) ECP deal excludes $76m of earnout payments to be made in 2013 and 2014
Euro Car Parts Sator HoldingKeystone Auto
OperationsKeystone Auto
Industries
68
Even Tuck-in Acquisition Quality
Smells of Desperation
Aside from large announced deals LKQ has continued to acquire various businesses in an opaque and unannounced fashion Below we analyze information found in the footnotes of its SEC filings for trends in its recent deal-making
We find further evidence that its deals are getting increasingly desperate with smaller sized and lower EBIT contribution
$ in mm 2012 YTD 2013 (a) Observation
Number of Deals 30 9 At 25-30 market share it must be harder to find smaller deals
Total Deal Value Goodwill Recorded
$2846 $1976
$411 $261
Goodwill amounting to ~65 of recent deals
Avg Deal Size $95 $45 Avg Deal Size Down 50
Revenue Contribution $1163 $124
EBIT Contribution $110 $05
Implied Avg EBIT MarginContribution
94 40 Avg EBIT Contribution Margin down 540bps indicates lower
quality businesses being added
Source Company financials (Note 9)(a) As the 6 months ended June 30 2013 and excludes the Sator acquisition
69
As Leverage Rises at the Same Time
With margins under persistent pressure growth in the US stagnating and the need to produce increasing revenue and EPS targets LKQ has brazenly pushed into Europe with two recent acquisitions
Recently in an unexpected manner LKQ announced the acquisition of Keystone Automotive Industries for $450m a deal that is currently being financed by short-term borrowing Pro forma for the incremental $70m of acquired EBITDA we estimate the companyrsquos leverage to be 22x DebtEBITDA
$ in
bill
ion
Note Pro forma for debt financed Keystone deal
$601
$956
$1118
$1312
$1762
180x
230x 220x214x
223x
000x
050x
100x
150x
200x
250x
$0
$200
$400
$600
$800
$1000
$1200
$1400
$1600
$1800
$2000
2010 2011 2012 9302013 PF 2014E
Total Debt DebtEBITDA
Deb
tEBITD
A
Inventory Accounting
Is Creative Accounting Inflating Gross
Margins
71
The Art of Inventory Accounting
Inventory Chicanery Tempts More Firms Fools More Auditors Wall St Journal Dec 14 1992
When companies are desperate to stay afloat inventory fraud is the easiest way to produce instant profits and dress up the balance sheet says Felix Pomerantz director of Florida International Universitys Center for Accounting Auditing and Tax Studies in Miamildquo Even auditors at the top accounting firms are often fooled because they usually still count inventory the old-fashioned way that is by taking a very small sample of the goods and raw materials in stock and comparing the count with managements tallies In addition Mr Pomerantz says outside auditors can fail to catch inventory scams because they either trust management too much or fear they will lose clients by being tougherldquo
72
No One Knows What LKQrsquos Sustainable Gross
Margin Rate is Potentially Even Management
httpseekingalphacomarticle1595912-lkq-management-discusses-q2-2013-results-earnings-call-transcriptpage=6ampp=qandaampl=last
Craig Kennison Robert W Baird amp Co Incorporated Research Division
And lastly on gross margin John it fell a little bit year-over-year Im guessing thats largely mix and a little bit of the scrap issue But what do you think the sustainable margin rate would be at the gross levelJohn S QuinnJohn Quinn LKQ Chief Financial Officer and Executive Vice President
Craig I think weve talked in the past that our view is excluding the seasonality that unless something changes things tend to stay the way they are in the short term And we probably did get a little bit negative impact in Q2 because of falling scrap prices We did see a little bit of benefit coming through in the car costs on the domestic side As I had mentioned the demand obviously went down Rob mentioned were buying a little bit better year-over-year so we are trying to see that theory if you will evidence of it coming through in the financials Then we do have a downtick coming with Sator in the short run because theyll be fully consolidated next quarter fourth quarter and so on And we only had them for 2 months So I would expect it to see a little sequential decline as a result of having them onboard to the full quarter (ECP) will as I mentioned earlier just anniversaried now so I dont anticipate any impact from that And you get a little bit sequential impact at having the absence of a decline in the scrap prices Itll help us a little bit in the next quarter
Q2 2013 Earnings Call Aug 01 2013
LKQ Does Not Guide on Gross Margins But When Recently Asked About LKQrsquos Sustainable Margin Rate the CFO
Seemed to Theorize Gross Margins to be Driven by 5 Different Factors and Evaded the Question Wholly
12
3
4
5
The Facts Gross Margins in
Persistent Decline
LKQrsquos margins have been in persistent decline since 2005 while consolidated inventory turns have been relatively stable
We believe there is more deterioration in LKQrsquos gross margin than observable on the Income Statement
Sources LKQ financials CapitalIQ 73
Gross Margins in Persistent Decline Flat Inventory Turns
Gro
ss M
argi
n
Inven
tory
Turn
over
74
Three Accounting Levers Would Enable
Gross Margin Inflation
If LKQrsquos consolidated gross margin is being inflated how would it be able to maintain a stable consolidated inventory turnover For reference from FY 2005 to the LTM period ended 9302013 consolidated inventory turns have been relatively stable
measuring 28x Over the same time period consolidated gross margin contracted disproportionately from 471 to 41
1 Aggressive Inventory Policy Enables Overstatement of Inventory ndash LKQrsquos Salvage amp Remanufactured products inventory accounting policy allows for complete discretion to leave costs on the balance sheet in the form of overstated inventory The recent surge in salvage inventory coupled with gross margin deterioration is consistent with this trend In isolation this policy results in inflated gross margins and CFO and exerts downward pressure on the rate of inventory turnover The generally high level of Salvage amp Remanufactured inventory ndash to which the aggressive policy applies ndash is a high level sign the company may be manipulating its margins
2 Acquisition Accounting Enables Understatement of Acquired Inventories ndash The acquisition fair market value process enables LKQ to understate the values of acquired company inventories and to allocate the plug figure to goodwill The result is that inventory costs which should be future period expenses are instead permanently deferred In isolation this would result in inflated gross margins and CFO and exert upward pressure on the rate of inventory turnover thereby counterbalancing the downward pressure caused by increases in Salvage and Remanufactured inventory and stabilizing consolidated inventory turnover
3 Mis-categorization of One-Time Gains to Directly Inflate Gross Margins ndash Management has shown the willingness to use its discretion to very blatantly inflate gross margins
Furthermore we observe that LKQ has never disclosed or broken out in its financials amounts for inventory writedowns We find this odd for a company that holds inventory such as auto parts that have a finite useful life
We believe LKQrsquos gross margins will continue to decline through 2014 against the backdrop of intensifying competitive pricing pressures and as past accounting overstatements have to be reversed we believe LKQ is at elevated risk of a crippling goodwill write-down
LKQ Appears to be Pulling 3 Accounting Levers in Unison
1) Inflated Profitability Focus on Inventory
ndash Interview w Recycled Parts Distributor
(1) ldquoRecycled Parts Distributorrdquo is an owner of large independent auto parts recyclers75
Prescience Point (ldquoPPrdquo) LKQ reports a 10-11 profit margin Is that the standard for a recycled parts distributor in general
Recycled Parts Distributor (ldquoRPDrdquo) 1 I cant hit those numbers Im not even sure theyre making any money on the recycled business Im in the business its hard to make a profithellip It is very competitive
Prescience Point (ldquoPPrdquo) Do you have some skepticism as to whether LKQ is as profitable as it indicates
RPD Well the first thing I would look at is their (recycled parts) inventories Because theyre easy to manipulate There is no way to take an accurate inventory on recycled parts There is no way to get the right value You can do some estimating How they value their inventory is crucial as inventory gets older its almost worthless
LKQ uses an aggressive policy for accounting for its Salvage and Remanufactured Inventory (refer to next slide) that allows for a high level of discretion to leave costs on the balance sheet in the form of overstated inventory LKQ is likely inflating its gross margin and earnings by failing to record a necessary expense for excess and obsolete inventory Omissions of expensing obsolete inventories result in future margin compression as past overstatements must be reversed earnings will be pressured at the time when the inventory is sold (at a deep discount) or disposed of In isolation a policy of overstating inventory exerts downward pressure on LKQrsquos rate of inventory turnover
LKQ calculates the carrying value of inventory through a formula that applies 1) the historical average of gross margin and 2) expected selling prices1 Using historical margins and future pricing estimates as inputs may paint an unrealistic picture of inventory value As a result the impact of any rapid margin change may be smoothed over time we believe LKQrsquos gross margin is deteriorating faster than presented in its Income Statement
The recent surge in salvage inventory coupled with gross margin deterioration is consistent with this smoothing trend and the overall concern of costs being left on the balance sheet
76
1) Aggressive Inventory Accounting Policy ndash
Enables Overstatement of Inventory amp GM
Prescience Point estimate assumes aftermarket and recycled product categories have equivalent margins Keystone and LKQ margins were ~inline prior to the Keystone acquisition Excludes our estimate for lsquoOtherrsquo inventory turns which was imputed assuming a 45 DSI
Salvage amp Remanufactured Inventory Turns and Consolidated Gross Margin Are Declining
Salvage amp Remanufactured Inventory Has Recently Surged While Gross Margins are Declining
(1) Note for there are no standard prices for many of LKQs products which would give management wide discretion for marking inventory values
Aftermarket and Refurbished Product Inventory Our aftermarket inventory cost is established based on the average price we pay for parts and includes expenses incurred for freight and overhead costs For items purchased from foreign companies import fees and duties and transportation insurance are also included Refurbished inventory cost is based on the average price we pay for cores and also includes expenses incurred for freight labor and other overhead
Salvage and Remanufactured Inventory Our salvage inventory cost is established based upon the price we pay for a vehicle including auction storage and towing fees as well as expenditures for buying and dismantling Inventory carrying value is determined using the average cost to sales percentage at each of our facilities and applying that percentage to the facilitys inventory at expected selling prices The average cost to sales percentage is derived from each facilitys historical vehicle profitability for salvage vehicles purchased at auction or from contracted rates for salvage vehicles acquired under certain direct procurement arrangements Remanufactured inventory cost is based upon the price paid for cores and also includes expenses incurred for freight direct manufacturing costs and overhead
The companyrsquos policy sounds like the Gross Margin or Gross Profit (GP) method used by many retailers for estimating inventories for interim financial statements The GP method is not an acceptable method for determining the year-end inventory balance since it only estimates what the ending inventory balance may be GAAP requires companies that use the GM method to conduct an annual physical inventory count to determine the actual value of inventory at year end as inventory values and physical quantities can decrease over time even if they are not sold Failing to identify and reflect such shrinkage would undermine the reliability and accuracy of a companyrsquos financial statements
Although LKQ does not call its policy the GP method its description indicates the two policies are close to if not identical LKQ may be violating GAAP at every year-end as GAAP mandates taking an annual physical inventory count If we are correct that LKQ could have gotten away with calculating inventory based on these estimates is surprising Like any retailer LKQ is not immune to shrinkage (refer to Thieves Steal Dozens of Car Parts from Local Shop) which undermines the credibility of financial statements in which inventory is based on estimates
Source httpwnepcom20130604thieves-steal-dozens-of-car-parts-from-local-shop 77
1) Aggressive Inventory Accounting Policy ndash
Enables Overstatement of Inventory Balance
LKQrsquos Salvage and Remanufactured Inventory Accounting Policy
78
2) Acquisition Accounting ndash Enables
Understatement of Acquired Inventories
Because LKQ is a serial acquirer that does not disclose specifics of the vast majority of its acquisitions such as deal terms or consistencies of target company balance sheets analyzing its accounting irregularities with precision and across periods is difficult But the surge in Salvage amp Remanufactured inventory the account subject to the aggressive inventory accounting policy serves as a higher level sign that margins and CFO may be manipulated
LKQrsquos acquisition policy gives it a lot of discretion when it comes to accounting manipulations We believe LKQ may be using acquisition accounting to understate values of acquired inventories further inflating its gross margin In isolation this policy would exert upward pressure on LKQrsquos rate of inventory turnover
At the time of any acquisition the acquirer is required by GAAP to present the fair value ndash or present a current value ndash of all the assets and liabilities on the balance sheet When LKQ acquires a company it is required to mark at fair value the inventory acquired undervaluing the inventory would enable the company to counterbalance the rises in Salvage and Remanufactured inventory (previously discussed) keeping consolidated inventory turns flat and inflate gross margins and CFO
As Tyco demonstrated when its frauds were exposed there is plenty of room for manipulation in the fair value process (Refer to paragraph 4 in the SEC settlement announcement)
The strategy would entail marking the value of tangible assets ndash that would otherwise result in future expenses down (eg inventory and PPampE) ndash as low as possible in the name of conservatism and to allocate the balance to goodwill In effect the policy moves future period expenses to the balance sheet as goodwill where they are permanently deferred
To demonstrate at the extreme if the Company books the entire value of acquired inventory as goodwill (implying that it has marked acquired inventory down to a $0 value) then sells that inventory the revenue will flow right down to its bottom line Because there is no cost associated with that inventory the Companyrsquos gross margin on the sale is inflated in this case equating to 100
How would LKQ be able to keep consolidated inventory turns from declining in the face of GM manipulation
Tyco
2) Acquisition Accounting ndash
Interview with Salvage Auto Consultant
We believe it is exactly this lsquocookie jar accountingrsquo the consultant refers to that LKQ is using to inflate GM and CFO and to manage stability in its inventory turns which inherently lends to the appearance of a high quality earnings stream
(1) Salvage Yard Recycled Auto Consultant ndash consults for salvage yards consults for some through the process of being acquired by LKQ79
Prescience Point (ldquoPPrdquo) When people sell to LKQ what prices is LKQ paying What metrics are they using and what are they buying a yard at
Salvage Auto Consultant (ldquoSACrdquo) 1 I do some consulting for people that are selling to LKQhellip If the business meets their (LKQrsquos) criteria it would be rare for them to pay more than 06x sales These days thats the most I have seen them pay 60 of annual sales so they are probably paying less than that and only that amount if profitability is above 10 net capex has been maintained and it fits their customer mix ndash they will not buy a yard unless it sells late model collisionhellip
PP So if a yard sells at 06x sales what is the typical value of inventory being bought
SAC Lets back up and triangulate this Lets take a yard that does $5m and that sells to LKQ for 60 of sales or $3mhellip Understand that this revenue multiple does not include real estate it applies only to the business Letrsquos assume that 80 of the yardrsquos sales are used parts which is typical for the industry so it has $5m in annual sales 80 from used parts implying that $4m of their sales come from used part sales which is $350k per month The inventory values that are sustainable on the balance sheet for an IRS audit are between 2-3 months saleshellip At 3 months sales which I think is more sustainable (than 2 monthsrsquo sales) but probably more than that is needed actuallyhellip but I donrsquot think the IRS would give a yard trouble with 3 monthsrsquo sales in inventory ndash theyrsquod kinda look at it and go on because it implies 4 turns to COGS So 3 x $350k = $10m of inventory That would imply that of the $3m purchase price LKQ paid the inventory purchase component of that is at least $1m
PP OK so they buy a yard for $3m and that yard would typically have $1m in inventory
SAC Id say $1m to $15m is what theyre bringing it in at I think theyre being thoughtful about that number by the way I donrsquot think theyrsquore just applying some percentage method to it I think theyre looking at the reports the turns the gross margins and making some assumptions on how valuable that inventory truly is and how much obsolescence there truly is And theyre bringing it in at a value to avoid taking writedowns later And it may mean they may do some cookie jar accounting on the front end and amortize or replace some of it with goodwill because theyrsquod bake off over a long time
2) Acquisition Accounting ndash Enables
Understatement of Acquired Inventories
According to the lsquoSalvage Auto Consultantrsquo interview on the previous slide LKQ buys recycled auto distributors at a maximum of 60 of annual sales a valuation that applies solely to the operation and excludes the value of real estate Based on his experience LKQ targets companies generating 10 profit margins If we assume the purchase price ranges from 40-60 of sales this would imply
LKQ is paying 4xndash6x net earnings for recycled auto parts distributors
Acquired inventory values make up 33 ndash 67 of the purchase price
From 2003 to 2012 (excluding the impacts of the distressed purchase of Greenleaf) LKQ spent $23 billion on acquisitions If we assume for conservatism that the purchase price allocations to PPampE were all related to real estate buys and back the cumulative PPampE allocation out from the cumulative purchase price we are left with $21 billion spent to acquire the businesses Over the same period $482m of the cumulative purchase price was allocated to inventory or only 227 of the cumulative purchase price ex PPampE
We believe LKQrsquos purchase price allocations are consistent with a policy of having used acquisition accounting to systematically understate acquisition inventory values thereby inflating its financials and successfully stabilizing its inventory turnover
80
2) Acquisition Accounting ndash LKQ at
Elevated Risk of Goodwill Writedown
We believe LKQ is at an elevated risk of a significant goodwill write down
From 2003 to 2012 (excluding the impacts of the distressed purchase of Greenleaf) LKQ allocated ~70 of its aggregate acquisition costs to balance sheet goodwill To date it has amassed an $192 billion of goodwill (and a further $154m to intangibles) relative to a book equity totaling $225 billion goodwill makes up 85 of LKQrsquos book value
By way of comparison Keystone ndash prior to LKQrsquos buyout of the company ndash from April 1 1998 to March 30 2006 allocated only 449 of its aggregate acquisition costs to goodwill in FY 2007 Keystonersquos goodwill amounted to 152 of book value
A goodwill write down for LKQ is not without precedent Jan 1 2002 LKQ wrote off ~57 of its balance sheet goodwill Prior to the write down goodwill had amounted to 72 of book value
That LKQ took a valuation impairment during the post-tech recession in 2002 citing contracting multiples but did nothing of the such during or after the 2008-2009 financial crisis which was the deepest recession the US has endured since the Great Depression does not pass logic In 2009 LKQrsquos closest comparable Greenleaf the 2nd largest wholesale auto parts recycling business in the US was in distress and sold it itself to LKQ for lsquoless than the fair market value of its assetsrsquo enterprise valuations were down across the board as liquidity evaporated
Today the stakes are much higher for LKQ than they were in 2002 The current size of its goodwill account is multiples of its 2002 enterprise value Because we believe that LKQ may be using this account to manipulate margins and CFO we also believe the account appears inflated and impaired as it stands
Sources 10-krsquos for Keystone Automotive Form S-1 for LKQ filed July 28 200381
Previous LKQ Write-Off of ~57 of Goodwill Balance
Valuations for some of the Companys acquisitions have declinedsignificantly since the Company completed its acquisitions during 1998and 1999 due to a number of factors including lower earningsmultiples applied in the valuations of comparable companies As aresult the Company determined that the carrying value of certainreporting units exceeded the fair value of those reporting units atJanuary 1 2002 and recorded an impairment of goodwill in theamount of $49898800 net of tax of $16120700
LKQ Explanation Lower Valuations of Comps
82
3) One-Time Gains to Inflate Gross Margins
We believe LKQ was manipulative in how it booked gains in 2012 from legal settlements awarded in a class action suit against several aftermarket suppliers The awards were booked as two legal settlement gains of $83m and $84m in Q112 and Q212 respectively
The gain classification artificially inflated gross margins The gains were booked as reductions of COGS significantly propping up and blunting a multi-year decline in gross margins In 2012 these gains elevated gross margins from 4095 to 4138 which helped to mask the significant drop from 4257 in 2011
The settlement gains had nothing to do with ongoing COGS While the original source of the lawsuit may have originated from issues related to LKQrsquos inventory account receiving a one-time settlement gain is irrelevant to current period operations and should be treated as one-time non-operating gains in nature In our judgment LKQrsquos classification is exceedingly aggressive
In light of our belief that games are likely being played in LKQrsquos accounting for inventories the nature of managementrsquos choice in this case underscores the potential severity of other manipulations exposed or not
Management also inflated its earnings prospects by including the legal settlement gains in its EPS guidance The Company chose to factor these one-time legal settlement benefits into guidance even while explicitly excluding other one-time gainslosses from guidance
In Q1rsquo12 management raised 2012 EPS guidance due to inclusion of the first legal settlement gain in its revision The entire value of the positive differential over prior guidance was attributable to the one time legal gain
Based on its Q1 10-Q (excerpted below) management knew that an additional settlement gain of near-equivalent value would be recognized sometime in 2012 Even though it also expected to recognize this second gain management chose not to also include it in the 2012 guidance revision that included the first gainhellip
Instead in Q22012 management booked the remaining previously expected settlement gain in the amount of $84m equating to+$04 EPS When they reported Q2rsquo2012 results (issued 7262012) management AGAIN raised its 2012 guidance to $265ndash$282m and $177 ndash $188 And again the positive differential from the prior guidance resulted from including the 2nd previously anticipated gain offset by a fall in scrap prices in the revised numbers In other words guidance would likely have been lowered had LKQ included the 2nd gain in the original guidance revision This seems to indicate they kept it in their back pocket to ensure the next revision to guidance would be a raise
83
Contrsquod
3) One-Time Gains to Inflate Gross Margins
ldquoWe are a plaintiff in a class action lawsuit against several aftermarket product suppliers Our recovery is expected to be approximately $16 million in the aggregate In January 2012 we reached a settlement agreement with certain of the defendants under which we recognized a gain of $83 million which was recorded in Cost of Goods Sold during the three month period ended March 31 2012hellip
We expect to recognize an additional $8 million gain related to settlements with certain other defendants in this lawsuit in the last nine months of 2012rdquo
ndash LKQ Q1rsquo2012 10-Q
84
On the Q2rsquo2012 earnings conference call CFO John Quinn was asked by an alert analyst whether hersquod expected the 2nd settlement gain when guidance had been issued in Q1 he completely dodged the question
But per the previous slide itrsquos written in black and white in the Q1rsquo2012 10-Q Of course he expected it
Craig R Kennison (Robert W Baird amp Co Incorporated Research Division)
ldquoJust to finalize on the guidance In the second quarter you had a $004 legal benefit which is being included in your guidance Did you expect that when you initially gave guidance after last quarterrdquo
John S Quinn
ldquoIt was not included in the guidance last quarterrdquo
ndash LKQ Q2rsquo2012 Earnings Conference call QampA 7282012
Contrsquod
3) One-Time Gains to Inflate Gross Margins
85
Another Red Flag ShippingHandling
Revenue is Diverging from Other Metrics
Source Company filings
LKQ collects revenues related to shipping and handling (SampH) and regularly reports these figures in its 10-K
If LKQ were a healthy growing firm we would expect to see SampH revenue at least stay constant over time with reported revenues COGS and average inventory
However we observe declining trends in LKQrsquos SampH revenue among all relevant financial metrics In particular we observe that SampH revenue to average inventory has declined at the fastest rate in the past six years We interpret this as strong indicator of potential inventory shenanigans
Shipping and Handling Revenue vs Other Financial Metrics
000
050
100
150
200
250
000
100
200
300
400
500
600
700
800
900
2006 2007 2008 2009 2010 2011 2012
of Avg Inventory (LHS) of COGS (RHS) of Total Revenue (RHS)
SampHInventory Has Largest Drop
86
WM and DZ ndash Previous Employers of Many
LKQ Execs amp Accounting Personnel
Flynn Enterprises Common Shareholder
John QuinnVarious Positions
John QuinnSVP and CFO
Mark SpearsController Head Acct
Mark SpearsFormer SVP CFO
Frank ErlainFmr VP Finance
Controller Accountant
Victor CasiniGen Counsel amp
Secretary
Walter HanleyAsso Gen Counsel
Walter HanleySVP Development
Victor CasiniGen Counsel amp
Secretary
Ken FreseAcctrsquog Mgr
Ken FreseAccountant
Ken FreseDir Accounting amp
Inventory
Joe HolstenCOO CEO WM Intrsquol
Joe HolstenFmr CEO Chairman
Frank ErlainVP amp
Controller
Sinon GalvinSVP Revenue Optimization
Sinon GalvinVarious Positions
WM Intrsquol
Fraud Allegations Improper Capitalization of Expense Files for Bankruptcy March 1996
Charged w $17 billion Accounting Fraud March 2002
Stephen EckelDir Oracle Fin Apps
Fmr AcctrsquogAss Contrsquoller
Stephen EckelAssistant Corporate
Controller
Source SEC filings LinkedInreg
Kevin FlynnFormer Director
Kevin FlynnVP Midwest
Vaughn HooksChief Tax Officer
Vaughn HooksVP Taxes
Dan ShoenerVP
Dan ShoenerVP of Finance
LKQ
87
LKQrsquos Director of Inventory Accounting
$17bn Accounting
Fraud
Fraud Allegations
Filed for Ch 11 Bankruptcy
httpwwwlinkedincomprofileviewid=30515327amplocale=en_USamptrk=tyah2amptrkInfo=tas3Aken20freseSource
In light of our belief that LKQ may be inflating its financials and most likely via inventory accounting shenanigans it is worth noting that LKQrsquos Director of Accounting and Inventory is connected with two companies previously alleged to have engaged in accounting manipulations to inflate their stock prices
The Waste Management
Playbook for Paper lsquoProfitabilityrsquo
Used Over and Over Again
89
Waste Management ndash Aggressive Roll-up
Strategy Replicated by LKQ amp Many Others
In 1968 Dean Buntrock Wayne Huizenga (both LKQ founding backers) and Lawrence Beck founded Waste Management (WM) In 1972 Donald Flynn (LKQrsquos founder) joined WM as CFO WM set out to consolidate the highly fragmented garbage hauling industry via an aggressive roll-up strategy Its growth would benefit from the tailwinds of recently issued EPA regulations that posed challenges for mom and pop operators
By the time WM went public in 1971 it had acquired 133 garbage haulers and was generating gt$10m in revenue In the first 9 months of 1972 it had acquired another 133 firms and by the end of the year had generated $72m in revenue From 1971 to 1980 WMrsquos revenue grew at a rate of 48 per year and in 1980 it generated $656m in revenue By 1986 WM had become the largest waste disposal firm in the world
Donald Flynn was given credit as the ldquofinancial geniusrdquo behind Waste Managementrsquos extraordinary growth from the 1970s to the early 1990s in a 1993 corporate history commissioned by the company
In 1976 the SEC alleged that WM founder Huizenga was involved in disguising unlawful political contributions that Waste Managementwas skimming dump fees and using the proceeds to create an illegal slush fund to be used for political contributions Huizenga signed a consent decree barring him and WM from using corporate money for unlawful political contributions and from filing materially false and misleading financial statements There was no admission of wrongdoing
In 1984 WM co-founder Huizenga and John Melk President of WM International sold their stakes in the company and would go on to invest in Blockbuster Entertainment Buntrock remained as CEO until 1996 and Flynn as CFO amp director until 1989 amp 1997 respectively
By the late 1980rsquos and early 1990rsquos WM had undertaken a botched international expansion in a push to become the worldrsquos first global lsquoenvironmental servicesrsquo company ldquoThat ambition led Waste Management to acquire a range of profit-draining businesses The eventual result was angry shareholders turmoil in the board room and a disruptive series of management purges and sudden resignations followed by revelations (in late 1997) of accounting irregularitiesrdquo
In 1998 the troubled company merged with USA Waste Services Inc
In 1997 a WM board-led probe turned up a massive financial fraud that went undetected from 1992ndash1997 involving the inflation of asset values and pre-tax earnings resulting in a $35B charge in 1998 and the largest financial restatement in history at that time The SEC charged WM with perpetrating a massive financial fraud
90
SEC vs Waste Management
In mid-July 1997 a new CEO ordered a review of WMrsquos accounting practices That review ultimately led to the restatement of the Companys financial statements for 1992 through the third quarter of 1997 When the Company filed its restated financial statements in February 1998 it acknowledged that it had misstated its pre-tax earnings by approximately $17 billion and took a $35 billion charge At the time the restatement was the largest in corporate history
From 1994 until 1997 a period at the heart of the perpetuation of the fraud Donald Flynn (LKQrsquos founder) was a Waste Management Audit Committee member and also served as Audit Committee Chairman during a period coinciding with the fraud
According to the SEC former WM CEO Dean Buntrock who would later be LKQrsquos founding backer amp director was ldquothe driving force behind the fraudrdquo and that ldquoHe was the primary beneficiary of the fraud and reaped more than $169 million in ill-gotten gains from among other things performance-based bonuses retirement benefits charitable giving and selling company stock while the fraud was ongoingrdquo
httpwwwsecgovnewsheadlineswastemgmt6htmWaste Management Founder Five Others Sued for Massive Fraud
91
SEC vs Waste Management ndash RE Multi-Year
ldquoMassive Earnings Management Fraudrdquo
Defendants Inflated Profits by $17 Billion To Meet Earnings Targets Defendants Reap Millions in Ill-Gotten Gains While Defrauded Investors Lose More Than $6 Billion
ldquoThe Securities and Exchange Commission filed suit today against the founder and five other former topofficers of Waste Management Inc charging them with perpetrating a massive financial fraud lasting more than five yearsrdquohellipldquoThe complaint alleges that defendants fraudulently manipulated the companys financial results to meet predetermined earnings targets The companys revenues were not growing fast enough to meet these targets so defendants instead resorted to improperly eliminating and deferring current period expenses to inflate earnings They employed a multitude of improper accounting practices to achieve this objectiverdquo
ndash SEC Press Release 3262002
bull On August 29 2005 the SEC announced its fraud action against the accused Waste Management officers would be settled for a total of $308m
bull Buntrock and the others accused neither admitted nor denied wrongdoing
WM Alumni Borrowing from the Old WM
Playbook Over and Over Again
Waste Managementrsquos aggressive rollup strategy gave its management a high level of flexibility to inflate revenue growth and margins and to conceal doing so
A closely-knit group of WM alumni and associates (including LKQrsquos founders) have repeatedly co-invested in and built several companies with each company replicating WMrsquos aggressive roll-up or an acquire-and-build strategy in either case either consolidating or flooding an industry with store openings in an effort to claim the dominant position as fast as possible Some of these companies include Blockbuster Video Discovery Zone Boston Chicken AutoNation Swisher Hygiene and LKQ Many of these companies have either failed to deliver on their sales pitches to investors failed outright or were tarred by allegations of fraud manipulative accounting andor unjust management enrichment
Based on our analysis in the majority of cases these WM alums and associates build businesses with the intent to create the illusion of growth as opposed to focusing on creating value through operational excellence This has prompted some critics to claim that they build companies that have little lasting value
Many involved seem to have learned to begin cashing out just before and soon after building a roll-up large enough to sell to the public at inflated valuations and have gotten very rich in the process
Billionaire Wayne Huizenga (LKQ founding backer and WM co-founder) has been involved in all of the above mentioned companies either as a backer or as an executive or both As he is quoted as saying (regarding some of the roll-ups that went on to fail after he cashed out)
We left these companies in great shape and to be blamed for their problems years after I left is ridiculous
92
Same Players Same Strategy Results
Marred by Accounting Irregularities amp Failures
93
John MelkInvestor
Charged with accounting fraud one
of the largest in history
Aggressive rollup strategy
Discovery ZoneBlockbuster Boston Chicken AutoNation Swisher Hygiene
Dean BuntrockCo-founder CEO
Dean BuntrockInvestor Franchisee
Dean Buntrock Founding Backer Director
Dean BuntrockInvestor Director
Donald FlynnCFO Director -Audit Committee
Donald FlynnInvestor
Donald FlynnFounding Backer Director
Donald Flynn Founder
Donald FlynnCEOChairman
John MelkPresident WM International
John MelkFounding Backer Director
John MelkFounding backer Director
John MelkInvestor Director
Lawrence BeckCo-founder
Lawrence BeckInvestor Franchisee
Lawrence BeckInvestor Franchisee
Peer PedersenDirector
Peer PedersenInvestor Franchisee
Peer PedersenDirector
Peer PedersenInvestor
Scott BeckInvestor COO Vice Chairman
Scott BeckInvestor
Scott BeckCEOChair
Steven BerrardCFO then CEO
Steven BerrardCo-founder Co-CEO
Steven BerrardCEO Director
Victor CassiniGen CounselSecretary
Victor CassiniGen Counsel Secretary
Wayne HuizengaCo-founder
Wayne HuizengaCEOChairman
Wayne HuizengaInvestor (via Blockbuster)
Director
Wayne HuizengaInvestor
Wayne HuizengaFounder Co-CEO
Wayne HuizengaChairman
Wayne HuizengaFounding backer (via
AutoNation)
Bought out by Viacom for $84B
Aggressive acquire-amp-build
strategy
Goes bankrupt Allegations of fraud
Aggressive acquire-amp-build
strategy
Goes bankrupt Accounting gimmicks to obscure financials
Aggressive acquire-amp-build
strategy
$$ Billions Lost Pooling of Interests
acquisition accounting
Aggressive rollup amp acquire-amp-build strategy
Accounting irregularities
Financials restatementAcquisition Accntng Issues
Ongoing SEC inquiry
Aggressive rollup strategy
An array of accounting
red flags amp misrepresentations
Aggressive rollup amp acquire-amp-build strategy
Dean BuntrockFranchisee
Steven BerrardCEO post-Viacom
LKQ
Blockbuster Entertainment
Blockbuster Entertainment proved to be Huizenga and his associatesrsquo most lucrative endeavor and its success would become a core aspect of their pitch to sell investors on subsequent endeavors employing the same strategy (with little success) We believeBlockbuster worked primarily because it operated in a relatively nascent quickly growing space ndash it had the wind at its back allowing for a comfortable margin for error Additionally by executing an extremely aggressive acquire-and-build strategy the companyrsquos key financial metrics were inherently blessed Lastly it was bought out by Viacom prior to falling apart as the result of fundamental forces The associatesrsquo subsequent endeavors however evidence that absent high luck rapid expansion strategies that depend on external capital are customarily near-impossible to manage and that managers are seduced by flexibility in accounting policies
In 1987 Donald Flynn Wayne Huizenga and John Melk (former President WM International) bought a controlling interest in Blockbuster Entertainment Company Blockbuster set out to consolidate the highly fragmented video rental field which was already growing in the double-digit range when Blockbuster came into the picture ndash via the implementation of a rabid buy-and-build strategy
Huizenga who assumed the role of CEO and Chairman built the company in accordance with his modus operandi ndash at a furious pace and with a buy-and-build strategy purchasing smaller chains and constructing new outlets When Huizenga and his associates invested in 1987 Blockbuster owned 15 stores and franchised 20 others From that point on Huizenga opened a Blockbuster store every 17 hours on average for seven years by the time of its 1994 takeout by Viacom Blockbuster had expanded the store count to 3700
Worries that the video rental industry was reaching a saturation point cast doubts on Blockbusters ability to keep opening stores indefinitely One response to this concern was to look to markets outside the United States for growth
In April 1993 Blockbuster supported Donald Flynn by injecting equity capital into his new venture Discovery Zone (DZ) buying a 20 stake (with the option to buy 499) Huizenga and other Blockbuster executives joined the DZ board
In September 1994 Viacom Inc acquired Blockbuster for $84 billion
94
Discovery Zone - Reckless Buy-and-Build
Fraud Allegations Bankruptcy
In July 1992 Donald Flynn (LKQrsquos founder) bought a controlling interest in and assumed the role of CEOChairman of the Discovery Zone an ownerfranchiser of indoor kidsrsquo playgrounds using proceeds from his success with Blockbuster DZ set out to build a leading market position in its space via a reckless acquire-amp-build strategy Unfortunately in its rush to accelerate revenue growth it incurred substantial debts and lost control of its costs landing it in bankruptcy Viacom later sued Flynn in 1997 claiming he was responsible for inflating DZrsquos earnings and misrepresented its financials to secure the sale of his stock to Viacom in 1995 shortly before DZ declared bankruptcy The suit was settled for an undisclosed cash sum
In April 1993 Blockbuster Entertainment injected equity capital into DZ to finance Flynnrsquos expansion plans buying a 20 stake (with the option to buy 499) In June 1993 DZ IPOed
DZ used public capital to expand rapidly Between 1991 and 1995 DZ expanded from 28 locations to 336 locations In September 1994 DZ bought 60 franchised DZ units operated by Blockbuster Blockbuster simultaneously increased its equity ownership in DZ to 499 by exercising its option to purchase additional equity directly from the Flynn family (through DKB Investments LP) on September 29 1994 Viacom acquired Blockbuster
November 1994-March 1995 ndash 3 lawsuits which were later consolidated were filed against DZ as it reported substantial operating losses in Q3rsquo04 and subsequent periods The claims allege DZ and certain directors amp officers including Flynn engaged in fraud intended to inflate DZrsquos stock price such as improperly capitalized preopening expenses failing to timely make public the change in the method of accounting for preopening expenses etc The consolidated complaint was dismissed as a result of DZrsquos Ch11 filing
On February 1 1996 DZ warned shareholders that it may seek bankruptcy protection after January sales fell below expectations the stock collapsed by gt60 on Feb 27 1996 Flynn resigned as DZrsquos Chairman On March 25 1996 DZ filed for Ch11 protection
In 1997 Viacom sued Donald Flynn and his sons claiming they inflated earnings through improper accounting adjustments and misrepresented the companyrsquos financial statements to secure a $25m sale of their personal stock to Viacom and to meet Wall Street Expectations for profitability According to Kevin Forde Donald Flynns attorney following settlement of the matter in 2004 There was a payment of a certain sum for dismissal of all claims and our clients were very satisfied with the settlement
95
This is a question of a company that grew too quickly without the infrastructure to do orderly and profitable growth
ndash Robert Mead Discovery Zone spokesman commenting just after the company files for Ch 11 (March 26 1996)
Boston Chicken ndash Reckless Buy-and-Build
Accounting Gimmickry Bankruptcy
In 1992 Scott Beck and a partner bought a controlling interest in Boston Chicken (BC) a rotisserie-style chicken restaurant with the $120m he made from selling his stake in Blockbuster Video franchise stores back to Blockbuster Entertainment The foundation of BCrsquos business strategy was based on reckless acquire-amp-build strategy This reckless expansion program however would prove to be the root cause of BCrsquos financial demise pushing the company into bankruptcy BC would likely have ended up in bankruptcy much sooner given its cash-degenerative store unit economics had gimmicky accounting not concealed signs of its deteriorating business
6 months after taking over Boston Chicken Beck was overseeing a chain of 53 restaurants in ten states By the end of 1992 Boston Chicken had 83 stores In 1993 Boston Chicken went public accumulating external capital for even more growth In 1993 BC wentpublic the chain nearly tripled in size to 217 stores By the end of 1994 it had 534 stores Management announced its intent to grow the chain at a rate of more than 325 stores annually at least through the end of the decade
Problems surfaced during the summer of 1997 Poor employee training high operating expenses and its lending policy to developer-franchisees had started to take their toll on company finances In 1998 Beck resigned Stores sales continued to falter and by July losses had reached $4371 million
On October 5 1998 BC filed for bankruptcyhellip A noted short-seller commented ldquoThe Chicken has been plucked due to deteriorating store-level economics management turmoil and an outsized amount of debt due to an aggressive expansion plan that had once impressed Wall Street but perhaps never made financial sense
(1) Howard Schilit Financial Shenanigans How to Detect Accounting Gimmicks amp Frauds in Financial Reports (New York Mcgraw-Hill2010) 103-10496
They have the most aggressive expansion program ever undertaken in the restaurant industryldquo
ndash Restaurant Analyst Mike Mueller in Restaurant Business (4101994)
Deceptive Accounting at Boston Chicken Discussed in Financial Shenanigans By Howard Schilit (Excerpts Below)1
Swisher Hygiene ndash Reckless Roll-Up
Financials Restatement SEC Inquiry
In 2004 Wayne Huizenga and Steven Berrard bought and took private public company Swisher International an industrial cleaning business In August 2010 they took Swisher public through a reverse merger renaming the successor entity Swisher Hygiene Swisher was set on consolidating its industry via an aggressive and reckless roll-up strategy Eventually the company announced that previously-issued financials could not be relied upon and that its profitability had been overstated Swisherrsquos Audit Committee is currently probing the companyrsquos acquisition accounting policies as the company contends with ongoing SEC and US Attorney inquiries
Based on an August 2010 Bloomberg News article Huizenga planned ldquoto build Swisher much the same way as he grew Waste Management Blockbuster and AutoNationrdquo and according to Huizenga
Swisher began raising capital and in approximately one year had bought 55 companies an average of more than one per week The Wall Street Journal named Swisher the ldquomost acquisitiverdquo business in North America in 2011 after its buying spree
By March 2012 Swishers Audit Committee announced its 2011 interim financials could not be relied upon and that it would delay the filing of its annual report due to an ongoing internal investigation primarily relating to possible adjustments to (1) the accounting for business acquisitions and (2) the calculation of the allowance of doubtful accounts receivable It concluded that previously issued interim financial statements could not be relied upon and that earnings were inflated for the affected periods According to its most recent 10-Q the SEC and the US Attorneys Office have requested more information from the company and the company faces federal shareholder lawsuits that allege the company artificially inflated its stock price (which collapsed as a result of the announcement)
Further disclosure in a corresponding 8-k shows that Swisher is focusing on its accounting for acquisitions which we believe LKQ may be using to manipulate its accounting as a source of its accounting irregularities
Huizenga resigned from Swishers board in May 2013 Berrard resigned as CEO in August 2012
97
This is another opportunity to build a company that will growhellip Now wersquoll have public capital to do acquisitions helliphelliphelliphelliphellip
You go to a guy and you say lsquoDo you want to sellrsquo If they think they can be a part of something thatrsquos going to grow -- you give them some cash and some stock -- theyrsquoll say rsquoyeshellip They want the stock because theyrsquoll think lsquoOh boy you guys are going to grow this business and Irsquom going to watch my stock growrsquo
During the course of its independent review and due in part to the significant number of acquisitions made by the Company the Audit Committee determined it would be in the best interest of the Company and its stockholders to review the accounting entries relating to each of the 63 acquisitions made by the Company during the year ended December 31 2011
AutoNation ndash Reckless Buy-and-Build
Billions Lost Most Comparable to LKQ
The case study of AutonNation Inc and its predecessor entity Republic Industries (collectively AN) we believe bears many parallels to how LKQs will develop AN tried to consolidate a highly competitive low margin maturelow growth industry but lacked a fundamentally superior way of making money Using public capital it over- expanded and -extended itself losing focus and eventually resulting in billions of dollars of shareholder losses
AN was led by Wayne Huizenga and Steve Berrard as co-CEOrsquos from 1996 ndash 1999 Using an aggressive acquire-amp-build strategy fueled by company shares they set out to consolidate the automotive business by building a one-stop-shop involved in every stage of selling renting and servicing new and used cars They built an empire of new car dealerships car rental agencies and used car megastores selling investors the vision that each one would feed the other to enable the company to generate profits on a vehicle throughout its lifetime
In 1996 amp 1997 it acquired hundreds of businesses mostly relying on the controversial pooling of interests acquisition accounting practice with its earnings likely inflated as a result In less than 2 years time AN was the largest auto retailer in the US with a market cap of gt$12B
They continuously reminded investors of the successes they achieved with Waste Management Inc (Huizenga sold out of WM in 1984) and Blockbuster Inc Per ANrsquos 1995 annual report We want to build a brand just like we did at Blockbuster Wall Street bought into the vision that Huizenga could replicate those successes in consolidating the autos market
The association would prove misleading the growth of WM and Blockbuster were supported by strong secular tailwinds WMs growth was supported by regulatory changes that made it almost impossible for mom and pops to compete Blockbusters growth benefited from a video-rental industry that was growing in the double digit range Like LKQrsquos ANrsquos end markets on the other hand were already mature growing at a very low single digit growth rates ndash ANrsquos success was dependent on stealing market share from existing competitors Similar to LKQ it also lacked the ability to drive down its most basic costs
With high fixed costs and inventory values that depreciated with each passing moment ANs used car business lost significant sums of money and led to investor disappointment its share price fell by gt80 from peak to trough representing a cumulative value of gt$10B
In 1999 Huizenga and Berrard stepped down New CEO Michael Jackson would dismantle the empire via asset sales and spin-offs in an effort to focus the enterprise and improve margins He spun off the rental car business and closed the money-losing used car business resulting in a pre-tax charge of gt$400m He announced AN would suspend further purchases of new-car dealerships and concentrate instead on reducing costs at existing dealerships and announced an increased its stock buyback program by $500m
(1) Paul F Kocourek Steven Y Chung and Matthew G McKenna ldquoStrategic Rollups Overhauling the Multi-Merger Machinerdquo Strategy amp Business second quarter 200098
ldquohellipit found it had no way to drive down the basic cost of the business mdash buying cars Unlike new-car dealers that accept many used vehicles as trade-ins often on favorable terms AutoNation had to compete at auctions with other dealers to build its inventory With relatively high fixed costs a huge inventory
that depreciated in value with every passing week and no sign of improvement AutoNation bailed out and exited the used-car business in late 1999 ldquo1
AutoNation ndash Reckless Buy-and-Build
the Build-Out of an Empire Destined to Fail In May 1995 Huizenga and a relative invested $31m in Republic Industries a public waste disposal company that would allow him to raise public
capital for his next venture Huizenga was appointed CEO and Chairman of the company
The next year Steven Berrard joined him as co-CEO and director Under their leadership the company announced plans to aggressively grow into a completely unrelated industry setting out to build a one-stop-shop for consumers automotive needs via consolidating the fragmented automotive retail and rental markets According to a New York Times article Huizenga said that Republic would cater to anybody who wants to rent lease or buy a car that is brand new or used
Republic expanded aggressively purchasing hundreds of franchised amp used car dealerships and car rental companies with the vision of assembling an empire that would reap economies of scale by involving itself in every stage of selling renting and servicing new and used cars It grew from only one franchised vehicle dealership at the end of 1996 to more than 270 franchised dealerships owned or under contract by the end of 1997 becoming Americarsquos largest automotive retailer in 1 years time
Amongst Republicrsquos major acquisitions was AutoNation USA (ldquoAN USArdquo) a developmental-stage private company owned by Huizenga and Berrard The two co-founded the company in September 1995 intending to grow it into a nationwide chain of used car megastores each of which would offer up to 1000 reconditioned late model low mileage vehicles When Republics intent to acquire AN was announced AN had not yet opened a single megastore and from inception to September 29 1996 AN USA had lost $214m on revenues of $92m with shareholders equity of $307m Republic paid 175m shares of stock for AN USA equating to $250m at its intent to acquire was announced on March 29 1996 but according to a class action complaint filed in January 1997 due to a rise in Republics share price prior to its close the deal was consummated for $643m
In 1996 and 1997 Republic also bought several vehicle rental companies including Alamo Rent-A-Car and National Car Rental System becoming one of the leading vehicle rental companies in the world
In 1998 Republic generated revenue of $16bn up from $56bn in 1996 But when the dust began to settle from a slowdown in its acquisition binge the economics of its business model did not pan out as promised Republic struggled as a car dealership with high overhead low profits and a strategy based on synergies that didnrsquot materialize The AutoNation USA business was a money-losing business operation
Furthermore Republic may have been relying on the acquisition accounting practice known as pooling of interests to inflate its earnings Republic applied this approach for more than half of its deals in 1996 amp 1997 without having used it its thin margins may have been in the red
Republic stock had risen from a split-adjusted $2 when Huizenga bought in to a peak of ~$44 in January 1997 by June 1997 shares had declined ~50 and would continue their descent each year until hitting a low of $5 in December 2000 Its market cap fell from a peak exceeding $12bn by gt80 representing ~$10bn in lost shareholder value
(1) Machan Dyan Crime Garbage and Billboards Forbes November 20 1995 vol 156 issue99
We were looking for a shell [company] and this happened to come up he says It could have been in anythinghellip1
When they think of transportation he said we want them to think about us
AutoNation ndash Reckless Buy-and-Build
New Profit-Focused CEO Dismantles Empire At Republics May 1998 shareholder meeting Huizenga expressed his disappointment about the companys stagnant share price according to an Sun
Sentinel article describing the event he told investors about how the matrix of car dealerships and rental car agencies was going to simultaneously grow sales to perhaps as much as $60 billion in three to five yearslsquo and that costs would be cut to boost profits
Notwithstanding the mounting pressures to remain focused in July 1998 AutoNation invested in Huizengas close associate Donald Flynns new endeavor LKQ Corp (It would cash out of this investment in 2003)
In 1999 under pressure from shareholders and a falling share price Republic began to unwind what it had built over the preceding 4 years streamlining its operations and undergoing management changes
In April 1999 Republic spun off its waste disposal segment and subsequently changed its name to Autonation Inc (ldquoANrdquo)
On September 24 1999 Huizenga and Berrard stepped down from their co-CEO positions Michael Jackson former CEO of Mercedes Benz USA was named new CEO
On September 30 6 days after Jackson was hired Autonation announced the spin-off of the car rental business to focus exclusively on the automotive retail business
On December 13 1999 3 months after taking the helm Jackson killed the concept of used-car megastores announcing the immediate closure of the money-losing chain and the expectation of a pre-tax loss of between $430 ndash $490m Of its 29 megastores 23 would be closed and 6 integrated with new vehicle franchises
According to a December 14 1999 New York Times article
AN also announced it would suspend further acquisitions of new car dealerships instead concentrating on reducing costs at existing dealerships and announced an increased its stock buyback program by $500m In the press release Jackson emphasized his focus on improving profitability and the sustainability of the AN business model
Jacksonrsquos initiatives tremendously benefited the companys efficiency tremendously A 2001 study for USA Today showed that AutoNation increased revenue per employee 82 percent from 1998 to 2002 a greater increase in efficiency than any other large public company in the country
100
ldquoMr Jacksonhellip said that the used car superstores (ie AN USA) were high-cost operations with no chance of ever generating profits proportionate to their risk Even if AutoNation had been willing to invest heavily devote a lot of management time and wait for years he said the cost structure in those stores
would still have been very high leading to marginal operations
Our focus now is on improving our operating margins and on creating a unique and branded customer experience in our new vehicle franchises which are now AutoNations sole business focus By closing the megastores and implementing SGampA reductions we have taken the necessary steps to ensure
the long-term success of AutoNation
LKQ Governance Concerns
102
Key Management Changes Start in
2009-2010 Just As Business is Improving
We believe LKQrsquos core business began slowing in the 2009-2010 which coincided with the APU rate stalling and a stagnation in insurance paid collision repairs Beginning in this period we also observe various changes to key management positions
LKQrsquos CFO Mark Spears also the former Principal Accountant at Waste Management mysteriously resigned in May 2009 despite a record year for the Company Spearsrsquo departure came ~1 year after the SEC issued a comment letter questioning numerous aspects of their business and further comment letters would follow
Subsequent changes have included a new CEO and the departure of the Head of IR and Chief Acctrsquog Officer
Date Executive Role Note
52109 Mark Spears CFO Resigns Press Release
12610 Rob Wagman Promotion from SVP Ops to Co-CEO
Press Release
12610 Joe Holsten Resign CEO joins the Board Press Release
Dec 2010 Sarah Lewensohn Director of Investor Relations
No longer listed as IR contact in PR
22811 Frank Erlain Long time VP Finance Chief Acctrsquog Officer Retires
8K filing
3512 Victor Casini SVP General Counsel resigns from the Board
8K filing
Comment Letters httpwwwsecgovArchivesedgardata1065696000000000008014694filename1pdfhttpwwwsecgovArchivesedgardata1065696000000000010023419filename1pdf
103
Delinkage of Incentives Insiders Dumping
Rewarded to Acquire at Any Cost
Insiders have been selling shares aggressively since the IPO when former owners of acquired companies affiliates and management owned 22 Since 2009 insider selling pressure has intensified and now insiders own less than 2
Managementrsquos annual bonuses are tied to revenue growth and long-term incentives are also tied to Revenue EPS and ROE with the following weightings revenue (475) earnings ($475) and ROE at just 5 These metrics incentive management to recklessly acquire revenue and boost EPS
Beneficial Ownership of Insiders vs Revenue and Free Cash Flow Growth
$ in bn
104
And Sell Stock Shortly After Trumpeting the
Merits and Growth Opportunities at Keystone
SEC Form 4 filings show that key members of the management team made timely open market sales shortly after announcing the acquisition of Keystone Automotive Operations Inc on December 5 2013
These sales directly call into question why management would announce one of the largest deals in company history that ldquosignificantly expands its addressable marketrdquo and then abruptly unload stock Our take is that therersquos an increasing disconnect between shareholdersrsquo best interest and managerial incentives
Executive Role Date Shares Wtd Avg Price Type
Wagman PresidentCEO 12102013 25000 $3371 Open Market
Quinn CFO 1292013 15000 $3362 Open Market
12102013 5000 $3431 Open Market
Holsten Chairman 12112013 6025 $3350 Open Market
of the Board 12132013 25975 $3355 Open Market
Greenspan SVP Operations 12132013 20000 $3388 Open Market
Source SEC Form 4 filings
105
Board Lacking Relevant Experience and
Necessary Focus for Adequate Oversight
LKQrsquos Board is comprised of accomplished business executives but only one non-executive member Mr Foster appears to have relevant experience in the auto parts business
Furthermore no other Board members appear to have experience in the scrap metal or related industrial sectors that would be of value to shareholders
Mr Meister and Mr OrsquoBrien both serve on the compensation committee and serve on a combined 24 other Boards which makes us question there focus and commitment to LKQ
Committee Service Current
Director Age Role Main Background Comp Audit Govern Govt Affairs Other Boards
A Clinton Allen 69 Lead Independent Lab Testing x x 3
Kevin Flynn (1) 45 Seed InvestorDiscovery Zone x Chair 1
Ronald Foster 71 Fmr Chairman of Keystone x x 1
Joe Holsten 60 Chairman Waste Management 1
Blyth McGarvie 56 Consumer Products Chair x 2
Paul Meister 60 HealthcareLife Sciences Chair x 8
John OBrien 69 Insurance x Chair 16
Guhan Subramanian 42 AcademicNo Board Exp x x 0
Robert Wagman 48 President and CEO Auto Products 0
William Webster 55 Payday Lending x x 2
(1) Recently deceased in August 2013 and yet to be replaced
Source Company and public information CapitalIQ
106
Governance Concerns Executive Pay
Also concerning is that the compensation committee constituents appear overcommitted The Chairman Mr Meister serves on 8 other boards while Mr OrsquoBrien is listed as serving on 16 other boards We suspect shareholders interests may not be adequately supervised on the matter of compensation with the big time commitments of its committee members
Management annual bonuses are tied to revenue growth and long-term incentives are also tied to Revenue EPS and ROE with the following weightings revenue (475) earnings ($475) and ROE at just 5 This mix of metrics incentivizes management to recklessly acquire revenue and do whatever possible to boost EPS
The CEOrsquos total comp has increased 374 in the past 4 years while free cash flow is up only 9 over a multi-year horizon cumulative free cash flow after acquisitions is nil Approximately 50 of the comp increase has come in stock but as a whole the management team has been net sellers The 6 member management team reaped $129m in compensation for 2012 (up 83 from 2009 comp of $71m)1
(1) Includes consulting comp and incentive comp related to Mr Holsten
9
82
92
100
101
233
374
0 50 100 150 200 250 300 350 400
Free Cash Flow
Total Exec Comp
Adj EBITDA
EPS
Revenue
Share Price
CEO Comp
Wheres the Beef
Cumulative Growth 2009 - 2012
The Misguided Analyst Community
108
LKQ Enlists Firm Associated with Stock
Pumps for Research Coverage Initiation
ldquoOccasionally we find a critic of RedChip who in a fury of madness mistakenly throws us into the ldquopump and dumprdquo category of investor relations firmsrdquo ndashDave Gentry Founder of Redchip1
(1) httpwwwredchipcomblogindexphpredchippresidentpump-and-dump-is-a-pejorative-term-and-rightly-soUZ05RrW1E0w
httpphxcorporate-irnetphoenixzhtmlc=147311ampp=irol-newsArticleampID=933038amphighlight=Photo Source httpwwwredchipcomaboutaboutmainasppage=management
RedChip a firm commonly associated with having promoted speculative and in many previous instances fraudulent companies was among the first to provide research coverage on LKQ
109
RedChip Denounced by the Investing Public
for Promotion of Frauds
CNBC Faceoff Heat Over Chinese Reverse MergersJan 11 2011
Chinese reverse mergers are continuing to make headlines causing investors to take notice and as a result these special types of mergers have come under increased scrutiny
Tuesday on The Strategy Session David Gentry president and CEO of RedChip Companies a business that promotes small-cap companies including Chinese reverse mergers fired back
CNBCs David Faber and partner continue their discussion about Chinese reverse mergers with Dave Gentry president of RedChip a company that promotes these products
Source httpwwwcnbccomid41024808 Source httpglobenewswirecomnews-
release2013010451458410017068enRedChip-Announces-Exit-From-China-Small-Cap-Sectorhtml
RedChip Announces Exit From China Small-Cap SectorJan 3 2013
RedChip Companies Inc (RedChip) an international small-cap research investor relations and media company today announced that it has exited the China small-cap sector and terminated its contracts with its three Chinese clients We made a decision to close our Beijing office months ago and wind down our China operations stated Dave Gentry President and CEO of RedChip Wall Street has for the most part lost confidence in the financial reporting of US-listed Chinese companies We are concerned that Big Four accounting firms were unable to detect financial fraud in companies like Sino-Forest and Longtop Financialldquo Mr Gentry continued When multi-billion dollar funds like Paulson amp Co and The Carlyle Group with their unlimited resources are unable to detect fraud in their Chinese-based portfolio companies when top-tier investment banks like Goldman Sachs are unable to detect fraud in their Chinese-client companies then I think reasonable investors must take a step back and seriously consider whether the potential rewards outweigh the downside risks of investing in US-listed Chinese companies We simply are not willing to take the risk
Prescience Point was on the forefront of identifying Chinese investment scams and has been wary of paid-for research conducted by RedChip
110
LKQ Has Worked Hard to Garner Broader
Analyst Support as a Wall St Darling
Broker Rating Price Target
Barrington Market Perform $3300
BBampT Outperform $3500
BofaML Neutral $3200
CL King Buy $3200
Deutsche Hold $2700
Great Lakes Hold $3300
Stifel Nicolaus Buy $3300
Ray James Outperform $3200
Baird Outperform $3800
Sidoti Buy $3900
Stephens Overweight $3500
FBR Outperform $4000
William Blair Outperform --
Average Price $3420
Date Conferences Presented
52213 BBampT Stephens William Blair
21213 Raymond James Sidoti BofAML
8112 BBampT
52312 Stephens William Blair Deutsche Bank
41712 Baird Barrington
31512 BofA Merrill Lynch
21512 Raymond James Sidoti
82511 CL King ThinkEquity
71211 Jefferies Canaccord Genuity BBampT
41211 Baird Barrington
3711 Raymond James
2010 Raymond James CLK King BofAML Morgan Keegan Gabelli Deutsche Bank
2009 BBampT RBC CL King Morgan Keegan Deutsche JPM
The chorus of analysts are singing buy buy buy The one independent analyst at WellingtonGreat Lakes Research recently downgraded the stock to Hold
111
While JP Morgan Recently Ditched its
Credit Exposure to LKQ Earlier this Year
JP Morgan was Keystone Automotiversquos long-time banker MampA advisor and lead admin agent for its credit facility JP Morgan continued to serve as LKQrsquos lead banker
JP Morgan resigned from its lead banking position in 2013 and appears to have completely severed all ties to the company The significance of this event must be considered as a leading underwriter in high yield bonds JP Morgan mysteriously did not participate in LKQrsquos $600m bond offering thereby sacrificing underwriting fees The bank also assigned key swap contracts to other parties as another credit risk reducing measure
New Counterparty Notional Amount Maturity Fixed Int Rate
Wells Fargo US$250m 101415 15638
Wells Fargo US$60m 103116 11950
Bank of America C$25m 32416 143
Source httpwwwsecgovArchivesedgardata1065696000106569613000044lkq8-khtm
On April 30 2013 JPMorgan Chase Bank NA (JP Morgan) the counterparty on certain of the Companys floating to fixed interest rate swaps assigned its obligations under its swap contracts to Wells Fargo Bank NA and Bank of America NA JP Morgan is no longer a secured lender under the Second Amended and Restated Credit Agreement and therefore assigned its obligation to Wells Fargo Bank NA and Bank of America NA The Company believes Wells Fargo Bank NA and Bank of America NA are creditworthy to perform their obligations as the counterparty to their respective swap contracts The counterparty notional amount maturity date and fixed interest rate of each of the swaps assigned by JP Morgan are listed below
112
Analystsrsquo Views on the Growth Story
are Completely Wrong
Wall St Analyst Views of LKQ
ldquoOpen Ended Growth Story with the Collision Strategy Just Beginning to Unfold LKQ Can Grow Revenues Organically 5-7 and Earnings 15-20 in the Next Several Yearsrdquo
ldquoSecular growth drivers for LKQ include the annual shift to alternative parts versus OEM parts that continues at a rate of 50-100 basis points annuallyrdquo
ldquoLKQ brings professional processes and technology to an under-managed industryrdquo
ldquoLKQs is a preferred partner for insurance companies small auto recyclers seeking a partnerexit strategy and repair shops
ldquoLKQ is a Premium Mid-cap Growth Storyrdquo
Prescience Point View
Sustainable organic growth is likely overstated and closer to 0 ndash 2 in North America European expansion is fraught with problems and a mature and competitive marketplace Earnings growth appears highly engineered with opaque acquisitions and levers for multiple accounting shenanigans being pulled Adjusted free cash flow after acquisitions is the appropriate yardstick to evaluate LKQ
Share shift has stalled and may reverse OEMs with large balance sheets are subsidizing price matching programs and vehicle fleet age has likely peaked
Early mover advantages have eroded auto recycling is now a global business Rampant customer serviceemployee complaints suggest that LKQ is acquiring just to manage earnings and not build a world class operation
Our research suggests not many want to do business with LKQ but rather they have to Insurance companies are introducing new programs such as PartsTrader that will force price compression
LKQ is a poorly constructed roll-up and should not trade at a premium to leading after market auto recycling or industrial distributors
113
Detailed Aftermarket Auto Part and
Metal Recycling Comparables
($ in millions except per share figures)
Stock 13E-14E LTM Enterprise Value Net Price
Price Ent Revenue EPS EBITDA FCF PE EBITDA Sales Debt Tangible
Name Ticker 1102014 Value Growth Growth Margin Margin 2014E 2015E 2014E 2015E 2014E 2015E EBITDA Book
Aftermarket Auto Parts
AutoZone AZO $49000 $21241 23 27 218 104 165x 148x 103x 99x 22x 22x 20x NM
OReilly Automotive ORLY $13299 $15473 63 131 190 105 197x 173x 112x 104x 22x 21x 08x 23x
Genuine Parts GPC $8345 $13630 52 55 88 64 182x 167x 102x 95x 09x 09x 06x 71x
Advance Auto Parts AAP $11564 $8560 493 278 136 55 166x 143x 71x 64x 09x 09x 01x 76x
Monro Muffler MNRO $5581 $1917 99 271 137 84 279x 220x 135x 119x 21x 19x 16x 151x
Uni-Select UNSto $3000 $1104 -02 140 42 59 119x 110x 97x 93x 06x 06x 61x 45x
Pep Boys PBY $1180 $922 47 1458 57 02 200x 148x 61x 56x 04x 04x 25x 13x
Boyd Group BYDUN $3341 $505 193 670 69 38 220x 213x 97x 95x 07x 07x -01x 11x
Max 493 1458 218 105 279x 220x 135x 119x 22x 22x 61x 151x
Average 121 379 117 64 191x 165x 97x 91x 13x 12x 17x 56x
Min -02 27 42 02 119x 110x 61x 56x 04x 04x -01x 11x
Metal Recycling
Steel Dynamics STLD $1910 $6072 44 699 81 24 135x 112x 70x 62x 08x 08x 33x 31x
Comercial Metals CMC $2056 $3468 -03 542 47 -02 199x 133x 88x 71x 05x 05x 31x 21x
Sims Metal SMSMY $924 $2028 -107 1074 27 21 159x 115x 97x 70x 03x 03x 07x 12x
Schnitzer Steel SCHN $2894 $1118 46 1252 41 07 180x 137x 78x 66x 04x 04x 34x 18x
Metalico MEA $240 $233 47 -1455 34 24 480x 218x 76x 66x 04x 04x 66x 14x
Max 47 1252 81 24 480x 218x 97x 71x 08x 08x 66x 31x
Average 05 423 46 15 231x 143x 82x 67x 05x 05x 34x 19x
Min -107 -1455 27 -02 135x 112x 70x 62x 03x 03x 07x 12x
LKQ Corp LKQ $3300 $11846 188 257 135 61 243x 192x 150x 124x 20x 18x 27x 570x
Source Company financials CapitalIQ calendarized estimates
114
Valuation Premium is Unwarranted Relative
to Aftermarket Parts and Recyclers
Source CapitalIQ company filings Averages exclude LKQ
Price 2014E EPS Price to Tangible Book Value
Enterprise Value to 2014E EBITDA Enterprise Value to 2014E Revenues
00x
20x
40x
60x
80x
100x
120x
140x
160x
PB
Y
AA
P
BY
DU
N
UN
Sto
GP
C
AZ
O
OR
LY
MN
RO
ST
LD
ME
A
SC
HN
CM
C
SM
SM
Y
LKQ
Auto Part Distributors Scrap Processors
Average
00x
05x
10x
15x
20x
25x
PB
Y
UN
Sto
BY
DU
N
AA
P
GP
C
MN
RO
OR
LY
AZ
O
SM
SM
Y
SC
HN
ME
A
CM
C
ST
LD
LKQ
Auto Part Distributors Scrap Processors
Average
00x
50x
100x
150x
200x
250x
300x
UN
Sto
AZ
O
AA
P
GP
C
OR
LY
PB
Y
BY
DU
N
MN
RO
ST
LD
SM
SM
Y
SC
HN
CM
C
LKQ
Auto Part Distributors Scrap Processors
Average
00x
100x
200x
300x
400x
500x
600x
BY
DU
N
PB
Y
OR
LY
UN
Sto
GP
C
AA
P
MN
RO
SM
SM
Y
ME
A
SC
HN
CM
C
ST
LD
LKQ
Auto Part Distributors Scrap Processors
Average
115
Detailed Industrial Distribution Comparables
LKQ often refers to itself as a ldquodistributionrdquo company From this perspective LKQrsquos stock is dramatically overvalued relative to some of the best industrial distribution companies in America
($ in millions except per share figures)
Stock LTM Enterprise Value Net Price
Price Ent EBITDA FCF PE EBITDA Sales Debt Book
Name Ticker 1102014 Value Margin Margin 2014E 2015E 2014E 2015E 2014E 2015E EBITDA Value
WW Grainger GWW $26371 $18396 159 79 377x 182x 108x 99x 18x 17x 00x 35x
Home Depot Supply HDS $2430 $10218 88 -115 180x 116x 117x 99x 11x 10x 73x NM
Wesco WCC $9194 $5545 60 35 151x 141x 97x 88x 07x 07x 34x 23x
MSC Industrial MSM $8540 $5214 183 96 203x 174x 104x 90x 18x 17x -04x 39x
Anixter AXE $9322 $3773 58 25 142x 131x 90x 84x 06x 06x 21x 28x
Applied Industrial Tech AIT $4826 $1955 80 38 165x 138x 91x 78x 08x 07x -04x 26x
Max 183 96 377x 182x 117x 99x 18x 17x 73x 39x
Average 105 26 203x 147x 101x 90x 11x 10x 20x 30x
Trim Avg 97 44 175x 146x 100x 89x 11x 10x 13x 30x
Min 58 -115 142x 116x 90x 78x 06x 06x -04x 23x
LKQ Corp LKQ $3300 $11846 135 61 243x 192x 150x 124x 20x 18x 27x 45x
Source Company financials CapitalIQ calendarized estimates
Trim average exludes maximum and minimum
116
LKQrsquos Valuation Premium is Unwarranted
Relative to Industrial Distributors
Source CapitalIQ company filings Averages exclude LKQ
Enterprise Value to 2014E EBITDA Enterprise Value to 2014E Revenues
Price 2014E EPS Price to Book Value
00x
20x
40x
60x
80x
100x
120x
140x
160x
AXE AIT WCC MSM GWW HDS LKQ
Average
00x
05x
10x
15x
20x
25x
AXE WCC AIT HDS GWW MSM LKQ
Average
00x
50x
100x
150x
200x
250x
300x
350x
400x
AXE WCC AIT HDS MSM LKQ GWW
Average
00x
05x
10x
15x
20x
25x
30x
35x
40x
45x
50x
WCC AIT AXE GWW MSM LKQ
Average
117
LKQ is an Ineffective Roll-up Valuation
Beyond the Sum of its Parts Isnrsquot Justifiable
$ in mm 1998-2013 Acq 2011 Acq May 2013 Acq Dec 2013 Approx Total
Estimated Revenues~ growth
~$37000-2
~$1200~20
~$4000~4-6
~$7000NA
$6000Low single digits
Gross MarginContribution
Low 40 if accurate
~430 ~330 Low 30
Estimated EBITDA margin
$4400120
$91076
$33083
$700100
$650108
Purchase Price ~$2100 $347 (1) $272 $450 gt$2700
EVLTM EBITDA -- Acquired 89x Acquired 88x Acquired 64x At best 70x ndash 100x
EVLTM Revenues -- Acquired 068x Acquired 073x Acquired 064x At best 060x ndash 10x
Comments (2) North American Salvage Assets of
diminished value and potentially impaired
value in Heavy Duty Core business value in serious question LKQ has paid big premiums to book
value for these industrial assets
Growth is artificially high in the near term due to rapid store expansion Growth is
expected to slow dramatically as it reaches its market saturating location limit Also LKQ has yet to demonstrate an ability to
drive APU growth in Europe
(3) Acquired from H2 Partners which also
owns the UKrsquos Unipart Auto (a competitor to
ECP) H2 did not appear to extract synergies
between the two so we are skeptical of LKQrsquos ability to drive value between ECPSator
(4) Keystone was previously bankrupt and up for sale for at least a year until LKQ bought it
LKQ has yet to demonstrate any ability
to extract value here and its key markets are fundamentally different from LKQrsquos existing ones
At 70x ndash 100x EBITDA and adjusting for $17bn of debt
outstanding $107m of cash and 3088m shares os our price target is
~$1000 - $1500share( 50 ndash 70 ) downside LKQrsquos current valuation at 15x is a
substantial premium to the sum of its parts at the upper end of
its historical range and a significant premium to all its
stock trading peers
Source Company financials converted from local currencies(1) ECP deal excludes $339m earnout payment made in March 2013(2) Note that in Q4rsquo12 LKQ mysteriously realigned the reporting structure of its heavy-duty salvage yards and removed it as an operating segment to be included within Wholesale North America (p 7 2012 10K)
(3) H2 Equity Acquires Unipart (UK) httpwwwunipartcoukUserFilesFileUnipartAutomotiveH2pressrelease[1]pdf(4) Platinum Equity Seeks Buyer for Keystone Automotive httpwwwreuterscomarticle20130129keystone-platinum-idUSL1N0AXM6U20130129
Over 160 Acquisitions (Salvage Aftermarket
Reman Heavy Duty Etc) Euro Car Parts Sator HoldingKeystone Auto
Operations LKQ Corp
118
Cheap Money Leverage and Bad Deals =
Valuation Expansion
LKQrsquos long-term Enterprise Valuation to forward EBITDA multiple has trended in the 10x ndash 11x range The recent valuation expansion appears to be a function of expansionary monetary policies favoring stocks the companyrsquos use of more leverage to buy low quality businesses as it expand into Europe and we believe a fundamental misevaluation by market participants of LKQ as an effective roll-up
We believe investorsrsquo are discounting perfect execution and unrealistic growth expectations for a company with significant fundamental challenges and lacking operational excellence as indicated by
An ldquoFrdquo rating by the Better Business Bureau
28 our of 5 ranking on Employee Review site Glassdoorcom
Our conversations with industry participants
500x
700x
900x
1100x
1300x
1500x
1700x
1900x
Enterprise Value NTM EBITDA Long-Term Average
QE Leverage Fueled Valuation Expansion on Bad Acquisitions
LKQrsquos EV NTM EBITDA Historical Valuation
Appendix
120
Does LKQ Have Too Cozy a Relationship
with its Auditors
According to the SEC at the onset of the WM fraud the Company capped Arthur Andersens audit fees However WM advised AA it could earn additional fees for special work mdash eg consulting services Over the succeeding years AAs corporate audit fees remained flat while the fees for special work multiplied
Despite enormous revenue growth and international geographic expansion LKQrsquos audit and total fees paid to auditors have barely increased Oddly enough tax planning fees have fallen at the fastest pace despite LKQ having reported progressively growing international earnings and cash flow
$ in millions
2008 2009 2010 2011 2012 CAGR
Audit Fees $182 $160 $170 $197 $204 29
Audit-Related $005 $009 $030 $028 $012 211
Tax Fees $063 $075 $062 $032 $035 -140
All Other Fees $012 $000 $000 $000 $000 -1000
Total Fees $263 $244 $261 $257 $251 -12
Annual Growth
revenues 694 73 206 324 261 212
employees 55 42 200 492 134 162
Sales by Geography
US 1000 1000 1000 1000 831 78 (1)
Europe 00 00 00 00 169 22(1)
(1) as of LTM 93113 Source Company filings
121
LKQ Received the Coveted ldquoFrdquo Grade
by The Better Business Bureau
httpwwwbbborgchicagobusiness-reviewsauto-parts-and-supplies-used-and-rebuiltlkq-in-chicago-il-12010519
122
Insider Views from Glassdoor
Source httpwwwglassdoorcomReviewsLKQ-Reviews-E20395htmsortsortType=RDampsortascending=false
9
Report Highlights (contrsquod)
Gross Margins (GMs) Appear Inflated as Inventory Turnover is Stable Caught in a massive margin squeeze with used auto parts prices deflating and salvage vehicles rising LKQrsquos GMs have been in persistent decline since 2005 down 590bps while consolidated inventory turns have been relatively stable We believe there is more deterioration in LKQrsquos GMs than observable on the Income Statement We believe LKQ may pull 2 primary accounting levers to manipulate GMs and inventory turns
1 Aggressive Inventory Policy Enables Overstatement of Inventory ndash LKQ uses an aggressive policy for accounting for its Salvage and Remanufactured Inventory that allows for a high level of discretion which management can use to inflate gross margin by leaving costs on the balance sheet in the form of overstated inventory The recent surge in LKQrsquos salvage inventory coupled with gross margin deterioration is consistent with this trend and the overall concern of costs being left on the balance sheet In isolation this policy results in inflated gross margins and CFO and exerts downward pressure on the rate of inventory turnover The generally high level of Salvage amp Remanufactured inventory ndash to which the aggressive policy applies ndash is a high level sign the company may be manipulating its margins We believe LKQ is likely inflating its gross margin and earnings by failing to record a necessary expense for excess and obsolete inventory Omissions of expensing obsolete inventories result in future margin compression
But the surge in Salvage amp Remanufactured inventory the account subject to the aggressive inventory accounting policy serves as a higher level sign that margins and CFO may be manipulated How would LKQ be able to keep consolidated inventory turns from declining in the face of GM manipulation
2 Acquisition Accounting Enables Understatement of Acquired Inventories ndash The acquisition fair market value process enables LKQ to understate the values of acquired company inventories and to allocate the plug figure to goodwill The result is that inventory costs which should be future period expenses can be instead permanently deferred Based on conversations with a recycled auto consultant who consults recycled parts distributors that are selling to LKQ we estimate acquired inventory values make up 33-67 of the acquisition purchase price (adjusted for real estate) From 2003-2012 LKQ has allocated only 227 of the cumulative acquisition purchase price (ex PPampE) to inventory which would be consistent with utilizing this policy In isolation this would result in inflated gross margins and CFO and exert upward pressure on the rate of inventory turnover thereby counterbalancing the downward pressure caused by increases in Salvage and Remanufactured inventory and stabilizing consolidated inventory turnover
We believe LKQrsquos GMs will continue to decline through 2014 against the backdrop of intensifying pricing pressures and as past accounting overstatements have to be reversed we believe LKQ is at elevated risk of a crippling goodwill write-down As of 93013 LKQ carries $21bn of goodwill + intangibles on its balance sheet (47 of Assets 92 of Book Equity) for a collection of industrial assets that would ordinarily sell for little premium to book value We note that LKQ attempts to explain GMs declining as a function of rising costs to acquire salvage vehicles However the Manheim Index peaked in 2011 and has already started to decline When asked for guidance on a sustainable gross margin target LKQ still cannot give investors any clear guidance on the matter and now cites the move into Europe as a complicating factor for the decline
10
Report Highlights (contrsquod)
LKQrsquos Business Strategy and Trajectory Right out of the Waste Management Playbook LKQ was founded in 1998 by Donald Flynn with the financial backing of Dean Buntrock and AutoNation Inc led by Wayne Huizenga Flynn Buntrock and Huizenga were all previously executives of Waste Management Inc (WM) a company notorious for having perpetrated a massive multi-year financial fraud resulting in the largest restatement in corporate history at the time
Following a board-led probe of the companyrsquos accounting practices in 1997 WM was forced to restate its financial statements for the period 1992 ndashQ3rsquo1997 acknowledging that it had misstated its pre-tax earnings by approximately $17 billion and took a $35 billion charge The SEC charged certain executives with financial fraud According to the SEC complaint ldquodefendants fraudulently manipulated the companys financial results to meet predetermined earnings targets The companys revenues were not growing fast enough to meet these targets so defendants instead resorted to improperly eliminating and deferring current period expenses to inflate earningsrdquobull Donald Flynn (LKQrsquos founder) was a Waste Management Audit Committee member from 1994 until 1997 ndash a period at the heart of the perpetuation
of the fraud ndashand also served as Audit Committee Chairman during a period coinciding with the fraud He was previously WMrsquos CFO from 1972 ndash1989
bull Dean Buntrock (an LKQ founding backer amp former director) co-founded WM with Wayne Huizenga (LKQ founding backer) Buntrock was WMrsquos CEO during the period of the fraud and according to the SEC complaint ldquothe driving force behind the fraudrdquo
Waste Managementrsquos aggressive rollup strategy gave its management a high level of flexibility to inflate revenue growth and margins and to conceal doing so for years Many individuals previously associated with Waste Management would go on to build businesses using the WM playbook Specifically a closely-knit group of WM alumni and associates (including LKQrsquos founders) have repeatedly co-invested in and built several companies with each company replicating WMrsquos aggressive roll-up or an acquire-and-build strategy either setting out to consolidating a fragmented industry or flooding an industry with store openings in an effort to build a dominant market position as quickly as possible Some of these companies include Blockbuster Video Discovery Zone Boston Chicken AutoNation Swisher Hygiene and LKQ
Many of these companies have either failed to deliver on their sales pitches to investors failed outright or were tarred by allegations of fraud manipulative accounting andor unjust management enrichment Based on our analysis in the majority of cases these WM alums and associates built businesses with the intent to create the illusion of growth as opposed to focusing on creating value through operational excellence resulting in little to no lasting value
In light of our belief that LKQ is inflating its financials it is worth noting that Discovery Zone another company previously founded by LKQ founder Donald Flynn ndash and in which Dean Buntrock Wayne Huizenga and several other WM alums were associated -- similarly utilized an acquire-and-build strategy It ended up in bankruptcy and was alleged to have engaged in accounting manipulations Many current and former officers ndash notably accounting officers ndash from both WM and Discovery Zone are current and former accounting officers with LKQ (refer to page 13) We also note that in light of our opinion that LKQ may be engaging in inventory accounting shenanigans LKQrsquos Director of Accounting and Inventory was previously employed by both WM and Discovery Zone
11
Report Highlights (contrsquod)
Flawed Corporate Governance Rewards Bad Practice We believe that managementrsquos incentive structure is at the foundation of its failed capital allocation record Management is rewarded by the roll-up strategy with annual bonuses and incentives incentivizing empire-building at any cost Annual bonuses are tied to revenue growth and long-term incentives are tied to Revenue EPS and ROE with the following weightings revenue (475) earnings (475) and ROE (5) There are no stipulations that revenue has to be organic and therefore the management team is perfectly incentivized to acquire and overpay for revenue and game the accounting to inflate profits
The CEOrsquos total comp has increased 374 in the past 4 years while free cash flow is up only 9 in the same period Approximately 50 of the comp increase has come in stock but as a whole the management team has been net sellers of stock Insiders have sold shares aggressively since the IPO when former owners of acquired companies affiliates and management owned 22 Since 2009 insider selling pressure has intensified with insiders currently owning less than 2 Insiders even sold stock recently in Dec 2013 just days after touting the merits of the Keystone deal There is now an almost complete break in the linkage between shareholder interests and executive wealth
In another cautionary sign in an 8-K filing during April LKQ revealed that JP Morgan was no longer a secured lender under its credit agreement JP Morgan had supported both Keystone and LKQ for a number of years While we do not know the why the relationship was severed when a bulge bracket investment bank turns away from a fee generating client of LKQrsquos size there is risk of smoke before fire
Valuation as a ldquoPremium Midcap Growth Storyrdquo is Unwarranted We believe The Streetrsquos view of LKQ as a proven acquirer with an ldquoopen-endedrdquo growth opportunity does not stand the test of logic Trading at 2x 15x and 25x 2014E sales EBITDA and EPS respectively LKQrsquos stock is priced at an unjustified premium to Aftermarket Auto Metal Recyclers and Industrial Distribution peers and fails to reflect few if any of the serious issues our research highlights Specifically our analysis indicates LKQ appears to be engaging in aggressive deal-making and accounting to manufacture GAAP profits and appears to make bad economic business decisions in order to meet predetermined financial targets We believe that management has taken to masking the companyrsquos weakening growth prospects by gaming the accounting to inflate organic growth and that it is dependent on ever-larger acquisitions to keep the growth story alive while insiders cash out As a result of our concerns over the integrity of its financial reporting we believe LKQ is at high risk of having to restate its historical financial results We believe the growth story management has spun to investors is a bill of goods Given concerns about the reliability of its financial statements we believe the company has an intrinsic value of $10 ndash $15 per share close to its book value representing 50-70 downside from the current price
12
LKQrsquos Only Competitive Advantage is Pricehellip
GMrsquos Price Matching Program Is Designed
Specifically to Thwart LKQ
Keystone List Price
OEM price-match 33
discount from Keystone
Price (Keystone list has
generally been 20-25
less than OEM OEM is
now undercutting
Keystonersquos price by 33)
GM reimburses dealer
for loss on part cost
GM pays dealer 14
return on part cost
We have sourced an internal GM dealer document detailing GMrsquos price-matching program ldquoBump the Competitionrdquo We are told it specifically targets LKQ-Keystone GM subsidizes dealers to sell parts (in this case a fender and a door) at levels 33 below aftermarket list prices makes them whole on the loss and pays the dealer an additional guaranteed 14 profit on the cost for the part
Source Felders Collision Parts Inc v General Motors Company et al Complaint Exhibit 4 filed 10122012
Same Players Same Strategy Results
Marred by Accounting Irregularities amp Failures
13
John MelkInvestor
Charged with accounting fraud one
of the largest in history
Aggressive rollup strategy
Discovery ZoneBlockbuster Boston Chicken AutoNation Swisher Hygiene
Dean BuntrockCo-founder CEO
Dean BuntrockInvestor Franchisee
Dean Buntrock Founding Backer Director
Dean BuntrockInvestor Director
Donald FlynnCFO Director -Audit Committee
Donald FlynnInvestor
Donald FlynnFounding Backer Director
Donald Flynn Founder
Donald FlynnCEOChairman
John MelkPresident WM International
John MelkFounding Backer Director
John MelkFounding backer Director
John MelkInvestor Director
Lawrence BeckCo-founder
Lawrence BeckInvestor Franchisee
Lawrence BeckInvestor Franchisee
Peer PedersenDirector
Peer PedersenInvestor Franchisee
Peer PedersenDirector
Peer PedersenInvestor
Scott BeckInvestor COO Vice Chairman
Scott BeckInvestor
Scott BeckCEOChair
Steven BerrardCFO then CEO
Steven BerrardCo-founder Co-CEO
Steven BerrardCEO Director
Victor CassiniGen CounselSecretary
Victor CassiniGen Counsel Secretary
Wayne HuizengaCo-founder
Wayne HuizengaCEOChairman
Wayne HuizengaInvestor (via Blockbuster)
Director
Wayne HuizengaInvestor
Wayne HuizengaFounder Co-CEO
Wayne HuizengaChairman
Wayne HuizengaFounding backer (via
AutoNation)
Bought out by Viacom for $84B
Aggressive acquire-amp-build
strategy
Goes bankrupt Allegations of fraud
Aggressive acquire-amp-build
strategy
Goes bankrupt Accounting gimmicks to obscure financials
Aggressive acquire-amp-build
strategy
$$ Billions Lost Pooling of Interests
acquisition accounting
Aggressive rollup amp acquire-amp-build strategy
Accounting irregularities
Financials restatementAcquisition Accntng Issues
Ongoing SEC inquiry
Aggressive rollup strategy
An array of accounting
red flags amp misrepresentations
Aggressive rollup amp acquire-amp-build strategy
Dean BuntrockFranchisee
Steven BerrardCEO post-Viacom
LKQ
14
WM and DZ ndash Previous Employers of Many
LKQ Executives amp Accounting Personnel
Flynn Enterprises Common Shareholder
John QuinnVarious Positions
John QuinnSVP and CFO
Mark SpearsController Head Acct
Mark SpearsFormer SVP CFO
Frank ErlainFmr VP Finance
Controller Accountant
Victor CasiniGen Counsel amp
Secretary
Walter HanleyAsso Gen Counsel
Walter HanleySVP Development
Victor CasiniGen Counsel amp
Secretary
Ken FreseAcctrsquog Mgr
Ken FreseAccountant
Ken FreseDir Accounting amp
Inventory
Joe HolstenCOO CEO WM Intrsquol
Joe HolstenFmr CEO Chairman
Frank ErlainVP amp
Controller
Sinon GalvinSVP Revenue Optimization
Sinon GalvinVarious Positions
WM Intrsquol
Fraud Allegations Improper Capitalization of Expense Files for Bankruptcy March 1996
Charged w $17 billion Accounting Fraud March 2002
Stephen EckelDir Oracle Fin Apps
Fmr AcctrsquogAss Contrsquoller
Stephen EckelAssistant Corporate
Controller
Source SEC filings LinkedInreg
Kevin FlynnFormer Director
Kevin FlynnVP Midwest
Vaughn HooksChief Tax Officer
Vaughn HooksVP Taxes
Dan ShoenerVP
Dan ShoenerVP of Finance
LKQ
15
Current Capital Structure
LKQ Corp Capital Structure
$ in mm except per share amounts
Stock Price $3300 Metrics LTM 93013 2013E 2014E 2015E
Shares outstanding 3006 EVSales 25x 23x 20x 18x
Net Options $704 avg strike 56 EVEBITDA 193x 189x 150x 124x
RSUs outstanding 26 PriceEPS 333x 306x 243x 192x
Fully Diluted Shares 3088 DebtEBITDA 29x 28x 22x 18x
Market Capitalization $101909
Debt Outstanding Rate Maturity Unused Covenants
Receivables Securitzation $100 101 2015
Term Loan A $4444 308 2018 max lev 35x min EBITDA cov 30x
Revolver (1) $6498 308 2018 $7000 max lev 35x min EBITDA cov 30x
Senior Unsecured Notes $6000 475 2023
Notes Payable $389 180 2018
Other Debt $189 350 NA
Total Debt $17621 361
Less Cash $1073
Total Enterprise Value $118456
1) Assumes $450m Keystone acquisition is fully funded on the revolver as per company press release
Background and Business
Background ndash LKQ Corp
LKQ Corporation (LKQ) a wholesale replacement auto parts distributor was founded in 1998 by Donald Flynn and with the financial backing of Dean Buntrock and AutoNation Inc the automobile retailer founded and led at the time by Wayne Huizenga Flynn would recruit Joseph Holsten to serve as LKQrsquos CEO1 Flynn Buntrock Huizenga and Holsten are all former executives of Waste Management Inc (WM)
LKQ has set out to consolidate the fragmented wholesale alternative auto parts industry by implementing an aggressive roll-up strategy fueling growth through acquisitions Since 1998 LKQ has grown through over 171 acquisitions primarily in the US and Canada becoming the largest provider of aftermarket amp recycled collision auto parts in North America
In May 2006 the company acquired Keystone Automotive Industries Inc (Nasdaq KEYS) a provider of aftermarket vehicle collision replacement parts for $4800 per share in cash or $811m in total enterprise value The deal was the largest in the companyrsquos history
In October 2011 LKQ expanded into foreign markets with the acquisition of UK-based Euro Car Parts Limited this was followed by the April 2013 acquisition of Netherlands-based Sator Holding Using an acquire-and-build strategy to grow in Europe LKQ has become one of the largest European suppliers of mechanical aftermarket auto parts LKQ generated $41B of revenue in 2012 split 7232 between North America and Europe
LKQrsquos business strategy ndash and as later discussed the strategies of numerous other companies founded by the aforementioned and other former Waste Management executives ndash appears taken right out of WMrsquos old playbook The following slide provides a brief elaboration of Waste Managementrsquos strategy and significant events in relation to LKQrsquos founders
(1) International Directory of Company Histories Vol 71 St James Press 2005 17
18
Background ndash
Waste Management Inc 1968-1998
In 1968 Dean Buntrock and Wayne Huizenga (both LKQ founding backers) along with Lawrence Beck founded Waste Management (WM) In 1972 Donald Flynn (LKQrsquos founder) joined WM as CFO WM set out to consolidate the highly fragmented garbage hauling industry via an aggressive roll-up strategy By the time WM went public in 1971 it had acquired 133 garbage haulers and was generating gt$10m in revenue In the first 9 months of 1972 it had acquired another 133 firmsand generated FY 1972 revenue of $72m From 1971 to 1980 WMrsquos revenue grew at a rate of 48 per year reaching $656m in revenue in 1980 By 1986 WM had become the largest waste disposal firm in the world
Donald Flynn was given credit as the ldquofinancial geniusrdquo behind Waste Managementrsquos extraordinary growth from the 1970s to the early 1990s in a 1993 corporate history commissioned by the company
By the late 1980rsquos and early 1990rsquos WM had undertaken a botched international expansion in a push to become the worldrsquos first global lsquoenvironmental servicesrsquo company ldquoThat ambition led Waste Management to acquire a range of profit-draining businesses The eventual result was angry shareholders turmoil in the board room and a disruptive series of management purges and sudden resignations followed by revelations (in late 1997) of accounting irregularitiesrdquo
Buntrock remained as CEO until 1996 and Flynn as CFO amp director until 1989 amp 1997 respectively
From 1994 until 1997 a period at the heart of the perpetration of the fraud Donald Flynn was a Waste Management Audit Committee member the panel responsible for overseeing accounting policies and procedures and also served as Audit Committee Chairman during a period coinciding with the fraud
According to the SEC former WM CEO Dean Buntrock was ldquothe driving force behind the fraudrdquo and that ldquoHe was the primary beneficiary of the fraud and reaped more than $169 million in ill-gotten gains from among other things performance-based bonuses retirement benefits charitable giving and selling company stock while the fraud was ongoingrdquo
Additional source httpwwwsecgovnewsheadlineswastemgmt6htm
In 1997 a new CEO ordered a review of WMrsquos accounting practices The probe turned up a massive financial fraud that went undetected from 1992ndash1997 The fraud involved inflated asset values and profitability resulting in a $35B charge in 1998 and the largest financials restatement in history at that time SEC charges ensued
Background ndash LKQ Corporate Evolution
LKQ began in 1998 to roll-up wholesale recycled auto parts distributors (ie salvage yards) establishing a network of such businesses and serving the collision repair industry By 2003 it had become the largest provider in the fragmented recycled products market in the US
LKQ soon began diversifying through acquisitions of aftermarket recycled refurbished and remanufactured product suppliers and manufacturers and self service retail businesses
In October 2007 LKQ made a transformative acquisition in buying Keystone Automotive Industries Inc becoming the industryrsquos dominant distributor of both recycled and aftermarket products in the US Keystone is LKQrsquos largest acquisition to date costing $811m Keystone generated ~$730m in revenue in 2007 As a result of the acquisition LKQrsquos Parts and Services revenue split shifted from 7129 to 3961 recycled products vs aftermarket products
In 2008 LKQ entered the heavy-duty truck parts recycling industry through various acquisitions The heavy-duty truck parts recycling industry has operating and sales functions that are similar to the auto recycled parts business
In October 2011 LKQ made its third largest purchase in its history expanding to the United Kingdom with the acquisition of Euro Car Parts Holdings Limited (ECP) ECPs product offerings are primarily focused on wholesale automotive aftermarket mechanical products LKQ purchased ECP for a total consideration (including earnouts) of $432m ECP generated $5096m in revenue in 2011 and had grown revenue at a CAGR of 33 from 2009-2011 As of October 2013 ECP operated out of 138 branches supported by a national distribution center
In May 2013 LKQ made its second significant acquisition in Europe buying Sator Holding an automotive aftermarket parts distribution company based in the Netherlands with operations in the Netherlands Belgium Luxembourg and Northern France LKQ bought Sator for $272m (EUR 210m) Sator generated $374m in revenue in 2012 The acquisition expanded LKQrsquos geographic presence in the European automotive aftermarket products market into continental Europe
Sources LKQ 10-K for 2012 10-Q for Q2rsquo2013 2007 Investor Presentation httpwwwlkqcorpcomusenabout-usaspx 19
Acquisition of Keystone Automotive Results in Dominant Competitive Position as a US Aftermarket Parts Distributor
Recent International Expansion with 2 Large-Scale Acquisitions European Aftermarket Parts Distributors
Background ndash LKQ Business Overview
LKQ provides alternative auto parts used for vehicle repairs Alternative auto parts can be used in vehicle repairs in place of new branded auto parts made by vehicle manufacturers or ldquoOEMsrdquo
To be clear buyers of replacement auto parts have 5 options to choose when repairing their vehicles
1 New OEM parts ndash branded auto parts produced by vehicle manufacturers (ie ldquoOEMrdquo)
2 Aftermarket parts ndash new generic parts that were not produced by the OEMs LKQ sources the majority of the aftermarket parts it sells in North America from Taiwan and other Asian countries
3 Recycled products ndash used parts that were originally produced by OEMs LKQ sources its recycled inventories by buying salvaged vehicles at auction then disassembling them at its salvagejunk yards
4 Refurbished parts ndash used products that have been refurbished LKQ processes these from cores obtained from salvage vehicles
5 Remanufactured parts ndash used products that have been remanufactured LKQ processes them from cores obtained from its salvage operations
The value in using alternative parts in place of new OEM parts is that they have traditionally been less expensive
Source LKQ 10-K for 2009 and 2012 20
or any of the below alternative auto parts all of which LKQ provides
For example if you get into an accident and need to replace the vehicle bumper you have 3 options
1 Replace it with a new branded bumper manufactured by General Motors (ie a new OEM part)
2 Get a new generic bumper that was made in Taiwan (ie an ldquoaftermarket partrdquo)
3 Get a bumper from the junkyard (ie a ldquorecycled partrdquo)
Options 2 and 3 are examples of alternative parts There are others discussed below
According to its filings ldquoWe compete with the OEMs primarily on price and to a lesser extent on service and
qualityrdquo In essence LKQ sells nothing more than commodity products which we will show has a diminishing
competitive price value proposition Furthermore numerous customer complaints and an ldquoFrdquo Rating from the
Better Business Bureau (see Appendix) severely calls into question its service and quality performance
21
Background ndash LKQ Revenue Growth
Driven by APU
LKQ sells its products and services primarily to collision repair shops (ie lsquobody shopsrsquo) but insurance companies are its lsquoindirectrsquo de facto customer Pressure exerted by insurance companies on body shops to hold claims costs down by using alternative auto parts resulted in a 30 year-long rising trend in the market share for usage of alternative parts vs OEM parts in collision repairs This trend has been a core pillar of the LKQ growth story since it went public in 2003
This trend is measured by the ldquoAlternative Parts Usagerdquo (APU) or the percentage of total replacement part dollars spent on alternative parts vs OEM parts The APU has risen from 23 in 2000 to 37 in 2012 according to CCC Information Systems provider of the industryrsquos dominant estimate writing platform
LKQ has displayed a chart encapsulating this trend as a centerpiece of its growth story in all of its investor presentations spanning at least the past 5 years until recently the company has excluded it from all of its 2013 presentations As explained later in this report we believe this share shift has stalled and may reverse
Source LKQ 10-K for 2012 LKQ conference calls LKQ 2009 investor presentation
ldquoRecently CCC published their annual crash course publication The industrys average use of alternative parts for collision repairs increased by almost 300 basis points to 35 for 2009 from 32 in 2008 sharply accelerating from the decade-long trend we have seen of 100 basis points per year increaseshellip Reflecting the increase in APU demand for LKQs wholesale parts remain strong during the quarter Our first quarter organic revenue from the sale of parts and services increased 56 even with reductions in miles driven of 16 in January and 29 in Februaryrdquo
ndash Joseph Holsten LKQ Chairman Q1rsquo2010 Earnings Call (4292010)
European Business Growing as a
Percent of Consolidated Revenue
For the past 3 quarters LKQrsquos European Parts and Services business has demonstrated an organic growth rate gt5x that of its North America counterpart over this period Europe grew at an average rate of ~34 vs ~6 in North America
Fueled by organic and acquisition growth (including the relatively large purchase of Sator) as of 9312013 European Parts and Services Revenue had grown to 28 of consolidated revenue from 15 one year prior
(1) lsquoNorth Americarsquo amp lsquoEuropersquo categories represent geographic sources of Parts and Services Revenue
(2) lsquoOtherrsquo Revenue is comprised of sales of scrap metal and aluminum ingots and sows
(3) Revenue shares were computed by annualizing Q3rsquo2012 amp Q3rsquo2013 reportable category revenues
22
LKQ Organic Revenue Growth by Category Europe Growing in Terms of Revenue Contribution123
As of Q3rsquo2012 As of Q3rsquo2013
Organic Parts amp Services Revenue Growth by Geography
High-Level Indications of Fabricated
GAAP Profits Unsustainable Business
Model
LKQ is a classic roll-up fueling growth through acquisitions In the following slides we elaborate on our view that LKQ is an ineffective roll-up undeserving of its rich valuation By contrast an effective roll-up can create enormous value which warrants a rich PE
24
LKQ is a Roll-up Dynamics of
Roll-up Strategies
(1) Paul F Kocourek Steven Y Chung and Matthew G McKenna ldquoStrategic Rollups Overhauling the Multi-Merger Machinerdquo Strategy amp Business second quarter 2000
The bet underlying a rollup is that it can reduce costs and drive growth to create enormous value In fact kindling organic growth ndash driven by a superior value proposition ndash is particularly important as the pace of acquisitions begins its inevitable decline When all goes well we find a cycle of value creation that takes on a life of its own (refer to the figure at lower right)hellip The market rewards this kind of growth with a higher PE ratio which creates the currency for more acquisitions ldquo1
But Wall Street is littered with companies that have failed to properly effectuate it and that have over time destroyed vast amounts of shareholder wealth Among such companies are Waste Management (WM) and AutoNation (AN) In this report we elaborate on our view that LKQ with common backers very much resembles both companies
For example like LKQ AN set out to build a one-stop-shop establishing presence in all aspects of its markets ndash new and used auto sales auto rental and auto servicing It tried to consolidate a highly competitive low margin maturelow growth industry as such ANrsquos success was dependent on stealing market share from existing competitors Like LKQ it also had no ability to drive down its most basic cost ndash that of buying used cars it had to compete at auctions with other dealers to build its relatively huge inventory which depreciated in value at a very fast rate1 Using public capital it acquired hundreds of businesses It used a concerning acquisition accounting methodology pooling of interests (which is no longer allowed by GAAP) that likely inflated its reported earnings In its early stages it was a Wall Street darling ndash touted as a strong buy by sell-side analysts ndash and valued for perfection but reality caught up with its over- expansion and -extension into money-losing endeavors Over a 35 year period its market value of gt$12B fell by gt80 from peak to trough with shareholder losses exceeding $10B
Dynamics of an Effective Rollup
The roll-up strategy inherently flatters earnings and CFO metrics Roll-ups usually show both strong earnings and strong CFO (ie high earnings quality) due to the inherent financial statement mechanics of paying for growth through acquisition outflows (which do not affect earnings or CFO) Cash spent to acquire businesses runs through the Investing section of the Statement of Cash Flows so the acquirer is able to inherit a new CFO stream without any CFO outlay (ie working capital investment) Moreover as the acquirer liquidates the working capital of the acquired company in the normal course of business ndash collecting on receivables or selling inventory ndash it can realize an unsustainable CFO boost that has virtually nothing to do with the performance of its business
As such free cash flow after acquisitions is a key metric for analyzing roll-ups presenting a better picture of the businessrsquos economics In LKQrsquos case it demonstrates that LKQ is an ineffective consistently cash-degenerative roll-up LKQrsquos free cash flow after acquisitions has been negative in 8 of 9 years from 2004-2012 and is negative in the last twelve month period through September 30 2013 a cautionary sign that its strong positive CFO is not what it appears
25
LKQ Appears to be an Ineffective
Consistently Cash-Degenerative Roll-up
Adjusted Free Cash Flow is free cash flow after acquisitions (ie CFO ndash capex ndash acquisition outflows)
LKQrsquos Free Cash Flow Adjusted for Acquisitions LKQrsquos Earnings Quality lsquoAppearsrsquo High
26
High-Level Indications of Fabricated GAAP
Profits Unsustainable Business Model
Furthermore our analysis indicates LKQ may be engaging in aggressive accounting to engineer GAAP profits
Since 2007 LKQ has reported cumulative Earnings and EBIT of $1222m and $2153m respectively
Meanwhile it has burned cumulative free cash flow after acquisitions of -$1623m and raised cumulative net capital of $1625m suggesting it has never earned a cash-on-cash return on invested capital
Put another way the immense wealth generation represented by LKQrsquos historical GAAP profits is not observable in the companyrsquos cash flows ndash it appears to be lsquopaperrsquo wealth generated from accounting gimmickry and enabled by an aggressive roll-up strategy and accounting practices
Capital Raised = equity + net debt + option proceeds Adj FCF = CFO ndash capex ndash business acquisitions
LKQ Appears Increasingly Dependent on External Capital to Generate Any EBIT and Net Income
Reported North America Parts amp Services
Organic Revenue Growth Appears
Overstated Pricing Pressures Intensifying
28
North America (NA) Organic Growth
Appears Overstated
LKQ reported organic revenue growth averaging ~65 from 2008 ndash 2012 and ~6 in the 9 months ended 9302013 for its North America Parts and Services (PampS) business which accounts for ~75 of consolidated PampS revenue These growth rates do not appear reconcilable with trends in its primary driving fundamental factors or representative of LKQrsquos sustainable North America organic growth rate which we believe likely falls in the range of 0-2
Data for insurance claims paid for repairable accidents indicates no growth
Growth in market share of alternative auto parts relative to OEM parts (ie APU) which has risen for 3 decades and served as a primary driver of LKQrsquos organic growth flat-lined from 2010 ndash 2012 and may taper or reverse
For the first time replacement auto parts prices deflated in 2012 as competitive pressures intensified
Market share gains from alternative parts competitors are limited by LKQrsquos market dominance already owning 25-30 of the market market share is LKQrsquos to lose
LKQrsquos North American PampS organic growth rate also appears unhinged from growth rates reported by dominant companies in its primary end market For example the Boyd Group (TSX BYDUN) a large publicly traded multi-service operator in the North American collision repair industry has reported average same store sale growth of just 2 over the same period LKQ has reported organic growth of 65 While Boydrsquos results have shown significant cyclicality LKQrsquos results have been highly consistent and steadily positive ndash such patterns in an otherwise cyclical business are often a hallmark of companies over-concerned with meeting Wall Street estimates and financial transgressions
NA Organic Growth ndash Insurance Collision
Claim Payouts Are Not Growing
According to LKQ ~85 of all repairs are paid for by insurance companies in effect they are the ultimate payee for replacement auto parts
The total value of Insurance Collision Claims paid for Repairable Accident Claims (which excludes Total Loss data) has been stable at ~$28 billion over the past 5 years time This is the result of steadily increasing severity despite a downward trend in accidents and cars repaired
Per the table below the 5yr CAGR for total insurance claims paid for repairable accident claims is 0
29
Source The Romans Group LLC
30
OEM Price-Matching Programs Also Forcing
Aftermarket Auto Part Price Deflation
LKQ has historically benchmarked its prices against OEM parts prices which historically have risen 10 ndash 20 pa
ldquohellip maybe another way to look at that is that we typically price our parts based on new OE partshelliprdquo 1
ldquoWe track OE prices relative to what theyre doing They are still averaging consistently 15 to 2 increases though we tend to follow right on their heels When they raise were right behind themrdquo 2
Recently OEMrsquos have expanded their price-matching programs wherein they are matching alternative parts prices Theyrsquove set their sites on regaining market share previously lost to alternative parts suppliers by empowering their dealersrsquo parts departments to match aftermarket parts prices and are succeeding
We believe these programs have become widespread and much more pervasive than LKQ has led investors to believe
(1) Joseph Holsten former CEO on Q4rsquo2008 earnings call
(2) Robert Wagman CEO on Q3rsquo2011 earnings call
We believe that substantially in excess of 50 of collision parts by dollar amount are supplied by OEMs with the balance being supplied by distributors like us The OEMs are therefore in a position to exert pricing pressure in the marketplace We compete with the OEMs primarily on price and to a lesser extent on service and quality From time to time OEMs have experimented with reducing prices on specific products to match the lower prices of alternative products If such price reductions were to become widespread it could have a material adverse impact on our business
ndash LKQ 10-K for 2012 (Risk Factors)
31
NA Organic Growth ndash OEM Price Matching
Interview With Aftermarket Distributor
Prescience Point (ldquoPPrdquo) Can you describe whats been happening in the industry
Aftermarket Parts Distributor (ldquoAPDrdquo)1 The OEs dealerships are selling below their cost This is happening nationwide It started around 2008
PP How is it impacting aftermarket parts distributors
APD Its put 4 out of business within 200 miles of here and it put me out of business too So thats 5 out of 5 The only one left standing is LKQ
Its a really strange deal I called the 4 companies and asked them why they went out of business and they said it was because of the OEs matching their prices
They are being dis-intermediated by the OEMs Theyre not selling parts either By way of example The gentleman who runs (the local) LKQ-Keystone and I have been competitors ever since Ive been in business He started out w a company that LKQ bought out then he went to another company and LKQ bought them out and now he works for LKQ For this entire time weve been competitors Anytime Ive ever asked him about hows hes doing hes said lsquoWere doing great were just selling shit left and righthellip for about 18 years thats been his answer 3 weeks ago I called him and he says ldquoTalk to any one of my salespeople and they will tell you how badly weve been hurting If you want to know how bad it is talk to anyone of my salesmen we arent selling shitrdquo It was the first time hes ever in his life made a negative comment about his businesshellip
PP Do you think this will continue to impact LKQs ability to generate business in North America
APD If it continues it will put them out of business as far as aftermarket and salvage parts go
(1) ldquoAftermarket Parts Distributorrdquo is an owner of an aftermarket collision parts distributor
OEM Price Matching Interview With
Aftermarket Distributor (Contrsquod)
32
Prescience Point (ldquoPPrdquo) What would motivate the OE dealerships to sell products at a loss How can the dealerships take these losses
Aftermarket Parts Distributor (ldquoAPDrdquo) 1 Because the OEs are paying them (the dealers) back on their money making them whole and then giving them a 14 profit (on top of that)
I have a document that shows how this is happening This specific document relates to a doorhellip GM is telling its dealer to ldquoForget the dealer list price sell it 33 below Keystones list price Well give you all your money back plus a 14 profitrdquo LKQ cannot then step in and offer the part at the same price ($456) it wouldnrsquot be able to sell the part because the body shop prefers the OE part Body shops are happy because they are getting OE parts for aftermarket prices
PP LKQs investor presentation contains a slide demonstrating its lsquoClear Value Propositionrsquo They give specific examples For example a new OEM front door might cost $1300 vs a recycled OEM front door that would cost $800 for a savings of 40 So is that not the case for a new vs recycled products
APD If an insurance company writes the recycled part for $800 the OEM will sell its $1300 (dealer list price) part for $800 and give the dealership a 14 profit
PP The presentation also gives another example for an aftermarket product It says a new OEM fender might cost $200 but an aftermarket fender sells for $160 for a 22 savings Same thing there The OEM will match that price
APD Same deal the dealer will sell it for $160 GM reimburse them for their $40 loss and give them a 14 return on top of that
(1) ldquoAftermarket Parts Distributorrdquo is an owner of an aftermarket collision parts distributor
33
LKQrsquos Only Competitive Advantage is Pricehellip
GMrsquos Price Matching Designed to Thwart LKQ
Keystone List Price
OEM price-match 33
discount from Keystone
Price (Keystone list has
generally been 20-25
less than OEM OEM is
now undercutting
Keystonersquos price by 33)
GM reimburses dealer
for loss on part cost
GM pays dealer 14
return on part cost
We have sourced an internal GM dealer document detailing its price-matching program ldquoBump the Competitionrdquo We are told it specifically targets LKQ-Keystone GM subsidizes dealers to sell parts (in this case a fender and a door) at levels 33 below aftermarket list prices makes them whole on the loss and pays the dealer an additional guaranteed 14 profit on the cost for the part
Source Felders Collision Parts Inc v General Motors Company et al Complaint Exhibit 4 filed 10122012
34
GMrsquos ldquoBump The Competitionrdquo Directed
at Outcompeting LKQ Retaking Lost Share
Launched in 2009 the ldquoBump the Competitionrdquo program from General Motors was designed to capture share of the aftermarket by lowering the price of its OEM replacement parts relative to the competition The initial rebates took the form of fast cash Visareg Award Cardshellip
httpwwwgmrepairinsightscomwp-contentuploads201304Repair-Insights-Q2-2013pdf
httpgmbtccaloginphp
wwwgenuinegmpartscom
35
OEM Price Matching Programs Date to 2009
GM Expanded its Programs in 2013 to Be Even
More Price Competitive Applied to More Parts
Source httpwwwgmlamcomguidelinespartsconquest_bulletinpdfSource Felder Collision Parts Inc vs General Motors Company et all 101212httpwwwmcmlspcomsandboxpodmock2431CollisiontoolsBTC_Calculator_010109v1axls
GMrsquos push to Bump the
Competition Dates back to
2009 amp Recent Evidence it has
become ldquoMore Price
Competitiverdquo
36
Mazdarsquos ldquoCollision Parts AdvantageTMrdquo
Program Also Directed at Displacing LKQ
Launched in 2011 the ldquoCollision Parts AdvantageTM rdquo program was launched by Mazda to warn its customers that aftermarket Like Kind and Quality are generally of lower quality than certified OEM parts The program offers its customers and chosen repair shops the choice to use its OEM parts with a price matching guarantee
httpwwwmazdaserviceinfocomPDFsCollision20Parts20Advantagepdf
OEM Price-Matching
APU Has Flat-Lined Likely to TaperDecline
The OEMs are aggressively reclaiming market share by competing away LKQrsquos price advantage ndash the prime basis of its value proposition Their efforts have successfully halted the three decade-long trend of steadily increasing APU CCC Information Services provider of the dominant estimate-writing platform indicates APU has leveled off over the past 3 years and the share shift may reverse CCCrsquos assessment is that a decline or tapering in APU is likely to materialize
A rising APU was a primary driver of LKQrsquos organic growth We note that every single LKQ investor presentation we have studied dating back to 2007 has given prominence to a slide displaying the decade long trend in APU For the first time ever LKQ has chosen to exclude this slide from its 2013 presentations We believe this change is a tacit admission that this metric no longer figures into the companyrsquos lsquogrowth storyrsquo
Sources LKQ Third Quarter 2012 Investor Presentations CCC Crash Course 2012
37
Collision Replacement Products Market Shift
APU has flat-lined
The Autumn Update to Crash Course 2011 included a discussion on the impact of the aging fleet on parts utilization and showed that the increase in industry-wide non-OE part utilization was driven in large part by the growing share of older model year vehicles where non-OE parts availability is higher As consumers begin to purchase more new vehicles and as more manufacturers provide price-matching programs for their dealers non-OE share of parts dollars (ie APU) will likely taper or decline
ndash CCC Crash Course 2012 published on 372012
38
LKQ Appears To Be Deceiving Investors
About the Current APU Problems
According to CEO Robert Wagman on the Q3rsquo2011 earnings call LKQ claims APU rose from 37 to 38 in 2012
Its own data source refutes that claim As its source for APU data communicated in conference calls and investor presentations LKQ cites the annual results released by CCC Information Services Per Robert Wagman on the Q3rsquo2011 earnings conference call
Discussion What LKQ Tells Investors What LKQrsquos Data Source Says
Alternative Parts Usage (APU) rate
Source Q312 conference call on 10252012 --As mentioned on previous calls we were confident that the historical trend of 100 basis point improvement in alternative part usage would continue in 2012 And today I am pleased to announce that that goal (for a 100 basis point improvement in APU in 2012) was achieved through the end of the third quarter According to CCC Information Services APU now stands at 38
Source CCC Crash 2012 Fall Update published 10172012 --The percent of the total dollars spent on replacement parts that were OEM was essentially flat year-over-year 632 percent at mid-year 2012 versus 631 percent at mid-year 2011(ie From mid-year 2011 to 2012 APU fell from 369 to 368)
CCC Crash Course 2013 report published 3282013 --At the close of 2012 the industryrsquos share of replacement part dollars was split at 63 percent OEM versus 37 percent non-OEM
Assessment of Trend in APU
Source Q312 conference call on 10252012 --As we enter the last quarter of 2012 and prepare for 2013 our outlook continues to be positive Im encouraged by the trends in miles driven the continued growth in APU the recent reduction in vehicle pricing at auctions the strength of Euro Car Parts and the robust pipeline of acquisition opportunities we are witnessing
CCC Crash 2012 Crash Course published on 372012 --The Autumn Update to Crash Course 2011 included a discussion on the
impact of the aging fleet on parts utilization and showed that the increase in industry-wide non-OE part utilization was driven in large part by the growing share of older model year vehicles where non-OE parts availability is higher As consumers begin to purchase more new vehicles and as more manufacturers provide price-matching programs for their dealers non-OE share of parts dollars (ie APU) will likely taper or decline
ldquoAs mentioned on previous calls we were confident that the historical trend of 100 basis point improvement in alternative part usage would continue in 2012hellip According to CCC Information Services APU now stands at 38hellipAs we enter the last quarter of 2012 and prepare for 2013 our outlook continues to be positive Im encouraged byhellip the continued growth in APU helliprdquo
ldquohellip we only get the annual results from the estimating company as to whats happening to the APU trendhelliprdquo
NA Organic Growth ndash APU
LKQ Appears to have Deceived Investors
What LKQ Tells Investors
In its March 2013 Investor Presentation LKQ
claims that APU had reached 38 in
accordance with previous guidance
Sources LKQ 10-K for 2012 March 2013 Investor Presentation (Raymond James 34th Annual Institutional Investors Conference)39
What LKQ Says in its SEC Filings
We believe however that as the insurance
and repair industries continue to recognize
the advantages of aftermarket recycled
refurbished and remanufactured products
the alternatives to new OEM replacement
products will account for a larger percentage
of total vehicle replacement product sales
Since 2008 alternative parts usage has
increased from approximately 32 to
37 of the collision replacement product
market We compete with OEMs on the
basis of price service and product quality
Even as it tells investors APU rose 100 basis points in 2012 LKQ contradicts itself in its own filings with the Securities and Exchange Commission which report that APU did indeed not rise
40
OEM Price-Matching
Parts Price Deflation Began in 2Hrsquo2012
The expansion of OEM price-matching programs have become so expansive that they drove deflation in parts prices in 2012 Industry data source Mitchell International reported a decrease in the indexed price of vehicle parts for its market basket for the first time in the 10 years Mitchell International has been collecting data
Prices began deflating in the second half of the year it is clear that the OEMs are expanding their price matching programs to cover more parts and that the programs are being implemented by more and more dealers
Source Mitchell Industry Trends Report Q2 2013
ldquoFor the first time we saw a decrease in the indexed price for the market basket Loyal readers of the Industry Trends Report will see that the 2012 decrease was not evident when we ran the index report early in 2012 so the decrease was in the latter half of 2012hellip The domestic vehicle parts market basket experienced such a decrease that it offset the moderate increases in the Asian and European market baskethellip So what we are seeing is the impact of the expansion of the competition parts price matching programs from the domestic OEs driving the decrease in the overall indexhelliprdquo
ndash Mitchell Industry Trends Report Q2 2013
41
OEM Price-Matching (Contrsquod)
Parts Price Deflation Began in 2Hrsquo2012
gt50 of LKQrsquos consolidated revenues are generated from the sale of aftermarket parts
According to CCC Information Systems aftermarket parts deflated by 24 in 2012
ldquoBetween 2011 and 2012 hellip the average price paid per replacement part fell by 03 percent Average price paid per replacement part varied by part type with reconditioned parts increasing 20 percent aftermarket parts decreasing by 24 percent and recycled parts increasing 08 percentrdquo
ndash CCC Crash Course 2013 report published 3282013
Source CCC Crash Course 2013
42
State Farm Insurancersquos New PartsTrader
Platform to Drive Even More Pricing Pressure
wwwpartstraderuscom
Insurance companies exert significant influence in the vehicle repair decision since they ultimately pay for the majority of collision repairs of insured vehicles Therefore they are incentivized to drive auto parts prices as low as possible to maximize their profits
In May 2013 State Farm Insurance the largest US auto insurer confirmed the end of the pilot phase and a national rollout of PartsTrader an electronic ordering system to its Select Service direct repair facilities The national roll-out is expected to be completed by 2014
PartsTrader is a web-based collision replacement parts market connecting OEM aftermarket remanufactured specialized and recycled automotive parts suppliers with collision repairers looking for replacement parts
As an online competitive marketplace designed to allow collision shops to make better procurement decisions with information on part quality delivery time supplier reputation and prices PartsTrader is expected to drive more competition amongst alternative parts distributors lowering auto parts prices and serving as another blow to industry organic revenue growth
httpwwwfenderbendercomFenderBenderMay-2013State-Farm-Initiates-PartsTrader-Expansion
43
NA Organic Growth ndash
Not Reconcilable w End Market Growth
LKQrsquos reported NA Parts and Services organic growth rate also appears unhinged from the growth rates reported by companies in its primary North American end market collision repair shops
For example Boyd Group (TSX BYDUN) is a Canada-based company that is consolidating the USCanada collision repair industry as a multi-service operator (MSO) Boyd has 228 locations in five Canadian provinces and 14 US states
According to the Romans Group LLC Boyd is a player in the fastest growing segment of the collision repair industry and is outperforming its peers in that segment1 Specifically
Boyd is a part of ldquothe $20+ million US collision repair segment (which) continues to grow market share and brand relatively faster than other segments of the collision repair industryrdquo and
Boyd has significantly grown its market share relative to the other top $20mm+ operators since 2006
(1) A Profile of the Evolving Collision Repair Marketplace Parts 1 amp 2 The Romans Group 2012
LKQrsquos NA Organic Growth is Too Predictably
Positive and Smooth in a Cyclical Industry
The significance in disparity between LKQ and Boydrsquos organic growth rates defies logic Boyd Group ndash again an outperformer amongst collision repairers ndash has reported organic growth of 2 on average since Q1rsquo2009 with significant variability in its growth rate (61 standard deviation) and has reported negative growth in several quarters on the other hand LKQ has reported organic growth in Parts and Services of 70 on average over the same time period with relatively little variability in its growth rate (standard deviation of just 18) and has never reported a period of negative organic growth
Note that LKQ changed its reporting of organic growth categories on 3313 As a result this analysis runs through 123112 for the purpose of presenting a fair apples-to-apples comparison 44
Source LKQ Press Release Source Boyd Group Press Releases
LKQ Quarterly Parts and Services Reported Organic Growth Rate SSS Growth - Boyd Group - Multi-Service Operator of Collision Repair Shops
00
20
40
60
80
100
120
-100
-50
00
50
100
150Average 20Std Dev 61
Average 70Std Dev 18
The European ldquoGrowth Fantasyrdquo ndash
Short-Term Decision-Making Signals
Desperation to Keep Financials Inflated amp
Meet Guidance Targets
Euro Car Parts ndash
LKQrsquos Largest Contributor to Organic Growth
In Q4rsquo2011 LKQ began expanding into Europe Its acquisition of UK-based Euro Car Parts (ECP) a distributor of mechanical aftermarket parts was made ndash and this was never disclosed by LKQ ndash as the UK aftermarket industry was significantly contracting (which is projected to continue) amounting to a high risk gamble using shareholder capital At the time of purchase ECP operated out of 89 branchstore locations and opened an average of 10 new branches per year in the period 2007-2011
LKQ pitched the purchase primarily as an open-ended opportunity to replicate its North American success
in Europe by driving APU ndash currently at 5 in the UK vs 37 in the US ndash for collision repairs
We believe LKQ is operating ECP to inflate its financials and meet guidance targets at the long term
shareholder expense of entrenchment in a contracting market which will result in a new financial hole
LKQ will predictably seek to plug with more acquisitions (which it has already begun making)
46
Euro Car Parts ndash
LKQrsquos Largest Contributor to Organic Growth
History of Acquisition In October 2011 LKQ acquired Euro Car Parts (ECP) a leading distributor of mechanicalaftermarket parts in the UK for a total of ~$432m (including the paid in full performance-based contingent component) ECP was founded by Sukhpal Singh Ahluwalia who today serves as Chairman of LKQ Europe
LKQ reported that ECP had grown revenue at a CAGR of 30+ from 2009-2011 it generated 2011 revenue of $523m equating to ~15 of LKQ sales
At the time of purchase ECP operated 89 branch locations and opened an average of 10 new branches per year in the period 2007-2011
LKQ pitched the acquisition as
a) an opportunity to continue expanding ECPrsquos branch network and
b) an open-ended opportunity to drive alternative part usage (APU) for collision repairs in the UK ndashwhere APU is ~5 (vs 37 in the US) ndash by educating insurers about the value proposition of alternative parts Per Chairman Joseph Holsten on the October 4 2011 ECP acquisition call
ECP is LKQrsquos single largest driver of reported organic growth LKQ reported ECPrsquos organic growth rate to be 30+ beginning in Q4rsquo2012 and in each quarter since
47
ldquohellip the opportunity is that whereas APU in the United States has moved from really even a sub-20 level when we first formed LKQ to 37 last year the UK market today stands at 3-7 APU utilization raterdquo
ECP ndash 30+ Organic Growth in a
Contracting Industry
In its investor presentations LKQ cites ECPrsquos growth rate and the potential to increase collision-repair APU to imply the acquisition presents a new doorway for growth It cites Datamonitor Group as its source for sizing the expansive UK aftermarket parts industry an lsquo$18bn marketrsquo
LKQ never mentioned that according to the same source (Datamonitor Group MarketLine) the UK aftermarket parts industry was in significant contraction at the time LKQ acquired ECP According to Datamonitorrsquos February 2012 publication the UK industry was expected to contract in 2011 by -58 and is projected to continue contracting
How can a UK-based distributor of aftermarket auto parts regularly report lsquoorganic growthrsquo exceeding 30 as the industry around it is contracting
48
ldquoThe United Kingdom automotive aftermarket sector shrank by 58 in 2011 to reach a value of $172595 millionhellip In 2016 the United Kingdom automotive aftermarket sector is forecast to have a value of $168771 million a decrease of 22 since 2011rdquo
ldquoThe UK automotive aftermarket sector entered a period of decline from 2008 through to 2011 The sector is expected to continue to recover with marginal growth in 2012 before falling into decline once again from 2013 through to the end of the forecast period in 2016rdquohellip It contracted at a ldquocompound annual rate of change (CARC) of -35 between 2007 and 2011rdquo
ldquoThe performance of the sector is forecast to decline further with an anticipated CARC of -04 for the five-year period 2011-2016 which is expected to take the sector to a value of $168771 million by the end of 2016rdquo
ndash Datamonitor MarketLine Automotive Aftermarket in the United Kingdom February 2012
ECP ndash
lsquoOrganic Growthrsquo That Isnrsquot Really lsquoOrganicrsquo
LKQ doesnrsquot define ECPrsquos lsquoorganic growthrsquo in the way investors might expect for a business characterized by sales originating at storefronts for which lsquoorganic growthrsquo would be represented by a same store sales growth
LKQ treats ECP revenue from stores existing for gt1 year and revenue from stores opened during the year as organic revenue1
As such its reported organic growth rate is fueled by opening new ECP branches and the more new branches it opens in a given period the more it can inflate the reported organic growth rate
Because ECP is in the midst of a rapid branch expansion it is able to report lsquoorganicrsquo growth of 30+ even as the broader UK aftermarket parts industry contracts
While ECPrsquos reported growth rate sheds light on the companyrsquos size in comparing data that are fundamentally incomparable it provides little information on the performance and health of its existing branch network Further it obscures LKQrsquos consolidated organic growth metric LKQ uses a different standard for reporting its North America organic growth which according to management only includes salvage yards open and within the system for a year In essence the company is mixing two different measurement approaches and potentially misleading investors
(1) LKQ Earnings conference call for Q2rsquo2012(2) Q3rsquo13 earnings release
49
2
Different measurement approaches
Yet each described as
lsquoOrganicrsquo
50
Throughout 2012 LKQ repeatedly raised guidance for the number of 2012 branch openings from 20 to 30 to 42 ECP has also repeatedly raised guidance for the maximum number of full-sized ECP branches the UK market can absorb from 100 to 120 to 150 to 175 to 200 giving itself more and more room to continue ramping the number of branch locations As demonstrated in the pages to follow these revisions were made with the purpose of meeting PampS revenue growth guidance
The table below summarizes LKQrsquos repeated revisions of guidance for the number of branches to be opened per period and for the maximum number branches the UK market could absorb The slides to follow detail these revisions
SourceGuidance for New
ECP Branch OpeningsGuidance for Maximum ECP Branches UK market could
absorbArticle in The Telegraph
(4212009)90 to 100 total ECP branches to give presence across the UK
ECP Acq call (1042011) 10-12 per year
Q4rsquo2011 earnings call (2232012)
Guidance for 2012 20 openingsChange vs prior guidance +10 openingsTotal store count if guidance met 110 branches
120 full sized branches + 15 satellites
Q1rsquo2012 earnings call (4262012)
Revised guidance for 2012 30 openingsChange vs prior guidance +10 openingsCumulative change vs initial guidance +20 opensTotal store count if guidance met 120 branches
2013E guidance 20-25 openings
150 full sized branches + 25 satellites(175 total)Change vs prior guidance +40
Q3rsquo2012 earnings call (10252012)
Revised guidance for 2012 42 openingsChange vs prior guidance +12 openingsCumulative change vs initial guidance +32 opensTotal store count if guidance met 132
150 full sized branches + 25 satellites(175 total)
Q4rsquo12 earnings call(2282013)
Guidance for 2013 10 openings Change vs prior 2013 guidance -10 openings Total store count if guidance met 142
150-175 full sized branches + 25 satellites(175-200 total)Change vs prior guidance +25Cumulative change vs initial guidance +65
Q1rsquo2013 earnings call(4252013)
Revised guidance for 2013 15 openings Change vs prior 2013 guidance +5 openingsTotal store count if guidance met 147
Q2rsquo2013 earnings call(812013)
175-200 full sized branches + 25 satellites(225 total)Change vs prior guidance +25Cumulative change vs initial guidance +90
Short-Term Decision-Making Signals Desperation
to Keep Financials Inflated amp Hit Guidance
51
In an article published by The Telegraph on 4212009 ECP founder (currently Chairman of LKQ Europe) Sukhpal Singh Ahluwaliastated that he thought ECP could have a total of 90-100 branches ldquogiving it a presence across the UKrdquo
On the October 2011 conference call detailing the ECP acquisition LKQ told investors it had a plan to open 10-12 branches per year for the next few years At that time LKQ appeared more focused on the opportunity to grow collision repair APU in the UK
On the Q4rsquo2011 earnings call LKQ raised the number of branches it had planned to open to 20 in 2012 LKQ stated that the UK could support a total of 120 full-sized stores and 15 smaller lsquosatellitersquo stores so ldquowhen were all said and done we could be in the 135 rangerdquo
SourcePlans for New ECP Branches
Guidance for Maximum ECP Branches UK market could absorb
Article in The Telegraph (4212009)
Sukhpal Singh (from The Telegraph article Sukhpal Singhrsquos Next Goals for Euro Car Parts)I think we could increase to 90 to 100 branches We need to have a presence across the UK
ECP Acquisition Call (1042011)
Robert L WagmanYes we -- right now Craig we have a plan to grow 10 to 12 branches per year for the next few years -- for the upcoming years to complete out the major UK markets major markets that theyre in
Q4rsquo11 Earnings Call(2232012)
Given the market opportunities in the UK and the attractive unit economics at ECPs locations we anticipate ramping up our total branch openings for 2012 to roughly 20
Craig R KennisonRE ECPhellip what do you think that market the UK market can support long-term in terms of the number of stores that you operate
Robert L WagmanWe think the right number is going to be somewhere around 120 Craig to fully develop the network So we think well be at 20 by the end of this year As far as the what the market -- the overall market 120 seems to be the number what well also do is open some satellite stores They wont be full branch stores to support some of the remote areas of the UK So I think when were all said and done we could be in the 135 range
Short-Term Decision-Making Signals Desperation
to Keep Financials Inflated amp Hit Guidance
52
On the Q1rsquo2012 LKQ announced an increase in anticipated store openings to 30 in 2012 which would result in a total of 120 stores (the previously stated market saturating count) Furthermore it announced plans to open another 20-25 stores in 2013 which would take the total number of stores to 140-145 well beyond previous guidance for UK market saturation It followed by raising the ceiling on the number of stores the market could absorb to 150 full-sized stores and 25 satellite branches (175 in total) which would seem to indicate branches in major metropolitan areas being ldquo5 miles or so apartrdquo(akin to a Starbucks model) LKQ would continue to raise from this level the maximum number of stores the UK could absorb
On the Q3rsquo2012 earnings call for the 3rd time LKQ revised higher guidance for the number of branch openings planned to 32 for 2012 (from initial guidance for 10-12) which would make for 132 branches in total LKQ also stated ldquoWeve said we believe the total store count is going to be somewhere around 150 to 175rdquo
SourcePlans for New ECP Branches
Guidance for Maximum ECP Branches UK market could absorb
Q1rsquo12 Earnings Call(4262012)
And due to favorable market conditions and ECPs managements proven ability to effectively and efficiently open branches we anticipate accelerating new branch openings to 30 in 2012 which is 10 more than the 20 we were anticipating on our last call
Robert L WagmanSo we believe well get to roughly 120 locations by the end of this year if all goes to plan We want to add probably another 20 or 25 next year which adds to about 150
Unknown AnalystWould you tell us just a little bit there about ECP and talk about the footprint I mean with the growth expansion-- if you look at how far these are apart any chance of cannibalizing in those markets
Robert L WagmanhellipWe think that surely branches in major metropolitan areas can be 5 miles or so apart So theres not necessarily cannibalization its just better service for the customershellip And then on the last call we talked about these ancillary locations not full sized branches Our average branch over there is a 10000-square foot branch These would be smaller offshoots in more rural areas That may be another 20 to 25 locations So when this is all said and done well be at about roughly 175 locations in the UK Cannibalization there is a slight -- when you put one 5 miles apart from each other we do move some of the revenue from one branch to the other Butagain because of the better service levels we can provide we do see an uptick in the revenue pretty quickly
Q3rsquo12 Earnings Call (10252012)
During the quarter we opened 10 new branches in the UK bringing our total branch count to 120 Since the acquisition of ECP in early October 2011 we have opened 31 branches surpassing the target number of 30 I mentioned on the last call Given that market conditions in the UK combined with the continued success of ECP we have approved an additional 12 new branch openings for the fourth quarter bringing our total target to 132 branches by year-end
John R LawrenceRob would you take a -- if you look at ECP overall out for the next 12 to 18 months -- how do you look at allocating CapEx dollars Obviously youre doing that with some more stores but longer term that marketplace -- the viability to spend more capital over there
Robert L WagmanWeve said we believe the total store count is going to be somewhere around 150 to 175 We believe that number is still to be true And in fact we may actually be able to go a little bit above 175 with those satellite stores to feed the more remote areas
Short-Term Decision-Making Contrsquod
53
On the Q4rsquo12 call LKQ indicated that the 12 stores opened through January 2013 were pulled forward from the 25 it had projected to open in 2013 and that it would take a break from opening new stores until Q2rsquo2013 at which point it could have evaluated the progress of the newly opened stores There was a deceptive change in language in guidance for possible total store count calling for 150-175 full sized branches andan additional 25 satellites (200 in total) (Recall that on the Q1rsquo12 call then reaffirmed on the Q3rsquo12 call they guided that the market could absorb to 150 full-sized stores and 25 satellite branches (175 in total)
On the Q1rsquo2013 earnings call LKQ announced plans to open another 15 in Q3 and Q4 2013 which would make for a total of 147 ECP branches (against initial guidance that the UK could absorb 120)
On the Q2rsquo2013 call in August 2013 LKQ again raised the limit on its estimate for the total number of stores the UK could absorb to 175-200 full sized branches (from 150-175 before that 150 before that and 120 before that)
Then on November 12 2013 in a press release announcing ECPrsquos founder had been promoted to serve as chairman of LKQ Europe he stated ldquoThe UK alone will have 200 Euro Car Parts branches within three yearsrdquo
SourcePlans for New ECP Branches
Guidance for Maximum ECP Branches UK market could absorb
Q4rsquo12 Earnings Call(2282013)
Robert L WagmanDuring the fourth quarter we opened 10 new branches and we opened 2 additional branches in January bringing our total branch count to 132hellip hellipWith the 12 we did in Q4 originally scheduled for 2013 so we pushed them in 2012 So as John said were going to reevaluate this in Q2 but I would expect if we feel comfortable well add another 10 in 2013 to fill up to get to 142 with still some growth for 2014 and 15 as well
Robert L WagmanhellipWere still standing by our projections of 150 to 175 what we call Tier 1 ECP locations and an additional 25 or so Tier 2 the smaller or remote markets
Q1rsquo13 Earnings Call (4252013)
Now turning to Euro Car Parts We continue to be impressed with the performance of Euro Car Parts and its ability to capture market share In Q1 ECP achieved strong organic revenue growth of 321 With the continued performance in ECPs financial results and the strength of ECPs management team I am pleased to announce that we have approved an additional 15 new branches for 2013 that are scheduled to open in the third and fourth quarter of this year
Q2rsquo13 Earnings Call(812013)
John S Quinnhellip Weve targeted 15 for the balance of this year That will take us up to circa 147
John S Quinn We think the right number is probably somewhere in 175 to 200 for what we consider a full branch and then there will be some satellite opportunities in addition to that Over time as we grow that were going to have to look at the infrastructure associated with that regional hubs and the 2 main central hubs
LKQ PR announcing leadership change
Sukhpal Singh Ahluwalia lsquoI have never been more hungry excited or determined to maximise our potential for the next decade and beyond The UK alone will have 200 Euro Car Parts branches within three years and we have ambitious targets for paint collision parts and e-commercersquo
Short-Term Decision-Making Contrsquod
12282012 Right before 2012 Yr End ldquoOur Biggest Sale Ever Up to 45rdquo We have a Sale on at the moment where you can save up to 45 off on Car Partsbut it doesnt last long - must end midnight 1st Jan so hurry
8162012 rdquoMid Month Madness 30 off Car Parts Selected Car Partsrdquo Owning to popular demand (everybody likes a big juicy discount) ndashwersquove decided to bring the big daddy back ndash yes thatrsquos 30 off Car Parts as well as ALL Engine oils
9272012 Right before Q3rsquo12 Ended ECP ran a promotion ldquoThe Boss is Away 31 off Promo Code InsidehellipEnds Sundayrdquo Our biggest ever discount offered on almost ALL car partshellipcash in before the boss is back
bull In 2012 ECP started heavy price discounting of parts across the board Most discounts touted up to 30 off often on all products sold By the end of the year the savings discounts reached up to 45 off
bull Many of these sales appeared right at the end of the quarter in what appears to be an attempt to juice results ahead of reporting to investors
httpwwwgolfgtiforumcoukindexphptopic=2361380 httpwwwgolfgtiforumcoukindexphptopic=2386450 httpwwwgolfgtiforumcoukindexphptopic=2461350
Short-Term Decision-Making Steep
Discounting to Hit Numbers in 2012
54
5242013 ndashrdquoThe Online Bank Holiday Sale Up to 50 Off Everythingrdquo
ldquoItrsquos BACK again ndash Up to 50 OFF EVERYTHING No promo code required Must End Midnight Monday 27th Mayhelliprdquo
9272013 Before the end of Q3rsquo13
ldquoEnd of Summer Clearance up to 50 off Everything Onlinerdquoand you donrsquot need a promo code as current prices reflect the discount by defaultrdquo
3282013 Before the end of Q1rsquo13
ldquoOur Biggest Ever Sale ndash Up to 50 off Everythingrdquo
55
httpwwwgolfgtiforumcoukindexphpPHPSESSID=rffknoatjiinf0n2nuhh828uv6amptopic=2512620
httpwwwgolfgtiforumcoukindexphpPHPSESSID=rffknoatjiinf0n2nuhh828uv6amptopic=2542750
httpwwwgolfgtiforumcoukindexphpPHPSESSID=rffknoatjiinf0n2nuhh828uv6amptopic=2598690
In 2013 discounts increased noticeably from 30 to upwards of 50 off Each promotion is touted as its ldquobiggest sale everrdquo ECP has continued its practice of running promotions right towards the end of the quarter
Not one time has LKQ attributed such discounts as a driver of its persistently declining gross margin
With Even Bigger Promotions in 2013
On the Q4rsquo2011 call (22312) LKQ guided for 20 stores to be opened in 2012 and guided for
2012 Parts and Services organic revenue growth 55-70 (Guidance for PampS organic
growth includes the impact from anticipated ECP store openings)
On the Q1rsquo2012 earnings call (42612) guidance was revised lower to 50-70 even as
LKQ raised the number of anticipated 2012 store openings by +10 to 30 indicating the
intent to make up for unanticipated weakness in North America with new branch
openings LKQ stated that in order to meet 2012 guidance certain anticipated tailwinds
would have to materialize specifically stating APU would likely rise from 37 to 38
On the Q3rsquo2012 earnings call (102512) LKQ raised the number of anticipated 2012 store
openings by +12 to 42 and raised the lower end of the range for organic growth by 50bp to
60-70 In Q3 the opening of new ECP branches alone accounted for 40 of Parts and
Services organic growth
The increase in the number of stores openings during Q4rsquo12 resulted in ECP growing to
account for 75 of LKQrsquos Q4rsquo2012 PampS organic growth by our estimates enabling it to
report 6 organic revenue growth and meet the low end of the guidance range
In sum LKQ stated a reliance on APU rising to 38 to meet the initially released 2012
guidance levels although LKQ appears deceptive with investors in claiming this APU target
was met the data released by its information source refutes its claims reporting that at the
end of 2012 APU was 37 unchanged from 2011 This left LKQ reliant on other sources of
organic growth to meet guidance
In 2012 LKQ juiced its organic growth rate by opening double the number of ECP
branches initially guided for indicating LKQ made strategic decisions related to ECP
openings at the expense of long-term value creation to inflate its financials and hit
guidance 2012 guidance for organic revenue growth 56
ldquoWe included in the internal growth and the earnings guidance the new ECP locations opened to date and planned for the balance of the year Rob mentioned that we plan to increase the number of branch openingshellip To reach our guidance were obviously assuming that the rest of the year gets better and we do think there are some tailwinds to help us in that regard In 2011 we saw alternative part usage rate in the industry of 37 Based on what were seeing in the market today we believe that in 2012 well see that rate increase to at least 38
How Did This Play Out In Pacifying
Wall St Estimates
ECP ndash lsquoOrganicrsquo Growth Contribution to LKQ
Parts and Services Org Growth is Now gt50
ECPrsquos reported organic growth rate has grown to account for gt50 of LKQrsquos consolidated Parts and Services organic growth rate
ECPrsquos organic growth rate is a short-term phenomenon
As ECPrsquos reported organic growth rate begins to fall and converge with the industry rate of growth it will result in yet another large financial hole LKQ will predictably seek to plug
(1) Q2rsquo2013 ECP SSS adjusted for 2 extra selling days SSS provides little insight as it is inflated by the revenue ramp of newly opened branches which take 3 years to mature
(2) NA organic growth contribution is a PP estimate imputed by backing out organic growth from ECP from reported Parts and Services organic growth 57
ECP Reported Organic Sales Growth1 ECP Contribution to Parts and Services Organic Growth2
PP model Uses 2006 as anchor year and is based on the number of per year ECP branch openings since 2006 and our projection of store builds through 2016 which reflects LKQrsquos Europe Chairmanrsquos expectation of 200 stores within 3 years Assumes that at maturation each store generates $54m ECPrsquos average reported revenuestore in the period 2010-2012 ECP generally experiences the most significant growth benefit from a new branch in the year of first generating sales and benefits continue to accrue through a 3 year store maturation period (LKQ earnings conference call for Q3rsquo2012)
ECP ndash lsquoOrganicrsquo Growth Rate Unsustainable
Driven by Accelerated Store Expansion
ECP had a total of 89 branches when LKQ bought it in October 2011 and had opened an average of 10 new branches per year from 2007-2011 In 2012 alone LKQ opened 40 new branches In just 2 years at 9312013 LKQ had 138 total branches and intends to have 200 by the end of 2016
The chart to the right below contains a simulation approximating the revenue build and growth rate for ECP that would result solely from opening new ECP branches The levels of organic growth projected by the estimated growth rate trend are reflective of the levels reported by ECP (after taking into account that our simulation understates ECPrsquos reported growth rates in its earlier periods due to assuming no new stores were opened in 2006 and prior) As such we believe ECPrsquos growth is almost entirely explained by branch openings as opposed to same store sales growth for matured (ie gt3 years old) branches a result we would expect given the industry may be contracting
This means that as ECP approaches its market saturating goal of 200 total branches its reported organic growth rate will plummet converging to the industry rate of growth ndash which is negative
58Historical Data from ECP 2009 Annual Report amp the ECP Heritage webpage
2014-2016E from ldquo200 Euro Car Parts branches within three years ldquo
ECP Current and Projected Store Base Simulated ECP Growth Solely from New Branch Openings
LKQ appears to operate ECP with the primary intent of unsustainably inflating its financials and meeting guidance targets at the long term shareholder expense of entrenchment in a contracting market We believe the result is predictable A new financial hole will be left in the wake of a slowdown of in ECP branch openings that LKQ will seek to plug with more acquisitions (which have already begun taking place)
Growing ECP branches was not an LKQ priority when it justified the acquisition and this is evident by its initial plan to open only 10-12 stores per year On the ECP Acquisition call (1142012) LKQ stated that it had a strategic ldquoplan to grow 10 to 12 branches per year for the next few yearsrdquo It broke from that lsquoplanrsquo just one quarter later and following repeated revisions branch store openings opened 40 branches in 2012 Coincidentally growth in North America was weakening Based on our estimates by Q4rsquo2012 ECP accounted for a full 75 of consolidated PampS organic growth and enabling LKQ to hit guidance
LKQ has repeatedly raised the ceiling for the maximum number of ECP branches the UK market can absorb On the Q1rsquo2012 earnings call LKQ stated in another revision that the UK could absorb a maximum of 150 full-sized ECP branches and indicated that at that level ldquobranches in major metropolitan areas can be 5 miles or so apartrdquo which would clearly result in cannibalization LKQ has since raised the ceiling on the maximum branch count to 200
As of 9302013 LKQ had a total of 138 stores (and growing) and plans to have 147 by YE2013 exceeding by 27 branches its initial guidance for the maximum number of stores the UK market could absorb (120 full-sized stores) which was likely the most credible number it has espoused given that it preceded the repeated store ramp-up and apparent quest to meet guidance It may have already saturated the UK market yet LKQ continues to invest shareholder capital into building new branches
LKQ appears to be juicing ECP sales with heavy discounting of parts with many such promotions offered right at the end of LKQrsquos fiscal quarters
Inevitably as ECP reaches its market saturating location capacity we expect ndash and we believe management has anticipated ndash its reported organic growth rate to plummet and converge to the industry average LKQ moved quickly to buy Sator in April 2013 amounting to its 3nd largest purchase ever at the time As a result its European reporting segment now includes both ECP and Sator This new reporting will obscure future financial deterioration at ECP
59
LKQrsquos Short-Termism Results in Increasing
Dependency on Acquisitions to Stay Afloat
60
Other Red Flags ECPrsquos Receivables
Growing 2x Faster Than Revenues
The recent acquisition of Sator appears designed to hide the problems occurring at Euro Car Parts By removing Satorrsquos Q2 2013 revenue and accounts receivable contribution we find that ECPrsquos receivables grew at 2x faster than reported revenues This is a major red flag for investors to consider
Source Company financial filings
European Segment Quarterly Operating Results$ in millions
Euro Car Parts Results Only SatorECP Pro Forma
3m Ended 3m Ended 3m Ended 3m Ended 3m Ended 3m Ended 3m Ended Sator ECP Only
Dec 2011 March 2012 June 2012 Sept 2012 Dec 2012 March 2013 June 2013 Contribution(1) June 2013
Revenue $1385 $1607 $1652 $1813 $1888 $2126 $2978 $688 $2290
QoQ growth -- 160 28 97 41 126 401 -- 77
YoY growth -- -- -- -- 363 323 803 -- 386
Accts Receivables Net $509 $590 $600 $689 $702 $787 $1437 $531 $906
QoQ growth -- 160 17 148 18 121 827 -- 152
YoY growth -- -- -- -- 379 333 1393 -- 509
(1) LKQ Quarterly filing Note 9
61
The Real ECP A Lemon with Terrible
Customer Feedback
httpwwwreviewcentrecomOnline-Car-Part-SuppliersEuro-Car-Parts-www-eurocarparts-com-review_2041339
Increasing Dependency on Acquisitions to
Inflate Financials Conceal Cumulative
Manipulations
Apparent Dependency on Acquisitions to Inflate
Profits and Conceal Cumulative Manipulations
LKQrsquos move to expand internationally beginning with its acquisition of ECP was reminiscent of another chapter from the Waste Management Story ndash the final chapter that ended with fraud and failure
On the October 4 2011 ECP Acquisition conference call LKQ Chairman (and former President of Waste Management International) Joseph Holsten unprompted assured shareholders that LKQ would not repeat Waste Managementrsquos international expansion mistakes
The ensuing realities however have reflected little in the form of caution
63
Now a few of us in LKQ have kind of been down a similar road before in the waste business when we founded Waste Management International in the early 90s And we ran down the road kind of fast and probably got into markets that were not good markets to be in And as I go out -- you will see it from this management team Itrsquos a team that learns from that lesson and will be more cautious in its market entries in Europe We have a very strong commitment to our board that job one is to make sure that the deal in the UK is functioning and functioning extremely well before we move into further markets
We believe LKQ entered Europe in search of a fresh pool of large-scale acquisition targets and that it is dependent on acquisitions to continue inflating its organic growth rate and GAAP profits while papering over cumulative past misstatements
LKQ entered the UK market with the express primary purpose of driving APU for collision repairs and has made very little progress in doing so to date
Despite Chairman Holstenrsquos pledge of caution LKQ has invested shareholder capital to aggressively ramp the ECP branch countwhile the industry around it contracts
Furthermore just a year and a half following the ECP acquisition ndash again not having yet proven ldquothe deal in the UK is functioning extremely wellrdquo when measured against its stated core purpose ndash LKQ acquired Netherlands-based Sator Holding a distributor of spare parts to the automotive aftermarket industry in Belgium the Netherlands and Luxembourg for a total of $273m Sator was LKQrsquos 3rd largest acquisition ever at the time LKQ pitched the acquisition as an opportunity to ldquoachieve significant synergies and ultimately in the coming years use Sator in our highly successful Euro car parts operations as platforms for further expansion into collision parts or other revenue and profit streams in Europerdquo In the same way that it did ECP ndash as an open-ended opportunity of driving APU for collision repairs currently at 7 in Western Europe vs 37 in the US
In commenting about the acquisition founder and President of ECP Sukhpal Singh Ahluwalia appears to have had its sites set more on acquisitions than on expanding collision-repair APU
In a November 12 2013 LKQ press release announcing that Sukhpal Singh Ahluwalia would be promoted to serve as Chairman of LKQ Europe Singh stated
With time Holstenrsquos assurances of caution and LKQrsquos pitches for open-ended opportunities to drive collision European collision APU have been exposed to be diversions 64
ldquohellip Our goal is also to use this transaction as a springboard for further acquisitions in Europerdquo
ldquohellip Under my Chairmanship we will continue to hunt for new acquisitions maintain relationships with our key suppliers and push
forward to access new markets My vision is to develop a group of European aftermarket companies exceeding $5bn in
annualised revenue within five years The UK alone will have 200 Euro Car Parts branches within three years and we have
ambitious targets for paint collision parts and e-commercersquordquo
Dependency on Acquisitions to Inflate Profits
and Conceal Possible Cumulative Manipulations
LKQ is rapidly accelerating its deal making both in number and in dollar value
LKQ acquired 30 companies in 2012 alone against the backdrop of having acquired a total of 71 companies in the 3 years from 2010-2012 and 171 since its 1998 inception Notably LKQ reported a record 17 acquisitions in just Q4rsquo12
Within the past 2 years LKQ announced 3 of 4 of its largest acquisitions ever
Its acquisition of Keystone Automotive Operations on December 5 2013 is its 2nd largest ever Its acquisition of ECP in Q4 2011 is its 3rd largest ever Its acquisition of Sator in Q2rsquo2013 is its 4th largest ever
65
of Quarterly Deals Completed
Rapid Surge in Acquisitions in Q412
Acquisition Fair Value
Includes $3037m paid for ECP
Includes $273m paid for Sator
$450m paid for Keystone Automotive Operations (announced 1252013)
Dependency on Larger and Larger Acquisitions to
Inc Profits and Conceal Cumulative Problems
2012 change from midpoint
High Low Actual Results - 22813 Actual Initial Guidance Final Guidance
2012 Guidance -22312
Organic Revenue (partsservices) 550 -- 750 Organic Revenue (partsservices) 600 050 050
ECP branch openings included in guidance 20 -- 20 Income from continuing ops $2612 -25 -27
Income from continuing ops $2580 -- $2780 Diluted EPS $087 -25 -28
Diluted EPS (1) $0860 -- $093 CFO $2062 -222 -191
CFO $2500 -- $2800 CAPEX $882 -180 -72
CAPEX $1000 -- $1150
2012 Guidance -42612
Organic Revenue 500 -- 700
ECP branch openings included in guidance 30 -- 30
Income from continuing ops $2620 -- $2820
Diluted EPS $088 -- $094
CFO $2500 -- $2800
CAPEX $1000 -- $1150
2012 Guidance -72612
Organic Revenue 550 -- 700
ECP branch openings included in guidance 30 -- 30
Income from continuing ops $2650 -- $2820
Diluted EPS (1) $089 -- $094
CFO $2500 -- $2800
CAPEX $1000 -- $1150
2012 Guidance -102512
Organic Revenue 600 -- 700
ECP branch openings included in guidance 42 -- 42
Income from continuing ops $2650 -- $2720
Diluted EPS (1) $088 -- $091
CFO $2400 -- $2700
CAPEX $900 -- $1000
(1) Adjusted for 21 stock split on 81712 In April guidance was adjusted to include $003c legal settlement
While LKQ met 2012 revenue and barely missed on EPS guidance it missed dramatically on CFO guidance 2012 CFO came in -19 below revised guidance issued only 2 months before year end on 10252012 even as consolidated inventory turnover rose to 27x in 2012 (vs 25x in 2011)
As previously discussed acquisition accounting inherently and unsustainably boosts CFO LKQ made a record number of acquisitions in Q4 just as a gaping financial hole in CFO exposed itself We believe LKQ may be making acquisitions with the intent of inflating its financials and papering over past accounting manipulations
The cumulative deal size was insufficient to bail the company out but we note that in 2013 LKQ proceeded to raise the stakes making its 2nd
and 4th largest acquisitions since its inception
66
Dependency on Acquisitions to Inflate Profits
and Conceal Cumulative Manipulations
Note Yellow shading indicates
changes in guidance
67
As LKQrsquos Deal Making Gets Progressively
Worse and More Desperate
The recent acquisitions of Euro Car Parts Sator and Keystone Automotive Operations exhibit progressively lower gross margins and have been acquired at multiples that are substantially lower than LKQrsquos own current valuation We believe these acquisitions are partially used as a cover to explain away possible overstatement and deterioration of margins in its core business
$ in mm 2007 2011 2013 2013
Revenues growth(a)
$7269136
$509625
$3740~4-6
$7000--
Gross Margin 448 438 331 Low 30
EBIT margin
$49168
$33466
$26070
----
EBITDA margin
$64989
$38976
$31083
$700100
EPS Accretion(b) -- 015 - $018c $001c --
Purchase Price(c) $811 $347 $272 $450
EVLTM EBITDA 125x 89x 88x 64x
EVLTM Revenues 11x 068x 073x 064x
Source Company financials converted from local currencies(a) Sator growth described as low single digits on investor conference call(b) As stated to investors in the deal announcement(c) ECP deal excludes $76m of earnout payments to be made in 2013 and 2014
Euro Car Parts Sator HoldingKeystone Auto
OperationsKeystone Auto
Industries
68
Even Tuck-in Acquisition Quality
Smells of Desperation
Aside from large announced deals LKQ has continued to acquire various businesses in an opaque and unannounced fashion Below we analyze information found in the footnotes of its SEC filings for trends in its recent deal-making
We find further evidence that its deals are getting increasingly desperate with smaller sized and lower EBIT contribution
$ in mm 2012 YTD 2013 (a) Observation
Number of Deals 30 9 At 25-30 market share it must be harder to find smaller deals
Total Deal Value Goodwill Recorded
$2846 $1976
$411 $261
Goodwill amounting to ~65 of recent deals
Avg Deal Size $95 $45 Avg Deal Size Down 50
Revenue Contribution $1163 $124
EBIT Contribution $110 $05
Implied Avg EBIT MarginContribution
94 40 Avg EBIT Contribution Margin down 540bps indicates lower
quality businesses being added
Source Company financials (Note 9)(a) As the 6 months ended June 30 2013 and excludes the Sator acquisition
69
As Leverage Rises at the Same Time
With margins under persistent pressure growth in the US stagnating and the need to produce increasing revenue and EPS targets LKQ has brazenly pushed into Europe with two recent acquisitions
Recently in an unexpected manner LKQ announced the acquisition of Keystone Automotive Industries for $450m a deal that is currently being financed by short-term borrowing Pro forma for the incremental $70m of acquired EBITDA we estimate the companyrsquos leverage to be 22x DebtEBITDA
$ in
bill
ion
Note Pro forma for debt financed Keystone deal
$601
$956
$1118
$1312
$1762
180x
230x 220x214x
223x
000x
050x
100x
150x
200x
250x
$0
$200
$400
$600
$800
$1000
$1200
$1400
$1600
$1800
$2000
2010 2011 2012 9302013 PF 2014E
Total Debt DebtEBITDA
Deb
tEBITD
A
Inventory Accounting
Is Creative Accounting Inflating Gross
Margins
71
The Art of Inventory Accounting
Inventory Chicanery Tempts More Firms Fools More Auditors Wall St Journal Dec 14 1992
When companies are desperate to stay afloat inventory fraud is the easiest way to produce instant profits and dress up the balance sheet says Felix Pomerantz director of Florida International Universitys Center for Accounting Auditing and Tax Studies in Miamildquo Even auditors at the top accounting firms are often fooled because they usually still count inventory the old-fashioned way that is by taking a very small sample of the goods and raw materials in stock and comparing the count with managements tallies In addition Mr Pomerantz says outside auditors can fail to catch inventory scams because they either trust management too much or fear they will lose clients by being tougherldquo
72
No One Knows What LKQrsquos Sustainable Gross
Margin Rate is Potentially Even Management
httpseekingalphacomarticle1595912-lkq-management-discusses-q2-2013-results-earnings-call-transcriptpage=6ampp=qandaampl=last
Craig Kennison Robert W Baird amp Co Incorporated Research Division
And lastly on gross margin John it fell a little bit year-over-year Im guessing thats largely mix and a little bit of the scrap issue But what do you think the sustainable margin rate would be at the gross levelJohn S QuinnJohn Quinn LKQ Chief Financial Officer and Executive Vice President
Craig I think weve talked in the past that our view is excluding the seasonality that unless something changes things tend to stay the way they are in the short term And we probably did get a little bit negative impact in Q2 because of falling scrap prices We did see a little bit of benefit coming through in the car costs on the domestic side As I had mentioned the demand obviously went down Rob mentioned were buying a little bit better year-over-year so we are trying to see that theory if you will evidence of it coming through in the financials Then we do have a downtick coming with Sator in the short run because theyll be fully consolidated next quarter fourth quarter and so on And we only had them for 2 months So I would expect it to see a little sequential decline as a result of having them onboard to the full quarter (ECP) will as I mentioned earlier just anniversaried now so I dont anticipate any impact from that And you get a little bit sequential impact at having the absence of a decline in the scrap prices Itll help us a little bit in the next quarter
Q2 2013 Earnings Call Aug 01 2013
LKQ Does Not Guide on Gross Margins But When Recently Asked About LKQrsquos Sustainable Margin Rate the CFO
Seemed to Theorize Gross Margins to be Driven by 5 Different Factors and Evaded the Question Wholly
12
3
4
5
The Facts Gross Margins in
Persistent Decline
LKQrsquos margins have been in persistent decline since 2005 while consolidated inventory turns have been relatively stable
We believe there is more deterioration in LKQrsquos gross margin than observable on the Income Statement
Sources LKQ financials CapitalIQ 73
Gross Margins in Persistent Decline Flat Inventory Turns
Gro
ss M
argi
n
Inven
tory
Turn
over
74
Three Accounting Levers Would Enable
Gross Margin Inflation
If LKQrsquos consolidated gross margin is being inflated how would it be able to maintain a stable consolidated inventory turnover For reference from FY 2005 to the LTM period ended 9302013 consolidated inventory turns have been relatively stable
measuring 28x Over the same time period consolidated gross margin contracted disproportionately from 471 to 41
1 Aggressive Inventory Policy Enables Overstatement of Inventory ndash LKQrsquos Salvage amp Remanufactured products inventory accounting policy allows for complete discretion to leave costs on the balance sheet in the form of overstated inventory The recent surge in salvage inventory coupled with gross margin deterioration is consistent with this trend In isolation this policy results in inflated gross margins and CFO and exerts downward pressure on the rate of inventory turnover The generally high level of Salvage amp Remanufactured inventory ndash to which the aggressive policy applies ndash is a high level sign the company may be manipulating its margins
2 Acquisition Accounting Enables Understatement of Acquired Inventories ndash The acquisition fair market value process enables LKQ to understate the values of acquired company inventories and to allocate the plug figure to goodwill The result is that inventory costs which should be future period expenses are instead permanently deferred In isolation this would result in inflated gross margins and CFO and exert upward pressure on the rate of inventory turnover thereby counterbalancing the downward pressure caused by increases in Salvage and Remanufactured inventory and stabilizing consolidated inventory turnover
3 Mis-categorization of One-Time Gains to Directly Inflate Gross Margins ndash Management has shown the willingness to use its discretion to very blatantly inflate gross margins
Furthermore we observe that LKQ has never disclosed or broken out in its financials amounts for inventory writedowns We find this odd for a company that holds inventory such as auto parts that have a finite useful life
We believe LKQrsquos gross margins will continue to decline through 2014 against the backdrop of intensifying competitive pricing pressures and as past accounting overstatements have to be reversed we believe LKQ is at elevated risk of a crippling goodwill write-down
LKQ Appears to be Pulling 3 Accounting Levers in Unison
1) Inflated Profitability Focus on Inventory
ndash Interview w Recycled Parts Distributor
(1) ldquoRecycled Parts Distributorrdquo is an owner of large independent auto parts recyclers75
Prescience Point (ldquoPPrdquo) LKQ reports a 10-11 profit margin Is that the standard for a recycled parts distributor in general
Recycled Parts Distributor (ldquoRPDrdquo) 1 I cant hit those numbers Im not even sure theyre making any money on the recycled business Im in the business its hard to make a profithellip It is very competitive
Prescience Point (ldquoPPrdquo) Do you have some skepticism as to whether LKQ is as profitable as it indicates
RPD Well the first thing I would look at is their (recycled parts) inventories Because theyre easy to manipulate There is no way to take an accurate inventory on recycled parts There is no way to get the right value You can do some estimating How they value their inventory is crucial as inventory gets older its almost worthless
LKQ uses an aggressive policy for accounting for its Salvage and Remanufactured Inventory (refer to next slide) that allows for a high level of discretion to leave costs on the balance sheet in the form of overstated inventory LKQ is likely inflating its gross margin and earnings by failing to record a necessary expense for excess and obsolete inventory Omissions of expensing obsolete inventories result in future margin compression as past overstatements must be reversed earnings will be pressured at the time when the inventory is sold (at a deep discount) or disposed of In isolation a policy of overstating inventory exerts downward pressure on LKQrsquos rate of inventory turnover
LKQ calculates the carrying value of inventory through a formula that applies 1) the historical average of gross margin and 2) expected selling prices1 Using historical margins and future pricing estimates as inputs may paint an unrealistic picture of inventory value As a result the impact of any rapid margin change may be smoothed over time we believe LKQrsquos gross margin is deteriorating faster than presented in its Income Statement
The recent surge in salvage inventory coupled with gross margin deterioration is consistent with this smoothing trend and the overall concern of costs being left on the balance sheet
76
1) Aggressive Inventory Accounting Policy ndash
Enables Overstatement of Inventory amp GM
Prescience Point estimate assumes aftermarket and recycled product categories have equivalent margins Keystone and LKQ margins were ~inline prior to the Keystone acquisition Excludes our estimate for lsquoOtherrsquo inventory turns which was imputed assuming a 45 DSI
Salvage amp Remanufactured Inventory Turns and Consolidated Gross Margin Are Declining
Salvage amp Remanufactured Inventory Has Recently Surged While Gross Margins are Declining
(1) Note for there are no standard prices for many of LKQs products which would give management wide discretion for marking inventory values
Aftermarket and Refurbished Product Inventory Our aftermarket inventory cost is established based on the average price we pay for parts and includes expenses incurred for freight and overhead costs For items purchased from foreign companies import fees and duties and transportation insurance are also included Refurbished inventory cost is based on the average price we pay for cores and also includes expenses incurred for freight labor and other overhead
Salvage and Remanufactured Inventory Our salvage inventory cost is established based upon the price we pay for a vehicle including auction storage and towing fees as well as expenditures for buying and dismantling Inventory carrying value is determined using the average cost to sales percentage at each of our facilities and applying that percentage to the facilitys inventory at expected selling prices The average cost to sales percentage is derived from each facilitys historical vehicle profitability for salvage vehicles purchased at auction or from contracted rates for salvage vehicles acquired under certain direct procurement arrangements Remanufactured inventory cost is based upon the price paid for cores and also includes expenses incurred for freight direct manufacturing costs and overhead
The companyrsquos policy sounds like the Gross Margin or Gross Profit (GP) method used by many retailers for estimating inventories for interim financial statements The GP method is not an acceptable method for determining the year-end inventory balance since it only estimates what the ending inventory balance may be GAAP requires companies that use the GM method to conduct an annual physical inventory count to determine the actual value of inventory at year end as inventory values and physical quantities can decrease over time even if they are not sold Failing to identify and reflect such shrinkage would undermine the reliability and accuracy of a companyrsquos financial statements
Although LKQ does not call its policy the GP method its description indicates the two policies are close to if not identical LKQ may be violating GAAP at every year-end as GAAP mandates taking an annual physical inventory count If we are correct that LKQ could have gotten away with calculating inventory based on these estimates is surprising Like any retailer LKQ is not immune to shrinkage (refer to Thieves Steal Dozens of Car Parts from Local Shop) which undermines the credibility of financial statements in which inventory is based on estimates
Source httpwnepcom20130604thieves-steal-dozens-of-car-parts-from-local-shop 77
1) Aggressive Inventory Accounting Policy ndash
Enables Overstatement of Inventory Balance
LKQrsquos Salvage and Remanufactured Inventory Accounting Policy
78
2) Acquisition Accounting ndash Enables
Understatement of Acquired Inventories
Because LKQ is a serial acquirer that does not disclose specifics of the vast majority of its acquisitions such as deal terms or consistencies of target company balance sheets analyzing its accounting irregularities with precision and across periods is difficult But the surge in Salvage amp Remanufactured inventory the account subject to the aggressive inventory accounting policy serves as a higher level sign that margins and CFO may be manipulated
LKQrsquos acquisition policy gives it a lot of discretion when it comes to accounting manipulations We believe LKQ may be using acquisition accounting to understate values of acquired inventories further inflating its gross margin In isolation this policy would exert upward pressure on LKQrsquos rate of inventory turnover
At the time of any acquisition the acquirer is required by GAAP to present the fair value ndash or present a current value ndash of all the assets and liabilities on the balance sheet When LKQ acquires a company it is required to mark at fair value the inventory acquired undervaluing the inventory would enable the company to counterbalance the rises in Salvage and Remanufactured inventory (previously discussed) keeping consolidated inventory turns flat and inflate gross margins and CFO
As Tyco demonstrated when its frauds were exposed there is plenty of room for manipulation in the fair value process (Refer to paragraph 4 in the SEC settlement announcement)
The strategy would entail marking the value of tangible assets ndash that would otherwise result in future expenses down (eg inventory and PPampE) ndash as low as possible in the name of conservatism and to allocate the balance to goodwill In effect the policy moves future period expenses to the balance sheet as goodwill where they are permanently deferred
To demonstrate at the extreme if the Company books the entire value of acquired inventory as goodwill (implying that it has marked acquired inventory down to a $0 value) then sells that inventory the revenue will flow right down to its bottom line Because there is no cost associated with that inventory the Companyrsquos gross margin on the sale is inflated in this case equating to 100
How would LKQ be able to keep consolidated inventory turns from declining in the face of GM manipulation
Tyco
2) Acquisition Accounting ndash
Interview with Salvage Auto Consultant
We believe it is exactly this lsquocookie jar accountingrsquo the consultant refers to that LKQ is using to inflate GM and CFO and to manage stability in its inventory turns which inherently lends to the appearance of a high quality earnings stream
(1) Salvage Yard Recycled Auto Consultant ndash consults for salvage yards consults for some through the process of being acquired by LKQ79
Prescience Point (ldquoPPrdquo) When people sell to LKQ what prices is LKQ paying What metrics are they using and what are they buying a yard at
Salvage Auto Consultant (ldquoSACrdquo) 1 I do some consulting for people that are selling to LKQhellip If the business meets their (LKQrsquos) criteria it would be rare for them to pay more than 06x sales These days thats the most I have seen them pay 60 of annual sales so they are probably paying less than that and only that amount if profitability is above 10 net capex has been maintained and it fits their customer mix ndash they will not buy a yard unless it sells late model collisionhellip
PP So if a yard sells at 06x sales what is the typical value of inventory being bought
SAC Lets back up and triangulate this Lets take a yard that does $5m and that sells to LKQ for 60 of sales or $3mhellip Understand that this revenue multiple does not include real estate it applies only to the business Letrsquos assume that 80 of the yardrsquos sales are used parts which is typical for the industry so it has $5m in annual sales 80 from used parts implying that $4m of their sales come from used part sales which is $350k per month The inventory values that are sustainable on the balance sheet for an IRS audit are between 2-3 months saleshellip At 3 months sales which I think is more sustainable (than 2 monthsrsquo sales) but probably more than that is needed actuallyhellip but I donrsquot think the IRS would give a yard trouble with 3 monthsrsquo sales in inventory ndash theyrsquod kinda look at it and go on because it implies 4 turns to COGS So 3 x $350k = $10m of inventory That would imply that of the $3m purchase price LKQ paid the inventory purchase component of that is at least $1m
PP OK so they buy a yard for $3m and that yard would typically have $1m in inventory
SAC Id say $1m to $15m is what theyre bringing it in at I think theyre being thoughtful about that number by the way I donrsquot think theyrsquore just applying some percentage method to it I think theyre looking at the reports the turns the gross margins and making some assumptions on how valuable that inventory truly is and how much obsolescence there truly is And theyre bringing it in at a value to avoid taking writedowns later And it may mean they may do some cookie jar accounting on the front end and amortize or replace some of it with goodwill because theyrsquod bake off over a long time
2) Acquisition Accounting ndash Enables
Understatement of Acquired Inventories
According to the lsquoSalvage Auto Consultantrsquo interview on the previous slide LKQ buys recycled auto distributors at a maximum of 60 of annual sales a valuation that applies solely to the operation and excludes the value of real estate Based on his experience LKQ targets companies generating 10 profit margins If we assume the purchase price ranges from 40-60 of sales this would imply
LKQ is paying 4xndash6x net earnings for recycled auto parts distributors
Acquired inventory values make up 33 ndash 67 of the purchase price
From 2003 to 2012 (excluding the impacts of the distressed purchase of Greenleaf) LKQ spent $23 billion on acquisitions If we assume for conservatism that the purchase price allocations to PPampE were all related to real estate buys and back the cumulative PPampE allocation out from the cumulative purchase price we are left with $21 billion spent to acquire the businesses Over the same period $482m of the cumulative purchase price was allocated to inventory or only 227 of the cumulative purchase price ex PPampE
We believe LKQrsquos purchase price allocations are consistent with a policy of having used acquisition accounting to systematically understate acquisition inventory values thereby inflating its financials and successfully stabilizing its inventory turnover
80
2) Acquisition Accounting ndash LKQ at
Elevated Risk of Goodwill Writedown
We believe LKQ is at an elevated risk of a significant goodwill write down
From 2003 to 2012 (excluding the impacts of the distressed purchase of Greenleaf) LKQ allocated ~70 of its aggregate acquisition costs to balance sheet goodwill To date it has amassed an $192 billion of goodwill (and a further $154m to intangibles) relative to a book equity totaling $225 billion goodwill makes up 85 of LKQrsquos book value
By way of comparison Keystone ndash prior to LKQrsquos buyout of the company ndash from April 1 1998 to March 30 2006 allocated only 449 of its aggregate acquisition costs to goodwill in FY 2007 Keystonersquos goodwill amounted to 152 of book value
A goodwill write down for LKQ is not without precedent Jan 1 2002 LKQ wrote off ~57 of its balance sheet goodwill Prior to the write down goodwill had amounted to 72 of book value
That LKQ took a valuation impairment during the post-tech recession in 2002 citing contracting multiples but did nothing of the such during or after the 2008-2009 financial crisis which was the deepest recession the US has endured since the Great Depression does not pass logic In 2009 LKQrsquos closest comparable Greenleaf the 2nd largest wholesale auto parts recycling business in the US was in distress and sold it itself to LKQ for lsquoless than the fair market value of its assetsrsquo enterprise valuations were down across the board as liquidity evaporated
Today the stakes are much higher for LKQ than they were in 2002 The current size of its goodwill account is multiples of its 2002 enterprise value Because we believe that LKQ may be using this account to manipulate margins and CFO we also believe the account appears inflated and impaired as it stands
Sources 10-krsquos for Keystone Automotive Form S-1 for LKQ filed July 28 200381
Previous LKQ Write-Off of ~57 of Goodwill Balance
Valuations for some of the Companys acquisitions have declinedsignificantly since the Company completed its acquisitions during 1998and 1999 due to a number of factors including lower earningsmultiples applied in the valuations of comparable companies As aresult the Company determined that the carrying value of certainreporting units exceeded the fair value of those reporting units atJanuary 1 2002 and recorded an impairment of goodwill in theamount of $49898800 net of tax of $16120700
LKQ Explanation Lower Valuations of Comps
82
3) One-Time Gains to Inflate Gross Margins
We believe LKQ was manipulative in how it booked gains in 2012 from legal settlements awarded in a class action suit against several aftermarket suppliers The awards were booked as two legal settlement gains of $83m and $84m in Q112 and Q212 respectively
The gain classification artificially inflated gross margins The gains were booked as reductions of COGS significantly propping up and blunting a multi-year decline in gross margins In 2012 these gains elevated gross margins from 4095 to 4138 which helped to mask the significant drop from 4257 in 2011
The settlement gains had nothing to do with ongoing COGS While the original source of the lawsuit may have originated from issues related to LKQrsquos inventory account receiving a one-time settlement gain is irrelevant to current period operations and should be treated as one-time non-operating gains in nature In our judgment LKQrsquos classification is exceedingly aggressive
In light of our belief that games are likely being played in LKQrsquos accounting for inventories the nature of managementrsquos choice in this case underscores the potential severity of other manipulations exposed or not
Management also inflated its earnings prospects by including the legal settlement gains in its EPS guidance The Company chose to factor these one-time legal settlement benefits into guidance even while explicitly excluding other one-time gainslosses from guidance
In Q1rsquo12 management raised 2012 EPS guidance due to inclusion of the first legal settlement gain in its revision The entire value of the positive differential over prior guidance was attributable to the one time legal gain
Based on its Q1 10-Q (excerpted below) management knew that an additional settlement gain of near-equivalent value would be recognized sometime in 2012 Even though it also expected to recognize this second gain management chose not to also include it in the 2012 guidance revision that included the first gainhellip
Instead in Q22012 management booked the remaining previously expected settlement gain in the amount of $84m equating to+$04 EPS When they reported Q2rsquo2012 results (issued 7262012) management AGAIN raised its 2012 guidance to $265ndash$282m and $177 ndash $188 And again the positive differential from the prior guidance resulted from including the 2nd previously anticipated gain offset by a fall in scrap prices in the revised numbers In other words guidance would likely have been lowered had LKQ included the 2nd gain in the original guidance revision This seems to indicate they kept it in their back pocket to ensure the next revision to guidance would be a raise
83
Contrsquod
3) One-Time Gains to Inflate Gross Margins
ldquoWe are a plaintiff in a class action lawsuit against several aftermarket product suppliers Our recovery is expected to be approximately $16 million in the aggregate In January 2012 we reached a settlement agreement with certain of the defendants under which we recognized a gain of $83 million which was recorded in Cost of Goods Sold during the three month period ended March 31 2012hellip
We expect to recognize an additional $8 million gain related to settlements with certain other defendants in this lawsuit in the last nine months of 2012rdquo
ndash LKQ Q1rsquo2012 10-Q
84
On the Q2rsquo2012 earnings conference call CFO John Quinn was asked by an alert analyst whether hersquod expected the 2nd settlement gain when guidance had been issued in Q1 he completely dodged the question
But per the previous slide itrsquos written in black and white in the Q1rsquo2012 10-Q Of course he expected it
Craig R Kennison (Robert W Baird amp Co Incorporated Research Division)
ldquoJust to finalize on the guidance In the second quarter you had a $004 legal benefit which is being included in your guidance Did you expect that when you initially gave guidance after last quarterrdquo
John S Quinn
ldquoIt was not included in the guidance last quarterrdquo
ndash LKQ Q2rsquo2012 Earnings Conference call QampA 7282012
Contrsquod
3) One-Time Gains to Inflate Gross Margins
85
Another Red Flag ShippingHandling
Revenue is Diverging from Other Metrics
Source Company filings
LKQ collects revenues related to shipping and handling (SampH) and regularly reports these figures in its 10-K
If LKQ were a healthy growing firm we would expect to see SampH revenue at least stay constant over time with reported revenues COGS and average inventory
However we observe declining trends in LKQrsquos SampH revenue among all relevant financial metrics In particular we observe that SampH revenue to average inventory has declined at the fastest rate in the past six years We interpret this as strong indicator of potential inventory shenanigans
Shipping and Handling Revenue vs Other Financial Metrics
000
050
100
150
200
250
000
100
200
300
400
500
600
700
800
900
2006 2007 2008 2009 2010 2011 2012
of Avg Inventory (LHS) of COGS (RHS) of Total Revenue (RHS)
SampHInventory Has Largest Drop
86
WM and DZ ndash Previous Employers of Many
LKQ Execs amp Accounting Personnel
Flynn Enterprises Common Shareholder
John QuinnVarious Positions
John QuinnSVP and CFO
Mark SpearsController Head Acct
Mark SpearsFormer SVP CFO
Frank ErlainFmr VP Finance
Controller Accountant
Victor CasiniGen Counsel amp
Secretary
Walter HanleyAsso Gen Counsel
Walter HanleySVP Development
Victor CasiniGen Counsel amp
Secretary
Ken FreseAcctrsquog Mgr
Ken FreseAccountant
Ken FreseDir Accounting amp
Inventory
Joe HolstenCOO CEO WM Intrsquol
Joe HolstenFmr CEO Chairman
Frank ErlainVP amp
Controller
Sinon GalvinSVP Revenue Optimization
Sinon GalvinVarious Positions
WM Intrsquol
Fraud Allegations Improper Capitalization of Expense Files for Bankruptcy March 1996
Charged w $17 billion Accounting Fraud March 2002
Stephen EckelDir Oracle Fin Apps
Fmr AcctrsquogAss Contrsquoller
Stephen EckelAssistant Corporate
Controller
Source SEC filings LinkedInreg
Kevin FlynnFormer Director
Kevin FlynnVP Midwest
Vaughn HooksChief Tax Officer
Vaughn HooksVP Taxes
Dan ShoenerVP
Dan ShoenerVP of Finance
LKQ
87
LKQrsquos Director of Inventory Accounting
$17bn Accounting
Fraud
Fraud Allegations
Filed for Ch 11 Bankruptcy
httpwwwlinkedincomprofileviewid=30515327amplocale=en_USamptrk=tyah2amptrkInfo=tas3Aken20freseSource
In light of our belief that LKQ may be inflating its financials and most likely via inventory accounting shenanigans it is worth noting that LKQrsquos Director of Accounting and Inventory is connected with two companies previously alleged to have engaged in accounting manipulations to inflate their stock prices
The Waste Management
Playbook for Paper lsquoProfitabilityrsquo
Used Over and Over Again
89
Waste Management ndash Aggressive Roll-up
Strategy Replicated by LKQ amp Many Others
In 1968 Dean Buntrock Wayne Huizenga (both LKQ founding backers) and Lawrence Beck founded Waste Management (WM) In 1972 Donald Flynn (LKQrsquos founder) joined WM as CFO WM set out to consolidate the highly fragmented garbage hauling industry via an aggressive roll-up strategy Its growth would benefit from the tailwinds of recently issued EPA regulations that posed challenges for mom and pop operators
By the time WM went public in 1971 it had acquired 133 garbage haulers and was generating gt$10m in revenue In the first 9 months of 1972 it had acquired another 133 firms and by the end of the year had generated $72m in revenue From 1971 to 1980 WMrsquos revenue grew at a rate of 48 per year and in 1980 it generated $656m in revenue By 1986 WM had become the largest waste disposal firm in the world
Donald Flynn was given credit as the ldquofinancial geniusrdquo behind Waste Managementrsquos extraordinary growth from the 1970s to the early 1990s in a 1993 corporate history commissioned by the company
In 1976 the SEC alleged that WM founder Huizenga was involved in disguising unlawful political contributions that Waste Managementwas skimming dump fees and using the proceeds to create an illegal slush fund to be used for political contributions Huizenga signed a consent decree barring him and WM from using corporate money for unlawful political contributions and from filing materially false and misleading financial statements There was no admission of wrongdoing
In 1984 WM co-founder Huizenga and John Melk President of WM International sold their stakes in the company and would go on to invest in Blockbuster Entertainment Buntrock remained as CEO until 1996 and Flynn as CFO amp director until 1989 amp 1997 respectively
By the late 1980rsquos and early 1990rsquos WM had undertaken a botched international expansion in a push to become the worldrsquos first global lsquoenvironmental servicesrsquo company ldquoThat ambition led Waste Management to acquire a range of profit-draining businesses The eventual result was angry shareholders turmoil in the board room and a disruptive series of management purges and sudden resignations followed by revelations (in late 1997) of accounting irregularitiesrdquo
In 1998 the troubled company merged with USA Waste Services Inc
In 1997 a WM board-led probe turned up a massive financial fraud that went undetected from 1992ndash1997 involving the inflation of asset values and pre-tax earnings resulting in a $35B charge in 1998 and the largest financial restatement in history at that time The SEC charged WM with perpetrating a massive financial fraud
90
SEC vs Waste Management
In mid-July 1997 a new CEO ordered a review of WMrsquos accounting practices That review ultimately led to the restatement of the Companys financial statements for 1992 through the third quarter of 1997 When the Company filed its restated financial statements in February 1998 it acknowledged that it had misstated its pre-tax earnings by approximately $17 billion and took a $35 billion charge At the time the restatement was the largest in corporate history
From 1994 until 1997 a period at the heart of the perpetuation of the fraud Donald Flynn (LKQrsquos founder) was a Waste Management Audit Committee member and also served as Audit Committee Chairman during a period coinciding with the fraud
According to the SEC former WM CEO Dean Buntrock who would later be LKQrsquos founding backer amp director was ldquothe driving force behind the fraudrdquo and that ldquoHe was the primary beneficiary of the fraud and reaped more than $169 million in ill-gotten gains from among other things performance-based bonuses retirement benefits charitable giving and selling company stock while the fraud was ongoingrdquo
httpwwwsecgovnewsheadlineswastemgmt6htmWaste Management Founder Five Others Sued for Massive Fraud
91
SEC vs Waste Management ndash RE Multi-Year
ldquoMassive Earnings Management Fraudrdquo
Defendants Inflated Profits by $17 Billion To Meet Earnings Targets Defendants Reap Millions in Ill-Gotten Gains While Defrauded Investors Lose More Than $6 Billion
ldquoThe Securities and Exchange Commission filed suit today against the founder and five other former topofficers of Waste Management Inc charging them with perpetrating a massive financial fraud lasting more than five yearsrdquohellipldquoThe complaint alleges that defendants fraudulently manipulated the companys financial results to meet predetermined earnings targets The companys revenues were not growing fast enough to meet these targets so defendants instead resorted to improperly eliminating and deferring current period expenses to inflate earnings They employed a multitude of improper accounting practices to achieve this objectiverdquo
ndash SEC Press Release 3262002
bull On August 29 2005 the SEC announced its fraud action against the accused Waste Management officers would be settled for a total of $308m
bull Buntrock and the others accused neither admitted nor denied wrongdoing
WM Alumni Borrowing from the Old WM
Playbook Over and Over Again
Waste Managementrsquos aggressive rollup strategy gave its management a high level of flexibility to inflate revenue growth and margins and to conceal doing so
A closely-knit group of WM alumni and associates (including LKQrsquos founders) have repeatedly co-invested in and built several companies with each company replicating WMrsquos aggressive roll-up or an acquire-and-build strategy in either case either consolidating or flooding an industry with store openings in an effort to claim the dominant position as fast as possible Some of these companies include Blockbuster Video Discovery Zone Boston Chicken AutoNation Swisher Hygiene and LKQ Many of these companies have either failed to deliver on their sales pitches to investors failed outright or were tarred by allegations of fraud manipulative accounting andor unjust management enrichment
Based on our analysis in the majority of cases these WM alums and associates build businesses with the intent to create the illusion of growth as opposed to focusing on creating value through operational excellence This has prompted some critics to claim that they build companies that have little lasting value
Many involved seem to have learned to begin cashing out just before and soon after building a roll-up large enough to sell to the public at inflated valuations and have gotten very rich in the process
Billionaire Wayne Huizenga (LKQ founding backer and WM co-founder) has been involved in all of the above mentioned companies either as a backer or as an executive or both As he is quoted as saying (regarding some of the roll-ups that went on to fail after he cashed out)
We left these companies in great shape and to be blamed for their problems years after I left is ridiculous
92
Same Players Same Strategy Results
Marred by Accounting Irregularities amp Failures
93
John MelkInvestor
Charged with accounting fraud one
of the largest in history
Aggressive rollup strategy
Discovery ZoneBlockbuster Boston Chicken AutoNation Swisher Hygiene
Dean BuntrockCo-founder CEO
Dean BuntrockInvestor Franchisee
Dean Buntrock Founding Backer Director
Dean BuntrockInvestor Director
Donald FlynnCFO Director -Audit Committee
Donald FlynnInvestor
Donald FlynnFounding Backer Director
Donald Flynn Founder
Donald FlynnCEOChairman
John MelkPresident WM International
John MelkFounding Backer Director
John MelkFounding backer Director
John MelkInvestor Director
Lawrence BeckCo-founder
Lawrence BeckInvestor Franchisee
Lawrence BeckInvestor Franchisee
Peer PedersenDirector
Peer PedersenInvestor Franchisee
Peer PedersenDirector
Peer PedersenInvestor
Scott BeckInvestor COO Vice Chairman
Scott BeckInvestor
Scott BeckCEOChair
Steven BerrardCFO then CEO
Steven BerrardCo-founder Co-CEO
Steven BerrardCEO Director
Victor CassiniGen CounselSecretary
Victor CassiniGen Counsel Secretary
Wayne HuizengaCo-founder
Wayne HuizengaCEOChairman
Wayne HuizengaInvestor (via Blockbuster)
Director
Wayne HuizengaInvestor
Wayne HuizengaFounder Co-CEO
Wayne HuizengaChairman
Wayne HuizengaFounding backer (via
AutoNation)
Bought out by Viacom for $84B
Aggressive acquire-amp-build
strategy
Goes bankrupt Allegations of fraud
Aggressive acquire-amp-build
strategy
Goes bankrupt Accounting gimmicks to obscure financials
Aggressive acquire-amp-build
strategy
$$ Billions Lost Pooling of Interests
acquisition accounting
Aggressive rollup amp acquire-amp-build strategy
Accounting irregularities
Financials restatementAcquisition Accntng Issues
Ongoing SEC inquiry
Aggressive rollup strategy
An array of accounting
red flags amp misrepresentations
Aggressive rollup amp acquire-amp-build strategy
Dean BuntrockFranchisee
Steven BerrardCEO post-Viacom
LKQ
Blockbuster Entertainment
Blockbuster Entertainment proved to be Huizenga and his associatesrsquo most lucrative endeavor and its success would become a core aspect of their pitch to sell investors on subsequent endeavors employing the same strategy (with little success) We believeBlockbuster worked primarily because it operated in a relatively nascent quickly growing space ndash it had the wind at its back allowing for a comfortable margin for error Additionally by executing an extremely aggressive acquire-and-build strategy the companyrsquos key financial metrics were inherently blessed Lastly it was bought out by Viacom prior to falling apart as the result of fundamental forces The associatesrsquo subsequent endeavors however evidence that absent high luck rapid expansion strategies that depend on external capital are customarily near-impossible to manage and that managers are seduced by flexibility in accounting policies
In 1987 Donald Flynn Wayne Huizenga and John Melk (former President WM International) bought a controlling interest in Blockbuster Entertainment Company Blockbuster set out to consolidate the highly fragmented video rental field which was already growing in the double-digit range when Blockbuster came into the picture ndash via the implementation of a rabid buy-and-build strategy
Huizenga who assumed the role of CEO and Chairman built the company in accordance with his modus operandi ndash at a furious pace and with a buy-and-build strategy purchasing smaller chains and constructing new outlets When Huizenga and his associates invested in 1987 Blockbuster owned 15 stores and franchised 20 others From that point on Huizenga opened a Blockbuster store every 17 hours on average for seven years by the time of its 1994 takeout by Viacom Blockbuster had expanded the store count to 3700
Worries that the video rental industry was reaching a saturation point cast doubts on Blockbusters ability to keep opening stores indefinitely One response to this concern was to look to markets outside the United States for growth
In April 1993 Blockbuster supported Donald Flynn by injecting equity capital into his new venture Discovery Zone (DZ) buying a 20 stake (with the option to buy 499) Huizenga and other Blockbuster executives joined the DZ board
In September 1994 Viacom Inc acquired Blockbuster for $84 billion
94
Discovery Zone - Reckless Buy-and-Build
Fraud Allegations Bankruptcy
In July 1992 Donald Flynn (LKQrsquos founder) bought a controlling interest in and assumed the role of CEOChairman of the Discovery Zone an ownerfranchiser of indoor kidsrsquo playgrounds using proceeds from his success with Blockbuster DZ set out to build a leading market position in its space via a reckless acquire-amp-build strategy Unfortunately in its rush to accelerate revenue growth it incurred substantial debts and lost control of its costs landing it in bankruptcy Viacom later sued Flynn in 1997 claiming he was responsible for inflating DZrsquos earnings and misrepresented its financials to secure the sale of his stock to Viacom in 1995 shortly before DZ declared bankruptcy The suit was settled for an undisclosed cash sum
In April 1993 Blockbuster Entertainment injected equity capital into DZ to finance Flynnrsquos expansion plans buying a 20 stake (with the option to buy 499) In June 1993 DZ IPOed
DZ used public capital to expand rapidly Between 1991 and 1995 DZ expanded from 28 locations to 336 locations In September 1994 DZ bought 60 franchised DZ units operated by Blockbuster Blockbuster simultaneously increased its equity ownership in DZ to 499 by exercising its option to purchase additional equity directly from the Flynn family (through DKB Investments LP) on September 29 1994 Viacom acquired Blockbuster
November 1994-March 1995 ndash 3 lawsuits which were later consolidated were filed against DZ as it reported substantial operating losses in Q3rsquo04 and subsequent periods The claims allege DZ and certain directors amp officers including Flynn engaged in fraud intended to inflate DZrsquos stock price such as improperly capitalized preopening expenses failing to timely make public the change in the method of accounting for preopening expenses etc The consolidated complaint was dismissed as a result of DZrsquos Ch11 filing
On February 1 1996 DZ warned shareholders that it may seek bankruptcy protection after January sales fell below expectations the stock collapsed by gt60 on Feb 27 1996 Flynn resigned as DZrsquos Chairman On March 25 1996 DZ filed for Ch11 protection
In 1997 Viacom sued Donald Flynn and his sons claiming they inflated earnings through improper accounting adjustments and misrepresented the companyrsquos financial statements to secure a $25m sale of their personal stock to Viacom and to meet Wall Street Expectations for profitability According to Kevin Forde Donald Flynns attorney following settlement of the matter in 2004 There was a payment of a certain sum for dismissal of all claims and our clients were very satisfied with the settlement
95
This is a question of a company that grew too quickly without the infrastructure to do orderly and profitable growth
ndash Robert Mead Discovery Zone spokesman commenting just after the company files for Ch 11 (March 26 1996)
Boston Chicken ndash Reckless Buy-and-Build
Accounting Gimmickry Bankruptcy
In 1992 Scott Beck and a partner bought a controlling interest in Boston Chicken (BC) a rotisserie-style chicken restaurant with the $120m he made from selling his stake in Blockbuster Video franchise stores back to Blockbuster Entertainment The foundation of BCrsquos business strategy was based on reckless acquire-amp-build strategy This reckless expansion program however would prove to be the root cause of BCrsquos financial demise pushing the company into bankruptcy BC would likely have ended up in bankruptcy much sooner given its cash-degenerative store unit economics had gimmicky accounting not concealed signs of its deteriorating business
6 months after taking over Boston Chicken Beck was overseeing a chain of 53 restaurants in ten states By the end of 1992 Boston Chicken had 83 stores In 1993 Boston Chicken went public accumulating external capital for even more growth In 1993 BC wentpublic the chain nearly tripled in size to 217 stores By the end of 1994 it had 534 stores Management announced its intent to grow the chain at a rate of more than 325 stores annually at least through the end of the decade
Problems surfaced during the summer of 1997 Poor employee training high operating expenses and its lending policy to developer-franchisees had started to take their toll on company finances In 1998 Beck resigned Stores sales continued to falter and by July losses had reached $4371 million
On October 5 1998 BC filed for bankruptcyhellip A noted short-seller commented ldquoThe Chicken has been plucked due to deteriorating store-level economics management turmoil and an outsized amount of debt due to an aggressive expansion plan that had once impressed Wall Street but perhaps never made financial sense
(1) Howard Schilit Financial Shenanigans How to Detect Accounting Gimmicks amp Frauds in Financial Reports (New York Mcgraw-Hill2010) 103-10496
They have the most aggressive expansion program ever undertaken in the restaurant industryldquo
ndash Restaurant Analyst Mike Mueller in Restaurant Business (4101994)
Deceptive Accounting at Boston Chicken Discussed in Financial Shenanigans By Howard Schilit (Excerpts Below)1
Swisher Hygiene ndash Reckless Roll-Up
Financials Restatement SEC Inquiry
In 2004 Wayne Huizenga and Steven Berrard bought and took private public company Swisher International an industrial cleaning business In August 2010 they took Swisher public through a reverse merger renaming the successor entity Swisher Hygiene Swisher was set on consolidating its industry via an aggressive and reckless roll-up strategy Eventually the company announced that previously-issued financials could not be relied upon and that its profitability had been overstated Swisherrsquos Audit Committee is currently probing the companyrsquos acquisition accounting policies as the company contends with ongoing SEC and US Attorney inquiries
Based on an August 2010 Bloomberg News article Huizenga planned ldquoto build Swisher much the same way as he grew Waste Management Blockbuster and AutoNationrdquo and according to Huizenga
Swisher began raising capital and in approximately one year had bought 55 companies an average of more than one per week The Wall Street Journal named Swisher the ldquomost acquisitiverdquo business in North America in 2011 after its buying spree
By March 2012 Swishers Audit Committee announced its 2011 interim financials could not be relied upon and that it would delay the filing of its annual report due to an ongoing internal investigation primarily relating to possible adjustments to (1) the accounting for business acquisitions and (2) the calculation of the allowance of doubtful accounts receivable It concluded that previously issued interim financial statements could not be relied upon and that earnings were inflated for the affected periods According to its most recent 10-Q the SEC and the US Attorneys Office have requested more information from the company and the company faces federal shareholder lawsuits that allege the company artificially inflated its stock price (which collapsed as a result of the announcement)
Further disclosure in a corresponding 8-k shows that Swisher is focusing on its accounting for acquisitions which we believe LKQ may be using to manipulate its accounting as a source of its accounting irregularities
Huizenga resigned from Swishers board in May 2013 Berrard resigned as CEO in August 2012
97
This is another opportunity to build a company that will growhellip Now wersquoll have public capital to do acquisitions helliphelliphelliphelliphellip
You go to a guy and you say lsquoDo you want to sellrsquo If they think they can be a part of something thatrsquos going to grow -- you give them some cash and some stock -- theyrsquoll say rsquoyeshellip They want the stock because theyrsquoll think lsquoOh boy you guys are going to grow this business and Irsquom going to watch my stock growrsquo
During the course of its independent review and due in part to the significant number of acquisitions made by the Company the Audit Committee determined it would be in the best interest of the Company and its stockholders to review the accounting entries relating to each of the 63 acquisitions made by the Company during the year ended December 31 2011
AutoNation ndash Reckless Buy-and-Build
Billions Lost Most Comparable to LKQ
The case study of AutonNation Inc and its predecessor entity Republic Industries (collectively AN) we believe bears many parallels to how LKQs will develop AN tried to consolidate a highly competitive low margin maturelow growth industry but lacked a fundamentally superior way of making money Using public capital it over- expanded and -extended itself losing focus and eventually resulting in billions of dollars of shareholder losses
AN was led by Wayne Huizenga and Steve Berrard as co-CEOrsquos from 1996 ndash 1999 Using an aggressive acquire-amp-build strategy fueled by company shares they set out to consolidate the automotive business by building a one-stop-shop involved in every stage of selling renting and servicing new and used cars They built an empire of new car dealerships car rental agencies and used car megastores selling investors the vision that each one would feed the other to enable the company to generate profits on a vehicle throughout its lifetime
In 1996 amp 1997 it acquired hundreds of businesses mostly relying on the controversial pooling of interests acquisition accounting practice with its earnings likely inflated as a result In less than 2 years time AN was the largest auto retailer in the US with a market cap of gt$12B
They continuously reminded investors of the successes they achieved with Waste Management Inc (Huizenga sold out of WM in 1984) and Blockbuster Inc Per ANrsquos 1995 annual report We want to build a brand just like we did at Blockbuster Wall Street bought into the vision that Huizenga could replicate those successes in consolidating the autos market
The association would prove misleading the growth of WM and Blockbuster were supported by strong secular tailwinds WMs growth was supported by regulatory changes that made it almost impossible for mom and pops to compete Blockbusters growth benefited from a video-rental industry that was growing in the double digit range Like LKQrsquos ANrsquos end markets on the other hand were already mature growing at a very low single digit growth rates ndash ANrsquos success was dependent on stealing market share from existing competitors Similar to LKQ it also lacked the ability to drive down its most basic costs
With high fixed costs and inventory values that depreciated with each passing moment ANs used car business lost significant sums of money and led to investor disappointment its share price fell by gt80 from peak to trough representing a cumulative value of gt$10B
In 1999 Huizenga and Berrard stepped down New CEO Michael Jackson would dismantle the empire via asset sales and spin-offs in an effort to focus the enterprise and improve margins He spun off the rental car business and closed the money-losing used car business resulting in a pre-tax charge of gt$400m He announced AN would suspend further purchases of new-car dealerships and concentrate instead on reducing costs at existing dealerships and announced an increased its stock buyback program by $500m
(1) Paul F Kocourek Steven Y Chung and Matthew G McKenna ldquoStrategic Rollups Overhauling the Multi-Merger Machinerdquo Strategy amp Business second quarter 200098
ldquohellipit found it had no way to drive down the basic cost of the business mdash buying cars Unlike new-car dealers that accept many used vehicles as trade-ins often on favorable terms AutoNation had to compete at auctions with other dealers to build its inventory With relatively high fixed costs a huge inventory
that depreciated in value with every passing week and no sign of improvement AutoNation bailed out and exited the used-car business in late 1999 ldquo1
AutoNation ndash Reckless Buy-and-Build
the Build-Out of an Empire Destined to Fail In May 1995 Huizenga and a relative invested $31m in Republic Industries a public waste disposal company that would allow him to raise public
capital for his next venture Huizenga was appointed CEO and Chairman of the company
The next year Steven Berrard joined him as co-CEO and director Under their leadership the company announced plans to aggressively grow into a completely unrelated industry setting out to build a one-stop-shop for consumers automotive needs via consolidating the fragmented automotive retail and rental markets According to a New York Times article Huizenga said that Republic would cater to anybody who wants to rent lease or buy a car that is brand new or used
Republic expanded aggressively purchasing hundreds of franchised amp used car dealerships and car rental companies with the vision of assembling an empire that would reap economies of scale by involving itself in every stage of selling renting and servicing new and used cars It grew from only one franchised vehicle dealership at the end of 1996 to more than 270 franchised dealerships owned or under contract by the end of 1997 becoming Americarsquos largest automotive retailer in 1 years time
Amongst Republicrsquos major acquisitions was AutoNation USA (ldquoAN USArdquo) a developmental-stage private company owned by Huizenga and Berrard The two co-founded the company in September 1995 intending to grow it into a nationwide chain of used car megastores each of which would offer up to 1000 reconditioned late model low mileage vehicles When Republics intent to acquire AN was announced AN had not yet opened a single megastore and from inception to September 29 1996 AN USA had lost $214m on revenues of $92m with shareholders equity of $307m Republic paid 175m shares of stock for AN USA equating to $250m at its intent to acquire was announced on March 29 1996 but according to a class action complaint filed in January 1997 due to a rise in Republics share price prior to its close the deal was consummated for $643m
In 1996 and 1997 Republic also bought several vehicle rental companies including Alamo Rent-A-Car and National Car Rental System becoming one of the leading vehicle rental companies in the world
In 1998 Republic generated revenue of $16bn up from $56bn in 1996 But when the dust began to settle from a slowdown in its acquisition binge the economics of its business model did not pan out as promised Republic struggled as a car dealership with high overhead low profits and a strategy based on synergies that didnrsquot materialize The AutoNation USA business was a money-losing business operation
Furthermore Republic may have been relying on the acquisition accounting practice known as pooling of interests to inflate its earnings Republic applied this approach for more than half of its deals in 1996 amp 1997 without having used it its thin margins may have been in the red
Republic stock had risen from a split-adjusted $2 when Huizenga bought in to a peak of ~$44 in January 1997 by June 1997 shares had declined ~50 and would continue their descent each year until hitting a low of $5 in December 2000 Its market cap fell from a peak exceeding $12bn by gt80 representing ~$10bn in lost shareholder value
(1) Machan Dyan Crime Garbage and Billboards Forbes November 20 1995 vol 156 issue99
We were looking for a shell [company] and this happened to come up he says It could have been in anythinghellip1
When they think of transportation he said we want them to think about us
AutoNation ndash Reckless Buy-and-Build
New Profit-Focused CEO Dismantles Empire At Republics May 1998 shareholder meeting Huizenga expressed his disappointment about the companys stagnant share price according to an Sun
Sentinel article describing the event he told investors about how the matrix of car dealerships and rental car agencies was going to simultaneously grow sales to perhaps as much as $60 billion in three to five yearslsquo and that costs would be cut to boost profits
Notwithstanding the mounting pressures to remain focused in July 1998 AutoNation invested in Huizengas close associate Donald Flynns new endeavor LKQ Corp (It would cash out of this investment in 2003)
In 1999 under pressure from shareholders and a falling share price Republic began to unwind what it had built over the preceding 4 years streamlining its operations and undergoing management changes
In April 1999 Republic spun off its waste disposal segment and subsequently changed its name to Autonation Inc (ldquoANrdquo)
On September 24 1999 Huizenga and Berrard stepped down from their co-CEO positions Michael Jackson former CEO of Mercedes Benz USA was named new CEO
On September 30 6 days after Jackson was hired Autonation announced the spin-off of the car rental business to focus exclusively on the automotive retail business
On December 13 1999 3 months after taking the helm Jackson killed the concept of used-car megastores announcing the immediate closure of the money-losing chain and the expectation of a pre-tax loss of between $430 ndash $490m Of its 29 megastores 23 would be closed and 6 integrated with new vehicle franchises
According to a December 14 1999 New York Times article
AN also announced it would suspend further acquisitions of new car dealerships instead concentrating on reducing costs at existing dealerships and announced an increased its stock buyback program by $500m In the press release Jackson emphasized his focus on improving profitability and the sustainability of the AN business model
Jacksonrsquos initiatives tremendously benefited the companys efficiency tremendously A 2001 study for USA Today showed that AutoNation increased revenue per employee 82 percent from 1998 to 2002 a greater increase in efficiency than any other large public company in the country
100
ldquoMr Jacksonhellip said that the used car superstores (ie AN USA) were high-cost operations with no chance of ever generating profits proportionate to their risk Even if AutoNation had been willing to invest heavily devote a lot of management time and wait for years he said the cost structure in those stores
would still have been very high leading to marginal operations
Our focus now is on improving our operating margins and on creating a unique and branded customer experience in our new vehicle franchises which are now AutoNations sole business focus By closing the megastores and implementing SGampA reductions we have taken the necessary steps to ensure
the long-term success of AutoNation
LKQ Governance Concerns
102
Key Management Changes Start in
2009-2010 Just As Business is Improving
We believe LKQrsquos core business began slowing in the 2009-2010 which coincided with the APU rate stalling and a stagnation in insurance paid collision repairs Beginning in this period we also observe various changes to key management positions
LKQrsquos CFO Mark Spears also the former Principal Accountant at Waste Management mysteriously resigned in May 2009 despite a record year for the Company Spearsrsquo departure came ~1 year after the SEC issued a comment letter questioning numerous aspects of their business and further comment letters would follow
Subsequent changes have included a new CEO and the departure of the Head of IR and Chief Acctrsquog Officer
Date Executive Role Note
52109 Mark Spears CFO Resigns Press Release
12610 Rob Wagman Promotion from SVP Ops to Co-CEO
Press Release
12610 Joe Holsten Resign CEO joins the Board Press Release
Dec 2010 Sarah Lewensohn Director of Investor Relations
No longer listed as IR contact in PR
22811 Frank Erlain Long time VP Finance Chief Acctrsquog Officer Retires
8K filing
3512 Victor Casini SVP General Counsel resigns from the Board
8K filing
Comment Letters httpwwwsecgovArchivesedgardata1065696000000000008014694filename1pdfhttpwwwsecgovArchivesedgardata1065696000000000010023419filename1pdf
103
Delinkage of Incentives Insiders Dumping
Rewarded to Acquire at Any Cost
Insiders have been selling shares aggressively since the IPO when former owners of acquired companies affiliates and management owned 22 Since 2009 insider selling pressure has intensified and now insiders own less than 2
Managementrsquos annual bonuses are tied to revenue growth and long-term incentives are also tied to Revenue EPS and ROE with the following weightings revenue (475) earnings ($475) and ROE at just 5 These metrics incentive management to recklessly acquire revenue and boost EPS
Beneficial Ownership of Insiders vs Revenue and Free Cash Flow Growth
$ in bn
104
And Sell Stock Shortly After Trumpeting the
Merits and Growth Opportunities at Keystone
SEC Form 4 filings show that key members of the management team made timely open market sales shortly after announcing the acquisition of Keystone Automotive Operations Inc on December 5 2013
These sales directly call into question why management would announce one of the largest deals in company history that ldquosignificantly expands its addressable marketrdquo and then abruptly unload stock Our take is that therersquos an increasing disconnect between shareholdersrsquo best interest and managerial incentives
Executive Role Date Shares Wtd Avg Price Type
Wagman PresidentCEO 12102013 25000 $3371 Open Market
Quinn CFO 1292013 15000 $3362 Open Market
12102013 5000 $3431 Open Market
Holsten Chairman 12112013 6025 $3350 Open Market
of the Board 12132013 25975 $3355 Open Market
Greenspan SVP Operations 12132013 20000 $3388 Open Market
Source SEC Form 4 filings
105
Board Lacking Relevant Experience and
Necessary Focus for Adequate Oversight
LKQrsquos Board is comprised of accomplished business executives but only one non-executive member Mr Foster appears to have relevant experience in the auto parts business
Furthermore no other Board members appear to have experience in the scrap metal or related industrial sectors that would be of value to shareholders
Mr Meister and Mr OrsquoBrien both serve on the compensation committee and serve on a combined 24 other Boards which makes us question there focus and commitment to LKQ
Committee Service Current
Director Age Role Main Background Comp Audit Govern Govt Affairs Other Boards
A Clinton Allen 69 Lead Independent Lab Testing x x 3
Kevin Flynn (1) 45 Seed InvestorDiscovery Zone x Chair 1
Ronald Foster 71 Fmr Chairman of Keystone x x 1
Joe Holsten 60 Chairman Waste Management 1
Blyth McGarvie 56 Consumer Products Chair x 2
Paul Meister 60 HealthcareLife Sciences Chair x 8
John OBrien 69 Insurance x Chair 16
Guhan Subramanian 42 AcademicNo Board Exp x x 0
Robert Wagman 48 President and CEO Auto Products 0
William Webster 55 Payday Lending x x 2
(1) Recently deceased in August 2013 and yet to be replaced
Source Company and public information CapitalIQ
106
Governance Concerns Executive Pay
Also concerning is that the compensation committee constituents appear overcommitted The Chairman Mr Meister serves on 8 other boards while Mr OrsquoBrien is listed as serving on 16 other boards We suspect shareholders interests may not be adequately supervised on the matter of compensation with the big time commitments of its committee members
Management annual bonuses are tied to revenue growth and long-term incentives are also tied to Revenue EPS and ROE with the following weightings revenue (475) earnings ($475) and ROE at just 5 This mix of metrics incentivizes management to recklessly acquire revenue and do whatever possible to boost EPS
The CEOrsquos total comp has increased 374 in the past 4 years while free cash flow is up only 9 over a multi-year horizon cumulative free cash flow after acquisitions is nil Approximately 50 of the comp increase has come in stock but as a whole the management team has been net sellers The 6 member management team reaped $129m in compensation for 2012 (up 83 from 2009 comp of $71m)1
(1) Includes consulting comp and incentive comp related to Mr Holsten
9
82
92
100
101
233
374
0 50 100 150 200 250 300 350 400
Free Cash Flow
Total Exec Comp
Adj EBITDA
EPS
Revenue
Share Price
CEO Comp
Wheres the Beef
Cumulative Growth 2009 - 2012
The Misguided Analyst Community
108
LKQ Enlists Firm Associated with Stock
Pumps for Research Coverage Initiation
ldquoOccasionally we find a critic of RedChip who in a fury of madness mistakenly throws us into the ldquopump and dumprdquo category of investor relations firmsrdquo ndashDave Gentry Founder of Redchip1
(1) httpwwwredchipcomblogindexphpredchippresidentpump-and-dump-is-a-pejorative-term-and-rightly-soUZ05RrW1E0w
httpphxcorporate-irnetphoenixzhtmlc=147311ampp=irol-newsArticleampID=933038amphighlight=Photo Source httpwwwredchipcomaboutaboutmainasppage=management
RedChip a firm commonly associated with having promoted speculative and in many previous instances fraudulent companies was among the first to provide research coverage on LKQ
109
RedChip Denounced by the Investing Public
for Promotion of Frauds
CNBC Faceoff Heat Over Chinese Reverse MergersJan 11 2011
Chinese reverse mergers are continuing to make headlines causing investors to take notice and as a result these special types of mergers have come under increased scrutiny
Tuesday on The Strategy Session David Gentry president and CEO of RedChip Companies a business that promotes small-cap companies including Chinese reverse mergers fired back
CNBCs David Faber and partner continue their discussion about Chinese reverse mergers with Dave Gentry president of RedChip a company that promotes these products
Source httpwwwcnbccomid41024808 Source httpglobenewswirecomnews-
release2013010451458410017068enRedChip-Announces-Exit-From-China-Small-Cap-Sectorhtml
RedChip Announces Exit From China Small-Cap SectorJan 3 2013
RedChip Companies Inc (RedChip) an international small-cap research investor relations and media company today announced that it has exited the China small-cap sector and terminated its contracts with its three Chinese clients We made a decision to close our Beijing office months ago and wind down our China operations stated Dave Gentry President and CEO of RedChip Wall Street has for the most part lost confidence in the financial reporting of US-listed Chinese companies We are concerned that Big Four accounting firms were unable to detect financial fraud in companies like Sino-Forest and Longtop Financialldquo Mr Gentry continued When multi-billion dollar funds like Paulson amp Co and The Carlyle Group with their unlimited resources are unable to detect fraud in their Chinese-based portfolio companies when top-tier investment banks like Goldman Sachs are unable to detect fraud in their Chinese-client companies then I think reasonable investors must take a step back and seriously consider whether the potential rewards outweigh the downside risks of investing in US-listed Chinese companies We simply are not willing to take the risk
Prescience Point was on the forefront of identifying Chinese investment scams and has been wary of paid-for research conducted by RedChip
110
LKQ Has Worked Hard to Garner Broader
Analyst Support as a Wall St Darling
Broker Rating Price Target
Barrington Market Perform $3300
BBampT Outperform $3500
BofaML Neutral $3200
CL King Buy $3200
Deutsche Hold $2700
Great Lakes Hold $3300
Stifel Nicolaus Buy $3300
Ray James Outperform $3200
Baird Outperform $3800
Sidoti Buy $3900
Stephens Overweight $3500
FBR Outperform $4000
William Blair Outperform --
Average Price $3420
Date Conferences Presented
52213 BBampT Stephens William Blair
21213 Raymond James Sidoti BofAML
8112 BBampT
52312 Stephens William Blair Deutsche Bank
41712 Baird Barrington
31512 BofA Merrill Lynch
21512 Raymond James Sidoti
82511 CL King ThinkEquity
71211 Jefferies Canaccord Genuity BBampT
41211 Baird Barrington
3711 Raymond James
2010 Raymond James CLK King BofAML Morgan Keegan Gabelli Deutsche Bank
2009 BBampT RBC CL King Morgan Keegan Deutsche JPM
The chorus of analysts are singing buy buy buy The one independent analyst at WellingtonGreat Lakes Research recently downgraded the stock to Hold
111
While JP Morgan Recently Ditched its
Credit Exposure to LKQ Earlier this Year
JP Morgan was Keystone Automotiversquos long-time banker MampA advisor and lead admin agent for its credit facility JP Morgan continued to serve as LKQrsquos lead banker
JP Morgan resigned from its lead banking position in 2013 and appears to have completely severed all ties to the company The significance of this event must be considered as a leading underwriter in high yield bonds JP Morgan mysteriously did not participate in LKQrsquos $600m bond offering thereby sacrificing underwriting fees The bank also assigned key swap contracts to other parties as another credit risk reducing measure
New Counterparty Notional Amount Maturity Fixed Int Rate
Wells Fargo US$250m 101415 15638
Wells Fargo US$60m 103116 11950
Bank of America C$25m 32416 143
Source httpwwwsecgovArchivesedgardata1065696000106569613000044lkq8-khtm
On April 30 2013 JPMorgan Chase Bank NA (JP Morgan) the counterparty on certain of the Companys floating to fixed interest rate swaps assigned its obligations under its swap contracts to Wells Fargo Bank NA and Bank of America NA JP Morgan is no longer a secured lender under the Second Amended and Restated Credit Agreement and therefore assigned its obligation to Wells Fargo Bank NA and Bank of America NA The Company believes Wells Fargo Bank NA and Bank of America NA are creditworthy to perform their obligations as the counterparty to their respective swap contracts The counterparty notional amount maturity date and fixed interest rate of each of the swaps assigned by JP Morgan are listed below
112
Analystsrsquo Views on the Growth Story
are Completely Wrong
Wall St Analyst Views of LKQ
ldquoOpen Ended Growth Story with the Collision Strategy Just Beginning to Unfold LKQ Can Grow Revenues Organically 5-7 and Earnings 15-20 in the Next Several Yearsrdquo
ldquoSecular growth drivers for LKQ include the annual shift to alternative parts versus OEM parts that continues at a rate of 50-100 basis points annuallyrdquo
ldquoLKQ brings professional processes and technology to an under-managed industryrdquo
ldquoLKQs is a preferred partner for insurance companies small auto recyclers seeking a partnerexit strategy and repair shops
ldquoLKQ is a Premium Mid-cap Growth Storyrdquo
Prescience Point View
Sustainable organic growth is likely overstated and closer to 0 ndash 2 in North America European expansion is fraught with problems and a mature and competitive marketplace Earnings growth appears highly engineered with opaque acquisitions and levers for multiple accounting shenanigans being pulled Adjusted free cash flow after acquisitions is the appropriate yardstick to evaluate LKQ
Share shift has stalled and may reverse OEMs with large balance sheets are subsidizing price matching programs and vehicle fleet age has likely peaked
Early mover advantages have eroded auto recycling is now a global business Rampant customer serviceemployee complaints suggest that LKQ is acquiring just to manage earnings and not build a world class operation
Our research suggests not many want to do business with LKQ but rather they have to Insurance companies are introducing new programs such as PartsTrader that will force price compression
LKQ is a poorly constructed roll-up and should not trade at a premium to leading after market auto recycling or industrial distributors
113
Detailed Aftermarket Auto Part and
Metal Recycling Comparables
($ in millions except per share figures)
Stock 13E-14E LTM Enterprise Value Net Price
Price Ent Revenue EPS EBITDA FCF PE EBITDA Sales Debt Tangible
Name Ticker 1102014 Value Growth Growth Margin Margin 2014E 2015E 2014E 2015E 2014E 2015E EBITDA Book
Aftermarket Auto Parts
AutoZone AZO $49000 $21241 23 27 218 104 165x 148x 103x 99x 22x 22x 20x NM
OReilly Automotive ORLY $13299 $15473 63 131 190 105 197x 173x 112x 104x 22x 21x 08x 23x
Genuine Parts GPC $8345 $13630 52 55 88 64 182x 167x 102x 95x 09x 09x 06x 71x
Advance Auto Parts AAP $11564 $8560 493 278 136 55 166x 143x 71x 64x 09x 09x 01x 76x
Monro Muffler MNRO $5581 $1917 99 271 137 84 279x 220x 135x 119x 21x 19x 16x 151x
Uni-Select UNSto $3000 $1104 -02 140 42 59 119x 110x 97x 93x 06x 06x 61x 45x
Pep Boys PBY $1180 $922 47 1458 57 02 200x 148x 61x 56x 04x 04x 25x 13x
Boyd Group BYDUN $3341 $505 193 670 69 38 220x 213x 97x 95x 07x 07x -01x 11x
Max 493 1458 218 105 279x 220x 135x 119x 22x 22x 61x 151x
Average 121 379 117 64 191x 165x 97x 91x 13x 12x 17x 56x
Min -02 27 42 02 119x 110x 61x 56x 04x 04x -01x 11x
Metal Recycling
Steel Dynamics STLD $1910 $6072 44 699 81 24 135x 112x 70x 62x 08x 08x 33x 31x
Comercial Metals CMC $2056 $3468 -03 542 47 -02 199x 133x 88x 71x 05x 05x 31x 21x
Sims Metal SMSMY $924 $2028 -107 1074 27 21 159x 115x 97x 70x 03x 03x 07x 12x
Schnitzer Steel SCHN $2894 $1118 46 1252 41 07 180x 137x 78x 66x 04x 04x 34x 18x
Metalico MEA $240 $233 47 -1455 34 24 480x 218x 76x 66x 04x 04x 66x 14x
Max 47 1252 81 24 480x 218x 97x 71x 08x 08x 66x 31x
Average 05 423 46 15 231x 143x 82x 67x 05x 05x 34x 19x
Min -107 -1455 27 -02 135x 112x 70x 62x 03x 03x 07x 12x
LKQ Corp LKQ $3300 $11846 188 257 135 61 243x 192x 150x 124x 20x 18x 27x 570x
Source Company financials CapitalIQ calendarized estimates
114
Valuation Premium is Unwarranted Relative
to Aftermarket Parts and Recyclers
Source CapitalIQ company filings Averages exclude LKQ
Price 2014E EPS Price to Tangible Book Value
Enterprise Value to 2014E EBITDA Enterprise Value to 2014E Revenues
00x
20x
40x
60x
80x
100x
120x
140x
160x
PB
Y
AA
P
BY
DU
N
UN
Sto
GP
C
AZ
O
OR
LY
MN
RO
ST
LD
ME
A
SC
HN
CM
C
SM
SM
Y
LKQ
Auto Part Distributors Scrap Processors
Average
00x
05x
10x
15x
20x
25x
PB
Y
UN
Sto
BY
DU
N
AA
P
GP
C
MN
RO
OR
LY
AZ
O
SM
SM
Y
SC
HN
ME
A
CM
C
ST
LD
LKQ
Auto Part Distributors Scrap Processors
Average
00x
50x
100x
150x
200x
250x
300x
UN
Sto
AZ
O
AA
P
GP
C
OR
LY
PB
Y
BY
DU
N
MN
RO
ST
LD
SM
SM
Y
SC
HN
CM
C
LKQ
Auto Part Distributors Scrap Processors
Average
00x
100x
200x
300x
400x
500x
600x
BY
DU
N
PB
Y
OR
LY
UN
Sto
GP
C
AA
P
MN
RO
SM
SM
Y
ME
A
SC
HN
CM
C
ST
LD
LKQ
Auto Part Distributors Scrap Processors
Average
115
Detailed Industrial Distribution Comparables
LKQ often refers to itself as a ldquodistributionrdquo company From this perspective LKQrsquos stock is dramatically overvalued relative to some of the best industrial distribution companies in America
($ in millions except per share figures)
Stock LTM Enterprise Value Net Price
Price Ent EBITDA FCF PE EBITDA Sales Debt Book
Name Ticker 1102014 Value Margin Margin 2014E 2015E 2014E 2015E 2014E 2015E EBITDA Value
WW Grainger GWW $26371 $18396 159 79 377x 182x 108x 99x 18x 17x 00x 35x
Home Depot Supply HDS $2430 $10218 88 -115 180x 116x 117x 99x 11x 10x 73x NM
Wesco WCC $9194 $5545 60 35 151x 141x 97x 88x 07x 07x 34x 23x
MSC Industrial MSM $8540 $5214 183 96 203x 174x 104x 90x 18x 17x -04x 39x
Anixter AXE $9322 $3773 58 25 142x 131x 90x 84x 06x 06x 21x 28x
Applied Industrial Tech AIT $4826 $1955 80 38 165x 138x 91x 78x 08x 07x -04x 26x
Max 183 96 377x 182x 117x 99x 18x 17x 73x 39x
Average 105 26 203x 147x 101x 90x 11x 10x 20x 30x
Trim Avg 97 44 175x 146x 100x 89x 11x 10x 13x 30x
Min 58 -115 142x 116x 90x 78x 06x 06x -04x 23x
LKQ Corp LKQ $3300 $11846 135 61 243x 192x 150x 124x 20x 18x 27x 45x
Source Company financials CapitalIQ calendarized estimates
Trim average exludes maximum and minimum
116
LKQrsquos Valuation Premium is Unwarranted
Relative to Industrial Distributors
Source CapitalIQ company filings Averages exclude LKQ
Enterprise Value to 2014E EBITDA Enterprise Value to 2014E Revenues
Price 2014E EPS Price to Book Value
00x
20x
40x
60x
80x
100x
120x
140x
160x
AXE AIT WCC MSM GWW HDS LKQ
Average
00x
05x
10x
15x
20x
25x
AXE WCC AIT HDS GWW MSM LKQ
Average
00x
50x
100x
150x
200x
250x
300x
350x
400x
AXE WCC AIT HDS MSM LKQ GWW
Average
00x
05x
10x
15x
20x
25x
30x
35x
40x
45x
50x
WCC AIT AXE GWW MSM LKQ
Average
117
LKQ is an Ineffective Roll-up Valuation
Beyond the Sum of its Parts Isnrsquot Justifiable
$ in mm 1998-2013 Acq 2011 Acq May 2013 Acq Dec 2013 Approx Total
Estimated Revenues~ growth
~$37000-2
~$1200~20
~$4000~4-6
~$7000NA
$6000Low single digits
Gross MarginContribution
Low 40 if accurate
~430 ~330 Low 30
Estimated EBITDA margin
$4400120
$91076
$33083
$700100
$650108
Purchase Price ~$2100 $347 (1) $272 $450 gt$2700
EVLTM EBITDA -- Acquired 89x Acquired 88x Acquired 64x At best 70x ndash 100x
EVLTM Revenues -- Acquired 068x Acquired 073x Acquired 064x At best 060x ndash 10x
Comments (2) North American Salvage Assets of
diminished value and potentially impaired
value in Heavy Duty Core business value in serious question LKQ has paid big premiums to book
value for these industrial assets
Growth is artificially high in the near term due to rapid store expansion Growth is
expected to slow dramatically as it reaches its market saturating location limit Also LKQ has yet to demonstrate an ability to
drive APU growth in Europe
(3) Acquired from H2 Partners which also
owns the UKrsquos Unipart Auto (a competitor to
ECP) H2 did not appear to extract synergies
between the two so we are skeptical of LKQrsquos ability to drive value between ECPSator
(4) Keystone was previously bankrupt and up for sale for at least a year until LKQ bought it
LKQ has yet to demonstrate any ability
to extract value here and its key markets are fundamentally different from LKQrsquos existing ones
At 70x ndash 100x EBITDA and adjusting for $17bn of debt
outstanding $107m of cash and 3088m shares os our price target is
~$1000 - $1500share( 50 ndash 70 ) downside LKQrsquos current valuation at 15x is a
substantial premium to the sum of its parts at the upper end of
its historical range and a significant premium to all its
stock trading peers
Source Company financials converted from local currencies(1) ECP deal excludes $339m earnout payment made in March 2013(2) Note that in Q4rsquo12 LKQ mysteriously realigned the reporting structure of its heavy-duty salvage yards and removed it as an operating segment to be included within Wholesale North America (p 7 2012 10K)
(3) H2 Equity Acquires Unipart (UK) httpwwwunipartcoukUserFilesFileUnipartAutomotiveH2pressrelease[1]pdf(4) Platinum Equity Seeks Buyer for Keystone Automotive httpwwwreuterscomarticle20130129keystone-platinum-idUSL1N0AXM6U20130129
Over 160 Acquisitions (Salvage Aftermarket
Reman Heavy Duty Etc) Euro Car Parts Sator HoldingKeystone Auto
Operations LKQ Corp
118
Cheap Money Leverage and Bad Deals =
Valuation Expansion
LKQrsquos long-term Enterprise Valuation to forward EBITDA multiple has trended in the 10x ndash 11x range The recent valuation expansion appears to be a function of expansionary monetary policies favoring stocks the companyrsquos use of more leverage to buy low quality businesses as it expand into Europe and we believe a fundamental misevaluation by market participants of LKQ as an effective roll-up
We believe investorsrsquo are discounting perfect execution and unrealistic growth expectations for a company with significant fundamental challenges and lacking operational excellence as indicated by
An ldquoFrdquo rating by the Better Business Bureau
28 our of 5 ranking on Employee Review site Glassdoorcom
Our conversations with industry participants
500x
700x
900x
1100x
1300x
1500x
1700x
1900x
Enterprise Value NTM EBITDA Long-Term Average
QE Leverage Fueled Valuation Expansion on Bad Acquisitions
LKQrsquos EV NTM EBITDA Historical Valuation
Appendix
120
Does LKQ Have Too Cozy a Relationship
with its Auditors
According to the SEC at the onset of the WM fraud the Company capped Arthur Andersens audit fees However WM advised AA it could earn additional fees for special work mdash eg consulting services Over the succeeding years AAs corporate audit fees remained flat while the fees for special work multiplied
Despite enormous revenue growth and international geographic expansion LKQrsquos audit and total fees paid to auditors have barely increased Oddly enough tax planning fees have fallen at the fastest pace despite LKQ having reported progressively growing international earnings and cash flow
$ in millions
2008 2009 2010 2011 2012 CAGR
Audit Fees $182 $160 $170 $197 $204 29
Audit-Related $005 $009 $030 $028 $012 211
Tax Fees $063 $075 $062 $032 $035 -140
All Other Fees $012 $000 $000 $000 $000 -1000
Total Fees $263 $244 $261 $257 $251 -12
Annual Growth
revenues 694 73 206 324 261 212
employees 55 42 200 492 134 162
Sales by Geography
US 1000 1000 1000 1000 831 78 (1)
Europe 00 00 00 00 169 22(1)
(1) as of LTM 93113 Source Company filings
121
LKQ Received the Coveted ldquoFrdquo Grade
by The Better Business Bureau
httpwwwbbborgchicagobusiness-reviewsauto-parts-and-supplies-used-and-rebuiltlkq-in-chicago-il-12010519
122
Insider Views from Glassdoor
Source httpwwwglassdoorcomReviewsLKQ-Reviews-E20395htmsortsortType=RDampsortascending=false