Embed Size (px)
Citation preview
1
Report – July 2020
www.talismanunderwritingplc.com
This document has been produced for shareholders of Talisman Underwriting Plc and may not be reproduced or passed to another person other than their personal advisor.
THIS DOCUMENT IS NOT AN OFFER OF SHARES OR OTHER SECURITIES
2
CONTENTS
SECTION I PAGE
1. Introduction 3 2. Underwriting Performance 7 3. Dividend Payments 7 4. Result for the 2017 Year of Account 8 5. Forecast for the 2018 Year of Account 8 6. Forecast for the 2019 Year of Account 9 7. Portfolio Planning 9 8. Market Trends and Renewals 10 9. Conclusion 13
SECTION II
10. Syndicate Participations 15 11. Syndicate Pre-emptions 15 12. Syndicate Capacity Purchased 16
13. Corporate Members Purchased 16 14. Syndicate Ratings 16
15. Risk Ratings 17
16. Business Split Analysis 17 17. Realistic Disaster Scenarios (RDS) 18
3
Talisman Underwriting Plc
Report – July 2020 1. Introduction Since the early part of this year, the impact of COVID-19 across the globe has been at the forefront or our minds as we navigate our way through such uncharted waters with much still unknown. The pandemic continues to have a devastating effect on communities and the global economy creating many challenges in every walk of life. At Lloyd’s the underwriting room closed in March and will not open again until September. Underwriters and staff have been working from home and the City remains deserted. Fortunately, the digital age in which we live enables the Lloyd’s business to carry on serving its clients and paying valid claims. Operational changes were required of the market and the move to electronic trading occurred at a pace never envisaged. Working practices have changed forever and doubtless for the better. Lloyd’s demands regular information from syndicates and much of the data is shared with Argenta Private Capital Ltd (Argenta), members’ agent to Talisman, and its analysts. In May 2020, Lloyd’s announced that it estimated its exposure to claims from COVID-19 at between US$3bn and US$4.3bn. Event cancellation was the largest class at 31% followed by property at 29%. The exposure to credit lines at 11% is probably below the industry average. Updated information will become available with each quarter’s reporting. The data used in this report is at 31 March 2020 and enables us to give a reasonable view on the anticipated outcome but with the obvious caveats. The pandemic is sadly far from over and making comment is rather like estimating the cost of a Hurricane while the wind is still blowing. Market conditions have responded and rates, terms and conditions are now the best seen for at least a decade. The improvements since 2017 compound year by year to what many now call a hard market for numerous classes of business. Talisman’s 2017 underwriting year of account closed at 31 December 2019 with a pure underwriting loss of 4.49% of premium limit. This outcome, which is much as predicted, compares well with the market loss of 7.97%. Whilst the cost of insurance losses during 2018 was not as severe as in 2017, it was still above the average. In this report last year a mid-point loss of 2.7% of premium limit was forecast. That has deteriorated to 3.65% compared to the market average loss of 6.64% that has moved by a greater amount from 3.8%. One important factor currently affecting this year is the lack of investment income, with interest rates almost at zero. When the account closes at 31 December 2020 a small loss has now to be anticipated with much depending upon the release of redundant reserves. About two thirds of the cost of COVID-19 related claims will fall to the 2019 underwriting year of account and managing agents had to calculate their exposures, as best they could, in their estimates at 31 March 2020. For Talisman, a mid-point loss of 0.7% of premium limit is forecast, compared to a market loss of 1.3%. It must not be forgotten that trading conditions improved again during the year and it may well be that the cost of attritional claims reduces consequent to the lockdown and level of economic activity. By taking a reasonable view on current data, a positive outcome for the year could still be achieved. During 2019, Lloyd’s continued its drive to improve underwriting performance to ensure the market could deliver long-term sustainable profits. The so-called decile 10 approach continued to remove the worst performing parts of each business. Talisman benefits from this exercise as uncompetitive players, once removed, leave the top performers to lead in their business classes. Lloyd’s has a rigorous business planning process but, for a select group of top performers, a ‘light touch’ scheme was introduced allowing a ‘file and use’ approach. This facilitated their ability to
4
grow and take advantage of the ever improving trading conditions. Talisman remains with its focus on top performing syndicates, five of which were part of this select group. In 2019, on an annual accounting basis, Lloyd’s overall produced a profit of £2.5bn, an improvement of £3.5bn over 2018. The combined loss ratio improved by 2.4%, but the main improvement came from investment income of £3.5bn which for Talisman was much to the benefit of the 2017 underwriting year of account. The release from redundant reserves was just 0.9%. Premium income growth was up 1.1%, but the weighted average increase in prices was 5.4%. With syndicates cutting out the poorer risks the underlying reduction in premium volumes was 2.6%. The most notable events in the calendar year were typhoons Faxai and Hagibis as well as hurricane Dorian that hit the Bahamas. We operate in a high risk business that by nature is cyclical. Customers buy insurance to protect their businesses and property and our role is to pay valid claims. The cost of losses in 2017 and 2018 was above average with COVID-19 bringing uncertainty to 2019. Nonetheless, the market has been responding with rates increases compounding year on year since 2017 such that the trading prospects for now and going forward, are very appealing.
Ruffer Annual Performance Report 2020 Managing Talisman’s cash flow and capital position at Lloyd’s is a key function of the Board. The Funds at Lloyd’s (FAL) of the company comprise cash, bank guarantees and holdings in Ruffer stock. Should the FAL fall in value it would be necessary for the amount of that reduction in value to be replaced and thus the potential for volatility needs to be minimised. Within the FAL at 31 December 2019, Talisman held £2.58m of the Ruffer Total Return fund that continues to meet its investment objective and for the twelve months of 2019 produced a return of 8.1%. The report from the managers is below.
Ruffer Annual Performance Report 2020
The Talisman portfolios (invested 100% in the Ruffer Total Return International fund) returned 10.6% in the
12 months to 30 June 2020. We regard this as a good result at a time of significant market stress and profound
economic uncertainty. The portfolio has achieved its objective of preserving capital regardless of the market
conditions. Furthermore, we have produced some much-needed growth and feel confident about our
prospects from here.
The first half of 2020 has demonstrated how the Ruffer strategy should perform. We protected capital in the
sell-off in February and March, but we also managed to capture the rebound since April posting one of our
strongest quarters ever in Q2 2020.
Although this report covers the last 12 months, the first eight seem remarkably insignificant in the context of
the pandemic. After a positive start to 2020, stock markets plunged in March on escalating fears of the global
impact of COVID-19 and a Russian-Saudi oil price war. The virus shook the world and plunged the global
economy into the deep freeze from February. The combination of these events revealed the structural and
technical frailties in what we had come to call ‘avalanche prone’ markets. In the fastest decline in stock market
history, equity markets fell by a third in just 22 days, hitting their lows on 23 March, the very day the UK
officially went into lockdown.
Cue the cavalry. Stock markets rallied in the second quarter as central banks, very much led by the US, swung
into their now habitual role of supporting asset prices. The size, breadth and swiftness of the monetary and
fiscal intervention is unprecedented in peacetime and we wait to see whether it is sufficient to keep businesses
and employment afloat, but for now at least, it has been a big enough bazooka to reassure investors. In April
and May equity markets duly recorded one of their fastest recoveries.
5
Portfolio attribution
Of course, we did not see the coronavirus crisis coming but our all-weather portfolio construction means we
don’t need a crystal-ball. In the downturn it was the portfolio’s protective assets which generated the returns.
In the last six months notable positive contributions came from credit protection, gold, index-linked bonds
and option protection. The negative side of the ledger was dominated by equities, where we were hit hard.
Overall, in the acute period of the crisis the portfolio behaved in a balanced fashion and as we would expect.
It is worth highlighting the success of our unconventional protections which have cost the portfolio in recent
years. The Ruffer Illiquid Multi-Strategies Fund contained our positions to benefit from rising credit spreads
and burst into life, almost doubling at the peak of the market stress. The options on rising volatility and falling
equity indices rose by between 20 and 100-fold, proving that whilst small in size they could be ferocious at
the right moment. Lastly, the LF Ruffer Gold Fund rose 56% in the six months to 30 June.
The equity book was bruising as stated above. Our holdings were deliberately racy because they were an offset
to our large defensive positions elsewhere. Our focus on value and cyclicals resulted in many of our stocks
falling more than the market as economic prospects collapsed. The best performing individual stock for the
year was Ocado which rose 72%.
Portfolio changes
We entered 2020 defensively positioned due to a wide variety of economic, political and market risks which
we did not believe were discounted in elevated valuations and stretched balance sheets.
In January we bought a basket of Japanese companies which we believe are ripe for engagement and activism
to improve governance and shareholder returns by paying out excess cash, selling down cross-shareholdings,
or engaging in M&A. The virus has disrupted this positive trend in Japanese corporate activity, but these
businesses are extremely conservatively run and compellingly valued.
In March we faced a decision about adding to equities as they fell. Rather than catching what felt like a falling
knife in the equity market, we were excited to be given an opportunity to add to distressed and disrupted
positions in other asset classes. We added to gold equities in mid-March; these had sold off in line with the
equity market and had not yet started to respond to the improving fundamentals for gold – zero rates and
quantitative easing, or for their operating costs – cheaper labour and oil prices.
Another casualty of the panic and forced selling was US inflation-linked bonds. This presented a brief but
compelling opportunity to extend the duration of our US TIPS. We moved 8% of the portfolio from short
dated bonds out to beyond 2040 giving this part of the portfolio greater potency should real yields falls.
These two moves increased our portfolio risk and duration but in a more oblique and targeted fashion than
buying equities. On a risk adjusted basis this was a most attractive trade, as the forced selling was purely
technical and we could deploy a large amount of capital quickly. We preferred the risk/reward in these trades
over equities as they were closer to the source of a rally which was likely to be government intervention.
We added a little to existing holdings in Royal Bank of Scotland and Lloyd’s. A new holding, Vinci, is a key
infrastructure play in France controlling roads, concessions, and construction. We managed to buy it well,
almost 50% off its recent highs with a 10% free cashflow yield.
Towards the end of the period we continued to take profits in quality and growth companies, trimming Ocado,
Sony and US healthcare stocks. The proceeds have been used to focus the equity book more into value and
cyclical stocks. Recent additions include American Express and Charles Schwab.
6
Investment outlook
As always, our goal remains to provide consistent positive returns regardless of what the market or economy
throws at us. There is an epoch-defining tug-of-war going on between the unprecedented interventions of
governments and central banks versus the unimaginable disruption to the functioning of the global economy
caused by the pandemic. As a consequence, we think the inflationary endgame is closer and more likely than
it was six months ago. The debt explosion has moved the persistence of negative real rates to a necessity to
maintain the ability to service it.
The world today, in lockdown, is unequivocally deflationary but the solutions are unequivocally inflationary.
The hands on the steering wheel have quietly passed from central bankers to governments around the globe
– and they have an entirely different set of objectives and incentives.
The stable inflationary environment of the last 30 years leads to a problem of imagination. Nobody much
under 60 has any clear memory of what it is like to deal with inflation as a real world problem. But inflation
is very much a behavioural phenomenon – if you know your money will not be worth as much tomorrow, you
will go out and spend it today. For now these expectations lie dormant, but they can very quickly become self-
re-enforcing as we recently saw with the rush to turn money into goods on supermarket shelves. Remember
at its simplest, inflation is caused by too much money spent chasing too few goods.
On top of this, austerity is dead and fiscal spending is here to stay. What’s more it is currently being financed
by the central bank money printing. It doesn’t matter whether it is the political left or the right in power –
they all have their own expensive plans to stimulate and get the economy going again.
From the US Democrats’ Green New Deal or Medicare-for-All, Trump’s Coronavirus Stimulus Cheques, to
Rishi Sunak’s furlough schemes, bounce bank loans and stamp duty holidays, the spending taps are clearly
on. But the problem with ‘printing money’ is one of control. Once voters know that unfettered money can be
bestowed so easily, politicians will suffer greater pressure to create more! As Milton Friedman said, ‘Nothing
is so permanent as a temporary government program’.
This is an environment of financial repression – interest rates held below the rate of inflation for a sustained
period. We have already had a decade and we think it is going to get worse.
The solutions to the crisis this time have resulted in money being injected directly into the real economy and
people’s pockets, those companies and citizens who desperately need it and will spend it. Quite the contrast
to stimulus being stuck on bank balance sheets as happened in the aftermath of the global financial crisis.
Economic and market regimes matter, we think the Corona-crisis will act as an accelerant into a new regime
of high economic and market volatility and higher inflation. All of these are bad for asset prices. If this is the
case, then investors must protect themselves against it. This world will require a profoundly different
portfolio from the one which has served investors well over the last couple of decades.
A portfolio of index-linked bonds, gold, value stocks which benefit from stimulated GDP growth and a
significant sprinkling of protection against market calamity looks to be the right mix. We have performed
satisfactorily in the initial onslaught, but we fear this story is far from over.
At Ruffer our approach has always been not to try to precisely time events, but to position our portfolio in
anticipation of the environment we believe will now inevitably emerge. To that end, we will continue to strive
to produce a defensive, uncorrelated return which can offer useful diversification and peace of mind to
Talisman investors.
7
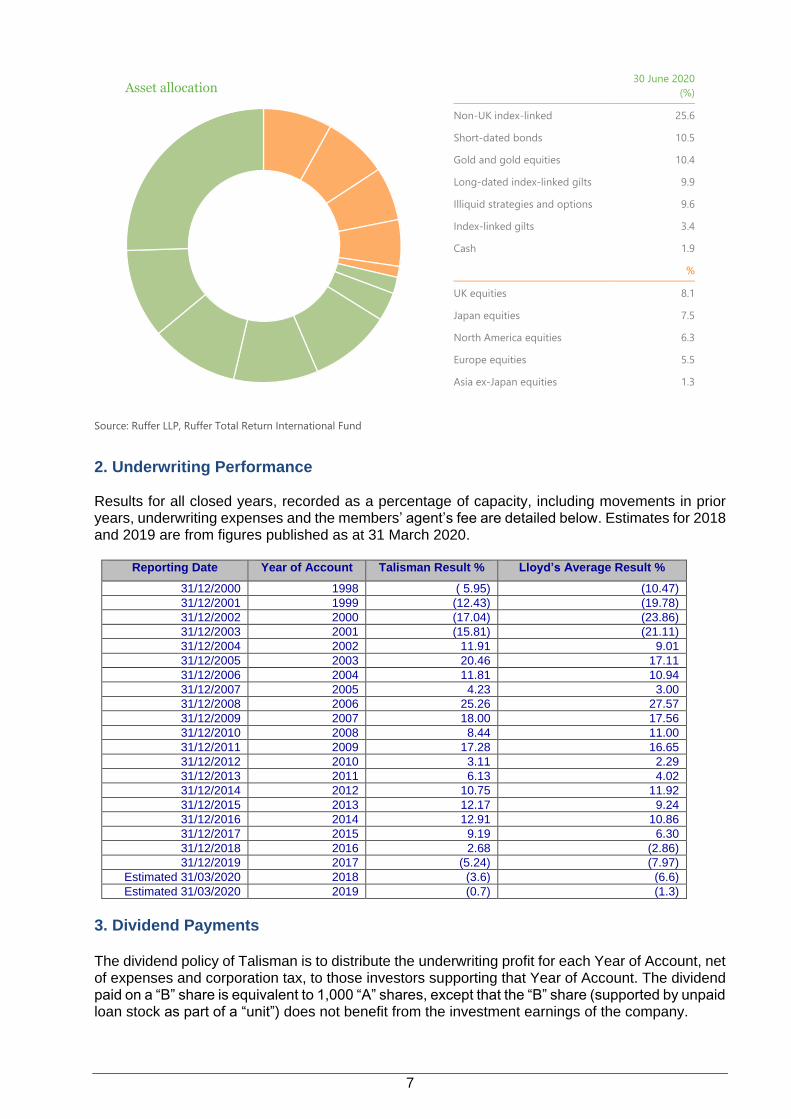
Asset allocation
30 June 2020
(%)
Non-UK index-linked 25.6
Short-dated bonds 10.5
Gold and gold equities 10.4
Long-dated index-linked gilts 9.9
Illiquid strategies and options 9.6
Index-linked gilts 3.4
Cash 1.9
%
UK equities 8.1
Japan equities 7.5
North America equities 6.3
Europe equities 5.5
Asia ex-Japan equities 1.3
Source: Ruffer LLP, Ruffer Total Return International Fund
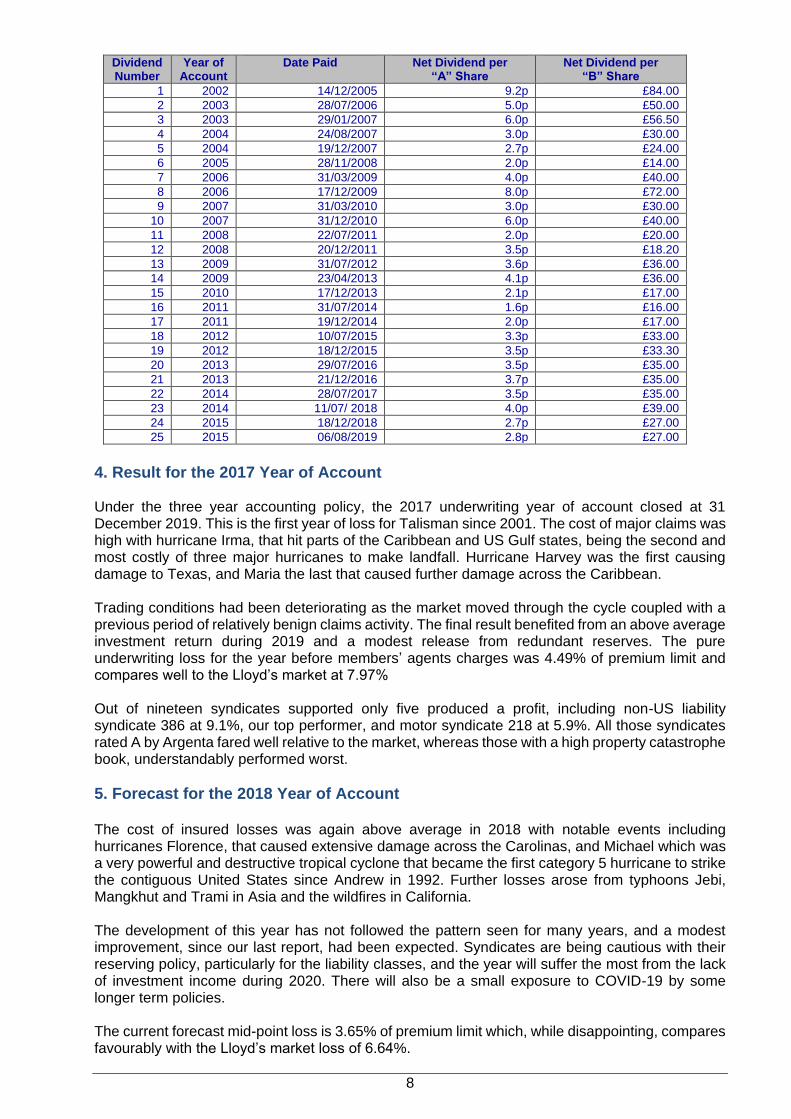
2. Underwriting Performance Results for all closed years, recorded as a percentage of capacity, including movements in prior years, underwriting expenses and the members’ agent’s fee are detailed below. Estimates for 2018 and 2019 are from figures published as at 31 March 2020.
Reporting Date Year of Account Talisman Result % Lloyd’s Average Result %
31/12/2000 1998 ( 5.95) (10.47)
31/12/2001 1999 (12.43) (19.78)
31/12/2002 2000 (17.04) (23.86)
31/12/2003 2001 (15.81) (21.11)
31/12/2004 2002 11.91 9.01
31/12/2005 2003 20.46 17.11
31/12/2006 2004 11.81 10.94
31/12/2007 2005 4.23 3.00
31/12/2008 2006 25.26 27.57
31/12/2009 2007 18.00 17.56
31/12/2010 2008 8.44 11.00
31/12/2011 2009 17.28 16.65
31/12/2012 2010 3.11 2.29
31/12/2013 2011 6.13 4.02
31/12/2014 2012 10.75 11.92
31/12/2015 2013 12.17 9.24
31/12/2016 2014 12.91 10.86
31/12/2017 2015 9.19 6.30
31/12/2018 2016 2.68 (2.86)
31/12/2019 2017 (5.24) (7.97)
Estimated 31/03/2020 2018 (3.6) (6.6)
Estimated 31/03/2020 2019 (0.7) (1.3)
3. Dividend Payments The dividend policy of Talisman is to distribute the underwriting profit for each Year of Account, net of expenses and corporation tax, to those investors supporting that Year of Account. The dividend paid on a “B” share is equivalent to 1,000 “A” shares, except that the “B” share (supported by unpaid loan stock as part of a “unit”) does not benefit from the investment earnings of the company.
8
Dividend Number
Year of Account
Date Paid Net Dividend per “A” Share
Net Dividend per “B” Share
1 2002 14/12/2005 9.2p £84.00
2 2003 28/07/2006 5.0p £50.00
3 2003 29/01/2007 6.0p £56.50
4 2004 24/08/2007 3.0p £30.00
5 2004 19/12/2007 2.7p £24.00
6 2005 28/11/2008 2.0p £14.00
7 2006 31/03/2009 4.0p £40.00
8 2006 17/12/2009 8.0p £72.00
9 2007 31/03/2010 3.0p £30.00
10 2007 31/12/2010 6.0p £40.00
11 2008 22/07/2011 2.0p £20.00
12 2008 20/12/2011 3.5p £18.20
13 2009 31/07/2012 3.6p £36.00
14 2009 23/04/2013 4.1p £36.00
15 2010 17/12/2013 2.1p £17.00
16 2011 31/07/2014 1.6p £16.00
17 2011 19/12/2014 2.0p £17.00
18 2012 10/07/2015 3.3p £33.00
19 2012 18/12/2015 3.5p £33.30
20 2013 29/07/2016 3.5p £35.00
21 2013 21/12/2016 3.7p £35.00
22 2014 28/07/2017 3.5p £35.00
23 2014 11/07/ 2018 4.0p £39.00
24 2015 18/12/2018 2.7p £27.00
25 2015 06/08/2019 2.8p £27.00
4. Result for the 2017 Year of Account Under the three year accounting policy, the 2017 underwriting year of account closed at 31 December 2019. This is the first year of loss for Talisman since 2001. The cost of major claims was high with hurricane Irma, that hit parts of the Caribbean and US Gulf states, being the second and most costly of three major hurricanes to make landfall. Hurricane Harvey was the first causing damage to Texas, and Maria the last that caused further damage across the Caribbean. Trading conditions had been deteriorating as the market moved through the cycle coupled with a previous period of relatively benign claims activity. The final result benefited from an above average investment return during 2019 and a modest release from redundant reserves. The pure underwriting loss for the year before members’ agents charges was 4.49% of premium limit and compares well to the Lloyd’s market at 7.97% Out of nineteen syndicates supported only five produced a profit, including non-US liability syndicate 386 at 9.1%, our top performer, and motor syndicate 218 at 5.9%. All those syndicates rated A by Argenta fared well relative to the market, whereas those with a high property catastrophe book, understandably performed worst.
5. Forecast for the 2018 Year of Account The cost of insured losses was again above average in 2018 with notable events including hurricanes Florence, that caused extensive damage across the Carolinas, and Michael which was a very powerful and destructive tropical cyclone that became the first category 5 hurricane to strike the contiguous United States since Andrew in 1992. Further losses arose from typhoons Jebi, Mangkhut and Trami in Asia and the wildfires in California. The development of this year has not followed the pattern seen for many years, and a modest improvement, since our last report, had been expected. Syndicates are being cautious with their reserving policy, particularly for the liability classes, and the year will suffer the most from the lack of investment income during 2020. There will also be a small exposure to COVID-19 by some longer term policies. The current forecast mid-point loss is 3.65% of premium limit which, while disappointing, compares favourably with the Lloyd’s market loss of 6.64%.
9
6. Forecast for the 2019 Year of Account The major catastrophes for the year were typhoons Faxai and Hagibis, which struck Japan and caused extensive wind and flood damage together with hurricane Dorian, which was a powerful category five storm that devastated parts of the Bahamas. Other notable events were the wildfires in Australia and the US, as well as the Chilean riots. The first forecasts from the syndicates at 31 March 2020 show a midpoint loss of 0.7% of premium limit compared to the Lloyd’s market loss of 1.3%. Due to inception date accounting a major portion of the COVID-19 loss will fall to this year. We shall be monitoring events very carefully to more fully understand the impact of COVID-19 on the market and syndicates as we move through the year. Nonetheless it should be noted that trading conditions for many classes of business were much improved over 2018 and that the claims pattern for the year will not be normal consequent to the lockdowns across the globe and the reduction in economic activity affecting so many businesses. The final result will depend on claims activity until the end of this year, investment earnings during 2021 and the level of redundant reserves at closure. We keep an open mind but a profit is still possible.
7. Portfolio Planning
Syndicate Split 2020 Syndicate selection is key to Talisman’s success and almost 50% of capacity is allocated to the four syndicates rated A by Argenta, being numbers 33, 609, 623 and 2791. That amount increases to 85% when the five B+ rated syndicates are added. Talisman is fortunate that it benefitted from the pre-emptions on the ‘light touch’ and other highly rated syndicates such that, having taken into account the capacity acquired through the three acquisitions, the only capacity required to be purchased at auction was on syndicate 386. With the overall capacity of Talisman increasing from £25m to £29m, that capacity was obtained to maintain the syndicate’s participation at around 6%.
The participation on motor syndicate 218 was dropped and compensated for by the pre-emptions and increases on the Blenheim syndicate 5886 and the Beazley smart tracker 5623 both of which retain a positive outlook by Argenta and come as limited tenancy capacity at no cost. Full details are given in Section II.
19.90%
19.00%
11.74%10.54%
7.37%
6.00%
5.55%
4.80%
4.32%3.66%
7.11%33
510
609
623
2791
386
2121
5886
2010
4444
Other
10
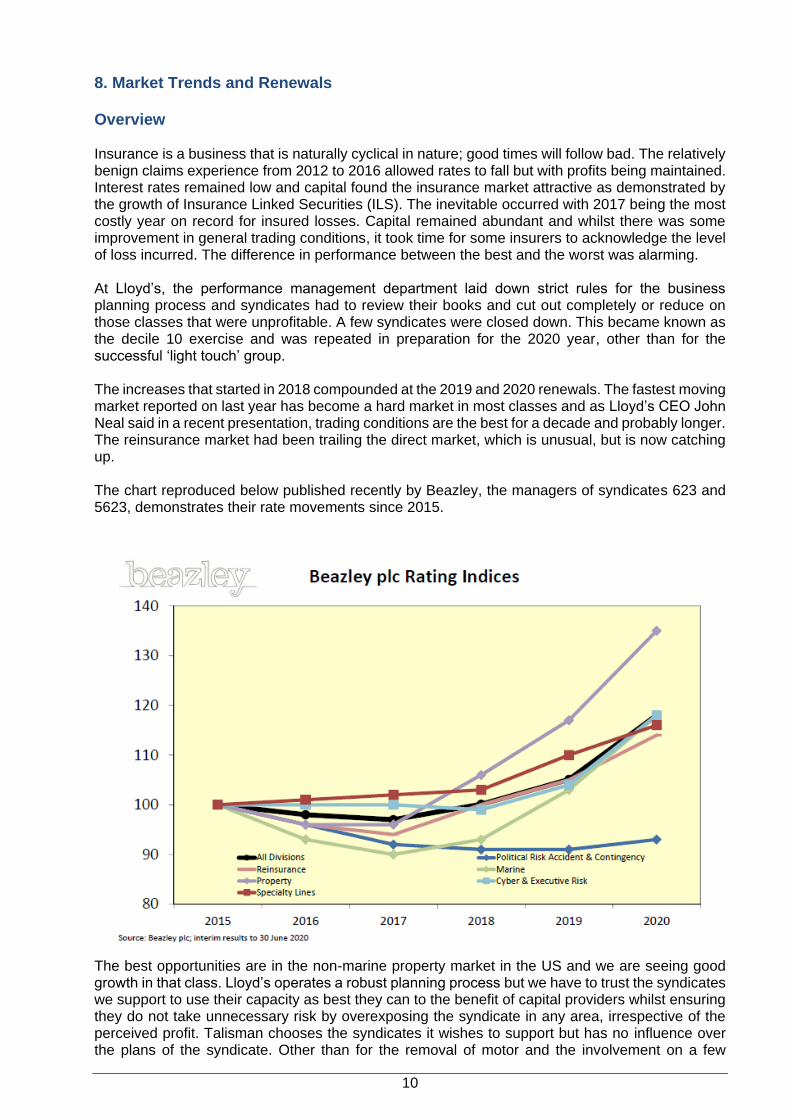
8. Market Trends and Renewals Overview Insurance is a business that is naturally cyclical in nature; good times will follow bad. The relatively benign claims experience from 2012 to 2016 allowed rates to fall but with profits being maintained. Interest rates remained low and capital found the insurance market attractive as demonstrated by the growth of Insurance Linked Securities (ILS). The inevitable occurred with 2017 being the most costly year on record for insured losses. Capital remained abundant and whilst there was some improvement in general trading conditions, it took time for some insurers to acknowledge the level of loss incurred. The difference in performance between the best and the worst was alarming. At Lloyd’s, the performance management department laid down strict rules for the business planning process and syndicates had to review their books and cut out completely or reduce on those classes that were unprofitable. A few syndicates were closed down. This became known as the decile 10 exercise and was repeated in preparation for the 2020 year, other than for the successful ‘light touch’ group. The increases that started in 2018 compounded at the 2019 and 2020 renewals. The fastest moving market reported on last year has become a hard market in most classes and as Lloyd’s CEO John Neal said in a recent presentation, trading conditions are the best for a decade and probably longer. The reinsurance market had been trailing the direct market, which is unusual, but is now catching up. The chart reproduced below published recently by Beazley, the managers of syndicates 623 and 5623, demonstrates their rate movements since 2015.
The best opportunities are in the non-marine property market in the US and we are seeing good growth in that class. Lloyd’s operates a robust planning process but we have to trust the syndicates we support to use their capacity as best they can to the benefit of capital providers whilst ensuring they do not take unnecessary risk by overexposing the syndicate in any area, irrespective of the perceived profit. Talisman chooses the syndicates it wishes to support but has no influence over the plans of the syndicate. Other than for the removal of motor and the involvement on a few
11
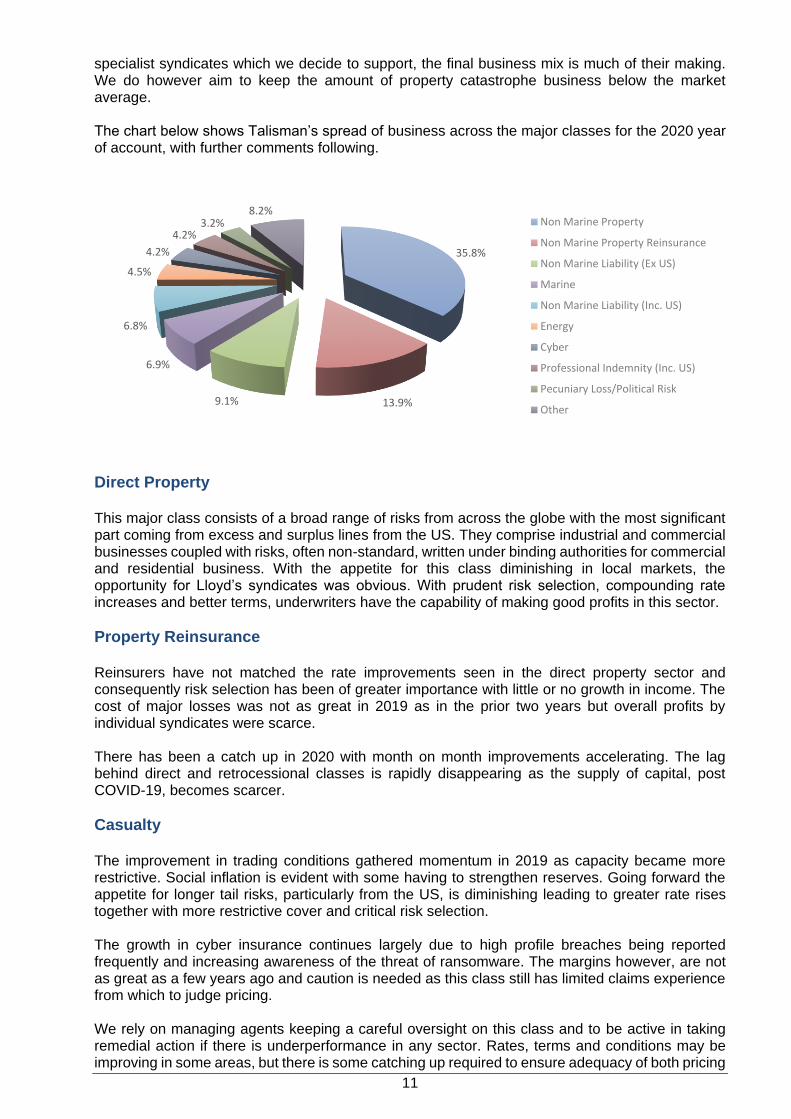
specialist syndicates which we decide to support, the final business mix is much of their making. We do however aim to keep the amount of property catastrophe business below the market average. The chart below shows Talisman’s spread of business across the major classes for the 2020 year of account, with further comments following.
Direct Property This major class consists of a broad range of risks from across the globe with the most significant part coming from excess and surplus lines from the US. They comprise industrial and commercial businesses coupled with risks, often non-standard, written under binding authorities for commercial and residential business. With the appetite for this class diminishing in local markets, the opportunity for Lloyd’s syndicates was obvious. With prudent risk selection, compounding rate increases and better terms, underwriters have the capability of making good profits in this sector.
Property Reinsurance Reinsurers have not matched the rate improvements seen in the direct property sector and consequently risk selection has been of greater importance with little or no growth in income. The cost of major losses was not as great in 2019 as in the prior two years but overall profits by individual syndicates were scarce. There has been a catch up in 2020 with month on month improvements accelerating. The lag behind direct and retrocessional classes is rapidly disappearing as the supply of capital, post COVID-19, becomes scarcer.
Casualty The improvement in trading conditions gathered momentum in 2019 as capacity became more restrictive. Social inflation is evident with some having to strengthen reserves. Going forward the appetite for longer tail risks, particularly from the US, is diminishing leading to greater rate rises together with more restrictive cover and critical risk selection. The growth in cyber insurance continues largely due to high profile breaches being reported frequently and increasing awareness of the threat of ransomware. The margins however, are not as great as a few years ago and caution is needed as this class still has limited claims experience from which to judge pricing. We rely on managing agents keeping a careful oversight on this class and to be active in taking remedial action if there is underperformance in any sector. Rates, terms and conditions may be improving in some areas, but there is some catching up required to ensure adequacy of both pricing
35.8%
13.9%9.1%
6.9%
6.8%
4.5%
4.2%
4.2%3.2%
8.2%Non Marine Property
Non Marine Property Reinsurance
Non Marine Liability (Ex US)
Marine
Non Marine Liability (Inc. US)
Energy
Cyber
Professional Indemnity (Inc. US)
Pecuniary Loss/Political Risk
Other
12
and reserves. The increase in the use of litigation funding and higher jury awards only serve to highlight the critical analysis required of management.
Marine Lloyd’s continues to lead the world in this class but the decile 10 exercise led to many withdrawing or reducing exposures in the hull, cargo and yacht classes for 2019. This led to an improving performance for those who remained. This trend should continue through 2020 with strong underwriting discipline persisting. However, the impact of COVID-19 on economic activity will be material for some time making income levels for the future far less predictable.
Energy The direction of pricing was positive in 2019 with downstream property and liability gaining most following a disappointing performance emanating principally from US refinery losses. Momentum continues with improvements in both rates and policy terms. In contrast, upstream losses have been below average and capacity is sufficient to meet the increasing capacity required by clients.
Aviation The aviation market has seen increased claims activity arising from the grounding of the Boeing 737 Max fleet and from the space account. However, there was a positive movement in trading conditions during 2019 as some underwriters withdrew from this sector. As with marine, and probably more so, the global reduction in economic activity will have a major impact on income, albeit with a corresponding reduction in exposure, although the correlation between the two may prove not to be the same.
Motor Talisman withdrew its support for motor syndicate 218 for the 2020 year of account following the recommendation from Argenta to all clients to cease support. Although 2017 closed with a profit, the outlook remains challenging and very competitive. The syndicate’s expense ratio compares unfavourably with its peers and Brexit may increase the cost of spares and introduce delays adding further to car hire charges. Although writing this business requires little capital, due to the diversification it brings to the portfolio, the uncertainties and weaknesses of trading conditions we believe outweigh any benefits. Like 2017, the 2019 year is looking profitable which will be a welcome end to our long association with this syndicate.
13
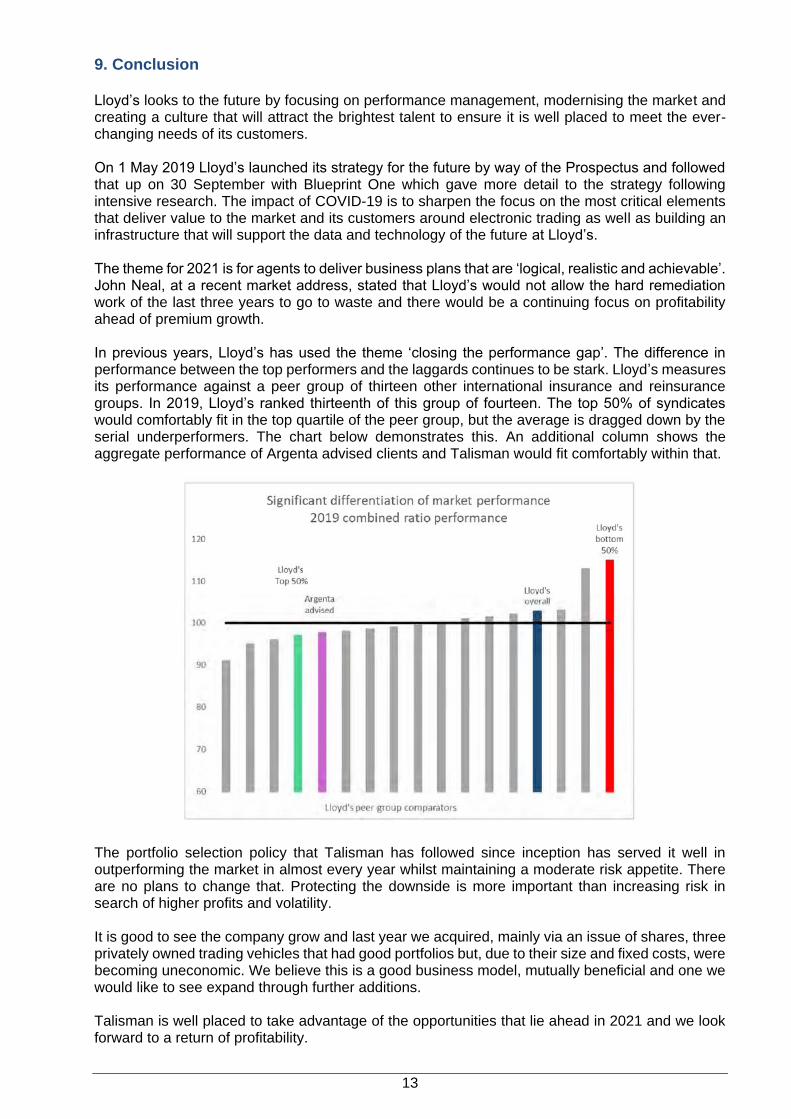
9. Conclusion Lloyd’s looks to the future by focusing on performance management, modernising the market and creating a culture that will attract the brightest talent to ensure it is well placed to meet the ever-changing needs of its customers. On 1 May 2019 Lloyd’s launched its strategy for the future by way of the Prospectus and followed that up on 30 September with Blueprint One which gave more detail to the strategy following intensive research. The impact of COVID-19 is to sharpen the focus on the most critical elements that deliver value to the market and its customers around electronic trading as well as building an infrastructure that will support the data and technology of the future at Lloyd’s. The theme for 2021 is for agents to deliver business plans that are ‘logical, realistic and achievable’. John Neal, at a recent market address, stated that Lloyd’s would not allow the hard remediation work of the last three years to go to waste and there would be a continuing focus on profitability ahead of premium growth. In previous years, Lloyd’s has used the theme ‘closing the performance gap’. The difference in performance between the top performers and the laggards continues to be stark. Lloyd’s measures its performance against a peer group of thirteen other international insurance and reinsurance groups. In 2019, Lloyd’s ranked thirteenth of this group of fourteen. The top 50% of syndicates would comfortably fit in the top quartile of the peer group, but the average is dragged down by the serial underperformers. The chart below demonstrates this. An additional column shows the aggregate performance of Argenta advised clients and Talisman would fit comfortably within that.
The portfolio selection policy that Talisman has followed since inception has served it well in outperforming the market in almost every year whilst maintaining a moderate risk appetite. There are no plans to change that. Protecting the downside is more important than increasing risk in search of higher profits and volatility. It is good to see the company grow and last year we acquired, mainly via an issue of shares, three privately owned trading vehicles that had good portfolios but, due to their size and fixed costs, were becoming uneconomic. We believe this is a good business model, mutually beneficial and one we would like to see expand through further additions. Talisman is well placed to take advantage of the opportunities that lie ahead in 2021 and we look forward to a return of profitability.

14
SECTION II
15
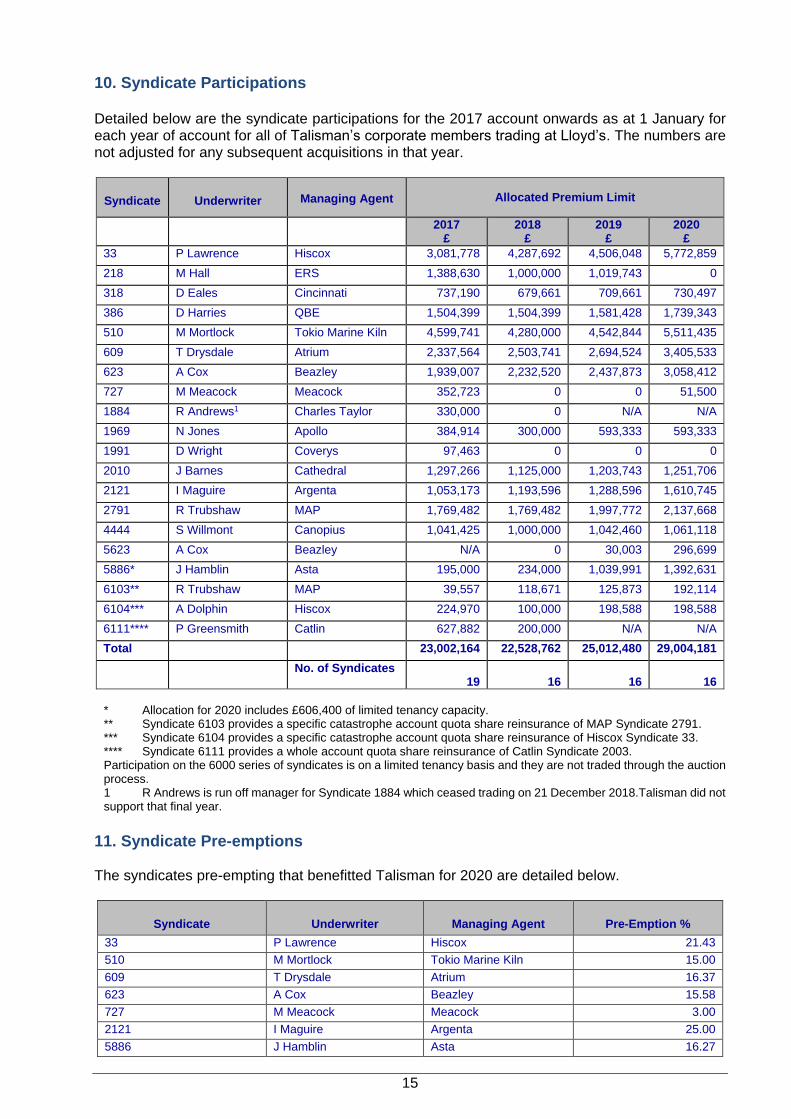
10. Syndicate Participations Detailed below are the syndicate participations for the 2017 account onwards as at 1 January for each year of account for all of Talisman’s corporate members trading at Lloyd’s. The numbers are not adjusted for any subsequent acquisitions in that year.
Syndicate Underwriter
Managing Agent Allocated Premium Limit
2017 £
2018 £
2019 £
2020 £
33 P Lawrence Hiscox 3,081,778 4,287,692 4,506,048 5,772,859
218 M Hall ERS 1,388,630 1,000,000 1,019,743 0
318 D Eales Cincinnati 737,190 679,661 709,661 730,497
386 D Harries QBE 1,504,399 1,504,399 1,581,428 1,739,343
510 M Mortlock Tokio Marine Kiln 4,599,741 4,280,000 4,542,844 5,511,435
609 T Drysdale Atrium 2,337,564 2,503,741 2,694,524 3,405,533
623 A Cox Beazley 1,939,007 2,232,520 2,437,873 3,058,412
727 M Meacock Meacock 352,723 0 0 51,500
1884 R Andrews1 Charles Taylor 330,000 0 N/A N/A
1969 N Jones Apollo 384,914 300,000 593,333 593,333
1991 D Wright Coverys 97,463 0 0 0
2010 J Barnes Cathedral 1,297,266 1,125,000 1,203,743 1,251,706
2121 I Maguire Argenta 1,053,173 1,193,596 1,288,596 1,610,745
2791 R Trubshaw MAP 1,769,482 1,769,482 1,997,772 2,137,668
4444 S Willmont Canopius 1,041,425 1,000,000 1,042,460 1,061,118
5623 A Cox Beazley N/A 0 30,003 296,699
5886* J Hamblin Asta 195,000 234,000 1,039,991 1,392,631
6103** R Trubshaw MAP 39,557 118,671 125,873 192,114
6104*** A Dolphin Hiscox 224,970 100,000 198,588 198,588
6111**** P Greensmith Catlin 627,882 200,000 N/A N/A
Total 23,002,164 22,528,762 25,012,480 29,004,181
No. of Syndicates 19
16
16 16
* Allocation for 2020 includes £606,400 of limited tenancy capacity. ** Syndicate 6103 provides a specific catastrophe account quota share reinsurance of MAP Syndicate 2791. *** Syndicate 6104 provides a specific catastrophe account quota share reinsurance of Hiscox Syndicate 33. **** Syndicate 6111 provides a whole account quota share reinsurance of Catlin Syndicate 2003. Participation on the 6000 series of syndicates is on a limited tenancy basis and they are not traded through the auction process. 1 R Andrews is run off manager for Syndicate 1884 which ceased trading on 21 December 2018.Talisman did not support that final year.
11. Syndicate Pre-emptions The syndicates pre-empting that benefitted Talisman for 2020 are detailed below.
Syndicate Underwriter Managing Agent Pre-Emption %
33 P Lawrence Hiscox 21.43
510 M Mortlock Tokio Marine Kiln 15.00
609 T Drysdale Atrium 16.37
623 A Cox Beazley 15.58
727 M Meacock Meacock 3.00
2121 I Maguire Argenta 25.00
5886 J Hamblin Asta 16.27
16
12. Syndicate Capacity Purchased The syndicate capacity purchased by Talisman at the 2019 auctions is detailed below.
Syndicate Managing Agent Capacity Cost £
386 QBE 117,263 84,687
13. Corporate Members Purchased The following capacity, net of pre-emptions, was obtained through the purchase of 3 corporate members during 2019:
Syndicate Nameco No. 420 St. Albans LLP Swann LLP Total
33 116,669 83,125 48,277 248,071
318 0 0 20,836 20,836
386 0 22,000 18,652 40,652
510 96,300 93,702 59,706 249,708
609 96,398 92,776 42,844 232,018
623 100,784 77,796 29,681 208,261
727 50,000 0 0 50,000
2010 0 25,000 22,963 47,963
2791 69,948 46,631 23,317 139,896
4444 0 0 18,658 18,658
5623 0 0 10,000 10,000
5886 71,667 35,833 28,667 136,167
6103 25,000 0 0 25,000
Total 626,766 476,863 323,601 1,427,230
14. Syndicate Ratings Syndicate ratings are calculated using various indicators that Argenta has used in determining support for individual syndicates. These include quantitative issues such as past performance, the prudence of reserves, potential volatility in returns, the security behind the reinsurance programme and the level of delegated authority given by a syndicate to third parties. In addition, qualitative issues, such as the managing agent’s operational and governance structure, its strategy and its alignment of interest with capital providers are also taken into account. These are combined to produce an overall rating for each syndicate that ranges from “A” to “D”. The table below shows the bias toward better rated syndicates and provides a comparison with the previous 2 years.
Rating Talisman % Market %
2020 2019 2018 2020 2019 2018
A 49.6 46.5 52.9 46.5 44.9 46.7
B+ 35.5 35.7 27.5 30.7 31.2 23.8
B 4.5 4.2 12.8 6.0 6.5 9.8
C+ 0 2.4 1.3 0 1.3 2.6
C 10.4 11.2 5.5 11.7 16.1 16.5
D 0 0 0 5.1 0 0.6
17
15. Risk Ratings The Risk Rating has been compiled as an indicator of the level of each syndicate’s trading and management risk as perceived by Argenta. “Risk” may be defined, in this context, as the likelihood of the syndicate suffering a large, above average, loss as assessed by reference to a number of quantitative and qualitative criteria as follows:
The Syndicate Capital Requirements produced by Lloyd’s (reflecting the volatility of the business written;
The volatility of past syndicate results;
The exposure to catastrophic loss (as determined by syndicates’ Realistic Disaster Scenarios);
The exposure to reinsurance failure;
The quality of the managing agent. The Risk Rating is not therefore a measure of potential profitability. Nor does the fact that a syndicate has a lower rating mean that it will not suffer a large loss. Rather, a lower rating would suggest that, based on a number of objective tests, followed by a subjective assessment, the syndicate is thought less likely to suffer an abnormally large loss. Insurance is inherently a high risk business and therefore the emphasis of this analysis is on relative risk. The table below demonstrates the bias away from higher risk syndicates in comparison to the market.
Rating Talisman % Market %
2020 2019 2018 2020 2019 2018
Very High 1.3 1.3 1.0 5.2 5.8 5.8
Higher 7.3 0.1 0.0 9.7 6.8 9.0
Medium to Higher 30.2 51.7 47.6 30.5 47.7 45.8
Medium 61.2 46.9 51.4 54.6 39.7 39.4
16. Business Split Analysis The table below shows the estimated business split of Talisman for the 2020 Year of Account. As a comparison, we show the market average for all capacity available to third party capital providers and the figures for 2018 and 2019. The categories used are based on the estimated split of account supplied by syndicates in their 2020 business forecasts and adjusted to take account of the level of premium income forecast to be written. The initial risk codes supplied by syndicates are numerous, accordingly Argenta combines these initial codes into the broader categories shown.
Risk Category Talisman % Market Average %
2020 2019 2018 2020 2019 2018
Non Marine Property 35.8 32.2 33.6 33.7 30.9 30.3
Non Marine Property Reinsurance 13.9 14.1 14.4 15.4 16.3 18.0
Non Marine Liability (Ex US) 9.1 9.1 9.6 7.9 8.4 7.7
Marine 6.9 6.2 7.2 6.0 5.0 6.8
Non Marine Liability (Inc. US) 6.8 6.7 8.9 6.6 7.1 9.6
Energy 4.5 4.8 4.1 4.1 4.3 3.5
Cyber 4.2 4.2 - 4.9 4.7 -
Professional Indemnity (Inc. US) 4.2 4.0 4.3 5.0 4.7 4.3
Pecuniary Loss/Political Risk 3.2 3.4 3.0 3.0 3.1 2.8
Professional Indemnity (Ex US) 3.2 3.1 3.0 2.9 3.0 2.7
Accident & Health 2.9 2.8 3.8 2.7 2.8 3.6
Aviation 2.7 2.3 2.0 2.3 2.0 1.7
Aviation Reinsurance 2.7 0.6 0.5 2.3 0.6 0.6
Marine Reinsurance 1.1 1.1 1.1 1.1 1.0 0.9
Space & Satellite 0.5 0.5 0.5 0.4 0.5 0.5
Non Marine Liability Reinsurance 0.4 0.8 0.8 0.7 1.2 1.2
UK Motor 0.1 4.1 3.3 2.9 3.8 5.1
18
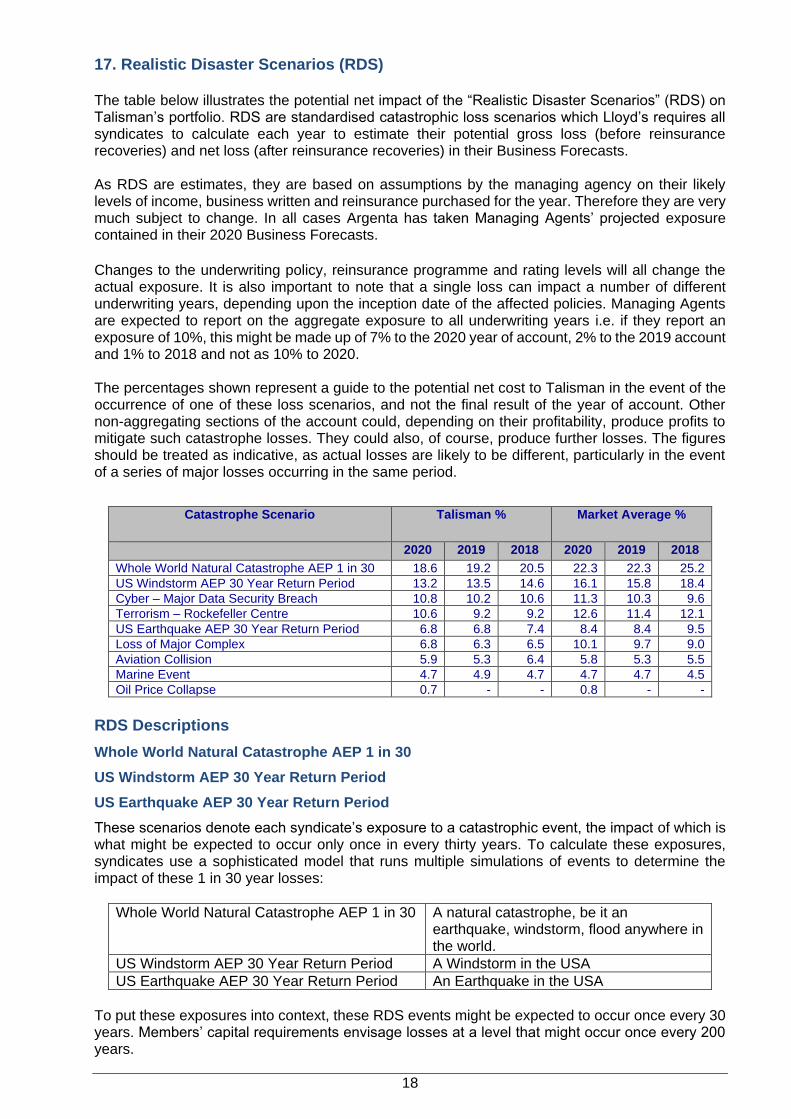
17. Realistic Disaster Scenarios (RDS) The table below illustrates the potential net impact of the “Realistic Disaster Scenarios” (RDS) on Talisman’s portfolio. RDS are standardised catastrophic loss scenarios which Lloyd’s requires all syndicates to calculate each year to estimate their potential gross loss (before reinsurance recoveries) and net loss (after reinsurance recoveries) in their Business Forecasts. As RDS are estimates, they are based on assumptions by the managing agency on their likely levels of income, business written and reinsurance purchased for the year. Therefore they are very much subject to change. In all cases Argenta has taken Managing Agents’ projected exposure contained in their 2020 Business Forecasts.
Changes to the underwriting policy, reinsurance programme and rating levels will all change the actual exposure. It is also important to note that a single loss can impact a number of different underwriting years, depending upon the inception date of the affected policies. Managing Agents are expected to report on the aggregate exposure to all underwriting years i.e. if they report an exposure of 10%, this might be made up of 7% to the 2020 year of account, 2% to the 2019 account and 1% to 2018 and not as 10% to 2020. The percentages shown represent a guide to the potential net cost to Talisman in the event of the occurrence of one of these loss scenarios, and not the final result of the year of account. Other non-aggregating sections of the account could, depending on their profitability, produce profits to mitigate such catastrophe losses. They could also, of course, produce further losses. The figures should be treated as indicative, as actual losses are likely to be different, particularly in the event of a series of major losses occurring in the same period.
Catastrophe Scenario Talisman % Market Average %
2020 2019 2018 2020 2019 2018
Whole World Natural Catastrophe AEP 1 in 30 18.6 19.2 20.5 22.3 22.3 25.2
US Windstorm AEP 30 Year Return Period 13.2 13.5 14.6 16.1 15.8 18.4
Cyber – Major Data Security Breach 10.8 10.2 10.6 11.3 10.3 9.6
Terrorism – Rockefeller Centre 10.6 9.2 9.2 12.6 11.4 12.1
US Earthquake AEP 30 Year Return Period 6.8 6.8 7.4 8.4 8.4 9.5
Loss of Major Complex 6.8 6.3 6.5 10.1 9.7 9.0
Aviation Collision 5.9 5.3 6.4 5.8 5.3 5.5
Marine Event 4.7 4.9 4.7 4.7 4.7 4.5
Oil Price Collapse 0.7 - - 0.8 - -
RDS Descriptions
Whole World Natural Catastrophe AEP 1 in 30
US Windstorm AEP 30 Year Return Period
US Earthquake AEP 30 Year Return Period
These scenarios denote each syndicate’s exposure to a catastrophic event, the impact of which is what might be expected to occur only once in every thirty years. To calculate these exposures, syndicates use a sophisticated model that runs multiple simulations of events to determine the impact of these 1 in 30 year losses:
Whole World Natural Catastrophe AEP 1 in 30 A natural catastrophe, be it an earthquake, windstorm, flood anywhere in the world.
US Windstorm AEP 30 Year Return Period A Windstorm in the USA
US Earthquake AEP 30 Year Return Period An Earthquake in the USA
To put these exposures into context, these RDS events might be expected to occur once every 30 years. Members’ capital requirements envisage losses at a level that might occur once every 200 years.
19
In syndicates’ 2020 business plans, exposures are based on the modelling output typically used for reinsurance purchase which better explains how frequently a given loss might be expected to occur over a prolonged (many hundreds of years) period. These models are also extensively used in determining the level of capital required for a syndicate to be resilient to the size of loss that can be expected to recur once every 200 years. The parameter that Lloyd’s uses is called the Aggregate Exceedance Probability (or AEP) and it calculates the total loss that the syndicate would expect to experience once every thirty years arising out of the particular peril. Therefore, a “1 in 30 year US Wind AEP” describes the anticipated loss from all US wind events in a single year that would be expected to recur once in thirty years. Note the word “aggregate” in AEP means that this exposure could be consequent upon a single large event, or a combination of smaller events. Aviation Collision
Assumes a collision between two aircraft over a major city, anywhere in the world, using the syndicate’s two highest airline exposures. Assumes a total liability loss of up to US$4 billion, comprising of up to US$2 billion per airline and any balance up to US$1 billion from an air traffic control liability policy(ies) and/or a major product manufacturer’s product liability policy(ies), where applicable. Consideration should also be given to other exposures on the ground. Cyber Attack
A series of simultaneous cyber-attacks are launched on large multinational organisations across one industrial sector with the intention of causing major disruption and financial loss to organisations. During the attacks, customer data (e.g. internet protocol address, credit card details and other information) is lost. The attacks target vulnerabilities in the operating systems, web applications and/or software used by these organisations. For the purposes of this exercise it is assumed that multiple systems and/or multiple organisations using the same systems/software are affected. The hacking attacks may take the form of a virus, or an alternative vector of attack. As a result of the breach, customer management and trading systems, networks and supply chains are disrupted at these organisations for a duration of 24 hours. Assumes the ten largest clients worldwide are targeted, in the sector with the greatest exposure and that all client data at these organisations is lost, that class actions are pursued and there will be organisations that face third party liability claims Loss of Major Complex
Assumes a total loss to all platforms and bridge links of a major complex. Includes property damage, removal of wreckage, liabilities, loss of production income and capping of the well.
Marine Collision
A cruise vessel carrying 2,000 passengers and 800 staff and crew is involved in a high-energy collision with a fully laden tanker of greater than 50,000 DWT with 20 crew. The incident involves the tanker sinking and spilling its cargo; there are injuries and loss of lives aboard both vessels. Assumes an apportionment of negligence of 30% to the tanker owner and 70% to the cruise vessel and that the collision occurs in US waters. Assumes that the cost of pollution clean-up and compensation fund amounts to US$2 billion. This would result in claims against the International Group of P&I Associations’ General Excess of Loss Reinsurance Programme, and any other covers that might be in force. Assumes an additional compensation to all passengers and crew for death, injury or other costs of USD1.15 billion and removal of wreck for the Tanker of USD100m. The cruise ship is severely damaged but is towed back to a safe harbour (repair estimate US$50m and US$10m for salvage operations).
20
Oil Price Collapse This is a new scenario for the 2020 business planning process. It considers loss implications for the political risk and trade credit markets in the event of a sharp and sustained fall in the price of oil. Parameters are the impact of a sudden fall in oil prices of 70% with no recovery in prices for at least two years. Managing agents are required to consider their exposures to a series of countries, ranked according to vulnerability into high, medium and low risk producers. Factors by nation include economic vulnerability, fuel export dependence, national credit ratings and the nation’s required breakeven price of oil. Analysis should include policies written in political risk and credit classes including contract frustration, confiscation, expropriation, nationalisation and deprivation, political violence and war on land. Terrorism
Rockefeller Centre Event - The Midtown Manhattan area, New York, at 11:00am on 1st January suffers a 2-tonne bomb blast attack causing collapse and fire following within a radius of 200m, massive debris damage to surrounding properties up to a radius of 400m and light debris damage to surrounding properties up to a radius of 500m. 1,000 blue/white collar worker deaths and 2,500 injuries in total. Overland/underground transport systems are partially damaged, leading to significant business interruption exposure for a period of three months. All possible affected business classes should be included in the calculations, such as Contingent Business Interruption and Specie/Fine Art.
21
THE COMPANY Chairman Peter Steel
Directors
Robert Eaton David Monksfield Paul Sandilands
Company Secretary Graham Hodgson
Registered Office 70 Gracechurch Street London EC3V 0XL Tel: 020 7825 7139 Email: [email protected] www.talismanunderwritingplc.com
Company
Registration Number 03370297
ADVISORS Auditors PKF Littlejohn LLP
Statutory Auditor 1 Westferry Circus Canary Wharf London E14 4HD
Bankers Coutts & Co
440 The Strand London WC2R 0QS
Fund Manager Ruffer LLP
80 Victoria Street London SW1E 5JL
Members’ Agent Argenta Private Capital Limited
70 Gracechurch Street London EC3V 0XL
Solicitors Mills & Reeve LLP Botanic House
100 Hills Road Cambridge CB2 1PH
22


![RENAULT TALISMAN [2016+] 31110 RENAULT TALISMAN … · 31110 1.0 28/09/2018 2 31110 renault talisman renault talisman grandtour [2016+] [2016+] type rfd kg s = 100 e3 55r-01 7907](https://img.pdfslide.net/doc/110x75/5ed0802b8862292f7d0cdc2a/renault-talisman-2016-31110-renault-talisman-31110-10-28092018-2-31110-renault.jpg)