Embed Size (px)
Citation preview
1 Number as at date of the report
Report on the first three quarters of the year 2017 for EP Energy, a.s.
1
Consolidated sales reached EUR 1,290 million Consolidated EBITDA totaled EUR 260 million Consolidated pro forma adjusted EBITDA for last twelve
months amounted to EUR 351 million Indicative Net Consolidated Leverage Ratio amounted to 1.8x On June 20, 2017 Fitch affirmed the EP Energy´s Group rating
at BB+, Stable Outlook
EP Energy, a.s. (”group” or “Group” or “EPE” or “EPE Group“) is a vertically integrated
energy utility that include 571 companies. In 2017 the Group was the leading heat supplier in the Czech Republic, one of major power generators in the Czech Republic and the second largest electricity distributor in Slovakia. The Group benefits from relatively low exposure to market developments, as a significant majority of EBITDA is generated by regulated assets or assets with long term off take contracts. The Group’s key operations are located in the Czech Republic, Slovak Republic and Hungary.

KEY FIGURES AT A GLANCE
Consolidated financial results in EUR millions
1-9 2016 1-9 2017
Sales 1,327 1,290 EBITDA1 196 260 Pro forma Adjusted EBITDA (last twelve months)2 351 Total net debt per financial statements3 662 Indicative EP Energy Net Consolidated Leverage Ratio 4 1.8x Profit from operations 72 155 Profit before tax 119 104 Net profit /(loss) attrib. to EP Energy owners 65 31 Total assets 2,621 CAPEX5 84 63
Operating highlights (EPE excluding SSE)6
1-9 2016 1-9 2017
Installed cogeneration Capacity ..... MWe 894 894
Installed condensation Capacity .... MWe 360 360
Installed heat capacity7 ................. MWth 3,331 3,276
Heat supplied ................................ TJ8 14,311 14,606
Power produced………………….……... GWh 2,049 2,731
Power traded9 ............................... GWh 3,838 2,491
Power supplied9 ............................. GWh 1,721 1,533
Natural gas supplied9 .................... GWh 1,222 1,489
Operating highlights SSE6,9
1-9 2016 1-9 2017
Power distributed ………………………. GWh 4,315 4,546
Power traded ................................. GWh 5,335 4,453
Power supplied .............................. GWh 2,863 2,825
Natural gas supplied ...................... GWh 213 244
Power produced ………………………... GWh 16 15 Installed capacity ………………………… MWe 63 63
(1) EBITDA represents profit from operations plus depreciation of property, plant and equipment and amortization of intangible assets minus negative goodwill (if applicable). The EBITDA included in this report does not represent the term EBITDA as may be defined by any documentation for any financial liabilities of the EP Energy Group (also “EPE Group”). For further discussion over the EPE Group performance refer to the following pages.

(2) Pro forma Adjusted EBITDA (last twelve months) calculation in EUR millions:
10/2016 – 9/2017
Actual IFRS EBITDA for the period January – September 2017 260
Actual IFRS EBITDA for the period January – December 2016 293
Actual IFRS EBITDA for the period January – September 2016 (196)
Simple EBITDA (last twelve months) 357 Disposal of non-core assets adjustment (6)
Pro forma Adjusted EBITDA (last twelve months) 351 *Amounts might not sum up due to rounding
To derive Pro forma Adjusted EBITDA for the period from October 1, 2016 to September 30, 2017, EPE utilized EPE Group IFRS consolidated financial statements as of and for the year ended December 31, 2016 (EBITDA of EUR 293 million) and EPE Group IFRS condensed consolidated interim financial statements as of and for the nine-month period ended September 30, 2017 (EBITDA of EUR 260 million) with the nine-month period ended September 30, 2016 (EBITDA of EUR 196 million) as comparatives.
Pro forma Adjusted EBITDA represents pro forma profit from operations plus pro forma depreciation of property, plant and equipment and pro forma amortization of intangible assets minus pro forma negative goodwill (if applicable) further adjusted to reflect one-off result related to disposal of non-core assets made in March 2017 (EBITDA effect of EUR 6 million).
The Pro forma Adjusted EBITDA included in this report does not represent the term EBITDA as may be defined by any documentation for any financial liabilities of the EP Energy Group. For further discussion over the EPE Group performance refer to the following pages.
(3) Total net debt balance is based on the consolidated financial statements (Total Loans and borrowings plus Total Financial instruments and financial liabilities less Cash and cash equivalents), but excludes the liabilities (representing a prepayment for a dividend) towards an affiliate Pražská teplárenská Holding a.s. (also “PTH”) of EUR 13 million (December 31, 2016: EUR 14 million). The Total net debt included in this report does not represent the term Indebtedness as may be defined by any documentation for any financial liabilities of the EPE Group.
Net Debt calculation (in million EUR):
30.9.2017
Loans and borrowings (non-current) add 531
Financial instruments and financial liabilities (non-current) add 10
Loans and borrowings (current) add 630
Financial instruments and financial liabilities (current) add 6
PTH liability less 13
Cash and cash equivalents less 502
Net Debt 662
(4) We include in this report the calculation as of September 30, 2017 of our "Indicative Net Consolidated Leverage Ratio", as defined in the EP Energy Indentures. The calculation of our Net Consolidated Leverage Ratio differs from any leverage ratio included in the offering memoranda for the senior secured notes or otherwise included herein, and consistent with the definition, is made on the basis of certain good faith judgments made by us.
(5) Excluding additions related to emission allowances and goodwill and disregarding actual cash flows.

(6) The operating data is based on the results of the respective entities on a 100% basis for the full period, regardless of the date when each entity joined the EPE Group or the ownership share of the EPE Group in each entity, however the data excludes SSE, which is presented separately. Furthermore, the operating data do not include results of the German assets that are presented within discontinued operations. Specifically, the nine-month period ended September 30, 2016 includes operations of Pražská teplárenská LPZ, a.s. (“LPZ”) for five months, while period ended September 30, 2017 does not include operations of LPZ as it was disposed on June 1, 2016.
(7) Installed heat capacity on heat exchangers.
(8) 1 TJ = 0.2778 GWh.
(9) Figures relate to the Power Distribution and Supply segment only.
Difference between consolidation scope for 3Q 2016 and 3Q 2017 is described later in section: “Key factors affecting comparability of the results of operations of the EPE Group”.
Attachments:
EP Energy, a.s. - Unaudited condensed consolidated interim financial statements as of and for the nine-month period ended September 30, 2017 are presented in a separate file as an attachment to this report
CONTENT:
The word from CEO
Economy and Market development 1
Key developments in 2017 5
Reporting 7
Management’s discussion and analysis of financial
condition and results of operations 11
>> We remain focused on solid business performance, exploiting group synergies and financial performance of the Group<<
Dear investors, customers and partners,
Our first three quarters 2017 IFRS EBITDA reached EUR 260 million, which is EUR 64 million, or 33%,
higher compared to the corresponding period of the last year. The Pro forma Adjusted EBITDA for the
last twelve-month period ended September 30, 2017, reflecting full consolidation of SSE reached EUR
3512 million compared to EUR 2863 million for the fiscal year ended December 31, 2016.
The Heat Infra segment’s results, with EBITDA of EUR 102 million – up by EUR 4 million
period-on-period remain solid. Results of the segment were positively influenced by the weather
pattern triggering higher heat offtake, which almost fully balanced out low-margin heat deliveries lost
due to strategic disposal of LPZ in June 2016. LPZ comprised of several non-strategic assets including
a set of smaller scale local heat sources and related distribution network islands located predominantly
on the left bank of Vltava river in Prague. Results of the segment were also positively influenced by
EUR 6 million profit on disposal of non-core assets such as land plots and not-utilized real estate.
The results achieved by the Power Distribution and Supply segment, with EBITDA of EUR 156 million
- up by EUR 58 million period-on-period - were positively affected by accounting for compensation of
losses reported by the SSE Group as a result of subsidies paid by SSE Group to renewable energy
producers, which are compensated to the SSE Group with a delay. On the other hand, the segment
(as well as the other competitors) was impacted by negative margin realised on power supply portfolio
esp. in peak hours in January and partially in February 2017 caused primarily by spiking power and gas
spot prices and low liquidity of Slovak power market during extremely cold weather conditions in
conjunction with problems of French nuclear fleet.
The Renewables segment is significantly smaller compared to the previous two segments in terms of
installed capacity and, consequently, resulting economic performance. However, it remains an
important part of our diversified portfolio.
On behalf of the Board of Directors and everyone at EP Energy, I would like to thank you for your
ongoing support as we strive to continue creating the shareholder value while keeping our low
risk-profile.
Yours faithfully Tomáš David
Chairman of the Board and CEO
2 Adjusted for one off disposal of non-core assets held by PT Real estate totalling EUR 6 million 3 Includes adjustment reflecting the disposal of LPZ totalling EUR 7 million

1
Economy and Market developments
Economy development:
According to the preliminary estimates of the Czech Statistical Office, the Czech gross domestic product adjusted for price, seasonal, and calendar effects increased by 5.0%, year-on-year, in the first three quarters of the year 2017 and rose by 0.5% in the third quarter 2017 compared to the previous quarter. The development was attributable primarily to growing consumption of households supported by investment activities of companies. According to the preliminary estimate, performance of most of industries of the Czech economy was growing, i.e. not only that of manufacturing, but also performance of majority of economic activities (industries) of services.
According to preliminary estimates of the Slovak Statistical Office, the Slovak gross domestic product adjusted for price, seasonal, and calendar effects rose by 3.4%, year-on-year, in the third quarter 2017 and increased by 0.8% in the third quarter 2017 compared to the previous quarter.
According to preliminary estimates of the Hungarian Central Statistical Office, the Hungarian gross domestic product adjusted for price, seasonal, and calendar effects rose by 3.8%, year-on-year, in the third quarter 2017 and increased by 0.8% in the third quarter 2017 compared to the previous quarter.
The outlook for the economy development remains rather positive - according to the Czech National Bank4, the Czech GDP should increase by 4.5% in 2017 and the International Monetary Fund (also “IMF”) expects5 the Slovak GDP by 3.3% and Hungarian GDP should increase by 3.2% in 2017.
Weather:
Heat and renewable segment performance and electricity production in cogeneration mode are correlated to weather development. Seasonality is natural in the group performance (e.g. heat sales are strongest in 1Q and 4Q, accompanied by higher power production in cogeneration mode).
From the heating business perspective, the first three quarters of the year 2017 were colder than the comparative period that, however, was unusually warm. Day-degrees, the metrics representing space heating needs during the given period6, were in the areas in the Czech Republic and Hungary where we deliver the heat year-to-year 9.0% higher, which translated into higher heat consumption.
For illustration, in Prague, where we deliver heat through our subsidiary PT, average temperature during heating season 2017 (January – May) was at 6.01 °C, which is lower than 6.81 °C in the respective period 2016.
4 the most recent forecast published on November 3, 2017 5 the most recent forecast published on October 10, 2017 6 Day-degrees measure integrates the difference between reference indoor temperature and outdoor
temperature over the given period of time. A higher value indicates that the temperature in the given period was below the reference temperature for a longer period of time. Day-degrees relate to all areas where we deliver heat.

2
Source: ČHMU Prague (Czech Hydrometeorological Institute) - monthly average temperature calculated from daily averages
Heat market:
Our heat business is concentrated in the Czech Republic and in Hungary, where the market remains solid and stable. The market is regionally diversified with local natural “monopolies”, as the infrastructure for heat transportation creates substantial barriers to entry. The fuel basis varies, although the most commonly used ones in the Czech Republic are brown coal, hard coal and natural gas.
Due to our favourable cost structure (given predominantly by the fact that we produce heat in an efficient cogeneration mode and based primarily on brown coal, the most cost efficient source of primary energy), we are able to offer our customers highly competitive prices.
Heat prices in the Czech Republic are based on a “costs plus reasonable profit” mechanism, required by the legislation and regulation by the independent Energy Regulatory Office (“ERO”), which we comply with. This mechanism supports the stability of the heat segment for market participants and allows us to benefit from our favourable cost position. Given the low price levels we charge compared to market average, we are allowed to set prices (i.e. there is no tariff imposed to us) and we are only monitored by the ERO. Hungarian operations are regulated using the standard Regulated Asset Base (“RAB”) multiplied by WACC plus eligible operating expenditures and allowed depreciation formula.
Electricity and CO2 market:
During the entire year 2016 power and EU Allowance (“EUA”) prices remained rather under pressure due to low prices of hard coal driven by volume of Chinese imports and increasing subsidised renewable energy production, while power demand was rather stagnating. Recent positive development in power prices is attributable to temporary extensive closure of French nuclear reactors over safety and routine maintenance and substantial increase in hard coal prices during 2017. In the first three quarters 2017, the 1-year forward electricity prices on the European Energy Exchange (also “EEX”) increased in base load to EUR 31.0 per MWh (compared to EUR 24.9 per MWh year ago) and
-10
0
10
20
30
Jan Feb Mar Apr May Jun Jul Aug Sep Oct Nov Dec
°C Average temperature in Prague - Libuš
2016 2017Heating season

3
peak load increased to EUR 39.0 per MWh (compared to EUR 31.4 per MWh year ago), representing an increase for the base load and peak load prices of 24.5% and 24.2% respectively.7
EUA with spot delivery was traded at average around EUR 5.3 per ton in the first three quarters 20178, which represents increase of the y-t-y prices by 0.1%.
As for the Czech market, the power prices follow the German market, as the two markets are physically well interconnected. The spread between German and Czech power prices was oscillating between negative 1.0 and 0.0 EUR/MWh during 2016 and the first three quarters of 2017. Negative spread (i.e. relative drop in German power prices compared to Czech power price), which can be observed recently after years of rather positive spread, is a consequence of intensified production in German offshore wind farms. The low spreads encourage cross border trading and, vice versa, the liquidity of the Czech market increases.
7 Source: Thomson Reuters: EEX Base Year Future and Peak Year Future (simple average of the daily price for 1 year forward prices calculated for the respective year) 8Source: Thomson Reuters: EEX-EUSP3-SPOT, simple average
20,0
22,0
24,0
26,0
28,0
30,0
32,0
34,0
36,0
38,0
Jan
uar
y-1
6
Feb
ruar
y-1
6
Mar
ch-1
6
Ap
ril-
16
May
-16
Jun
e-1
6
July
-16
Au
gust
-16
Sep
tem
be
r-1
6
Oct
ob
er-
16
No
vem
be
r-1
6
De
cem
ber
-16
Jan
uar
y-1
7
Feb
ruar
y-1
7
Mar
ch-1
7
Ap
ril-
17
May
-17
Jun
e-1
7
July
-17
Au
gust
-17
Sep
tem
be
r-1
7
EUR
/MW
h
PXE Base Load CAL-17 / 18 and EEX Phelix Base Year Future
CAL 17 / 18 Phelix Base Year Future
-1,2
-1,0
-0,8
-0,6
-0,4
-0,2
0,0
0,2
EUR
/MW
h
Spread between PXE Base Load CAL-17 / 18 and EEX Phelix Base Year Future
Spread

4
Source: PXE Base Load CAL17 and CAL18; EEX Phelix Base Year Future On the Czech market, electricity production from cogenerating units benefits from regulatory support. The CZK 2009 is received as subsidy for each MWh produced in highly efficient cogeneration mode. This subsidy accounted for EUR 3 million in the first three quarters 2017 which remains similar as for first three quarters 2016 (EUR 3 million).
Besides relatively low share of power production on EBITDA and cash flow generation of the EPE Group, let us note that from the performance perspective, EPE is exposed to the spread between the power price and the price of emission allowance rather than to development of power prices alone.
Source: Thomson Reuters, EEX Simple Spread defined as the difference between Phelix Day Base and EUA price, using trading day data when both power and EUA are traded and simple monthly averages
Note: simple spread represents the price difference between power price and EUA price
9 Beginning on January 1, 2014 the subsidy was divided into four levels (CZK 200/MWh, CZK 140/MWh, CZK 60/MWh and CZK 45/MWh), depending on the efficiency of the cogeneration production of the plant. The majority of our power produced in cogeneration mode continues to receive the CZK 200/MWh level of subsidy.
0,0
10,0
20,0
30,0
40,0
50,0
EUR
/MW
h
Simple spread development in the years 2016 and 2017
Phelix Day Base Price EUA Simple Spread

5
Key developments in the first three quarters of the year 2017
i) Repayment of EP Energy Group´s loans, other financing matters and dividends
On January 20, 2017 EP Energy, a.s. paid interim dividend of EUR 10 million (equivalent CZK 270 million).
On January 20, 2017 EP Energy, a.s. granted loans to ARISUN, s.r.o. and Triskata, s.r.o. that used the funds to repay their bank loans of EUR 1 million each.
On March 10, 2017 EP Energy, a.s. paid interim dividend of EUR 10 million (equivalent CZK 270 million).
On May 18, 2017 EP Energy, a.s. declared dividend of EUR 50 million which was settled against outstanding loan provided to EP Infrastructure, a.s. earlier in May.
On May 22, 2017 EP Energy a.s. provided a loan of EUR 8 million to EP Infrastructure, a.s.
ii) Other matters
On February 24, 2017 the transaction with Macquarie Infrastructure and Real Assets (MIRA) was closed. As a result, MIRA gained 31% in EP Infrastructure, a.s. (EPIF), the parent company of EP Energy, a.s. The remaining 69% of EPIF remained with EPH, which also retained management control over EPIF. The MIRA-managed consortium is led by Macquarie European Infrastructure Fund 5 and includes other global institutional investors.
Following the sale of a minority shareholding in EPIF changes also occurred in the shareholder structure of EPH as follows:
• The current shareholders of EPH concluded a series of transactions, through which Daniel Křetínský (94%) and selected members of the existing management of EPH (6%), became sole owners of EPH.
• The shareholders, Biques Limited, Milees Limited and EP Investment S.à.r.l. received in total EUR 1.5 billion at closing from EPH for the sale of their shares in EPH representing in aggregate 30% of EPH share capital. Whereas Biques Limited sold all its shares in EPH, Milees Limited and EP Investment S.à.r.l. sold each 2.17 % shares in EPH in this share-buy-back transaction.
• Milees Limited will further receive EUR 1.75 to 2.75 billion (plus interest) over time, whereby the final amount payable to Milees Limited will reflect growth in the underlying value of EPH over the coming years.
Ultimate Shareholders of the EP Energy
As of date
of the report
(%) EP Investment S.à r.l 36.57 EP Investment S.à r.l 2 32.43 MIRA 31.00 Total 100.00
On March 9, 2017 Mr. Daniel Křetínský resigned as the Chairman of the Board of Directors of EP Energy, a.s. and Mr. Tomáš David was elected as the new Chairman of the Board of Directors. On March 10, 2017 Mr. Daniel Křetínský was removed from office of member of the Board of Directors and with
6
effect from March 11, 2017 Mr. William Price was elected as the new member of the Board of Directors.
On March 9, 2017 PT Real Estate, a.s. sold its 100% share in Nový Veleslavín, a.s. for EUR 9 million (CZK 256 million).
On 13 July 2017, the real estate company Pod Juliskou holding unused assets was sold. The completion date is expected to take place in early 2018.
Subsequent events
On October 13, 2017 the sole shareholder of the Company approved the interim dividend in the
amount of EUR 8 million. The interim dividend was settled via set off against the payable of EP
Infrastructure, a.s. to the Company.
In October 2017, the Company provided a short-term deposit of EUR 40 million to its parent company EP Infrastructure, a.s. The deposit is expected to return before the year end.
At the end of November the project of merger of EP Energy, a.s. and EP Hungary, a.s. is expected to become effective with the decisive date of 1 January 2017. In connection with the merger the Company’s share capital will be increased by increasing the nominal value of the shares from CZK 657 to CZK 665 each.
Except for the matters described above and elsewhere in the Report on the first three quarters of the year 2017 for EP Energy, a.s. or in the condensed consolidated interim financial statements as of September 30, 2017, the Company’s management is not aware of any other material subsequent events that could have a significant effect on the condensed consolidated interim financial statements as of September 30, 2017.

7
EP Energy, a.s. (the “Company”) Report on the first three quarters of 2017
Reporting
This report (the “Report”) is the report required under Section 4.03 of the indenture governing the senior secured notes (the “Notes I” or “2019 Notes”), dated as of October 31, 2012 (the “Indenture I” or “2019 Indenture”) and Section 4.03 of the indenture governing the senior secured notes (the “Notes II“ or “2018 Notes”) dated as of April 18, 2013 (the “Indenture II” or “2018 Indenture”) for the nine-month period ended September 30, 2017.
Presentation of financial information
This Report summarizes consolidated financial and operating data derived from the unaudited condensed consolidated interim financial statements of EP Energy, a.s. as of and for the nine-month period ended September 30, 2017 prepared in accordance with IFRS as adopted by the European Union (“IFRS”).
Non-IFRS measures
In addition, we have included certain non-IFRS financial measures in this Report, such as EBITDA, Pro forma Adjusted EBITDA and certain other financial measures and ratios. Non-IFRS financial measures are derived on the basis of methodologies other than IFRS.
Definitions of EBITDA, Pro forma Adjusted EBITDA EBITDA represents profit from operations plus depreciation of property, plant and equipment and amortization of intangible assets minus negative goodwill (if applicable). The EBITDA included in this report does not represent the term EBITDA as may be defined by any documentation for any financial liabilities of the EP Energy Group (also “EPE Group”). For further discussion over the EPE Group performance refer to the following pages.
Pro forma Adjusted EBITDA represents pro forma profit from operations plus pro forma depreciation of property, plant and equipment and pro forma amortization of intangible assets minus pro forma negative goodwill (if applicable).
To derive Pro forma Adjusted EBITDA for the period from October 1, 2016 to September 30, 2017, EPE utilized EPE Group IFRS consolidated financial statements as of and for the year ended December 31, 2016 (EBITDA of EUR 293 million) and EPE Group IFRS condensed consolidated interim financial statements as of and for the nine-month period ended September 30, 2017 (EBITDA of EUR 260 million) with the nine-month period ended September 30, 2016 (EBITDA of EUR 196 million) as comparatives.
Pro forma Adjusted EBITDA (last twelve months) calculation in EUR millions:
10/2016 – 9/2017
Actual IFRS EBITDA for the period January – September 2017 260
Actual IFRS EBITDA for the period January – December 2016 293
Actual IFRS EBITDA for the period January – September 2016 (196)
Simple EBITDA (last twelve months) 357
Less sale of non-core assets (6) Pro forma Adjusted EBITDA (last twelve months) 351 *Amounts might not sum up due to rounding

8
The Pro forma Adjusted EBITDA included in this report does not represent the term EBITDA as may be defined by any documentation for any financial liabilities of the EP Energy Group. For further discussion over the EPE Group performance, refer to the following pages.
After the listing of the Notes on the Irish Stock Exchange, the EPE Group has begun to report segment information in accordance with IFRS 8 Segment Reporting (starting with the 2012 annual consolidated financial statements). Since we did not previously report segment information using IFRS 8 rules, it may be difficult to compare our segment data with our “line of business” data previously reported elsewhere.
We present EBITDA, Pro forma Adjusted EBITDA and other certain financial measures and ratios because we believe these financial measures may enhance an investor’s understanding of the profitability and cash flow generation of our business that could be used to service or pay down debt, pay income taxes and for other uses, and because they are frequently used by securities analysts, investors and other interested parties in the evaluation of companies generally. We use EBITDA and Pro forma Adjusted EBITDA to assess our performance. EBITDA and Pro forma Adjusted EBITDA are not measures calculated in accordance with IFRS and our use of the terms EBITDA and Pro forma Adjusted EBITDA may vary from others in our industry. EBITDA and Pro forma Adjusted EBITDA differ from Consolidated EBITDA and Adjusted EBITDA as may be defined in the Indenture. EBITDA and Pro forma Adjusted EBITDA should not be considered as an alternative to “Sales: energy,” “Sales: other,” “Gross profit,” “Profit/(loss) from operations,” “Cash generated from (used in) operating activities” or any other performance measure derived in accordance with IFRS.
Although we believe EBITDA, Pro forma Adjusted EBITDA and other certain financial measures and ratios to be useful performance indicators for our group as a whole and certain of our segments, we believe that such measurements may not accurately reflect our results of operations, and may not serve as accurate performance indicators, of our Power Distribution and Supply segment due to the implementation of our power optimization strategy in this segment.
EBITDA, Pro forma Adjusted EBITDA and all the other non-IFRS measures presented herein have important limitations as analytical tools and you should not consider them in isolation or as substitutes for analysis of our results as reported under IFRS. We also note that differences in the consolidation scope as described in part of this Report “Key factors affecting comparability of the results of operations of the EPE group” are impacting the comparability of the financial data.
Exchange rates
For your convenience, we have translated Czech crown amounts in this Report into euro. The exchange rates for the income statement and cash flow statement items are the following average exchange rates of the Czech National Bank in Czech crown per euro for the relevant period.
- Nine-month period ended September 30, 2016: CZK 27.035 per EUR 1.000 - Nine-month period ended September 30, 2017: CZK 26.553 per EUR 1.000
The exchange rates for balance sheet items are the rates as of period end.
- As of December 31, 2016: CZK 27.020 per EUR 1.000 - As of September 30, 2017: CZK 25.975 per EUR 1.000
You should not view such translations as a representation that such Czech crown amounts actually represent such euro amounts, or could be or could have been converted into euro at the rate indicated or at any other rate.

9
Forward-looking statements
This Report contains “forward-looking statements” within the meaning of the securities laws of certain jurisdictions. In some cases, these forward-looking statements can be identified by the use of forward-looking terminology, including the words “assume,” “believe,” “could,” “estimate,” “anticipate,” “expect,” “intend,” “may,” “will,” “plan,” “continue,” “ongoing,” “potential,” “predict,” “project,” “risk,” “target,” “seek,” “should” or “would” and similar expressions or, in each case, their negative or other variations or comparable terminology or by discussions of strategies, plans, objectives, targets, goals, future events or intentions. These forward-looking statements include all matters that are not historical facts. They appear in a number of places throughout this Report and include statements regarding our intentions, beliefs or current expectations concerning, among other things, our results of operations, financial condition, liquidity, prospects, growth and strategies, our reserves and the industry in which we operate.
By their nature, forward-looking statements involve known and unknown risks and uncertainties because they relate to events and depend on circumstances that may or may not occur in the future. Forward-looking statements are not guarantees of future performance. You should not place undue reliance on these forward-looking statements.
Key factors affecting comparability of the results of operations of the EPE Group
The EPE Group was formed through a series of strategic acquisitions and business combinations. The current EPE Group was originally formed with acquisitions of ownership interests in Pražská energetika (“PRE”) in 2004 and in UE in 2005 by J&T Group, which is one of beneficial owners of EPH (our ultimate parent company). EPH was formed in 2009 and the ownership interests in PE, EOP, UE, EPET and PEAS were transferred to it by J&T Group. We were formed on December 16, 2010, but we have restated financial statements from August 2009, based on the results of our subsidiaries that were owned by EPH during that period. Before our formation, many of our current subsidiaries were subsidiaries of EPH, but because the EPE Group has grown steadily through acquisitions, these entities have been under common control for only a short period of time. The acquisition of various subsidiaries or additional interests in such subsidiaries and the disposition of certain subsidiaries mean that our results of operations necessarily differ before and after these acquisitions and dispositions and do not reflect a change in organic operating results but rather the impact of an acquisition or disposition.
Specifically, during 2016 activities and assets held by EP Infrastructure, a.s. – “EPIF” were reorganized in order to refocus on regulated and/or long-term contracted infrastructure-type assets. The reorganization also included the following matters relating to the EPE Group and affecting comparative period:
German assets sale
German assets include, among others, MIBRAG and Saale Energie (“German assets”). MIBRAG is a wholly-owned subsidiary of JTSD, Saale Energie is a wholly-owned subsidiary of EP Germany; both EP Germany and JTSD were wholly-owned subsidiaries of EPE (where EP Germany has been since December 31, 2015 directly owned by JTSD as a result of the sale of all EP Germany shares by EPE to JTSD for EUR 4.3 million, corresponding to fair value of equity of EP Germany).
The German assets were disposed of by means of sale of 100% shares in JTSD by EPE to EPH for EUR 156.0 million (corresponding to fair value of equity of JTSD); the disposal was completed on April 1, 2016 and the purchase price was fully settled in cash. Further details on German assets sale and EPIF reorganization can be found in the Report on the year ended December 31, 2016 for EP Energy, a.s.

10
The following table sets out how the main subsidiaries are included in the respective periods in our condensed consolidated interim financial statements:
Periods presented in the EPE Group’s consolidated IFRS financial statement
Subsidiary 1-9 2016 1-9 2017
Elektrárna Opatovice, a.s. Fully consolidated Fully consolidated
United Energy, a.s. Fully consolidated Fully consolidated
Pražská teplárenská a.s. Fully consolidated Fully consolidated
Plzeňská energetika a.s. Fully consolidated Fully consolidated
EP ENERGY TRADING, a.s. Fully consolidated Fully consolidated
Stredoslovenská energetika, a.s. Fully consolidated Fully consolidated
EP Cargo, a.s. Fully consolidated Fully consolidated
Budapesti Erömü Zrt Fully consolidated Fully consolidated
JTSD/MIBRAG (including its subsidiary, among others, MNE)
Classified as discontinued operation and not included in continuing operations.
Not included
Helmstedter Revier GmbH Classified as discontinued operation and not included in continuing operations.
Not included
Saale Energie GmbH Classified as discontinued operation and not included in continuing operations.
Not included
Pražská teplárenská LPZ, a.s. Fully consolidated Not included
We have recently added new businesses to the EPE Group and may have made and may make acquisitions in the future. Newly added or acquired businesses may not be integrated or managed successfully, and we may fail to realize the anticipated synergies, growth opportunities and other benefits expected from these additions or acquisitions. Our consolidated financial statements included in this Report may not be representative of our historical or future results of operations and may not be comparable across periods, which may make it difficult to evaluate our results of operations and future prospects.
Development of the key risks for the group
The risk profile of the EPE Group has not materially changed since the last reporting date and the risk analysis provided in the Report for the year ended December 31, 201610 is still a valid indication of the key risks that the EPE Group faces. The Group continues to actively keep track of the risks and has dedicated staff to follow different risk areas.
10 Published on April 28, 2017

11
Management’s discussion and analysis of financial condition and results of operations
Overview of the EPE Group
We are a leading vertically integrated energy utility focusing on heat and power generation and distribution, as well as energy supply and trading. We generate a substantial percentage of our EBITDA in the Slovak Republic and the Czech Republic, where our principal operations are located. In addition, through the acquisition of BERT in December 2015 we entered the Hungarian market. For the first three quarters of 2017, the EPE Group had consolidated sales and EBITDA of EUR 1,290 million and EUR 260 million, respectively. A significant part of our business comes from regulated activities (i.e., heat and power distribution and renewable energy), and business contracted through long-term agreements with a stable customer base (i.e., grid balancing services as part of our power generation activities), which we believe provides us with resiliency of cash flows and future performance.
Principal operating subsidiaries of the EPE Group
The EPE Group’s principal operating subsidiaries are Elektrárny Opatovice, a.s. (“EOP”), Pražská teplárenská a.s. (“PT”), United Energy, a.s. (“UE”), Stredoslovenská energetika, a.s. (“SSE”), Stredoslovenská energetika – Distribúcia, a.s. (SSE-D), EP ENERGY TRADING, a.s. (“EPET”) and Budapesti Erömü Zrt (“BERT”). EOP, PT, UE and BERT operate in the Heat Infra segment and SSE with EPET operate in the Power Distribution and Supply segment. Together these subsidiaries accounted for the vast majority of the EPE Group’s sales and EBITDA for the first three quarters of 2017.
For a list of EPE’s other subsidiaries and minority interests, see Note 33 to EPE’s unaudited condensed consolidated interim financial statements as of and for the nine-month period ended September 30, 2017.
EPE operating segments
We operate in the following reportable segments: Heat Infra, Power Distribution and Supply, Renewables, Holding, Other.
Heat Infra and Power Distribution and Supply are the core segments of the Group.
Until April 1, 2016 the Group also operated Mining segment which was disposed as part of the reorganization of EP Infrastructure, a.s. (“EPIF”) in 2016 (see the section Key factors affecting comparability of the results of operations of the EPE Group - German assets sale). Mining segment was classified as discontinued operation in 2016 and therefore did not affect the EBITDA for the nine-month period ended September 30, 2016.
Heat Infra:
The Heat Infra segment owns and operates four large-scale combined heat and power plants (CHPs) in the Czech Republic operated in highly efficient cogeneration mode and represented primarily by: Elektrárny Opatovice, a.s., United Energy, a.s., Plzeňská energetika a.s. and Pražská teplárenská a.s., which is operating the largest district heating system in the Czech Republic, supplying heat to the City of Prague. The heat generated in segment’s cogeneration power plants is supplied mainly to retail customers through well-maintained and robust district heating systems that the EPE Group owns in most of the cases. The segment also includes Budapesti Erömü Zrt., which is a leading heat and power

12
producer in Hungary, operating three Combined Cycle Gas Turbine (“CCGT”) plants in the Budapest area. In addition, EPE disposed Pražská teplárenská LPZ, a.s. (“LPZ”) on June 1, 2016 therefore the below data include its operation in the nine-month period ended September 30, 2016 only.
The segment also included Saale Energie GmbH and Helmstedter Revier GmbH until April 1, 2016. These entities were classified as discontinued operations therefore do not affect the EBITDA of first three quarters of 2016 and were disposed as part of the reorganization of EP Infrastructure, a.s. (“EPIF”) in 2016 (see the section Key factors affecting comparability of the results of operations of the EPE Group - German assets sale).
Power Distribution and Supply:
Primarily, the Power Distribution and Supply segment reports distribution of electricity in the central Slovakia region. The segment consists of a Power Distribution division and a Supply division. The Supply division primarily supplies power and natural gas to end-consumers in the Czech Republic and Slovakia. The Power Distribution division purchases and sells in the wholesale market power generated by the Heat Infra segment and purchases from external sources and purchases electricity and natural gas to supply customers through the Supply division. This segment is mainly represented by SSE, SSE-D, EPET, EP Sourcing, a.s. (“EPS”) and EP Cargo a.s. (“EPC”).
Renewables:
The Renewables segment owns and operates three solar power plants and holds a minority interest in an additional solar power plant and a majority interest in one wind farm in the Czech Republic. The Group also owns two solar power plants in Slovakia, and a biogas facility in Slovakia.
The segment also included Mibrag Neue Energie until April 1, 2016 that was classified as discontinued operation therefore does not affect the EBITDA of first three quarters of 2016 and was disposed as part of the reorganization of EP Infrastructure, a.s. (“EPIF”) in 2016 (see the section Key factors affecting comparability of the results of operations of the EPE Group - German assets sale).
Holding
The Holding segment represents EP Energy, a.s. as a holding company. The segment profit therefore primarily represents dividends received from its subsidiaries, finance expense and results from acquisition accounting.
Other
The segment Other consists of minor operations not fitting to our key segments.
Reorganization
As part of the reorganization of EPIF in 2016, the Company sold-off its power generation activities in Germany as well as its mining operations in Germany to its ultimate parent company EPH (effective on April 1, 2016). The decision to sell-off these activities, which comprise an isolated geographical segment (Germany), was reached at the end of 2015. Due to the fact that these operations were predominantly representing the whole German operations, mining operations and condensation power production, the Company presents these activities as discontinued operations as of and for the nine-month period ended September 30, 2016 (i.e. does not affect EBITDA of any presented period).

13
The table below shows summary financial information for the EPE segments:
For the nine-month period ended September 30,
In million EUR
2016 2017
Total sales Heat Infra .................................................................................................. 369 369
Power Distribution and Supply ................................................................. 1,041 1,025
Renewables ............................................................................................... 4 4
Other ......................................................................................................... 5 3
Total segments ..................................................................................... 1,419 1,401
Intersegment eliminations ........................................................................ (92) (111)
Consolidated data ................................................................................ 1,327 1,290
Depreciation and amortization Heat Infra .................................................................................................. (73) (53)
Power Distribution and Supply ................................................................. (49) (50)
Renewables ............................................................................................... (2) (2)
Total segments ..................................................................................... (124) (105)
Consolidated data ................................................................................ (124) (105)
Profit/(loss) from operations Heat Infra .................................................................................................. 25 49
Power Distribution and Supply ................................................................. 49 106
Renewables ............................................................................................... 1 1
Total segments ..................................................................................... 75 156
Holding ...................................................................................................... (3) (1)
Intersegment eliminations ........................................................................ - -
Consolidated data ................................................................................ 72 155
EBITDA(1) Heat Infra .................................................................................................. 98 102
Power Distribution and Supply ................................................................. 98 156
Renewables ............................................................................................... 3 3
Total segments ..................................................................................... 199 261
Holding ...................................................................................................... (3) (1)
Intersegment eliminations ........................................................................ - -
Consolidated data ................................................................................ 196 260
(1) Represents Profit/(loss) from operations plus Depreciation and amortization less Negative goodwill (if applicable)

14
Heat Infra
The Heat Infra segment accounted for 49.2% of consolidated EBITDA for the first three quarters 2016 and 39.1% of consolidated EBITDA for the first three quarters 2017, in each case before intersegment eliminations and holding results. We conduct our Heat Infra operations in the Czech Republic through the following major subsidiaries: Pražská teplárenská, Elektrárny Opatovice, United Energy and Plzeňská energetika and in Hungary through Budapesti Erömü Zrt. The table below shows a summary of key operating data for the Heat Infra segment. The operating data are based on the results of the whole entity regardless of the date when each entity joined the EPE Group or the ownership share of the EPE Group in each entity. EPE disposed Pražská teplárenská LPZ, a.s. (“LPZ”) on June 1, 2016 therefore the below data include its operation in first three quarters 2016. Results of all other subsidiaries of the Group, which belong to the Heat Infra Business, are for the entire period.
As of and for the nine-month period ended September 30,
2016 2017
Installed heat capacity(1) .......................................................... MWth 3,331 3,276
Heat supplied ........................................................................... TJ 14,311 14,606
Installed cogeneration capacity ............................................... MWe 894 894
Installed condensation capacity .............................................. MWe 360 360
Certified grid balancing capacity(2) ........................................... MWe 517 517
Cogeneration production ......................................................... GWh 931 1,090
Condensation production ........................................................ GWh 1,118 1,641
Grid balancing services ............................................................ GWh 1,588 1,752
(1) Heat capacity installed on heat exchangers
(2) Grid balancing capacity is included in Installed condensation capacity and Installed cogeneration capacity
Installed heat capacity
Installed heat capacity decreased by 55 MWth, or 1.7%, to 3,276 MWth as of September 30, 2017, as compared to 3,331 MWth as of September 30, 2016. This decrease was due to decommissioning of 55 MWth source at PT at the end of 2016.
Heat supplied
Heat supplied increased by 295 TJ, or 2.1%, to 14,606 TJ for the first three quarters 2017 as compared to 14,311 TJ for the first three quarters 2016. Heat supply figures include 970 TJ produced by LPZ in 3Q 2016, while 0 TJ in 3Q 2017 (as it was disposed on June 1, 2016). This effect was almost balanced by higher heat supplied volume caused by relatively colder weather pattern. As outlined previously in the Report, day-degrees, the metrics representing “coldness” of the weather pattern (difference between reference indoor temperature and actual outdoor temperature integrated over the given period of time) were in the areas where we deliver the heat period-to-period by 9.0% higher which resulted in higher heat offtake by customers.
Installed capacity
Installed cogeneration capacity remained on 894 MWe at September 30, 2017 and September 30, 2016.
Installed condensation capacity remained at 360 MWe at September 30, 2017 and September 30, 2016.
Certified grid balancing capacity remained at 517 MWe, at September 30, 2017 and September 30, 2016.

15
Cogeneration production
Cogeneration production increased by 159 GWh, or 17.1%, to 1,090 GWh for the first three quarters 2017, as compared to 931 GWh for the first three quarters 2016. While all CHPs produced slightly higher volume of power in cogeneration mode generally due to the better weather conditions and higher heat demand that allowed higher production in cogeneration mode, namely BERT recorded very high power production volume (663 GWh in the first three quarters 2017, while 539 GWh in the first three quarters 2016) as it managed to seize temporary opportunities at the Hungarian power market.
Condensation production
Condensation generation increased by 523 GWh, or 46.8%, to 1,641 GWh for the first three quarters 2017, as compared to 1,118 GWh for the first three quarters 2016. This relates mostly to Czech CHPs which seized opportunity of higher power prices, while retaining relatively low variable costs.
Grid balancing services
Grid balancing services increased by 164 GWh, or 10.3%, to 1,752 GWh for the first three quarters 2017 as compared to 1,588 GWh for the first three quarters 2016. This increase in grid balancing services primarily reflects a higher success rate in winning tenders for grid balancing services organized by the Czech TSO CEPS and success in providing grid balancing service in Hungary by BERT.
The table below shows a summary of key financial performance data for the Heat Infra segment. The financial data is based on EPE consolidated financial information before eliminations of intersegment transactions and take into account the ownership share of the EPE Group in each entity and its acquisition date. EPE disposed LPZ on June 1, 2016 therefore only data for first three quarters of 2016 include its operations. Results of all other subsidiaries of the Group which belong to the Heat Infra Business are for the entire period.
For the nine-month period ended September 30,
2016 2017
Total sales .................................................................................. in EUR millions 369 369
EBITDA ....................................................................................... in EUR millions 98 102
EBITDA
As our contracts with suppliers for our Heat Infra operations in the Czech Republic are generally priced in Czech crowns, but our contracts for sales of electricity are primarily priced in EUR, EBITDA from our power generation operations presented in CZK as a functional currency may increase or decrease (and even be negative) depending on currency exchange rate fluctuations (our heat operations are not affected by currency fluctuations as all sales transactions are priced in Czech crowns, however the EBITDA is affected by translation of CZK to EUR for reporting presentation purposes as the EPE Group´s presentation currency is EUR). We generally lock in the exchange rate at the time a contract is entered through the use of derivatives, the amounts due or paid under these derivative contracts, which offset the exchange rate fluctuation effects discussed above, are included in EBITDA in Total sales as Gain (loss) from commodity derivatives for trading with electricity and gas, net.
EBITDA increased by EUR 4 million, or 4.0%, to EUR 102 million for the first three quarters 2017 as compared to EUR 98 million for the first three quarters 2016. Slightly better result than in prior year stems i) from EUR 6 million profit on disposal of Nový Veleslavín, a.s., which was a member of PT Group holding a land plot and a not utilized building and ii) from better result on power sales caused by higher power prices and higher cogeneration production. Those were compensated i) by sale of LPZ in June

16
2016 (EBITDA EUR 7 million) and ii) by worse result of BERT due to lower margins achieved on sale of heat and power.
Power Distribution and Supply
The Power Distribution and Supply segment accounted for 49.2% of consolidated EBITDA for the first three quarters 2016 and 59.8% of consolidated EBITDA for the first three quarters 2017, in each case before intersegment eliminations and holding results. We conduct our Power Distribution and Supply operations in the Slovak Republic and the Czech Republic mainly through our subsidiary SSE, SSE-D, EPET, EPS and EPC.
The table below shows a summary of key operating data for the Power Distribution and Supply segment. The operating data are based on the results of the whole entity regardless of the date when each entity joined the EPE Group or the ownership share of the EPE Group in each entity, however the data excludes SSE which is presented separately.
For the nine-month period ended September 30,
2016 2017
Power traded ....................................................................................... GWh 3,838 2,491
Power supplied .................................................................................... GWh 1,721 1,533
Natural gas traded ............................................................................... GWh 1,486 1,539
Natural gas supplied ............................................................................ GWh 1,222 1,489
The table below shows a summary of key operating data for the SSE Group:
For the nine-month period ended September 30,
2016 2017
Power distributed ................................................................................ GWh 4,315 4,546
Power traded ....................................................................................... GWh 5,335 4,453
Power supplied .................................................................................... GWh 2,863 2,825
Natural gas supplied ............................................................................ GWh 213 244
Power produced .................................................................................. GWh 16 15
Installed capacity ................................................................................. MWe 63 63
Power distributed
Power distributed by SSE-D reached 4,546 GWh for the first three quarters 2017, which represents an increase by 231 GWh, or 5.4%, as compared to the first three quarters 2016. The distribution increased on all voltage levels primarily due to strong winter.
Power traded
Power traded (excluding SSE) decreased by 1,347 GWh, or 35.1%, to 2,491 GWh for the first three quarters 2017 as compared to 3,838 GWh for the first three quarters 2016. This decrease in power traded was primarily due to the new EPET strategic role in EPH group, when trading department was moved out of EPET business and EPET further focuses primarily on supply business.
Power traded realized by SSE reached 4,453 GWh for the first three quarters of year 2017, which is a decrease of 16.5%, or 882 GWh, as compared to 5,335 GWh for the first three quarters of year 2016. The reason for the decline in activity was lower re-sold volume coming from renewable resources on the Slovak market.

17
Power supplied
Power supplied (excluding SSE) decreased by 188 GWh, or 10.9%, to 1,533 GWh for the first three quarters 2017 as compared to 1,721 GWh for the first three quarters 2016. This decrease in power supplied reflects lower consumption of EPET wholesale customer portfolio.
Power supply realized by SSE reached 2,825 GWh for the first three quarters 2017, which is a decrease by 38 GWh, or 1.3%, as compared to 2,863 GWh for the first three quarters 2016.
Natural gas traded
Natural gas traded (excluding SSE) increased by 53 GWh, or 3.6%, to 1,539 GWh for the first three quarters 2017 as compared to 1,486 GWh for the first three quarters 2016. This increase in natural gas traded was primarily due to the one-off gas wholesale deal in second quarter and third quarter 2017.
Natural gas supplied
Natural gas supplied (excluding SSE) increased by 267 GWh, or 21.8%, to 1,489 GWh for the first three quarters 2017 as compared to 1,222 GWh for the first three quarters 2016. This increase in natural gas supplied reflects higher consumption of EPET customer portfolio due to the better weather conditions in the year 2017.
Natural gas supplied by SSE reached 244 GWh for the first three quarters 2017, which is an increase by 31 GWh, or 14.6%, as compared to 213 GWh for the first three quarters 2016. This increase is due to growth of supply portfolio through new customer acquisitions and low temperatures namely in January 2017.
The table below shows a summary of key financial data for the Power Distribution and Supply segment. The financial data are based on EPE consolidated financial information before eliminations of intersegment transactions and take into account the ownership share of the EPE Group in the entity and acquisition date.
For the nine-month period ended September 30,
2016 2017
Total Sales .................................................................................. in EUR millions 1,041 1,025
EBITDA ....................................................................................... in EUR millions 98 156
EBITDA
As part of our power trading activities, EPET engages in sales of power generated by EPE Group companies, as well as resales of power purchased on the wholesale market in connection with our energy production optimization process, which leads to an overall increase in the volume of sales of power. However, with an increasing number of resales, total costs as a percentage of total sales increase as the margins realized on each subsequent optimization transaction tend to decline as the frequency of optimization transactions increases. Moreover, because our contracts with suppliers for our Heat Infra operations in the Czech Republic are generally priced in Czech crowns (with the exception of supplies under certain contracts for brown coal to the EOP and UE, which are priced in EUR and were significantly reduced starting in 2016), but we may purchase power in EUR, EBITDA from our supply operations may increase or decrease (and even be negative) depending on currency exchange rate fluctuations (the EBITDA is affected by translation of CZK to EUR for reporting presentation purposes as the EPE Group´s presentation currency is EUR). We generally lock in the exchange rate and power prices at the time a contract is entered into through the use of derivative contracts, the amounts due or paid under these derivative contracts, which offset the exchange rate

18
and power price fluctuation effects discussed above, are included in EBITDA and the effect of fair valuation of financial commodity derivatives is included in Total sales as Gain (loss) from commodity derivatives for trading with electricity and gas, net, unless they qualify for hedge accounting under IFRS, in which case they are reflected in the Cost of sales: Other and Sales: Other lines for currency derivatives and in the Sales: Energy and Cost of sales: Energy for derivatives hedging the price of power.
EBITDA increased by EUR 58 million, or 59.2%, to EUR 156 million for the first three quarters 2017 as compared to EUR 98 million for the first three quarters 2016. EBITDA realized by SSE Group (inc. SSE-D) increased by EUR 62 million to EUR 148 million, which is a result of two major effects: (i) the System Operations Tariff (“SOT”) effect (see the section Regulatory contingent assets related to green energy) that had a positive effect of EUR 8 million in the first three quarters 2017, while negative effect of EUR 65 million in the first three quarters 2016 and (ii) the increase was partly offset with a loss in supply portfolio management (loss EUR 8 million), where the losses were caused by limited ability of SSE (similarly to other market participants) to convert the pre-hedged position into the exact daily and hourly profiles because of extremely high peak power prices in January and February resulted from strong winter and outage of nuclear power plants in France. In addition, negative effect of EUR 3 million stems primarily from increase in operating expenses.
Furthermore, EPC experienced a slight decrease in EBITDA by EUR 1 million mainly due to lower sales from coal transportation and EPET’s EBITDA decreased by EUR 1 million mainly as a result of new EPET’s business strategy focusing primarily on supply business.
Renewables
The Renewables segment accounted for 1.1% of consolidated EBITDA for the first three quarters 2017 and for 1.5% for the first three quarters 2016, in each case before intersegment eliminations and holding results. Our Renewables business is conducted in the Czech Republic and the Slovak Republic, and operations include wind, solar and biogas power generating facilities.
As of and for the nine-month period ended September 30,
2016 2017
Installed Capacity ........................................................................................ MWe 14 14
Power Production ........................................................................................ GWh 20 18
Installed capacity
Installed capacity remained at 14 MWe as of September 30, 2017 and September 30, 2016.
Power production
Power production decreased by 2 GWh, or 10.0%, to 18 GWh for the first three quarters 2017 as compared to 20 GWh for the first three quarters 2016.
The table below shows a summary of key financial data for the Renewables segment. The financial data are based on EPE consolidated financial information before eliminations of intersegment transactions and take into account the ownership share of the EPE Group in each entity and its acquisition date.

19
For the nine-month period ended September 30,
2016 2017
Total Sales ............................................................................ in EUR millions 4 4
EBITDA .................................................................................. in EUR millions 3 3
EBITDA
EBITDA is stabilized on EUR 3 million for the first three quarters 2017 and for the first three quarters 2016.
Other
The Other segment accounted for 0.0% of consolidated EBITDA for the first three quarters 2017 and also for the first three quarters 2016, in each case before intersegment eliminations and holding results. The table below shows a summary of key financial data for the Other segment:
For the nine-month period ended September 30,
2016 2017
Total sales.............................................................................................. in EUR millions 5 3
EBITDA ................................................................................................... in EUR millions - -
EBITDA remained at EUR 0 million in the first three quarters in both periods 2017 and 2016.
Holding
The table below shows a summary of key financial data for the Holding entities segment:
For the nine-month period ended September 30,
2016 2017
Total sales ............................................................................................. in EUR millions - -
EBITDA .................................................................................................. in EUR millions (3) (1)
The main driver of the negative EBITDA in both 2016 and 2017 was the other operating expenses of EP Energy, as the only entity presented within the Holding segment. The costs were primarily associated with costs relating to outsourcing of various functions and costs for professional services at EP Energy.
Other revenues and expenses
Our repeating expenses are generally related to wages and salaries and associated social and health insurance, administrative costs for repairs and maintenance, other taxes and fees, costs for audit and accounting services, costs for legal consultancy, operating leases, rent of premises, communication expenses, travel expenses, costs for translation, non-tax deductible fees, rental income and other administrative costs.
20
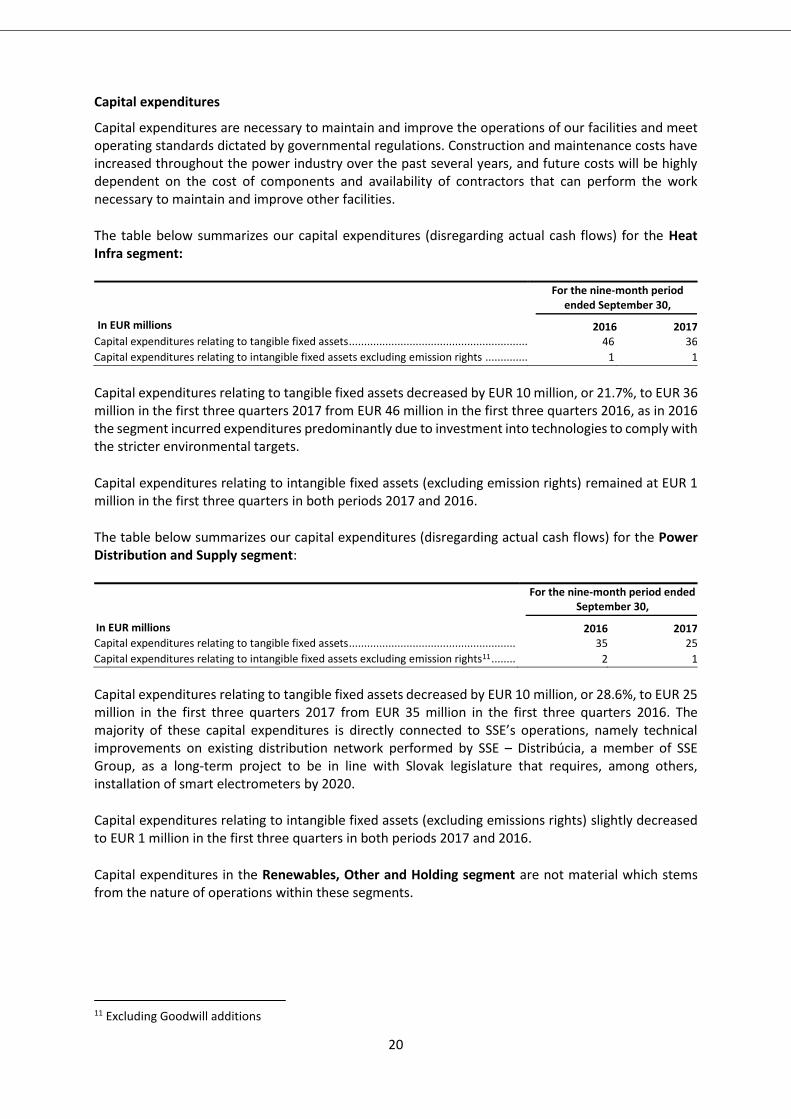
Capital expenditures
Capital expenditures are necessary to maintain and improve the operations of our facilities and meet operating standards dictated by governmental regulations. Construction and maintenance costs have increased throughout the power industry over the past several years, and future costs will be highly dependent on the cost of components and availability of contractors that can perform the work necessary to maintain and improve other facilities.
The table below summarizes our capital expenditures (disregarding actual cash flows) for the Heat Infra segment:
In EUR millions
For the nine-month period ended September 30,
2016 2017
Capital expenditures relating to tangible fixed assets ........................................................... 46 36
Capital expenditures relating to intangible fixed assets excluding emission rights .............. 1 1
Capital expenditures relating to tangible fixed assets decreased by EUR 10 million, or 21.7%, to EUR 36 million in the first three quarters 2017 from EUR 46 million in the first three quarters 2016, as in 2016 the segment incurred expenditures predominantly due to investment into technologies to comply with the stricter environmental targets.
Capital expenditures relating to intangible fixed assets (excluding emission rights) remained at EUR 1 million in the first three quarters in both periods 2017 and 2016.
The table below summarizes our capital expenditures (disregarding actual cash flows) for the Power Distribution and Supply segment:
In EUR millions
For the nine-month period ended September 30,
2016 2017
Capital expenditures relating to tangible fixed assets ....................................................... 35 25
Capital expenditures relating to intangible fixed assets excluding emission rights11 ........ 2 1
Capital expenditures relating to tangible fixed assets decreased by EUR 10 million, or 28.6%, to EUR 25 million in the first three quarters 2017 from EUR 35 million in the first three quarters 2016. The majority of these capital expenditures is directly connected to SSE’s operations, namely technical improvements on existing distribution network performed by SSE – Distribúcia, a member of SSE Group, as a long-term project to be in line with Slovak legislature that requires, among others, installation of smart electrometers by 2020.
Capital expenditures relating to intangible fixed assets (excluding emissions rights) slightly decreased to EUR 1 million in the first three quarters in both periods 2017 and 2016.
Capital expenditures in the Renewables, Other and Holding segment are not material which stems from the nature of operations within these segments.
11 Excluding Goodwill additions

21
The EPE Group
Description of key income statement line items and key performance indicators of the EPE Group
Key income statement line items
Sales: Energy. EPE presents Sales: Energy in five component parts: sales of electricity (incl. distribution), sales of heat, sales of gas, sales of coal and sales of other energy products across all of our segments. EPE recognizes revenue when persuasive evidence exists, usually in the form of an executed sales agreement, that the significant risks and rewards of ownership have been transferred to the buyer, recovery of the consideration is probable, the associated costs and possible return of goods can be estimated reliably, there is no continuing management involvement with the goods, and the amount of revenue can be measured reliably. Revenue from the sale of own products and goods in the course of ordinary activities is measured at the fair value of the consideration received or receivable, net of returns, trade discounts and volume rebates. Discounts are recognized as a reduction of revenue as the sales are recognized, if it is probable that discounts will be granted and the amount can be measured reliably. Revenues from services rendered are recognized in profit or loss in proportion to the stage of completion of the transaction at the reporting date. The stage of completion is assessed by reference to surveys of work performed. No revenue is recognized if there are significant uncertainties regarding the recovery of the consideration due, associated costs or the possible return of goods.
Sales: Other. Sales: Other represent revenues from non-core activities, including sales of energy by-products (such as ash and gypsum).
Gain (loss) from commodity derivatives for trading with electricity and gas, net. At the date of the financial statements, trading derivatives are measured at fair value. As the trading in commodity derivatives forms a significant part of the Group’s total trading activities, the measurement effect is recognized in “Gain (loss) from commodity derivatives for trading with electricity and gas, net”, a separate line item under “Total sales”.
Cost of sales: Energy. Cost of sales: Energy is divided into five component parts, namely cost of sold energy, cost of sold gas and other energy products, consumption of coal and other material, consumption of energy and other cost of sales. Cost of sales: Energy does not include directly attributable overhead costs (particularly personnel expenses, depreciation and amortization, repairs and maintenance, emission rights, taxes and charges). Cost of sales: Energy also includes losses incurred in energy trading transactions.
Cost of sales: Other. Cost of sales: Other is divided into five component parts, namely cost of goods sold, consumption of material, consumption of energy, changes in work-in-progress, semi-finished products and finished goods and other cost of sales. Cost of sales: Other does not include directly attributable overhead costs (particularly personnel expenses, depreciation and amortization, repairs and maintenance, emission rights, taxes and charges).
Personnel expenses. Personnel expenses represent expenses related to employees and board members, including wages and salaries of employees, benefits, remuneration of board members, social and health insurance, provisions related to employees (e.g., provisions for untaken holidays, accruals for bonuses and rewards), revenues/expenses related to employee benefits recorded in accordance with IAS 19 and other costs related to employees during the reporting period.
Depreciation and amortization. Depreciation represents non-cash expenses of tangible assets over time. Amortization represents non-cash expenses of intangible assets over time.

22
Repairs and maintenance. Repairs and maintenance represent externally incurred costs to bring an asset back to an earlier condition or to keep the asset operating in its present condition.
Emission rights, net. Emission rights, net comprise the profit from sale of emission allowances and the consumption of emission allowances on a continuous basis based on the actual production of emissions, with a corresponding decrease in the carrying value of deferred income on a systematic basis over the period for which the rights were issued.
Negative goodwill. Negative goodwill (gain on bargain purchase) represents a gain occurring when the price paid for an acquisition is less than the fair value of net assets of the acquired company.
Taxes and charges. Taxes and charges comprise electricity taxes, property taxes and other taxes and charges (excluding income tax).
Other operating income and expenses. Other operating income and expenses represent items that are of secondary importance compared to the EPE Group’s principal activities. These items include, for example, rental income, contractual penalties received from suppliers or paid to customers, consulting fees and commissions expense, transport services, insurance services, consumption of material, gains/losses on sale of intangible assets/property (excluding the sale of emissions allowances), plant and equipment or inventories, creation and reversal of various provisions, outsourcing and administrative fees and professional and advertising services.
Finance income. Finance income comprises interest income on funds invested, dividend income, changes in the fair value of financial assets at fair value through profit or loss, foreign currency gains (only if total foreign currency gains and losses result in net income; receivables in foreign currency are recalculated mark-to-market at the end of the accounting period to Czech crowns) that do not qualify for hedge accounting, gains on sale of investments in securities and gains on hedging instruments that are recognized in profit or loss.
Finance expense. Finance cost comprises interest expense on borrowings, unwinding of the discount on provisions (e.g., on provisions for decommissioning), foreign currency losses (only if total foreign currency gains and losses result in a net expense; payables in foreign currency are recalculated mark-to-market at the end of the accounting period to Czech crowns); realized profit from currency derivative contracts that do not qualify for hedge accounting, changes in the fair value of financial assets at fair value through profit or loss, fees and commissions expense for payment transactions and guarantees and impairment losses recognized on financial assets.
Profit/(loss) from financial instruments. Profit/(loss) from financial instruments represents profit or loss from commodity derivatives that are not presented as a part of Gain (loss) from commodity derivatives for trading with electricity and gas, net, currency derivatives (including both realized and mark-to-market valuations at the end of the accounting period), hedging activities and interest rate derivatives that do not qualify for hedge accounting.
Share of profit/(loss) of equity accounted investees. Share of profit/loss of equity accounted investees represents a share of profit of equity accounted associates.
Gain/(loss) on disposal of subsidiaries, special purpose entities, joint ventures and associates. Gain/Loss on disposal of subsidiaries, special purpose entities, joint ventures and associates comprises gain or loss from selling an ownership interest in a company.

23
Income tax expenses. Income tax expenses represent the sum of the tax currently payable and deferred tax. The tax currently payable is based on taxable profit for the year. Deferred tax is accounted for using the balance sheet method and is recognized on differences between the carrying amounts of assets and liabilities in the consolidated financial statements and the corresponding tax bases.
Other comprehensive income for the period, net of tax. Other comprehensive income represents the difference between net income in the income statement and comprehensive income (which is the change in equity of a business enterprise during a period from transactions and other events and circumstances from non-owner sources; it includes all changes in equity during a period except those resulting from investments by owners and distributions to owners).
Total comprehensive income for the period. Total comprehensive income for the year represents the change in equity during a period resulting from transactions and other events, other than those changes resulting from transactions with owners in their capacity as owners. Total comprehensive income comprises all components of “profit or loss” and of Other comprehensive income, net of tax, and represents the certain gains and losses of the enterprise not recognized in the income statement.

24
Results of operations of the EPE Group
The following sections provide a period-by-period comparison of the EPE Group’s historical income statement data. The financial data has been prepared in accordance with IFRS, and has been derived from the EPE’s condensed consolidated interim financial statements for the nine-month period ended September 30, 2017 (which include financial information for the nine-month period ended September 30, 2016 as a comparison) and should be read in conjunction with and is qualified in its entirety by reference to these financial statements, including the notes thereto.
Results of operations of the EPE Group: the first three quarters 2017 compared to the first three quarters 2016
The following table sets forth our historical income statement data derived from the EPE’s condensed consolidated interim financial statements for the nine-month period ended September 30, 2017, prepared in accordance with IFRS as adopted by the EU, as well as other financial data. For a description of the changes in the reporting perimeter, see “Key factors affecting comparability of the results of operations of the EPE Group”.
Condensed consolidated interim statement of comprehensive income For the nine-month period ended 30 September 2017 In million EUR
2016 2017 (nine months) (nine months) Sales: Energy 1,300 1,276
of which: Electricity 929 928 Heat 237 228 Gas 111 113 Coal 23 7
Sales: Other 23 19 Gain (loss) from commodity derivatives for trading with electricity and gas, net
4 (5)
Total sales 1,327 1,290
Cost of sales: Energy (1,014) (913) Cost of sales: Other (21) (14)
Total cost of sales (1,035) (927)
Subtotal 292 363
Personnel expenses (73) (75) Depreciation and amortization (124) (105) Repairs and maintenance (6) (8) Emission rights, net (8) (14) Taxes and charges (3) (3) Other operating income 21 29 Other operating expenses (27) (32)
Profit (loss) from operations 72 155
Finance income 13 1 Finance expense (50) (54) Profit (loss) from financial instruments (15) 2
Net finance income (expense) (52) (51)

25
Share on profit of equity accounted investees, net of tax (3) - Gain/(loss) on disposal of subsidiaries, special purpose entities, joint ventures and associates
102 -
Profit (loss) before income tax 119 104
Income tax expenses (14) (29)
Profit (loss) from continuing operations 105 75
Profit (loss) from discontinued operations, net of tax (12) -
Profit (loss) for the period 93 75
Items that are or may be reclassified subsequently to profit or loss: Foreign currency translation differences for foreign operations 5 (31) Foreign currency translation differences from presentation currency 14 31 Effective portion of changes in fair value of cash flow hedges, net of tax (2) 30 Other comprehensive income for the period, net of tax 17 30
Total comprehensive income for the period 110 105
Profit (loss) attributable to: Owners of the Company Profit for the year from continuing operations 77 31 Profit for the year from discontinued operations (12) -
Profit for the year attributable to owners of the company 65 31
Non-controlling interest Profit for the year from continuing operations 28 44
Profit for the year attributable to non-controlling interest 28 44
Profit (loss) for the period 93 75
Total comprehensive income attributable to: Owners of the Company 81 59 Non-controlling interest 29 46
Total comprehensive income for the period 110 105
Key line items
Sales: Energy
Sales: Energy decreased by EUR 24 million, or 1.8%, to EUR 1,276 million for the first three quarters 2017 as compared to EUR 1,300 million for the first three quarters 2016.
Sales of electricity
Sales of electricity decreased by EUR 1 million, or 0.1%, to EUR 928 million for the first three quarters 2017 as compared to EUR 929 million for the first three quarters 2016. Decrease of revenue can be attributed mainly to Hungarian operations and lower prices achieved by them.
Sales of heat
Sales of heat decreased by EUR 9 million, or 3.8%, to EUR 228 million for the first three quarters 2017 as compared to EUR 237 million for the first three quarters 2016. The decrease in sales of heat was primarily due to disposal of LPZ in June 1, 2016 and lower heat selling price realised by BERT since

26
January 2017. It was partially compensated by higher volume of heat sold due to cold weather pattern in areas where we deliver heat.
Sales of gas
Sales of gas increased by EUR 2 million, or 1.8%, to EUR 113 million for the first three quarters 2017 as compared to EUR 111 million for the first three quarters 2016. Minor increase is primarily result of EUR 8 million increased Slovak gas sales due to cold weather pattern and minor customer portfolio acquisitions, which was compensated by EUR 6 million lower Czech gas sales primarily due to reduction of gas trading activities since January 2017.
Sales of coal
Sales of coal decreased by EUR 16 million, or 69.6% to EUR 7 million for the first three quarters 2017 as compared to EUR 23 million for the first three quarters 2016 due to lower volume of sales to external off-takers.
Sales: Other
Sales: Other decreased by EUR 4 million, or 17.4%, to EUR 19 million for the first three quarters 2017 as compared to EUR 23 million for the first three quarters 2016. This decrease was primarily due to disposal of three minor entities, EP Coal trading Polska s.a., EP CARGO POLSKA s.a and LokoTrain, in 2016, which resulted in EUR 6 million decrease.
Gain (loss) from commodity derivatives for trading with electricity and gas, net
Gain (loss) from commodity derivatives for trading with electricity and gas, net decreased by EUR 9 million, to negative EUR 5 million for the first three quarters 2017 as compared to positive EUR 4 million for the first three quarters 2016. This resulted from fair value re-measurement of trading derivatives as at the date of financial statements.
Cost of sales: Energy
Cost of sales: Energy decreased by EUR 101 million, or 10.0%, to EUR 913 million for the first three quarters 2017 as compared to EUR 1,014 million for the first three quarters 2016. This decrease in Cost of sales: Energy was primarily due to higher achieved margin on sale of electricity and natural gas by Czech and Slovak entities.
Cost of sales: Other
Cost of sales: Other decreased by EUR 7 million, or 33.3%, to EUR 14 million for first three quarters 2017 as compared to EUR 21 million for the first three quarters 2016. Decrease related to disposal of three minor companies in 2016 (see Sales: Other).
Personnel expenses
Personnel expenses increased by EUR 2 million, or 2.7%, to EUR 75 million for the first three quarters 2017 as compared to EUR 73 million for the first three quarters 2016.
Depreciation and amortization
Depreciation and amortization decreased by EUR 19 million, or 15.3%, to EUR 105 million in the first three quarters 2017 as compared to EUR 124 million for the first three quarters 2016. The decrease stems primarily from impairment charged on Hungarian operations in 2016, which decreased the subsequent depreciation charge significantly.

27
Repairs and maintenance
Repairs and maintenance costs increased by EUR 2 million, or 33.3%, to EUR 8 million for the first three quarters 2017 as compared to EUR 6 million for the first three quarters 2016.
Emission rights, net
Emission rights, net increased by EUR 6 million, or 75.0%, to negative EUR 14 million for the first three quarters 2017 as compared to negative EUR 8 million for first three quarters 2016, which primarily results from continuing decrease of emission allowances’ free allocation and higher consumption of emission allowances due to higher production in CHPs.
Taxes and charges
Taxes and charges remained at EUR 3 million for the first three quarters 2017 and 2016.
Other operating income
Other operating income increased by EUR 8 million, or 38.1%, to EUR 29 million for the first three quarters 2017 as compared to EUR 21 million for the first three quarters 2016. The increase relates to gain from sale of non-core assets (land plots and not used buildings).
Other operating expenses
Other operating expenses increased by EUR 5 million, or 18.5%, to EUR 32 million for the first three quarters 2017 as compared to EUR 27 million for the first three quarters 2016.
Finance income
Finance income decreased by EUR 12 million, or 92.3%, to EUR 1 million for the first three quarters 2017 as compared to EUR 13 million for the first three quarters 2016. Finance income is mostly represented by interest income, primarily due from loans provided to EPIF and which were repaid on May 2, 2016. New loan was drawn by EPIF in May 2017 (unpaid remained EUR 8 million as of September 30, 2017) and as a result, almost no interest income was realized in first three quarters 2017.
Finance expense
Finance expense increased by EUR 4 million, or 8.0%, to EUR 54 million for the first three quarters 2017 as compared to EUR 50 million for the first three quarters 2016. Primary reason for increase of finance expense is EUR 8 million expense related to FX losses (while in 2016 group recognized EUR 1 million FX gain).
Profit/(loss) from financial instruments
Profit/(loss) from financial instruments increased by EUR 17 million to a profit of EUR 2 million for the first three quarters 2017 as compared to loss of EUR 15 million for the first three quarters 2016. This relates to revaluation of derivatives held by group for hedging purposes.
Gain/(loss) on disposal of subsidiaries, special purpose entities, joint ventures and associates.
Gain/(loss) on disposal of subsidiaries, special purpose entities, joint ventures and associates decreased to EUR 0 million for the first three quarters 2017 as compared to EUR 102 million for the first three quarters 2016, when the German assets were disposed.

28
Income tax expenses
Income tax expenses increased by EUR 15 million, or 107.1%, to EUR 29 million for the first three quarters 2017 as compared to EUR 14 million for the first three quarters 2016. Current year income tax includes also a significant impact of special sector tax effective in Slovakia and Hungary, which to great extent, together with better tax results, drives the variance.
Other comprehensive income for the period, net of tax
Other comprehensive income for the period, net of tax, changed by EUR 13 million to EUR 30 million for the first three quarters 2017 as compared to EUR 17 million for the first three quarters 2016. It is primarily result of gain on cash flow hedging recognized in first three quarters 2017.
29
Liquidity and capital resources of the EPE Group
Capital resources
EPE’s financial condition and liquidity are and will continue to be influenced by a variety of factors, including:
• our ability to generate cash flows from our operations;
• the level of our outstanding indebtedness, and the interest EPE is obligated to pay on such indebtedness, which affects our financing costs;
• prevailing interest rates, which affect our debt service requirements;
• our ability to continue to borrow funds from banks and international debt capital markets;
• our level of acquisitions activity; and
• our capital expenditure requirements and development projects.
EPE’s historical liquidity requirements have arisen primarily from the need for us to meet EPE’s debt service requirements, to fund capital expenditures for the general maintenance and expansion of EPE’s production and heat distribution facilities and for new facilities, to fund growth in our working capital and to support our acquisition strategy.
EPE’s primary sources of liquidity historically have been cash flows from operations of subsidiaries, cash on EPE’s balance sheet and external financings (including shareholder loans and bonds since EPE’s issuance of the Notes). EPE’s ability to generate cash from our operations depends on future operating performance, which is in turn dependent, to some extent, on general economic, financial, competitive market, legislative, regulatory and other factors, many of which are beyond our control.
EPE believes that its operating cash flows, together with the cash reserves and future borrowings permitted under EPE’s debt facilities, will be sufficient to fund EPE’s working capital requirements, anticipated capital expenditures and debt service requirements as they become due. EPE intends to maintain cash balances at EPE to meet the Group’s short-term liquidity needs, including working capital (which we intend to replenish periodically with cash from operations).
EP Energy and its subsidiaries may from time to time use available liquidity (from any sources) to reduce the indebtedness of the Group. In particular, subject to compliance with applicable law and the terms and conditions of the bonds, the Company and its subsidiaries may from time to time repurchase outstanding bonds issued by them in the open market or otherwise at any time and at any price, as they may determine in their absolute discretion depending on prevailing market conditions.
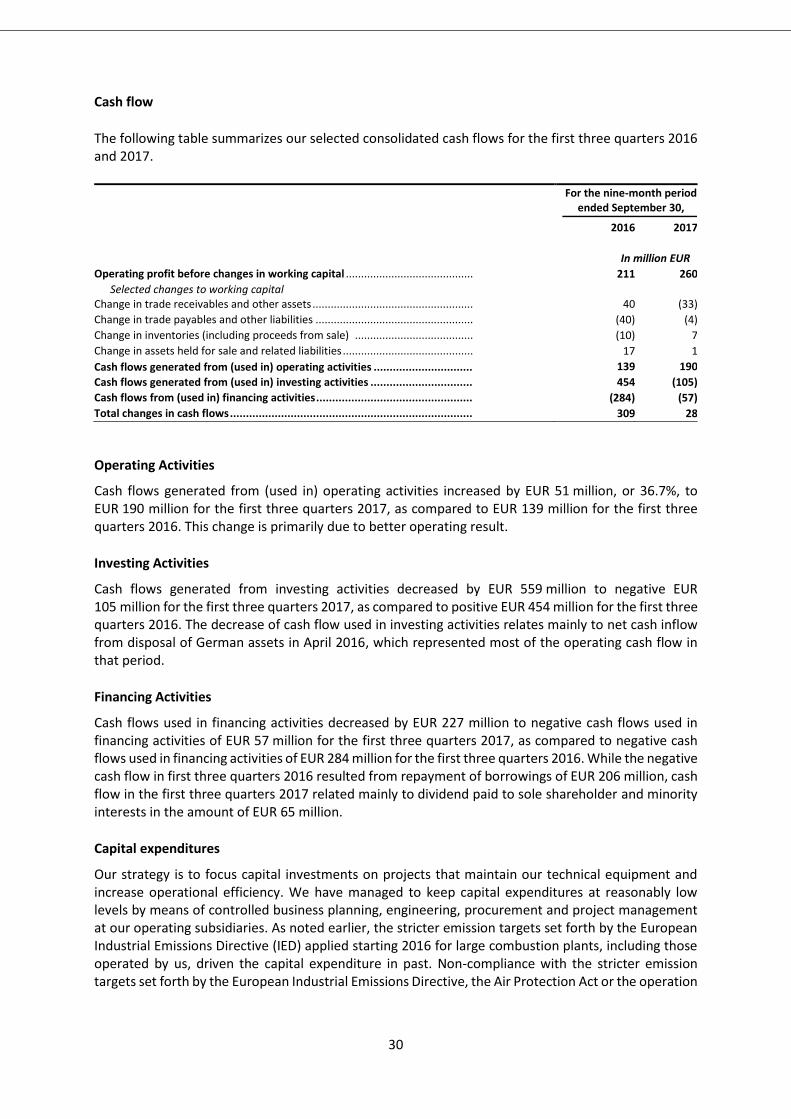
30
Cash flow
The following table summarizes our selected consolidated cash flows for the first three quarters 2016 and 2017.
For the nine-month period ended September 30,
2016 2017
In million EUR
Operating profit before changes in working capital .......................................... 211 260
Selected changes to working capital Change in trade receivables and other assets ..................................................... 40 (33)
Change in trade payables and other liabilities .................................................... (40) (4)
Change in inventories (including proceeds from sale) ....................................... (10) 7
Change in assets held for sale and related liabilities ........................................... 17 1
Cash flows generated from (used in) operating activities ............................... 139 190
Cash flows generated from (used in) investing activities ................................ 454 (105)
Cash flows from (used in) financing activities ................................................. (284) (57)
Total changes in cash flows ............................................................................ 309 28
Operating Activities
Cash flows generated from (used in) operating activities increased by EUR 51 million, or 36.7%, to EUR 190 million for the first three quarters 2017, as compared to EUR 139 million for the first three quarters 2016. This change is primarily due to better operating result.
Investing Activities
Cash flows generated from investing activities decreased by EUR 559 million to negative EUR 105 million for the first three quarters 2017, as compared to positive EUR 454 million for the first three quarters 2016. The decrease of cash flow used in investing activities relates mainly to net cash inflow from disposal of German assets in April 2016, which represented most of the operating cash flow in that period.
Financing Activities
Cash flows used in financing activities decreased by EUR 227 million to negative cash flows used in financing activities of EUR 57 million for the first three quarters 2017, as compared to negative cash flows used in financing activities of EUR 284 million for the first three quarters 2016. While the negative cash flow in first three quarters 2016 resulted from repayment of borrowings of EUR 206 million, cash flow in the first three quarters 2017 related mainly to dividend paid to sole shareholder and minority interests in the amount of EUR 65 million.
Capital expenditures
Our strategy is to focus capital investments on projects that maintain our technical equipment and increase operational efficiency. We have managed to keep capital expenditures at reasonably low levels by means of controlled business planning, engineering, procurement and project management at our operating subsidiaries. As noted earlier, the stricter emission targets set forth by the European Industrial Emissions Directive (IED) applied starting 2016 for large combustion plants, including those operated by us, driven the capital expenditure in past. Non-compliance with the stricter emission targets set forth by the European Industrial Emissions Directive, the Air Protection Act or the operation

31
permit in the designated time periods may lead to the imposition of penalties or even result in operations being shut down.
We also expect to accelerate our capital expenditures on certain refurbishments to our heating network operations over the next years in order to be eligible for public subsidies currently available in the Czech Republic.
During the first three quarters 2016 and 2017, capital expenditures, irrespective of actual cash flows, were as follows:
As of and for the nine-month period ended September 30,
2016 2017
Capital expenditures for tangible fixed assets...................................................... 81 61
Capital expenditures for intangible fixed assets excluding emission rights ......... 3 2
Capital expenditures for emission rights (incl. free allocations) .......................... 10 9
Total capital expenditures .............................................................................. 94 72
Property, plant and equipment, at depreciated cost ........................................... 1,579 1,542
Capital expenditures for tangible fixed assets and intangible fixed assets excluding emission rights
Capital expenditures for tangible fixed assets decreased by EUR 20 million, or 24.7%, to EUR 61 million for the first three quarters 2017 as compared to EUR 81 million for the first three quarters 2016. This decrease mostly relates to large investment made in EOP in 2016 due to stricter emission requirements (finishing of investments made mainly in 2015) and partially also due to postponing some of the investment due to cold weather in first three quarters of 2017 (especially SSE operations).
Capital expenditures for intangible fixed assets decreased by EUR 1 million, or 33.3%, to EUR 2 million in the first three quarters 2017 as compared to EUR 3 million in first three quarters 2016.
Capital expenditures for emission rights
For the periods presented in this Report out of all entities included in the EPE Group, EOP, PE, UE and BERT were required to purchase emission allowances for their own respective consumption due to an insufficient allocation of emission allowances. The share that our Czech operating subsidiaries will need to purchase will increase over time as the result of the allocation system under which fewer emissions allowances are now allocated free of charge. We are exposed to changes in the way emissions allowances are allocated, including the conditions attaching to free allocations and the allocation of emissions allowances, as well as volatility in the market prices of emissions allowances that we need to acquire.

32
Contractual and other material financial obligations of the EPE Group
The table sets out our loans and borrowings as of December 31, 2016 and September 30, 2017.
In EUR millions Dec 31, 2016 Sep 30, 2017
Issued debentures at amortised cost ........................................................................ 1,098 1,114
Loans payable to credit institutions .......................................................................... 38 34
Loans payable to other than credit institutions ........................................................ 14 13
of which owed to the parent company / ultimate parent company ......................... - -
of which owed to other related companies ............................................................... 14 13
Total .......................................................................................................................... 1,150 1,161
Non-current ............................................................................................................... 1,140 531
of which owed to the parent company / ultimate parent company .......................... - -
of which owed to other related companies ............................................................... 14 13
Current ...................................................................................................................... 10 630
Total .......................................................................................................................... 1,150 1,161
Off-balance sheet arrangements of the EPE Group
The table below sets out EPE’s financial commitments and contingencies as of December 31, 2016 and September 30, 2017.
In EUR millions Dec 31, 2016 Sep 30, 2017
Granted pledges – securities .................................................................................... 855 890
Guarantees given ..................................................................................................... 117 129
Other granted pledges ............................................................................................. 886 1,186
Total ................................................................................................................... 1,858 2,205
Granted pledges represent securities of individual EPE Group companies used as collateral for external financing.
Guarantees given mainly include contracts for the future supply of energy for EUR 129 million (December 31, 2016: EUR 113 million).
Other granted pledges:
In EUR millions Dec 31, 2016 Sep 30, 2017
Loans granted(1) ....................................................................................... 325 323
Property, plant and equipment ............................................................... 395 394
Cash and cash equivalents ...................................................................... 75 386
Trade receivables .................................................................................... 62 59
Inventories .............................................................................................. 29 24
Total ................................................................................................... 886 1,186
(1) Total balance of pledged granted loans includes intercompany loans of EUR 309 million (December 31, 2016: EUR 319 million)
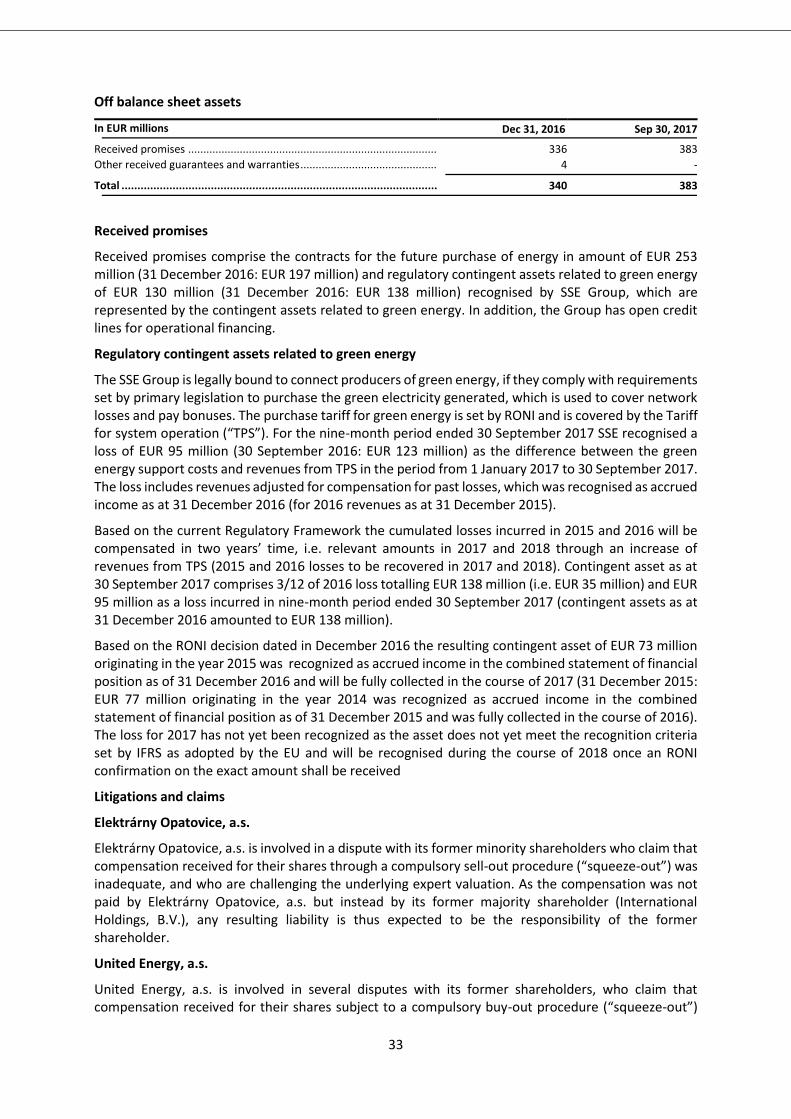
33
Off balance sheet assets
In EUR millions Dec 31, 2016 Sep 30, 2017
Received promises .................................................................................. 336 383
Other received guarantees and warranties ............................................. 4 -
Total ................................................................................................... 340 383
Received promises
Received promises comprise the contracts for the future purchase of energy in amount of EUR 253 million (31 December 2016: EUR 197 million) and regulatory contingent assets related to green energy of EUR 130 million (31 December 2016: EUR 138 million) recognised by SSE Group, which are represented by the contingent assets related to green energy. In addition, the Group has open credit lines for operational financing.
Regulatory contingent assets related to green energy
The SSE Group is legally bound to connect producers of green energy, if they comply with requirements set by primary legislation to purchase the green electricity generated, which is used to cover network losses and pay bonuses. The purchase tariff for green energy is set by RONI and is covered by the Tariff for system operation (“TPS”). For the nine-month period ended 30 September 2017 SSE recognised a loss of EUR 95 million (30 September 2016: EUR 123 million) as the difference between the green energy support costs and revenues from TPS in the period from 1 January 2017 to 30 September 2017. The loss includes revenues adjusted for compensation for past losses, which was recognised as accrued income as at 31 December 2016 (for 2016 revenues as at 31 December 2015).
Based on the current Regulatory Framework the cumulated losses incurred in 2015 and 2016 will be compensated in two years’ time, i.e. relevant amounts in 2017 and 2018 through an increase of revenues from TPS (2015 and 2016 losses to be recovered in 2017 and 2018). Contingent asset as at 30 September 2017 comprises 3/12 of 2016 loss totalling EUR 138 million (i.e. EUR 35 million) and EUR 95 million as a loss incurred in nine-month period ended 30 September 2017 (contingent assets as at 31 December 2016 amounted to EUR 138 million).
Based on the RONI decision dated in December 2016 the resulting contingent asset of EUR 73 million originating in the year 2015 was recognized as accrued income in the combined statement of financial position as of 31 December 2016 and will be fully collected in the course of 2017 (31 December 2015: EUR 77 million originating in the year 2014 was recognized as accrued income in the combined statement of financial position as of 31 December 2015 and was fully collected in the course of 2016). The loss for 2017 has not yet been recognized as the asset does not yet meet the recognition criteria set by IFRS as adopted by the EU and will be recognised during the course of 2018 once an RONI confirmation on the exact amount shall be received
Litigations and claims
Elektrárny Opatovice, a.s.
Elektrárny Opatovice, a.s. is involved in a dispute with its former minority shareholders who claim that compensation received for their shares through a compulsory sell-out procedure (“squeeze-out”) was inadequate, and who are challenging the underlying expert valuation. As the compensation was not paid by Elektrárny Opatovice, a.s. but instead by its former majority shareholder (International Holdings, B.V.), any resulting liability is thus expected to be the responsibility of the former shareholder.
United Energy, a.s.
United Energy, a.s. is involved in several disputes with its former shareholders, who claim that compensation received for their shares subject to a compulsory buy-out procedure (“squeeze-out”)

34
was inadequate, and who are challenging the validity of the underlying resolution of the general shareholders meeting. The outcome of this matter is unforeseeable and United Energy, a.s. intends to defend itself.
In May 2014, Court of appeal came to the conclusion that one claim challenging the validity of the underlying resolution of the general shareholders meeting is not relevant and UE believes that this conclusion may serve as a precedent for the other claims.
The parallel dispute regarding inadequate compensation is still ongoing with no clear outcome. The court hearing with mediator took place in September 2017 with no decision. Next meeting with mediator is planned be held by the end of 2017.
Plzeňská energetika a.s.
In August 2012, Škoda Investment a.s. (SI) filed a claim for unjust enrichment against Plzeňská energetika a.s. (PE) for approximately EUR 2 million. This unjust enrichment claim allegedly arises from the fact that Plzeňská energetika a.s. owns and operates utility distribution systems (e.g., for gas, water and heat), which lie on the property of Škoda Investment a.s., thereby illegally restricting the ownership of Škoda Investment a.s. In February 2016 both parties, i.e. PE as well as SI, received an official request from the court to settle the dispute by mediation. Following this request the hearing has been adjourned until further notice. In June 2016 SI has filed an additional claim for unjust enrichment against PE for approximately EUR 1 million. Additional claim covers period 2013 – 2014. After considering all the circumstances Plzeňská energetika a.s. created an adequate provision as at 30 September 2017. Since mediation did not lead to any outcome, it was terminated and the next court hearing is planned to be held by the end of the year.
Stredoslovenská energetika, a.s. Group (“SSE Group”)
The SSE Group is a party to various legal proceedings. As at 30 September 2017 and 2016 no legal provisions were recorded. The Group management has decided not to disclose details in respect of material legal claims as they are currently ongoing and disclosure may prejudice the SSE Group.
Regulatory proceedings by ERO against Pražská teplárenská (“PT”)
PT is involved in regulatory proceedings commenced in October 2015 by ERO claiming that prices charged to customers of PT’s local small-scale heating infrastructures in 2011 were in breach of the Czech Act on Prices. In March 2016, ERO issued a decision ordering PT to pay EUR 9 million (CZK 240 million) consisting of a penalty in the amount of EUR 4.5 million (CZK 120 million) and restitution to affected customers in the amount of EUR 4.5 million (CZK 120 million). PT appealed the decision on 24 March 2016 with supplemental information provided on 14 April 2016. On 7 July 2016 PT received a resolution from ERO by which the Chairman of ERO returned the case again to the first instance for a new hearing. In November 2016 PT received new decision which confirmed the result of the court of the first instance. PT appealed again and on 23 December 2016 ERO issued a decision changing the amount to be paid to EUR 8 million (CZK 222 million) consisting of a penalty in the amount of EUR 4 million (CZK 111 million) and restitution to affected customers in the amount of EUR 4 million (CZK 111 million). On 26 January 2017 PT filed an appeal on the decision and applied for suspensive effect. At the same time PT submitted a fine of EUR 4 million to the ERO’s account. On 23 February 2017 the regional court satisfied the request for a suspensive effect in full and on 28 April 2017 the ERU returned the fine back to PT and PT again conservatively recorded a provision of EUR 4 million. No development has taken place since then.

35
Attachments stored on www.epenergy.cz:
EP Energy, a.s. - Unaudited condensed consolidated interim financial statements as of and for the nine-month period ended September 30, 2017 prepared in accordance with IAS 34 – Interim Financial Reporting.

36
EP Energy, a.s.
Unaudited condensed consolidated interim statement of comprehensive income For the period from July 1 to September 30, 2017
In millions of EUR (“mEUR”)
July 1 to September 30, 2017
July 1 to September 30, 2016
Sales: Energy
343 360
of which: Electricity
287 285
Heat
33 27
Gas
26 38
Coal
(3) 10
Sales: Other
8 5
Gain (loss) from commodity derivatives for trading with electricity and gas, net
(2) 2
Total sales
349 367
Cost of sales: Energy
(256) (312)
Cost of sales: Other
(5) (6)
Cost of sales
(261) (318)
Subtotal
88 49
Personnel expenses
(26) (24)
Depreciation and amortization
(36) (40)
Repairs and maintenance
(3) (2)
Emission rights, net
(4) (2)
Taxes and charges
(1) (1)
Other operating income
7 5
Other operating expenses
(9) (3)
Profit/(loss) from operations
16 (18)
Finance income
1 (1)
Finance expense
(16) (15)
Profit/(loss) from financial instruments
(3) (3)
Net finance income/(expense)
(18) (19)
Share of profit of equity accounted investees, net of tax - (3) Profit/(loss) before income tax
(2) (40)
Income tax expenses
(1) 7
Profit/(loss) for the period (3) (33)

37
EP Energy, a.s.
Unaudited condensed consolidated interim statement of cash flow For the period from July 1 to September 30, 2017 In millions of EUR (“mEUR”)
July 1 to September 30,
2017
July 1 to September 30,
2016
OPERATING ACTIVITIES
Profit (loss) for the period
(3) (33) Adjustments for:
Income taxes
1 (7)
Depreciation and amortization
36 40
Non-cash (gain) loss from commodity derivatives for trading with electricity and gas, net
(1) -
Emission rights
4 2
Share of profit of equity accounted investees - 3
Gain / Loss on financial instruments
3 3
Net interest expense
13 14
Change in allowance for impairment to trade receivables and other assets, write-offs - 1
Change in provisions - 4
Other finance fees, net
1 -
Unrealized foreign exchange gains/(losses), net (12) 2
Operating profit before changes in working capital
42 29
Change in trade receivables and other assets
(44) -
Change in inventories (including proceeds from sale)
4 (8)
Change in assets held for sale and related liabilities
1 15
Change in trade payables and other liabilities
45 (4)
Cash generated from (used in) operations
48 32
Interest paid
(1) -
Income taxes paid
1 (16)
Cash flows generated from (used in) operating activities
35 16
INVESTING ACTIVITIES
Purchase of financial instruments 1 -
Proceeds from sale of financial instruments - derivatives
4 (2)
Acquisition of property, plant and equipment, investment property and intangible assets (40) (38)
Purchase of emission rights (1) -
Proceeds from sale of property, plant and equipment, investment property and other intangible assets
1 1
Increase in participation in existing subsidiaries and special purpose entities
1 -
Cash flows from (used in) investing activities
(33) (39)
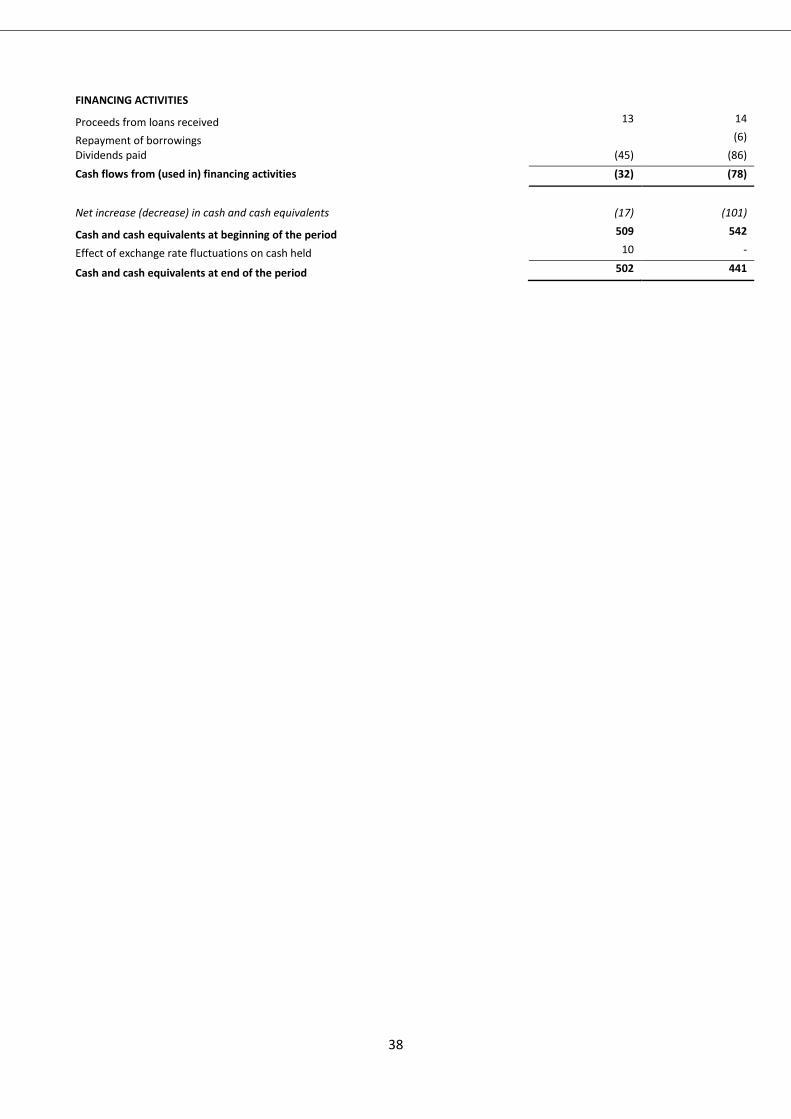
38
FINANCING ACTIVITIES
Proceeds from loans received 13 14
Repayment of borrowings (6)
Dividends paid
(45) (86)
Cash flows from (used in) financing activities
(32) (78)
Net increase (decrease) in cash and cash equivalents
(17) (101)
Cash and cash equivalents at beginning of the period 509 542
Effect of exchange rate fluctuations on cash held 10 -
Cash and cash equivalents at end of the period 502 441