Embed Size (px)
Citation preview
Report No. 16216-TR
Trinidad and TobagoThe Financing of EducationDecember 23, 1996
Human and Social Development GroupLatin America and the Caribbean Region
Document of the World Bank
Pub
lic D
iscl
osur
e A
utho
rized
Pub
lic D
iscl
osur
e A
utho
rized
Pub
lic D
iscl
osur
e A
utho
rized
Pub
lic D
iscl
osur
e A
utho
rized
Currency Equivalents(As of December 31, 1994)
US$1 = TT$5.80TT$1 = US$0.17
Fiscal Year
January 1 - December 31
Vice President Shahid Javed BurkiDirector Paul IsenmanManager/Country Sector Leader Julian SchweitzerStaff Member Kin Bing Wu
Acronyms and Abbreviations
CAC - Certificate of Acquired Competencies
CEE - Common Entrance Examination (End of Primary' Education)
CXC - Caribbean Examination Council (End of Secondary Education)
GCE A Level - General Certificate of Education Advanced Level Examination (Cambridge)
GCE 0 Level - General Certificate of Education Ordinary Level Examinlation (Cambridge)
NEC - National Education Certificate (End of Secondary Vocational Education)
14+ - Examination to be taken at the end of Junior Secondary Education
MENS - Ministry of Environment and National Serviccs
MIECA - Ministry of Industry, Enterprise, and Consumer Affairs
MLC - Ministry of Labor and Cooperatives
MOCASS - Ministry of Consumer Affairs and Social Services
MOE - Ministry of Education
MOEA - Ministry of External Affairs
MOEL - Ministry of Energy and Labor
MOF - Ministry of Finance
MOH - Ministry of Health
MOPD - Ministry of Planning and Development
MOPM - Ministry of Planning and Mobilization
MSYA - Ministry of Sports and Youth
MYSCC - Ministry of Youth, Sport, Culture, and Creative Arts
PSS - Private School Survey
SLC - Survey of Living Conditions
SLCE - School Leaving Certificate Examination
TTUTA - Trinidad and Tobago Unified Teachers' Association

PREFACE
This report was prepared by Kin Bing Wu. It is based on findings of a mission to Trinidad and Tobagofrom October 10 to October 21, 1994. The mission supported the Basic Education Project, which was taskmanaged by Joel Reyes and advised by Michael Potashnik, and Poverty Assessment, which was task managedby Judy Baker. The report was reviewed by Yoshiaki Abe, Director of Country Department III; Norman Hicks,Lead Economist; Michael Lewin, Country Economist; and Ralph Romain, Principal Education Specialist. It wasprepared under the supervision of Julian Schweitzer, Division Chief. Rajendra Swamy analyzed data from theSurvey of Living Conditions. Evelyn de Castro prepared the graphs and tables; Cecilia Zavaleta and Aracelly G.Woodall provided support in word processing.
A seminar, which was co-sponsored by the Government and the World Bank, was held to disseminatethe report in Trinidad and Tobago on April 2 and 3, 1996. Participants included representatives of the Ministriesof Finance, Planning and Development, Education, and Community and Social Services; a representative of theTobago House of Assembly; representatives of principals, teachers, parents, employers, and higher educationinstitutions; and representatives of the Inter-American Development Bank, the Caribbean Development Bank,UNESCO, and the USAID. The seminar provided a forum to all stakeholders for discussion on a wide range ofeducation issues. The open exchange of ideas laid the basis for defining the agenda for further reform. Anotheroutcome of the seminar was the subsequent initiation by the Trinidad and Tobago Unified Teachers' Associationand Principals' Associations to undertake a study on school-level finance to complement this study.
This final report incorporated the feedback from stakeholders, updated information on enrollment andpublic expenditure on education, added new findings on achievement, and projected the school-age population.Haiyan Hua analyzed data from the International Study on Reading Literacy. Eduard Bos projected thepopulation growth based on official information from the 1990 census. Veena Mayani assisted in revising theexpenditure data, and Luca Pastorello prepared the new graphs and tables. Rosalia Sanchez-Rushton providedsupport in word processing.

Acknowledgments
This report was made possible by the cooperation of colleagues in Trinidad and Tobago. Special thanksare due to the following individuals:
In the Ministry of Education, Mr. Augustus Ramrekersingh, Minister; Mr. Justin Paul, Permanent Secretary(Administration); Ms. Claudia Harvey, Permanent Secretary (Curriculum); Mr. Kenrick Seeparsad, ChiefEducation Officer; Mr. Hollison Gift, Director of Planning; Ms. Kathleen Thomas, Director of Finance; Ms.Janet Stanley-Marcano, Director of Research and Evaluation; Mr. Maurice Chin-Aleong, Planning Officer; Ms.Pryma Harrysingh, Economist; Ms. Yvonne Lewis, Educational Research Officer; Mr. Narine Singh, ResearchOfficer; Ms. Jennifer Hussain, Education Research Officer; Mr. Dhanraj Ramnarine, Research Officer; Mr.Whitney Alfred, Planner, Education Facilities; Mr. Ralph Francois, Statistics Officer 3 (Acting); Ms. MargaretRichards, Accounting Executive 2; Mr. Ken Balbos, Accounting Executive 2; Mr. Kenneth Carew, AccountingExecutive 1 (Acting); Mr. Rambaran, Accountant, Educational Facilities Maintenance Unit; Mr. BrianBissessar, Training Officer 2; Ms. Allison Carrington, Training Officer 1; Mr. Fulton Alfred, School Supervisor1, Port of Spain Environs; Mr. Kenneth Fullong, School Supervisor 2, St. George Regional District; Ms. MollyGuy, Pre-School Supervisor 2; Ms. Mala Dhanie, Pre-School Supervisor 1; Mr. Rupert Martin, Supervisor,Learning Resource Center; Ms. Helen Thomas, Research Assistant, Planning Unit.
In the Ministry of Finance, Ms. Joyce Ramoutar, Senior Economist, Monetary, Fiscal and Trade Div 3ion; andMs. Wilma Horrell, Budget Analyst 2, Budget Division.
In the Ministry of Planning and Development, Ms. Dorothy Sookdeo, Director, Project Planning andReconstruction, and Ms. J. St. Cyr, Assistant Director, Project Planning and Reconstruction.
In the Central Statistics Office, Mr. Peter Pariag, Senior Statistician; Mr. Clifford Lewis, Statistician; and Mr.Sinaanr Bajnath, Statistical Assistant for providing very useful information.
In the University of West Indies, Ms. Jenevieve Vincent, Accountant; Professor Vena Jules, Faculty ofEducation.
In the Schools, Mr. Bernard Garcia, Principal of Malabar Roman Catholic School in East St. George; Mr.Martin Brathwaite, Vice Principal of Guaico Government Primary School in North Eastern Education Divisionof St. George; Ms. Rose Bereaux, Principal of St. Philip Government School in Port of Spain; Mr. RoyAugustus, Principal, Rosary Boys' School (Catholic) of Port of Spain; Mr. Ramjit Ramsook, Vice Principal, MCBean Hindu School in Caroni; and Mr. Lalman Nanan, Principal, Serville School (private), Caroni; Ms.Catherine Robley Philips, Senior Person, Belmont Pre-School in Port of Spain; and Ms. Veronica Piris, Diane'sPlayhouse, Balisier Street Kindergarten (Private), Couva, Caroni. I appreciate the cooperation of Father GeraldPantin, Executive Director, and Sister Ruth of Servol.

I
Table of Contents
EXECUTIVESUMMARY ............................................................... vii
1. EDUCATION IN TRINIDAD AND TOBAGO ................................................................ 1
A. ACCOMPLISHMENTS AND CHALLENGES ................................................................ 1B. THE EDUCATION SYSTEM ............................................................... 2C. QUALITY ................................................................ 5D. GOVERNANCE AND FINANCE ................................................................ 11E. DIFFERENCES IN RESOURCE ENDOWMENT AMONG DIFFERENT TYPES OF SCHOOLS .......................................................... 1 3F. PRIVATE EXPENDITURE ON EDUCATION ............................................................... 14
(1) Sources ofprivatefunding .............................................................. 14(2) Estimates of Total Household Spending on Education .............................................................. 15
2. PUBLIC EXPENDITURE ON EDUCATION ............................................................... 17
A. DISTRIBUTION OF EDUCATION EXPENDITURE BY MINISTRY ............................................................... 17B. RECESSION, STRUCTURAL ADJUSTMENT, AND PUBLIC EXPENDITURE ON EDUCATION ...................................................... 21
(I) Austerity Measures ............................................................. 23(2) Changes in composition ofpublic expenditure on education .............................................................. 23(3) Changes in intra-sectoral allocation ............................................................. 25(4) Fluctuation in public spending on education .............................................................. 28
3. SYSTEM PERFORMANCE INDICATORS FOR THE RICH AND POOR ............................................................. 30
A. ENROLLMENT RATES ATTENDANCE AND THEIR VARIATION ................................................................ 30B. OUT-OF-POCKET COSTS AND THEIR INCIDENCE ............................................................... 3 3C. ACHIEVEMENT RESULTS ............................................................... 37D. LABOR MARKET OUTCOMES ............................................................... 41
4. EDUCATION AND THE ROLE OF GOVERNMENT ............................................................... 43
A. IMPLICATIONS FOR FUTURE EDUCATION FINANCE ............................................................... 43B. POLICY OPTIONS FOR QUALITATIVE IMPROVEMENT ............................................................... 44C. OPPORTUNITIES AND CHALLENGES ............................................................... 47
REFERENCES AND INFORMATION SOURCES ...................................................... 50APPENDICES ...................................................... 53
Contents
TABLES
Table 1: .... Types of and Enrollment in Secondary Schools, 1994 ..................................... 12
Table 2: .... Teachers' Qualification at the Secondary Level ..................................... 14
Table 3: .... Estimates of Private Spending on Education, 1991 ..................................... 16
Table 4: ... GDP, Central government Revenue and Expenditure, and Government Expenditure onEducation, 1985-94 .21
Table 5: .... Changes in the Composition of Public Expenditure on Education, 1985-94 ......................... 24
Table 6: .... Changes in Recurrent Public Expenditure on Education, 1985-94 ..................................... 26
Table 7: .... Changes in Enrollment and Annual Per-student Recurrent Public Expenditure, 1985-94 ......... 27
Table 8: .... Changes in Recurrent Per-student Expenditure as a Percentage of Per Capita GDP, 1985-94 ... 27
Table 9: .... School Enrolled by Age, Education Level, and Expenditure Quintile ................................ 31
Table 10: .... Secondary School Enrollment by Grade and Income Group (Percentage) ........................... 32
Table 11: .... Level of Educational Attainment of Heads of Household by Per Capita Expenditure Quintile ..33
Table 12: .... Mean Days of Attendance and Reasons for Non-attendance ............................................ 34
Table 13: .... Means of Transportation (Percentage) ................................................................. 35
Table 14: .... Travel and Lunch Cost by Education Level (TT$) ........................................................ 35
Table 15: .... Textbook Availability and Reasons for Non-availability (Percentage) ................................ 36
Table 16: .... Percentage of Primary School Students Scoring Below the Minimum Acceptable levels in theCommon Entrance Examination by School Type, 1994 .37
Table 17: .... Mean CEE Score for Entrance to Secondary Schools by School Type and Enrollment inSecondary Schools by School Type and Family Income Level .38
Table 18: .... Family Income and Mean CEE Score of Intakes into Secondary Schools from Various Years ..38
Table 19: .... Distribution of Mean CEE Examination (Percentage) .................................................... 39
Table 20: .... CXC Examination Pass Rates at Exit of Secondary Education (Form 5), 1988 (Percentage) .... 39
Table 21: .... Placement Rates and Mean CEE Scores at Entrance to Secondary School by Education District,1992 .40
ii
Contents
Table 22: .... Labor Force by Employment Status, Gender and Educational Attainment, 1990 ................... 41
BOXES
Box 1: The Education System in Trinidad and Tobago, 1994 .................................................... 3
Box 2: The Total Sources of Public and Private Funding in an Extremely SuccessfulAssisted School .......................................................... 15
Box 3: Ministries with Budgets on Education and Training ...................................................... 19
Box 4: Categories and Sources of Funding of Recurrent public Expenditure on Education ............... 20
FIGURES
Figure la: Gross Enrollment Ratio in Lower Secondary Education .................................................. 4
Figure lb: Gr oss Enrollment Ratio in Preschool .......................................................... 4
Figure 2: Population A: Mean Test Scores in IEA Reading Literacy Study ....................................... 6
Figure 3: Population B: Mean Test Scores in IEA Reading Literacy Study ........................................ 6
Figure 4: % of Candidates Passing Biology in CXC Exam .......................................................... 8
Figure 5: % of Candidates Passing Chemistry in CXC Exam ........................................................ 8
Figure 6a: % of Candidates Passing English A in CXC Exam.9
Figure 6b: % of Candidates Passing English B in CXC Exam ......................................................... 9
Figure 7: % of Candidates Passing Math in CXC Exam .......................................................... 10
Figure 8: % of Candidates Passing Physics in CXC Exam .......................................................... 10
Figure 9: GDP Central Government Revenue & Expenditure (1985-1994) ...................................... 22
Figure 10: Total Expenditure on Education by Level (1985-1994) .................................................. 22
Figure 11: Total Recurrent Public Expenditure on Education by Level (in million constant 1994 TT$)1985-94 .22
..i
Contents
Figure 12: Per-Student Recurrent Public Expenditure (1985-1994) (In constant 1994 TT$) ................... 22
Figure 13: Determinants of Effective Learning at Primary Level .................................................... 44
Figure 14: Projection of School-Age Population between 1990 and 2020 in Trinidad and Tobago ........... 49
APPENDICES
Appendix 1: GDP (In Million TT$), 1985-94 ............................................................... 54
Appendix 2: Central Government Revenue and Expenditure (In Million TT$), 1985-94 ............... 55
Appendix 3A: Public Expenditure on Education, 1985-94 (In Million TT$ at Current Prices) .......... 56
Appendix 3B: Public Expenditure on Education (Percentage of Total of Each Level) ..................... 58
Appendix 4: Share of Recurrent and Capital Expenditure on Education by Level, 1985-94 ........... 60
Appendix 5: Total Public Expenditure by Level, 1994-95 (In Million Constant 1994 TT$) ............ 61
Appendix 6: Enrollment in Government & Assisted Schools by Level of Education (Number ofStudents) ................................................... 62
Appendix 7: Per-student Recurrent Public Expenditure (In Constant 1994 TT$) ............. .......... 63
Appendix 8: Per-student Recurrent Expenditure as a Percentage of per Capital GDP .................. 64
Appendix 9: Estimate for 1993/94 of Annual Cost of Undergraduate Degree Programs at St.Augustine Campus, Trinidad ......................................................... 65
Appendix 10: Private School Recurrent Expenditure, 1991 .................................................... 66
Appendix 11: Estimates of Household Spending on Education , 1991 (In Current 1991 TT$) .......... 67
Appendix 12: Projected School-Age Population By Selected Age Range, 1990-2020 ..................... 68
Appendix 13: Trinidad and Tobago Repetition, Promotion, and Dropout Rates in Primary Education71
Appendix 14: Cohort Flow Analysis ......................................................... 72
Appendix 15: Additional Recurrent Cost for Expanding Coverage, 1994-2001 ............................ 74
Appendix 16: Mean Days of Attendance for Persons Attending Full-time School (by gender) .......... 76
Appendix 17: Mean Days of Attendance for Persons Attending Full-time School (by Urban/Ruralareas) .77
iv
Contents
Appendix 18: Reasons for Non-Attendance among Primary & Secondary School Students during thePrevious Week (by Urban/Rural Classification) ................................................. 78
Appendix 19: Reasons for Non-availability of Textbooks among Primary & Secondary SchoolStudents .80
Appendix 20: Allocation of Education Budget in Trinidad & Tobago, 1985-1994 .83
Appendix 21: Average Score of CXC Examination by Country, 1995 .84
Appendix 22: Average Student Ability Scores in the IEA International Study on Reading Literacy 85
v

I
Executive Summary
1. Trinidad and Tobago (T&T) has made much progress in education. Since Independence, the countryhas built a complete education system from pre-schools to postgraduate studies. Near universal primaryeducation was achieved as early as the 1960s. Equal access has been extended to all children irrespective ofgender, race and religion. In 1994, about 45 percent of the 3- and 4-year-olds enrolled in pre-school, about70 percent of primary school graduates entered secondary education; and over 6 percent of the 19-to-24-year-olds enrolled in post-secondary education.
2. Governance of education is public, religious, and private; however, public finance extends to schoolslruII by religious denominations (assisted schools). The government assumes the bulk of the responsibility forfinancing primary and secondary education, vocational and technical education and training, and tertiaryeducation, while leaving early childhood education mostly to the private sector. Public funding covers 100percent of recurrent and capital expenditure of government schools, and 100 percent of recurrent spendingbut 75 percent of capital expenditure of assisted primary schools and 67 percent of capital expenditure ofassisted secondary schools. Public expenditure on education accounted for 4 to 5 percent of the GDP in theperiod from 1985 to 1994, and household expenditure on education for approximately 2 percent of the GDP.
3. These expenditures have been, in substantial part, financed by the country's natural endowment ofpetroleum. Since the fall in oil prices in 1982, the economy has suffered from negative growth in 9 of 12years between 1982 and 1994. Government budgetary deficits led to the adoption of structural adjustmentmeasures in 1986. Government spending was reduced by about 29 percent in real terms between 1985-87and 1992-94, and public allocation to education by about 26 percent. The economic reform program, whichwas started in 1989 and accelerated in 1992, had reversed the economic decline. In 1994, GDP grew nearly 4percent in real terms.
4. With the resumption of growth, it is imperative to address the problems of education that haveresulted from a decade of reduced investment in the sector. The major challenges are quantitative expansionand qualitative improvement. Furthermore, there is increasing evidence that the quality of education providedin most schools is poor. The large variability in learning outcomes among children from different incomegroups and school types, as measured by nationwide selection examinations, has persisted through the years.More recently, an international study on reading found that T&T's 9- and 14-year-olds performed poorlyrelative to students in some 20 participating countries, given the country's level of development. Moreover,the study confirmed the existence of large between-school and rural and urban disparities in achievement.This bodes poorly for the country's new economic development strategy of reducing its reliance on petroleumexports by encouraging foreign investment and developing labor intensive industries; a low skilled butrelatively high cost labor force is not competitive on the international market. Moreover, as education ispositively associated with productivity and earnings, variability in educational attainment and achievementwill lead to differential employment prospects and future life-time earnings, thereby contributing toperpetuating the cycle of poverty.
5. The Ministry of Education (MOE) rose to meet these challenges by organizing a national task force toformulate a comprehensive education reform program. The resultant Education Policy Paper (1993-2003)articulates the vision for educational accomplishment, identifies the areas that require qualitativeimprovement, quantitative expansion, and additional investment, and lays out a strategy for restructuring thesystem of educational management and delivery. Specific measures which require additional financinginclude training of administrators and teachers; reducing pupil-to-teacher ratios; increasing teachers' salaries;de-shifting junior secondary schools and paying for places in private secondary schools to accommodate thesestudents; and to construct new schools. This ambitious plan calls for a careful examination of education
vii
policies, the past and present patterns of educational finance, and performance of the system in order to assessthe sustainability of the reform.
6. The review of public expenditure on education found that budgets for education and training havebeen scattered across a number of ministries. Any efforts to rationalize the use of scarce resources must beginby identifying allocation on education and training in various ministries in order to establish the magnitude ofspending and to identify trends over time.
7. The major categories of recurrent spending on education are personnel cost, goods and services,minor equipment, and transfers and subsidies. Recurrent expenditures accounted for 95 to 98 percent of thetotal education budget, while capital expenditure accounted for the remainder of the share. Of the recurrentexpenditure, personnel was the largest component, accounting for 69-78 percent between 1985-87 and 1992-94, to be followed by transfers and subsidies to assisted schools, higher education, and households throughscholarships, grants, and school lunch, which accounted for 17 to 22 percent over the same period. Goodsand services accounted for 3 to 4 percent, and minor equipment for 0.1-0.2 percent. Between 1985-87 and1992-94, both the share of personnel expenditure and minor equipment declined, but the share of goods andservices and transfers and subsidies increased. Among subsidies to households, book grants were completelyhalted, but school lunch has been growing and subsidies to tertiary education also grew.
8. In 1985-87, primary education claimed 47 percent and secondary education 36 percent of the totalrecurrent education expenditure, while tertiary education 7 percent or 11 percent if spending on Teachers'College and post-secondary technical institutes were added. However, the magnitude of decline in publiceducation expenditure over the years differed by level of education -- primary and secondary educationdeclined by 38 percent, respectively, and technical education by 33 percent, while tert.ary education rose by19 percent. As enrollment increased between the 1985-87 and 1992-94 period, per-student spending wasreduced by 45 percent in primary education, 40 percent in secondary education, and 32 percent in technicaleducation, much steeper than the decrease by 13 percent in higher education.
9. In 1992-94, per-student recurrent public expenditure was equivalent to 8 percent of the GDP percapita in primary education, 12 percent in secondary education, 17 percent in technical education, 86 percentin teacher education, and 91 percent for university education. This ratio indicates that public subsidizationwas lowest in primary education to which the poor have access, but heaviest in university, where upper andmiddle class children are overwhelmingly represented. In comparison with the ratio of 1985-87, publicspending in the early 1990s has become even more regressive.
10. Education and Poverty. Analysis of the Survey of Living Condition data, collected in 1992, found alarge degree of variation in enrollment by expenditure quintile. While students from all expenditure quintilesattended primary school, the representation of children from low income families was progressively reducedas the level of education increased. University was clearly a venue for the wealthy: enrollment by studentsfrom the fifth quintile was four times as much as that by youths in the fourth quintile, compared with zeroenrollment of youths in the first to the third quintals. Transportation and lack of textbook were problems forlow income children, particu!arly rural children, 64 percent of students in the lowest quintile walked toschool, ^ompared with 21 percent in the fifth quintile who walked. Moreover, over 30 percent of schoolstudents in first quintile did not have textbooks, compared with less than 10 percent among the fifth quintile.
11. In the Common Entrance Examination, 44 and 55 percent of Standard 5 students in governmentprimary schools scored below the minimal acceptable levels in mathematics and English. respectively,compared with 37 and 49 percent of students in assisted primary schools, and 12 and 13 percent in privateprimary schools. It is clear that students in government schools performed the worst, and those in privateschools, the best. Since government schools tend to cater for poorer students, and since students are selected
viii
to different types of secondary schools according to their CEE scores, poor students who attend publicprimary school have fewer opportunity for post-compulsory education or are tracked to secondary schools ofthe last choice.
12. Students in junior secondary schools, senior comprehensive, and composite schools have the lowmean CEE scores at the point of entrance to secondary education, whereas those in 7-year traditional schoolshave the highest scores. Students from lower income families are concentrated in junior secondary, seniorcomprehensive, and composite schools. By contrast, students from upper and middle classes have the highestconcentration in 7-year traditional schools, 5-year traditional schools, and Sixth Form Colleges, far abovetheir share in the total student population in secondary schools.
13. Inequity in education is reflected in unequal access to different levels of education, as well as toschools of different quality. Denominational sectors tend to be able to tap into other private resources due totheir connections with religious and business communities. Therefore the resource endowment variesenormously from school to school. The ability of households to bear the direct and indirect cost of schoolingaffects enrollment and educational attainment. Poor families are less likely to be able to afford pre-school fortheir children, and thus less being able to prepare them for formal schooling. When the children reachcompulsory education age, the poor have little option to send their children outside the local school catchmentareas; rather they must accept whatever quality the nearby school can provide. They are less likely to be ableto afford textbooks for their children, who thus suffer a distinct disadvantage in competition with studentsfrom better off families. As a result, children from low-income families are less likely to perform well inexamination, and less likely to be placed in secondary school. Even when they are placed, they are morelikely to be tracked to junior secondary schools that offer shorter hours of instruction and less qualifiedteachers. As a result, they are less prepared to progress further to the next level. At the same time, theirfamily is less likely to buy textbooks or afford the opportunity cost to keep them in school. Rural students areadversely affected more than urban students due to greater difficulty in organizing transportation, lesseravailability of textbooks, and lesser availability of places in secondary schools. When the disadvantagedstudents leave school, they have acquired less cognitive skills and are less able to compete in the job market,resulting in higher probability of unemployment. For women, their child care responsibility becomes abarrier to participation in the labor market and to income-generating activities.
14. Policy Options. Policy instruments to improve learning generally can be grouped into five types: (i)provision of instructional materials and facilities (such as textbooks, libraries, and laboratories); (ii) increasingthe opportunity to learn through increasing instructional time and homework; (iii) provision of teachertraining; (iv) increasing teachers' salaries; (v) and reducing class size. Other factors which affect learningachievement include home environment and parental practices. However, these can be less directlyinfluenced by policy intervention and are beyond the scope of this study. Research on school effectivenessfound that providing school libraries is cost-effective in nearly 90 percent of the studies, and increasinginstructional time (such as lengthening the school day or providing additional instruction in a certain subject)almost equally effective. Asking students to do homework comes third, and provision of textbooks tochildren who do not have them comes fourth. Improving teachers' knowledge through training is found to beeffective the majority of the cases, and having experienced teachers also come close. However, provision oflaboratories, increasing teacher salaries, and reducing class size are found to be effective in less than 40percent of the cases.
15. Policy makers are well advised to take note of these findings before committing resources tointerventions which are least cost-effective but have enormous recurrent cost implications. Given theimportance of libraries in facilitating learning, the government is going in the right direction in providingschool libraries. Also, given the importance of textbooks to learning, and since over 30 percent of students in
ix
the lowest quintile lack books, the elimination of textbook subsidies in 1988 was misguided Building up theschool library and providing book grants are two areas where the government can act effectively.
16. On the issue of instructional time there is room for improvement. T&T now has 195 school days perschool year and 897 hours of instruction for primary education, lower than East Asian countries such as SouthKorea which has 204 days and 980 hours, and Malaysia, which has 210 days and 1,008 hours. To improveoverall achievement of students in the country, it is advisable for the authorities to increase the school days orinstructional hours. This will provide more opportunity to learn and to solidify what has been taught.Extending the number of school days would have resource implications. However, the Education PolikyPaper recommends increasing teachers' salaries as an incentive for acquiring better qualifications. If this is tobe implemented, the reward to teachers for longer school days instruction hours should be included as part ofthe reward.
17. On the issue of instructional hours and deshifting, the Education Policy Paper explicitly recognizesthe shorter hours offered in junior secondary schools as a problem and talks of deshifting as a remedy.However, available international evidence does not find any negative impact of double-shift schooling,provided that the hours of instruction have been adequate. It is, therefore, advisable that junior secondaryeducation remains on a double-shift basis but the hours of instruction be extended for each shift because theresource implications for deshifting is enormous.
18. Teacher training is an area that requires special attention if quality of education is to be raised, a needexplicitly acknowledged in the Education Policy Paper. The high unit cost of Teachers' College raises thequestion as to the cost-effectiveness of the current form of pre-service teacher training. Therefore, thechallenge is not to provide more pre-service training of the same kind, but to find a cost-effective way tosupport teachers on their job. Also, the fact that schools which have more teachers with university degreeshave higher performance indicate that teachers' knowledge of their subject matter is critical to improvestudent learning. Thus, pedagogical training must be accompanied by a strong academic training of teachers.How teacher training can be done cost-effectively requires further research and careful thinking. Oneexample is the publication and distribution of teachers' guides that provides concrete support for instruction.Another is to make use of education technology and the mass media to provide information to a massaudience of students, parents, and teachers.
19. The Education Policy Paper also advocates the reduction of pupil-to-teacher ratio from 30:1 to 25:1or 20:1 as a means to improve quality. Ironically, this policy variable has been found to be the least cost-effective, and T&T's ratios compare very favorably with other countries. In T&T, the apparent correlationbetween pupil-to-teacher ratio and student achievement might be spurious--better students are tracked intoschools which are better resourced. Before measures are taken in this respect, it is advisable to take intoaccount three issues. First, given the rigidity in the redeployment and dismissal of teachers, the magnitude ofexpanding the teaching force in the government's proposal will have serious long-term implications for therecurrent expenditure on education. Any step in this direction must take the demographic trends into account.Given the projected decline in the primary school-age population, even if the current number of teachersremained unchanged, declining primary school enrollment will lead to a decline in the pupil-to-teacher ratio.Moreover, it is not the pupil-to-teacher ratio per se that will affect quality, but the training and the skill mixof teachers that is important. Consideration should be given on how best to educate, upgrade, and retainmathematics and science teachers at all levels, because these skills are also sought after by other occupations,and yet they are critical to facilitating the improvement of the competitiveness of the workforce.
20. A related issue is overcrowding in classrooms, and poor acoustic and lighting conditions. Manyprimary school buildings are structures without permanent partitions for classrooms. Classes are separated bymobile screens. The noise level within each building is extremely high, rendering it difficult for children to
x
listen. Improvement of the physical arrangement of classrooms might lead to effective learning. However,renovation would require high capital spending, and improvement can only be gradual. It is advisable thatthis factor be taken into account when building new schools.
21. To provide a level playing field for the poor, it is desirable to target children in the first quintile forassistance to enhance over school readiness. The use of a compensatory voucher to enable poor householdsto pursue pre-school education might give poor children a head start. At the same time, infant classes offeredin primary schools should be closely scrutinized to ensure that they offer active, high quality kindergarteneducation. Furthermore, the provision of child care would enable women to work to generate income fortheir families.
22 The payoff in terms of higher employment prospects of students should be examined carefully giventhe large amount of public resources spent on formal and informal vocational training.
23. Finally, it is important to mention the impact of increasing expenditure on school lunch. Whilenutrition is known to have positive effects on learning and school lunch is a means of income transfer, giventhat spending on school lunch is rapidly growing to the extent that it consumed 16 percent of primaryeducation expenditure, it is important to contain government spending in this area in order to protecteducational inputs from being crowded out.
24. The population projection from 1990 to 2020 shows that the population of children of pre-school andprimary school ages will decline at the beginning of the next century before they grow modestly again. Theimplications for the future are that even if spending remains unchanged at this level, it will be translated intohigher per-student expenditure, thereby making it possible to improve quality. However, the population of the12-to-24-year-olds will grow and peak at different periods before they go on a decline. Therefore, the futuredemand for schooling will be in the post-primary levels. The challenge to the education sector is to increasesupply to maintain the current transition rates, and eventually to universalize lower secondary education. Tofinance this, public expenditure has to be increased and cost recovery seems to be unavoidable. Variousstudies have found that students from the middle- and upper-income groups are overwhelmingly representedin senior secondary education and tertiary education. To ensure that children in the lower end of the incomedistribution have an equal opportunity for junior secondary education, charging tuition fees at uppersecondary level would help relieve the resource constraint. Scholarships and grants targeted at low-incomestudents should be made available to the qualified students to ensure that they are not denied access on thebasis of their ability to pay.
xi

1. Education in Trinidad and Tobago
A. Accomplishments and Challenges
1.1 Trinidad and Tobago (T&T) has made much progress in education. Since Independence, the countryhas built a complete education system from pre-schools to postgraduate studies. Near universal primaryeducation was achieved as early as the 1960s. Equal access has been extended to all children irrespective ofgender, race and religion. In 1994, about 45 percent of the 3- and 4-year-olds enrolled in pre-school, about70 percent of primary school graduates entered secondary education; and over 6 percent of the 19-to-24-year-olds enrolled in post-secondary education.
1.2 Expansion of the education system has been, in substantial part, financed by the country's naturalendowment of petroleum. In the 1970s and early 1980s, when petroleum and its derivatives commanded apremium in the world market, the country enjoyed unprecedented prosperity, thereby enabling rapidexpansion of secondary and tertiary education. However, as oil prices plummeted since 1982, the economyhas suffered from negative growth in 9 of the last 12 years. GDP per capita nearly halved, falling from$6,600 in 1982 to $3,700 by 1994. Government budgetary deficits led to the adoption of structuraladjustment measures. Government spending was reduced by about 29 percent between 1985-87 and 1992-94,and public allocation to education by about 26 percent. As the economy stagnated, social problems mounted.Unemployment rates climbed from 10 percent in 1982 to 20 percent by 1992. Most of the unemployed areyouths. The incidence of poverty also increased. About 21 percent of the population lived below the povertyline in 1992, and 10 percent could not even afford a nutritionally balanced food basket.
1.3 To reverse the economic decline, the government embarked in 1992 on a major reforrn program todivest public enterprises and to orient the private sector towards export; to remove policy impediments thathave constrained the level and efficiency of investments in non-oil/gas sectors; and to improve the efficiencyof production and exploration of oil and gas. As a result of these measures, real GDP grew by nearly 4percent in 1994 after a decade of almost uninterrupted economic decline. The projected growth rate between1995 and 1999 is 2 to 4 percent (World Bank, 1995). With the resumption of economic growth, it isimperative to address the problems of education that have resulted from a decade of reduced investment in thesector. The major challenges are quantitative expansion and qualitative improvement.
1.4 The Ministry of Education (MOE) rose to meet these challenges by organizing a national task force toformulate a comprehensive education reform program. The resultant Education Policy Paper (1993-2003)articulates the vision for educational accomplishment, identifies the areas that require qualitative improvementand quantitative expansion, and lays out a strategy for restructuring the system of educational managementand delivery. This ambitious plan calls for a careful examination of the education policies, the past andpresent patterns of educational finance, and performance of the system. This report begins with a descriptionof the structure, enrollment and population trends, quality, and finance of education in T&T. It analyzespublic and private expenditure on education, assesses the impact of adjustment programs on expenditure, andraises issues concerning whether resources have been used efficiently and equitably between different levelsof education. Then, it presents analyses that allow an assessment of key dimensions of system performance byincome level, and reviews the consequences of educational policies for the poor. The report closes with adiscussion of policy options on a range of specific measures to improve performance and to finance reform inan equitable manner.
B. The Education System
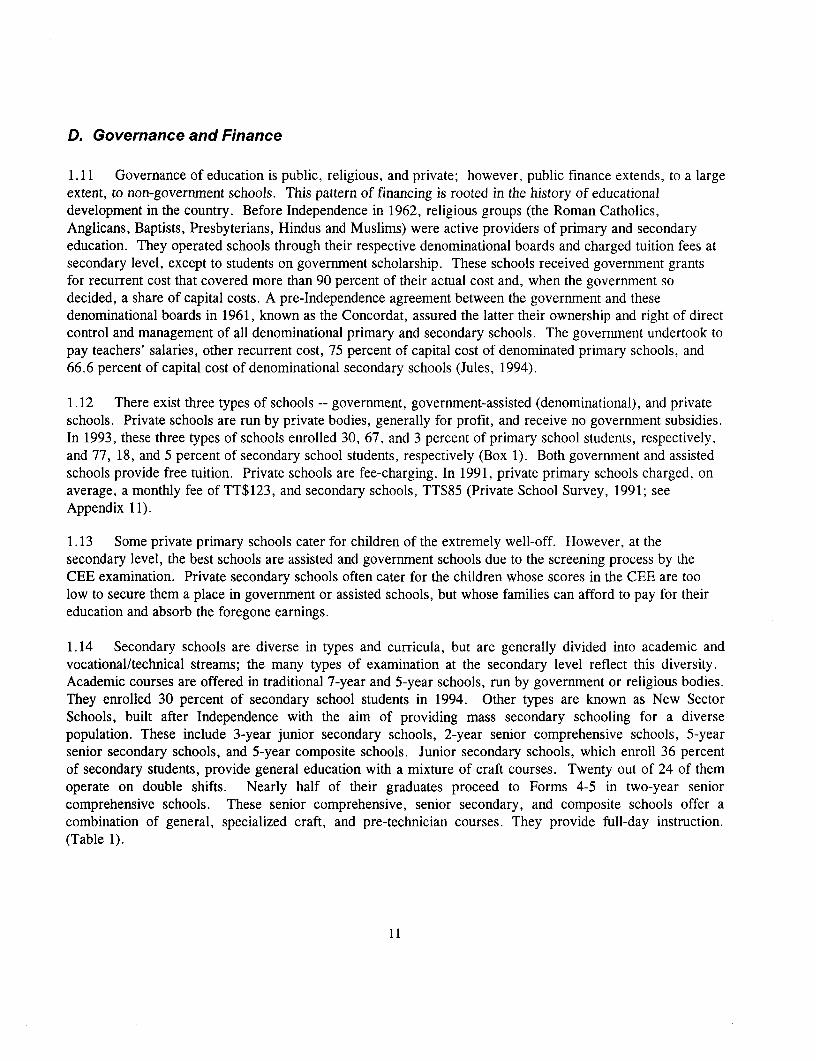
1.5 The education system in Trinidad and Tobago provides two years of pre-school education for the agecohort of 3-4; seven years of universal schooling which includes two years of "infant classes" for childrenaged 5 and 6, and 5 years of primary schooling for the 7-11 age cohort; two years of post-primary classes forthose who were not placed in secondary schools; three years of junior secondary education for the 12-14 agecohort; two years of senior secondary education for the 15-16 age group; two years of university-preparatorySixth Forms for the 17-18 age cohort; two years of technical education also for the 17-18 age group, andhigher education for the 19-plus age group. This structure reflects certain prevailing patterns in theAnglophone Caribbean countries (Box 1).
1.6 While universal primary education was attained, the gross enrollment ratio in junior secondaryeducation was below the expected level in comparison with other Caribbean countries, given T&T's GrossNational Product (GNP) per capita (Figure la). Much of the need for sorting and placement was attributableto the shortage of school places at the post-compulsory levels. Because post-primary education is notuniversal, students at the end of each schooling cycle have to sit a nationwide examination for selection forpublicly subsidized places at the next level. At the end of primary schooling, Standard 5 students sit theCommon Entrance Examination (CEE) for placement in Form 1. Those who have failed CEE twice couldenroll in post-primary levels for a maximum of two years, and take the School Leaving CertificateExamination (SLCE) to obtain a certificate of having completed primary schooling. If they pass the SLC,they can be placed in Form 2. If they fail twice, their formal schooling in public schools would beterminated, but they have the options for non-formal vocational education at youth camps, youth centers,apprenticeship, private schools, and national services.
1.7 At the secondary level, the 14+ Examination at the end of Form 3 was originally intended to screenstudents for places in Form 4. It still helps students and schools diagnose problems. The CaribbeanExamination Council General Proficiency Examination (CXC), administered at Form 5, certifies thecompletion of secondary schooling and selects students for Form 6. About 20 percent of Form 5 students alsotake the Cambridge General Certificate of Education Ordinary Level (GCE 0 Level) Examination which isset and scored in the United Kingdom. The National Examination Council (NEC) Examination, alsoadministered at Form 5, screens students in the vocational craft track for admission to Technical Institutes.Graduates from Technical Institutes have to be certified by the process of Certificate of AcquiredCompetencies (CAC). The Cambridge General Certificate of Education Advanced Level (GCE A Level) isadministered at the end of Upper Sixth Form for selection for university places.'. This system of selectionand examination has truncated the curriculum, driven classroom interaction, and generated enormous pressureon students, parents, and teachers. Any attempts to reform the system must address the curriculum,examination, and financing issues simultaneously.
'The Education Policy Paper proposes reform of the examination system by having a 2-part National Certificate ofSecondary Education (NCSE). Part I will cover junior secondary education, and Part 11, senior secondary education. Thereis also a proposal to develop a Post-Secondary Caribbean Education Certificate Examination (PSCEC) to target a widerrange than the traditional "A" Level groups, including those in the technical and vocational streams.
2
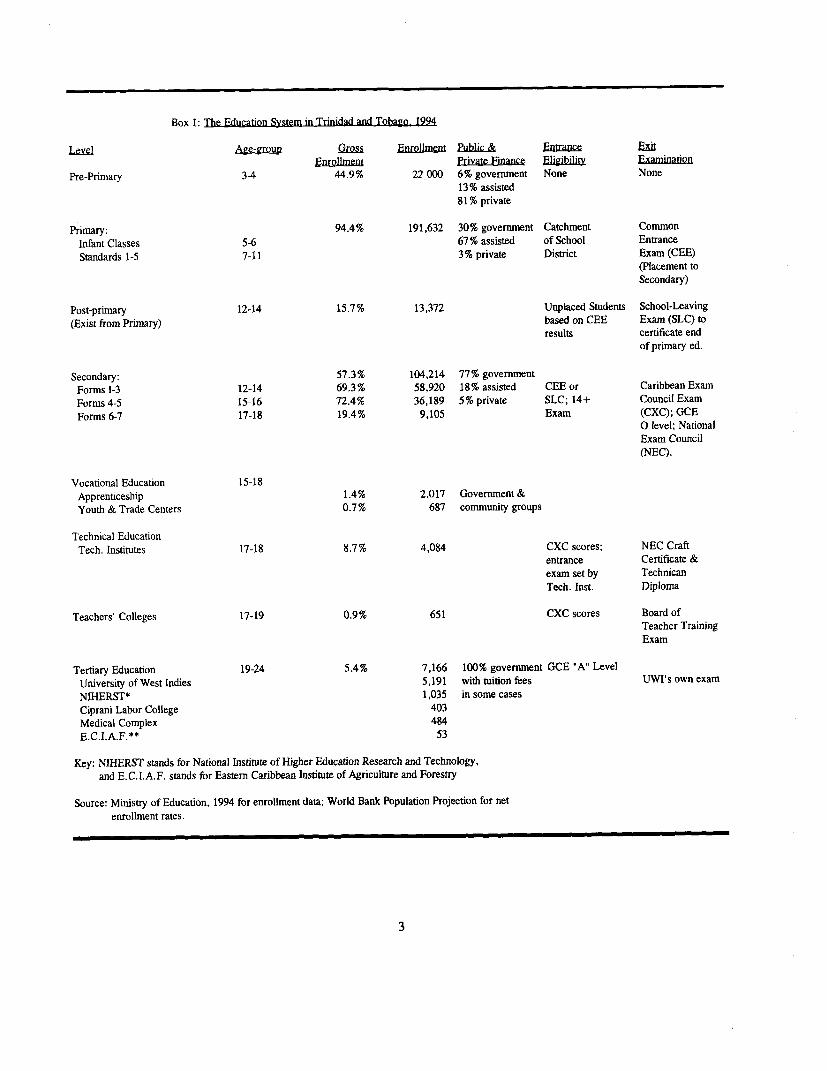
Box I: The Education System in Trinidad and Tobago, 1994
Level1 Age-group Grss Enrlmmn Public & Entrance EsiEnrllmen Private Financ Eligibilit,y Eaminafio
Pre-Primary 3-4 44.9% 22 000 6% government None None13% assisted81% private
Primary: 94.4% 191,632 30% government Catchment CommonInfant Classes 5-6 67% assisted of School EntranceStandards 1-5 7-11 3% private District Exam (CEE)
(Placement toSecondary)
Post-primary 12-14 15.7% 13,372 Unplaced Students School-Leaving(Exist from Primary) based on CEE Exam (SLC) to
results certificate endof primary ed.
Secondary: 57.3% 104,214 77% governmentForms 1-3 12-14 69.3% 58,920 18% assisted CEE or Caribbean ExamForms 4-5 15-16 72.4% 36,189 5% private SLC; 14+ Council ExamForms 6-7 17-18 19.4% 9,105 Exam (CXC); GCE
O level; NationalExam Council(NEC).
Vocational Education 15-18Apprenticeship 1.4% 2,017 Government &Youth & Trade Centers 0.7% 687 community groups
Technical EducationTech. Institutes 17-18 8.7% 4,084 CXC scores; NEC Craft
entrance Certificate &exam set by TechnicanTech. Inst. Diploma
Teachers' Colleges 17-19 0.9% 651 CXC scores Board ofTeacher TrainingExam
Tertiary Education 19-24 5.4% 7,166 100% government GCE "A" LevelUniversity of West Indies 5,191 with tuition fees UWI's own examNIHERST* 1,035 in some casesCiprani Labor College 403Medical Complex 484E.C.I.A.F."* 53
Key: NIHERST stands for National Institute of Higher Education Research and Technology,and E.C.I.A.F. stands for Eastern Caribbean Institute of Agriculture and Forestry
Source: Ministry of Education, 1994 for enrollment data; World Bank Population Projection for netenrollment rates.
3
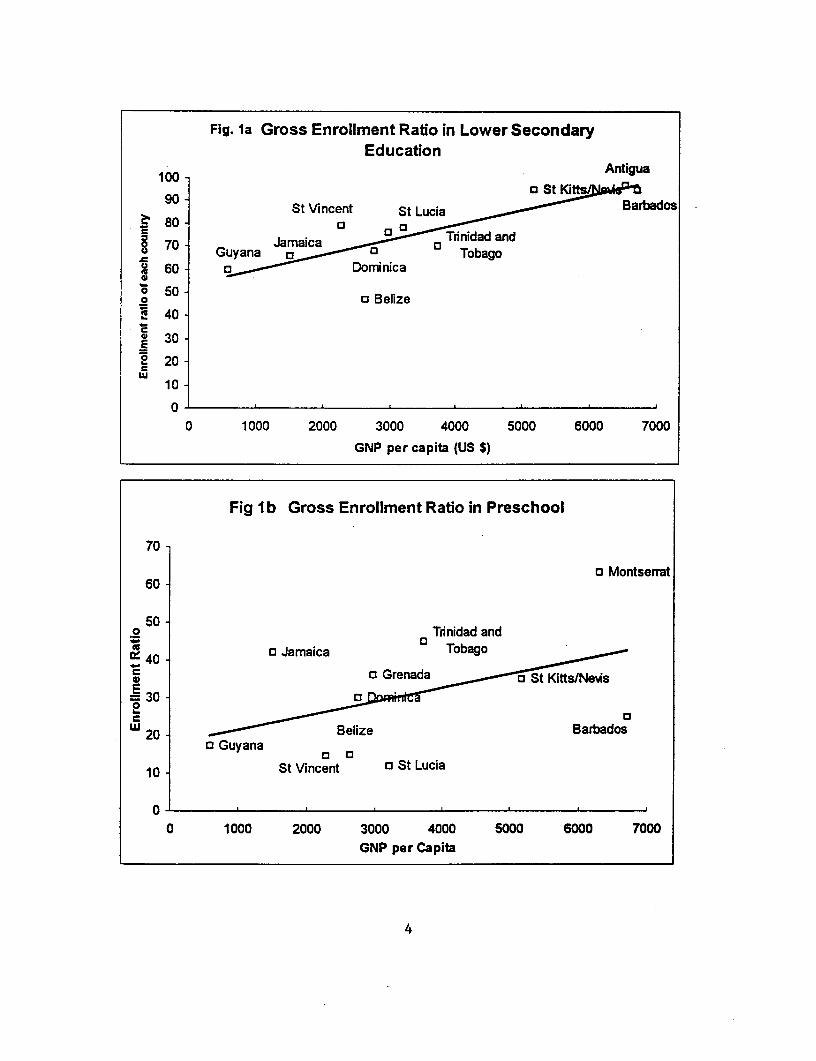
Fig. la Gross Enrollment Ratio in Lower SecondaryEducation
100 Antiguao St Kittsl
90 St Vincent St Lucia Barbados~80-
o 70 Jamaica aQ ~~Guyana a°Tobago60 o Dominica
*0 50 o o Belizea 40
30
2 20
100
0 1000 2000 3000 4000 5000 6000 7000
GNP per capita (US $)
Fig I b Gross Enrollment Ratio in Preschool
70
o Montserrat60 -
50 Tnnidad and
= 40 - c JamaicaX o~~~~~~~ ~ ~ Grenada aKitts/NeVsi
=30 -
20 - Belize Barbados0 Guyana 0 O
10 - St Vincent 0 St Lucia
0O-a 1000 2000 3000 4000 5000 6000 7000
GNP per Capita
4
C. Quality
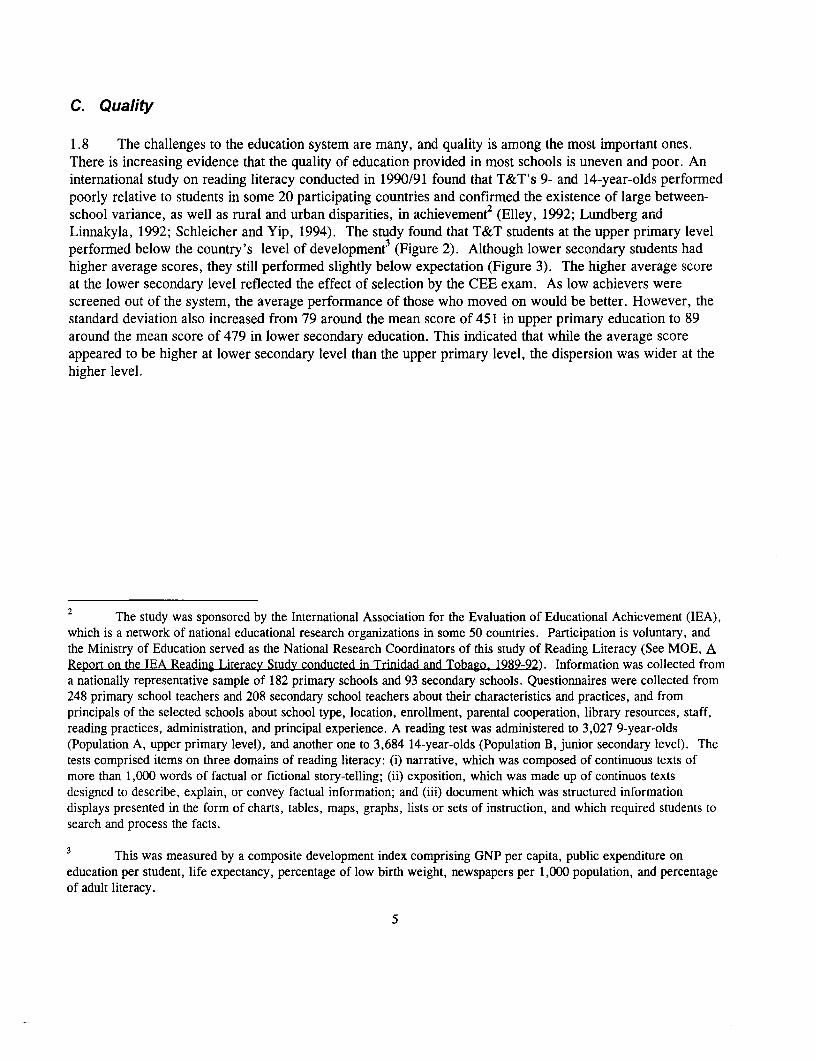
1.8 The challenges to the education system are many, and quality is among the most important ones.There is increasing evidence that the quality of education provided in most schools is uneven and poor. Aninternational study on reading literacy conducted in 1990/91 found that T&T's 9- and 14-year-olds performedpoorly relative to students in some 20 participating countries and confirmed the existence of large between-school variance, as well as rural and urban disparities, in achievement (Elley, 1992; Lundberg andLinnakyla, 1992; Schleicher and Yip, 1994). The study found that T&T students at the upper primary levelperformed below the country's level of development3 (Figure 2). Although lower secondary students hadhigher average scores, they still performed slightly below expectation (Figure 3). The higher average scoreat the lower secondary level reflected the effect of selection by the CEE exam. As low achievers werescreened out of the system, the average performance of those who moved on would be better. However, thestandard deviation also increased from 79 around the mean score of 451 in upper primary education to 89around the mean score of 479 in lower secondary education. This indicated that while the average scoreappeared to be higher at lower secondary level than the upper primary level, the dispersion was wider at thehigher level.
2 The study was sponsored by the International Association for the Evaluation of Educational Achievement (IEA),which is a network of national educational research organizations in some 50 countries. Participation is voluntary, andthe Ministry of Education served as the National Research Coordinators of this study of Reading Literacy (See MOE, AReport on the IEA Reading Literacy Study conducted in Trinidad and Tobago. 1989-92). Information was collected froma nationally representative sample of 182 primary schools and 93 secondary schools. Questionnaires were collected from248 primary school teachers and 208 secondary school teachers about their characteristics and practices, and fromprincipals of the selected schools about school type, location, enrollment, parental cooperation, library resources, staff,reading practices, administration, and principal experience. A reading test was administered to 3,027 9-year-olds(Population A, upper primary level), and another one to 3,684 14-year-olds (Population B, junior secondary level). Thetests comprised items on three domains of reading literacy: (i) narrative, which was composed of continuous texts ofmore than 1,000 words of factual or fictional story-telling; (ii) exposition, which was made up of continuos textsdesigned to describe, explain, or convey factual information; and (iii) document which was structured informationdisplays presented in the form of charts, tables, maps, graphs, lists or sets of instruction, and which required students tosearch and process the facts.
3 This was measured by a composite development index comprising GNP per capita, public expenditure oneducation per student, life expectancy, percentage of low birth weight, newspapers per 1,000 population, and percentageof adult literacy.
5
Fig.2: Population A: Mean Test Scores in IEA Reading Literacy Study600 -
o a F&0, 400 - o In o
= o°.S 300-CL
'0 200-
100
0 I , , _ , . .
0 0.5 1 1.5 2 2.5 3 3.5 4 4.5Composite Development Index
Fig3: Population B: Mean Test Scores in IEA Reading Literacy Study600 -
o~~~~~~~~~~~~~~~~~~~~ aFB
0~~~~~~~~~~~~~~~1
2 3500 -7.
020-
c 100-
0 0.5 1 1.5 2 2.5 3 3.5 4 4.5
Composite Development Index
6
1.9 This alarming trend is confirmed by the increase in the variance in test scores between schools from25 percent at the upper primary level to 58 percent at the lower secondary level. Correspondingly, the portionof the achievement variance accounted for by the differences between students (within school) was reducedfrom 75 percent at the upper primary level to 42 percent at the lower secondary level (Wu and Hua, 1996).The growing between-school variance at the higher levels of the education pyramid indicated that thevariability in learning outcomes was increasingly less attributable to the differences between students (such asparental education and income, home resources, student age and gender), but more to the differences betweenschools (for example, in terms of library resources, availability of instructional materials and facilities,teachers' education and experience, principals'experience, percentage of student absenteeism, instructionaltime, curriculum coverage, and parental cooperation). In other words, where the between-school variance inachievement is large, there is much room for policy interventions.
1.10 Indicators of quality in senior secondary education can be found in the regional CXC examinationwhich was taken by students in other Caribbean countries. The results provide more evidence of progressiveimprovement of average performance at an even higher level of the school system. In comparison withstudents from other Caribbean countries, T&T students' performance in Biology and Physics was well abovethe prediction based on the country's Gross National Product (GNP) per capita (Figures 4 & 8, andAppendix 22). This was largely attributable to screening throughout the education system and the relativelylow participation rates in taking examination in these subjects. For example, only 14 percent of the totalcandidates took the Biology test, and 8 percent the Physics test. In English A,6 which had a participation rateas high as 58 percent, T&T students performed below the predicted level (Figure 6a). In Mathematics, whichhad a participation rate of 52 percent, T&T students performed at the predicted level (Figure 7). Theseresults have two implications. First, T&T is sucessful in educating a small number of elite students who aresecond to none; however, it is less successful in bringing the masses to a level of high performance. Second,the low rates of student participation in the study of science indicated a relatively low stock of future scientistsand engineers. All of these indicators boded poorly for the country's new economic development strategy ofreducing its reliance on petroleum exports by encouraging foreign investment and developing labor intensiveindustries; a low skilled but relatively high cost labor force is not competitive on the international market. Thefollowing section examines the issues of governance and finance in order to better understand the roots ofdisparity in quality.
4 The average proportion of between-school variance in achievement in industrialized countries was 12 percent. Indeveloping countries, this ranged from 18 percent in Colombia to 33 percent in Jamaica and 60 percent in Egypt at theprimary level, and from 12 percentage in Botswana to 62 percent in Brazil at the secondary level (Riddell, 1993). Thus,the between-school variance at the lower secondary level in T&T put it in the category of high variance countries.
5 Students attaining Grades l and 2 in the CXC exams are considered having passed the examination by employersand schools for further studies.
6 English A is the required for matriculation. It is more demanding than English B.7
Fig4 % of Candidates Passing Biology in CXC Exam
50.0- ° Bominica Montserrat> 45.0 - St Vincent Trinidad and °
ua 40.0 - St Lucia Tobago St Kitts/Nevis
w 35.0 - Grenada Antigua
.E 30.0 -0: Jamaica 0 0= 30.0 - O~~~~~~~1 Belize
t!" 25.0 - BelzeTurks & Caicos
." 20.0 - o Guyana
v~ 15.0-
10.0-0S 5.0-
0.0 0 1000 2000 3000 4000 5000 6000 7000
GNP per capita (US S)
Fig 5 % of Candidates Passing Chemistry in CXC Exam
90.0 -
, 80.0- Montserrat
, 70.0 - St Vincent
,,c 60.0 -0° o St Lucia Antigua60.0 QU 5000- DominicaO St Kitts/Nevis 0
a50 .0 -oinca Trinidad and3 40 0 - a Jamaica 13 1 Grenadra Tobago
40.0 -~~~~~40.0 ~~~~~~~Belize
30.0 - 13 Guyanaa 30.0 0 Guyan- Turks & Caicos
20.0 Anguilla a10.0 -
0.00 1000 2000 3000 4000 5000 6000 7000
GNP per cpita (US S)
8
Fig. 6a % of Candidates Passing English A in CXC Exam
70.0Montserrat
60.0-
7 50.0 -EL ~~~~~~St Vincent Brao
U 40.0 - 03 Dominica40. -o Belinia and o3
.c :rCucia Tobago Turks & Caicos$ 30.0 -aica o Grenada
j, 20.0-
10.0 - o Guyana0
0.00 1000 2000 3000 4000 5000 6000 7000
GNP per Capita (US $)
Fig 6b % of Candidates Passing the English B CXC Exam
80.0 oAnguilla
70.0 o St Vincent Trinidad and
Dominica 0 Tobago Barbados360.0 St Lucia o °3
l a 13St Kitts/Nevis
! 50.0 -Jamaica 0 Grenada ° °Turks & Caicos Antigua
c 40.0 -
ae
20.0
10.0
0.0 -0 1000 2000 3000 4000 5000 6000 7000
GNP per capita (US $)
9
Fig. 7 % of Candidates Passing Math in CXC Exam
@ 50.0 - Barbados
Y 45.0-
40.0 - St Vincen LucO o ~~~~~~~~~~~Trinidad and03 St Kifts/Nevis035.0 - 3Beliz-e gua
ffi 30.0 - ° o Montserrat03 Jamaica
c 25.0 - Turks & Caicos a
= 20.0 - O Guyana Anguilla
c15.0 -
10.0 -
,u 5.0 -0
10.0
0 1000 2000 3000 4000 5000 6000 7000
GNP per capita
Fig 8 % of Canditates passing the Physics CXC Exam
60.0
o0 St Vincent 0U 50.0 - St LouDcjfaWinicao Trinidad and Barbados
w OGrenada Tobago
Ew 0 -elze- Antiaua
40.0 0
03 Jamaica O St Kitts/Nevis03 Guyana
c 30.0-
20.0-
10.0 - Turks & Caicos
0.00 1000 2000 3000 4000 5000 6000 7000
GNP per capita (US S)
10
D. Governance and Finance
1.11 Governance of education is public, religious, and private; however, public finance extends, to a largeextent, to non-government schools. This pattern of financing is rooted in the history of educationaldevelopment in the country. Before Independence in 1962, religious groups (the Roman Catholics,Anglicans, Baptists, Presbyterians, Hindus and Muslims) were active providers of primary and secondaryeducation. They operated schools through their respective denominational boards and charged tuition fees atsecondary level, except to students on government scholarship. These schools received government grantsfor recurrent cost that covered more than 90 percent of their actual cost and, when the government sodecided, a share of capital costs. A pre-Independence agreement between the government and thesedenominational boards in 1961, known as the Concordat, assured the latter their ownership and right of directcontrol and management of all denominational primary and secondary schools. The government undertook topay teachers' salaries, other recurrent cost, 75 percent of capital cost of denominated primary schools, and66.6 percent of capital cost of denominational secondary schools (Jules, 1994).
1.12 There exist three types of schools -- government, government-assisted (denominational), and privateschools. Private schools are run by private bodies, generally for profit, and receive no government subsidies.In 1993, these three types of schools enrolled 30, 67, and 3 percent of primary school students, respectively,and 77, 18, and 5 percent of secondary school students, respectively (Box 1). Both government and assistedschools provide free tuition. Private schools are fee-charging. In 1991, private primary schools charged, onaverage, a monthly fee of TT$123, and secondary schools, TT$85 (Private School Survey, 1991; seeAppendix 11).
1.13 Some private primary schools cater for children of the extremely well-off. However, at thesecondary level, the best schools are assisted and government schools due to the screening process by theCEE examination. Private secondary schools often cater for the children whose scores in the CEE are toolow to secure them a place in government or assisted schools, but whose families can afford to pay for theireducation and absorb the foregone earnings.
1.14 Secondary schools are diverse in types and curricula, but are generally divided into academic andvocational/technical streams; the many types of examination at the secondary level reflect this diversity.Academic courses are offered in traditional 7-year and 5-year schools, run by government or religious bodies.They enrolled 30 percent of secondary school students in 1994. Other types are known as New SectorSchools, built after Independence with the aim of providing mass secondary schooling for a diversepopulation. These include 3-year junior secondary schools, 2-year senior comprehensive schools, 5-yearsenior secondary schools, and 5-year composite schools. Junior secondary schools, which enroll 36 percentof secondary students, provide general education with a mixture of craft courses. Twenty out of 24 of themoperate on double shifts. Nearly half of their graduates proceed to Forms 4-5 in two-year seniorcomprehensive schools. These senior comprehensive, senior secondary, and composite schools offer acombination of general, specialized craft, and pre-technician courses. They provide full-day instruction.(Table 1).
11
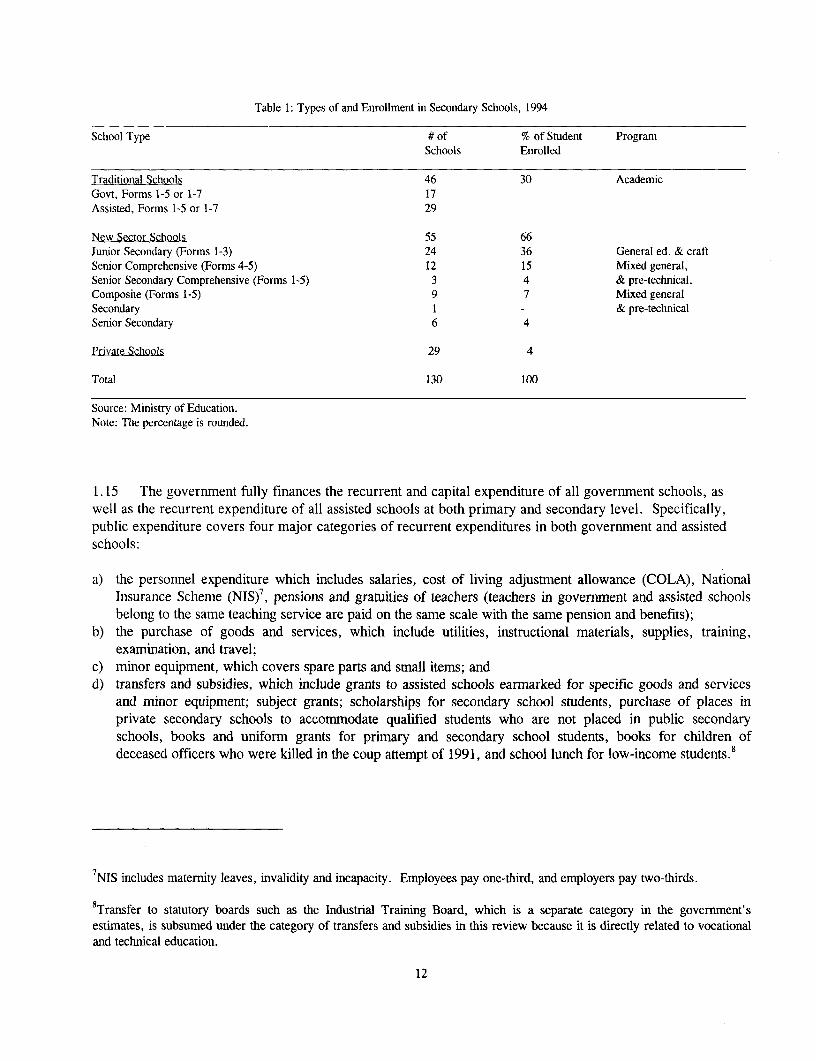
Table 1: Types of and Enrollment in Secondary Schools, 1994
School Type # of % of Student ProgramSchools Enrolled
Traditional Schools 46 30 AcademicGovt, Forms 1-5 or 1-7 17Assisted, Forms 1-5 or 1-7 29
New Sector Schools 55 66Junior Secondary (Forms 1-3) 24 36 General ed. & craftSenior Comprehensive (Forms 4-5) 12 15 Mixed general,Senior Secondary Comprehensive (Forms 1-5) 3 4 & pre-technical.Composite (Forms 1-5) 9 7 Mixed generalSecondary I - & pre-technicalSenior Secondary 6 4
Private Sclhools 29 4
Total 130 100
Source: Ministry of Education.Note: The percentage is rounded.
1.15 The government fully finances the recurrent and capital expenditure of all government schools, aswell as the recurrent expenditure of all assisted schools at both primary and secondary level. Specifically,public expenditure covers four major categories of recurrent expenditures in both government and assistedschools:
a) the personnel expenditure which includes salaries, cost of living adjustment allowance (COLA), NationalInsurance Scheme (NIS)7, pensions and gratuities of teachers (teachers in government and assisted schoolsbelong to the same teaching service are paid on the same scale with the same pension and benefits);
b) the purchase of goods and services, which include utilities, instructional materials, supplies, training,examination, and travel;
c) minor equipment, which covers spare parts and small items; andd) transfers and subsidies, which include grants to assisted schools earmarked for specific goods and services
and minor equipment; subject grants; scholarships for secondary school students, purchase of places inprivate secondary schools to accommodate qualified students who are not placed in public secondaryschools, books and uniform grants for primary and secondary school students, books for children ofdeceased officers who were killed in the coup attempt of 1991, and school lunch for low-income students.8
7NIS includes maternity leaves, invalidity and incapacity. Employees pay one-third, and employers pay two-thirds.
8Transfer to statutory boards such as the Industrial Training Board, which is a separate category in the government'sestimates, is subsumed under the category of transfers and subsidies in this review because it is directly related to vocationaland technical education.
12
1.16 Funding to assisted schools are negotiated once every three to five years. Once an agreement isreached, the government has to honor its commitment even in times of a budget crunch. Expenditure on utilitiesand subject grants to assisted schools are not subject to cut. However, in government schools, there are nosubject grants, and expenditure are not protected from reduction. This puts government schools at adisadvantage. The government pays 100 percent of the capital expenditure in government schools, and 75percent of the capital expenditure in assisted primary schools, and 66.6 percent of the capital expenditure inassisted secondary schools. Capital expenditure is used to finance school construction, refurbishment, andmajor repair. The denominational boards make up the difference in capital expenditure.
1.17 In early childhood education, neither the government nor the religious groups are as active as theyhave been in primary and secondary education. Of the some 22,000 pre-schoolers, 81 percent attend privatepre-schools, which charge an average tuition fees of TT$51 per month. Only 6 percent enroll in publicly-funded, community-run pre-schools, and 13 percent in Servol9-run centers, which receive governmentsubvention. These publicly subsidized pre-schools charged about TT$20-30 per month.
1.18 At the tertiary level, UWI is an autonomous public institution which receives about 85 percent of itsrecurrent expenditure from government transfers and subsidies. Tuition fees make up the remaining 15percent. Tuition fees vary by academic disciplines, ranging from TT$4,340 per year for full-time study inArts and Humanities, TT$3,740 in Social Sciences, and TT$6,340 in Natural Sciences to TT$5,340 in Law,TT$7,780 in Engineering, and TT$8,130 in Agriculture in 1993 (Appendix 9). UWI's own generated incomefrom research and consultancy is negligible.
1.19 The post-secondary Technical Institutes are government-run and financed. The government alsosubsidizes a variety of post-primary vocational programs, including youth camps, youth centers, andapprenticeships. Other post-secondary education institutions that receive government subsidies are theTeachers' Colleges, which train primary and junior secondary school teachers, Eastern Caribbean Institute ofAgriculture and Forestry (ECIAF), the new National Institute for Higher Education, and School ofContinuing Studies at UWI.
E. Differences in Resource Endowment Among Different Types of Schools
1.20 The structure of governance and financing in T&T raises the question of how the differences inresource endowment among government, assisted, and private were translated into differences in indicators ofschool quality. An examination of two widely used indicators--pupil-to-teacher ratios and teacherqualification--suggests that the differences are substantial. The average pupil-to-teacher ratio in governmentand assisted primary schools ranges from 26:1 to 28: 1, with rare extremes of 20:1 and 38:1 By contrast, theratio in private primary schools was 18:1 (T&T government's private school survey, 1991). The pupil-to-teacher ratios for public secondary schools vary systematically. They are 28:1 for junior secondary, 15:1 forsenior comprehensive, 20:1 for composite, 17:1 for traditional government, and 20:1 for assisted secondaryschools. The ratio for private secondary schools was 19:1 (Report on Education Statistics, 1990-91, p. 14-15). These ratios appear to correlate with achievement results among these schools, which will be discussed ingreater details in Chapter 3.
9Servol is a non-profit, Catholic organization that provides a variety of social services to the poor.
13
1.21 The qualifications of primary school teachers do not seem to vary much between assisted andgovernment schools. In T&T, primary school teachers are senior secondary school graduates. About 77percent of primary school teachers in both government and assisted schools have been trained in theTeachers' College, with emphasis on pedagogy. There is little difference in the distribution of trainedprimary school teachers between government and assisted schools. Information on teacher qualification inprivate schools is not available. However, Chapter 3 will present evidence to show enormous variability inlearning outcomes among students from different types of primary schools (Table 17). It is difficult toascertain the cause, which could be a mix of factors due to tracking of students from different backgroundsinto different types of schools, recruitment of different types of teachers into different school types, andadditional inputs in assisted and private primary schools. Further study is required to identify the reasons.
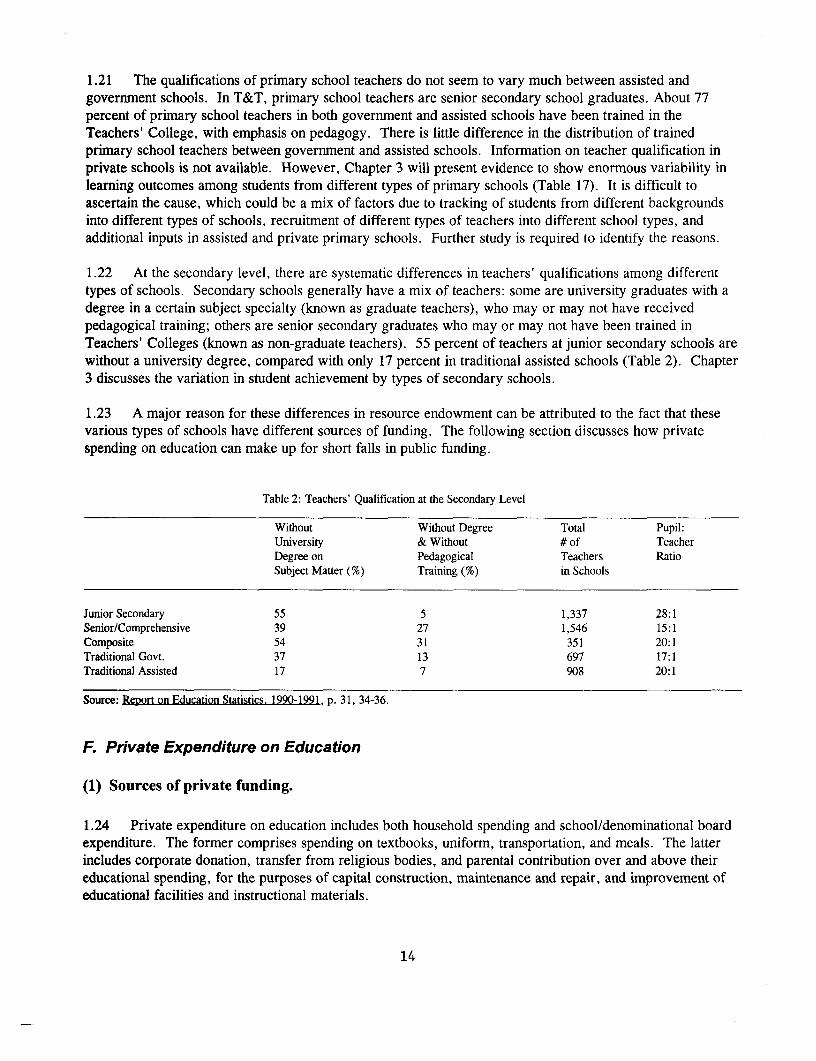
1.22 At the secondary level, there are systematic differences in teachers' qualifications among differenttypes of schools. Secondary schools generally have a mix of teachers: some are university graduates with adegree in a certain subject specialty (known as graduate teachers), who may or may not have receivedpedagogical training; others are senior secondary graduates who may or may not have been trained inTeachers' Colleges (known as non-graduate teachers). 55 percent of teachers at junior secondary schools arewithout a university degree, compared with only 17 percent in traditional assisted schools (Table 2). Chapter3 discusses the variation in student achievement by types of secondary schools.
1.23 A major reason for these differences in resource endowment can be attributed to the fact that thesevarious types of schools have different sources of funding. The following section discusses how privatespending on education can make up for short falls in public funding.
Table 2: Teachers' Qualification at the Secondary Level
Without Without Degree Total Pupil:University & Without # of TeacherDegree on Pedagogical Teachers RatioSubject Matter (%) Training (%) in Schools
Junior Secondary 55 5 1,337 28:1Senior/Comprehensive 39 27 1,546 15:1Composite 54 31 351 20:1Traditional Govt. 37 13 697 17:1Traditional Assisted 17 7 908 20:1
Source: Report on Education Statistics, 1990-1991, p. 31, 34-36.
F. Private Expenditure on Education
(1) Sources of private funding.
1.24 Private expenditure on education includes both household spending and school/denominational boardexpenditure. The former comprises spending on textbooks, uniform, transportation, and meals. The latterincludes corporate donation, transfer from religious bodies, and parental contribution over and above theireducational spending, for the purposes of capital construction, maintenance and repair, and improvement ofeducational facilities and instructional materials.
14
1.25 While the formula for funding of recurrent expenditure does not appear to distinguish betweengovernment and assisted schools, assisted schools can tap into more diverse resources, including religioussources. Assisted schools that have a good reputation and connection with the business and professionalcommunities can raise substantial funds to supplement their recurrent and capital spending. Box 2 providesan example of an extremely successful school which is able to raise funds, in a year, 135 times more than thegovernment subvention. Therefore, the resource endowment differs enormously from school to school. Theunaccounted for differential in inputs is a likely reason behind the large variability in learning outcomes. Inthe absence of a survey on nongovernmental sources of funding for schools, it is difficult to estimate the totalamount of contribution from companies, religious bodies, and communities because of the enormousvariability from school to school and from year to year.
Box 2: The Total Sources of Public and Private Funding in An Extremely Successful Assisted School
The ability of schools to generate their own income varies tremendously from school to school and fromyear to year. Often, the location of the school, the business, religious, and community network the school has, andthe leadership of school management matter in the ability of the school to generate own income. The following caseis an unusually successful Roman Catholic pritmary school in the business district of Port-of-Spain which raised closeto a half a million TT dollars in 1994. It should be noted that the government subvention to assisted schools is overand above teachers' salaries. The additional funds were used by the said school to build up the school library, musicrooms, science and computer laboratories. By contrast, government schools, particularly those in rural areas, are notfitted with libraries, let alone laboratories and other activity rooms. This case illustrates just how substantial thevariation is in the unaccounted for input from school to schools.
Total sources of public & pnvate funding TT$ % of TotalGovernment subvention 3,600 0.7
Corporate Grants 3,250 0.7Prize Money 4,350 0.9Raffle 57,977 11.9Cinema Show 4,536 0.9Carnival Jam 1,125 0.2Walksthon-Family day 39,030 8.0Security Fund 108,000 22.2Cafeteria 200,006 41.2Carnival Band 2,870 0.6Barbecue and Band Launching 59,920 12.3Miscellaneous 874 0.2
Total Income 485,538 100.0
(2) Estimates of Total Household Spending on Education
1.26 Estimates of total household spending on education can be made on the basis of (i) a comprehensivePrivate School Survey (PSS) conducted jointly by MOE and the Central Statistical Office (CSO) in June,
15
1991; (ii) Survey of Living Conditions (SLC) conducted by the MOPD in June, 1992; and (iii) informationgathered during the mission.
1.27 The PSS provides information about the average tuition fee in private schools at each level ofeducation (Appendices 10 and 11). The total private spending on school tuition can be estimated bymultiplying the fees per student by the total enrollment at each level. The SLC provides information aboutthe cost of lunch and travel by education level and by per capita expenditure quintile. However, as thisconstitutes a relatively small share of the total private cost of education, an average of lunch and travel costwas used to multiply the enrollment at each level to arrive at a total figure. The aggregated householdexpenditure on books and uniform in the SLC yields no information on the individual and by education level.So the cost of books and uniform is roughly estimated on the basis of inquiry during mission. The estimatesof private spending on education are presented in Appendix 11. Table 3 summarizes the estimates of privatespending on education as a percentage of GDP.
1.28 An important part of private spending which could not be estimated is that on private tutoring afterschool, which is common among middle and upper income families, given the enormous examinationpressure. This is another unaccounted for source that affects learning outcomes.
Table 3: Estimates of Private Spending on Education, 1991
In Million 1991 TT$ As % of GDP
Tuition fees in private schools 35.2 0.16UWI student tuition fees 17.6 0.08Total travel and lunch expense of private school students 32.3 0.14Total book expense of private school students 6.5 0.03Total uniform expenses of private school students 6.5 0.03Total travel and lunch of public school students 262.0 1.16Total book expenses of public school students 46.4 0.21Total uniform expense of public school students 46.4 0.21
Total household spending on education 453.0 2.01
1.29 In conclusion, private spending on education has been quite substantial in T&T. In addition to theestimated household spending which is equivalent to 2 percent of GDP or half of the public expenditure oneducation, other sources such as corporate and religious body donation and private tutoring would raise thetotal private sector spending on education above the 2 percent level. The level of private funding, just likepublic expenditure, is affected by the economic conditions of the country. Just as household disposableincome and ability to invest in education are affected by economically active members' employment statusand earnings, so are corporate donations influenced by corporate profits and losses. In times of recession,private spending can also be expected to be constrained. However, the ability and willingness to invest ineducation do vary by household income levels. The policy question is at what level of education and withwhich income group should the government share cost to ensure equal access to quality education for all.This question will be addressed in Chapter 4 after discussing public expenditure on education and evaluatingperformance of the system.
16
2. Public Expenditure on Education
2.1 Public expenditure on education accounted for about two-thirds of total education spending inTrinidad and Tobago. The budget on education and training, however, is dispersed among various ministries,although the Ministry of Education (MOE) has the largest share. This does not make it easy for policymakersto develop a comprehensive view of public allocation to education. Any efforts to rationalize the use ofscarce resources must begin by identifying allocations to education and training in various ministries in orderto establish the magnitude of spending and to identify trends over time. Section 2.1 provides relevantestimates.
A. Distribution of Education Expenditure by Ministry
2.2 Before 1991, the MOE was responsible for primary, secondary, vocational and technical education,teacher training, tertiary education, public libraries, national archives, and contribution to internationaleducational and cultural agencies. The Ministry of Finance's (MOF) budget paid for pensions and gratuitiesof teachers, administrative, and support staff in the education sectors. The Ministry of Energy and Labor(MOEL), Ministry of Planning and Mobilization (MOPM), Ministry of External Affairs (MOEA), Ministry ofHealth (MOH), and Ministry of Industry, Enterprise, and Consumer Affairs (MIECA) also had smallbudgetary allocations for vocational and technical education and training, medical education, and pre-schools(see Boxes 3 & 4).
2.3 MOE has the authority to transfer funds within subcategories, such as using the telephone budget topay the electricity bill. But transferring funds from one major category to another, such as from purchase ofgoods and services to minor equipment requires the approval of MOF. The budget is so tight that MOE oftenhas to suppress spending in one area in order to release funds on another. Unexpected holidays result insavings from school meals.
2.4 The priorities of MOF are in the following order: service debt, pay salaries, and provide currenttransfers and subsidies. Within goods and services, the priority is to pay items that have a salary component,then traveling, and electricity. Training and repair and maintenance are not on the priority list.Supplementary funding is outside the budget originally agreed with Parliament. If funds are not forthcoming, training and utilities will be cut to transfer funds to priority areas. The Director of Finance in MOEmakes recommendations about what categories of funds to transfer from and the Permanent Secretaryapproves it. MOF adopts line item funding rather than block release in order to ensure that salaries are paid.
2.5 After 1991, the jurisdiction and budget over higher education, national libraries, and archives weretransferred out of MOE to the Office of the Prime Minister. Because of this transfer, a reduction in MOEbudget per se after 1991 should n=t be taken as a reduction in public spending on education as a whole.MOE's budget now covers pre-school, primary, secondary, vocational and technical education, teachertraining, special education, adult education, and contribution to international educational and cultural bodies(Box 3).
17
2.6 MOF's budget continues to pay pension and gratuities to retired education staff. MOF also guaranteesloans to UWI students, totaling TT$5.8 million in 1994, although commercial banks handle the lending.MOH supports part of medical and nurses' education. Ministry of Consumer Affairs and Social Services(MOCASS) provides some funding for pre-primary education. Budgetary support for vocational and technicaleducation and training is provided by Ministry of Labor and Cooperatives (MLC), which supports the LaborCollege; Ministry of Sports and Youth Affairs (MSYA), which pays for trade centers, youth camps, andyouth centers; and Ministry of Environment and National Services (MENS), which covers national servicesthat is vocational in nature. In 1993, the budget for the apprenticeship scheme was transferred to MOE.
2.7 This review excludes from education expenditure general contribution to international educational andcultural bodies, which should be classified under the budget of external affairs, but includes spending that hasa direct bearing on education, such as the purchase of services from the Caribbean Examination Council.Box 4 shows how the total public expenditure on education is reclassified and compiled in this review.
2.8 The fiscal year is the same as the calendar year. In June, MOF sends out a circular requesting eachMinistry to prepare estimates of expenditure for the following year. These estimates are to be submitted byJuly 31. MOF estimates the revenue and prepares the budget for presentation to the Parliament in the lastweek of November. Each ministry is allowed to spend one-twelfth of the estimates in the following January ifappropriation has not as yet been made by Parliament. In 1991-93, the appropriation was made in lateNovember. Funds were supposed to be disbursed on a quarterly basis. However, due to the fiscalconstraints, they were disbursed monthly, on the basis of the revenue received in the previous month. Mostministries were allocated 90 percent of their estimates.
2.9 MOF releases funds in the first week of the month. MOE makes application to the comptroller forcredit in order to issue cheques. Unspent funds in the MOE account are returned to MOF by the end of theyear. Salaries are paid directly from MOE to teachers, without going through the schools. Expenditure forgoods and services and minor equipment is paid directly by MOE to schools upon approval of request. In thecase of capital expenditure, often a substantial portion of the allocation under development program were notspent. In 1986, only 20 percent of the development allocation was spent, although actual spending increasedto 97 percent in 1994 (Appendix 20).
18
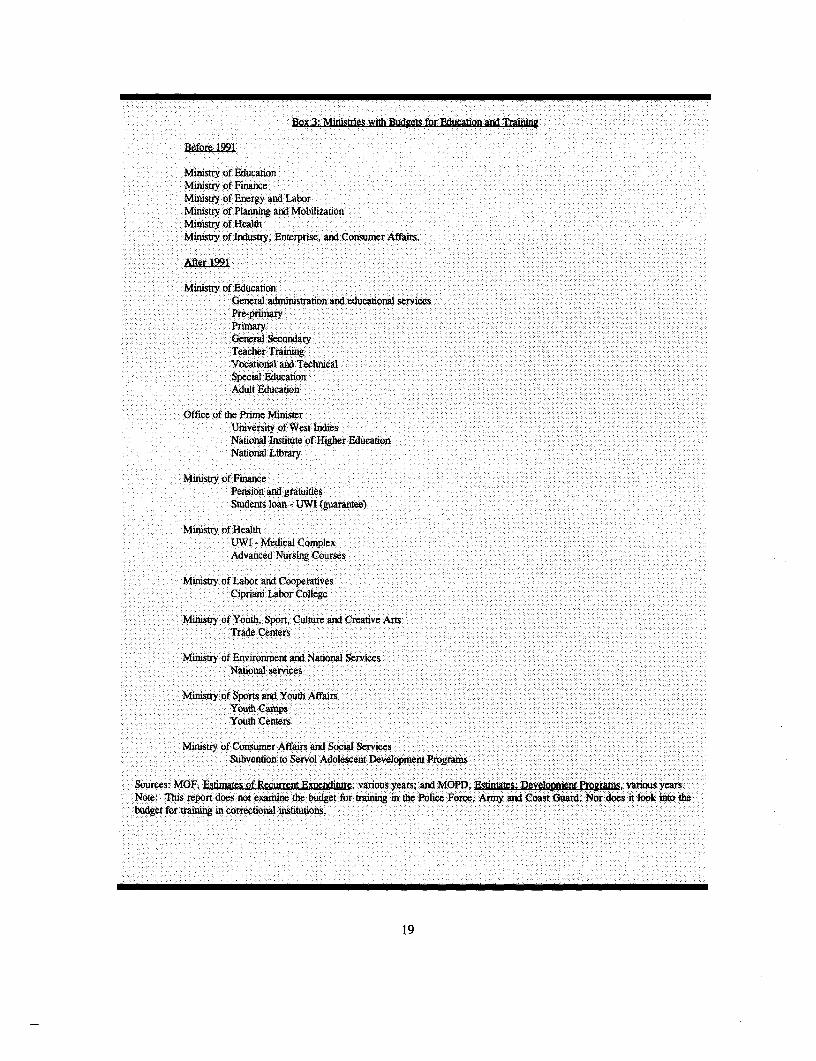
Box 3' Mlnstries with Bud1ets for Euaonand 1raining
Ministry of EducationMinistry of FinanceMiistry of Energy and LaborMuistry of Planling and MobilizationMmistry of HealthMinisty of Industuy, Enterprise, and Consumer Affairs.
AfLt 199
Ministry of EducationGeneral adinistration and educationl servicesPre-priaxyPrimaryGeneral SecondaryTeacher TrainingVocational and TechnicalSpecial EducationAdult Education
Office of te Prime MinisterUniversity of West IndiesNational nstitute of gher EducationNatiorn Library
Ministry of FinancePension and gratuidesStudents loan - UWI (garantee)
Ministry of HealthUWI - Medical ComplexAdvanced Nursing Courses
Ministry of Labor and CooperativesCiprtani Labor College
Ministry of Youth, Sport, Culture and Creative ArtsTrade Centers
Ministry of Environment and National ServicesNational services
Ministry of Sports and Youth AffairsYouth CampsYouth Centers
Ministry of Consumer Affairs and Social ServicesSubvention to Servol Adolescent Development Programs
Sources: MOF, , various years; and MOPD, EW=& Dmlkp= plgram, vanou yearsNote: This report does not examine the budget for training in the Police Force, Army and Coast Guard. Nor does it look into thebudget for training in correctional institutions.
19
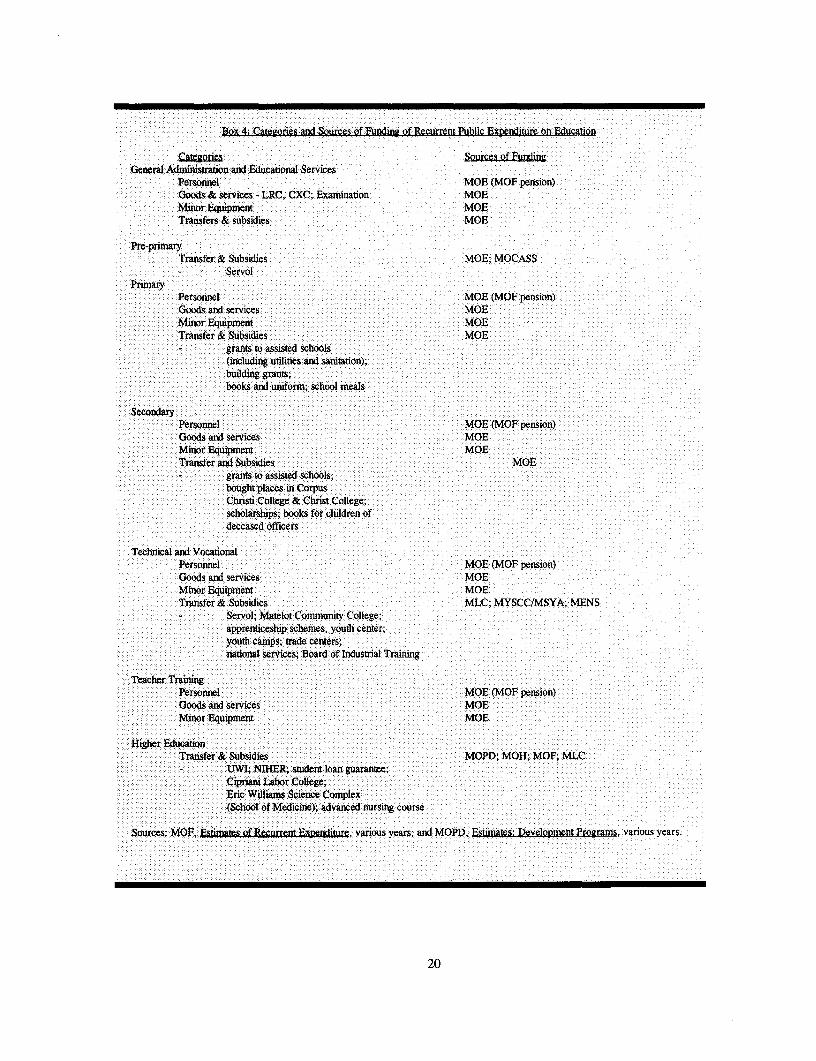
B3ox 4: Catgories :and SNources of eFui of Rurreant PblIi Expenditur otn Eduction
Sources of FurnKine0General Administration and Educational Services
Personnel : MOE (MOF pension)Goods& services - LRC, CXC; Examation MOEMinor Equipme MOE.TransferS & subsidies MOE
;Pre-prmaty00:t; i 0 t000 0 : : Transfer & Subsidies MOE; MOCASS::-: : i: ::iServol
Personnel MOE (MOF pension)
Goo dsand services MOE
77Transfer &Subsidies MOE- grantstoassisted schools
~books and uniform; schoo meals
Secndlar'yPersonnel MOE (MOF pension)Goods and seavices MOEMinor Equipment: : MOE
Transfer and SubsidiesMOE- grants to assisted schools;
bougbitplacesin corpusChristiCollege&ChristCollege;scholarships; books for children ofdeceased0officers
Technical and VocationalPersonnel MOE (MOE pension)
'Goods and.services MOEMinor Equipment . MOETransfer & Subsidies: MLC; MYSCC/MSYA; MENS
Servol Matelooot ty College.;:apprenticeship schemes, youth center;youth camns, trde centers;
national services; Board of lnustrial Traiunng
Personnel :MOE (MOF pension)Goods and services. MOE.Minor Equ0ipmenit .MOE
Transfe & Subsidies MOPD; MOH; MOF; MLC0t;T0;t-S 0; UW.L; NIHER; sdent loan guarantiee;
:000000000Cipian L!:XS1040t:t;t CT3abor College;; gf; ;yt 0j00tiy0 000 t00t;tk0 f 0fEric William Sciece Complex::(School o Medicine); advaned nursing course
Sources. MOF, E various years; and MOPD, Estimate Devejop=nt Programs, vaious years.
20
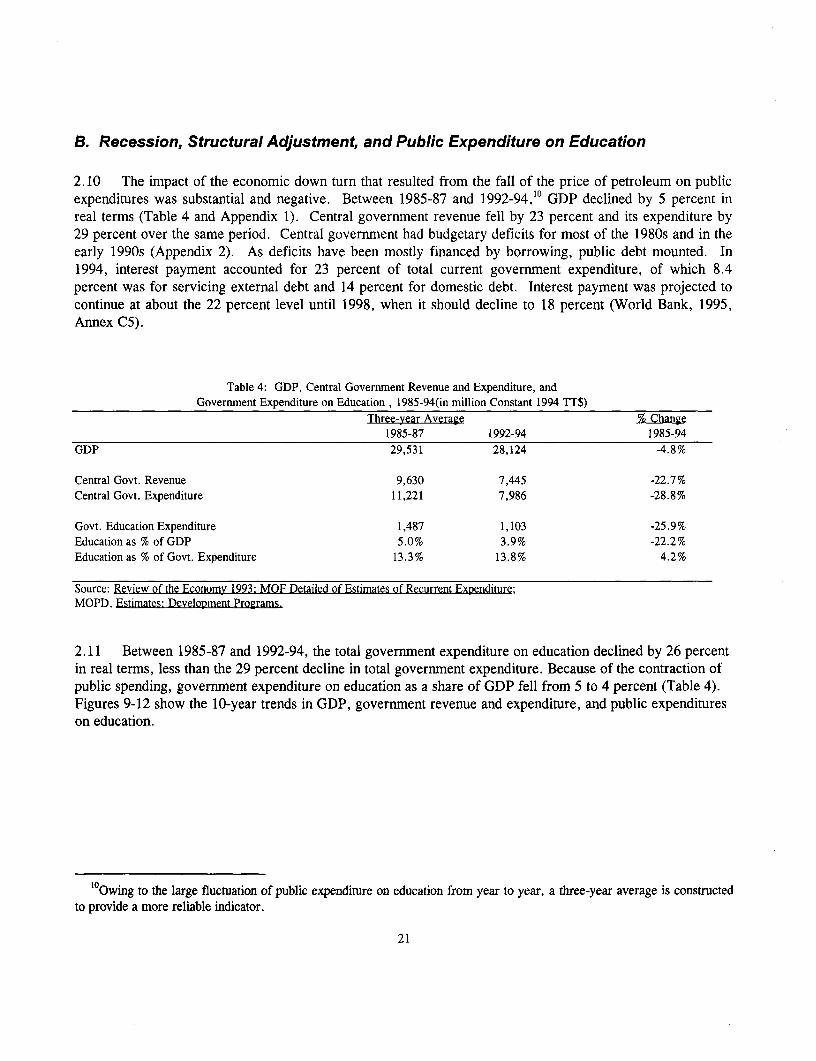
B. Recession, Structural Adjustment, and Public Expenditure on Education
2.10 The impact of the economic down turn that resulted from the fall of the price of petroleum on publicexpenditures was substantial and negative. Between 1985-87 and 1992-94,'° GDP declined by 5 percent inreal terms (Table 4 and Appendix 1). Central government revenue fell by 23 percent and its expenditure by29 percent over the same period. Central government had budgetary deficits for most of the 1980s and in theearly 1990s (Appendix 2). As deficits have been mostly financed by borrowing, public debt mounted. In1994, interest payment accounted for 23 percent of total current government expenditure, of which 8.4percent was for servicing external debt and 14 percent for domestic debt. Interest payment was projected tocontinue at about the 22 percent level until 1998, when it should decline to 18 percent (World Bank, 1995,Annex C5).
Table 4: GDP, Central Government Revenue and Expenditure, andGovernment Expenditure on Education, 1985-94(in million Constant 1994 TT$)
Three-year Average % Change1985-87 1992-94 1985-94
GDP 29,531 28,124 -4.8%
Central Govt. Revenue 9,630 7,445 -22.7%Central Govt. Expenditure 11,221 7,986 -28.8%
Govt. Education Expenditure 1,487 1,103 -25.9%Education as % of GDP 5.0% 3.9% -22.2%Education as % of Govt. Expenditure 13.3% 13.8% 4.2%
Source: Review of the Economy 1993: MOF Detailed of Estimates of Recurrent Expenditure;MOPD, Estimates: Development Programs.
2.11 Between 1985-87 and 1992-94, the total government expenditure on education declined by 26 percentin real terms, less than the 29 percent decline in total government expenditure. Because of the contraction ofpublic spending, government expenditure on education as a share of GDP fell from 5 to 4 percent (Table 4).Figures 9-12 show the 10-year trends in GDP, government revenue and expenditure, and public expenditureson education.
'Owing to the large fluctuation of public expenditure on education from year to year, a three-year average is constructedto provide a more reliable indicator.
21
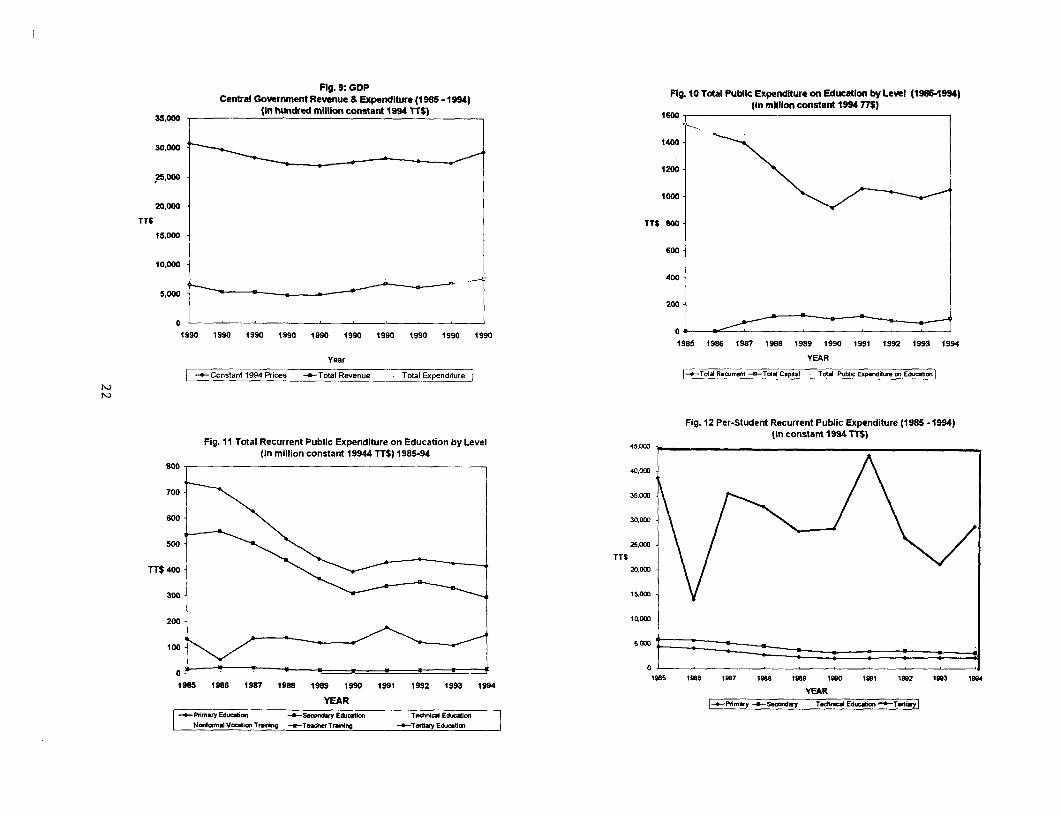
Fig. 9: GDP Fig. 10 Tatal Pubic Expenditure on Educatlon by Level (1988-19941Central Government Revenue & Expenditure (1985- 1994) (in million constant 1994 77$)
(In hundred million constant 1994 77$) 16001
30,000 1400
120025,000
100020,000
TT$ TTS 800-
II5,000
600
10,000 400
5,000200 -
0
1990 1990 1990 1990 1990 1990 1990 1990 1990 1990 31985 1986 1987 1988 1989 1990 1991 1992 1993 1994
Year YEAR
| _Constant1994lPrices -aTotal Revenue Total Expenditure |TCot R.wnZt -e--TotalO Cpital Total ublic EpendiXP e on Eductier
Fig. 12 Per-Student Recurrent Public Expenditure (1985 -1994)(In constant 199477T$)
Fig. 11 Total Recurrent Public Expenditure on Education by Level 45,03o(in million constant 19944 TTS) 1985-94
800 40,000
700' 35,000
600 30,003
500 25,000
TT$TT$ 400 -20.000
300 -15,00
200 -10.003
100 5,030DO
0 1895 18 1987 1933 1989 1980 11 1882 1993 19841985 1986 1987 1988 1989 1990 1991 1992 1993 1994 YEAR
YEAR -- Prmary -Seondwy . Tedchiw Educ*ien aTurty
Prmary Educion -Secndary Educlicn Tchraim EduoionNoniomlVmaVodon TrInbg u-TeacherTdaing -T4Ury Educatim
(1) Austerity Measures
2.12 In 1988, the government adopted structural adjustment measures, including the reduction ingovernment spending, increased taxation, privatization of public enterprises, and currency devaluation. Asdevelopment projects were halted, capital expenditure declined by 70 percent, while recurrent expenditure by16 percent in real terms between 1985-87 and 1991-93. Salaries and wages were contained by a series ofmeasures, namely, (1) non-implementation of the Tribunal award to the civil service and a freeze on COLAin 1984; (2) non-payment of increments since 1987; (3) a ten percent reduction in salaries in 1989-90; (4) theintroduction of a voluntary termination of employment plan to reduce public sector employment; and (5)another freeze on COLA in 1992. Since education is a labor intensive enterprise, this affected morale in thesector significantly.
2.13 Austerity measures specific to the education sector include the following: (1) the introduction in 1988of a tax on all university students, known as CESS, which is equivalent to 10 percent of the estimated cost tomake up for the low tuition fees; (2) the phasing out of book and uniform grants to primary and secondarystudents in 1989; and (3) reduction of funding for school meals from TT$15.9 million in 1987 to zero in1988. The CESS was eventually replaced by a fee increase to recover 15 percent of the recurrent cost ofUWI. Tuition fees also varied by discipline, thereby taking into account both the cost and the expectedeconomic returns to graduates from a given discipline. A book grant to needy students introduced in 1991was terminated in 1994. School lunch payments were reintroduced in 1989 and grew rapidly since then.
(2) Changes in composition of public expenditure on education
2.14 The major categories of recurrent spending on education are personnel cost, goods and services,minor equipment, and transfers and subsidies (Table 5). Of all these items, recurrent expenditures accountedfor 95 to 98 percent of the total education budget, while capital expenditure accounted for the remainder ofthe share (Appendix 5). The increase of capital expenditure in recent years is largely attributable to theprovision of government financing for external borrowing from the IDB and from the World Bank for theYouth Training and Employment Partnership Program.
2.15 Of the recurrent expenditure, minor equipment, which accounted for the smallest share of theeducation expenditure (0.1-0.2 percent), had the largest cut in spending (65 percent). However, maintenanceand repair of minor equipment is what often ensure that things are in operation. Assisted schools which havebeen successful in raising funds to supplement their revenue often spend on this item.
2.16 Goods and services also accounted for a relatively small share, but it is the only item, except capitalexpenditure, that increased over the years. Further examination of the 10-year trend in Appendix 3A and 3Bfound that the increase is attributable to government financing for projects financed by such agencies as theWorld Bank and the IDB.
2.17 Transfers and subsidies, which included salaries and benefits at the tertiary level, but not at theprimary and secondary levels, accounted for about 20-21 percent of the total expenditure and suffered onlyminor reduction. Examination of the 10-year trend in Appendix 3A and 3B found that since tertiaryeducation budget had been transferred to the Prime Minister's Office in 1991, appropriation to this level hadalso increased. MOH allocation to the Medical Complex, and massive transfer of budget from other
23
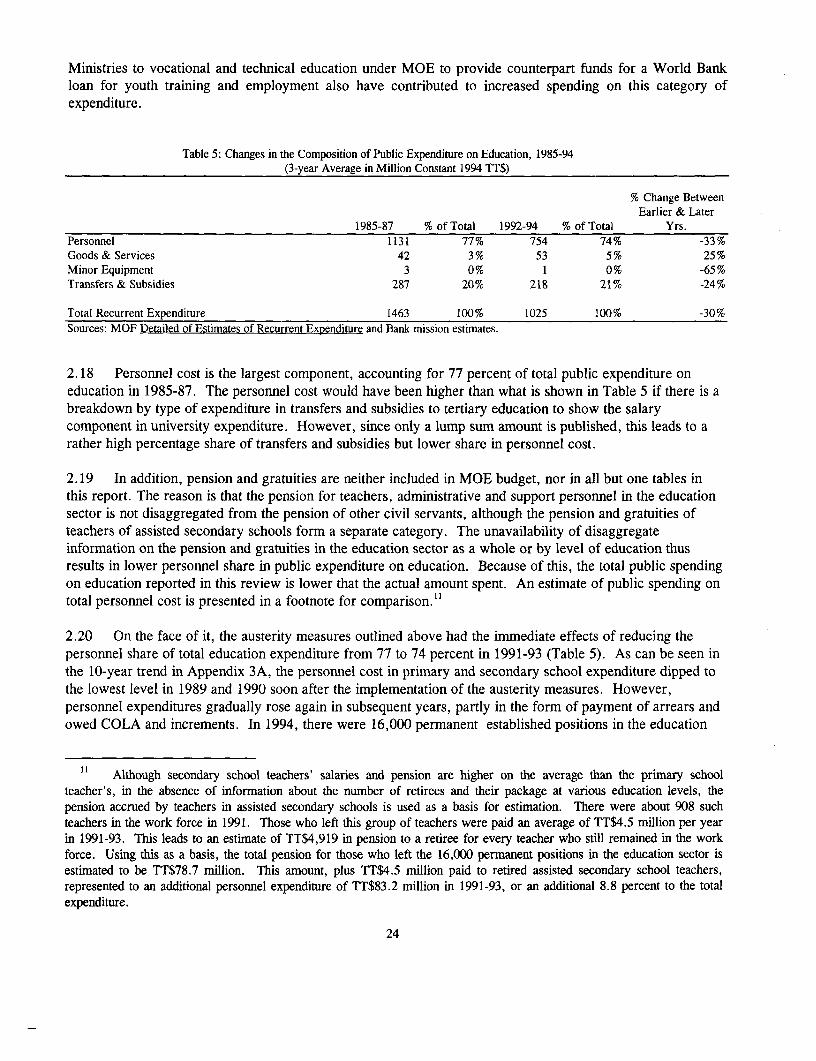
Ministries to vocational and technical education under MOE to provide counterpart funds for a World Bankloan for youth training and employment also have contributed to increased spending on this category ofexpenditure.
Table 5: Changes in the Composition of Public Expenditure on Education, 1985-94(3-year Average in Million Constant 1994 TT$)
% Change BetweenEarlier & Later
1985-87 % of Total 1992-94 % of Total Yrs.Personnel 1131 77% 754 74% -33%Goods & Services 42 3% 53 5% 25%Minor Equipment 3 0% 1 0% -65%Transfers & Subsidies 287 20% 218 21% -24%
Total Recurrent Expenditure 1463 100% 1025 100% -30%Sources: MOF Detailed of Estimates of Recurrent Expenditure and Bank mission estimates.
2.18 Personnel cost is the largest component, accounting for 77 percent of total public expenditure oneducation in 1985-87. The personnel cost would have been higher than what is shown in Table 5 if there is abreakdown by type of expenditure in transfers and subsidies to tertiary education to show the salarycomponent in university expenditure. However, since only a lump sum amount is published, this leads to arather high percentage share of transfers and subsidies but lower share in personnel cost.
2.19 In addition, pension and gratuities are neither included in MOE budget, nor in all but one tables inthis report. The reason is that the pension for teachers, administrative and support personnel in the educationsector is not disaggregated from the pension of other civil servants, although the pension and gratuities ofteachers of assisted secondary schools form a separate category. The unavailability of disaggregateinformation on the pension and gratuities in the education sector as a whole or by level of education thusresults in lower personnel share in public expenditure on education. Because of this, the total public spendingon education reported in this review is lower that the actual amount spent. An estimate of public spending ontotal personnel cost is presented in a footnote for comparison."
2.20 On the face of it, the austerity measures outlined above had the immediate effects of reducing thepersonnel share of total education expenditure from 77 to 74 percent in 1991-93 (Table 5). As can be seen inthe 10-year trend in Appendix 3A, the personnel cost in primary and secondary school expenditure dipped tothe lowest level in 1989 and 1990 soon after the implementation of the austerity measures. However,personnel expenditures gradually rose again in subsequent years, partly in the form of payment of arrears andowed COLA and increments. In 1994, there were 16,000 permanent established positions in the education
I I Although secondary school teachers' salaries and pension are higher on the average than the primary schoolteacher's, in the absence of information about the number of retirees and their package at various education levels, thepension accrued by teachers in assisted secondary schools is used as a basis for estimation. There were about 908 suchteachers in the work force in 1991. Those who left this group of teachers were paid an average of TT$4.5 million per yearin 1991-93. This leads to an estimate of TT$4,919 in pension to a retiree for every teacher who still remained in the workforce. Using this as a basis, the total pension for those who left the 16,000 permanent positions in the education sector isestimated to be TT$78.7 million. This amount, plus TT$4.5 million paid to retired assisted secondary school teachers,represented to an additional personnel expenditure of TT$83.2 million in 1991-93, or an additional 8.8 percent to the totalexpenditure.
24
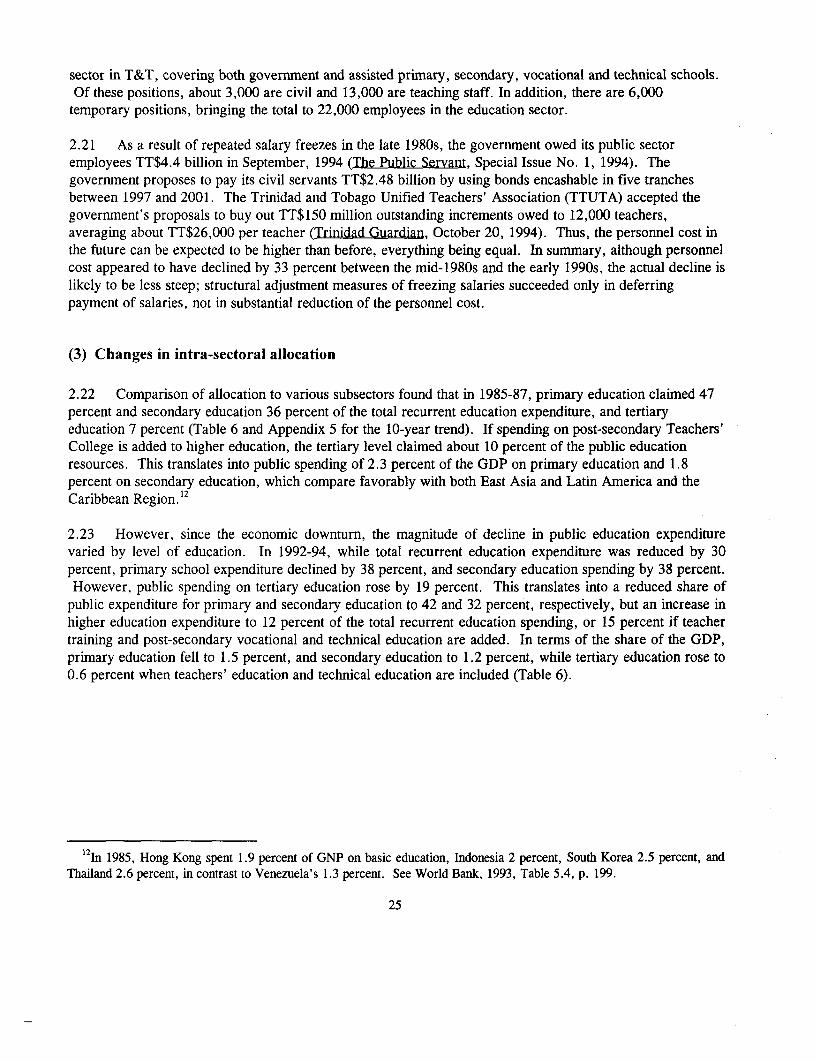
sector in T&T, covering both government and assisted primary, secondary, vocational and technical schools.Of these positions, about 3,000 are civil and 13,000 are teaching staff. In addition, there are 6,000
temporary positions, bringing the total to 22,000 employees in the education sector.
2.21 As a result of repeated salary freezes in the late 1980s, the government owed its public sectoremployees TT$4.4 billion in September, 1994 (The Public Servant, Special Issue No. 1, 1994). Thegovernment proposes to pay its civil servants TT$2.48 billion by using bonds encashable in five tranchesbetween 1997 and 2001. The Trinidad and Tobago Unified Teachers' Association (TTUTA) accepted thegovernment's proposals to buy out TT$150 million outstanding increments owed to 12,000 teachers,averaging about TT$26,000 per teacher (Trinidad Guardian, October 20, 1994). Thus, the personnel cost inthe future can be expected to be higher than before, everything being equal. In summary, although personnelcost appeared to have declined by 33 percent between the mid-1980s and the early 1990s, the actual decline islikely to be less steep; structural adjustment measures of freezing salaries succeeded only in deferringpayment of salaries, not in substantial reduction of the personnel cost.
(3) Changes in intra-sectoral allocation
2.22 Comparison of allocation to various subsectors found that in 1985-87, primary education claimed 47percent and secondary education 36 percent of the total recurrent education expenditure, and tertiaryeducation 7 percent (Table 6 and Appendix 5 for the 10-year trend). If spending on post-secondary Teachers'College is added to higher education, the tertiary level claimed about 10 percent of the public educationresources. This translates into public spending of 2.3 percent of the GDP on primary education and 1.8percent on secondary education, which compare favorably with both East Asia and Latin America and theCaribbean Region. 12
2.23 However, since the economic downturn, the magnitude of decline in public education expenditurevaried by level of education. In 1992-94, while total recurrent education expenditure was reduced by 30percent, primary school expenditure declined by 38 percent, and secondary education spending by 38 percent.However, public spending on tertiary education rose by 19 percent. This translates into a reduced share of
public expenditure for primary and secondary education to 42 and 32 percent, respectively, but an increase inhigher education expenditure to 12 percent of the total recurrent education spending, or 15 percent if teachertraining and post-secondary vocational and technical education are added. In terms of the share of the GDP,primary education fell to 1.5 percent, and secondary education to 1.2 percent, while tertiary education rose to0.6 percent when teachers' education and technical education are included (Table 6).
I2In 1985, Hong Kong spent 1.9 percent of GNP on basic education, Indonesia 2 percent, South Korea 2.5 percent, andThailand 2.6 percent, in contrast to Venezuela's 1.3 percent. See World Bank, 1993, Table 5.4, p. 199.
25
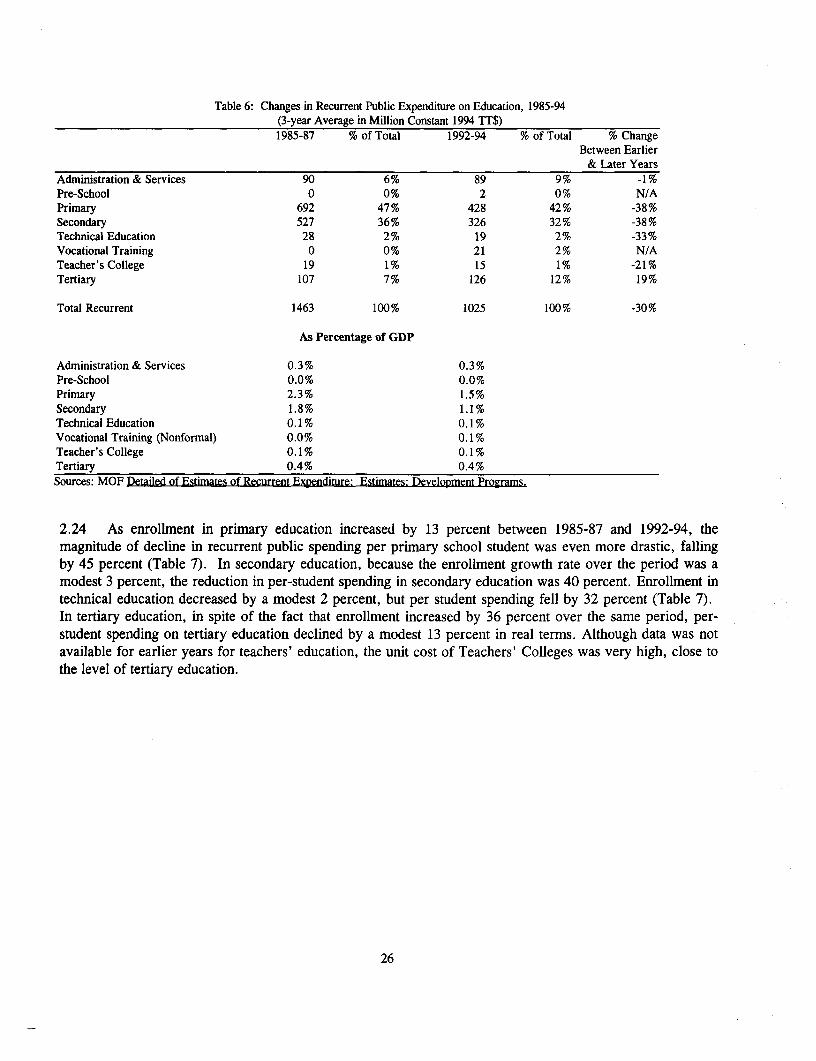
Table 6: Changes in Recurrent Public Expenditure on Education, 1985-94(3-year Average in Million Constant 1994 TT$)1985-87 % of Total 1992-94 % of Total % Change
Between Earlier& Later Years
Administration & Services 90 6% 89 9% -1%Pre-School 0 0% 2 0% N/APrimary 692 47% 428 42% -38%Secondary 527 36% 326 32% -38%Technical Education 28 2% 19 2% -33%Vocational Training 0 0% 21 2% N/ATeacher's College 19 1% 15 1% -21%Tertiary 107 7% 126 12% 19%
Total Recurrent 1463 100% 1025 100% -30%
As Percentage of GDP
Administration & Services 0.3% 0.3%Pre-School 0.0% 0.0%Primary 2.3% 1.5%Secondary 1.8% 1.1%Technical Education 0.1 % 0.1 %Vocational Training (Nonformal) 0.0% 0.1%Teacher's College 0.1 % 0.1 %Tertiary 0.4% 0.4%Sources: MOF Detailed of Estimates of Recurrent Expenditure: Estimates& Development Programs.
2.24 As enrollment in primary education increased by 13 percent between 1985-87 and 1992-94, themagnitude of decline in recurrent public spending per primary school student was even more drastic, fallingby 45 percent (Table 7). In secondary education, because the enrollment growth rate over the period was amodest 3 percent, the reduction in per-student spending in secondary education was 40 percent. Enrollment intechnical education decreased by a modest 2 percent, but per student spending fell by 32 percent (Table 7).In tertiary education, in spite of the fact that enrollment increased by 36 percent over the same period, per-student spending on tertiary education declined by a modest 13 percent in real termns. Although data was notavailable for earlier years for teachers' education, the unit cost of Teachers' Colleges was very high, close tothe level of tertiary education.
26
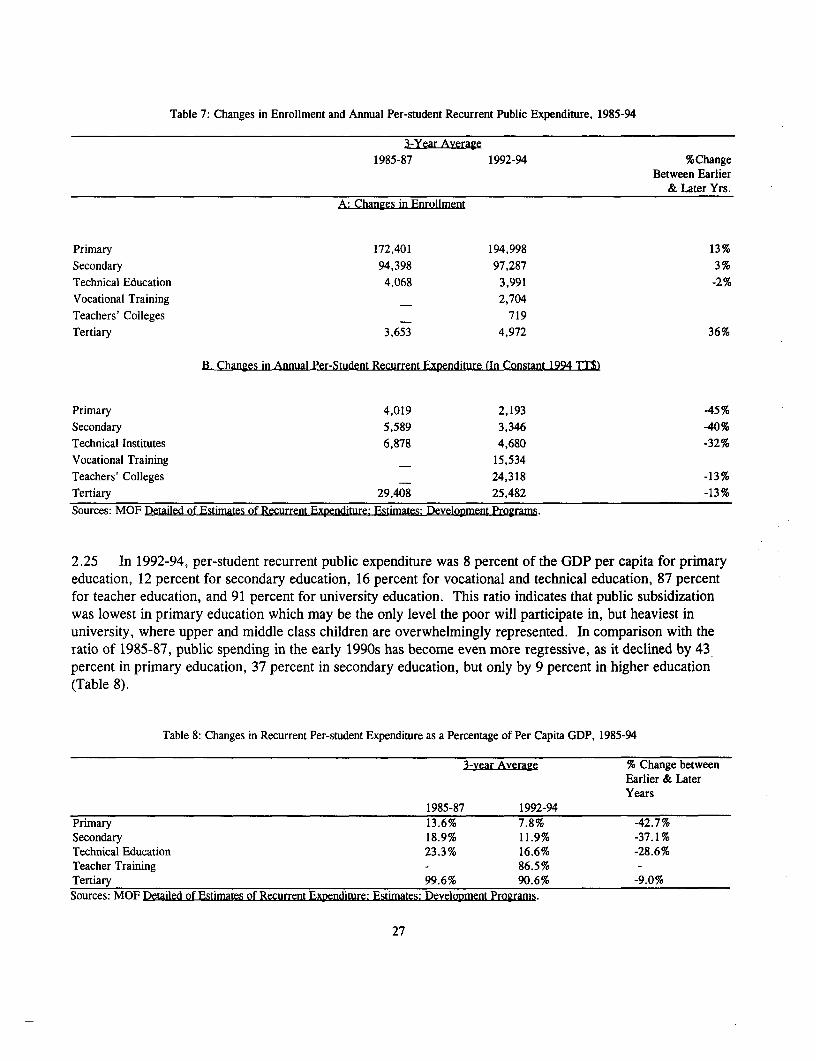
Table 7: Changes in Enrollment and Annual Per-student Recurrent Public Expenditure, 1985-94
3-Year Average1985-87 1992-94 %Change
Between Earlier& Later Yrs.
A: Changes in Enrollment
Primary 172,401 194,998 13%
Secondary 94,398 97,287 3%Technical Education 4,068 3,991 -2%Vocational Training 2,704
Teachers' Colleges 719Tertiary 3,653 4,972 36%
B. Changes in Annual Per-Student Recurrent Expenditure (In Constant 1994 TT$)
Primary 4,019 2,193 45%Secondary 5,589 3,346 -40%Technical Institutes 6,878 4,680 -32%Vocational Training 15,534Teachers' Colleges 24,318 -13%Tertiary 29,408 25,482 -13%
Sources: MOF Detailed of Estimates of Recurrent Expenditure: Estimates: Development Programs.
2.25 In 1992-94, per-student recurrent public expenditure was 8 percent of the GDP per capita for primaryeducation, 12 percent for secondary education, 16 percent for vocational and technical education, 87 percentfor teacher education, and 91 percent for university education. This ratio indicates that public subsidizationwas lowest in primary education which may be the only level the poor will participate in, but heaviest inuniversity, where upper and middle class children are overwhelmingly represented. In comparison with theratio of 1985-87, public spending in the early 1990s has become even more regressive, as it declined by 43percent in primary education, 37 percent in secondary education, but only by 9 percent in higher education(Table 8).
Table 8: Changes in Recurrent Per-student Expenditure as a Percentage of Per Capita GDP, 1985-94
3-year Average % Change betweenEarlier & LaterYears
1985-87 1992-94Primary 13.6% 7.8% -42.7%Secondary 18.9% 11.9% -37.1%Technical Education 23.3% 16.6% -28.6%Teacher Training - 86.5%Tertiary 99.6% 90.6% -9.0%Sources: MOF Detailed of Estimates of Recurrent Expenditure: Estimates: Development Programs.
27
(4) Fluctuation in public spending on education.
2.26 An examination of the ten-year trend found that public funding has been erratic and fluctuated widelyfrom year to year, depending on the availability of funds (Appendices 3A and 3B). Capital expenditure oneducation fluctuated extremely from 0 percent in 1986 to 9 percent in 1989, with tremendous variations fromyear to year. This indicates the sporadic nature of the availability of funds. When tertiary educationabsorbed 64 percent of the capital expenditure in 1987, the allocation to primary education was zero.Similarly, when 53 percent of the capital expenditure was spent on primary education in 1994, spending ontertiary education was only 1.2 percent, and that on secondary education was reduced to 11 percent(Appendix 4).
2.27 The recurrent expenditure for general administration and educational services, which include the civilestablishment in MOE and the Learning Resource Center, varied between 6 and 11 percent of the totalrecurrent expenditure between 1985 and 1994'3. Primary education spending varied from the high level of 49percent in 1986 to the low level of 41 percent in 1994. Secondary education expenditure fluctuated between28 and 38 percent, while higher education varied from 4 percent in the low extreme in 1986 to 17 percent inthe high extreme in 1991 (Appendix 4).
2.28 The trends between 1985 and 1994 show obvious trade-offs in intra-sectoral allocation. For example,when allocation to higher education was at its height at 17 percent in 1991, the allocation to primaryeducation was at its low point at 41 percent. Another example is in 1994, when the allocation toadministration and educational services rose to 11 percent in order to fund the Learning Resource Center,secondary education expenditure was cut to the all time low of 28 percent (Appendix 4).
2.29 Within each sub-sector, personnel expenditure accounted for the largest share of recurrentexpenditure (Appendix 3B). Moreover, personnel cost in general administration, primary education, andvocational and technical education has fluctuated greatly with the lowest points around 1989 and 1991 due tothe 10 percent pay cut and the implementation of the voluntary retirement plan. The latter would have abearing on pension and gratuities in subsequent years. Pension and gratuities of assisted school teachers,which were categorized separately in the government's annual estimates of recurrent expenditure, have grewfrom 0.8 percent of secondary education expenditure in 1988 to 1.5 percent in 1994. The personnel cost atother levels of education has also increased over time (Appendix 3B).
2.30 Allocation for the purchase of goods and services, which include instructional materials, training,examination, traveling, repair and maintenance, accounted for less than 1 percent in primary education andless than 3 percent in secondary education. From this pattern of allocation, it is clear that spending oneducational inputs, namely, books and library, and in-service training, has been negligible.
2.31 Allocation to minor equipment was even more paltry, less than 1 percent in primary and secondaryeducation, respectively. Grants to assisted primary schools for the purchase of goods and services, minorequipment, and building accounted for about 3 percent of expenditure at that level, while grants to assistedsecondary schools accounted for 3-4 percent of the expenditure at that level. Since transfers to assistedschools remained small, schools wishing to improve their instructional facilities had to raise funds themselves.
13 The dramatic increase to 14 percent in the 1994 estimate is attributable to the operation of the newly establishedLearning Resource Center.
28
The greatest variation in expenditure comes from the capacity of schools which can use its parents andalumni network to raise funds well above that of public subsidies.
2.32 Transfers and subsidies to households have taken the form of book and uniform grants, and schoolmeals in primary schools. Before 1991, book and uniform grants were not targeted to needy children, butwere available on demand. During periods of austerity, these grants were cut from 7 and 8 percent inprimary and secondary education, respectively, in 1987 to zero in 1989. After 1991, needs-based bookgrants were made available to primary and secondary students. However, because the funds could not coverall the needy students, they were distributed to schools instead to purchase books for use by students. In1994, book grants were completely discontinued.
2.33 The largest and expanding subsidies were free lunch in primary schools, was expanded from threemeals to five meals per week, covering about a quarter of primary school students by 1994. Spending onschool meals increased from 0 in 1985 to 13 percent of recurrent primary education expenditure in 1994.School lunch, which cost about $5 per meal per day in 1994, is an important means of income transfer, andkeeps the attendance rate high. However, as this spending is on the rise, it crowds out other educationallyeffective inputs such as book grants to poor children.
2.34 In summary, the trend between 1985 and 1994 shows that decline in public investment in educationduring economic recession have severely constrained the ability of the system to cope with the challenges.Equally worrying is the trend of increasing regressivity in public spending on education, with per-studentspending on primary education suffering the most drastic cut while that on higher education saw substantialincrease. The following Chapter discusses the likely impact of the severe decline in per-student spending inthe primary and secondary levels, and the uneven resource endowment of various types of school oneducational attainment and learning outcomes.
29
3. System Performance Indicators for the Rich and Poor
3.1 By some indicators, Trinidad and Tobago's education system compares favorably with those in LatinAmerican and Caribbean. 14 . For example, girls' enrollment in both primary and secondary schools isslightly more than 50 percent of the total (MOE statistics). Girls also perform better than boys at all levels(Jules, 1994 and Appendix 13). Repetition rates in primary schools are less than 2 percent on average, exceptin Standard 5, where students voluntarily repeat in order to have a second chance to be placed in a secondaryschool. Dropout rates are less than 0.5 percent on average, again except in Standard 5. For a cohort of1,000 students who enter Standard 1, on average, 96 percent of boys, and 97 percent of girls can be expectedto reach Standard 5 (Appendix 14). However, these indicators mask the problems in equity and quality.
A. Enrollment Rates Attendance and Their Variation.
3.2 Inequity in education is reflected in unequal access to different levels of education, as well as toschools of different quality. Since education is positively associated with productivity and earnings,variability in educational attainment and achievement will lead to differentials in employment prospects andfuture life-time earnings, thereby contributing to perpetuating the cycle of poverty. Analysis of the SLC datacollected in 1992 found a large degree of variation in enrollment by expenditure quintile. In the 2-4 agegroup, only 21 percent of children in the first (lowest) expenditure quintile attended school, compared with 51percent of children in the fifth (highest) expenditure quintile (Table 9A). Active, high quality early childhoodeducation programs have demonstrated to impact on the development of initiative and school readiness to theextent that it can mitigate impoverished home environment and has long-term positive effects on schoolachievement, social behavior, employment, and property ownership."5 That a significantly smaller proportionof children from low-income homes enroll in pre-school means that a majority of them are less prepared forprimary schooling.
3.3 Among the 5-11 age cohort, the enrollment rate was 93 percent among the lowest quintile, comparedwith 99 percent of highest quintiles (Table 9A). This generally high level of enrollment is consistent with thepolicy of universal primary education. However, the lower enrollment rates among lower quintiles isindicative of the problem of inequity. Furthermore, the distribution of children from different quintiles indifferent types of schools is uneven. While 87 percent of children from the lowest quintile attendedgovernment and assisted primary schools, only 78 percent of the top quintile attended these schools and 16percent of them went to private schools (Table 9B).
14Overall in Latin America and the Caribbean Region, 42 percent of first graders repeat their grade, and 29 percent of allprimary school students repeat their grade each year. See Wolff et. al. 1994, p. 20.
15A longitudinal study of participants in Perry Pre-School in Michigan, USA, found that adults who were born in poverty
but attended a high-quality, active learning preschool program at ages 3 and 4 have higher achievement scores at 14 and 19than nonparticipants, greater probability to finish high school, half as many criminal arrests, higher earnings, greaterproperty wealth, and greater commitment to marriage. Over pre-school participants' lifetimes, the public is receiving anestimated $7.16 for every dollar invested. See Schweinhard, et. al. 1993.
30
Table 9: School Enrolled by Age, Education Level, and Expenditure Quintile
Per Capita Expenditure Quintile # of Persons1 2 3 4 5 Total in the(Poorest) (Wealthiest) Sample
9A: Percentage Enrolled by Age GroupAge Groups2-4 21 27 43 37 51 33 3635-11 93 95 98 99 99 96 1,11112-15 81 87 92 95 97 89 49016-19 28 34 53 53 67 45 474
9B: Percentage Enrolled by Age Group by Education Level
Ages 2-4Pre-school 18 25 38 35 47 30Primary 3 1 5 2 4 3
Ages 5-11Pre-school 3 4 5 7 3 4Primary 89 88 93 90 94 90
Govt. & assisted 88 87 90 85 78 87Private 1 1 3 5 16 4
Junior Secondary 0 1 0 2 0 1
Ages 12-15Primary 20 24 10 13 19 19
Govt. & Assisted 20 23 19 12 17 18Private 0 1 1 1 2 1
Junior Secondary 37 27 33 38 20 32Vocational 3 3 1 1 0 2Upper Secondary 21 31 38 43 58 35
Govt. & Assisted 13 11 24 26 46 21Private 0 1 2 2 5 2Senior Comprehensive 5 16 5 10 5 9Composite 3 3 6 5 2 4
Other 0 3 0 0 0 0
Ages 16-19Junior Secondary 0 0 0 0 1 0Vocational 4 7 2 4 3 4Youthcamps, etc. 0 1 0 0 0 0Senior Secondary 24 23 42 36 51 34
Govt. & Assisted 4 7 20 12 19 12Private 0 1 4 4 8 3Senior Compr. 19 11 12 16 21 16Composite 1 2 1 2 0 1
Technical Institutes 0 1 5 1 3 2University 0 0 0 1 4 1Other 0 0 2 5 1 1
_Source: SLC data, 1992.
31
3.4 Among the 12-15 age cohort, enrollment of children of the lowest quintiles dropped to 81 percent, but97 percent of children of the highest quintile still attended school (Table 9A). Students of the lowest quintileswere heavily represented in 3-year junior secondary schools (37 percent) and vocational programs (3percent), compared with only 20 percent of those in the top quintile in junior secondary schools and zero invocational programs (Table 9A). By contrast, children of the highest quintile were concentrated in 5- or 7-year schools (57 percent in total), of which 46 percent were in traditional government and assisted schools,and 5 percent in private secondary schools. In comparison, only 21 percent of children in the lowest quintileattended senior secondary schools, of whom only 13 percent attended traditional government and assistedschools, 5 percent in senior comprehensive, 3 percent in composite schools, and zero in private schools(Table 9B).
3.5 The findings from a recent study on secondary schools (Jules, 1994) reinforces the messages comingfrom the SLC survey. The share of students in the total student population from lower income group was 31percent in Form I and 26 percent in Form 5, and 13 and 11 percent in Lower 6 and Upper 6, respectively.By contrast, the share of students from the upper income group was 6 percent in Form 1, 20 percent and 18percent in Lower 6 and Upper 6, respectively (Table 10).
3.6 Among the 16-19 age group, only 28 percent of the lowest quintile versus 67 percent of the highestquintile were still in school. Students from the third quintile were the major users of technical institutes, butnot those from the lowest quintile. University was clearly a venue for the wealthy: enrollment by studentsfrom the fifth quintile was four times as much as that by youths in the fourth quintile, compared with zeroenrollment of youths in the first to the third quintals (Table 9B).
Table 10: Secondary School Enrollment by Grade and Income Group (Percentage)
Upper Middle Lower Others'6 % of Number ofLevel Level Level Total Students
Form 1 6 49 31 15 100 17,157Form 2 6 48 30 15 100 17,008Form 3 6 50 29 14 100 16,359Form 4 7 51 27 15 100 14,123Form 5 8 51 26 15 100 14,263Lower6 20 60 13 7 100 2,261Upper 6 18 61 11 10 100 2,143
Source: Jules, 1994, Table 6. p. 37Note: The percentage shares are rounded.
3.7 Two major factors lie behind the difference in enrollment by expenditure quintile: (i) householdability to pay the direct and indirect private cost of education, which, in turn, is a function of familycharacteristics such as household income and parental education; and (ii) differential access to good schoolswhich affect the ability of students to progress to the next level. On the cost side, even though tuition is freeof charge, households still bear the direct cost of transportation, lunch, books, and uniforms, and the indirector the opportunity cost of foregone earnings by sending a child to school rather than to work.
'6 The category, other, includes housepersons (homemakers), not applicable, and no response.
32
3.8 Analysis of SLC data found that the educational attainment of heads of household differed enormouslyby expenditure quintile. For example, only 16 percent of household heads of the poorest 20 percent hadsecondary education, and less than 1 percent of them had higher education, compared with 53 percent ofheads of the wealthiest 20 percent who had secondary education, and 16 percent had higher education (Table11). As education has a strong correlation with earnings and inter-generational mobility, this explains to alarge extent why attendance of children of the first two quintals are lower that of children of upper quintileseven at the compulsory education level.
Table 11: Level of Educational Attainment by Heads of Household by Per Capita Expenditure Quintile
Per Capita Expenditure Quintile Median Per Capita Monthly Expenditure1 2 3 4 5 (TT$)
Primary 84 76 73 56 32 631Secondary 16 23 27 40 53 1,136Tertiary 0.8 0.7 0.4 4.3 16 2,616
Source: SLC data, 1992.
3.9 Examination of the mean days of attendance found that the differences between students from variousquintiles in pre-school, primary, and senior secondary education to be minimal (Table 12A). The high schoolattendance has been a tradition in T&T, except in the rainy seasons in rural area.
3.10 However, the reasons for non-attendance varied by expenditure quintile. Among primary schoolstudents, 23 percent in the first quintile cited financial problems, and 17 percent cited transportation problemsas the main reasons of non-attendance, whereas none of these factors affected students in the upper quintile(Table 12B). In the junior secondary level, there is much variation in mean days of attendance, indicating thatadolescence with an awakened sense of independence and uncertainty around the school-to-work transitiontend to slack off in attendance (Table 12A). By contrast, attendance rate of those who have made it to seniorsecondary tend to be higher.
3.11 This hypothesis is supported by the reasons cited for non-attendance by secondary school students. 17percent of students in the second quintile considered schooling not worth their while, and 4 percent ofstudents in the fourth quintile were affected by pregnancy. That it was not a problem for the lower quintilecould be due to the fact that unmotivated or pregnant teenagers from poor families might have dropped outrather than staying in school (Table 12B). More second quintile students (22 percent) than first quintilestudents (15 percent) cited financial problems. Again, this might be due to the fact that those first quintilestudents who really could not afford to go to secondary schools have dropped out, while those in the secondquintile stayed enrolled, but recognized the increasing opportunity cost of schooling.
B. Out-of-Pocket Costs and Their Incidence.
3.12 The means of transportation varied by quintile (Table 13). Transportation was a problem for lowincome children as 64 percent of students in the first quintile walked to school. By contrast, of students in thefifth quintile, only 21 percent walked to school, 13 percent who took maxi cabs, 19 percent who went by taxi,and 20 percent who went by private cars. This affected the rural areas more than the urban areas, because 63
33
percent of students in the first quintile in the rural areas walked to school. The breakdown of reasons fornon-attendance by urban and rural areas confirmed that transportation is more of a problem for students in thecountryside (Appendix 18). When such a large number of poor children have to walk to school, they havelittle choice but to go to the nearest school, irrespective of the quality of instruction. By contrast, wealthystudents have a wider range of option. When schools in poorer neighborhood and rural areas are of poorerquality, these children have less opportunities to become high achievers.
Table 12: Mean Days of Attendance and Reasons for Non-attendance
Per Capita Expenditure quintiles1 2 3 4 5 Total
12A: Mean days of attendance per weekPre-school 4.4 4.5 4.2 4.6 4.7 4.5Primary 4.4 4.6 4.6 4.7 4.7 4.6Junior Secondary 3.9 4.5 4.7 4.5 2.9 4.3Senior Secondary 4.3 4.4 4.5 4.5 4.6 4.5
12B: Reasons for Non-attendance (Percentage)Primary SchoolIllness 14 17 22 28 15 18Finance problem 23 3 11 3 0 11Transport problem 17 0 0 0 0 6Homeduty 0 0 0 3 0 0Not worth 4 0 2 3 10 3Holiday 22 34 26 35 25 28Baby sitting 0 2 0 0 0 0Other 21 41 39 28 50 33No answer 0 3 0 0 0 1Absentees 27 24 20 15 14 1Total Students 100 100 100 100 100 100N= 292 248 231 194 143 1108
Secondary SchoolIllness 12 6 10 26 7 13Finance problem 15 22 0 0 0 8Transport 3 0 0 0 0 1Working 0 0 0 4 0 1Not worth 0 17 5 7 0 5Holiday 33 11 29 30 20 26Pregnant 0 0 0 4 0 1Other 37 44 57 30 73 45Absentees 27 16 16 21 16 20Total 100 100 100 100 100 100N= 123 113 128 127 96 587
Source: SLC data, 1992./Note: The percentage is rounded.
3.13 Travel accounted for a very substantial cost when the daily expenses are multiplied by 22 days in amonth (Table 14). Moreover, this only represents the travel cost of one child, among other school agechildren in the family. Another daily recurrent cost is lunch. Families might be able to get around it bygiving lunch to children to carry to school. As a result, the amount of money households spent on lunch wasnot as high as that on transportation (Table 14). These daily costs translate into an annual cost of TT$292 for
34
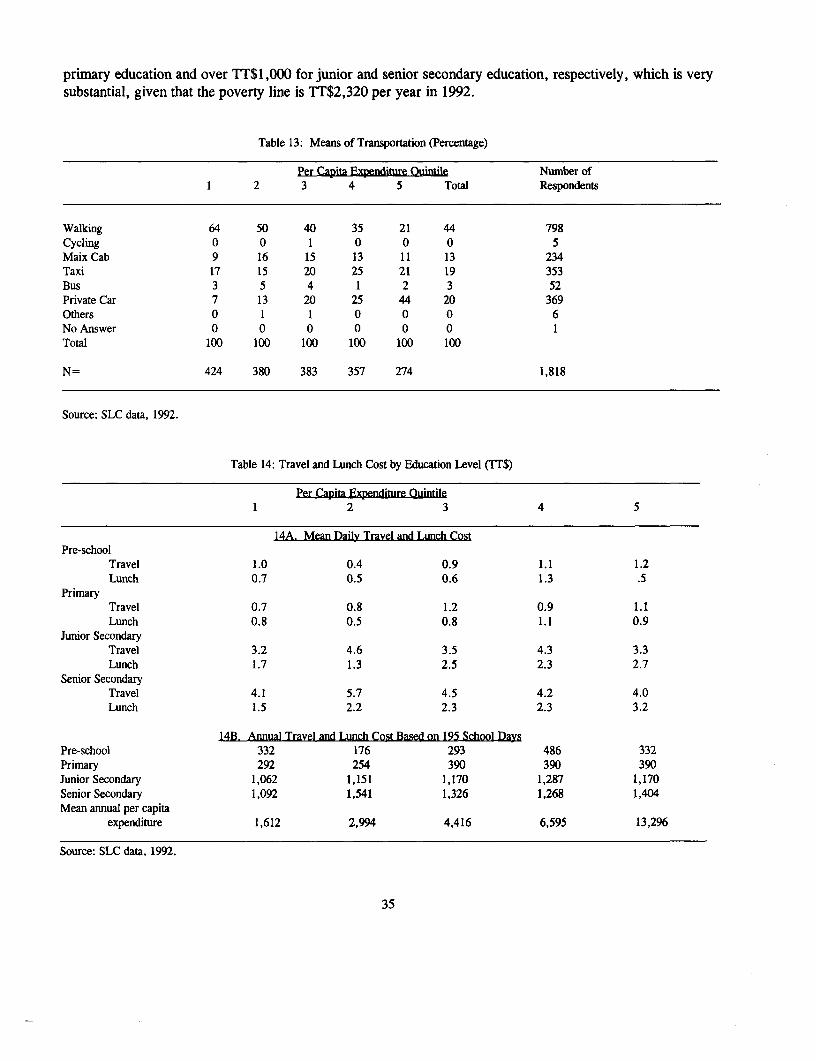
primary education and over TT$1,000 for junior and senior secondary education, respectively, which is verysubstantial, given that the poverty line is TT$2,320 per year in 1992.
Table 13: Means of Transportation (Percentage)
Per Capita Expenditure Quintile Numnber of1 2 3 4 5 Total Respondents
Walking 64 50 40 35 21 44 798Cycling 0 0 1 0 0 0 5Maix Cab 9 16 15 13 11 13 234Taxi 17 15 20 25 21 19 353Bus 3 5 4 1 2 3 52Private Car 7 13 20 25 44 20 369Others 0 1 1 0 0 0 6No Answer 0 0 0 0 0 0 1Total 100 100 100 100 100 100
N= 424 380 383 357 274 1,818
Source: SLC data, 1992.
Table 14: Travel and Lunch Cost by Education Level (TT$)
Per Capita Expenditure Quintile1 2 3 4 5
14A. Mean Daily Travel and Lunch CostPre-school
Travel 1.0 0.4 0.9 1.1 1.2Lunch 0.7 0.5 0.6 1.3 .5
PrimaryTravel 0.7 0.8 1.2 0.9 1.1Lunch 0.8 0.5 0.8 1.1 0.9
Junior SecondaryTravel 3.2 4.6 3.5 4.3 3.3Lunch 1.7 1.3 2.5 2.3 2.7
Senior SecondaryTravel 4.1 5.7 4.5 4.2 4.0Lunch 1.5 2.2 2.3 2.3 3.2
14B. Annual Travel and Lunch Cost Based on 195 School DaysPre-school 332 176 293 486 332Primary 292 254 390 390 390Junior Secondary 1,062 1,151 1,170 1,287 1,170Senior Secondary 1,092 1,541 1,326 1,268 1,404Mean annual per capita
expenditure 1,612 2,994 4,416 6,595 13,296
Source: SLC data, 1992.
35
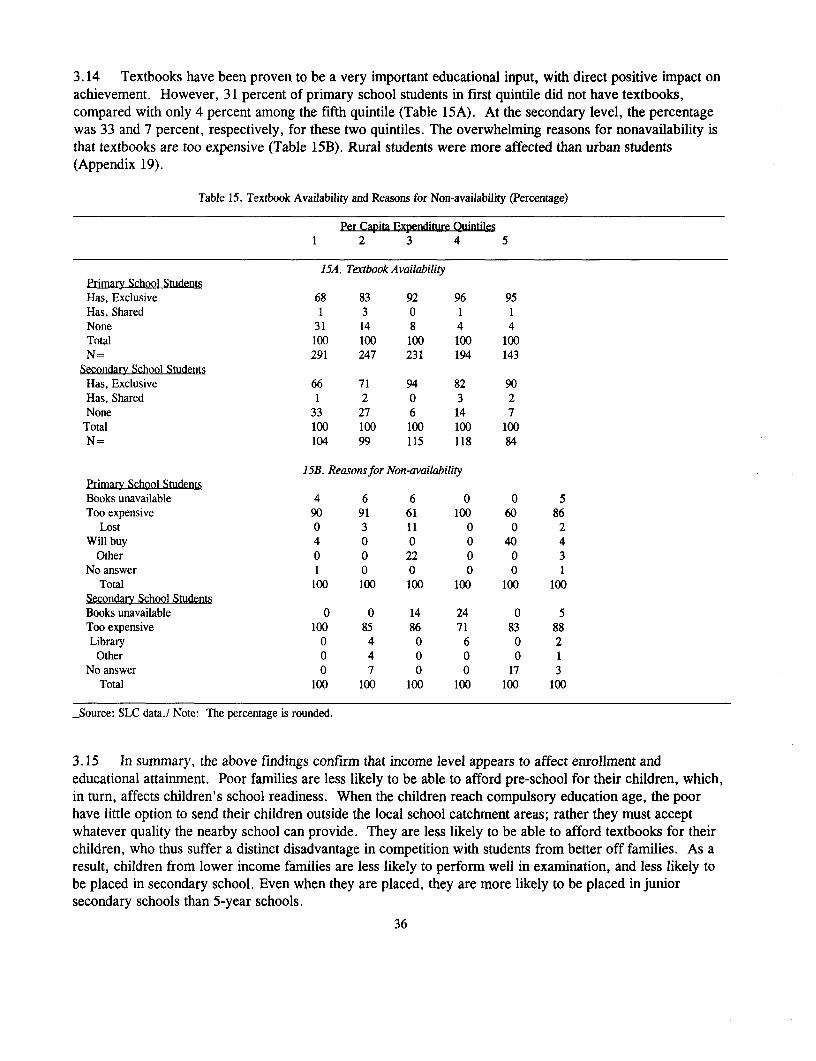
3.14 Textbooks have been proven to be a very important educational input, with direct positive impact onachievement. However, 31 percent of primary school students in first quintile did not have textbooks,compared with only 4 percent among the fifth quintile (Table 15A). At the secondary level, the percentagewas 33 and 7 percent, respectively, for these two quintiles. The overwhelming reasons for nonavailability isthat textbooks are too expensive (Table 15B). Rural students were more affected than urban students(Appendix 19).
Table 15. Textbook Availability and Reasons for Non-availability (Percentage)
Per Capita Expenditure Quintiles1 2 3 4 5
15A. Textbook AvailabilityPrimary School StudentsHas, Exclusive 68 83 92 96 95Has, Shared 1 3 0 1 1None 31 14 8 4 4Total 100 100 100 100 100N= 291 247 231 194 143
Secondary School StudentsHas, Exclusive 66 71 94 82 90Has, Shared 1 2 0 3 2None 33 27 6 14 7Total 100 100 100 100 100N= 104 99 115 118 84
15B. Reasons for Non-availabilityPrimary School StudentsBooks unavailable 4 6 6 0 0 5Too expensive 90 91 61 100 60 86
Lost 0 3 11 0 0 2Will buy 4 0 0 0 40 4
Other 0 0 22 0 0 3No answer 1 0 0 0 0 1
Total 100 100 100 100 100 100Secondary School StudentsBooks unavailable 0 0 14 24 0 5Too expensive 100 85 86 71 83 88Library 0 4 0 6 0 2
Other 0 4 0 0 0 1No answer 0 7 0 0 17 3
Total 100 100 100 100 100 100
-Source: SLC data./ Note: The percentage is rounded.
3.15 In summary, the above findings confirm that income level appears to affect enrollment andeducational attainment. Poor families are less likely to be able to afford pre-school for their children, which,in turn, affects children's school readiness. When the children reach compulsory education age, the poorhave little option to send their children outside the local school catchment areas; rather they must acceptwhatever quality the nearby school can provide. They are less likely to be able to afford textbooks for theirchildren, who thus suffer a distinct disadvantage in competition with students from better off families. As aresult, children from lower income families are less likely to perform well in examination, and less likely tobe placed in secondary school. Even when they are placed, they are more likely to be placed in juniorsecondary schools than 5-year schools.
36
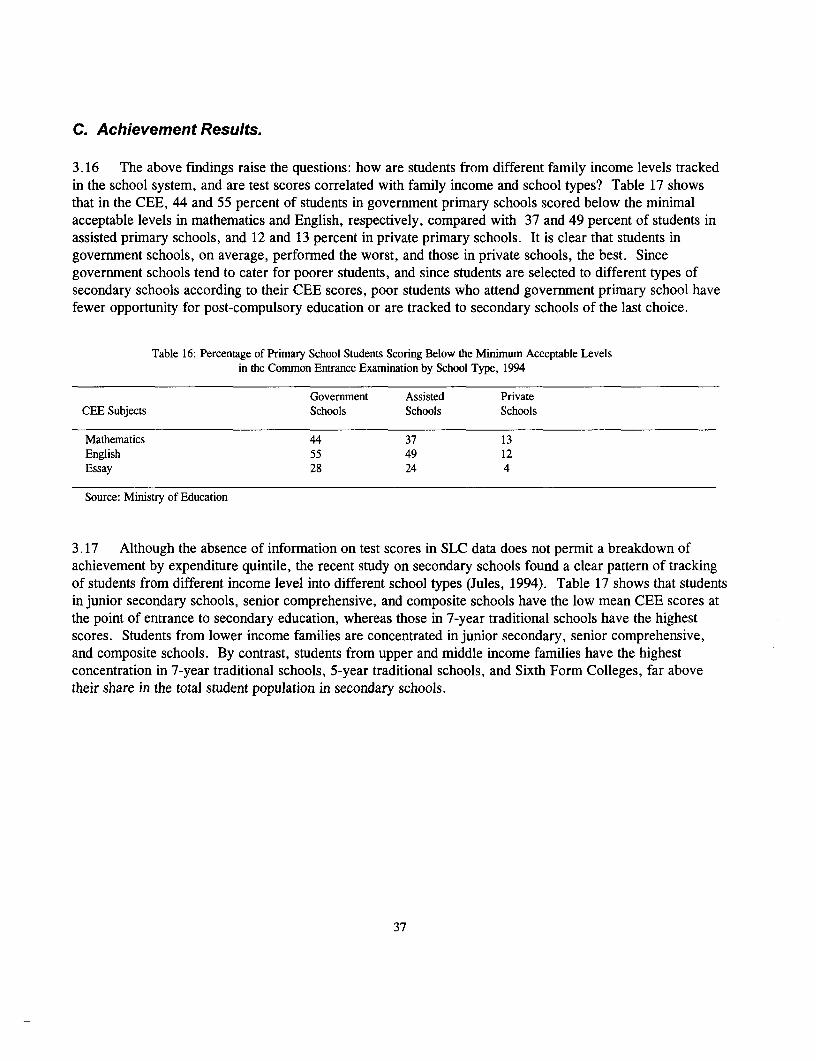
C. Achievement Results.
3.16 The above findings raise the questions: how are students from different family income levels trackedin the school system, and are test scores correlated with family income and school types? Table 17 showsthat in the CEE, 44 and 55 percent of students in government primary schools scored below the minimalacceptable levels in mathematics and English, respectively, compared with 37 and 49 percent of students inassisted primary schools, and 12 and 13 percent in private primary schools. It is clear that students ingovernment schools, on average, performed the worst, and those in private schools, the best. Sincegovernment schools tend to cater for poorer students, and since students are selected to different types ofsecondary schools according to their CEE scores, poor students who attend government primary school havefewer opportunity for post-compulsory education or are tracked to secondary schools of the last choice.
Table 16: Percentage of Primary School Students Scoring Below the Minimum Acceptable Levelsin the Common Entrance Examination by School Type, 1994
Government Assisted PrivateCEE Subjects Schools Schools Schools
Mathematics 44 37 13English 55 49 12Essay 28 24 4
Source: Ministry of Education
3.17 Although the absence of information on test scores in SLC data does not permit a breakdown ofachievement by expenditure quintile, the recent study on secondary schools found a clear pattern of trackingof students from different income level into different school types (Jules, 1994). Table 17 shows that studentsin junior secondary schools, senior comprehensive, and composite schools have the low mean CEE scores atthe point of entrance to secondary education, whereas those in 7-year traditional schools have the highestscores. Students from lower income families are concentrated in junior secondary, senior comprehensive,and composite schools. By contrast, students from upper and middle income families have the highestconcentration in 7-year traditional schools, 5-year traditional schools, and Sixth Form Colleges, far abovetheir share in the total student population in secondary schools.
37
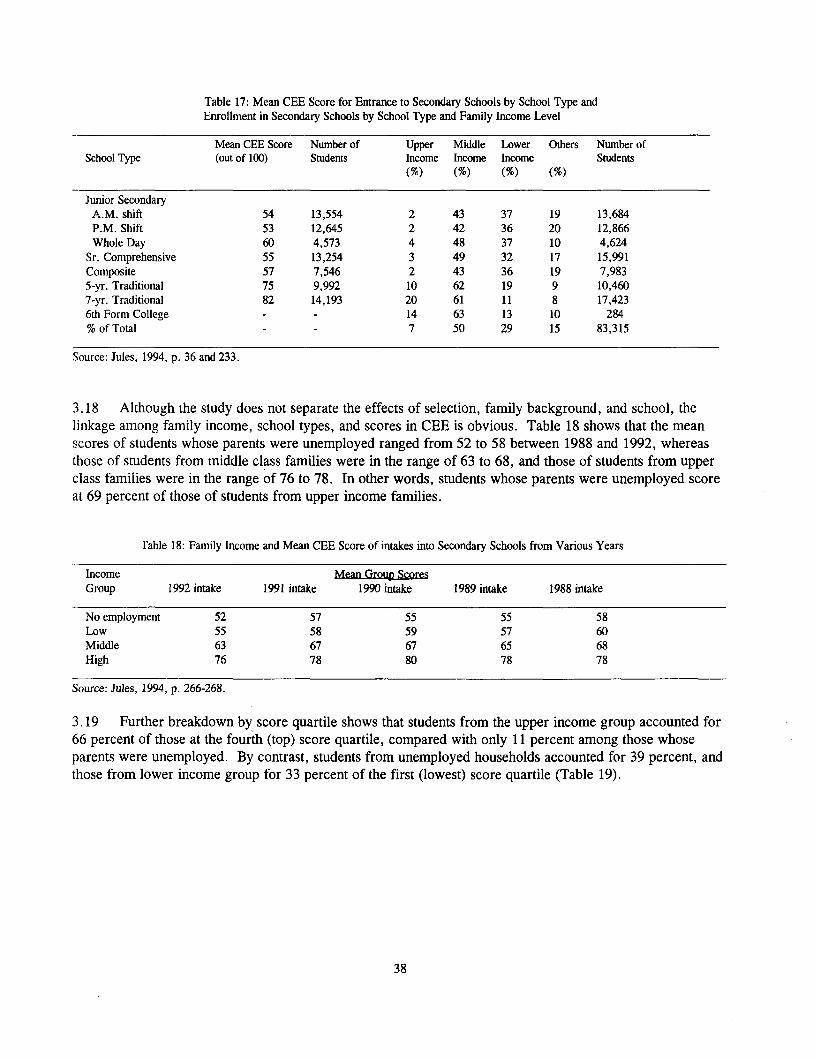
Table 17: Mean CEE Score for Entrance to Secondary Schools by School Type andEnrollment in Secondary Schools by School Type and Family Income Level
Mean CEE Score Number of Upper Middle Lower Others Number ofSchool Type (out of 100) Students Income Income Income Students
(%) (%) (%) (%)
Junior SecondaryA.M. shift 54 13,554 2 43 37 19 13,684P.M. Shift 53 12,645 2 42 36 20 12,866Whole Day 60 4,573 4 48 37 10 4,624
Sr. Comprehensive 55 13,254 3 49 32 17 15,991Composite 57 7,546 2 43 36 19 7,9835-yr. Traditional 75 9,992 10 62 19 9 10,4607-yr. Traditional 82 14,193 20 61 11 8 17,4236th Form College - - 14 63 13 10 284% of Total - - 7 50 29 15 83,315
Source: Jules, 1994, p. 36 and 233.
3.18 Although the study does not separate the effects of selection, family background, and school, thelinkage among family income, school types, and scores in CEE is obvious. Table 18 shows that the meanscores of students whose parents were unemployed ranged from 52 to 58 between 1988 and 1992, whereasthose of students from middle class families were in the range of 63 to 68, and those of students from upperclass families were in the range of 76 to 78. In other words, students whose parents were unemployed scoreat 69 percent of those of students from upper income families.
rable 18: Family Income and Mean CEE Score of intakes into Secondary Schools from Various Years
Income Mean Group SresGroup 1992 intake 1991 intake 1990 intake 1989 intake 1988 intake
No employment 52 57 55 55 58Low 55 58 59 57 60Middle 63 67 67 65 68High 76 78 80 78 78
Source: Jules, 1994, p. 266-268.
3.19 Further breakdown by score quartile shows that students from the upper income group accounted for66 percent of those at the fourth (top) score quartile, compared with only 11 percent among those whoseparents were unemployed. By contrast, students from unemployed households accounted for 39 percent, andthose from lower income group for 33 percent of the first (lowest) score quartile (Table 19).
38
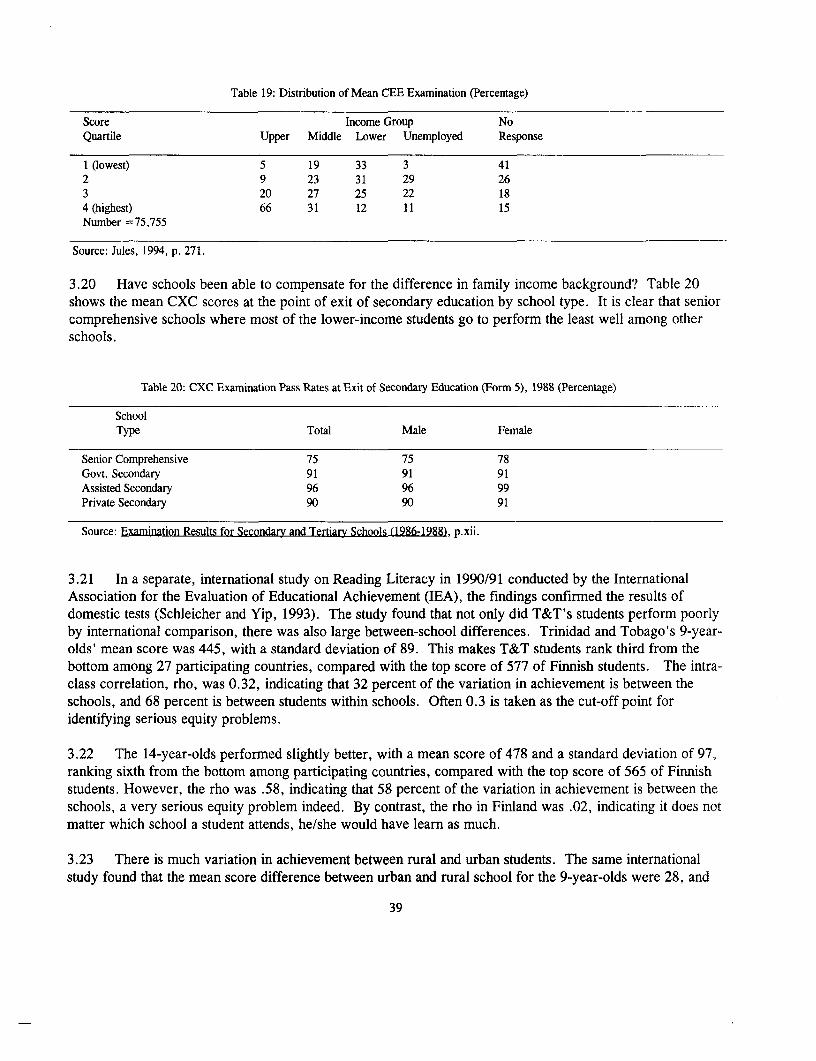
Table 19: Distribution of Mean CEE Examination (Percentage)
Score Income Group NoQuartile Upper Middle Lower Unemployed Response
I (lowest) 5 19 33 3 412 9 23 31 29 263 20 27 25 22 184 (highest) 66 31 12 11 15Number =75,755
Source: Jules, 1994, p. 271.
3.20 Have schools been able to compensate for the difference in family income background? Table 20shows the mean CXC scores at the point of exit of secondary education by school type. It is clear that seniorcomprehensive schools where most of the lower-income students go to perform the least well among otherschools.
Table 20: CXC Examination Pass Rates at Exit of Secondary Education (Form 5), 1988 (Percentage)
SchoolType Total Male Female
Senior Comprehensive 75 75 78Govt. Secondary 91 91 91Assisted Secondary 96 96 99Private Secondary 90 90 91
Source: Examination Results for Secondary and Tertiary Schools (1986-1988), p.xii.
3.21 In a separate, international study on Reading Literacy in 1990/91 conducted by the InternationalAssociation for the Evaluation of Educational Achievement (IEA), the findings confirmed the results ofdomestic tests (Schleicher and Yip, 1993). The study found that not only did T&T's students perform poorlyby international comparison, there was also large between-school differences. Trinidad and Tobago's 9-year-olds' mean score was 445, with a standard deviation of 89. This makes T&T students rank third from thebottom among 27 participating countries, compared with the top score of 577 of Finnish students. The intra-class correlation, rho, was 0.32, indicating that 32 percent of the variation in achievement is between theschools, and 68 percent is between students within schools. Often 0.3 is taken as the cut-off point foridentifying serious equity problems.
3.22 The 14-year-olds performed slightly better, with a mean score of 478 and a standard deviation of 97,ranking sixth from the bottom among participating countries, compared with the top score of 565 of Finnishstudents. However, the rho was .58, indicating that 58 percent of the variation in achievement is between theschools, a very serious equity problem indeed. By contrast, the rho in Finland was .02, indicating it does notmatter which school a student attends, he/she would have learn as much.
3.23 There is much variation in achievement between rural and urban students. The same internationalstudy found that the mean score difference between urban and rural school for the 9-year-olds were 28, and
39
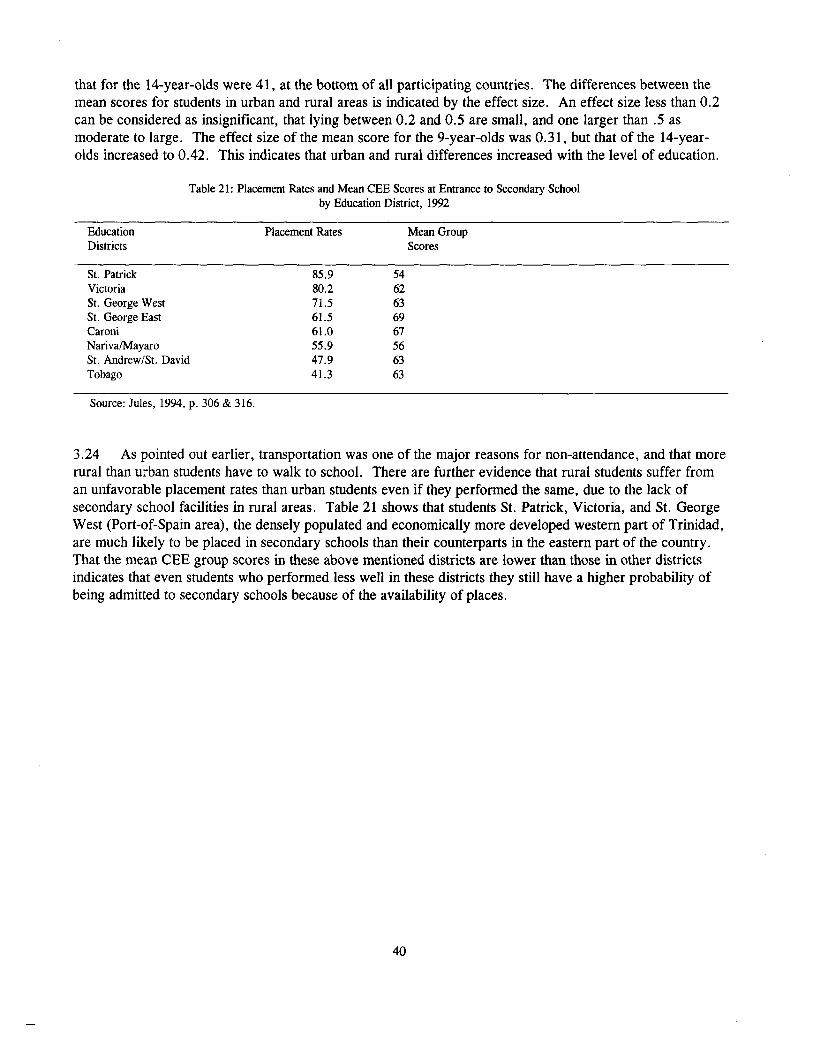
that for the 14-year-olds were 41, at the bottom of all participating countries. The differences between themean scores for students in urban and rural areas is indicated by the effect size. An effect size less than 0.2can be considered as insignificant, that lying between 0.2 and 0.5 are small, and one larger than .5 asmoderate to large. The effect size of the mean score for the 9-year-olds was 0.31, but that of the 14-year-olds increased to 0.42. This indicates that urban and rural differences increased with the level of education.
Table 21: Placement Rates and Mean CEE Scores at Entrance to Secondary Schoolby Education District, 1992
Education Placement Rates Mean GroupDistricts Scores
St. Patrick 85.9 54Victoria 80.2 62St. George West 71.5 63St. George East 61.5 69Caroni 61.0 67Nariva/Mayaro 55.9 56St. Andrew/St. David 47.9 63Tobago 41.3 63
Source: Jules, 1994, p. 306 & 316.
3.24 As pointed out earlier, transportation was one of the major reasons for non-attendance, and that morerural than urban students have to walk to school. There are further evidence that rural students suffer froman unfavorable placement rates than urban students even if they performed the same, due to the lack ofsecondary school facilities in rural areas. Table 21 shows that students St. Patrick, Victoria, and St. GeorgeWest (Port-of-Spain area), the densely populated and economically more developed western part of Trinidad,are much likely to be placed in secondary schools than their counterparts in the eastern part of the country.That the mean CEE group scores in these above mentioned districts are lower than those in other districtsindicates that even students who performed less well in these districts they still have a higher probability ofbeing admitted to secondary schools because of the availability of places.
40
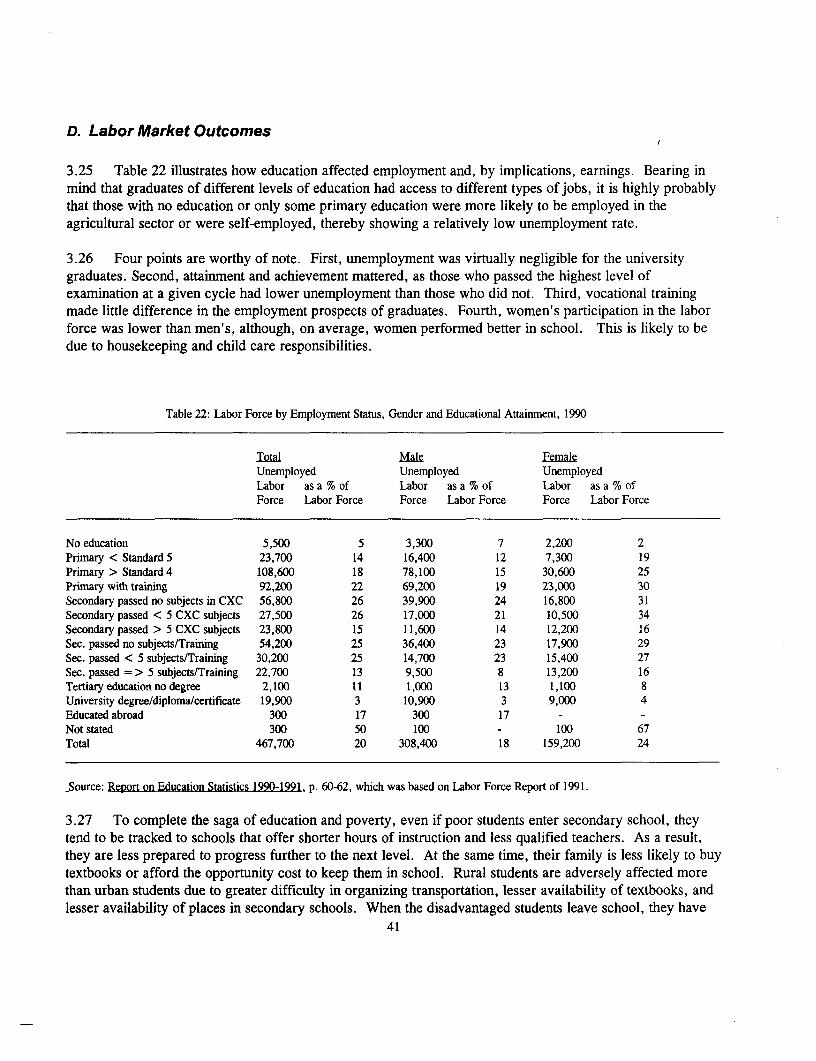
D. Labor Market Outcomes
3.25 Table 22 illustrates how education affected employment and, by implications, earnings. Bearing inmind that graduates of different levels of education had access to different types of jobs, it is highly probablythat those with no education or only some primary education were more likely to be employed in theagricultural sector or were self-employed, thereby showing a relatively low unemployment rate.
3.26 Four points are worthy of note. First, unemployment was virtually negligible for the universitygraduates. Second, attainment and achievement mattered, as those who passed the highest level ofexamination at a given cycle had lower unemployment than those who did not. Third, vocational trainingmade little difference in the employment prospects of graduates. Fourth, women's participation in the laborforce was lower than men's, although, on average, women performed better in school. This is likely to bedue to housekeeping and child care responsibilities.
Table 22: Labor Force by Employment Status, Gender and Educational Attainment, 1990
IQtal Mal FemaleUnemployed Unemployed UnemployedLabor as a % of Labor as a % of Labor as a % ofForce Labor Force Force Labor Force Force Labor Force
No education 5,500 5 3,300 7 2,200 2Primary < Standard 5 23,700 14 16,400 12 7,300 19Primary > Standard 4 108,600 18 78,100 15 30,600 25Primary with training 92,200 22 69,200 19 23,000 30Secondary passed no subjects in CXC 56,800 26 39,900 24 16,800 31Secondary passed < 5 CXC subjects 27,500 26 17,000 21 10,500 34Secondary passed > 5 CXC subjects 23,800 15 11,600 14 12,200 16Sec. passed no subjects/Training 54,200 25 36,400 23 17,900 29Sec. passed < 5 subjects/Training 30,200 25 14,700 23 15,400 27Sec. passed => 5 subjects/Training 22,700 13 9,500 8 13,200 16Tertiary education no degree 2,100 11 1,000 13 1,100 8University degree/diploma/certificate 19,900 3 10,900 3 9,000 4Educated abroad 300 17 300 17 - -Not stated 300 50 100 - 100 67Total 467,700 20 308,400 18 159,200 24
Source: Report on Education Statistics 1990-1991, p. 60-62, which was based on Labor Force Report of 1991.
3.27 To complete the saga of education and poverty, even if poor students enter secondary school, theytend to be tracked to schools that offer shorter hours of instruction and less qualified teachers. As a result,they are less prepared to progress further to the next level. At the same time, their family is less likely to buytextbooks or afford the opportunity cost to keep them in school. Rural students are adversely affected morethan urban students due to greater difficulty in organizing transportation, lesser availability of textbooks, andlesser availability of places in secondary schools. When the disadvantaged students leave school, they have
41
acquired less cognitive skills and are less able to compete in the job market, resulting in higher probability ofunemployment. For women, their child care responsibility becomes a barrier to participation in the labormarket and to income-generating activities. The cycle of poverty is thus perpetuated.
42
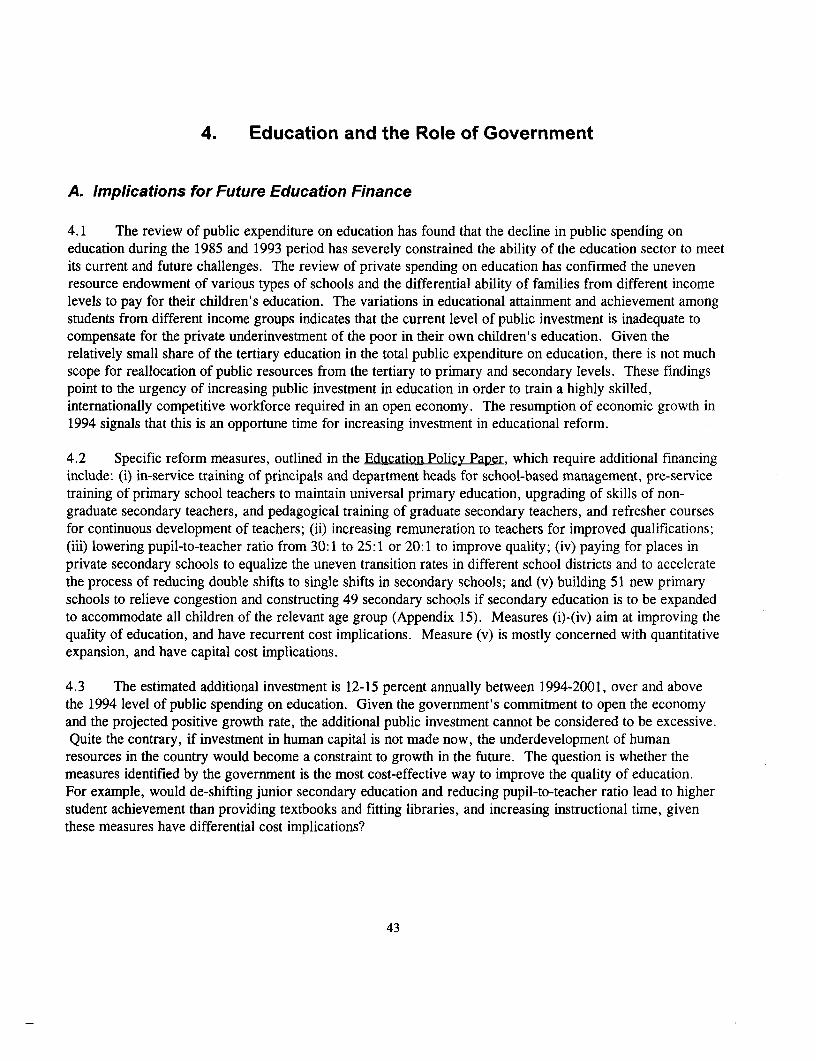
4. Education and the Role of Government
A. Implications for Future Education Finance
4.1 The review of public expenditure on education has found that the decline in public spending oneducation during the 1985 and 1993 period has severely constrained the ability of the education sector to meetits current and future challenges. The review of private spending on education has confirmed the unevenresource endowment of various types of schools and the differential ability of families from different incomelevels to pay for their children's education. The variations in educational attainment and achievement amongstudents from different income groups indicates that the current level of public investment is inadequate tocompensate for the private underinvestment of the poor in their own children' s education. Given therelatively small share of the tertiary education in the total public expenditure on education, there is not muchscope for reallocation of public resources from the tertiary to primary and secondary levels. These findingspoint to the urgency of increasing public investment in education in order to train a highly skilled,internationally competitive workforce required in an open economy. The resumption of economic growth in1994 signals that this is an opportune time for increasing investment in educational reform.
4.2 Specific reform measures, outlined in the Education Policy Paper, which require additional financinginclude: (i) in-service training of principals and department heads for school-based management, pre-servicetraining of primary school teachers to maintain universal primary education, upgrading of skills of non-graduate secondary teachers, and pedagogical training of graduate secondary teachers, and refresher coursesfor continuous development of teachers; (ii) increasing remuneration to teachers for improved qualifications;(iii) lowering pupil-to-teacher ratio from 30:1 to 25:1 or 20:1 to improve quality; (iv) paying for places inprivate secondary schools to equalize the uneven transition rates in different school districts and to acceleratethe process of reducing double shifts to single shifts in secondary schools; and (v) building 51 new primaryschools to relieve congestion and constructing 49 secondary schools if secondary education is to be expandedto accommodate all children of the relevant age group (Appendix 15). Measures (i)-(iv) aim at improving thequality of education, and have recurrent cost implications. Measure (v) is mostly concerned with quantitativeexpansion, and have capital cost implications.
4.3 The estimated additional investment is 12-15 percent annually between 1994-2001, over and abovethe 1994 level of public spending on education. Given the government's commitment to open the economyand the projected positive growth rate, the additional public investment cannot be considered to be excessive.Quite the contrary, if investment in human capital is not made now, the underdevelopment of human
resources in the country would become a constraint to growth in the future. The question is whether themeasures identified by the government is the most cost-effective way to improve the quality of education.For example, would de-shifting junior secondary education and reducing pupil-to-teacher ratio lead to higherstudent achievement than providing textbooks and fitting libraries, and increasing instructional time, giventhese measures have differential cost implications?
43
B. Policy Options for Qualitative Improvement
4.4 Research findings. These questions cannot be answered with a high degree of certainty for T&Tbecause cost-effectiveness of a particular intervention is country-specific, and can only be measured by quasi-experimental studies by comparing learning gains of students in experimental and control groups. However,the findings of research on the determinants of achievement based on the data from the IEA Reading LiteracyStudy has some instructive value. The variables which had a statistical significant relationship with readingachievement were, besides school type, special teachers, class materials, parental cooperation, number oflibrary books per student, teachers' years of post-secondary education, principals' years of experience,percentage of student absenteeism, percentage of full-time female teachers, and teachers' years of teachingexperience. A change in one unit of each one of these inputs is associated with a corresponding change in thetest scores. The effects of these inputs were in the order of their presentation. In other words, the findingsconfirmed the importance of all of the policy variables in making a difference in achievement (Wu and Hua).
These findings on T&T are echoed by other research on the determinants of effective learning .Figure 13 provides a summary of these studies.
Figure 13. Determinants of Effective Learning at Primary Level
A 90
., 70 6
~ 0501
W~401:10U)20_'CU IIII 1
X 10 Libraries Instructional Homework Textbooks Teacher Teacher Laboratories Teacher Class sizetime knowledge experience salary
School Input
44
4.5 Policy instruments to improve learning generally can be grouped into five categories: (i) provision ofinstructional materials and facilities (such as textbooks, libraries, and laboratories); (ii) increasing theopportunity to learn through increasing instructional time and homework; (iii) provision of teacher training;(iv) increasing teachers' salaries; (v) and reducing class size. As can be seen from Figure 5, providing schoollibraries is found to be cost-effective in nearly 90 percent of the studies, and increasing instructional time(such as lengthening the school day or providing additional instruction in a certain subject) almost equallyeffective. Asking students to do homework comes third, and provision of textbooks to children who do nothave them comes fourth. Improving teachers' knowledge through training is found to be effective themajority of the cases, and having experience teachers also come close. However, provision of laboratories,increasing teacher salaries, and reducing class size are found to be effective in less than 40 percent of thecases (World Bank, 1995; Lockheed and Verspoor, 1991; Harbison and Hanushek, 1992; Postlethwaite andRoss, 1989; Warwick and Reimers; Tatoo, et. al. 1989; Fuller and Clarke, 1994). Policy makers are welladvised to take note of these findings before committing resources to interventions which are least cost-effective but have enormous recurrent cost implications.
4.6 Libraries and Instructional materials. Given the importance of libraries in facilitating learning, thegovernment is going in the right direction in providing school libraries. Also, given the importance oftextbooks to learning, and since over 30 percent of students in the lowest quintile lack books, the eliminationof textbook subsidies in 1988 was misguided Building up the school library and providing book grants aretwo areas where the government can act effectively.
4.7 Instructional time. T&T now has 195 school days per school year and 897 hours of instruction forprimary education (UNESCO, 1994, p. 133-134). While within the norms of neighboring Venezuela,'7 whichhas 180 days and 900 hours of instruction per school year, they are lower than East Asian countries such asSouth Korea which has 204 days and 980 hours, and Malaysia, which has 210 days and 1,008 hours. Toimprove overall achievement of students in the country, it is advisable for the authorities to increase theschool days or instructional hours. This will provide more opportunity to learn and to solidify what has beentaught. Extending the number of school days or instructional hours would have resource implications.However, the Education Policy Paper recommends increasing teachers' salaries as an incentive for acquiringbetter qualifications. If this is to be implemented, the reward for longer school days and instruction hoursshould be included as part of the reward.
4.8 Most primary schools operate on the same duration, but great variation comes in the secondaryschool. Twenty of 24 junior secondary schools operate on double shifts with reduced school hours. Thiscould be one of the reasons for lower achievement among junior secondary school students. The EducationPolicy Paper explicitly recognizes the shorter hours offered in junior secondary schools as a problem andtalks of deshifting as a remedy. However, the resource implications should be evaluated against the potentialgains in academic achievements. Available international evidence does not find any negative impact ofdouble-shift schooling, provided that the hours of instruction have been adequate (Bray, 1992). Given that theeducation system will be hard press to maintain the current transition rates for secondary education in face ofan increase in the 12-to-16 age cohort into the first decade of the 21st century, it is advisable that juniorsecondary education remains on a double-shift basis but extending the number of school days into the summervacation or on weekends. In this way, the hours of instruction can be extended for each shift while therequired capital investments can be made to construct, extend, and refurbish buildings and facilities to
17Venezuelan students performed poorer than T&T students in the same international study.
45
accommodate the additional students . Students and teachers can also alternate between morning andafternoon shifts every other year to mitigate the tracking problem whereby the poorest students and teachershave to go to the afternoon shift.
4.9 Teacher training is an area that requires special attention if quality of education is to be raised, aneed explicitly acknowledged in the Education Policy Paper. The high unit cost of Teachers' College raisesthe question as to the cost-effectiveness of the current form of pre-service teacher training. Therefore, thechallenge is not to provide more pre-service training of the same kind, but to find a cost-effective way tosupport teachers on their job. Also, the fact that schools which have more teachers with university degreeshave higher performance indicate that teachers' knowledge of their subject matter is critical to improvestudent learning. Thus, pedagogical training must be accompanied by a strong academic training of teachers.How teacher training can be done cost-effectively requires further research and careful thinking. Oneexample is the publication and distribution of teachers' guides that provides concrete support for instruction.Another is to make use of education technology and the mass media to provide information to a massaudience of students, parents, and teachers.
4.10 The Education Policy Paper also advocates the reduction of pupil-to-teacher ratio from 30:1 to 25:1or 20:1 as a means to improve quality. Ironically, this policy variable, however, has found to be the leastcost-effective, and T&T's ratios compare very favorably with other countries. For example, even today infast-growing South Korea and Taiwan, the ratio is about 40 students to a teacher. In T&T, the apparentcorrelation between pupil-to-teacher ratio and student achievement might be spurious--better students aretracked into schools which are better resourced. Before measures are taken in this respect, it is advisable totake into account three issues. First, given the rigidity in the redeployment and dismissal of teachers, themagnitude of expanding the teaching force in the government's proposal will have serious long-termimplications for the recurrent expenditure on education. Any step in this direction must take the demographictrends into account. Given the projected decline in the under-10 school-age population, even if the currentnumber of teachers remained unchanged, declining enrollment in lower primary education will lead to adecline in the pupil-to-teacher ratio. In the secondary level, given the projected high growth rates the school-age population, the challenge is to keep up the supply of teachers, not to reduce the pupil-to-teacher ratio.Moreover, it is not the pupil-to-teacher ratio per se that will affect quality, but the training and the skill mixof teachers that is important. Consideration should be given on how best to educate, upgrade, and retainmathematics and science teachers at all levels, because these skills are also sought after by other occupations,and yet they are critical to facilitating the improvement of the competitiveness of the workforce.
4.11 Physical conditions of schools. A related issue is overcrowding classroom, and poor acoustic andlighting conditions. Many primary school building are a structure without permanent partitions forclassrooms. Classes are separated by mobile screens. The noise level within each building is extremely high,rendering it difficult for children to listen. Improvement of the physical arrangement of classrooms mightlead to effective learning. However, renovation would require high capital spending, and improvement canonly be gradual. It is advisable that this factor be taken into account when building new schools.
4.12 Early Childhood Education. Not mentioned above in the brief review of cost-effectiveness studies isthe value of early childhood education, which has been found to enhance school readiness. To provide a levelplaying field for the poor, it is desirable to target children in the first quintile for assistance. The use of acompensatory voucher to enable poor households to pursue pre-school education might give poor children ahead start. At the same time, infant classes offered in primary schools should be closely scrutinized to ensurethat they offer active, high quality kindergarten education. Furthermore, the provision of child care wouldenable women to work to generate income for their families.
46
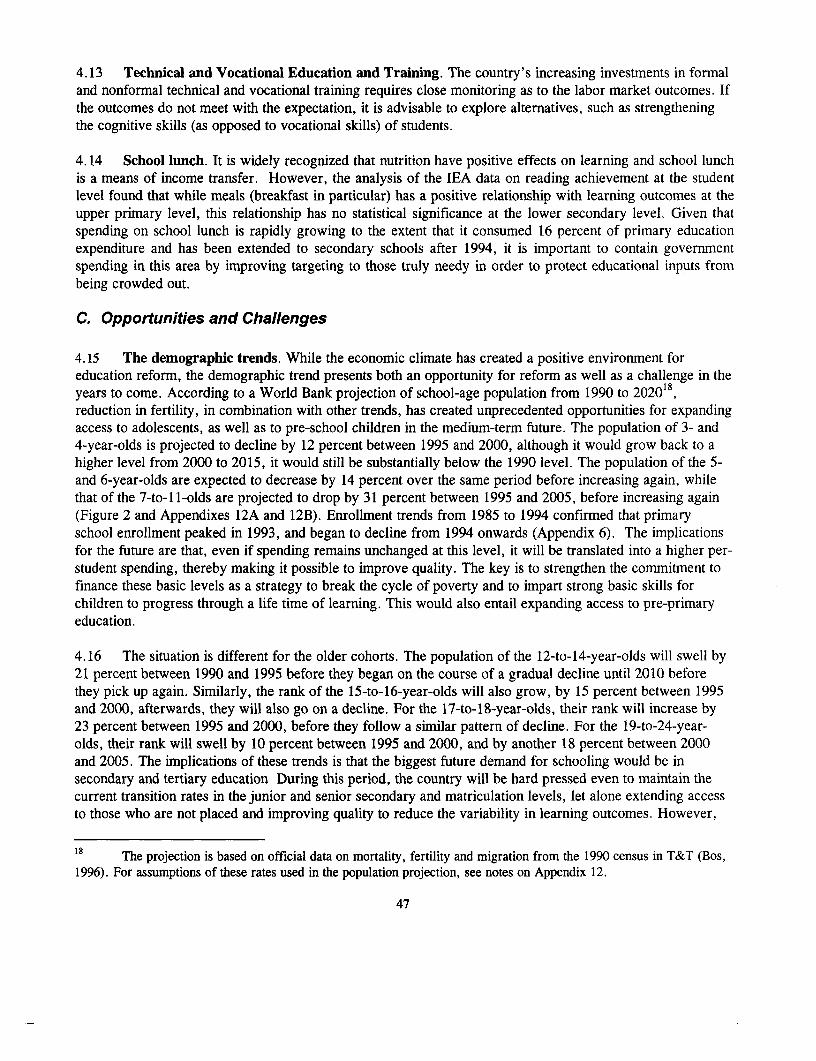
4.13 Technical and Vocational Education and Training. The country's increasing investments in formaland nonformal technical and vocational training requires close monitoring as to the labor market outcomes. Ifthe outcomes do not meet with the expectation, it is advisable to explore alternatives, such as strengtheningthe cognitive skills (as opposed to vocational skills) of students.
4.14 School lunch. It is widely recognized that nutrition have positive effects on learning and school lunchis a means of income transfer. However, the analysis of the IEA data on reading achievement at the studentlevel found that while meals (breakfast in particular) has a positive relationship with learning outcomes at theupper primary level, this relationship has no statistical significance at the lower secondary level. Given thatspending on school lunch is rapidly growing to the extent that it consumed 16 percent of primnary educationexpenditure and has been extended to secondary schools after 1994, it is important to contain governmnentspending in this area by improving targeting to those truly needy in order to protect educational inputs frombeing crowded out.
C. Opportunities and Challenges
4.15 The demographic trends. While the economic climate has created a positive environment foreducation reform, the demographic trend presents both an opportunity for reform as well as a challenge in theyears to come. According to a World Bank projection of school-age population from 1990 to 2020",reduction in fertility, in combination with other trends, has created unprecedented opportunities for expandingaccess to adolescents, as well as to pre-school children in the medium-term future. The population of 3- and4-year-olds is projected to decline by 12 percent between 1995 and 2000, although it would grow back to ahigher level from 2000 to 2015, it would still be substantially below the 1990 level. The population of the 5-and 6-year-olds are expected to decrease by 14 percent over the same period before increasing again, whilethat of the 7-to-i 1-olds are projected to drop by 31 percent between 1995 and 2005, before increasing again(Figure 2 and Appendixes 12A and 12B). Enrollment trends from 1985 to 1994 confirmed that primaryschool enrollment peaked in 1993, and began to decline from 1994 onwards (Appendix 6). The implicationsfor the future are that, even if spending remains unchanged at this level, it will be translated into a higher per-student spending, thereby making it possible to improve quality. The key is to strengthen the commitment tofinance these basic levels as a strategy to break the cycle of poverty and to impart strong basic skills forchildren to progress through a life time of learning. This would also entail expanding access to pre-primaryeducation.
4.16 The situation is different for the older cohorts. The population of the 12-to-14-year-olds will swell by21 percent between 1990 and 1995 before they began on the course of a gradual decline until 2010 beforethey pick up again. Similarly, the rank of the 15-to-16-year-olds will also grow, by 15 percent between 1995and 2000, afterwards, they will also go on a decline. For the 17-to-18-year-olds, their rank will increase by23 percent between 1995 and 2000, before they follow a similar pattern of decline. For the 19-to-24-year-olds, their rank will swell by 10 percent between 1995 and 2000, and by another 18 percent between 2000and 2005. The implications of these trends is that the biggest future demand for schooling would be insecondary and tertiary education During this period, the country will be hard pressed even to maintain thecurrent transition rates in the junior and senior secondary and matriculation levels, let alone extending accessto those who are not placed and improving quality to reduce the variability in learning outcomes. However,
1 8 The projection is based on official data on mortality, fertility and migration from the 1990 census in T&T (Bos,
1996). For assumptions of these rates used in the population projection, see notes on Appendix 12.
47
the first decade of the 21st century presents such an opportunity as this cohort will shrink. This is the periodfor universalizing junior secondary education, with a view towards extending towards higher levelsprogressively. Preparation for these undertakings should begin without delay.
4.17 Implications for Financing. If the target is to attain universal junior secondary within the next tenyears, additional resources has to be drawn on to finance the expansion. Various studies have found thatstudents from the middle- and upper-income groups are overwhelmingly represented in senior secondaryeducation and tertiary education. To ensure that children in the lower end of the income distribution have anequal opportunity for junior secondary education, charging tuition fees at upper secondary level would relievethe resource constraint.
4.18 Currently, about 32,000 students enroll in Forms 4 to Upper Six. If they are asked to pay the sameamount of tuition fees as a private school student, which is $1,000 per year, this would amount toTT$32,000,000, or equivalent to 12 percent of the secondary education expenditure. If they pay half of this,it would be equivalent to 6 percent of the secondary education expenditure. The recovered cost can well beused to finance expansion or qualitative improvement of education. If tuition fees are charged in publiclyfunded schools, scholarships and grants targeted at low-income students should be made available to thequalified students to ensure that they are not denied access on the basis of their ability to pay.
4.19 The current enrollment rate in higher education is low by both regional and world standards, givenT&T's income level. Expanding secondary education will stimulate the demand for better trained teachers,thereby putting pressure on university. Expanding enrollment in higher education on one hand will haveadditional resource implication. However, if existing facilities and faculty members still have excess capacity,expanding higher education will help reduce the high unit cost in this sector, if cost recovery, ex post or exante, is pursued simultaneously.
4.20 In summary, the demographic trend presents the opportunity for reform. The challenge is how tofinance quantitative expansion and qualitative improvement in a cost-effective manner. Instituting costrecovery at the senior secondary level is justifiable on grounds of equity, efficiency, and quality. However,the political economy of implementing cost recovery calls for a prudent approach. Public support for costrecovery must be mobilized first, and this entails widely publicizing the social cost, benefits, and imperativesfor cost sharing in pursuit of a common goal. As the future generation will have to assume the financialobligations committed by this generation, it is imperative that they be endowed with knowledge and skills toensure their survival in an increasingly competitive world.
48
Fig. 14 Projection of School-Age Population between 1990 and 2020 in Trinidad and Tobago
180
t24160 -------------------
.
140----------------
12 to 14~~~~~~~~~~~~~~~~~~~~~~~~~~~-*-3t
17 to 18~~~~~~~~~~~~~~~~-U 7 o1
40 ---- )-)--- )0 0 0 0 0 0 0 0 0 0 0 0 00---- -----
…(NI (NI NJ (I (N (NI (NI (NI NI (I (N (NI (NJ NI NI N (NI NI 3to(N4(N
3 to 4 ~ --11- Years
REFERENCES AND INFORMATION SOURCES
Central Bank of Trinidad and Tobago. Various months. Monthly Statistical Digest.
Central Statistical Office, Office of the Prime Minister. 1990. Examination Results for Secondary andTertiary Schools. 1986-1988.
. 1993a. Report on Education Statistics 1989-9.
_ . 1993b. The National Income of Trinidad and Tobago 1981-1991.
. 1993c. 1990 Population and Housing Census Institutional Report.
. 1994a. Report on Education Statistics 1990-91.
. 1994b. Economic Indicators, July-December. 1993.
_ . 1994c. Population and Vital Statistics Report 1992.
Chin-Aleong, Maurice. 1992. "Technical/Vocational Education in Trinidad and Tobago - Trends andDirections." Mimeo.
Elley, Warwick B. 1992. How in the World Do Students Read? The International Association for theEvaluation of Educational Achievement. The Hague, Netherlands.
Inter-American Development Bank. 1986. "Trinidad and Tobago Primary Education Program." ProjectReport (TT-0031).
Jules, Vena. 1994. A Study of the Secondary School Population in Trinidad and Tobago: PlacementPatterns and Practices: A Research Report. The Centre for Ethnic Studies, University of West Indies, St.Augustine Campus.
Lundberg, Ingvar and Pirjo Linnakyla. 1992. Teaching Reading Around the World. The InternationalAssociation for the Evaluation of Educational Achievement. The Hague, Netherlands.
Miller, Errol. 1992. Education for All: Caribbean Perspectives and Imperatives. Inter-AmericanDevelopment Bank, January.
Ministry of Education. Government of Trinidad and Tobago. 1992. A Report on the lEA ReadingLiteracy Study Conducted In Trinidad and Tobago, 1989-92.
50
_ . 1994a. Draft Development Programme Estimates 1995 with Projections for 1996 and 1997.
. 1994b. Education Policy Paper (1993-2003). National Task Force on Education (White Paper).
. 1994c. National Assessment Programme. (English). Standard 3.
. 1994d. Primary School Test 1994 Standard One (7+). (Mathematics, LanguageArts/Reading Test).
. 1994e. Primary School Test 1994 Standard Three (9+). (Mathematics, LanguageArts/Reading Test).
- 1994f. Primary School Leaving Certificate Examination 1994. (English Language, EnglishComposition and Comprehension),
. 1994g. Common Entrance Examination March 1994. (Mathematics, Science, English, andSocial Studies).
. 1994h. "Preliminary Analysis of Mathematics, English, and Essay Test Scores byIndividual Schools." Seeparsad, Chief Education Officer.
Ministry of Finance. Republic of Trinidad and Tobago. 1987 to 1994. EEstimates: Details of Estimates of Recurrent Expenditure.
. 1987 to 1994. Estimates of the Expenditure.
. 1994. Review of the Economy 1993.
. 1993. Budget Speech 1994.
and Central Statistical Office. 1992. 1990 Population and Housing Census Listing of AreaRegistr.
Ministry of Planning and Development. 1987 to 1994. Estimates of Development Programme.
_ . 1992. Public Sector Investment Programme 1993. Ministry of Planning and Development.November.
. 1993. Public Sector Investment Programme 1994. Ministry of Planning and Development.November.
. 1992. Medium Term Policy Framework: From Stabilization to Growth 1993-1995.November.
51
_ 1993. "Trinidad and Tobago Survey of Living Conditions: 1992. Report No. 1: SocialIndicators of Living Conditions."
National Insurance Board. The Employer's Guide to National Insurance. Undated.
Schleicher, Andreas and Jean Yip. 1994. "Indicators of Between-School Differences in ReadingAchievement." IEA, Mimeo.
L. J. Schweinhart, H. V. Barnes, and D. P. Weikart, Significant Benefits: The High/Scope PerryPreschool Study Through Age 27. Ypsilanti, MI: High/Scope Press, 1993.
Theaker, John. 1992. Prefeasibility Study of Technical Vocational Education and Training in Trinidad andTobago (IDB Loan No. 550/OC-TT). Revised Mid-Term Report. Vol. 1 -Presentation of Analysis:Findings and Recommendations. Crown Agents. December.
The Public Servant, Special Issue No. 1, 1994 (Civil Servants' Newsletter).
Trinidad Guardian, October 20, 1994 (Newspaper in Trinidad and Tobago).
UNESCO, 1993. World Education Report 1993. Paris: UNESCO.
Wolff, Lawrence, Ernesto Schiefelbein, and Jorge Valenzuela, "Improving the Quality of PrimaryEducation in Latin America and the Caribbean: Toward the 21st Century," World Bank Discussion PaperNo. 257, Washington, D.C, 1994.
World Bank. 1991. Education and Training for Youth Employment Project. Staff Appraisal Report No.9065-TR.
. 1992. Access. Quality and Efficiency in Caribbean Education: A Regional Study. Report No.9753-CRG.
. 1993. The East Asian Miracle: Economic Growth and Public Policy. Oxford UniversityPress.
. 1995. "Country Assistance Strategy: Trinidad and Tobago."
. 1995. "Trinidad and Tobago Basic Education Project." Staff Appraisal Report.
Wu, Kin Bing and Haiyan Hua. "The Deterninants of Achievement in the Upper Primary and LowerSecondary Levels in Trinidad and Tobago." Draft.
52
Statistical Appendix
Appendix 1: GDP (In Million TT$), 1985-94Appendix 2: Central Government Revenue and Expenditure (In Million TT$), 1985-94Appendix 3A: Public Expenditure on Education, 1985-94 (In Million TT$ at Current
Prices)Appendix 3B: Public Expenditure on Education (Percentage of Total of Each Level)Appendix 4: Share of Recurrent and Capital Expenditure on Education by Level,
1985-94Appendix 5: Total Public Expenditure by Level, 1994-95 (In Million Constant 1994
TT$)Appendix 6: Enrollment in Government & Assisted Schools by Level of Education
(Number of Students)Appendix 7: Per-student Recurrent Public Expenditure (In Constant 1994 TT$)Appendix 8: Per-student Recurrent Expenditure as a Percentage of per Capital GDPAppendix 9: Estimate for 1993/94 of Annual Cost of Undergraduate Degree Programs
at St. Augustine Campus, TrinidadAppendix 10: Private School Recurrent Expenditure, 1991Appendix 11: Estimates of Household Spending on Education, 1991 (In Current 1991
TT$)Appendix 12: Projected School-Age Population by Selected Age Range, 1990-2020Appendix 13: Trinidad and Tobago Repetition, Promotion, and Dropout Rates in
Primary EducationAppendix 14: Cohort Flow AnalysisAppendix 15: Recurrent Cost for Expanding Coverage, 1994-2001Appendix 16: Mean Days of Attendance for Persons Attending Full-tirne School (by
gender)Appendix 17: Mean Days of Attendance for Persons Attending Full-time School (by
Urban/Rural areas)Appendix 18: Reasons for Non-Attendance among Primary & Secondary School
Students during the Previous Week (by Urban/Rural Classification)Appendix 19: Reasons for Non-availability of Textbooks among Primary & Secondary
School StudentsAppendix 20: Allocation of Education Budget in Trinidad & Tobago, 1985-1994Appendix 21: Average Score of CXC Examination by Country, 1995Appendix 22: Average Student Ability Scores in the IEA International Study on
Reading Literacy
53
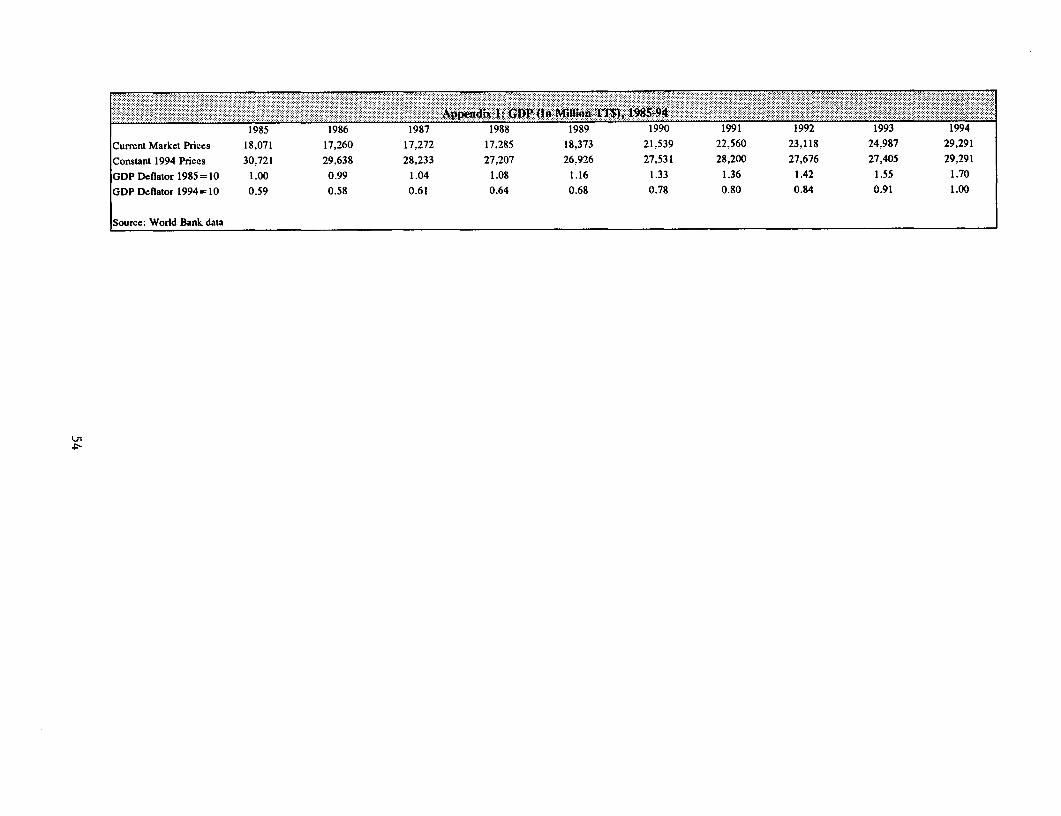
1985 1986 1987 1988 1989 1990 1991 1992 1993 1994
Current Market Prices 18.071 17,260 17,272 17.285 18,373 21.539 22,560 23,118 24,987 29,291
Constant 1994 Prices 30.72 1 29.638 28.233 27,207 26.926 27,531 28.200 27,676 27,405 29,291
GDP Deflator 1985=10 1.00 0.99 1.04 1.08 1.16 1.33 1.36 1.42 1.55 1.70
GDP Deflator 1994= 10 0.59 0.58 0.61 0.64 0.68 0.78 0.80 0.84 0.91 1.00
Source: World Bank data
U,~~~~~~~~~~~~~~~~~~~~~~~~~~~~~~~~~~~~~~~~~~~~~~~~~~~~~~~~~~~~~~~~~~~~~~ .....
.. . . .... . . .
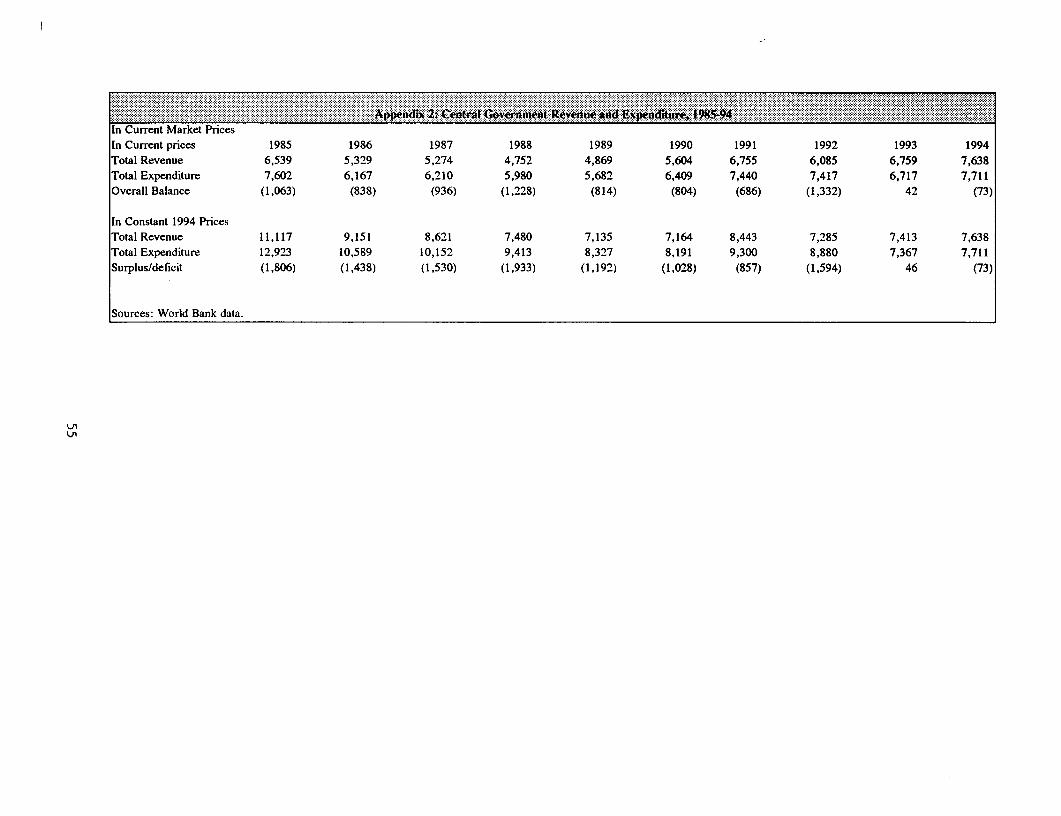
In Current Market PricesIn Cuffent prices 1985 1986 1987 1988 1989 1990 1991 1992 1993 1994Total Revenue 6,539 5,329 5,274 4,752 4,869 5,604 6,755 6,085 6,759 7,638Total Expenditure 7,602 6,167 6,210 5,980 5,682 6,409 7,440 7,417 6,717 7,711OveraIl Balance (1,063) (838) (936) (1,228) (814) (804) (686) (1,332) 42 (73)
In Constant 1994 PricesTotal Revenue 11,117 9,151 8,621 7,480 7,135 7,164 8,443 7,285 7,413 7,638Total Expenditure 12,923 10,589 10,152 9,413 8,327 8,191 9,300 8,880 7,367 7,711Surplus/deficit (1,806) (1,438) (1,530) (1,933) (1,192) (1,028) (857) (1,594) 46 (73)
Sources: World Bank data.
LI
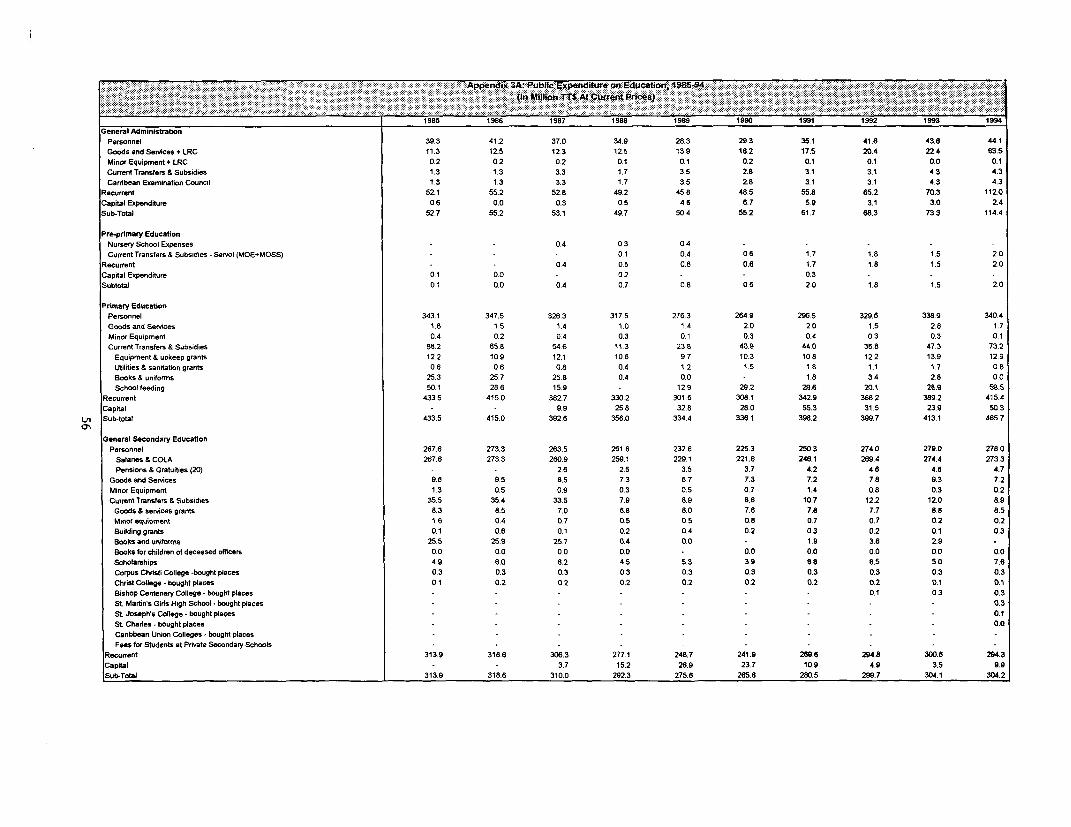
195 1996 1997 1 998 98190911992 1993 19General Administrafon
Personnel 39.3 41.2 37.0 34.9 28.3 29.3 35.1 41.6 43.6 44.1Goods andServices LRC 11.3 12.5 123 12.5 13.9 16.2 17.5 20.4 22.4 63.5Minor Equipment + LRC 0.2 0.2 0.2 0.1 0.1 0.2 0.1 0.1 0.0 0.1Current Transfers & Subsidies 1.3 1.3 3.3 1.7 3.5 2.8 3.1 3.1 4.3 4.3Carribean Examination Council 1 3 1.3 3.3 1.7 3.5 28 3.1 3.1 4.3 4.3
Recurrent 52.1 55.2 52.8 49.2 45.8 48.5 55.8 85.2 70.3 112.0Capital Expenditure 0.6 0.0 0.3 0.5 4.6 6.7 5.9 3.1 3.0 2.4Sub-Total 527 55.2 53.1 49.7 50.4 55.2 61.7 68.3 73.3 114.4
Pre-primary Education
Nursery School Expenses - - 0.4 0.3 04 - --Current Transfers& Subsidies -Servol (MOE-MOSS) - - - 0.1 0.4 0.6 1.7 1.8 1.5 2.0
Recurrent - - 04 0.5 0.8 0.6 1.7 1.8 1.5 2.0Capital Expenditure 0.1 0.0 - 0 2 - - 0.3Subtotal 0 1 0.0 0.4 0.7 0,8 086 20 1.8 1.5 2.0
Primary Education
Personnel 343.1 347.5 3263 3175 2763 264.9 296.5 329.6 338.9 340.4Goods and Services 1.8 15 1.4 1.0 14 2.0 2.0 1.5 2.8 1.7Minor Equipment 04 0.2 04 0.3 0.1 0.3 0.4 0.3 0.3 0.1Current Transfers & Subsidies 88.2 65.8 546 113 238 40.9 44.0 38.8 47.3 73.2
Equipment & upkeep grants 122 10.9 12.1 10.6 97 10.3 10.8 122 13.9 129Ulities & sanitation grants 0.6 0,6 0.8 0.4 1.2 1.5 18' 11 1.7 0.8Books & uniforms 25.3 25.7 25.8 0.4 0.0 - 1.8 3.4 2.8 0.0School feeding 5so.1 28.8 15.9 - 12.9 29.2 29.6 201 2S.9 5W5
Recurrent 4335 4150 382.7 330.2 301.6 308.1 342.9 3682 389.2 415.4Capital - - 9.9 25.8 32.8 28.0 55.3 31.5 23.9 50.3
tU Sub-total 433.5 415.0 392.6 356.0 334.4 336.1 398.2 399.7 413.1 465e7a'
General Secondary EducationPersonnel 267.6 273.3 263.5 261.6 232.6 225.3 250.3 274.0 279.0 278.0
Salanes & COLA 267.6 273.3 260.9 259.1 229.1 221.6 246.1 269.4 274.4 273.3Pensions & Gratuities (20) - - 2.6 2.5 3.5 3.7 4.2 4.6 4.6 4.7
Goods and Services 9.6 9.5 8.5 7.3 6.7 7.3 7.2 7.8 9.3 7.2Minor Equipment 1.3 0.5 0.9 0.3 0.5 0.7 1.4 0.8 0.3 0.2Current Transters & Subsidies 35.5 35.4 33.5 7.9 8.9 8.6 10.7 12.2 12.0 8.9
Goods & services grants 8.3 8.5 7.0 6.8 8.0 7.6 7.8 7.7 8.8 8.5Minor equipment 1.6 0.4 0.7 0.5 0.5 0.8 0.7 0.7 0.2 0.2Building grants 0.1 0.6 0.1 0.2 0.4 0.2 0.3 0.2 0.1 0.3Books and uniforms 25.5 25.9 25.7 0.4 0.0 - 1.9 3.8 2.9Books for children of deceased officers 0.0 0.0 0.0 0.0 - 0.0 0.0 0.0 0.0 0.0Scholarships 4.9 6.0 6.2 4.5 5.3 3.9 6.6 6.5 5.0 7.6Corpus Christ College -bought places 0.3 0.3 0.3 0.3 0.3 0.3 0.3 0.3 0.3 0.3Chrst College - bought places 0.1 0.2 0.2 0.2 0.2 0.2 0.2 0.2 0.1 0.1Bishop Centenary College - bought places - - - - - 0.1 0.3 0.3St. Marbn's Girls High School - bought places - - 0.3St Joseph's College - bought places - 0.1St Charles - bought places - - - 0.0Caribbean Union Colleges - bought placesFees for Students at Private Secondary Schools - - - - - -
Recurrent 313.9 318.6 306.3 2771 248.7 241.9 269.6 294.8 300.6 294.3Capital - - 3.7 1S.2 26.9 23.7 10.9 4.9 3.5 9.9Sub-Total 313.9 318.6 310.0 292.3 275.6 265.6 280.5 299.7 304.1 304.2
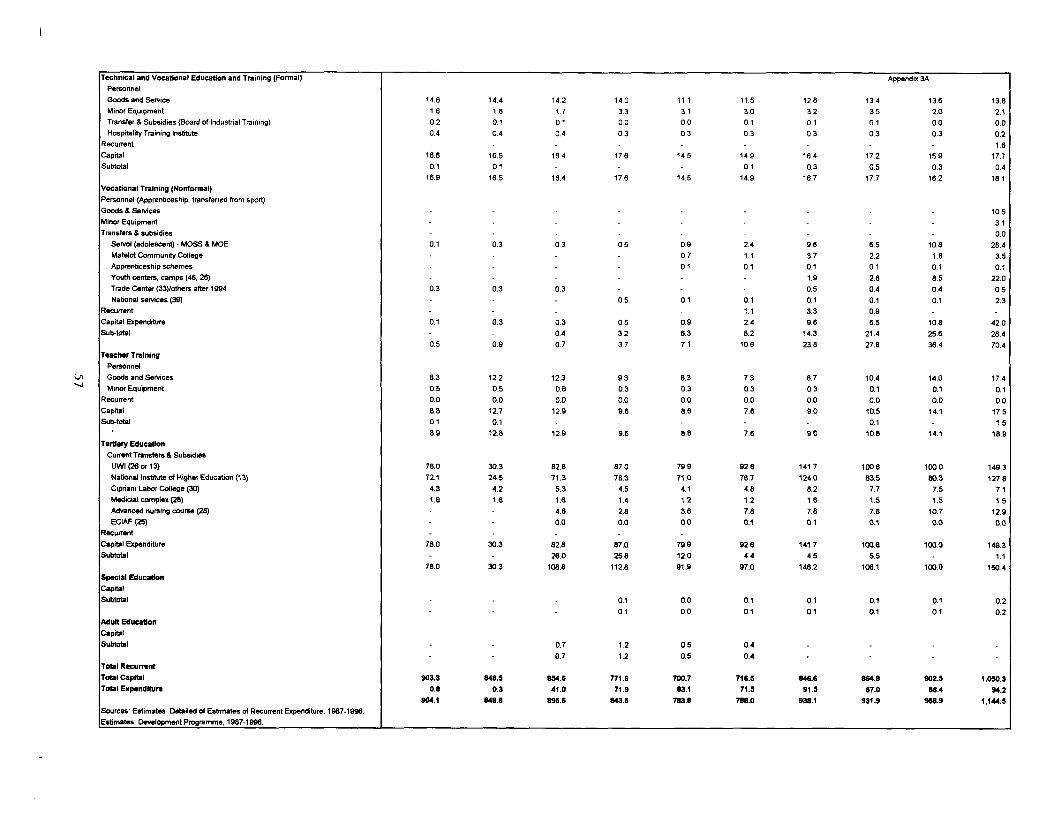
Technical and Vocational Education and Training (Formnal) Appendix 3APersonnelGoods and Service 14.6 14.4 142 140 11 1 115 128 134 13.6 13.8Minor Equipment 16 1f6 17 33 31 30 32 35 20 2.1Transfer & Subsidies (Board of Industrial Training) 0 2 01 01 0.0 0.0 01 01 0.1 0 0 0 0Hosprtality Training Instrtute 0.4 0 4 0. 0 3 0 3 0.3 0 3 0 3 0.3 0.2
Recurrent - - - - - - 1.6Capital 16.6 165 164 176 14.5 14.9 164 17.2 159 177Subtotal 01 01 - - - 01 0 3 0.5 0.3 0.4
16.9 165 16.4 17.6 14.5 14.9 167 177 162 181Vocational Training (Nonformral)Personnel (Apprenticeship, transferred from sport)Goods & Services - - - - - - 10 5Minor Equipment - - - 31Transfers & subsidies - - - - --- - 0.0
Servol (adolescent) - MOSS & MOE 01 0 3 0 3 0.5 0 9 2.4 9 6 6 5 10 8 28.4Matelot Community College - - - - 0.7 1.1 3.7 2.2 1.8 3.5Apprenticeship schemes - - - 01 0.1 01 01 0.1 0.1Youth centers, camps (46, 26) - - - 1.9 2.8 8.5 22.0Trade Center (33)/others after 1994 0.3 0.3 0.3 - - - 0.5 0 4 0 4 0 5Nabonal services (39) - - - 05 01 0.1 0.1 0.1 0.1 2.3
Recurrent - - - - 1.1 3.3 09Capital Expenditure 0.1 0.3 0.3 05 0.9 2.4 96 65 108 42.0Sub-total - - 0.4 3 2 6 3 8.2 14.3 21.4 25.6 28.4
0.5 0.9 0.7 3 7 71 10 6 23 8 27.8 36.4 70 4Teacher Training
PersonnelLbn Goods and Services 83 12.2 123 9.3 8.3 73 87 104 140 17.4
Minor Equipment 05 05 0.6 0.3 0.3 03 0.3 0.1 0.1 0.1Recurrent 0.0 0.0 0.0 0.0 0.0 0.0 0 0 0.0 0.0 0 0Capital 8.8 12.7 129 96 88 7.6 9.0 105 14.1 17.5Sub-total 01 0.1 - - - - - 0.1 - 1.5
8.9 12.8 12.9 9.6 8.8 7.6 9 0 108 14.1 18.9Tertiary Education
Current Transfers & SubsidiesUWI (26 or 13) 78.0 30.3 82.8 87.0 79.9 92.8 141 7 100.8 1000 149.3National Institute of Higher Education (13) 721 24.5 71.3 78.3 71.0 76.7 124.0 83.5 80.3 127.8Cipriani Labor College (30) 4.3 4.2 5.3 4.5 4.1 4.8 8.2 7.7 7.5 7.1Medicial complex (28) 1.6 16 16 1.4 1.2 1.2 1.6 1.5 1.5 1.5Advanced nursing course (28) 4.6 2.8 3.8 7.8 7.8 7 8 10.7 12.9ECIAF (25) - - 0.0 0.0 0 0 0.1 0.1 0.1 0.0 0.0
RecurrentCapital Expenditure 78.0 30.3 82.8 87.0 79.9 92.6 141.7 100.6 100.0 149.3Subtotal - - 26.0 25.8 12.0 4.4 4.5 5.5 - 1.1
78.0 30.3 108.8 112.8 91.9 97.0 148.2 106.1 100.0 150.4Special EducatonCaptalSubtoal - - - 0.1 0.0 0.1 0.1 0.1 0.1 0.2
- - - 01 0.0 01 0.1 0.1 01 0.2Adult EducationCapitalSubtotal - - 0.7 1.2 0.5 0.4 - - -
- - 0.7 1.2 0.5 0.4 - -Total RecurrentTotl Capttal 903.3 848.5 854.6 771.6 700.7 716.5 846.6 864.8 902.5 1,050.3Total Expenditur 0.8 0.3 41.0 71.9 83.1 71.5 81.5 67.0 56.4 94.2
904.1 848.8 895.6 843.5 783.8 788.0 938.1 931.9 958.9 1,144.5Sources Estimates Detailed of Estimates of Recurrent Expenditure, 1987-1996.Estimates: Development Programme, 1987-1996.
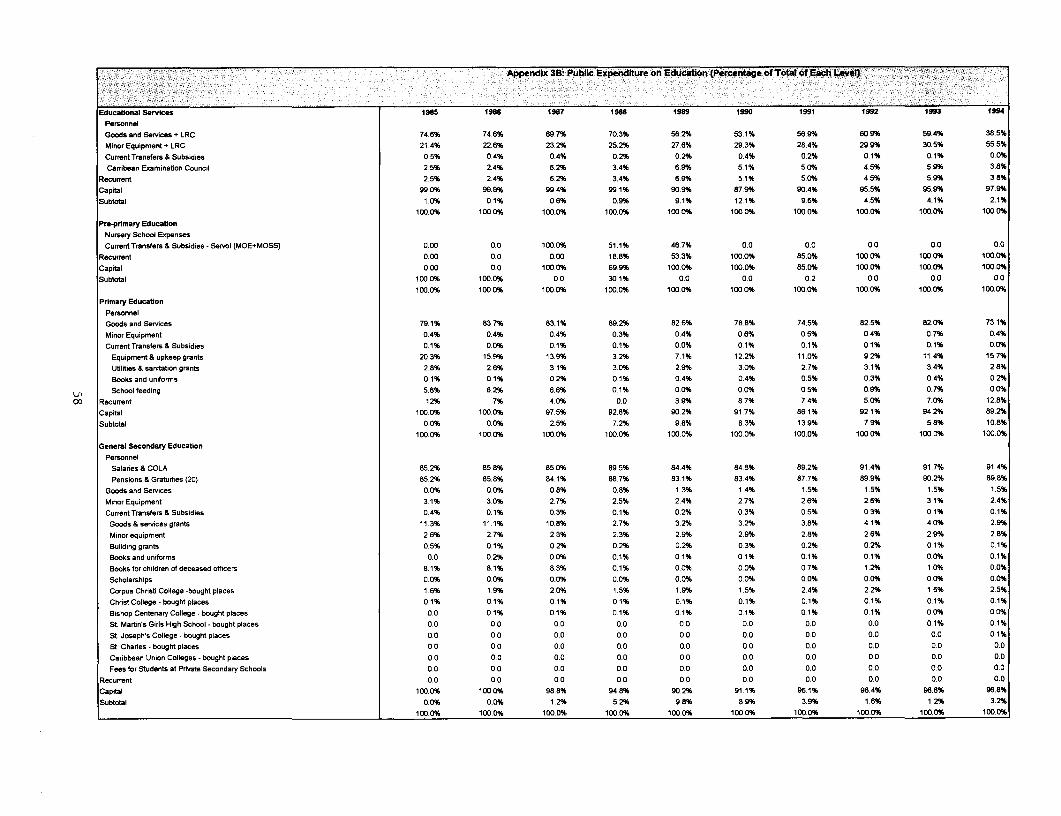
~'~Appendix 38: Public Expendfture'on Educto Pec ae ofTtlo 0W Each evel
Educational ServIces 1985 11986 1987 1988 1989 1990 11991 1992 1993 1994
PersonnelGoods and Services +LRC 74,6% 74.8% 69 7% 70.3% 56.2% 53.1% 56.9% WV9% 59.4% 38.5%Minor Equipment + LRC 21+4% 226% 23,2% 25.2% 27.6% 29.3% 26.4% 29.9% 30.5% 55 5%
Current Transfers & Subsidies 0~5% 0.4% 0.4% 0,2% 0~2% 0O4% 0.2% 01% 0.1% 0,0%
Carribean Examination Council 2.5% 2.4% 62% 34% 6.9% 5.1% 5.0% 4.5% 5,9% 38%
Recurrent 2.5% 24% 6.2% 3.4% 6.9% 5.1% 5.0% 4 5% 5.9% 3 8%
Capital 99.0% 99.9% 99.4% 99.1% 90.9% 87.9% 90,4% 95.5% 95.9% 97.9%
Subtotal 1 0% 0,1% 0+6% 0.9% 9.1% 12.1% 9.6% 4.5% 4.1% 2.1%19000% 100.0% 10&0(% 100.0% 100.0% 1000(% 100.0% 100,0% 100&0% 100.0%
Pro-primary EducationNursery School ExpensesCurrent Transfems& Subsidies - Servol (MOEvMOSS) 0~00 0.0 100.0% 51.1% 46.7% 0.0 0.0 0.0 0.0 0+0
Recurrent 0.00 0~0 0.00 18.6% 53.3% 100.0% 85.0% 100.0% 100.0% 100.0%
Capital 0+00 0~0 100.0% 69.9% 100.0% 100.0% 65.0% 100,0% 100.0% 100.0%Subtotal 1000% 100.0% 0~0 301% 0.0 0.0 0.2 0.0 0.0 0+0
100.0% 100 0% 100.0% 100.0% 100.0% 100,0% 100.0% 100.0% 100,0% 100.0%
Primary EducationPersonnelGoods and Services 79.1% 63 7% 83.1% 89.2% 826% 78.8% 74.5% 62.5% 82.0% 73.1%
Minor Equipment 0+4% 0.4% 0.4% 03% 0.4% 0.6% 0.5% 0.4% 0 7% 0.4%Current Transfers & Subsidies 0.1% 0.0% 0.1% 0.1% 0.0% 0.1% 0.1% 01% 0.1% 0.0%
Equipment & upkeep grants 20 3% 15SP% 13.9% 3,2% 7,1% 12.2% 11.0% 92% 11.4% 15.7%
Utilities & sanitation grants 2.8% 2.6% 3,1% 3.0% 2.9% 30% 27% 3.1% 34% 28%
Books and uniforms 0.1% 0.1% 0.2% 0.1% 0,4% 0.4% 0 5% 0.3% 0.4% 0.2%
a School feeding 5.6% 6.2% 6.6% 0,1% 0.0% 0.0% 0.5% 0.9% 0.7% 0.0%()f Recurrent 12% 7% 4~0% 0.0 3.9% 6.7% 7.4% 5.0% 7O% 1268%
Capital 100.0% 100+0% 97.5% 928% 90.2% 91.7% 8661% 921% 94,2% 89.2%
Subtotal 0,0% 0.0% 2.5% 7.2% 9.8% 83% 13 9% 7.9% 5.8% 10,8%
100.0% 100.0% 1000% 100.0% 100,0% 100~0% 100.0% 100,0% 1000% 100+0%General Secondary Education
PersonnelSalaries & COLA 85.2% 85,8% 85.0% 895% 84.4% 84.8% 892% 91.4% 91.7% 91.4%
Pensions & Gratuities (20) 85,2% 85.8% 84.1% 88.7% 83.1% 83.4% 87.7% 89.9% 90.2% 89.8%
Goods and Services 0.0% 0.0% 0+8% 0.8% 1.3% 1.4% 1 5% 1.5% 1.5% 1.5%
Minor Equipment 31% 30% 2.7% 2.5% 2.4% 2.7% 2.6% 2,6% 3.1% 2.4%Current Transfers & Subsidies 04% 0.1% 03% 01% 0.2% 0.3% 0~5% 0.3% 0.1% 0,1%
Goods & services grants 11.3% 111% 10.8% 2.7% 322% 32% 3.8% 4,1% 4.0% 2.9%
Minor equipment 2,6% 2.7% 2+3% 2.3% 29% 2.9% 2,8% 2.6% 2.9% 2.8%
Building grants 0.5% 0.1% 0.2% 0.2% 0.2% 0.3% 0.2% 0.2% 0 1% 01%
Books and uniforms 0.0 0.2% 0.0% 0.1% 0.1% 0,1% 0.1% 01% 00(% 0.1%
Books for children of deceased officers 81% 8.1% 8.3% 01% 0,0% 00(% 07% 1.2% 1.0% 0.0%
Scholarshiips 0.0% 0~0% 00(% 0.0% 0.0% 0~0% 0.0% 0.0% 0.0% 0.0%
Corpus ChristiCollege -bought places 1.6% 1.9% 2.0% 1.5% 1,9% 1.5% 2.4% 2,2% 1.6% 2.5%
Christ College -bought places 01% 0.1% 0.1% 0+1% 0.1% 0.1% 0 1% 0.1% 0.1% 01%
Bishop Centenary College - bought places 00 0.1% 01% 01% 0.1% 01% 01% 0.1% 0~0% 0.0%
St. Martin's Girls High School - bought places 0.0 00 0.0 0.0 0.0 0.0 0.0 0.0 0.1% 0.1%
St Joseph's College - bought places 0.0 0.0 0.0 0.0 0 0 0.0 0.0 0.0 0.0 01%
St. Charles - bought places 0,0 0.0 0.0 0.0 0.0 0 0 0.0 0.0 0.0 0.0
Caribbean Union Colleges - bought places 0.0 0.0 0.0 0.0 0.0 0.0 0.0 0.0 0.0 0.0
Fees for Students at Private Secondary Schools 0.0 0.0 0.0 0.0 0.0 0.0 0.0 0.0 0.0 0.0Recurrent 0.0 0.0 0,0 0.0 0.0 0~0 0.0 0.0 0.0 0.0
Capital 100.0% 100,0% 98.8% 94.8% 902% 91.1% 96,1% WA4% 98.8% 96.8%
Subtotal 0,0% 0.0% 1.2% 5.2% 9.8% 8.9% 3.9% 1.6% 1 2% 3.2%
100.0% 100,0% 1000(% 100.0% 100.0% 1000% 100.0% 100.0% 100.0% 100.0%
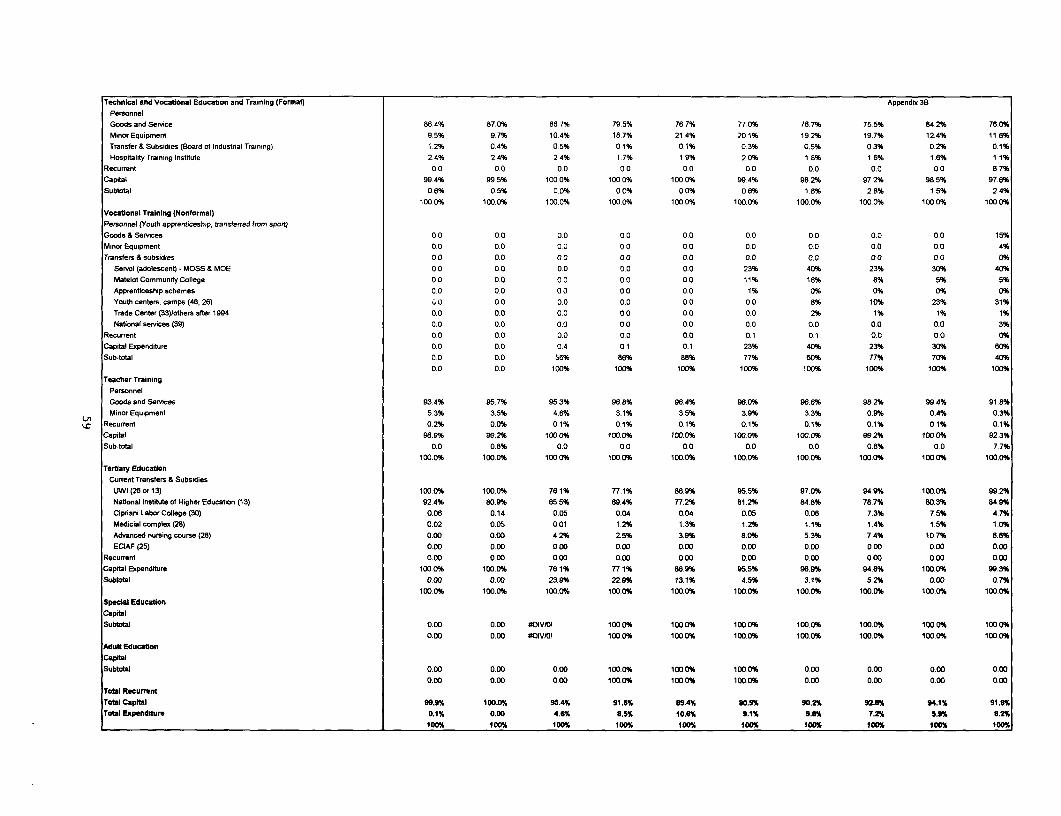
Technical and Vocaional Educabon and Training (Formal) Appendix 3BPersonnelGoods and Servce 86 4% 87 0% 86 7% 79.5% 76 7% 77 0% 76.7% 75 5% 84 2% 7680%Minor Equipment 95% 97% 104% 187% 214% 201% 192% 197% 12.4% 116%Transfer & Subsidies (Board of Industrial Training) 12% 0.4% 0 5% 01% 01% 0 3% 0.5% 0 3% 0.2% 01%Hospitality Training Institute 24% 24% 24% 17% 19% 2.0% 18% 16% 16% 11%
Recurrent 00 0.0 00 00 0.0 00 00 0.0 00 8 7%Capital 994% 995% 1000% 1000% 100.0% 99.4% 982% 972% 98.5% 97.6%Subtotal 0 6% 0 5% 0 0% 0.0% 0 0% 0 6% 18% 2 8% 15% 2.4%
1000% 100.0% 100.0% 100.0% 1000% 100.0% 1000% 1000% 1000% 100,0%
Vocational Training (Nonfornal)Personnel (Youth apprenbceship, transferred from sport)Goods & Services 00 00 00 00 00 00 0.0 0.0 0.0 15%
Minor Equipment 0 0 0.0 0 0 0 0 0 0 0 0 0 0 0.0 0 0 4%Transfers & subsidies 0 0 0 0 0.0 0 0 0.0 0.0 0.0 00 0a 0%
Servol (adolescent) - MOSS & MOE 00 00 0 0 0.0 0.0 23% 40% 23% 30% 40%Matelot Community College 00 0.0 00 0.0 00 11% 16% 8% 5% 5%Apprenticeship schemes 0 0 00 0 0 00 0.0 1% 0% 0% 0% 0%Youth centers, camps (4, 26) 010 0.0 00 0.0 0.0 00 8% 10% 23% 31%Trade Center (33)/others after 1994 0.0 0.0 00 00 00 0.0 2% 1% 1% 1%National semces (39) 0 0 0 0 0.0 0.0 0.0 0 0 0 0 0 0 0.0 3%
Recurent 0 0 0.0 0.0 0 0 0.0 01 0.1 0.0 0 0 0%Capital Expenditure 00 0.0 04 0.1 0.1 23% 40% 23% 30% B0%Sub-total 0 0 0.0 56% 86% 88% 77% 60% 77% 70% 40%
0.0 0.0 100% 100% 100% 100% 100% 100% 100% 100%Teacher Training
PersonnelGoods and Serrvces 93.4% 95.7% 953% 968% 96.4% 96.0% 96.8% 982% 994% 918%Minor Equipment 5 3% 3.5% 4 6% 3.1% 3.5% 3 9% 3 3% 0.9% 0.4% 0 3%
x Recurrent 0.2% 0.0% 01% 01% 01% 01% 0,1% 01% 01% 01%Capital 98.9% 99.2% 1000% 100.0% 100.0% 100.0% 100.0% 992% 100.0% 923%Sub-total 00 0.8% 0.0 0.0 00 00 0.0 0.8% 0.0 7.7%
100.0% 1000% 100.0% 100.0% 100.0% 100.0% 100.0% 1000% 1000% 100.0%Tertiary Educaton
Current Transfers & SubsidiesUWI (28 or 13) 100.0% 100.0% 76.1% 771% 86.9% 955% 97.0% 94.9% 100.0% 99.2%National Instute of Higher Education (13) 92.4% 80.9% 65.5% b9.4% 77 2% 81.2% 84.8% 78.7% 80.3% 84.9%Cipiani Labor College (30) 0.06 0.14 0.05 0.04 004 0.05 0.06 7.3% 7.5% 4.7%Medicial complex (28) 0.02 0.05 0 01 1.2% 1.3% 1.2% 11% 1.4% 1.5% 10%Advanced nursing course (28) 0.00 0.00 42% 2.5% 39% 8.0% 5.3% 7.4% 10.7% 8.8%ECIAF (25) 0.00 0.00 0.00 0.00 0e00 0.00 0o00 0o00 0.00 o.o
Recurrent 0.00 0.00 0.00 0,00 0.00 0.00 0.00 0.00 0.00 0.00Capital Expenditure 1000% 100.0% 76.1% 77 1% 869% 95.5% 989% 94.8% 1000% 99.3%Subtotal 0.00 0.00 23.9% 22.9% 13.1% 4.5% 31% 5.2% 0.00 0.7%
100 0% 100.0% 100.0% 100.0% 100.0% 100.0% 1000% 100.0% 100.0% 100.0%Special EducatonCapitalSubtotal 0.00 0.00 ODIV01 100.0% 100.0% 100.0% 100.0% 100.0% 1000% 1000%
0.00 0.00 #DIV/0I 100.0% 100.0% 100.0% 1000% 100.0% 1000% 100.0%Adult EducationCapitalSubtotal 0.00 0.00 0.00 100.0% 100.0% 100.0% 0.00 0.00 0.00 000
0.00 0 00 0.00 100.0% 100.0% 100.0% 0.00 0.00 0.00 0.00Total RecurretrTotal CapItal 99.9% 100.0% 95.4% 91.5% 89.4% 90.9% 90.2% 92.0% 94.1% 91.9%Total Expendltur 0.1% 0.00 4.6% 8.5% 10.6% 9.1% 9.6% 7.2% 5.9% 8.2%
100% 100% 100% 100% 100% 100% 100% 100% 100% 100%
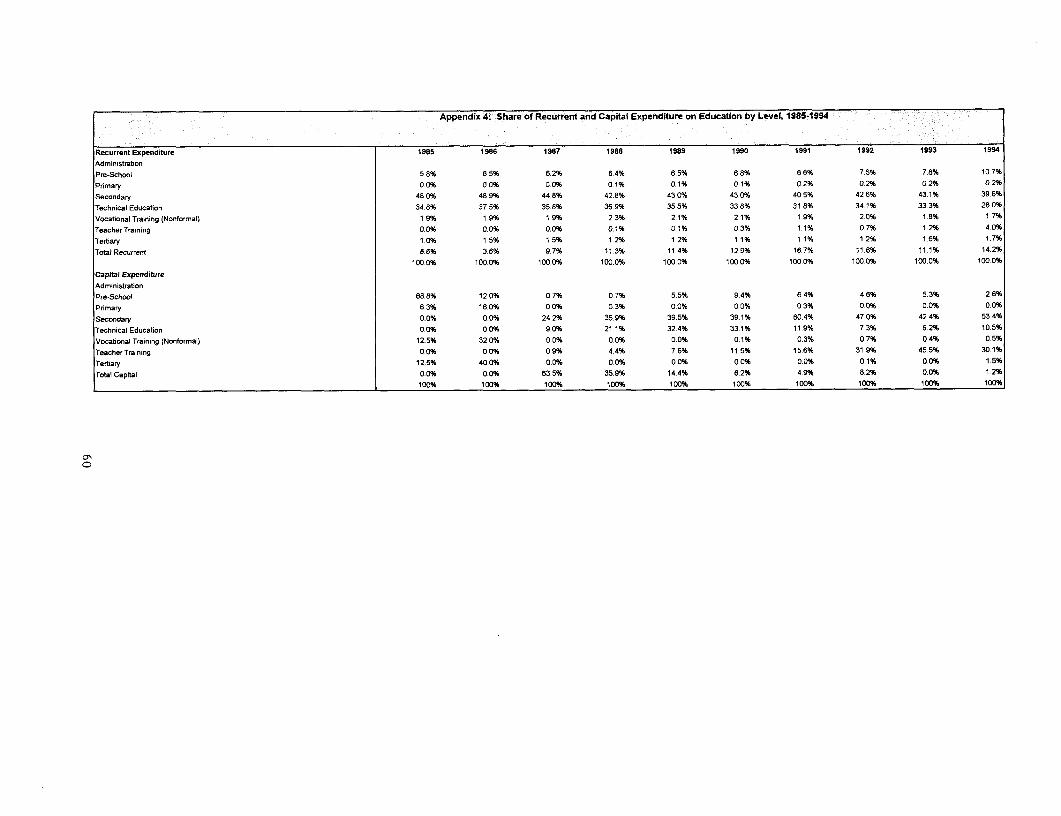
Appendix 4: Share of Recurrent and Capital Expenditure on Education by Level, 1985-1994
Recurrent Expenditure 1985 1986 1987 1988 1989 1990 1991 1992 1993 1994
AdministrationPre-School 5S8% 6.5% 6.2% 6,4% 6.5% 6,8% 66% 75% 7.8% 107%
Primary 0,0% 0 0% 0,0% 01% 01% 01% 0.2% 0 2% 0,2% 0 2%
Secondary 48.0% 48.9% 44.8% 42.8% 43,0% 43.0% 40.5% 42 3% 43.1% 39.6%
Technical Education 34.8% 375% 35.8% 359% 35 5% 33 8% 31 8% 341% 33.3% 280%
Vocational Training (Nonformal) 19% 19% 19% 2 3% 2.1% 21% 19% 2.0% 1.8% 17%
Teacher Training 0.0% 0.0% 0.0% 0.1% 01% 03% 1.1% 0.7% 1.2% 40%
Tertiary 10% 15% 15% 12% 1 2% 1 1% 1 1% 12% 16% 1.7%
Total Recurrent 8.6% 3.6% 9.7% 113% 11.4% 12.9% 16.7% 11.5% 11.1% 14.2%
100.0% 100.0% 100.0% 100.0% 100.0% 100.0% 100 0% 100,0% 100 0% 100,0%
Capital ExpenditureAdministrationPre-School 688% 12 0% 0 7% 0 7% 5.5% 9.4% 6 4% 46% 5.3% 26%
Primary 6.3% 160% 00% 03% 0.0% 00% 03% 0.0% 00% 0.0%
Secondary 0.0% 0.0% 24.2% 35.9% 39.5% 391% 60.4% 47,0% 42.4% 53,4%
Technical Educabon 0.0% 00% 90% 21 1% 32.4% 331% 119% 73% 6.2% 105%
Vocational Training (Nonformal) 12.5% 32 0% 0 0% 0 0% 0.0% 0.1% 0.3% 0.7% 0,4% 0,5%
Teacher Training 0.0% 00% 09% 44% 76% 115% 156% 31 9% 455% 301%
Terbary 125% 400% 00% 0.0% 0.0% 00% 0.0% 0.1% 0.0% 1.5%
Total Capital 0.0% 0.0% 63.5% 35.9% 14.4% 6.2% 4.9% 82% 0.0% 1.2%
100% 100% 100% 100% 100% 100% 100% 100% 100% 100%
C
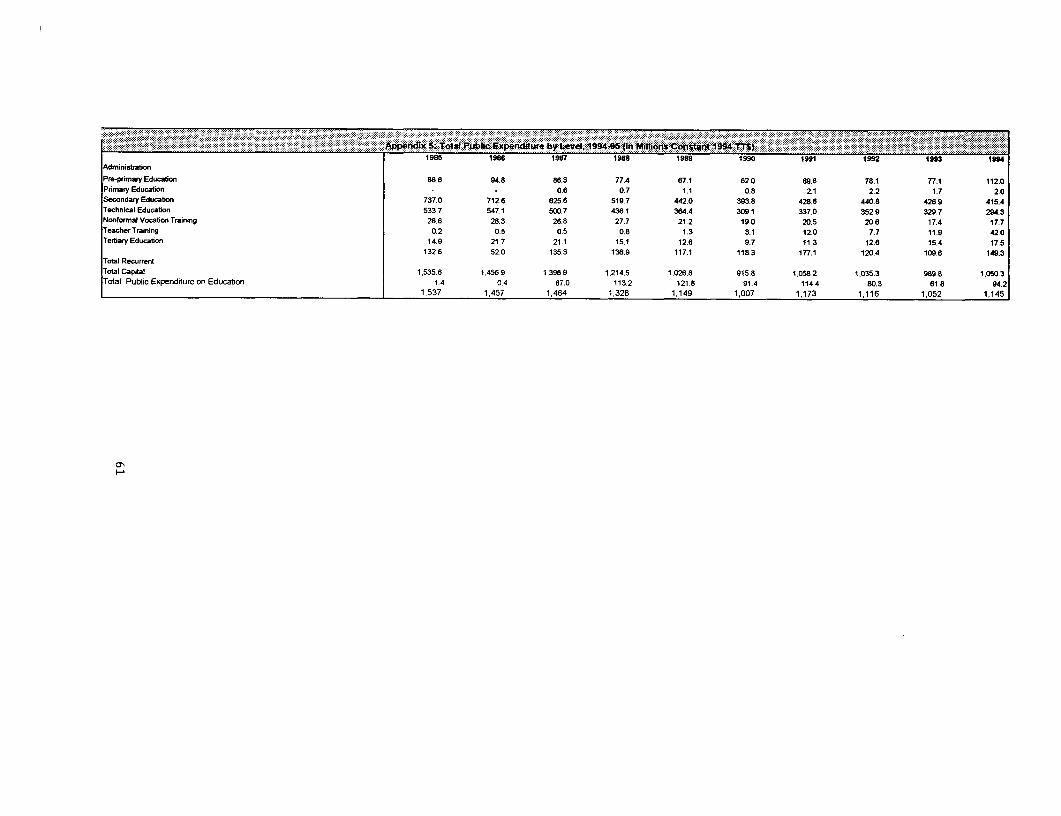
Ippendix &~T IPobIh~ Expenditure by
1985 1986 1987 1988 1989 1990 1991 1992 1993 1994Adminisbfbao
Pre-prinmary Education 886 94.8 86.3 77.4 67.1 620 69.8 78.1 77.1 112.0Primary Education - 0.6 0.7 1.1 0.8 2.1 2.2 1.7 2.0Secondary Education 737.0 712.6 625.6 519.7 442.0 393.8 428.6 440.8 428.9 415.4Technical Educaion 533.7 547.1 500.7 4361 364.4 309.1 337.0 352.9 329 7 294.3Norformal Vocabon Training 286 28.3 26.8 27.7 21.2 19.0 20.5 206 17.4 17.7Teacher Training 0.2 0.5 0.5 0.8 1.3 3.1 120 7.7 11.9 420Tertiary Education 14.9 21.7 21.1 15.1 12.6 9.7 11.3 12.8 15.4 17.5
1326 520 135.3 136.9 117.1 1183 177.1 120.4 109.6 149.3Total RecurrentTotal Capital 1,535.6 1,456.9 1,3969 1,214.5 1.0268 915.8 1,0582 1,0353 989.8 1,050.3Total Public Expenditure on Education 1.4 0.4 67.0 113.2 121 8 91.4 1144 80.3 61 8 94.2
1,537 1.457 1,464 1,328 1,149 1,007 1,173 1,116 1,052 1,145
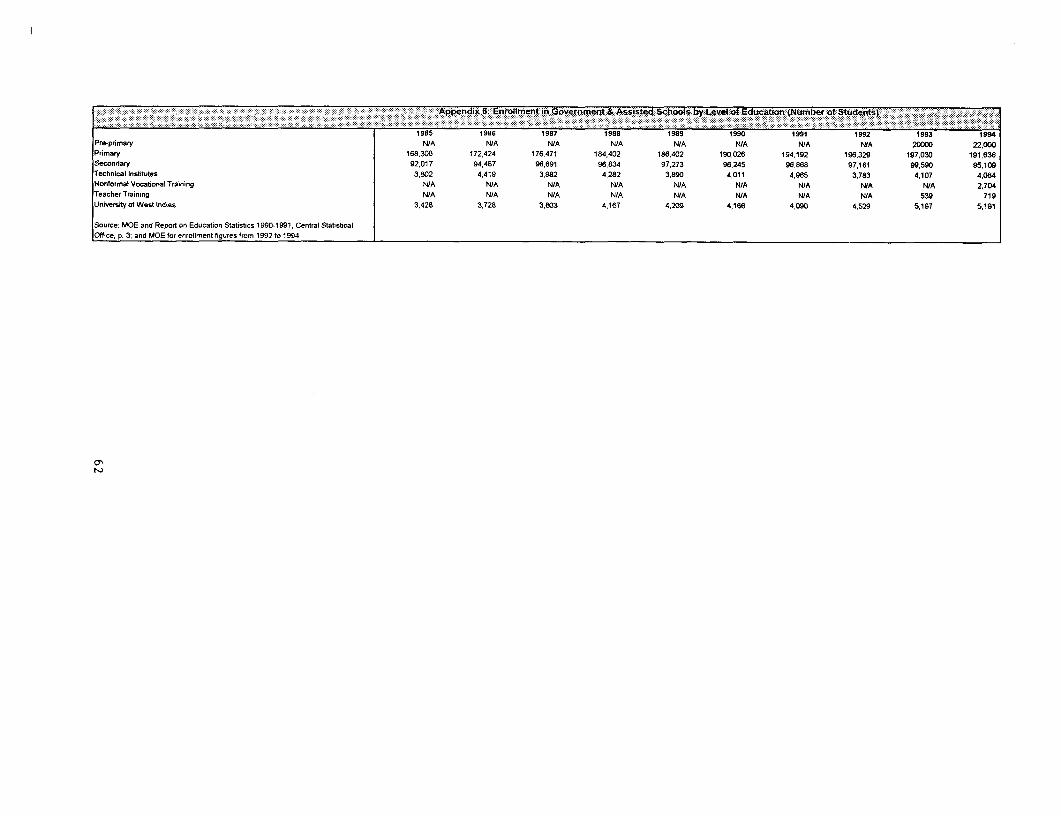
.App- n ix: Enrollment in GoetOnment A4 sisted Scttool Str LeveIoat mve. 'O U O '"
1965 1986 1987 1988 1989 1990 1991 1992 1993 1994
Pre-pnmary N/A N/A N/A N/A N/A N/A N/A N/A 20000 22,000
Prmary 168,308 172,424 176,471 184,402 186,402 190,026 194,192 196.329 197,030 191,636
Secondary 92,017 94,487 96,691 96,834 97,273 96,245 96,868 97,161 99,590 95,109
Technical Insttutes 3,802 4,419 3,982 4,282 3,890 4,011 4.965 3,783 4,107 4,084
Nonformal Vocational Training N/A N/A N/A N/A N/A N/A N/A N/A N/A 2,704
Teacher Training N/A N/A N/A N/A N/A N/A N/A N/A 539 719
University ot West Indies 3,428 3,728 3,803 4,167 4,209 4,166 4,090 4,529 5,197 5,191
Source: MOE and Report on Education Statistics 1990-1991, Central Statistical
Ofrice, p 3; and MOE for enrollment figures from 1992 to 1964.
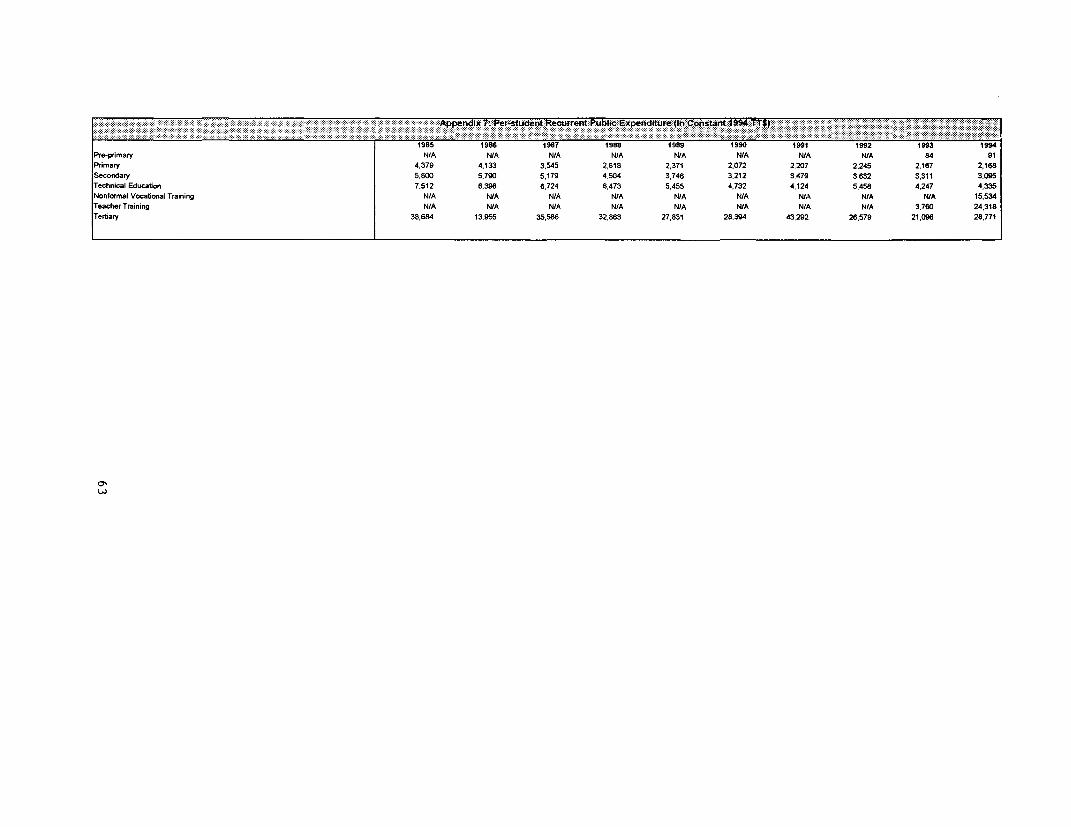
.. Appendii7: Per-student RecuTen Pu edireIn Cnstant9 4 -
1985 1986 1987 1988 1989 1990 1991 1992 1993 1994
Pre-primary N/A N/A NtA N/A NtA N/A N/A N/A 84 91
Primary 4,379 4.133 3,545 2,618 2,371 2,072 2,207 2,245 2,167 2,168
Secondary 5,800 5,790 5,179 4,504 3,746 3,212 3,479 3,632 3,311 3,095
Technical Education 7,512 6,398 6,724 6,473 5,455 4.732 4,124 5,458 4,247 4,335
Nonformal Vocational Training N/A N/A N/A N/A N/A N/A N/A N/A N/A 15,534
Teacher Training N/A N/A N/A N/A N/A N/A N/A N/A 3.760 24,318
Tertiary 38,684 13,955 35,586 32,863 27,831 28,394 43,292 26.579 21,096 28,771
U)CY
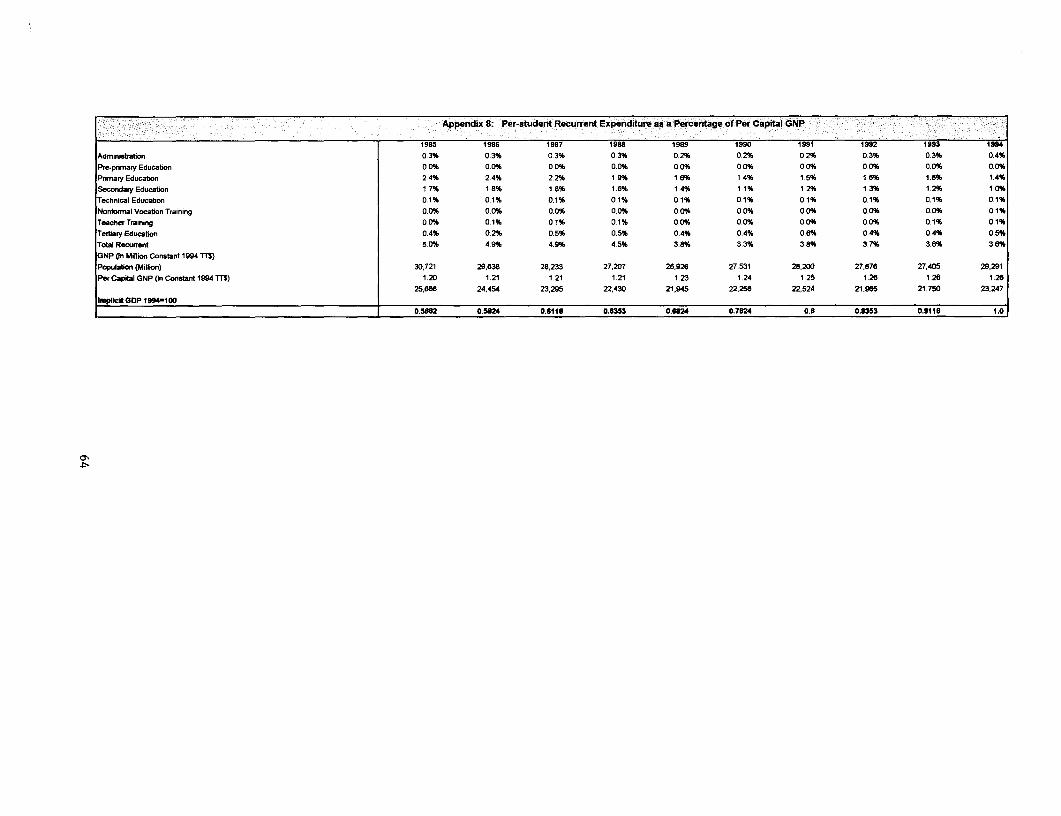
Appendix8: Per-studentRecurrent Exp itur a aPercnaefPerCapt GNP
1985 1986 1987 1988 1989 1990 1991 1992 1993 1894
Administration 0.3% 0.3% 0 3% 0.3% 0.2% 0.2% 0 2% 0.3% 0.3% 0.4%Pre-primary Education 0 0% 0.0% 0.0% 0.0% 0,0% 0 0% 0.0% 0.0% 0,0% 0.0%
Primary Education 2.4% 2.4% 2.2% 1 5% 16% 14% 1.5% 16% 1.6% 1.4%
Secondary Education 17% 18% 1.8% 1.6% 1.4% 1 1% 12% 1.3% 1.2% 1.0%
Technical Education 0.1% 0.1% 0.1% 01% 01% 01% 0.1% 01% 0.1% 01%
Nonformal Vocaton Training 0.0% 0.0% 0.0% 0.0% 0,0% 0.0% 0,0% 0.0% 0.0% 01%
Teacher Trining 00% 0.1% 01% 01% 00% 00% 00% 00% 01% 01%
Tertary Education 0.4% 0.2% 0.5% 0.5% 04% 0.4% 0.6% 0,4% 0,4% 0.5%
Total Recurrent 5 0% 4,9% 4.9% 4 5% 3.8% 33% 3.8% 3.7% 3.6% 3.6%
GNP (n Million Constant 1994 11)
Populabon (Million) 30,721 29,636 28,233 27,207 26,926 27,531 28.200 27,676 27.405 29,291
Per Capital GNP (n Constant 1994 TT$) 120 1.21 1.21 1.21 123 1.24 125 1,26 1.26 1.26
25,686 24,454 23,295 22,430 21,945 22.256 22,524 21,965 21,750 23.247
Implicit GDP 18941000.5082 0.5S24 0.6118 0.6J53 0.6824 0.7824 0.8 0.8353 0.S11S 1.0
0'-
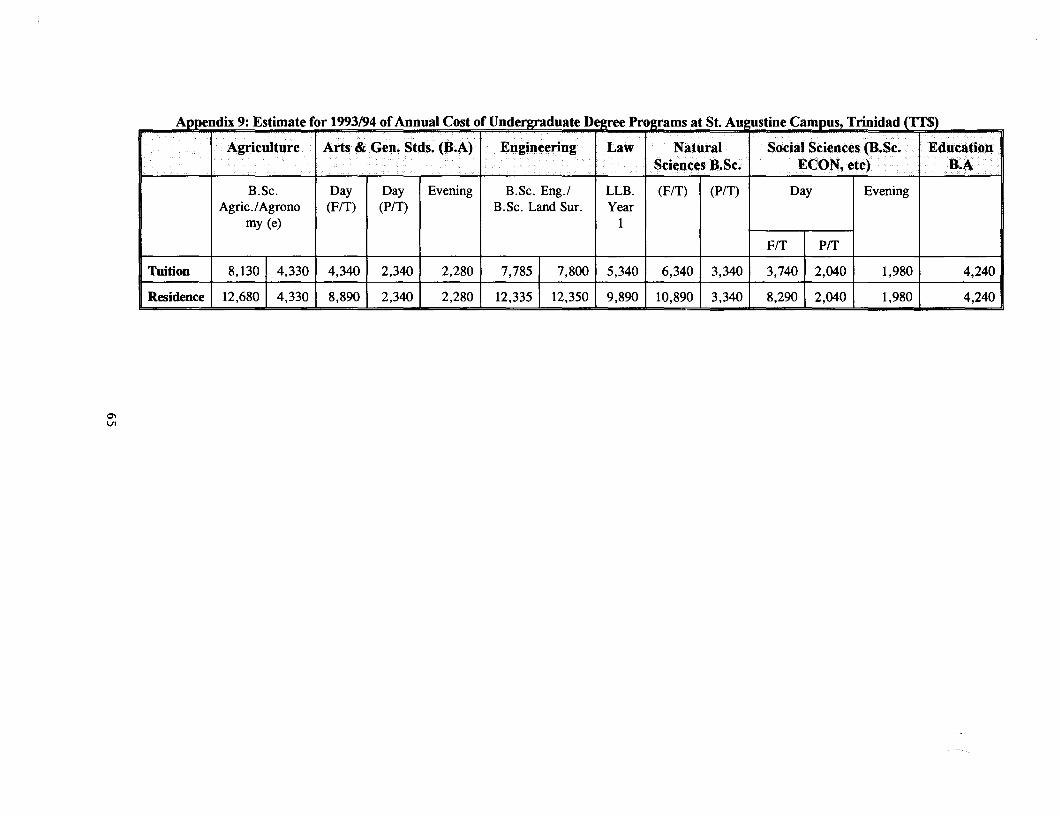
Appendix 9: Estimate for 1993/94 of Annual Cost of Undergraduate Degree Programs at St. Augustine Campus, Trinidad (TT$)
Agriculture Arts & Gen. Stds. (B.A) Engineering Law Natural Social Sciences (B.Sc. EducationSciences B.Sc. ECON, etc) B.A
B.Sc. Day Day Evening B.Sc. Eng./ LLB. (F/T) (P/T) Day EveningAgric./Agrono (F/T) (P/T) B.Sc. Land Sur. Year
my (e) 1
F/T P/T
Tuition 8,130 4,330 4,340 2,340 2,280 7,785 7,800 5,340 6,340 3,340 3,740 2,040 1,980 4,240
Residence 12,680 4,330 8,890 2,340 2,280 12,335 12,350 9,890 10,890 3,340 8,290 2,040 1,980 4,240
oJ_
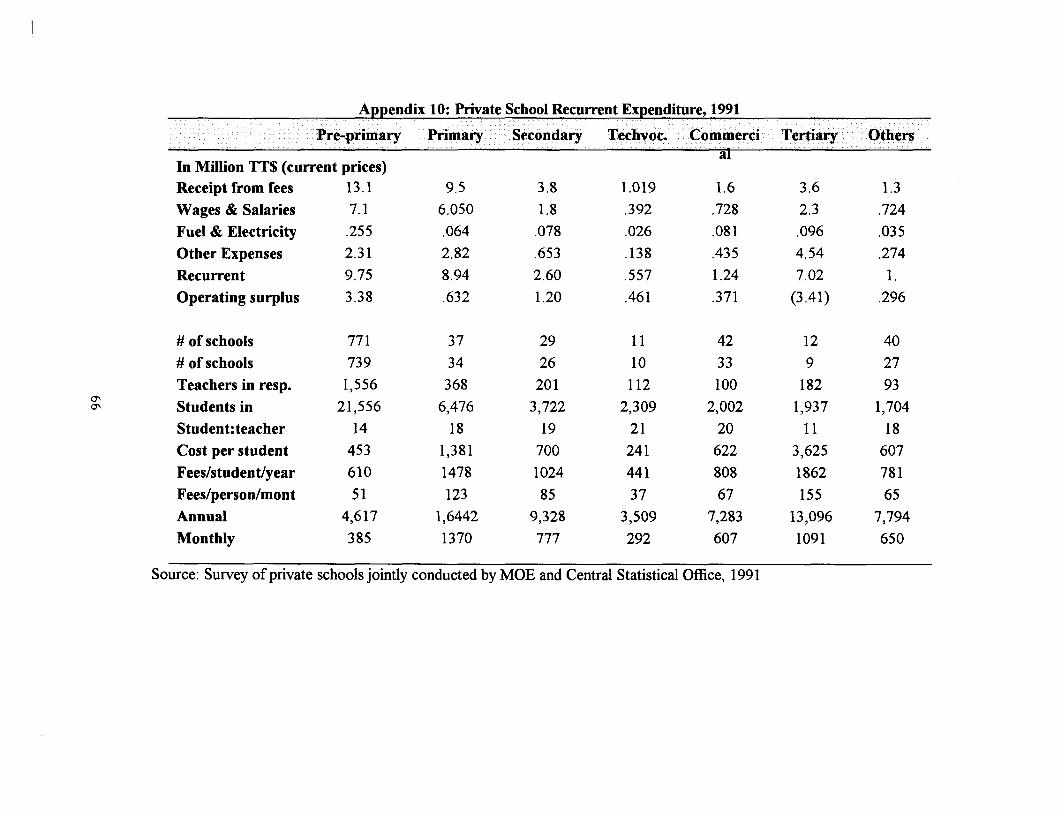
Appendix 10: Private School Recurrent Expenditure, 1991
Pre-primary Primary Secondary Tehvoc. Commerci Tertiary Others
In Million TT$ (current prices)Receipt from fees 13.1 9.5 3.8 1.019 1.6 3.6 1.3
Wages & Salaries 7.1 6.050 1.8 .392 .728 2.3 .724Fuel & Electricity .255 .064 .078 .026 .081 .096 .035Other Expenses 2.31 2.82 .653 .138 .435 4.54 .274Recurrent 9.75 8.94 2.60 .557 1.24 7.02 1.Operating surplus 3.38 .632 1.20 .461 .371 (3.41) .296
# of schools 771 37 29 11 42 12 40# of schools 739 34 26 10 33 9 27Teachers in resp. 1,556 368 201 112 100 182 93Students in 21,556 6,476 3,722 2,309 2,002 1,937 1,704Student:teacher 14 18 19 21 20 11 18Cost per student 453 1,381 700 241 622 3,625 607Fees/student/year 610 1478 1024 441 808 1862 781Fees/person/mont 51 123 85 37 67 155 65Annual 4,617 1,6442 9,328 3,509 7,283 13,096 7,794Monthly 385 1370 777 292 607 1091 650
Source: Survey of private schools jointly conducted by MOE and Central Statistical Office, 1991
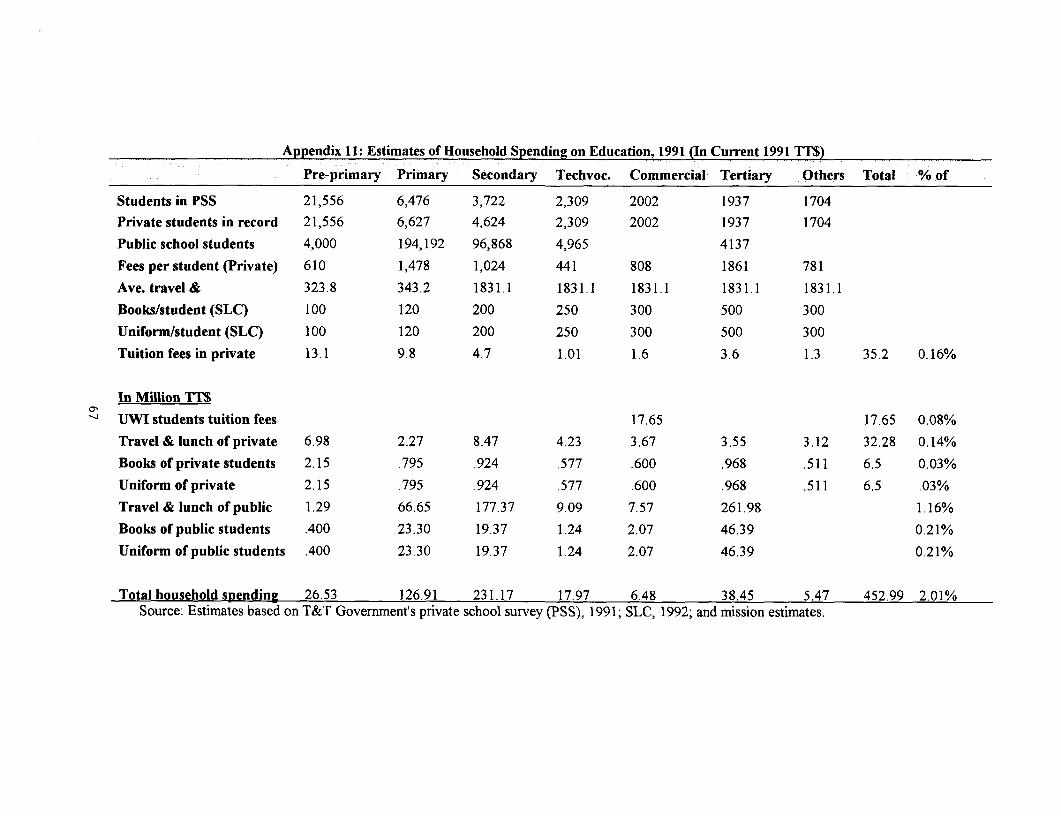
Appendix 11: Estimates of Household Spending on Education, 1991 (In Current 1991 TT$)
Pre-primary Primary Secondary Techvoc. Commercial Tertiary Others Total % of
Students in PSS 21,556 6,476 3,722 2,309 2002 1937 1704
Private students in record 21,556 6,627 4,624 2,309 2002 1937 1704
Public school students 4,000 194,192 96,868 4,965 4137
Fees per student (Private) 610 1,478 1,024 441 808 1861 781
Ave. travel & 323.8 343.2 1831.1 1831.1 1831.1 1831.1 1831.1
Books/student (SLC) 100 120 200 250 300 500 300
Uniform/student (SLC) 100 120 200 250 300 500 300
Tuition fees in private 13.1 9.8 4.7 1.01 1.6 3.6 1.3 35.2 0.16%
In Million TT$
UWI students tuition fees 17.65 17.65 0.08%
Travel&lunchofprivate 6.98 2.27 8.47 4.23 3.67 3.55 3.12 32.28 0.14%
Books of private students 2.15 .795 .924 .577 .600 .968 .511 6.5 0.03%
Uniform of private 2.15 .795 .924 .577 .600 .968 .511 6.5 .03%
Travel& lunch ofpublic 1.29 66.65 177.37 9.09 7.57 261.98 1.16%
Books of public students .400 23.30 19.37 1.24 2.07 46.39 0.21%
Uniform of public students .400 23.30 19.37 1.24 2.07 46.39 0.21%
Total household spending 26.53 126.91 231.17 17.97 6.48 38.45 5.47 452.99 2.01%Source: Estimates based on T&T Government's private school survey (PSS), 1991; SLC, 1992; and mission estimates.
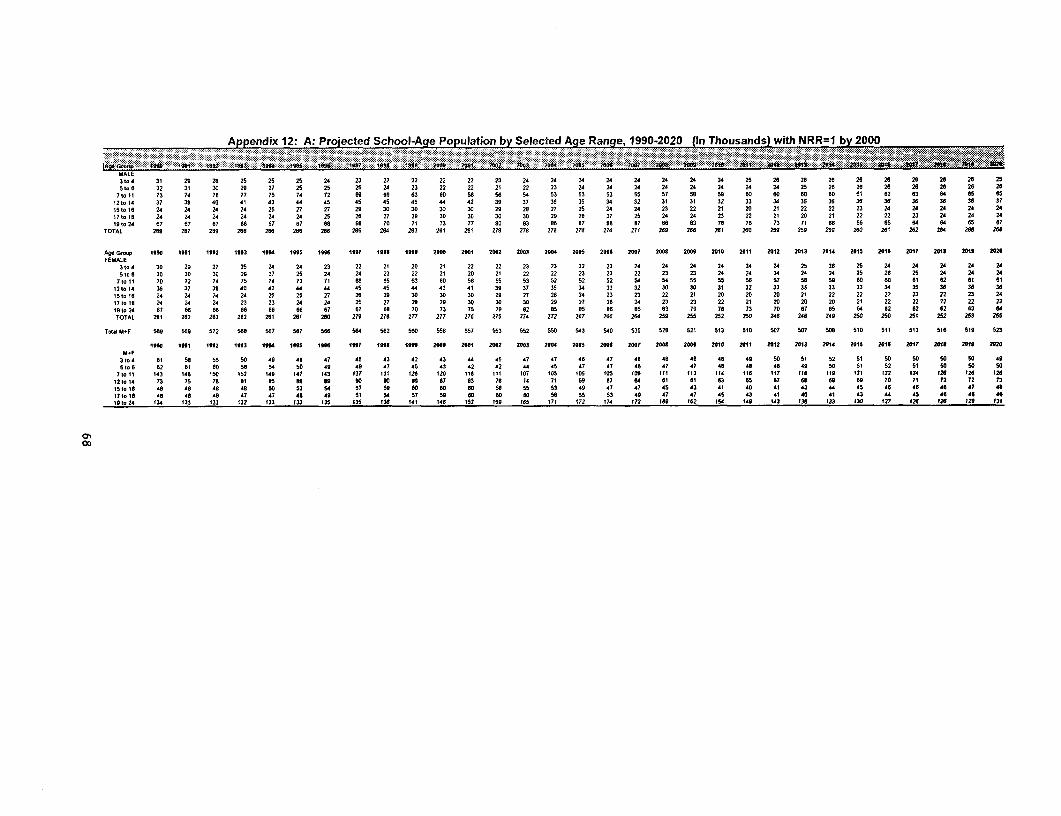
.... ~~~.>.. ~~~~ N:. ~Appendix 12: A: Projected School-Age Population, by Selected Age Range, 1990-2020 (In Thousands? with NRR=lb 2000........... 9..ie t:~$::1s67. .... . ... '.± . :-... N.:;~.~~~~:~~~:.Ž:k:~~~~~~~~x~~~. . ..- . ... ............ .-......... *. .c..~~~~~~~~~~~~~~~~~~~~.. .............. .....
MALE3WA4 31 29 29 25 25 25 24 23 22 22 22 22 23 24 24 24 24 24 24 24 24 25 26 26 26 26 26 26 26 26 2
5 a6 3 1 3 6 2 2 5 2 4 2 2 2 21 22 23 24 24 24 24 24 24 24 24 25 26 26 26 26 26 26 26i$i 73 74 7$ 77 75 74 72 66 60 63 60 se 56 54 53 53 53 55 57 se 59 60 66 65 60 61 62 63 64 65 6
12itoiA 37 38 40 41 43 44 45 45 45 45 44 42 36 37 34 35 34 32 31 31 32 33 34 34 36 36 36 26 36 36 27iStolfi 24 24 24 ~ ~~~~4 2 2 7 2 9 2 6 3 0 2 26 27 25 24 24 23 22 2$ 26 21 22 22 23 24 24 24 24 24
17t181 24 24 24 24 24 24 25 26 27 29 30 35 30 30 29 29 27 25 24 24 23 22 21 20 21 22 22 23 24 24 2416t.24 67 67 67 60 67 67 68 69 70 71 73 77 60 03 66 67 99 67 66 63 79 76 73 71 se 66 65 64 64 65 67
TOTAL 296 267 299 266 266 266 266 265 24 263 261 291 776 276 276 276 274 271 245 266 261 266 259 256 235 260 261 262 264 266 266
AO. Gc-p 1666 1641 1992 1963 1964 1965 1966 1997 166 16569 290 296$ 2962 2003 2094 2665 2606 2067 2666 2609 2616 2011 2912 2613 2014 2615 2616 2617 2016 2019 2926
FEMALE31*.4 30 29 27 25 74 24 23 22 21 20 21 22 22 23 23 22 23 24 24 24 24 24 24 25 26 25 24 24 24 24 245t.6 30 30 370 26 27 25 24 24 23 22 21 20 21 22 22 23 23 22 23 23 24 24 24 24 24 25 26 25 24 24 24
7toii1 70 72 74 75 74 73 71 66 65 63 60 56 55 53 52 52 52 54 54 55 55 se 37 56 59 60 60 el 62 61 el12io14 36 37 39 40 42 44 44 45 45 44 43 Al 36 37 35 34 33 32 35 30 31 32 33 33 23 23 34 22 26 36 2615io 16 34 24 24 24 25 25 27 26 29 30 36 30 29 277 26 24 233 23 22 21 20 26 26 21 22 212 22 22 22 23 24
17o9 24 24 24 23 23 24 24 25 27 2 29 35 0 30 25 27 26 24 23 23 32 21 20 20 20 2i 22 22 22 22 22
19gio24 67 66 69 64 66 66 67 67 66 70 73 75 79 62 65 65 66 65 63 79 76 73 70 67 95 64 63 62 62 63 64TOTAL 26i 292 262 262 261 26$ 260 279 276 277 277 276 275 274 272 267 240 264 259 255 252 25 246 246 746 250 290 259 252 263 266
Tol.1 M.F sag 546 572 5460 567 567 506 544 542 566 556 057 553 552 550 543 540 535 526 521 513 SlO 567 507 506 510 51$ 513 516 516 523
1Is0 19611 1962 19613 1194 1966 19661 1961' 1666 1696 2066 2661 2662 2663 2064 2605 2666 706 766 266 261 261 26112 2613 2614 2061 0616 697 2666 m61 2629M.F
3A0 6$ 56 55 SO 49 49 47 45 43 42 43 44 45 47 47 46 47 46 46 46 46 46 56 SI 52 51 56 50 56 66 49LS 62 6 60 56 54 so 46 46 47 45 43 42 42 44 AS 47 47 46 47 47 48 46 46 46 50 SI 52 SI so so so
7to 1I $43 i1S ¶50 152 $46 ¶4? 143 $37 131 $26 $26 hGO Ml $57 $05 $05 105 $26 fit 112 hA4 figd ii f ii 1l6 tf $22 124 926 $26 126$29014 73 75 79 91 BS 66 eg 90 50 6 87 93 79 74 71 69 67 64 6$ 6$ 63 65 97 66 69 69 75 li 73 72 73$554:16 69 46 46 AS 56 52 54 57 56 60 60 60 56 55 53 46 47 47 45 43 41 40 Al 43 44 45 46 46 46 4? 4617,1I 49 69 49 47 A7 AS AS 9$ 54 57 59 60 66 9 96 55 53 AS A7 A7 AS A3 41 40 Al 43 44 45 46 46 A616$o 2A 124 I33 123 132 $33 133 I35 935 126 iAi $46 $62 $56 965 ,17 $72 174 $72 fgo 562 iSA $46 143 136 $33 936 f27 926 iN0 $29 iS?
OD
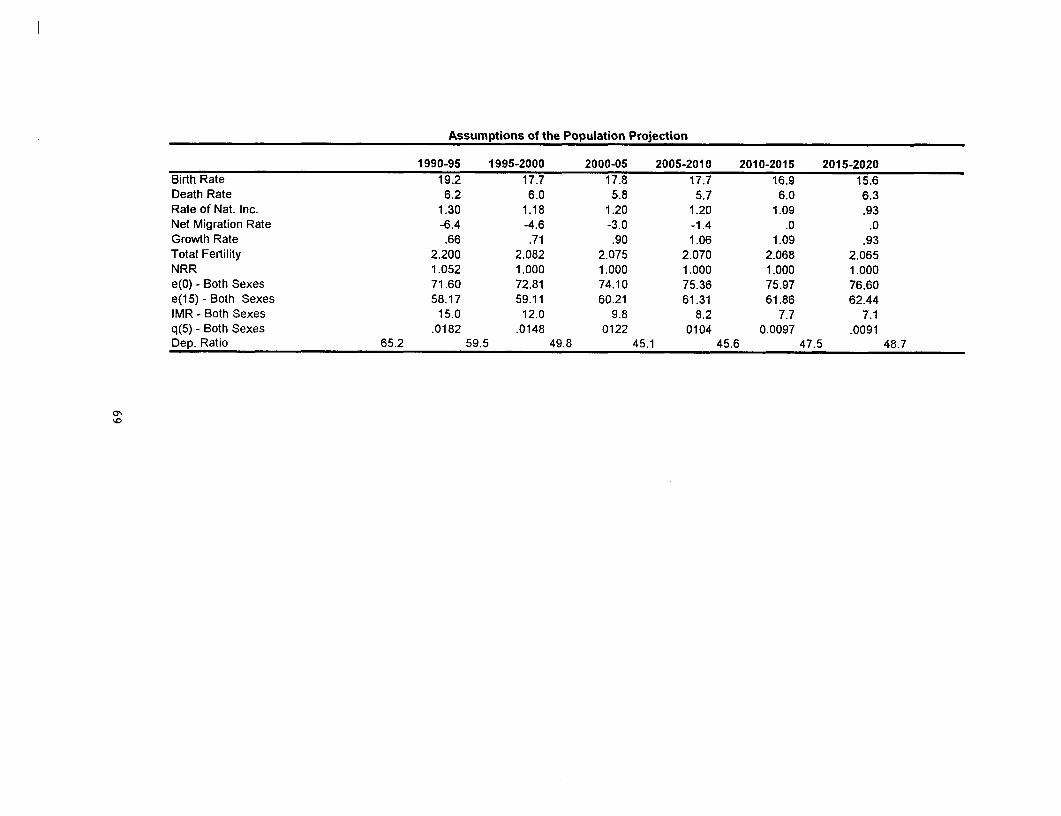
Assumptions of the Population Projection
1990-95 1995-2000 2000-05 2005-2010 2010-2015 2015-2020Birth Rate 19.2 17.7 17.8 17.7 16.9 15.6Death Rate 6.2 6.0 5.8 5.7 6.0 6.3Rate of Nat. Inc. 1.30 1.18 1.20 1.20 1.09 .93Net Migration Rate -6.4 -4.6 -3.0 -1.4 .0 .0Growth Rate .66 .71 .90 1.06 1.09 .93Total Fertility 2.200 2.082 2.075 2.070 2.068 2.065NRR 1.052 1.000 1.000 1.000 1.000 1.000e(O) - Both Sexes 71.60 72.81 74.10 75.36 75.97 76.60e(15) - Both Sexes 58.17 59.11 60.21 61.31 61.86 62.44IMR - Both Sexes 15.0 12.0 9.8 8.2 7.7 7.1q(5) - Both Sexes .0182 .0148 0122 0104 0.0097 .0091Dep. Ratio 65.2 59.5 49.8 45.1 45.6 47.5 48.7
0o
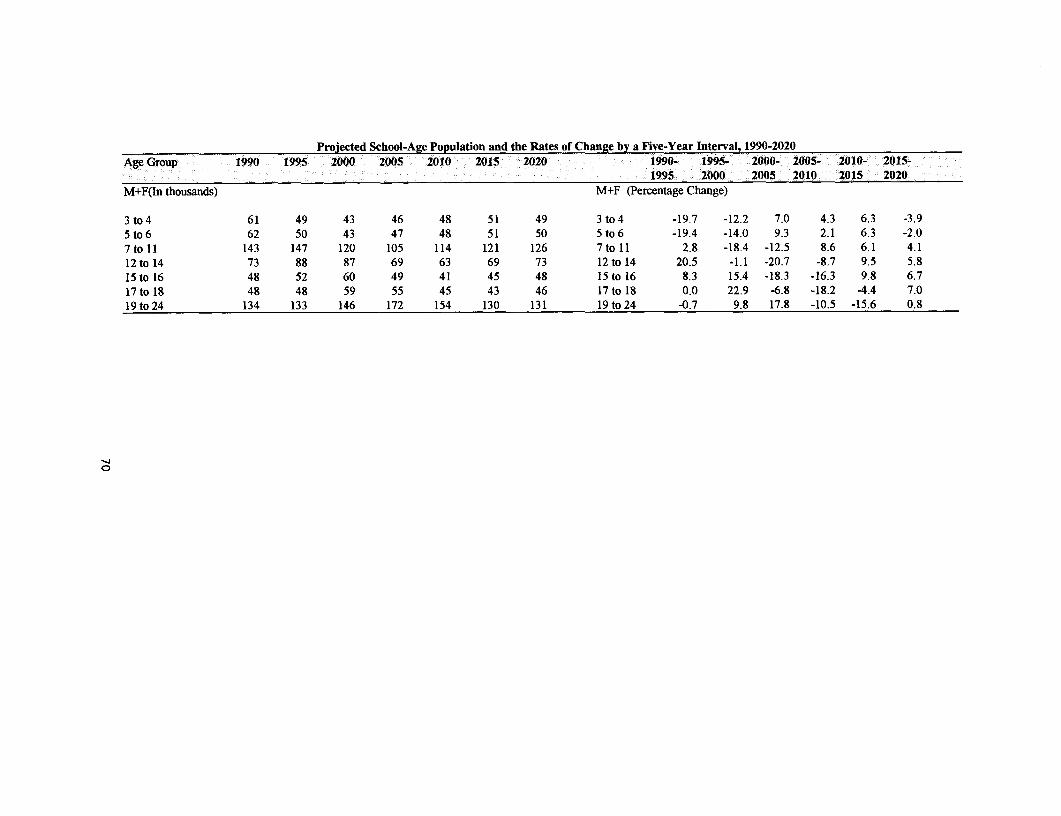
Projected School-Age Population and the Rates of Change by a Five-Year Interval, 1990-2020
Age Group 1990 1995 :2000: 2005 : 2010: 2015 :2020 1990- 1995- :2000- 2005- 2010- 2015-1995 2000 2005 2010 2015 2020
M+F(In thousands) M+F (Percentage Change)
3 to 4 61 49 43 46 48 51 49 3 to 4 -19.7 -12.2 7.0 4.3 6.3 -3.95 to 6 62 50 43 47 48 51 50 5 to 6 -19.4 -14.0 9.3 2.1 6.3 -2.07to 1 143 147 120 105 114 121 126 7to 11 2.8 -18.4 -12.5 8.6 6.1 4.112 to 14 73 88 87 69 63 69 73 12 to 14 20.5 -1.1 -20.7 -8.7 9.5 5.815 to 16 48 52 60 49 41 45 48 15 to 16 8.3 15.4 -18.3 -16.3 9.8 6.717 to 18 48 48 59 55 45 43 46 17 to 18 0.0 22.9 -6.8 -18.2 -4.4 7.019 to 24 134 133 146 172 154 130 131 19 to 24 -0.7 9.8 17.8 -10.5 -15.6 0.8
C
Appendix 13: Trinidad and Tobago Repetition, Promotion, and Dropout Rates in Primary Education
Standard 1 Standard 2 Standard 3 Standard 4 Standard 5 Post-Primary 6 Post-Primary7
Male Female Male Female Male Female Male Female Male Female Male Female Male Female
1990-91
Repetition 1.5 0.9 1.2 0.7 0.7 0.7 0.9 0.8 11.3 12.8 15.9 12.8 21.9 19.3
Promotion 98.0 98.8 98.1 98.7 98.7 98.8 98.5 98.8 85.7 85.0 - - - -
Dropout 0.5 0.3 0.7 0.6 0.6 0.5 0.6 0.4 2.9 2.2 - - -
1991-92
Repetition 1.1 0.7 0.9 0.5 0.7 0.4 1.2 1.0 10.1 12.3 13.2 12.9 27.1 19.9
Promotion 98.5 98.9 98.7 99.1 98.8 99.2 98.2 98.6 87.8 86.0 - - -
Dropout 0.4 0.4 0.4 0.4 0.5 0.4 0.6 0.4 2.1 1.7 - - -
1992-93
Repetition 1.2 0.8 0.8 0.5 1.0 0.6 1.5 1.1 11.2 14.4 10.2 10.9 18.4 18.7
Promotion 98.6 98.9 99.0 99.4 98.7 99.1 98.1 98.6 87.6 84.7 - - -
Dropout 0.2 0.3 0.3 0.2 0.3 0.3 0.4 0.3 1.2 1.0 - - -
3-year Ave.
Repetition 1.3 0.8 1.0 0.6 0.8 0.6 1.2 0.9 10.9 13.2 13.1 12.2 22.5 19.3
Promotion 98.4 98.9 98.6 99.1 98.7 99.0 98.3 98.7 87.0 85.2 - - -
Dropout 0.4 0.3 0.5 0.4 0.5 0.4 0.5 0.4 2.1 1.6 -
Appendix 14: Cohort Flow Analysis
00 i; 0 t000 iMales i 0 0 t; tStd. 1 Std&2 Std.3 Std.4 Std. 5 Graduatesm 0 0ChortMembier till
1990 1000 1000
1991 13 984 996
1992 22 970 991
1993 30 957 987
1994 40 941 981
1995 142 819 142
1996 15 124 15
1997 2 13 2
1998 1
Pupil-year 5115
Dropout by grade 4 5 4 5 23
Survival by grade 1000 996 992 987 982 958
Females Std. 1 Std. 2 Std. 3 Std 4 Std. 5 Graduates ChortMember still
1990 1000 1000
1991 8 989 997
1992 13 979 993
1993 19 970 989
1994 28 957 985
1995 153 815 153
1996 20 133 20
1997 3 18 3
1998 2
Pupil-year 5139
Dropout by grade 3 4 4 4 19
Survival by grade 1000 997 993 989 985 966
Number of male students in a cohort who eventually complete Std. 5
Number of female students in a cohort who eventually complete Std. 5
Number of years to produce a male Std. 5 leaver (5115 pupil-yr./958 leavers)
Number of years to produce a female Std. 5 leaver (5139 pupil-yr./966 leavers)
Appendix 15: Additional Recurrent Cost for Expanding Coverage, 1994-2001
Annual Persons TotalTrained Cost Trained in Cost U
Persons per year (TT$) 8 years 1994-2001 opr
School-based Management
Principals 200 190,000 1,600 1,520,000 950
Dept. Heads 550,000 4,400,000
To Maintain Universal Primary Education
Pre-service training 438 768,000 3,500 6,144,000 1,755
To Maintain 70% Transition Rate
Training Nongraduate 238 2,446,970 1,900 19,575,758 10,303
Traning Graduate 175 1,803,030 1,400 14,424,242 10,303
3-month Refresher Course
Teachers 300 1,800,000 2,400 14,400,000 6,000
Incentives for Improving Qualification
Increased remuneration 1,283,000 10,264,000
Reduce Pupil:Teacher
30:1 to 25:1 1,297,890 10,383,120
30:1 to 20:1 4,295,846 34,366,768
Paying for Private Schools Places ( TT1,147.00 per student per year (adjusted for 1994 prices)
For 30% unplaced students 43,000 49,321,000 344,000 394,568,00 1,147
Total Recurrent Cost (at 10,138,890 81,111,120
Total Recurrent Cost (at 14,434,736 115,477,88
Total Recurrent Cost (at 25:1+bought places) 63,755.736 510,045.88
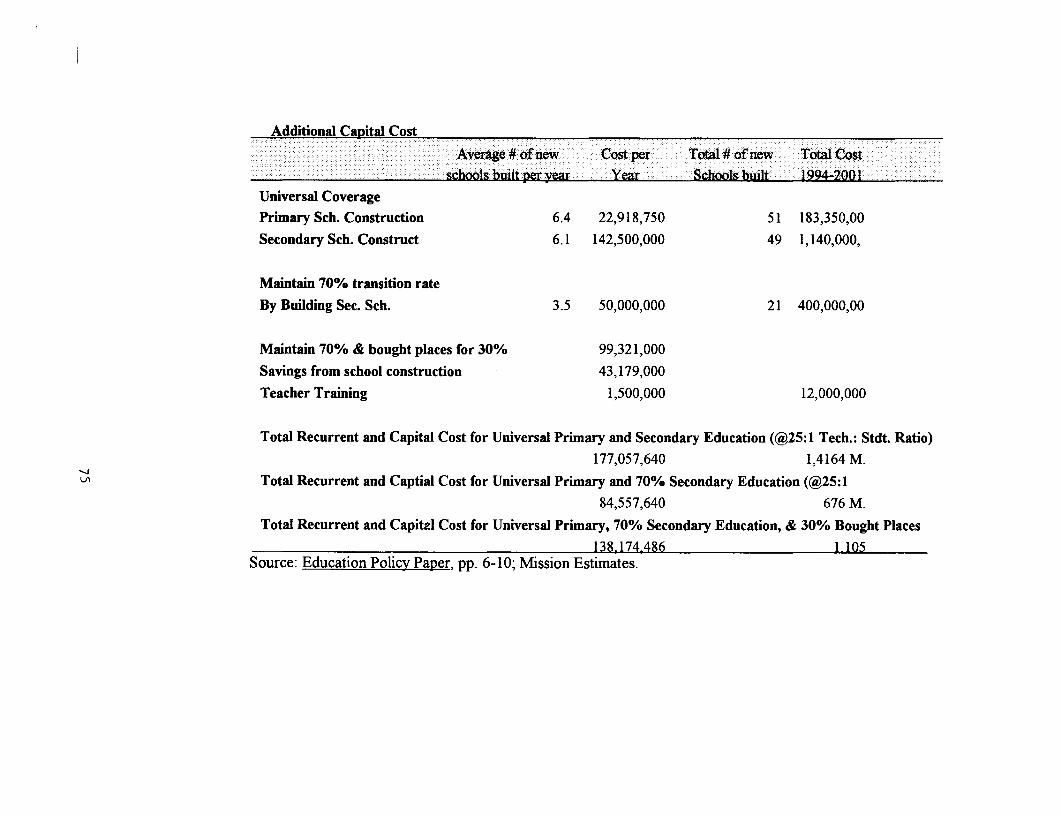
Additional Capital Cost
Average # of new Cost per Total # of new Total Cost
schools built per year Year Schools built 1994-2001
Universal Coverage
Primary Sch. Construction 6.4 22,918,750 51 183,350,00
Secondary Sch. Construct 6.1 142,500,000 49 1,140,000,
Maintain 70% transition rate
By Building Sec. Sch. 3.5 50,000,000 21 400,000,00
Maintain 70% & bought places for 30% 99,321,000
Savings from school construction 43,179,000
Teacher Training 1,500,000 12,000,000
Total Recurrent and Capital Cost for Universal Primary and Secondary Education (@25:1 Tech.: Stdt. Ratio)
177,057,640 1,4164 M.Total Recurrent and Captial Cost for Universal Primary and 70% Secondary Education (@25:1
84,557,640 676 M.Total Recurrent and Capital Cost for Universal Primary, 70% Secondary Education, & 30% Bought Places
138,174,486 1,105Source: Education Policy Paper, pp. 6-10; Mission Estimates.
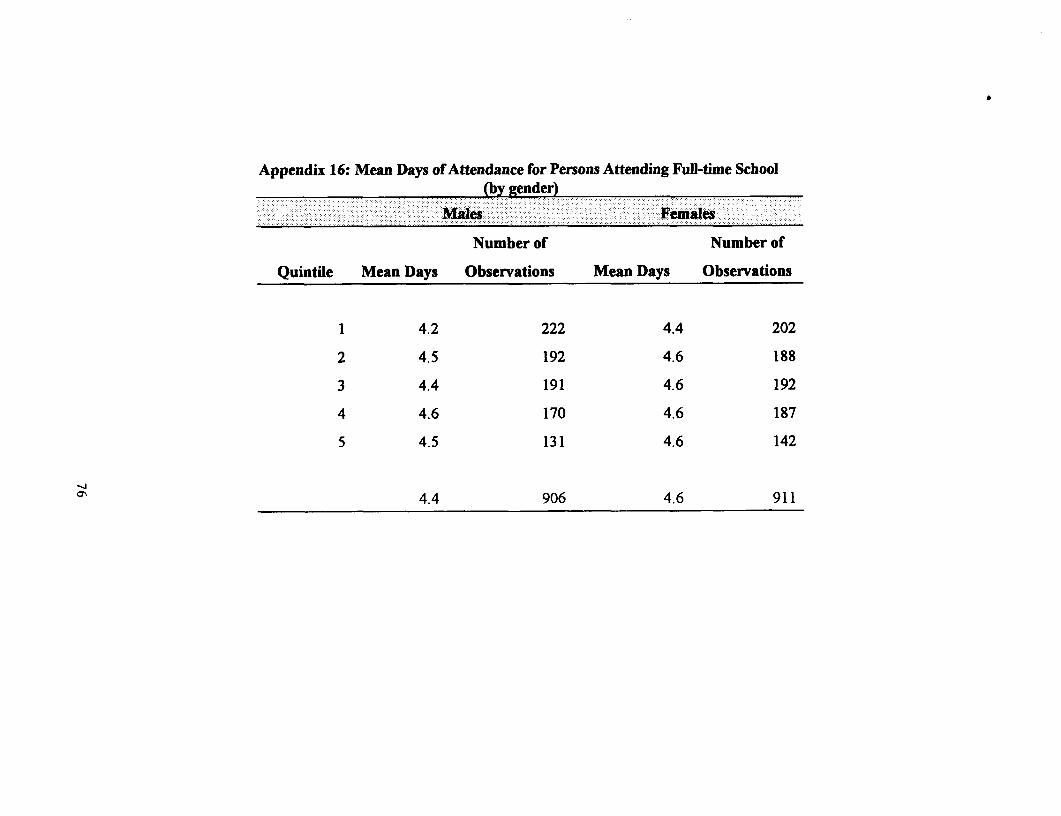
Appendix 16: Mean Days of Attendance for Persons Attending Fun-time School(by gender)
Maies F . ... ~. emalei
Number of Number of
Quintile Mean Days Observations Mean Days Observations
1 4.2 222 4.4 202
2 4.5 192 4.6 188
3 4.4 191 4.6 192
4 4.6 170 4.6 187
5 4.5 131 4.6 142
4.4 906 4.6 911
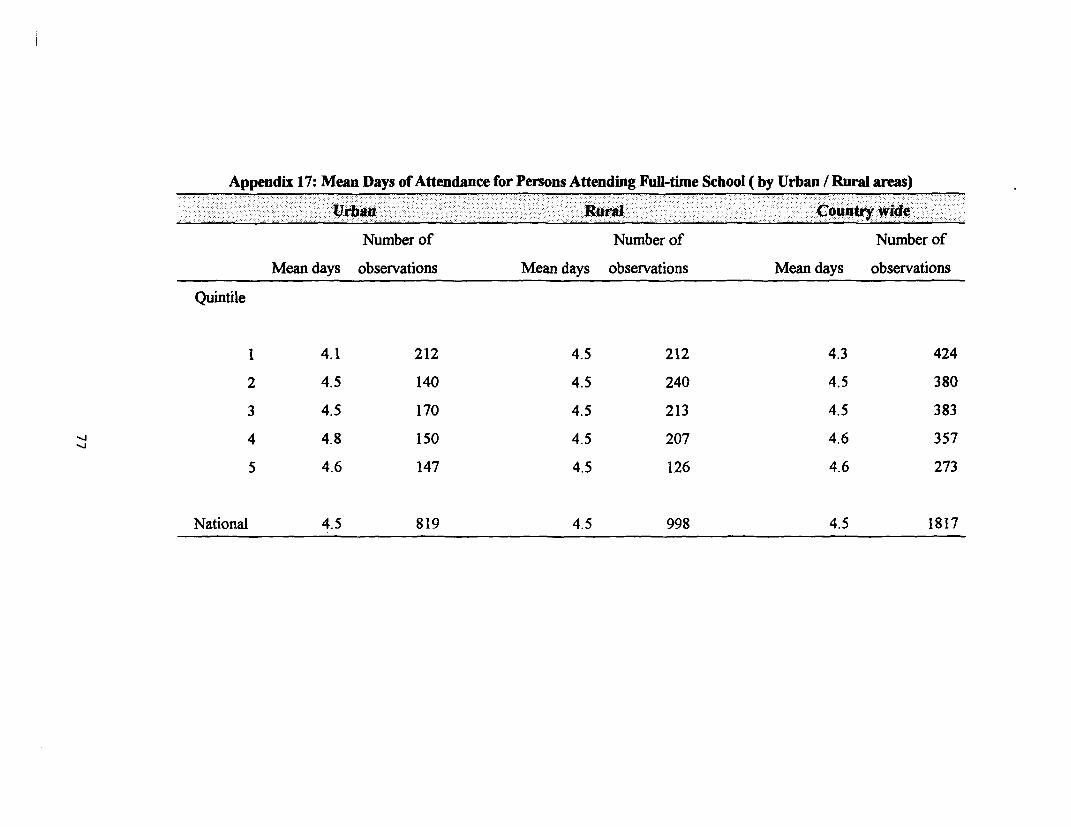
Appendix 17: Mean Days of Attendance for Persons Attending Full-time School ( by Urban / Rural areas)
-rban Rural County wld:
Number of Number of Number of
Mean days observations Mean days observations Mean days observations
Quintile
1 4.1 212 4.5 212 4.3 424
2 4.5 140 4.5 240 4.5 380
3 4.5 170 4.5 213 4.5 383
4 4.8 150 4.5 207 4.6 357
5 4.6 147 4.5 126 4.6 273
National 4.5 819 4.5 998 4.5 1817
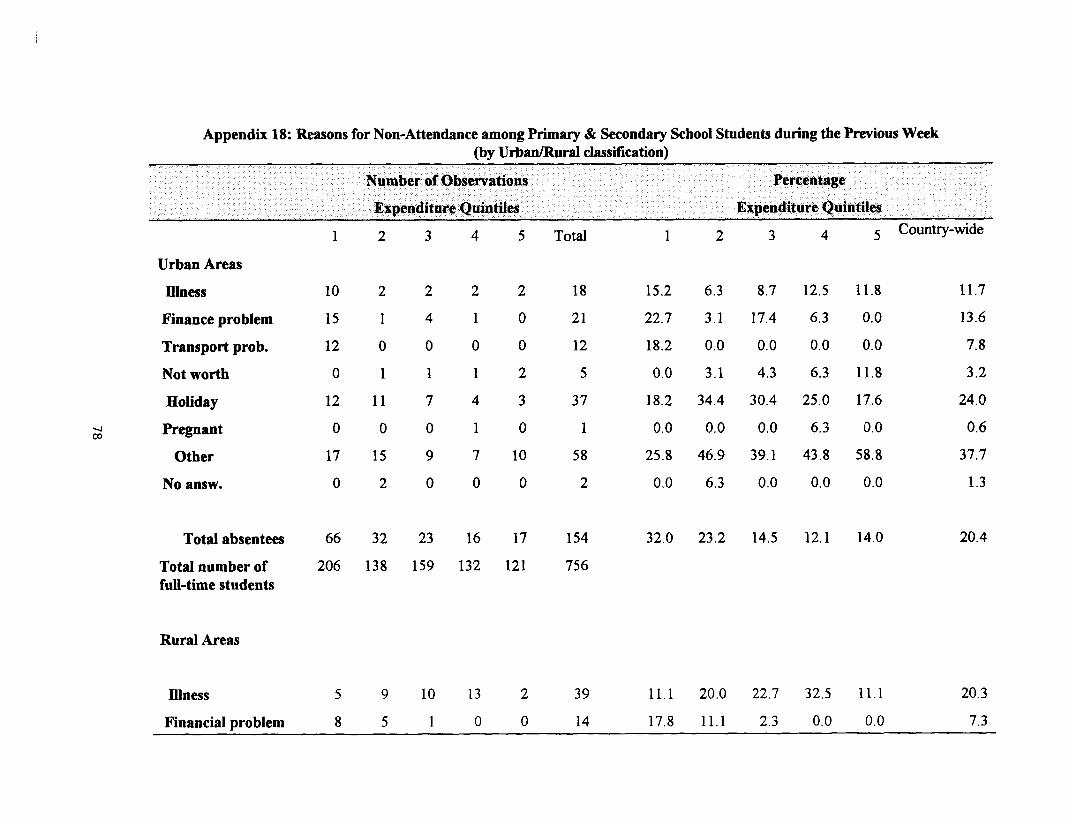
Appendix 18: Reasons for Non-Attendance among Primary & Secondary School Students during the Previous Week(by Urban/Rural classification)
Number ofObservations Percentage
Expendifture OQuintiles Expenditure Ouinitiles
1 2 3 4 5 Total 1 2 3 4 5 Country-wide
Urban Areas
Illness 10 2 2 2 2 18 15.2 6.3 8.7 12.5 11.8 11.7
Finance problem 15 1 4 1 0 21 22.7 3.1 17.4 6.3 0.0 13.6
Transport prob. 12 0 0 0 0 12 18.2 0.0 0.0 0.0 0.0 7.8
Not worth 0 1 1 1 2 5 0.0 3.1 4.3 6.3 11.8 3.2
Holiday 12 11 7 4 3 37 18.2 34.4 30.4 25.0 17.6 24.0
Pregnant 0 0 0 1 0 1 0.0 0.0 0.0 6.3 0.0 0.6
Other 17 15 9 7 10 58 25.8 46.9 39.1 43.8 58.8 37.7
No answ. 0 2 0 0 0 2 0.0 6.3 0.0 0.0 0.0 1.3
Total absentees 66 32 23 16 17 154 32.0 23.2 14.5 12.1 14.0 20.4
Total number of 206 138 159 132 121 756full-time students
Rural Areas
Illness 5 9 10 13 2 39 11.1 20.0 22.7 32.5 11.1 20.3
Financial problem 8 5 1 0 0 14 17.8 11.1 2.3 0.0 0.0 7.3
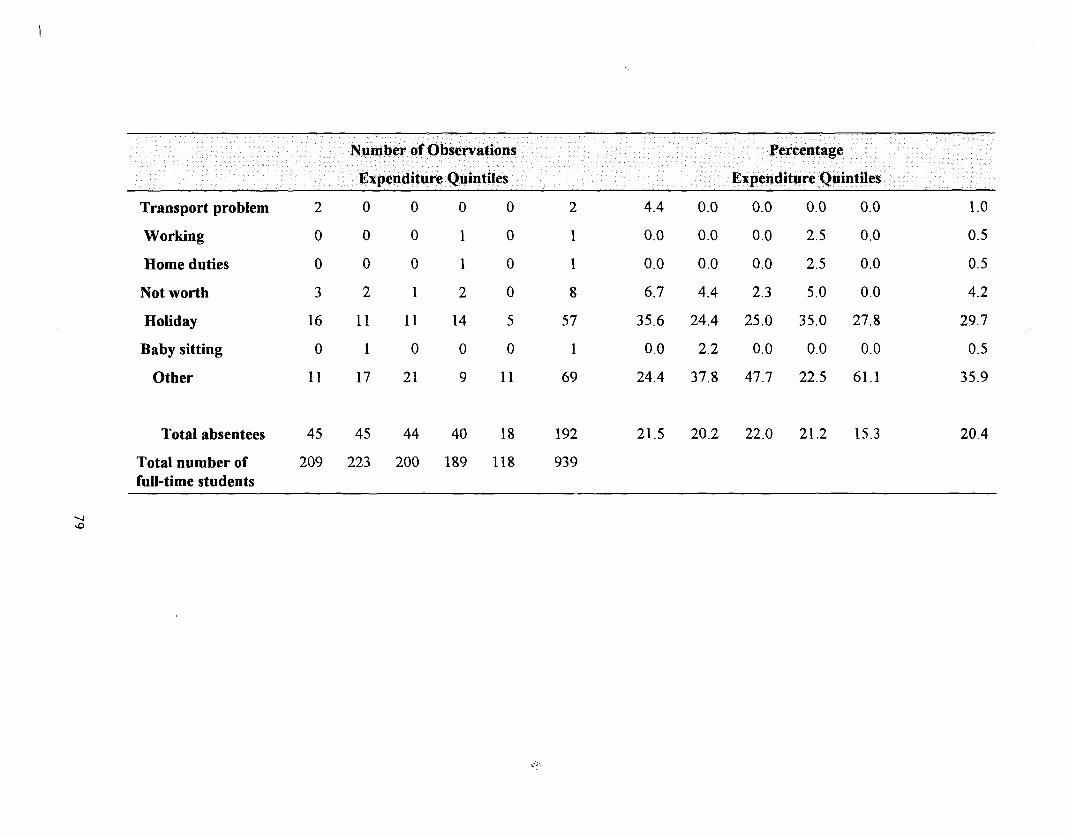
Number of Observations Percentage
Expenditure Quintiles Expenditure Quintiles
Transport problem 2 0 0 0 0 2 4.4 0.0 0.0 0.0 0.0 1.0
Working 0 0 0 1 0 1 0.0 0.0 0.0 2.5 0.0 0.5
Home duties 0 0 0 1 0 1 0.0 0.0 0.0 2.5 0.0 0.5
Not worth 3 2 1 2 0 8 6.7 44 2.3 5.0 0.0 4.2
Holiday 16 11 11 14 5 57 35.6 24.4 25.0 35.0 27.8 29.7
Baby sitting 0 1 0 0 0 1 0.0 2.2 0.0 0.0 0.0 0.5
Other 11 17 21 9 11 69 24.4 37.8 47.7 22.5 61.1 35.9
Total absentees 45 45 44 40 18 192 21.5 20.2 22.0 21.2 15.3 20.4
Total number of 209 223 200 189 118 939
full-time students
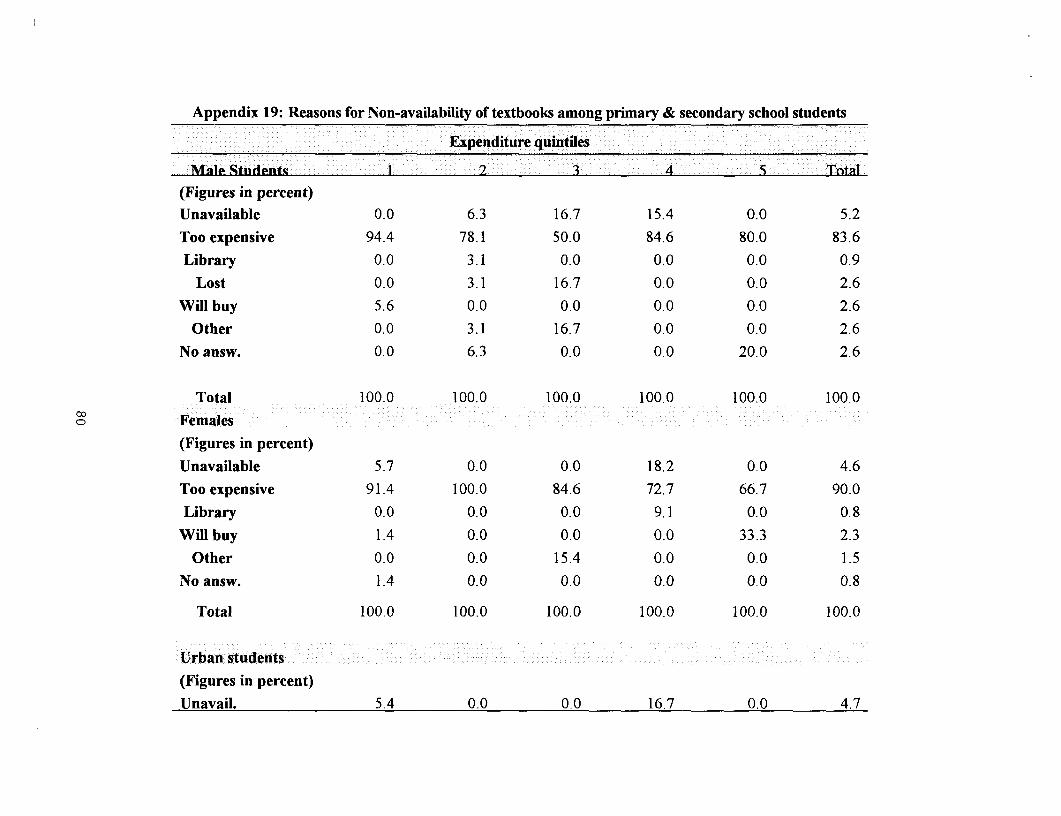
Appendix 19: Reasons for Non-availability of textbooks among primary & secondary school students
Expenditure quinties
Male S;tiuent 1 2 3 4 TntAl
(Figures in percent)Unavailable 0.0 6.3 16.7 15.4 0.0 5.2
Too expensive 94 4 78 1 50.0 84.6 80.0 83.6
Library 0.0 3 1 0.0 0.0 0.0 0.9
Lost 0.0 3.1 16.7 0.0 0.0 2.6
Will buy 5.6 0.0 0.0 0.0 0.0 2.6
Other 0.0 3.1 16.7 0.0 0.0 2.6
No answ. 0.0 6.3 0.0 0.0 20.0 2.6
Total 100.0 100.0 100.0 100.0 100.0 100.0
Females
(Figures in percent)Unavailable 5.7 0.0 0.0 18.2 0.0 4.6
Too expensive 91 4 100 0 84.6 72.7 66.7 90.0
Library 00 00 0.0 9.1 0.0 0.8
Will buy 1.4 0.0 0.0 0.0 33.3 2.3
Other 0.0 0.0 15.4 0.0 0.0 1.5
Noansw. 1.4 0.0 0.0 0.0 0.0 0.8
Total 100.0 100.0 100.0 100.0 100.0 100.0
Urban students
(Figures in percent)Unavail. 5.4 0.0 0.0 16.7 0.0 4.7
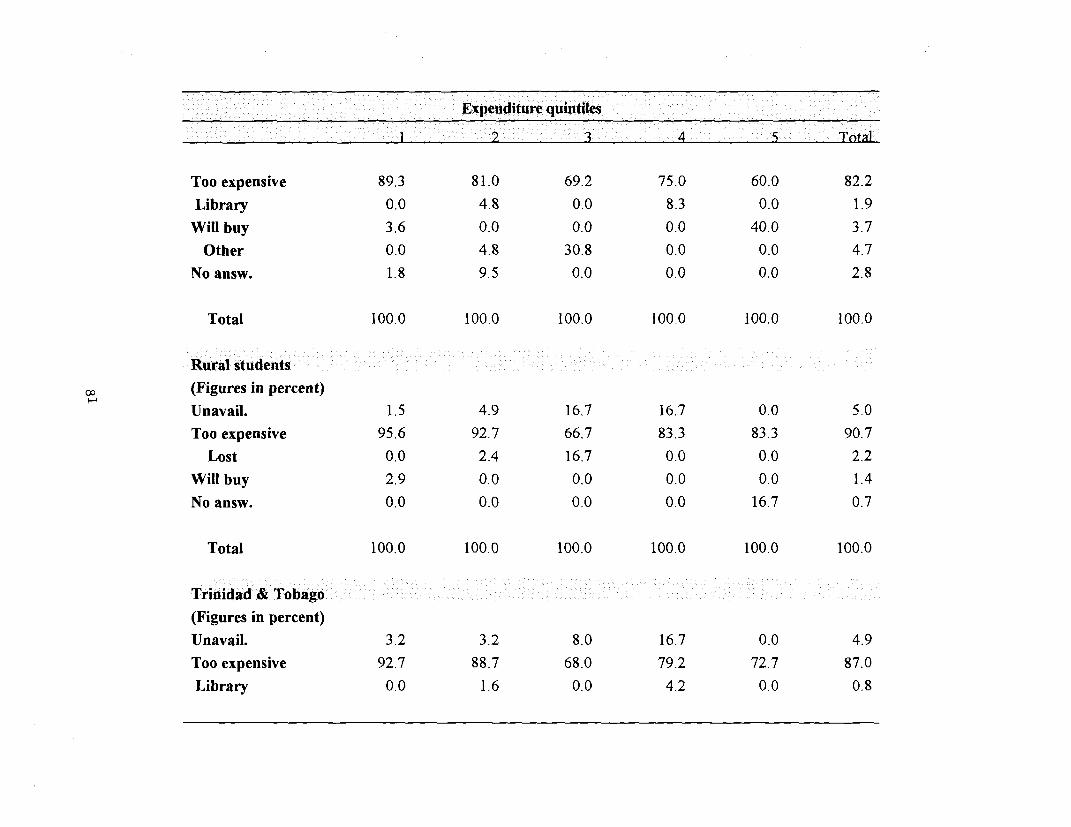
Expenditure quintiles
1 2 3 4 5 Total
Too expensive 89.3 81.0 69.2 75.0 60.0 82.2
Library 0.0 4.8 0.0 8.3 0.0 1.9
Will buy 3.6 0.0 0.0 0.0 40.0 3.7
Other 0.0 4.8 30.8 0.0 0.0 4.7
No answ. 1.8 9.5 0.0 0.0 0.0 2.8
Total 100.0 100.0 100.0 100.0 100.0 100.0
Rural students
(Figures in percent)Unavail. 1.5 4.9 16.7 16.7 0.0 5.0
Too expensive 95.6 92.7 66.7 83.3 83.3 90.7
Lost 0.0 2.4 16.7 0.0 0.0 2.2
Willbuy 2.9 0.0 0.0 00 00 1.4
No answ. 0.0 0.0 0.0 0.0 16.7 0.7
Total 100.0 100.0 100.0 100.0 100.0 100.0
Trinidad & Tobago
(Figures in percent)
Unavail. 3.2 3.2 8.0 16.7 0.0 4.9
Too expensive 92.7 88.7 68.0 79.2 72.7 87.0
Library 0.0 1.6 0.0 4.2 0.0 0.8
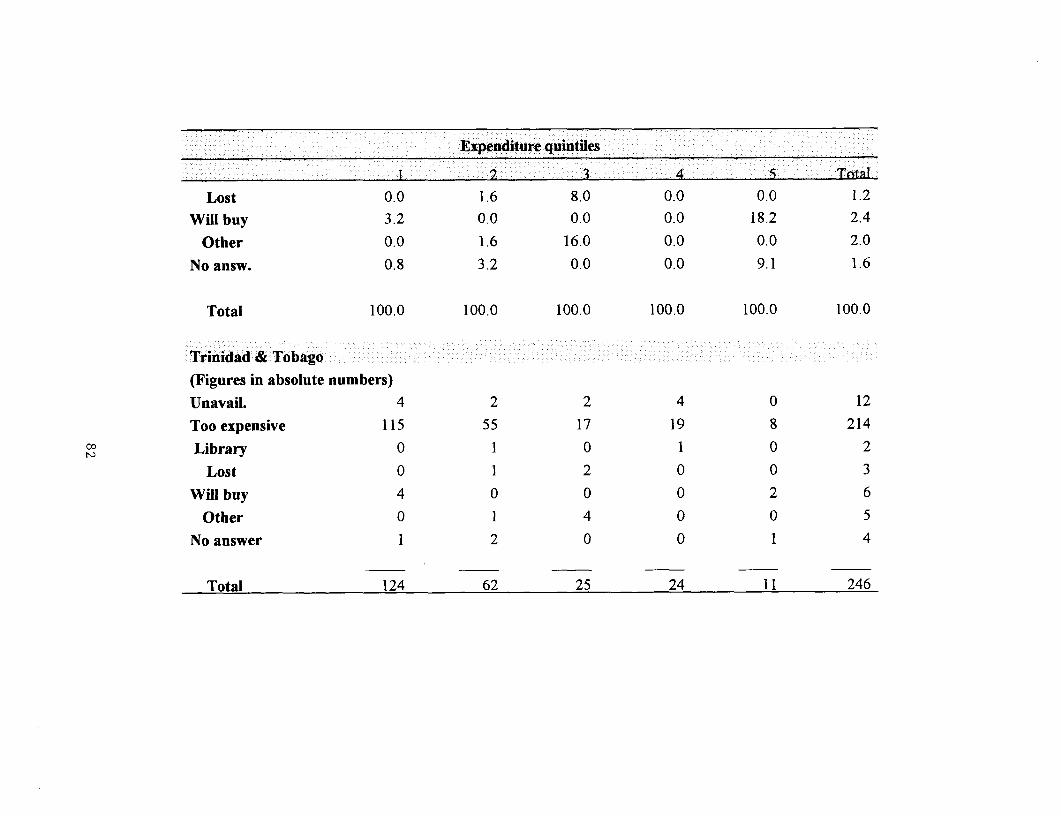
Expenditure quintiles
Lost 0.0 1.6 8.0 0.0 0.0 1.2
Will buy 3.2 0.0 0.0 0.0 18.2 2.4
Other 0.0 1.6 16.0 0.0 00 20
No answ. 0.8 3.2 0.0 0.0 9.1 1.6
Total 100.0 100.0 100.0 100.0 100.0 100.0
Trinidad & Tobago
(Figures in absolute numbers)
Unavail. 4 2 2 4 0 12
Too expensive 115 55 17 19 8 214
co Library 0 1 0 1 0 2
Lost 0 1 2 0 0 3
Will buy 4 0 0 0 2 6
Other 0 1 4 0 0 5
No answer 1 2 0 0 1 4
Total 124 62 25 24 11 246
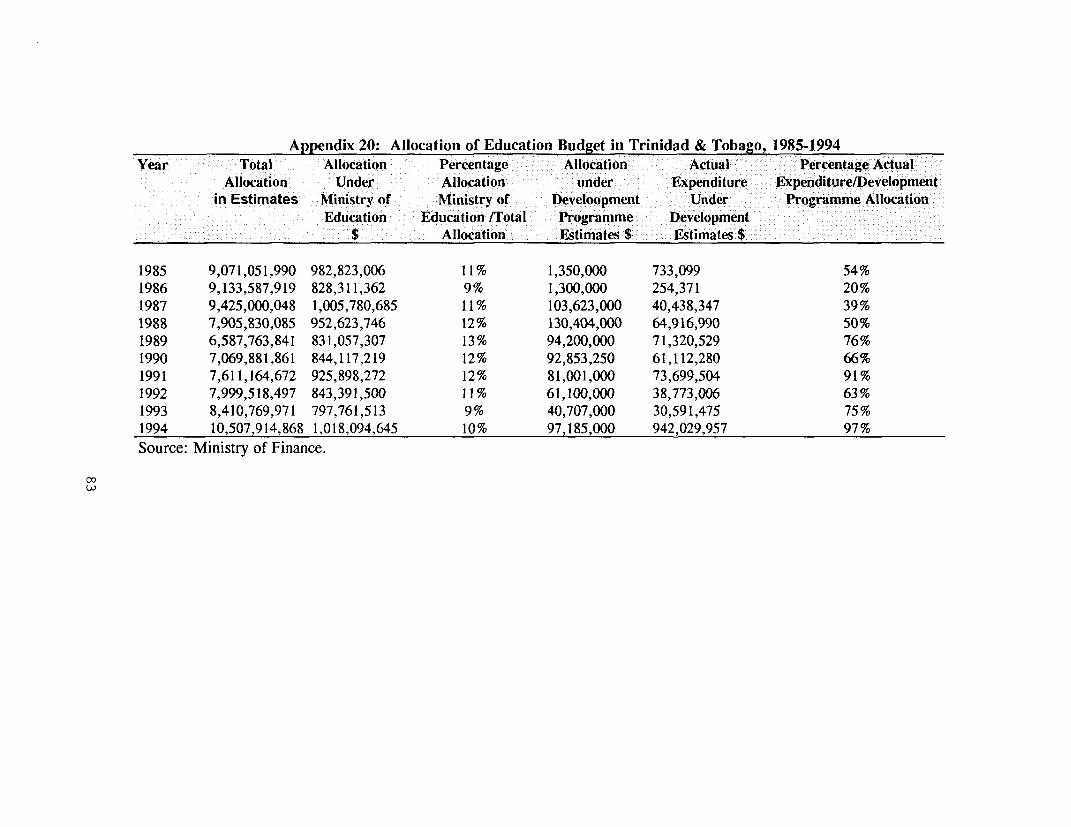
Appendix 20: Allocation of Education Budget in Trinidad & Tobago, 1985-1994Year Total Allocation Percentage Allocation Actual Percentage Actual
Allocation Under Allocation under Expenditure Expenditure/Developmentin Estimates Ministry of Ministry of Develoopment Under Programme Allocation
Education Education /Total Programme Development$ Allocation Estimates $ Estimates $
1985 9,071,051,990 982,823,006 11% 1,350,000 733,099 54%1986 9,133,587,919 828,311,362 9% 1,300,000 254,371 20%1987 9,425,000,048 1,005,780,685 11% 103,623,000 40,438,347 39%1988 7,905,830,085 952,623,746 12% 130,404,000 64,916,990 50%1989 6,587,763,841 831,057,307 13% 94,200,000 71,320,529 76%1990 7,069,881,861 844,117,219 12% 92,853,250 61,112,280 66%1991 7,611,164,672 925,898,272 12% 81,001,000 73,699,504 91%1992 7,999,518,497 843,391,500 11% 61,100,000 38,773,006 63%1993 8,410,769,971 797,761,513 9% 40,707,000 30,591,475 75%1994 10,507,914,868 1,018,094,645 10% 97,185,000 942,029,957 97%Source: Ministry of Finance.
00
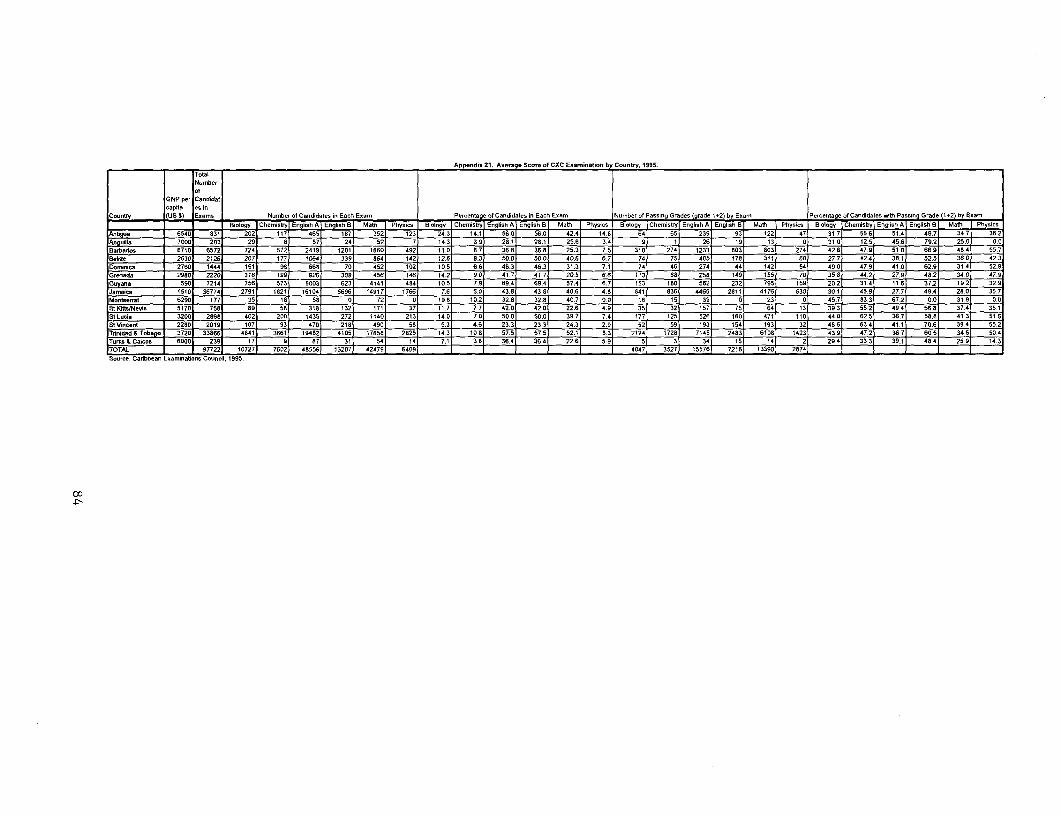
______________ _____________________________________________________ Appendin 21.pp.edig 2ScoAe.of CS..E ofiCXCi by Cy ... nly, 199 55
orGNP per C.ndidolcapita es in
Coon, (US 5) Ex.nr Nornbe,of C.ndid.tes in E-ch E.-, Percenlg of C-ndid.tes in Ea-h E...o Norober of P ... ing G,ae (gra,Je 102) by Eor 5
e,c-tge of Ca,did.tesoelthP.snin Glade (In2) by BE.Biology Che,r,i,,y EgqlisehA English BI Math Physics Biology Clhe-nsy E,nglish A En,glish, B MothI Physics Biology Chemisoy Engli.h A E,,glimh B Mathl Phyn.cs Biology Che,n.tsy English AI Englih BI MolIh Physics
AlbgS 6 540 831 202 117 465 187 352 123 24.3 174.1 55. 55.0 42.4 14 B 64 65 239 93 122 47 31.7 55.5 51.4 45.7 34.7 30.2Ang.ilIa 7000 _ 203 29 a 57 24 - 52 7 14.3 3.9 28.1 29.1 25.51 3.4 5 1 25 1 9 1 3 - 0 310 1Oi2.5 45.5 75.2 25.0 0.0B.rbados 6 7101 5572 724 572 - 2419 1201 1650 492 II 0 5.7 35.5 3558 25.3 7~5 310 274 1233 803 8503 274 4298 47.5 51.0 56.9 _45.4 55.71Sek- ~ 25301 2125 257 177 1054 330 054 142 12.6 0.3 50.0 50.0 40.6 6.7 74 __ 75 405 170 311 h0 27.7 42.4 30. 1 02.5 35.0 42.3Dominica 2750 1444 151 95 BBS 70 452 102 1.5. 5.5 45.3 45.3 31.3 7.1 __ 74 46 274 44 142 54 45.0 47.9 41.0 92.9 31.4 52.91Grenad. 20980 2220 319 l99 026 309 456 t45 14.2 0.0 41.7 41.7 20.5 6.6 113 88__0 250 149 108 70 35.9 44.~2 27.9 49.2 34 0 47.91C ana 590 7214 756 573 5003 623 4141 484 10.5 7~9 59.4 694 57.4 5.7 153 ISO 582 232 795 159 20.2 31.4 11 B 37.2 19.2 32.5Jamnica -1510 36774 2791 1821 16104 56994 14917 1754 7.65 5.0 43.8 43.0 40.5 4.8l 041 536 4440 2911 4170, 530 301l 45.9 27.7 49.4 29.0 35.7Monlsnerrat 5290 1771 35 19 a Sa - 0 721___ 0 i 9.0 10.21 32.9 32.8 40.7 0.0 156 1 5 39 - 0 23 0 45.7 83.3, 57.2 0.0 31.9 0.5St K",IyNeol 5170 759 sq9 50, 3151 132, 171 1 37 11.7 7.7( 42.0 42.0. 22.5 48w6_ 5 3 5 5 5 3 93 5. 54 5. 74 3.
S1La~~~~a ~3200 2849 4021 205 1 4351 272 11401 213 1450 7.5 5. 0 97 7. 7 3 2 9 41 10 40 5. 37 5. 13 5.SlVmncenl ~~~2280 20191 107 93 07 218 9 5 53__ . 33 2.3 2. . 2 6 5 5 4 2 95 9. 11 7. 94 5.
T4nidad&Tnba - 3720 339551 48411 35511 104921 41051 17958 295 1. 50 5. 75 5. . 14 12 14 43 55 43 49 4. 57 9. 45 5.Tsrkn&Coicos 9~0205 2391 171 91 871 3 4 1 . _ . 94 3. 2 . 4 1 42 2. 3 91 44 2. 4
Suc:Ca4bbea- Eaminations C-unc, 1995.
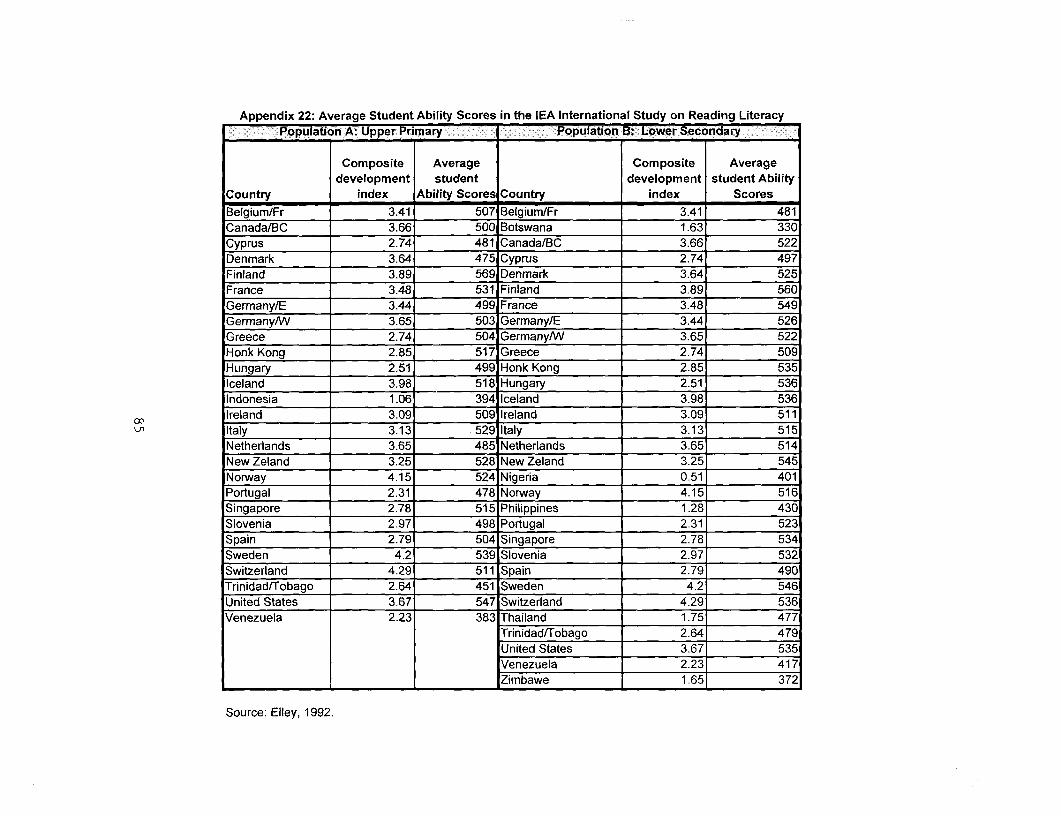
Appendix 22: Average Student Ability Scores in the IEA International Study on Reading LiteracyPopulation A: Upper Primary Population B: Lower Secondary
Composite Average Composite Averagedevelopment student development student Ability
Country index Ability Scores Country index ScoresBelgium/Fr 3.41 507 Belgium/Fr 3.41 481Canada/BC 3.66 500 Botswana 1.63 330Cyprus 2.74 481 Canada/BC 3.66 522Denmark 3.64 475 Cyprus 2.74 497Finland 3.89 569 Denmark 3.64 525France 3.48 531 Finland 3.89 560Germany/E 3.44 499 France 3.48 549GermanyNw 3.65 503 Germany/E 3.44 526Greece 2.74 504 Germany/W 3.65 522Honk Kong 2.85 517 Greece 2.74 509Hungary 2.51 499 Honk Kong 2.85 535Iceland 3.98 518 Hungary 2.51 536Indonesia 1.06 394 Iceland 3.98 536
co Ireland 3.09 509 Ireland 3.09 511U' Italy 3.13 __ 529 Italy_ 3.13 515
Netherlands 3.65 485 Netherlands 3.65 514New Zeland 3.25 528 New Zeland 3.25 545Norway 4.15 524 Nigeria 0.51 401Portugal 2.31 478 Norway 4.15 516Singapore 2.78 515 Philippines 1.28 430Slovenia 2.97 498 Portugal 2.31 52Spain 2.79 504 Singapore 2.78 534Sweden 4.2 539 Slovenia 2.97 532Switzerland 4.29 511 Spain X _ 2.79 490Trinidad/Tobago 2.64 451 Sweden 4.2 546United States 3.67 547 Switzerland 4.29 536Venezuela 2.23 383 Thailand __ 1.75 477
Trinidad/Tobago 2.64 479United States 3.67 535Venezuela 2.23 417Zimbawe 1.65u e
Source: Elley, 1992.

I