Embed Size (px)
Citation preview
Report No. 21391
Costa RicaCountry Assistance Evaluation
November 16, 2000
Operations Evaluation Department
Document of the World Bank
Abbreviations
ASIL Agricultural Sector Investment LoanCAE Country Assistance EvaluationCLASC IFC's Latin America and Caribbean DepartmentCNP Agriculture Marketing Agency (Consejo Nacional de Producci6n)CODESA Costa Rican Development Corporation (Corporaci6n
Costarricense de Desarrollo)ESW Economic and Sector WorkFAO Food and Agricultural Organization of the United NationsFIAS Foreign Investment Advisory ServiceGDP Gross Domestic ProductGNP Gross National ProductIADB Inter-American Development BankICR Implementation Completion ReportIFC International Finance CorporationIMF International Monetary FundINS National Insurance Company (Instituto Nacional de Seguros)LCR Latin American & Caribbean Regional OfficeOED Operations Evaluation DepartmentPAR Performance Audit ReportPSR Project Status ReportPUSC Partido Unidad Social CristianaSAL III Third Structural Adjustment LoanUSAID United States Agency for International Development
Director General, Operations Evaluation Mr. Robert PicciottoDirector, Operations Evaluation Department Mr. Gregory K. IngramManager, OEDCR: Mr. Ruben LamdanyTask Manager: Mr. Luis Ramirez
The World BankWashington, D.C. 20433
U.S.A.
Office of the Director-GeneralOperations Evaluation
November 16, 2000
MEMORANDUM TO THE EXECUTIVE DIRECTORS AND THE PRESIDENT
SUBJECT: Costa Rica: Country Assistance Evaluation
Costa Rica is a presidential democracy with a strong legislative assembly committed to growth,
the environment and social welfare. It has been a pioneer in incorporating women into the process of
development and in making environmental protection profitable for the country. Its economic and socialindicators show better results than those in all other lower-middle-income Latin American countries.Historically, however, the pace of reform has been slow and driven by a highly democratic process of
achieving consensus. This process has avoided backtracking after reforms have been adopted.
The Bank and the government agree on the broad objectives of the development strategy and on
the main elements of the policy agenda. The policy dialogue, however, has suffered because ofdisagreements on the urgency or political feasibility of some of the required structural reform measures,especially, after two important adjustment loans were cancelled in 1994-95 before they could be made
effective.
The 1993 CAS was based on a correct diagnosis of Costa Rica's long-term development problems
and included relevant objectives. The outcome, however, was unsatisfactory because the strategyincluded poorly designed structural adjustment lending instruments. It overlooked the lessons ofexperience and it ignored the political conditions that determrined ownership of the reforms. Following a
deadlock on the macro-policy dialogue, the Bank failed to assist Costa Rica, as originally planned, in
transport, urban development, female education, and forestry and bio-diversity investment projects. Theplanned econornic and sector work was also only partially delivered. At the Government's request, the
Bank relied only on non-lending services, mainly financed through grant facilities, and advised thecountry on several technical matters. The government continued to advance toward the strategy'sobjectives, at its own pace and with financial assistance from other donors and domestic borrowing.
Historically, most of the Bank's portfolio in Costa Rica has produced satisfactory developmentoutcomes. In particular, 100 percent of Costa Rica's US$310 million portfolio evaluated by the Bank
during 1993-99 has achieved satisfactory development outcomes. This seems to indicate that Costa Rica'scharacteristically slow pace of reform has not prevented good performance in projects. Many challenges,however, still remain. The government remains unable to reduce the fiscal deficit in a sustained way, thepublic domestic debt is excessive, and the state still plays a major role in production and financialactivities. The financial sector, infrastructure, urban administration, conservation and social programsstill call for long-term capacity development and policy reform. Health and education, once the envy ofother Latin American countries, have recently deteriorated.
Given these needs and Costa Rica's adequate overall project performance, the Bank should be ableto intensify its lending and ESW program by reviving its earlier plans to invest in forestry and bio-diversity, transport, urban development and female education. Most of these areas have in common thatthe expected social and economic benefits of investments are high and reasonably unaffected by CostaRica's traditionally slow pace of structural reform. The Bank should also consider lending support to
Contents (cont'd.)
Annexes
A. Statistical Tablesla. Costa Rica at a Glance 19lb. Costa Rica Social Indicators 222. Costa Rica Key Economic Indicators, 1988-1997 233. ESW list (1988-1998) 244. OED Summary Ratings for Costa Rica since 1988 255a. OED Evaluation Portfolio 265b. World Bank Project Ratings Sorted by Sector, FY88-FY88 276. PBD Infornation, 1988-1998 287. Bilateral ODA Commnitments 298. Bank Management for Costa Rica, 1990-1999 309. Costa Rica-Grants Summary 3110. IFC Activity FY91-99 3211. IFC Trust Fund Activity FY91-99 32
Attachment1. Report from CODE 33
i
Preface
This country assistance evaluation (CAE) assesses the relevance, efficacy andefficiency of the World Bank's assistance strategy for Costa Rica in the 1990s. It alsoexamines the influence that the strategy for thel980s had on determining the relevanceand effectiveness of the strategy for the 1990s. To assess relevance, the CAE examinesthe diagnosis of Costa Rica's long-term development problems at the time the Boardapproved the last country assistance strategy in 1993 (CAS 93). It also examines theobjectives of the 1993 strategy and their relationship with its lending and non-lendinginstruments. To assess efficacy, the CAE examines the progress achieved so far towardimplementing the strategy's objectives. To assess efficiency, the CAE compares the costfor the Bank of handling Costa Rica's program with its cost for similar lower-middle-income Latin American countries.
The objective of this CAE is to examine the relationship between the Bank andCosta Rica in the past in order to derive lessons for designing the future Bank countryassistance strategy. Its findings are based on a review of Bank documents, countryassistance strategy papers (CASs), implementation completion reports (ICRs),performance audit reports (PARs), supervision reports, and project files. The findings ofthe CAE are based also on interviews with government officials and Bank staff who wereassociated with Costa Rica in the 1990s.
An OED mission visited Costa Rica in June 2000 and discussed this report with theauthorities. Their comments have been incorporated. OED also discussed the mainfindings with former Government officials, members of the opposition and civil society.

1. Background
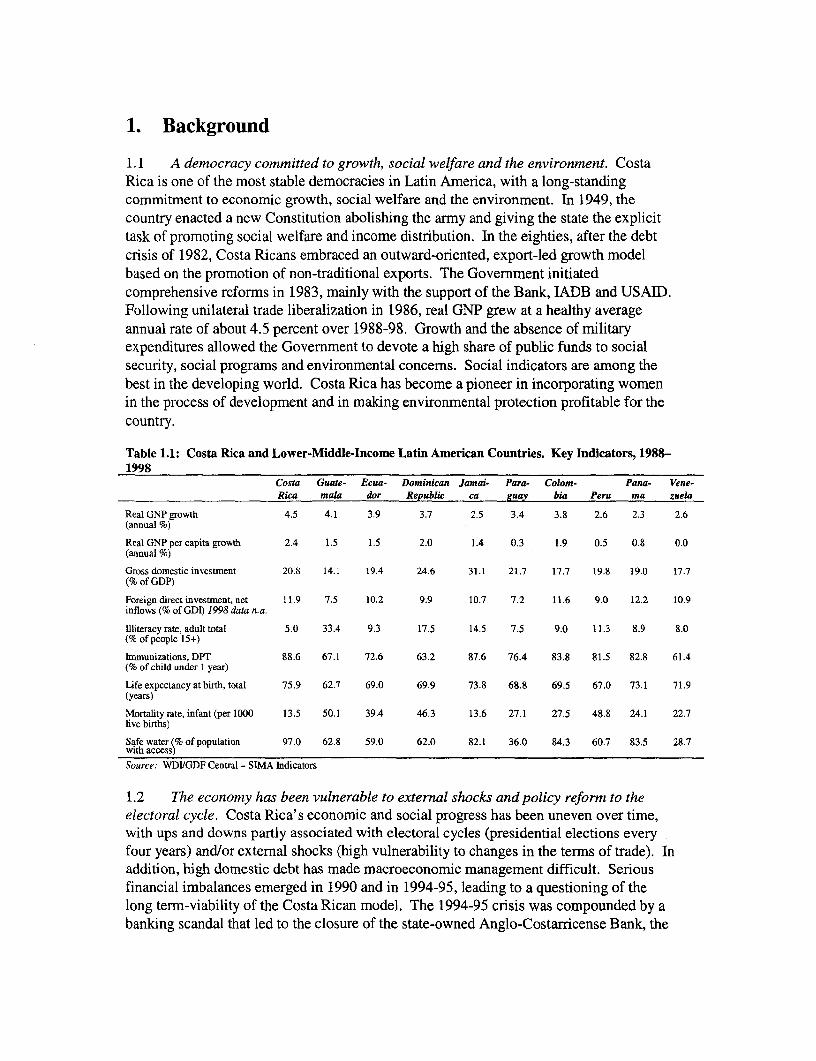
1.1 A democracy committed to growth, social welfare and the environment. CostaRica is one of the most stable democracies in Latin America, with a long-standingcommitment to economic growth, social welfare and the environment. In 1949, thecountry enacted a new Constitution abolishing the army and giving the state the explicittask of promoting social welfare and income distribution. In the eighties, after the debtcrisis of 1982, Costa Ricans embraced an outward-oriented, export-led growth modelbased on the promotion of non-traditional exports. The Government initiatedcomprehensive reforms in 1983, mainly with the support of the Bank, IADB and USAID.Following unilateral trade liberalization in 1986, real GNP grew at a healthy averageannual rate of about 4.5 percent over 1988-98. Growth and the absence of militaryexpenditures allowed the Government to devote a high share of public funds to socialsecurity, social programs and environmental concerns. Social indicators are among thebest in the developing world. Costa Rica has become a pioneer in incorporating womenin the process of development and in making environmental protection profitable for thecountry.
Table 1.1: Costa Rica and Lower-Middle-Income Latin American Countries. Key Indicators, 1988-1998
Costa Guate- Ecua- Dominican Jamai- Para- Colom- Pana- Vene-Rica mala dor Republic ca guay bia Peru ma zuela
Real GNP growth 4.5 4.1 3.9 3.7 2.5 3.4 3.8 2.6 2.3 2.6(annual %)
Real GNP per capita growth 2.4 1.5 1.5 2.0 1.4 0.3 1.9 0.5 0.8 0.0(annual %)
Gross domestic investment 20.8 14.1 19.4 24.6 31.1 21.7 17.7 19.8 19.0 17.7(% of GDP)
Foreign direct investment, net 11.9 7.5 10.2 9.9 10.7 7.2 11.6 9.0 12.2 10.9inflows (% of GDI) 1998 data n.a.
Illiteracy rate, adult total 5.0 33.4 9.3 17.5 14.5 7.5 9.0 11.3 8.9 8.0(% of people 15+)
hmmunizations, DPT 88.6 67.1 72.6 63.2 87.6 76.4 83.8 81.5 82.8 61.4(% of child under I year)
Life expectancy at birth, total 75.9 62.7 69.0 69.9 73.8 68.8 69.5 67.0 73.1 71.9(years)
Mortality rate, infant (per 1000 13.5 50.1 39.4 46.3 13.6 27.1 27.5 48.8 24.1 22.7live births)
Safe water (% of population 97.0 62.8 59.0 62.0 82.1 36.0 84.3 60.7 83.5 28.7with access)
Source: WDV/GDF Central - SIMA Indicators
1.2 The economy has been vulnerable to external shocks and policy reform to theelectoral cycle. Costa Rica's economic and social progress has been uneven over time,with ups and downs partly associated with electoral cycles (presidential elections everyfour years) and/or external shocks (high vulnerability to changes in the terms of trade). Inaddition, high domestic debt has made macroeconomic management difficult. Seriousfinancial imbalances emerged in 1990 and in 1994-95, leading to a questioning of thelong term-viability of the Costa Rican model. The 1994-95 crisis was compounded by abanking scandal that led to the closure of the state-owned Anglo-Costarricense Bank, the
2
oldest and third largest commercial bank in the country. Foreign investors complain ofexcessive bureaucracy, expensive labor costs and too much government involvement inthe economy. In spite of this, foreign private investment continues to expand due toCosta Rica's relative political stability, commitment to economic openness, excellenteducational system, market access, and high quality of its labor force.
1.3 Costa Rica's reform program is shaped by uncertain political consensus. CostaRica is a presidential democracy with a strong Legislative Assembly. The currentPresident-Miguel Angel Rodriguez, elected for a period of four years- assumed officeon May 8, 1998. The Government's political organization, headed by the Partido UnidadSocial Cristiana (PUSC), does not hold a majority in Congress. The Government hasrelentlessly exerted itself to achieve consensus on a reform package during the first 18months of its administration. Yet, it has faced strong political challenges to get supportfor its reform program. The need for wide political consensus cannot be overemphasized,as many reforms in the past have failed due to lack of Congressional support. This isprobably the main factor behind the slow pace of structural adjustments, in a countrywhere most of the population seems to favor these reforms.
2. The Reform Program
2.1 The economic program before 1982. Costa Rica's economic development modelbefore 1982 was based on heavy involvement of the state in a wide range of activities andupon import substitution industrialization with high barriers to trade. Economic andsocial conditions improved continuously for over twenty years. Nevertheless, after astrong decline in coffee prices in 1978 and the oil crisis in 1979, Costa Rica did not adjustpublic expenditures accordingly. At this time, import substitution was reaching its limitsand external financing from commercial banks was drying up. The Government wasforced to suspend servicing its external debt. This led to a major crisis that exposed thestructural weaknesses of the Costa Rican economy. In dealing with the crisis, theGovernment initiated a stabilization program supported by the EMF in 1982 and astructural adjustment program supported by the Bank, IADB, and USAID in 1983.
2.2 Structural reforms of 1984-93. Oriented toward liberalizing international tradeand reducing the role of the state in productive activities. The main objective of CostaRica's reform program after the 1982 crisis was to overcome two severe impediments togrowth: the anti-export bias of the trade regime and an overextended and inefficientpublic sector. The reforms aimed at reducing effective protection, increasing incentivesto exporters, reducing the role of the public sector in production, and improving theefficiency of public sector institutions. The Government was committed to reducingexport taxes, maintaining a competitive exchange rate and decreasing the level anddispersion of import taxes. It was also committed to maintaining a freeze on public sectoremployment and limiting the practice of revenue earmarking. In addition, it pledged tostreamline the public investment program, reduce the Agricultural Marketing Agency's
3
(CNP) losses and divest enterprises owned by the Costa Rican Development Corporation(CODESA).
2.3 Structural reforms of 1994-99. Oriented toward tax, expenditure and pensionreformns, restructuring the public sector, increasing private sector participation andadvancing financial sector reforn. Successive Governments have long recognized thatCosta Rica's vulnerability to external and domestic shocks is exacerbated by structuralweaknesses in the public sector. Hence, the Government's agenda for reform during1994-99 gave priority to re-defining the role of the state and improving the efficiency ofprivate markets, while continuing to provide for poverty alleviation and protecting theenvironment. President Jose M. Figueres (1994-98) had to deal with a banking crisis andan unsustainable fiscal deficit. In spite of political difficulties, the Government was ableto continue the trade liberalization program, improve fiscal discipline through tax,expenditure and budgetary reforms, and managed to attract a significant volume offoreign direct investment in high-tech industries. The Government of President MiguelAngel Rodriguez (1998-2002) has given high priority to move forward financial sectorreforms and to open public enterprises to competition with the private sector.Specifically, important areas for reform include changes to the banking and socialsecurity systems and to the regulatory framework to allow private participation in publicutilities and natural monopolies controlled by the state. The authorities, however, havenot yet been able to gamer congressional support for all of these reforms. Furtherinfrastructure development, better targeting of social programs and increased participationof the private sector in environmental protection are also high in the Government'sagenda.
Box 2.1: Costa Rica Relations with the IMF
In thel990s, the IMF approved three Stand-by operations and one staff-monitoring program forCosta Rica. The Government of Costa Rica did not draw from the last two precautionary Stand-byoperations approved in April 1993 (SDR21.04 million) and in November 1995 (SDR52.00 million)respectively. The staff monitored program was in place between October 1997 and April 1998 to facilitatethe transition to the administration of President Rodriguez, which took office in May 1998.
The last Staff Report for the 1999 Article IV Consultation was presented to the IMF Board inSeptember 1999. The staff appraisal concluded that "Costa Rica made significant progress in opening upthe trade system, diversifying its export base, attracting foreign investment, and improving socialconditions. However, successive administrations have been unable to reduce the fiscal deficit on asustained basis and deepen structural reforms. Moreover, the economy has remained vulnerable because ofthe relatively large domestic public debt with short-term maturity."
3. The Country Assistance Strategy
3.1 Three stages of assistance strategy. The Bank's assistance strategy to Costa Ricacan be divided in three distinct periods: First, the pre-structural adjustment stage, i.e.,before the debt crisis of the early 1980s. Second, the structural adjustment stage, i.e.,
4
after the crisis, from 1983 to 1993. Third, the present stage, i.e., from 1993 to date.Before 1980, the Bank's assistance to Costa Rica was concentrated on basic infrastructureand agricultural development. After the crisis of the early eighties, the Bank concentratedon quick disbursing lending to support structural reforms. Project lending was deferredand made conditional on satisfactory progress during the implementation phase of thestructural reform program.' After 1993, the Bank's assistance was expected toconcentrate on one last structural adjustment loan, ESW, and several selective sectorinvestment loans that would be used as vehicles for sector policy reforms. This lastperiod, however, has been characterized by a large undelivered lending program (seepara. 4.8), strong negative net disbursements (see para 4.17), and reduced but influentialESW (see para. 4.16). Informal advice, on the other hand, increased notably.
3.2 The policy dialogue before the Country Assistance Strategy of 1993 (CAS 93).The most significant event shaping today's assistance strategy derives from the evolutionof the relationship between Costa Rica and the Bank during the structural adjustmentstage (1983-1993). During this stage, the policy dialogue and the lending programbecame hostage to the country's slow progress at achieving structural reforms. Theexperience of appraisal, negotiation, signing, implementation and completion of SAL I(1985-86) and SAL II (1988-92) were not trouble-free. The performance of these loanswas characterized by protracted negotiations during appraisal, delayed approval andeffectiveness, and serious implementation and supervision problems. In addition, sinceproject lending had been made conditional to structural adjustment performance, theoverall Bank-country relationship suffered. Prolonged negotiations led to designproblems for both loans. The need for the authorities to seek National Assembly approvalfor foreign borrowing and for loan conditions led to implementation delays, to non-fulfillment of some conditions, and to a general deterioration of the policy dialogue. Theexperience of the Agricultural Sector Investment Loan (ASIL) was also difficult: Theproject originated in 1988/89 through an Identification Report prepared by FAO/WB'sCooperative Program and an Agricultural Sector Report prepared by the Bank. Afterseveral preparatory missions, the Bank appraised the project in April 1991, negotiated itfor two months in late 1991, approved it in March 1992 and, after several extensions ofeffectiveness deadlines, terminated it on April 1994. The project never became effective.
3.3 Lessons learned before CAS 93. Three main lessons had emerged from OED'sevaluation of the Costa Rican experience before the 1993 CAS:
* Key reforms requiring approval by Costa Rica's National Assembly should be actedupon before Board presentation and not as a condition for effectiveness or disbursement.Given Costa Rica's institutional environment, wide social support is needed to getNational Assembly approval and to implement reforms. This is a slow process, betterpursued without external involvement. Consensus is achieved quickly during a crisis, butapproval under duress, such as in 1991 with SAL I, led to policy reversal later. OEDfound that under normal circumstances, a slow and deliberate process of participation andconsensus building has been positive, leading to no backtracking after reforms have been
1. Bank's Assistance: Past experience. President's Report of SAL 111, March 1993.
5
adopted.2 In addition, as often pointed out by the Bank's legal department, conditionsagreed with the Executive should be strictly under control of the Executive and notdependent upon Congress approval.3
* In Costa Rica's case, it may not always be appropriate to link potentially productiveindividual projects to broad sector-policy reforms. For example, the project completionnote of ASIL concluded that the success of the project did not depend upon compliancewith broad trade and price reforms which had been made into conditions of effectiveness.These conditions were not met in time for the ASIL to become effective and the Bank lostan opportunity to support a potentially good project. Project components includedagricultural research and extension, land titling, rural infrastructure and institutionaldevelopment. These activities would have had high social and economic returns even ina policy environment with price distortions.4 On the other hand, when trade and pricepolicies are crucial for the results of an investment project, the Bank should ensure thatthe proper environment is in place before the project is approved, but not as condition foreffectiveness.
* Loan conditions should be precise, meaningful and address the root cause of aproblem rather than its symptoms. As such, conditions should be complemented with anagreed action program indicating how to achieve the targets and how to measure reliableindicators of progress. The government freeze on employment agreed under SAL I andthe target for public sector savings of SAL II were not very effective since there was nounderstanding of how the targets were going to be achieved and there were not adequatemonitoring indicators to measure progress.
3.4 The 1993 Country Assistance Strategy. The current Country Assistance Strategy(CAS 93) was presented to the Board in conjunction with a proposal for a ThirdStructural Adjustment Loan (SAL M) for US$100 million on March 10, 1993.5According to the strategy, the third SAL would be the last quick disbursement lendingoperation to Costa Rica. The strategy also proposed to focus on a highly selectiveinvestment program based upon the Bank's comparative advantage at the time.Individual investment projects and ESW would provide the vehicles for sector policyreforms. The overall program was contingent on the Government maintaining anappropriate macroeconomic framework and on a successful implementation of thestructural adjustment program. Total Bank lending to support this program over FY93-97would amount to about US$280 million.
2. OED, Report No 13263, PAR of Structural Adjustments Loans I and II, June 30, 1994, ch.4.3. Past and current government officials have pointed out to OED that they and their World Bank counterparts hadbeen aware of this constraint since at least the late 1980s, through the experience with SALs I and II.4. In theory, if the Net Present Value of a project measured at appropriate shadow prices is higher than the project'sopportunity cost, the project is economically justified. Appropriate shadow prices correct for price distortion in adistorted policy environment. As distortions are gradually eliminated, actual and shadow prices would tend toconverge. In fact, price distortions were eventually reduced when bipartisan political support for agricultural policyreforms was achieved after May 1994. The Bank, however, could not postpone conditions for effectiveness becausethese conditions had already been postponed earlier and were two years beyond signing.5. A simnilar assistance strategy had been prepared by the Region in October 30, 1992 in the form of a self-standingcountry strategy paper (CSP).
6
3.5 The reform program supported by CAS 93. Costa Rica's reform programsupported by SAL m included actions for public sector reform, poverty alleviation, tradeand regulatory framework and financial sector reform. The Government and the Bankfully agreed at the time-and continue to agree today-that these reforms are necessary"to reduce Costa Rica's vulnerability to external shocks and the recurrence ofmacroeconomic disequilibria prompted by inappropriate fiscal policies". On the povertyalleviation front, the reforms would "enable Costa Rica to resume progress in reducingpoverty [... ] while at the same time limiting the fiscal cost of ensuring a more equitablesociety" (President's Report, SAL E11).
3.6 The investment program supported by CAS 93. Investment projects included awater and sanitation project to rehabilitate infrastructure and improve management, costrecovery and the environment. A health project to improve management and healthdelivery by the private sector and to develop cost recovery instruments. A forestry andbio-diversity project to support forestry policy, institutional strengthening and bettermanagement of ecological resources. A transport project to improve infrastructure andmanagement, and to replenish transport sector investment resources (reallocated earlier toearthquake reconstruction from an existing transport project). An urban project to focuson urban transportation, environment, housing and municipal improvement. Finally, aproject in education to improve quality at the secondary level and expand opportunitiesfor female education.
3.7 The economic and sector work (ESW) program supported by CAS 93. The ESWprogram proposed by CAS 93 was expected to produce a Country EconomicMemorandum to focus on public sector reform. This report was needed to define thepolicy agenda for discussion with the Government of President Jose M. Figueres that tookoffice in May 1994. An ongoing forestry sector review would support an operation toimprove forestry and bio-diversity management. An urban sector study would help definepolicies to be included under a proposed urban project. Finally, a Poverty Assessmentstudy would review progress in poverty alleviation and seek improvements in targetedinterventions and the poverty orientation of social spending.
4. Evaluating the Strategy
Outcome of Bank Assistance
4.1 The outcome of CAS 93 was unsatisfactory, although the strategy has regainedsome relevance lately. Due to initial design flaws in the strategy, the Bank could notdeliver most of its lending and economic and sector work during a difficult period thatlasted some time after the cancellation of SAL III in 1995. The strategy was faultybecause it included inappropriate adjustment lending instruments and poorly designedreforms, including the passage of legislation as a condition to be met after Board approvaland before loan effectiveness. As the period progressed, however, the policy dialogueimproved. The government explicitly requested the Bank to reduce lending and toincrease technical advice. The Region believes this request was due to a lack of
7
counterpart funds in light of Costa Rica's fiscal position. While this was the case in 1995when the Govemment had to cut public investment very drastically to cope with thefinancial crisis, it was less so in 1996 and thereafter. OED, on the other hand, believesthat the authorities were uninterested in Bank lending because of their perception that itwould be difficult to reach agreement with the World Bank on a feasible program, in lightof their experience with SAL Im. The Bank, accordingly, supported the objectives of thestrategy mainly through non-lending services, providing advice to implement thosereforms that had achieved political support and contributing with studies to help achieveconsensus on those reforms still under discussion in the Assembly. The country hascontinued to implement reforms at its own pace, with financial assistance from otherdonors, domestic borrowing and, lately, by selling bonds in the international capitalmarket. In fact, the government has achieved many of the SAL In objectives, but has leftother relevant objectives undone, pending the nurturing of a political consensus.
Relevance
4.2 Highly relevant objectives, but poor design. OED concludes that the BankCountry Assistance Strategy reviewed by the Board on March 1993 was based on acorrect diagnosis of Costa Rica's long term development problems and included highlyrelevant objectives. Nevertheless, the CAS 93 included inappropriate lendinginstruments, overlooked lessons of experience and ignored political conditionsdetermining ownership of the program. Consequently, the Bank was unable to delivermost of its proposed ESW and lending program and the policy dialogue deteriorated.Lately, however, the strategy has regained relevance and the policy dialogue hasimproved. The Bank provided advice on several technical matters, responding quickly tomany formal and informal requests made by the authorities. The lending program,however, still needs improvement and the process by which the Bank provides adviceneeds to be revised. In particular, studies financed through grant facilities and the adviceprovided should be submitted to at least as rigorous a process of quality assurance as thatexpected from ESW.
4.3 Agreement about diagnosis and objectives, but not about urgency or politicalfeasibility. The Government of Costa Rica and the Bank have an excellent understandingof Costa Rica's long term development problems, and fully agree on the broad objectivesof the development strategy. They have also had a general agreement on the mainelements of the policy agenda. Nonetheless, the Bank and the Government have oftendisagreed on the urgency and feasibility of some of the specific measures required.Policy makers have felt that the required institutional changes will take many years toimplement. Meanwhile, social and economic indicators continue to perform better thanin other countries. A sense of urgency is not always present. The policy dialogue hassuffered because different perceptions of urgency have made the process of appraisal,negotiations, signing, effectiveness, implementation and supervision of SAL operationsextremely slow and difficult. The policy dialogue has also suffered because many agreedmeasures could not be fully implemented, and the Bank felt forced to compromise inorder to find solutions that would permit disbursement releases without full compliance
8
to SAL conditions.6 In the process, over the last fourteen years, both sides haveaccumulated displeasure with the outcome of Bank-financed structural adjustment.
4.4 CAS 93 included inappropriate lending instruments. The Structural AdjustmentLoan m1 (US$100 million) and the Agricultural Sector Investment and InstitutionalDevelopment Project7 (US$41 million) were not appropriate instruments to pursue theproposed objectives. SAL III included comprehensive institutional reforms in the public,financial and social sectors. While these reforms could not possibly be carried out duringthe normal disbursement profile of one quick disbursement SAL, CAS 93 explicitly ruledout any further structural adjustment lending. SAL m also included reforms to the publicsector, which required Congress approval that led to delays and finally forced thecancellation of the loan. ASIL was an investment loan linked to broad sector conditionsnot directly related to its investment activities. Those conditions, in the context of CostaRica's political environment, prevented effectiveness of a potentially good project twoyears after its approval.
4.5 CAS 93 included poorly designed reformns in spite of available lessons ofexperience. The lessons of experience show that Costa Rica has always been a slowreformer, but also that the Bank has been a slow learner. The assistance strategyreviewed by the Board in 1993 was closely associated to the design of SAL Im (March 10,1993). In spite of about nine years of earlier bad experiences and of explicitrecommendations to the contrary,8 SAL Im included the passage of legislation as acondition to be met after Board approval and before loan effectiveness. Bank staff hadinsisted during negotiations that these conditions should be met before the loan was to bepresented to the Board for approval, but LCR (Latin American & Caribbean RegionalOffice) senior management overruled the staff and the Board approved the loan aspresented to them by senior management. This was a mistake. The Bank had to extendthe deadline for effectiveness of SAL mII six times while waiting for the authorities toachieve the required passage of legislation by the National Assembly. After that, theBank could not declare the loan effective and had to cancel it two years after Board
6. Although "three major conditions of second tranche release had not been met ... [ ].. there was pressure to disbursesoon, in order not to jeopardize an IMF program nor to disrupt relations with the private external creditors banks".Performance Audit Report No 13263, June 30, 1994.7. The Agricultural Sector Investment and Institutional Development Project did not strictly belong to the FY 93-97lending program proposed by CAS 93. The Board had approved this loan on March 1992. Nevertheless, the loan hadnot become effective at the time of CAS 93, which reported that the loan had been subrnitted to the Assembly forratification.8. The Loan committee had recommended, as far back as 1984, that "key conditions of SAL I requiring Assemblyapproval should be approved (by the Assembly) before Board presentation". Bank management did not follow up withthis recommendation. OED's performance audit reports concluded that the Bank was forced to delay effectiveness ofSAL I because the Assembly did not approve on time an accompanying technical assistance loan which had been madea condition for effectiveness of SAL 1. In addition, three major conditions for the release of the second tranche of SALI -one of which being tariff reform- did not achieve Assembly's approval. The effectiveness of SAL It was alsodelayed for about one year for the same reason, a requirement for the Assembly to approve a tariff adjustment program.Effectiveness of ASIL, approved by the Board in March 1992, had already been delayed for about one year by the timeCAS 93 was presented to the Board due to similar difficulties. The Assembly did not approve agricultural trade andprice reforms. Given all the available evidence, it is hard to understand why the design of SAL III required the passageof legislation after Board approval and before effectiveness. OED could not find documentation justifying thisdecision.
9
approval. The policy dialogue deteriorated and affected negatively the overall lendingand non-lending program of the 1993-99 period.
4.6 CAS 93 ignored political conditions. The Bank assistance strategy wasundermined by a poor appreciation of the political conditions determining ownership ofthe reform program. The Project Completion Note of SAL m concluded that the loanwas terminated because the program was designed, negotiated and signed by oneAdministration. Its implementation, however, was left to a new Administration that had amarkedly different approach to the issues involved.9
4.7 Lately, the policy dialogue has improved. After the initial failure of CAS 93, theBank has made significant efforts at improving the assistance strategy and improving thepolicy dialogue by providing technical advice and responding quickly to many formal andinformal requests made by the authorities. The Bank has provided an array of non-lending services to support pension and financial sector reforms, foreign investment,energy, environment, forest conservation, bio-diversity, social programs, health,education, gender, rural electrification, postal services and information technology. Theadvice has sometimes been informal, has not been subjected to the same rigorous scrutinyby Bank peer reviewers as that expected from ESW, and has not been subjected to formalex-post evaluation by the Bank. Bank staff, however, has supervised the selection ofconsultants and the delivery of technical advice. Most of this assistance, has become animportant source of advice to implement reforms that achieved political consensus and asource of information to help achieving consensus on policy matters still underdiscussion.
Efficacy
4.8 Costa Rica has achieved satisfactory progress toward the objectives of CAS 93with minimal financial support from the Bank. OED concludes that Costa Rica hasadvanced significantly toward many of the objectives proposed under the strategy ofCAS 93. This progress was achieved in spite of minimal financial support from theBank. The Bank Board approved only two loans for US$38 million in 1993 after SAL III,and nothing since (see Table 5b). The Bank, however, as mentioned above, hasintensified its efforts at providing assistance through several grant programs, especiallyfrom the Global Environmental Facility, Human Resources Development andInstitutional Development grants. A total of about US$19 million in twenty grants fromthese different facilities have been approved between FY93 and June 30, 1999.10 Inaddition, IFC and FIAS have contributed to develop opportunities to attract privateforeign investment and expand private sector activities (see Box 4.1).
9. Project Completion Report No. 12952 of April 12, 1994 and OED's Performance Audit Report No. 13263 of
June 30, 1994.10. See Costa Rica- Grants summary, Annex A, Table 9.
10
Box 4.1: IFC's Portfolio has Achieved Satisfactory Outcome
The Strategy and Coordination unit of IFC's Latin America and Caribbean Department (CLASC) concludedthat, "despite a less than satisfactory enabling environment, IFC has been able to satisfactorily meet thedevelopment impact objectives of its projects in Costa Rica."
IFC has financed relatively small projects in Costa Rica in the 1990s (average size of about US$5 millioneach), except for a US$40 million investment for the expansion of a retail operation in FY99. Its totalportfolio of US$66.3 million is high, as a percentage of GDP, compared to IFC's portfolio in LatinAmerica. Recently, IFC has prepared Investment Evaluation Reports for two projects in the financialsector, both with satisfactory development outcome. These projects supported export oriented small andmedium private enterprises and contributed to capacity building in domestic banks.
IFC's future activities in Costa Rica depend mainly upon Costa Rica's pace of reform in opening newsectors, such as infrastructure, to private participation. In the interim, IFC will be focusing mainly onprojects with regional impact, especially in the financial, agricultural, manufacture and services sectors.
4.9 Progress at implementing structural reforms. The Government of Costa Rica hascontinued to implement its reform program-at its own pace, without much financialassistance from the Bank. It has continued to make progress in opening-up trade anddiversifying exports while maintaining political stability. The economic and politicalenvironment has become highly attractive to high-tech foreign investment. A publicworks concession reforrn was passed in early 1998, which will allow private domesticand foreign investment to have direct involvement in building, maintaining and operatingpublic infrastructure. Legislation to strengthen the national commission of securities andthe superintendence of pensions was approved in December 1997. The Central Bankissued regulations covering offshore operations of financial conglomerates. In addition,with the assistance of IADB, the Government is undertaking studies to formulate actionplans for the state banks that will remain in the hands of the state. Meanwhile, aliberalization law of the banking system, passed in 1995, dissolved the state banks'monopoly on checking accounts, permitting private banks to expand their activities andmarket share. The state, however, still dominates the commercial banking system withabout 75 percent of deposits and forces private banks to place about 17 percent of theirdemand deposits in state banks at below market rates.
4.10 Progress at implementing social and environmental reforms. The authorities havealso undertaken measures to improve the efficiency, targeting and level of socialexpenditures, including rationalization of government agencies and closer cooperationwith private providers of social services. Environmental policies have been strengthenedwith the passage of the Environment Law in 1996 and the implementation of a plan todivide the country in nine conservation regions. Costa Rica has also actively participatedin implementing the agreements of the International Conference on Climate Change, byissuing "green" bonds, allowing industrialized countries to purchase them and receivecredits toward the achievement of annual emissions targets. It has also agreed withCanada and the Netherlands on debt-for-nature and aid swaps for about US$40 million tosupport local sustainable development initiatives.
11
Box 4.2: Foreign Investment in High Technology: The Case of INTEL in Costa Rica
FIAS concluded early in the 1990s that Costa Rica had an excellent political and economic environment toattract foreign investment in the electronics industry. Political stability, commitment to economic openness,excellent educational systems, high quality of labor force relative to cost, widespread knowledge of Englishand market access were some of the main positive factors.
FIAS added that Costa Rica could further improve its environment for foreign investment in electronics.There was a need to expand, without decreasing its quality, some of the existing education programs inelectronics, including state support to on-the-job training programs. There was also a need to upgradetelecommunications, transport and capital markets infrastructure and to expand the intellectual property-protection system by improving patent laws and the functioning of the judicial system.
The announcement in November 1996 that Intel was going to initiate activities in Costa Rica by investingbetween US$300-500 million in a new plant over a five-year period was a very welcome development. TheGovernment of Costa Rica was fast to respond and mobilized support in the political and businesscommunities, developing information and assistance to Intel's requests in very short periods of time. Itdeveloped an electronics strategy and supported CINDE, Costa Rica's national promotion agency. TheMinistry of Foreign Trade coordinated government contacts with Intel under direct stewardship of thePresident of Costa Rica at the time, Mr. Jose M. Figueres. Foreign direct investment had become a majorsource of financing to supplement a very low level of domestic savings and scarce foreign financing forinvestment.
4.11 Progress in gender policies. Costa Rica has been a pioneer in incorporatingwomen in the process of development. As early as 1975, the Government had created theNational Center for Development of Women and the Family. By the early 1990s, afterthe approval of the Law to Promote the Social Equality of Women, Costa Rica reachedthe forefront in sponsoring women's rights with legislation comparable (or even moreadvanced) than legislation of many developed countries. In addition, a new law againstsexual harassment in labor and education was approved in 1995. Although women haveequal access to all basic social services and benefit directly from a number of socialprograms, earning differentials between working males and females still exist, but aremuch lower than in the rest of Latin America."1 In addition, there still exists a relativelyhigh incidence of teenage pregnancy, domestic violence against women and culturalfactors and attitudes preventing a better integration of women in society. CAS 93 hadproposed a project to improve female education, but this project did not materialize. TheBank, instead, continued with its informal policy to assists Costa Rica with non-lendingservices and approved in 1995 a US$389,000 IDF grant for institutional strengthening tointroduce a gender perspective in the agriculture and natural resources sector.
4.12 Progress in forestry policies. Costa Rica is considered a pioneer in reforestation,forest management and forest protection policies (Box 4.3). The Bank has influencedforestry policies directly by providing advice and seed money and indirectly bysupporting trade and price policies that have reduced the profitability of agriculture andcattle ranching in marginal forest lands. The Bank, however, has not been able to provide
11. Psacharopoulos and Tzannatos, Case Studies on Women's Employment and Pay in Latin America, the WorldBank, 1992.
12
funding for forest activities during 1993-99. CAS 93 was expected to provide lending fora project to support management of conservation areas, but this project did notmaterialize because of disagreements about project design and scope.
4.13 Progress in public sector policies. The Government has achieved approval of anew tax package and reforms to the special pension regimes and workers' rights. It hasalso reduced the scope of the public sector by scaling down operations and transferringsome functions to the private sector. It achieved approval of legislation to allow theprivate sector to build, own, operate and transfer projects in the telecommunications andelectricity sectors. Nevertheless, several legislative initiatives to dismantle statemonopolies in telecommunications, electricity and insurance continue to face seriouspolitical opposition.
Box 4.3: Forestry and the World Bank in Costa Rica
Costa Rica was once one of the most deforested countries in the world. Today it is a pioneer inreforestation, forest management, and forest protection policies. The financial presence of the World Bankand Bank Group related activities, however, has been very low in Costa Rica. The Bank's influence hasprimarily been in conceptual and methodological areas and in the provision of seed money. This is themain conclusion of a recent report on forestry prepared by OED.a
Following CAS 93, the Bank attempted to prepare a project to improve management of ConservationAreas in 1993, but negotiations failed. The same year, the Bank prepared a Forest Sector Review study.This study introduced many ideas that have influenced local forestry policy. The report made calculationsshowing that most of the benefits (66 percent) produced by Costa Rica's forests are enjoyed globally. Itcalculated the value of Costa Rica's forests, it suggested measures to improve the financial management ofnational parks, recommended deregulating harvesting in forest plantations and argued that subsidies fornatural forest management are technically justified. The emphasis of the study was on conservation ratherthan sustainable exploitation of the forests. The study, however, called attention on the compatibility offorest management and conservation and established criteria for forest protection and for allocatinginstitutional responsibilities in the Conservation Areas.
The Costa Ricans have developed many innovative organizations, mechanisms and tools toimplement their policies without financial participation of the Bank. The lack of funding has been mainlydue to internal divisions about which strategies to adopt in relation to Bio-diversity and Climate ChangeConventions. The Costa Ricans, meanwhile, have approved an environment, bio-diversity and forest law, adecentralized administration of the conservation areas and an innovative system for Payment forEnvironmental Services to encourage conservation by the private sector and discourage governmenttransfers. In summary, Costa Rica has made significant progress to eliminate deforestation and hasdeveloped imaginative tools to manage forestry and conservation. The system, however, still needsconsolidation to be sustainable.a. Forest Policy and the Evolution of Land Use in Costa Rica. OED Draft, June 25, 1999
4.14 Costa Rica achieved satisfactory development outcome in World Bank's portfolio.One hundred percent of Costa Rica's portfolio (total commitments of US$310 million)evaluated by the Bank during 1994-99 has achieved satisfactory development outcome(Annex A, Table 5a). Of this, about $200 million corresponds to projects implementedbefore 1993. This excellent result, however, overestimates development outcomebecause the evaluation does not include two projects closed during this period without
13
ratings (US$141 million).12 The evaluation includes only three projects subjected toindependent evaluation by OED (US$201 million) and four ongoing projects evaluated bythe region, not yet subjected to independent evaluation (US$109 million). Although it istoo early to independently evaluate these last four projects, the Bank has ratedimplementation as satisfactory-procurement regulations, however, continue to beproblematic and tend to slow down disbursements. It has also found good availability ofcounterpart funds, satisfactory implementation of procurement rules and overall progresstoward development objectives in spite of often finding macroeconomic policies less thanoptimal.'3 In addition, the results are based on ongoing projects that are only a smallfraction of the lending program originally proposed by CAS 93.
4.15 Good results. The overall portfolio of the Bank in Costa Rica, however, hasgenerally achieved better results than in most other clients, over longer evaluationperiods. About 87 percent of Costa Rica's portfolio achieved satisfactory developmentoutcomes over the 1970-1999 period. This result is much higher than the 70 per cent orthe 74 per cent satisfactory rating achieved in the same period by the LCR or by the Bankrespectively. This good performance of Costa Rica's portfolio has continued to be betterthan the rest of the Bank over most recent periods (1988-97). Costa Rica achieved 80percent satisfactory development outcome compared to only 73 percent satisfactory in theLCR region and the Bank (Annex A, Table 5a). These overall good results seem toindicate that the slow pace of reform characteristic of Costa Rica has not significantlyaffected the good performance of projects.
4.16 A reduced but influential economic and sector work. The Bank reduced ESWduring the CAS 93 period. The Bank prepared an update of a poverty study to identifythe needs of the poor and an influential study proposing a pension reform strategy. TheBank, however, failed to complete a Country Economic Memorandum14 that was neededto define the policy agenda for discussions with the Government of President Jose M.Figueres in 1994. In addition, the Bank failed to produce an urban sector study promisedunder CAS 93 to define policies to be included under a proposed urban project.
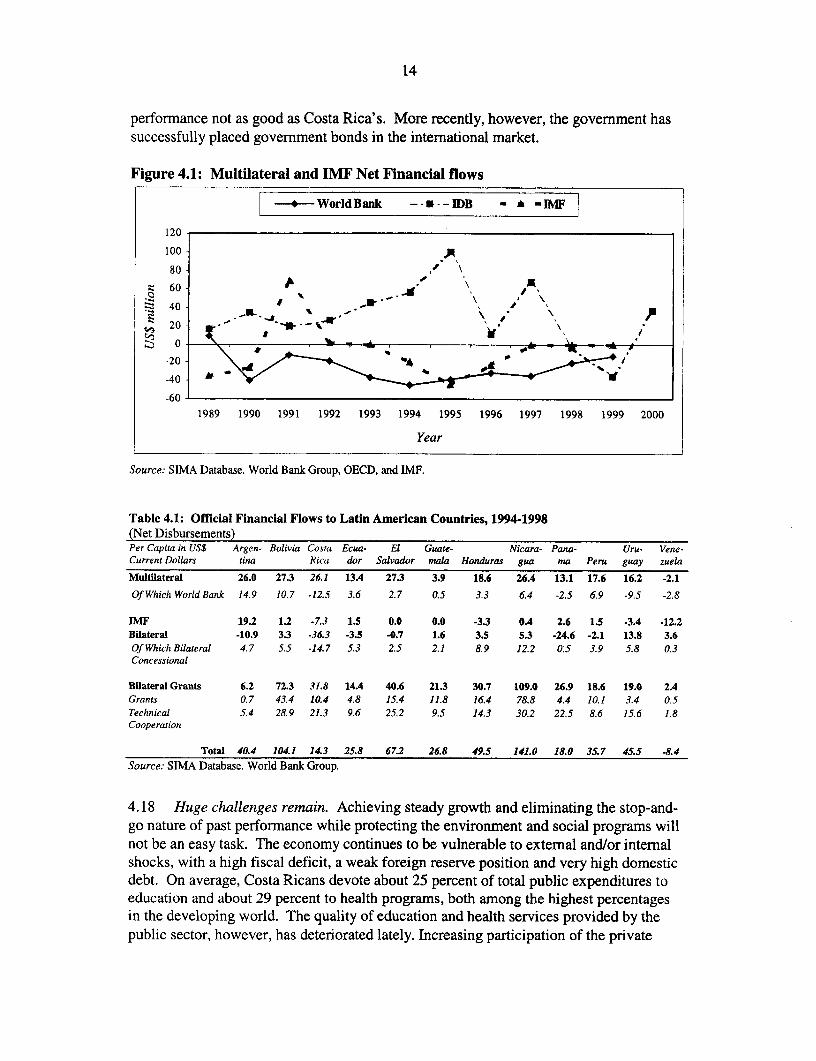
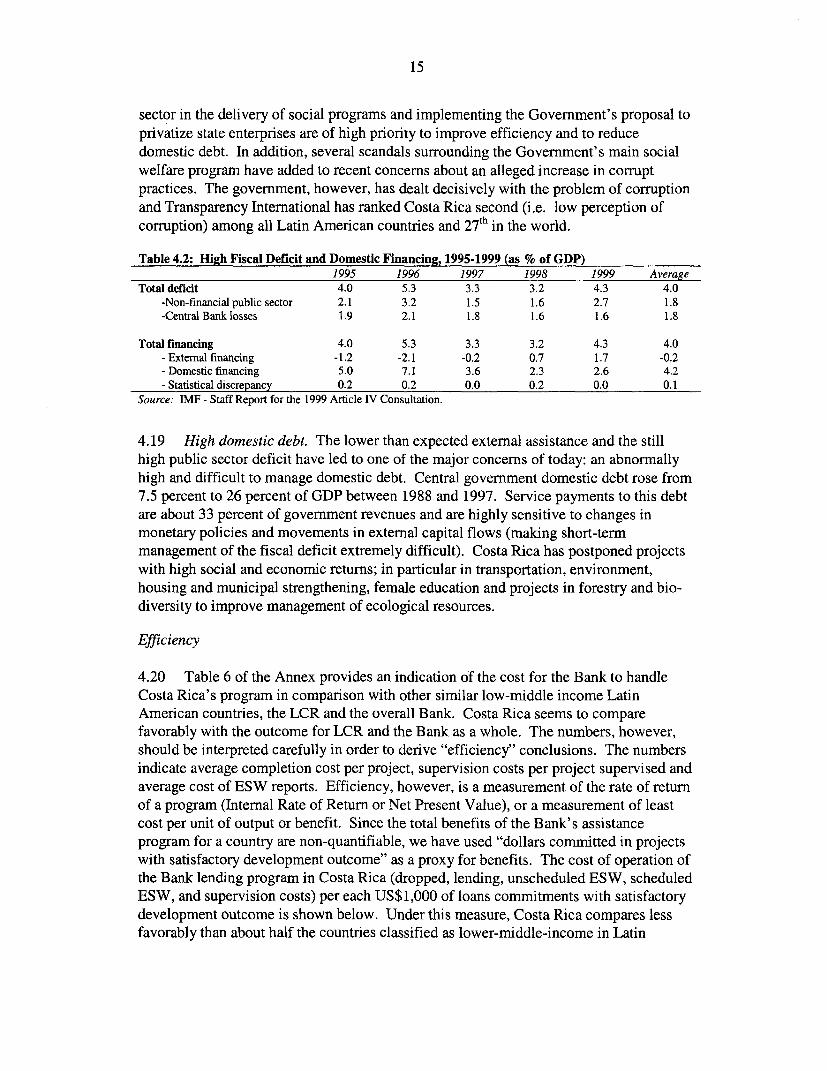
4.17 Other external assistance. The reduced financial assistance from the Bank did notsignificantly affect total multilateral assistance to Costa Rica because IADB hascontinued to support Costa Rica with highly positive net disbursements (Figure 4.1),mostly due to high disbursements from adjustment loans. Costa Rica has also enjoyedhigh levels of financial assistance from bilateral grants. This assistance, however, in per-capita terms, has been much lower than that received by other countries with overall
12. This is a nonnal procedure for projects approved by the Board but which do not become effective, such as SAL III(US$100 million) and ASIL (US$41 million).13. The ratings of macroeconomic conditions in Project Status Reports (PSRs) of March-June 1999 are not veryreliable. OED found inconsistencies in the ratings of these macroeconomic conditions. Two projects rated at the sametime, in March 1999, found different macroeconomic conditions, N (low or negligible) and M (modest). In addition,two projects rated in June 1999 found different macroeconomic conditions, M (modest) and S (substantial) at the sametime. A possible interpretation would be that equal macroeconomic conditions at the same time in the same countryaffect specific projects differently.14. The study was not officially discussed with the Government.
14
performance not as good as Costa Rica's. More recently, however, the government hassuccessfully placed government bonds in the international market.
Figure 4.1: Multilateral and IMF Net Financial flows
+4WorldBank ----- IDB - ^ -IMF
120
100
80 .'
z 0 60~40
-200
-40 A
1989 1990 1991 1992 1993 1994 1995 1996 1997 1998 1999 2000
Year
Source: SIMA Database. World Bank Group, OECD, and IMF.
Table 4.1: Official Financial Flows to Latin American Countries, 1994-1998(Net Disbursements)Per Capita in US$ Argen- Bolivia Costa Ecua- El Guate- Nicara- Pana- Uru- Vene-Current Dollars tina Rica dor Salvador mala Honduras gua ma Peru guay zuela
Multilateral 26.0 27.3 26.1 13.4 27.3 3.9 18.6 26.4 13.1 17.6 16.2 -2.1Of Which WorHd Bank 14.9 10.7 -12.5 3.6 2.7 0.5 3.3 6.4 -2.5 6.9 -9.5 -2.8
DIF 19.2 1.2 -7.3 1.5 0.0 0.0 -3.3 0.4 2.6 1.5 -3.4 -12.2Bilateral -10.9 3.3 -36.3 -3.5 -0.7 1.6 3.5 5.3 -24.6 -2.1 13.8 3.6Of Which Bilateral 4.7 5.5 -14.7 5.3 2.5 2.1 8.9 12.2 0:5 3.9 5.8 0.3Concessional
Biateral Grants 6.2 72.3 31.8 14A 40.6 21.3 30.7 109.0 26.9 18.6 19.0 2AGrants 0.7 43.4 10.4 4.8 15.4 11.8 16.4 78.8 4.4 10.1 3.4 0.5Technical 5.4 28.9 21.3 9.6 25.2 9.5 14.3 30.2 22.5 8.6 15.6 1.8Cooperation
Total 40.4 104.1 14.3 25.8 67.2 26.8 49.5 141.0 18.0 35.7 45.5 -8.4Source: SIMA Database. World Bank Group.
4.18 Huge challenges remain. Achieving steady growth and eliminating the stop-and-go nature of past performance while protecting the environment and social programs willnot be an easy task. The economy continues to be vulnerable to external and/or internalshocks, with a high fiscal deficit, a weak foreign reserve position and very high domesticdebt. On average, Costa Ricans devote about 25 percent of total public expenditures toeducation and about 29 percent to health programs, both among the highest percentagesin the developing world. The quality of education and health services provided by thepublic sector, however, has deteriorated lately. Increasing participation of the private
15
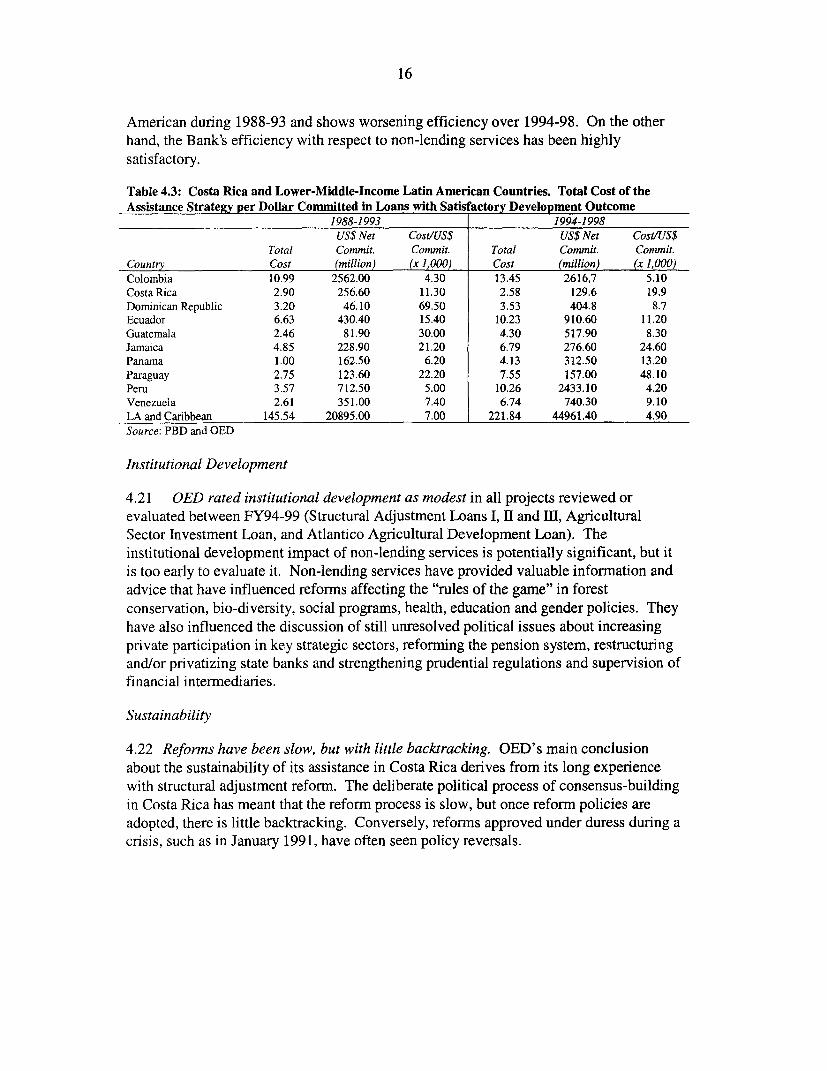
sector in the delivery of social programs and implementing the Government's proposal toprivatize state enterprises are of high priority to improve efficiency and to reducedomestic debt. In addition, several scandals surrounding the Government's main socialwelfare program have added to recent concerns about an alleged increase in corruptpractices. The government, however, has dealt decisively with the problem of corruptionand Transparency International has ranked Costa Rica second (i.e. low perception ofcorruption) among all Latin American countries and 27th in the world.
Table 4.2: High Fiscal Deficit and Domestic Financing, 1995-1999 (as % of GDP)1995 1996 1997 1998 1999 Average
Total deficit 4.0 5.3 3.3 3.2 4.3 4.0-Non-financial public sector 2.1 3.2 1.5 1.6 2.7 1.8-Central Bank losses 1.9 2.1 1.8 1.6 1.6 1.8
Total financing 4.0 5.3 3.3 3.2 4.3 4.0
- Extemal financing -1.2 -2.1 -0.2 0.7 1.7 -0.2- Domestic financing 5.0 7.1 3.6 2.3 2.6 4.2
- Statistical discrepancy 0.2 0.2 0.0 0.2 0.0 0.1
Source: IMF - Staff Report for the 1999 Article IV Consultation.
4.19 High domestic debt. The lower than expected external assistance and the stillhigh public sector deficit have led to one of the major concerns of today: an abnormallyhigh and difficult to manage domestic debt. Central government domestic debt rose from7.5 percent to 26 percent of GDP between 1988 and 1997. Service payments to this debtare about 33 percent of government revenues and are highly sensitive to changes inmonetary policies and movements in external capital flows (making short-termmanagement of the fiscal deficit extremely difficult). Costa Rica has postponed projectswith high social and economic returns; in particular in transportation, environment,housing and municipal strengthening, female education and projects in forestry and bio-diversity to improve management of ecological resources.
Efficiency
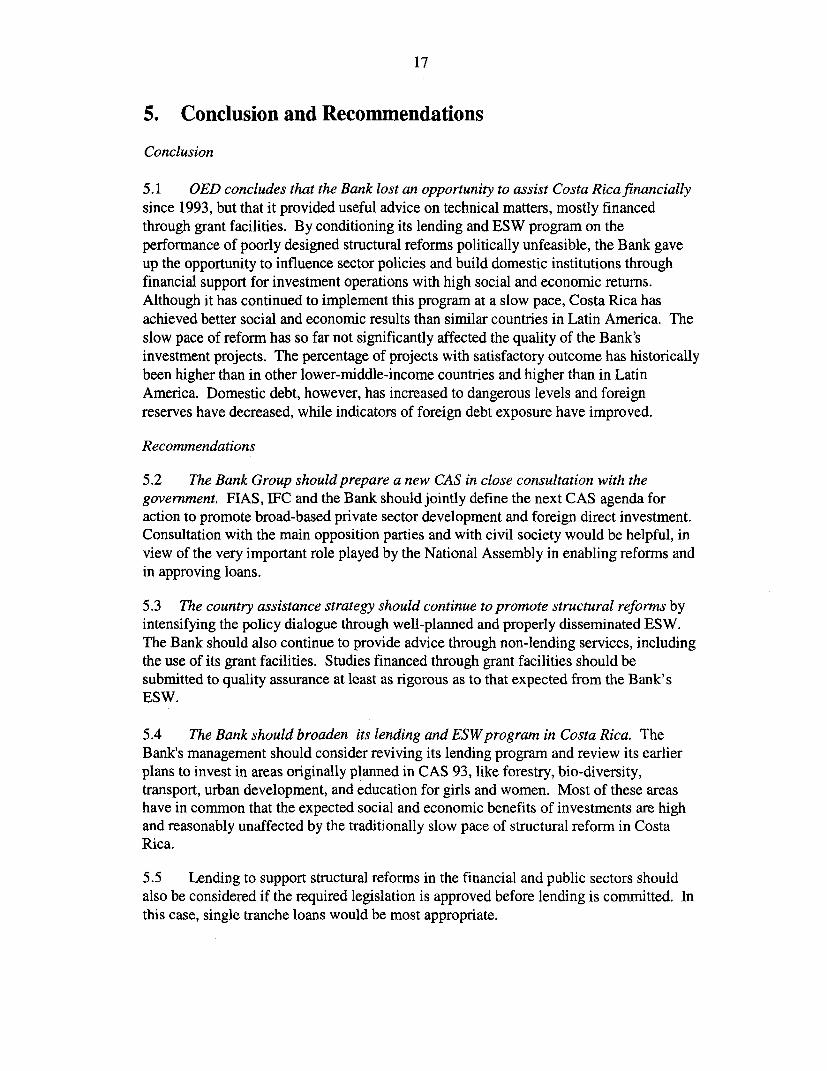
4.20 Table 6 of the Annex provides an indication of the cost for the Bank to handleCosta Rica's program in comparison with other similar low-middle income LatinAmerican countries, the LCR and the overall Bank. Costa Rica seems to comparefavorably with the outcome for LCR and the Bank as a whole. The numbers, however,should be interpreted carefully in order to derive "efficiency" conclusions. The numbersindicate average completion cost per project, supervision costs per project supervised andaverage cost of ESW reports. Efficiency, however, is a measurement of the rate of returnof a program (Internal Rate of Return or Net Present Value), or a measurement of leastcost per unit of output or benefit. Since the total benefits of the Bank's assistanceprogram for a country are non-quantifiable, we have used "dollars committed in projectswith satisfactory development outcome" as a proxy for benefits. The cost of operation ofthe Bank lending program in Costa Rica (dropped, lending, unscheduled ESW, scheduledESW, and supervision costs) per each US$1,000 of loans commitments with satisfactorydevelopment outcome is shown below. Under this measure, Costa Rica compares lessfavorably than about half the countries classified as lower-middle-income in Latin
16
American during 1988-93 and shows worsening efficiency over 1994-98. On the otherhand, the Bank's efficiency with respect to non-lending services has been highlysatisfactory.
Table 4.3: Costa Rica and Lower-Middle-Income Latin American Countries. Total Cost of theAssistance Strategy per Dollar Comniitted in Loans with Satis actory Development Outcome
1988-1993 1994-1998US$ Net Cost/US$ US$ Net CostIUS$
Total Commit. Commit. Total Commit. Commit.Country Cost (million) (x 1,000) Cost (million) (x 1,000)Colombia 10.99 2562.00 4.30 13.45 2616,7 5.10Costa Rica 2.90 256.60 11.30 2.58 129.6 19.9Dominican Republic 3.20 46.10 69.50 3.53 404.8 8.7Ecuador 6.63 430.40 15.40 10.23 910.60 11.20Guatemala 2.46 81.90 30.00 4.30 517.90 8.30Jamaica 4.85 228.90 21.20 6.79 276.60 24.60Panama 1.00 162.50 6.20 4.13 312.50 13.20Paraguay 2.75 123.60 22.20 7.55 157.00 48.10Peru 3.57 712.50 5.00 10.26 2433.10 4.20Venezuela 2.61 351.00 7.40 6.74 740.30 9.10LA and Caribbean 145.54 20895.00 7.00 221.84 44961.40 4.90Source: PBD and OED
Institutional Development
4.21 OED rated institutional development as modest in all projects reviewed orevaluated between FY94-99 (Structural Adjustment Loans I, 1: and mI, AgriculturalSector Investment Loan, and Atlantico Agricultural Development Loan). Theinstitutional development impact of non-lending services is potentially significant, but itis too early to evaluate it. Non-lending services have provided valuable information andadvice that have influenced reforms affecting the "rules of the game" in forestconservation, bio-diversity, social programs, health, education and gender policies. Theyhave also influenced the discussion of still unresolved political issues about increasingprivate participation in key strategic sectors, reforming the pension system, restructuringand/or privatizing state banks and strengthening prudential regulations and supervision offinancial intermediaries.
Sustainability
4.22 Reformis have been slow, but with little backtracking. OED's main conclusionabout the sustainability of its assistance in Costa Rica derives from its long experiencewith structural adjustment reform. The deliberate political process of consensus-buildingin Costa Rica has meant that the reform process is slow, but once reform policies areadopted, there is little backtracking. Conversely, reforms approved under duress during acrisis, such as in January 1991, have often seen policy reversals.
17
5. Conclusion and Recommendations
Conclusion
5.1 OED concludes that the Bank lost an opportunity to assist Costa Rica financiallysince 1993, but that it provided useful advice on technical matters, mostly financedthrough grant facilities. By conditioning its lending and ESW program on theperformance of poorly designed structural reforms politically unfeasible, the Bank gaveup the opportunity to influence sector policies and build domestic institutions throughfinancial support for investment operations with high social and economic returns.Although it has continued to implement this program at a slow pace, Costa Rica hasachieved better social and economic results than similar countries in Latin America. Theslow pace of reform has so far not significantly affected the quality of the Bank'sinvestment projects. The percentage of projects with satisfactory outcome has historicallybeen higher than in other lower-middle-income countries and higher than in LatinAmerica. Domestic debt, however, has increased to dangerous levels and foreignreserves have decreased, while indicators of foreign debt exposure have improved.
Recommendations
5.2 The Bank Group should prepare a new CAS in close consultation with thegovernment. FIAS, IFC and the Bank should jointly define the next CAS agenda foraction to promote broad-based private sector development and foreign direct investment.Consultation with the main opposition parties and with civil society would be helpful, inview of the very important role played by the National Assembly in enabling reforms andin approving loans.
5.3 The country assistance strategy should continue to promote structural reforms byintensifying the policy dialogue through well-planned and properly disseminated ESW.The Bank should also continue to provide advice through non-lending services, includingthe use of its grant facilities. Studies financed through grant facilities should besubmitted to quality assurance at least as rigorous as to that expected from the Bank'sESW.
5.4 The Bank should broaden its lending and ESW program in Costa Rica. TheBank's management should consider reviving its lending program and review its earlierplans to invest in areas originally planned in CAS 93, like forestry, bio-diversity,transport, urban development, and education for girls and women. Most of these areashave in common that the expected social and economic benefits of investments are highand reasonably unaffected by the traditionally slow pace of structural reform in CostaRica.
5.5 Lending to support structural reforms in the financial and public sectors shouldalso be considered if the required legislation is approved before lending is committed. Inthis case, single tranche loans would be most appropriate.
18
5.6 To enhance its effectiveness, the Bank group should be selective in the areas ofintervention and should coordinate closely with bilateral and other multilateral agenciesinvolved in Costa Rica, especially the IADB.
5.7 More generally Bank management should inform the Board if it finds that thestrategy the Board had endorsed requires important changes during implementation.
19 Annex A
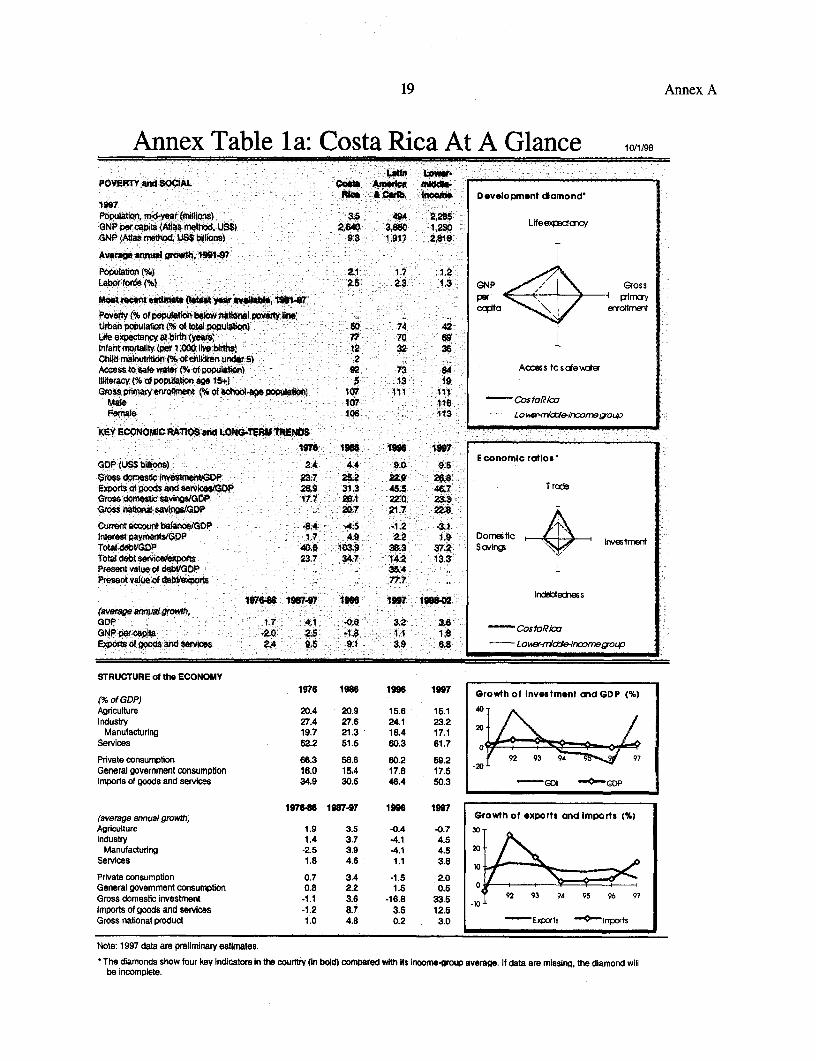
Annex Table la: Costa Rica At A Glance 10/1198
LaUn Lo*we-POVERTY and SOCIAL Costa AMerIa mIdas-
R - & ACarb Iem Development dlomond-1997Population, mid-year (millions) 3.5 494 2,285GNP per capa (Afas method, US$) 2,640 3%O 1,230 LlfeexcnGNP (Atas method. US$billions) 9.3 1,917 2,818
Average annual growh, 19914.97
Poplation (%) 2.1 1.7 1.2 -
Laborforce(%) 2.5 23 1.3 GNP Gross
Most recent estime (Istt ysra abbb, 16614*7 PirnQ/a erolln
Poverty {% of population beOw national poet iine .. t * *- mcnUtban population (% o total ppulation) So 74 42Ute expectancy at brth (year, 7 7 6IInfant tality (Per 1,00 live births 12 32 36Child malnutrition 1% of children under 5) 2Access to safe wae (% of population) 92 73 84 Acoss to safeAderIlliteracy(%otpopulatronage S+) 5 13 19Gross prmaryenro(terwt (S ofawhoo-age populaion) 10? III III ___
Mate 107 .. 116 CostaR/CFemale 106 .. 113 Lo-- - rerde-/ncoremgroup
KEY ECONOMIC RATIOS en LONG-TERM thENDS
1976 198B io66 1997Economic rotlos'
GDP (US$ biions) 2.4 4.4 9.0 9.6Gross domrestic investmerit/OP 23.7 262 2Z9 26.8Export of goods and iv GP 26. 31.3 45.5 46.7 T rcdsGross domestic savings/GOP 17.1 26.1 22.0 23.3Gross natibonl savings/GDP .. 20 21.7 2t28
Current accournt balanoe/GOP .6.4 .4.5 -1.2 -3.Interest payments/GDP , 1.7 4.9 2.2 1.9 Domestc InvestrmertTotal debVGDP 40.8 103.9 38.3 37.2 S ovIngsTotat debt service/exports 23.7 34.7 14.2 13.3Presert value of debtGDP ., .. 35.4Present value of debt/exports .. .. 77.7
1866 16747 1996 1997 1966.2 Indediess(avearge anna/growh,GDP 1,7 4.1 .0.6 3.2 3.8 ~ ~coJ taR/cOGNP per capa *2.0 2.5 -1i. 1.1 I,Exports of goods and sevices 24 9.5 9.1 3.9 6.8 Lo0er-nrWdWncsSoao
STRUCTURE of the ECONOMY
(% of GDP) 1976 1966 1996 1997 Growth of Invostment and GDP (%)
Agriculture 20.4 20.9 15.6 15.1 40 AIndustry 27.4 27.6 24.1 23.2 2 -
Manufacturing 19.7 21.3 18.4 17.1Services 52.2 51.5 80.3 61.7 o
Private consumption 66.3 58.6 60.2 59.2 .r 92 93 94General govemment consumption 16.0 15.4 17.8 17.5Imports of goods and services 34.9 30.5 4B.4 50.3 G01 0 GDP
1976466 1907-97 1996 1997(average annual growhm Growth of exports and Imports (%)Agriculture 1.9 3.5 -0.4 -0.7 30Industry 1.4 3.7 -4.1 4.5
Manufacturing -2.5 3.9 -4.1 4.5 /Services 1.8 4.6 1.1 3.8 10.
Private consumption 0.7 3.4 *1.5 2.0General govemment consumption 0.8 2.2 1.5 0.5 _____ __.__
Gross domestic investment *1.1 3.6 -16.8 33.5 -l 92 93 94 95 96 97Imports of goods and services -1.2 8.7 3.5 12.5Gross national product 1.0 4.8 0.2 3.0 Export lrprts
Note: 1997 data are preliminary estimates.
The diamonds show four key Indicators in the country (in bold) compared with its income-group average. If data are missing, the diamond willbe incomplete.
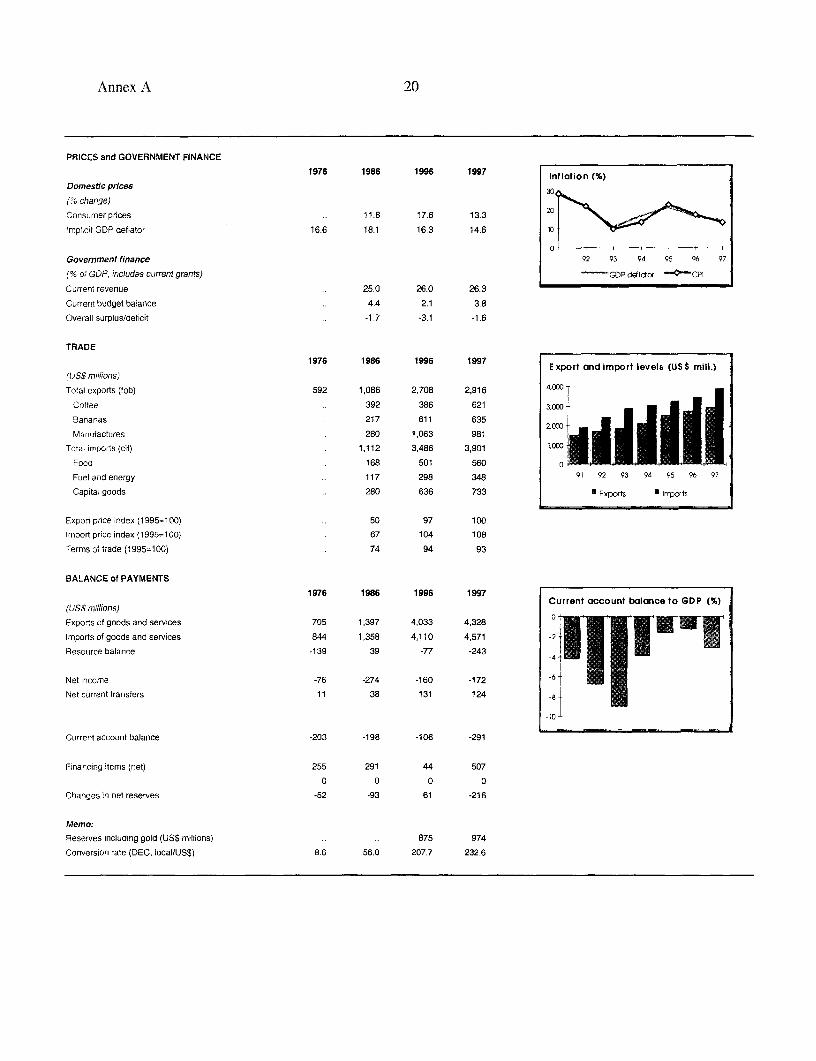
Annex A 20
PRICES and GOVERNMENT FINANCE
1976 1986 1996 1997 Inflation t%)
Domestic prices 30
(% change)
Consumerprices .. 11.8 17.6 13.3 20
Implicit GDP deflator 16.6 18.1 16.3 14.6 10
Govemment finance 92 93 94 95 96 97
(% of GDP, includes ctirrent grants) D DPdeictor -CPI
Current revenue .. 25.0 26.0 26.3
Current budget baiance . 4.4 2.1 3.8
Overall surplus/deficit .. -1.7 -3.1 -1.6
TRADE
1976 1986 1996 1997 E xport and import levels (US $ mill.)
(IJS$ millions)
Total exports (fob) 592 1,086 2,708 2,916 4.000 -
Coffee 392 386 621 3000
Bananas 217 611 635 iLJManufactures 280 1,063 981 2000 -
Totas imports (cif) 1,112 3,486 3,901 ,o -
Food 168 501 560 o MOR
Fuel and energy .. 117 298 348 91 92 93 94 95 96 97
Capital goods .. 280 636 733 r Exports * Inports
Export price index 11995=100) .. 50 97 100
Importprice index (1995=100) . 67 104 108
Terms of trade (1995=100) .. 74 94 93
BALANCE of PAYMENTS
1976 1986 1996 1997Current account balance to GDP (%)
(USs millions)
Exports of goods and services 705 1,397 4,033 4,328 0
Imports of goods and services 844 1,358 4,110 4,571 -2
Resource balance -139 39 -77 -243
Net incorne -76 -274 -160 -172 -6
Net current transfers 11 38 131 124 -8
Current account balance -203 -198 -106 -291
Financing items (net) 255 291 44 507
0 0 0 0
Changes in net reserves -52 -93 61 -216
Memo:
Reserves including gold (US$ millions) 875 974
Conversion rate (DEC, local/US$) 8.6 56.0 207.7 232.6
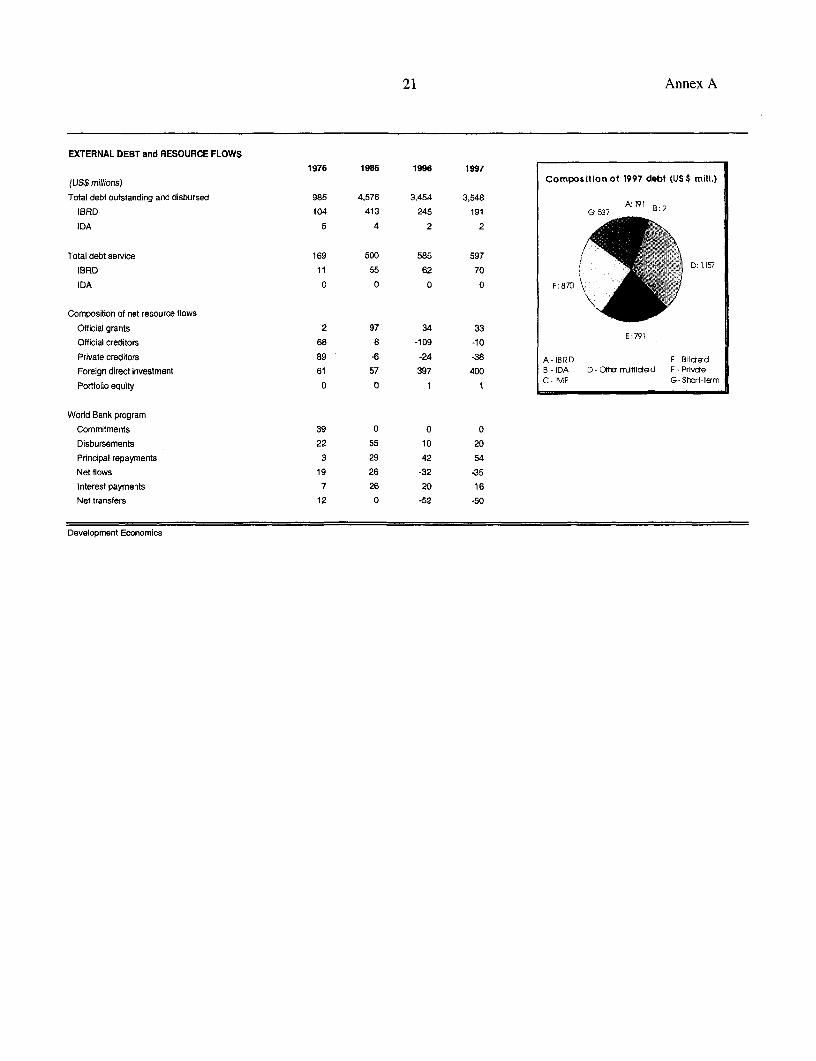
21 Annex A
EXTERNAL DEBT and RESOURCE FLOWS1976 1986 1996 1997
(US$ millions) Compositlon of 1997 debt (US $ milt.)
Total debt outstanding and disbursed 985 4,576 3,454 3,548
I1RD 104 413 245 191 AG9S B52
IDA 5 4 2 2
Total debt service 169 500 585 597
IBRD 1 1 55 62 70
IDA 0 0 0 0 F: 870
Composftion of net resource flows
Official grants 2 97 34 33
Official creditors 68 8 -109 -10 E: 791
Private creditors 89 -6 -24 -38A - IB RD E - B ilderdForeign direct investment 61 57 397 400 B - IDA D- Other rrtilderd F - Prlvcte
Porttolioequity 0 0 1 1 C-IMF G- Short-tem
World Bank program
Commitments 39 0 0 0
Disbursements 22 55 10 20
Principal repayments 3 29 42 54
Net flows 19 26 -32 -35
Interest payments 7 26 20 16
Net transfers 12 0 -52 -50
Development Economics
Annex A 22
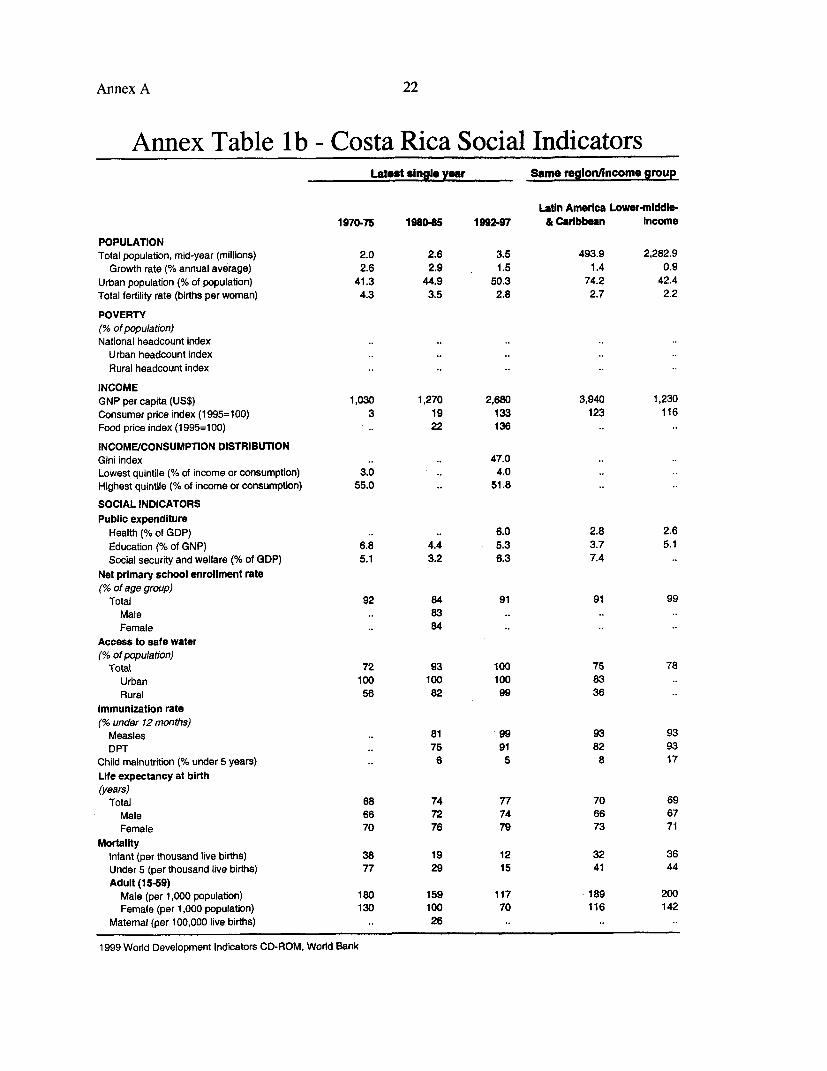
Annex Table lb - Costa Rica Social IndicatorsLatest single year Same region/income group
Latin America Lower-middle-1970-75 1980-85 1992.97 & Caribbean Income
POPULATIONTotal population, mid-year (millions) 2.0 2.6 3.5 493.9 2,282.9
Growth rate (% annual average) 2.6 2.9 1.5 1.4 0.9Urban population (% of population) 41.3 44.9 50.3 74.2 42.4Total ferblity rate (births per woman) 4.3 3.5 2.8 2.7 2.2
POVERTY(% of population)National headcount index .. ..
Urban headcount indexRural headcount index .. .. .. .
INCOMEGNP per capita (US$) 1,030 1,270 2,680 3,940 1,230Consumerpriceindex(1995=100) 3 19 133 123 116Food price index (1 995=1 00) .. 22 136
INCOME/CONSUMPTION DISTRIBUTIONGini index .. ., 47.0Lowest quintile (% of income or consumption) 3.0 .. 4.0Highest quintile (% of income or consumption) 55.0 .. 51.8
SOCIAL INDICATORSPublic expenditure
Health (% of GDP) .. .. 6.0 2.8 2.6Education (% of GNP) 6.8 4.4 5.3 3.7 5.1Social security and welfare (% of GDP) 5.1 3.2 6.3 7.4
Net primary school enrollment rate(% of age group)
Total 92 84 91 91 99Male 83Female .. 84
Access to safe water(% of population)
Total 72 93 100 75 78Urban 100 100 100 83Rural 56 82 99 36
Immunization rate(% under 12 months)
Measles .. 81 99 93 93DPT .. 75 91 82 93
Child malnutrition (% under 5 years) .. 6 5 8 17Life expectancy at birth(years)
Total 68 74 77 70 69Male 66 72 74 66 67Female 70 76 79 73 71
MortalityInfant (per thousand live births) 38 19 12 32 36Under 5 (per thousand live births) 77 29 15 41 44Adult (1 5-59)
Male (per 1,000 population) 180 159 117 189 200Female (per 1,000 population) 130 100 70 116 142
Maternal (per 100,000 live births) .. 26 ..
1999 World Development Indicators CD-ROM, World Bank
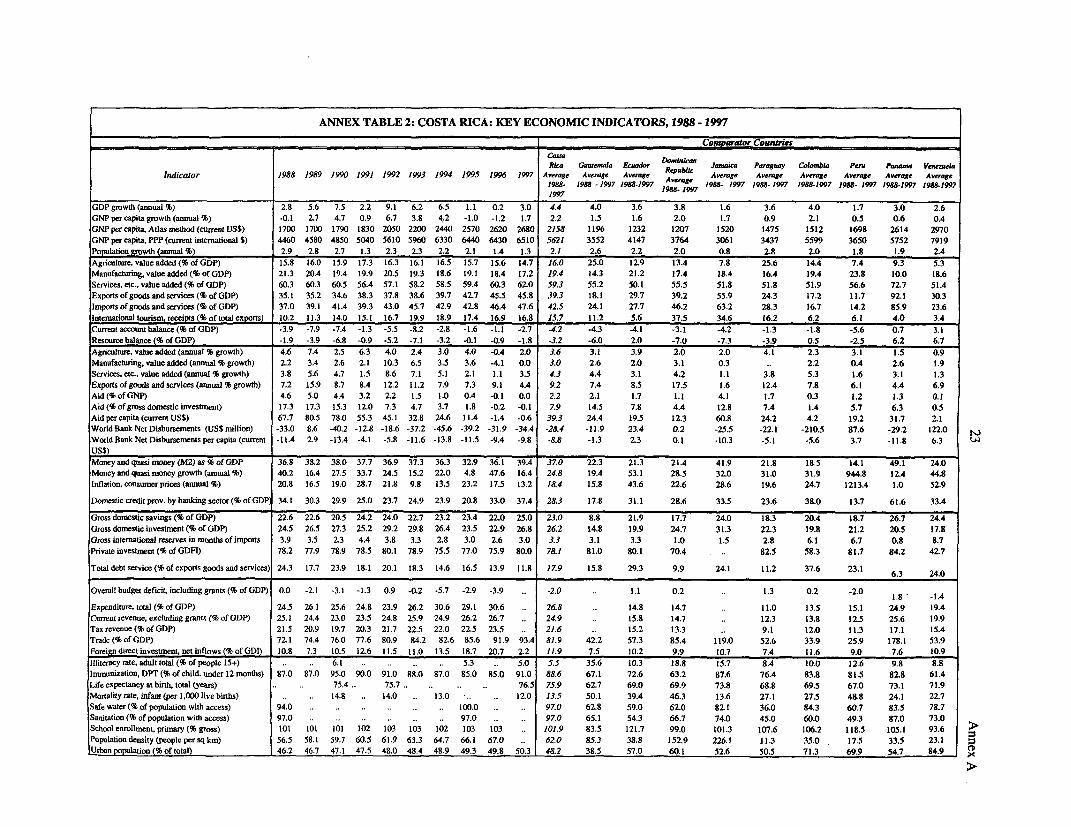
ANNEX TABLE 2: COSTA RICA: KEY ECONOMIC INDICATORS, 1988 - 1997
2Comarator Countries
Rica ua(emla Ecador epaW Jamtaica Paragutay CoLombia Peru Pwuama Vene.ula
indicator 1988 1989 1990 1991 1992 1993 1994 1995 1996 1997 Awerge Average Aveage Average Ame Arg wae Aeae Arg wg
1988- 1988 - 1997 1988- 18-1997 1988. 1997 1988. 1997 1988-1997 1988- 1997 1988-1997 1988-19971997 18-19
GDP growth (annual %) 2.8 5.6 7.5 2.2 9.1 6.2 6.5 1.1 0.2 3.0 4.4 4.0 3.6 3.8 1.6 3.6 4.0 1.7 3.0 2.6
GNP per capita growth (annual %) -0.1 2.7 4.7 0.9 6.7 3.8 4'.2 -1.0 -1.2 1.7 2.2 1.5 1.6 2.0 1.7 0.9 2.1 0.5 0.6 0.4
GNP per capita, Atlasmzethsod(cucrnt US$) 1700 1700 1790 1830 2050 2200 2440 2570 2620 2680 2158 1196 1232 1207 1520 1475 1512 1698 2614 2970
GNP per capita, PPP (curnent intemnatioual $) 4460 4580 4850 5040 5610 5960 6330 6440 6430 6510 5621 3552 4147 3764 3061 3437 5599 3650 5752 7919
Populationgrwth (annual % 2.9 2.8 2.7 1.3 2.3 2.3 2.2 2.1 1.4 1.3 2.1 2.6 2.2 2.0 0.8 2.8 2.0 1.8 1.9 2.4
Agriculture, value added (%of GDP) 15.8 16.0 15.9 17.3 16.3 16.1 16.5 15.7 15.6 14.7 16.0 25.0 12.9 13.4 7.8 25.6 14.4 7.4 9.3 5.3
Manufactwring, value added (% orGDP) 21.3 20.4 19.4 19.9 20.5 19.3 18.6 19.1 18.4 17.2 19.4 14.3 21.2 17.4 18.4 16.4 19.4 23.8 10.0 18.6
Services, etc., value added (% of GDP) 60.3 60.3 60.5 56.4 57.1 58.2 58.5 59.4 60.3 62.0 59.3 55.2 50.1 55.5 51.8 51.8 51.9 56.6 72.7 51.4
Exports of goods and services (% of GDP') 35.1 35.2 34.6 38.3 37.8 38.6 39.7 42.7 45.5 45.8 39.3 18.1 29.7 39.2 55.9 24.3 I7.2 11.7 92.1 30.3
Imports of goods and servics (% of GDP) 37.0 39.1 41.4 39.3 43.0 45.7 42.9 42.8 46.4 47.6 42.5 24.1 27.7 46.2 63.2 28.3 16.7 14.2 85.9 23.6
Intemsationsal tourism receipt (%of totalexports) 10.2 11.3 14.0 15.1 16.7 19.9 18.9 17.4 16.9 16.8 15.7 11.2 5.6 37.5 34.6 16.2 6.2 6.1 4.0 3.4
Cunrent accountbalance (% of GtP) .3.9 -7.9 -7.4 -1.3 -5.5 -8.2 -2.8 .1.6 -1.1 -2.7 -4.2 -4.3 -4.1 -3.1 -4.2 .1.3 -1.8 -5.6 0.7 3.1
Resource balance (%ofGODP) _-1.9 -3.9 -6.8 -0.9 -5.2 .7.1 -3.2 -0.1 -0.9 -1.8 .3.2 -6.0 2.0 -7.0 -7.3 -3.9 0.5 -2.5 6.2 6.7
Agriculture. value added (annual % growths) 4.6 7.4 2.5 6.3 4.0 2.4 3.0 4.0 -0.4 2.0 3.6 3.1 3.9 2.0 2.0 4.1 2.3 3.1 1.5 0.9
Manufacturing, value added (annual * girowth) 2.2 3.4 2.6 2.1 10.3 6.5 3.5 3.6 -4.1 0.0 3.0 2.6 2.0 3.1 0.3 .. 2.2 0.4 2.6 1.9
Services,.etc., valuseadded (annual %growths) 3.8 5.6 4.7 1.5 8.6 7.1 5.1 2.1 1.1 3.5 4.3 4.4 3.1 4.2 1.1 3.8 5.3 1.6 3.1 1.3
Exports of goods and services (annua % growtht) 7.2 15.9 8.7 8.4 12.2 11.2 7.9 7.3 9.1 4.4 9.2 7.4 8.5 17.5 1.6 12.4 7.8 6.1 4.4 6.9
Aid (%of GNP) 4.6 5.0 4.4 3.2 2.2 1.5 1.0 0.4 -01 0.0 2.2 2.1 1.7 1.1 4.1 1.7 0.3 1.2 1.3 0.1
Aid (%of gross domestic invesbssent) 17.3 17.3 15.3 12.0 7.3 4.7 3.7 1.8 -0.2 -0. 1 7.9 14.5 7.8 4.4 12.8 7.4 1.4 5.7 6.3 0.5
Aid per capita (currnt US$) 67.7 80.5 78.0 55.3 45.1 32.8 24.6 11.4 -1.4 -0.6 39.3 24.4 19.5 12.3 60.8 24.2 4.2 19.2 31.7 2.1
World Bank Net Disbursements (US$ mil[lion) -33.0 8.6 -40.2 -12.8 -18.6 -37.2 -45.6 -39.2 -31.9 -34.4 -28.4 -11.9 23.4 0.2 -25.5 -22.1 -210.5 87.6 -29.2 122.0
World Bank Net Disbursemsents per capita (cunrent -11.4 2.9 -13.4 -4.1 -5.8 -11.6 -13.8 -11.5 -9.4 -9.8 -8.8 -1.3 2.3 0.1 -10.3 -5.1 -5.6 3.7 .1I1.8 6.3 t.
US$) __________________________________________________Money and qusi nsoney (M2) as %of GDP 36.8 38.2 38.0 37.7 36.9 37.3 36.3 32.9 36.1 39.4 37.0 22.3 21.3 21.4 41.9 21.8 18.5 14.1 49.1 24.0
Money and qutasi mioney growth (annual %) 40.2 16.4 27.5 33.7 24.5 15.2 22.0 4.8 47.6 16.4 24.8 19.4 53.1 28.5 32.0 31.0 31.9 944.8 12.4 44.8
Infation. conunser prices (annual %) 20.8 16.5 19.0 28.7 21.8 9.8 13.5 23.2 17.5 13.2 18.4 15.8 43.6 22.6 28.6 19.6 24.7 1213.4 1.0 52.9
Domestic credit ploy, by banking sector (% of GDP, 34.1 30.3 29.9 25.0 23.7 24.9 23.9 20.8 33.0 37.4 28&3 17.8 31.1 28.6 33.5 23.6 38.0 13.7 61.6 33.4
Gross domiestic savings (% of GDP) 22.6 22.6 20.5 24.2 24.0 22.7 23.2 23.4 22.0 25.0 23.0 8.8 21.9 17.7 24.0 18.3 20.4 18.7 26.7 24.4
Gross donmestic invesument (% of G3DP) 24.5 26.5 27.3 25.2 29.2 29.8 26.4 23.5 22.9 26.8 26.2 14.8 19.9 24.7 31.3 22.3 19.8 21.2 20.5 17.8
Grossinternational rewerves in monthssof imponss 3.9 3.5 2.3 4.4 3.8 3.3 2.8 3.0 2.6 3.0 3.3 3.1 3.3 1.0 1.5 2.8 6.1 6.7 0.8 8.7
Private investment (% of GDFI) 78.2 77.9 78.9 78.5 80.1 78.9 75.5 77.0 75.9 80.0 78.1 81.0 80. 1 70.4 .. 82.5 58.3 81.7 84.2 42.7
Total debt serice (%of exports goods and services) 24.3 17.7 23.9 18.1 20.1 18.3 14.6 16.5 13.9 11.8 17.9 15.8 29.3 9.9 24.1 11.2 37.6 23.1 6.3 24.0
Overall budget deficit, including grants (% of GDP) 0.0 -2.1 -3.1 -1.3 0.9 .0.2 -5.7 -2.9 -3.9 .. -2.0 .. 1.1 0.2 .. 1.3 0.2 -2.0 18 -.
Expenditure total (% of GDP) 24.5 26.1 25.6 24.8 23.9 26.2 30.6 29.1 30.6 .. 26.8 .. 14.8 14.7 .. 11.0 13.5 15.1 24.9 19.4
Current revenue, excluding grants (% of GDP) 25.1 24.4 23.0 23.5 24.8 25.9 24.9 26.2 26.7 .. 24.9 .. 15.8 14.7 .. 12.3 13.8 12.5 25.6 19.9
Tax revenue (%of GDP) 21.5 20.9 19.7 20.3 21.7 22.5 22.0 22.5 23.5 .. 21.6 .. 15.2 13.3 .. 9.1 12.0 11.3 17.1 15.4
Trade (% of GDP) 72.1 74.4 76.0 77.6 80.9 84.2 82.6 85.6 91.9 93.4 81.9 42.2 57.3 85.4 119.0 52.6 33.9 25.9 178.1 53.9
Foreign diect investment, net inflows (%of GDI) 10.8 7.3 10.5 12.6 11.5 11.0 13.5 18.7 20.7 2.2 11.9 7.5 10.2 9.9 10.7 7.4 11.6 9.0 7.6 10.9
Illiteracy rate, adult tota (% of people 15+) .. 6.1. .. 5.3 .. 5.0 5.5 35.6 10.3 18.8 15.7 8.4 10.0 12.6 9.8 8.8
Imununizationi, DPT (% of ciild, Under 12 monthss) 87.0 87.0 95.0 90.0 91.0 88.0 87.0 85.0 85.0 91.0 88.6 67.1 72.6 63.2 87.6 76.4 83.8 81.5 82.8 61.4
Life expectancy at birtli, total (years) . .. 75.4 .. 75.7 76.5 75.9 62.7 69.0 69.9 73.8 68.8 69.5 67.0 73.1 71.9
Moritaiy rate, infant (per 1,000live birftl) - . 14.8 .. 14.0 .. 13.0 12.0 13.5 50.1 39.4 46.3 13.6 27.1 27.5 48.8 24.1 22.7
Safe water (% of population with access) 94.0. ... 100.0 . .. 97.0 62.8 59.0 62.0 82.1 36.0 84.3 60.7 83.5 78.7
Santitation (% of population with access) 97.0. ... 97.0 . .. 97.0 65.1 54.3 66.7 74.0 45.0 60.0 49.3 87.0 73.0
School enrollssent, prinsary(% gross) 101 101 101 102 103 103 102 103 103 .. 101.9 83.5 121.7 99.0 101.3 107.6 106.2 118.5 105.1 93.6
POpulation density (people per sq km) 56.5 58.1 59.7 60.5 61.9 63.3 64.7 66.1 67.0 .. 62.0 85.3 38.8 152.9 226.1 11.3 35.0 . 17.5 33.5 23.1
lUrban population (% of total) 146.2 46.7 47.1 47.5 48.0 48.4 48.9 49.3 49.8 50.3 148.2 38.5 57.0 60.1 52.6 50.5 71.3 69.9 54.7 84.9
Annex A 24
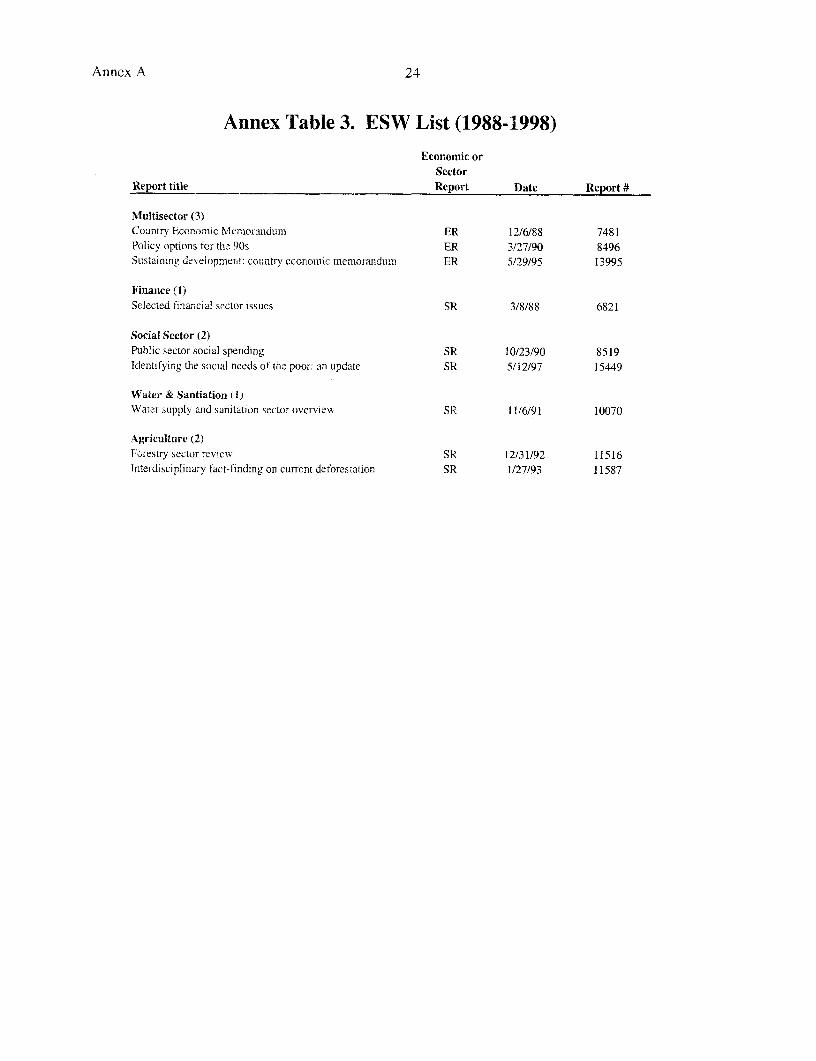
Annex Table 3. ESW List (1988-1998)Economic or
SectorReport title Report Date Report
Multisector (3)Country Economic Memorandum ER 12/6/88 7481Policy options for the 90s ER 3/27/90 8496Sustaining development: country economic memorandum ER 5/29/95 13995
Finance (1)Selected financial sector issues SR 3/8/88 6821
Social Sector (2)Public sector social spending SR 10/23/90 8519Identifying the social needs of the poor: an update SR 5/12/97 15449
Water & Santiation (1)Water supply and sanitation sector overview SR 11/6/91 10070
Agriculture (2)Forestry sector review SR 12/31/92 11516Interdisciplinary fact-finding on current defbrestation SR 1/27/93 11587
25 Annex A
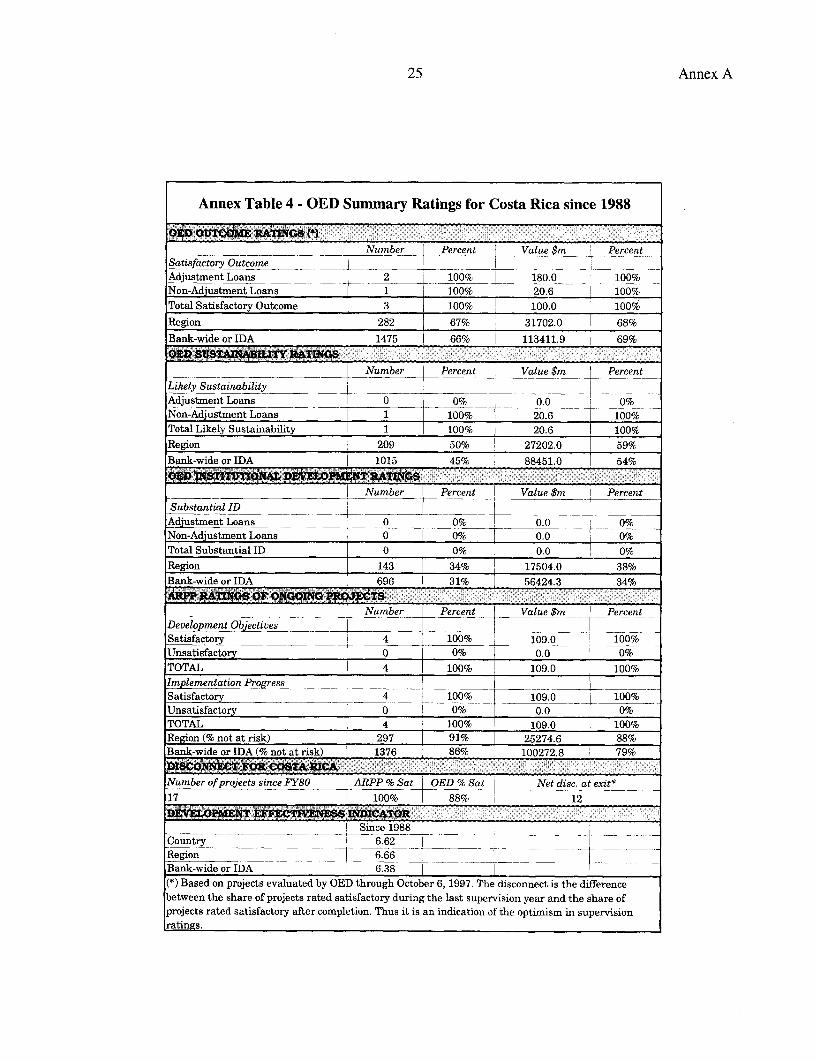
Annex Table 4 - OED Summary Ratings for Costa Rica since 1988
O WD o1Jt60~I wnTl oas (- _ _ _ _ _ __ _ _ _ _ _ _
__________ Number _ercent I Value$m PercentSatisfactorv Outcome. -_ _ .______ . _ _______
Adjustment Loans _ 2 __ 100% 180.0 _ 100%Non-Adjustment Loans 1 100% 20.6 100%Total Satisfactory Outcome 3 100% 100.0 100%
Region 282 67% ! 31702.0 68%
Bank-wide or IDA 1475 66% 113411.9 69%
O- S TAMAS, Y "TINOS _
I Number Percent I Value $m I PercentLikely Sustainability _ _ _Adjustment Loans 0 00% 0 0 - 0%
Non-Adjustment Loans 1 100% 20.6 100%
Total Likely Sustainability 1 100% 20.6 100%Region Q 209 50% 1 27202.0 59%
Bank-wide or IDA 1015 45% 88451.0 54%
OEkg tSkTMftI4AL D&=0PM=T UATCOS_
__Number Percent Value $m PercentSubstantial IDAdjustment Loans 0 _ 0% 0.0 [ 0%Non-Adjustment Loans 0 0% 0.0 0%Total Substantial ID 0 0% 0.0 0%Region 143 34% 17504.0 38%Bank-wide or IDA 696 - 31% 56424.3 34%APSP MXTiGS OF ONGOXG _ O_o, _,_.._ __
Number Percent Value $m PercentDeelnent Objectives -19010
Satisfactory 4 0°G109.0 | 100%Unsatisfactory 0 0% 0.0 0%TOTAL 4 100% 109.0 100%Implementation Progress _ -- ________ ____ . _ ___ ____
Satisfactory 4 100% 109.0 _ 100%Unsatisfactory 0 0%0.0 0%TOTAL 4 100% 109.0 100%Region (% not at risk) J 297 ; 91% 25274.6 88%Bank-wide or IDA (% not at risk) 1376 86% 100272.8 79%
;1scdw3T PORT COSTA ,M& ,_.___...___.,__ _X
Number of projects since FY80 ARPP % Sat OED % Sat Net disc. at exit*
17 100% 88% 12
nPvMnENT F 1iEESS UMcATOPtSkince 1988
Country 6.62_6.6
Region _ 6.66 --- - -_ ._ ---- t -- ----- t- -t- - ____
Bank-wide or IDA 6.38 8(*) Based on projects evaluated by OED through October 6, 1997. The discolnect is the differencebetween the share of projects rated satisfactory during the last supervision year and the share ofprojects rated satisfactory after completion. Thus it is an indication of the optimism in supervisionratings.
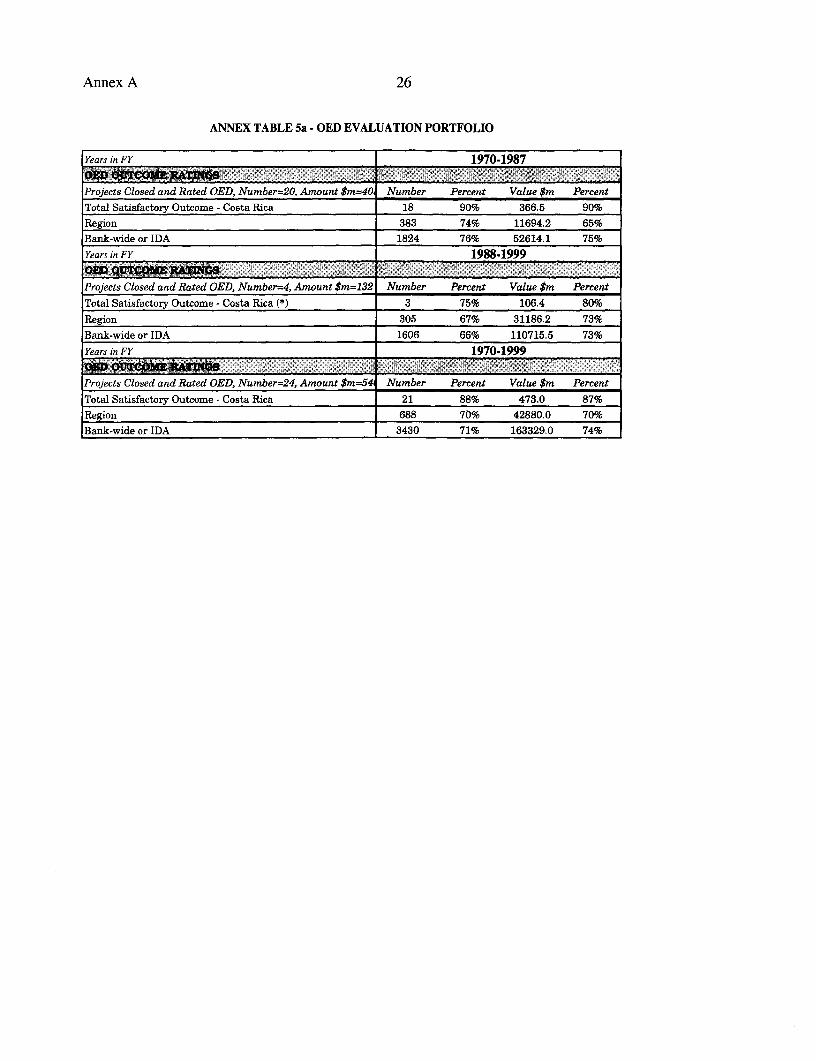
Annex A 26
ANNEX TABLE 5a - OED EVALUATION PORTFOLIO
Years in FY 1970-1987
__W~~~~~~~~~~~~~~~~~~~~~~~~IProjects Closed and Rated OED, Number=20, Amount $m=40, Number Percent Value $m Percent
Total Satisfactory Outcome - Costa Rica 18 90% 366.5 90%
Region 383 74% 11694.2 65%Bank-wide or IDA 1824 76% 52614.1 75%
Years in FY 1988-1999
Projects Closed and Rated OED, Number=4, Amount $m=132 Number Percent Value $m Percent
Total Satisfactory Outcome - Costa Rica (*) 3 75% 106.4 80%
Region 305 67% 31186.2 73%Bank-wide or IDA 1606 66% 110715.5 73%
Years in FY 1970-1999
Projects Closed and Rated OED, Number=24, Amount $m=54 Number Percent Value $m Percent
Total Satisfactory Outcome - Costa Rica 21 88% 473.0 87%Region 688 70% 42880.0 70%Bank-wide or IDA 3430 71% 163329.0 74%
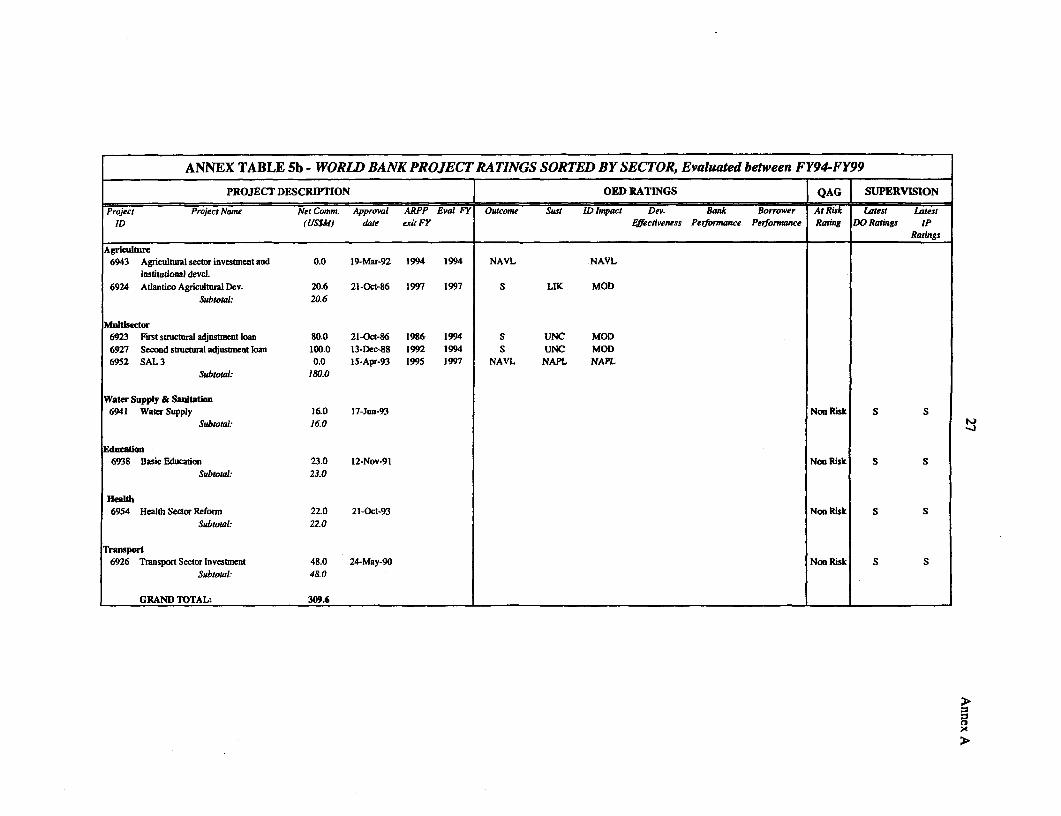
ANNEX TABLE 5b - WORLD BANK PROJECT RATINGS SORTED BY SECTOR, Evaluated between FY94-FY99
PROJECT DESCRIPTION | OED RATINGS QAG SUPERVISION
Projecs Project Name Net Conmm Approval ARPP Eval FY Outcome Sust ID impact Dev. Bank Borrower At Rsrk Latest LatestID (US$M) date exit FY Effechtveness Performance Performance Radng DO Ratings IP
_______________________________________________________________________ RadngsAgriculture
6943 Agricultural sector investment and 0.0 19-Mar-92 1994 1994 NAVL NAVLinasitudonal devel.
6924 Adantico Agricultural Dev. 20.6 21-Oct-86 1997 1997 S LIK MOD
Subtotal: 20.6
Muhlsector6923 First structural adjustmnent loan 80.0 21-Oct-86 1986 1994 S UNC MOD
6927 Second stmctural adjustment loan 100.0 13-Dec-88 1992 1994 S UNC MOD6952 SAL 3 0.0 15-Apr-93 1995 1997 NAVL NAPL NAPL
Subtotal: 180.0
Water Supply & Sanitation6941 Water Supply 16.0 17-Jun-93 Non Risk S S
Subtotal: 16.0
Education6938 Basic Education 23.0 12-Nov-91 Non Risk S S
Subtotal: 23.0
Health6954 Health Sector Reforn 22.0 21-Oct-93 Non Risk S S
Subtotal: 22.0
Transport6926 Transport Sector Investnent 48.0 24-May-90 Non Risk S S
Subtotal: 4&0
GRAND TOTAL: 309.6 _____
>e
:9.
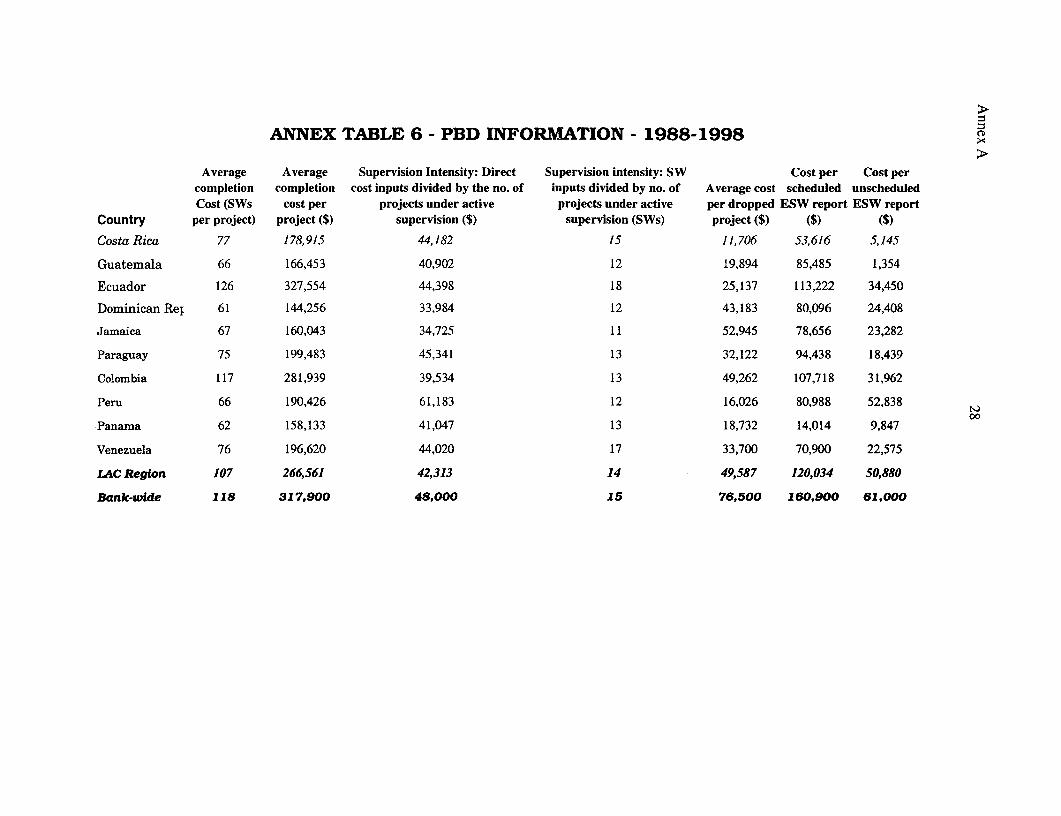
ANNEX TABLE 6 - PBD INFORMATION - 1988-1998
Average Average Supervision Intensity: Direct Supervision intensity: SW Cost per Cost percompletion completion cost inputs divided by the no. of inputs divided by no. of Average cost scheduled unscheduledCost (SWs cost per projects under active projects under active per dropped ESW report ESW report
Country per project) project ($) supervision ($) supervision (SWs) project ($) ($) ($)
Costa Rica 77 178,915 44,182 15 11,706 53,616 5,145
Guatemala 66 166,453 40,902 12 19,894 85,485 1,354
Ecuador 126 327,554 44,398 18 25,137 113,222 34,450
Dominican Rey 61 144,256 33,984 12 43,183 80,096 24,408
Jamaica 67 160,043 34,725 11 52,945 78,656 23,282
Paraguay 75 199,483 45,341 13 32,122 94,438 18,439
Colombia 117 281,939 39,534 13 49,262 107,718 31,962
Peru 66 190,426 61,183 12 16,026 80,988 52,83800
Panama 62 158,133 41,047 13 18,732 14,014 9,847
Venezuela 76 196,620 44,020 17 33,700 70,900 22,575
LAC Region 107 266,561 42,313 14 49,587 120,034 50,880
Bank-wide 118 317,900 48,000 15 76,500 160,900 61,000
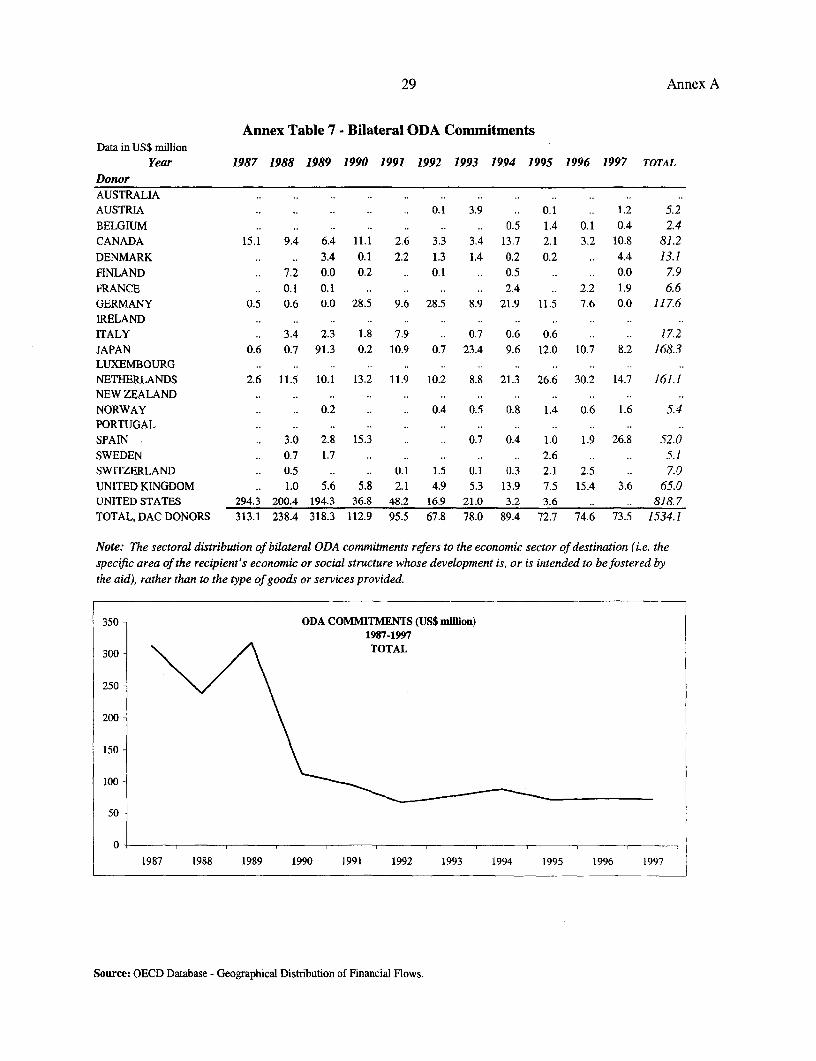
29 Annex A
Annex Table 7 - Bilateral ODA CommitmentsData in US$ million
Year 1987 1988 1989 1990 1991 1992 1993 1994 1995 1996 1997 TOTALDonorAUSTRALIA . . . . . . . . .
AUSTRIA .. . . . . 0.1 3.9 .. 0.1 .. 1.2 5.2BELGIUM .. . . . . . . 0.5 1.4 0.1 0.4 2.4
CANADA 15.1 9.4 6.4 11.1 2.6 3.3 3.4 13.7 2.1 3.2 10.8 81.2DENMARK . .. 3.4 0.1 2.2 1.3 1.4 0.2 0.2 .. 4.4 13.1FINLAND .. 7.2 0.0 0.2 .. 0.1 .. 0.5 . .. 0.0 7.9FRANCE .. 0.1 0.1 . .. . .. 2.4 .. 2.2 1.9 6.6
GERMANY 0.5 0.6 0.0 28.5 9.6 28.5 8.9 21.9 11.5 7.6 0.0 117.6
ITALY .. 3.4 2.3 1.8 7.9 .. 0.7 0.6 0.6 . .. 17.2JAPAN 0.6 0.7 91.3 0.2 10.9 0.7 23.4 9.6 12.0 10.7 8.2 168.3LUXEMBOURG . . . . . . . . .
NETHERLANDS 2.6 11.5 10.1 13.2 11.9 10.2 8.8 21.3 26.6 30.2 14.7 161.1NEW ZEALAND . . . . . . . . .
NORWAY . .. 0.2 . .. 0.4 0.5 0.8 1.4 0.6 1.6 5.4PORTUGAL . . . . . . . . .
SPAIN .. 3.0 2.8 15.3 . .. 0.7 0.4 1.0 1.9 26.8 52.0SWEDEN .. 0.7 1.7 .. . . . . 2.6 . .. 5.1
SWITZERLAND .. 0.5 . .. 0.1 1.5 0.1 0.3 2.1 2.5 .. 7.0UNITED KINGDOM .. 1.0 5.6 5.8 2.1 4.9 5.3 13.9 7.5 15.4 3.6 65.0UNITED STATES 294.3 200.4 194.3 36.8 48.2 16.9 21.0 3.2 3.6 . .. 818.7TOTAL, DAC DONORS 313.1 238.4 318.3 112.9 95.5 67.8 78.0 89.4 72.7 74.6 73.5 1534.1
Note: The sectoral distribution of bilateral ODA commitments refers to the economic sector of destination (i.e. thespecific area of the recipient's economic or social structure whose development is, or is intended to be fostered bythe aid), rather than to the type of goods or services provided.
350 -ODA COMMITMENTS (US$ million)1987-1997
300 -TOTAL
250-
200-
150-
100
50-
0 III
1987 1988 1989 1990 1991 1992 1993 1994 1995 1996 1997
Source: OECD Database - Geographical Distribution of Financial Flows.

Annex A 30
ANNEX TABLE 8 - BANK MANAGEMENT FOR COSTA RICA: 1990 - 1999
Year Vice President Country Director Country Operations Resident RepresentativeDivision Chief
1990 S. Shahid Husain Rainer B. Steckhan Miguel E. Martinez n.a.
1991 S. Shahid Husain Rainer B. Steckhan Marko Voljc n.a.
1992 S. Shahid Husain Rainer B. Steckhan Marko Voljc n.a.
1993 S. Shahid Husain Edilberto L. Segura Robert M. Lacey n.a.
1994 Shahid Javed Bukil Edilberto L. Segura Robert M. Lacey n.a.
1995 Shahid Javed Burki Edilberto L. Segura Donna Dowsett-Coirolo Shahla Torabi*
1996 Shahid Javed Burki Coirolo n.a. Shahla Torabi*
Donna Dowsett-1997 Shahid Javed Burki Donna Dowsett- n.a. Shahla Torabi*
1998 Shahid Javed Buri Donna owstt n.a. Shahla Torabi*
1999 Shahid Javed Burki oirolo n.a. n.a.________ RgoaIpeettnMsiCoirolo
*Regional Implementation Mission
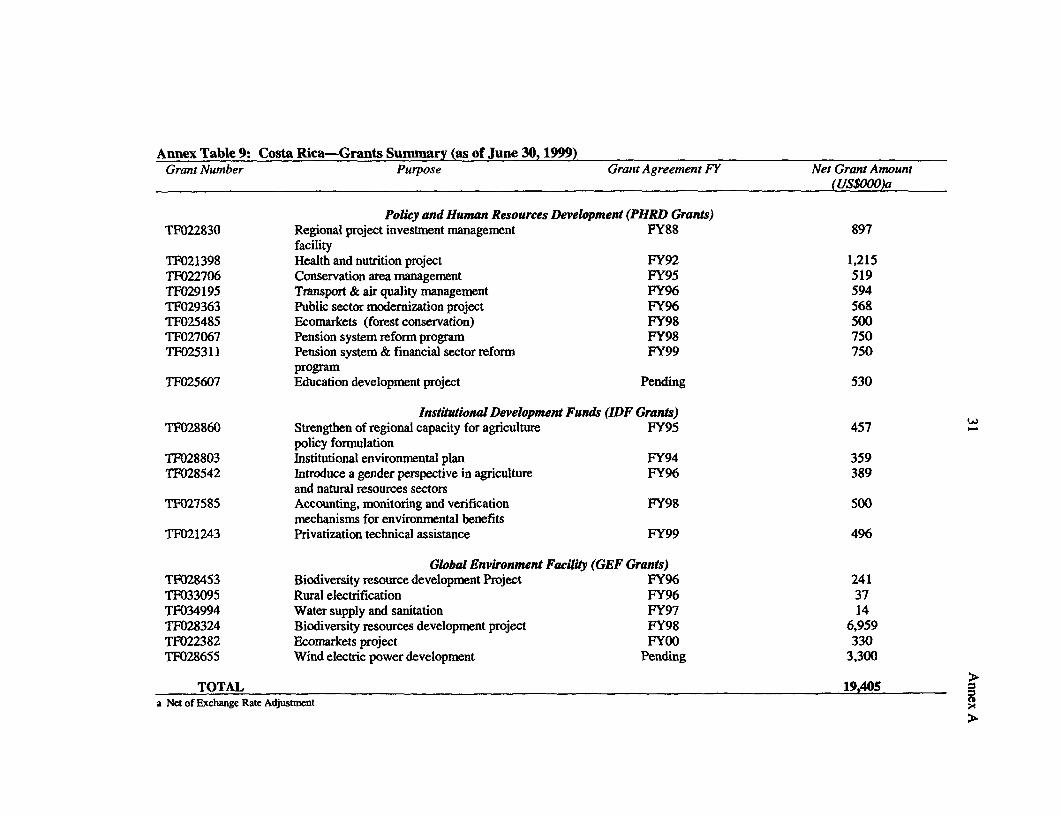
Annex Table 9: Costa Rica-Grants Summary (as of June 30, 1999)Grant Number Purpose Grant Agreement FY Net Grant Amount
(US$OOO)a
Poicy and Human Resources Development (PHRD Grants)TF022830 Regional project investment management FY88 897
facilityTF021398 Health and nutrition project FY92 1,215TF022706 Conservation area management FY95 519TF029195 Transport & air quality management FY96 594TF029363 Public sector modernization project FY96 568TF025485 Ecomnarkets (forest conservation) FY98 500TF027067 Pension system reform program FY98 750TF025311 Pension system & financial sector reforn FY99 750
programTF025607 Education development project Pending 530
lnstidutonal Development Funds (IDF Grants)TF028860 Strengthen of regional capacity for agriculture FY95 457 -
policy formulationTF028803 Institutional environmental plan FY94 359TF028542 Introduce a gender perspective in agriculture FY96 389
and natural resources sectorsTF027585 Accounting, monitoring and verification FY98 so0
mechanisms for environmental benefitsTF021243 Privatization technical assistance FY99 496
Global Environment Facility (GEF Grants)TF028453 Biodiversity resource development Project FY96 241TF033095 Rural electrification FY96 37TF034994 Water supply and sanitation FY97 14TF028324 Biodiversity resources development project FY98 6,959TF022382 Ecomarkets project FY00 330TF028655 Wind electric power development Pending 3,300
TOTAL 19,405a Net of Exchange Rate Adjustment
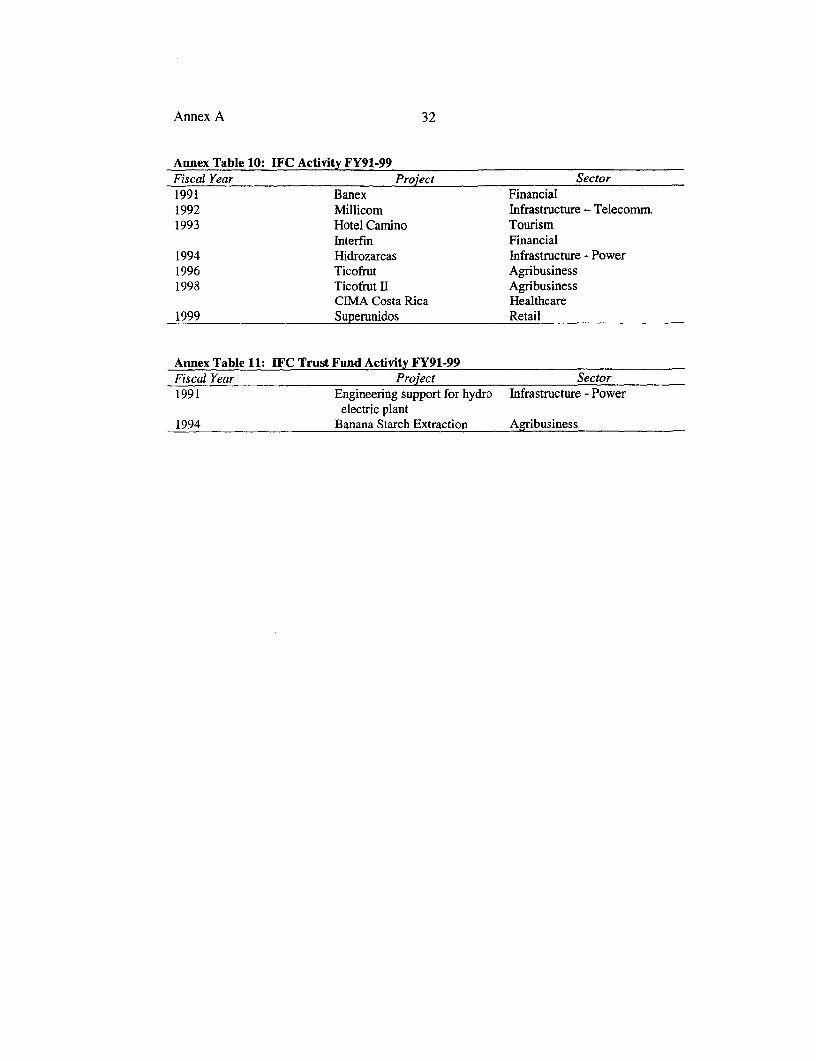
Annex A 32
Annex Table 10: IFC Activity FY91-99Fiscal Year Project Sector1991 Banex Financial1992 Millicom Infrastructure - Telecomm.1993 Hotel Camino Tourism
Interfin Financial1994 Hidrozarcas Infrastructure - Power1996 Ticofrut Agribusiness1998 Ticofrut n Agribusiness
CIMA Costa Rica Healthcare1999 Superunidos Retail
Annex Table 11: IFC Trust Fund Activity FY91-99Fiscal Year Project Sector1991 Engineering support for hydro Infrastructure - Power
electric plant1994 Banana Starch Extraction Agribusiness
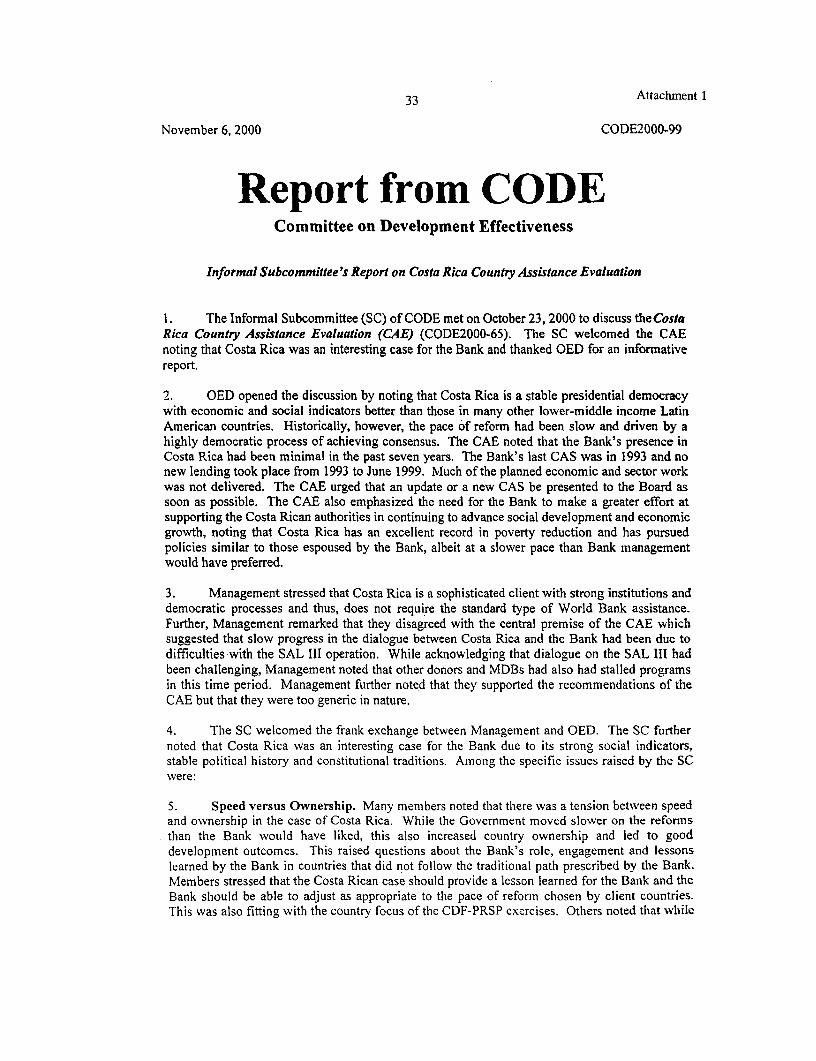
33 Attachment 1
November 6, 2000 CODE2000-99
Report from CODECommittee on Development Effectiveness
Informal Subcommittee's Report on Costa Rica Country Assistance Evaluation
I. The Informal Subcommittee (SC) of CODE met on October 23, 2000 to discuss the CostaRica Country Assistance Evaluation (CAE) (CODE2000-65). The SC welcomed the CAEnoting that Costa Rica was an interesting case for the Bank and thanked OED for an informativereport.
2. OED opened the discussion by noting that Costa Rica is a stable presidential democracywith economic and social indicators better than those in many other lower-middle income LatinAmerican countries. Historically, however, the pace of reform had been slow and driven by ahighly democratic process of achieving consensus. The CAE noted that the Bank's presence inCosta Rica had been minimal in the past seven years. The Bank's last CAS was in 1993 and nonew lending took place from 1993 to June 1999. Much of the planned economic and sector workwas not delivered. The CAE urged that an update or a new CAS be presented to the Board assoon as possible. The CAB also emphasized the need for the Bank to make a greater effort atsupporting the Costa Rican authorities in continuing to advance social development and economicgrowth, noting that Costa Rica has an excellent record in poverty reduction and has pursuedpolicies similar to those espoused by the Bank, albeit at a slower pace than Bank managementwould have preferred.
3. Management stressed that Costa Rica is a sophisticated client with strong institutions anddemocratic processes and thus, does not require the standard type of World Bank assistance.Further, Management remarked that they disagreed with the central premise of the CAE whichsuggested that slow progress in the dialogue between Costa Rica and the Bank had been due todifficulties with the SAL III operation. While acknowledging that dialogue on the SAL III hadbeen challenging, Management noted that other donors and MDBs had also had stalled programsin this time period. Management further noted that they supported the recommendations of theCAE but that they were too generic in nature.
4. The SC welcomed the frank exchange between Management and OED. The SC furthernoted that Costa Rica was an interesting case for the Bank due to its strong social indicators,stable political history and constitutional traditions. Among the specific issues raised by the SCwere:
S. Speed versus Ownership. Many members noted that there was a tension between speedand ownership in the case of Costa Rica. While the Government moved slower on the reforrnsthan the Bank would have liked, this also increased country ownership and led to gooddevelopment outcomes. This raised questions about the Bank's role, engagement and lessonslearned by the Bank in countries that did not follow the traditional path prescribed by the Bank.Members stressed that the Costa Rican case should provide a lesson learned for the Bank and theBank should be able to adjust as appropriate to the pace of reform chosen by client countries.This was also fitting with the country focus of the CDF-PRSP exercises. Others noted that while
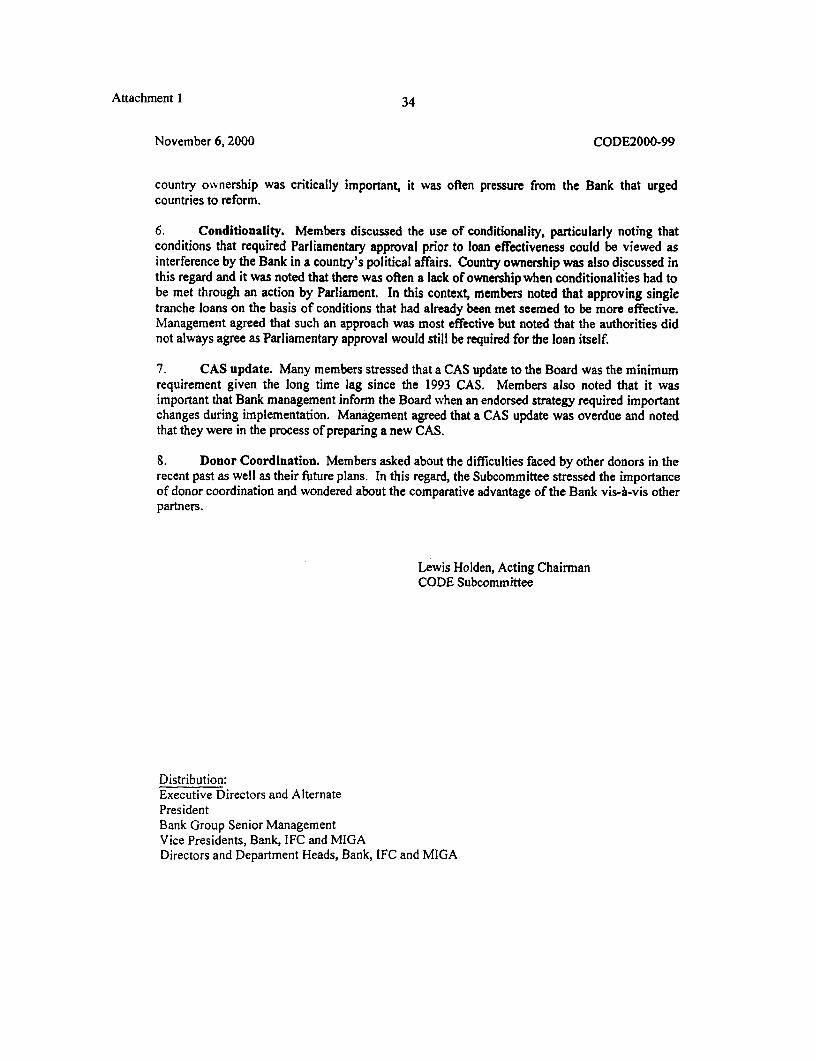
Attachment 1 34
November 6, 2000 CODE2000-99
country ownership was critically important, it was often pressure from the Bank that urgedcountries to reform.
6. Conditionality. Members discussed the use of conditionality, particularly noting thatconditions that required Parliamentary approval prior to loan effectiveness could be viewed asinterference by the Bank in a country's political affairs. Country ownership was also discussed inthis regard and it was noted that there was often a lack of ownership when conditionalities had tobe met through an action by Parliament. In this context, members noted that approving singletranche loans on the basis of conditions that had already been met seemed to be more effective.Management agreed that such an approach was most effective but noted that the authorities didnot always agree as Parliamentary approval would still be required for the loan itself.
7. CAS update. Many members stressed that a CAS update to the Board was the minimumrequirement given the long time lag since the 1993 CAS. Members also noted that it wasimportant that Bank management inform the Board when an endorsed strategy required importantchanges during implementation. Management agreed that a CAS update was overdue and notedthat they were in the process of preparing a new CAS.
8. Donor Coordination. Members asked about the difficulties faced by other donors in therecent past as well as their future plans. In this regard, the Subcommittee stressed the importanceof donor coordination and wondered about the comparative advantage of the Bank vis-a-vis otherpartners.
Lewis Holden, Acting ChairnanCODE Subcommittee
Distribution:Executive Directors and AlternatePresidentBank Group Senior ManagementVice Presidents, Bank, IFC and MIGADirectors and Department Heads, Bank, IFC and MIGA