Embed Size (px)
Citation preview

SD 2.12.05
Report No. 856
Aggregates Proficiency Testing
Round 12
May 2014
Acknowledgments
PTA wishes to gratefully acknowledge the technical assistance provided for this program and for the supply of the samples by Mr G Hooper, Golder Associates Pty Ltd.
© Copyright Proficiency Testing Australia, 2014
PO Box 7507 SILVERWATER NSW 2128, Australia

SD 2.12.05
CONTENTS
1. FOREWORD ........................................................................................................ 1
2. FEATURES OF THE PROGRAM ......................................................................... 1
3. FORMAT OF THE APPENDICES ........................................................................ 2
4. STATISTICAL DESIGN OF THE PROGRAM ....................................................... 2
Table A: Summary Statistics ................................................................................ 4
5. PTA AND TECHNICAL ADVISOR’S COMMENTS ............................................... 5
Table B: Comparison of Robust CVs and Percentage of Outliers ....................... 7
6. OUTLIER RESULTS ............................................................................................. 9
Table C: Summary of Statistical Outliers ............................................................. 9
7. REFERENCES ..................................................................................................... 9
APPENDIX A – Results and Data Analysis
Apparent Particle Density (nearest 0.01 t/m3)..........................................................…A1
Particle Density on a Dry Basis (nearest 0.01 t/m3)..................................................…A2
Particle Density on a Saturated-Surface-Dry Basis (nearest 0.01 t/m3)....................…A4
Water Absorption (nearest 0.1%).............................................................................…A5
Particle Size Distribution (nearest 0.1%)..................................................................…A7
Flakiness Index (nearest 1%).................................................................................. …A13
Dry Strength Loss at Nominated Load (nearest 0.1%)………………....................... …A14 APPENDIX B – Homogeneity Testing
Homogeneity Testing................................................................................................…B1 APPENDIX C – Documentation
Instructions to Participants........................................................................................…C1
Results Sheet............................................................................................................…C2

1
SD 2.12.05
1. FOREWORD
This report summarises the results of a proficiency testing program on the determination of mechanical tests of aggregate. It constitutes the twelfth round of an ongoing series of programs. The program was conducted in March 2014 by Proficiency Testing Australia (PTA). The aim of the program was to assess laboratories’ abilities to competently perform the prescribed analyses. The Program Coordinator was Ms L Galbraith and the Technical Advisor was Mr G Hooper, Golder Associates Pty Ltd. This report was authorised by Mrs F Watton, Quality - Business Development Manager.
2. FEATURES OF THE PROGRAM (a) Participants were provided with one 13 Kg sample of aggregate. (b) A total of 66 laboratories received samples, comprising:
- 60 Australian participants; and
- 6 overseas participants, including:
- Malaysia; - Serbia; - Republic of Korea; and - Papua New Guinea.
Of these 66 laboratories, 2 were unable to submit results by the due date. (c) Laboratories were provided with the Instructions to Participants and Results
Sheet (see Appendix C). Laboratories were requested to perform the tests according to their routine methods and to record their results on the Results Sheet.
(d) Prior to sample distribution, a number of randomly selected samples were
analysed for homogeneity. Based on the results of this testing (see Appendix B), the homogeneity of the samples was established.
(e) Each laboratory was randomly allocated a unique code number for the
program to ensure confidentiality of results. Reference to each laboratory in this report is by code number only. Please note that a number of laboratories reported more than one set of results and, therefore, their code numbers (with letter) could appear several times in the same data set.
(f) Results (as reported by participants) with corresponding summary statistics
(i.e. number of results, median, uncertainty of the median, normalised

2
SD 2.12.05
interquartile range, robust coefficient of variation, minimum, maximum and range) are presented in Appendix A (for each sample and for each of the analyses performed). Measurement Uncertainty (MU) is also presented where supplied by participants. Please note that this information is presented for information purposes only and has not been used for the formal evaluation of results.
(g) A robust statistical approach, using z-scores, was utilised to assess
laboratories’ testing performance (see Section 3). Robust z-scores and z-score charts relevant to each test are presented in Appendix A.
(h) The document entitled Guide to Proficiency Testing Australia, 2012 (reference
[1]) defines the statistical terms and details the statistical procedures referred to in this report.
(i) A tabulated listing of laboratories (by code number) identified as having outlier
results can be found on page 9. 3. FORMAT OF THE APPENDICES (a) Appendix A contains the analysis of results reported by laboratories for the
samples. This section contains the following for each determinant, where appropriate: - a table of results and calculated z-scores;
- a list of summary statistics; and
- ordered z-score charts.
(b) Appendix B contains details of the homogeneity testing. (c) Appendix C contains copies of the Instructions to Participants and Results
Sheet. 4. STATISTICAL DESIGN OF THE PROGRAM (a) Outlier Results and Z-scores In order to assess laboratories’ testing performance, a robust statistical
approach, using z-scores, was utilised. Z-scores give a measure of how far a result is from the consensus value (i.e. the median), and gives a "score" to each result relative to the other results in the group.
A z-score close to zero indicates that the result agrees well with those from
other laboratories. Whereas, a z-score with an absolute value greater than or equal to 3.0 is considered to be an outlier and is marked by the symbol “§”.

3
SD 2.12.05
The table on page 9 summarises the outlier results detected. (b) Results Tables and Summary Statistics Each of these tables contains the results returned by each laboratory,
including the code number for the method used, and the robust z-score calculated for each result.
Results have been entered exactly as reported by participants. That is,
laboratories which did not report results to the precision (i.e. number of significant figures) requested on the Results Sheet have not been rounded to the requested precision before being included in the statistical analysis.
A list of summary statistics appears at the bottom of each of the tables of results and consists of:
- the number of results for that test/sample (No. of Results);
- the median of these results, i.e. the middle value (Median);
- the uncertainty of the median;
- the normalised interquartile range of the results (Normalised IQR);
- the robust coefficient of variation, expressed as a percentage (Robust CV) - i.e. 100 x Normalised IQR / Median;
- the minimum and maximum laboratory results; and
- the range (Maximum - Minimum).
The median is a measure of the centre of the data. The normalised IQR is a measure of the spread of the results. It is calculated by multiplying the interquartile range (IQR) by a correction factor which converts the IQR to an estimate of the standard deviation. The IQR is the difference between the upper and lower quartiles (i.e. the values above and below which a quarter of the results lie, respectively).
Please see reference [1] for further details on these robust summary statistics.
(c) Ordered Z-Score Charts On these charts each laboratory's robust z-score is shown, in order of
magnitude, and is marked with its code number. From these charts, each laboratory can readily compare its performance relative to the other laboratories.
These charts contain solid lines at +3.0 and -3.0, so that outliers are clearly
identifiable as those laboratories whose "bar" extends beyond these "cut-off" lines. The y-axis of these charts has been limited, so very large z-scores appear to extend beyond the chart boundary.

4
SD 2.12.05
The following table summarises the results submitted by participants for the
program. TABLE A: SUMMARY STATISTICS
Test No. of Results Median Normalised IQR
Particle Density and Water Absorption of Course
Aggregate
Apparent Particle Density (nearest 0.01 t/m3) 45 2.640 0.007
Particle Density on a Dry Basis (nearest 0.01 t/m3) 45 2.580 0.009
Particle Density on a Saturated-Surface-Dry Basis (nearest 0.01 t/m3)
45 2.600 0.010
Water Absorption (nearest 0.1%) 45 0.90 0.07
Particle Size Distribution (individual percent retained to
nearest 0.1%)
26.5 mm 60 Not calculated
19.0 mm 60 5.85 1.30
13.2 mm 60 50.15 2.87
9.5 mm 60 37.40 3.02
4.75 mm 60 5.00 1.35
Flakiness Index (nearest 1%)
43 13.0 2.2
Dry Strength Loss at Nominated Load (nearest 0.1%) 33 8.60 0.89

5
SD 2.12.05
5. PTA AND TECHNICAL ADVISOR’S COMMENTS General Comments For this round, of the 66 participating laboratories, 2 laboratories could not submit results in time for inclusion into the final report. Another 2 laboratories results were omitted from the consensus due to reporting errors in Particle Size Distribution. Thus the participating 62 laboratories returned a total of 496 results for z-score analysis. Of these, 27 results were outliers, thus making up 5.4% of the total number of results submitted. Particle Density and Water Absorption of Course Aggregate Laboratories receiving outliers are reminded to check their processes, in particular laboratory 43, which returned an outlier for all Particle Density and Water Absorption of Course Aggregate tests. A target CV was used to make adjustments to results for Particle Density on a Dry Basis and for Particle Density on a Saturated-Surface-Dry Basis. Adjustments made to the CV for Apparent Particle Density had no effect on the z-scores or summary statistics. These were adjusted according to Queensland Department of Main Roads Method Q214B reproducibility guidelines. Please note summary sheets have been reissued to reflect changes made by the reproducibility guidelines. All laboratories reporting outlier results are encouraged to check their procedures and calibration of equipment. Particle Size Distribution For Particle Size Distribution (PSD) at 26.5mm, statistical analysis could not be performed as the results did not follow a normal distribution. Overall performance in PSD was good. All laboratories reporting outlier results are strongly encouraged to check their procedures. It is important that those laboratories that have questionable results, i.e., a z-score 2.0< |z-score| <3.0 also review their procedures. There was a high occurrence of outliers in the 4.75 mm sieve analysis. Laboratories receiving an outlier may need to check if they used only the sieves from which results were requested. If laboratories used other sieves, for example a 6.7 mm sieve, then material retained on this sieve must be included in the amount retained on the 4.75 mm sieve. Results submitted by laboratories 25 and 79 were omitted from the consensus as results were not reported to the correct units.

6
SD 2.12.05
Flakiness Index and Dry Strength at Nominated Load No outliers were reported for Flakiness Index. Results reported for Dry Strength at Nominated Load were satisfactory. Metrological Traceability and Measurement Uncertainty of Assigned Values Consensus values (median) derived from participants’ results are used in this program. These values are not metrologically traceable to an external reference. A nominal 20mm sized aggregate supplied from a quarry was used for the Aggregates Round 12 program. This sample was prepared according to standard AS1141.3.1, paragraphs 6.4.2 and 6.4.3. As the assigned value for each test in this program is the median of the results submitted by the participants, the uncertainty of the median has been calculated and is presented in the summary statistics tables of Appendix A.

7
SD 2.12.05
TABLE B: COMPARISON OF ROBUST CVs AND PERCENTAGE OF OUTLIERS
Test Apparent Particle
Density (nearest 0.01 t/m 3)
Particle Density on a Dry Basis
(nearest 0.01 t/m 3)
Particle Density on a Saturated-
Surface-Dry Basis (nearest 0.01 t/m 3)
Water Absorption (nearest 0.1%)
Flakiness Index (nearest 1%)
Dry Strength at Nominated Load (nearest 0.1%)
Round Robust CV
% outliers
Robust CV
% outliers
Robust CV
% outliers
Robust CV
% outliers
Robust CV
% outliers
Robust CV
% outliers
Aggregates 12 0.3% 4.4 0.4% 2.2 0.4% 2.2 8.2% 4.4 17.1% -- 10.3% 3.0
Aggregates 11 0.3% 8.8 0.4% 8.8 0.4% 5.9 18.5% 5.9 15.9% -- na na
Aggregates 10 0.3% 6.9 0.3% -- 0.6% 3.6 24.7% 3.3 8.7% 14.3 11.4% --
Particle Size
Distribution (individual percent retained to
nearest 0.1%)
19.0mm 13.2mm 9.5mm 4.75mm
Round Robust CV
% outliers
Robust CV
% outliers
Robust CV
% outliers
Robust CV
% outliers
Aggregates 12 22.2% 6.7 5.7% 5.0 8.1% 5.0 27.1% 16.7
Aggregates 11 56.7% 4.5 8.5% -- 7.7% 2.3 21.2% 4.4
Aggregates 10 na na 19.1% -- 4.8% 6.4 22.6% --

8
SD 2.12.05
Analysis of Results by Method Groups Grouped analysis was performed for methods appearing greater than or equal to 11 times in each test. The results are tabulated below.
Test Grouped Method
No. of Results Median
Uncertainty of the
Median Particle Density and Water
Absorption of Course Aggregate
Apparent Particle Density (nearest 0.01 t/m3) AS1141.6.1 37 2.640 0.002
Particle Density on a Dry Basis (nearest 0.01 t/m3) AS1141.6.1 37 2.580 0.002
Particle Density on a Saturated-Surface-Dry Basis
(nearest 0.01 t/m3) AS1141.6.1 37 2.640 0.002
Water Absorption (nearest 0.1%) AS1141.6.1 37 0.90 0.02
Particle Size Distribution (individual percent retained
to nearest 0.1%)
19.0 mm AS1141.11 & AS1141.11.1 44 6.00 0.25
13.2 mm AS1141.11 & AS1141.11.1 44 50.15 0.55
9.5 mm AS1141.11 & AS1141.11.1 44 37.30 0.53
4.75 mm AS1141.11 & AS1141.11.1 44 5.10 0.26
Flakiness Index (nearest 1%)
AS1141.15 33 13.0 0.5
Dry Strength Loss at Nominated Load (nearest 0.1%)
AS1141.22 27 8.60 0.19

9
SD 2.12.05
6. OUTLIER RESULTS
Laboratories reporting outlier results are listed in the following table:
TABLE C: SUMMARY OF STATISTICAL OUTLIERS
Test Laboratory Code No.
Particle Density and Water Absorption of Course Aggregate
Apparent Particle Density (nearest 0.01 t/m3) 43, 64
Particle Density on a Dry Basis (nearest 0.01 t/m3) 43
Particle Density on a Saturated-Surface-Dry Basis
(nearest 0.01 t/m3) 43
Water Absorption (nearest 0.1%) 43, 69
Particle Size Distribution (individual percent retained to nearest 0.1%)
19.0 mm 10, 33, 57, 71
13.2 mm 23, 57, 71
9.5 mm 2, 57, 71
4.75 mm 9, 37, 40, 44, 51A,
51B, 51C, 61, 64, 71 Flakiness Index
(nearest 1%) --
Dry Strength Loss at Nominated Load (nearest 0.1%) 4
7. REFERENCES
[1] Guide to Proficiency Testing Australia, 2012 (This document can be found on the PTA website, www.pta.asn.au).
[2] AS1141.3.1 - 2012 Methods for sampling and testing aggregates Method 3.1 Sampling - Aggregates.
[3] Q214B - 2013 Particle Density and Water Absorption of Aggregate (Coarse Fraction).

9
SD 2.12.05
APPENDIX A
Results and Data Analysis
Apparent Particle Density (nearest 0.01 t/m3)..........................................................…A1
Particle Density on a Dry Basis (nearest 0.01 t/m3)..................................................…A2
Particle Density on a Saturated-Surface-Dry Basis (nearest 0.01 t/m3)....................…A4
Water Absorption (nearest 0.1%).............................................................................…A5
Particle Size Distribution (nearest 0.1%)..................................................................…A7
Flakiness Index (nearest 1%).................................................................................. …A13
Dry Strength Loss at Nominated Load (nearest 0.1%)………………....................... …A14

A1
SD 2.12.05
Apparent Particle Density (nearest 0.01 t/m 3)
Laboratory Code Result Robust
z-score Method
1 2.62 -2.70 1141.6.1
2 2.64 0.00 AS1141.6.1
4 2.64 0.00 AS1141.6.1
5 2.63 -1.35 AS1141.6.1
9 2.63 -1.35 AS1141.6.1
10 2.64 0.00 ISO 6783
12 2.63 -1.35 Q214B
16 2.64 0.00 AS1141.6.1
18 2.64 0.00 MS EN 1097 Part 6
19 2.64 0.00 AS1141.6.1
20 2.64 0.00 AS1141.6.1
22 2.64 0.00 AS1141.6.1-2000
23 2.63 -1.35 AS1141.6.1
26 2.64 0.00 1141.6.1
27 2.63 -1.35 AS1141.6.1
28 2.64 0.00 AS1141.6.1
29 2.64 0.00 AS1141.6.1
30 2.65 1.35 AS1141.6.1
31 2.64 0.00 ASTM C 127
33 2.65 1.35 AS1141.6.1
36 2.64 0.00 AS1141.6.1
37 2.64 0.00 AS1141.6.1
39 2.63 -1.35 AS1141.6.1
40 2.65 1.35 AS1141.6.1
41 2.63 -1.35 AS1141.6.1
43 2.59 -6.74 § AS1141.6.1
44 2.64 0.00 AS1141.6.1
45 2.65 1.35 1141.6.1
47 2.64 0.00 AS1141.6.1
51A 2.64 0.00 #
51B 2.64 0.00 #
51C 2.64 0.00 #
53 2.63 -1.35 AS1141.6.1
Apparent Particle Density
(nearest 0.01 t/m 3)
Laboratory Code Result Robust
z-score Method
56 2.64 0.00 AS1141.6.1
58 2.64 0.00 AS1141.6.2
60 2.63 -1.35 AS1141.6.1
61 2.63 -1.35 AS1141.6.1
64 2.67 4.05 § AS1141.6.1
68 2.64 0.00 AS1141.6.1
69 2.64 0.00 AS1141.6.1
76 2.63 -1.35 AS1141.6.1 - 2000
77 2.64 0.00 AS1141.6.1
78A 2.64 0.00 AS1141.6.1
78B 2.64 0.00 AS1141.6.1
78C 2.65 1.35 AS1141.6.1
No. of
Results 45
Median 2.640 Normalised
IQR 0.007
Robust CV 0.3% Uncertainty of median
0.001
Minimum 2.59
Maximum 2.67
Range 0.08
Notes: A “§” indicates an outlier i.e. |z-score| ≥ 3.0. A “#” indicates no response was provided.

A2
SD 2.12.05
Particle Density on a Dry Basis (nearest 0.01 t/m 3)
Laboratory Code Result Robust
z-score Method
1 2.58 0.00 1141.6.1
2 2.57 -1.11 AS1141.6.1
4 2.58 0.00 AS1141.6.1
5 2.57 -1.11 AS1141.6.1
9 2.57 -1.11 AS1141.6.1
10 2.58 0.00 ISO 6783
12 2.56 -2.21 Q214B
16 2.58 0.00 AS1141.6.1
18 2.59 1.11 MS EN 1097 Part 6
19 2.58 0.00 AS1141.6.1
20 2.58 0.00 AS1141.6.1
22 2.58 0.00 AS1141.6.1-2000
23 2.58 0.00 AS1141.6.1
26 2.57 -1.11 1141.6.1
27 2.57 -1.11 AS1141.6.1
28 2.58 0.00 AS1141.6.1
29 2.57 -1.11 AS1141.6.1
30 2.58 0.00 AS1141.6.1
31 2.57 -1.11 ASTM C 127
33 2.58 0.00 AS1141.6.1
36 2.59 1.11 AS1141.6.1
37 2.58 0.00 AS1141.6.1
39 2.58 0.00 AS1141.6.1
40 2.59 1.11 AS1141.6.1
41 2.57 -1.11 AS1141.6.1
43 2.47 -12.18 § AS1141.6.1
44 2.57 -1.11 AS1141.6.1
45 2.58 0.00 1141.6.1
47 2.58 0.00 AS1141.6.1
51A 2.58 0.00 #
51B 2.58 0.00 #
51C 2.59 1.11 #
53 2.58 0.00 AS1141.6.1
Particle Density on a Dry Basis (nearest 0.01 t/m 3)
Laboratory Code Result Robust
z-score Method
56 2.57 -1.11 AS1141.6.1
58 2.59 1.11 AS1141.6.2
60 2.57 -1.11 AS1141.6.1
61 2.56 -2.21 AS1141.6.1
64 2.60 2.21 AS1141.6.1
68 2.58 0.00 AS1141.6.1
69 2.56 -2.21 AS1141.6.1
76 2.56 -2.21 AS1141.6.1 - 2000
77 2.58 0.00 AS1141.6.1
78A 2.57 -1.11 AS1141.6.1
78B 2.58 0.00 AS1141.6.1
78C 2.57 -1.11 AS1141.6.1
No. of
Results 45
Median 2.580 Normalised
IQR 0.009
Robust CV 0.4% Uncertainty of median
0.002
Minimum 2.47
Maximum 2.60
Range 0.13
Notes: A “§” indicates an outlier i.e. |z-score| ≥ 3.0. A “#” indicates no response was provided.

A3
SD 2.12.05

A4
SD 2.12.05
Particle Density on a Saturated-Surface-Dry Basis
(nearest 0.01 t/m 3) Laboratory
Code Result Robust z-score Method
1 2.60 0.00 1141.6.1
2 2.60 0.00 AS1141.6.1
4 2.60 0.00 AS1141.6.1
5 2.59 -0.96 AS1141.6.1
9 2.59 -0.96 AS1141.6.1
10 2.60 0.00 ISO 6783
12 2.59 -0.96 Q214B
16 2.60 0.00 AS1141.6.1
18 2.61 0.96 MS EN 1097 Part 6
19 2.60 0.00 AS1141.6.1
20 2.61 0.96 AS1141.6.1
22 2.60 0.00 AS1141.6.1-2000
23 2.60 0.00 AS1141.6.1
26 2.60 0.00 1141.6.1
27 2.59 -0.96 AS1141.6.1
28 2.61 0.96 AS1141.6.1
29 2.60 0.00 AS1141.6.1
30 2.60 0.00 AS1141.6.1
31 2.60 0.00 ASTM C 127
33 2.61 0.96 AS1141.6.1
36 2.61 0.96 AS1141.6.1
37 2.60 0.00 AS1141.6.1
39 2.60 0.00 AS1141.6.1
40 2.61 0.96 AS1141.6.1
41 2.60 0.00 AS1141.6.1
43 2.52 -7.69 § AS1141.6.1
44 2.60 0.00 AS1141.6.1
45 2.61 0.96 1141.6.1
47 2.60 0.00 AS1141.6.1
51A 2.60 0.00 #
51B 2.60 0.00 #
51C 2.61 0.96 #
53 2.59 -0.96 AS1141.6.1
Particle Density on a Saturated-Surface-Dry Basis
(nearest 0.01 t/m 3)
Laboratory Code Result Robust
z-score Method
56 2.60 0.00 AS1141.6.1
58 2.60 0.00 AS1141.6.2
60 2.59 -0.96 AS1141.6.1
61 2.59 -0.96 AS1141.6.1
64 2.63 2.88 AS1141.6.1
68 2.60 0.00 AS1141.6.1
69 2.59 -0.96 AS1141.6.1
76 2.59 -0.96 AS1141.6.1 - 2000
77 2.60 0.00 AS1141.6.1
78A 2.60 0.00 AS1141.6.1
78B 2.60 0.00 AS1141.6.1
78C 2.60 0.00 AS1141.6.1
No. of
Results 45
Median 2.600 Normalised
IQR 0.010
Robust CV 0.4% Uncertainty of median
0.002
Minimum 2.52
Maximum 2.63
Range 0.11
Notes: A “§” indicates an outlier i.e. |z-score| ≥ 3.0. A “#” indicates no response was provided.

A5
SD 2.12.05
Water Absorption (nearest 0.1%)
Laboratory Code Result Robust
z-score Method
1 0.7 -2.70 1141.6.1
2 1.0 1.35 AS1141.6.1
4 0.9 0.00 AS1141.6.1
5 0.9 0.00 AS1141.6.1
9 1.0 1.35 AS1141.6.1
10 1.0 1.35 ISO 6783
12 0.9 0.00 Q214B
16 0.9 0.00 AS1141.6.1
18 0.9 0.00 MS EN 1097 Part 6
19 0.8 -1.35 AS1141.6.1
20 0.8 -1.35 AS1141.6.1
22 0.9 0.00 AS1141.6.1-2000
23 0.8 -1.35 AS1141.6.1
26 1.0 1.35 1141.6.1
27 1.0 1.35 AS1141.6.1
28 0.84 -0.81 AS1141.6.1
29 0.9 0.00 AS1141.6.1
30 1.0 1.35 AS1141.6.1
31 1.0 1.35 ASTM C 127
33 1.0 1.35 AS1141.6.1
36 0.8 -1.35 AS1141.6.1
37 0.9 0.00 AS1141.6.1
39 0.8 -1.35 AS1141.6.1
40 0.9 0.00 AS1141.6.1
41 0.9 0.00 AS1141.6.1
43 1.9 13.49 § AS1141.6.1
44 1.0 1.35 AS1141.6.1
45 1.0 1.35 1141.6.1
47 0.9 0.00 AS1141.6.1
51A 0.9 0.00 #
51B 1.0 1.35 #
51C 0.9 0.00 #
53 0.8 -1.35 AS1141.6.1
Water Absorption (nearest 0.1%)
Laboratory Code Result Robust
z-score Method
56 0.9 0.00 AS1141.6.1
58 0.9 0.00 AS1141.6.2
60 0.8 -1.35 AS1141.6.1
61 1.1 2.70 AS1141.6.1
64 0.9 0.00 AS1141.6.1
68 0.9 0.00 AS1141.6.1
69 1.2 4.05 § AS1141.6.1
76 1.0 1.35 AS1141.6.1 - 2000
77 0.9 0.00 AS1141.6.1
78A 1.1 2.70 AS1141.6.1
78B 0.9 0.00 AS1141.6.1
78C 1.0 1.35 AS1141.6.1
No. of
Results 45
Median 0.90 Normalised
IQR 0.07
Robust CV 8.2%
Uncertainty of median
0.01
Minimum 0.7
Maximum 1.9
Range 1.2
Notes: A “§” indicates an outlier i.e. |z-score| ≥ 3.0. A “#” indicates no response was provided.

A6
SD 2.12.05

A7
SD 2.12.05
Particle Size Distribution (nearest 0.1%)
Laboratory Code 26.5 mm 19.0 mm Robust
z-score 13.2 mm Robust z-score Method
1 0 7.2 1.04 56.2 2.11 1141.11
2 0 4.7 -0.89 52.2 0.71 Q103B (AS1141.11)
4 0 8.6 2.12 49.9 -0.09 AS1141.11.1
5 0 5.8 -0.04 48.9 -0.44 AS1141.11
9 0.0 8.2 1.81 45.9 -1.48 AS1141.11.1
10 0 13.5 5.90 § 44.3 -2.04 EN 933-1
11 0 5.7 -0.12 50.3 0.05 AS1141.11
12 0 5.9 0.04 49.7 -0.16 Q103B
16 0 4.6 -0.96 54.5 1.51 AS1141.11.1
17 0.0 8.1 1.73 47.4 -0.96 AS1141.11
18 0 6.4 0.42 49.0 -0.40 MS30:Part 4
19 0 6.5 0.50 46 -1.44 AS1141.11.1
20 0 9.6 2.89 51.7 0.54 AS1141.11.1
23 0 5 -0.66 41 -3.19 § AS1141.11.1
24 0.0 5.0 -0.66 47.0 -1.10 Q103B-1996
25 0.0 7.6* na 60.5* na 1141.11.1
26 0.0 5.7 -0.12 52.9 0.96 1141.11.1
27 0.0 9.0 2.43 50.5 0.12 AS1141.6.1.11
28 0.00 7.20 1.04 51.10 0.33 AS1141.11.1
29 0.0 5.7 -0.12 50.8 0.23 #
30 0 6.1 0.19 51.9 0.61 AS1141.11.1
33 0 12.0 4.74 § 51.7 0.54 AS1141.11
36 0 6.1 0.19 52.4 0.78 AS1141.11.1
37 0.0 5.0 -0.66 46.7 -1.20 AS1141.11
39 0 5.6 -0.19 54.0 1.34 AS1141.11
40 0.0 6.5 0.50 49.7 -0.16 AS1141.11
41 0.0 4.1 -1.35 48.0 -0.75 AS1141.11.1
43 0 6.2 0.27 50.0 -0.05 AS1141.11
44 0.0 4.1 -1.35 53.5 1.17 AS1141.11
45 0.0 3.7 -1.66 46.3 -1.34 1141.11.1
46 0.5 5.7 -0.12 48.4 -0.61 #
47 0 4.6 -0.96 54.1 1.38 AS1141.11.1
48 0.0 7.4 1.19 49.5 -0.23 AS1141.11
49 0.0 5.7 -0.12 45.9 -1.48 AS1141.11.1 (note: pan retained 0.8%)
50 0.0 7.0 0.89 48.1 -0.71 AS1141.11
51A 0 6.0 0.12 47.4 -0.96 AS1141.11
51B 0 6.5 0.50 48.6 -0.54 AS1141.11
51C 0 5.1 -0.58 42.8 -2.56 AS1141.11
53 0.0 6.7 0.66 53.0 0.99 AS1141.11
54 0 5.3 -0.42 51.1 0.33 #

A8
SD 2.12.05
Notes: A “§” indicates an outlier i.e. |z-score| ≥ 3.0. A “#” indicates no response was provided. A “*” indicates result was not included in the consensus. na indicates not applicable.
Particle Size Distribution (nearest 0.1%) continued
Laboratory Code 26.5 mm 19.0 mm Robust
z-score 13.2 mm Robust z-score Method
56 0 6.3 0.35 48.9 -0.44 AS1141.11.1
57 0 10.3 3.43 § 61.8 4.06 § #
58 0.0 3.6 -1.73 51.2 0.37
AS1141.11 Note: AS1141.11 done
without washing over 75mic sieve
60 0.0 7.1 0.96 50.9 0.26 AS1141.11.1
61 0.0 5.5 -0.27 54.8 1.62 AS1141.11
62 0 6.6 0.58 54.4 1.48 1141.11
63 0.0 4.63 -0.94 51.58 0.50 AS1141.11.1
64 0.0 3.0 -2.20 53.2 1.06 #
65 5.0 -0.66 45.8 -1.51 Q103B
66 0 6.0 0.12 54.0 1.34 AS1141.11
67A 0.0 5.0 -0.66 51.7 0.54 WA210-1
67B 0.0 6.2 0.27 49.0 -0.40 WA 210.1
67C 0.0 7.6 1.35 48.1 -0.71 AS 210.1
68 0.0 5.5 -0.27 51.3 0.40 AS1141.11 (unwashed)
69 0.0 4.7 -0.89 48.1 -0.71 AS1141.11.1
71 0.0 1.1 -3.66 § 61.4 3.92 § AS1289.3.6.1
76 0.0 5.3 -0.42 48.9 -0.44 AS1141.11.1
77 0.0 4.5 -1.04 51.9 0.61 AS1141.11.1
78A 0.0 6.7 0.66 48.1 -0.71 AS1141.11.1
78B 0.0 6.9 0.81 50.6 0.16 AS1141.11.1
78C 0.0 4.9 -0.73 49.8 -0.12 AS1141.11.1
79 # 94.7* na 49.8* na 1141.11
No. of Results:
60 60
60
Median: 5.85 50.15 Normalised
IQR: 1.30
2.87
Robust CV: 22.2% 5.7% Uncertainty of median:
0.21
0.46
Minimum: 1.1 41.0
Maximum: 13.5 61.8
Range: 12.4 20.8

A9
SD 2.12.05

A10
SD 2.12.05
Particle Size Distribution (nearest 0.1%)
Laboratory Code 9.5 mm Robust
z-score 4.75 mm Robust z-score Method
1 31.1 -2.09 4.6 -0.30 1141.11
2 6.4 -10.26 § 5.0 0.00 Q103B (AS1141.11)
4 34.6 -0.93 5.5 0.37 AS1141.11.1
5 39.3 0.63 5.0 0.00 AS1141.11
9 40.0 0.86 0.5 -3.33 § AS1141.11.1
10 31.7 -1.89 9.0 2.96 EN 933-1
11 38.4 0.33 4.8 -0.15 AS1141.11
12 37.8 0.13 5.6 0.44 Q103B
16 34.3 -1.03 5.7 0.52 AS1141.11.1
17 37.5 0.03 5.7 0.52 AS1141.11
18 38.3 0.30 5.0 0.00 MS30:Part 4
19 41.3 1.29 4.9 -0.07 AS1141.11.1
20 34.2 -1.06 4.0 -0.74 AS1141.11.1
23 46 2.85 6 0.74 AS1141.11.1
24 40.4 0.99 6.5 1.11 Q103B-1996
25 94.3* na 99.6* na 1141.11.1
26 34.9 -0.83 5.5 0.37 1141.11.1
27 34.9 -0.83 4.7 -0.22 AS1141.6.1.11
28 36.80 -0.20 4.20 -0.59 AS1141.11.1
29 36.1 -0.43 6.4 1.03 #
30 35.3 -0.70 5.6 0.44 AS1141.11.1
33 31.2 -2.05 3.8 -0.89 AS1141.11
36 36.4 -0.33 4.2 -0.59 AS1141.11.1
37 41.7 1.42 0.6 -3.25 § AS1141.11
39 35.8 -0.53 3.9 -0.81 AS1141.11
40 34.9 -0.83 0.5 -3.33 § AS1141.11
41 39.6 0.73 7.3 1.70 AS1141.11.1
43 37.2 -0.07 5.7 0.52 AS1141.11
44 36.5 -0.30 0.5 -3.33 § AS1141.11
45 41.2 1.26 7.3 1.70 1141.11.1
46 40.2 0.93 4.0 -0.74 #
47 33.7 -1.22 6.2 0.89 AS1141.11.1
48 38.5 0.36 4.5 -0.37 AS1141.11
49 40.6 1.06 7.0 1.48 AS1141.11.1 (note: pan retained 0.8%)
50 37.4 0.00 5.9 0.67 AS1141.11
51A 39.3 0.63 0.7 -3.18 § AS1141.11
51B 37.7 0.10 0.7 -3.18 § AS1141.11
51C 44.2 2.25 0.6 -3.25 § AS1141.11
53 36.1 -0.43 4.1 -0.67 AS1141.11
54 37.7 0.10 5.1 0.07 #

A11
SD 2.12.05
Notes: A “§” indicates an outlier i.e. |z-score| ≥ 3.0. A “#” indicates no response was provided. A “*” indicates result was not included in the consensus. na indicates not applicable.
Particle Size Distribution (nearest 0.1%) continued
Laboratory Code 9.5 mm Robust
z-score 4.75 mm Robust z-score Method
56 37.7 0.10 6.0 0.74 AS1141.11.1
57 25.8 -3.84 § 1.9 -2.29 #
58 36.0 -0.46 7.6 1.92
AS1141.11 Note: AS1141.11 done
without washing over 75mic sieve
60 35.9 -0.50 5.2 0.15 AS1141.11.1
61 33.6 -1.26 0.6 -3.25 § AS1141.11
62 32.5 -1.62 5.4 0.30 1141.11
63 37.05 -0.12 5.4 0.30 AS1141.11.1
64 37.6 0.07 0.5 -3.33 § #
65 41.5 1.36 6.7 1.26 Q103B
66 33.0 -1.46 5.0 0.00 AS1141.11
67A 37.9 0.17 4.5 -0.37 WA210-1
67B 39.2 0.60 4.6 -0.30 WA 210.1
67C 37.2 -0.07 6.2 0.89 AS 210.1
68 37.5 0.03 4.6 -0.30 AS1141.11 (unwashed)
69 40.3 0.96 5.9 0.67 AS1141.11.1
71 28.1 -3.08 § 0.5 -3.33 § AS1289.3.6.1
76 38.9 0.50 5.9 0.67 AS1141.11.1
77 36.2 -0.40 5.5 0.37 AS1141.11.1
78A 38.3 0.30 6.2 0.89 AS1141.11.1
78B 37.4 0.00 4.3 -0.52 AS1141.11.1
78C 38.3 0.30 6.1 0.81 AS1141.11.1
79 61.6* na 99.6* na 1141.11
No. of Results:
60 60
Median: 37.40 5.00 Normalised
IQR: 3.02 1.35
Robust CV: 8.1% 27.1% Uncertainty of median:
0.49 0.22
Minimum: 6.4 0.5 Maximum: 46.0 9.0
Range: 39.6 8.5

A12
SD 2.12.05

A13
SD 2.12.05
Flakiness Index (nearest 1%)
Laboratory Code Result Robust
z-score Method
2 9 -1.80 Q201
4 11 -0.90 AS1141.15
5 11 -0.90 AS1141.15
9 10 -1.35 AS1141.15
10 8 -2.25 EN 933-3
12 11 -0.90 Q201
16 14 0.45 AS1141.15
18 14 0.45 MS30:Part 5
19 9 -1.80 AS1141.15
23 14 0.45 AS1141.15
24 11.0 -0.90 Q103B-1996
26 8.0 -2.25 1141.15
27 9 -1.80 AS1141.15
29 15 0.90 AS1141.15
30 11 -0.90 AS1141.15
33 17 1.80 AS1141.15
36 11 -0.90 AS1141.15
37 11 -0.90 AS1141.15
39 13 0.00 AS1141.15
40 12 -0.45 AS1141.15
41 13 0.00 AS1141.15
44 12 -0.45 AS1141.15
45 14 0.45 1141.15
47 14 0.45 AS1141.11.1
51A 16 1.35 AS1141.15
51B 14 0.45 AS1141.15
51C 14 0.45 AS1141.15
56 10 -1.35 AS1141.15
60 13 0.00 AS1141.15
61 13 0.00 AS1141.15
62 13 0.00 1141.15
65 11.0 -0.90 Q201
66 16.0 1.35 AS1141.15
Flakiness Index (nearest 1%)
Laboratory Code Result Robust
z-score Method
67A 12 -0.45 WA 216-1
67B 13 0.00 WA 216.1
67C 11 -0.90 WA 216.1
68 13 0.00 AS1141.15
69 9 -1.80 AS1141.15
76 15 0.90 AS1141.15.1999
77 14 0.45 AS1141.15
78A 14 0.45 AS1141.15
78B 15 0.90 AS1141.15
78C 15 0.90 AS1141.15
No. of
Results 43
Median 13.0
Normalised IQR
2.2
Robust CV 17.1%
Uncertainty of median
0.4
Minimum 8
Maximum 17
Range 9

A14
SD 2.12.05
Dry Strength Loss at Nominated Load (nearest 0.1%)
Laboratory Code Result Robust
z-score Method
4 5.9 -3.04 § AS1141.22
5 8.2 -0.45 AS1141.22
9 9.5 1.01 AS1141.22
12 8.3 -0.34 Q205A
19 7.3 -1.46 AS1141.22
20 7.8 -0.90 AS1141.22
23 7.4 -1.35 AS1141.22
24 10 1.57 Q205A - 2013
26 8.6 0.00 1141.22
27 8.0 -0.67 AS1141.22 (6.2)
28 7.40 -1.35 AS1141.22
29 8.8 0.22 AS1141.22
30 8.6 0.00 AS1141.22
33 7.6 -1.12 AS1141.22
36 8.8 0.22 AS1141.22
39 8 -0.67 AS1141.22, 6.2
40 7.3 -1.46 AS1141.22
41 9.6 1.12 AS1141.22
44 8.8 0.22 AS1141.22
47 9.5 1.01 AS1141.22
50 9.0 0.45 AS1141.22
51A 9.3 0.79 AS1141.22
51B 8.1 -0.56 AS1141.22
51C 8.2 -0.45 AS1141.22
56 8.6 0.00 AS1141.22
60 8.4 -0.22 AS1141.22
62 9.8 1.35 1141.22
65 9.2 0.67 Q205
68 9.9 1.46
AS1141.22 (Part 6.2, dry
condition only)
76 8.4 -0.22 AS1141.22.1996
Dry Strength Loss at Nominated Load
(nearest 0.1%) Laboratory
Code Result Robust z-score Method
78A 8.1 -0.56 AS1141.22
78B 9.3 0.79 AS1141.22
78C 9.0 0.45 AS1141.22
No. of
Results 33
Median 8.60
Normalised IQR
0.89
Robust CV 10.3%
Uncertainty of median
0.2
Minimum 5.9
Maximum 10
Range 4.1
Notes: A “§” indicates an outlier i.e. |z-score| ≥ 3.0.

A15
SD 2.12.05

SD 2.12.05
APPENDIX B
Homogeneity Testing
B1
SD 2.12.05
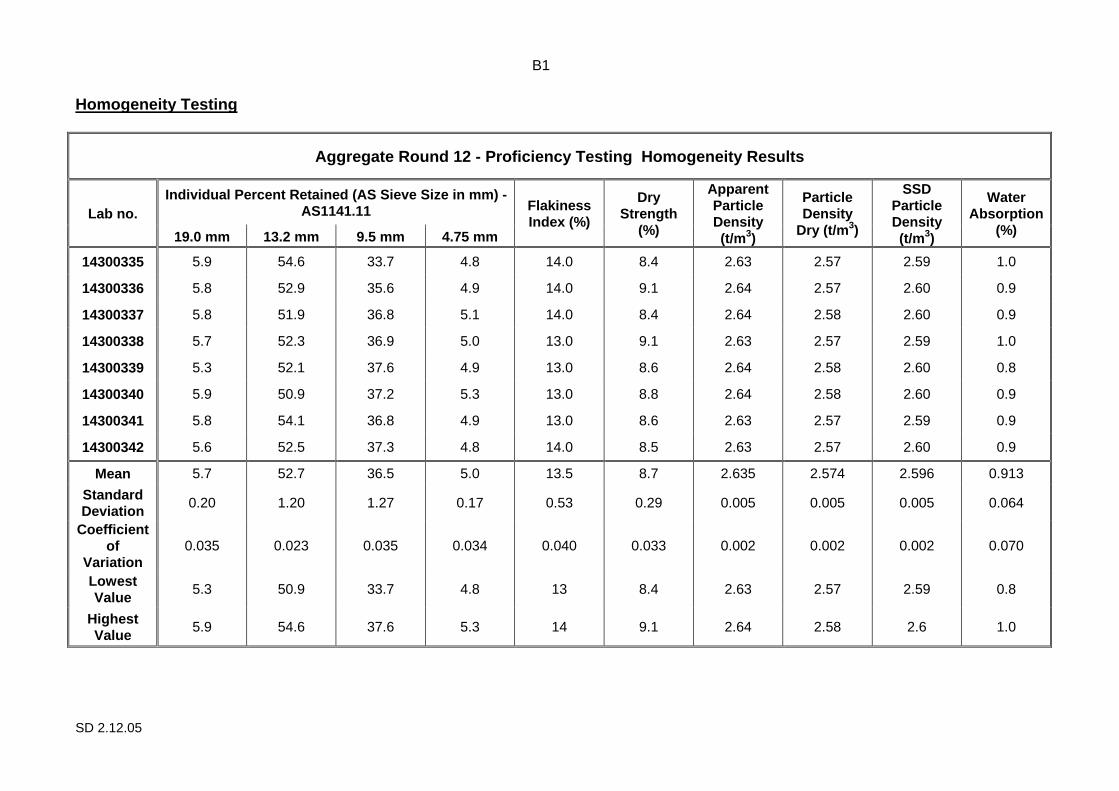
Homogeneity Testing
Aggregate Round 12 - Proficiency Testing Homogenei ty Results
Lab no. Individual Percent Retained (AS Sieve Size in mm) -
AS1141.11 Flakiness Index (%)
Dry Strength
(%)
Apparent Particle Density (t/m 3)
Particle Density
Dry (t/m 3)
SSD Particle Density (t/m 3)
Water Absorption
(%) 19.0 mm 13.2 mm 9.5 mm 4.75 mm
14300335 5.9 54.6 33.7 4.8 14.0 8.4 2.63 2.57 2.59 1.0
14300336 5.8 52.9 35.6 4.9 14.0 9.1 2.64 2.57 2.60 0.9
14300337 5.8 51.9 36.8 5.1 14.0 8.4 2.64 2.58 2.60 0.9
14300338 5.7 52.3 36.9 5.0 13.0 9.1 2.63 2.57 2.59 1.0
14300339 5.3 52.1 37.6 4.9 13.0 8.6 2.64 2.58 2.60 0.8
14300340 5.9 50.9 37.2 5.3 13.0 8.8 2.64 2.58 2.60 0.9
14300341 5.8 54.1 36.8 4.9 13.0 8.6 2.63 2.57 2.59 0.9
14300342 5.6 52.5 37.3 4.8 14.0 8.5 2.63 2.57 2.60 0.9
Mean 5.7 52.7 36.5 5.0 13.5 8.7 2.635 2.574 2.596 0.913
Standard Deviation
0.20 1.20 1.27 0.17 0.53 0.29 0.005 0.005 0.005 0.064
Coefficient of
Variation 0.035 0.023 0.035 0.034 0.040 0.033 0.002 0.002 0.002 0.070
Lowest Value
5.3 50.9 33.7 4.8 13 8.4 2.63 2.57 2.59 0.8
Highest Value
5.9 54.6 37.6 5.3 14 9.1 2.64 2.58 2.6 1.0

SD 2.12.05
APPENDIX C
Documentation
Instructions to Participants ……………………………………………………………… C1
Results Sheet ……………………………………………………………………………. C2

C1
SD 2.12.05
PROFICIENCY TESTING AUSTRALIA AGGREGATES (ROUND 12) PROFICIENCY TESTING PROGRAM INSTRUCTIONS TO PARTICIPANTS To ensure that results from this program can be analysed properly, participants are asked to adhere carefully to the following instructions. 1. One 13 Kg sample of aggregate has been supplied to each laboratory. 2. Before any testing, mix the sample and then cone and quarter or rifle
thoroughly using the whole sample. 3. The following determinations are to be performed on the sample:
• Particle density and water absorption of course aggregate –AS1141.6.1 • Particle Size Distribution – AS1141.11, perform the test on 26.5mm, 19.0mm,
13.2mm, 9.5mm and 4.75mm sieves. • Flakiness index – AS1141.15 • Dry Strength – AS1141.22 (Part 6.2, dry condition only, 13.2 - 9.5mm size
fraction at supplied test load (180kN). 1 point only. 4. Laboratories routinely performing these tests to other methods are required to
follow their normal method and note this on the results sheet. 5. The results for all determinations are to be recorded on the results sheet to the
accuracy and reporting basis indicated on the results sheet. The method used is also to be recorded.
6. Testing may commence as soon as the sample is received. All laboratories
must return the results sheet no later than 14 March 2014 to: Laura Galbraith Proficiency Testing Australia Fax: 02 9743 6664 Email: [email protected]

C2
SD 2.12.05
PROFICIENCY TESTING AUSTRALIA AGGREGATES (ROUND 12) PROFICIENCY TESTING PROGRAM
RESULTS SHEET Lab Code
TEST
(report to) Result Method
Particle density and water absorption of course aggregate
Apparent particle density (nearest 0.01 t/m3)
Particle density on a dry basis
(nearest 0.01 t/m3)
Particle density on a saturated-surface-dry basis
(nearest 0.01 t/m3)
Water absorption (nearest 0.1%)
Particle Size Distribution (INDIVIDUAL PERCENT
RETAINED to nearest 0.1%)
26.5mm
19.0mm
13.2mm
9.5mm
4.75mm
Flakiness Index (nearest 1%)
Dry Strength loss @ nominated load (nearest 0.1%)
Date of tests: Signature: Please return by 14 March 2014 to: Laura Galbraith Fax: 02 9743 6664 Email: [email protected]

SD 2.12.05
- End of Report -