Embed Size (px)
Citation preview
EVALUATION OF CONCRETE CORES, BLACK CANYON DAM, IDAHO
June 7983 Engineering and Research Center
department of the Interior Bureau of Reclamation
Division of Research oncrete and Structural Branch
. .... ,- - 7
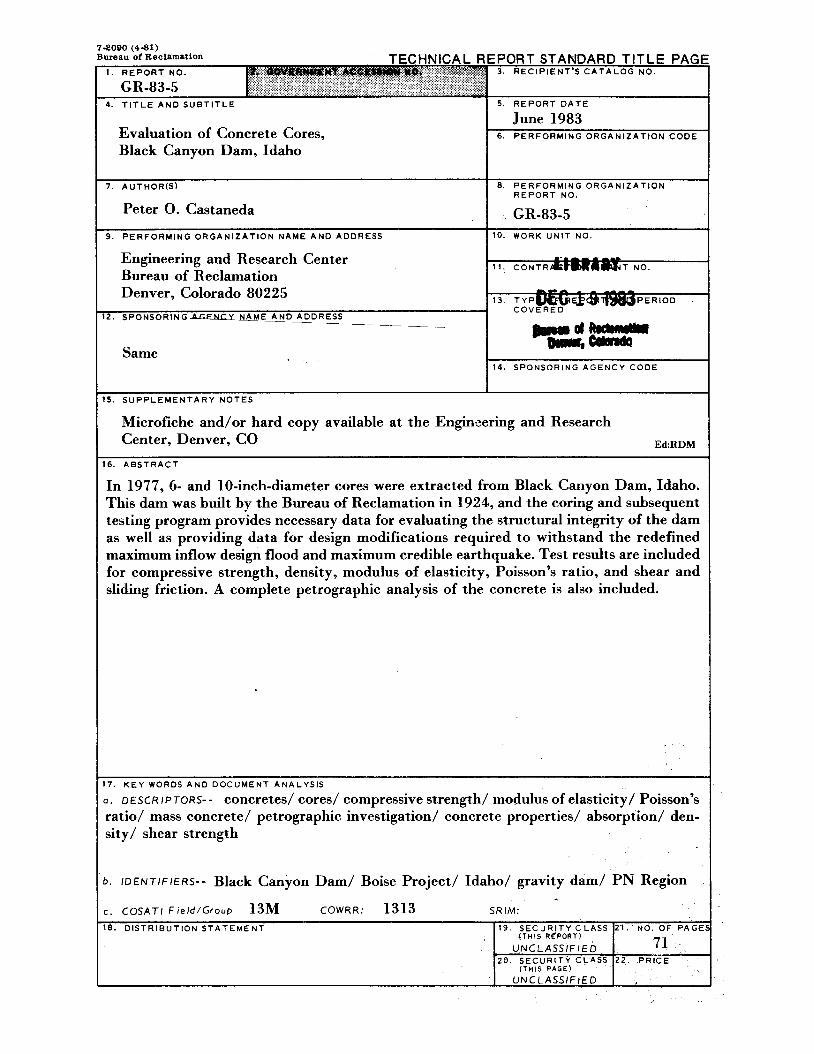
Evaluation of Concrete Cores, Black Canyon Dam, Idaho
I 9. P E R F O R M I N G O R G A N I Z A T I O N NAME AND ADDRESS 10. WORK U N I T NO.
7 . AUTHOR(S)
Peter 0. Castaneda
I Engineering and Research Center Bureau of Reclamation
8. P E R F O R M I N G O R G A N I Z A T I O N R E P O R T NO.
GR-83-5
1 1 . C O N T R T NO.
I
15. S U P P L E M E N T A R Y N O T E S
Denver, Colorado 80225
12. S P O N S O R I N G P G F N C Y NAME A N D ADDRESS -
Same
Microfiche and/or hard copy available at the Engineering and Research Center, Denver, CO E~:RDM
13. T Y P P E R I O D C O V E R E D
WE%: EZF 14. SPONSORING A G E N C Y C O D E
16. A B S T R A C T
In 1977, 6- and 10-inch-diameter cores were extracted from Black Canyon Dam, Idaho. This dam was built by the Bureau of Reclamation in 1924, and the coring and subsequent testing program provides necessary data for evaluating the structural integrity of the dam as well as providing data for design modifications required to withstand the redefined maximum inflow design flood and maximum credible earthquake. Test results are included for compressive strength, density, modulus of elasticity, Poisson's ratio, and shear and sliding friction. A complete petrographic analysis of the concrete is also included.
17. K E Y WORDS A N D D O C U M E N T ANALYSIS
a . D E S C R I PTORS- - concretes/ cores/ compressive strength/ modulus of elasticity/ Poisson's ratio/ mass concrete/ petrographic investigation/ concrete properties/ absorption/ den- sity/ shear strength
I b I D E N T I F I E R S - - Black Canion Dam/ Boise Project/ Idaho/ gravity dam/ PN Region
I C . c o s ~ r l F ~ e l d / G r o u p 13M COWRR: 1313 SR IM:

EVALUATION OF CONCRETE CORES
BLACK CANYON DAM, IDAHO
by Peter 0. Castaneda
Concrete and Structural Branch
Division of Research
Engineering and Research Center
Denver, Colorado
June 1983
UNITED STATES DEPARTMENT OF THE INTERIOR * BUREAU OF RECLAMATION
L
l
L
L
L
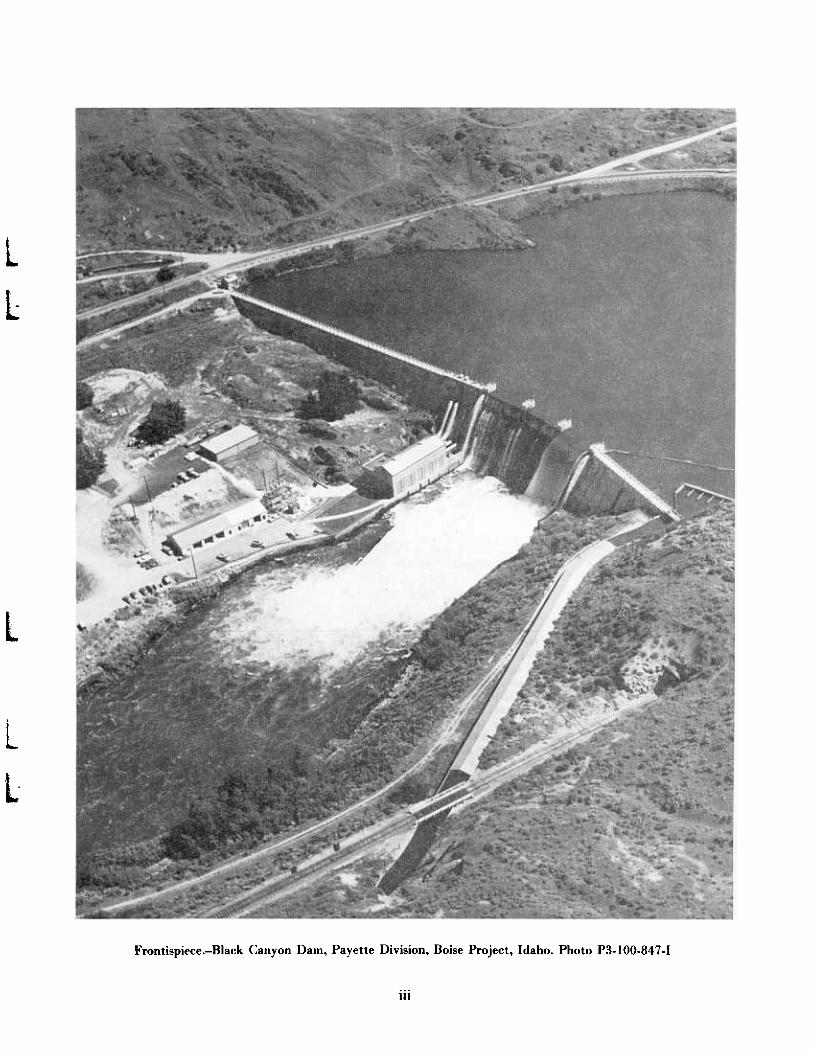
Frontispiece.-Black Canyon Dam, Payette Division, Boise Project, Idaho. Photo P3.100.847.I
III
ACKNOWLEDGMENTS
This study was conducted by members of the Concrete and Structural Branch. Significant contri-
butions to the report were made by J. N. Hartwell, Applied Sciences Branch, who performed the
petrographic examination; and by members of the Geotechnical Branch, who performed the shear
and sliding friction tests.
As the Nation's principal conservation agency, the Department of theInterior has responsibility for most of our nationally owned publiclands and natural resources. This includes fostering the wisest use ofour land and water resources, protecting our fish and wildlife, preserv-ing the environmental and cultural values of our national parks andhistorical places, and providing for the enjoyment of life through out-door recreation. The Department assesses our energy and mineralresources and works to assure that their development is in the bestinterests of all our people. The Department also has a major respon-sibility for American Indian reservation communities and for peoplewho live in Island Territories under U.S. Administration.
IV
CONTENTS
Introduction. . . . . . . . . . . . . . . . . . . . . . . . . . . . . . . . . . . . . . . . . . . .
Conclusions . . . . . . . . . . . . . . . . . . . . . . . . . . . . . . . . . . . . . . . . . . . .
Core extraction and drilling. . . . . . . . . . . . . . . . . . . . . . . . . . . . . . . . .
Shipping and receiving. . . . . . . . . . . . . . . . . . . . . . . . . . . . . . . . . . . . .
Core testing. . . . . . . . . . . . . . . . . . . . . . . . . . . . . . . . . . . . . . . . . . . .
Appendix A - Petrographic examinaion .........................
Appendix B - Break bond and sliding friction test results. . . . . . . . . . . . .
TABLES
Table
1 Summary of Black Canyon Dam core testing. . . . . . . . . . . . . . .
FIG URES
Figure
1 General location map - BlackCanyonDam. . . . . . . . . . . . . . . .
2 Drill hole locations - Black Canyon Dam. . . . . . . . . . . . . . . . .
'"
Page
1
1
2
2
2
9
15
Page
4
5
7

INTRODUCTION
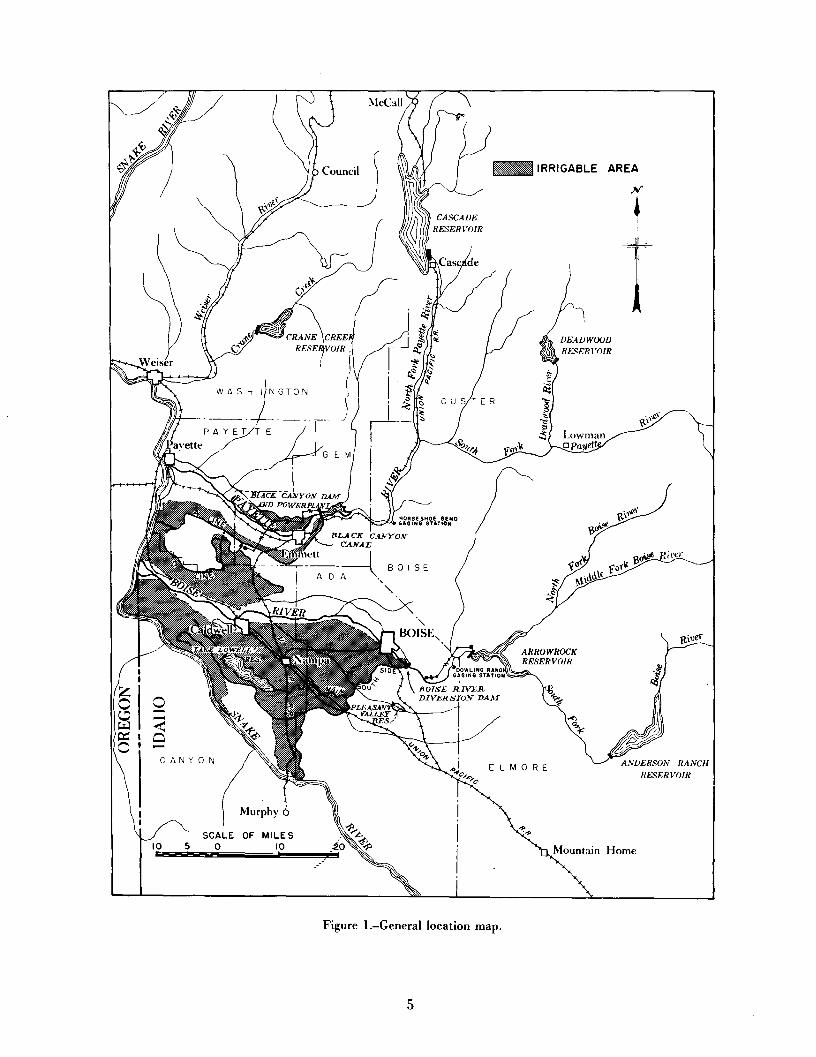
The Black Canyon Dam, on the Payette River near Emmett, Idaho, is a concrete, gravity-type
dam with an ogee overflow spillway. Built by the Bureau of Reclamation in 1924, the dam has
a structural height of 183 feet and serves to divert water to the Payette Division through the
Black Canyon Canal. The dam heads the gravity distribution system in the 114,000-acre Payette
Division. The Bureau continues to operate and maintain the dam. A general location map is shown
on figure 1.
In June and August 1977,6- and 10-inch-dial1leler cores, respectively, were extracted from the
dam. These cores were tested to evaluate the condition of concrete in the dam. These data and
analyses were provided for use in evaluating the "tructural integrity of the existing structure and
for design modifications required to withstand the redefined maximum inflow design flood and
maximum credible earthquake.
CONCLUSIONS
1. Though only a limited number of specimens were tested, compressive strength and density
results indicate that the concrete in Black Canyon Dam is of good quality, when compared
to the concrete design strength of 2,000 pounds per square inch required in the original specifi-
cations. The average compressive strength was 4,500 pounds per square inch, and the average
density was 155.4 pounds per cubic foot. Considering the age of the concrete and construction
methods available at the time of construction, the test results were favorable.
2. The petrographic examination (app. A) indicates that the concrete is of satisfactory physical
and chemical quality. No evidence of alkali-aggregate reaction, sulfate or chloride attack, or
freeze-thaw deterioration was observed in the examined interior concrete.
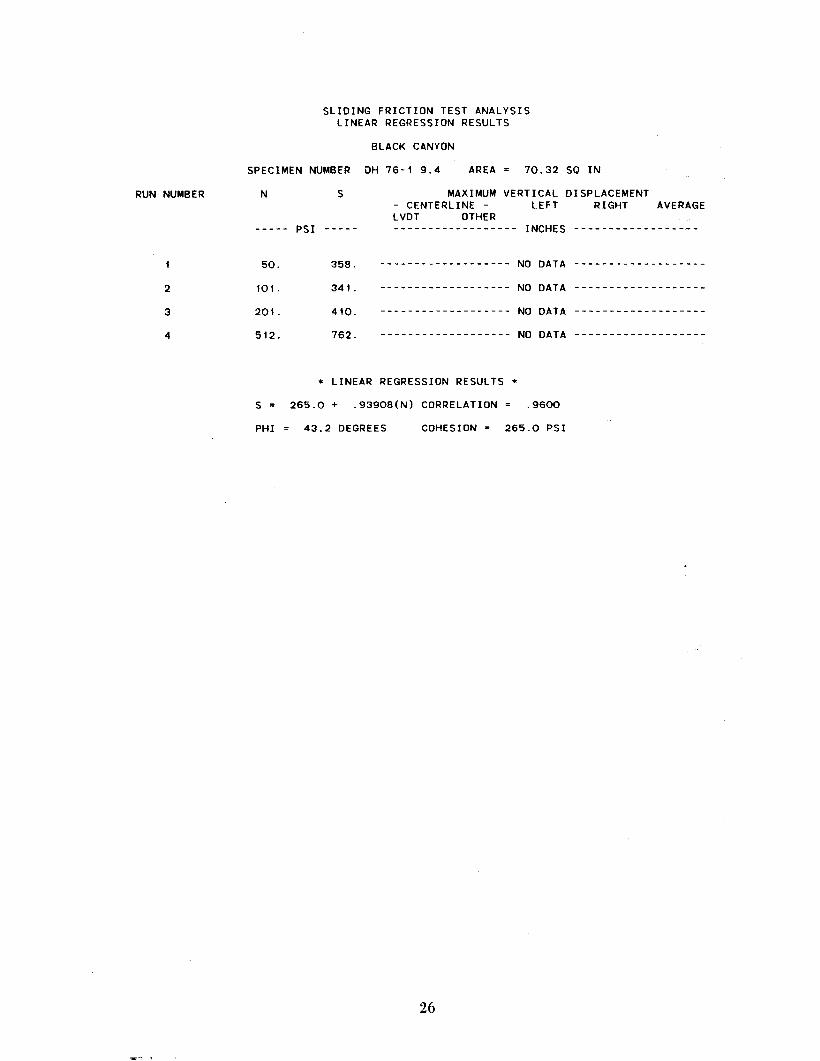
3. Direct shear test results, analyzed by linear regression, are comparable to results obtained
on other Bureau projects, with the cohesion on sliding friction tests averaging 215.5 pounds
per square inch, and the average angle of friction (<1» was 390 . Sliding friction results indicate
1
similar behavior in both unbonded and bonded joints. Statistical variances prevented any con-
clusions on the break bond tests.
4. From visual inspection and the testing, the concrete is of good quality and is serviceable,
with only surface deterioration occurring on the downstream face.
CORE EXTRACTION AND DRILLING
About 78 feet of 6-inch-diameter cores and 86 feet of 10-inch-diameter cores were extracted from
the dam in June and August 1977, respectively. Two galleries run throughout the length of the
overflow section, one 25 feet and another 50 feet below the top of the section. Core drilling
occurred in these galleries, with drill hole 76-1 drilled in the left one-third of the upper gallery,
and drill hole 76-2 drilled in the middle one-third of the upper gallery. In the lower gallery, drill
holes 76-3 and 76-4 were in the left one-third, and drill holes 76-5, 76-6, 76-6A, and 76-6B in
the middle one-third. Locations of the drill holes are shown on figure 2.
SHIPPING AND RECEIVING
Cores were marked appropriately for location and elevation, packed in damp sawdust, and shipped
to the Engineering and Research Center in Denver, Colorado, for testing and examination. When
the cores arrived in Denver, they were unpacked, logged, and inspected. Lift lines were identified
and marked; however, the locations of two of the lift lines were later questioned by the Rock
Mechanics Section after erratic results were found during direct shear testing (app. B). All cores
were damp and undamaged when received; however, they were then subjected to an extended
drying period of about 4 years in the laboratory before testing. Just prior to testing, all cores were
placed in a vacuum for at least 30 minutes, and submerged for vacuum-saturation for 72 hours.
CORE TESTING
Compression tests were performed on the 6-inch cores, and direct shear tests on the 10-inch cores.
Compressive strength tests were run in accordance with ASTM designation: C 42 (Obtaining and
2
II!' I
Testing Drilled Cores and Sawed Beams of Concrete). Prior to testing, the 6-inch-diameter cores
were sawed to 12-inch lengths to conform to the standard length-diameter ratio of 2:1. The density
of each specimen was determined in accordance with ASTM designation: C 642 (Specific Gravity,
Absorption, and Voids in Hardened Concrete), except that specimens were saturated by vacuum
saturation rather than by soaking in boiling water.
The direct shear tests were performed as described in appendix .B, and analyzed in accordance
with Bureau Report No. GR-15-76.' The 10-inch-diameter cores were cut to a height of about
8 to 10 inches, with an identified lift line located at midpoint, and oriented perpendicular to the
axis of the cylinder. The specimens were then embedded in 4-inch steel load rings, and shear loads
were applied to the joints. Sliding friction and break bond tests were run on intact (bonded) joints;
only sliding friction tests were run on unbonded joints. The purpose of these shear tests was to
aid the designer in selecting the angle of friction (<1» and the cohesion to predict structural
performance.
Representative fragments of the cores were selected for petrographic examination to determine
the petrographic quality of the concrete and evaluate leaching at the lift lines. The selected frag-
ments were examined megascopically, microscopically, by x-ray diffraction and differential ther-
mal analysis, and by some qualitative physical and chemical tests.
A summary of results from data for density, compressive strength, and shear strength tests is given
in table 1. Detailed petrographic evaluations are given in appendix A, and details on the shear
testing are given in appendix B.
,Haverland, M. L., The Angle-Envelope Method of Analyzing Shear Tests, Report No. GR-15-76, Bureau of
Reclamation, Denver, Colorado, January 1976.
3

""""'"
Table I.-Summary of Black Canyon Dam core testing'
Specimen Compressive Modulus of Break bond Sliding friction2
Drill hole depth strength elasticity Poisson's Density Break Normal Cohesion Tan I/>
No. (ft) (lb/in2) (lb/in2 x106) ratio (lb/ft3 ) value load (lb/in2)
(lb/in2 ) (lb/in2)
76-1 4.9 3,260 3.34 0.30 147.176-1 8.9 5,470 3.46 0.18 155.976-1 9.4 265 0.94
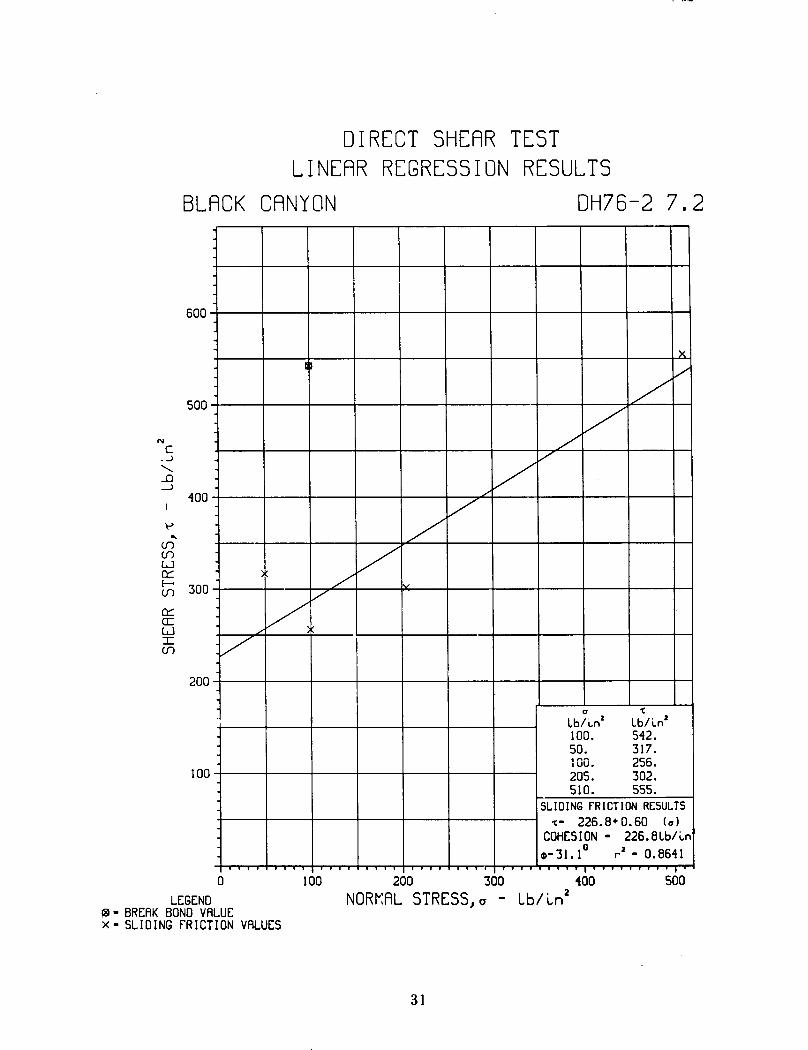
76-2 1.0 4,750 3.68 0.16 153.776-2 6.8 3,460 2.84 0.19 153.276-2 7.2 542 100 227 0.60
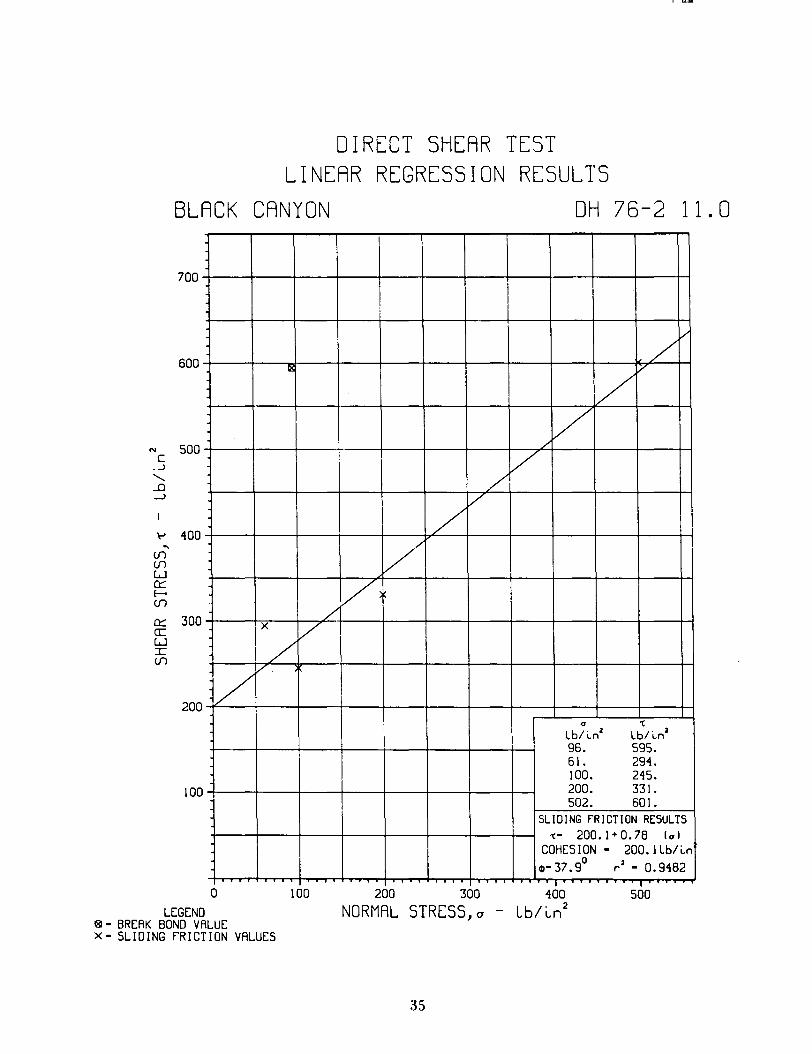
76-2 11.0 595 96 200 0.78
76-3 32.0 827 50 354 0.83
76-3 3.5 721 114 227 0.71
76-3 5.5 5,100 4.17 0.20 157.876-3 38.2 945 198 177 0.83
.f;o. 76-3 10.0 4,350 3.13 0.15 165.476-4 2.4 4,320 4.69 0.22 155.876-4 3.0 187 1.17
76-4 4.8 4,050 2.78 0.19 154.776-5 2.8 3,430 2.87 0.28 156.376-5 4.8 4,260 3.20 0.16 155.176-5 6.5 131 0.84
76-5 8.0 4,350 3.81 0.19 155.476-6 2.7 152 0.74
76-6 10.8 7,180 4.20 0.21 154.476-6A 4.0 414 106 181 0.89
76-6B 2.6 227 1.03
12.4 481 207 139 1.05
Average 4,500 3.51 0.20 155.4 206 0.87
,Compressive strength testing used 6-inch cores, and 10-inch cores were used for direct shear testing.
2 Sliding friction results are by linear regression analysis.3 Lift line may not have been precisely marked.
AREA
]V"
~Q1
J'i;
~ ~ "ft\'
Lowman\t'
0 p(];~et
~,,,e"
j
~ 0(.;i :I:
~ -<O:::IQ0'-
CANYON
/\
ANDERSON RANCH
HESERVO!R
10l.....
5SCALE OF MILES
0 10
Figure I.-General location map.
5

rIII", .,

N. W. S. El. 2497.5
- - - 64.0' x 14.5' Dum gote not shown W. S. El. 2482.5
-- -- - - - Timber 5-0 x bulkhead 5-0 shaf t wrr
t 0 '20.3' ga1lW'y Drum pate chamber
(Drainage gallery for
Axis o f dam--
No. 4 t 25.6
C Pier No. 2 3 Sta. 2 + 79.2 C: Pier No. 3
Sta. 3352.4
PLAN-EL. 9456
3
ier
SECTION THRU SPILLWAY
NO. 4 Axis Pier No. 2 DH 76-5 / ' D H 76-6 \ AXIS Pier No. 3 a . 2 + 7 9 . 2 1 $to. 3+152 stu. 3.35 J sta, 3 + 52.4
PLAN- EL. P4PO.J
Sto. 4 * 25.6
NOTE All stotions measured along axis o f dom.
M I L L HOLE LOCATIONS
Axis Pier No. 2 Sta. 2 + 79.2 Sto. 3 + 52.4 2 l i f t s + ?' Relocated dr i l l hob over drummy
l D H 7 6 - 1 1 6.610' I 2 4 5 6 . 0 I 2 r Z O I (hiin. I / 1 I cmcrete in gallery floor. I . . . I . . ' I . . . , ' I
. I , e . .
8 . .
, /DH 76-1 DH 76-% ,/' as" k l l e r y ,
' :,QJ C r J y
A
' 1 c 5L0.x 5:0' ~ ~ u ~ c e w a y s . . *
. . , '. . . . , . . .
(DH 76-4 /DH 76-3
' ... . 0 0 x I4 Construction by - pass
I I
?
SECTION A-A
W 76-4 6 ' 6 lo' 2 l i f t s 2' Relocated dr i l l hok in area o f I 2420'3 I ' * " 1 (Min. 1 1 ) I wet gallery.
DH 76-2 6' 6 lo'
W 76-66
# 6-inch cores nw'o drilled m t e l y from the 10-inch cores, but in the same vicinity as the 10-inch cores.
W76-6
W 76-64
F i %.-Drill hole locations - Black Canyon Dam.
24"' O
10.
6'610'
10'
' 35
2420.3
2420.3
2420.3
3 l i f t s + 2' (Min. 16)
3 t 35
Use l i f t lines vis& in inclined stairway as a guide in Mmking core.
Relocated t o intercept l i f t lines which appwred opm in inclined stoirwav.
3 * 35
3 t 35
+ 2, (M;,,, 161)
I l i f t + 2'
I l i f t + 2'
Relocated d r i l l hole inside 7' gallery ceiling t o faci l i tate dr i l l r ia set up.
APPENDIX A
PETROGRAPHIC EXAMINATION


I UID
~ppendix A
.""j-'
O'1tONAL .0.. NO. 10JULY '.7~ 1(0"1°"G'50'"~ 4'" C.". 101.11..
"-UNITED STATES GOVERNMENT
MemorandumTO
Memor and urn
Chief, Concrete and Structural Branch
,,~
D~nver, Co10radQDATE: April 14,:1982
FROM ~Chief, Applied Sciences Branch
SUBJEl;T: Petrographic Examination of Concrete Core - Black Canyon Dam - ,80iseproJect,Idaho
Examined by: J. N. Hartwell
Petrographic referral code: 82-21
INTRODUCTION; T
A cursory examination of Black Canyon Dam 6-. and lO-inch-diameter:RPnq-etecore from drill holes 76-1 through -6, -6A, and 6-B was performed in theConcrete LabQratory to se lect representative fragmen~s for furtper.test ingand examination in the Petrographic Laboratory. "Atl holes were drilfedfromgalleries w,ithin the dam. -'
...
The purposes of theexarnination w,ere to determ.ine, the petrographic qual'tty ofthe concrete, including deterioration due fo alkali-aggregate reaction, andinvestigate leaching at the lift lines. In addition, comparative observationswere made between lower and higher .strength .concrete.
'J
PETROGRAPHIC EXAMINATION
The selected concrete fragmentsv.'ere examin,ed megascopically, microsc9P.ically,by XRD (X-ray diffraction) and DJA(differential thermalanalyS;is), and b"ysome qualitative .physical and chemical tests.
A detailed "Petrographic Exarnination of Concrete" sheet is attached whichincludes the cursory observations and petrographic descriptions of aggregate,paste, air voids, secondary and hydration products, microfractures, and otherobservations. Fragments from the various drill holes are petrographicallysimilar and, therefore, are described together.
CONCLUSION-DISCUSSION
Concrete
The examined concrete from Black Canyon Damis petrographically of satisfac-tory physical and chemical quality and, therefore, is considered serviceable
i BIt;1 U.S. SlIfI;"[.S BtmJs Rt[,lIlarlJ tm Iht P/lYroll 5a,,;,,1,s PI/RI..,.., ..
11
concrete. No evidence of alkali-aggregate reaction, sulfate or chlorideattack, or freeze-thaw deterioration was observed in the examined concrete.
The aggregate is physically satisfactory and chemically innocuous. Theconcrete is generally gray to tan and slightly to moderately absorptive. Thedistribution of the paste and aggregate is variable but generally satisfactoryand the paste-aggregate bond is moderately strong. The examined concretecontains few entrapped air voids which are generally unfilled to very fewlined with calcium carbonate, calcium hydroxide, and occasionally ettringite.The presence of calcium hydroxide and calcium silicates as cement productsand the absence of unhydrated cement particles indicate the examined concreteis well hydrated. The presence of calcium carbonate and ettringite indicatessomewhat old, carbonated concrete.
Compressive strength values of concrete core tested by the Concrete Sectionranged from approximately 3,200 to 7,200 lb/in2 with an average of approxi-mately 4,500 lb/in2. Comparative observations of higher and lower strengthconcrete indicate the lower strength specimens contained more larger gravelparticles (+3 in) and/or appeared to be less well consolidated than higherstrength specimens.
Lift Lines
The examined lift lines or suspected lift lines from Black Canyon Damarepetrographically of variable physical quality and do not appear to havedeteriorated significantly since emplacement.
The examined lift lines are quite variable in appearance. Well-consolidatedareas are generally slightly absorptive, carbonated, comprised chiefly ofpaste and sand, and contain few entrapped air voids. Poorly consolidatedareas are generally moderately absorptive, carbonated, comprised of paste andsand and gravel, and contain numerous entrapped air voids.
Areas which exhibit poor consolidation and contain numerous entrapped airvoids may be sufficiently porous, if interconnected, to allow water topercolate very slowly through the structure, therefore, some leaching at liftlines may be expected. However. only a few examined areas exhibited minoramounts of secondarily deposited calcium carbonate and/or iron oxides.
Ice crystal impressions in rock sockets at or near several examined liftlines indicate freezing prior to initial set of the concrete. Although noweakening of the concrete was apparent in the affected areas, the ice crystalimpressions may contribute to leaching at lift lines.
;;Z~~/t
Attachment
Copy to: 0-2200-915
0-1511 (Guy)0-1523
12
PETROGRAPHIC EXAMINATION OF CONCRETE
Subject: Black Canyon DamBoise Project, Idaho
Field No.: DH 76-1 through-6A, and -6B
Cursory Observations: Concrete - 6-in (O.15-m) and 10-in (O.25-m) diametercore; moderately to well consolidated; few to moderate amounts of entrappedair voids; tan to gray paste; very slightly fractured to nonfractured; noreaction rims around aggregate particles; slight to moderate effervescencewith cold dilute HC1 (hydrochloric acid); chiefly slightly to moderatelyabsorptive Lift lines - well to poorly consolidated; few to numerousamounts of entrapped air voids; tan to gray paste; moderate to high effer-vescence with cold dilute HC1; moderately absorptive; ice crystal impressionsin rock sockets at or near lift lines
Petrographic Examination
Aggregate (concrete and lift lines)
Gravel: Generally rounded to subrounded in shape; consists of granite-diorite series rocks, altered volcanics, basalt, quartzite, few woodyfragments (sticks, roots, etc.) especially at or near lift lines, obsidian,and a few glassy volcanic rock types
Sand: Generally subrounded to subangular in shape; consists of same rocktypes found in the gravel as well as monomineralic grains of quartz,feldspar, mica, amphibole, olivine, and a few miscellaneous detritalminerals
Gravel and sand: Petrographically of satisfactory physical quality andnot considered potentially deleteriously reactive with high-alkali cement
Paste
Concrete - Generally gray to tan; generally slightly to moderately absorp-tive; breaks with moderate to hard hammer blows generally around andthrough very few aggregate particles; variably distributed with sand andgravel; moderately strong paste-aggregate bond; generally moderately wellto poorly consolidated; exterior paste moderately effervescent and interiorpaste only slightly effervescent with cold dilute HC1
Lift lines - Generally tan to gray; variable, but generally moderately toslightly absorptive; variable, chiefly paste and sand with very fewvisible coarse gravel particles to well distributed paste and aggregate;moderately strong paste-aggregate bond; variable, poorly to well consoli-dated; generally moderately effervescent with cold dilute HCl
Voids (concrete and lift lines)
Chiefly few to numerous entrapped air voids generally at or near liftlines or occasionally concentrated beneath larger gravel particles;irregularly shaped; and generally unfilled to very few lined with calciumcarbonate, calcium hydroxide, and occasionally ettringite
13
Fie 1d No.: DH 76-1 through-6A, and -68
Secondary Products (concrete and-lift lines)
Moderate amounts of calcium carbonate in paste and lining few voids androck sockets; lift lines contain more calcium carbonate in paste andoccasionally thinly coated with calcium carbonate and/or iron oxides;minor amounts of ettringite lining few voids; no silica gel developed infragments soaked 3 to 4 weeks in Denver tapwater; only minor amounts ofsoluble chloride ions and no sulfate ions chemically detected
Hydration Products (concrete and lift lines)
Moderate amounts of portlandite (calcium hydroxide) and calcium silicates;no unhydrated cement particles; water of hydration appears adequate
Microfractures (concrete and lift lines)
Generally non fractured; few unfilled discontinuous microfractures generallyin paste and around aggregate particles
Other Observations
Ice crystal impressions in rock sockets generally at or near several liftlines; cloth fibers on few lift line surfaces apparently from materialused during curing
14
:IIJ:"!'I
APPENDIX B
BREAK BOND AND SLIDING FRICTION TEST RESULTS


TO
THROUGH:
FROM
SUBJECT:
i
Appendix B
o,.t'O""'''''l-
"...;.AM NO "," ,.~ £()ITIOH
S"GEk- 'U:.(O. NO 11
~U P 4-0<:")\lU,I-101
UNITED STATES GOVERNMENT
MemorandumMemorandumHead, Concrete Section
Denver, ColoradoDATE: May 12, 1982
r..~.'-t'J.~.-:.;.)..Chief, Concrete and Structural Dr andl ~;;i-Z17
Chief, Geotechn ical Branch 1"c:.7""""to-. Sol ..4dilJf:}
Head, Rock Mechanics Section
Break Bond and Sliding Friction lest Results on Black Canyon Dam - 10-inch-diameter Concrete Core
Direct shear tests were performed on 12 concrete specimens from Black CanyonDam as requested in memorandum nom Chief Design Engineer dated November 3,1981, to Chief, Division of Re"e,Jd;rl. The specimens were obtained from drillholes 76-1 through 76-6, 76-6A, 0nd 76-6B, all of which yielded core approxi-mately 10 inches in diameter. Sh'~n specimens had both break bond andsliding friction tests performe,1, while the remaining five specimens had openjoints and only the sliding frictIon tests were run.
The hreak bOrF.: tests Viet'e "dli US1 approlimdtfiy :10, ll){)~, clnd 200-1b/ininurmdl stress. All the sliding tt ticn tests were perforlJled w',Jer approxi-mately the following repedted norli'd! stress:
'. ?50 Ib/in-100 lb/in2200 lb/in2500 lb/in2
A direct shear test is where an intact specimen is subjected to a biaxialstress field until shear failure occurs in a predetermined location. Thispredetermined locat ion is termed the "d" distance which is defined as thedistance between the two holding devices to which shear and normal loads areapplied. In this case, the normal load is applied perpendicular to the "liftlines" in the concrete specimens. The shear zone for these specimens wasrestricted to the material located within the "d" distance of 1 inch which isthe standard distance for 10-inch-diameter specimens on the large shearmachine.
Failure analysis for all sliding friction data has been defined by the linearregression method. The results of all of the tests are shown in the appendix.A linear regression analysis for all of the specimens is shown in figure 1.This includes both break bond and sliding friction results. The regressionresults for the break bond points are suspect. It is felt this condition wasa result of the "lift line" of some specimens were not precisely located.The two most questionable specimens are DH-76-32.0 and 8.2. Not only does
Bu.y U.S. Sat'ings &ndr Regularly on the Pa,yroll Sat.ings Plan
17
the high break value appear suspicious, table 1, but examination of thesespecimens after the test shows that large aggregate was also broken in thesheared lone. See afterbreak photographs in the appendix.
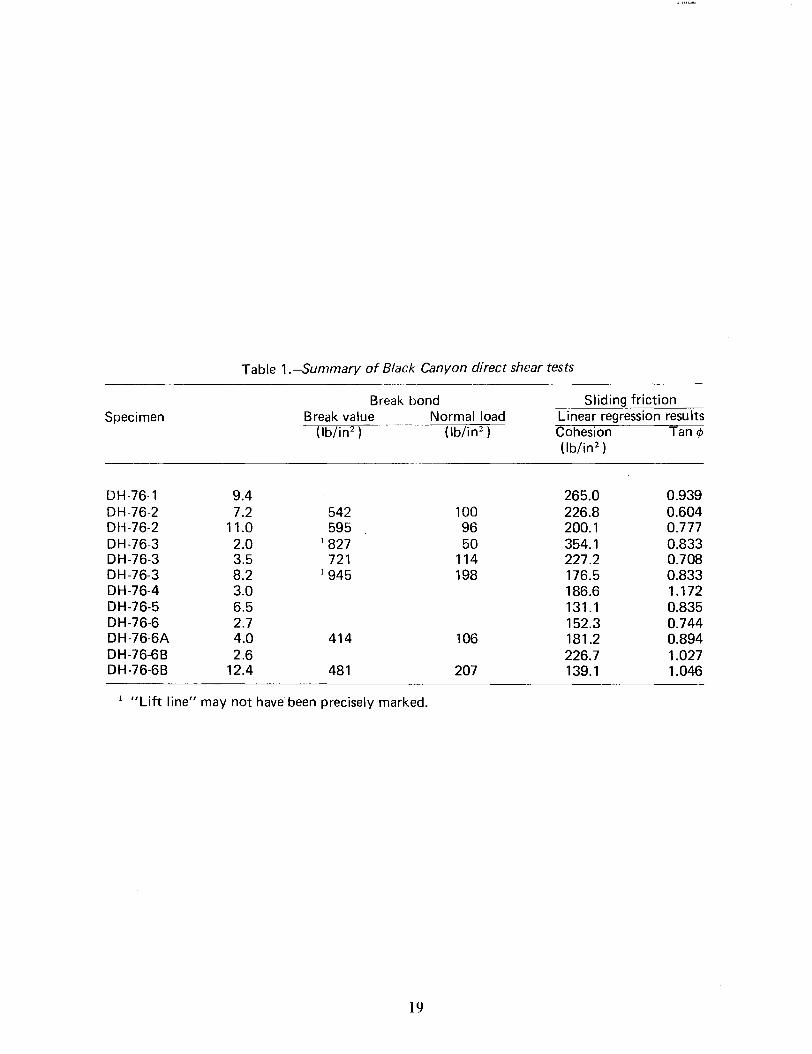
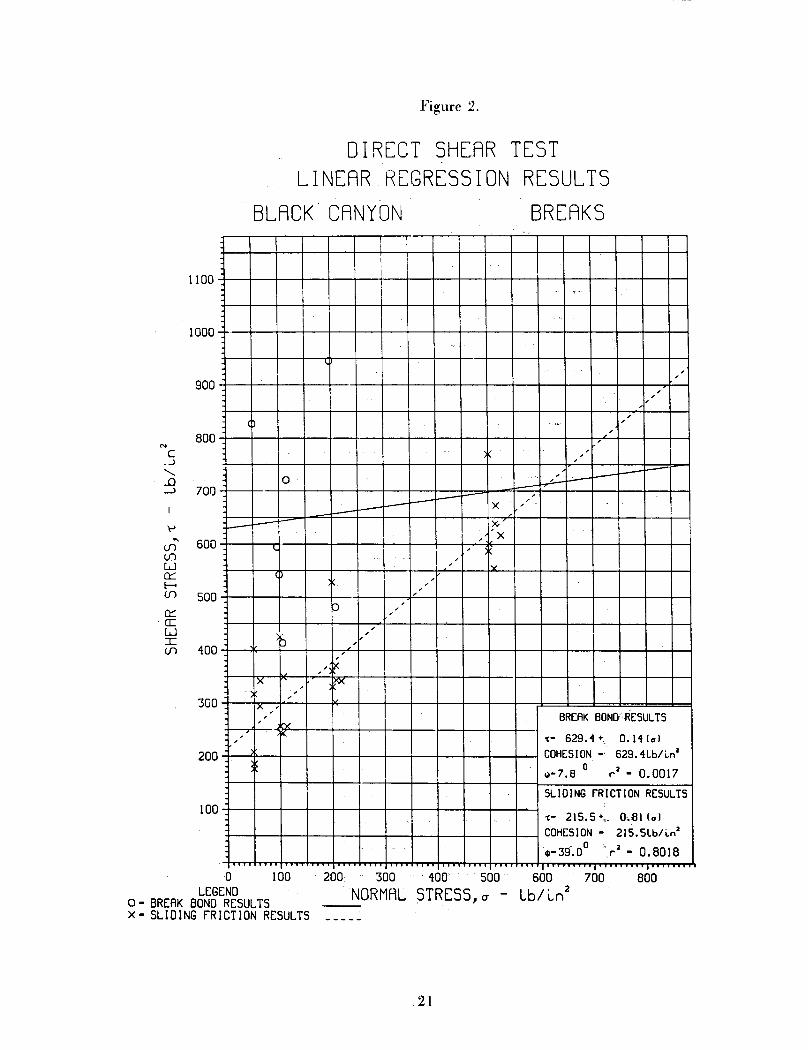
As seen in table 1, the overall, the results for sliding friction testsranged from 131.1 to 354.1 lb/in2 for cohesion and from 0.604 to 1.172 fortan 0. The regression analysis yielded a cohesion of 205.4 lb/in2 and atan 0 of 0.87 for the combined results of both break-induced slides andopen joint sl ides as shown in figure 1. It can be noted that the results forthe open joint slides have a lower cohesion value than the break-inducedslides. This comparison is shown graphically on figures 2 and 3. The openjoint slides, figure 3, result in a cohesion of 191.7 lb/in2 and a tan 0of 0.95. This is compared to the break-induced slides, figure 2, of215.5 lb/in2 and a tan 0 of 0.81. This can be explained by the fact thatthe open joints are cleaner and less rough then the freshly broken break-induced jo int s.
C#VrLrj 8 ~ftf~'
Attachment
Copyto: 0-1543(with attachments)0-15400-1510(without attachments)
18
DH-76-1 9.4 265.0 0.939DH-76-2 7.2 542 100 226.8 0.604DH-76-2 11.0 595 96 200.1 0.777DH-76-3 2.0
]
827 50 354.1 0.833DH-76-3 3.5 721 114 227.2 0.708DH-76-3 8.2 1945 198 176.5 0.833DH-76-4 3.0 186.6 1.172DH-76-5 6.5 131.1 0.835DH-76-6 2.7 152.3 0.744DH-76-6A 4.0 414 106 181.2 0.894DH-76-6B 2.6 226.7 1.027DH-76-6B 12.4 481 207 139.1 1.046
1 "Lift line" may not have been precisely marked.
Table 1.-Summary of Black Canyon direct shear tests
SpecimenBreak bond
Break value Normal load(lb/in2)
.
(lb/in2)
Sliding frictionLinear regression resultsCohesion Tan c/>
(lb/in2 )
19

--,,,,,
"
",,
x ,,'x ,
, -0 ', - -- ,
>--- x,,--- ,I'><I
- ,, X\.
",
'"~' IX,,
::> ',
,,
-p- <
,,
,'~)<;
'~,,
I",
',~BREAKBOND RESULTS,,
"I' -c' 629." + 0.14 I..J,
COHESION - 629."Lb/Ln'0 ,
- 0.0017\I)-7.B r
SLIDING fRICTION RESULTS0
-c- 205." + 0.B71..JCOHESION - 205."Lb/Ln'
I ~-11.00,
- 0.8097r. ,
Figure 1.
DIRECT SHEAR TESTLINEAR REGRESSION RESULTS
BLACK CANYON COMBINED
10
1100
1000
900
800'"C...)..........0-> 700
\->
(f)"' 600(f)LJ~f-(f) 5000:::cr:LJ
~ 400
300
200
0 100 200 300 400 500 600 700LEGEND NORMAL STRESS, c - Lb/ ~n20 - BREAK BONO RESULTS
x - SLiDING fRICTION RESULTS -- - --
800
20
II
,-
"."
""
,,
""
,
".- ,,
,
"" ~- -0 -~- ,....--I-- ,- 'I---- - X ',
I---- - x., "x
L ,
"
,,'wi
",,
) ,
"
"b",
"~IX ,~"
1)<." BREAK BON~RESULTS
" "L .,
"C.. 629.1 + 0.11 (a),
COHESION - 629.1Lbhn a
(j)-7.80 a 0.0017r -
SL JO I NG FRI CT I ON RESULTS
"C- 215.5 +;. Od31 (aJCOHESION- 215.5Lb/i.n a
. .0 a 0.8018$- 39. 0 r -.,
N
C)
'-...0->
....
<.n' 600U1LJ0:::E--<U1 5000:::a:LJ:r:U1
Figure 2.
DIRECT SHEAR TESTLINEAR REGRESSION RESULTS
BLACK CANYON BREAKS
1100
1000
900
800
700
400
300
200
100
0 100 200 300 400 500 600 700
0 - BREAK B~~gE~~SULTSNORMAL STRESS, (7 - Lb/ Ln2
X - SLIDING fRICTION RESULTS- -- --
800
21

,,,,,,
,,,,,,
,,,,
IX ',,
)(,,,
,,,,,
,,,
,, rx-,
,,
,,
~',,
)',,,,,
, r<BREAK BOND RESULTS,
,NOBREAKS'
SLIDING fRICTION RESULTS
"'. 191.7+ 0.9Slerl
COHESION. 191.7Lb/i.nl0 rl - 0.8283.-13.1
,
NC
.J
........
...a-> 700
'"if)' 600if)wCk:f-if) 500Ck:a:w~ 400
III"! 'I
Figure 3.
DIRECT SHEAR TESTLINEAR REGRESSION RESULTS
BLACK CANYON SLIDES
1100
1000
900
800
300
200
100
a 100 200 300 400 500 600 700
NORMAL STRESS,o - Lb/~n2800
22

I 1111
APPENDIXTO
APPENDIX B

')I[:~ :1
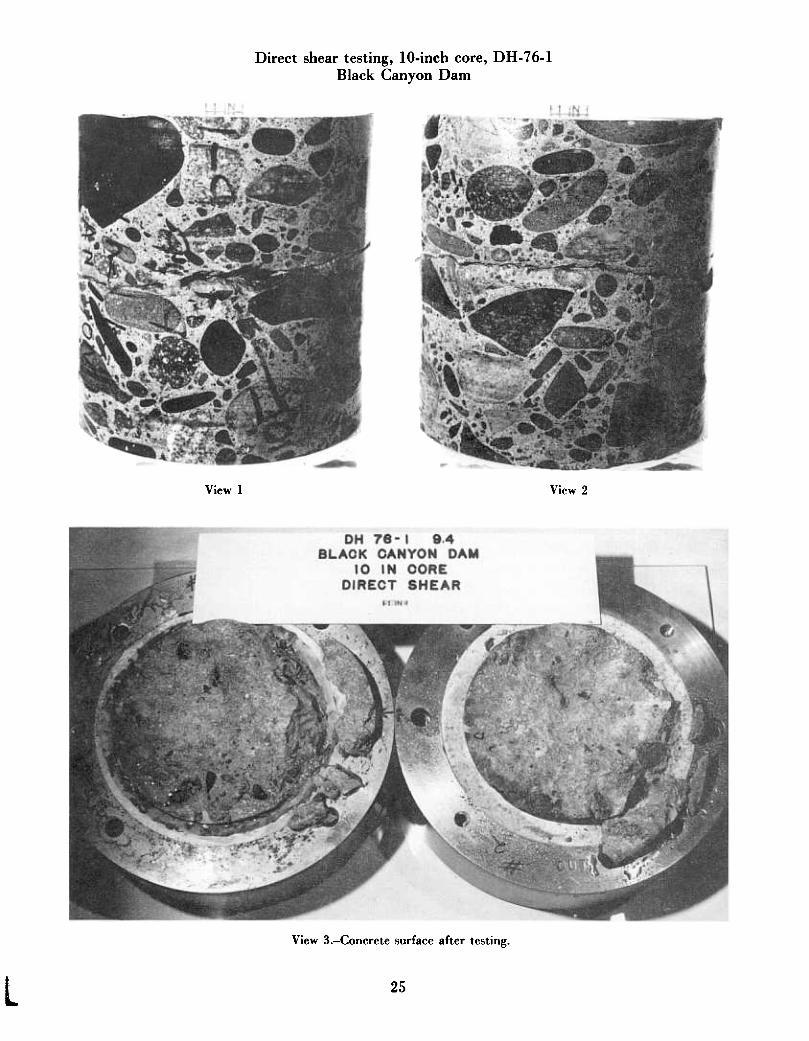
Direct shear testing, 10-inch core, DH- 76-1Black Canyon Dam
View 1 View 2
View 3.-Concrete surface after testing.
L 25
RUN NUMBER
2
3
4
SLIDING FRICTION TEST ANALYSISLINEAR REGRESSION RESULTS
SPECIMEN NUMBER
101.
201.
512.
S =
PHI =
N
PSI -----
50. 358.
341.
BLACK CANYON
DH 76-1 9.4 AREA = 70.32 SO IN
S MAXIMUM VERTICAL DISPLACEMENT
- CENTERLINE - LEFT RIGHT AVERAGELVDT OTHER
INCHES ------------------
NO DATA -------------------
NO DATA -------------------
410. NO DATA -------------------
762. NO DATA -------------------
265.0 +
*LINEAR REGRESSION RESULTS *
.9600
43.2 DEGREES
.93908(N) CORRELATION =
COHESION = 265.0 PSI
26
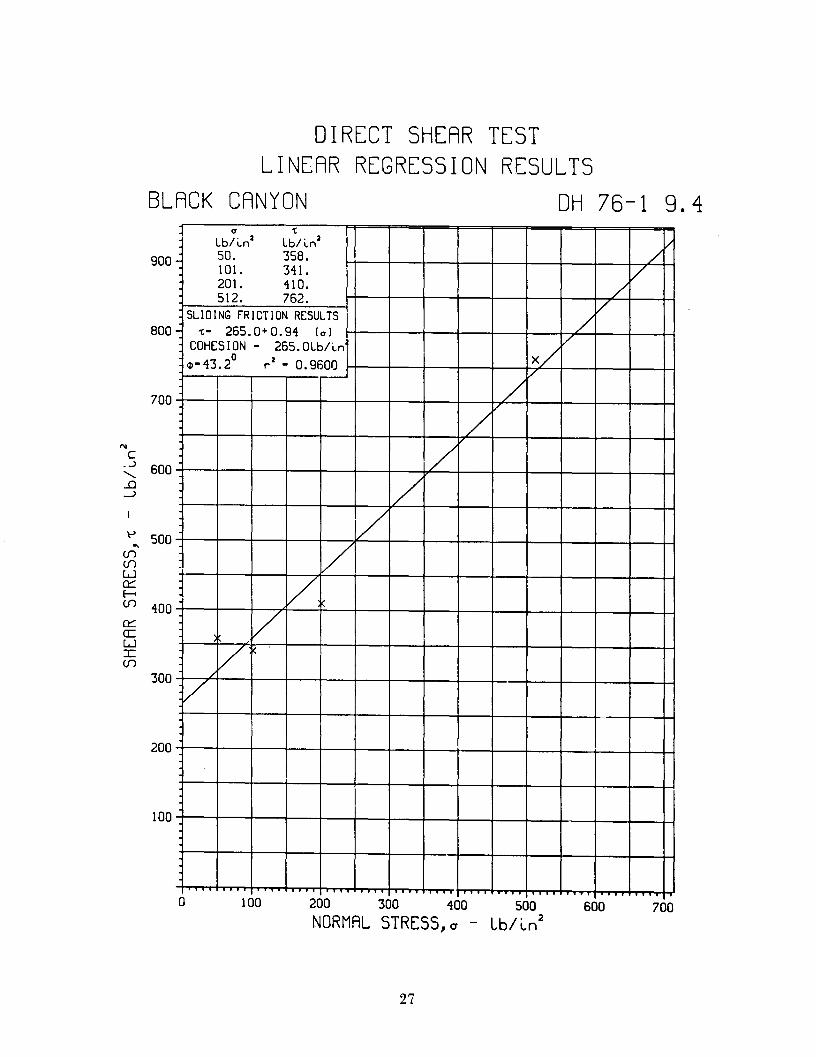
a 1:lbli.n2 Lb/ i.n2 /
- 50. 358. /101. 341. V201. 410. /512. 762.
/SLIDINGfRICTION RESULTS/- 1:- 265.0+ 0.94 (a)
VCOHESION - 265.0Lb/i.nx/0 r2 - 0.9600cP-43. 2
//
//
//
~V/V
/ I\.
/
'".. .
DIRECT SHEAR TEST
LINEAR REGRESSION RESULTS
BLACK CANYON DH 76-1 9.4
100
a 100 200 300 400 500
NORMAL STRESS,c - Lb/~n2600 700
900
800
700
'"C..J
600.........l)-.J
'"' 500"'en
enL.J0::::E--<en 4000::::cr:L.J:r:en
300
200
27

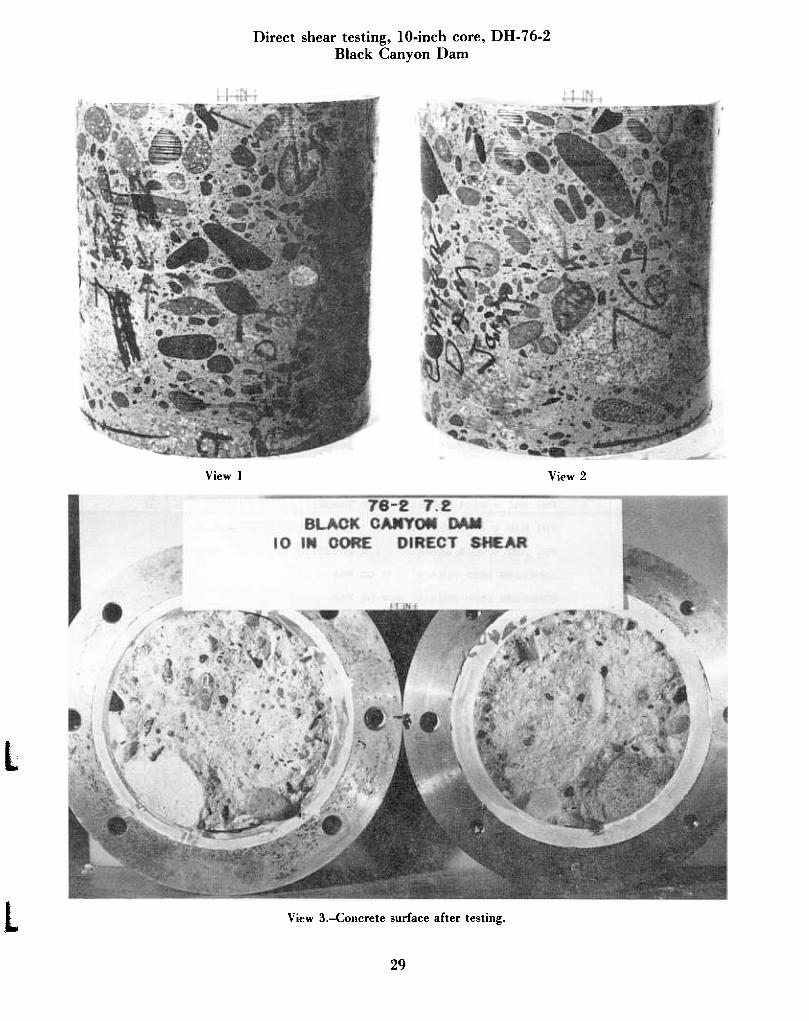
Direct shear testing, IO-inch core, DH- 76-2Black Canyon Dam
View 1 View 2
L
l View 3.-Concrete surface after testing.
29
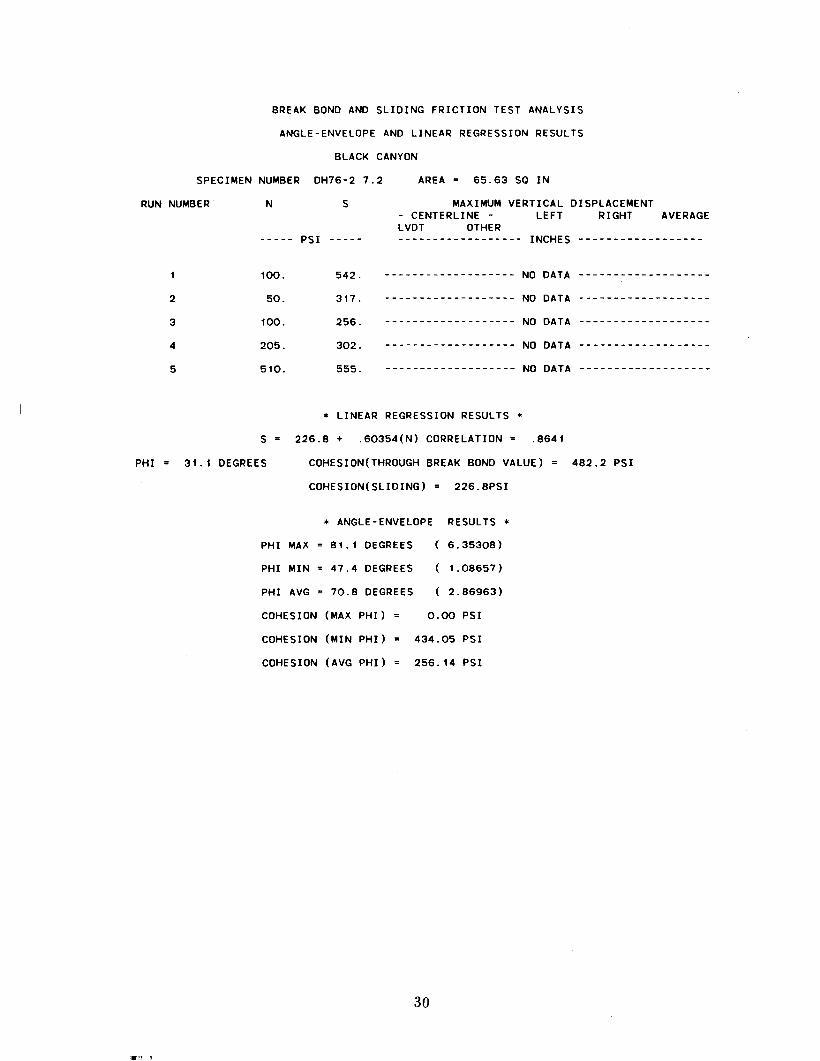
100. 542 ------------------- NO DATA - - - - - - -------------
2 50. 317 ------------------- NO DATA -------------- -- - --
3 100. 256. ------------ ------- NO DATA -------------------
4 205. 302. ------------------- NO DATA -------------------
5 510. 555. ------------------- NO DATA -------------------
PHI AVG " 70.8 DEGREES
COHESION (MAX PHI)"
0.00 PSI
COHESION (MIN PHI)"
434.05 PSI
COHESION (AVG PHI)"
256.14 PSI
BREAK BOND AND SLIDING FRICTION TEST ANALYSIS
ANGLE-ENVELOPE AND LINEAR REGRESSION RESULTS
BLACK CANYON
SPECIMEN NUMBER DH76-2 7.2 AREA" 65.63 SO IN
RUN NUMBER N S MAXIMUM VERTICAL DISPLACEMENT
- CENTERLINE - LEFT RIGHT AVERAGELVDT OTHER
INCHES ------------------PSI -----
. LINEAR REGRESSION RESULTS.
S " 226.8 + .60354(N) CORRELATION" .8641
PHI" 31.1 DEGREES COHESION(THROUGH BREAK BOND VALUE) " 482.2 PSI
COHESION(SLIDING) " 226.8PSI
. ANGLE-ENVELOPE RESULTS.
PHI MIN " 47.4 DEGREES
( 6.35308)
( 1.08657)
PHI MAX" 81.1 OEGREES
( 2.86963)
30
III!'H !I
I
)(
/V
.//
/VV
/'
/
//
~/: V
/
a 'CLbli.n2 Lb/ ~n2
100. 542.50. 317.,,,....
256..uu.205. 302.510. 555.
SLIDING fRICTION RESULTS
'C' 226.8+ 0.60 (a)
COHESION. 226.8Lbli.n0 r2 . 0.8641cD.31. 1I
DIRECT SHEAR TESTLINEAR REGRESSION RESULTS
BLACK CANYON DH76-2 7.2
100
600
500
N
C.oJ.........
-D->
400
t->
"'(f)(f)L.J0::::
~ 300
0::::
cr:L.JJ:(f)
200
0
LEGEND181. BREAK BOND VALUEX. SLI 0 I NG fR I CTION VALUES
100 200 300 100
NOR~AL STRESS, a - Lb/~n2
500
31

IJII!!'I
rL
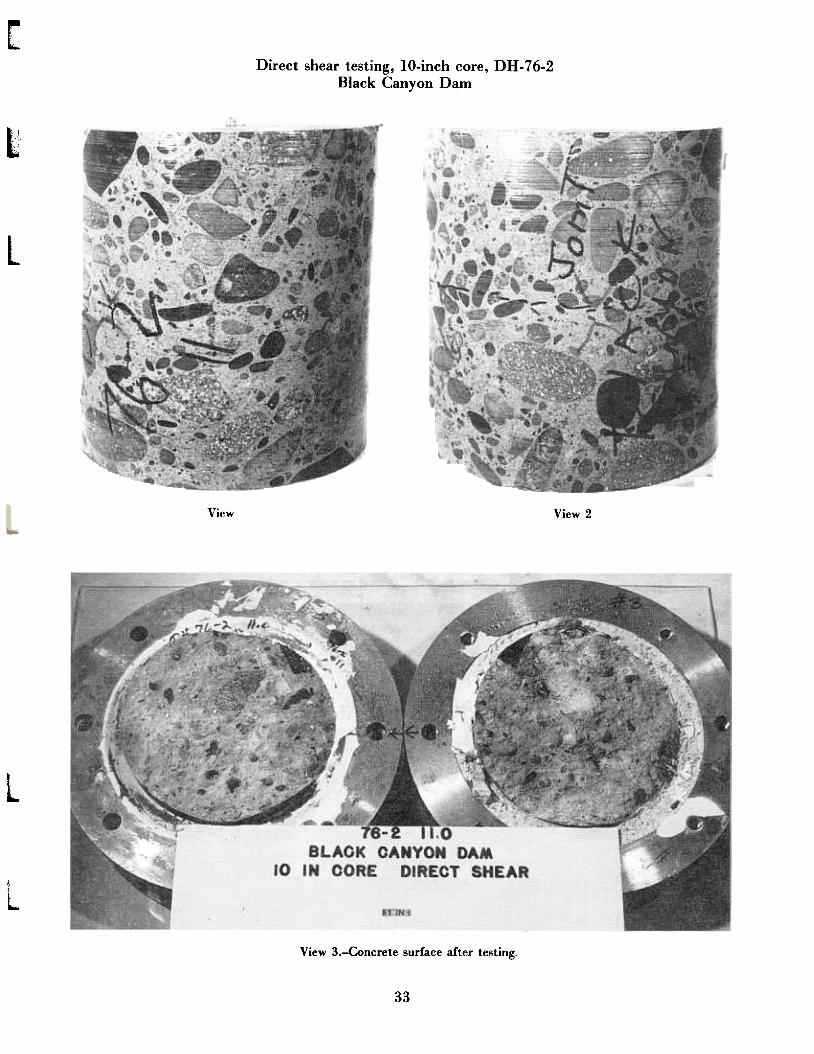
Direct shear testing, lO-inch core, DH- 76-2Black Canyon Dam
L
L
View View 2
L
L
View 3.-Concrete surface after testing.
33
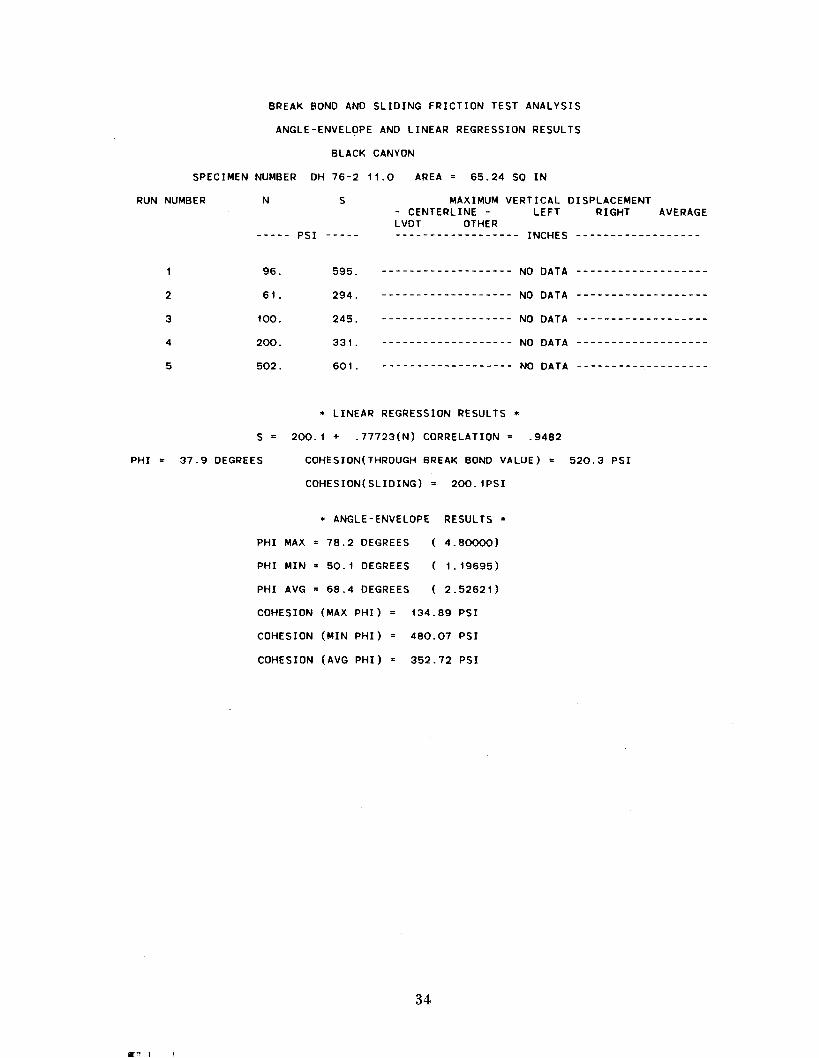
96. 595. ------------------- NO DATA -------------------
2 61 294 ------------------- NO DATA -------------------
3 100. 245. ------------------- NO DATA -------------------
4 200. 331 ------------------- NO DATA -------------------
5 502. 601 ------------------- NO DATA -------------------
BREAK BOND AND SLIDING FRICTION TEST ANALYSIS
ANGLE-ENVELOPE AND LINEAR REGRESSION RESULTS
BLACK CANYON
SPECIMEN NUMBER DH 76 - 2 11.0 AREA = 65.24 SQ IN
RUN NUMBER N S MAXIMUM VERTICAL DISPLACEMENT
- CENTERLINE - LEFT RIGHT AVERAGELVDT OTHER
INCHES ------------------PSI -----
*LINEAR REGRESSION RESULTS *
S = 200.1 + .77723(N) CORRELATIDN = .9482
PHI = 37.9 DEGREES COHESION(THROUGH BREAK BONO VALUE) = 520.3 PSI
COHESION(SLIDING) = 200.1PSI
* ANGLE-ENVELOPE RESULTS *
PHI MIN = 50.1 DEGREES
( 4.80000)
( 1.19695)
( 2.52621)
PHI MAX = 78.2 DEGREES
PHI AVG = 68.4 DEGREES
COHESIDN (MAX PHI) =
CDHESIDN (MIN PHI) =
134.89 PSI
480.07 PSI
COHESION (AVG PHI) = 352.72 PSI
34
IFni
/'
/18 i/7
///'
//
///'
//
x V/
/<1 .,;
Lb/ ~nZ Lb/ ~nz96. 595.61. 294.100. 245.200. 331.502. 601.
SLIDING FRICTION RESULTS.,;- 200. I + O.78 (<1)
COHESION - 200.lLb/~n0
rZ - 0.9482111-37.9.
I
N 500C
).........
-D~
t-' 400...
if)if)L..J0:::E-<if)
0::: 300cr:L..JIif)
DIRECT SHEAR TESTLINEAR REGRESSION RESULTS
BLACK CANYON DH 76-2 11.0
700
600
200
100
0 100
LEGEND0 -BREAK BOND VALUEX -SLIDING fRICTION VALUES
200 300 400
NORMAL STRESS,o - Lb/~n2
500
35

rII!!!'I
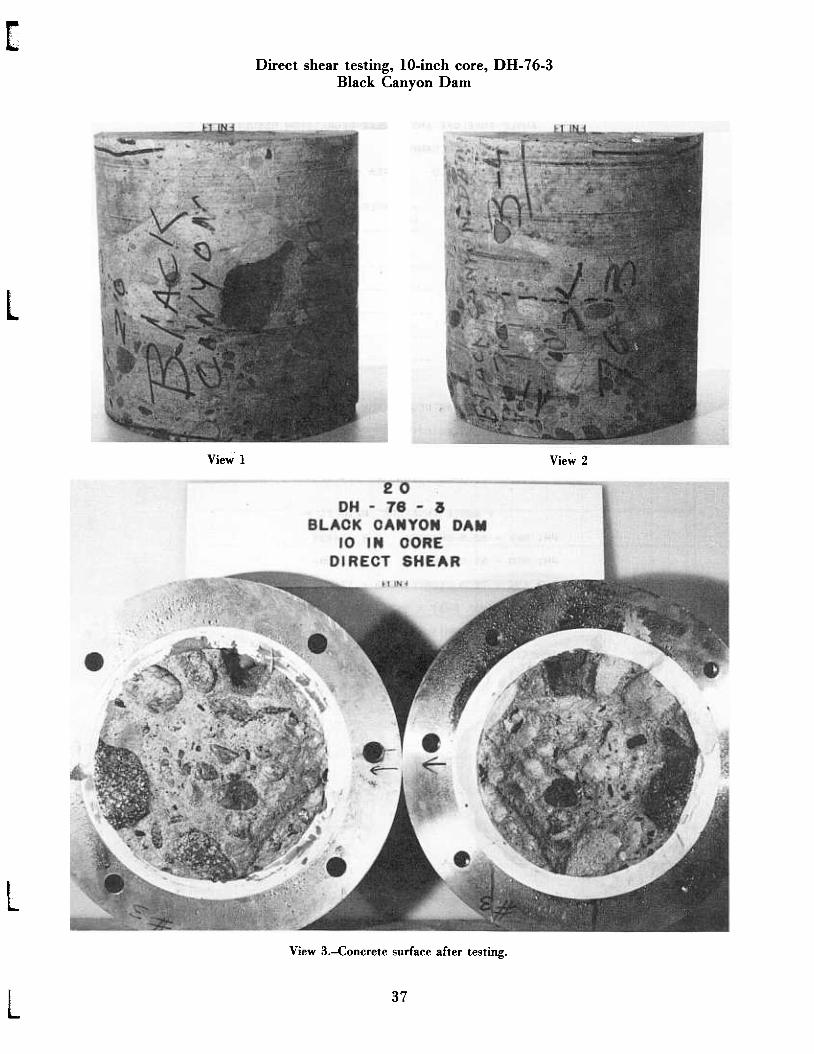
[Direct shear testing, IO-inch core, DH- 76-3
Black Canyon Dam
l
View 1 View 2
L
View 3.-Concrete surface after testing.
L 37
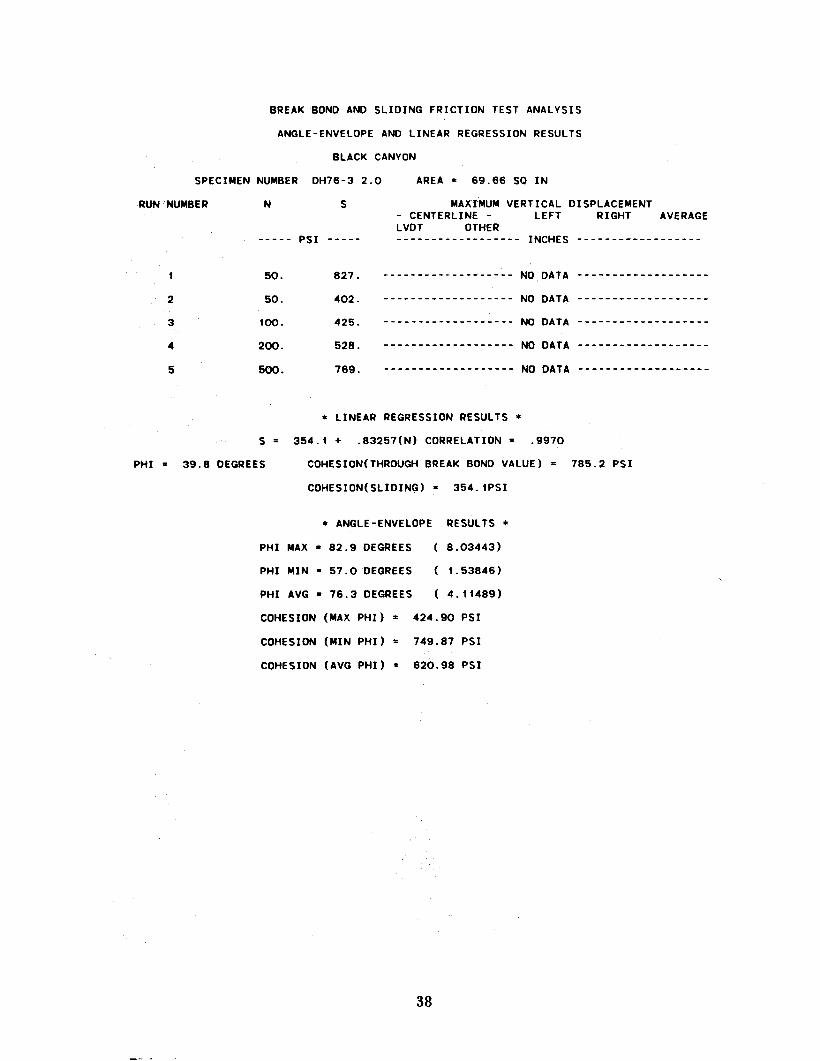
50. 827. ------------------- NO DATA -------------------
2 50. 402. -----------.------- NO DATA -------------------3 100. 425. ------------------- NO DATA -------------------
4 200. 528. ---.--------------- NO DATA -------------------
5 500. 769. ------------------. NO DATA --------------------
PHI MAX .. 82.9 DEGREES (8.03443)
PHI MIN .. 57.0 DEGREES ( 1.53846)
PHI AVG .. 76.3 DEGREES ( 4.11489)
COHESION (MAX PHI)" 424.90 PSI
COHESION (MIN PHI)" 749.87 PSI
COHESION (AVG PHI)" 620.98 PSI
BREAK BOND AND SLIDING FRICTION TEST ANALYSIS
ANGLE-ENVELOPE AND LINEAR REGRESSION RESULTS
BLACK CANYON
SPECIMEN NUMBER OH76-3 2.0 AREA .. 69.66 SO IN
RUNMJMBE R N S MAXTMUM VERTICAL DISPLACEMENT- CENTERLINE - LEFT RIGHT AVERAGELVDT OTHER
INCHES ------------------u-u PSI
. LINEAR REGRESSION RESULTS.
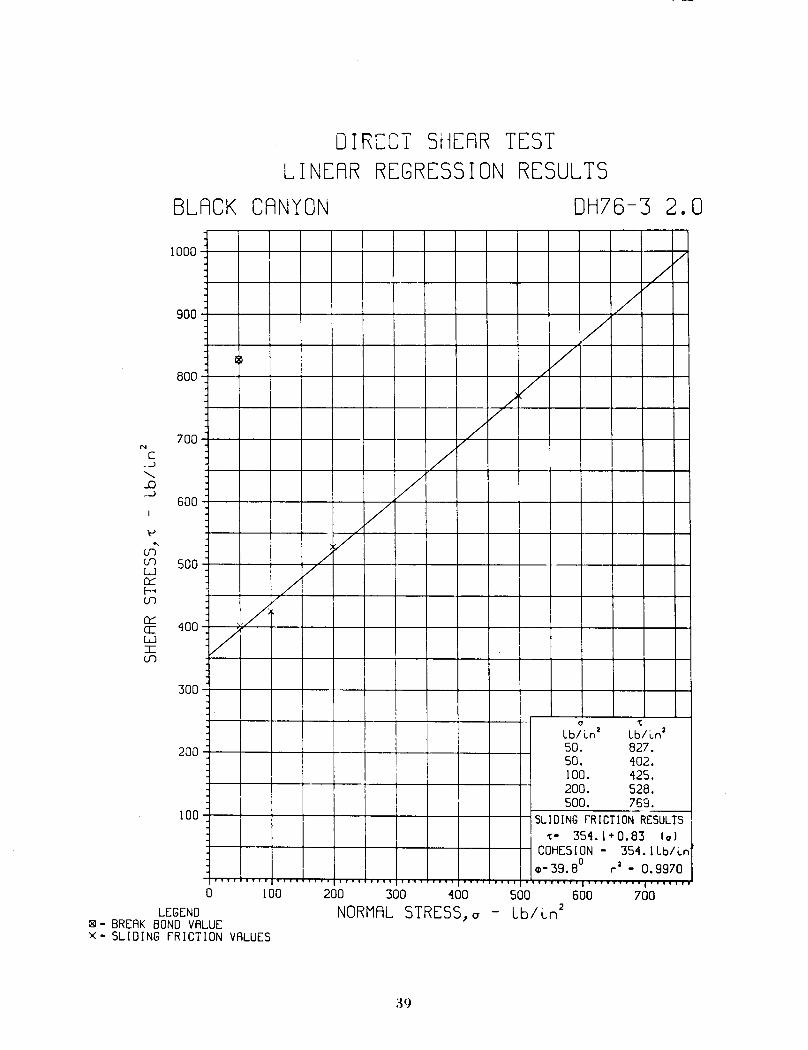
S .. 354.1 + .83257(N) CORRELATION .. .9970
PHI .. 39.8 DEGREES COHESION(THROUGH BREAK BOND VALUE) .. 785.2 PSI
COHESION(SLIDING) .. 354.1PSI
. ANGLE-ENVELOPE RESULTS.
38
700N
C...J
"..D.-J
600
<->...
(f)(f)
500L..J0::::t--o(f)
0::::400a:
L..JI(f)
300
//-----r
/, /
//
//'
//
/v
1//
v/
//
1,/
V
(}'(
Lbhn z Lb/~nz50. 827.50. 402.
I 100. 425.200. 528.500. 769.
SLIDINGFRICTION RESULTS'(- 354.1+0.83 (oj
COHESION - 354. ILb/~n0 z - 0.9970<1>-39.8 rI I' .
BLACK
DIRECT SHEAR TESTLINEAR REGRESSION RESULTS
CANYON OH76-3 2.0
1000
900
800
200
100
0 100
LEGEND181- BREAK BOND VALUEx - SLIDING fRICTION VALUES
200 300 400 500 600
NORMAL STRESS,a - Lb/Ln2
700
:N

18; ~;~ ~

Direct shear testing, lO-inch core, DH- 76-3Black Canyon Dam
1 IN
L
L
l
l
View View 2L
L
L
I
L
L,\View 3.-Concrete surface after testing.
L4}

114. 72 1 -------- ----- ------ NO DATA - ------------------
2 62 342 ------------------- NO DATA -------------------
3 113. 257. ------------------- NO DATA -------------------
4 217 342 ------------------- NO DATA ------------- -- -- --
5 524 617 ----- -------------- NO DATA -------------------
* ANGLE-ENVELOPE RESULTS *PHI MAX = 79.7 DEGREES ( 5.51724)
PHI MIN = 49.7 DEGREES ( 1.17740)
PHI AVG = 69.2 DEGREES ( 2.63532)
COHESION (MAX PHI) = 90.74 PSI
COHESION (MIN PHI) = 586.35 PSI
COHESION (AVG PHI) = 419.85 PSI
BREAK BOND AND SLIDING FRICTION TEST ANALYSIS
ANGLE-ENVELOPE AND LINEAR REGRESSION RESULTS
BLACK CANYON
SPECIMEN NUMBER OH 76-3 3.5 AREA = 65.48 SQ IN
RUN NUMBER N S MAXIMUM VERTICAL DISPLACEMENT- CENTERLINE - LEFT RIGHT AVERAGELVDT OTHER
INCHES ------------------uu- PSI
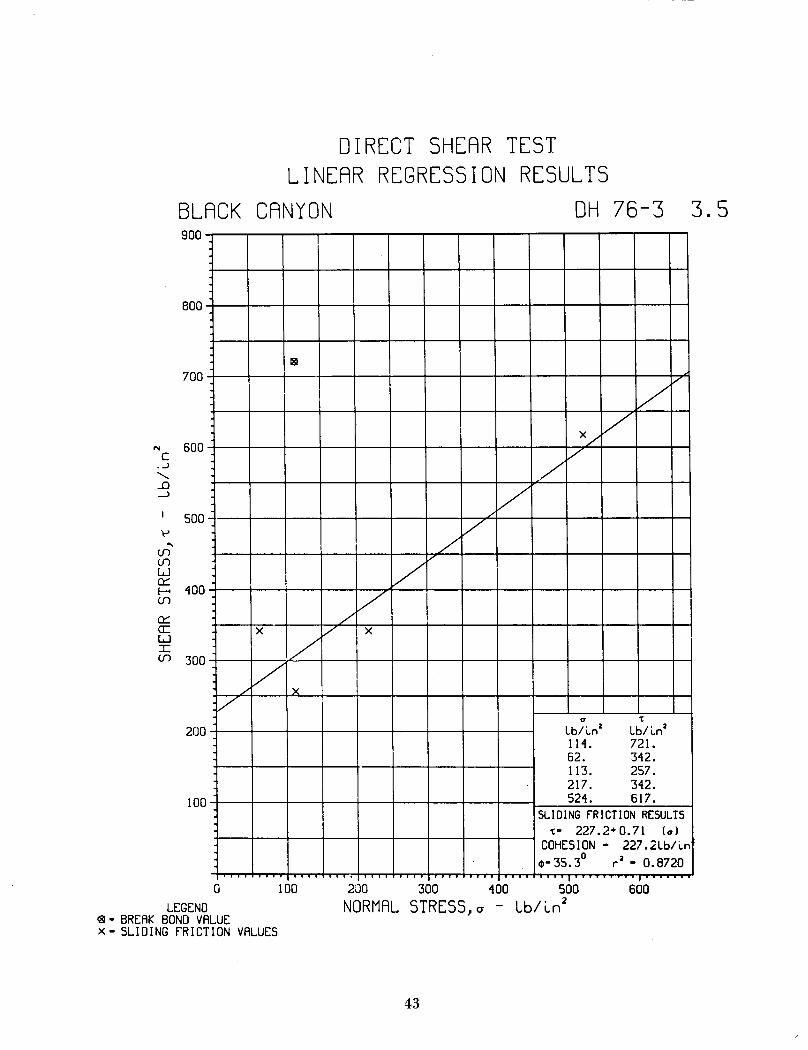
* LINEAR REGRESSION RESULTS *S = 227.2 + .70818(N) CORRELATION = .8720
PHI = 35.3 DEGREES COHESION(THROUGH BREAK BOND VALUE) = 639.9 PSI
COHESION(SLIDING) = 227.2PSI
42
181
/x/ 7
/v
//'
/'
/./
/x ,/ x
//
x/'
Va .,;
Lb/ i..n2 Lbli..n211'1. 721.62. 3'12.113. 257.217. 3'12.52'1. 617.
SLIDING fRICTION RESULTS.,;- 227.2+ 0.71 (a)
COHESION - 227.2Lb/i..n
C\I-35. 30 r2 - 0.8720, -r
N 600C
...J
"...D~
<->
"(f)(f)WQ::f-< '100(f)
Q::cr:W:r:(f)
300
DIRECT SHEAR TESTLINEAR REGRESSION RESULTS
BLACK CANYON DH 76-3 3.5900
800
700
500
200
100
0 100
LEGEND0 - BREAK BONO VALUEX - SL I 0 I NG fR I CTI ON VALUES
200 300 '100 500
NORMAL STRESS, a - Lb/~n2
600
43

.' r! ~

Direct shear testing, lO.inch core, DH.76.3Black Canyon Dam
l
L
View 1 View 2
l
View 3.-Concrete surface after testing.
45

* ANGLE-ENVELOPE RESULTS *
PHI MAX" 76.7 DEGREES ( 4.24337)
PHI MIN " 49.6 DEGREES ( 1.17485)
PHI AVG " 67.8 DEGREES (2.44800)
COHESION (MAX PHI)"
105.09 PSI
COHESION (MIN PHI)"
712.76 PSI
COHESION (AVG PHI)"
460.63 PSI
RUN NUMBER
PHI"
BREAK BOND AND SLIDING FRICTION TEST ANALYSIS
ANGLE-ENVELOPE AND LINEAR REGRESSION RESULTS
BLACK CANYON
SPECIMEN NUMBER DH 76-3 8.2 AREA" 65.37 SQ IN
N MAXIMUM VERTICAL DISPLACEMENT- CENTERLINE - LEFT RIGHT AVERAGELVDT OTHER
INCHES ------------------
S
PSI
198. 945. NO DATA -------------------
2 208. NO DATA -------------------49.
3 257. NO DATA -------------------100.
4 200. NO DATA -------------------361.
5 587. NO DATA -------------------500.
* LINEAR REGRESSION RESULTS *
S " .83310(N) CORRELATION" .9948176.5 +
39.8 DEGREES COHESION(THROUGH BREAK BOND VALUE)" 780.4 PSI
COHESION(SLIDING)"
176.5PSI
46

/
//
V/
/
V/
/1/
7v
/
//,
//
,/ a "C
LbhnZ LbhnZ/ 198. 945.
~49. 208.[7 100. 257.
200. 361.500. 587.
SLIDINGfRICTION RESULTS"C' 176.5+0.83 (a)
COHESION. 176.5Lb/Ln0
rZ . 0.9948I
~.39. 8~'I
'I
II 1II'Ii
DIRECT SHEAR TESTLINEAR REGRESSIuN RESULTS
BLACK CANYON DH 76-3 8.2
100
1100
1000
900
800'"C.-1"'-...D--.J 700
\->
(f)" 600(f)
L..Ja::::E--<(f)
500a::::a:L..JI(f) 400
300
200
0 100
LEGEND~. BREAK BOND VALUE>( . SL I 0 I NG fR I CT I ON VALUES
200 300 400 500 600 700
NORMAL STRESS, a - Lb/~n2800
47

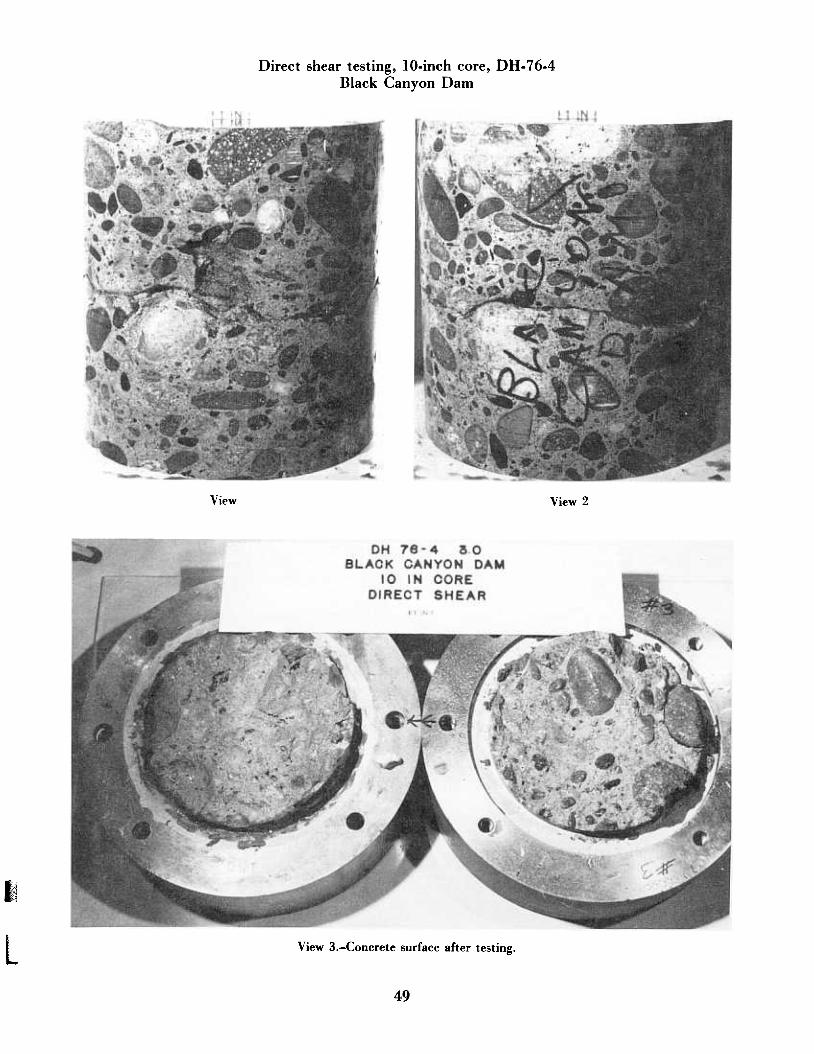
Direct shear testing, IO-inch core, DH- 76-4Black Canyon Dam
View View 2
I '~
,:;
L View 3.-Concrete surface after testing.
49
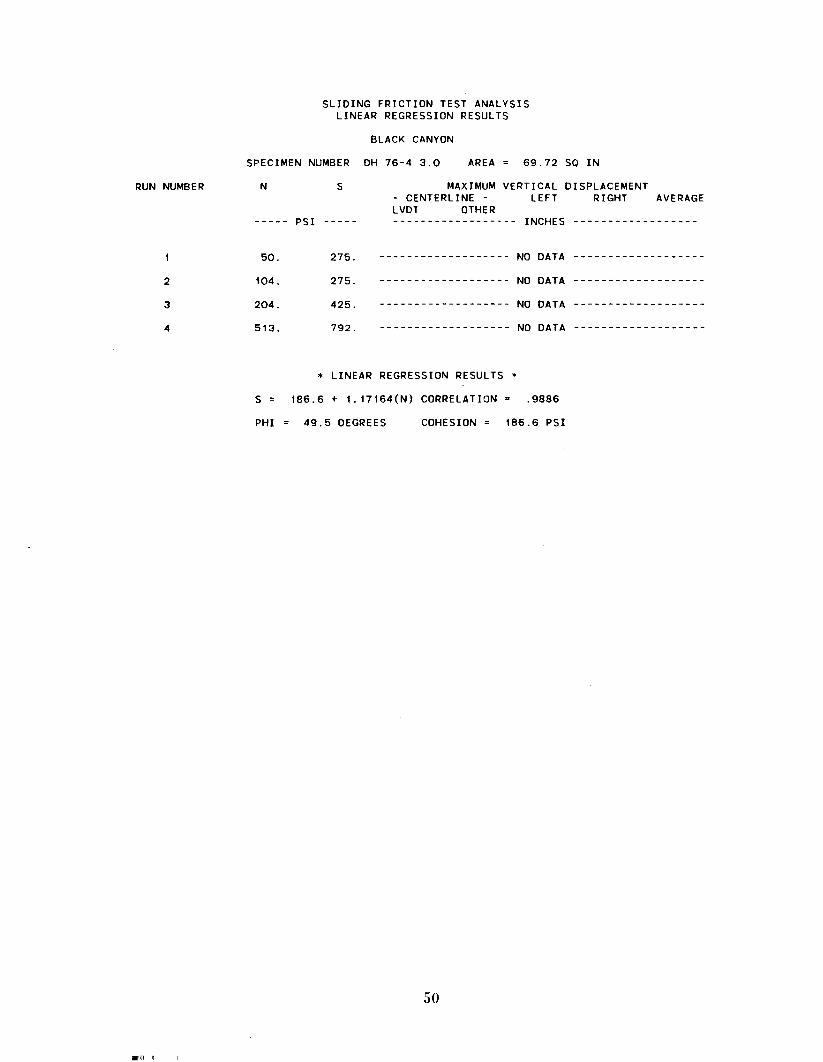
RUN NUMBER
2
3
4
.!~ 1
SLIDING FRICTION TEST ANALYSISLINEAR REGRESSION RESULTS
SPECIMEN NUMBER
PSI
104.
204.
513.
S'"
PHI'"
N
50.
BLACK CANYON
DH 76-4 3.0 AREA'"
69.72 SQ IN
S MAXIMUM VERTICAL DISPLACEMENT
- CENTERLINE - LEFT RIGHT AVERAGELVDT OTHER
INCHES ------------------
275. NO DATA -------------------
275. NO DATA -------------------
425. NO DATA -------------------
792. NO DATA -------------------
* LINEAR REGRESSION RESULTS *
186.6 + 1.17164(N) CORRELATION'"
49.5 DEGREES
.9886
COHESION'"
186.6 PSI
50
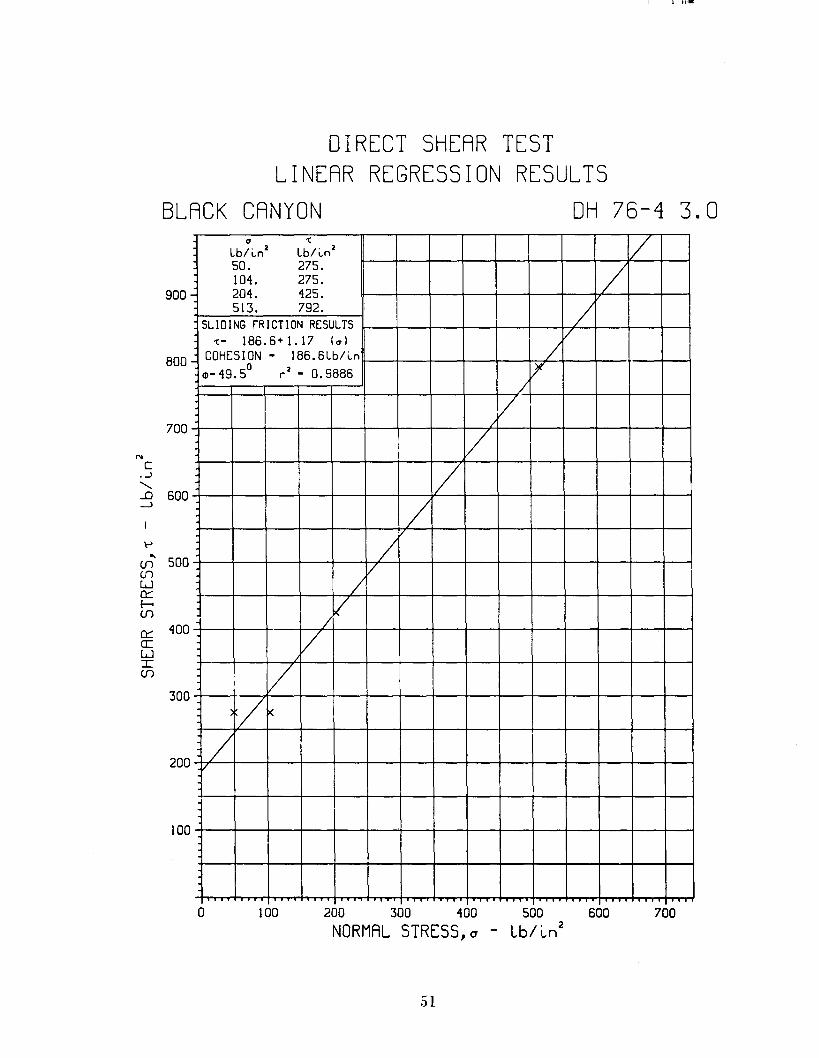
a -c /Lbll.n2 Lb/ i.n2
50. 275.
/104. 275.- 204. 425.
513. 792. /SLIDING PRICTION RESULTS186. 6 + 1. 17 (aJ /-c-
/- COHESION - 186.6Lb/i.n0 2 Y~-49.5 r - 0.9886
/V
/
//
//
//
//
//
:/~
/v
. . . . . . . .
N
C..J........
..0 600->
~
en 500(f)
wa:::f--o(j)
a::: 400a:wI(j)
E lii-
DIRECT SHEAR TESTLINEAR REGRESSION RESULTS
BLACK CANYON DH 76-4 3.0
900
800
700
300
200
100
0 100 200 300 400 500
NORMAL STRESS,a - Lb/~n2
600 700
51

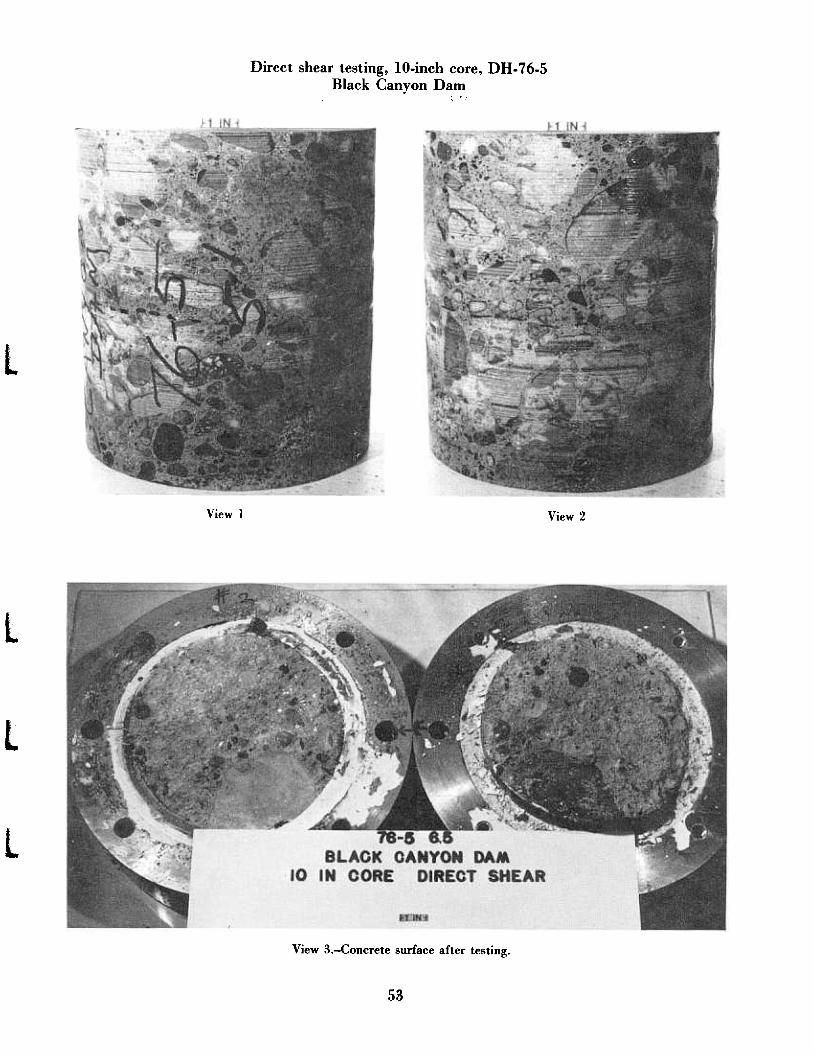
Direct shear testing, lO-inch core, DH- 76-5Black Canyon Da~
l
View 1 View 2
L
L
l
View 3.-Concrete surface after testing.
53
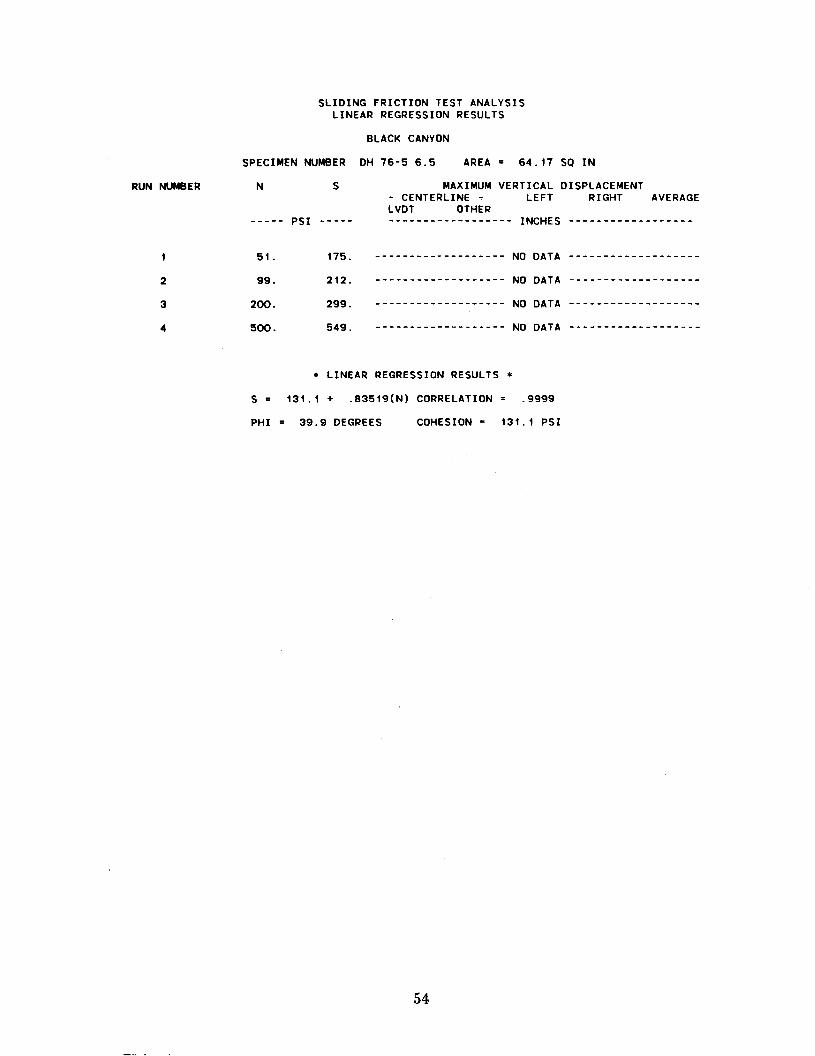
51 175. ---------- --------- NO DATA -------------------
99. 212. ------------------- NO DATA -------------------
200. 299. ------------------- NO DATA -------------------
500. 549. ------------------- NO DATA -------------------
RUN NUMBER
2
3
4
SLIDING FRICTION TEST ANALYSISLINEAR REGRESSION RESULTS
BLACK CANYON
SPECIMEN NUMBER DH 76-5 6.5 AREA = 64. 17 SO IN
N S MAXIMUM VERTICAL DISPLACEMENT
- CENTERLINE - LEFT RIGHT AVERAGEL VDT OTHER
INCHES ------------------PSI -----
* LINEAR REGRESSION RESULTS *S = .83519(N) CORRELATION = .9999131.1 +
PHI = 39.9 DEGREES COHESION = 131 . 1 PS I
54
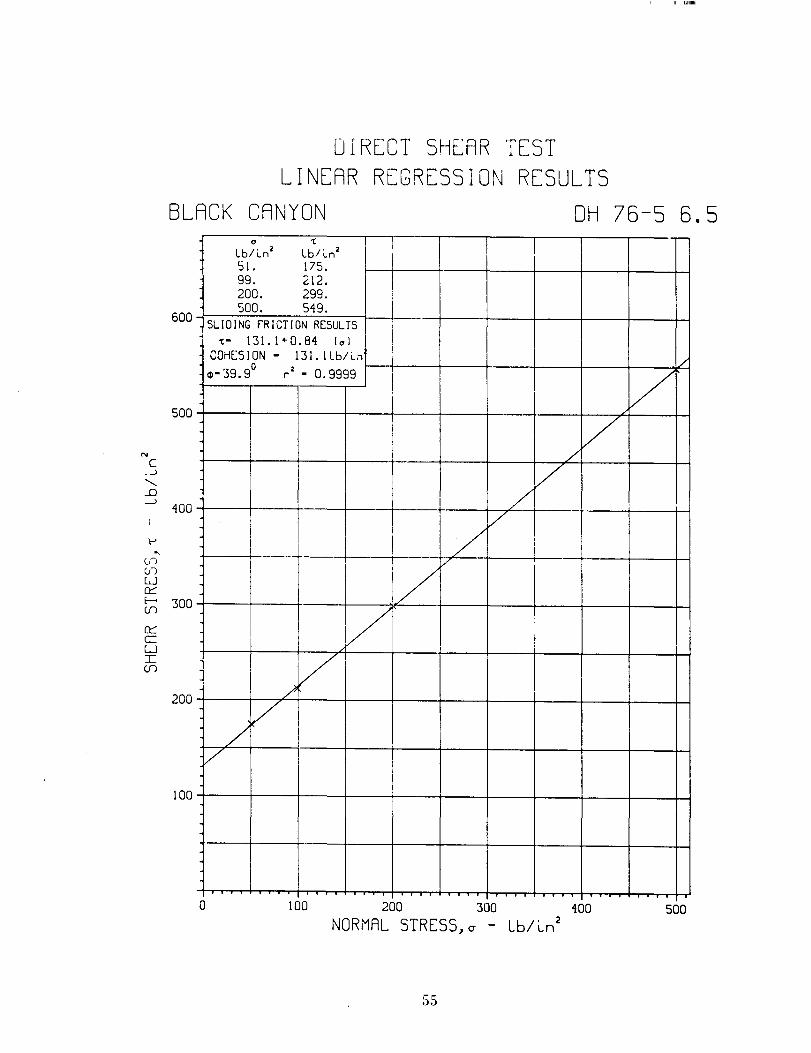
0 '( ILbhn2 Lbl ~n2
I51. 175.99. 212.
I
200. 299. i500. 549. 1SLIDING fRICTION RESULTS 1-
II131. 1+ 0.84 (0) f
'(- Ii
COHESION - 131.1Lbh"/0 2 - 0.9999 [7$- 39.9 r
I
i
I
I VII /
I
//I
i
I
V__1_-1- / I
/
/V
V~7
/V
.
DIRECT SHEAR TESTLINEAR REGRESSION RESULTS
BLACK CANYON DH 76-5 6.5
100
0 100 200 300 400
NORMAL STRESS,cr - Lb/Ln2SOD
600
SOD
N
C...J.........
...0~
400
...
"-enenL.J0::::E- 300en
0::::a:L.J:r:en
200
55

rII! III ~
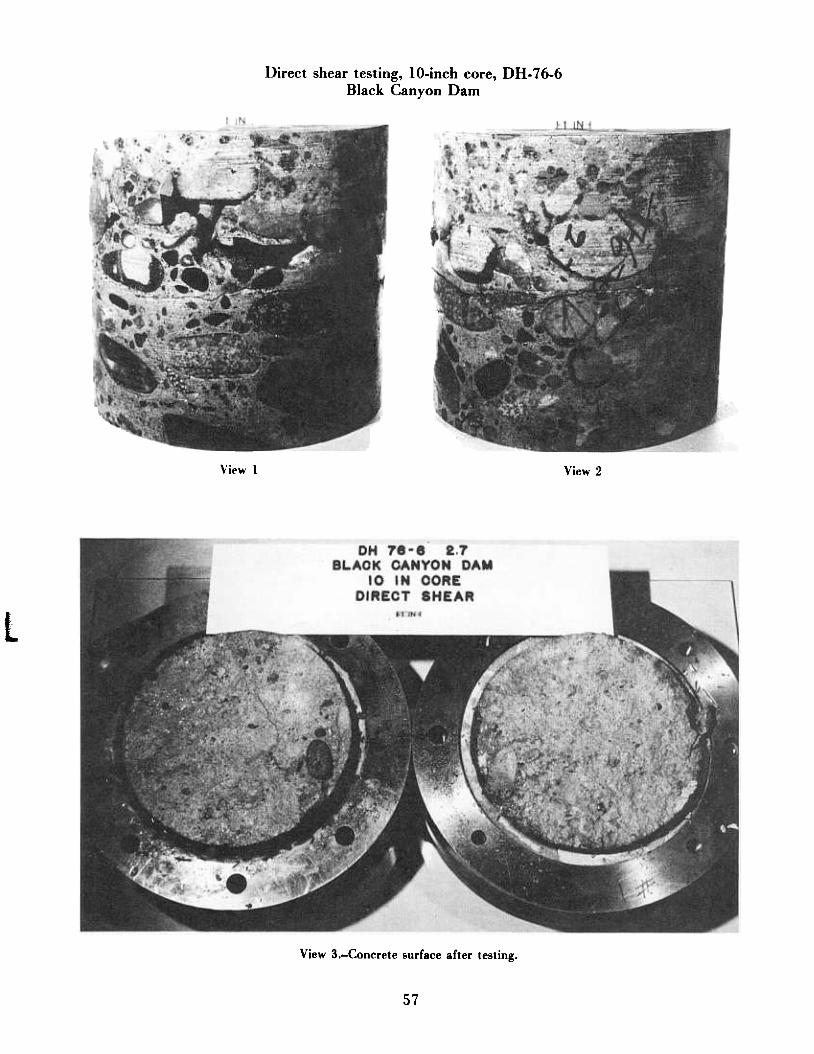
Direct shear testing, IO-inch core, DH- 76-6Black Canyon Dam
View 1 View 2
l
View 3.-Concrete surface after testing.
57
RUN NUMBER
2
3
4
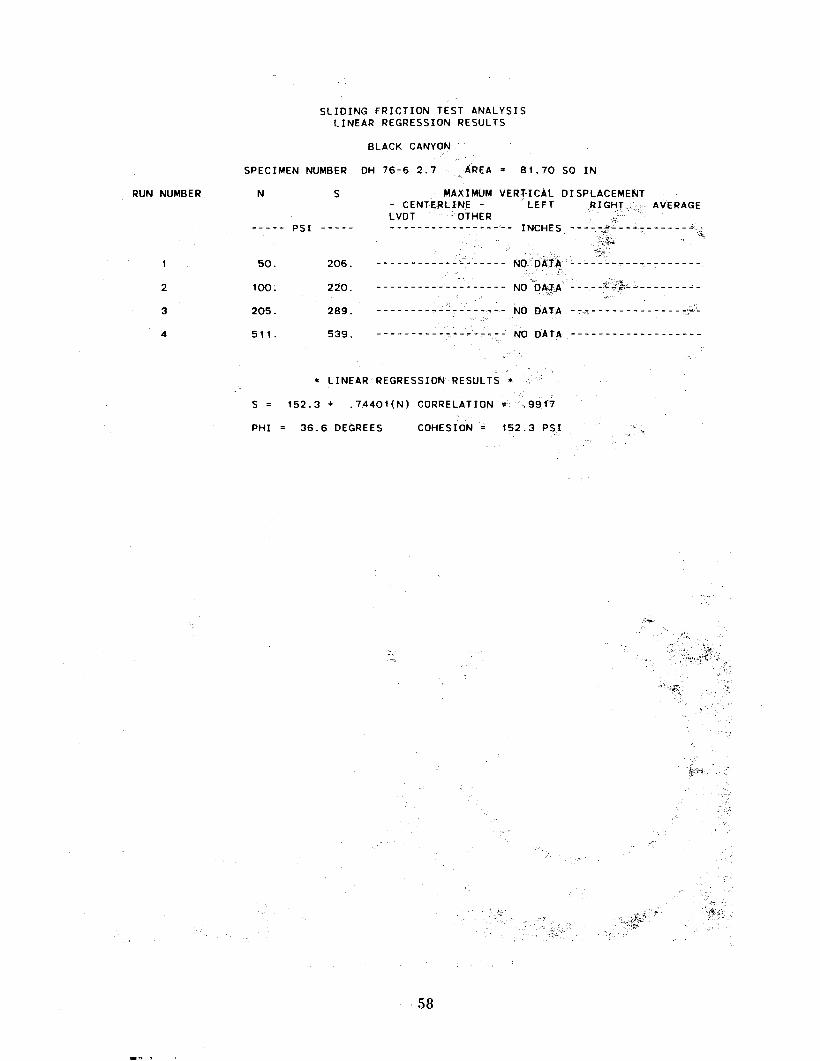
SLIDING FRICTION TEST ANALYSISLINEAR REGRESSION RESULTS
SPECIMEN NUMBER
--_u PSI
100.
2()5.
511.
S =
PHI =
N
50. 206.
220.
289.
539.
BLACK CANYON
DH 76-6 2.7 AREA = 81.70 SO IN
. MAXIMUM VER~ICAL DISPLACEME~T- CENTERLINE - LEFT AVERAGELVDT OTHER
~ ~- INCHES ---
S
NODAi~
- - - - - - - - - - - - - - - - - - - NO -O,\,JA' - - - -
-------- NO DATA ----------------
---------
'...--------
--- NO DATA -------------------
152.3 +
* LINEAR REGRESSION RESULTS *
.9917
36.6 DEGREES
.74401(N) CORRELATION ~
COHESION" 152.3 PSI
58

- a ,;lbli.n2 lbli.n250. 206.100. 220.205. 289.511. 539.
- SLIDING fRICTION RESULTS,;- 152.3+ 0.74 (a)
COHESION- 152.3lbli.n0
r2 - O.991711>-36.6
//'
Y/
/'
/- /
/'
V/
1/V
V X
/'
/V
V17
~.
D linE
DIRECT SHEAR TESTLINEAR REGRESSION RESULTS
BLACK CANYON OH 76-6 2.7
100
0 100 200 300 400
NORMAL STRESS,a - Lb/~n2500 600
800
700
600
N
C..J
'- 500..D-..J
t->
"'~ 400w~E-~en~5 300:r:en
200
59

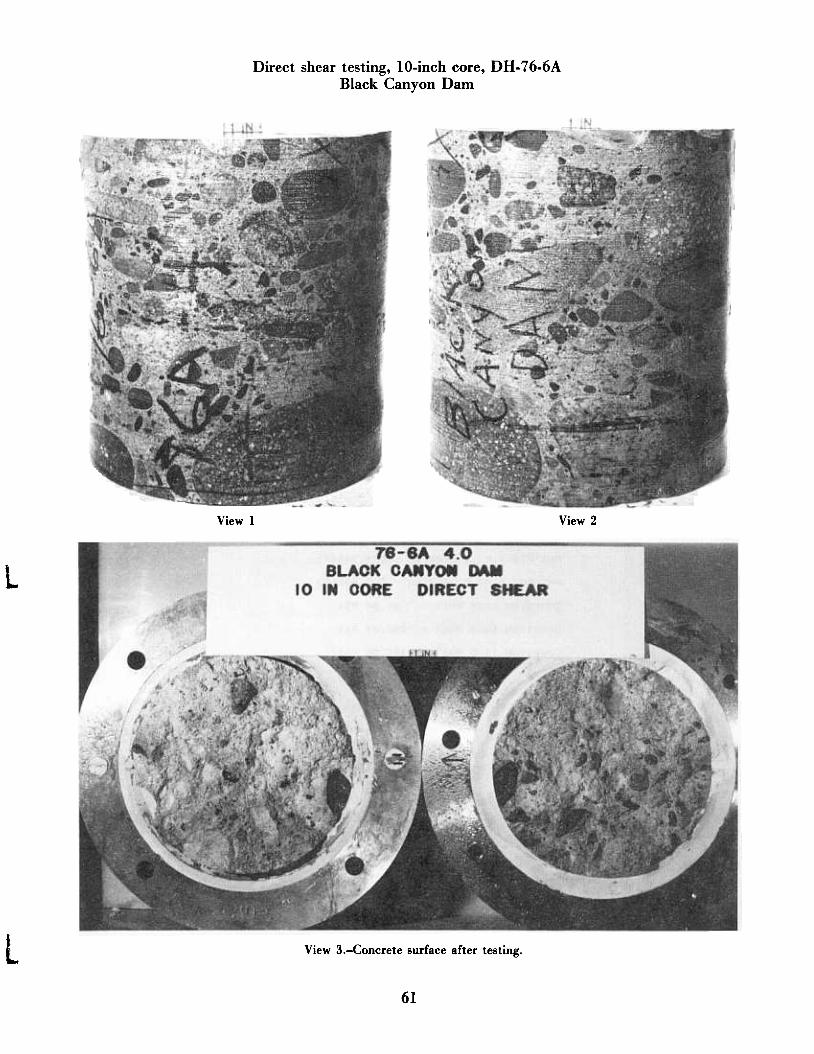
Direct shear testing, lO-inch core, DH-76-6ABlack Canyon Dam
View 1 View 2
L
L View 3.-Concrete surface after testing.
61
106. 414. ------------------- NO DATA -------------------
2 50. 176. ------------------- NO DATA -------------------
3 106. 350. ------------------- NO DATA -------------------
4 207. 344. ------------------- NO DATA -------------------
5 513. 639. ------------------- NO DATA -------------------
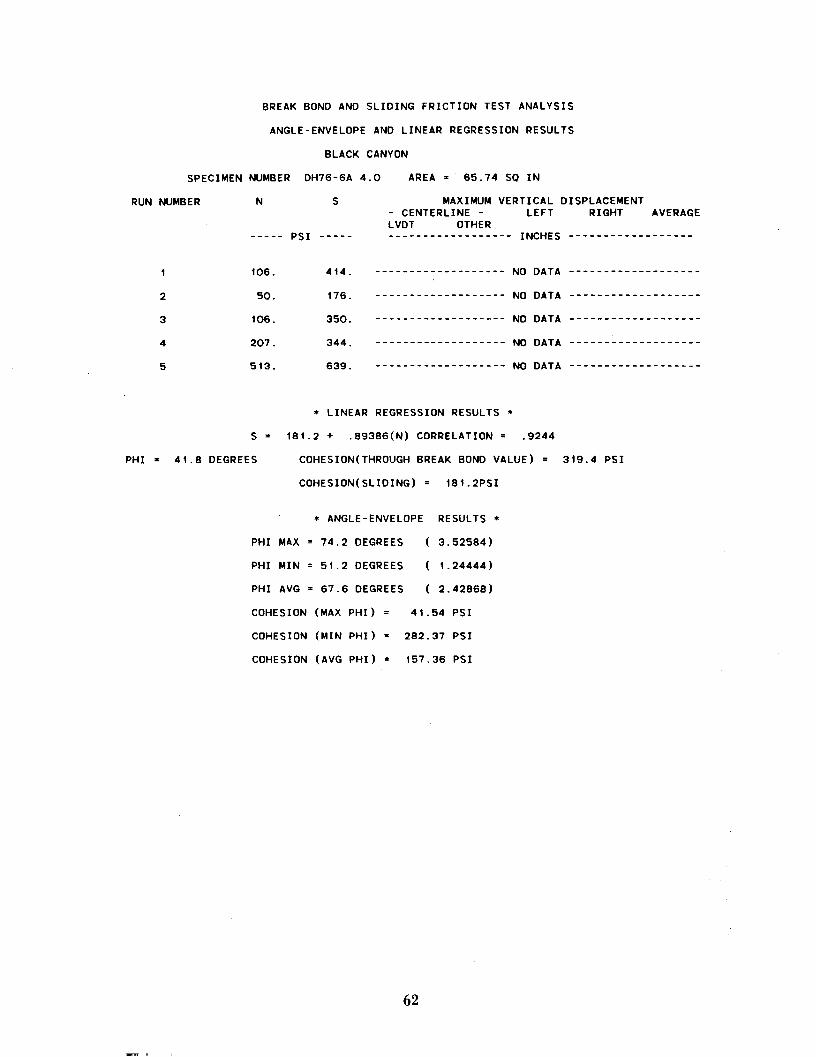
PHI AVG = 67.6 DEGREES
COHESION (MAX PHI) = 41 .54 PS I
COHESION (MIN PHI) = 282.37 PSI
COHESION (AVG PHI) = 157.36 PSI
BREAK BOND ANO SLIDING FRICTION TEST ANALYSIS
ANGLE-ENVELOPE AND LINEAR REGRESSION RESULTS
BLACK CANYON
SPECIMEN NUMBER DH76-6A 4.0 AREA = 65.74 SQ IN
RUN NUMBER N S MAXIMUM VERTICAL DISPLACEMENT- CENTERLINE - LEFT RIGHT AVERAGELVDT OTHER
INCHES -------------------uu PSI
* LINEAR REGRESSION RESULTS *
S = 181.2 + .89386(N) CORRELATION = .9244
PHI = 41.8 DEGREES COHESION(THROUGH BREAK BOND VALUE) = 319.4 PSI
COHESION(SLIDING) = 181. 2PSI
* ANGLE-ENVELOPE RESULTS *
PHI MAX = 74.2 DEGREES ( 3.52584)
( 1.24444 )
( 2.42868)
PHI MIN = 51.2 DEGREES
62
/
t//
//
V
//
/I!II /
//7 x
/
//
V/
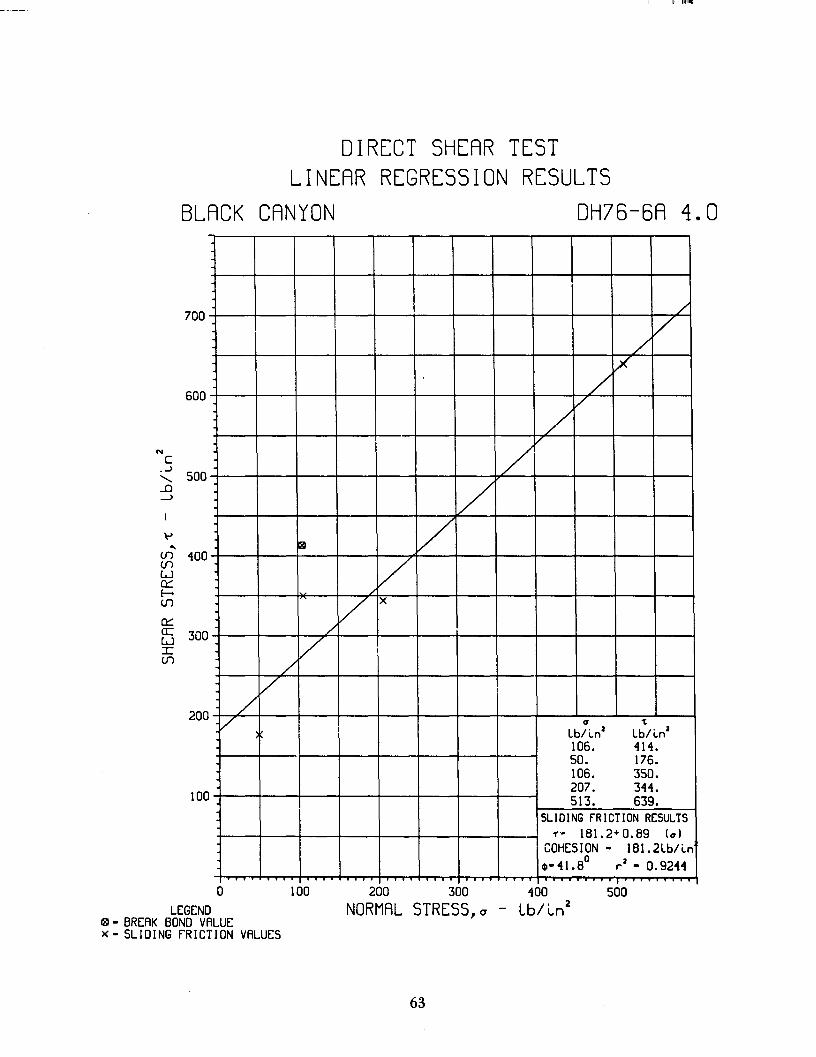
/ a 1:Lbhn2 Lbhn2106. 414.50. 176.106. 350.207. 344.513. 639.
SLIDING fRICTION RESULTS,.-. 181. 2+ O. 89 (a)
COHESION - 181.2Lb/Ln0 r2 - 0.924441)-41.8
T .
---------
N
C.J
'- 500..0..J
\->...
(f) 400(f)
wa:::E-o(f)
a:::cr: 300wI(f)
DIRECT SHEAR TESTLINEAR REGRESSION RESULTS
BLACK CANYON DH76-6A 4.0
700
600
200
100
0 100
LEGENDI!II -BREAK BOND VALUEX -SLIDING FRICTION VALUES
200 300 400
NORMAL STRESS, a - Lb/~n2500
63

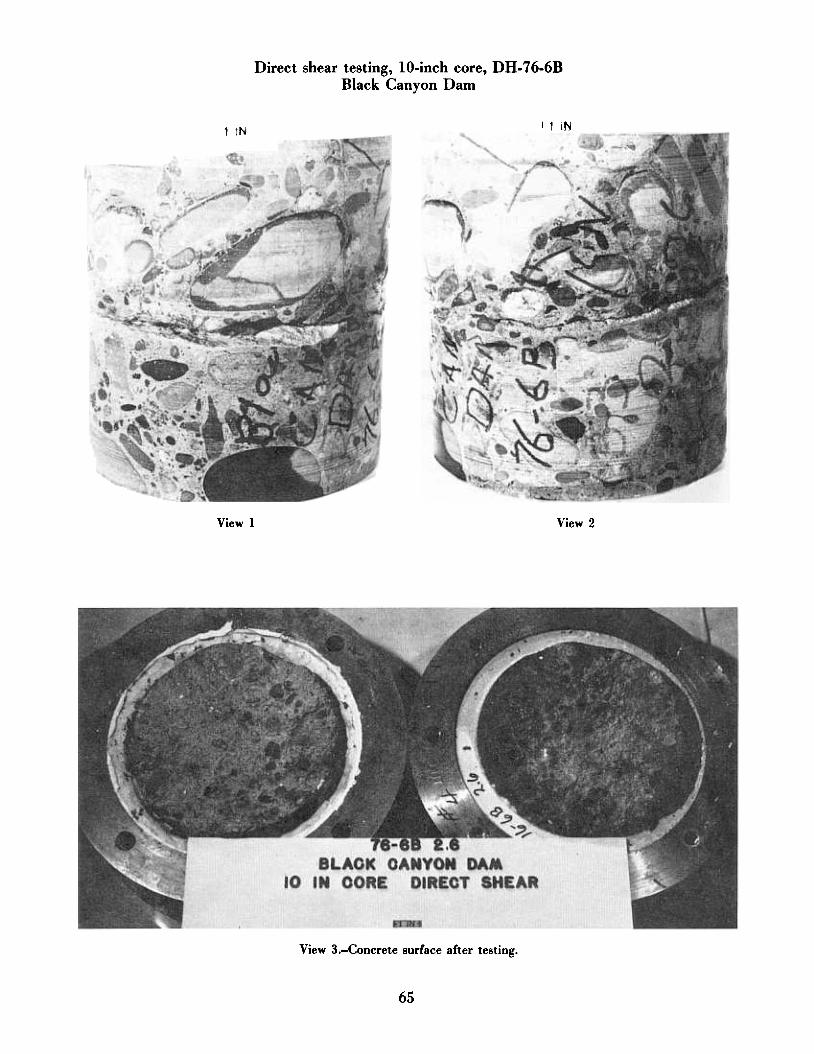
Direct shear testing, lO-inch core, DH- 76-6BBlack Canyon Dam
t 1 IN1 IN
View 1 View 2
View 3.-Concrete surface after testing.
65
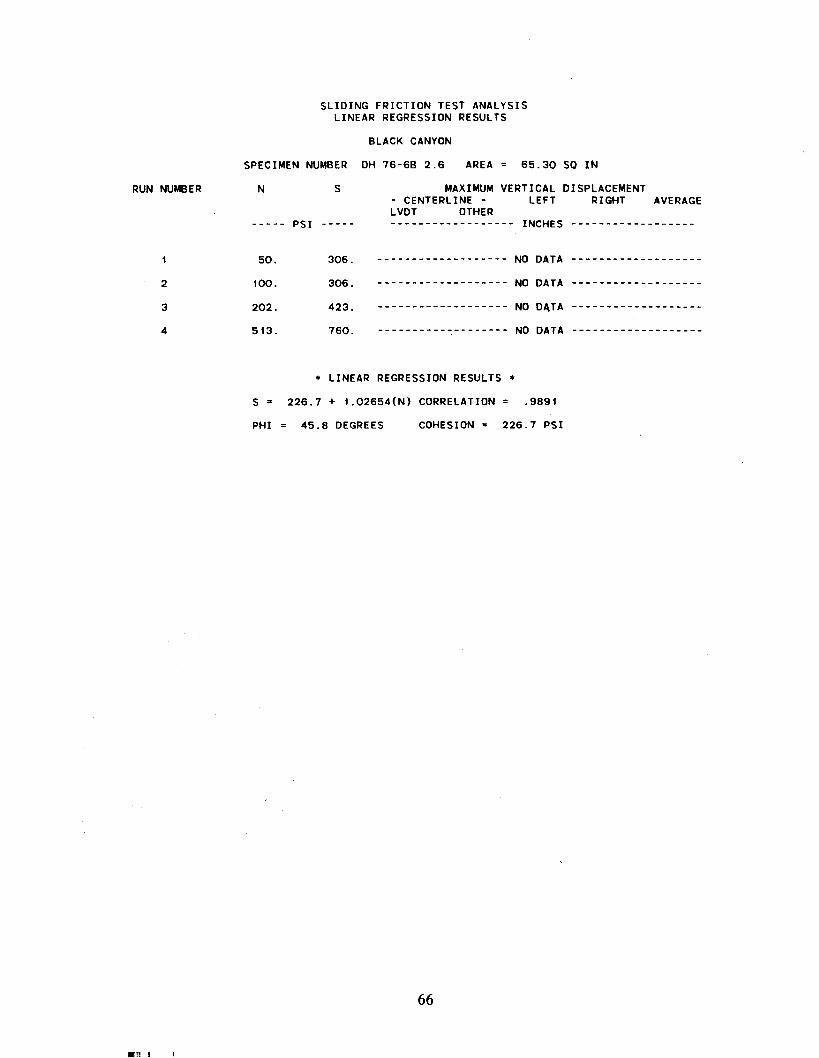
50. 306. ------------------- NO DATA -------------------
100. 306. ------------------- NO DATA -------------------
202. 423. ------------------- NO DATA -------------------
513. 760. ------------------- NO DATA -------------------
RUN NUMBER
2
3
4
18'11g
SLIDING FRICTION TEST ANALYSISLINEAR REGRESSION RESULTS
BLACK CANYON
SPECIMEN NUMBER DH 76-6B 2.6 65.30 SO INAREA =
N S MAXIMUM VERTICAL DISPLACEMENT- CENTERLINE - LEFT RIGHT AVERAGELVDT OTHER
INCHES ------------------PSI
* LINEAR REGRESSION RESULTS *
S = 226.7 + 1.02654(N) CORRELATION = .9891
PHI = 45.8 DEGREES 226.7 PSICOHESION =
66

a -c
/Lbhn2 Lb/~n2- 50. 306.
100. 306. /202. 423.513. 760.
/SLIDING fRICTION RESULTS- -c- 226. 7 + 1. 03 (a)
COHE:SION- 226.7Lbhn /0 r2 - 0.9891e11-45.8
//
//V
/
/'/
//
//
/V
//
//
.
. . .
N
C.J 600........
.D)
~ 500"'U1
U1wa::::E-oU1 400a::::a::w:r:U1
DIRECT SHEAR TESTLINEAR REGRESSION RESULTS
BLACK CANYON DH 76-6B 2.6
900
800
700
300
200
100
a 100 200 300 400 500
NORMAL STRESS,a - Lb/Ln2
600 700
67

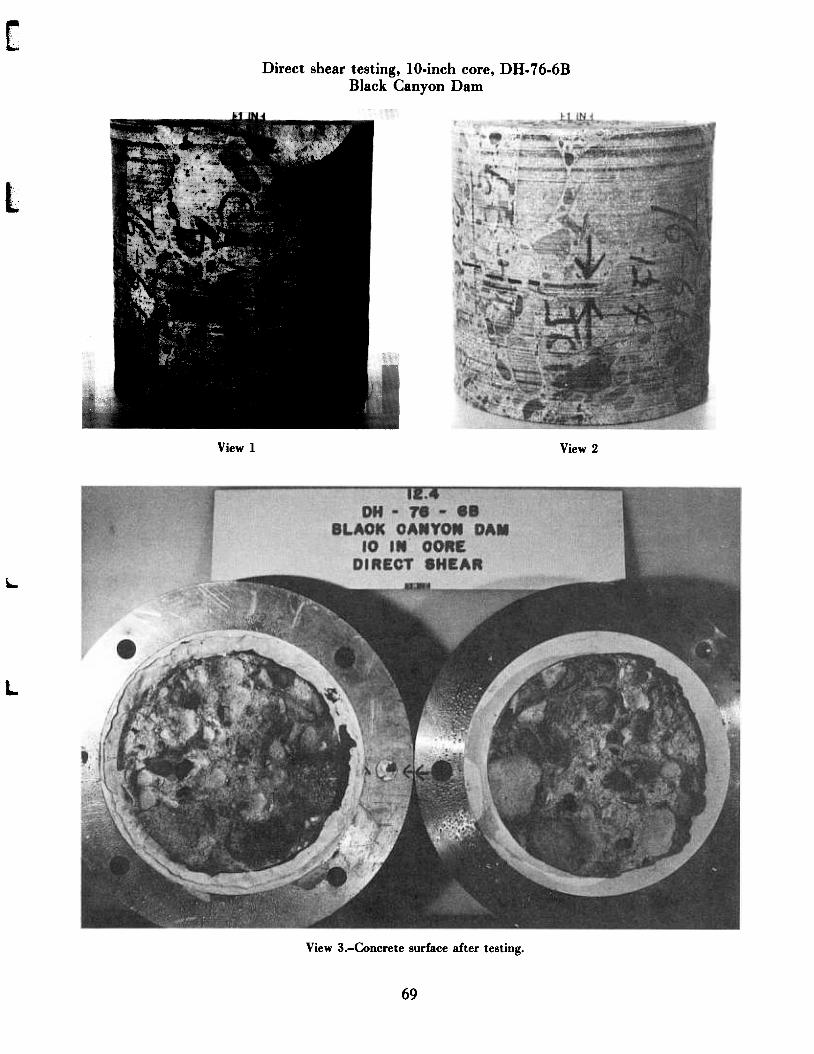
[Direct shear testing, lO.inch core, DH.76.6B
Black Canyon Dam
l
View 1 View 2
Lo
L
View 3.-Concrete sudace after testing.
69
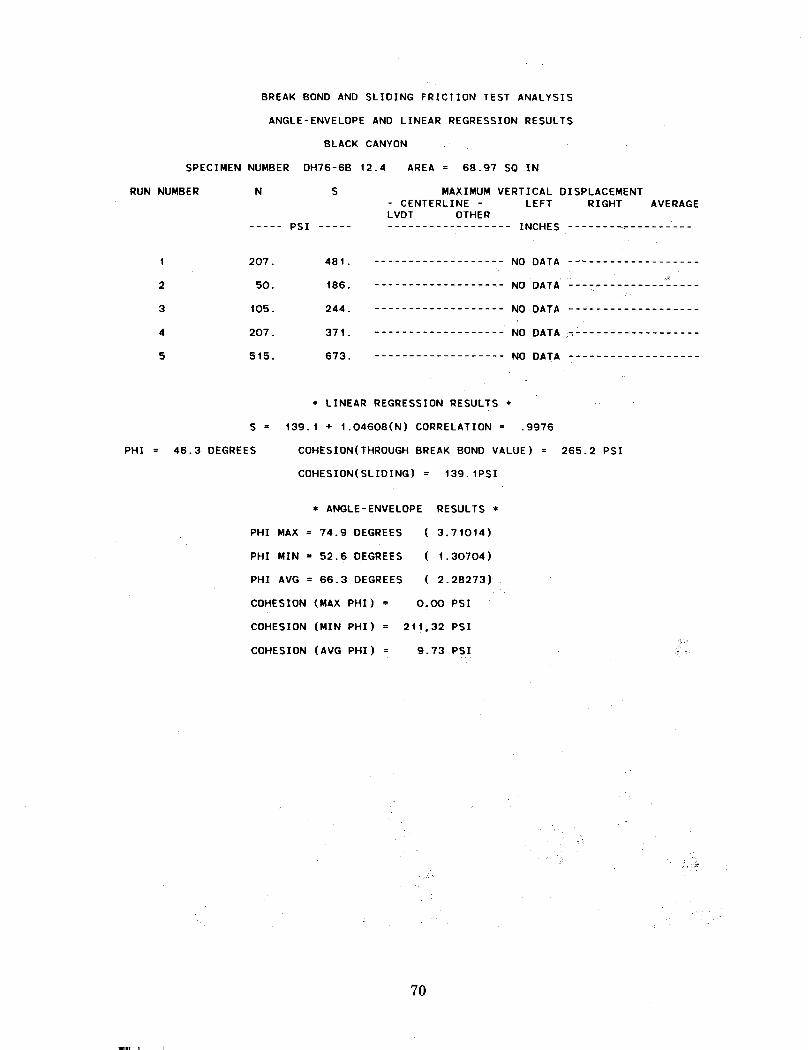
PHI MAX = 74.9 DEGREES ( 3.71014)
PHI MIN = 52.6 DEGREES ( 1 .30704 )
PHI AVG = 66.3 DEGREES ( 2.28273)
COHESION (MAX PHI) = 0.00 PSI
COHESION (MIN PHI) = 211,32 PSI
COHESION (AVG PHI) = 9.73 PSI
RUN NUMBER
PHI =
BREAK BOND AND SLIDING FRICTION TEST ANALYSIS
ANGLE-ENVELOPE AND LINEAR REGRESSION RESULTS
BLACK CANYON
SPECIMEN NUMBER DH76-6B 12.4 AREA = 68.97 SQ IN
N S MAXIMUM VERTICAL DISPLACEMENT- CENTERLINE - LEFT RIGHT AVERAGELVDT OTHER
INCHES ~---------PSI
207. 481. NO DATA --~----------------
',02 50. 186. NO DATA -------------------
3 105. 244. NO DATA -------------------
4 207. 371. NO DATA -------------------
5 515. 673. NO DATA -------------------
* LINEAR REGRESSIDN RESULTS *S = 139.1 + 1.04608(N) CORRELATION = .9976
46.3 DEGREES COHESION(THROUGH BREAK BOND VALUE) = 265.2 PSI
COHESION(SLIDING) = 139.1PSI
* ANGLE-ENVELOPE RESULTS *
70
//
//
//
//
181 /1/
~//
/K
0 1:'
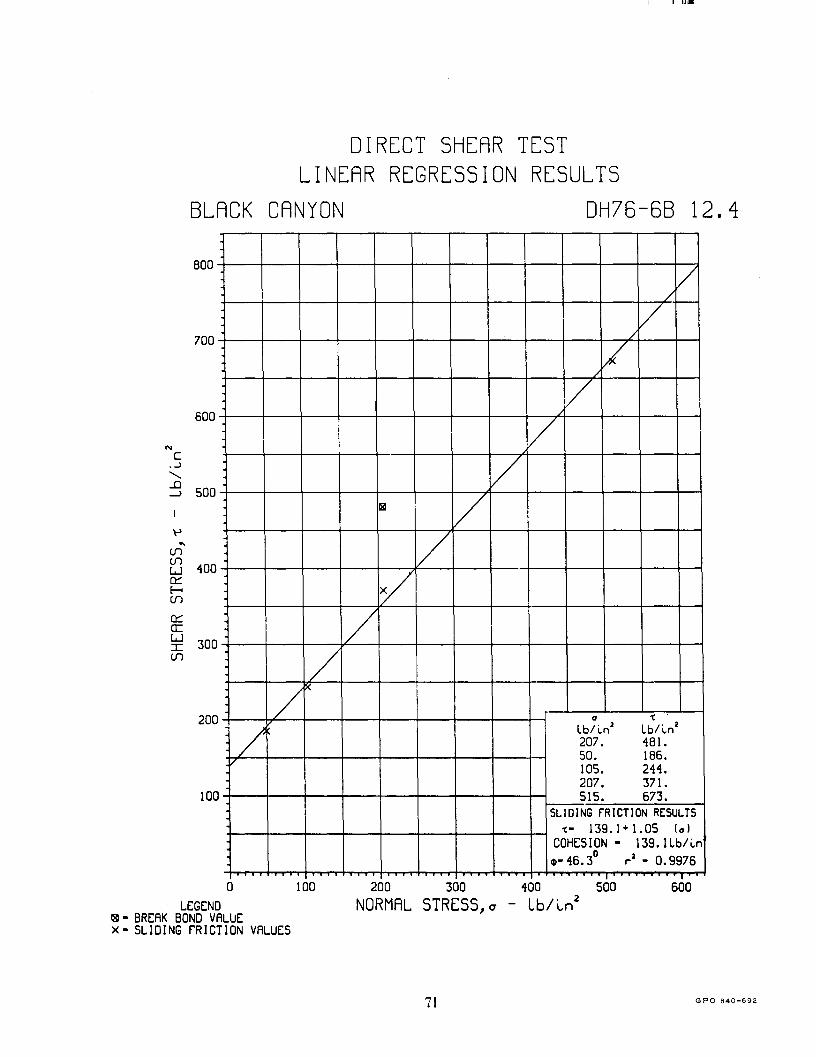
/lbhn2 lbhn2207. i81.50. 186.105. 2H.207. 371.515. 673.
SLIDING fRICTION RESULTS1:. 139. 1+ 1. 05 (0)
COHESION. 139. llb/~n0 r2 . 0.9976~.i6. 3
. .. I I
'"C..J
"~ 500
~...
(j)
~ iOOQ:::E-<(j)
Q:::cr:
~ 300(j)
I lil,iIII
DIRECT SHEAR TESTLINEAR REGRESSION RESULTS
BLACK CANYON DH76-6B 12.4
800
700
600
200
100
a 100LEGEND
\81. BREAK BOND VALUEx. SLl 0 I NG fR I CTl ON VALUES
200 300 iOO 500
NORMAL STRESS, a - Lb/~n2
600
71 GPO 640-692

Mission of the Bureau of Reclamation
The Bureau of Reclamation of the U.S. Department of the Interior is responsible for the development and conservation of the Nation's water resources in the Western United States.
The Bureau's original purpose "to provide for the reclamation of arid and semiarid lands in the West" today covers a wide range of interre- lated functions. These include providing municipal and industrial water supplies; hydroelectric power generation; irrigation water for agricul- ture; water quality improvement; flood control; river navigation; river regulation and control; fish and wildlife enhancement; outdoor recrea- tion; and research on water-related design, construction, materials, atmospheric management, and wind and solar power.
Bureau programs most frequently are the result of close cooperation with the U.S. Congress, ohher Federal agencies, States, local govern- ments, academic institutions, water-user organizations, and other concerned groups.
for Sale." It describes some of the technical publications currently available, their cost, and how to order them. The pamphlet can be obtained upon request from the Bureau of Reclamation, Attn D-922,