Embed Size (px)
Citation preview

DIMENSIONS OF A SUBMARINE DIESELAS FUNCTION OF ENGINE POWER AND SPEED
REPORT NUMBER: OEMO 94/08 AND 94/11
ila6tf
T'U DelftVAKGROEP OEMO
R.F. van Kuilenburgstnr : 485375

I. List of contentsList of contents page 1
List of symbols and constants page
page 3
Seiliger Process2.1 Seiliger Process page 42.2 parameters of the seiliger process page 62.3 parameter b page 72.4 power page 82.5 conclusion
Turbocharging3.1 mechanical driven page it 33.2 exhaust driven,
Diameter exhaustgaspipe page 20
Dimensional relations page 23
Engine dimensions6.1 width page 246.2 heigth page 266.3 length page 286.4 mass page 30
7. Model SUBDIESEL page 33
References page 36
Appendix
Engine databaseSubmarine engine databaseAdditional figures
1
slo*/
T U DelftVakgroep OEMO
-
page
page

II. List of symbols and constants
compression ratioip density kg/m3ip pressure (absoluut)i Pa (105 Pa = Il bar),p pressure ratio
energy (amount of heat); 'Ni,,
pm,. mean effective pressure BarI amount of fuel injected ikg/s
tis isentropic efficiency
ix air excess factorim mass kg
(Prn massflow kg/s
Rpm maximum pressure barfix efficiency
slipfactor
iu velocity rrisbe specific fuel consumption kg/kWhX specific air consumption kg/kWhCp, specific heat (air) J/kgK
stoichiometrische lucht/brandstof ratioT temperature
ratio of specific heatsFtc, heat of combustion 1107kg
NJ' lossfactor
W powervolume m3
(13V volumef low m3/sR gasconstant J/kgKg gravitation& acceleration m/S2Ps standard pressure Pa
2
MG
TU DelftVakgroep OEMO
-
-
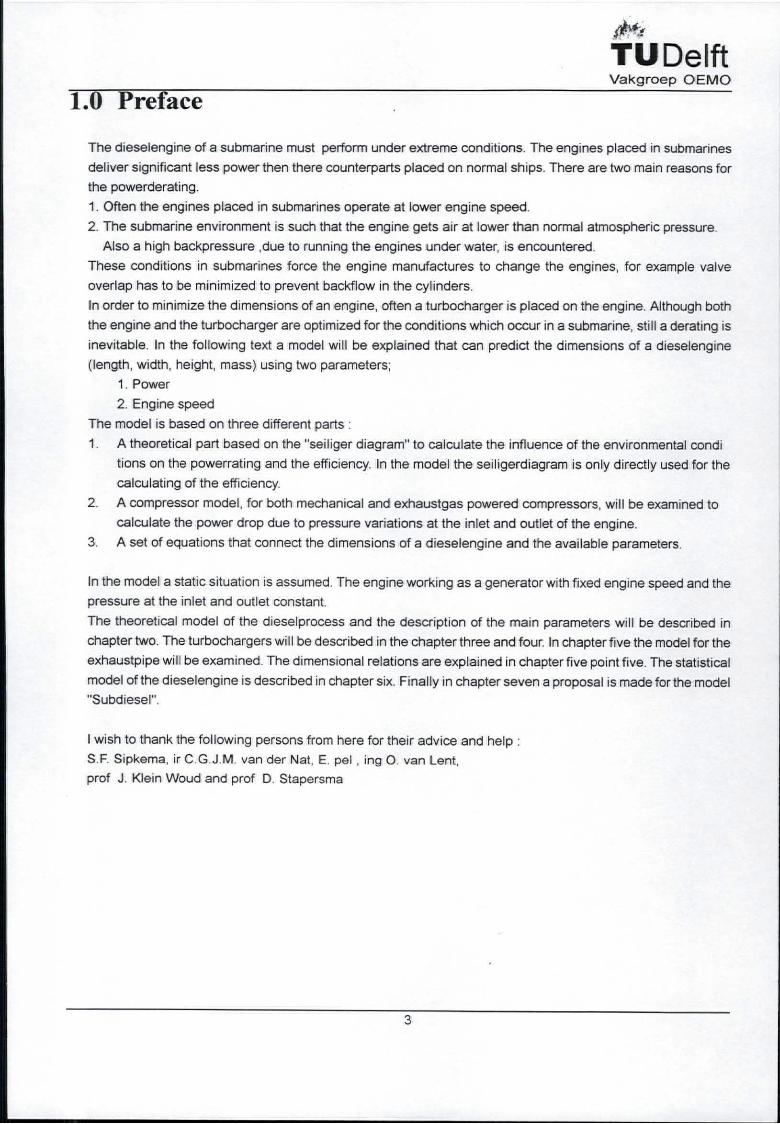
1.0 Preface
The dieselengine of a submarine must perform under extreme conditions. The engines placed in submarines
deliver significant less power then there counterparts placed on normal ships. There are two main reasons for
the powerderating.
Often the engines placed in submarines operate at lower engine speed.
The submarine environment is such that the engine gets air at lower than normal atmospheric pressure.
Also a high backpressure ,due to running the engines under water, is encountered.
These conditions in submarines force the engine manufactures to change the engines, for example valveoverlap has to be minimized to prevent backf low in the cylinders.
In order to minimize the dimensions of an engine, often a turbocharger is placed on the engine. Although both
the engine and the turbocharger are optimized for the conditions which occur in a submarine, still a derating is
inevitable. In the following text a model will be explained that can predict the dimensions of a dieselengine(length, width, height, mass) using two parameters;
Power
Engine speed
The model is based on three different partsill, A theoretical part based on the "seiliger diagram" to calculate the influence of the environmental condi
tions on the powerrating and the efficiency. In the model the seiligerdiagram is only directly used for thecalculating of the efficiency.
A compressor model, for both mechanical and exhaustgas powered compressors, will be examined to
calculate the power drop due to pressure variations at the inlet and outlet of the engine.
A set of equations that connect the dimensions of a dieselengine and the available parameters.
In the model a static situation is assumed. The engine working as a generator with fixed engine speed and thepressure at the inlet and outlet constant.
The theoretical model of the dieselprocess and the description of the main parameters will be described in
chapter two. The turbochargers will be described in the chapter three and four. In chapter five the model for the
exhaustpipe will be examined. The dimensional relations are explained in chapter five point five. The statistical
model of the dieselengine is described in chapter six. Finally in chapter seven a proposal is made for the model"Subdiesel".
I wish to thank the following persons from here for their advice and help :S.F. Sipkema, ir C G J M. van der Nat, E. pel , ing 0. van Lent,prof J. Klein Woud and prof D. Stapersma
410-
T U DelftVakgroep OEMO
2..
2
3
3'

2 Seilinger process
2.1 seilingerprocessIn this chapter the seiliger model of the combustion process will be used to calculate the pm, as a function of
basic engine parameters. It is shown that on the basis of the available data the results from the seiligerprocess show a large deviation of the real data. This makes the seiliger diagram unusable for use in the model.
The relevant parameters which influence the power drop due to submarine conditions are isolated. These
parameters will be used in the following chapters to calculate the engine derating. The expectation is that the
seiliger diagram although not giving good results correctly shows the trends.
Vs V
V cl 6 T2
V2
4
= -
041TU DelftVakgroep OEMO
Win(1-2) = cv (T2 - Ti)
p( max)
p(vul)
p(omg)
3
8
5
1r
6
assumptions figure 1, seiliger diagram
Ideal gasproperties : PV=mRT
CP and C are constant
The medium is air during the whole process
isentropic compression and expansion
P = constant
-1- V" = constant
V : specific volume (m3/kg)
px. : pressure (pa)e : compression ratio (-)T : temperature (K)
K : ratio of specific heats (-)
1-2. Isentropic compression of air
11.
-

2-3. Heat supply with constant volume
dr'3 =aP2
V3
V2 -
3-4 Heat supply with constant pressure
P21- =P3
V cl= bvl
4-5. isentropic expansion
P4 C V5 E
Ps ) V4 b
T4 b
T3
T1-45 =
5-6 Opening of the exhaust valve, pressure drops to level of exhaust receiver. cloui(s_i) = c,T,(a
6-7 Outlet stroke, removal of exhaustgases
7-8 Closing of exhaust valve, opening inlet valve
8-9 Inlet stroke, filling of the cylinder with fresh air
Theoretic efficiency of the seiliger process is given by
Woui - Win Q2-3 + Q3-4 Q5-1nth,seiliger
`-d toe Q2-3
invullen van (2- 3), (3 -4), (5-6) geeft
ab" - 111th,seiliger 1 K-1r/ra 1) + Ka(b-1)1
Mean effective pressure according to seiligerdiagram is given by
Wth Wout Win
WthPth
Vs
PthPi VI Wth
Vs
invullen van (2- 3), (3 - 4), (4-5) en (5-6) geeft
E 1 [Pth = JD I -1 i(a - 1) Ka(b - 1)1 - lab" - 111E-1 K - 1
zie stapersma [1994]
qin(2-3) = Cl/ Ek 1(a - 1) WHY
q,(3_4)= K - 1) Wout(3-4) (K - 1) cv T, e" a(b -
5
qin-out
Ahoy
TU DelftVakgroep OEMO
W0u1(4-5) - Cv T1(e'lab - ab"
=
= -
=
T1
+
:
+Q3_4
b =

2.2 Parameters of the seihgerprocess
There are two basic parameters of the seiligerprocess which determine the shape of the combustiondiagram.These are the a parameter and the b parameter, together with the engine dimensions (such as cylindervolume
and compression ratio) they determine they whole process completely. The reason to choose the a and laparameters for classifying the process is that certain engineering choices can directly incorporated in theparameters (such as maximum pressure). In this chapter the change of these parameters is examined forsubmarine conditions in order to find the derating of the engine. It is clear that one can never find the precise
derating, there are just too many parameters that can be adjusted. The engine manufacturers often have very
different solutions which makes it difficult to predict the engine derating just from global data. What can be
predicted is the way different manufacturers have (probably) chosen to come to an optimum submarine en-gine.
In the seiliger process the parameter a can be written as : a = PRIM('
P2
with P2 = Pi.EA
leads to a P max
with pl = inlet pressure (pa)
c = compression ratio (-)1( = ratio of specific heats
The calculating of the a parameter in this report is based on the following considerations
The number of possible variations between maximum cylinder pressure (print), compression ratio () and theinletpressure (p1) is too large, thus a simplification is necessary.
The submarine engine has to run under both normal conditions and submarine conditions. The most impor-tant running condition is the running under water. lids logic that the engine is optimally tuned for that condition,If the engine is running at normal atmospheric conditions then the ratio between maximum pressure and inletpressure has to drop because otherwise the maximum pressure will be to high. This change in ratio can beachieved by different injection timing
The only problem is that the process shape can change very considerably when the inletpressure changes.If the inletpressure is too low, there is a chance that the maximum pressure cannot be reached with themaximum amount of fuel that can be burnt in cylinder.
The above means that we have three choices for calculating the a parameter (and power) when the inletpressurevaries :
Maintain a constant a parameter = pmax is dependent of pinMaintain a constant pmax = a varies with pri
A combination of point one and two, for certain p constant pmax is maintained and for other p, a constanta parameter is maintained
TU DelftVakgroep OEMO
6
=
1'.
2.
.3. a

2.3 b parameter.The b parameter can be derived in three ways, the Way that is most meaningful is through the air excessfactor.
The b parameter can also be calculated with
The maximum temperature in the cylinder (T3)
The ending pressure p5 (when the exhaustvalve opens).
The disadvantage of these parameters is the short time period in which they occur. The maximum temperature,
for example occurs only during a very short period and is hardly a constraint for the process. The endingpressure falls to the exhaust pressure as soon as the exhaustvalve opens.
Another reason is that the maximum temperature and the ending pressure are not clear parameters. the air-excessfactor is a more logic choice.
When the air excess factor is chosen as parameter lb can be written as :
1 Hob = 1 +
Ka
Stapersma [1994]
with = specific heat of air (J/kgK)
= air excess factor (-)= stoichiometric air/fuel ratio
Ho = heat of combustion (kJ/kg)E = compression ratio (-)
= ratio of specific heatsT1 = entrance temperature of the air in the cylinder (K)
= VI/Vi
The b parameter depends on a, A. and T1, %all other parameters are engine dependent and are independentof the inletpressure.
T1 is also taken constant; in many cases an intercooler will be applied between compressor and inletvalve,which ensures a constant inlettemperature.
The air excess (A.) factor must be held above a certain value in order to avoid smoke forming and ensurecomplete combustion. The air excess factor is taken to be a constant, this is a choice made to minimize thenumber of parameters which influence the engine derating. In practice the engine manufacturer decideswhether the air excess factor remains constant or notThe a parameter is discussed in the paragraph before.
The flow factor cannot be determined exactly without extensive numerical calculations. According to Stapersma,[1994] the flow factor can be taken 0,85-0.90 under submarine conditions and close to one under normalatmospheric pressure. The problem is that the change of the flow factor against the change of the inletpressure
and backpressure is not known. If we assume a constant backpressure (see chapter charging ) then a lineardependence is assumed.
T U DelftVakgroep OEMO
:
2.
T
7
..

2.4power
In this chapter the relation between the seiligerdiagram and the environmental conditions is explained.It is clear that the seiligerprocess is only accurate if all the parameters are exactly known, in this report this is
not the case. In this chapter a hypothetical engine is considered, only kwalitative effects are generated.
The relevant parameters for the mean effective pressure turn out to be the inletpressure, a-parameter and
b-parameter.
We define two main parameters . pin and the flow-factor. Furthermore we define a number of scenarios, that
represent the different engineering choices and process that can happen during the environmental changes.
pmax = constant, flow-factor variesa=constant, flowfactor varies
point one and two but with constant flow-factor
The formulas of the seiliger process are given by
Stapersma [1994]
ab" -111 th,seiliger 1 _ [(a - + Ka(b -1)1
The parameters used for calculation are
b = 1 +1
tc-a
8
risr., Ho
(A.,ae"-li Co
41500 kJ/kg
0.713 kJ/K1 6
14.5
13.5
1.4
bar
T U DelftVakgroep OEMO
a = PmaxEA'
p1
P tri =E \
E-1 K1)[(a- +K-a -(b - Pme = 17m.17td.77c.1lN.qdAll
with p1 = inletpressure (after compressor) (Pa)%
sP= fill efficiency (-)= compression ratio (-)= ratio of specific heats (-)
'nth = theoretic efficiency (-)a = constant (-)
= constant (-)
nm = mechanical efficiency (-)
lltd = thermodynamic effiency (-)/lc = combustion effieciency (-)
= heat loss efficiency (-)
Tlw* = thermodynamic efficiency (-)
IlIh = theoretic effeciency (-)
= heat of combustion
cv, = specific heat of air
= air excess factora = stoichiometric air/fuel ratio
= compression ratio
= ratio of specific heats
= flow-ratio
ID = inletpressure
ith.sethger = theoretic efficiency
:
:
1
=1)1
K
b

. All the parameters were the same for all the calculated engines.The calculations are done to investigate the influence that the different parameters have on the engine effi-ciency and engine power.
The inletpressure is varied between one bar and five bar, these are values that can occur in a charged subma-
rine. The flow-factor is arbitrary varied between 1 (five bar inletpressure) and 0.8 (one bar inletpressure).
On the next pages the following different scenarios are investigated
a parameter with constant Pmax
a parameter constant (reference worst case)
constant flow-factor
.A factor that arise from the figures is that the power delivered according to the seiligerprocess is much too low
in comparision with real engines For example the MTU1163 has the following propertiespin = 5,1 bar
pme = 29,4 bar
pmax = 180 barHo = 42000
efficiency =041
The seiligerproces with the same parameters gives
= 22,66 bar = 30.43 barpme pme
The calculation with I = 1,1 gives a much better result but as the pme of seiliger process is already too large,the mechanical losses decrease the pme with 20%. Then the result deviates even more
The seiligerprocess gives a pme that is too low. The tuning of the seiligerpocess is very difficult becase thedifferent parameters influence each other. The tunable parameters are
flow-factor
compression ratio
air-excess factorinlettemperatureHo
pmax
From these parameters the inlettemperature, pmax and Ho are more or less fixed. This leaves three param-eters
flow-factor
compression ratio
airexcess-factor
To find the correct combination of parameters is very difficult. The conclusion is that for a simple model theseiliger process is too complicated and gives very little extra information. The seiliger process is useful fortrend .analysis to investigate the influence of differenent environmental conditions
In the following pages a analysis of the influence of the different choices is made using the seiliger process,wich targets at an algorithm for calculating the powerdrop due to the submarine conditions.
9
it*TU DelftVakgroep OEMO
efficiency = 0,52 efficiency = 0,48
a =1,09 a =1,09b =3,00 b =3,93flow-eff = 1,00 flow-eff = 1,00
air-excess = 1,61 air-excess = 1,1
:

2500
2Q00
1503
1003
5,03
0,03
2
engine power selliger
3
pin (bar)
figure 2, power according to seiligerprocessflow factor varies
flow factor
5
figure 4. engine power according toseiliger process, flow factor
flowfactor.is varying
p max = =Canta - constant
10
Q06
0.64
0.54
efficiency ot the seillger process
2 a
pin bar
TU DelftVakgroep OEMO
PTIOX = metal
a., =dart
figure 3, efficiency, according to seiligerprocesflowfactor varies
s constant
figure 5. engine power according toseiliger process, flow factor =1
The constant a parameter is calculated with inletpressure 5 bar and maximum pressure p, bar. For thetables see appendix table A.
The influence of the choice on the a parameter is small for power delivered by the engine but the effect on theefficiency is relative large.
From table A follows that the b parameter for Pmax = constant is less then one for low inletpressures, this is in
reality not acceptable. To get a b parameter that is higher then one the maximum pressure has to be lowered.The flow factor has only a marginal effect on the power, the basic characteristics remain unchanged. The
constant flow factor has a effect on the efficiency, this drops from 0.56 to 0.54 at the worst conditions. Theconclusion is therefore that the flow-factor has little effect on the power of the engine (calculated with theseiligerprocess) with changing inletpressures. On the next page this will be closer examined.
engine pater wager efficiency d U seiligar process
25.00 Qffl
Q6420,c0
QI3215,03 castepmax = cambial
a =ccnsiart
.o0E0
67.a = censtal
10.03
QS3
5000,ffi
QCO0.54
2 3 4 5 2 3 4 5
pin (bar) pin bar
4 5
OW

From the literature the following formula can be derived
piH
0.0427 Ai PiX L,,,
Met . Hu = energy kcal/kgI = air-excess factor (-)r = density kg/m3
I = flow factor INh = efficiency (-)
The formula gives the pi as a function of six parameters. All the parameters influence directly the pi. Theseiligerprocess must give the same relation, see figure 6 If figures 3..5 and 6 are combined, it becomes clearthat the flow-factor doesn't inlfuence the shape of the process very much.
Difference between direct flow-factor and calculated
increasing pressure
figure 6. difference in flow-factor calculatedwith seiliger or through direct calculating
Fortunately the seiliger process gives a direct connection between flowfactor and engine power. The onlything that is left is to determine the power drop (with constant flow factor this time) as the inletpressur changes.The effiency is very dependent of the choice of the a parameter. If a=constant then the effiency is 0,54 andindependent of the inletpressure. If pmax=constant the effiency varies between 0,64 and 0,54, if all other Ilosses are taken into account then the effiency varies between 0,51 and 0,41. wich are normal values for thiskind of engines. In the model the efficiency will be a constant, eventually the efficiency can be made depen-dent of the inletpressure but this has little effect. The reason is that the efficiency is very sensitive to engineer-ling choices which are unknown at this moment. It is the same problem as with the calculation of the meaneffective pressure.
11
1,00
0,80
0,20
0,00
Acky
TU DelftVakgroep OEMO
pmax = constant
a = constant
flow factor
0,02
0.01
10,0/
-0;02
-0,02
-003
-0,03
0,60
0,40

25,00
20,00
15,00
10,00
5,00
0,00
power-pin
figure 7 linear regression of the powerdrop with theseiligerdia gram, for data see table A
The following formula can be derived for the relative loss of power :
Apm, = a AP' +C
with a = mean of all the trend lines
a =4.32
y = pmi (bar)
x = inlet pressure after compressor (bar)
The theoretic efficieny is taken as the mean value between the values of a=constant, (flow, vanes and flow =
constant) this gives a values for the efficiency of 0.55, this is dependent of the values of a
2.5 ConclusionIt has been shown that in this particular case the seiligerdiagram is not the right calculating method for the VieThis has two reasons
There is not enough data to "tune" the seiliger process correctly.
For the determination of the dimensions of the engine it is enough to know the pme, using the seiligerprocess introduces more unknown parameters then the one has in the beginning (pale).
To determine the influence of the environment the seiligerprocess is successfully used to determine the influ-ence of the inletpressure with different assumptions. It has been shown that the power of the engine is linear
dependent of the flow factor (this in contrary with the opinion of some people). A formulation is derived tocalculate the influence of environmental conditions on the power.
12
if- variabel,pmax=constant
if= vanabel, a =constant
ff=1,
pmax=constant
If = 1, a=constant
y = 4,3907x - 0,1272
y = 4,5051x - 1,4138
y 4,091x + 1,8173
y 43161x + 1E-14
ITU DelftVakgroep OEMO
FATrill1 2 3 4 5
pin (bar)
:
=
3 Turbocharging
3.1 mechanical driven turbocharger
In the following chapter a simple model of a mechanical turbocharger is explained. For the final model data
from Pielstick is used. The turbocharger model will be used to explain the characteristics of this data. Only the
two relevant parameters from the previous chapters are used, inletpressure and flow-factor.
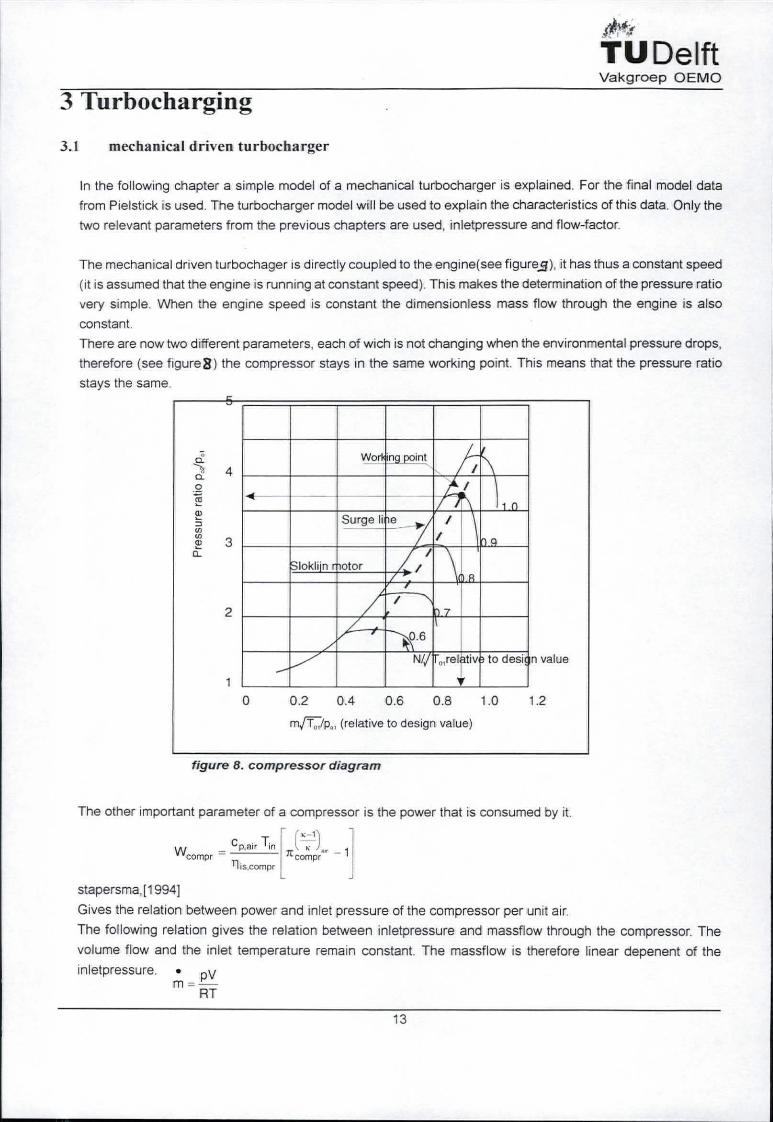
The mechanical driven turbochager is directly coupled to the engine(see figures), it has thus a constant speed
(it is assumed that the engine is running at constant speed). This makes the determination of the pressure ratio
very simple. When the engine speed is constant the dimensionless mass flow through the engine is alsoconstant.
There are now two different parameters. each of wich is not changing when the environmental pressure drops,
therefore (see figure 8) the compressor stays in the same working point. This means that the pressure ratiostays the same.
inletpressure.
0.2 0.4 as 0.8 1.0
mrrjpo, (relative to design value)
figure 8. compressor diagram
The other important parameter of a compressor is the power that is consumed by it.
C ,ir T.VVcompr = in
fl is,compr
stapersma,[1994]
Gives the relation between power and inlet pressure of the compressor per unit air.
The following relation gives the relation between inletpressure and massflow through the compressor. Thevolume flow and the inlet temperature remain constant. The massflow is therefore linear depenent of the
pV
m PT
co- -1mpr
13
of,TU DelftVakgroep OEMO
Wo ng point Ank
.4
r41rmooIjallilln'
NIlokli n otor
Eirdaki3.6i,rellativ
Y
to desi
a: 40CD"
E/3-
3
2
1
n value
1.2
I

Combining the two fomulas gives a linear relation between the inletpressure and the powerconsumption of thecompressor. The only problem is powerconsumption of the compressor at iso conditions. P ielstick gives for the
powerconsumption at iso conditions about 1/3 of the normal engine power, for an engine of 1000 kW thepowerconsumption will be 300 kW.
cooling A
intake air drum
figure, 9 Schematic drawing of a mechanical turbocharger arrangement :
In practice the mechanically driven turbocharger is oversized to obtain a nominal power at low inletpressures
and high backpressures. The extra inletpressure is at iso inletconditions, blown off to prevent damage to the
dieselengine. This is a waste of energy because the dieselengine is running mostly close to iso conditions anddoesn't need the large compressor.
The following discussion is based on data received from PIELSTICK. Pielstick engines obtain a higherinletpressure than the pressure needed for 100% power output and good filling of the cylinder. This causes aslightly higher fuel/air ratio than necessary in normal conditions.
At high backpressures the difference between the inletpressure and the backpressure is becoming so low thatthe cylinder is no longer completely filled with clean air due to the bad fill-factor. At a certain moment thebypass valve is completely closed and the inletpressure will drop linear with the suction pressure. This results
in a drop in power. At lower backpressures the fill-factor is better and the whole process is delayed to lowerinletpressures.
1000 mho,-
2100 mbar
clurton alboaskrep
Tvu/olluX poievord door compressor
%magma,' dliftverschre stayue sle;14.71ure Kahn()
vocr 100% wflflTh,r,)
figure, 10 powerdrop with mechanical charger
14
TU DelftVakgroep OEMO
% power100
90
80
70
60075 0.80 0.85 0.90 ass
pox= 1400 mbar
/ 1800 mbar
mechanicaldriven turbo
exhaustdriven turbo
1 PO (bar
figure, 11 powerdrop according to Pie/stick
cooling
I I
0 0 0 0 0 0
intake air drum
oxhaustdrum'

The pielstick figure shows this effect very well. The 'delayed derating as the backpresssure is lower. This is a
possible explanation for the observed power characteristics. However it depends also on the choices made by
the manufacturer. The lower boundary of the inletpressure ( approximately 0,76 bar dependent on the of type
compressor used) is set by the stalling of the compressor and the minimum pressure which is still safe for the
crew. Stalling of the compressor must always be avoided because it can cause allot of damage to both theengine and the compressor itself.
The fill-factor acts here as a feedbackloop through which the backpressure influences the process.
Note The engine power is not the generator power. In the PIELSTICK figure only the bruto brake power isused The engine delivers more energy to the generator under the worst conditions then under the normalconditions this is due to the less power consumption of the compressor.
For the mechanical compressor calculating the following modelsetup is proposed
1 compressor power consumption is x% of the nominal engine powerpees is the desired engine power
The compressor power is linear dependent of the inlet pressure according to the following fomula
Pin 0,Pcompr compr,iso
Po
4 Backpressure effects are neglected
This gives for the total compressor model .
install (
Pumw))
xPin)
Pdes
1-Po
etle,F' -
1 P'1- X
P !kW) power to beInstalled
p,, (bar)
(kW)
figure, 12 compressor model
15
otitr
TU DelftVakgroep OEMO
with = engine power that must be installed in the submarine (pme)
Pdes = desired engine power (Pm)p inletpressure before compressore (bar)po normal inlet pressure before compressor (bar)
2
=

turbocharger 2
'V
turbocharger 1
,
VItncooling
MN
ty.sealing air
intake air drum
D00000exhaustdrum
I
0 0 0 0 0coolingA A1_t__+__t_i
Intake air drum
figure, 12 Twin turbocharger arrangement, (Pie/stick)
Pielstick offers a different solution for the supercharging problem. To avoid the need for a large oversizedcompressor which takes a lot of power, two different turbochargers are used in serie. One is the conventional
mechanical driven turbocharger and the other is a exhaust driven turbocharger. Together they deliver enough
pressure for the engine to be running at full load. The main advantage is that the energy which is in theexhaustgases is now used. This has the effect that the mechanical driven turbocharger can be much smaller
and more of the engine power can be delivered to the generator. The system has also a major drawback, the
influence of the backpressure is much greater then with only a mechanical driven compressor. But the engine
will mostly run under "normal" conditions, the effect of the high power drop is only experienced during shortperiods of time (starting, influence of waves).
In the figure the characteristics of the mechanical compressor are clearly visible (see previous paragraph). The figure is
given purely for information, no attempt is made to explain it.
10
figure. 13 Engine characteristics with double charger arrangement
16
'T'U De ftVakgroep OEMO
auo 050
I I
I I I

4 exhaustgas driven turbocompressor
The exhaust driven turbocharger is without special preparations not suitable for submarines. As the graphs
show that even at low backpressures the power falls rapidly. In this chapter a simple theoretical model will be
compared with data given by engine manufactures. It appears that the simple model cannot explain the char-
acteristics of real engines.
The following configuration will be considered
The exhaustgas driven turbocompressor is far more complex than the mechanical driven compressor. The
mechanical driven compressor has a fixed (known) speed, since it is directly coupled to the engine. Theexhaustgas driven compressor has a rotational speed that is determined by a balance between the compres-
sor, engine and the turbine. Also in opposite to the mechanical driven compressor the exhaustgas drivencompressor has no fixed compression ratio. The compression ratio depends on the suction pressure,outletpressure and the engine performance. These points are the reason that, for a given environment andengine speed, a matching procedure must be performed to find compression ratios, inletpressures and turbine
speeds of the turbocharger. For every change in environment, an another matching must be performed. This
implies the knowledge of turbine and compressor characteristics, and also of the characteristics of the diesel-
engine. It is clear that this is a very time consuming procedure, and it depends upon the availability of the
characteristics of the different parts.
According to stapersma,[19941 the pressure in the exhaustreceiver can be considered independent of thebackpressure and the inletpressure. Also temperature effects can be neglected. The following calculations are
based upon these assumptions.
This is a very great simplification of the process to avoid iterations.
For the pressure ratio of the turbine and compressor the following formula can be derived Stapersma,[1994]:
r )
frcomp 1 + Rm 82 nis.comp 77is,turb r
17
1-ii
figure, 14 ex-haust chargerconfiguration
k -1)A" )6
turb
= air
= exhaustgas
410,/f4
TU DelftVakgroep OEMO
with = temperature ratio c/torng (K)
= mechanical efficiency (-)82 = lossfactor (-)
= value dependent of turbocharger system (pulse or equal pressure system)
= isentropic efficiency of the compressor
= isentropic efficiency of the turbine
= ratio of specific heats
=

When the calculated values and the data given by MTU are compared figure 9 emerges
The MTU data is calculated with the given powerratings instead of inletpressures but the powerrating is linear
coupled to the inletpressure. It is not completely correct but itis good enough for a comparision (ratios aredimensionless)
1,00
C0.900.80
0.700,60
T.; 0.502 0.40
0.300,200,100.00
Inletpressure reattive to normal conditions
1.5
pexh after turbine rn bar
2
18
- pin calculated
-"pin" tvITU
-Pohinoom Cain'Mn))
y = -0,5048x 1.951952 - 2,5221e2.075
figure 15, relative powerdrop calculated and given by MTU
The calculation has been done with the following parameters3
=162 =1
=1=0.9scorn
=0.9slur
=1.4
Pback = 2.0 bar
The MTU data has been calculated using the engine power under different environmental conditions.
It is clear that the method of a fixed exhaustdrumpressure is not very accurate
MTU has a very good backpressure performance and almost a behavior of a mechanical turbocharger. The
disadvantage of this good backpressure performance is the very large powerdrop this constitutes. If we com-
pare a normal MTU396 12V engine to a submarine variant, a powerdrop of 50% is visible (see figure 17 and
figure 18 at next page). The efficiency of the engine is not severely affected, the derating must come from lessfuel injection.
For the model the calculation of the power drop is based on MTU supercharging characteristicsIt is not very accurate to take only one source for a complete model. but the MTU engines are very goodengines. This means that futher engines from other manufacturers will perform similar to MTU engines.
The behavior of the engines with changing inletpressures as almost the same as the mechanical chargers.For the model see page 19.
TU DelftVakgroep OEMO
-
:
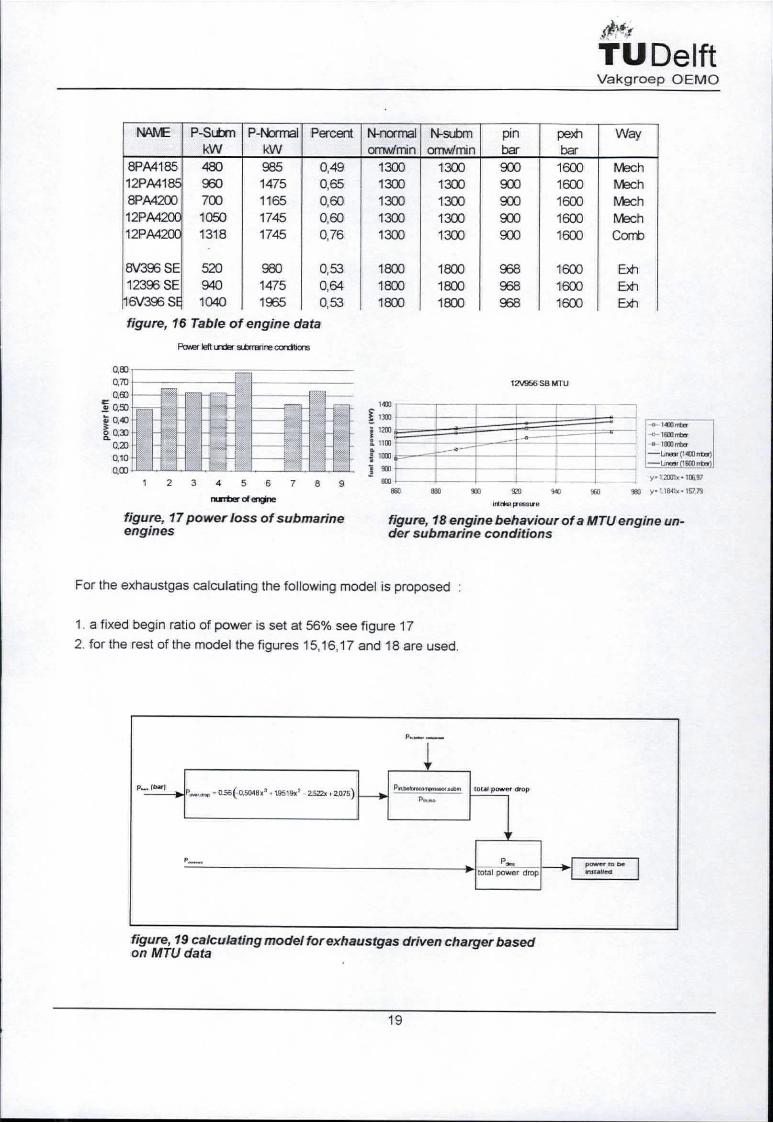
figure, 16 Table of engine data
Pork* %tinder sixrprire conzi9cris
I2V9S6 se MTU
0.20
0,10 1
0,00
1 2 3 4 5 6 7 8 9
nutter engine
figure, 17 power loss of submarineengines
figure, 19 calculating model for exhaustgas driven charger basedon MTU data
19
.00-f
T DelftVakgroep OEMO
o- 1430 rrbl1500 nta1893 oto
Lwow (1400 rrter)LAD. FOOD*
12001x 106,97
lbari- C36( D,5046 13519x2 2 5x 2075
total power droppow, to beIntlelfed
NAME P-SubmkW
P-NbmIalkW
Percent N-normalomw/min
N-submomw/min
pinbar
pextibar
Way
8PA4185 480 985 0,49 1300 1300 900 1600 Mach12PA4185 960 1475 0,65 1300 1300 900 1600 (\itch8PA4200 700 11E5 0,60 1300 1300 900 1600 Mech12PA4200 1050 1745 0,60 1300 1300 900 1600 Mech12PA4200 1318 1745 0,76 1300 1300 900 1600 Comb
8V396 SE 520 980 0,53 1800 1800 968 1600 E4-1
12396 SE 940 1475 0,64 1800 1800 968 1600 Den16V396 SE 1040 1965 053 1800 1800 968 1600 Exh
`4J
390
200
100
000
900
,
.l000 .. _.
(_____860 660 900 920 943 960 980 y. 1 I841x 157 79
int cow Reamer
figure, 18 engine behaviour of a MTU engine un-der submarine conditions
For the exhaustgas calculating the following model is proposed
a fixed begin ratio of power is set at 56% see figure 17
for the rest of the model the figures 15,16,17 and 18 are used.
PkvIninracnrnpmsor.subm Coral power drop
P4"
0,70
1.
.2.
-0-

5.0 Diameter of the exhaustgas pipe
Assumptions : 1. completely turbulent flow Re » 2000stationary situationcirkel cross diameter
The following configuration will be considered see figure 13
figure, 19 exhaust configuration
The different friction parts are 1. straight pipe, lenght L, Diameter D kw :see figure
two 90 degree bents (sharp) kw :1,30one ball valve (open) kw : 0.05entrance loss kw 0.05
The total friction is calculated in the following way
Ap L 1 2 n=4f--v + 1v2D2 w2
with =,friction coeffient pipe -
L = lenght pipe
= diameter pipe
exhaustgas speed m/s
kw = friction coeffient
=pressure bardensity kg/m3
20
TU DelftVakgroep OEMO
5. exitloss (confined) kw : 1
This configuration can be altered for other pipe lay outs.
Pipe roughness E :
Aluminium : 0 (smooth)
Wrougth iron : 0,05
Iron : 0,12
Galvanized iron,steel : 0,15Cast iron : 0,25
:
:
:
v' =

The speed v can be calculated with
Volumestroom 4Vv =7CD2 frD24
But the diameter is unknown, an interation must be performed to obtain a solution.
D can be calculated with, the following iteration
figure, 20 calculation model of exhaustpipe diameter
The beginparameters are
'V = volumeflow through the pipe. m3/s
P 7 density of the exhaust gases kg/ma
= kinematic viscosity -iE = roughness of the pipe mm
allowable pressure drop over the exhaustpipe ti
The diameter DP has a guessed beginvalue,
The parameter D As during the iteration adjusted until the correct pressure drop is found. At the end of thelinteration the diameter found must be checked to correct values that are too high or too low.
note : the diameter found (is without isolation around the pipe !
211
TU DelftVakgroep OEMO
Vp,c,rti4V IL 12 n4f Ap =Ap desired ?D2 Dv 2 171 2
I Re= pvDRetail
It =fcn(Re,
=D
correction D
:
:

Friction factor for flow in tubes
0.10.0
0.0
0.0
0.00.01
0.00.0080.006
0.004
0.002
0.0015
0.0010.00080.0006
102
figure, 21 friction coefficient
For a complete resistance calculation the valves can be taken into effect (Kw is the friction coefficient).The friction coefficients for the different valves are given in the table below.
ball valve
gate valve
glove valve
T junction
pipe entrance
pipe exit
25 30
K, I 486 206
open
open
9
sharp rounded
0 1 0
-07-
k.,1 1 3 1.5 1.0 0.4
free yet confined yet
kink
40 60 80 90 1 00 140
figure, 22 friction factors of additional appendages
22
TU DelftVakgroep OEMO
MMENtail SIIIIIECIIII....am=mom MINE111.1 =L1:011111
Itt
......mmmui11INIMMIRMIIIIIIlmanual
1.....0.1...2
Omni.Pc
IMUINIMENMINIMUM NIIN
imMMEINIMInr
Nun=.......au
MlaillildlIMM7111111111111111111111111111111111111111111su 'n=Emu
=sunmumI Iiiir
ilmlin NEM nulllow 5-
-,i,111111
NW independentf/2 of Re 11111 11/11/11roughness
relative
t 5
1,111 mil,,,,,,
==-2100IIII i fill111111..._-=.,..............N.--....111111111110111101=.11111111NM
.Zi-.7.4=-74Z
MilMMMEIMEMIHOMMIEMMIN 0.05
- laminar /lowmorimmumaior.
nun11111111W1111114-1"-1111111KIIMITM..".;
IMMUMUNI/1=1*FitrativmmillIMUNIMINIIMIMIE7-!-eniirar..iiimmorsiOn
-1.'""%!ER-....malmsmr.,.......0...,Talarmarmararn
MIsomirammmen
',W-airmaii.......aunno.......
MOP/
22 Lee-smums.
........i..-MOMS
0 OA08.01g.is' 8S 004
-"2
IINIM
111111 mInn!111111
Smooth Pipes InMg! 1.,..i,a.
mommiimilikisffilmrtme,
Ohal"'MMMEMNIT:=1:1111111101111.MMUUM
MiiiiiitaviiirimPP
....aiii11111111111111E-1-2
---=7.1
- roc...2,
ocz'onoTRe
MO =Bizullms =mum NMI MINIIIINIIII IIIIIIIMIIIIIIIIIIIl_t_l_ MIMMIIMMIIIII111111
40 SO 60 70 85 A
53 17 5.5 1.6 0.05 R
, D.13-50.131fl "
90
3/4 1/2 1/4 smooth bent
0.9 4.5 2.4
3/4 1/2 1/4 90 120 135 150 165
K I .30 050 0.26 0.11 0.0213 36 112
0.5 0.05
2 4 6 8 10° 2 4682. 4 6 8 10s2 4 6 810 2 4 6 8 10.
bents 45.1610ot/1 90.srnoom 90.snarp I80
K. I 0.35 0.75 1_3 1.5 11 2.431'861.26 0.980.74 0.14
104
0.2
K.

5.5 Dimension relations
In this chapter two important parameters for the determination of the engine dimensions are given, as well asthe formulas for calculating the stroke and bore.
Stapersma,[1994] defines two engine parameters
The 'Literpower defined by
Pe Pe NZ- - 6.60.000
The "Technology number" defined by
Pe Pe
ZA (52
with cm = mean piston speedA = cylinder surface
= number of cylinders
= nett brake power
Pm° = mean effective pressure
= speed
= 2 (fourstroke) and 1 (twostroke)
Vs = stroke volume
From these two numbers some scale laws can be derived. With the knowledge of p cm: the dimensionsof the cylinders can be calculated. Cm can be derived from the data given by the motorfacturers Cm is fairlyconstant. The mean effective pressure (Pm) can be calculated through the seiligerdiagram.After some rewriting the above formulas the following relationships can be found
stroke30 cm constantsIS =
diameter
Ahoy
TU DelftVakgroep OEMO
1 (Peg c.ii(Pea)pecm) Z ) Z )
stroke/diameter
r 1 111 Z
N Pe-8
The formulas are tested with some real numbers:, the values calculated and found in the data match good.
The liter power turns out to be a good parameter for analysing the engine dimensions.
23
and
:
=

6.0 Engine dimensions
Li widthThe data for the following figures comes from a database of 52 engines from 8 different manufactures. Theengines are only divided in different manufactures. Engines with 48,60 or 90 degree V-angle are present,apparently this makes no difference.
The width is defined in the following war:
The width of the engines can roughly devided into two levels (see figure 16).2300 mm
1500 mm
These two categories make 72% of the total.
2500
iI
Width
Ii
II
23:0
15:ID
0
v1
8:0 103D 1571D 210 2113
ergnespaad(r.pm)
figure, 24 width in mm
24
TU DelftVakgroep OEMO
, ,zr M1- CZ:, CO CD On N Un CO 4 .7,-- ...-- 1 N N C.1 CO CO
number of engine
figure, 23 width of engines in mm
N.- 0 CO ( CNCO cr cr
0 0 a
A---g°G-0
2000
500

The width is decreasing with increasing engine speed. This can be explained from the fact that for higherengine speed the dynamical forces also increase. This results in a increase in force levels on the crankshaft.
The auxiliary equipment can be placed inside or outside the V, in that way a constant width is achieved.
figure, 25 different engine arrangements
To obtain a good formulator the width, the connection between engine power and the engine width is examined in figure
A. The two width levels are clearly visible.
2500
2000
E 1500
1000
500
0
width
0 1000 2000 3000 4000 5000
power (kW)figure, 26 engine width against power
= MTU
PIELSTICK
= DEUTZ
SULZER
For power ratings below 2000 kW a width of 1500 mm is to be taken for the engine. Fora power range above the 2000 kW
both the 1500 mm level and the 2250 level can be chosen. Also for a engine speed below the 1500 rpm, the width must be
chosen as 2250 mm above the 1500 rpm the width can be chosen 1500 mm.
The engine speed can be used as a check on the width chosen in the power figure.Example : 1. Power : 3000 kW
2. Speed : 1900 rpm
From the power figure a width of 2250 mm is chosen, checking with the engine speed figure the width isadjusted to 1500 mm.
width = t 500 mm
figure, 27 model for calculating the width
25
wulth = 3500 mm
TU DelftVakgroep OEMO
BERGENME§ En lig
111 - WA RTSILAgmE MAN
PfkV/1
engine power no engine speed no
<2000 kw ? < 1500 rpm ?N /rpm_
yes yes

6.2 height
For the height The total height is taken including turbocharger and auxiliary equipment but not with the exhauSt-
pipe.
Figure 21 shows the height of a diesel engine is declining with the engine speed. The same explanationisvalid here as for the width. Also three different height levels are visible if we plot the height against the enginepower (figure 23). The three heigth levels are 80% of the total.
3500
3000
2500
E 2000
fs 1500.2 1000
500
0
1
IHeigth
hr
ii
r LC)!C71
LC) 0) CO N- tn a) CO f3/4-- rLfl C)0) N-CNI CO CO mr V' le) Lt) 4.0 CO' CO
engine number
figure, 28 heigth of engines In mm
3500, 30002500
Z. 200041 1500
1000.° 500
0
figure, 29, h,eigth against engine speed
26
en;TU DelftVakgroep OEMO
hieiEghBERGEN
WARTS ILA
VAN'
mTU
PIELSTICK
0 DEUTZ1000 2000
engine (r.p.m.3 El, SULZER
E
3000

Figure 29 shows that there are three different engine height levels.
First the power has to be selected. This gives the number of different levels for the height. Also it gives the
constraints for the height. Then the final height is chosen through the given rpm. If still a number of heightlevels is valid then the figures in the appendix Ill give additional constraints.
Pliter > 0,10 1. Height <2000 mmPliter < 0,10 2. Height >2000 mm
3500
3000
2500
2000
1500
1000
500
0
Heigth
0 1000 2000 3000 4000 5000
power (kW)
figure, 30 engine heigth against engine power
BERGEN
WARTSI LA
MAN
MTU
RIELST1CK
DEUTZ
SULZER
1,11,Pm_
engine power1000 kW 7
yeS
heigth few.:1800 mm
hergth level1800 Or 2700min
engine speed'< 7000 r pm 7
engine speed< f SOO rprn
Ye
yes
engine power<3000 kW 7
yel
holgth level1800 or 2700or 3200 elm
heigth o 3200 mrn
h .19111 2700 nlal
heigth = 1800 MM
figure, 30 model for calculating the engine heigth
heigth level1700 or 1100 men
27
sktfTU DelftVakgroep OEMO
Mttt $0 OP 132
Ei 121 MIL
00° IP
9
ril 1111
Four different power ranges can be seen in figure 301. Power <1000 kW 1 height level 1800 mm
2. Power 1000-2000 kW 2 height levels 1800,2700 mm3. Power 2000-3000 kW 3 height levels 1800,2700,3200 mm4. Power >3000 kW 2 height levels 2700,3200 mm
1. Speed <1000 rpm height = 3200 mm2. Speed 1000-1500 rpm height = 2700 mm3. Speed >1500 rpm height = 1800 mm
engine2000
ye
P1.14W1

6.3 length
This is the most difficult parameter, the engine length has only a slight dependence on the engine power.
Figure 23 shows a close relation of the length of the different engine types Unfortunately engine manufac-
tures make very different choices in the length of the engine, as can be seen figure 23. Two different slopes
can be identified. One consists of the MTU and PIELSTICK engines and one of the BERGEN and MANengines.
7000
6000
lit 50004000
3000
g 20001000
0
0
length
1000 2000 3000 4000 5000
power (kW)
figure, 31 length of the engine against power
BERGEN
WARTSILA
Ez MAN
- PIELSTICK
DEUTZ
SULZER
0.8
0.7
0.6
,tir? 0.5
0 4
c, 0.31 0,2
0,1
0
0,00
length
0,05 0,10 0,15 0,20
Pliter
figure, 32 length against Pliter/2
0.25
BERGEN
WARTSILA
ka MAN
MTh
PIELSTICK
DEUTZ
IL: SULZER
28
AttfT U DelftVakgroep OEMO
=;.
iIIIIIIIII
ea
II'
MTU
C
C

which gives the following fomula
Constraints
2 Minimum length = 2000 mm
3. Maximum length = 6000 mm
LZ B L = lenght of engine (mm)0,74 Z = number of cylinders
= bore (mm)
29
soitf
TU DelftVakgroep OEMO
1800
1 64GOO ,... i El MAN
c lc.7.,. 0 MT LIc .c.4 co
, 400...,
cl 200I
Ll PIELS TICKcco_
000..00 0,10 0,20 0,30
0 DELIT7
Filter El suLaR
figure, 33 length/number of cylinders against Pliter/2
If we look at figure 25, it appears that the length divided by the number of cylinder has a constant value, if Pliter
has a value above the 0,10. Below this value the length per cylinder has a much greater value. This is visible
in figure 23. Length is taken as a linear function of the number of cylinders with some additional constraints.
Length :
There are two different slopes visible in the power-length, see figures 31 and 33.Pliter > 0,10 slope: 400-600mm/cylPliter < 0,10 slope: 600-800mm/cyl
1. The (L-0,5*Z*B)/L value must lie between 0,6 and 0,7 with a most likely value of 0,63 (see figure 24)
0,74
LZ Ba
adjust 0 vntue between 0.80 and 0,60
figure, 34 model for calculating the length of the engine
length BERGEN
1000 n WAR ISLA
between no2000-6000 mm?
yes
V
L determined
Immi L
11.
2.
:

6.4 mass
Determination of the mass of the dieselengine
To get a good comparison: the mass of the dieselengine is divided by the number of cylinders. If we look at the
figure 39, it is clear that the difference between generator sets and propulsion systems is relative small. Engine
manufacturers give only very little information about the engine weight, it is not always clear wether the sup-
porting frame (of the generator set) is included or not.
In figure 35 a dependency is visible between Pliter and the engine weight as we set the weight per kW out to
Pliter. At higher Pliter (higher technology engines), the weight per kW decreases, as expected. This figure has
only one disadvantage, the variation is very small, but to calculate the mass this ratio has to be multiplied by
the number of kilowatts requested. This can easily be a multiplication 1000 or more; in this way a small differ-
ence can grow very large. To minimize this disadvantage the figure 27 was made. The mass per cylinder has
been related to the cylindervolume. The variation is larger but the multiplication factor is less than 20; theoverall result is a variation that is roughly the same as in figure 35.
For the final calculation of the weight both figures are used. For the calculation model see page 32, figure 40..
30
TU DelftVakgroep OEMO
14.00
F 12.00
-El. 10.00
IN 8.00
6,00
4,00
2,00
0,000.00
mass
0.05 0,10 0,15 0,20 0.25
Pliterfigure, 35 mass/power of engine against Plitert2
13 BERGEN
WARTSILA
MAN
CI MTU
PIELST1CK
SULZER
DEUTZ
cylinder volume
figure, 36 mass/number of cylinders against cylindervolume
2000
tt 1800
-=c 1600
1400
1200
1000
800
600
400
200
mass
BERGEN
WARTSILA
MAN
PIELSTICK
DEUTZ
SUI 7PR
MTh5000000 10000000 15000000
0

14W
12W
2,00
0,C0
16,0E+6
14,0E+6
12,0E+6
10,0E+6
8,0E+6
6,0E+6
4,0E+6
2,0E+6
C00,0E+0
ITTES
0.20
mass/number of cylinders
0,Z
Reaks1
Polyrcom (R3e431)1
y = 541.1:ee - 19a d1x 18.90B
Reeks1
Lineair (Reeks 1)
y = 6808x + 2E+06
-0,05 0.05 0,15 0.25
PI it er/2
31
Oltf
TUDelftVakgroep OEMO
figure, 37 determination of themean line
figure, 38 determination ofthe mean line
4t
0
*
8
I tee - 4,
:
0-
mass figure, 39 difference betweengensets and propulsion sets
44-o
2000
150 rgen s ets
.000propu Im
-50
0 5C0 1000 1500 2030
OW 010 015
Plilerr2
rreSS
441111

pow
er
Plit
er
Cyl
inde
rvol
ume
win
ner
of c
ylin
der,
no
Pin
ter
> 0
,175
7m
ass/
pow
er =
2.1
not v
alid
Pilf
er r
ange
mas
s/nu
mbe
r of
ryl
figur
e, 4
0 ca
lcul
atio
n m
odel
for
the
mas
s de
term
inat
ion
541,
6X's
190,
41 ta
t 113
,908
mas
s/po
wer
pow
er'm
ass/
pow
er)
num
ber
of c
yl'
-Om
-mas
t/num
ber
of c
yf
mea
n va
lue
mas
s 'k
g/
yes
tar
betw
een
OM
and
0.1
75 ?

7.0 Proposal for the model "Subdiesel"
bar
bar
bar
SW
redo calculation with different number of cylinders (even)
30cmS-
D4-8-1).(-6)spe-crs Z
5 anddetermined
056(05048 1.5e19s' 2.5221 2075)
PonsLallPau
11- )(Pk')Po
xmlornam ru,ron
33
rPre
Pe
cm
total power dna])
Par,total power drop
A
Ptechpe cm-
62
smfVU DelftVakgroep OEMO
Pliter - P0N660000
Ptech
P(kW)
P (kW/
Pliter
exhaust driven
power to beInstalled
power to beInstalled
mechanical driven
11 ). SAC
S/D between no1,0 and 1,2 7
yes
V
pme
CEOrnIs
iHO

mm
engine power<2000 kW 7
= 1500 mm
engine powerI 000 kW 7
yes
LZ B
nop.
p.engine power< 2000 kW 7
V
INJ
engine speed<I SOO rpm 7
width = 2250 mm
engine speed< 1000 rpm 7
engine speed< 1500 rpm
110
yes
no
adjust 0 value between 0.80 and 0.60
yes
L determined
nowidth 1500 mm
engine power< 3000 kW 7
heigth 7700 mm
Ofheigth = MOO mm
34
TUDelftVakgroep OEMO
heigth level1800 mm
heigth Jewel1800 or 2700m,.
belch level1800 oi 2700or 3200 mm
heigth /eve!2700 or 3200 mm
op heigth = 3200 mm
L between noZ000,6000 rmn7
SW
rpm
yes yes
width
IL
a
I

Cyl
inde
rvol
urne
\\13<
:\
kW
Fitt
er >
0.1
75 7
no
uses
res
ult c
alcu
late
d in
pre
viou
s m
odel
par
ts
inte
rnal
mod
el p
aram
eter
0pa
ram
eter
gvi
en b
y us
er
541.
6X-1
90,4
1x+
18,9
013
mas
s/po
wer
= 2
.1
not v
alid
Plit
er r
ange
mas
s/nu
mbe
r of
ryl
mas
s/po
wer re
sult
bloc
k
pow
er'
imas
s/po
wer
)
num
ber
of c
yi.m
ass/
num
ber
of r
yl
mea
n va
lue
mas
s fk
g)
yes
Nite
r be
twee
n0:
1-6
and
0.17
5

8.0 References
Friedhelm Oehler, 1967
Friedhelm Oehler : "Thermodynamische Untersuchung des Einflusses der atmospharischen Zustandsgrossen sowie
der auslegung der Abgasturboladergruppe auf das Betriebsverhalten von aufgeladenen Dieselmotoren" , Fakultat fur
Machinenwesen der Rheinisch - Westfalischen Technische I-lochschule, Aachen
Klein Woud, 1992
Prof. ir. J. Klein VVoud "Maritieme Werktuigbouwkunde I", collegedictaat mt210, Technische Universiteit Delft, Delft
Stapersma, 1994
Prof ii. D. Stapersma : "Dieselmotoren B", copieen overheadsheets i52a, Technische Universiteit Delft, Delft
Stapersrna, 1994
Prof ir D. Stapersma persoonlijk gesprek, Delft
Janssen, 1991
L.P.B.M. Janssen ; M.M.C.G. VVarmoeskerken : "Transport phenomena data companion". Technische Universiteit
Delft; DUM, Delft
VVisman, 1990
W.H.Wisman : "Inleiding Thermodynamica", Technische Universiteit Delft; DUM, Delft
Houtman, 1992
ir. C.J. Houtman 'Inleiding Gasturbines", Technische Universiteit Delft, Delft
Cohen, 1993
H. Cohen, G.F.C. Rogers, H.I.1-1 Saravanamuttoo ' Gasturbine Theory"; Longman Scientific &Technical, third edi
tion ; John wiley & Sons, New York
Beyer, Ulrich
ing. U. Beyer : "Technisches Handbuch Dieselmotoren": Veb Verlag Technik, Berlin
Akker van den, 1992
prof. dr. H E.A. van den Akker : " Fysische Transport verschijnselen I, II", Technische Universiteit Delft
4474,4'
T U DelftVakgroep DEMO
36
:
,

Appendix
37
out(
TU DelftVakgroep OEMO

Table A.
Calculating results of seiligerprocesa
n na wi ci so n: al .6 ai ci ,e2e, p- n me" g g
2 2 2 2 2 2 2 2 2 2 2 2 2 2 SI 2 2 2, 2, 2 2 2 Ta :hi 2 2 2, 2, La .2 , :Ar zOcitioriddoodcitiocidociaciaandriocicidoOddcicisioticicieSci
asIsi,:zazaistii 122 2 .7 2 P- 7- I -2 P g .7) ei 2 2 2 2 2 Et S t tt 2 t Sneannnninninnirineinnneinne:ninine4nerie: ----- - ninneeninnnnerin
31)
it 8.2.8.8-11.8.8. 8.8.8.2.118.8. 8.8.8.448.44"8:88.8."473:S.S.42-8.8-M8.8.4Es ------------------------- 7 7 7 7 7 7 7 7 7 7rt:
:t
.s.s.qed,P12);.1817.2.2Agszglg?:-...inisiir,r2g2grnArnIssr.-,222--.......000,00.s.2,-..i..7.4.-.4:..-cui.t.z..2.---6.;a0cmg;,-;;;;
.II222 22271$32222222GtOtS22222222S3S3S;2222222cicicicicicicidddciaddcldocicicicio dodo.° 00000n cannon
2rOtt g '8 7 2 71'2 2 4 tt? to; 2 2 Z3;2 I! g 2,2 2 St Pt t; ,14 2 2 2 .2 2 2 2- ----
6-6-.snz.grkaz.22.2.2.3.z7D.22a3.2figaiFIgzURRg:141graYA'aitlrn8.8.dd00000d0000000cidooddood000cc.-.
el el. elelo. el el ill el let in.. low," 1.2 " "'rine"' -n"nner, v. 5."2 n t 2 t t-":-": 2 2 ettt
N. N. N. P. .1 Pt N. ak n n to or o co el - err v.. = -etpepp.rnnn1nmrnr, 444444 pip* -
38
isp4.TU DelftVakgroep OEMO
2

1
Table B Calculating results flow factor
Att.'WU DelftVakgroep OEMO
39
difference I differenceok ok
flowfactordifferenceinteitiressitre-(Vei-Vt, ipower1
- "power2 power1 power2
1 4,03 3,57 5,11 4,32 0,79 0,83 oicri1,,1 4,50 3,95 5,65 4,75 0,80 0,83 0,0111,2 4,98 4,33 6,18 5,18 0,80 0,84 0,011,3 5,45 -4,72 6,70 5,61 0,81 0,84 0,0011,4 5,92 5,10 7,22 6,04 0,82 0,84 0,001,5 6,38 5,50 7,72 6,47 0,83 0,85 0,001,61,7
6,857,31
5,906,30
8,228,71 1
6,911
7,340,830,84
0,850;86
0,000,00
11;8 7,77 6,70 9,20 7,77 0,85 0,86 -0,011,9 8,23 7,111 9,67 8,20 0,85 0,87 -0,012 8,69 7,52 10,14 8,63 0,86 0,87 -0,01
2,1 9,14 7,94 10,60 9,06 0,86 0,88 -0,012,2 9,60 8,36 11,06 9,50 0,87 0,88 -0,012,3 10,05 8,78 11,51 9,93 0,87 0,88 -0,012,4 10,50 9,21 11,95 10,36 088 0,89 -0,042,5 10,95 9,64 12,39 10,79 0,88 0,89 -0,012,6 11,40 10,07 12,82 11,22 0,89 0,90 -0,01'2,7 11,84 10,51 13,24 11,65 0,89 0,90 -0,012,8 12,29 10,95 13,66 112,09 0,90 0%911 -0,0112,9 12,73 11,40 14,08 12,52 0,90 0,91 -0,01.3 13,17 111,85 14,48 12,95 0,91 0,911 -0,01
3,1 13,61 12,30 14,89 13,38 0,91 0,92 -0,013,2 14,05 12,76 15,28 13,81 0,92 0,92 -0,013,3 14,48 13,22 15,67 14,24 0,92 0,93 -0,013,4 14,92 13,68 16,06 14,67 0,93 0,93 -0,013,5 15,35 14,15 16,44 15,11 0,93 0,943,6 15,78 14,62 16,82 15,54 0,94 0,94 -0,013,7 16,20 15,09 17,19 15,97 0,94 0,95 -0,013,8 16,63 15,57 17,55 16,40 0,95 0,95 -0;013,9 17,05 16,05 17,911 16,83 10,95 0,95 -0,014 17,48 16,54 18,27 17,26 0,96 0,96 -0,01
4,1 17,90 17,02 18,62 17,70 0,96 0,96 -0,014,2 18,31 17,52 18,97 18,13 0,97 0,97 -0,014,3 18,73 18,01 19,311 18,56 0,97 0,97 0,004,4 19,14 18,51 19,65 18,99 0,97 0,97 0,004,5 19,56 1,9,01 19,98 19,42 0,98 0,98 0,004,6 19,96 119,52 20,31 19,85 0,98 0,98 0,004,7 20,37 20,03 20,63 20,29 0,99 0,99 0,004,8 20,78 20,54 20,95 20,72 0,99 0,99 0,004,9 21,18 21,06 21,27 21,15 1,00 1,00 0,0051 21,58 211,58 21,58 21,58 11,00 1,00 '0,00
-0,01
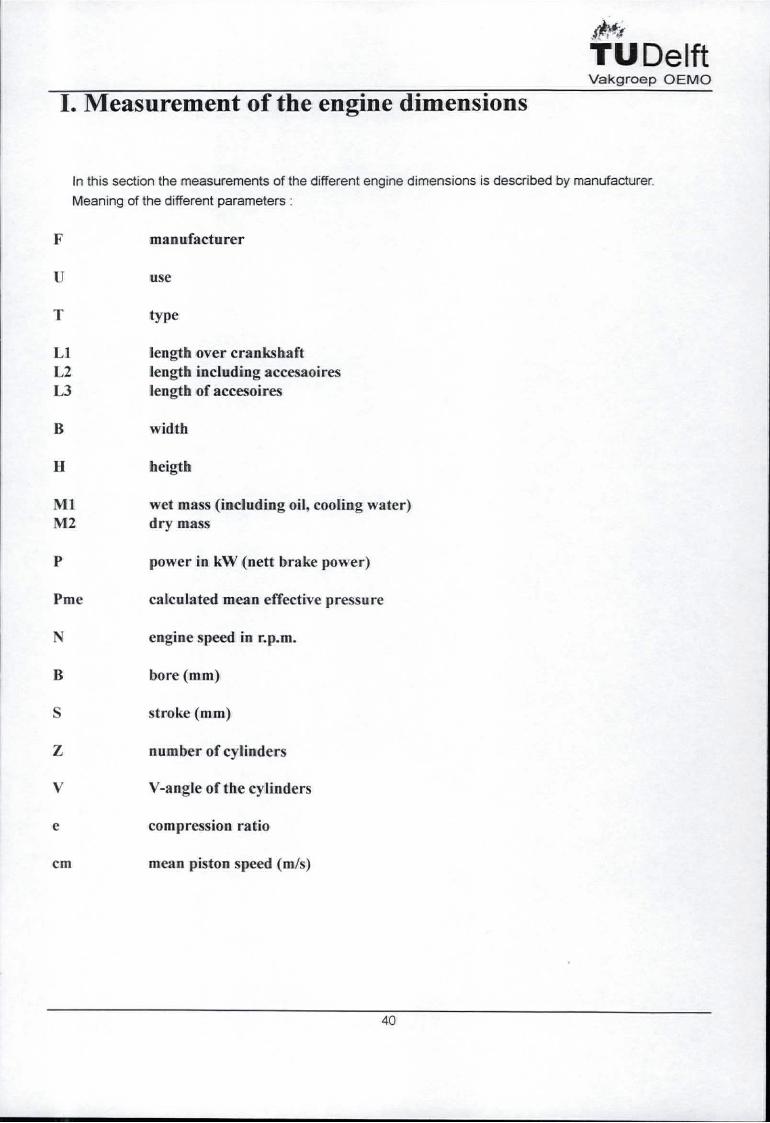
I. Measurement of the engine dimensions
In this section the measurements of the different engine dimensions is described by manufacturer.
Meaning of the different parameters
manufacturer
use
type
Li length over crankshaftL2 length including accesaoiresL3 length of accesoires
width
heigth
MI wet mass (including oil, cooling water)M2 dry mass
power in kW (nett brake power)
Pme calculated mean effective pressure
engine speed in r.p.m.
bore (mm)
stroke (mm)
number of cylinders
V V-angle of the cylinders
compression ratio
cm mean piston speed (m/s)
40
4*-tf
T U DelftVakgroep OEMO
H

11.
411
OttTU DelftVakgroep OEMO
Fabrikant "Type Lenote1 tente2 - 13-L1 Len. te- Breedte Hbogle2 Gewicht. mm mm mm mm mm mm Kenat)
Bergen Diesel Genset KVG-12 3675 4545 8701 3675 2320 3150 24000Been Diesel Genset KVG8-12 3675 4545 87011 3675 2320 3150 24000Bergen Diesel 875 4635Bergen Diesel 675I 4635Bergen Diesel Genset KVG-18 5115 5990 875 5115 2320 3120 34000
8751 51151035! 23651335; 28901335! 3765
I 2000I 2200! 2700
2001 3400Genset 150: 3800 1510
MAN B&VV Genset V16 20127 4150 4300 150: 4150 1510 2600MAN B&W Genset V18 20127 45001 4650 150. 4500 1510 2600
MTU Genset 12V595 1F30. di 3335 2835 1500 2600MTU Genset 16V595 1130 3930 3430 1500 2600MTU Genset 8V396 TE34D l'i- 2130 - 1630 1540 1530MTU Genset 12V396 TE340 2600 'L 2100 1540 1700MIL, Genset 16V396 TE34D 3060 2560 1540 1750
PIELSTICK Genset 6 PA4V185 VG 1105 1640 [ 535 1105 1450 1865'PIELSTICK Genset' 8 PA4V185 VG 1405 1940 535' 1405 1450 1865PIELSTICK Genset 2 PA4V185 VG ' 2005 2540 535' 2005 1450 11365. IPIELSTICK Genset 6 PA4V185 VG 2605 3140 535 2605 1450 1865PIELSTICK Genset 8 PA4V185 VG 2905 3440 535 2905 1700 1920'PIELSTICK Genset 8 PA4V200VG 14051 1925 520 1405 1575 1865'PIELSTICK Pro 112 PA4V200VG 2005 2525 520 2005 1450 1800PIELSTICK Propul 16 PA4V200VG 2605 3125 520 2605 1700 1865PIELS11CK Pro ul 18 PA4V200VG 2905 3425 520 2905 1700 1865PIELSTICK P I 12 PA5V255 2940 4060 1120 2940 1980 2620PIELSTICK Proput 16 PA5V255 3830 5140 1310 3830 2070 2870PIELSTICK Pro ul 18 PA5V255 42751 5590 1315 4275 2070 2870
Bergen Diesel Pro's 870 3892 2300 3160 216-cBergen Diesel Propul KVMB-12 ' 3892 4762 870 3892 2300 3160 21600Bergen Diesel Propul KVM-16. 4852 5727 875 4852 2320 3160 26500.Bergen Diesel Propul KVMB-16 4852 5727 875 4852 2320 3160 26500Bergen Diesel Propul KVM-18 5332 6207 875 5332 2320 3160 29073Bergen Diesel Propul KVMB-18 5332 6207 875 5332 2320 3160Wartsila Vasa Propul 8V22 2017 3052 1035 2017 2164 2600Wartsila Vasa .r1J 12V22 2797 4132 1335 2797 2088 2620Wartsila Vasa flu. 16V22 3577 4912 1335 3577 2088 2710
Deutz MVVM Propul TBD 604B V8 1533 1912 379 1533 1389 1875Deutz MVVM Propul TBD 604B V12 2113 2628 515 2113 1389 2035Deutz MVVM Propul TBD 604B V16 2613 31281 515 2613 1389 2035
SULZER Pro ul 12V Al25 3170 42101 1040 3170 2370 3150SULZER Pro ul 16V AT25 4090 5130 1040 4090 2370 3150
MTh Propul 16V396 TB84' 3550 3050 1480 1960RATU Pro ul 12V396 T894 3040, 25401 1480 1910MW Pro ul 16V396 T894! 3550 3050 1480 1960MTU Propui 8V396 7E94 2330 2830 1540 1520MW Pro I 12V396 TE94 2870 2370 1540 1600MW Propul 16V396 TE94 3430 2930 1540 1750MTU Propul 12V595 7E60"
.335 2835 1500 2570
MTU Propul 12V595 7E60 3930' 3430 1500 2600I WU Propul 12V595 1E90 339pf 2890 1500 2570i MTU Pro ul 12V595 1E90 3980 _ 2480 1500 2600
Wartsila Vasa Genset 1)025 V12 53 3425 2925 1510 2285 6600.Wartsila Vasa Genset UO25 V12 54 3425. 2925 1510 2285 6600Wartsila Vase Genset UD25 V12 55 342C- -- 2925 1510 2285 6600
I
Genset KVG-16 4635 5510 2320 3120 31000Genset KVGB-16 4635 5510 2320 3120 31000
Bergen Diesel Genset KVGt3-18 5115 5990 2320 3120 34000Wartsila Vasa Genset 8V22 2365 3400 2165 2360Wartsila Vasa Genset 12V22 2890 4225 2085 2665Wartsila Vasa Genset 16V22 3765 5100 2085 2665Wartsila Vasa Genset UD30 V12 S4 2500 1580 2000 5800Wartsila Vasa Genset LI030 V12 S6 2700 1580 2000, 5800
7850Wartsila Vasa Genset UD30 V16 3200 1580 2000MAN B&W Genset V12 20/27 3400 3600 1510 2600MAN B&W V14 20/27 3800 3950 2600
3892! 4762

1
42
T UDeiftVakgroep OEMO
evAchVZ
!
Ce ich1d
Vermo enkW
Pm bar ,Jjnhoudbar
Toerental inhoud ,houdUrnin rrom43
Irz 5A23'limn
1-05/z 011
2000 1991 18 758 750 3,32E-.10 1,77E+082000 2122 16 758 900: 3,32E+10 1.775+081938 2650 18 689 750, 3.99E+10 236E+081938 2825 16 689 900 3,99E+10 2,36E+081889 2980 18 666 750! 4.34E+10 2,65E+081889 3180 16 666 900 4,34E+10 265E+08
168 10100 1400 19 850 1200 1.74E+10 72948480258 15500 2100 19 704 12004 2.35E+10 1,09E+08340 20400 2800 19 638 1200. 2,83E+10 1,46E+08483 970 15 417 1500. 7,9E+09 51927750483 1170 18 450 1500: 8,53E+09 5I927750IE491 1545 18 400 1500 1,01E+10 69237000883 10600 1200 14 600 1000 1,41E+10 1,02E+08843 11800 1400 14 564 1000 1.55E+10 1,19E+08819 13100 1600 14 538 1000 1,69E+10 136E+08800 14400 1800 14 517 1000 183E+10 153E+08744 8930 2280 26 556 1500 1,35.10, 71413020711 11380 3040 26 491 1500 1,53E+10 95217360355 2840 980 20 533 1900 5.025+09 31630005321 3850 1475 20 433 1900 6.81E+09 47445008309 4950 1965 20 383 1900 8,25E+09 63260010523 3140 740 17 547 1500 443E+09 33851948484 3870 985 17 485 1500 5.255+09 45135930468 5620 1475 17 423 1500 6.87E+09 67703895 5641991 056445 7120 1970 17 393 1500 8,49E+09 90271860 5641991 053443 7970 2215 17 382 1500 1.12E+10 l,02E1-08'I 5641991 0.52,550 4400 1130 17 4811 1500 5.65E+09 52752000 6594000 0,5e;533 6400 1690 17 421 1500 6.59E+09 79128000 6594000 052488 7800 21 16 391 1500 9$15+09 106E+08 6594000 0.49483 8700 2430 16 381 1500 1.09E+10 1A9E+08 6594000 047fl 1417 17000 2640 19 677 1000 2.115+10 165E+08 13782049 062
1388 22200 3520 19 643 1000 3.05E 10 221E+08 13782049 0,60'1378 24800 3960 19 621 1000 3.32E+10 248E+08 13782049 0,59,18001800
19901 2205
1818
794794
750 3.46E+10 177E+08 14718750 069,825 346E+10 1775+08 14718750 0,6
1656 --,2650 18 716 750 42E+10 2365+08 14718750 0,61656 2940 8 7184 825 42E+1 236E+08 14718750 0.65'laTi
: 2980 18 690 750 4.555+10 2,655+08 14718750 0,64'1611 290001 3310 18 590 825 4.55E+10 2.655+08 14718750 0,641263--A 10100 A400 19 763 1200 1.72E 72948480 9115560 0.711292 155001 2100 19 689, 200 226E+10 1695+08 9118560 0,681275 20400 2800 19 614 1200 2.785+10 146E+08
394 3150 648 16 478 1500 4.98E 09 35390940361 4330 1274 16 4381 1800 7.43E+09 53086410360 5755 1696 16 3911 1800 8.84E+09 71683 20200 2640 18 702. 1000 314E+10
1575 25200 3520 18 6411 1000 2.53E+10358 5725 2240. 21 4441 2000 .03E+10 63260010390 4685 1920 23 507L 2100 8.55E+09 47445008358 5725 2560 23 4441 2100 1 035+10 632600103611 2890 11204 21 583i 2000 5.455 09 31630005325 3900 1680 21 4781 2000 707E 09 47445008313 5000 2240 21 429: 2000 9.24E+09 63260010 Yfl742 8900 1980, 22, ---5(318 1500 1,29E+10 71413020709 11350. 2640. 221 4911 lsoo 1.53E+10 95217360 5951085 0.61756 9070 3240 30 5651 1800 1 3lE+l0 71413020 5951085 0,66725 11600 4320, 30 498- 1800 1 55E+10 95217360 5951085 0.62550 588 12 571, 1500 1./5E+10 38151000 3179250 0.74550 625' 13 571 1500 1 16c+10 38151000 3179250 0,74550 670 14, 571 1500 1 -8E-10 38151000 3179250 0.74
'
I
14718750 06714718750 0,6714718750 0.641471875014718750
0,640,62
14718750 0,629118560 0,74
0,690,650,580,610,56-
8478000 0,678478000 0,658478000 0,638478000 0,615951085 0,665951085 0,613953751 0.693953751 0,623953751 0,575641991 6.665641991 0,62
1
9118560 0,644423868 0,644423868 0,61
70781880 44238681,77E+08 147187502,36E+08 14718750 0,61
3953751 0,633953751 0,673953751 0.633953751 0,723953751 0.66
0,625951085 0,66
-

43
m*;TU DelftVakgroep IOEMO
Bonn Sin. Cylinders Cylindern cm Mee Pledin 1/veimoqen 0 berek SID
mm mm graders Ms IcalkINI mrn
250 300 12 60 75 o.oeL 34 12,05 250 120
250 300 12 sa , 9,0 , 0.061 36 11,31 250 1,20
250 300 16 60:. 75 0,06 34 11,70 250 1,20
250 300 16 60 9,0 0.06 36 10,97 250 1,20
250 300 18 60 7,5 0.06 34 11,41 250 1.20'
250 300 18 60 90 006 36 1069 250 1,20
220 240 8 60 9,6 0,10 46 721 220 1,09
220 240 12 60 9,6 0,10 as 7,381 220 1,09
220 240 16 60 9,6 0,10 46 7,291 220 1,09
175 180 12 60 9,0 009 34 5,98 175 1,03
175 180 12 60 9,0 0,11 41 496 175 1,03
175 180 16 60 9,0 0,11 40 5,06 175 1,03
200 270 12 90 9,0 __9.9J 8,83. 200 1,35
200 270 14 , 90 9,0 0,061 321 8,43/ 200 1,35
200 270 16 90 9,0 0.06 32 8,19/ 200 1,35
200 270 18 90 9,0 0,06 32 800' 200 1,35
190 210 12 90 10,s 0,16 67-,.3,90 1,11
210 16 90 10 5 016 67 3.74 190' 1,11
901- 11,7L 5.___.. .7 - -2790 - ---res 11 ,12
165 185 8
165 185 12 90, 11.7 0,16. 58 2,61165 1,12
--.. 7._.. __ -.. ......_2.52 165 112'
165 185 16' 90 112 0.16.O6 --16.S - -011 46 4,24
..185 1,14.1 - 185 210 6
185 210210
a 9012 90,
10,5 0.111 4646-
3933
.
.81
185 1,14
1--- 185 10,5 '0.9,11 185- . _ _.3,61 185 .:1,14
41--- 185 210 16 90 10 5 '0,1t 46
1165 10. -11i1- 90so
10.5 -.011--16,S 6.11
-185946 3,50 i,i4200
_ i
45 3,89.. ..
1,05200 2101 8
10,5 0,11 :15 ,793- - -. .-.. _
200 1:05200 210, 121 90,
200 210! 90 1,05 D,10 43 3,8T. -270 - - c1.05
200' 210 18 901-6-0/1
10,5 0,109,0 008
-43 3.58. 200 1,05
255- . _
.43 6.44.. _.
1,06255 270 12-- _255_ 2r 16, 43
. ._..6.31. 255 i.b-Ts. _60 9,0 0.08
b. 255 270---* 9,0,, 0,08 43, 616 255. 1,0 6. _... ... .
.60
250 300 12.
006 34 10.85 250 1' 20_ .-
250 oo 12 . obi -8,i1 0.06 37 9.80 .250 1,20,
. 60..... .. . .
_/7.5 0,06 34 1000 250, 1501- -__ . _
....... _I 250.
300 . ie-250 300 16 60 8.3- 0.66 37. 9.01. 250, 1:20
250 let.. .
aal 7,s. 34 9,73_ 250 1,20.16,6s300Tar ' -66' - 13-- 70.06
66._..0.10
37 5.76_ 250_. _
.1,20 /
46 7.21 210 --1,09250 300220 240
-/8, 60
240 116, 60
46 7,38_ -220.. . -
46 1.29.. 220 ' '"1,
091,09
220 9,6 10..--_.-0
220 240601
9,6- 0,10170 195 -1' 48 -11./.- 012 .47 3.71 170 1.-I5
- 'Tif. - '0,12 -47 3:413: -140- - 71-15 ''
-413-7- 170 195._'12
1701 195 16.1_ 4( 012 47 339 140 1,1, ,
250 idri 12 '60 ids,. C7,07. 45 155_ 250 ._120/ I-250 300 '45 -12016. 60 10,0 0.07- 7,16 ia.b
165 185 16 °I 12,3; 0,18 66 256165 1)2130 0,20 75
._ ..- ' 165_ . -._. _ 244
130 0,20 75. 154 165165 185 12 90 12
1,1-2165 185 101 90
r 165 185 8/ 90 12.3. 0,-18 66 2,58 165 1/,12
IL 165 185 12 90 123. --Cie -660.18 -- '
_ . _66
0,14 515
- - -4-:12Iii 18-5.. -4.23 165 ' -1111i
4,49 190 11,11165 185
r- -- 715 -i-TO1
-.16'11-2.1,_
do 12,390
.. . -10,5;
190 210 16i go 105 0.14 58 430 190 111
121 90 12,6-_-.
10,23 -.95 2.86 1-66 - 1,11'190 210190 210 16
- --.--.90 126 0,23 -95, -169/ .__.'190.1,11
150, 180 i2 9,0 _0.08 28 9.135r 150 - 1,10
1501 180 12 45_9,0 0,08 39. IsCr:not. 50 1,20
150 180 12 48 9/0-- 10,09 32 .gC/V/01' 150 -1 20- - . _ __. . . .. . .,
32
190
1,14
16
7,5
11.7'
-

Fhb
ritto
nlI
Typ
oI v
erm
opn
I the
rehl
alI
1091
ebr
eedt
ebo
ogie
ewi0
111
5.an
tcy
baw
dt
sIáF
pint
aat
pex
usI
1kW
gmin
1m
mR
IMm
mkg
1m
mR
IMn*
arm
bar
PIE
LST
ICK
18
PA
4185
SM
'48
0'
1300
2320
1470
1470
1470
1470
., '
1690
1785
1785
,178
517
852/
30
5000
816
521
090
016
00P
IELS
TIC
K...
1P
iffic
riek
iiP
IELS
TIC
K
12P
A41
85 S
M96
013
00/
3520
ii'P
X42
03-§
m .
it70
0.
1300i 2
320
12P
A42
00 S
M10
5013
00,
azo
SM
DS
'13
18'
1300
'&
75
9000
1255
000
-1-
'18
521
090
016
0018
521
090
016
0080
0092
0012
0021
090
016
00P
IELS
TIC
K r
lIPA
4200
1220
01
210
900
1600
PA
INIA
NP
AX
MA
NV
ALE
NT
A 8
$Z
VA
LEN
TA
12S
Z66
4,
1200 12
00-
/97
216
1012
_12
i19
721
6__
PA
XM
AN
.V
ALE
NT
A 1
65Z
1350
1200
3 97
014
5020
7090
0016
i19
721
685
016
00
PA
TM
AN
VA
LEN
TA
18S
Z15
2012
00.
181
197
t21
6H
ED
EM
OR
A. .
..,
V12
1311
4S1J
814
001
3315
1560
1840
121
210
210
950
600
4.F
INC
A-N
TE
RI I
FIN
CA
NT
ER
1A
210.
12 S
Mt
940
1500
i34
10-
440
A21
0.16
SK
414
1015
006
.
;13
5013
4026
3593
0012
121
023
095
016
0028
5511
400
1621
023
095
016
00
1,
2400
3600
816
518
596
816
00
MT
U'
8V39
6 S
E52
010
0021
50'
1600
7M
TU
I12
V39
6 58
8394
018
0025
501
1600
2650
7800
1216
518
596
816
00
MT
U1
16V
396
SE
1040
1600
3000
116
0028
0068
0016
165
185
968
1600
MT
U'
12V
9565
812
7013
5033
1016
60__
;___
_'29
0012
000
1223
023
096
816
00
MT
U16
1195
688
1690
1350
I 40
001
1660
_29
9014
900
1600
MT
U20
V95
6 S
6.2l
15H
1130
i46
901
leao
3085
1830
020
230
230
966
1600
1623
023
096
8

3500
3000
2500
2000
« 15001000
500
00,00
heigth
0.05 010 0.15 0.20
Pliter
0.25
BERGEN
WARTSILA
2 MAN
MTU
PIELSTICK
DEUTZ
74 SULZER
1
46
T U DelftVakgroep OEMO
cc K2
-Li.-
-- -1z-
3500
3000
2500
2000
1500
1000
500
0
heigth
2
BERGEN
WARTSILA
MAN
MTU
PIELSTICK
DEUTZ
SULZER
cm
10000 20 40 60
Ptech
80
A
A

5. 350-0 300
2 250200
a150
2 100
g 50e.
00
0'.00
length
ITT1
R°0
0.05 0,10 0.1'5 0,20
Pliter2
47
7000
6000
I::5000
S 40003000
.0c 2000a 1000
0
length
IJIAaW fl/LW'111411111Whilrit
F I
MtnOJ 0 COGNP
number of engine
CO, iN-
total Length
crankshaftilenght
!length
'difference
tn 3000000000
12 2500000000
-5-c, 2000000000
3 1500000000
a 1000000000
500000000o
.E 00
length,
r(Cr cC%- CO CD co;NI C') Li;
engine number
At;TUDe ftVakgroep OEMO
El BERGEN
Li WARTSILA
io MAN'
MTU
10 PIELSTICK
.11 DEUTZ'025
io SULZER
H-4

9
48
/41
4,0stantk
0,9
TU DelftVakgroep iOEMO
aturabgastleMPer-
aftstioltverbrauCi
or turbine
L""cf.
clef/ruck
h
tung (cot
, .0 200 300 400 500 mmWs 600
Abgasdruck nach turbine
Illustration found in Techntsches HandbuchlDieselmotoren