Embed Size (px)
Citation preview

Prepared for: KTA - Qk4 Louisville, Kentucky
April 11, 2007
Report of Geotechnical ExplorationI-64 EB and I-64 WB over Story AvenueS0290 (B64-15) Ohio River Bridges Project Kennedy Interchange - Section 1 Item Nos. 5-118.18 & 19 Jefferson County, Kentucky

Prepared for: KTA - Qk4 Louisville, Kentucky
April 11, 2007
Report of Geotechnical ExplorationI-64 EB and I-64 WB over Story AvenueS0290 (B64-15) Ohio River Bridges Project Kennedy Interchange - Section 1 Item Nos. 5-118.18 & 19 Jefferson County, Kentucky

Report of Geotechnical Exploration I-64 EB and I-64 WB over Story Avenue
S0290 (B64-15) Ohio River Bridges Project
Kennedy Interchange - Section 1 Item Nos. 5-118.18 & 19
Jefferson County, Kentucky
v:\lexington\adam\s0290\s0290 report.doc i
Table of Contents
Section Page No.
1. Introduction ....................................................................................................11.1. Project Overview......................................................................................11.2. Structure Location and Description..........................................................1
2. Site Topography and Geologic Conditions.................................................2
3. Summary of Borings......................................................................................2
4. Soil, Bedrock, and Groundwater Conditions ..............................................4
5. Laboratory Testing and Results ...................................................................45.1. General ....................................................................................................45.2. Testing of Cohesive Soils/Undisturbed (Shelby) Tube Samples.............5
5.2.1. Engineering Classification Test Results for Cohesive Samples .......................................................................................5
5.2.2. Unconfined Compressive Strength Testing of Cohesive Samples .......................................................................................5
5.2.3. Unconsolidated-Undrained (UU) Triaxial Testing........................65.2.4. One-Dimensional Consolidation Testing of Cohesive
Samples .......................................................................................65.3. Laboratory Testing of Non-Cohesive Soils/Standard Penetration
Test Samples...........................................................................................7
6. Derivation of Soil Parameters.......................................................................76.1. Correction of Standard Penetration Test Data.........................................76.2. Soil Parameter Selections .......................................................................8
7. Foundation Analyses.....................................................................................97.1. General ....................................................................................................97.2. Steel H-Pile Analyses ..............................................................................9
7.2.1. Pile Capacity ................................................................................97.2.2. Hammer Energy.........................................................................11
7.3. Drilled Shaft Analyses............................................................................12
8. Embankment Stability Analyses.................................................................14
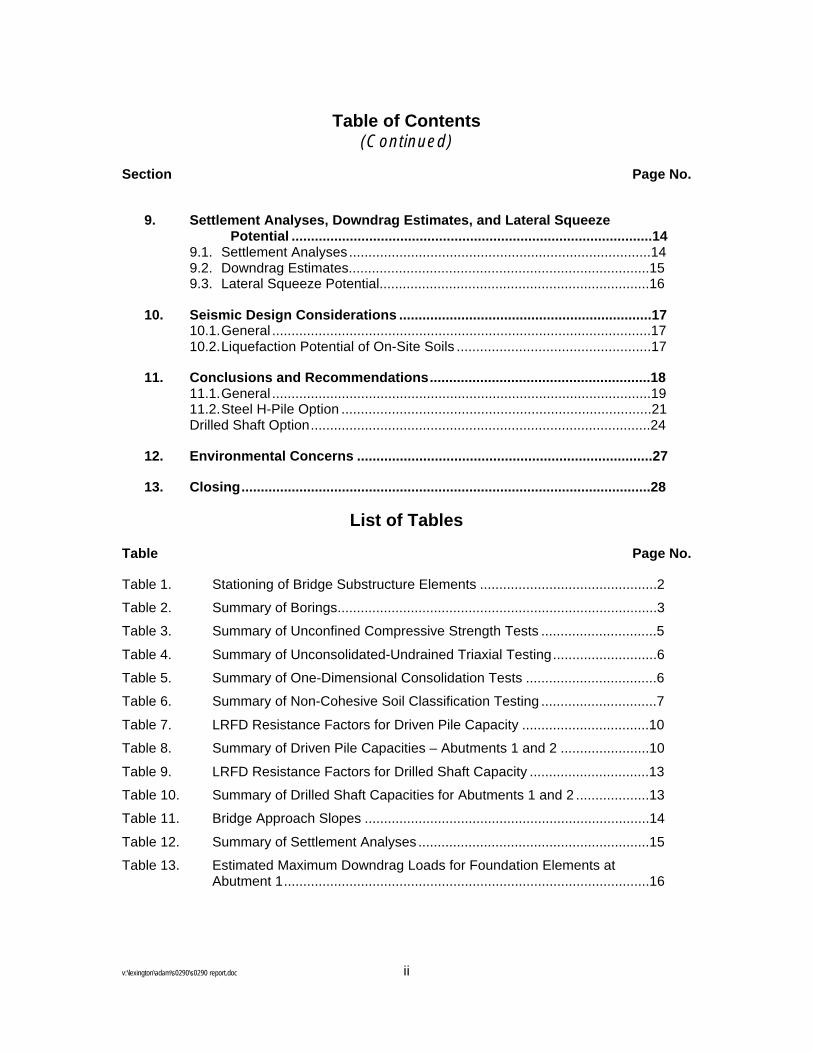
Table of Contents (Continued)
v:\lexington\adam\s0290\s0290 report.doc ii
Section Page No.
9. Settlement Analyses, Downdrag Estimates, and Lateral Squeeze Potential .............................................................................................14
9.1. Settlement Analyses..............................................................................149.2. Downdrag Estimates..............................................................................159.3. Lateral Squeeze Potential......................................................................16
10. Seismic Design Considerations .................................................................1710.1.General ..................................................................................................1710.2.Liquefaction Potential of On-Site Soils ..................................................17
11. Conclusions and Recommendations.........................................................1811.1.General ..................................................................................................1911.2.Steel H-Pile Option ................................................................................21Drilled Shaft Option........................................................................................24
12. Environmental Concerns ............................................................................27
13. Closing..........................................................................................................28
List of Tables
Table Page No.
Table 1. Stationing of Bridge Substructure Elements ..............................................2
Table 2. Summary of Borings...................................................................................3
Table 3. Summary of Unconfined Compressive Strength Tests ..............................5
Table 4. Summary of Unconsolidated-Undrained Triaxial Testing...........................6
Table 5. Summary of One-Dimensional Consolidation Tests ..................................6
Table 6. Summary of Non-Cohesive Soil Classification Testing ..............................7
Table 7. LRFD Resistance Factors for Driven Pile Capacity .................................10
Table 8. Summary of Driven Pile Capacities – Abutments 1 and 2 .......................10
Table 9. LRFD Resistance Factors for Drilled Shaft Capacity ...............................13
Table 10. Summary of Drilled Shaft Capacities for Abutments 1 and 2 ...................13
Table 11. Bridge Approach Slopes ..........................................................................14
Table 12. Summary of Settlement Analyses ............................................................15
Table 13. Estimated Maximum Downdrag Loads for Foundation Elements at Abutment 1...............................................................................................16

Table of Contents (Continued)
v:\lexington\adam\s0290\s0290 report.doc iii
List of Appendixes
Appendix
Appendix A
Appendix B
Appendix C
Appendix D
Appendix E
Appendix F
Appendix G
Appendix H
Appendix I
Appendix J
Location Map
Client Drawings from ProjectWise
Subsurface Data Sheets
Coordinate Data Submission Form
Laboratory Test Results
Correction of SPT Data
Idealized Soil Profiles
Single Shaft/Pile Capacity Estimates for Abutments 1 and 2
H-Pile Resistances
Environmental Sites

Report of Geotechnical ExplorationI-64 EB and I-64 WB over Story Avenue
S0290 (B64-15)Ohio River Bridges Project
Kennedy Interchange - Section 1Item Nos. 5-118.18 & 19
Jefferson County, Kentucky
v:\lexington\adam\s0290\s0290 report.doc 1
1. Introduction
1.1. Project Overview
The Bi-State Management Team, consisting of representatives from the Federal Highway Administration (FHWA), Kentucky Transportation Cabinet (KYTC) and Indiana Department of Transportation (INDOT), is planning and overseeing the design of the Ohio River Bridges Project, which will address the cross-river transportation needs in Louisville, Kentucky and Southern Indiana. The Ohio River Bridges Project consists of six (6) separate design sections.
Section 1 - Kennedy Interchange
Section 2 - Downtown Bridge
Section 3 - Downtown Indiana Approach
Section 4 - East End Kentucky Approach
Section 5 - East End Bridge
Section 6 - East End Indiana Approach
As a part of the Ohio River Bridges Project, the Kennedy Interchange will be reconstructed/relocated just south of its current location. The relocation includes the widening, reconstruction and construction of over 80 bridges, construction of approximately 28 retaining walls and about 22 miles of roadway, ramps and connectors to allow for more efficient traffic movement. Kentucky Transportation Associates (KTA), a collaboration of several engineering consulting firms, is serving as the design consultant for the Kennedy Interchange reconstruction/relocation.
1.2. Structure Location and Description
Reconstruction of the Kennedy Interchange section of the Ohio River Bridges project includes the widening of Interstate 64 (I-64) to accommodate additional lanes of travel and new entrance/exit ramps. This report specifically addresses the geotechnical concerns relative to the new construction of the I-64 bridge over Story Avenue, designated as S0290 (B64-15). In order to construct the new I-64 over Story Avenue bridge a temporary bridge widening, which will be covered under a separate cover as bridge S8050 (BT-6), will be needed to maintain traffic.
v:\lexington\adam\s0290\s0290 report.doc 2
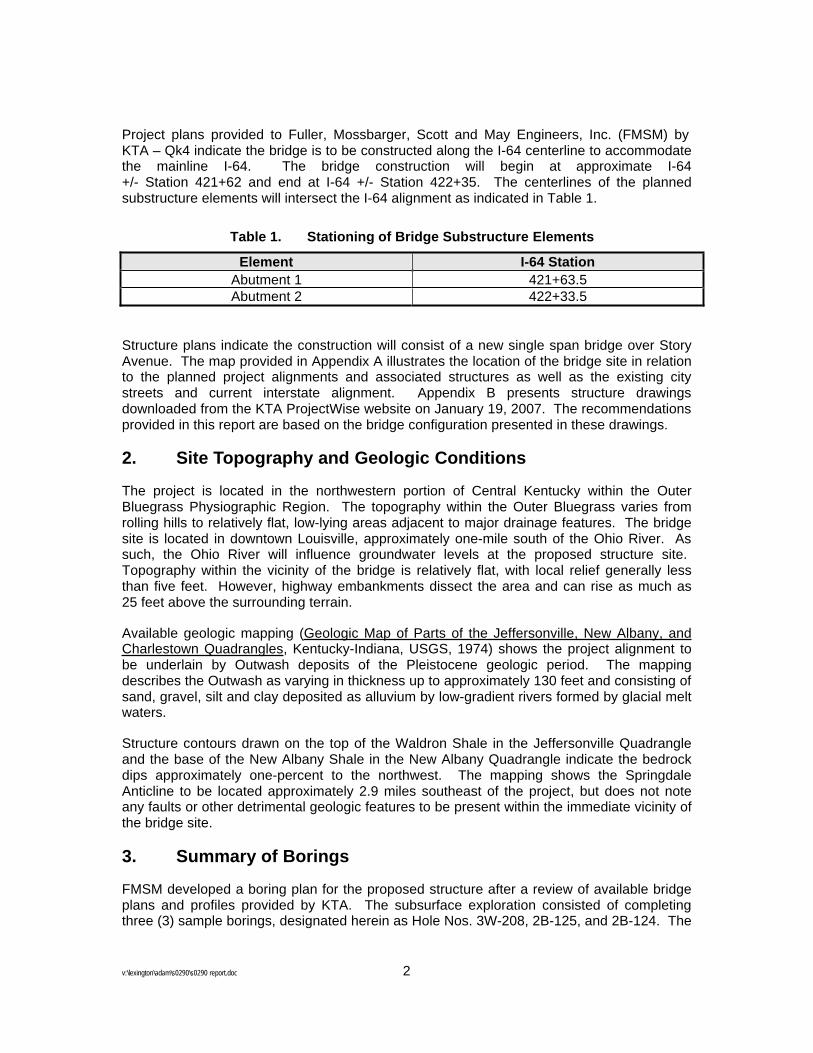
Project plans provided to Fuller, Mossbarger, Scott and May Engineers, Inc. (FMSM) by KTA – Qk4 indicate the bridge is to be constructed along the I-64 centerline to accommodate the mainline I-64. The bridge construction will begin at approximate I-64 +/- Station 421+62 and end at I-64 +/- Station 422+35. The centerlines of the planned substructure elements will intersect the I-64 alignment as indicated in Table 1.
Table 1. Stationing of Bridge Substructure Elements
Element I-64 Station Abutment 1 421+63.5Abutment 2 422+33.5
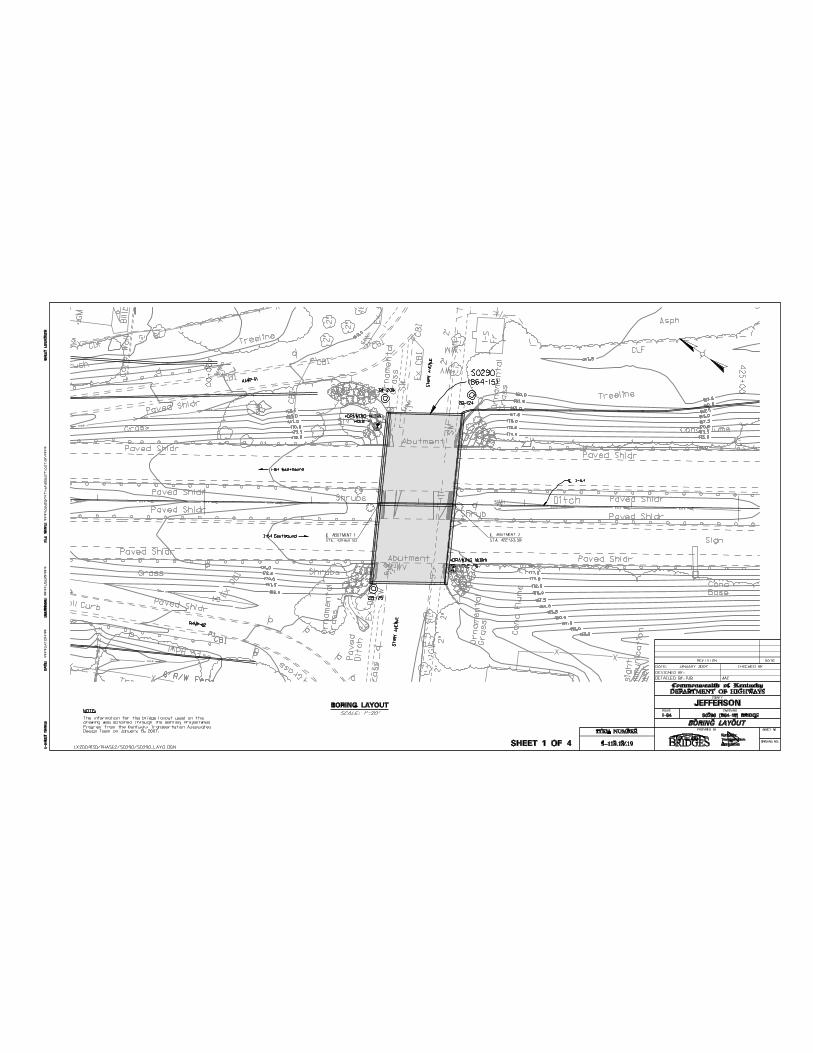
Structure plans indicate the construction will consist of a new single span bridge over Story Avenue. The map provided in Appendix A illustrates the location of the bridge site in relation to the planned project alignments and associated structures as well as the existing city streets and current interstate alignment. Appendix B presents structure drawings downloaded from the KTA ProjectWise website on January 19, 2007. The recommendations provided in this report are based on the bridge configuration presented in these drawings.
2. Site Topography and Geologic Conditions
The project is located in the northwestern portion of Central Kentucky within the Outer Bluegrass Physiographic Region. The topography within the Outer Bluegrass varies from rolling hills to relatively flat, low-lying areas adjacent to major drainage features. The bridge site is located in downtown Louisville, approximately one-mile south of the Ohio River. As such, the Ohio River will influence groundwater levels at the proposed structure site. Topography within the vicinity of the bridge is relatively flat, with local relief generally less than five feet. However, highway embankments dissect the area and can rise as much as 25 feet above the surrounding terrain.
Available geologic mapping (Geologic Map of Parts of the Jeffersonville, New Albany, and Charlestown Quadrangles, Kentucky-Indiana, USGS, 1974) shows the project alignment to be underlain by Outwash deposits of the Pleistocene geologic period. The mapping describes the Outwash as varying in thickness up to approximately 130 feet and consisting of sand, gravel, silt and clay deposited as alluvium by low-gradient rivers formed by glacial melt waters.
Structure contours drawn on the top of the Waldron Shale in the Jeffersonville Quadrangle and the base of the New Albany Shale in the New Albany Quadrangle indicate the bedrock dips approximately one-percent to the northwest. The mapping shows the Springdale Anticline to be located approximately 2.9 miles southeast of the project, but does not note any faults or other detrimental geologic features to be present within the immediate vicinity of the bridge site.
3. Summary of Borings
FMSM developed a boring plan for the proposed structure after a review of available bridge plans and profiles provided by KTA. The subsurface exploration consisted of completing three (3) sample borings, designated herein as Hole Nos. 3W-208, 2B-125, and 2B-124. The

v:\lexington\adam\s0290\s0290 report.doc 3
borings identified as Drawing 16389, Hole #1 and #6 are borings that were drilled in 1964 for the existing roadway and structure. These borings have been presented herein for informational purposes only.
KTA – Qk4 survey personnel established the boring locations and surface elevations in accordance with the Final Boring Plan dated March 10, 2006. Table 2 provides a summary of the stations, offsets, elevations, and depths of the borings drilled for the bridge construction. The boring locations are referenced to I-64 mainline stationing.
Table 2. Summary of Borings
HoleNo.
Station/Offset
SurfaceElevation
Top of Rock
Elevation
Refusal/BeginCore
Elevation
Lengthof
Core
BoringTermination
Depth
Bottom of Hole
Elevation3W-208 421+68 99? Lt. 459.6 -- -- -- 80.0 381.02B-125 421+59 80? Rt. 461.0 -- -- -- 80.0 379.62B-124 422+49 103? Lt. 459.6 -- 364.6 -- 95.0 364.6
Drawing 16389 Hole #1 Boring Drilled for Existing Bridge Drawing 16389 Hole #6 Boring Drilled for Existing Bridge
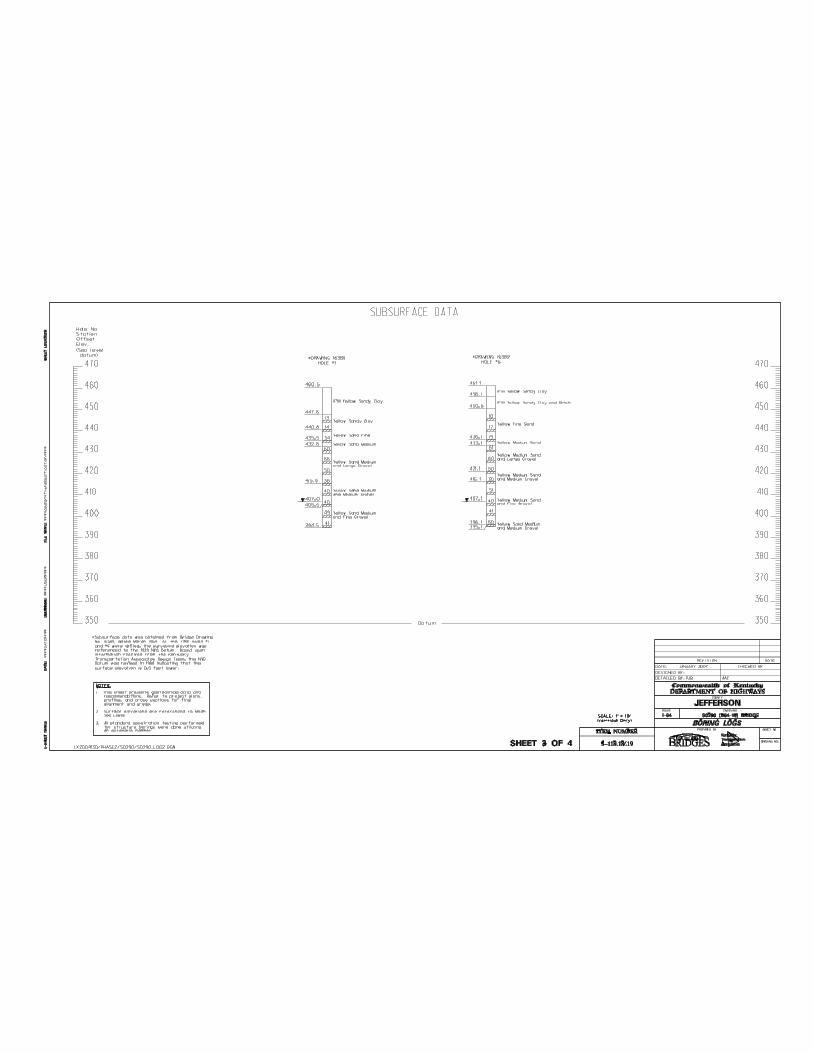
FMSM personnel performed drilling and sampling operations in March and May 2006. A geotechnical engineer from FMSM monitored the field operations and adjusted the boring program as field and/or subsurface conditions warranted. The drill crews operated one all-terrain-vehicle mounted drill rig and one truck-mounted drill rig equipped with hollow-stem augers. The field personnel generally performed soil sampling at five-foot intervals of depth to provide in situ strength data and specimens for subsequent laboratory strength and/or classification testing. Typically, undisturbed thin-wall (Shelby) tube samples were obtained within cohesive soil horizons and standard penetration (SP) testing was performed within granular (non-cohesive) materials. The drill crews checked each boring for the presence of groundwater prior to backfilling. The Subsurface Data Sheets in Appendix C provide a boring layout that depicts the locations of the borings in relation to the planned structure as well as graphical logs presenting the results of the drilling, sampling, and laboratory testing programs. Refer to Appendix D for the Coordinate Data Submission Form summarizing the as-drilled boring locations, surface elevations, and associated latitudes and longitudes.
The drill rigs utilized for the sampling operations were equipped with automatic hammers to perform SP testing in accordance with Section 302-5 of the current KYTC Geotechnical Manual. The use of automatic hammers provides for a more efficient and consistent transfer of energy than traditional SP testing with a safety hammer/rope/cat-head system. Thus, blowcounts observed from automatic hammers are lower than those observed with the safety hammer system. Typical correlations for SP results used in geotechnical engineering are based on the safety hammer system and require that blowcounts from SP testing using an automatic hammer be corrected for efficiency. A discussion on the correction of the blowcounts is included in Section 6 of this report. The corrected N-values will be utilized in subsequent sections of this report for applicable engineering analyses.

v:\lexington\adam\s0290\s0290 report.doc 4
4. Soil, Bedrock, and Groundwater Conditions
The drilling and sampling operations performed for the planned bridge construction indicate the subsurface materials consist of relatively thick (90+ feet) soil deposits consistent with the outwash/alluvial type materials described by the geologic mapping. In general, the subsurface materials observed during drilling operations primarily consist of a relatively thin mantle of clay (5 to 10 feet thick) overlying sand deposits extending to bedrock. Drilling operations in the area suggest the top of bedrock is approximately 95 feet below the ground surface.
Surface materials overlying the outwash deposits consist of topsoil, and/or fill materials associated with previous development in the city of Louisville. Holes 3W-208, 2B-125 and 2B-124 encountered both topsoil and fill materials extending to depths of approximately 0.4 feet and 10.0 feet, respectively. Generally, the zone described as topsoil consisted of an organic dark brown soil mantle containing grass roots. The engineer monitoring the drilling operations described the fill materials as consisting of silty to sandy lean clay mixed with brick fragments and remnants.
The outwash deposits encountered within the test borings generally consisted of approximately 10 feet of sandy lean clay overlying relatively thick sand deposits (85+ feet) with varying amounts of gravel and silt. The field engineer visually described the clay soils as being brown to dark brown in color, damp to moist in terms of natural moisture content, medium stiff to stiff in consistency, and containing varying amounts of sand and gravel. The natural moisture content of the clay materials generally increased with increasing depth.
The sands observed in the borings are brown to gray in color, fine- to medium-grained, damp to wet in terms of natural moisture content, loose to dense, and contain varying amounts of gravel size particles. Uncorrected N-values from SP testing ranged from a low of 4 to a high of 44 blows per foot. In general, the upper 15 to 20 feet of the sand deposits exhibit low N-values (10 or less), with an average uncorrected N-value of approximately 7. The lower sands grade into more dense sands and gravels with N-values ranging from a minimum of 9 to a maximum of 44 blows per foot (average uncorrected N-value of approximately 23).
FMSM personnel recorded an approximate measurement of the depth to the groundwater surface at each boring during drilling and sampling operations. Based on the groundwater level observations prior to backfilling the borings, the groundwater level at the structure site varies from approximate elevation 416.2 at the location of Hole 2B-124 to 419.1 at Hole 2B-125. The average elevation derived from the observations is 417.6 feet, which correlates well with the normal pool elevation of 420 feet for the Ohio River noted on the geologic mapping. The graphical logs provided on the Subsurface Data Sheets in Appendix C depict the approximate location of the groundwater surface, as recorded in each boring.
5. Laboratory Testing and Results
5.1. General
Selected soil specimens recovered during standard penetration testing and Shelby tube sampling operations were subjected to natural moisture content, wash gradation (silt plus clay determinations), soil classification, unconfined compressive strength testing, unconsolidated-undrained triaxial testing and one-dimensional consolidation testing. FMSM performed laboratory testing in accordance with applicable American Association of State

v:\lexington\adam\s0290\s0290 report.doc 5
Highway Transportation Officials (AASHTO) or Kentucky Methods (KM) of soil testing specifications. Laboratory personnel developed the soil classification identifications in accordance with both the Unified (USCS) and AASHTO soil classification systems. The test results were used to establish material properties for subsequent engineering analyses to estimate soil bearing capacities and settlements of proposed foundation elements as well as evaluate slope stability of the bridge approach embankments. The following paragraphs provide detailed discussions of the laboratory testing program.
5.2. Testing of Cohesive Soils/Undisturbed (Shelby) Tube Samples
Borings drilled for the subject bridge construction included undisturbed (Shelby) tube sampling within predominantly cohesive soil horizons. FMSM?s soils laboratory extruded the tubes and trimmed six-inch specimens. Lab personnel determined visual descriptions, unit weights (wet and dry), and natural moisture for each six-inch specimen prior to submitting a summary of the extruded specimens to a geotechnical engineer for assignment of lab testing. The laboratory testing performed on the extruded samples consisted of engineering classification, unconfined compressive strength, unconsolidated-undrained triaxial testing and one-dimensional consolidation testing. The following paragraphs provide further discussion of the test results.
5.2.1. Engineering Classification Test Results for Cohesive Samples
FMSM performed engineering classification testing on selected six-inch Shelby tube specimens. The testing included one classification test per soil type in a Shelby tube. The cohesive soils classify as CL, ML and CL-ML according to USCS, and A-6 and A-4 based on the AASHTO classification system. The Subsurface Data Sheets provided in Appendix C depict the results of the classification testing adjacent to the graphical logs.
5.2.2. Unconfined Compressive Strength Testing of Cohesive Samples
FMSM performed unconfined compressive strength testing on soil specimens to provide information for estimating total stress strength parameters for the cohesive soil horizon. The unconfined compressive strength values obtained range from 540 psf (0.27 tsf) to 3,560 psf (1.78 tsf). Table 3 summarizes the data obtained from this testing. The Subsurface Data Sheets provided in Appendix C also depict the results of the unconfined compressive strength testing adjacent to the appropriate graphical log.
Table 3. Summary of Unconfined Compressive Strength Tests
Unit WeightHoleNo.
Stationand
Offset
SampleInterval
(ft)Dry(pcf)
Wet(pcf)
MoistureContent
%
UnconfinedCompressive
Strength(psf)
EstimatedCohesion
(psf)3W-208 421+68 99? Lt. 2.0 – 4.0 107.3 128.0 19.3 2,700 1,3503W-208 421+68 99? Lt. 5.0 – 7.0 109.9 129.1 17.5 3,480 1,7402B-125 421+59 80? Rt. 2.0 – 4.0 107.1 127.7 19.2 2,780 1,3402B-125 421+59 80? Rt. 5.0 – 7.0 109.5 129.1 17.9 3,560 1,7802B-124 422+49 103? Lt. 2.0 – 3.5 106.6 124.9 17.2 540 270

v:\lexington\adam\s0290\s0290 report.doc 6
The unconfined compressive strength can be used to estimate the bearing capacity and cohesion of a soil material. The value of cohesion in an engineering analysis is generally estimated to be one-half of the unconfined compressive strength for cohesive soils. Based on the above test results, the cohesion values estimated from unconfined compression testing range from 270 psf (0.14 tsf) to 1,740 psf (0.87 tsf).
5.2.3. Unconsolidated-Undrained (UU) Triaxial Testing
FMSM also performed unconsolidated-undrained (UU) triaxial testing on a single soil specimen to provide information for estimating total stress strength parameters for the cohesive soil horizon. The strength value obtained from this testing is 1,224 psf (0.61 tsf). Table 4 summarizes the data obtained from this testing. The Subsurface Data Sheets provided in Appendix C also depict the results of the UU testing adjacent to the appropriate graphical log.
Table 4. Summary of Unconsolidated-Undrained Triaxial Testing
UU Triaxial Strength HoleNumber
Station and Offset
SampleInterval
(ft)
ConfiningStress(psi) (psf) (tsf)
3W-208 421+68 99? Lt. 10.6 – 11.1 9 1,224 0.61
The UU triaxial strength can also be used to estimate the bearing capacity and cohesion of a soil material. The value of cohesion in an engineering analysis is estimated to be equal to the UU triaxial strength for cohesive soils. Based on the above test results, the cohesion value derived from UU testing is 1,224 psf (0.61 tsf).
5.2.4. One-Dimensional Consolidation Testing of Cohesive Samples
One-dimensional consolidation testing was performed on selected samples extruded from the Shelby tubes to provide initial void ratio and consolidation parameters to be utilized in subsequent settlement analyses. The results of the consolidation tests are summarized in Table 5.
Table 5. Summary of One-Dimensional Consolidation Tests
HoleNo.
Stationand
Offset
TestInterval
(ft)
InitialVoidRatio(eo)
CompressionIndex(Cc)
Recompression Index(Cr)
PreconsolidationPressure(Pc) (psf)
3W-208 421+68 99? Lt. 5.0 – 7.0 0.600 0.165 0.035 2,600
Graphical plots (e-log p) of void ratio (e) versus log of applied pressure (p) are presented in Appendix E. Initial void ratio (eo), compression index (Cc) and recompression index (Cr) are directly obtained from the testing and/or the graphical plots. However, the Preconsolidation pressure (Pc) (consolidation pressure, greater than the existing overburden pressure, under which the sample has been previously subjected) was determined graphically based on the Casagrande method outlined in "Foundation Engineering", Peck, Hanson and Thornburn.
v:\lexington\adam\s0290\s0290 report.doc 7
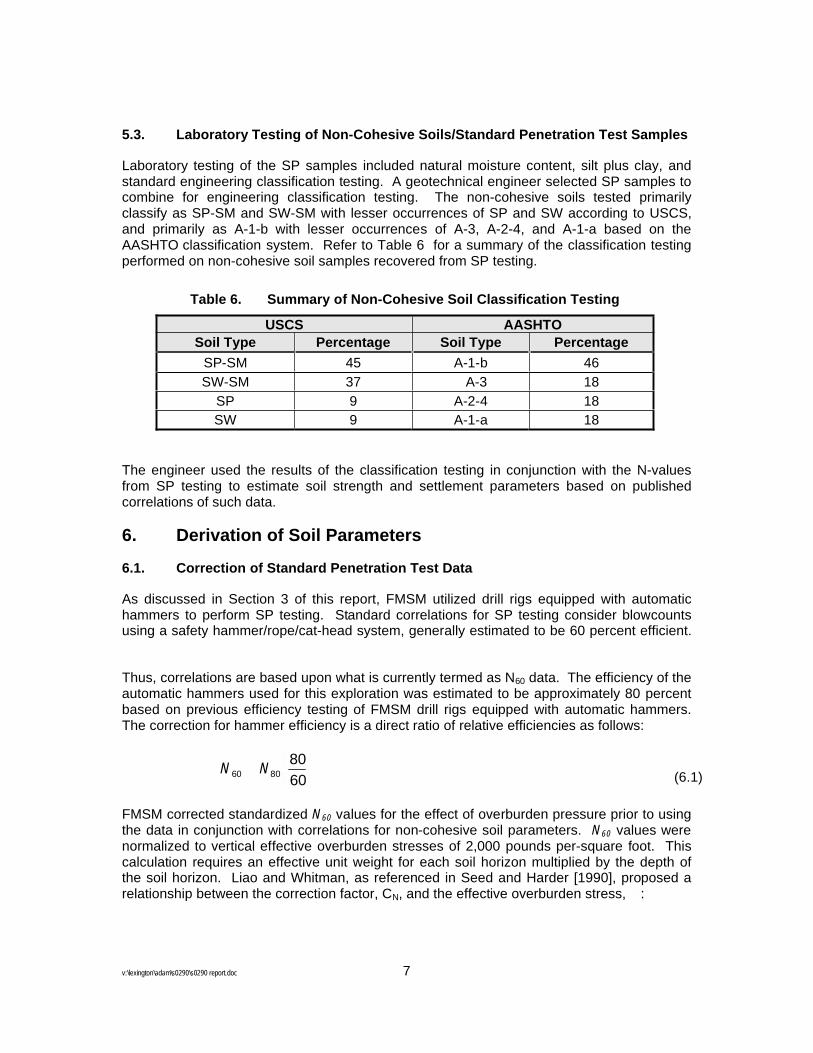
5.3. Laboratory Testing of Non-Cohesive Soils/Standard Penetration Test Samples
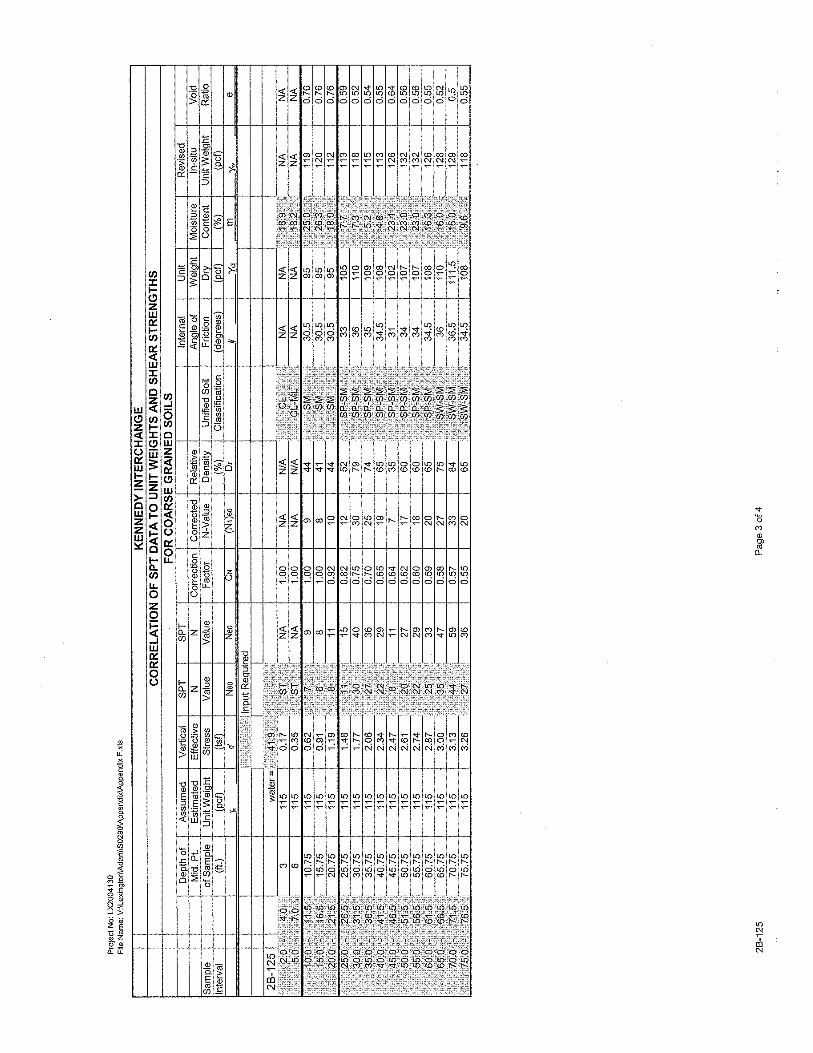
Laboratory testing of the SP samples included natural moisture content, silt plus clay, and standard engineering classification testing. A geotechnical engineer selected SP samples to combine for engineering classification testing. The non-cohesive soils tested primarilyclassify as SP-SM and SW-SM with lesser occurrences of SP and SW according to USCS, and primarily as A-1-b with lesser occurrences of A-3, A-2-4, and A-1-a based on theAASHTO classification system. Refer to Table 6 for a summary of the classification testing performed on non-cohesive soil samples recovered from SP testing.
Table 6. Summary of Non-Cohesive Soil Classification Testing
USCS AASHTOSoil Type Percentage Soil Type Percentage
SP-SM 45 A-1-b 46SW-SM 37 A-3 18
SP 9 A-2-4 18SW 9 A-1-a 18
The engineer used the results of the classification testing in conjunction with the N-values from SP testing to estimate soil strength and settlement parameters based on publishedcorrelations of such data.
6. Derivation of Soil Parameters
6.1. Correction of Standard Penetration Test Data
As discussed in Section 3 of this report, FMSM utilized drill rigs equipped with automatichammers to perform SP testing. Standard correlations for SP testing consider blowcountsusing a safety hammer/rope/cat-head system, generally estimated to be 60 percent efficient.
Thus, correlations are based upon what is currently termed as N60 data. The efficiency of theautomatic hammers used for this exploration was estimated to be approximately 80 percentbased on previous efficiency testing of FMSM drill rigs equipped with automatic hammers.The correction for hammer efficiency is a direct ratio of relative efficiencies as follows:
(6.1)
FMSM corrected standardized N60 values for the effect of overburden pressure prior to usingthe data in conjunction with correlations for non-cohesive soil parameters. N60 values werenormalized to vertical effective overburden stresses of 2,000 pounds per-square foot. Thiscalculation requires an effective unit weight for each soil horizon multiplied by the depth of the soil horizon. Liao and Whitman, as referenced in Seed and Harder [1990], proposed a relationship between the correction factor, CN, and the effective overburden stress, :
8060806N N0

v:\lexington\adam\s0290\s0290 report.doc 8
1(6.2)
where:
CN = correction factor for overburden stress
= vertical effective overburden stress (tsf)
Consequently, the standardized corrected N-value, (N )60 is equal to:
(6.3)
where:
CN = correction factor for overburden stress
N60 = standardized N-value
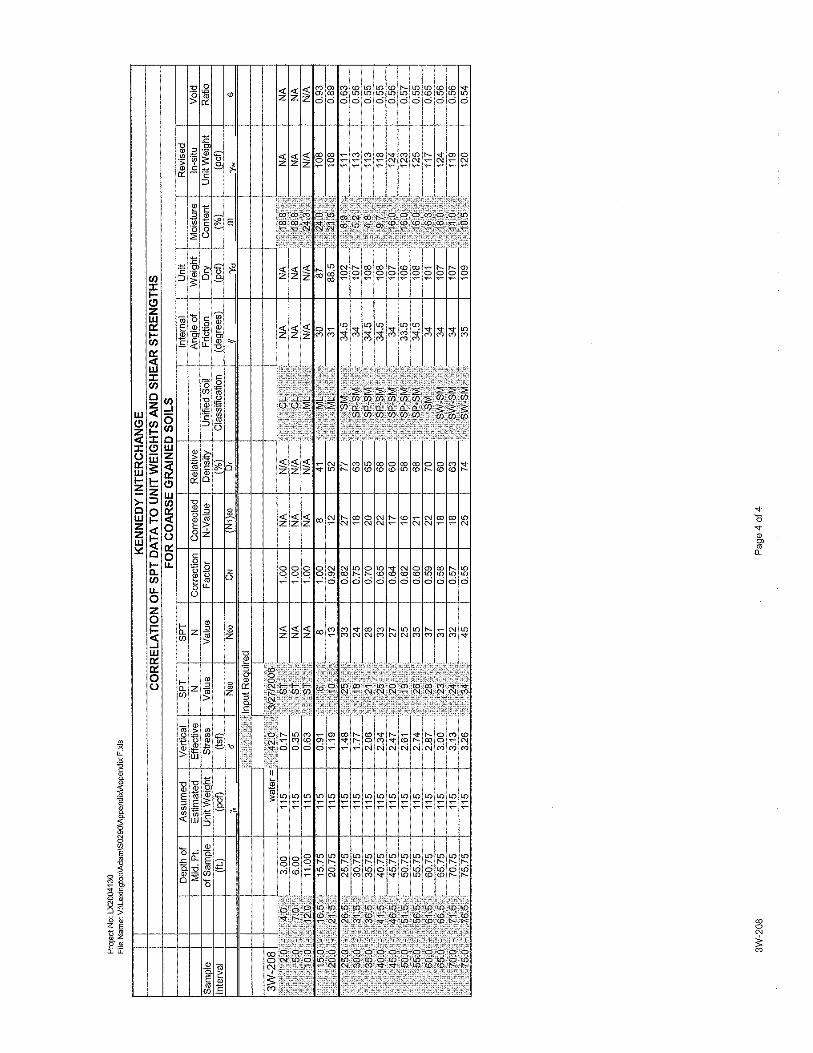
Appendix F contains summaries of the SP data and corrections for the three new boringsperformed along the bridge alignment. The spreadsheets also include correlations of corrected SP data with published correlations for estimates of unit weight and shear strength parameters. The values of (N )60 were utilized to obtain relative densities, Dr, based onrelationships developed by Tokimatsu and Seed [1988]. NAVFAC [1982] presents arelationship using relative density of specific soil types to correlate angle of internal friction,unit weight and void ratio. Soil classifications for the correlations came from actuallaboratory test results and visual observations, and were used to estimate an in situ unitweight of the material. Once the relationships for the angle of internal friction, unit weight and void ratio were established, an in situ unit weight was calculated based upon the natural moisture content.
6.2. Soil Parameter Selections
FMSM derived subsurface characterizations for the foundation soils along the bridgealignment based upon the results of the drilling and sampling program discussed in Section 3of this report, and the laboratory testing addressed in Section 5. The division of soil horizonswas based on visual soil descriptions, laboratory classification data, and corrected SP dataassociated with Boring Nos. 3W-208, 2B-125, and 2B-124.
A geotechnical engineer derived estimated soil parameters for each soil horizon. Strengthand settlement parameters for the cohesive materials were estimated based on the results of laboratory classification and unconfined compressive tests. The parameters derived for thecohesive materials are representative of sandy lean clay soils and are typical of clay soils found in this region of the state. Likewise, the settlement and strength parameters for the non-cohesive materials (sand deposits) were estimated based on corrected SP data, laboratory classification testing, and correlations of such data. Values of internal angles of friction ( ') for granular soils obtained from the correlations vary from 31.0 to 37.0 degrees. A review of these parameters indicate in general an increasing trend with depth which coincides with dense coarse grained deposits typically found within the site's geologicalsetting.
6060' NCN N
NC'

v:\lexington\adam\s0290\s0290 report.doc 9
7. Foundation Analyses
7.1. General
It is our understanding that the planned bridge will be supported by deep foundation elements. Discussions with the bridge designer, KTA-Qk4, indicate existing elements will be used at the Abutment 1 and Abutment 2 locations, as feasible. Based on information available to FMSM, the type and length of piles used for the existing foundation system is unknown. However, it is our understanding that, as part of construction of the existing foundations, piles were "designed for a maximum load of 40 tons per pile".
This project will be designed using the Load and Resistance Factor Design (LRFD) methodology. LRFD is a design approach in which applicable failure and serviceability conditions can be evaluated considering the uncertainties associated with loads and materials resistances. Where applicable, the following engineering analyses, in general, followed the current AASHTO LRFD guidelines. It is estimated that the existing structure was constructed in the middle to late 1960's. As such, the structure would have been designed using Allowable Stress Design (ASD) methodology. The 40 tons per pile mentioned previously would be in reference to an ASD load. Therefore, it is reasonable to estimate the total nominal geotechnical axial resistance (ultimate capacity) as 40 tons times a factor-of-safety equal to 3.0. This results in an ultimate capacity equal to 120 tons as an estimate for the existing piles. Based on the above discussion, FMSM estimates a 40-ton ASD capacity for this structure can be roughly equated to a 50-ton LRFD capacity.
This structure is situated just south of the 100-year flood limits for the Ohio River. The 100-year flood elevation is at 450.1 feet. This elevation is below the existing groundline at this structure, but is higher than the normal ground water elevation of about 420 feet. Therefore, the capacity analyses for the foundations within this report were performed with the water table positioned at the 100-year flood elevation of 450.1 feet to simulate conditions that may exist during a flood event in the Louisville area. This report provides recommendations for both driven steel H-pile and drilled concrete shaft foundation options for support of the subject bridge reconstruction.
7.2. Steel H-Pile Analyses
7.2.1. Pile Capacity
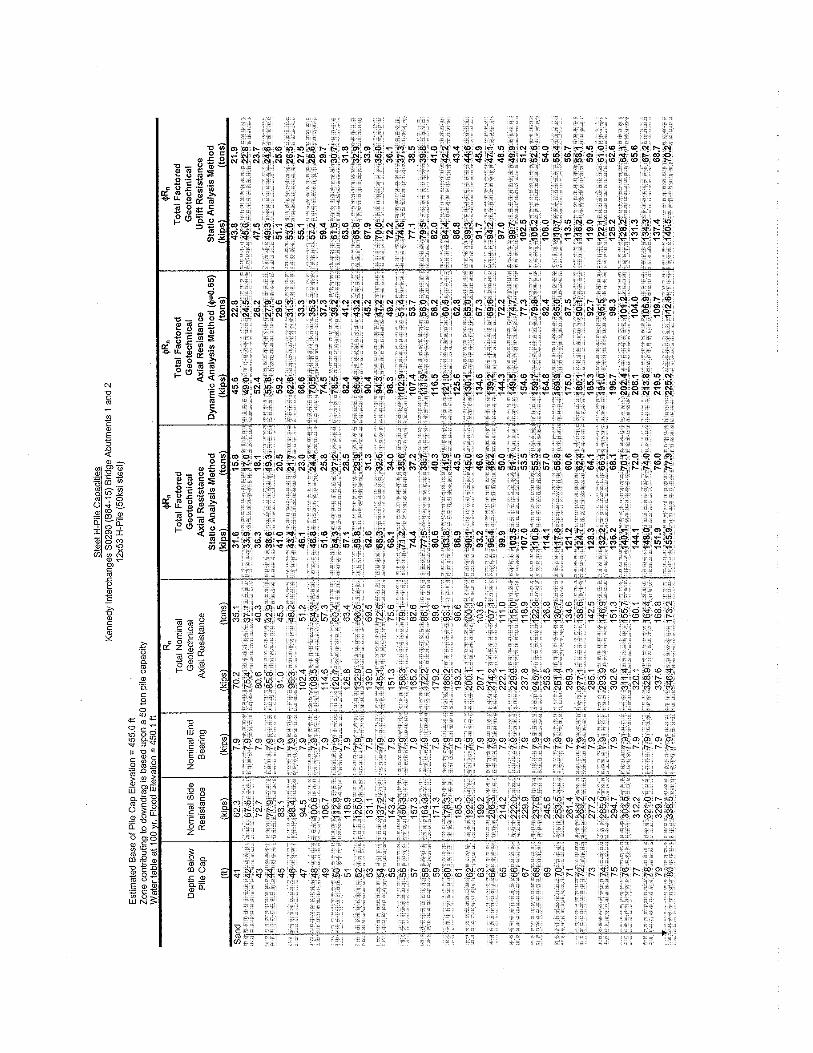
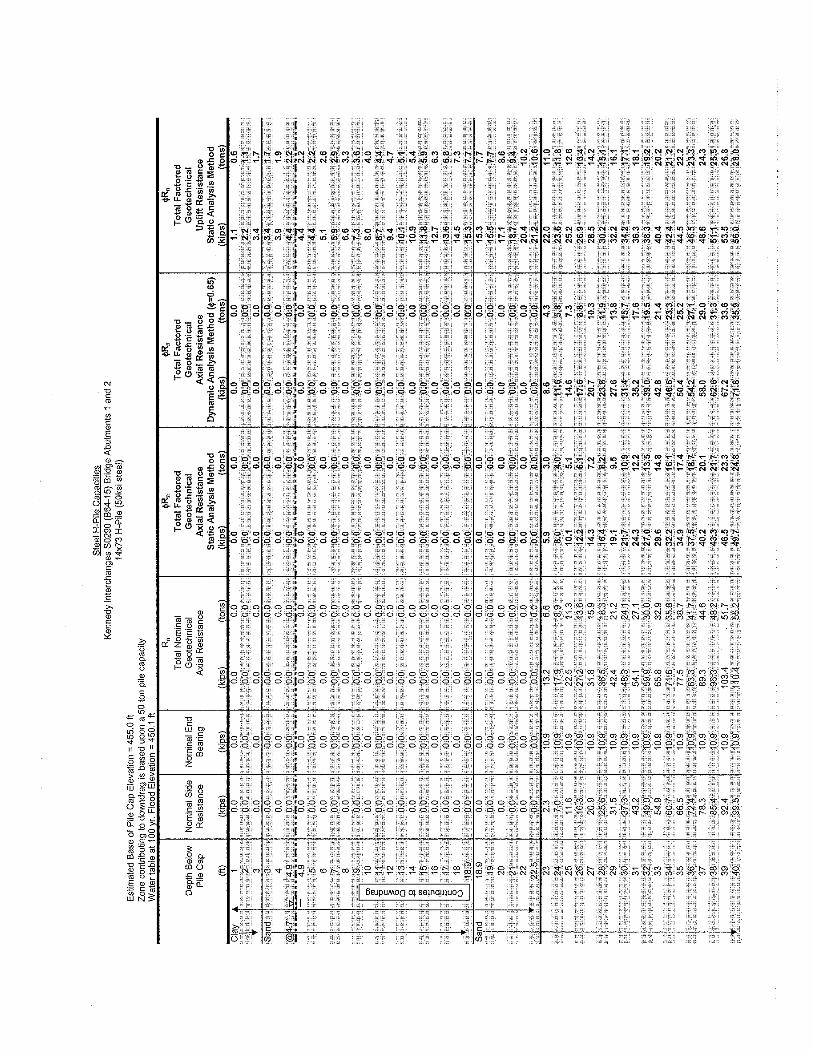
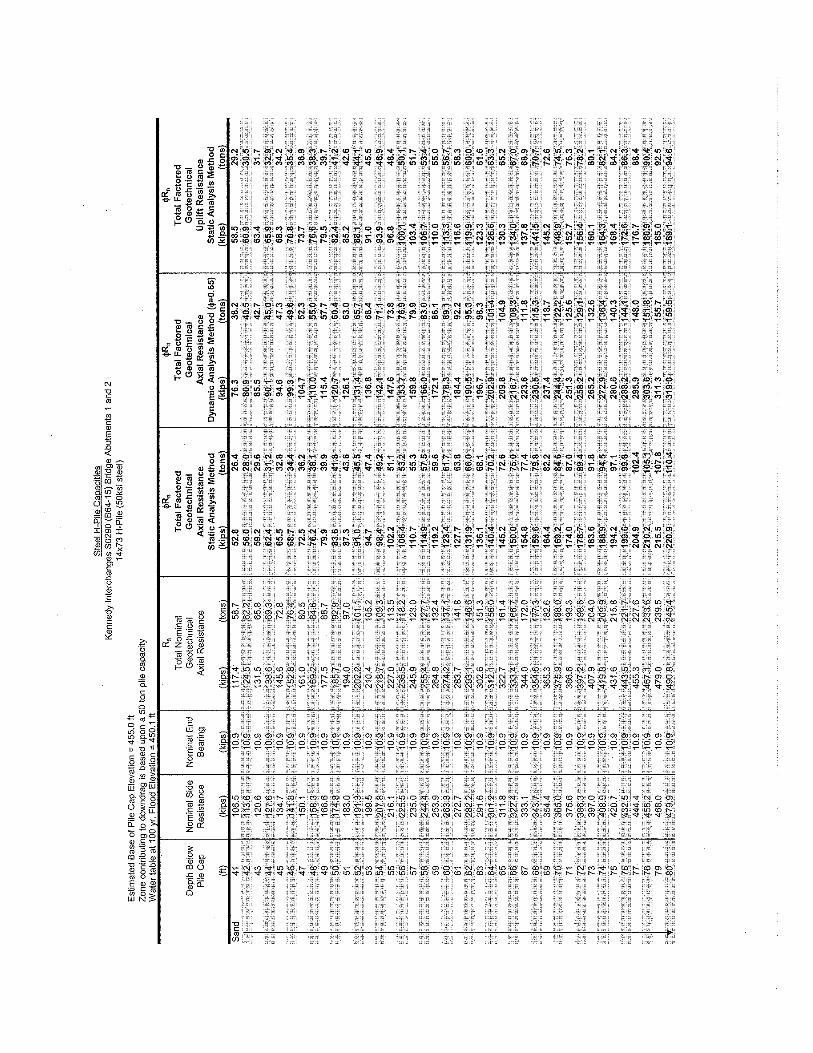
Based on information provided by the Designer, deep foundation elements bearing in the sand horizons overlying bedrock will be required and will rely primarily on friction resistance for axial capacity. A geotechnical engineer performed axial capacity estimates for three different H-pile sizes (12x53, 14x73 and 14x89). FMSM utilized the procedures outlined in the Federal Highway Administration Publication No. FHWA-HI-97-013, "Design and Construction of Driven Pile Foundations", and the computer program DRIVEN version 1.2, developed by Blue-Six Software, Inc. in conjunction with the FHWA, to estimate axial capacities of driven piles. The axial capacity calculations utilize soil parameters derived from the results of the field explorations and published correlations relating SP N-values to shear strengths. Appendix G provides an Idealized Soil Profile that outlines the recommended soil parameters for use in lateral load analyses. Refer to Appendix H for single shaft/pile nominal axial capacity estimates.
v:\lexington\adam\s0290\s0290 report.doc 10
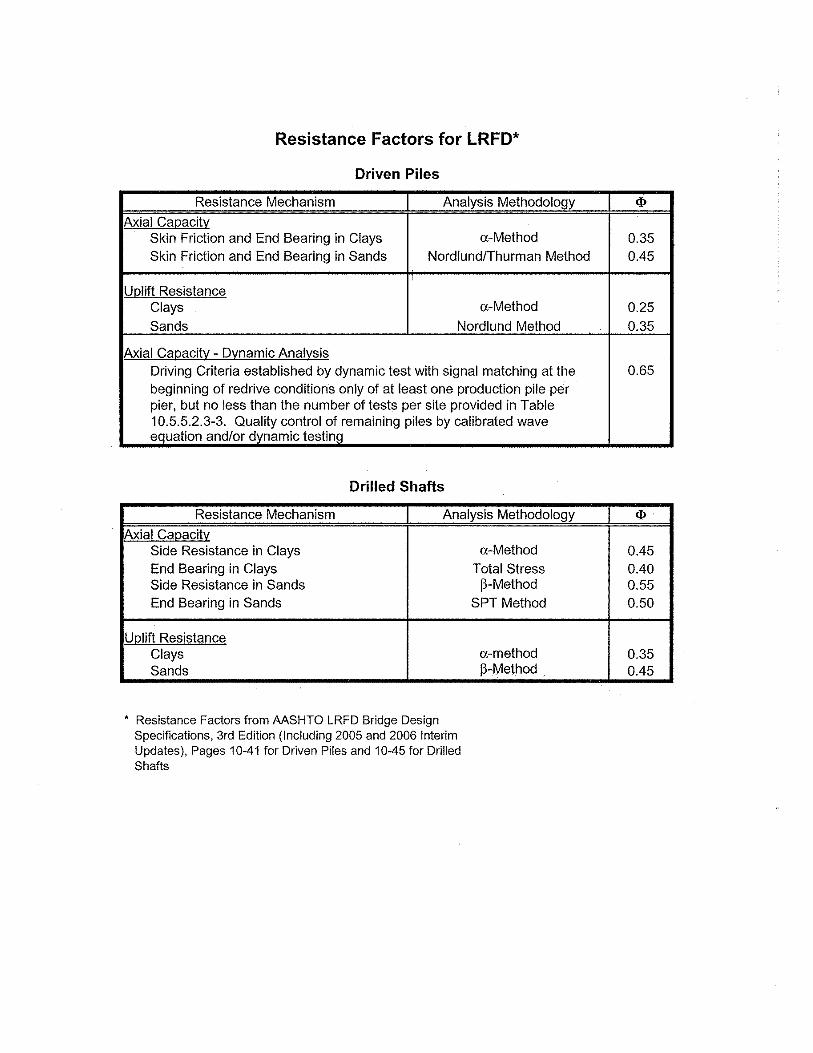
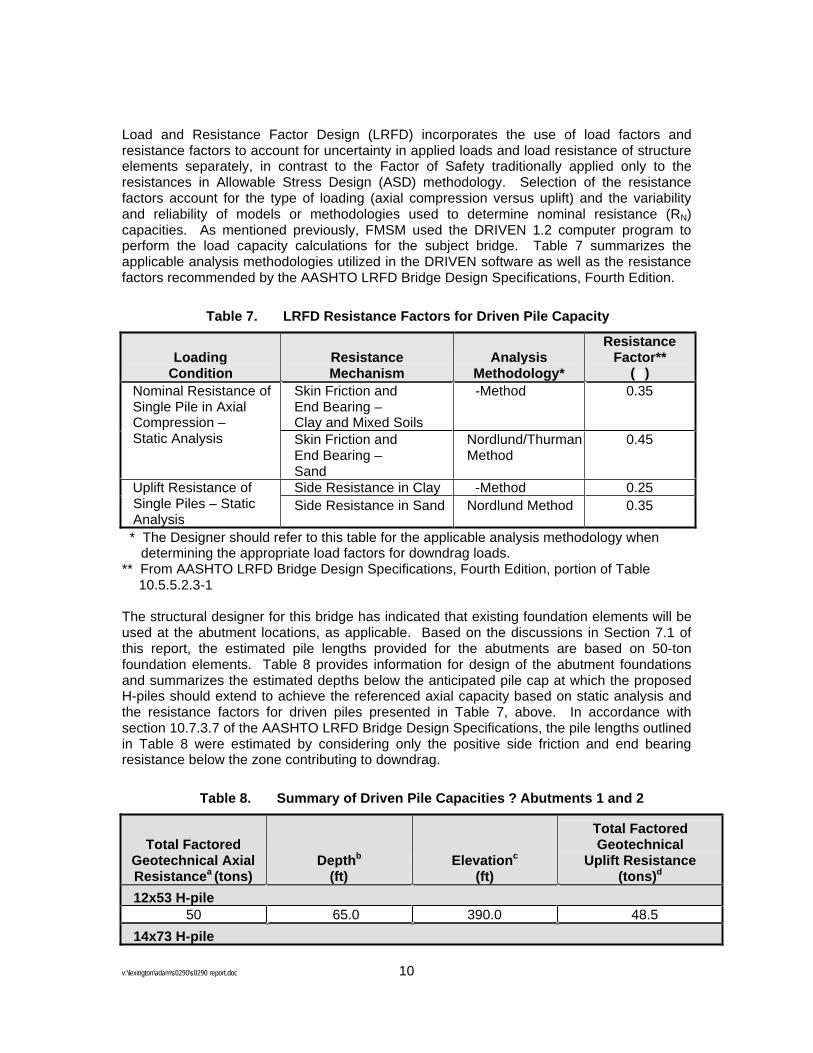
Load and Resistance Factor Design (LRFD) incorporates the use of load factors and resistance factors to account for uncertainty in applied loads and load resistance of structure elements separately, in contrast to the Factor of Safety traditionally applied only to the resistances in Allowable Stress Design (ASD) methodology. Selection of the resistance factors account for the type of loading (axial compression versus uplift) and the variability and reliability of models or methodologies used to determine nominal resistance (RN)capacities. As mentioned previously, FMSM used the DRIVEN 1.2 computer program to perform the load capacity calculations for the subject bridge. Table 7 summarizes the applicable analysis methodologies utilized in the DRIVEN software as well as the resistance factors recommended by the AASHTO LRFD Bridge Design Specifications, Fourth Edition.
Table 7. LRFD Resistance Factors for Driven Pile Capacity
LoadingCondition
ResistanceMechanism
Analysis Methodology*
ResistanceFactor**
( ) Skin Friction and End Bearing – Clay and Mixed Soils
-Method 0.35 Nominal Resistance of Single Pile in Axial Compression – Static Analysis Skin Friction and
End Bearing – Sand
Nordlund/Thurman Method
0.45
Side Resistance in Clay -Method 0.25 Uplift Resistance of Single Piles – Static Analysis
Side Resistance in Sand Nordlund Method 0.35
* The Designer should refer to this table for the applicable analysis methodology when determining the appropriate load factors for downdrag loads. ** From AASHTO LRFD Bridge Design Specifications, Fourth Edition, portion of Table
10.5.5.2.3-1
The structural designer for this bridge has indicated that existing foundation elements will be used at the abutment locations, as applicable. Based on the discussions in Section 7.1 of this report, the estimated pile lengths provided for the abutments are based on 50-ton foundation elements. Table 8 provides information for design of the abutment foundations and summarizes the estimated depths below the anticipated pile cap at which the proposed H-piles should extend to achieve the referenced axial capacity based on static analysis and the resistance factors for driven piles presented in Table 7, above. In accordance with section 10.7.3.7 of the AASHTO LRFD Bridge Design Specifications, the pile lengths outlined in Table 8 were estimated by considering only the positive side friction and end bearing resistance below the zone contributing to downdrag.
Table 8. Summary of Driven Pile Capacities ? Abutments 1 and 2
Total Factored Geotechnical Axial Resistancea (tons)
Depthb
(ft)Elevationc
(ft)
Total FactoredGeotechnical
Uplift Resistance (tons)d
12x53 H-pile50 65.0 390.0 48.5
14x73 H-pile

v:\lexington\adam\s0290\s0290 report.doc 11
Table 8. Summary of Driven Pile Capacities ? Abutments 1 and 2
Total Factored Geotechnical Axial Resistancea (tons)
Depthb
(ft)Elevationc
(ft)
Total FactoredGeotechnical
Uplift Resistance (tons)d
50 54.5 400.5 47.714x89 H-pile
50 51.0 404.0 46.7a Excludes any positive resistance within downdrag zone for Abutments 1 and 2. b Depth as measured from the bottom of the pile cap. c Based upon estimated bottom of pile cap at elevation 455.0. d Reported uplift resistance is for the corresponding pile length.
The Designer should note that these estimates are for the total factored geotechnical axial resistance (TFGAR) listed above. The tables presented in Appendix H for Abutments 1 and 2 are valid for the specified TFGAR only. The length estimates at the Abutments 1 and 2 locations are based on the pile capacities presented in Table 8 and the length of pile subjected to downdrag. Should more or less capacity be required, the Designer should consult FMSM because the downdrag load and length of pile subjected to downdrag are a function of the pile length. Additionally, should the elevation of the bottom of the pile cap change, pile lengths and elevations presented in Table 8 would no longer be valid and should be adjusted accordingly.
The pile lengths outlined in Table 8 are based on static analysis and the corresponding resistance factors outlined in Table 7. If construction specifications require dynamic analysis during pile installation as outlined in Table 10.5.5.2.3-1 of the AASHTO LRFD Bridge Design Specifications, Fourth Edition, the Designer may estimate pile lengths for bid documents on the appropriate resistance factor outlined in the AASHTO specifications, based on the level of field testing and construction control. The pile capacity tables in Appendix H also include a column of factored capacities utilizing a resistance factor ( dyn) of 0.65, which corresponds to a specific level of dynamic analysis testing during pile installation.
7.2.2. Hammer Energy
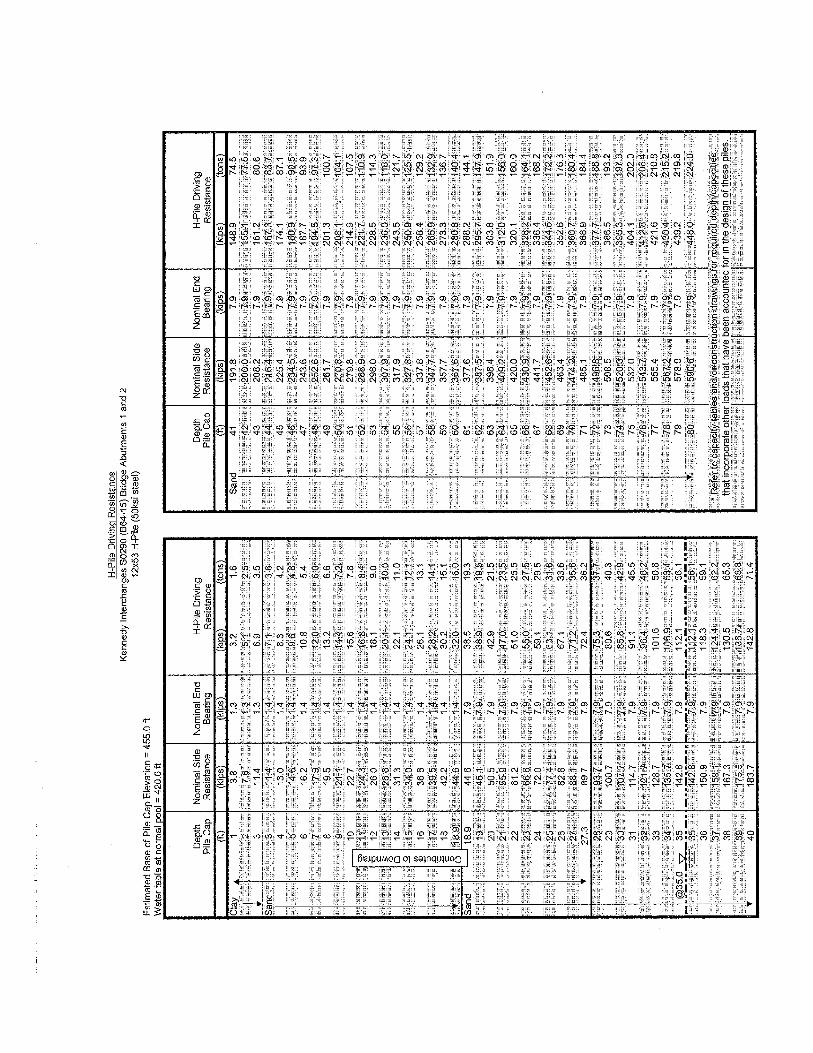
Static pile analyses estimate the ultimate driving resistance that 12-inch or 14-inch steel H-piles will experience during the installation process at the Abutment 1 location for the proposed bridge. FMSM utilized the guidelines presented in the FHWA publication "Soils and Foundations Workshop Manual" for the analyses.
The soil column contributing to driving resistance at the bridge location includes the upper clay layer and the underlying sand and gravel layers. The analyses are based on steel H-piles being driven to the maximum depths shown in Table 8 above for each of the three (3) pile types. Results of FHWA research and other literature regarding pile installation indicate that significant reductions in skin resistances occur during pile driving, primarily due to the dynamics of the installation process. Soils are remolded and pore water pressures apparently increase, causing reductions in shear strengths. The Kentucky Transportation Cabinet (KYTC) suggests the following reductions to skin resistances when estimating driving resistances:

v:\lexington\adam\s0290\s0290 report.doc 12
Clay - 50%
Sands - 25%
FMSM estimated the driving resistances under the condition that no interruptions, and therefore no pile "set" characteristics would be experienced during the driving process. Drivability analyses were conducted using the GRLWEAP (Version 2005) computer program for 12x53, 14x73 and 14x89 steel H-piles using common hammer manufactures presented in the hammer database of the GRLWEAP program.
The GRLWEAP analyses indicate that the ICE 30-S pile hammer which imparts approximately 22.5 ft-kips can drive the aforementioned piles to the specified depths without developing damaging compressive or tensile stresses within the pile, and without resulting in an excessive number of hammer blows per foot of driving. The FHWA publication titled "Soils and Foundations Workshop Manual-Second Edition" defines a reasonable range of hammer blows to be between 30 and 144 blows per foot for a steel H-pile. The Designer may use Appendix I in conjunction with Appendix H to determine a minimum driving resistance required to drive the pile to a sufficient depth to achieve the specified capacity.
7.3. Drilled Shaft Analyses
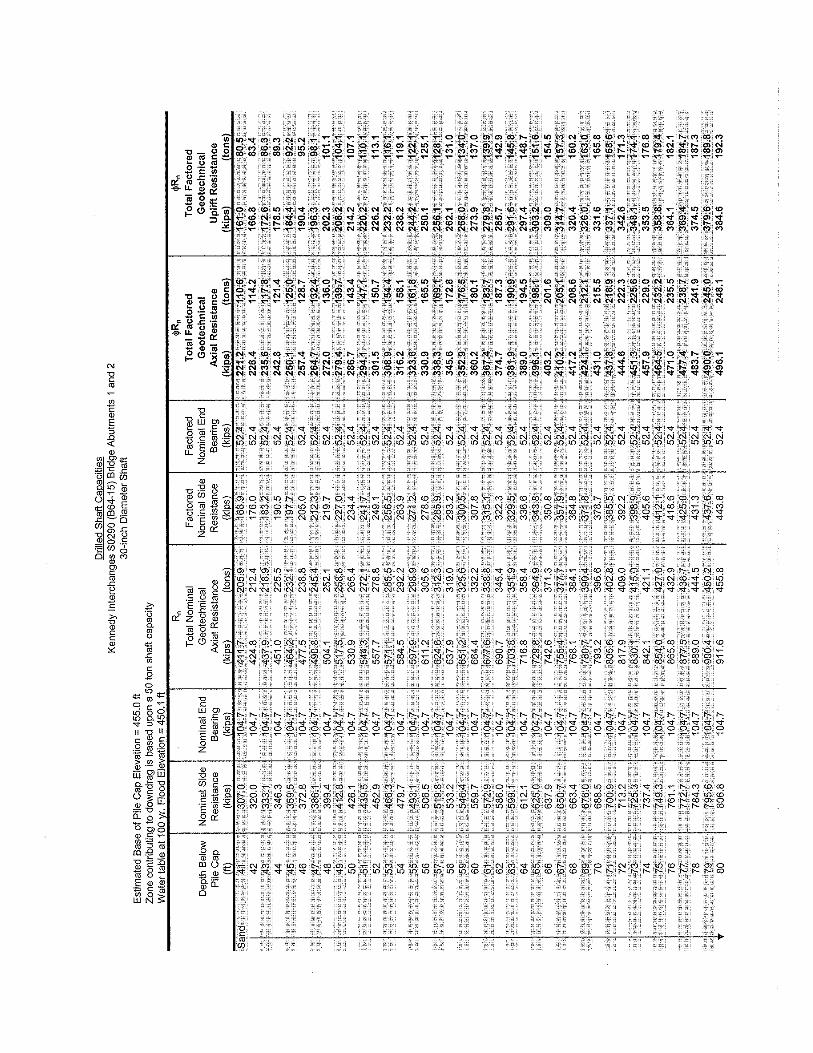
As previously stated, the foundation elements will bear in the sand horizons overlying bedrock and rely primarily on friction resistance for axial capacity. A geotechnical engineer performed axial shaft capacity estimates for 30-, 36-, 42-, and 48-inch diameter drilled shafts. FMSM utilized the procedures outlined in the Federal Highway Administration Publication No. FHWA-IF-99-025 and the computer program SHAFT version 4.0, written by Dr. Lymon L. Reese and Shin-Tower Wang, and marketed by Ensoft, Inc. to estimate axial capacities of drilled shafts. The axial capacity calculations utilize soil parameters derived from the results of the field explorations and published correlations relating SP N-values to shear strengths. Appendix G provides an Idealized Soil Profile that outlines the recommended soil parameters for use in lateral load analyses. Refer to Appendix H for single shaft/pile nominal axial capacity estimates.
As with driven piles, the selection of LRFD resistance factors for drilled shaft capacities involve an evaluation of the type of loading (axial compression versus uplift) and the variability and reliability of models or methodologies used to determine nominal resistance capacities. As mentioned previously, FMSM used the SHAFT 4.0 computer program to perform the load capacity calculations for the subject bridge widening. Table 9 summarizes the applicable analysis methodologies utilized in the SHAFT software as well as the resistance factors recommended by the AASHTO LRFD Bridge Design Specifications, Fourth Edition.
v:\lexington\adam\s0290\s0290 report.doc 13
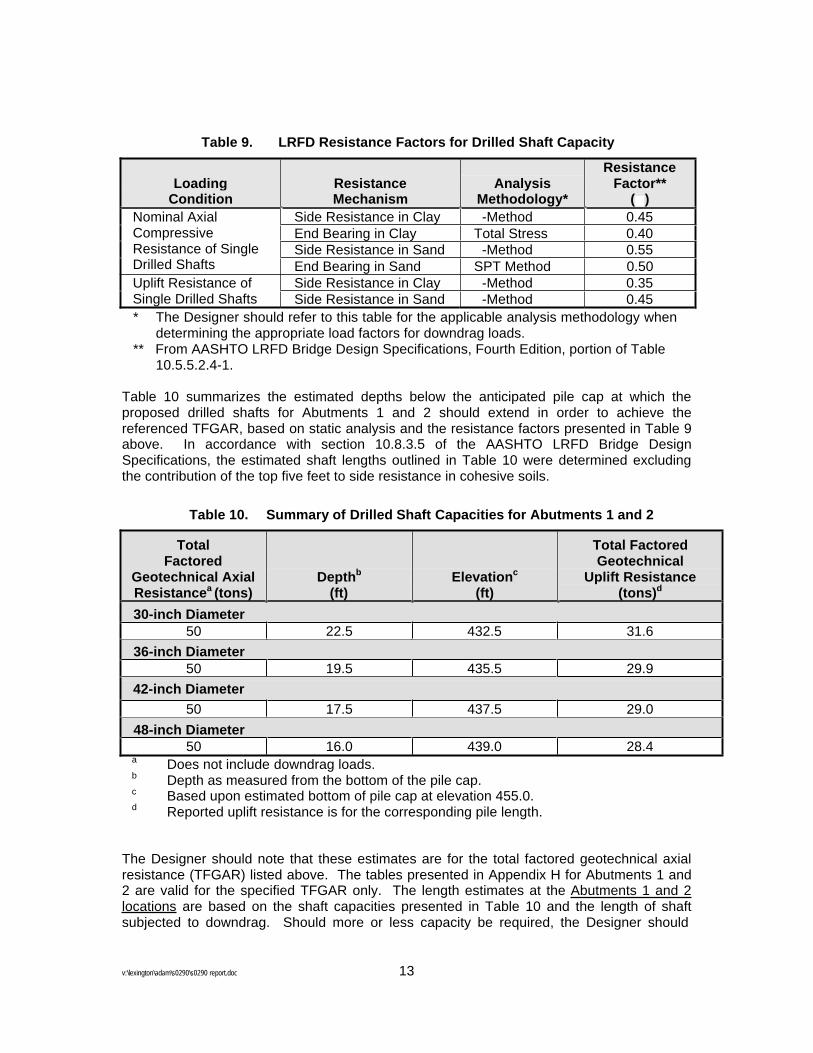
Table 9. LRFD Resistance Factors for Drilled Shaft Capacity
LoadingCondition
ResistanceMechanism
Analysis Methodology*
ResistanceFactor**
( ) Side Resistance in Clay -Method 0.45 End Bearing in Clay Total Stress 0.40 Side Resistance in Sand -Method 0.55
Nominal Axial Compressive Resistance of Single Drilled Shafts End Bearing in Sand SPT Method 0.50
Side Resistance in Clay -Method 0.35 Uplift Resistance of Single Drilled Shafts Side Resistance in Sand -Method 0.45 * The Designer should refer to this table for the applicable analysis methodology when
determining the appropriate load factors for downdrag loads. ** From AASHTO LRFD Bridge Design Specifications, Fourth Edition, portion of Table
10.5.5.2.4-1.
Table 10 summarizes the estimated depths below the anticipated pile cap at which the proposed drilled shafts for Abutments 1 and 2 should extend in order to achieve the referenced TFGAR, based on static analysis and the resistance factors presented in Table 9 above. In accordance with section 10.8.3.5 of the AASHTO LRFD Bridge Design Specifications, the estimated shaft lengths outlined in Table 10 were determined excluding the contribution of the top five feet to side resistance in cohesive soils.
Table 10. Summary of Drilled Shaft Capacities for Abutments 1 and 2
TotalFactored
Geotechnical Axial Resistancea (tons)
Depthb
(ft)Elevationc
(ft)
Total FactoredGeotechnical
Uplift Resistance (tons)d
30-inch Diameter50 22.5 432.5 31.6
36-inch Diameter50 19.5 435.5 29.9
42-inch Diameter50 17.5 437.5 29.0
48-inch Diameter50 16.0 439.0 28.4
a Does not include downdrag loads. b Depth as measured from the bottom of the pile cap. c Based upon estimated bottom of pile cap at elevation 455.0. d Reported uplift resistance is for the corresponding pile length.
The Designer should note that these estimates are for the total factored geotechnical axial resistance (TFGAR) listed above. The tables presented in Appendix H for Abutments 1 and 2 are valid for the specified TFGAR only. The length estimates at the Abutments 1 and 2 locations are based on the shaft capacities presented in Table 10 and the length of shaft subjected to downdrag. Should more or less capacity be required, the Designer should

v:\lexington\adam\s0290\s0290 report.doc 14
consult FMSM because the downdrag load and length of shaft subjected to downdrag are a function of the shaft length. Additionally, should the elevation of the bottom of the pile cap change, shaft lengths and elevations presented in Table 10 would no longer be valid and should be adjusted accordingly.
8. Embankment Stability Analyses
The ahead-station approach embankment is approximately 24 feet tall at the proposed location of Abutment 2. FMSM evaluated the global stability of the approach embankment-abutment-wingwall system at this location utilizing the REAME (Rotational Equilibrium Analysis of Multi-Layered Embankments) 2004 slope stability program, developed by Dr. Y.H. Huang at the University of Kentucky. The program estimates a circular (rotational) failure surface and calculates the factor of safety based on the Simplified Bishop method of slices. Short-term analyses using total-stress shear-strength parameters for the foundation and embankment materials simulate conditions that will exist immediately following the construction of the embankment. Long-term analyses, using effective-stress shear-strength parameters, simulate conditions that will exist long after the embankment is constructed and excess pore pressures within the materials have dissipated. Rapid drawdown analyses, using effective stress parameters and saturated soil conditions below a specified flood elevation, simulate conditions that will exist when water levels have receded following a flood event leaving the embankment materials in a saturated state. The current edition of the Kentucky Transportation Cabinet (KYTC) Geotechnical Manual presents target factors of safety for embankment stability situations. Table 11 summarizes these values.
Table 11. Bridge Approach Slopes
Short - Term Long ? Term Rapid Drawdown Bridge Approach Slopes 1.2 – 1.4 1.6 – 1.8 1.0 – 1.2
At the Abutment 2 location, short-term, long-term and rapid drawdown analyses returned factors of safety of 1.9, 1.6 and 1.6, respectively. These values meet or exceed the KYTC target values outlined in Table 11. Subsurface Data Sheet 4 of 4 in Appendix C presents results of the slope stability analyses, including predicted minimum factors of safety, predicted failure surfaces, and modeled groundwater table positions.
9. Settlement Analyses, Downdrag Estimates, and Lateral Squeeze Potential
9.1. Settlement Analyses
Project plans indicate the back-station approach embankments for the proposed bridge construction will be on the order of 22 feet in height. The subsurface exploration program indicates the foundation soils at the Abutment 1 location consist of approximately seven feet of clayey materials overlying sands up to a depth of approximately 87 feet. A geotechnical engineer performed settlement analyses at Abutment 1 to estimate the settlement of the foundation soils resulting from embankment construction and to evaluate the potential for negative skin friction or downdrag loads on the deep foundation elements.

v:\lexington\adam\s0290\s0290 report.doc 15
FMSM estimated settlement parameters for the foundations soils based on the results of the previously discussed laboratory testing. The geotechnical engineer estimated consolidation parameters for the clay type soils using the results of one-dimensional consolidation testing from nearby borings with similar engineering classifications. Settlement parameters for the granular (non-cohesive) materials were estimated based on corrected SP N-values correlated with laboratory classification testing as outlined in the guidelines presented in the FHWA Soils and Foundations Workshop Manual – Second Edition, pages 168 through 170.
FMSM performed settlement analyses at approximate I-64 Station 421+50, 75 feet right. In addition, time rate of settlement calculations were performed to estimate the time needed for the embankment to achieve primary consolidation (90% of total settlement) of the clay soils. Table 12 provides a summary of the settlement analyses performed for the subject bridge widening.
Table 12. Summary of Settlement Analyses
Estimated Settlement
Approximate Time Required for Primary
Consolidation (90%) of Cohesive Soils
LocationClay (in.)
Sands(in.)
Total(in.) (days) (weeks)
Abutment 1 (Back-Station
Approach)0.5 2.0 2.5 21 3
The Designer should note that settlement experienced at the proposed Abutment 1 location will have the effect of differential settlement with respect to the existing embankment. As discussed, construction of the proposed approach embankments will result in settlement of the underlying foundation soils. Based on the anticipated construction sequencing (installation of foundation elements at the abutment locations, construction of the planned breast wall, then construction of the embankment) the Designer should be aware that settlement will occur in the sand foundation soils below the tip elevation of the deep foundation elements. Settlement of the sands beneath the foundation elements will result in settlement of the pile/shaft group. It should be noted that this settlement is a result of construction of the embankment behind the breast wall abutment and not a result of structural loads placed on the shaft/pile group. Based on settlement calculations performed for the subject bridge structure and length estimates for the deep foundation elements, FMSM estimates this settlement to be less than ½ -inch for the pile foundation option and about 1-inch for the drilled shaft option. Because of the cohesionless nature of the soils beneath the bearing elevation of the deep foundation elements, this settlement should occur during construction of the embankment. The Contractor should be prepared to accommodate this settlement during construction.
9.2. Downdrag Estimates
Based on the anticipated loads and the subsurface profile at the bridge site, FMSM is recommending that the foundation systems for the bridge construction consist of deep foundation elements bearing in the sand horizons above the underlying bedrock. The settlement analyses presented in Section 9.1 of this report indicate that the clay and sand

v:\lexington\adam\s0290\s0290 report.doc 16
foundation soils at the Abutment 1 location may experience 2.5 inches of settlement due to construction of the planned back-station approach embankment. Approximately 0.5 inches of the estimated settlement will be consolidation within the clay layer underlying the embankment and 2.0 inches of the settlement will occur within the sands. Studies indicate that as little as 0.1 to 0.5 inches of settlement is sufficient to mobilize negative skin friction forces at the shaft/pile-soil interface. It is our understanding that the foundation elements will be constructed prior to fill placement as part of the embankment widening. Therefore, the proposed shafts/piles at this location will be subject to negative skin friction.
FMSM performed calculations to estimate downdrag loads resulting from settlement of the foundation soils in relation to the planned deep foundation elements. As recommended by the AASHTO LRFD Bridge Design Specifications, the downdrag analyses are based on relative soil movements of 0.4 inches between the foundation elements and the surrounding soil mass. The calculations are based on the lengths outlined in Table 8 and Table 10 for the maximum factored geotechnical axial resistance of the piles and for 50-ton capacity shafts. If the bridge design requires different lengths or capacities, the Designer should contact FMSM to re-evaluate the downdrag loads on the foundation elements. The calculations are based upon methods outlined in FHWA-HI-97-013 and FHWA-IF-99-025, which utilize soil strengths and effective stresses within the soil horizons. Table 13 outlines the potential negative skin friction estimates for both driven pile and drilled shaft foundation options.
Table 13. Estimated Maximum Downdrag Loads for Foundation Elements at Abutment 1
Estimated Maximum Downdrag Load
FoundationElement Type
Total FactoredGeotechnical
Axial Resistance(tons)
EstimatedTip
Elevation*(ft)
EstimatedElement Length
Subjected to Downdrag (ft) (kips) (tons)
12x53 Steel H-Pile 50 390.0 27.3 89.8 44.914x73 Steel H-Pile 50 400.5 22.5 83.4 41.714x89 Steel H-Pile 50 404.0 20.4 73.2 36.630" Drilled Shaft 50 432.5 13.4 78.2 39.136" Drilled Shaft 50 435.5 12.4 79.2 39.642" Drilled Shaft 50 437.5 10.9 69.0 34.548" Drilled Shaft 50 439.0 10.1 65.4 32.7
* As outlined in Tables 8 and 10 ** As measured downward from the bottom of the pile cap (Elev. 455.0 ft)
Because of the anticipated construction sequencing and schedule for construction of the planned bridge, a waiting period for anticipated settlement is not realistic prior to installation of the deep foundation elements. Therefore, the downdrag/negative skin friction forces should be considered in the design of the foundation elements. Recommendations are being provided in Section 11 for possible ways to deal with the downdrag loads.
9.3. Lateral Squeeze Potential
Studies conducted by the FHWA have shown that some bridge end bents supported on piles driven through thick deposits of compressible soils have tilted or rotated toward the embankment. Many end bents have experienced large horizontal movements resulting in structural damage. The condition causing the structural deformation is the unbalanced fill
v:\lexington\adam\s0290\s0290 report.doc 17
loading on the area surrounding the end bents, which causes the foundation soils to move (squeeze) laterally. This squeeze can transmit a large lateral thrust along the length of the piles embedded within the compressible foundation soils, resulting in the tops of the piles rotating toward the embankment.
FHWA guidelines suggest that if the pressure exerted by the weight of the embankment exceeds three times the undrained shear strength of the foundation soils, the potential for lateral squeeze exists. A review of the subsurface data obtained from the borings indicates the clay soils beneath the Abutment 1 approach embankment exhibit an undrained shear strength of 1,300 psf. The embankment loading at this location was estimated to be approximately 2,168 psf. Based on the noted criteria, the embankment loading at Abutment 1 does not exceed three times the average value of the foundation soil's undrained shear strength, indicating that the potential for lateral squeeze is low at this location and should be not be considered in the design of the foundation system.
10. Seismic Design Considerations
10.1. General
The 2007 AASHTO LRFD Bridge Design Specifications provides guidelines for selecting a seismic performance category and a soil profile type for bridge sites. This information establishes the elastic seismic response coefficient and spectrum for use in further structural design and analyses.
According to these guidelines, the bridge site classifies as Seismic Performance Zone 1 with an acceleration coefficient (A) of approximately 0.06 with a 90 percent probability of not being exceeded in 50 years (based on the 1988 NEHRP mapping included in the AASHTO LRFD Bridge Design Specifications, Fourth Edition). It is recommended that Soil Profile Type I soils be used in selecting the site coefficient (S). Further seismic analyses were beyond the scope of FMSM?s work for this project.
10.2. Liquefaction Potential of On-Site Soils
Liquefaction of soils is a phenomenon that may occur during seismic loading when a loose, saturated soil deposit experiences loss of shear strength. The short duration, cyclic loading induced by an earthquake increases the pore-water pressure in the soil skeleton, which, in turn, decreases the effective stress, resulting in a decrease in the soil's shear strength. If the pore water pressure becomes equal to the total stress acting on the soil, the effective stress becomes zero and liquefaction occurs.
Factors that affect the liquefaction susceptibility of a soil deposit are:
Soil Structure
Grain Characteristics
Relative Density
Confining Pressure
Maximum Ground Acceleration

v:\lexington\adam\s0290\s0290 report.doc 18
Duration of Earthquake
Soil structure constitutes both the geometric arrangement of soil particles and the interparticle forces, which act between them. Loose, cohesionless soils tend to be more susceptible to liquefaction than soils which are dense or in which cohesion constitutes significant parts of their shear strengths.
Grain characteristics of a soil are important in evaluating liquefaction susceptibility. Generally, soils with grain sizes equal to or smaller than the size of sand may be susceptible to liquefaction, depending on interparticle forces and/or density. Evidence is available to support that uniformly graded soils tend to be more susceptible to liquefaction and that fine sands tend to liquefy more readily than clays, silts, or gravely soils.
Determination of in situ relative density is also important in determining a soil's liquefaction susceptibility. Loosely deposited soils, in which in situ density is low relative to the maximum density, are more likely to liquefy than densely deposited soils. It has been shown that contractive soils (soils which tend to decrease in volume during shearing) may experience a loss of strength during shearing and subsequent liquefaction, while dilative soils (soils which tend to increase in volume during shearing) are less susceptible to this same strength loss and subsequent liquefaction.
Considerable data show that liquefaction potential of a soil is reduced by increasing the confining pressure. Consequently, liquefaction is less likely to occur at greater depths where confining pressures are higher.
Lower specific gravity has two effects on liquefaction susceptibility. First, confining pressure is lower, thus liquefaction potential is increased; and second, shear stresses induced during an earthquake are lower due to lower soil unit weights; thus liquefaction potential is decreased. The lower specific gravity of soils, therefore, has both positive and negative effects on liquefaction susceptibility.
Liquefaction potential is also very dependent on the magnitude of ground acceleration and duration of an earthquake. Obviously, a strong earthquake would increase the likelihood of liquefaction.
Based on these criteria, a review of drilling, sampling, and laboratory testing performed for this project; and the seismic categorization summarized in Section 10.1 of this report; it is FMSM's opinion that if the following recommendations for foundation construction are implemented, a detailed study to determine the liquefaction potential for soils at this site is not warranted.
11. Conclusions and Recommendations
FMSM developed the following recommendations based upon reviews of available data, information obtained during the field exploration, results of laboratory testing and engineering analyses, and discussions with the Designer and KYTC personnel. The recommendations are also based on the structure configuration presented in drawings downloaded from the KTA ProjectWise website on January 19, 2007.

v:\lexington\adam\s0290\s0290 report.doc 19
11.1. General
11.1.1. At the writing of this report, a borrow source for embankment material has not beenidentified. It is recommended that borrow material to be used for embankment constructionmeet the following minimum strength parameters.
Embankment Material Retained Fill Total Stress Effective Stress Total Stress Effective Stress
c = 1400 psf = 200 psf c = 1400 psf = 170 psf= 0° = 23° = 0° = 27°
= 120 pcf = 120 pcf = 120 pcf = 120 pcf
The retained fill material shall be placed in the entire area between the breast wall and a 1:1(H:V) line sloping upward and away from the base of the breast wall to the top of the breast wall. Non-durable shales and fat clays (USCS classification of CH) should specifically beexcluded from use within this zone.
The Contractor shall perform laboratory testing to confirm that the minimum total stress andeffective stress strength parameters are equal to our greater than the above values per material type for each borrow area. The test results shall be submitted to the Engineer forapproval.
11.1.2. Backfill behind the breast wall can consist of retained fill as noted above or non-erodible granular embankment. Coefficients of active earth pressure (Ka) were determinedbased on Coulomb earth pressure theory using phi angles of 27 and 38 degrees, based on avertical back of wall, and friction angles between the back of the wall and backfill of 17 and 29 degrees. Based on a unit weight of 120 pounds per cubic foot for the backfill material, thefollowing equivalent fluid pressures are applicable:
Retained Fill ( 27° Granular Embankment ( 38°
Slope of Backfill
Coefficient of Active Earth Pressure (Ka)
EquivalentFluid PressurePer Linear Foot
Coefficient of Active Earth Pressure (Ka)
EquivalentFluid PressurePer Linear Foot
Level 0.335 40 psf 0.218 26 psf3:1 (H:V) 0.464 56 psf 0.274 33 psf 2:1 (H:V) 0.714 86 psf 0.323 39 psf
Drainage systems consisting of free draining material and filter fabric shall be placed directlybehind the wall and be a minimum thickness of two feet. Use of filter fabric will help reducethe infiltration of fines into the granular material behind the wall and help reduce clogging ofthe drainage system. In addition, weep holes should also be provided in the design of the walls. If a drainage system is not provided, the design should incorporate full hydrostaticforces behind the wall.
11.1.3. Based on information provided by the Designer, portions of the existing foundationsystem will be incorporated into the foundation supporting the planned bridge. It is ourunderstanding that existing piles will remain and be used, where possible, in construction of the new bridge substructure elements.

v:\lexington\adam\s0290\s0290 report.doc 20
11.1.4. It is recommended that the Designer determine the current loading on the foundation elements to remain in place. The existing piles should not be designed to carry additional loading beyond its current design load. If this cannot be done and additional capacity is needed, the Designer should consider one of the following in the design:
a. Add additional friction piles/shafts.
b. Completely remove the existing pile caps, cut-off the existing piles, and design and construct a new foundation system.
11.1.5. It is recommended that, at a minimum, one existing pile at each substructure element to be used in the proposed bridge substructure be subjected to non-destructive tests prior to construction of the new pile caps. The Contractor may choose to perform load testing on existing piles that will not be incorporated into the new bridge structure to provide a more realistic estimate of the existing pile capacities.
11.1.6. Construction of the approach embankments for the subject bridge will involve widening of the existing interstate embankment. Project plans indicate the back-station approach embankment will be on the order of 22 feet in height. The subsurface exploration program indicates the foundation soils at the abutment locations consist of approximately seven feet of clayey materials overlying sands up to a depth of approximately 87 feet. The settlement analyses presented in Section 9.1 of this report indicate that the clay and sand foundation materials may experience settlement on the order of 2.5 inches with 2.0 inches occurring in the sands and 0.5 inches occurring in the clays at the Abutment 1 location. AASHTO specifications indicate that as little as 0.4 inches of settlement is sufficient to mobilize negative skin friction. Therefore, it is recommended that the design of steel H-piles and/or drilled shaft foundation elements include the anticipated down-drag forces. The downdrag estimates provided in Section 9.2 of this report are for the total factored geotechnical axial resistance of the H-piles and a 50-ton factored geotechnical axial resistance for drilled shaft elements installed to the estimated elevations outlined in Table 8 and Table 10 only. If the bridge design requires different lengths or capacities, the Designer should contact FMSM to re-evaluate the downdrag loads on the foundation elements.
11.1.7. Because the abutments will be breast wall abutments, the construction sequence will not allow a waiting period for settlement to occur prior to installing foundation elements. Therefore, one of the following alternatives may be implemented to reduce the downdrag loads:
a. Coat piles with bitumen slip layer to allow movement between the soil and the piles. Current practice allows for as much as 90 percent reduction in downdrag forces with this method.
b. Predrill and provide a polypropylene or steel sleeve for the pile to reduce down-drag. This method only prevents contact between the pile and adjacent soils.
c. Design the embankment with lightweight fill to reduce the overall settlement of the foundation soils.
d. Substitute an MSE wall with a stub type abutment for the full-height CIP breast wall abutment and allow the settlement to occur before the piles are installed.

v:\lexington\adam\s0290\s0290 report.doc 21
If consolidation of foundation soils is allowed to occur prior to driving the piles, which could be an option with item d (MSE wall), the piles do not need to be designed to accommodate down-drag loads. Also, allowing the foundation soils to consolidate will reduce the potential for abutment rotation associated with lateral squeeze. With the MSE wall option, a wick drain system could be designed and installed to accelerate consolidation of the foundation soils. If this is considered a viable option, the geotechnical consultant should be contacted to assist in the design of such a system.
11.1.8. Foundation excavations should be properly braced/shored to provide adequate safety to people working in or around the excavations. Bracing should be performed in accordance with applicable federal, state and local guidelines.
11.1.9. The Contractor should be made aware that the subject bridge is located near existing buildings. To better understand the source of construction vibrations and how they are attenuated to the existing buildings, it is recommended that a program be developed to record peak particle velocities (PPV) prior to and during roadway construction. Digital seismograph units should be placed between roadway construction activities and the existing structures.
11.1.10. The largest peak particle velocities that will be generated at surrounding buildings by proposed nearby construction activities are unknown at this time. It is recommended that a pile driving test program be performed prior to the installation of the production piles, and a preconstruction survey of existing structural defects of nearby structures be conducted and documented before the beginning of pile driving. This test program can be used to help establish threshold PPVs for the surrounding area and equipment.
11.1.11. The Designer may use the information provided herein to aid in the design of the foundation systems. Should the Designer require pile/shaft capacities other than the factored geotechnical axial resistances provided (more or less), the geotechnical consultant should be contacted to assist the Designer. It should be noted that the downdrag load and length of pile/shaft subjected to downdrag is a function of the design capacity/length of the foundation element. The geotechnical consultant is available to assist the Designer during foundation design.
11.1.12. Based on the AASHTO LRFD Bridge Design Specifications, Fourth edition, the bridge site classifies as Seismic Performance Category A, with an acceleration coefficient (A) of 0.06, with a 90 percent probability of not being exceeded in 50 years (based on the 1988 NEHRP map included in the referenced edition of the AASHTO specifications). It is recommended that Soil Profile Type I soils be used in selecting the site coefficient (S).
11.2. Steel H-Pile Option
11.2.1. The following table provides estimated pile lengths applicable for the recommended total factored geotechnical axial resistances (TFGAR) at abutment locations. The Designer should note that these estimates are for the TFGAR referenced in the following table only. The tables presented in Appendix H for Abutments 1 and 2 are valid for the specified TFGAR only. The length estimates at the Abutments 1 and 2 location are based on the pile capacities presented in the table and length of pile subjected to downdrag. Should more or less capacity be required, the Designer should consult FMSM because the downdrag load and length of pile subjected to downdrag are a function of pile length.
v:\lexington\adam\s0290\s0290 report.doc 22
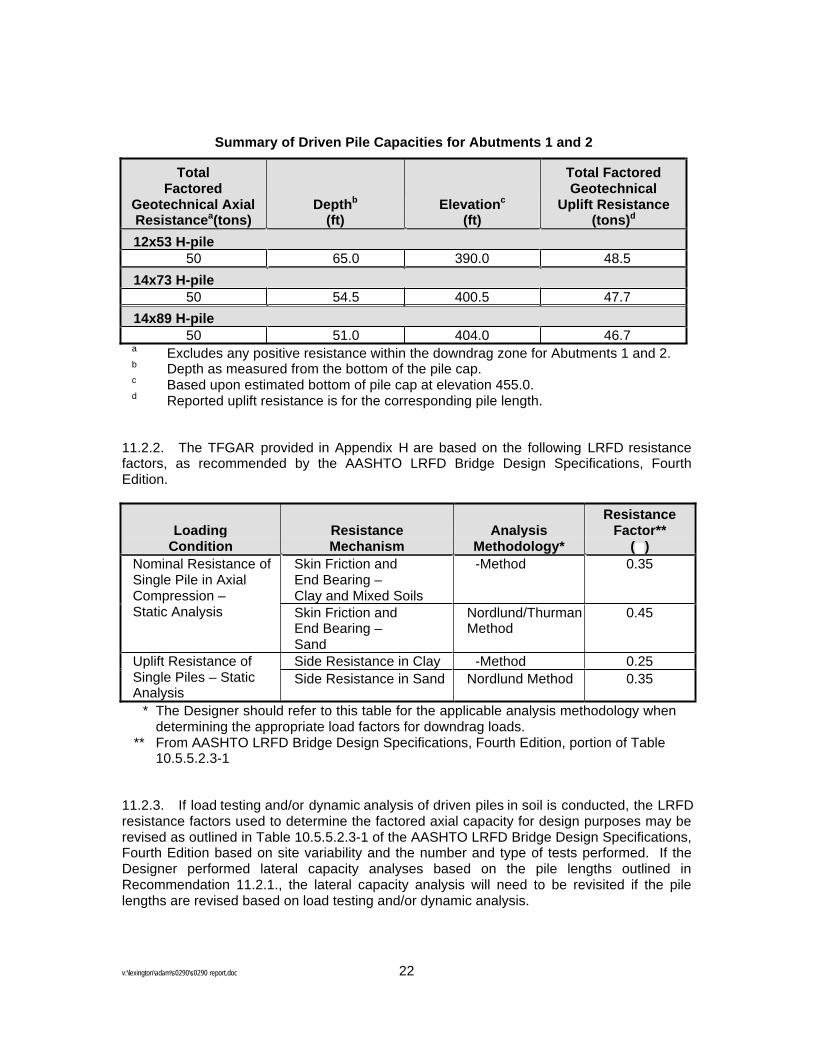
Summary of Driven Pile Capacities for Abutments 1 and 2
TotalFactored
Geotechnical Axial Resistancea(tons)
Depthb
(ft)Elevationc
(ft)
Total FactoredGeotechnical
Uplift Resistance (tons)d
12x53 H-pile50 65.0 390.0 48.5
14x73 H-pile50 54.5 400.5 47.7
14x89 H-pile50 51.0 404.0 46.7
a Excludes any positive resistance within the downdrag zone for Abutments 1 and 2. b Depth as measured from the bottom of the pile cap. c Based upon estimated bottom of pile cap at elevation 455.0. d Reported uplift resistance is for the corresponding pile length.
11.2.2. The TFGAR provided in Appendix H are based on the following LRFD resistance factors, as recommended by the AASHTO LRFD Bridge Design Specifications, Fourth Edition.
LoadingCondition
ResistanceMechanism
Analysis Methodology*
ResistanceFactor**
( ) Skin Friction and End Bearing – Clay and Mixed Soils
-Method 0.35 Nominal Resistance of Single Pile in Axial Compression – Static Analysis Skin Friction and
End Bearing – Sand
Nordlund/Thurman Method
0.45
Side Resistance in Clay -Method 0.25 Uplift Resistance of Single Piles – Static Analysis
Side Resistance in Sand Nordlund Method 0.35
* The Designer should refer to this table for the applicable analysis methodology when determining the appropriate load factors for downdrag loads.
** From AASHTO LRFD Bridge Design Specifications, Fourth Edition, portion of Table 10.5.5.2.3-1
11.2.3. If load testing and/or dynamic analysis of driven piles in soil is conducted, the LRFD resistance factors used to determine the factored axial capacity for design purposes may be revised as outlined in Table 10.5.5.2.3-1 of the AASHTO LRFD Bridge Design Specifications, Fourth Edition based on site variability and the number and type of tests performed. If the Designer performed lateral capacity analyses based on the pile lengths outlined in Recommendation 11.2.1., the lateral capacity analysis will need to be revisited if the pile lengths are revised based on load testing and/or dynamic analysis.

v:\lexington\adam\s0290\s0290 report.doc 23
11.2.4. As noted, all pile capacities presented in Appendix H are for single piles. In addition to applying appropriate resistance factors, individual capacities for piles in group configurations may be further reduced depending upon soil type, bearing condition of the pile cap, or center-to-center spacing as recommended in the current edition of the AASHTO LRFD Bridge Design Specifications. The following criteria should be observed:
Group Efficiency Factor Cohesive Soils Cohesionless Soils
CTCSpacing
Cap not in firm Contact with Ground
Cap in firm Contact with Ground
Cap in or not in firm Contact with Ground
6B 1.00 1.00 1.002.5B 0.65 1.00 1.00
The notation "B" is the pile diameter and the percent reduction can be linearly interpolated between the values and spacing provided.
11.2.5. The AASHTO LRFD Bridge Design Specifications recommend a resistance factor for horizontal geotechnical resistance of a single pile or pile group of 1.0 for lateral capacity analyses. Appendix G provides an Idealized Soil Profile that outlines the recommended soil parameters for use in lateral load analyses.
11.2.6. Use Grade 50 steel H-piles as friction piles. Piles should be driven to the target elevation and then left for a minimum of one day to allow for dissipation of excess pore pressures caused by the pile installation process. This should allow the soil to "set-up". After the one day waiting period, re-strike the piles to see if an adequate capacity has been achieved.
11.2.7. The hammer energy which could drive the pile section were based on the ultimate driving resistance that 12x53, 14x73 and 14x89 steel H-piles would experience during the installation process. The results of these calculations indicate that a hammer energy on the order of 22.5 foot-kips will be needed to drive the 12- and 14-inch piles to the recommended bearing elevation.
11.2.8. The Designer should place a note on the drawings that states: A hammer system capable of delivering a minimum energy of 22.5 foot-kips will be necessary to drive the 12X53, 14X73, and 14X89 H-Pile to depths of 65.0, 54.5, and 51.0 feet, respectively, below the pile cap without encountering excessive blow counts and over-stressing the piles. The Contractor should submit appropriate pile driving systems to the Kentucky Transportation Cabinet for approval prior to the installation of the first pile. Approval of the pile driving system by the Engineer will be subject to satisfactory field performance of the pile driving procedures.
11.2.9 Upon selecting the pile size and length required to support the applied loads, the Designer should select the minimum driving resistance required to install the pile to the design depth from Appendix I. This driving resistance should be reported to the Contractor to aid in determining when/if the pile has been driven to a sufficient depth to achieve the specified capacity.
11.2.10. Pile types, driving systems and installations should conform to current AASHTO Standard Specifications for Highway Bridges unless otherwise specified.

v:\lexington\adam\s0290\s0290 report.doc 24
11.2.11. Drivability studies were performed assuming continuous driving. If interruptions in driving individual piles should occur, difficulties in continuing the installation process will likely occur due to pile "set-up" characteristics.
11.2.12. The AASHTO LRFD Bridge Design Specifications, Fourth Edition recommends the following resistance factors for determining the structural capacity of steel H-piles.
Resistance Factor*
Loading Condition
Piles Subjected to Damage From Severe Driving Conditions**
GoodDriving Conditions
Axial Resistance c = 0.50 c = 0.60 In Compression
Combined Axial and N/A c = 0.70 Flexural Resistance f = 1.00
* As specified in Section 6.5.4.2 of the AASHTO LRFD Bridge Design Specifications, Fourth Edition ** Apply these values only to the section of the pile likely to be damaged during driving (Section 6.15.2 of the AASHTO specifications)
11.2.13. The capacity of the steel H-piles shall also consider the anticipated negative skin resistance/downdrag loads. AASHTO LRFD Bridge Design Specifications indicate that for friction piles subjected to downdrag loading, downdrag shall be considered at the service, strength and extreme limit states.
11.2.14. Construction of the proposed approach embankment will result in settlement of the underlying foundation soils. Based on the anticipated construction sequencing (installation of foundation elements at the abutment locations, construction of the planned breast wall, then construction of the embankment) the Designer should be aware that settlement will occur in the sand foundation soils below the tip elevation of the deep foundation elements at the abutment locations, resulting in settlement of the pile group. Based on settlement calculations performed for the subject bridge structure and length estimates for the deep foundation elements, FMSM estimates this settlement to be less than about ½-inch for the pile foundation option at both abutments. Because of the cohesionless nature of the soils beneath the bearing elevation of the piles, this settlement should occur during construction of the embankment. The Contractor should be prepared to accommodate this settlement during construction.
Drilled Shaft Option
11.3.1. Drilled Shaft Integrity Testing will be required for each drilled shaft. An appropriate number of Crosshole Sonic Logging (CSL) access tubes (approximately 3), consisting of two (2) inch nominal diameter schedule 40 steel pipe, will be required. These tubes should be shown on the drilled shaft details with the following note on the Drilled Shaft Detail Sheet:
Perform non destructive Drilled Shaft Integrity Testing on the Drilled Shafts using Crosshole Sonic Logging (CSL) in accordance with the "Special Note for Non-Destructive Testing of Drilled Shafts". The Department will pay for this testing and

v:\lexington\adam\s0290\s0290 report.doc 25
associated costs at the contract unit bid price for "CSL Testing". This includes CSL Testing Mobilization and CSL Testing. The access tubes are incidental to the shaft.
11.3.2. The following table provides estimated pile lengths applicable for the recommended total factored geotechnical axial resistances (TFGAR) at abutment locations. The Designer should note that these estimates are for the TFGAR referenced in the following table only. The tables presented in Appendix H for Abutments 1 and 2 are valid for the specified TFGAR only. The length estimates at the Abutments 1 and 2 location are based on the shaft capacities presented in the table and length of shaft subjected to downdrag. Should more or less capacity be required, the Designer should consult FMSM because the downdrag load and length of shaft subjected to downdrag are a function of shaft length.
Summary of Drilled Shaft Capacities for Abutments 1 and 2
TotalFactored
Geotechnical Axial Resistancea/Element
(tons)Depthb
(ft)Elevationc
(ft)
Total FactoredGeotechnical
Uplift Resistance (tons)d
30-inch Diameter50 22.5 432.5 31.6
36-inch Diameter50 19.5 435.5 29.9
42-inch Diameter50 17.5 437.5 29.0
48-inch Diameter50 16.0 439.0 28.4
a Does not include downdrag loads. b Depth as measured from the bottom of the pile cap. c Based upon estimated bottom of pile cap at elevation 455.0. d Reported uplift resistance is for the corresponding pile length.
11.3.3. The TFGAR estimates provided in Appendix H were derived utilizing the following LRFD resistance factors as recommended by the AASHTO LRFD Bridge Design Specifications, Fourth Edition.
11.3.4. If load testing of drilled shafts in soil is conducted, the LRFD resistance factors used to determine the factored axial capacity for design purposes may be revised as outlined in Table 10.5.5.2.4-1 of the AASHTO LRFD Bridge Design Specifications, Fourth Edition based on the number of tests performed and site variability. The Designer should note that lateral capacity requirements will need to be revisited if the shaft lengths are revised based on load testing.

v:\lexington\adam\s0290\s0290 report.doc 26
LoadingCondition
ResistanceMechanism
Analysis Methodology
ResistanceFactor*
( ) Side Resistance in Clay -Method 0.45 End Bearing in Clay Total Stress 0.40 Side Resistance in Sand -Method 0.55
Nominal Axial Compressive Resistance of Single Drilled Shafts End Bearing in Sand SPT Method 0.50
Side Resistance in Clay -Method 0.35 Uplift Resistance of Single Drilled Shafts Side Resistance in Sand -Method 0.45
* The Designer should refer to this table for the applicable analysis methodology when determining the appropriate load factors for downdrag loads.
** From AASHTO LRFD Bridge Design Specifications, Fourth Edition, portion of Table 10.5.5.2.4-1
11.3.5. As noted, all shaft capacities presented in Appendix H are for single shafts. In addition to applying appropriate resistance factors, individual capacities for shafts in group configurations should be further reduced depending upon center-to-center spacing as recommended in the current edition of the AASHTO LRFD Bridge Design Specifications. The following criteria should be observed.
CTCSpacing
Group Efficiency Factor forCohesive Soils
Group Efficiency Factor forNon-Cohesive Soils
6B 1.00 N/A4B 0.80 1.00
2.5B 0.65 0.65
The notation "B" is the shaft diameter and the percent reduction can be linearly interpolated between the values and spacing provided.
11.3.6. The AASHTO LRFD Bridge Design Specifications recommend a resistance factor for horizontal geotechnical resistance of a single shaft or shaft group of 1.0 for lateral capacity analyses. Appendix G provides an Idealized Soil Profile that outlines the recommended soil parameters for use in lateral load analyses.
11.3.7. The Contractor should embed the drilled shafts to the plan tip elevation or to an elevation as directed by the Engineer.
11.3.8. If temporary casing for drilled shafts is used during construction, the Contractor should either wait until concrete has been placed for the entire length of the shaft before pulling the casing, or the level of the concrete being placed should be maintained several
feet above the hydrostatic head as the casing is retrieved. These measures should be implemented by the Contractor to reduce the likelihood of soils collapsing into the shaft excavation and detrimentally affecting the structural integrity of the drilled shafts.
11.3.9. It is recommended that Class A Modified concrete in accordance with the current KYTC Special Note for Drilled Shafts be used in construction of the drilled shafts. The concrete should also exhibit good workability, i.e., high slump. Once an excavation is
v:\lexington\adam\s0290\s0290 report.doc 27
complete and the steel reinforcing cage has been placed, concrete should be tremmied to the bottom of the shaft and should replace/displace any water or slurry remaining after drilling operations.
11.3.10. If drilling slurry is to be used during drilled shaft installations, the slurry should be capable of suspending the soil particles encountered and not leave a thick coating of slurry, or "mud", on the excavation sides or bottom. In accordance with the current "Special Note for Drilled Shafts", the Contractor shall submit a detailed plan for its use and disposal along with a drilled shaft installation plan to the Geotechnical Branch of the Kentucky Transportation Cabinet for approval prior to implementation. The Contractor shall supply all equipment and construction techniques involving slurry that are necessary to maintain environmental standards.
11.3.11. Unless otherwise specified, all construction methods and materials used for drilled shaft installations shall be in accordance with the current "Special Note for Drilled Shafts".
11.3.12. The capacity of the shafts shall also consider the anticipated negative skin resistance/downdrag loads. AASHTO LRFD Bridge Design Specifications indicate that for friction shafts subjected to downdrag loading, downdrag shall be considered at the service, strength and extreme limit states.
11.3.13. Construction of the proposed approach embankment will result in settlement of the underlying foundation soils. Based on the anticipated construction sequencing (installation of foundation elements at the abutment locations, construction of the planned breast wall, then construction of the embankment) the Designer should be aware that settlement will occur in the sand foundation soils below the tip elevation of the deep foundation elements at the abutment locations, resulting in settlement of the shaft group. Based on settlement calculations performed for the subject bridge structure and length estimates for the deep foundation elements, FMSM estimates this settlement to be less than about 1-inch for the drilled shaft foundation option. Because of the cohesionless nature of the soils beneath the bearing elevation of the shafts at both abutments, this settlement should occur during construction of the embankment. The Contractor should be prepared to accommodate this settlement during construction.
12. Environmental Concerns
As a part of the Kennedy Interchange project, several bridges and retaining walls will be constructed within or near areas that are known or suspected to have environmental contaminates. The bridge covered as a part of this report is located near to several areas where a Phase II environmental site assessment is planned. Environmental Site 23 and 24 "Allied Ready Mix" is located approximately 450 feet to the west of the proposed bridge location. At the time of writing this report, the Phase II environmental site assessments have not been completed on these sites. Upon completion of the Phase II environmental site assessments, the Designer should review the subject environmental reports from the nearby sites for a better determination of potential concerns relative to foundation construction and worker protection. The map provided in Appendix J illustrates the location of the bridge in relation to the identified environmental sites.
v:\lexington\adam\s0290\s0290 report.doc 28
13. Closing
13.1. The conclusions and recommendations presented herein are based on data and subsurface conditions from the borings drilled during the March and May 2006 exploration using that degree of care and skill ordinarily exercised under similar circumstances by competent members of the engineering profession. No warranties can be made regarding the continuity of conditions between borings.
13.2 General soil and rock descriptions and indicated boundaries are based on an engineering interpretation of all available subsurface information and may not necessarily reflect the actual variation in subsurface conditions between borings and samples. Collected data and field interpretation of conditions encountered in individual borings are shown on the drafted sheets in Appendix C.
13.3. The observed water levels and/or conditions indicated on the boring logs are as recorded at the time of exploration. These water levels and/or conditions may vary considerably, with time, according to the prevailing climate, rainfall, tail water elevations or other factors and are otherwise dependent on the duration of and methods used in the exploration program.
13.4. FMSM exercised sound engineering judgment in preparing the subsurface information presented herein. This information has been prepared and is intended for design and estimating purposes. Its presentation on the plans or elsewhere is for the purpose of providing intended users with access to the same information available to the KYTC. This subsurface information interpretation is presented in good faith and is not intended as a substitute for personal investigations, independent interpretations or judgments of the Contractor.
13.5. All structure details shown herein are for illustrative purposes only and may not be indicative of the final design conditions shown in the contract plans.
Appendix A
Location Map


Appendix B
Client Drawings from ProjectWise
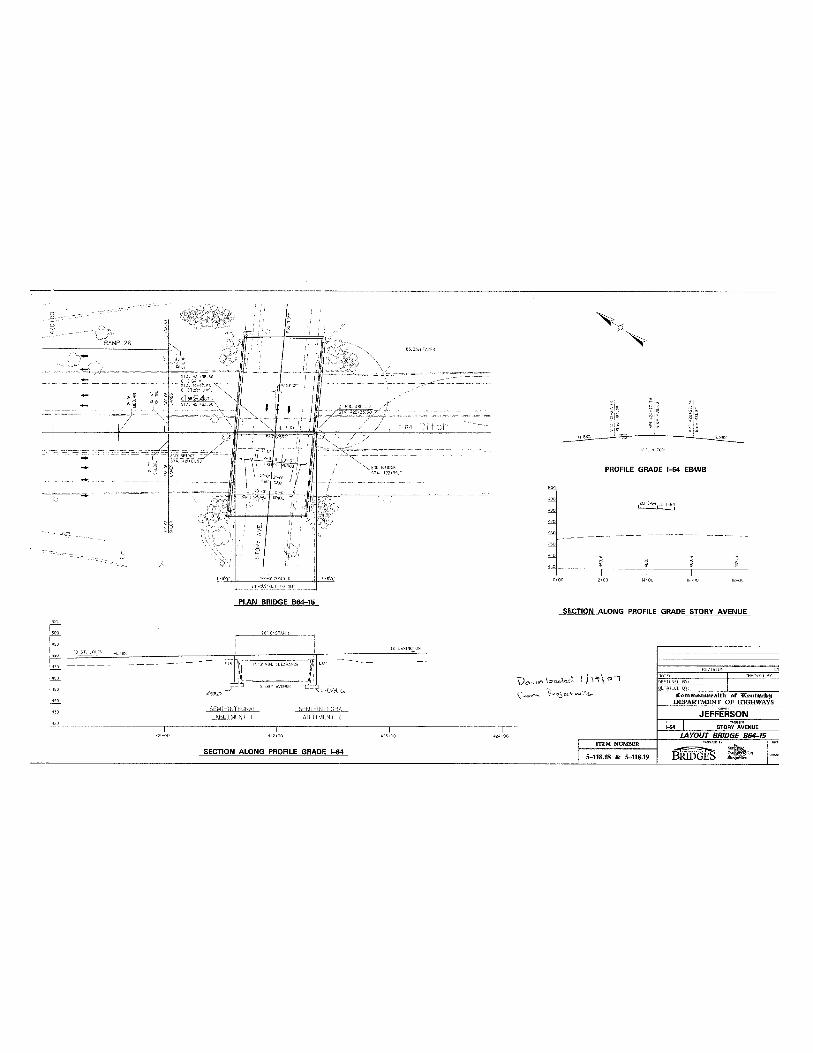

Appendix C
Subsurface Data Sheets