Embed Size (px)
Citation preview
Report of Investigations 9651
Material Properties Affecting the Stabilityof a 50-Year-Old Rock Dump in an ActiveMine
D.R. Tesarik and R.W. McKibbin
U.S. DEPARTMENT OF HEALTH AND HUMAN SERVICESPublic Health Service
Centers for Disease Control and PreventionNational Institute for Occupational Safety and Health
Pittsburgh Research LaboratoryPittsburgh, PA
December 1999

International Standard Serial NumberISSN 1066-5552
CONTENTSPage
Abstract . . . . . . . . . . . . . . . . . . . . . . . . . . . . . . . . . . . . . . . . . . . . . . . . . . . . . . . . . . . . . . . . . . . . . . . . . . . . . . . . . . . . . . 1Introduction . . . . . . . . . . . . . . . . . . . . . . . . . . . . . . . . . . . . . . . . . . . . . . . . . . . . . . . . . . . . . . . . . . . . . . . . . . . . . . . . . . . 2Site description . . . . . . . . . . . . . . . . . . . . . . . . . . . . . . . . . . . . . . . . . . . . . . . . . . . . . . . . . . . . . . . . . . . . . . . . . . . . . . . . . 2Field-determined material properties . . . . . . . . . . . . . . . . . . . . . . . . . . . . . . . . . . . . . . . . . . . . . . . . . . . . . . . . . . . . . . . . 3Hydraulic conductivity predicted from particle-size distribution . . . . . . . . . . . . . . . . . . . . . . . . . . . . . . . . . . . . . . . . . . . 6Downhole water content measurements . . . . . . . . . . . . . . . . . . . . . . . . . . . . . . . . . . . . . . . . . . . . . . . . . . . . . . . . . . . . . . 8Laboratory-determined material properties . . . . . . . . . . . . . . . . . . . . . . . . . . . . . . . . . . . . . . . . . . . . . . . . . . . . . . . . . . . 11Particle size analysis using image processing . . . . . . . . . . . . . . . . . . . . . . . . . . . . . . . . . . . . . . . . . . . . . . . . . . . . . . . . . 18Weather station . . . . . . . . . . . . . . . . . . . . . . . . . . . . . . . . . . . . . . . . . . . . . . . . . . . . . . . . . . . . . . . . . . . . . . . . . . . . . . . . . 19Summary and conclusions . . . . . . . . . . . . . . . . . . . . . . . . . . . . . . . . . . . . . . . . . . . . . . . . . . . . . . . . . . . . . . . . . . . . . . . . 21Acknowledgments . . . . . . . . . . . . . . . . . . . . . . . . . . . . . . . . . . . . . . . . . . . . . . . . . . . . . . . . . . . . . . . . . . . . . . . . . . . . . . 21References . . . . . . . . . . . . . . . . . . . . . . . . . . . . . . . . . . . . . . . . . . . . . . . . . . . . . . . . . . . . . . . . . . . . . . . . . . . . . . . . . . . . 21
ILLUSTRATIONS
1. Rock dump failure caused by water runoff . . . . . . . . . . . . . . . . . . . . . . . . . . . . . . . . . . . . . . . . . . . . . . . . . . . . . . . 22. Rock dump with 15-m-high vertical benches . . . . . . . . . . . . . . . . . . . . . . . . . . . . . . . . . . . . . . . . . . . . . . . . . . . . . 33. Drillhole and infiltrometer sites . . . . . . . . . . . . . . . . . . . . . . . . . . . . . . . . . . . . . . . . . . . . . . . . . . . . . . . . . . . . . . . 44. Frame for in situ density tests . . . . . . . . . . . . . . . . . . . . . . . . . . . . . . . . . . . . . . . . . . . . . . . . . . . . . . . . . . . . . . . . . 55. Density frame covered with natural latex rubber sheeting . . . . . . . . . . . . . . . . . . . . . . . . . . . . . . . . . . . . . . . . . . . 56. Density pit lined with polyethylene sheeting and filled with water . . . . . . . . . . . . . . . . . . . . . . . . . . . . . . . . . . . . 57. Infiltrometer . . . . . . . . . . . . . . . . . . . . . . . . . . . . . . . . . . . . . . . . . . . . . . . . . . . . . . . . . . . . . . . . . . . . . . . . . . . . . . 68. Water content versus depth . . . . . . . . . . . . . . . . . . . . . . . . . . . . . . . . . . . . . . . . . . . . . . . . . . . . . . . . . . . . . . . . . . 99. Change in water content versus depth since September 16, 1994 . . . . . . . . . . . . . . . . . . . . . . . . . . . . . . . . . . . . . . 10
10. Particle-size distribution curve for site 1 . . . . . . . . . . . . . . . . . . . . . . . . . . . . . . . . . . . . . . . . . . . . . . . . . . . . . . . . 1211. Particle-size distribution curve for site 2 . . . . . . . . . . . . . . . . . . . . . . . . . . . . . . . . . . . . . . . . . . . . . . . . . . . . . . . . 1212. Particle-size distribution curve for site 3 . . . . . . . . . . . . . . . . . . . . . . . . . . . . . . . . . . . . . . . . . . . . . . . . . . . . . . . . 1313. Particle-size distribution curve for site 4. . . . . . . . . . . . . . . . . . . . . . . . . . . . . . . . . . . . . . . . . . . . . . . . . . . . . . . . . 1314. Particle-size distribution curve for site 5 . . . . . . . . . . . . . . . . . . . . . . . . . . . . . . . . . . . . . . . . . . . . . . . . . . . . . . . . 1415. Particle-size distribution curve for site 6 . . . . . . . . . . . . . . . . . . . . . . . . . . . . . . . . . . . . . . . . . . . . . . . . . . . . . . . . 1416. Particle-size distribution curve for site 7 . . . . . . . . . . . . . . . . . . . . . . . . . . . . . . . . . . . . . . . . . . . . . . . . . . . . . . . . 1517. Particle-size distribution curve for site 8 . . . . . . . . . . . . . . . . . . . . . . . . . . . . . . . . . . . . . . . . . . . . . . . . . . . . . . . . 1518. Particle-size distribution curve for site 9 . . . . . . . . . . . . . . . . . . . . . . . . . . . . . . . . . . . . . . . . . . . . . . . . . . . . . . . . 1619. Particle-size distribution curve for site 10 . . . . . . . . . . . . . . . . . . . . . . . . . . . . . . . . . . . . . . . . . . . . . . . . . . . . . . . 1620. Particle-size distribution curve for site 11 . . . . . . . . . . . . . . . . . . . . . . . . . . . . . . . . . . . . . . . . . . . . . . . . . . . . . . . 1721. Particle-size distribution curve for site 12 . . . . . . . . . . . . . . . . . . . . . . . . . . . . . . . . . . . . . . . . . . . . . . . . . . . . . . . 1722. Particle-size distribution curves generated from mechanical and digital image processing sorts . . . . . . . . . . . . . . 1823. Maximum wind velocity and azimuth versus time . . . . . . . . . . . . . . . . . . . . . . . . . . . . . . . . . . . . . . . . . . . . . . . . . 1924. Minimum and maximum temperature versus time . . . . . . . . . . . . . . . . . . . . . . . . . . . . . . . . . . . . . . . . . . . . . . . . . 2025. Precipitation versus time . . . . . . . . . . . . . . . . . . . . . . . . . . . . . . . . . . . . . . . . . . . . . . . . . . . . . . . . . . . . . . . . . . . . . 20
TABLES
1. Investigations of rock dump stability . . . . . . . . . . . . . . . . . . . . . . . . . . . . . . . . . . . . . . . . . . . . . . . . . . . . . . . . . . . 32. Density, water content, and void ratio . . . . . . . . . . . . . . . . . . . . . . . . . . . . . . . . . . . . . . . . . . . . . . . . . . . . . . . . . . 53. Results of infiltration tests . . . . . . . . . . . . . . . . . . . . . . . . . . . . . . . . . . . . . . . . . . . . . . . . . . . . . . . . . . . . . . . . . . . 64. Hydraulic conductivity predicted from particle-size distributions, entire sample . . . . . . . . . . . . . . . . . . . . . . . . . . 75. Hydraulic conductivity predicted from particle-size distributions, sand fractions . . . . . . . . . . . . . . . . . . . . . . . . . 76. Correlation coefficients for calculated hydraulic conductivity and measured infiltration rates . . . . . . . . . . . . . . . 87. Degree of saturation at 0.3 m . . . . . . . . . . . . . . . . . . . . . . . . . . . . . . . . . . . . . . . . . . . . . . . . . . . . . . . . . . . . . . . . . 118. Soil classification data . . . . . . . . . . . . . . . . . . . . . . . . . . . . . . . . . . . . . . . . . . . . . . . . . . . . . . . . . . . . . . . . . . . . . . 11

UNIT OF MEASURE ABBREVIATIONS USED IN THIS REPORTcm centimeter mm millimeter
deg degree m/s meter per second
g gram m/s2 meter per second squared
kg kilogram m2/s square meter per second
kg/m3 kilogram per cubic meter pct percent
km kilometer V volt
L liter ° degree
m meter °C degree Celcius
min minute
MATERIAL PROPERTIES AFFECTING THE STABILITY OF A 50-YEAR-OLD ROCK DUMP IN AN ACTIVE MINE
By D.R. Tesarik1 and R.W. McKibbin2
ABSTRACT
Material properties affecting slope stability were measured in a large 50-year-old, partially consolidated rockdump located in an active open-pit mine. Field tests included single-ring infiltration and density. In addition,a nuclear depth-moisture gauge was used to measure water content in six stainless-steel-cased drillholes on thecrest and an upper bench of the rock dump. Precipitation, evaporation, wind speed and direction, andtemperature data were collected at a weather station installed on the dump’s crest. Laboratory tests includedparticle-size distribution, specific gravity, Atterberg limits, and water content. By measuring material propertiesof a rock dump presumed to be stable, the safety of miners working on or at the toe of old rock dumpsconstructed of similar material and located in a similar climate can be assessed.
1Mechanical engineer, Spokane Research Laboratory, National Institute for Occupational Safety and Health, Spokane, WA.2Mining engineer.
2
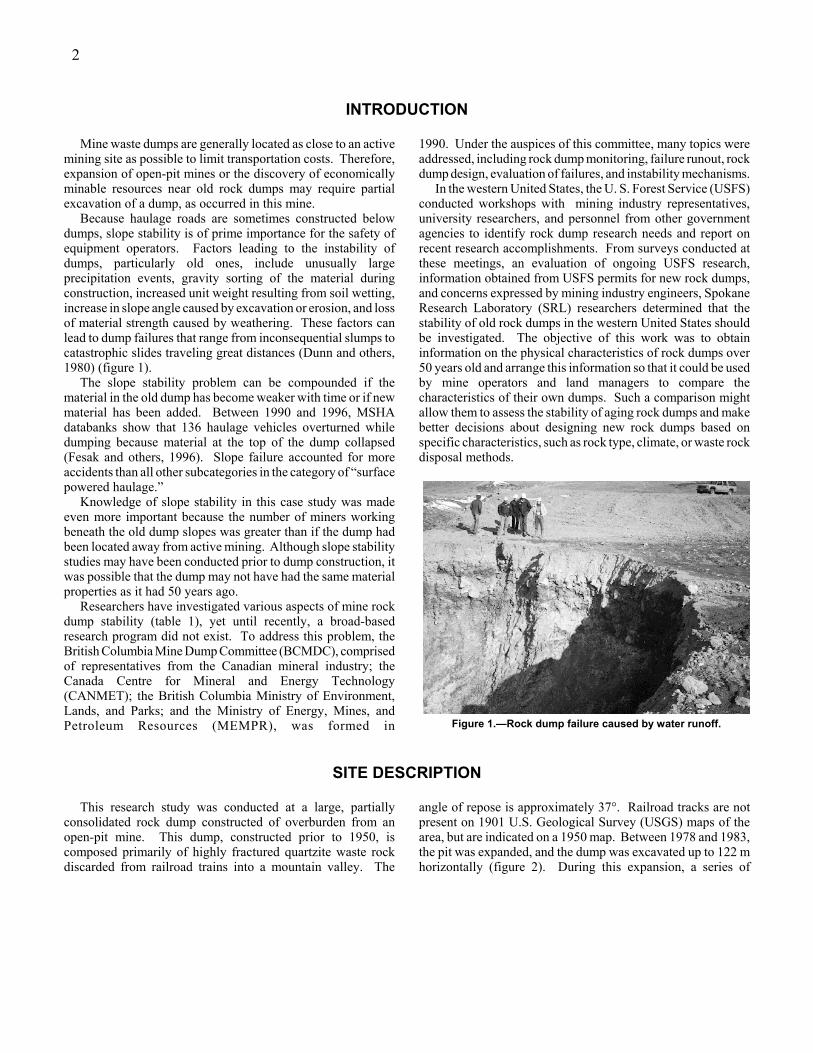
Figure 1.—Rock dump failure caused by water runoff.
INTRODUCTION
Mine waste dumps are generally located as close to an activemining site as possible to limit transportation costs. Therefore,expansion of open-pit mines or the discovery of economicallyminable resources near old rock dumps may require partialexcavation of a dump, as occurred in this mine.
Because haulage roads are sometimes constructed belowdumps, slope stability is of prime importance for the safety ofequipment operators. Factors leading to the instability ofdumps, particularly old ones, include unusually largeprecipitation events, gravity sorting of the material duringconstruction, increased unit weight resulting from soil wetting,increase in slope angle caused by excavation or erosion, and lossof material strength caused by weathering. These factors canlead to dump failures that range from inconsequential slumps tocatastrophic slides traveling great distances (Dunn and others,1980) (figure 1).
The slope stability problem can be compounded if thematerial in the old dump has become weaker with time or if newmaterial has been added. Between 1990 and 1996, MSHAdatabanks show that 136 haulage vehicles overturned whiledumping because material at the top of the dump collapsed(Fesak and others, 1996). Slope failure accounted for moreaccidents than all other subcategories in the category of “surfacepowered haulage.”
Knowledge of slope stability in this case study was madeeven more important because the number of miners workingbeneath the old dump slopes was greater than if the dump hadbeen located away from active mining. Although slope stabilitystudies may have been conducted prior to dump construction, itwas possible that the dump may not have had the same materialproperties as it had 50 years ago.
Researchers have investigated various aspects of mine rockdump stability (table 1), yet until recently, a broad-basedresearch program did not exist. To address this problem, theBritish Columbia Mine Dump Committee (BCMDC), comprisedof representatives from the Canadian mineral industry; theCanada Centre for Mineral and Energy Technology(CANMET); the British Columbia Ministry of Environment,Lands, and Parks; and the Ministry of Energy, Mines, andPetroleum Resources (MEMPR), was formed in
1990. Under the auspices of this committee, many topics wereaddressed, including rock dump monitoring, failure runout, rockdump design, evaluation of failures, and instability mechanisms.
In the western United States, the U. S. Forest Service (USFS)conducted workshops with mining industry representatives,university researchers, and personnel from other governmentagencies to identify rock dump research needs and report onrecent research accomplishments. From surveys conducted atthese meetings, an evaluation of ongoing USFS research,information obtained from USFS permits for new rock dumps,and concerns expressed by mining industry engineers, SpokaneResearch Laboratory (SRL) researchers determined that thestability of old rock dumps in the western United States shouldbe investigated. The objective of this work was to obtaininformation on the physical characteristics of rock dumps over50 years old and arrange this information so that it could be usedby mine operators and land managers to compare thecharacteristics of their own dumps. Such a comparison mightallow them to assess the stability of aging rock dumps and makebetter decisions about designing new rock dumps based onspecific characteristics, such as rock type, climate, or waste rockdisposal methods.
SITE DESCRIPTION
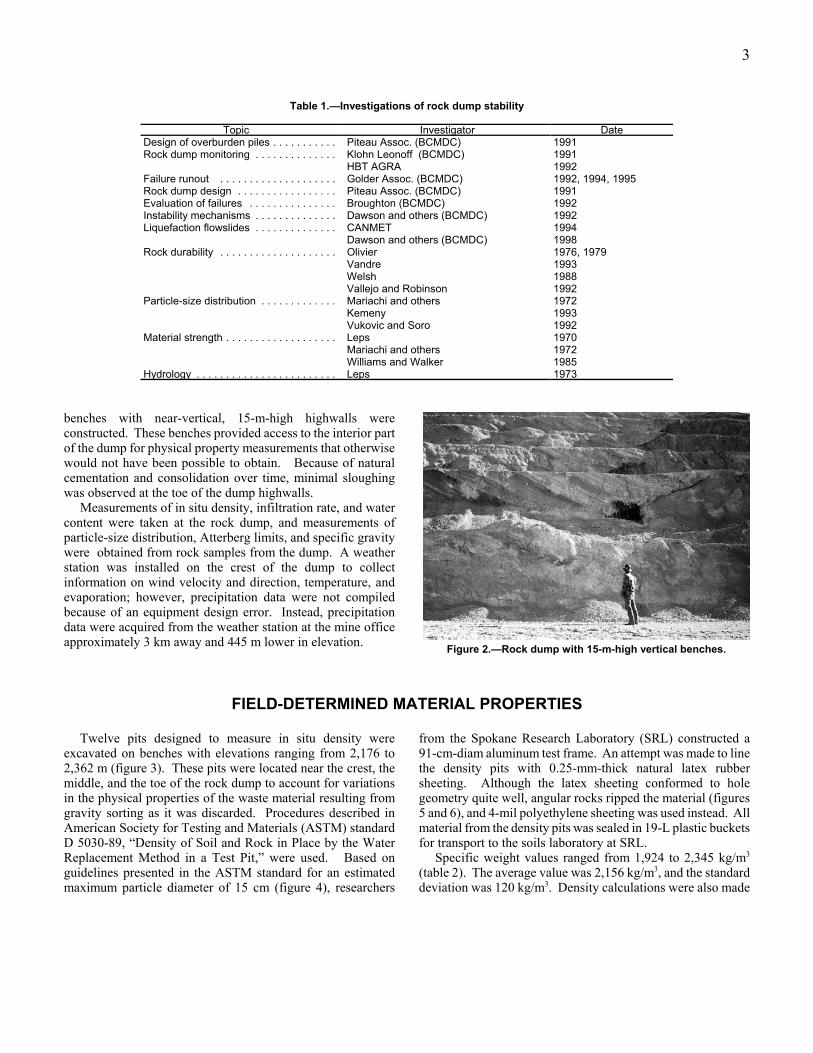
This research study was conducted at a large, partiallyconsolidated rock dump constructed of overburden from anopen-pit mine. This dump, constructed prior to 1950, iscomposed primarily of highly fractured quartzite waste rockdiscarded from railroad trains into a mountain valley. The
angle of repose is approximately 37°. Railroad tracks are notpresent on 1901 U.S. Geological Survey (USGS) maps of thearea, but are indicated on a 1950 map. Between 1978 and 1983,the pit was expanded, and the dump was excavated up to 122 mhorizontally (figure 2). During this expansion, a series of
3
Figure 2.—Rock dump with 15-m-high vertical benches.
Table 1.—Investigations of rock dump stability
Topic Investigator DateDesign of overburden piles . . . . . . . . . . . Piteau Assoc. (BCMDC) 1991Rock dump monitoring . . . . . . . . . . . . . . Klohn Leonoff (BCMDC) 1991
HBT AGRA 1992Failure runout . . . . . . . . . . . . . . . . . . . . Golder Assoc. (BCMDC) 1992, 1994, 1995Rock dump design . . . . . . . . . . . . . . . . . Piteau Assoc. (BCMDC) 1991Evaluation of failures . . . . . . . . . . . . . . . Broughton (BCMDC) 1992Instability mechanisms . . . . . . . . . . . . . . Dawson and others (BCMDC) 1992Liquefaction flowslides . . . . . . . . . . . . . . CANMET 1994
Dawson and others (BCMDC) 1998Rock durability . . . . . . . . . . . . . . . . . . . . Olivier 1976, 1979
Vandre 1993Welsh 1988Vallejo and Robinson 1992
Particle-size distribution . . . . . . . . . . . . . Mariachi and others 1972Kemeny 1993Vukovic and Soro 1992
Material strength . . . . . . . . . . . . . . . . . . . Leps 1970Mariachi and others 1972Williams and Walker 1985
Hydrology . . . . . . . . . . . . . . . . . . . . . . . . Leps 1973
benches with near-vertical, 15-m-high highwalls wereconstructed. These benches provided access to the interior partof the dump for physical property measurements that otherwisewould not have been possible to obtain. Because of naturalcementation and consolidation over time, minimal sloughingwas observed at the toe of the dump highwalls.
Measurements of in situ density, infiltration rate, and watercontent were taken at the rock dump, and measurements ofparticle-size distribution, Atterberg limits, and specific gravitywere obtained from rock samples from the dump. A weatherstation was installed on the crest of the dump to collectinformation on wind velocity and direction, temperature, andevaporation; however, precipitation data were not compiledbecause of an equipment design error. Instead, precipitationdata were acquired from the weather station at the mine officeapproximately 3 km away and 445 m lower in elevation.
FIELD-DETERMINED MATERIAL PROPERTIES
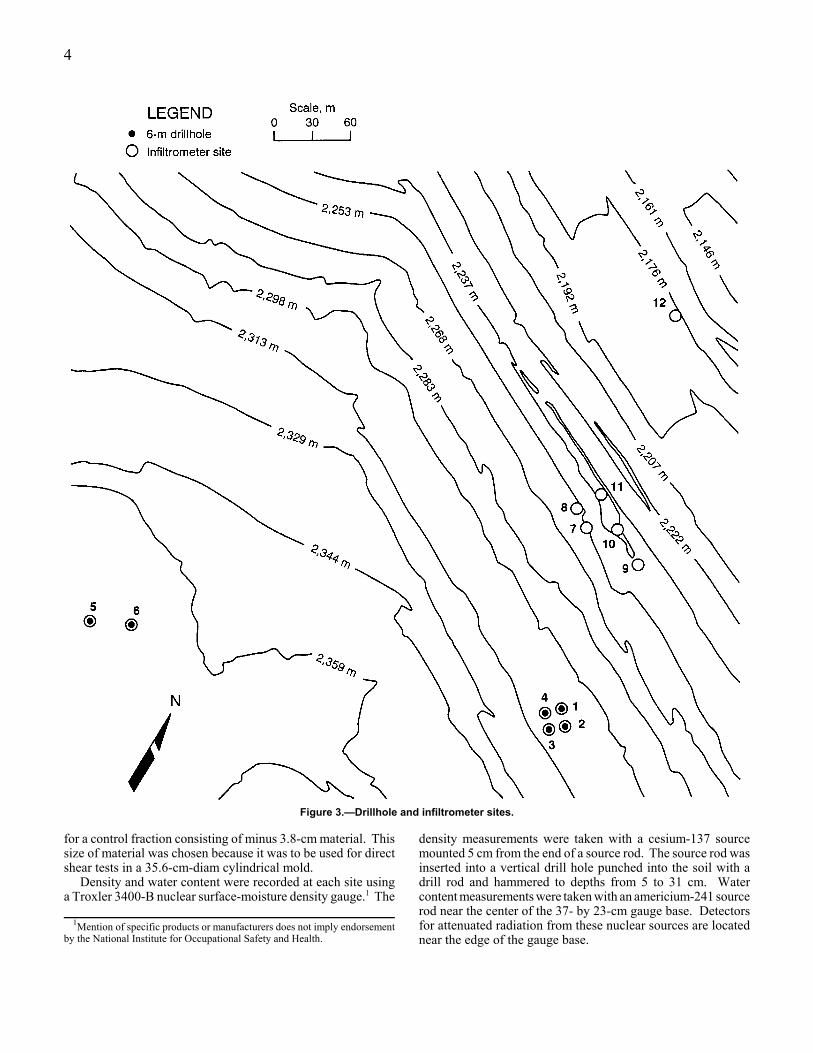
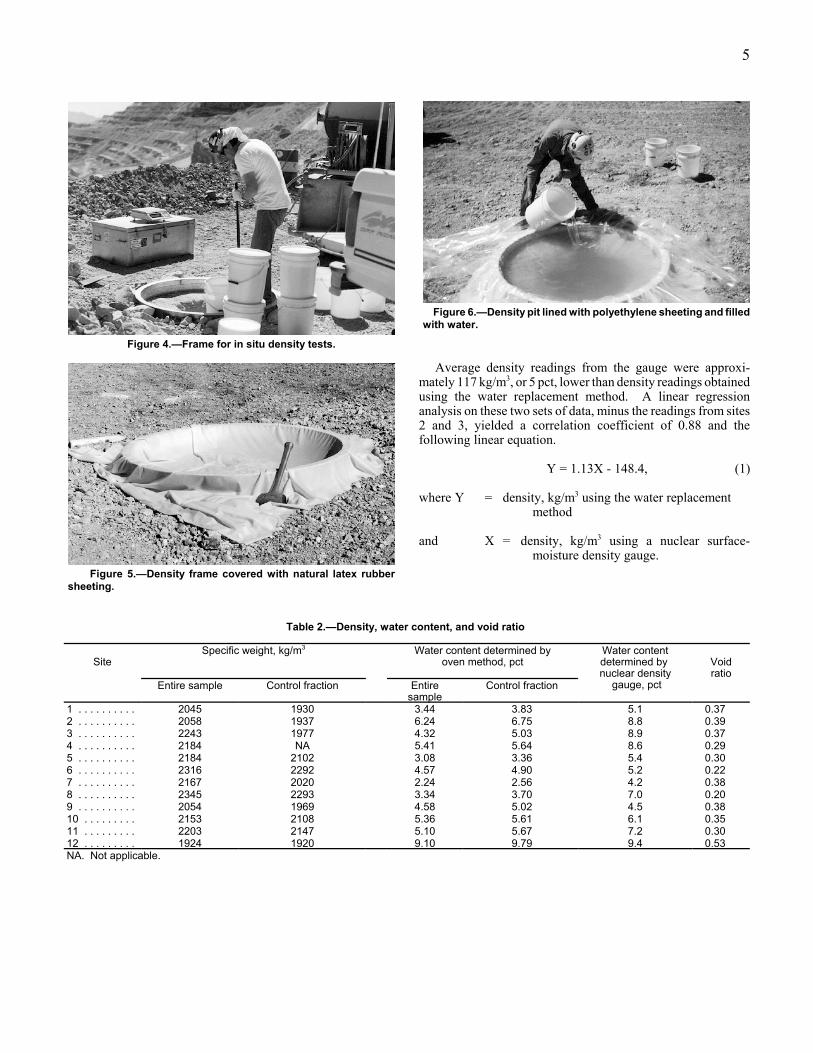
Twelve pits designed to measure in situ density wereexcavated on benches with elevations ranging from 2,176 to2,362 m (figure 3). These pits were located near the crest, themiddle, and the toe of the rock dump to account for variationsin the physical properties of the waste material resulting fromgravity sorting as it was discarded. Procedures described inAmerican Society for Testing and Materials (ASTM) standardD 5030-89, “Density of Soil and Rock in Place by the WaterReplacement Method in a Test Pit,” were used. Based onguidelines presented in the ASTM standard for an estimatedmaximum particle diameter of 15 cm (figure 4), researchers
from the Spokane Research Laboratory (SRL) constructed a91-cm-diam aluminum test frame. An attempt was made to linethe density pits with 0.25-mm-thick natural latex rubbersheeting. Although the latex sheeting conformed to holegeometry quite well, angular rocks ripped the material (figures5 and 6), and 4-mil polyethylene sheeting was used instead. Allmaterial from the density pits was sealed in 19-L plastic bucketsfor transport to the soils laboratory at SRL.
Specific weight values ranged from 1,924 to 2,345 kg/m3
(table 2). The average value was 2,156 kg/m3, and the standarddeviation was 120 kg/m3. Density calculations were also made
4
Figure 3.—Drillhole and infiltrometer sites.
for a control fraction consisting of minus 3.8-cm material. Thissize of material was chosen because it was to be used for directshear tests in a 35.6-cm-diam cylindrical mold.
Density and water content were recorded at each site usinga Troxler 3400-B nuclear surface-moisture density gauge.1 The
1Mention of specific products or manufacturers does not imply endorsementby the National Institute for Occupational Safety and Health.
density measurements were taken with a cesium-137 sourcemounted 5 cm from the end of a source rod. The source rod wasinserted into a vertical drill hole punched into the soil with adrill rod and hammered to depths from 5 to 31 cm. Watercontent measurements were taken with an americium-241 sourcerod near the center of the 37- by 23-cm gauge base. Detectorsfor attenuated radiation from these nuclear sources are locatednear the edge of the gauge base.
5
Figure 4.—Frame for in situ density tests.
Figure 5.—Density frame covered with natural latex rubbersheeting.
Figure 6.—Density pit lined with polyethylene sheeting and filledwith water.
Average density readings from the gauge were approxi-mately 117 kg/m3, or 5 pct, lower than density readings obtainedusing the water replacement method. A linear regressionanalysis on these two sets of data, minus the readings from sites2 and 3, yielded a correlation coefficient of 0.88 and thefollowing linear equation.
Y = 1.13X - 148.4, (1)
where Y = density, kg/m3 using the water replacement method
and X = density, kg/m3 using a nuclear surface-moisture density gauge.
Table 2.—Density, water content, and void ratio
SiteSpecific weight, kg/m3 Water content determined by
oven method, pctWater contentdetermined by nuclear density
gauge, pct
Voidratio
Entire sample Control fraction Entiresample
Control fraction
1 . . . . . . . . . . 2045 1930 3.44 3.83 5.1 0.372 . . . . . . . . . . 2058 1937 6.24 6.75 8.8 0.393 . . . . . . . . . . 2243 1977 4.32 5.03 8.9 0.374 . . . . . . . . . . 2184 NA 5.41 5.64 8.6 0.295 . . . . . . . . . . 2184 2102 3.08 3.36 5.4 0.306 . . . . . . . . . . 2316 2292 4.57 4.90 5.2 0.227 . . . . . . . . . . 2167 2020 2.24 2.56 4.2 0.388 . . . . . . . . . . 2345 2293 3.34 3.70 7.0 0.209 . . . . . . . . . . 2054 1969 4.58 5.02 4.5 0.3810 . . . . . . . . . 2153 2108 5.36 5.61 6.1 0.3511 . . . . . . . . . 2203 2147 5.10 5.67 7.2 0.3012 . . . . . . . . . 1924 1920 9.10 9.79 9.4 0.53NA. Not applicable.
6
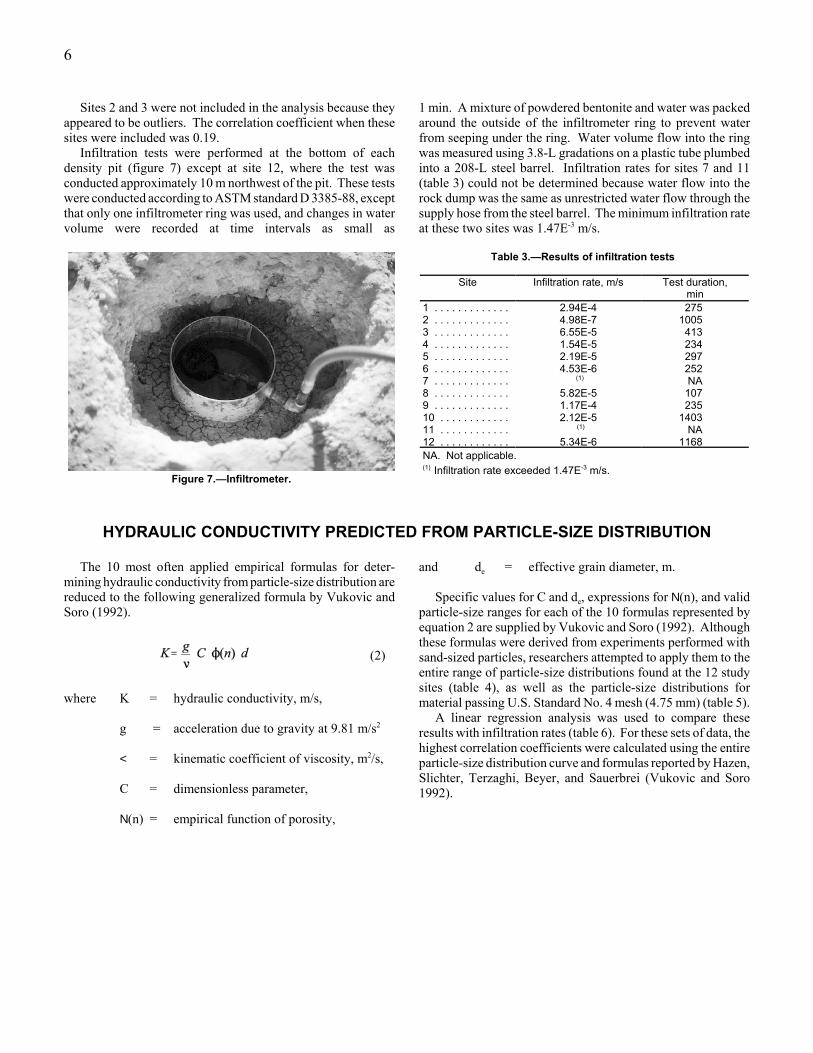
Figure 7.—Infiltrometer.
Sites 2 and 3 were not included in the analysis because theyappeared to be outliers. The correlation coefficient when thesesites were included was 0.19.
Infiltration tests were performed at the bottom of eachdensity pit (figure 7) except at site 12, where the test wasconducted approximately 10 m northwest of the pit. These testswere conducted according to ASTM standard D 3385-88, exceptthat only one infiltrometer ring was used, and changes in watervolume were recorded at time intervals as small as
1 min. A mixture of powdered bentonite and water was packedaround the outside of the infiltrometer ring to prevent waterfrom seeping under the ring. Water volume flow into the ringwas measured using 3.8-L gradations on a plastic tube plumbedinto a 208-L steel barrel. Infiltration rates for sites 7 and 11(table 3) could not be determined because water flow into therock dump was the same as unrestricted water flow through thesupply hose from the steel barrel. The minimum infiltration rateat these two sites was 1.47E-3 m/s.
Table 3.—Results of infiltration tests
Site Infiltration rate, m/s Test duration,min
1 . . . . . . . . . . . . . 2.94E-4 2752 . . . . . . . . . . . . . 4.98E-7 10053 . . . . . . . . . . . . . 6.55E-5 4134 . . . . . . . . . . . . . 1.54E-5 2345 . . . . . . . . . . . . . 2.19E-5 2976 . . . . . . . . . . . . . 4.53E-6 2527 . . . . . . . . . . . . . (1) NA8 . . . . . . . . . . . . . 5.82E-5 1079 . . . . . . . . . . . . . 1.17E-4 23510 . . . . . . . . . . . . 2.12E-5 140311 . . . . . . . . . . . . (1) NA12 . . . . . . . . . . . . 5.34E-6 1168NA. Not applicable.(1) Infiltration rate exceeded 1.47E-3 m/s.
HYDRAULIC CONDUCTIVITY PREDICTED FROM PARTICLE-SIZE DISTRIBUTION
The 10 most often applied empirical formulas for deter-mining hydraulic conductivity from particle-size distribution arereduced to the following generalized formula by Vukovic andSoro (1992).
(2)
where K = hydraulic conductivity, m/s,
g = acceleration due to gravity at 9.81 m/s2
< = kinematic coefficient of viscosity, m2/s,
C = dimensionless parameter,
N(n) = empirical function of porosity,
and de = effective grain diameter, m.
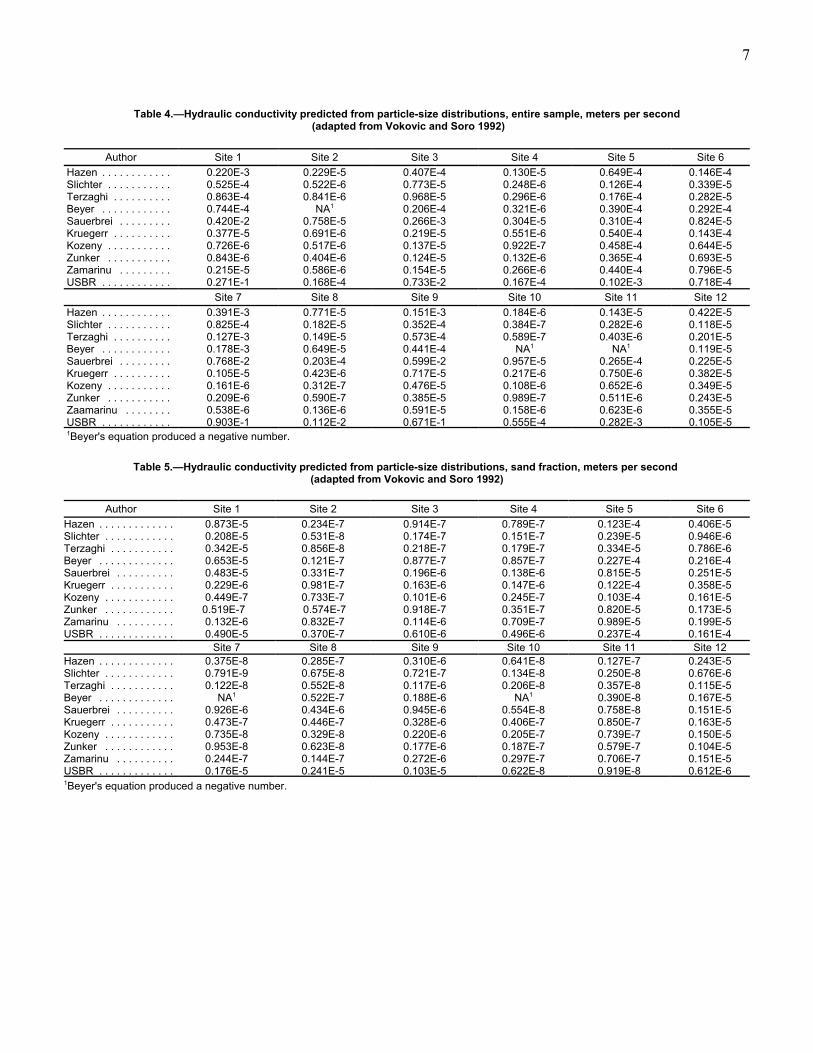
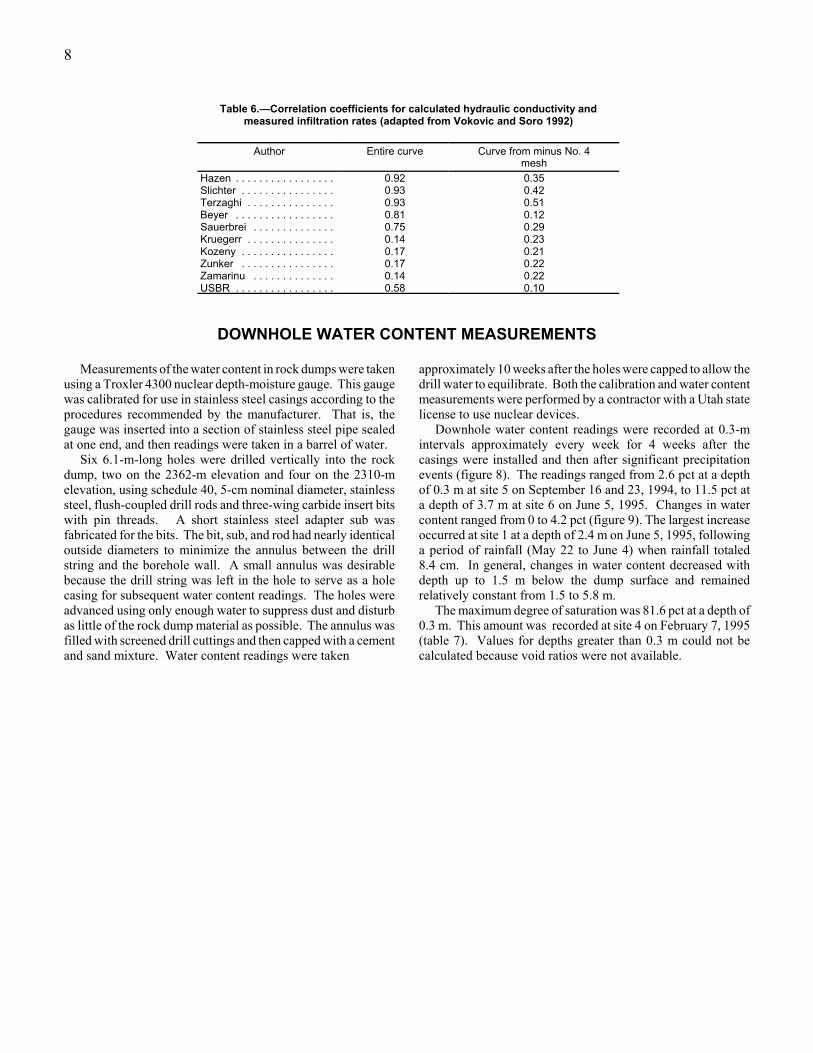
Specific values for C and de, expressions for N(n), and validparticle-size ranges for each of the 10 formulas represented byequation 2 are supplied by Vukovic and Soro (1992). Althoughthese formulas were derived from experiments performed withsand-sized particles, researchers attempted to apply them to theentire range of particle-size distributions found at the 12 studysites (table 4), as well as the particle-size distributions formaterial passing U.S. Standard No. 4 mesh (4.75 mm) (table 5).
A linear regression analysis was used to compare theseresults with infiltration rates (table 6). For these sets of data, thehighest correlation coefficients were calculated using the entireparticle-size distribution curve and formulas reported by Hazen,Slichter, Terzaghi, Beyer, and Sauerbrei (Vukovic and Soro1992).
7
Table 4.—Hydraulic conductivity predicted from particle-size distributions, entire sample, meters per second (adapted from Vokovic and Soro 1992)
Author Site 1 Site 2 Site 3 Site 4 Site 5 Site 6Hazen . . . . . . . . . . . . 0.220E-3 0.229E-5 0.407E-4 0.130E-5 0.649E-4 0.146E-4Slichter . . . . . . . . . . . 0.525E-4 0.522E-6 0.773E-5 0.248E-6 0.126E-4 0.339E-5Terzaghi . . . . . . . . . . 0.863E-4 0.841E-6 0.968E-5 0.296E-6 0.176E-4 0.282E-5Beyer . . . . . . . . . . . . 0.744E-4 NA1 0.206E-4 0.321E-6 0.390E-4 0.292E-4Sauerbrei . . . . . . . . . 0.420E-2 0.758E-5 0.266E-3 0.304E-5 0.310E-4 0.824E-5Kruegerr . . . . . . . . . . 0.377E-5 0.691E-6 0.219E-5 0.551E-6 0.540E-4 0.143E-4Kozeny . . . . . . . . . . . 0.726E-6 0.517E-6 0.137E-5 0.922E-7 0.458E-4 0.644E-5Zunker . . . . . . . . . . . 0.843E-6 0.404E-6 0.124E-5 0.132E-6 0.365E-4 0.693E-5Zamarinu . . . . . . . . . 0.215E-5 0.586E-6 0.154E-5 0.266E-6 0.440E-4 0.796E-5USBR . . . . . . . . . . . . 0.271E-1 0.168E-4 0.733E-2 0.167E-4 0.102E-3 0.718E-4
Site 7 Site 8 Site 9 Site 10 Site 11 Site 12Hazen . . . . . . . . . . . . 0.391E-3 0.771E-5 0.151E-3 0.184E-6 0.143E-5 0.422E-5Slichter . . . . . . . . . . . 0.825E-4 0.182E-5 0.352E-4 0.384E-7 0.282E-6 0.118E-5Terzaghi . . . . . . . . . . 0.127E-3 0.149E-5 0.573E-4 0.589E-7 0.403E-6 0.201E-5Beyer . . . . . . . . . . . . 0.178E-3 0.649E-5 0.441E-4 NA1 NA1 0.119E-5Sauerbrei . . . . . . . . . 0.768E-2 0.203E-4 0.599E-2 0.957E-5 0.265E-4 0.225E-5Kruegerr . . . . . . . . . . 0.105E-5 0.423E-6 0.717E-5 0.217E-6 0.750E-6 0.382E-5Kozeny . . . . . . . . . . . 0.161E-6 0.312E-7 0.476E-5 0.108E-6 0.652E-6 0.349E-5Zunker . . . . . . . . . . . 0.209E-6 0.590E-7 0.385E-5 0.989E-7 0.511E-6 0.243E-5Zaamarinu . . . . . . . . 0.538E-6 0.136E-6 0.591E-5 0.158E-6 0.623E-6 0.355E-5USBR . . . . . . . . . . . . 0.903E-1 0.112E-2 0.671E-1 0.555E-4 0.282E-3 0.105E-51Beyer's equation produced a negative number.
Table 5.—Hydraulic conductivity predicted from particle-size distributions, sand fraction, meters per second (adapted from Vokovic and Soro 1992)
Author Site 1 Site 2 Site 3 Site 4 Site 5 Site 6Hazen . . . . . . . . . . . . . 0.873E-5 0.234E-7 0.914E-7 0.789E-7 0.123E-4 0.406E-5Slichter . . . . . . . . . . . . 0.208E-5 0.531E-8 0.174E-7 0.151E-7 0.239E-5 0.946E-6Terzaghi . . . . . . . . . . . 0.342E-5 0.856E-8 0.218E-7 0.179E-7 0.334E-5 0.786E-6Beyer . . . . . . . . . . . . . 0.653E-5 0.121E-7 0.877E-7 0.857E-7 0.227E-4 0.216E-4Sauerbrei . . . . . . . . . . 0.483E-5 0.331E-7 0.196E-6 0.138E-6 0.815E-5 0.251E-5Kruegerr . . . . . . . . . . . 0.229E-6 0.981E-7 0.163E-6 0.147E-6 0.122E-4 0.358E-5Kozeny . . . . . . . . . . . . 0.449E-7 0.733E-7 0.101E-6 0.245E-7 0.103E-4 0.161E-5Zunker . . . . . . . . . . . . 0.519E-7 0.574E-7 0.918E-7 0.351E-7 0.820E-5 0.173E-5Zamarinu . . . . . . . . . . 0.132E-6 0.832E-7 0.114E-6 0.709E-7 0.989E-5 0.199E-5USBR . . . . . . . . . . . . . 0.490E-5 0.370E-7 0.610E-6 0.496E-6 0.237E-4 0.161E-4
Site 7 Site 8 Site 9 Site 10 Site 11 Site 12Hazen . . . . . . . . . . . . . 0.375E-8 0.285E-7 0.310E-6 0.641E-8 0.127E-7 0.243E-5Slichter . . . . . . . . . . . . 0.791E-9 0.675E-8 0.721E-7 0.134E-8 0.250E-8 0.676E-6Terzaghi . . . . . . . . . . . 0.122E-8 0.552E-8 0.117E-6 0.206E-8 0.357E-8 0.115E-5Beyer . . . . . . . . . . . . . NA1 0.522E-7 0.188E-6 NA1 0.390E-8 0.167E-5Sauerbrei . . . . . . . . . . 0.926E-6 0.434E-6 0.945E-6 0.554E-8 0.758E-8 0.151E-5Kruegerr . . . . . . . . . . . 0.473E-7 0.446E-7 0.328E-6 0.406E-7 0.850E-7 0.163E-5Kozeny . . . . . . . . . . . . 0.735E-8 0.329E-8 0.220E-6 0.205E-7 0.739E-7 0.150E-5Zunker . . . . . . . . . . . . 0.953E-8 0.623E-8 0.177E-6 0.187E-7 0.579E-7 0.104E-5Zamarinu . . . . . . . . . . 0.244E-7 0.144E-7 0.272E-6 0.297E-7 0.706E-7 0.151E-5USBR . . . . . . . . . . . . . 0.176E-5 0.241E-5 0.103E-5 0.622E-8 0.919E-8 0.612E-61Beyer's equation produced a negative number.
8
Table 6.—Correlation coefficients for calculated hydraulic conductivity andmeasured infiltration rates (adapted from Vokovic and Soro 1992)
Author Entire curve Curve from minus No. 4mesh
Hazen . . . . . . . . . . . . . . . . . 0.92 0.35Slichter . . . . . . . . . . . . . . . . 0.93 0.42Terzaghi . . . . . . . . . . . . . . . 0.93 0.51Beyer . . . . . . . . . . . . . . . . . 0.81 0.12Sauerbrei . . . . . . . . . . . . . . 0.75 0.29Kruegerr . . . . . . . . . . . . . . . 0.14 0.23Kozeny . . . . . . . . . . . . . . . . 0.17 0.21Zunker . . . . . . . . . . . . . . . . 0.17 0.22Zamarinu . . . . . . . . . . . . . . 0.14 0.22USBR . . . . . . . . . . . . . . . . . 0.58 0.10
DOWNHOLE WATER CONTENT MEASUREMENTS
Measurements of the water content in rock dumps were takenusing a Troxler 4300 nuclear depth-moisture gauge. This gaugewas calibrated for use in stainless steel casings according to theprocedures recommended by the manufacturer. That is, thegauge was inserted into a section of stainless steel pipe sealedat one end, and then readings were taken in a barrel of water.
Six 6.1-m-long holes were drilled vertically into the rockdump, two on the 2362-m elevation and four on the 2310-melevation, using schedule 40, 5-cm nominal diameter, stainlesssteel, flush-coupled drill rods and three-wing carbide insert bitswith pin threads. A short stainless steel adapter sub wasfabricated for the bits. The bit, sub, and rod had nearly identicaloutside diameters to minimize the annulus between the drillstring and the borehole wall. A small annulus was desirablebecause the drill string was left in the hole to serve as a holecasing for subsequent water content readings. The holes wereadvanced using only enough water to suppress dust and disturbas little of the rock dump material as possible. The annulus wasfilled with screened drill cuttings and then capped with a cementand sand mixture. Water content readings were taken
approximately 10 weeks after the holes were capped to allow thedrill water to equilibrate. Both the calibration and water contentmeasurements were performed by a contractor with a Utah statelicense to use nuclear devices.
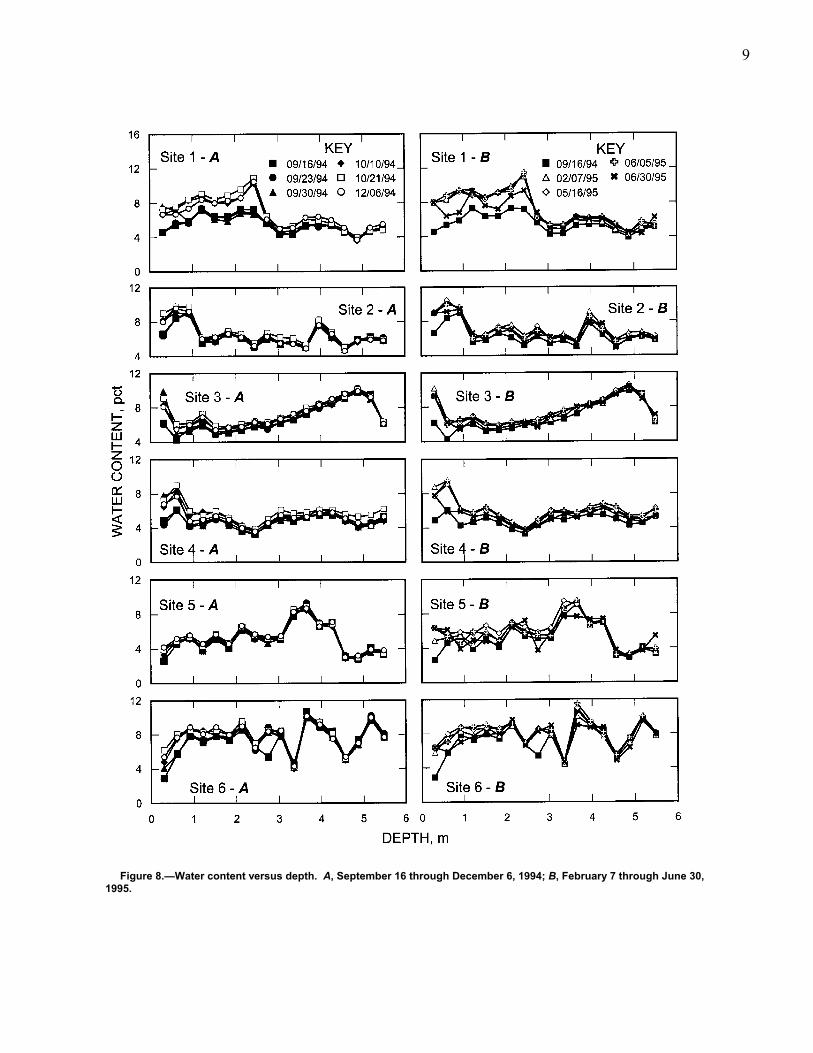
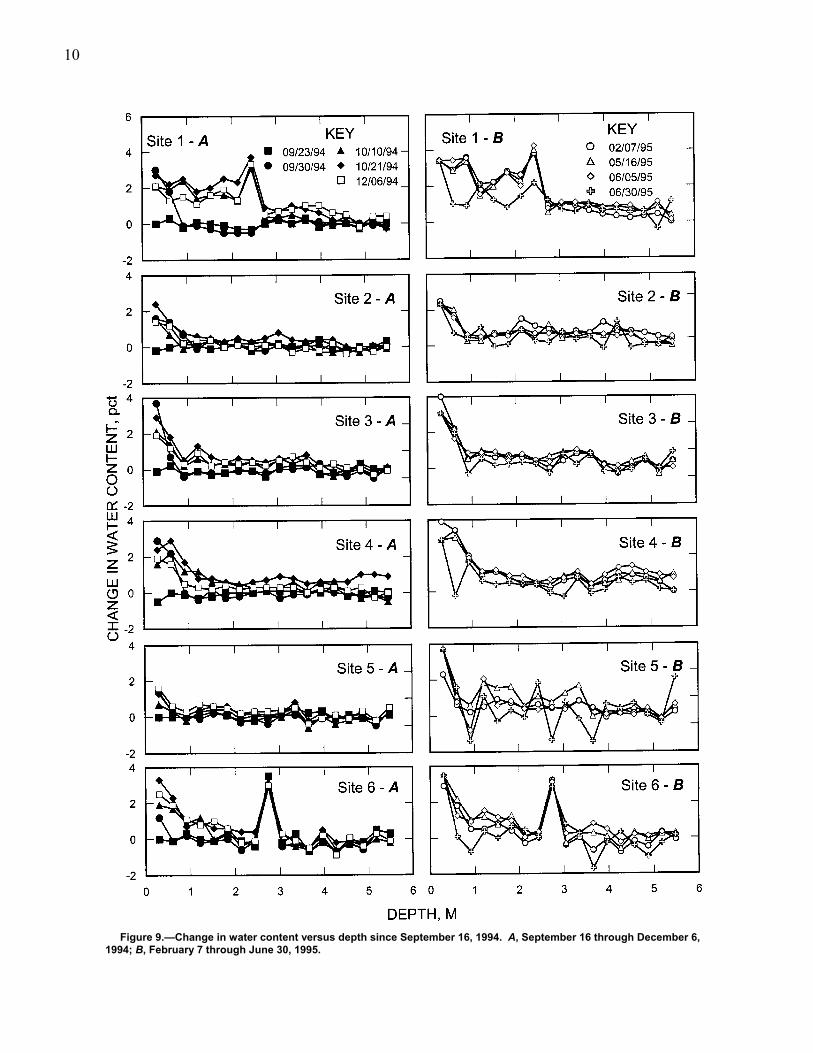
Downhole water content readings were recorded at 0.3-mintervals approximately every week for 4 weeks after thecasings were installed and then after significant precipitationevents (figure 8). The readings ranged from 2.6 pct at a depthof 0.3 m at site 5 on September 16 and 23, 1994, to 11.5 pct ata depth of 3.7 m at site 6 on June 5, 1995. Changes in watercontent ranged from 0 to 4.2 pct (figure 9). The largest increaseoccurred at site 1 at a depth of 2.4 m on June 5, 1995, followinga period of rainfall (May 22 to June 4) when rainfall totaled8.4 cm. In general, changes in water content decreased withdepth up to 1.5 m below the dump surface and remainedrelatively constant from 1.5 to 5.8 m.
The maximum degree of saturation was 81.6 pct at a depth of0.3 m. This amount was recorded at site 4 on February 7, 1995(table 7). Values for depths greater than 0.3 m could not becalculated because void ratios were not available.
9
Figure 8.—Water content versus depth. A, September 16 through December 6, 1994; B, February 7 through June 30,1995.
10
Figure 9.—Change in water content versus depth since September 16, 1994. A, September 16 through December 6,1994; B, February 7 through June 30, 1995.
11
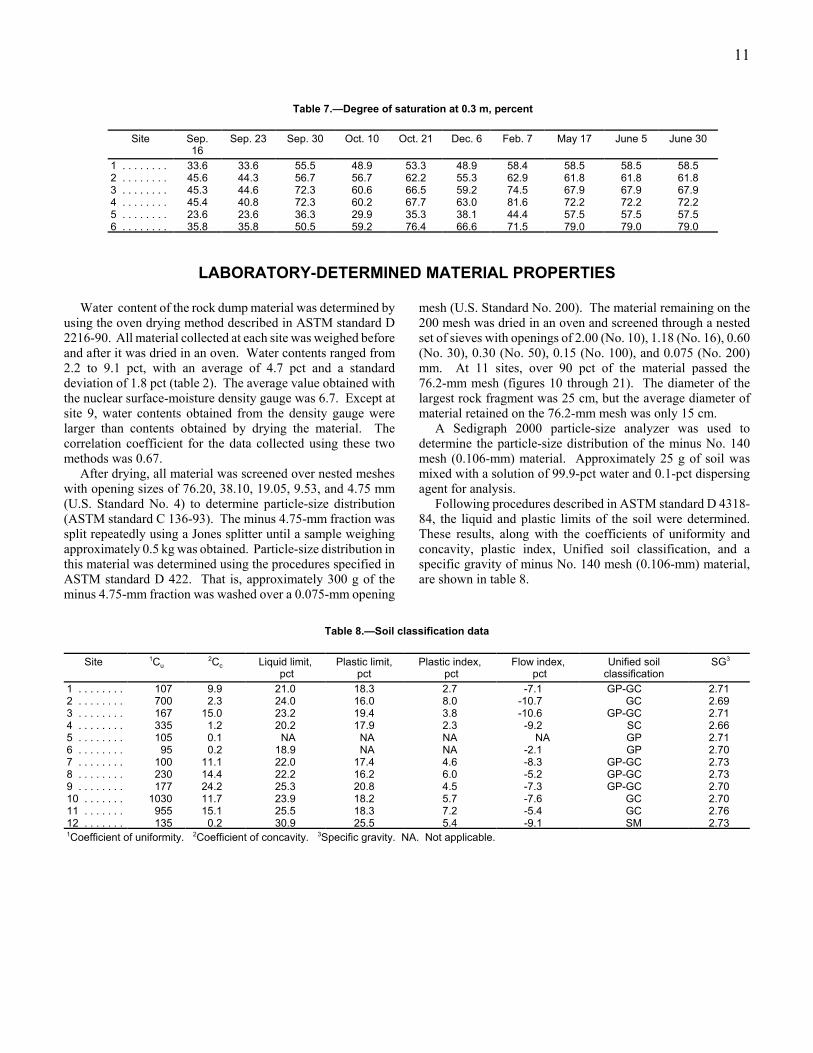
Table 7.—Degree of saturation at 0.3 m, percent
Site Sep.16
Sep. 23 Sep. 30 Oct. 10 Oct. 21 Dec. 6 Feb. 7 May 17 June 5 June 30
1 . . . . . . . . 33.6 33.6 55.5 48.9 53.3 48.9 58.4 58.5 58.5 58.52 . . . . . . . . 45.6 44.3 56.7 56.7 62.2 55.3 62.9 61.8 61.8 61.83 . . . . . . . . 45.3 44.6 72.3 60.6 66.5 59.2 74.5 67.9 67.9 67.94 . . . . . . . . 45.4 40.8 72.3 60.2 67.7 63.0 81.6 72.2 72.2 72.25 . . . . . . . . 23.6 23.6 36.3 29.9 35.3 38.1 44.4 57.5 57.5 57.56 . . . . . . . . 35.8 35.8 50.5 59.2 76.4 66.6 71.5 79.0 79.0 79.0
LABORATORY-DETERMINED MATERIAL PROPERTIES
Water content of the rock dump material was determined byusing the oven drying method described in ASTM standard D2216-90. All material collected at each site was weighed beforeand after it was dried in an oven. Water contents ranged from2.2 to 9.1 pct, with an average of 4.7 pct and a standarddeviation of 1.8 pct (table 2). The average value obtained withthe nuclear surface-moisture density gauge was 6.7. Except atsite 9, water contents obtained from the density gauge werelarger than contents obtained by drying the material. Thecorrelation coefficient for the data collected using these twomethods was 0.67.
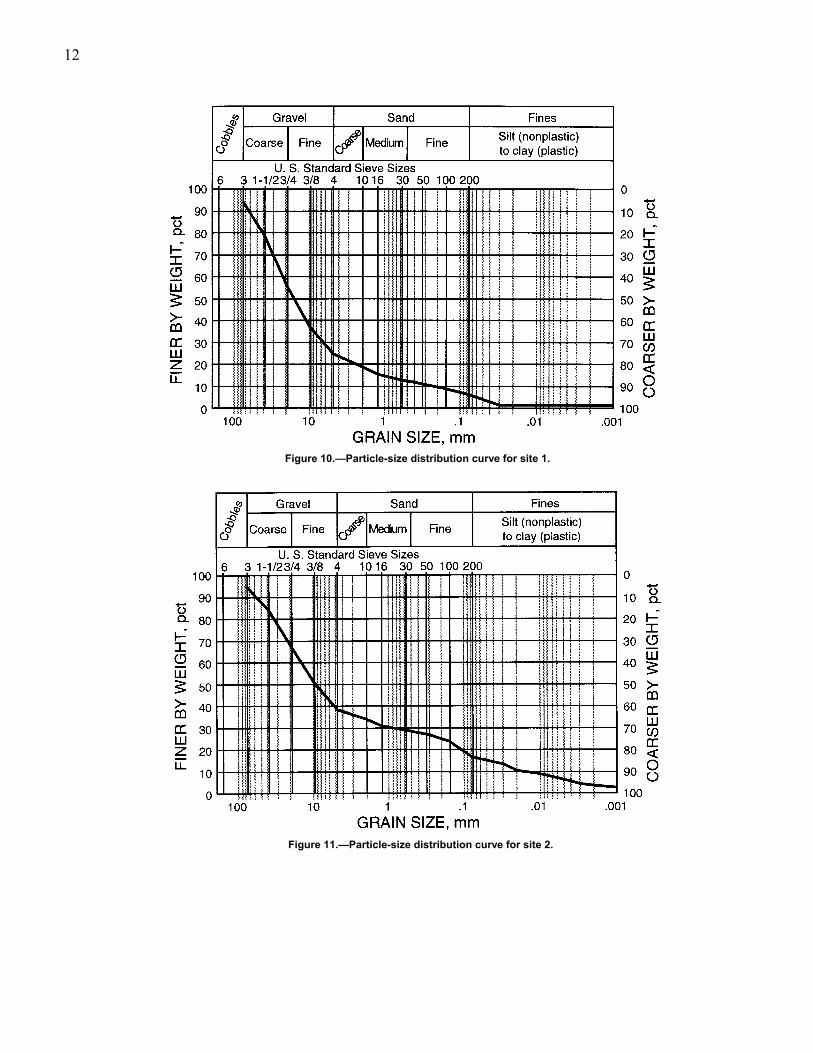
After drying, all material was screened over nested mesheswith opening sizes of 76.20, 38.10, 19.05, 9.53, and 4.75 mm(U.S. Standard No. 4) to determine particle-size distribution(ASTM standard C 136-93). The minus 4.75-mm fraction wassplit repeatedly using a Jones splitter until a sample weighingapproximately 0.5 kg was obtained. Particle-size distribution inthis material was determined using the procedures specified inASTM standard D 422. That is, approximately 300 g of theminus 4.75-mm fraction was washed over a 0.075-mm opening
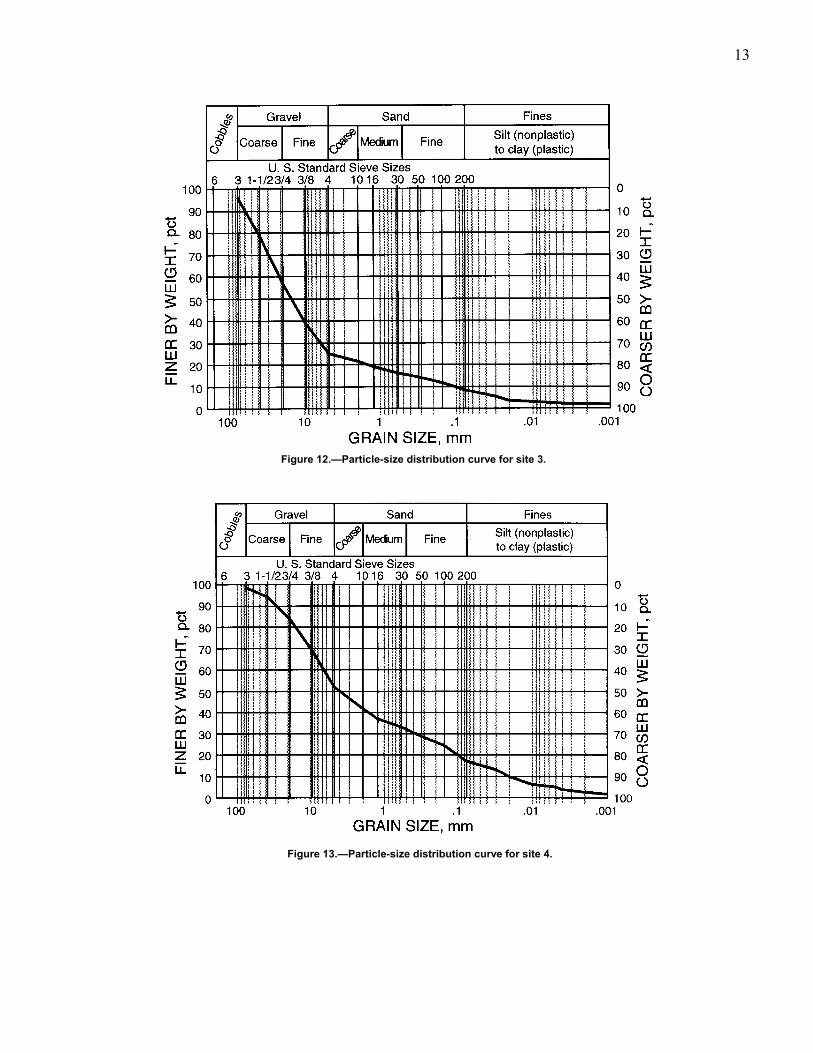
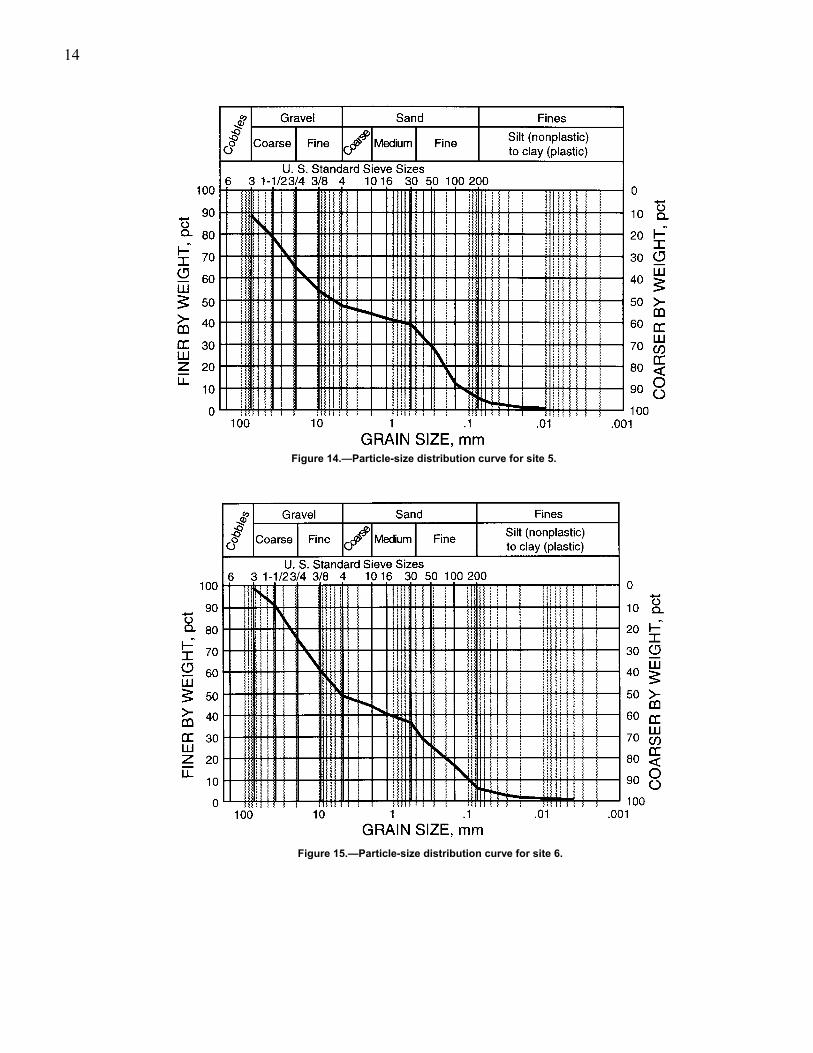
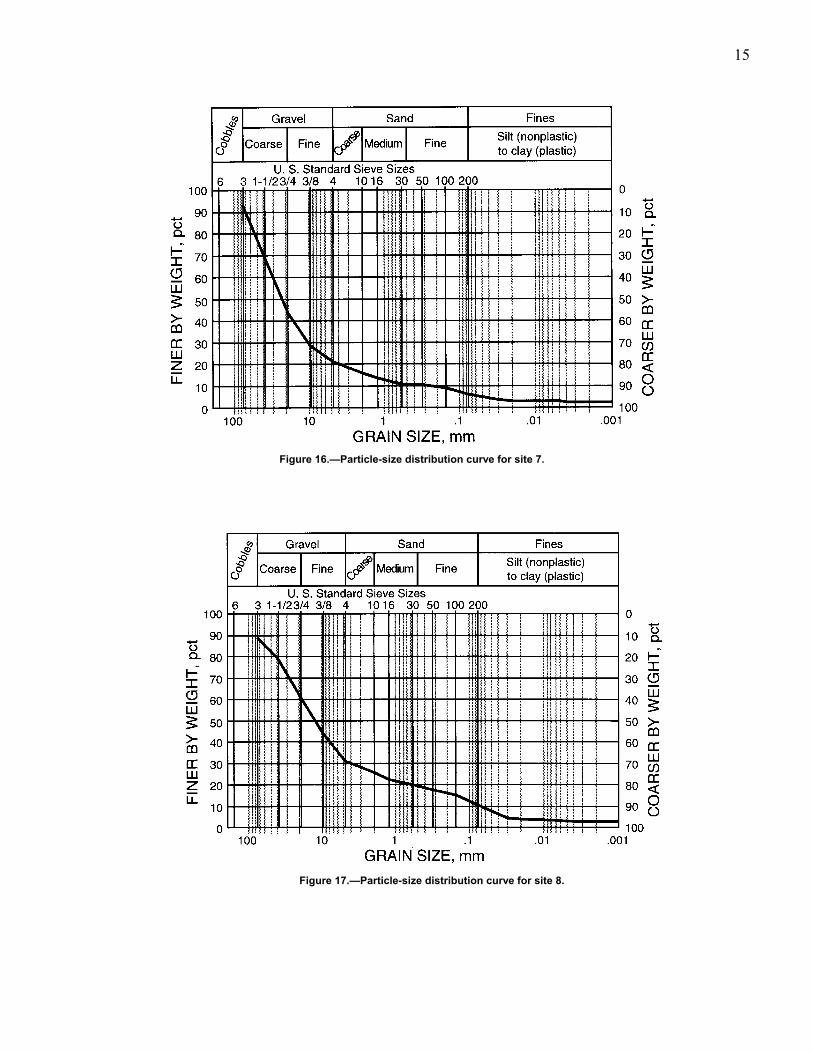
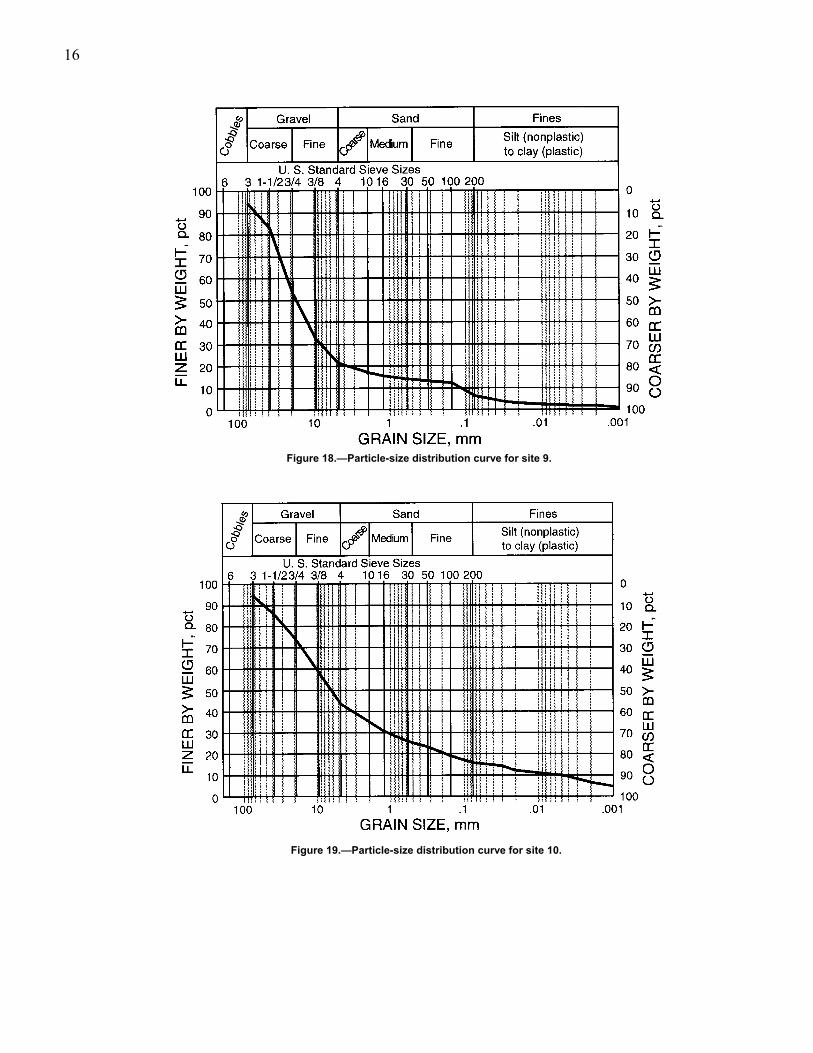
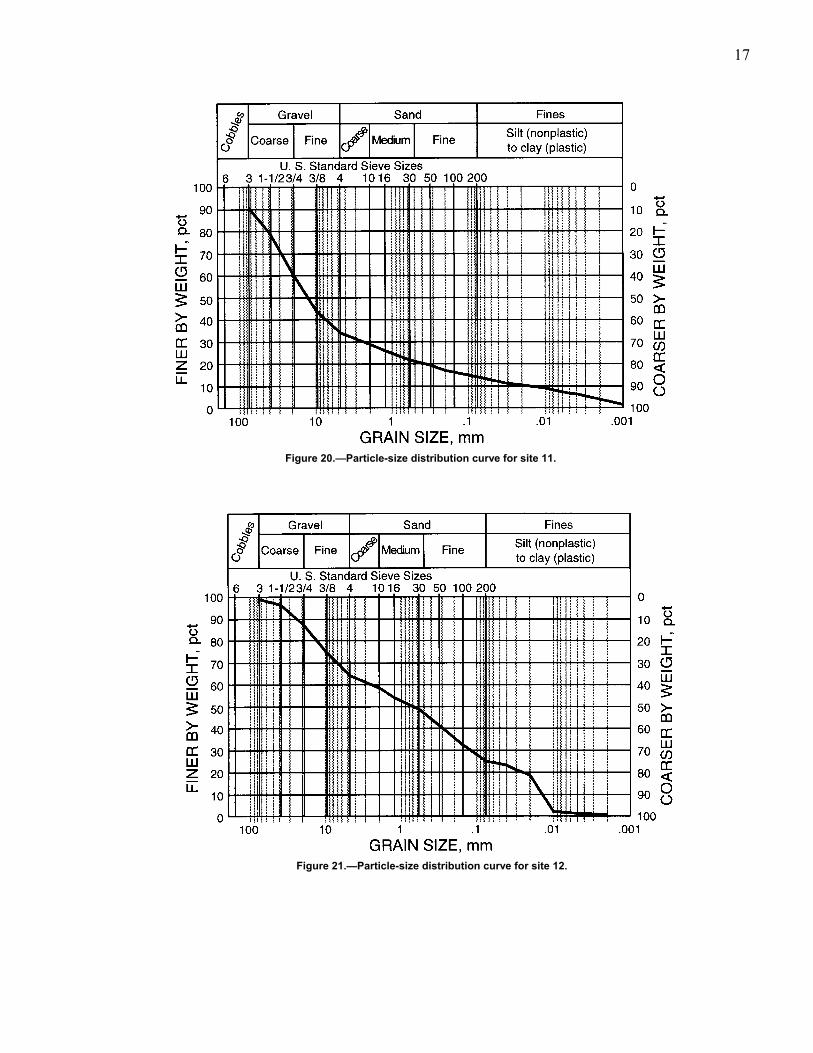
mesh (U.S. Standard No. 200). The material remaining on the200 mesh was dried in an oven and screened through a nestedset of sieves with openings of 2.00 (No. 10), 1.18 (No. 16), 0.60(No. 30), 0.30 (No. 50), 0.15 (No. 100), and 0.075 (No. 200)mm. At 11 sites, over 90 pct of the material passed the76.2-mm mesh (figures 10 through 21). The diameter of thelargest rock fragment was 25 cm, but the average diameter ofmaterial retained on the 76.2-mm mesh was only 15 cm.
A Sedigraph 2000 particle-size analyzer was used todetermine the particle-size distribution of the minus No. 140mesh (0.106-mm) material. Approximately 25 g of soil wasmixed with a solution of 99.9-pct water and 0.1-pct dispersingagent for analysis.
Following procedures described in ASTM standard D 4318-84, the liquid and plastic limits of the soil were determined.These results, along with the coefficients of uniformity andconcavity, plastic index, Unified soil classification, and aspecific gravity of minus No. 140 mesh (0.106-mm) material,are shown in table 8.
Table 8.—Soil classification data
Site 1Cu2Cc Liquid limit,
pctPlastic limit,
pctPlastic index,
pctFlow index,
pctUnified soil
classification SG3
1 . . . . . . . . 107 9.9 21.0 18.3 2.7 -7.1 GP-GC 2.712 . . . . . . . . 700 2.3 24.0 16.0 8.0 -10.7 GC 2.693 . . . . . . . . 167 15.0 23.2 19.4 3.8 -10.6 GP-GC 2.714 . . . . . . . . 335 1.2 20.2 17.9 2.3 -9.2 SC 2.665 . . . . . . . . 105 0.1 NA NA NA NA GP 2.716 . . . . . . . . 95 0.2 18.9 NA NA -2.1 GP 2.707 . . . . . . . . 100 11.1 22.0 17.4 4.6 -8.3 GP-GC 2.738 . . . . . . . . 230 14.4 22.2 16.2 6.0 -5.2 GP-GC 2.739 . . . . . . . . 177 24.2 25.3 20.8 4.5 -7.3 GP-GC 2.7010 . . . . . . . 1030 11.7 23.9 18.2 5.7 -7.6 GC 2.7011 . . . . . . . 955 15.1 25.5 18.3 7.2 -5.4 GC 2.7612 . . . . . . . 135 0.2 30.9 25.5 5.4 -9.1 SM 2.731Coefficient of uniformity. 2Coefficient of concavity. 3Specific gravity. NA. Not applicable.
12
Figure 10.—Particle-size distribution curve for site 1.
Figure 11.—Particle-size distribution curve for site 2.
13
Figure 12.—Particle-size distribution curve for site 3.
Figure 13.—Particle-size distribution curve for site 4.
14
Figure 14.—Particle-size distribution curve for site 5.
Figure 15.—Particle-size distribution curve for site 6.
15
Figure 16.—Particle-size distribution curve for site 7.
Figure 17.—Particle-size distribution curve for site 8.
16
Figure 18.—Particle-size distribution curve for site 9.
Figure 19.—Particle-size distribution curve for site 10.
17
Figure 20.—Particle-size distribution curve for site 11.
Figure 21.—Particle-size distribution curve for site 12.
18
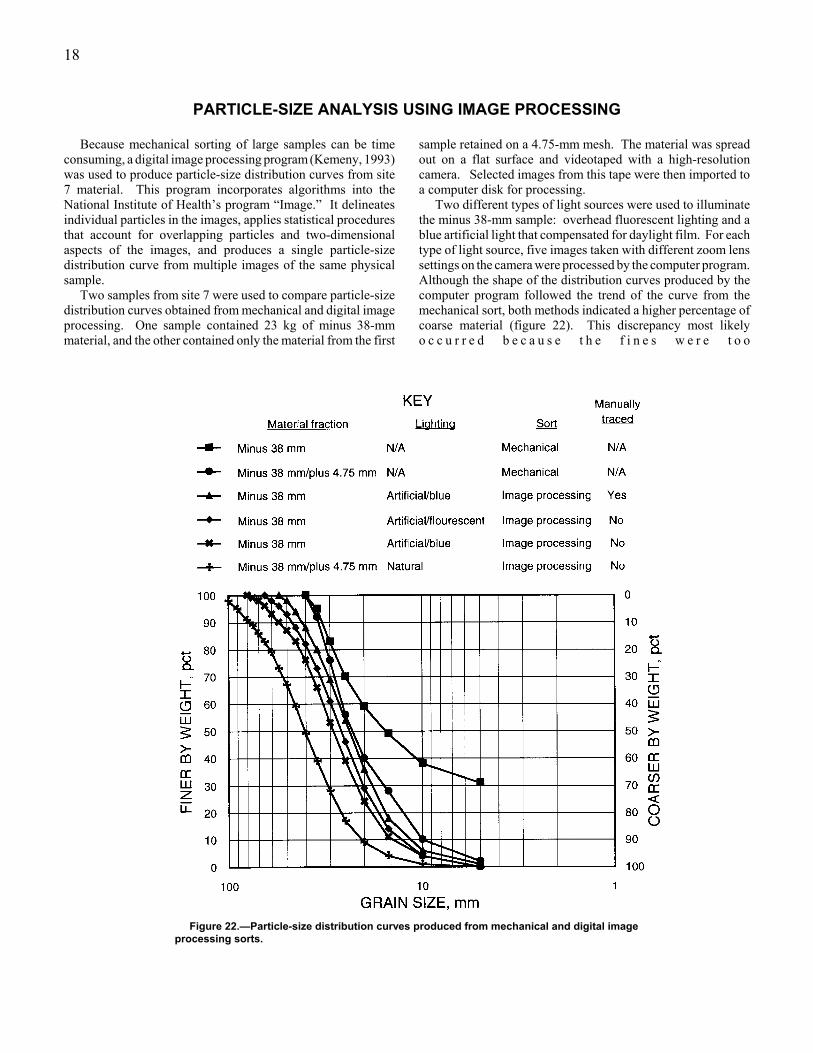
Figure 22.—Particle-size distribution curves produced from mechanical and digital imageprocessing sorts.
PARTICLE-SIZE ANALYSIS USING IMAGE PROCESSING
Because mechanical sorting of large samples can be timeconsuming, a digital image processing program (Kemeny, 1993)was used to produce particle-size distribution curves from site7 material. This program incorporates algorithms into theNational Institute of Health’s program “Image.” It delineatesindividual particles in the images, applies statistical proceduresthat account for overlapping particles and two-dimensionalaspects of the images, and produces a single particle-sizedistribution curve from multiple images of the same physicalsample.
Two samples from site 7 were used to compare particle-sizedistribution curves obtained from mechanical and digital imageprocessing. One sample contained 23 kg of minus 38-mmmaterial, and the other contained only the material from the first
sample retained on a 4.75-mm mesh. The material was spreadout on a flat surface and videotaped with a high-resolutioncamera. Selected images from this tape were then imported toa computer disk for processing.
Two different types of light sources were used to illuminatethe minus 38-mm sample: overhead fluorescent lighting and ablue artificial light that compensated for daylight film. For eachtype of light source, five images taken with different zoom lenssettings on the camera were processed by the computer program.Although the shape of the distribution curves produced by thecomputer program followed the trend of the curve from themechanical sort, both methods indicated a higher percentage ofcoarse material (figure 22). This discrepancy most likelyo c c u r r e d b e c a u s e t h e f i n e s w e r e t o o
19
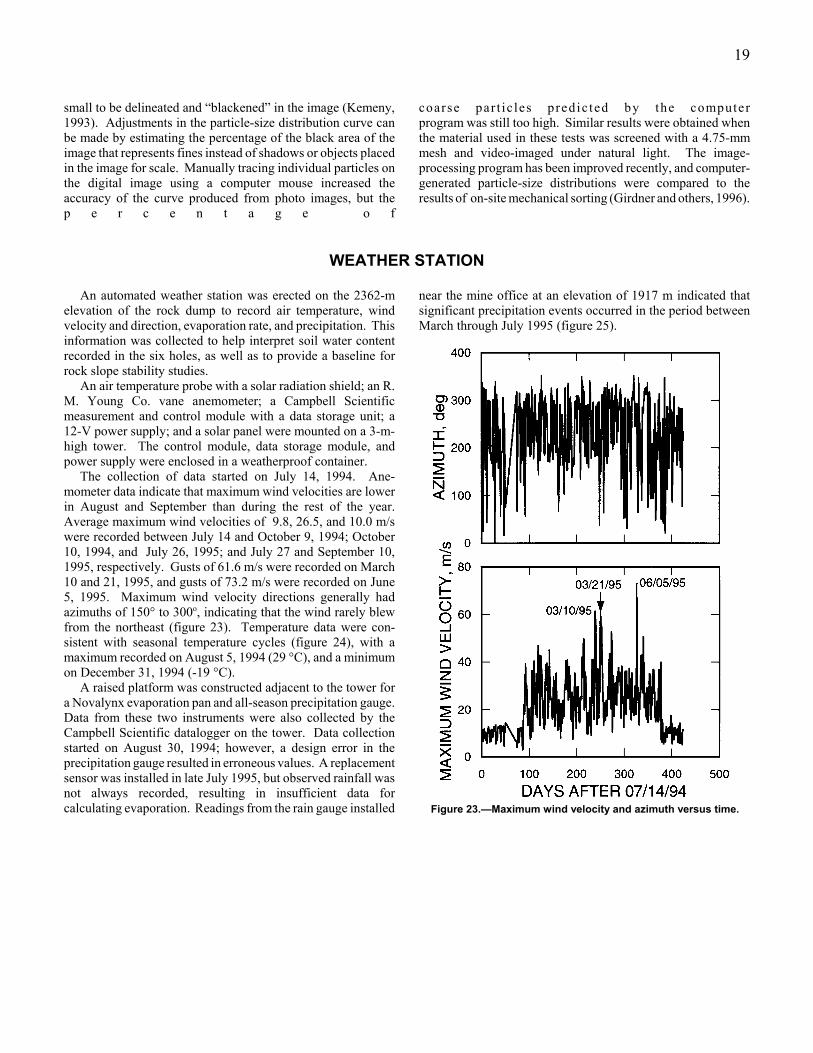
Figure 23.—Maximum wind velocity and azimuth versus time.
small to be delineated and “blackened” in the image (Kemeny,1993). Adjustments in the particle-size distribution curve canbe made by estimating the percentage of the black area of theimage that represents fines instead of shadows or objects placedin the image for scale. Manually tracing individual particles onthe digital image using a computer mouse increased theaccuracy of the curve produced from photo images, but thep e r c e n t a g e o f
coarse par t ic les predic ted by the computerprogram was still too high. Similar results were obtained whenthe material used in these tests was screened with a 4.75-mmmesh and video-imaged under natural light. The image-processing program has been improved recently, and computer-generated particle-size distributions were compared to theresults of on-site mechanical sorting (Girdner and others, 1996).
WEATHER STATION
An automated weather station was erected on the 2362-melevation of the rock dump to record air temperature, windvelocity and direction, evaporation rate, and precipitation. Thisinformation was collected to help interpret soil water contentrecorded in the six holes, as well as to provide a baseline forrock slope stability studies.
An air temperature probe with a solar radiation shield; an R.M. Young Co. vane anemometer; a Campbell Scientificmeasurement and control module with a data storage unit; a12-V power supply; and a solar panel were mounted on a 3-m-high tower. The control module, data storage module, andpower supply were enclosed in a weatherproof container.
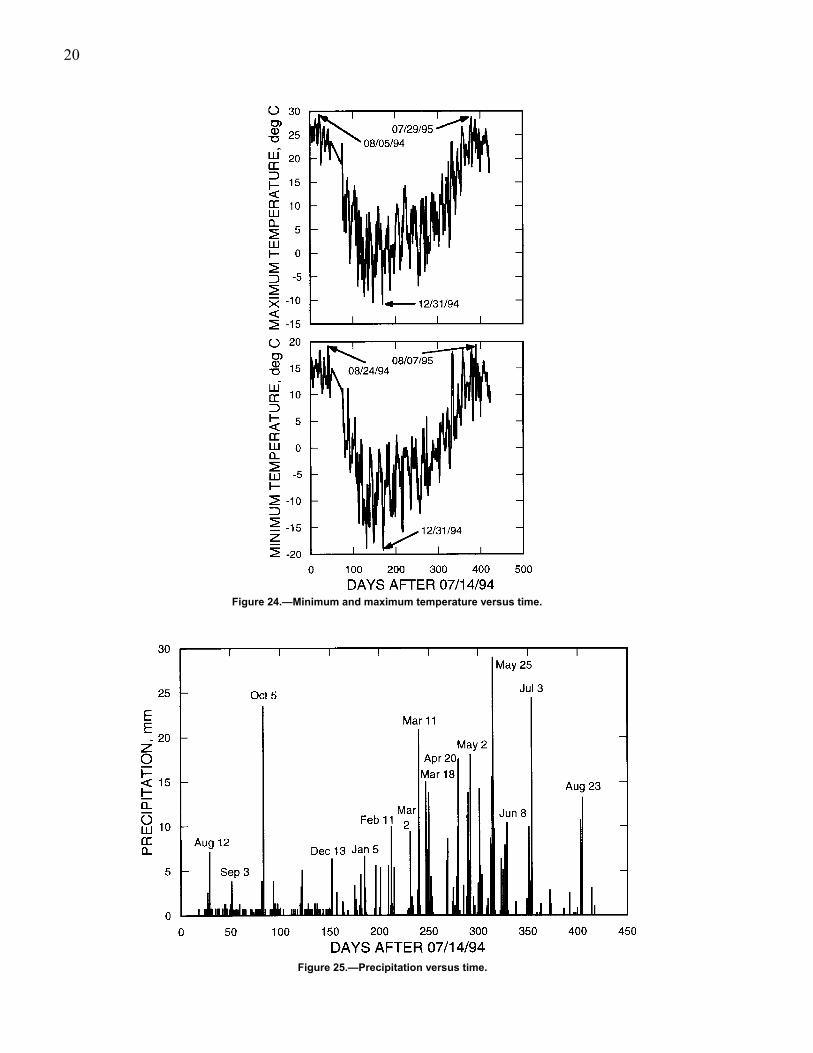
The collection of data started on July 14, 1994. Ane-mometer data indicate that maximum wind velocities are lowerin August and September than during the rest of the year.Average maximum wind velocities of 9.8, 26.5, and 10.0 m/swere recorded between July 14 and October 9, 1994; October10, 1994, and July 26, 1995; and July 27 and September 10,1995, respectively. Gusts of 61.6 m/s were recorded on March10 and 21, 1995, and gusts of 73.2 m/s were recorded on June5, 1995. Maximum wind velocity directions generally hadazimuths of 150° to 300o, indicating that the wind rarely blewfrom the northeast (figure 23). Temperature data were con-sistent with seasonal temperature cycles (figure 24), with amaximum recorded on August 5, 1994 (29 °C), and a minimumon December 31, 1994 (-19 °C).
A raised platform was constructed adjacent to the tower fora Novalynx evaporation pan and all-season precipitation gauge.Data from these two instruments were also collected by theCampbell Scientific datalogger on the tower. Data collectionstarted on August 30, 1994; however, a design error in theprecipitation gauge resulted in erroneous values. A replacementsensor was installed in late July 1995, but observed rainfall wasnot always recorded, resulting in insufficient data forcalculating evaporation. Readings from the rain gauge installed
near the mine office at an elevation of 1917 m indicated thatsignificant precipitation events occurred in the period betweenMarch through July 1995 (figure 25).
20
Figure 24.—Minimum and maximum temperature versus time.
Figure 25.—Precipitation versus time.
21
SUMMARY AND CONCLUSIONS
Material properties of a rock dump constructed of mineoverburden at least 50 years ago were measured using field andlaboratory techniques. Field measurements included in situdensity, surface water content, single-ring infiltrometer, anddownhole water content. Instruments installed at a weatherstation near the dump's crest collected wind, temperature,precipitation, and evaporation data. The rationale for con-ducting this work was to correlate the performance of an oldrock dump with its material properties. This information couldbe used to evaluate the stability of other old rock dumps.
Soil water content measurements were taken with a CampbellPacific nuclear depth-moisture gauge in 6.1-m-deep, vertical,stainless-steel-cased holes. These measurements indicated thatwater content decreased with depth up to 1.5 m below thedump’s surface and remained relatively constant from 1.5 to 5.8m. Despite numerous daily precipitation events in whichrainfall exceeded 15 mm, the maximum degree of saturation ata depth of 0.3 m in the rock dump was 82 pct. The condition ofa partially saturated surface, a relatively constant water contentin the dump’s interior, and the self-cementing
nature of the dump material may be the reasons why the dumphas remained stable for over 50 years.
Researchers determined that a nuclear surface-moisturedensity gauge could be used to measure surface densityprovided that the gauge was calibrated with measurementsobtained by the water replacement method. However, theaverage water content of the dump material measured by thegauge exceeded values obtained from oven drying by 40 pct,and correlation coefficient of data obtained from these twomeasurement techniques was only 0.67.
This work was intended to identify those physical propertiesand climatic conditions common to old, stable rock dumps.Similar investigations at failed rock dumps could identifydifferences in material properties between stable and unstabledumps that are critical to slope stability. With this knowledge,safer working practices could be developed. Future researchcould also include direct shear tests to determine materialstrength, slope stability analyses to calculate factors of safety,and investigations of the physical processes associated withnatural cementation observed at this site.
ACKNOWLEDGMENTS
The authors wish to express their appreciation to the minemanagement and engineering staff involved in this project forsuggestions in the experimental design, access to the researcharea, construction and maintenance of the weather station,contracting with the drilling company to drill and case theaccess holes for water content measurements, and providing thewater truck for the infiltration and in situ density tests. Bill M.Stewart and Ronald R. Backer, mining engineers at the Spokane
Research Laboratory, provided assistance with the field tests.Terrance J. McMahon, mining engineer, SRL, retired, assistedwith the laboratory tests; Bruce C. Vandre, geotechnicalengineer, USFS, retired, helped to identify research op-portunities; and John M. Kemeny, associate professor, Dept. ofMining and Geological Engineering, University of Arizona,provided the digital image processing software and assistance inits use.
REFERENCES
American Society for Testing Materials (ASTM). Standard Test Method forSieve Analysis of Fine and Coarse Aggregates. Vol. 4.02, C 136-93, 1994.
Broughton, S. E. Mined Rock and Overburden Piles, Review andEvaluation of Failures: Interim Report. British Columbia Ministry of Energy,Mines, and Petroleum Resources, Mar. 1992, 199 pp.
Canada Centre for Mineral and Energy Technology (CANMET).Liquifaction Flowslides in Western Canadian Coal Mine Waste Dumps, PhaseII: Case Histories. 1994.
Dawson, R. F., N. R. Morgenstern, and W. H. Gu. Instability MechanismsInitiating Flow Failures in Mountainous Mine Waste Dumps. Contract D.S.S.23440-0-9198101-X8G. CANMET, Nov. 1992, 80 pp.
Dawson, R. F., N. R. Morgenstern, and A. W. Stokes. LiquefactionFlowslides in Rocky Mountain Coal Mine Waste Dumps. Can. Geotech. J., vol.35, no. 2, 1998, pp. 328-343.
Dunn, I.S., L.R. Anderson, and F.W.Kiefer. Fundamentals of GeotechnicalAnalysis. Wiley & Sons, 1980, p. 235.
Fesak, G., R.M. Breland, and J. Sapdara. Analysis of Surface PoweredHaulage Accidents, January 1990-July 1996. Internal Report, Mine Safety andHealth Administration, U.S. Dept. of Labor, Arlington, VA, 1996, 14 pp.
Girdner, K., J. Kemeny, S. Annavarapu, and R. McGill. The Split Systemfor Analyzing the Size Distribution of Fragmented Rock. Measurement of BlastFragmentation: Proceedings of the Fragblast 5 Workshop on Measurement ofB l a s t F r a g m e n t a t i o n , J . F r a n k l i n a n dT. Katsabanis, eds. (Montreal, PQ, Aug. 23-24, 1996). Balkema, 1996, pp. 101-108.
Golder Associates, Ltd. Mined Rock and Overburden Piles: Failure RunoutCharacteristics. Interim Report. British Columbia Mine Waste Rock PileResearch Committee. Mar. 1992,Vol. 1, 199 pp.; Vol. 2, 118 pp.
_____. Mined Rock and Overburden Piles: Consequence Assessment forMine Waste Dump Failures. Interim Report. Ministry of Energy, Mines, andPetroleum Resources, Dec. 1994, 188 pp.
_____. Mined Rock and Overburden Piles: Runout Characteristics of Debrisfrom Dump Failures in Mountainous Terrain. Stage 2: Analysis, Modeling andPrediction. Feb, 1995, 274 pp.
HBT AGRA, Ltd. Mined Rock and Overburden Piles: Methods ofMonitoring. Interim Report. CANMET, Mar. 1992, 205 pp.
Kemeny, J. M., A. Devgan, R. M. Hagaman, and X. Wu. Analysis of RockFragmentation Using Digital Image Processing. J. Geotech. Engin., vol. 119,no. 7, 1993, pp. 1144-1160.
Klohn Leonoff, Ltd. Mined Rock and Overburden Piles: Operation andMonitoring of Mine Dumps. Interim Guidelines. British Columbia Mine WasteRock Pile Research Committee, May 1991, 70 pp.
Leps, T. M. Review of Shearing Strength of Rockfill. Journal of the SoilMechanics and Foundations Division. Vol. 96, no. SM4, July 1970, pp. 1159-1170.
_____. Flow-Through Rockfill. Embankment-Dam Engineering,Casagrande Volume. John Wiley, 1973, pp. 87-107.
Mariachi, N. D., C. K. Chan, and H. B. Seed. Evaluation of Properties ofRockfill Materials. J. Soil Mechan. Foundation Div., vol. 98, no. SM1, Jan.1972.

22
Olivier, H. J. A New Engineering-Geological Rock DurabilityClassification. Engin. Geol., no. 14, 1979, pp. 255-279.
_____. Importance of Rock Durability in the Engineering Classification ofKaroo Rock Masses for Tunnelling. Proceedings of the Symposium onExploration for Rock Engineering, Johannesburg, S. Africa, Nov. 1976. pp. 137-144.
Piteau Associates Engineering, Ltd. Mined Rock and OverburdenPiles—Investigation and Design of Mine Dumps, Interim Guidelines. Preparedfor the British Columbia Mine Dump Committee, 1991, p. 41.
Vallejo, L. E., R. A. Welsh, Jr., C. W. Lovell, and M. K. Robinson. TheInfluence of Fabric and Composition on the Durability of Appalachian Shales.Rock for Erosion Control, ASTM STP 1177, 1992.
Vandre, B. C. What is Coarse and Durable Mine Waste Rock? 29thEngineering Geology and Geotechnical Symposium (Mar. 22-24, 1993, Reno,NV). 14 pp.
Vukovic, M., and A. Soro. Determination of Hydraulic Conductivity ofPorous Media from Grain-Size Composition. Water Resources Publi., Littleton,CO, 1992.
Welsh, R. A. and M. K. Robinson. Improved Rock Durability TestingTechniques for Appalachian Valley Fills. U.S. Bur. Mines Inform. Cir. 9183,1988, pp. 220-227.
Williams, D. J., and L. K. Walker. Laboratory and Field Strength of MineWaste Rock. Transactions of the Institution of Engineers, Australia. CivilEngin., vol. 27, Aug. 1985, pp. 299-304.

DHHS (NIOSH) Publication No. 2000-110.
December 1999
To receive other information about occupational safety and health problems, call1-800-35-NIOSH (1-800-356-4674), or
visit the NIOSH Home Page on the World Wide Web athttp://www.cdc.gov/niosh


![ATTERBERG KLASIFIKASI[1]](https://img.pdfslide.net/doc/110x75/55cf97f6550346d03394b088/atterberg-klasifikasi1.jpg)