Embed Size (px)
Citation preview
Report
of the
Armed
Forces
Canteen
Council
For the
year ended
31 March
2011
Presented to the House of
Representatives Pursuant
to Section 13 of the Armed
Forces Canteens Act 1948
G5

- 1 -
Directory 2
Introduction 3
Highlights of the Year 4
Five year Performance Comparisons 4
Key Indicators 4
Report on Operations 5
Financial Review 7
Human Resources and Training 8
Distribution of Surplus 8
Outlook 8
Acknowledgement 9
Statement of Responsibility 10
Statement of Accounting Policies 11
Statement of Comprehensive Income 13
Statement of Changes in Equity 13
Balance Sheet 14
Cash Flow Statement 15
Notes to the Financial Statements 16
Auditor’s Report 21
- 2 -
Council Minister of Defence (Chair) Hon Dr Wayne Mapp Vice Chief of Defence Force (Deputy Chair) Rear Admiral J R Steer, ONZM Deputy Chief of Navy Commodore WRE Burroughs, MNZM, RNZN Deputy Chief of Army Brigadier CAS Lott, MNZM Deputy Chief of Air Force Air Commodore G J Howse, ONZM, AFC Financial and Commercial Adviser Mr. P Nankivell, BCA, CA Chief Executive Mr. A Jina, BCA, CA
Head Office Level 11 79 Boulcott Street PO Box 11-246 Wellington Telephone: (04) 496 6230 Fax: (04) 496 6239 Email: [email protected]
Solicitors Tripe Matthews & Feist, Wellington
Auditors Audit New Zealand, Wellington
Bankers Bank of New Zealand, 50 Manners Street, Wellington
G5

- 2 -
Council Minister of Defence (Chair) Hon Dr Wayne Mapp Vice Chief of Defence Force (Deputy Chair) Rear Admiral J R Steer, ONZM Deputy Chief of Navy Commodore WRE Burroughs, MNZM, RNZN Deputy Chief of Army Brigadier CAS Lott, MNZM Deputy Chief of Air Force Air Commodore G J Howse, ONZM, AFC Financial and Commercial Adviser Mr. P Nankivell, BCA, CA Chief Executive Mr. A Jina, BCA, CA
Head Office Level 11 79 Boulcott Street PO Box 11-246 Wellington Telephone: (04) 496 6230 Fax: (04) 496 6239 Email: [email protected]
Solicitors Tripe Matthews & Feist, Wellington
Auditors Audit New Zealand, Wellington
Bankers Bank of New Zealand, 50 Manners Street, Wellington
- 2 -
G5 G5
- 3 -
Mission The mission of the Armed Forces Canteen Council (AFCC) is:
“To provide a first class Canteen Service to meet the needs of the people of the New Zealand Defence Force”
Vision
“To be the first choice provider of Quality Canteen Services to the New Zealand Defence Force”
History Following the outbreak of the Second World War, it became apparent some form of canteen service was required to cater for the large intake of troops. The Canteen Board was set up under the Defence Canteen Emergency Regulations on 15 November 1939. After the war, the Government decided the Defence Canteen Emergency Regulations should remain in force and on 26 November 1948, Parliament passed the Armed Forces Canteens Act 1948. Initial funding was £106,833, an 11.6 percent share of the assets of the Canteen Board. Equity and the distribution of profits to the Services have increased over the years, reflecting the expansion of canteen and shop facilities at New Zealand Defence Force establishments and sound financial management. AFCC equity is currently $9.5m. Over the years, the AFCC has provided a full range of commercial services to keep pace with new demands, or to anticipate them. Trading outlets include grocery supermarkets, variety and duty free stores, cafeterias, canteens for field exercises and a wholesale service for military groups. The AFCC has maintained services at some military establishments, even though not profitable, to continue to provide a service to the members of the NZDF. The AFCC has outlets at camps and bases throughout New Zealand operating under the trading name of “Hot Shots”. The AFCC continues to provide canteen services to personnel of the New Zealand Defence Force (NZDF) and for part of the year, at Scott Base in Antarctica (New Zealand’s southernmost retail outlet).
Governance The functions of the Council are to provide amenities on service establishments for the benefit of members of the armed forces and of other persons employed or residing on those establishments. The AFCC, being a body corporate, is governed by a Council. The Council is chaired by the Minister of Defence with other members being the Vice Chief of Defence Force (Deputy Chair), the three Service Deputy Chiefs, a Financial and Commercial Adviser and the Chief Executive of the AFCC.
Trading Locations The Council has trading outlets at all major NZDF camps and bases from Auckland to Burnham and, seasonally, at Scott Base. The AFCC also supports field exercises and provides services on the frigates and international flights of service personnel that depart or land at NZDF airfields.
- 4 -
Sales reduced by $2.8m (15.4%) to $15.3m. Loss of prison business (approximately $1.2m p.a.) Improved gross profitability to 24.9% from 24.5% last year, the best ever in the history of the AFCC A net surplus of $916k, the 9th best result in the AFCC’s history
$550k was distributed to the members’ welfare funds in the year A new Point of Sale (POS) and retail management system was selected and tested, and is to be implemented in the 2012 year
2011 2010 2009 2008 2007 Turnover (Sales) $15.26m $18.04m $18.21m $16.06m $15.76m Cash $8.83m $9.47m $9.59m $8.35m $8.51m Pay Plan $4.56m $5.34m $5.24m $4.48m $4.04m Wholesale $1.87m $3.23m $3.38m $3.23m $3.21m Gross Profit $3.81m $4.41m $4.42m $3.88m $3.57m Other Income $0.73m $0.70m $0.76m $0.71m $0.67m Staff Remuneration $2.82m $2.86m $2.73m $2.66m $2.61m Property Charges $0.38m $0.48m $0.41m $0.41m $0.49m Other Overheads $0.42m $0.49m $0.52m $0.50m $0.51m Total Overheads $3.62m $3.83m $3.66m $3.57m $3.61m Net Surplus $0.92m $1.28m $1.52m $1.02m $0.63m Distribution $0.55m $0.77m $0.97m $0.71m $0.38m
2011 2010 2009 2008 2007 Equity $9.52m $9.16m $8.65m $8.11m $7.80m Total Assets $10.83m $10.77m $10.62m $9.76m $9.34m Working Capital Ratio 7.6 6.2 4.8 5.1 5.2 Quick Assets Ratio 5.6 4.6 3.3 3.5 3.5 Gross Profit % 24.9 24.5 24.3 24.2 22.6 Net Surplus % 6.0 7.1 8.3 6.3 4.0 Return on Equity - % 9.6 13.9 17.6 12.6 8.1 Value of Pay Plan Accounts $2.70m $3.20m $3.26m $2.93m $2.58m Distribution of Surplus $0.55m $0.77m $0.97m $0.71m $0.38m
- 3 -
G5 G5

- 3 -
Mission The mission of the Armed Forces Canteen Council (AFCC) is:
“To provide a first class Canteen Service to meet the needs of the people of the New Zealand Defence Force”
Vision
“To be the first choice provider of Quality Canteen Services to the New Zealand Defence Force”
History Following the outbreak of the Second World War, it became apparent some form of canteen service was required to cater for the large intake of troops. The Canteen Board was set up under the Defence Canteen Emergency Regulations on 15 November 1939. After the war, the Government decided the Defence Canteen Emergency Regulations should remain in force and on 26 November 1948, Parliament passed the Armed Forces Canteens Act 1948. Initial funding was £106,833, an 11.6 percent share of the assets of the Canteen Board. Equity and the distribution of profits to the Services have increased over the years, reflecting the expansion of canteen and shop facilities at New Zealand Defence Force establishments and sound financial management. AFCC equity is currently $9.5m. Over the years, the AFCC has provided a full range of commercial services to keep pace with new demands, or to anticipate them. Trading outlets include grocery supermarkets, variety and duty free stores, cafeterias, canteens for field exercises and a wholesale service for military groups. The AFCC has maintained services at some military establishments, even though not profitable, to continue to provide a service to the members of the NZDF. The AFCC has outlets at camps and bases throughout New Zealand operating under the trading name of “Hot Shots”. The AFCC continues to provide canteen services to personnel of the New Zealand Defence Force (NZDF) and for part of the year, at Scott Base in Antarctica (New Zealand’s southernmost retail outlet).
Governance The functions of the Council are to provide amenities on service establishments for the benefit of members of the armed forces and of other persons employed or residing on those establishments. The AFCC, being a body corporate, is governed by a Council. The Council is chaired by the Minister of Defence with other members being the Vice Chief of Defence Force (Deputy Chair), the three Service Deputy Chiefs, a Financial and Commercial Adviser and the Chief Executive of the AFCC.
Trading Locations The Council has trading outlets at all major NZDF camps and bases from Auckland to Burnham and, seasonally, at Scott Base. The AFCC also supports field exercises and provides services on the frigates and international flights of service personnel that depart or land at NZDF airfields.
- 4 -
Sales reduced by $2.8m (15.4%) to $15.3m. Loss of prison business (approximately $1.2m p.a.) Improved gross profitability to 24.9% from 24.5% last year, the best ever in the history of the AFCC A net surplus of $916k, the 9th best result in the AFCC’s history
$550k was distributed to the members’ welfare funds in the year A new Point of Sale (POS) and retail management system was selected and tested, and is to be implemented in the 2012 year
2011 2010 2009 2008 2007 Turnover (Sales) $15.26m $18.04m $18.21m $16.06m $15.76m Cash $8.83m $9.47m $9.59m $8.35m $8.51m Pay Plan $4.56m $5.34m $5.24m $4.48m $4.04m Wholesale $1.87m $3.23m $3.38m $3.23m $3.21m Gross Profit $3.81m $4.41m $4.42m $3.88m $3.57m Other Income $0.73m $0.70m $0.76m $0.71m $0.67m Staff Remuneration $2.82m $2.86m $2.73m $2.66m $2.61m Property Charges $0.38m $0.48m $0.41m $0.41m $0.49m Other Overheads $0.42m $0.49m $0.52m $0.50m $0.51m Total Overheads $3.62m $3.83m $3.66m $3.57m $3.61m Net Surplus $0.92m $1.28m $1.52m $1.02m $0.63m Distribution $0.55m $0.77m $0.97m $0.71m $0.38m
2011 2010 2009 2008 2007 Equity $9.52m $9.16m $8.65m $8.11m $7.80m Total Assets $10.83m $10.77m $10.62m $9.76m $9.34m Working Capital Ratio 7.6 6.2 4.8 5.1 5.2 Quick Assets Ratio 5.6 4.6 3.3 3.5 3.5 Gross Profit % 24.9 24.5 24.3 24.2 22.6 Net Surplus % 6.0 7.1 8.3 6.3 4.0 Return on Equity - % 9.6 13.9 17.6 12.6 8.1 Value of Pay Plan Accounts $2.70m $3.20m $3.26m $2.93m $2.58m Distribution of Surplus $0.55m $0.77m $0.97m $0.71m $0.38m
- 4 -
G5 G5

- 5 -
Business Objectives 2011 The objectives for financial performance for the year were:
• Sales of $16.8m • A gross profit margin of 23.2 percent on sales • A net surplus of $0.85m • Expenses and overheads to be less than 22.4% of sales • The containment of wage costs to 16.9% of sales • Interest income of $600k • Invest $52k in developing services (excluding POS)
Sales Annual sales decreased by $2.8m (15.4%) to $15.3m, compared with last year’s figure of $18.0m. This was below the 2011 Business Plan objective of $16.8m. The decrease in sales can be attributed to a number of factors, including:
• Most significantly, the loss of the prison business in Burnham, which accounted for an estimated $1.2m in lost sales.
• Very strong competition in the market place. External businesses are allowed to advertise in NZDF publications. NZDF personnel business has been targeted particularly by Noel Leemings, who have the NZDF contract for small appliances. Some of the interest free deals offered by High Street retailers have been difficult to match. It is widely acknowledged that some High Street retailers are trading at unsustainably low profit margins and this has been reflected in their published results. It is expected that there will be some consolidation in consumer electronics retailing within the next few years.
• Very strong competition from on-line retailers. The costs of setting up an on-line business are relatively small and the proliferation of such shopping sites available is transforming retail in New Zealand.
• The reduction in the number of new recruits in the New Zealand Defence Force. Tamaki Naval Base, Woodbourne Air Force Base and Waiouru Army Camp have all experienced very poor sales. Tamaki had two quarters with no intake at all. Recruits have traditionally been strong supporters of the AFCC.
• Reduced mess trading at Air Force locations. • Increased deployments of troops overseas, to major exercises and to post-earthquake
duties in Christchurch reduced our resident customer base. Linton, for example, was down on last year as a direct consequence.
• Uncertainty around job security is another likely factor influencing purchasing decisions, with uniformed personnel yet to learn which roles will be civilianised, and value for money initiatives possibly reducing overall personnel numbers.
• NZDF personnel and their families are also affected by the current recessionary economic environment.
Cash sales were down $644k (6.8%) compared with last year. These convenience sales are the staple part of the business. A major influence on cash sales is the size of camp/base resident populations, which fluctuate. Pay-Plan sales were also down by $781k (14.6%). This reflects increasing High Street and internet-based competition. In recent months, extraordinary offers have been extended by competitors. The lower number of recruits is a also a significant factor in the lower sales.
- 6 -
The most significant reductions in sales were in wholesale sales, down by $1,351k (41.8%). This is mainly because of the loss of the sales to Christchurch prison inmates, but also as more AFCC business is taken by local, subsidised NZDF mess contractors in running bars etc. Navy duty free sales reduced by 31% to $254k ($370k in 2010) reflecting a decrease in international deployments. The 2010 year was particularly strong with the introduction of the new vessels. Air Force duty free sales from Ohakea were the same as last year, at $91k. Whenuapai duty free increased by $12k (14%) to $97k. Navy sales were down overall by 16.7%. The lower duty free sales have already been noted, but Tamaki sales declined by $317k (34.7%). There were two quarters during which there were no new Navy recruits. Army sales reduced following the loss of the Burnham-based prison sales, as well as the other factors noted above. The total reduction in Army sales was $2,116k (an 18.5% decrease). After Burnham, Waiouru sales volume reduced by $555k (a 16.2% decrease) reflecting low new recruit numbers and the continuing movement of functions previously from Waiouru to other camps. Air sales decreased by $152k (5.0%). Ohakea sales were similar to last year. Whenuapai sales were behind last year by $45k (3.6%), although there was a lift in duty free sales as noted. Woodbourne was down by $121k (16.4%). A new manager commenced in July 2010, but with the very low population on the Base, sales cannot be readily increased.
Gross Profit The gross profit has reduced by $608k, but the gross profit percentage has actually increased to 24.9% (last year 24.5%). This is the highest percentage ever achieved by the AFCC. The high margin reflects a change in the mix of sales, as the less profitable wholesale business has declined more than the higher margin activities of the business. Although there has been a significant reduction in business volume, the AFCC’s maintenance of gross profitability compares favourably with those High Street retailers that have reduced margins to maintain market share during the economic downturn. Retail margins will continue to be under pressure as competition increases amongst the major existing chains, and while Australian chains investigate New Zealand opportunities. New Zealand retail margins in consumer electronics are not sustainable so some rationalisation in the retail sector is likely in the immediate future.
Interest Income (Other Income) Income derived from interest on Pay Plan sales and bank short term deposits totalled $602k. This was $19k (3.2 percent) more than last year and more than the business objective. As inventory holdings have been reduced and Pay Plan loans turned into cash, bank deposits have increased by $750k, although bank deposit interest rates have reduced and the lower level of Pay Plan loans reduces the overall effective interest rate earned. 2011 Pay Plan interest earned was $392k (last year $436k). This result reflects the decrease in hire purchase sales and the need to offer periods of interest-free hire purchase finance to remain competitive with other retailers.
Expenses and Overheads (Total Expenses)
Total expenditure for the year decreased by $212k (5.5 percent) to $3,621k, compared with last year’s figure of $3,833k. This is 23.7 percent of total sales with the business objective being 22.4 percent. Although some savings have been made, the sharp decline in sales has frustrated the achievement of this objective.
- 5 -
G5 G5

- 5 -
Business Objectives 2011 The objectives for financial performance for the year were:
• Sales of $16.8m • A gross profit margin of 23.2 percent on sales • A net surplus of $0.85m • Expenses and overheads to be less than 22.4% of sales • The containment of wage costs to 16.9% of sales • Interest income of $600k • Invest $52k in developing services (excluding POS)
Sales Annual sales decreased by $2.8m (15.4%) to $15.3m, compared with last year’s figure of $18.0m. This was below the 2011 Business Plan objective of $16.8m. The decrease in sales can be attributed to a number of factors, including:
• Most significantly, the loss of the prison business in Burnham, which accounted for an estimated $1.2m in lost sales.
• Very strong competition in the market place. External businesses are allowed to advertise in NZDF publications. NZDF personnel business has been targeted particularly by Noel Leemings, who have the NZDF contract for small appliances. Some of the interest free deals offered by High Street retailers have been difficult to match. It is widely acknowledged that some High Street retailers are trading at unsustainably low profit margins and this has been reflected in their published results. It is expected that there will be some consolidation in consumer electronics retailing within the next few years.
• Very strong competition from on-line retailers. The costs of setting up an on-line business are relatively small and the proliferation of such shopping sites available is transforming retail in New Zealand.
• The reduction in the number of new recruits in the New Zealand Defence Force. Tamaki Naval Base, Woodbourne Air Force Base and Waiouru Army Camp have all experienced very poor sales. Tamaki had two quarters with no intake at all. Recruits have traditionally been strong supporters of the AFCC.
• Reduced mess trading at Air Force locations. • Increased deployments of troops overseas, to major exercises and to post-earthquake
duties in Christchurch reduced our resident customer base. Linton, for example, was down on last year as a direct consequence.
• Uncertainty around job security is another likely factor influencing purchasing decisions, with uniformed personnel yet to learn which roles will be civilianised, and value for money initiatives possibly reducing overall personnel numbers.
• NZDF personnel and their families are also affected by the current recessionary economic environment.
Cash sales were down $644k (6.8%) compared with last year. These convenience sales are the staple part of the business. A major influence on cash sales is the size of camp/base resident populations, which fluctuate. Pay-Plan sales were also down by $781k (14.6%). This reflects increasing High Street and internet-based competition. In recent months, extraordinary offers have been extended by competitors. The lower number of recruits is a also a significant factor in the lower sales.
- 6 -
The most significant reductions in sales were in wholesale sales, down by $1,351k (41.8%). This is mainly because of the loss of the sales to Christchurch prison inmates, but also as more AFCC business is taken by local, subsidised NZDF mess contractors in running bars etc. Navy duty free sales reduced by 31% to $254k ($370k in 2010) reflecting a decrease in international deployments. The 2010 year was particularly strong with the introduction of the new vessels. Air Force duty free sales from Ohakea were the same as last year, at $91k. Whenuapai duty free increased by $12k (14%) to $97k. Navy sales were down overall by 16.7%. The lower duty free sales have already been noted, but Tamaki sales declined by $317k (34.7%). There were two quarters during which there were no new Navy recruits. Army sales reduced following the loss of the Burnham-based prison sales, as well as the other factors noted above. The total reduction in Army sales was $2,116k (an 18.5% decrease). After Burnham, Waiouru sales volume reduced by $555k (a 16.2% decrease) reflecting low new recruit numbers and the continuing movement of functions previously from Waiouru to other camps. Air sales decreased by $152k (5.0%). Ohakea sales were similar to last year. Whenuapai sales were behind last year by $45k (3.6%), although there was a lift in duty free sales as noted. Woodbourne was down by $121k (16.4%). A new manager commenced in July 2010, but with the very low population on the Base, sales cannot be readily increased.
Gross Profit The gross profit has reduced by $608k, but the gross profit percentage has actually increased to 24.9% (last year 24.5%). This is the highest percentage ever achieved by the AFCC. The high margin reflects a change in the mix of sales, as the less profitable wholesale business has declined more than the higher margin activities of the business. Although there has been a significant reduction in business volume, the AFCC’s maintenance of gross profitability compares favourably with those High Street retailers that have reduced margins to maintain market share during the economic downturn. Retail margins will continue to be under pressure as competition increases amongst the major existing chains, and while Australian chains investigate New Zealand opportunities. New Zealand retail margins in consumer electronics are not sustainable so some rationalisation in the retail sector is likely in the immediate future.
Interest Income (Other Income) Income derived from interest on Pay Plan sales and bank short term deposits totalled $602k. This was $19k (3.2 percent) more than last year and more than the business objective. As inventory holdings have been reduced and Pay Plan loans turned into cash, bank deposits have increased by $750k, although bank deposit interest rates have reduced and the lower level of Pay Plan loans reduces the overall effective interest rate earned. 2011 Pay Plan interest earned was $392k (last year $436k). This result reflects the decrease in hire purchase sales and the need to offer periods of interest-free hire purchase finance to remain competitive with other retailers.
Expenses and Overheads (Total Expenses)
Total expenditure for the year decreased by $212k (5.5 percent) to $3,621k, compared with last year’s figure of $3,833k. This is 23.7 percent of total sales with the business objective being 22.4 percent. Although some savings have been made, the sharp decline in sales has frustrated the achievement of this objective.
- 6 -
G5 G5

- 7 -
The major component of total expenditure is wage and salary costs. These decreased by $34k (1.2%) to $2,822k, compared with last year’s figure of $2,856k. This cost is 18.5% of sales and is higher than last year’s 15.8% and the business objective of 16.9%. Although two staff were made redundant following the loss of the prison business, the increase in the minimum wage, Kiwisaver payments and the compulsory four weeks annual leave entitlement have all increased the AFCC’s total costs. AFCC outlets are better staffed in the current year compared to last year. In 2012, staffing levels will be better matched to the new level of turnover, for those locations where turnover has reduced sharply. Property charges decreased by $106k (21.8%) to $377k compared with last year’s figure of $483k. This was chiefly because of the reduced depreciation of fixed assets, with some expensive leasehold improvements now fully depreciated. In addition, the AFCC benefited in the 2011 year from reduced head office rent and a four month rent holiday.
Net Surplus The net surplus for 2011 was $916k, or 6.0% of sales. This compares with last year’s net surplus of $1,276k, or 7.1% of sales. The $361k reduction in the net surplus was the consequence of the lower sales, partially offset by the reduced expenditure. Although considerably down on the last two years, this still represents a good level of surplus, being the 9th-best result in the AFCC’s 62 years.
Cash Flow The cash flow from operating activities resulted in a net gain of $964k. The cash balance improved because of reduced stock and accounts receivable, together with improved hire purchase debt collection. The cash outflow from investing activities totalled $1,470k. These cash flows produced a net decrease in cash held for the year of $505k. The balance of cash and cash equivalents held at 31 March 2011 was $352k and short-term deposits (deposits longer than three months) totaled $4,267k. The total of cash and cash equivalents, and short-term bank deposits amount to $4,620k compared with last years’ total of $3,870k. The AFCC was in a good cash position throughout the year and was able to meet its debts as they fell due.
As at 31 March 2011, the equity of the Council was $9,524k, an increase of $366k over last year. The equity was comprised of total assets of $10,828k, less total liabilities of $1,304k. Assets were cash and cash equivalents, short-term bank deposits, accounts receivable, inventory, fixed and intangible assets. Cash and bank deposits totalling $4,620k covered accounts payable and distributions of surplus when they fell due. Accounts receivable totalled $2,948k. Of this total, $2,701k represented balances in Pay Plan accounts. Inventory decreased by $92k from last year, to $2,486k. Fixed assets had a book value of $504k, which is $146k lower than last year. This year has seen the acquisition of the new POS software, reflected in the increase in intangible assets by $123k, to $126k. (There was an additional commitment for the balance of $57k for the software, which was paid in the new 2012 financial year.) Investments (shares and deposits in grocery and appliance-buying groups) increased from $123k to $145k.
- 8 -
Total liabilities were comprised of accounts payable and the outstanding distribution of surplus payable. Accounts payable decreased by $200k, and totalled $1,118k at the end of the financial year. The AFCC continues to be in a strong financial position.
One of the AFCC’s strengths is its experienced and motivated management team and workforce. The AFCC assists the development of staff by supporting training through the Retailers Association and the Retail Industry Training Organisation, so helping staff to gain recognised NZQA qualifications. There were two manager appointments at Hot Shots locations during the year. Viv Lauridsen was appointed manager at Trentham in March 2011. Claire Buchanan was appointed manager at Woodbourne in October 2010. As at 31 March 2011, the AFCC had 95 employees: 67 full-time and 28 part-time. The Manager of the Year Award was presented to Rob Gledhill, who is responsible for the Shop Café and Duty Free activities at the Philomel Naval Base. Our dedicated team at the Burnham Shops and Café must also be acknowledged, as they exceeded what could reasonably have been expected of them, at the time of most need, during the immediate aftermath of the Christchurch earthquake. The cafe was open continuously over this period, providing much needed sustenance to the many support workers who were based in the camp.
An interim distribution of surplus of $364,000 was paid after the first six months of trading. Provision has been made for a final distribution of $186,000, making the total distribution of surplus for the year $550,000. This is a reduction of $216,000 from 2010. The AFCC has retained $365,542 to maintain working capital, upgrade trading facilities, undertake a programme of capital investment and sustain its ability to take advantage of business opportunities. Distributions are made to Service Welfare Funds to provide amenities and benefits which facilitate Service recruitment, retention and morale. The payment of distributions of surplus is in keeping with the role of the AFCC and is a tangible reward for NZDF personnel who shop with the organisation.
It is expected that the 2012 year will be difficult as the implications of the recent Defence White Paper are worked through by the NZDF, over and above existing challenges. There are various initiatives to stimulate and grow the business and to reduce costs where possible, including:
• The new POS system is currently being introduced. This will secure the IT infrastructure of the AFCC as well as provide a platform for the introduction of additional services and a loyalty programme.
- 7 -
G5 G5

- 8 -
Total liabilities were comprised of accounts payable and the outstanding distribution of surplus payable. Accounts payable decreased by $200k, and totalled $1,118k at the end of the financial year. The AFCC continues to be in a strong financial position.
One of the AFCC’s strengths is its experienced and motivated management team and workforce. The AFCC assists the development of staff by supporting training through the Retailers Association and the Retail Industry Training Organisation, so helping staff to gain recognised NZQA qualifications. There were two manager appointments at Hot Shots locations during the year. Viv Lauridsen was appointed manager at Trentham in March 2011. Claire Buchanan was appointed manager at Woodbourne in October 2010. As at 31 March 2011, the AFCC had 95 employees: 67 full-time and 28 part-time. The Manager of the Year Award was presented to Rob Gledhill, who is responsible for the Shop Café and Duty Free activities at the Philomel Naval Base. Our dedicated team at the Burnham Shops and Café must also be acknowledged, as they exceeded what could reasonably have been expected of them, at the time of most need, during the immediate aftermath of the Christchurch earthquake. The cafe was open continuously over this period, providing much needed sustenance to the many support workers who were based in the camp.
An interim distribution of surplus of $364,000 was paid after the first six months of trading. Provision has been made for a final distribution of $186,000, making the total distribution of surplus for the year $550,000. This is a reduction of $216,000 from 2010. The AFCC has retained $365,542 to maintain working capital, upgrade trading facilities, undertake a programme of capital investment and sustain its ability to take advantage of business opportunities. Distributions are made to Service Welfare Funds to provide amenities and benefits which facilitate Service recruitment, retention and morale. The payment of distributions of surplus is in keeping with the role of the AFCC and is a tangible reward for NZDF personnel who shop with the organisation.
It is expected that the 2012 year will be difficult as the implications of the recent Defence White Paper are worked through by the NZDF, over and above existing challenges. There are various initiatives to stimulate and grow the business and to reduce costs where possible, including:
• The new POS system is currently being introduced. This will secure the IT infrastructure of the AFCC as well as provide a platform for the introduction of additional services and a loyalty programme.
- 8 -
G5 G5
- 9 -
• Negotiations with new suppliers in gaming consoles and mobile phones are expected to improve our range and profitability in these product categories.
• Rationalisation of the services and staffing at some of the smaller locations, as some of the smaller Canteens continue to struggle to break even.
I congratulate the management and staff of the AFCC on this year’s creditable result in a challenging trading environment. The success of the AFCC, as always, benefits NZDF personnel through the Services’ Welfare Funds. I also acknowledge the effective governance provided by the Council. Hon. Wayne Mapp Minister of Defence Chair, Armed Forces Canteen Council
- 10 -
The Council is responsible for ensuring that the financial statements give a true and fair view of the financial position of the Armed Forces Canteen Council as at 31 March 2011 and its financial performance and cash flows for the year ended on that date. The Council considers that the financial statements as presented have been prepared using the appropriate accounting policies, consistently applied and supported by reasonable judgments and estimates, and that all relevant financial reporting and accounting standards have been followed. The Council believes that proper accounting records have been kept which enable, with reasonable accuracy, the determination of the financial position of the Council and facilitate compliance of the financial statements with generally accepted accounting practice. The Council considers they have taken adequate steps to safeguard the assets of the Council and to prevent and detect fraud and other irregularities. The Council is pleased to present the financial statements for the financial year ended 31 March 2011. For and on behalf of the Council Hon Wayne Mapp Arvin Jina Minister of Defence Chief Executive Chair, Armed Forces Canteen Council 31st May 2011
- 9 -
G5 G5

- 9 -
• Negotiations with new suppliers in gaming consoles and mobile phones are expected to improve our range and profitability in these product categories.
• Rationalisation of the services and staffing at some of the smaller locations, as some of the smaller Canteens continue to struggle to break even.
I congratulate the management and staff of the AFCC on this year’s creditable result in a challenging trading environment. The success of the AFCC, as always, benefits NZDF personnel through the Services’ Welfare Funds. I also acknowledge the effective governance provided by the Council. Hon. Wayne Mapp Minister of Defence Chair, Armed Forces Canteen Council
- 10 -
The Council is responsible for ensuring that the financial statements give a true and fair view of the financial position of the Armed Forces Canteen Council as at 31 March 2011 and its financial performance and cash flows for the year ended on that date. The Council considers that the financial statements as presented have been prepared using the appropriate accounting policies, consistently applied and supported by reasonable judgments and estimates, and that all relevant financial reporting and accounting standards have been followed. The Council believes that proper accounting records have been kept which enable, with reasonable accuracy, the determination of the financial position of the Council and facilitate compliance of the financial statements with generally accepted accounting practice. The Council considers they have taken adequate steps to safeguard the assets of the Council and to prevent and detect fraud and other irregularities. The Council is pleased to present the financial statements for the financial year ended 31 March 2011. For and on behalf of the Council Hon Wayne Mapp Arvin Jina Minister of Defence Chief Executive Chair, Armed Forces Canteen Council 31st May 2011
- 10 -
G5 G5
STATEMENT OF ACCOUNTING POLICIESFOR THE YEAR ENDED 31 MARCH 2011
REPORTING ENTITY: The reporting entity is the Armed Forces Canteen Council (AFCC). The AFCC is a Public Benefit Entity established under the Armed Forces Canteens Act 1948 (The Act). The principle activity is to provide canteen services to the Armed Forces. These financial statements have been prepared to comply with Section 13 of The Act, Generally Accepted Accounting Practice (NZ GAAP) and the New Zealand Equivalents to International Financial Reporting Standards (NZ IFRS). MEASUREMENT BASE : The measurement base adopted is historical cost. The financial statements are presented in New Zealand currency. The functional currency of the AFCC is New Zealand Dollars.
ACCOUNTING POLICIES: The following particular accounting policies, which materially affect the measurement of financial results and financial position have been applied. The estimates and associated assumptions are based on historical experience and various other factors that are believed to be reasonable under the circumstances. Actual results may differ from these estimates.
Financial Instruments: The Council is party to financial instruments as part of its normal operations. These financial instruments include cash and cash equivalents, accounts receivable, held to maturity investments, and accounts payable. All financial instruments are recognised in the Balance Sheet and all revenues and expenses in relation to financial instruments are recognised in the Income Statement.
Cash and Cash Equivalents: Cash and cash equivalents include cash on hand, bank accounts and deposits with a maturity of no more than three months from the date of acquisition.
Accounts Receivable: Accounts receivable are designated as loans and receivables. They are initially measured at fair value and subsequently measured at their estimated realisable value after providing for a provision for impairment. Impairment is established when there is objective evidence, on a case by case basis, that the Council will not be able to collect amounts due according to the original terms of the agreement.
- 11 -
Held to Maturity Investments : Held to maturity investments are assets with fixed or determinable payments and fixed maturities that the AFCC has a positive intention and ability to hold to maturity. After initial recognition they are measured at amortised cost. Gains and losses when the asset is impaired or derecognised are recognised in the Income Statement. Investments in this category include short term bank deposits maturing after three months and deposits in Grocery and Appliance Buying Groups.
Inventories : Inventories consist of goods held for resale and are valued at the lower of cost or net realisable value, on a weighted average basis.
Financial Assets at Fair Value Through Equity: Financial assets at fair value through equity are those that are not classified in any of the other categories above. This category encompasses shareholdings that the AFCC holds for strategic purposes in Grocery and Appliance Buying Groups. These investments are subsequently measured at their fair value. As there is no quoted market price or other method to determine their market value, cost is used to approximate their market value.
Fixed Assets (Property, Plant and Equipment) : Fixed assets costing more than $200 are capitalised and recorded at cost less accumulated depreciation. All groups of assets forming part of a network which are material in aggregate are capitalised and recorded at cost. Any write-down of an item to its recoverable amount is recognised in the Income Statement.
- 11 -- 11 -
G5 G5

STATEMENT OF ACCOUNTING POLICIESFOR THE YEAR ENDED 31 MARCH 2011
Depreciation: Depreciation is provided on a straight line basis on all fixed assets including leasehold improvements at a rate which will write off the cost of the assets over their estimated useful lives. The useful lives and associated depreciation rates of major classes of assets have been estimated as follows: Buildings 40 Years 2.5% - 10% Computer Equipment 3 to 8 Years 12.5% - 30% Leasehold Improvements 5 to 10 Years 10% - 20% Motor Vehicles 5 to 7 Years 15% - 20% Plant and Equipment 5 to 8 Years 12.5% - 20% Video and DVD tapes 2 Years 50%
Intangible Assets: Acquired computer software licenses are capitalised on the basis of costs incurred to acquire and bring to use the specific software.
Amortisation: The carrying value of an intangible asset with a finite life is amortised on a straight-line basis over its useful life. The useful life and associated amortisation rate is as follows: Computer Software 3 to 8 Years 12.5% - 30%
Statement of Cash Flows. : Cash means cash and cash equivalents and bank accounts. Operating activities include cash and interest received from customers and records the cash payments for goods and services to suppliers and employees, net goods and service tax, interest paid to the bank and distribution of surpluses. Investing activities are those activities relating to the acquisition and disposal of non current assets.
Sales Revenue: The AFCC derives revenue through the sale of goods and services. Such revenue is recognised and recorded when the sale takes place.
Interest Income: Interest earned on hire purchase agreements is calculated on the daily balances and charged to the agreements monthly.
- 12 -
Employee Entitlements: Provision is made for annual leave liability which is calculated on an actual entitlement basis at current rates of pay. Sick Leave liability is calculated on the basis of unused entitlement at balance date to the extent that AFCC anticipates it will be used by staff to cover future absences.
Operating Leases : Leases where the lessor effectively retains substantially all the risks and benefits of ownership of the leased items are classified as operating leases. Operating lease expenses are recognised on a systematic basis over the period of the lease.
Income Tax : Income tax is not payable pursuant to Section 16 (1) of the Armed Forces Canteens Act 1948.
Goods and Service Tax (GST): The financial statements have been prepared so that all components are stated exclusive of GST with the exception of receivables and payables which are stated with GST included. The amount of GST owing to the Inland Revenue Department at balance date, being the difference between Output GST and Input GST, is included in Accounts Payable.
CHANGES IN ACCOUNTING POLICIES: There have been no changes in accounting policies since the date of the last financial statements. All policies have been applied on a basis consistent with previous years.
- 12 -- 12 -
G5 G5

STATEMENT OF COMPREHENSIVE INCOMEFOR THE YEAR ENDED 31 MARCH 2011
NOTE 2011 2010$ $
Sales revenue 15,264,388 18,040,800
Cost of sales 11,458,135 13,626,722
Gross profit 3,806,253 4,414,078
Other income 1 730,291 695,795
Less expenses: Employee remuneration. 2,821,931 2,856,149 Property charges 2 377,433 482,959 Interest 789 1,567 Other expenses 3 420,849 492,734
Total expenses 3,621,002 3,833,409
Net surplus 915,542 1,276,464
Less distributions 4 550,000 766,000
Net surplus after distributions 365,542 510,464
- 13 -
STATEMENT OF CHANGES IN EQUITYFOR THE YEAR ENDED 31 MARCH 2011
2011 2010$ $
Net Surplus 365,542 510,464
Equity at beginning of year 9,158,493 8,648,029
Equity at end of period 9,524,035 9,158,493
The Statement of Accounting Policies and accompanying Notes form part of these financial statements.
- 13 -- 13 -
G5 G5

BALANCE SHEETAS AT 31 MARCH 2011
NOTE 2011 2010$ $
EQUITY 9,524,035 9,158,493
Represented by:
CURRENT ASSETS
Cash and cash equivalents 5 352,207 857,704
Short term bank deposits 6 4,267,474 3,011,923
Accounts receivable 7 2,728,530 3,500,177
Inventory 2,485,688 2,578,044
Investments 8 12,390 5,200
9,846,289 9,953,048
NON-CURRENT ASSETS
Accounts receivable 7 219,772 49,659
Investments 8 132,207 117,900
Fixed assets 9 503,892 650,506
Intangible assets 10 125,853 2,394
- 14 -
TOTAL ASSETS 10,828,013 10,773,507
CURRENT LIABILITIES
Creditors and other payables 11 1,117,978 1,318,114
Surplus payable 4 186,000 296,900
TOTAL LIABILITIES 1,303,978 1,615,014
NET ASSETS 9,524,035 9,158,493
The Statement of Accounting Policies and accompanying Notes form part of these financial statements.
- 14 -- 14 -
G5 G5

CASH FLOW STATEMENTFOR THE YEAR ENDED 31 MARCH 2011
NOTE 2011 2010$ $
Cash flows from operating activities
Cash was provided from: Receipts from customers 16,006,307 18,613,378 Interest received 601,600 582,932
16,607,907 19,196,310Cash was disbursed to: Payments to suppliers (12,096,476) (14,040,355) Payments to employees (2,873,766) (2,831,130) Distribution of surplus (660,900) (955,100) Net goods and service tax (11,694) (370,206) Interest paid (789) (1,567)
(15,643,625) (18,198,358)
Net cash inflow from operating activities 12 964,282 997,952
Cash flows from investing activities
Cash was provided from: Proceeds from sale of fixed assets 57,015 13,672 Net proceeds from term deposit maturities 7,117,893 5,108,077
7,174,908 5,121,749Cash was disbursed to: Net purchases of term deposits (8,375,000) (8,120,000) Purchase of fixed assets (125,261) (114,662) Purchase of intangible assets (124,485) (2,433) Purchase of investments (19,941) (5,473)
(8,644,687) (8,242,568)
Net cash (outflow) from investing activities (1,469,779) (3,120,819)
- 15 -
Net cash (outflow) from investing activities (1,469,779) (3,120,819)
Net (decrease) in cash held (505,497) (2,122,867)
Opening cash brought forward 857,704 2,980,571
Ending cash carried forward 352,207 857,704
This is represented by:
Cash and cash equivalents 5 352,207 857,704
The Net goods and services tax component of operating activities reflects the net GST paid to and receivedfrom the Inland Revenue Department.
The Statement of Accounting Policies and accompanying Notes form part of these financial statements.
- 15 -- 15 -
G5 G5

NOTES TO AND FORMING PART OF THE FINANCIAL STATEMENTSFOR THE YEAR ENDED 31 MARCH 2011
2011 2010$ $
1. Other Income
Interest income 601,600 582,932 Commission 25,361 31,403 Rental from houses 32,651 18,737 Pay plan fees 62,432 59,764 Dividend received 8,247 2,959
730,291 695,795
2. Property Charges Depreciation and amortisation 215,886 324,347 Rental, concession fees and power 63,620 76,827 Repairs and maintenance 58,571 39,054 Motor vehicle expenses 39,356 42,731
377,433 482,959
3. Other Expenses
Audit fees for financial statements 32,870 31,100 Bad debt written off 23,408 28,908 Change in provision for impairment (5,645) 17,574 Operating leases 49,965 48,774 Sundry 320,251 366,378
420,849 492,734
4. Distribution of Surplus Distributions to the NZDF Single Services Welfare Funds pursuant to section 14 of the Armed Forces Canteens Act 1948.
Interim distributions paid were: Army Central Welfare Fund 244,995 302,739
- 16 -
Army Central Welfare Fund 244,995 302,739 RNZ Navy Central Fund 105,838 133,265 RNZ Airforce Central Fund 13,167 33,096
364,000 469,100 Final distributions payable are: Army Central Welfare Fund 129,138 206,318 RNZ Navy Central Fund 56,862 90,582
186,000 296,900
Total distribution 550,000 766,000
5. Cash and Cash Equivalents
Cash 70,319 70,479 Bank 90,416 83,762 Deposits with Grocery Groups 141 1,697 Deposit with the Bank 191,331 701,766
352,207 857,704
6. Short Term Bank Deposits Deposits placed with the Bank of New Zealand on short term 4,267,474 3,011,923 periods of greater than three months pending working capital and capital expenditure. Interest earned on these deposits are at the prevailing market rates.
- 16 -- 16 -
G5 G5

NOTES TO AND FORMING PART OF THE FINANCIAL STATEMENTSFOR THE YEAR ENDED 31 MARCH 2011
2011 2010$ $
7. Accounts Receivable Trade receivables 2,937,259 3,535,019 Other receivables 11,043 14,817
2,948,302 3,549,836 This is made up of: Current portion 2,895,687 3,495,240 Overdue 264,991 261,574 Less Impaired (212,376) (206,978)
2,948,302 3,549,836
Accounts receivable due within one year 2,728,530 3,500,177 Accounts receivable due after one year 219,772 49,659
2,948,302 3,549,836
Provision for impairment of receivables Opening Balance 206,978 189,406 Additional provisions made during the year 9,216 96,862 Receivables written off during the period (3,818) (79,290) Closing Balance 212,376 206,978
Collateral over impaired receivables is held to the extent that a fixed charge is retained over any goods sold on hire purchase until the final payment is made.
8. Investments Shares and Deposits in Grocery and Appliance Buying Groups - Deposits maturing within one year 12,390 5,200
- Trading Shares fully paid 58,964 46,664 - Deposits maturing after one year 73,243 71,236 Total term portion. 132,207 117,900
- 17 -
Total term portion. 132,207 117,900
Total Investments 144,597 123,100
9. Fixed Assets
Current yearOpening Closing
Cost Cost Additions Disposals Cost$ $ $ $
Buildings 103,503 0 103,503Leasehold Improvements 642,451 165,064 477,387Computer equipment 317,722 14,174 31,011 300,885Motor Vehicle 507,987 69,084 76,318 500,753Plant and equipment 1,332,395 40,288 54,602 1,318,081Video and DVD tapes 77,990 1,715 10,725 68,980
2,982,048 125,261 337,720 2,769,589
Accumulated depreciation Opening Depreciation Depn on ClosingAccum Depn Disposals Accum Depn
$ $ $ $Buildings 89,301 1,222 90,523Leasehold Improvements 549,672 77,663 165,065 462,270Computer equipment 278,499 18,815 35,412 261,902Motor Vehicle 308,210 78,737 64,909 322,038Plant and equipment 1,031,272 72,523 42,486 1,061,309Video and DVD tapes 74,588 3,324 10,257 67,655
2,331,542 252,284 318,129 2,265,697
- 17 -- 17 -
G5 G5
NOTES TO AND FORMING PART OF THE FINANCIAL STATEMENTSFOR THE YEAR ENDED 31 MARCH 2011
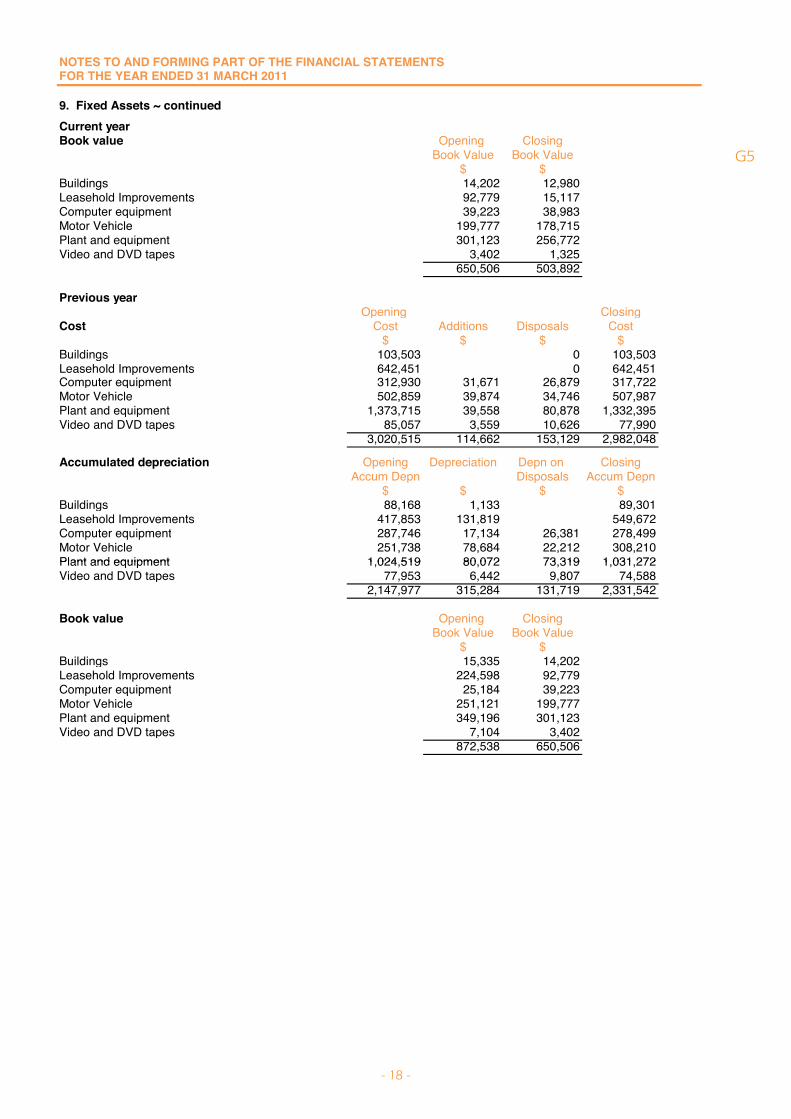
9. Fixed Assets ~ continuedCurrent yearBook value Opening Closing
Book Value Book Value$ $
Buildings 14,202 12,980Leasehold Improvements 92,779 15,117Computer equipment 39,223 38,983Motor Vehicle 199,777 178,715Plant and equipment 301,123 256,772Video and DVD tapes 3,402 1,325
650,506 503,892
Previous yearOpening Closing
Cost Cost Additions Disposals Cost$ $ $ $
Buildings 103,503 0 103,503Leasehold Improvements 642,451 0 642,451Computer equipment 312,930 31,671 26,879 317,722Motor Vehicle 502,859 39,874 34,746 507,987Plant and equipment 1,373,715 39,558 80,878 1,332,395Video and DVD tapes 85,057 3,559 10,626 77,990
3,020,515 114,662 153,129 2,982,048
Accumulated depreciation Opening Depreciation Depn on ClosingAccum Depn Disposals Accum Depn
$ $ $ $Buildings 88,168 1,133 89,301Leasehold Improvements 417,853 131,819 549,672Computer equipment 287,746 17,134 26,381 278,499Motor Vehicle 251,738 78,684 22,212 308,210Plant and equipment 1,024,519 80,072 73,319 1,031,272
- 18 -
Plant and equipment 1,024,519 80,072 73,319 1,031,272Video and DVD tapes 77,953 6,442 9,807 74,588
2,147,977 315,284 131,719 2,331,542
Book value Opening ClosingBook Value Book Value
$ $Buildings 15,335 14,202Leasehold Improvements 224,598 92,779Computer equipment 25,184 39,223Motor Vehicle 251,121 199,777Plant and equipment 349,196 301,123Video and DVD tapes 7,104 3,402
872,538 650,506
- 18 -- 18 -
G5 G5

NOTES TO AND FORMING PART OF THE FINANCIAL STATEMENTSFOR THE YEAR ENDED 31 MARCH 2011
10. Intangible Assets
Current yearOpening Closing
Cost Cost Additions Disposals Cost$ $ $ $
Computer software 194,970 124,485 319,455194,970 124,485 0 319,455
Accumulated amortisation Opening Amortisation Amort on ClosingAccum Amort Disposals Accum Amort
$ $ $ $Computer software 192,576 1,026 193,602
192,576 1,026 0 193,602Carrying value Opening Closing
Carry Value Carry Value$ $
Computer software 2,394 125,853
Previous yearOpening Closing
Cost Cost Additions Disposals Cost$ $ $ $
Computer software 201,432 2,433 8,895 194,970201,432 2,433 8,895 194,970
Accumulated amortisation Opening Amortisation Amort on ClosingAccum Amort Disposals Accum Amort
$ $ $ $Computer software 200,146 1,325 8,895 192,576
200,146 1,325 8,895 192,576
Carrying value Opening ClosingCarry Value Carry Value
- 19 -
Carry Value Carry Value$ $
Computer software 1,286 2,394
2011 2010$ $
11. Creditors and Other Payables Trade creditors 796,750 948,297 Accrued liabilities 48,028 38,041 Employee entitlements 273,200 331,776
1,117,978 1,318,114
12. Reconciliation of reported net surplus with cash flows from operating activities Net surplus 915,542 1,276,464 Add non cash items: Depreciation and amortisation 215,886 324,347 Add / (less) movements in working capital items: Decrease in receivables 601,534 89,509 Decrease in inventory 92,356 432,222 (Decrease) in payables (200,136) (169,490) Net working capital movements 493,754 352,241 Distribution of surplus (660,900) (955,100) Net cash inflow from operating activities 964,282 997,952
- 19 -- 19 -
G5 G5

NOTES TO AND FORMING PART OF THE FINANCIAL STATEMENTSFOR THE YEAR ENDED 31 MARCH 2011
2011 2010$ $
13. Operating Lease Commitments
Commitments relating to Head Office and Scott Base premises and Trading Locations for equipment rentals and for the 50% balance of the POS software licencing are as follows: Not later than one year 114,988 96,920 Later than one year and not later than five years 117,518 218,921 Total Commitment 232,506 315,841
14. Capital Commitments The contract for the delivery of the new Point of Sale System has the 50% balance of the software licence cost due at the time the first Canteen starts to use it Not later than one year 57,222
15. Key Management Personnel Compensation and Remuneration of Employees
Key management comprises members of the Council, Chief Executive and Finance Manager Members of the Council are not paid any remuneration
Salary and other short term employee benefits 274,007 231,090
Number of Employees $110,000 - $120,000 1 $150,000 - $160,000 1 $160,000 - $170,000 1
16. Contingent Liabilities
The Council has no material contingent liabilities (Nil in 2010).
17. Financial Instruments
- 20 -
(a) Fair values Fair values of financial instruments is equivalent to the amount disclosed in the Balance Sheet. This includes instruments such as cash and cash equivalents, short term deposits, investments, accounts receivable and accounts payable.(b) Credit risk Credit risk is the risk that an third party will not be able to meet its obligations to the Council. In the normal course of its business the Council incurs credit risk from cash and short term deposits with the bank, investments and accounts receivable. The Council places its cash and deposits with its authorised bank which has a high credit rating. Accounts receivable are subject to credit evaluations and collateral where possible. There is no significant concentration of credit risk. (c) Interest rate risk. Interest rate risk is the risk that interest rates will change, increasing or decreasing the cost of borrowing or lending. The interest rate risk on the Councils borrowings is limited to the corporate rate set by the bank on its overdraft. The interest rate risk on investments and accounts receivable will fluctuate, due to the changes in market interest rates. The Council does not consider there is any significant interest exposure on its borrowing or lending.
18. Related Party Transactions
The New Zealand Defence Force (NZDF) is considered a related party to the AFCC. Senior members of the NZDF serve on the Council as defined under s4 of the Armed Forces Canteens Act 1948. The NZDF provides facilities to the AFCC to conduct its operations in accordance with Defence Force Order 03/2007 During the year members of Council and key management, as part of normal customer relationship, were involved in minor purchases from the AFCC.
- 20 -- 20 -
G5 G5

- 21 -
G5 G5

- 22 -
G5 G5