Embed Size (px)
Citation preview
REPORT
OF THE
INDEMNITY
MORTGAGE
AND
DEED OF TRUST
WORKGROUP
December 21, 2012
TABLE OF CONTENTS
INTRODUCTION………………………………………………………………………………...1
METHODOLOGY………………………………………………………………………………..2
DESCRIPTION OF THE PROCESS USED AND THE DATA RELIED UPON BY THE
WORKGROUP……………………………………………………………………………………3
SURVEYS OF INDUSTRY AND BUSINESS GROUPS……………………………..…………7
INTERPRETATION AND APPLICABILITY OF NEW LAW………………………………...12
CONCLUSION…………………………………………………………………………………..13
APPENDIXES A THROUGH J...……………………………………………………………….14
- 1 -
INTRODUCTION The Indemnity Deed of Trust Workgroup was created by Chapter 2, State and Local Revenue and Financing Act of 2012 during the First 2012 Special Session of the General Assembly. It mandated the Director of Assessments and Taxation to form a Workgroup to study the impacts of imposing the recordation tax on indemnity mortgages and deeds of trust. A twelve member group was chosen, and the membership consisted of recognized experts in the subject matter of the law as well as representatives from State agencies, local governments, commercial real estate organizations, business organizations, and the Maryland banking industry, including a designee of the Maryland Bankers Association. Appendix A contains a roster of the Workgroup’s membership. The stated mission of the Workgroup was to study:
• The expected tax revenues to be collected for local governments;
• The impacts of the tax, if any, on the forms, volumes, and value of commercial real estate transactions in urban, suburban, and rural areas of the State and on the overall commercial real estate market in the State; and
• The impacts of the tax, if any, on residential real estate transactions.
The first meeting of the Workgroup was held on July 25, 2012. The website of the Department of Assessments and Taxation was utilized to invite public comment and provide interested persons notice of subsequent meetings. Subsequent meetings were held in August, September, October, and twice in November and twice in December. Minutes of the Workgroup meetings and written testimony are posted on the SDAT website at www.dat.state.md.us/IDOT.html In between meetings, members of the Workgroup provided extensive assistance in compiling data on the fiscal impact of the imposition of the recordation tax and developing survey questionnaires for affected industry and related business entities.
- 2 -
METHODOLOGY At the initial meeting of the Workgroup, the members discussed the significant need to be able to collect actual data measuring the fiscal impact for local governments of the applicability of the recordation tax to indemnity mortgages and deeds of trust1. It was determined that the best method to proceed was to request State Archives to provide customized monthly listings of all commercial deed of trust transactions in the Land Records for different county jurisdictions. The effort also entailed a significant expenditure of committee member time to investigate and evaluate certain commercial entity transactions reported in the Land Records by comparing these transactions for eleven jurisdictions in a defined three month period after the effective date of the new law to the transactions reported in the same three month period in 2011.2
The selection of these jurisdictions was intended to provide a broad sample of large, medium, and smaller counties containing urban, suburban and rural areas of the State, while taking into account the volume of the data and the limited time frame to produce a report.
The other method utilized by the Workgroup to evaluate the impact of the new law was to have its members from relevant business groups design questionnaires asking their own members for certain information included in the parameters of the study.
1 Hereinafter in this report, the term “deed of trust” shall be deemed to include mortgages. 2 The Workgroup wishes to extend its sincere gratitude to the Deputy State Archivist, Timothy D. Baker, and Frank Patnaude in his IT unit, whose agency greatly assisted the work of the group by providing special monthly data runs of Land Records information on deed of trust transactions that form the basis of this report. It also wishes to express its deep appreciation to a member of the Workgroup, Susan Dubin, Esquire, Assistant County Attorney for Baltimore County, and her student intern, Cassandra DeMcCuttac of Towson High School, who reviewed individually the thousands of deed of trust transactions analyzed in this study. Special thanks also to member Linda Watts, Chief, Bureau of Revenue for Howard County, who compiled the data into an understandable format.
- 3 -
DESCRIPTION OF THE PROCESS USED AND THE DATA RELIED UPON BY THE WORKGROUP In order to address the mission of the Workgroup, a subcommittee of the whole was tasked with gathering data from the Counties and the City of Baltimore. Several facts were quickly ascertained:
(a) the jurisdictions are not consistent in how they maintain and index data; and
(b) the on-line land records information publicly available through the mdlandrec.net website is not searchable and, therefore, were not useful for the purposes of this project.
Given the short time frame and limited resources available to the Workgroup, several procedural decisions were made:
(a) to limit the number of jurisdictions reviewed to the following: Anne Arundel County, Baltimore City, Baltimore County, Caroline County, Cecil County, Harford County, Howard County, Montgomery County, Queen Anne’s County, Washington County and Worcester County;
(b) to review only transactions involving entities (limited liability companies, corporations, partnerships, business trusts) based on the assumptions that (i) IDOTs are used almost exclusively in commercial transactions, and (ii) in commercial transactions, the grantor/mortgagor is almost always an entity3
(c) to limit the review to the months of August through October in 2011 and 2012; and
; and
(d) not to include the months of June and July in 2011 or 2012 because of the unusually large number of transactions that closed in June, 2012, creating a statistical anomaly.
3 Undoubtedly there are many commercial transactions, and perhaps many IDOTs, in which the grantor/mortgagor is an individual, but it would have been impractical to manually review all recorded transactions to include them. Limiting the documents reviewed only to those in which the grantor/mortgagor is an entity was the quickest way to filter out the thousands of residential home mortgages.
- 4 -
As a result of the searching limitations in the on-line mdlandrec.net website, the State Archivist was contacted and was able to provide customized data for the requested periods which had been indexed by the recording clerks in the selected jurisdictions (whether or not subjected to recordation tax)4
(a) deed of trust;
as any of the following:
(b) mortgage; (c) indemnity deed of trust; (d) indemnity mortgage; (e) supplemental deed of trust; (f) supplemental mortgage; (g) supplemental indemnity deed of trust; (h) supplemental indemnity mortgage; (i) amended deed of trust; (j) amended mortgage; (k) amended indemnity deed of trust; (l) amended indemnity mortgage; (m) modification of deed of trust; (n) modification of mortgage; (o) modification of indemnity deed of trust; (p) modification of indemnity mortgage.
This generated 8,830 documents.5
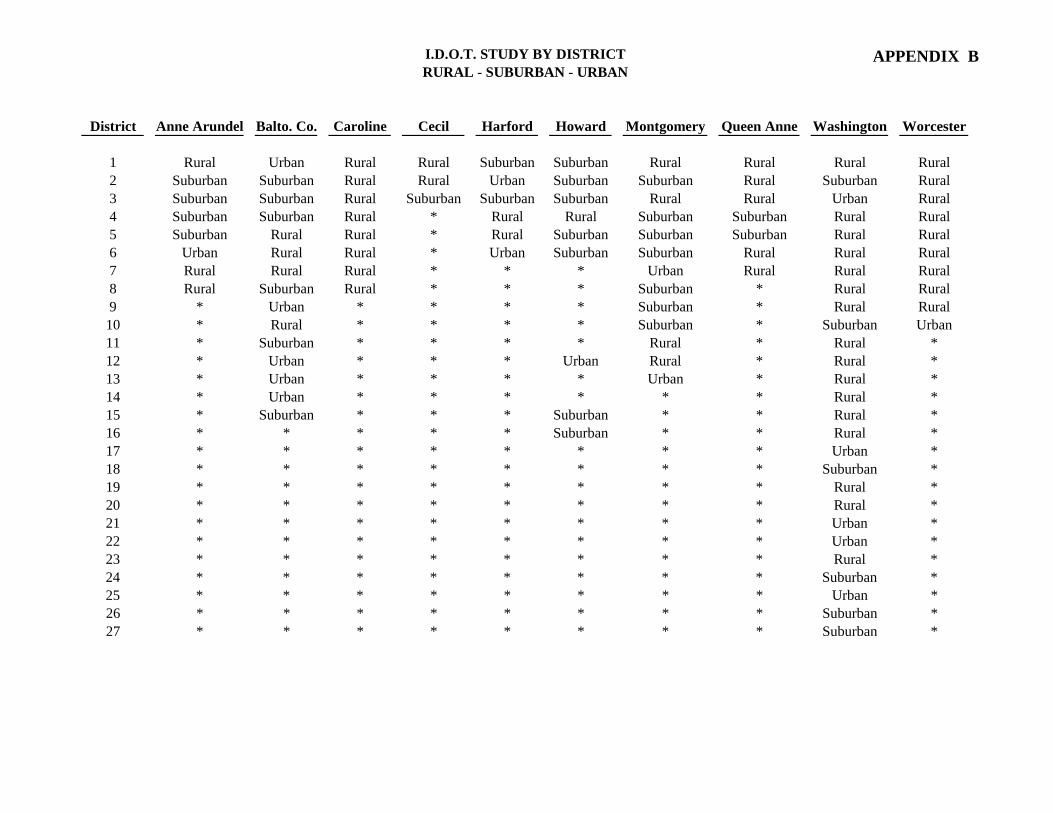
The data was initially reviewed to remove duplicate listings and misidentified documents (such as releases and assignments). The remaining 3,295 records were then individually reviewed to determine the type of document, the amount of the transaction, the amount of any recordation tax paid, and the tax district. The State Department of Assessments and Taxation provided information to identify which tax districts in each jurisdiction are urban, suburban or rural. Attached hereto is Appendix B which shows the classification in each jurisdiction reviewed.
Attached are Appendixes C and D which contain a compilation of the data for each of the jurisdictions reviewed, and include an annualized amount which has been compared to the State’s estimate contained in the fiscal note. The Workgroup wishes to caution that the annualized number is believed to be anomalous in that
4 Instruments subject to any recordation tax even if entitled to a partial exemption (such as a purchase money exemption on part of the transaction) were treated as taxable instruments. 5 It should be noted that, due to differences in indexing of documents by the various recording clerks, it cannot be determined whether all appropriate documents were captured for review, however, the Workgroup is satisfied that it was able to review a statistically representative sampling.
- 5 -
the three month review period includes several large transactions which generated taxes in excess of $1 million.6
Also attached is Appendix E which identifies the consideration for large transactions (in excess of $10 million) in each of the jurisdictions over the same period of time. A review of the data demonstrates, as expected, that for many of the jurisdictions tax revenues have increased during the three month review period.7 It also appears that, in most jurisdictions, the State’s estimates were significantly lower than can now be projected.8
It should be emphasized that whatever trends are observed are subject to the certain qualifications. Given the time limitations that the Workgroup was under to submit its report before December 31, 2012, the sample size may be too small and the time period too narrow from which to draw reliable conclusions. We are unable to conclude whether any of the observed trends are due exclusively to the change in the manner of taxing indemnity deeds of trust, or whether the changes we have
Overall, during the three month review periods, the number of transactions has decreased from 1,531 in 2011, to 1,242 in 2012. In addition, there has been a drop in the total consideration, from in excess of $10.5 billion to slightly over $5 billion, while the amount of tax revenues has increased by slightly less than $12 million. The change appears to be least significant in rural transactions, which saw a drop of 18 transactions, but an increased consideration of over $60.5 million, and increased tax revenues of under $500,000. During the corresponding period, there were 159 fewer urban transactions, with a reduced consideration of slightly above $2 billion, and increased tax revenues of almost $3.5 million. There were also 112 fewer suburban transactions, with a reduced consideration of almost $3.5 billion, and increased tax revenues of approximately $8 million. The review also disclosed that large transactions of over $10 million were disproportionately exempted from tax in 2011. There were over $8.5 billion worth of large transactions in 2011, as compared to less than $4 billion for the same period in 2012. Had taxes been collected on the indemnity deeds of trust in excess of $1 million during August through October, 2011, the eleven jurisdictions would have collected approximately $45,907,839.25 in recordation tax, with an annualized amount of $183,631,357. See Appendix F.
6 For example, Montgomery County had transactions of almost $152 million in August, 2012 and $150 million in September, 2012, each of which generated recordation taxes in excess of $1.5 million, and Howard County had a transaction in September, 2012 of $350 million which generated recordation taxes of $1.75 million. 7 However, it should be noted that tax revenues in the relevant period decreased for Caroline and Harford Counties. 8 State estimates, however, appear to be higher than current projections for Caroline, Cecil, Harford and Worcester Counties.

- 6 -
observed will continue. Other factors that could affect the data include, but are not limited to, the overall state of the economy.
- 7 -
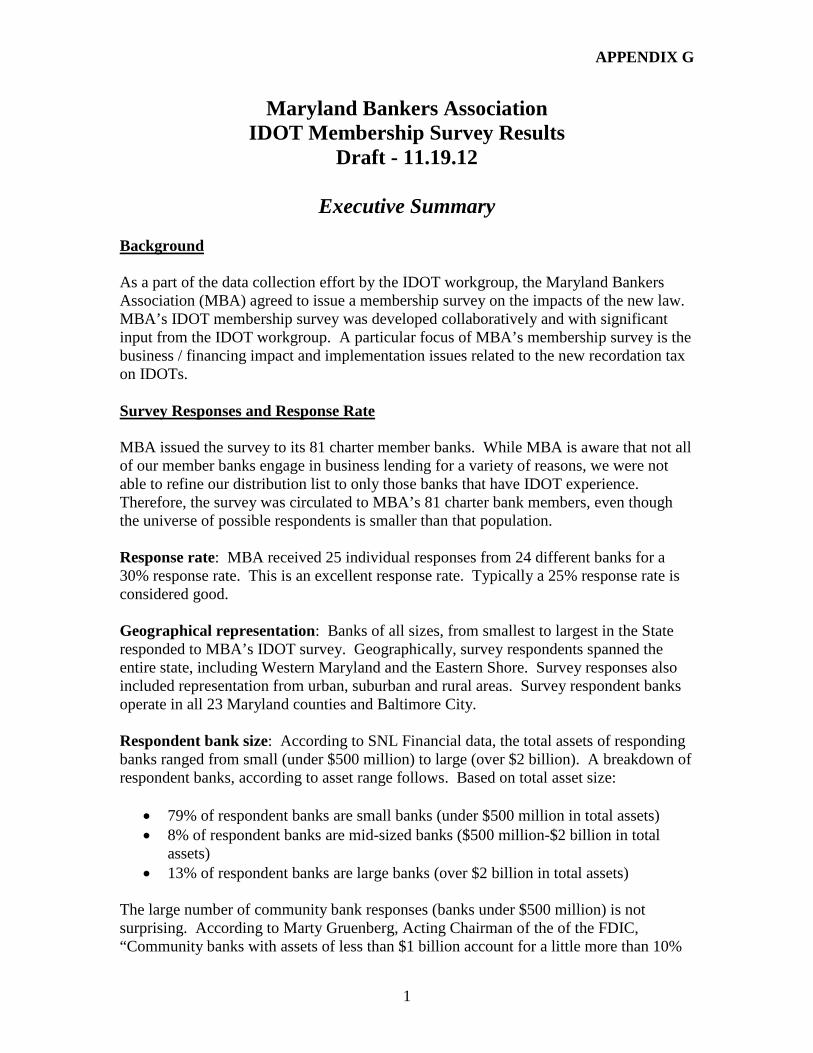
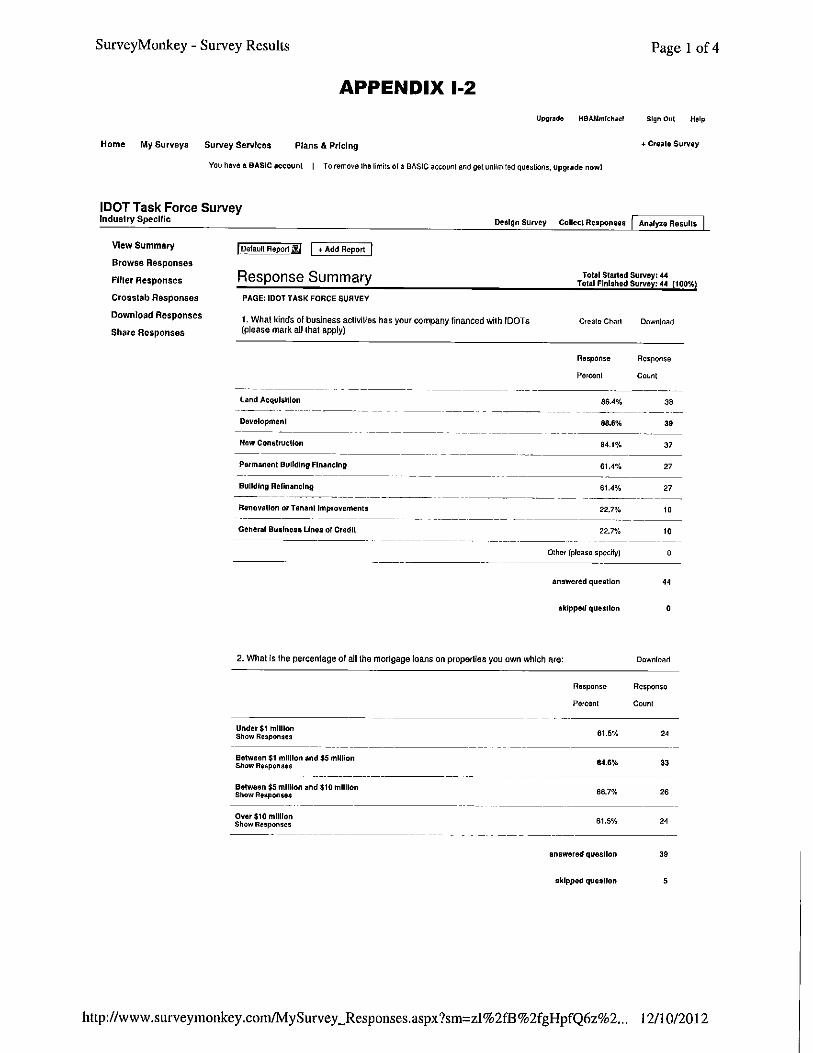
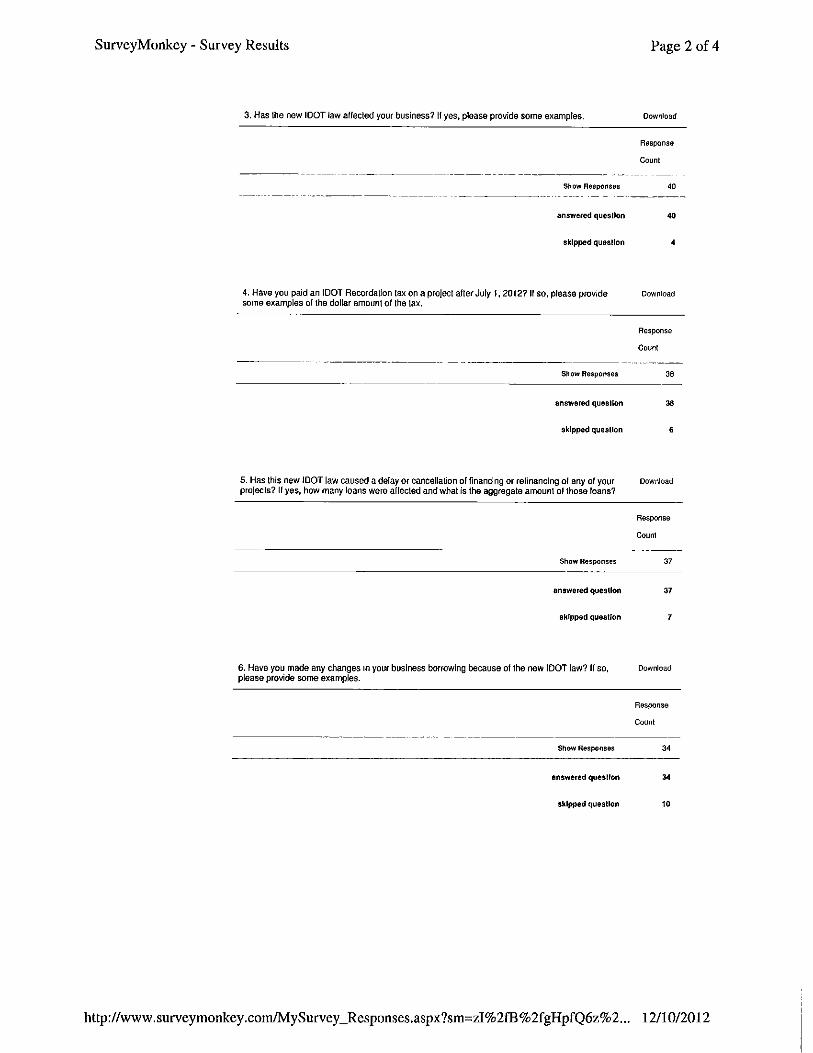
SURVEYS OF INDUSTRY AND BUSINESS GROUPS Another method used by the Workgroup to study the impact of imposing the recordation tax on indemnity mortgages and deeds of trusts has been to conduct questionnaire surveys of the members of specific industry and business related groups. These groups include the Maryland Bankers Association, the Maryland Chapters of NAIOP the Commercial Real Estate Development Association (“NAIOP”), the Homebuilders Association of Maryland, and the local government economic development community through the Maryland Economic Development Association. The questionnaires sought to obtain more specific information beyond the obvious fact that a tax would add to the cost of transactions. The surveys sought to examine the impact of the tax on the forms, volume, and value of commercial real estate transactions in urban, suburban, and rural areas of the State. Maryland Bankers Association The survey by the Maryland Bankers Association (“MBA”) resulted in 25 responses from its total membership of 81 charter member banks (a 30% response rate). The respondent banks are geographically representative of all sections of the State, including Western Maryland, Central Maryland, and the Eastern Shore. Responses came from banks doing business in urban, suburban, and rural areas in all 24 Maryland jurisdictions. Finally, 79% of the respondents are deemed small banks with total assets under $500 million. See Appendix G for the full MBA survey results. Slightly over a quarter of the MBA survey respondents (28%) indicated that they had seen a decrease in both the volume and dollars of commercial real estate as a direct result of the new IDOT law. Others indicated that it is too early to make any judgments on the new law or whether commercial loan volume has instead declined due to the downturn in the economy. Slightly under half of the respondents (48%) indicated that access to credit, liquidity and plans to expand are negatively affected, for at least some businesses, by the new law. No effect on liquidity or growth plans was noted by 32% of the respondents. Finally, 12% of the respondents did not know what effect the law had on their clients’ liquidity or future growth plans.
- 8 -
The following information was reported as the business actions by clients to the increased transaction costs due to the tax9
:
• 40% reported their business clients reduced profits to offset the additional costs of the tax;
• 24% reported that they did not know how their business clients were dealing with higher transactional cost;
• 20% indicated that their business clients increased product prices to offset the cost;
• 16% reported their clients made no changes to offset the higher costs; and, • 8% said their business clients decreased product offerings due to the cost.
In terms of the geographic areas that would be most affected by the new law, 64% of the respondents indicated a belief that all areas - urban, suburban and rural - would be affected alike. Another 20% thought the suburban areas would be most affected, and 16% indicated that they did not know. Survey responses did not specify reasons for these beliefs. A separate issue raised by the MBA survey is how the variance in interpretations of the new law among the jurisdictions had impacted the financing process. This issue will be discussed in another section of the report entitled “Interpretation and Applicability of New Law.” A general conclusion of the MBA survey is that it is difficult to gauge the full impact of the new law. The law has only been in effect since July 1, 2012, and that is insufficient time to fully study and understand its effects. The executive summary of the MBA survey concludes: “Further, the economic downturn has negatively impacted business growth and loan demand. As a result, it is hard to differentiate between the effects of the economy and the effects of the new law.” However, survey results indicate that access to credit, liquidity and plans to expand are, for at least some businesses, negatively impacted by the new law. 9 Percentages exceed 100%, as respondents could select more than one option.
- 9 -
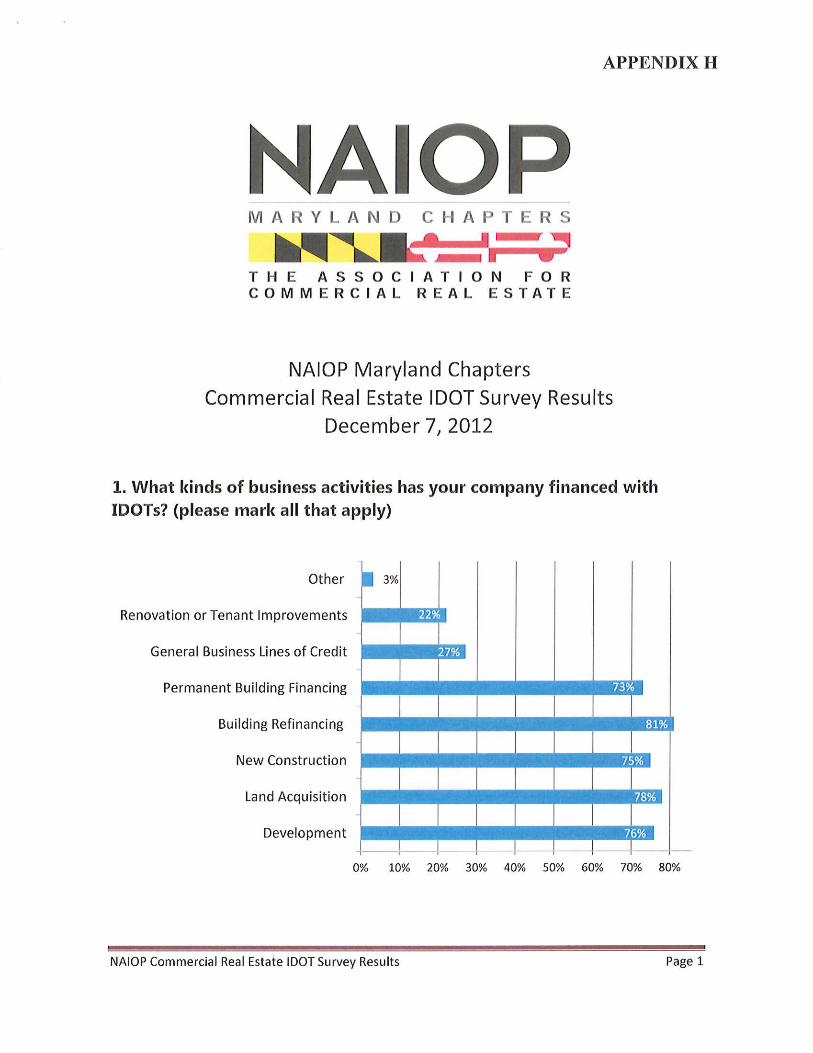
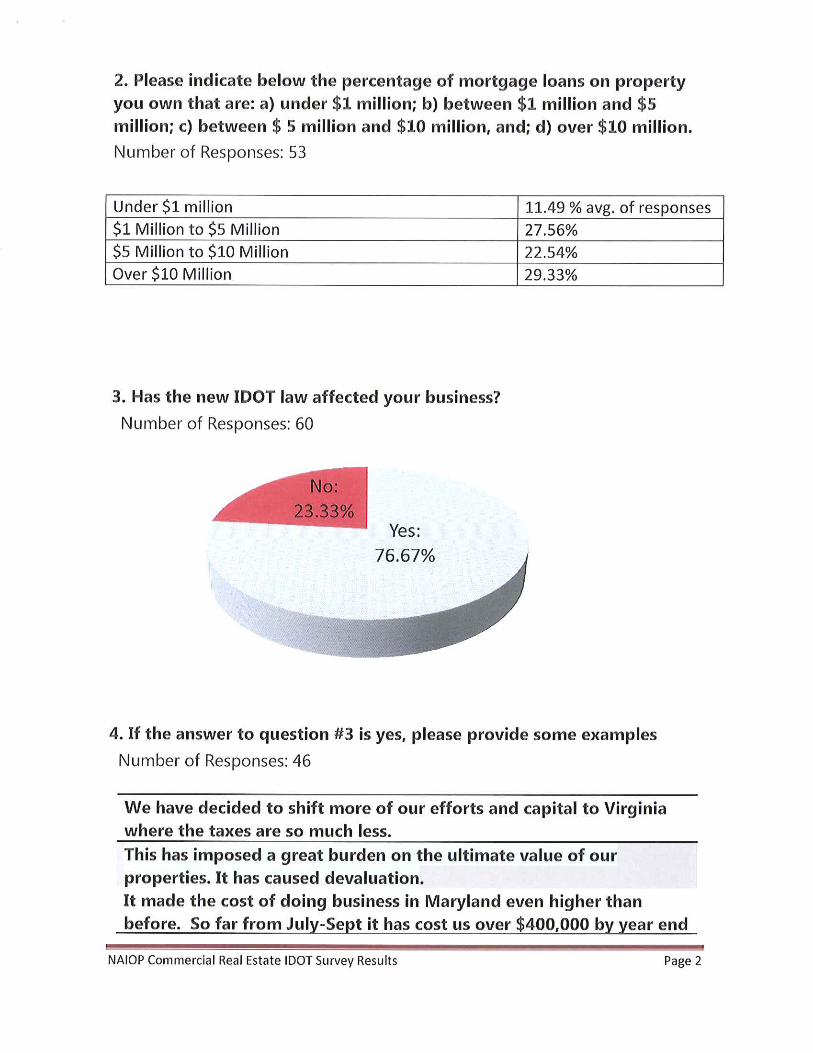
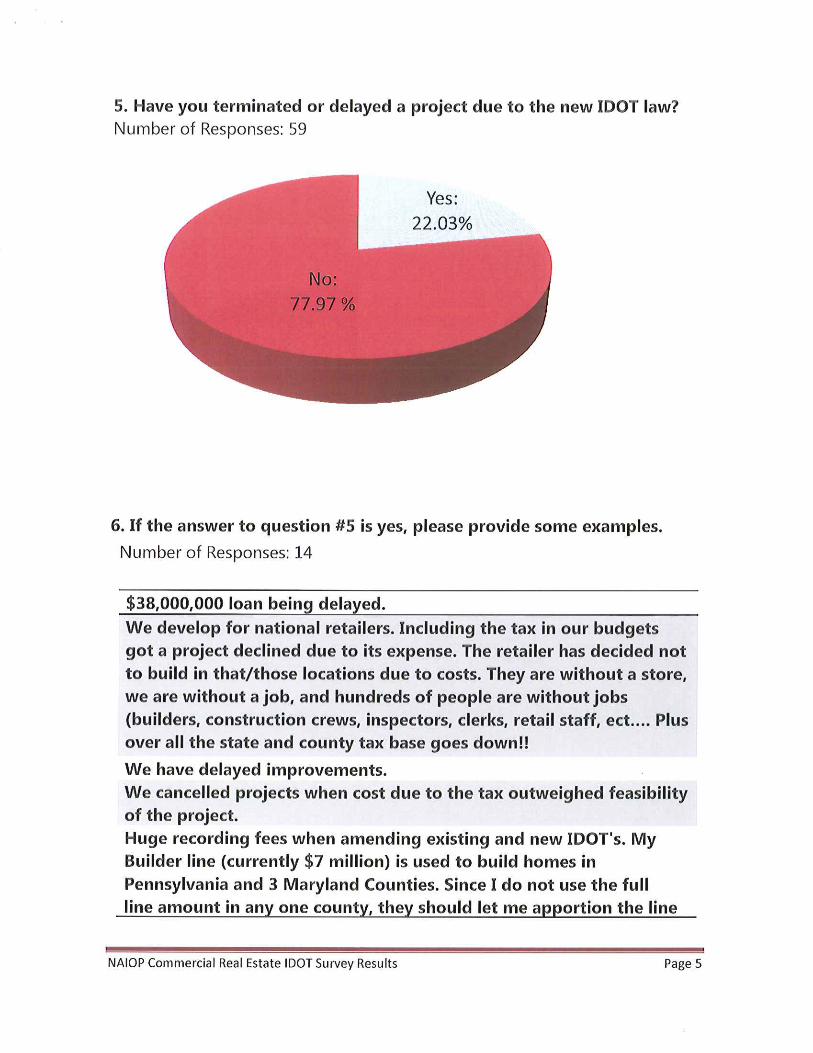
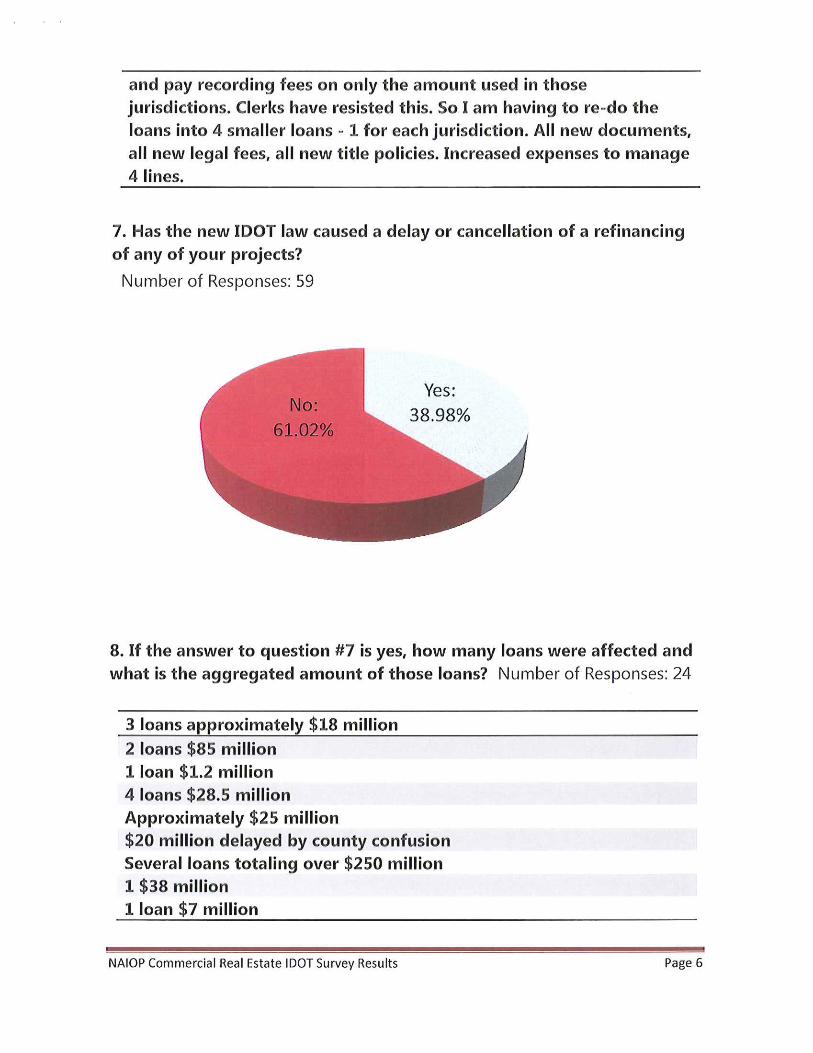
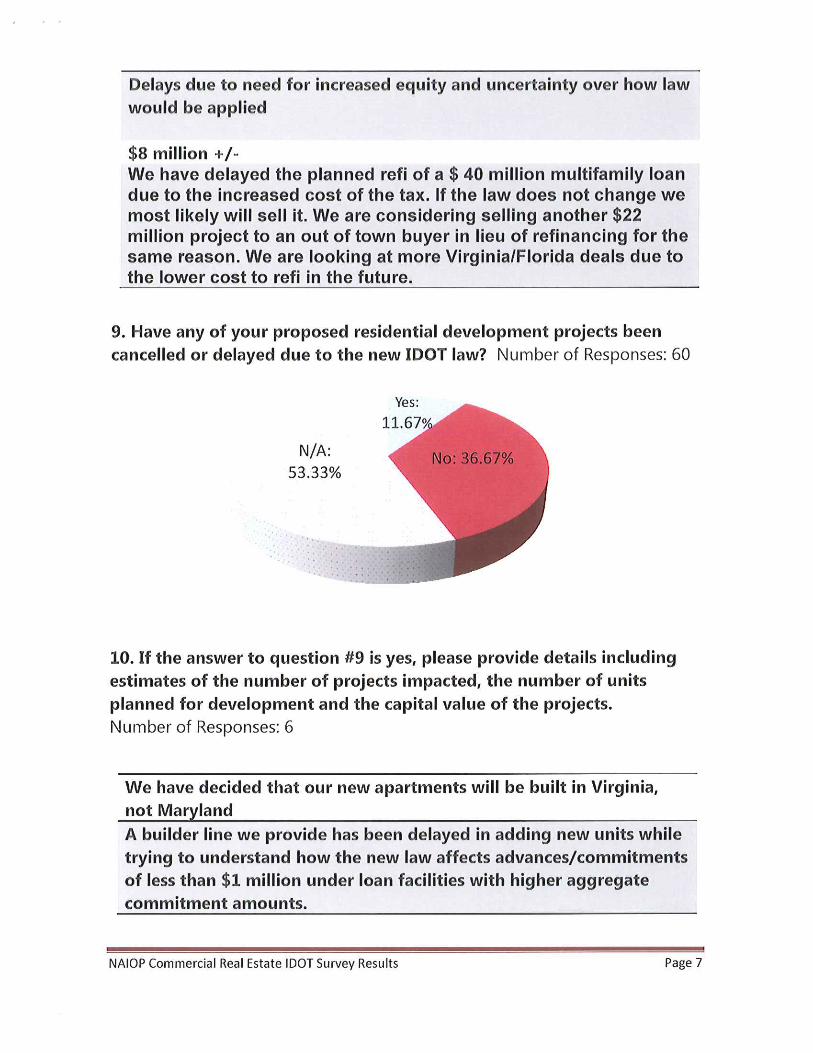
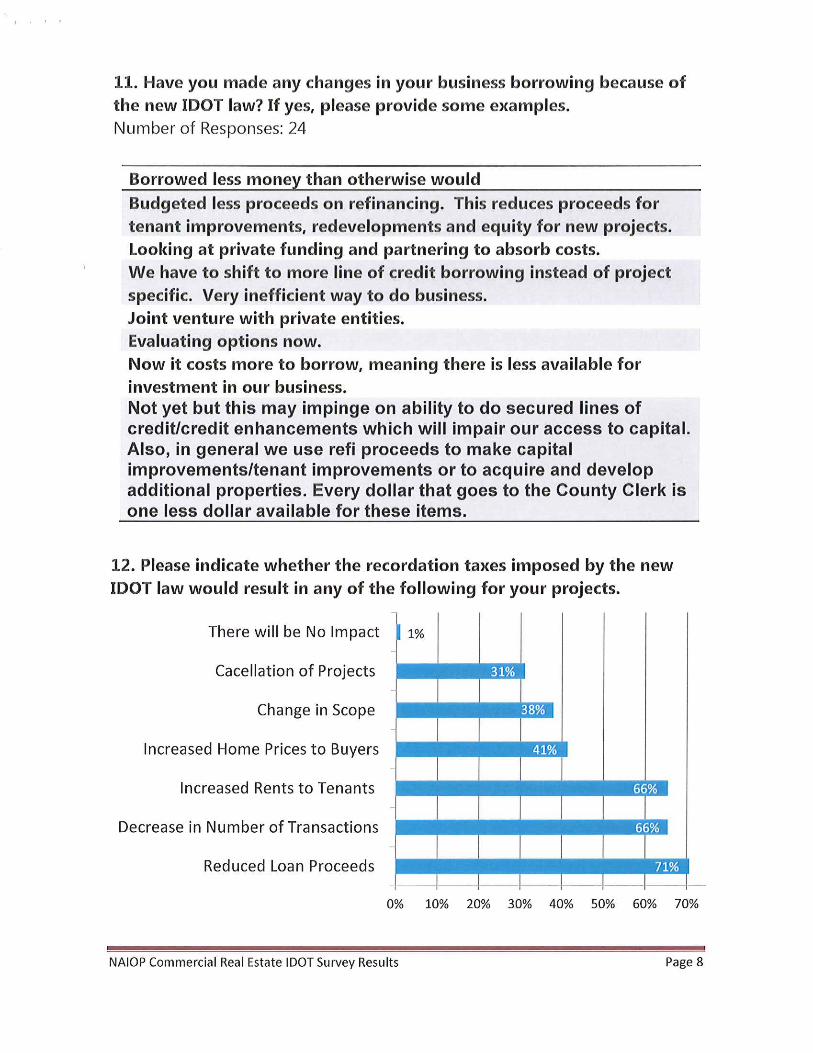
NAIOP NAIOP received 60 responses to its survey out of a membership of 194 property owners (a 31% response rate). When asked to identify the types of properties developed, 44 of the 60 respondents indicated that their commercial transactions are located in the following areas: 27% are urban; 68% are suburban and 4% are rural. Respondents also indicated that they do business in 20 of the 24 jurisdictions in the State (23 counties and Baltimore City). Over 73% of the respondents indicated that the loan proceeds are used for permanent building financing, building refinancing, new construction, land acquisition and development. The size of the loans received by the respondents are: under $1 million = 11.49% of responses; $1 million to $5 million = 27.56% of responses; $5 million to $10 million = 22.54%; and over $10 million = 29.33%. The percentage of NAIOP respondents who indicated that the new IDOT law has affected their business is over 76%. For new projects, 22% of the NAIOP respondents have indicated that the new law has caused them to terminate or delay a project. It was noted by 39% that the new IDOT law has caused a delay or cancellation of a refinancing of their projects, and 66% of the respondents reported that the new IDOT law would result in increased rent to their tenants. Some of the respondents indicated that they did not refinance due to the receipt of less proceeds or kept the same lender due to higher fees for moving a mortgage to another lending institution. Other companies took smaller loans to reduce costs. Some respondents indicated projects were required to provide additional equity. Apart from terminating some residential projects, the changes being made by the respondent companies to the new law include: borrowing less money than otherwise; budgeting less proceeds for refinancing; considering private funding and partnerships to absorb costs; shifting to increased lines of credit borrowing instead of project specific loans; developing joint ventures with private entities; changing the scope of the project; reducing the price paid for the property to reflect the additional cost; increasing rent to tenants; increasing home prices to buyers; selling certain projects rather than refinancing them; shifting more effort and capital out of state where the taxes are less; and delaying improvements made to buildings. Appendix H contains the full NAIOP survey results with the anecdotal statements about specific business projects.
- 10 -
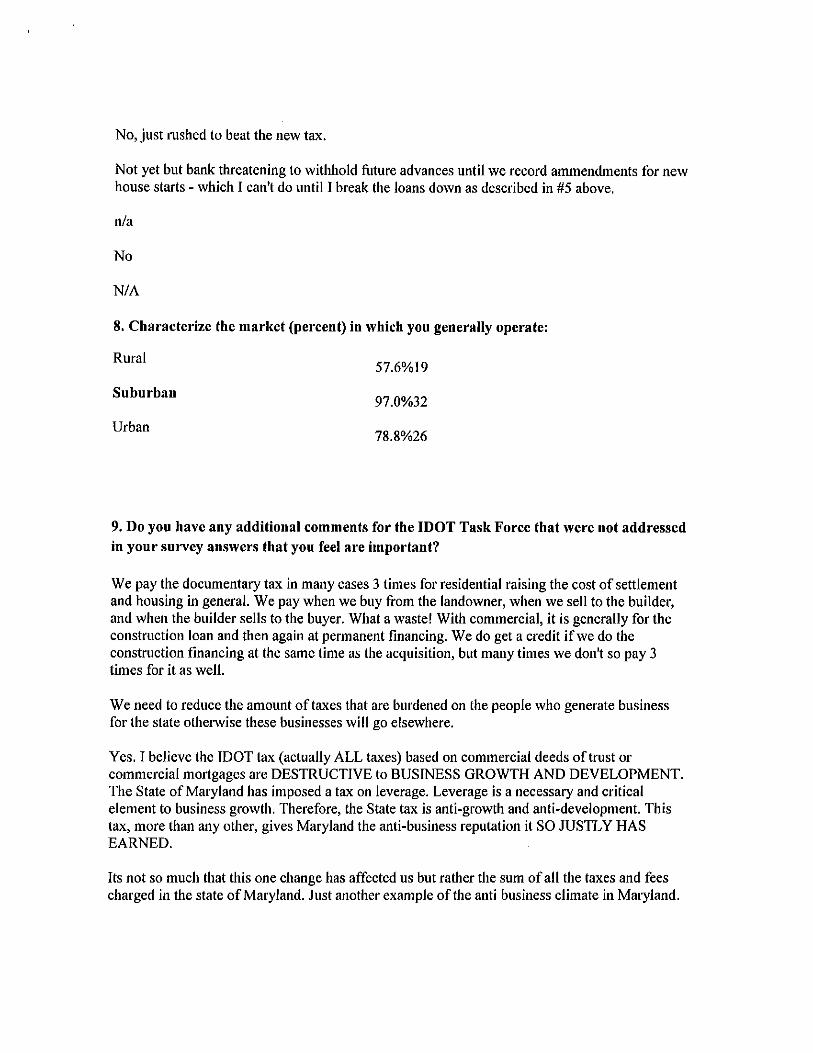
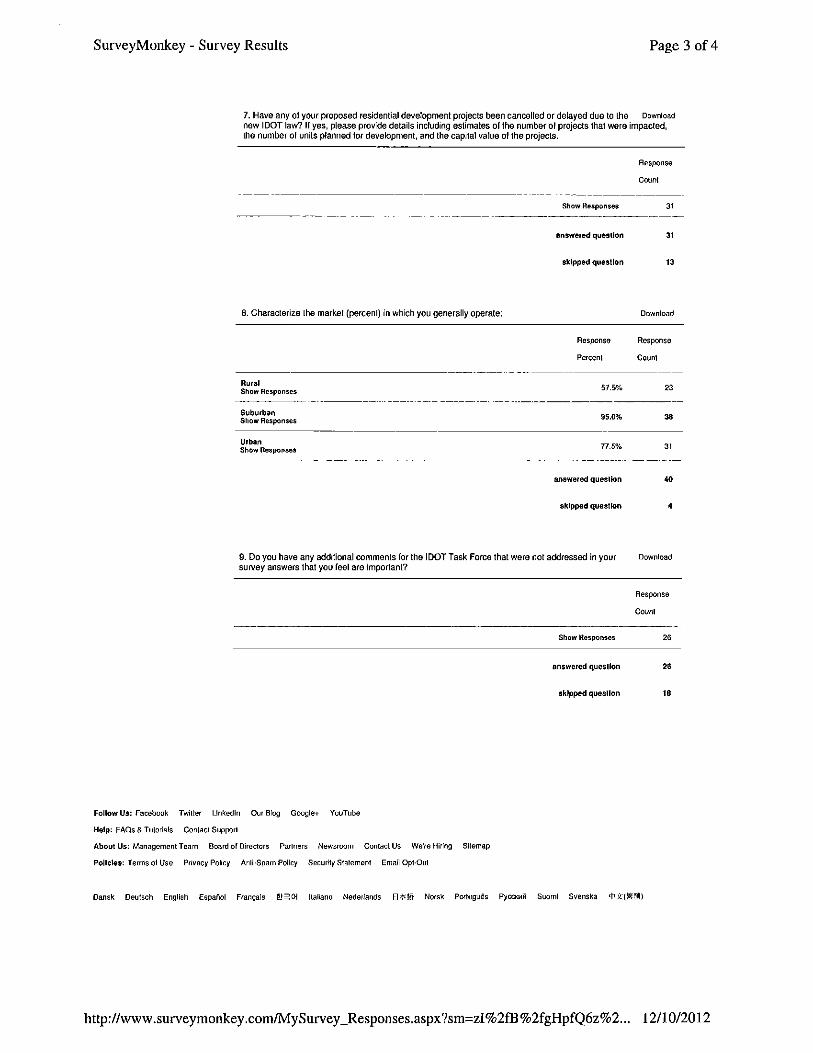
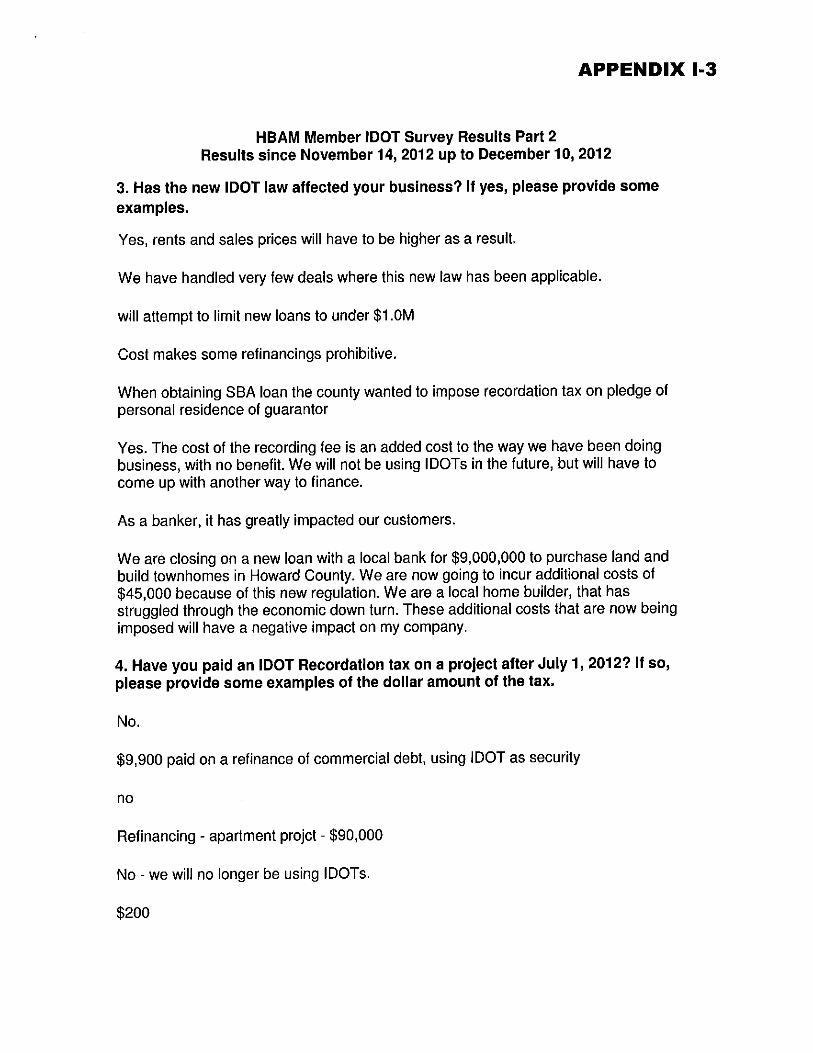
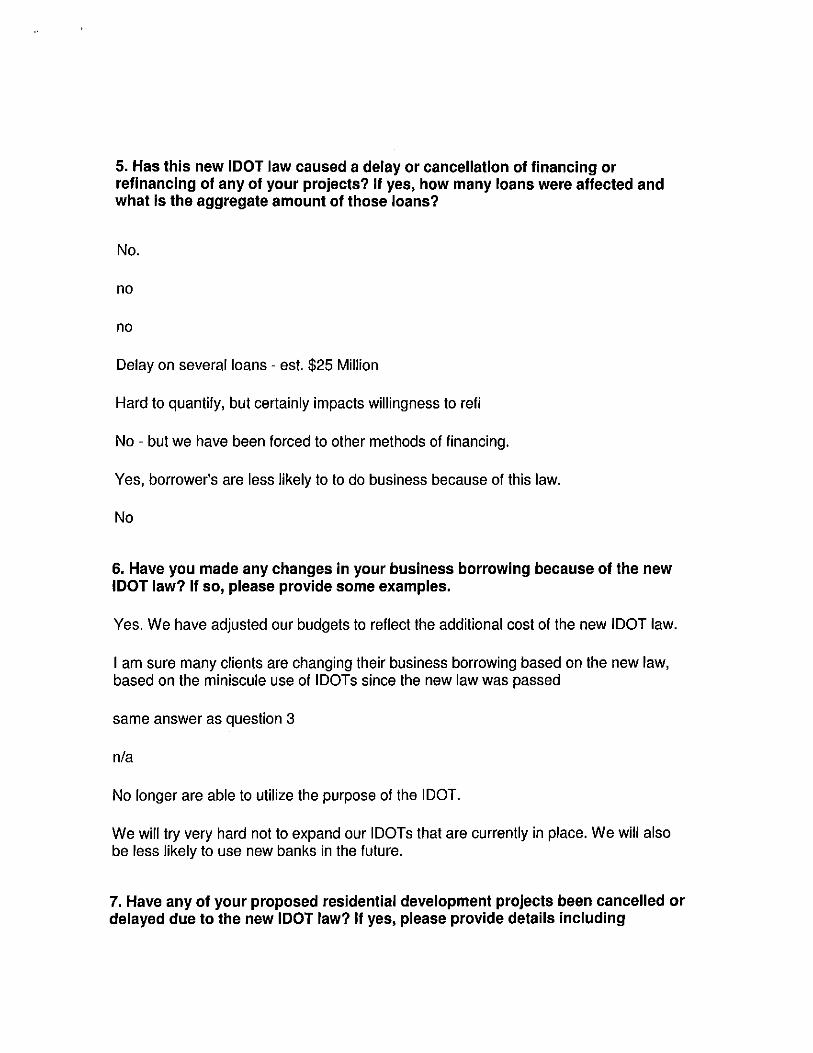
Homebuilders Association of Maryland The Homebuilders Association of Maryland (“HBAM”), which has a total membership of 700 members, received 44 responses to its survey. Appendix I contains the full survey results. Over 84% of the respondents indicated that they have used IDOTs to finance land acquisition, development, and new construction. Some 61.4% of the respondents have used IDOTs to finance permanent building financing or building refinancing. In terms of the amounts of the mortgage loans on properties the 44 respondents own, the specific numbers are: under $1 million = 24 respondents; between $1 million and $5 million = 33 respondents; between $5 million and $10 million = 26 respondents; and over $10 million = 24 respondents. The markets in which the respondent businesses operate are: 57.6% have rural projects; 97% have suburban projects; and 78.8% have urban projects10
.
Three-quarters (75%) of the HBAM respondents indicated the new law has affected their business. Another 23% of the respondents have indicated that they already have or will be paying the IDOT tax on a transaction in 2013. Slightly more than one-third (38%) have indicated they have delayed or terminated a project because of the new transaction cost. A decision to make adjustments or changes to borrowing was noted by 32% of the respondents. For residential development, 13% of the respondents indicated that they have delayed or terminated a residential project. The interesting anecdotal statements about particular business projects in the HBAM survey include the two responses about the increased transactional cost in the new law affecting locations involving national retailers. Similar to the NAIOP survey, this survey included several responses about the law’s effect on refinancing.
10 Answers exceed 44 respondents and 100%, as respondents could select more than one option.
- 11 -
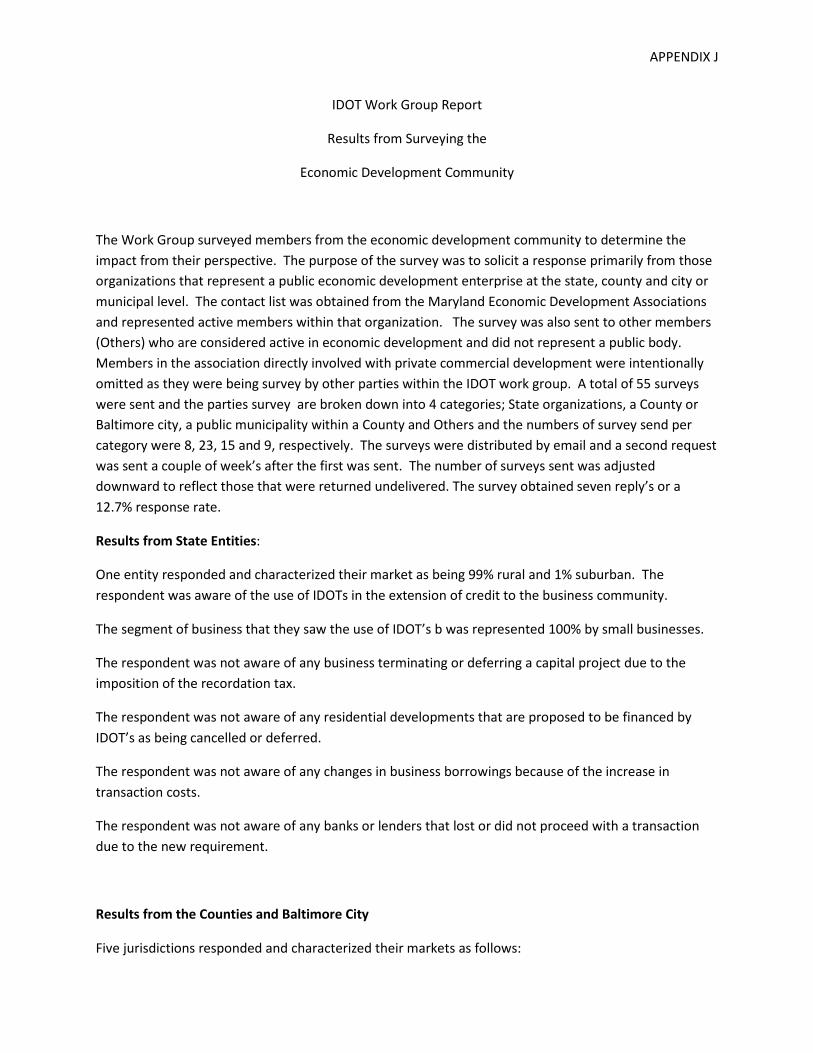
Economic Development Community Members of the economic development community were surveyed through organizations that primarily represent a public economic development enterprise at the state, county and city or municipal level. A specific list of contacts was obtained by a Workgroup member from the Maryland Economic Development Association. The response level to the survey was 7 of 55 surveys or a 12.7% response rate. Reponses were received from Baltimore City, Cecil County, Garrett County, Montgomery County, Wicomico County, the City of Bowie and one State economic development entity. The respondents indicated that the segment of the businesses they saw using IDOTs was represented between 80% and 100% from small businesses. None of the respondents at the State, County or Municipal level were aware of any businesses terminating or deferring a capital project due to the imposition of the recordation tax. Similarly, none were aware of any residential developments proposed to be financed by IDOTs as being cancelled or deferred. They were not aware of any changes in business borrowings because of the increase in transaction costs. Finally, the respondents were not aware of any banks or lenders that lost or did not proceed with a transaction due to the new requirement. See Appendix J. Again, the results of this survey are also limited and merely provide a preliminary indication of the impact of the new law in the first months after its effective date.
- 12 -
INTERPRETATION AND APPLICABILITY OF NEW LAW A separate issue was initially raised in the Workgroup’s discussions and then raised again in two of the surveys11
. This concerns varying interpretations of the law among the jurisdictions.
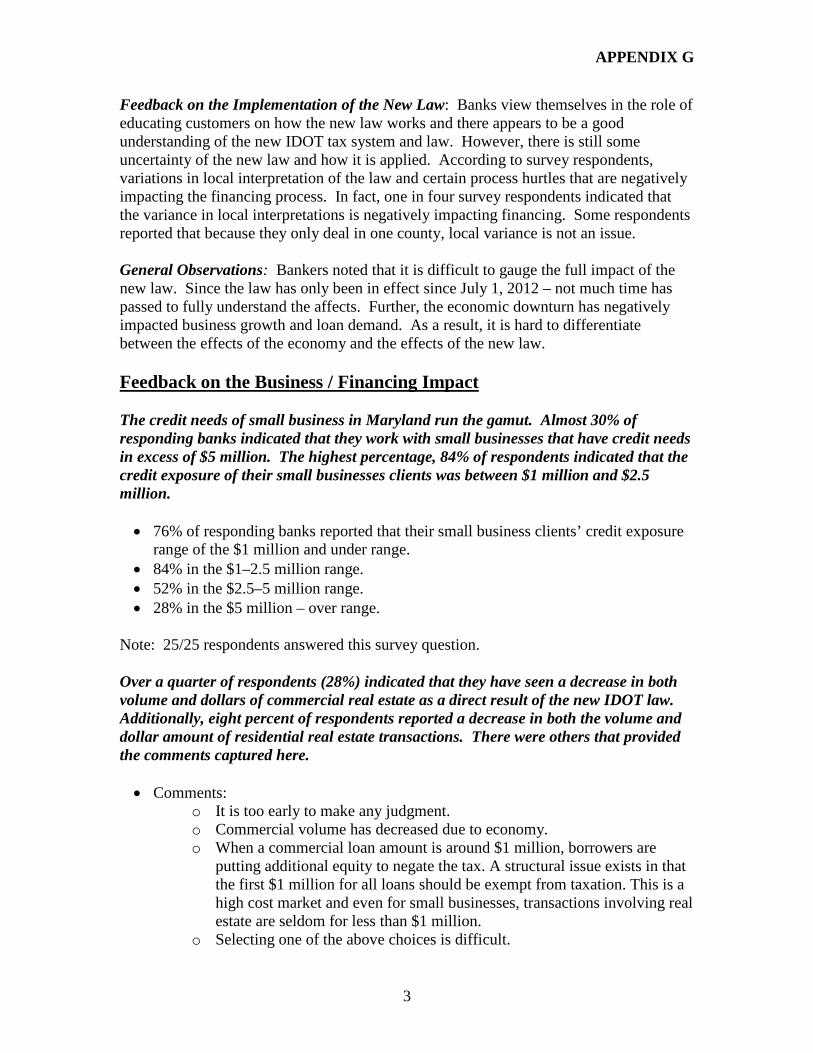
The recordation tax is administered by the Clerks of the Court, a State office in seventeen jurisdictions, and by the County Finance Offices in the other seven jurisdictions. As these transactions are presented to the various jurisdictions, different interpretations have produced different results for similar transactions that involve properties in different jurisdictions. This has produced some confusion or lack of predictability with the use of IDOTs, particularly with the title industry. Some 24% of respondents to the MBA survey noted that variance in interpretations of the new law among jurisdictions was negatively impacting the financing process for at least some businesses, and some 76% indicated no negative impact. The surveys and written testimony on this issue are posted on the SDAT website at www.dat.state.md.us/IDOT.html. It should be noted that the complexity of these transactions, and differing fact patterns, require each to be examined on an individual basis, making uniformity difficult during this initial implementation period.
11 They are the MBA and NAIOP surveys.
- 13 -
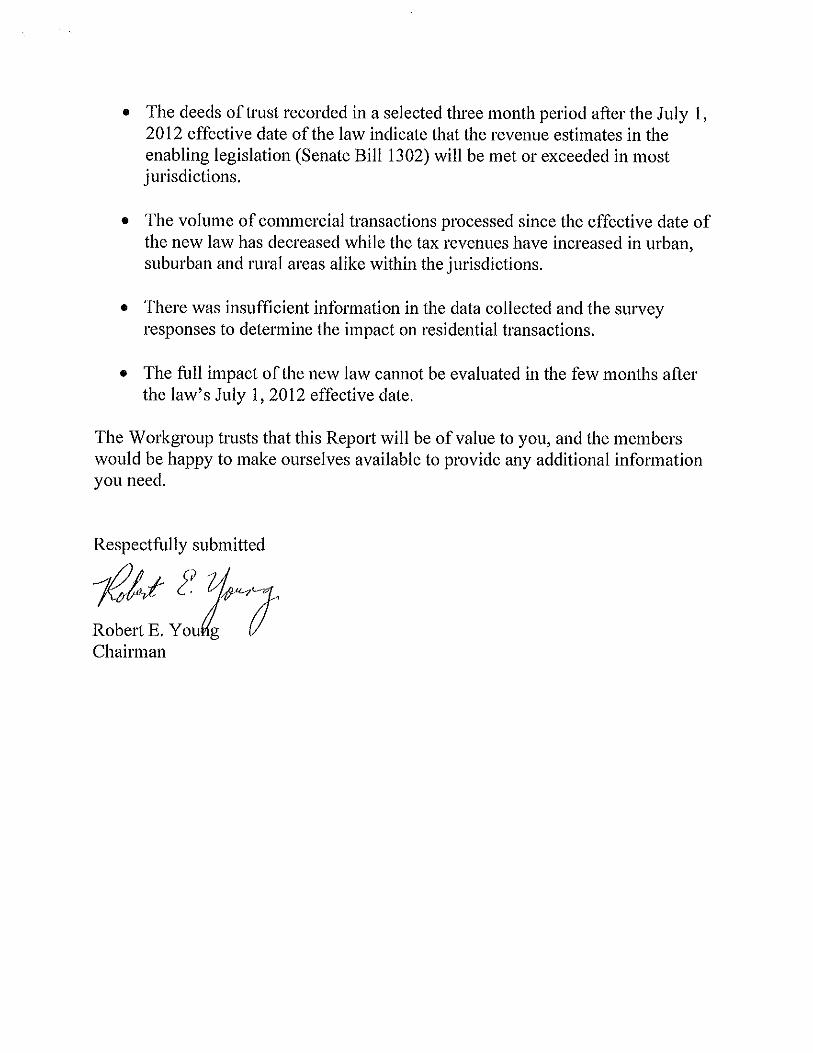
CONCLUSION The charge of the Indemnity Mortgage and Deed of Trust Workgroup to study the impact of the recordation tax on these instruments has been completed. The Workgroup can report to you the following findings: (1) the data collected for the two comparative periods indicates that the fiscal estimate of the tax revenues to be collected by local governments in the enabling legislation (SB 1302) will be met or exceeded for most jurisdictions in the State; (2) the volume of commercial transactions since the effective date of the new law is down although the tax revenues have increased in urban, suburban and rural areas alike within the jurisdictions; (3) neither the data collected nor the survey responses provided sufficient information to determine the impact on residential transactions; and (4) the full impact of the new law cannot be evaluated in the few months after the law’s July 1, 2012 effective date. A separate issue arose regarding the uniform interpretation and applicability of the new law on these transactions. This issue is noted in the report only for informational purposes.

- 14 -
APPENDIXES
APPENDIX A
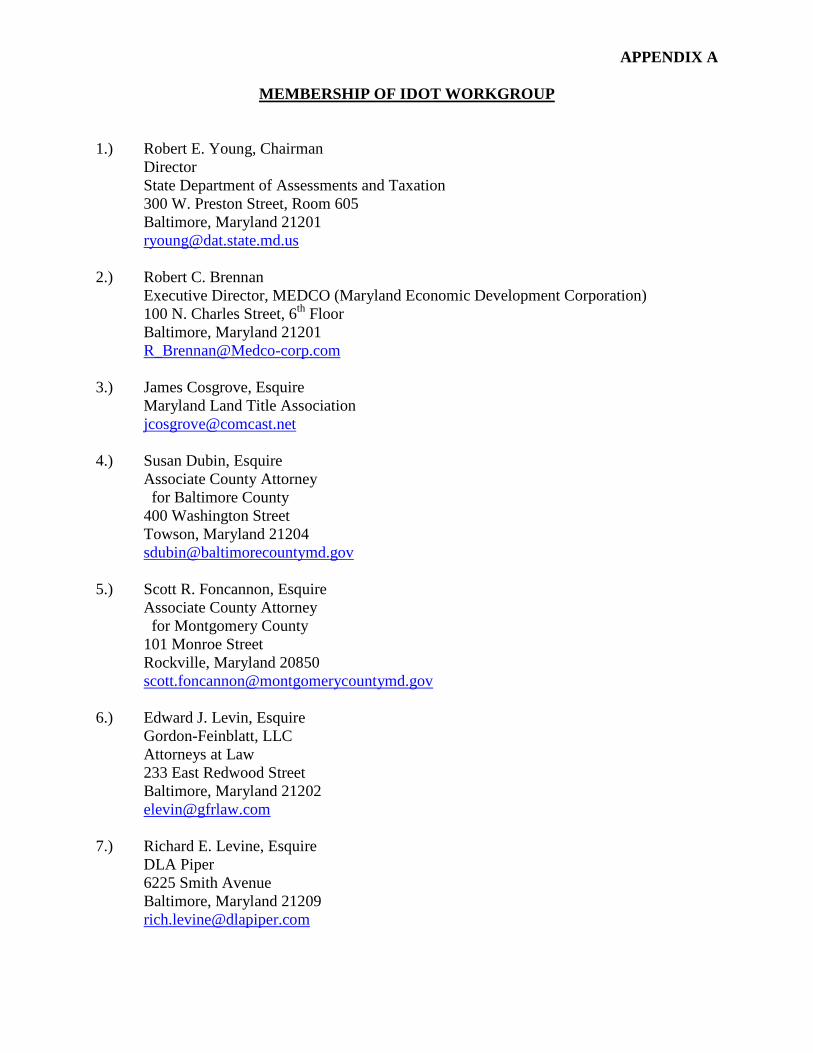
MEMBERSHIP OF IDOT WORKGROUP
1.) Robert E. Young, Chairman Director State Department of Assessments and Taxation 300 W. Preston Street, Room 605 Baltimore, Maryland 21201 [email protected] 2.) Robert C. Brennan Executive Director, MEDCO (Maryland Economic Development Corporation) 100 N. Charles Street, 6th Floor Baltimore, Maryland 21201 [email protected] 3.) James Cosgrove, Esquire Maryland Land Title Association [email protected] 4.) Susan Dubin, Esquire Associate County Attorney for Baltimore County 400 Washington Street Towson, Maryland 21204 [email protected] 5.) Scott R. Foncannon, Esquire Associate County Attorney for Montgomery County 101 Monroe Street Rockville, Maryland 20850 [email protected] 6.) Edward J. Levin, Esquire Gordon-Feinblatt, LLC Attorneys at Law 233 East Redwood Street Baltimore, Maryland 21202 [email protected]
7.) Richard E. Levine, Esquire DLA Piper 6225 Smith Avenue Baltimore, Maryland 21209 [email protected]
APPENDIX A
MEMBERSHIP OF IDOT WORKGROUP – Continued
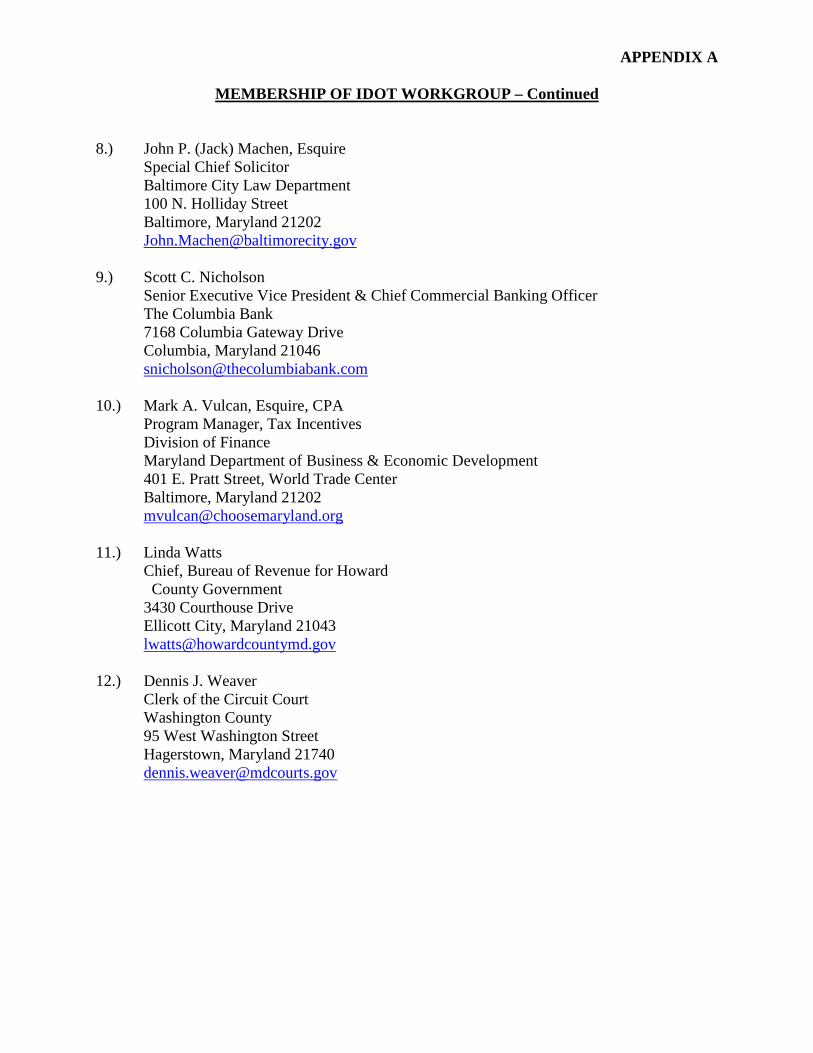
8.) John P. (Jack) Machen, Esquire Special Chief Solicitor Baltimore City Law Department 100 N. Holliday Street Baltimore, Maryland 21202 [email protected] 9.) Scott C. Nicholson Senior Executive Vice President & Chief Commercial Banking Officer The Columbia Bank 7168 Columbia Gateway Drive Columbia, Maryland 21046 [email protected] 10.) Mark A. Vulcan, Esquire, CPA Program Manager, Tax Incentives Division of Finance Maryland Department of Business & Economic Development 401 E. Pratt Street, World Trade Center Baltimore, Maryland 21202 [email protected] 11.) Linda Watts Chief, Bureau of Revenue for Howard County Government 3430 Courthouse Drive Ellicott City, Maryland 21043 [email protected] 12.) Dennis J. Weaver Clerk of the Circuit Court Washington County 95 West Washington Street Hagerstown, Maryland 21740 [email protected]
APPENDIX B
District Anne Arundel Balto. Co. Caroline Cecil Harford Howard Montgomery Queen Anne Washington Worcester
1 Rural Urban Rural Rural Suburban Suburban Rural Rural Rural Rural2 Suburban Suburban Rural Rural Urban Suburban Suburban Rural Suburban Rural3 Suburban Suburban Rural Suburban Suburban Suburban Rural Rural Urban Rural4 Suburban Suburban Rural * Rural Rural Suburban Suburban Rural Rural5 Suburban Rural Rural * Rural Suburban Suburban Suburban Rural Rural6 Urban Rural Rural * Urban Suburban Suburban Rural Rural Rural7 Rural Rural Rural * * * Urban Rural Rural Rural8 Rural Suburban Rural * * * Suburban * Rural Rural9 * Urban * * * * Suburban * Rural Rural10 * Rural * * * * Suburban * Suburban Urban11 * Suburban * * * * Rural * Rural *12 * Urban * * * Urban Rural * Rural *13 * Urban * * * * Urban * Rural *14 * Urban * * * * * * Rural *15 * Suburban * * * Suburban * * Rural *16 * * * * * Suburban * * Rural *17 * * * * * * * * Urban *18 * * * * * * * * Suburban *19 * * * * * * * * Rural *20 * * * * * * * * Rural *21 * * * * * * * * Urban *22 * * * * * * * * Urban *23 * * * * * * * * Rural *24 * * * * * * * * Suburban *25 * * * * * * * * Urban *26 * * * * * * * * Suburban *27 * * * * * * * * Suburban *
I.D.O.T. STUDY BY DISTRICTRURAL - SUBURBAN - URBAN
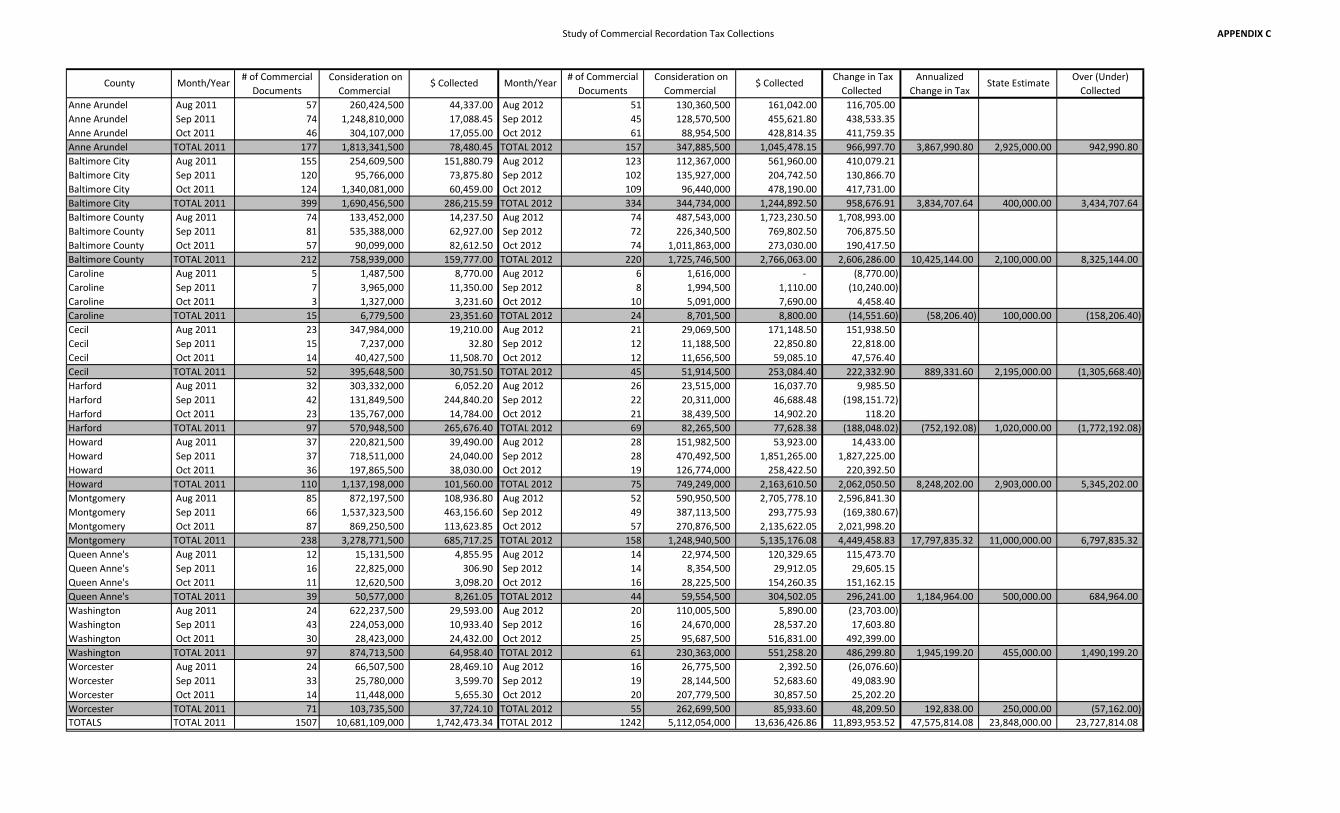
Study of Commercial Recordation Tax Collections APPENDIX C
Anne Arundel Aug 2011 57 260,424,500 44,337.00 Aug 2012 51 130,360,500 161,042.00 116,705.00 Anne Arundel Sep 2011 74 1,248,810,000 17,088.45 Sep 2012 45 128,570,500 455,621.80 438,533.35 Anne Arundel Oct 2011 46 304,107,000 17,055.00 Oct 2012 61 88,954,500 428,814.35 411,759.35 Anne Arundel TOTAL 2011 177 1,813,341,500 78,480.45 TOTAL 2012 157 347,885,500 1,045,478.15 966,997.70 3,867,990.80 2,925,000.00 942,990.80 Baltimore City Aug 2011 155 254,609,500 151,880.79 Aug 2012 123 112,367,000 561,960.00 410,079.21 Baltimore City Sep 2011 120 95,766,000 73,875.80 Sep 2012 102 135,927,000 204,742.50 130,866.70 Baltimore City Oct 2011 124 1,340,081,000 60,459.00 Oct 2012 109 96,440,000 478,190.00 417,731.00 Baltimore City TOTAL 2011 399 1,690,456,500 286,215.59 TOTAL 2012 334 344,734,000 1,244,892.50 958,676.91 3,834,707.64 400,000.00 3,434,707.64 Baltimore County Aug 2011 74 133,452,000 14,237.50 Aug 2012 74 487,543,000 1,723,230.50 1,708,993.00 Baltimore County Sep 2011 81 535,388,000 62,927.00 Sep 2012 72 226,340,500 769,802.50 706,875.50 Baltimore County Oct 2011 57 90,099,000 82,612.50 Oct 2012 74 1,011,863,000 273,030.00 190,417.50 Baltimore County TOTAL 2011 212 758,939,000 159,777.00 TOTAL 2012 220 1,725,746,500 2,766,063.00 2,606,286.00 10,425,144.00 2,100,000.00 8,325,144.00 Caroline Aug 2011 5 1,487,500 8,770.00 Aug 2012 6 1,616,000 - (8,770.00) Caroline Sep 2011 7 3,965,000 11,350.00 Sep 2012 8 1,994,500 1,110.00 (10,240.00) Caroline Oct 2011 3 1,327,000 3,231.60 Oct 2012 10 5,091,000 7,690.00 4,458.40 Caroline TOTAL 2011 15 6,779,500 23,351.60 TOTAL 2012 24 8,701,500 8,800.00 (14,551.60) (58,206.40) 100,000.00 (158,206.40) Cecil Aug 2011 23 347,984,000 19,210.00 Aug 2012 21 29,069,500 171,148.50 151,938.50 Cecil Sep 2011 15 7,237,000 32.80 Sep 2012 12 11,188,500 22,850.80 22,818.00 Cecil Oct 2011 14 40,427,500 11,508.70 Oct 2012 12 11,656,500 59,085.10 47,576.40 Cecil TOTAL 2011 52 395,648,500 30,751.50 TOTAL 2012 45 51,914,500 253,084.40 222,332.90 889,331.60 2,195,000.00 (1,305,668.40) Harford Aug 2011 32 303,332,000 6,052.20 Aug 2012 26 23,515,000 16,037.70 9,985.50 Harford Sep 2011 42 131,849,500 244,840.20 Sep 2012 22 20,311,000 46,688.48 (198,151.72) Harford Oct 2011 23 135,767,000 14,784.00 Oct 2012 21 38,439,500 14,902.20 118.20 Harford TOTAL 2011 97 570,948,500 265,676.40 TOTAL 2012 69 82,265,500 77,628.38 (188,048.02) (752,192.08) 1,020,000.00 (1,772,192.08) Howard Aug 2011 37 220,821,500 39,490.00 Aug 2012 28 151,982,500 53,923.00 14,433.00 Howard Sep 2011 37 718,511,000 24,040.00 Sep 2012 28 470,492,500 1,851,265.00 1,827,225.00 Howard Oct 2011 36 197,865,500 38,030.00 Oct 2012 19 126,774,000 258,422.50 220,392.50 Howard TOTAL 2011 110 1,137,198,000 101,560.00 TOTAL 2012 75 749,249,000 2,163,610.50 2,062,050.50 8,248,202.00 2,903,000.00 5,345,202.00 Montgomery Aug 2011 85 872,197,500 108,936.80 Aug 2012 52 590,950,500 2,705,778.10 2,596,841.30 Montgomery Sep 2011 66 1,537,323,500 463,156.60 Sep 2012 49 387,113,500 293,775.93 (169,380.67) Montgomery Oct 2011 87 869,250,500 113,623.85 Oct 2012 57 270,876,500 2,135,622.05 2,021,998.20 Montgomery TOTAL 2011 238 3,278,771,500 685,717.25 TOTAL 2012 158 1,248,940,500 5,135,176.08 4,449,458.83 17,797,835.32 11,000,000.00 6,797,835.32 Queen Anne's Aug 2011 12 15,131,500 4,855.95 Aug 2012 14 22,974,500 120,329.65 115,473.70 Queen Anne's Sep 2011 16 22,825,000 306.90 Sep 2012 14 8,354,500 29,912.05 29,605.15 Queen Anne's Oct 2011 11 12,620,500 3,098.20 Oct 2012 16 28,225,500 154,260.35 151,162.15 Queen Anne's TOTAL 2011 39 50,577,000 8,261.05 TOTAL 2012 44 59,554,500 304,502.05 296,241.00 1,184,964.00 500,000.00 684,964.00 Washington Aug 2011 24 622,237,500 29,593.00 Aug 2012 20 110,005,500 5,890.00 (23,703.00) Washington Sep 2011 43 224,053,000 10,933.40 Sep 2012 16 24,670,000 28,537.20 17,603.80 Washington Oct 2011 30 28,423,000 24,432.00 Oct 2012 25 95,687,500 516,831.00 492,399.00 Washington TOTAL 2011 97 874,713,500 64,958.40 TOTAL 2012 61 230,363,000 551,258.20 486,299.80 1,945,199.20 455,000.00 1,490,199.20 Worcester Aug 2011 24 66,507,500 28,469.10 Aug 2012 16 26,775,500 2,392.50 (26,076.60) Worcester Sep 2011 33 25,780,000 3,599.70 Sep 2012 19 28,144,500 52,683.60 49,083.90 Worcester Oct 2011 14 11,448,000 5,655.30 Oct 2012 20 207,779,500 30,857.50 25,202.20 Worcester TOTAL 2011 71 103,735,500 37,724.10 TOTAL 2012 55 262,699,500 85,933.60 48,209.50 192,838.00 250,000.00 (57,162.00) TOTALS TOTAL 2011 1507 10,681,109,000 1,742,473.34 TOTAL 2012 1242 5,112,054,000 13,636,426.86 11,893,953.52 47,575,814.08 23,848,000.00 23,727,814.08
Over (Under) Collected
# of Commercial Documents
Consideration on Commercial
$ Collected Change in Tax Collected
Annualized Change in Tax
State Estimate$ CollectedCounty Month/Year # of Commercial Documents
Consideration on Commercial
Month/Year
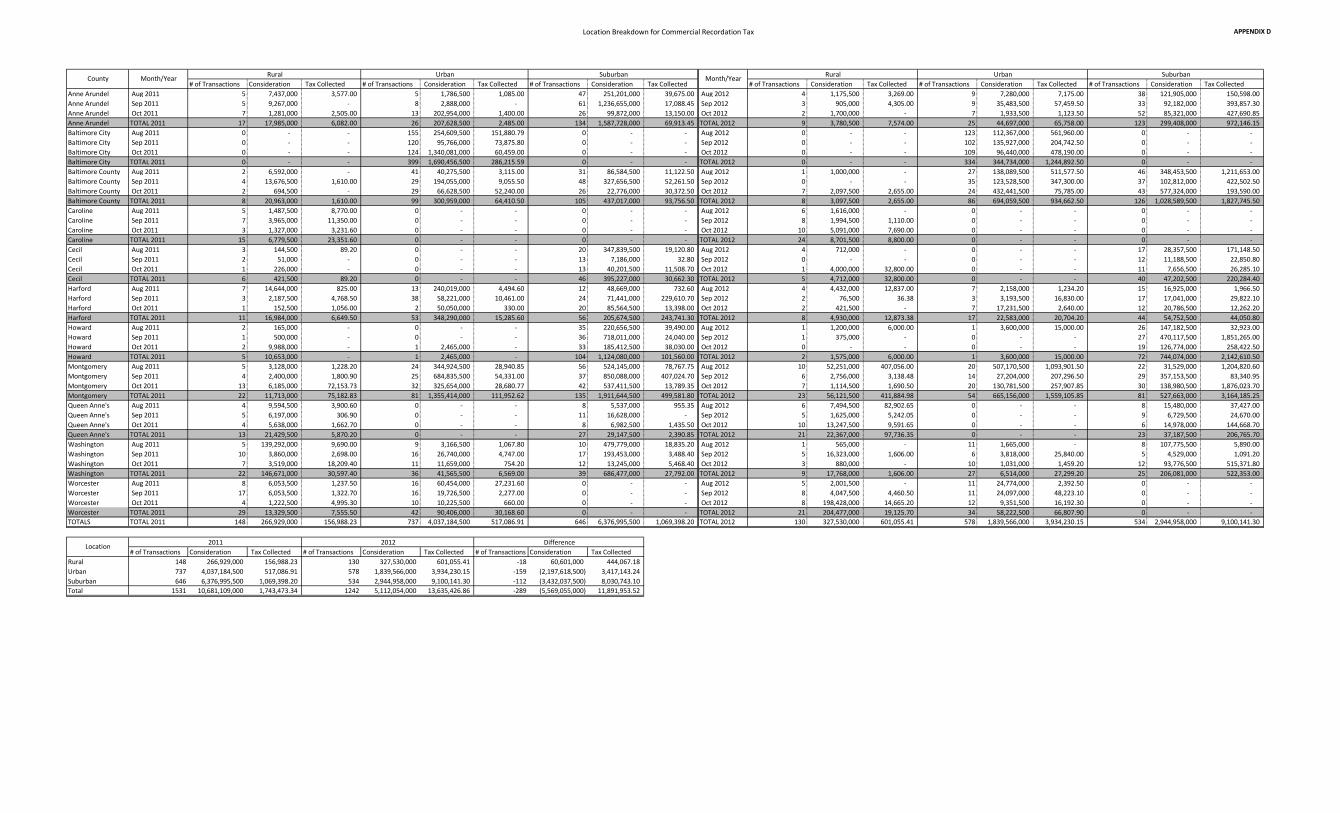
Location Breakdown for Commercial Recordation Tax APPENDIX D
# of Transactions Consideration Tax Collected # of Transactions Consideration Tax Collected # of Transactions Consideration Tax Collected # of Transactions Consideration Tax Collected # of Transactions Consideration Tax Collected # of Transactions Consideration Tax CollectedAnne Arundel Aug 2011 5 7,437,000 3,577.00 5 1,786,500 1,085.00 47 251,201,000 39,675.00 Aug 2012 4 1,175,500 3,269.00 9 7,280,000 7,175.00 38 121,905,000 150,598.00 Anne Arundel Sep 2011 5 9,267,000 - 8 2,888,000 - 61 1,236,655,000 17,088.45 Sep 2012 3 905,000 4,305.00 9 35,483,500 57,459.50 33 92,182,000 393,857.30 Anne Arundel Oct 2011 7 1,281,000 2,505.00 13 202,954,000 1,400.00 26 99,872,000 13,150.00 Oct 2012 2 1,700,000 - 7 1,933,500 1,123.50 52 85,321,000 427,690.85 Anne Arundel TOTAL 2011 17 17,985,000 6,082.00 26 207,628,500 2,485.00 134 1,587,728,000 69,913.45 TOTAL 2012 9 3,780,500 7,574.00 25 44,697,000 65,758.00 123 299,408,000 972,146.15 Baltimore City Aug 2011 0 - - 155 254,609,500 151,880.79 0 - - Aug 2012 0 - - 123 112,367,000 561,960.00 0 - - Baltimore City Sep 2011 0 - - 120 95,766,000 73,875.80 0 - - Sep 2012 0 - - 102 135,927,000 204,742.50 0 - - Baltimore City Oct 2011 0 - - 124 1,340,081,000 60,459.00 0 - - Oct 2012 0 - - 109 96,440,000 478,190.00 0 - - Baltimore City TOTAL 2011 0 - - 399 1,690,456,500 286,215.59 0 - - TOTAL 2012 0 - - 334 344,734,000 1,244,892.50 0 - - Baltimore County Aug 2011 2 6,592,000 - 41 40,275,500 3,115.00 31 86,584,500 11,122.50 Aug 2012 1 1,000,000 - 27 138,089,500 511,577.50 46 348,453,500 1,211,653.00 Baltimore County Sep 2011 4 13,676,500 1,610.00 29 194,055,000 9,055.50 48 327,656,500 52,261.50 Sep 2012 0 - - 35 123,528,500 347,300.00 37 102,812,000 422,502.50 Baltimore County Oct 2011 2 694,500 - 29 66,628,500 52,240.00 26 22,776,000 30,372.50 Oct 2012 7 2,097,500 2,655.00 24 432,441,500 75,785.00 43 577,324,000 193,590.00 Baltimore County TOTAL 2011 8 20,963,000 1,610.00 99 300,959,000 64,410.50 105 437,017,000 93,756.50 TOTAL 2012 8 3,097,500 2,655.00 86 694,059,500 934,662.50 126 1,028,589,500 1,827,745.50 Caroline Aug 2011 5 1,487,500 8,770.00 0 - - 0 - - Aug 2012 6 1,616,000 - 0 - - 0 - - Caroline Sep 2011 7 3,965,000 11,350.00 0 - - 0 - - Sep 2012 8 1,994,500 1,110.00 0 - - 0 - - Caroline Oct 2011 3 1,327,000 3,231.60 0 - - 0 - - Oct 2012 10 5,091,000 7,690.00 0 - - 0 - - Caroline TOTAL 2011 15 6,779,500 23,351.60 0 - - 0 - - TOTAL 2012 24 8,701,500 8,800.00 0 - - 0 - - Cecil Aug 2011 3 144,500 89.20 0 - - 20 347,839,500 19,120.80 Aug 2012 4 712,000 - 0 - - 17 28,357,500 171,148.50 Cecil Sep 2011 2 51,000 - 0 - - 13 7,186,000 32.80 Sep 2012 0 - - 0 - - 12 11,188,500 22,850.80 Cecil Oct 2011 1 226,000 - 0 - - 13 40,201,500 11,508.70 Oct 2012 1 4,000,000 32,800.00 0 - - 11 7,656,500 26,285.10 Cecil TOTAL 2011 6 421,500 89.20 0 - - 46 395,227,000 30,662.30 TOTAL 2012 5 4,712,000 32,800.00 0 - - 40 47,202,500 220,284.40 Harford Aug 2011 7 14,644,000 825.00 13 240,019,000 4,494.60 12 48,669,000 732.60 Aug 2012 4 4,432,000 12,837.00 7 2,158,000 1,234.20 15 16,925,000 1,966.50 Harford Sep 2011 3 2,187,500 4,768.50 38 58,221,000 10,461.00 24 71,441,000 229,610.70 Sep 2012 2 76,500 36.38 3 3,193,500 16,830.00 17 17,041,000 29,822.10 Harford Oct 2011 1 152,500 1,056.00 2 50,050,000 330.00 20 85,564,500 13,398.00 Oct 2012 2 421,500 - 7 17,231,500 2,640.00 12 20,786,500 12,262.20 Harford TOTAL 2011 11 16,984,000 6,649.50 53 348,290,000 15,285.60 56 205,674,500 243,741.30 TOTAL 2012 8 4,930,000 12,873.38 17 22,583,000 20,704.20 44 54,752,500 44,050.80 Howard Aug 2011 2 165,000 - 0 - - 35 220,656,500 39,490.00 Aug 2012 1 1,200,000 6,000.00 1 3,600,000 15,000.00 26 147,182,500 32,923.00 Howard Sep 2011 1 500,000 - 0 - - 36 718,011,000 24,040.00 Sep 2012 1 375,000 - 0 - - 27 470,117,500 1,851,265.00 Howard Oct 2011 2 9,988,000 - 1 2,465,000 - 33 185,412,500 38,030.00 Oct 2012 0 - - 0 - - 19 126,774,000 258,422.50 Howard TOTAL 2011 5 10,653,000 - 1 2,465,000 - 104 1,124,080,000 101,560.00 TOTAL 2012 2 1,575,000 6,000.00 1 3,600,000 15,000.00 72 744,074,000 2,142,610.50 Montgomery Aug 2011 5 3,128,000 1,228.20 24 344,924,500 28,940.85 56 524,145,000 78,767.75 Aug 2012 10 52,251,000 407,056.00 20 507,170,500 1,093,901.50 22 31,529,000 1,204,820.60 Montgomery Sep 2011 4 2,400,000 1,800.90 25 684,835,500 54,331.00 37 850,088,000 407,024.70 Sep 2012 6 2,756,000 3,138.48 14 27,204,000 207,296.50 29 357,153,500 83,340.95 Montgomery Oct 2011 13 6,185,000 72,153.73 32 325,654,000 28,680.77 42 537,411,500 13,789.35 Oct 2012 7 1,114,500 1,690.50 20 130,781,500 257,907.85 30 138,980,500 1,876,023.70 Montgomery TOTAL 2011 22 11,713,000 75,182.83 81 1,355,414,000 111,952.62 135 1,911,644,500 499,581.80 TOTAL 2012 23 56,121,500 411,884.98 54 665,156,000 1,559,105.85 81 527,663,000 3,164,185.25 Queen Anne's Aug 2011 4 9,594,500 3,900.60 0 - - 8 5,537,000 955.35 Aug 2012 6 7,494,500 82,902.65 0 - - 8 15,480,000 37,427.00 Queen Anne's Sep 2011 5 6,197,000 306.90 0 - - 11 16,628,000 - Sep 2012 5 1,625,000 5,242.05 0 - - 9 6,729,500 24,670.00 Queen Anne's Oct 2011 4 5,638,000 1,662.70 0 - - 8 6,982,500 1,435.50 Oct 2012 10 13,247,500 9,591.65 0 - - 6 14,978,000 144,668.70 Queen Anne's TOTAL 2011 13 21,429,500 5,870.20 0 - - 27 29,147,500 2,390.85 TOTAL 2012 21 22,367,000 97,736.35 0 - - 23 37,187,500 206,765.70 Washington Aug 2011 5 139,292,000 9,690.00 9 3,166,500 1,067.80 10 479,779,000 18,835.20 Aug 2012 1 565,000 - 11 1,665,000 - 8 107,775,500 5,890.00 Washington Sep 2011 10 3,860,000 2,698.00 16 26,740,000 4,747.00 17 193,453,000 3,488.40 Sep 2012 5 16,323,000 1,606.00 6 3,818,000 25,840.00 5 4,529,000 1,091.20 Washington Oct 2011 7 3,519,000 18,209.40 11 11,659,000 754.20 12 13,245,000 5,468.40 Oct 2012 3 880,000 - 10 1,031,000 1,459.20 12 93,776,500 515,371.80 Washington TOTAL 2011 22 146,671,000 30,597.40 36 41,565,500 6,569.00 39 686,477,000 27,792.00 TOTAL 2012 9 17,768,000 1,606.00 27 6,514,000 27,299.20 25 206,081,000 522,353.00 Worcester Aug 2011 8 6,053,500 1,237.50 16 60,454,000 27,231.60 0 - - Aug 2012 5 2,001,500 - 11 24,774,000 2,392.50 0 - - Worcester Sep 2011 17 6,053,500 1,322.70 16 19,726,500 2,277.00 0 - - Sep 2012 8 4,047,500 4,460.50 11 24,097,000 48,223.10 0 - - Worcester Oct 2011 4 1,222,500 4,995.30 10 10,225,500 660.00 0 - - Oct 2012 8 198,428,000 14,665.20 12 9,351,500 16,192.30 0 - - Worcester TOTAL 2011 29 13,329,500 7,555.50 42 90,406,000 30,168.60 0 - - TOTAL 2012 21 204,477,000 19,125.70 34 58,222,500 66,807.90 0 - - TOTALS TOTAL 2011 148 266,929,000 156,988.23 737 4,037,184,500 517,086.91 646 6,376,995,500 1,069,398.20 TOTAL 2012 130 327,530,000 601,055.41 578 1,839,566,000 3,934,230.15 534 2,944,958,000 9,100,141.30
# of Transactions Consideration Tax Collected # of Transactions Consideration Tax Collected # of Transactions Consideration Tax CollectedRural 148 266,929,000 156,988.23 130 327,530,000 601,055.41 -18 60,601,000 444,067.18 Urban 737 4,037,184,500 517,086.91 578 1,839,566,000 3,934,230.15 -159 (2,197,618,500) 3,417,143.24 Suburban 646 6,376,995,500 1,069,398.20 534 2,944,958,000 9,100,141.30 -112 (3,432,037,500) 8,030,743.10 Total 1531 10,681,109,000 1,743,473.34 1242 5,112,054,000 13,635,426.86 -289 (5,569,055,000) 11,891,953.52
Urban Suburban Month/Year
Location
County Rural Urban Suburban
2011 2012 Difference
Month/Year Rural
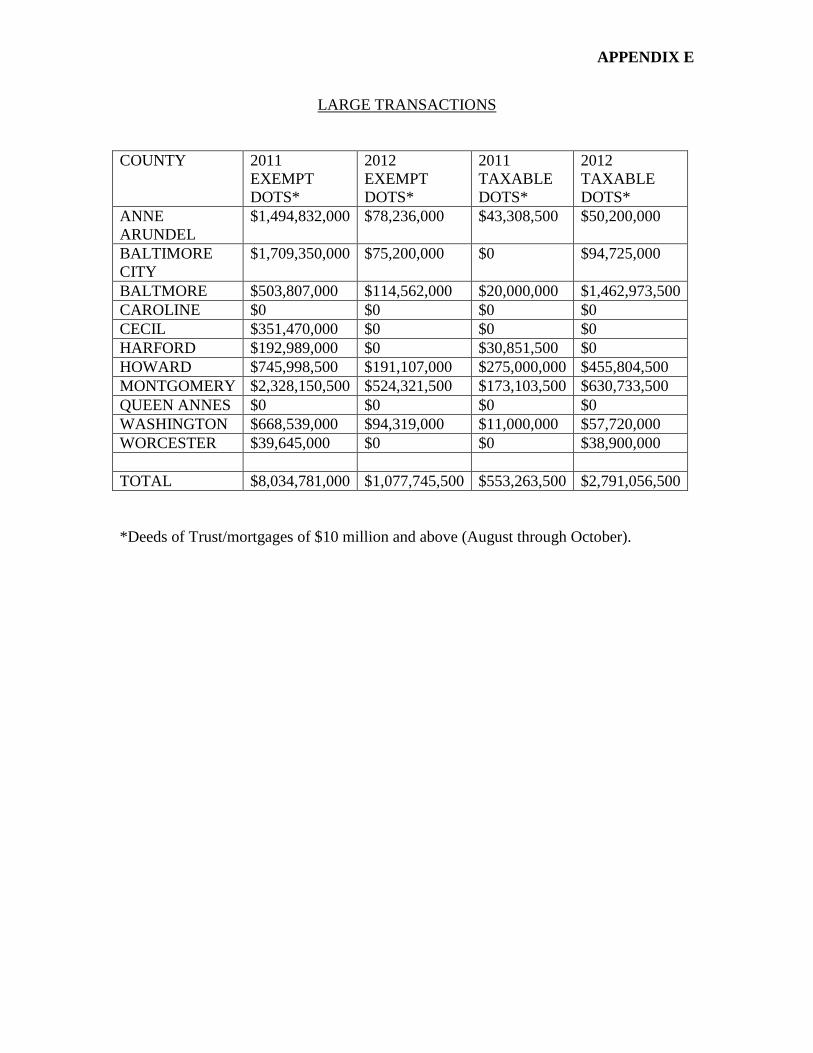
APPENDIX E
LARGE TRANSACTIONS
COUNTY 2011 EXEMPT DOTS*
2012 EXEMPT DOTS*
2011 TAXABLE DOTS*
2012 TAXABLE DOTS*
ANNE ARUNDEL
$1,494,832,000 $78,236,000 $43,308,500 $50,200,000
BALTIMORE CITY
$1,709,350,000 $75,200,000 $0 $94,725,000
BALTMORE $503,807,000 $114,562,000 $20,000,000 $1,462,973,500 CAROLINE $0 $0 $0 $0 CECIL $351,470,000 $0 $0 $0 HARFORD $192,989,000 $0 $30,851,500 $0 HOWARD $745,998,500 $191,107,000 $275,000,000 $455,804,500 MONTGOMERY $2,328,150,500 $524,321,500 $173,103,500 $630,733,500 QUEEN ANNES $0 $0 $0 $0 WASHINGTON $668,539,000 $94,319,000 $11,000,000 $57,720,000 WORCESTER $39,645,000 $0 $0 $38,900,000 TOTAL $8,034,781,000 $1,077,745,500 $553,263,500 $2,791,056,500 *Deeds of Trust/mortgages of $10 million and above (August through October).
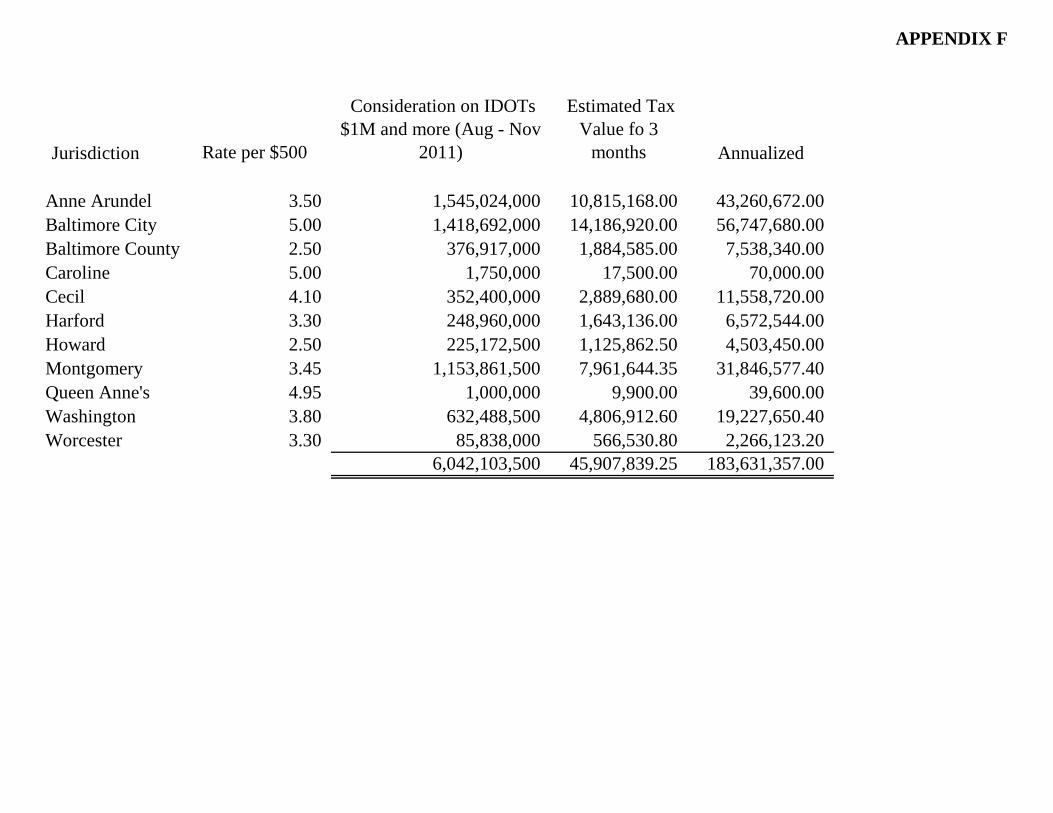
APPENDIX F
Jurisdiction Rate per $500
Consideration on IDOTs $1M and more (Aug - Nov
2011)
Estimated Tax Value fo 3
months Annualized
Anne Arundel 3.50 1,545,024,000 10,815,168.00 43,260,672.00 Baltimore City 5.00 1,418,692,000 14,186,920.00 56,747,680.00 Baltimore County 2.50 376,917,000 1,884,585.00 7,538,340.00 Caroline 5.00 1,750,000 17,500.00 70,000.00 Cecil 4.10 352,400,000 2,889,680.00 11,558,720.00 Harford 3.30 248,960,000 1,643,136.00 6,572,544.00 Howard 2.50 225,172,500 1,125,862.50 4,503,450.00 Montgomery 3.45 1,153,861,500 7,961,644.35 31,846,577.40 Queen Anne's 4.95 1,000,000 9,900.00 39,600.00 Washington 3.80 632,488,500 4,806,912.60 19,227,650.40 Worcester 3.30 85,838,000 566,530.80 2,266,123.20
6,042,103,500 45,907,839.25 183,631,357.00
APPENDIX G
1
Maryland Bankers Association IDOT Membership Survey Results
Draft - 11.19.12
Executive Summary Background As a part of the data collection effort by the IDOT workgroup, the Maryland Bankers Association (MBA) agreed to issue a membership survey on the impacts of the new law. MBA’s IDOT membership survey was developed collaboratively and with significant input from the IDOT workgroup. A particular focus of MBA’s membership survey is the business / financing impact and implementation issues related to the new recordation tax on IDOTs. Survey Responses and Response Rate MBA issued the survey to its 81 charter member banks. While MBA is aware that not all of our member banks engage in business lending for a variety of reasons, we were not able to refine our distribution list to only those banks that have IDOT experience. Therefore, the survey was circulated to MBA’s 81 charter bank members, even though the universe of possible respondents is smaller than that population. Response rate: MBA received 25 individual responses from 24 different banks for a 30% response rate. This is an excellent response rate. Typically a 25% response rate is considered good. Geographical representation: Banks of all sizes, from smallest to largest in the State responded to MBA’s IDOT survey. Geographically, survey respondents spanned the entire state, including Western Maryland and the Eastern Shore. Survey responses also included representation from urban, suburban and rural areas. Survey respondent banks operate in all 23 Maryland counties and Baltimore City. Respondent bank size: According to SNL Financial data, the total assets of responding banks ranged from small (under $500 million) to large (over $2 billion). A breakdown of respondent banks, according to asset range follows. Based on total asset size:
• 79% of respondent banks are small banks (under $500 million in total assets) • 8% of respondent banks are mid-sized banks ($500 million-$2 billion in total
assets) • 13% of respondent banks are large banks (over $2 billion in total assets)
The large number of community bank responses (banks under $500 million) is not surprising. According to Marty Gruenberg, Acting Chairman of the of the FDIC, “Community banks with assets of less than $1 billion account for a little more than 10%
APPENDIX G
2
of the banking assets in our country, but provide nearly 40% of all the small loans that insured financial institutions make to businesses and farms.” Survey Results Summary Feedback on Business / Financing Impacts: According to survey respondents, the credit needs of their small businesses clients range from under one million dollars to over five million dollars. Respondents also reported that businesses’ access to credit, liquidity, and plans to expand are negatively affected by the new law. Almost half of the respondents reported that the new law has a negative impact on business access to credit. Similarly, one in two respondents indicated that their business clients have dealt with the higher transactional costs related to the new law by delayed or eliminated expansion plans. Following are two anecdotal, examples of how businesses are dealing with the higher transactional costs related to the new law.
• “When a commercial loan amount is around $1 million, borrowers are putting additional equity to negate the tax…This is a high cost market and even for small businesses, transactions involving real estate are seldom for less than $1 million.”
• “In every transaction secured by real estate we are educating our
customers/prospects upfront on the recordation costs that now may be incurred to access capital. In several instances customers have reduced the amount requested to be borrowed so as to avoid the costs associated with recordation, thereby limiting expansion and the potential for additional job growth.”
One in five survey respondents indicated that they have seen a direct correlation between fewer commercial and/or residential real estate deals and the new law. Others said that they believed the decline in commercial and real estate transactions are more a factor of the economy. Others believe it is simply too early to tell. The following example of a transaction that did not occur due to the law was provided by a respondent banker. According to one respondent, “in one instance, an Small Business Administration (SBA) refinancing did not occur – as our borrower scrambled to put together funds for the recording costs, the timeframe for the SBA refinancing program expired.” SBA loans are funded by a federal government program designed to help finance small businesses borrowers. It is unfortunate that this borrower was unable to benefit in this way. With regard to geographic impact, the majority of survey respondents felt that the new law would impact businesses similarly, regardless of where the business is located. Interestingly, one in four survey respondents believed that the suburban areas would be most affected by the new law. While the reasons for this response are not clear, it could be due to the high real estate costs in suburban areas. Interestingly, bankers noted that areas in Maryland that boarder other states with lower recordation taxes would be most affected by the new law.
APPENDIX G
3
Feedback on the Implementation of the New Law: Banks view themselves in the role of educating customers on how the new law works and there appears to be a good understanding of the new IDOT tax system and law. However, there is still some uncertainty of the new law and how it is applied. According to survey respondents, variations in local interpretation of the law and certain process hurtles that are negatively impacting the financing process. In fact, one in four survey respondents indicated that the variance in local interpretations is negatively impacting financing. Some respondents reported that because they only deal in one county, local variance is not an issue. General Observations: Bankers noted that it is difficult to gauge the full impact of the new law. Since the law has only been in effect since July 1, 2012 – not much time has passed to fully understand the affects. Further, the economic downturn has negatively impacted business growth and loan demand. As a result, it is hard to differentiate between the effects of the economy and the effects of the new law. Feedback on the Business / Financing Impact The credit needs of small business in Maryland run the gamut. Almost 30% of responding banks indicated that they work with small businesses that have credit needs in excess of $5 million. The highest percentage, 84% of respondents indicated that the credit exposure of their small businesses clients was between $1 million and $2.5 million. • 76% of responding banks reported that their small business clients’ credit exposure
range of the $1 million and under range. • 84% in the $1–2.5 million range. • 52% in the $2.5–5 million range. • 28% in the $5 million – over range.
Note: 25/25 respondents answered this survey question. Over a quarter of respondents (28%) indicated that they have seen a decrease in both volume and dollars of commercial real estate as a direct result of the new IDOT law. Additionally, eight percent of respondents reported a decrease in both the volume and dollar amount of residential real estate transactions. There were others that provided the comments captured here. • Comments:
o It is too early to make any judgment. o Commercial volume has decreased due to economy. o When a commercial loan amount is around $1 million, borrowers are
putting additional equity to negate the tax. A structural issue exists in that the first $1 million for all loans should be exempt from taxation. This is a high cost market and even for small businesses, transactions involving real estate are seldom for less than $1 million.
o Selecting one of the above choices is difficult.
APPENDIX G
4
The commercial market is beginning to show 'spotty' signs of activity and should a client need to use the equity in their commercial or residential real estate to support a commercial loan we are pursuing these requests. I believe if we changed the amount to $5.0 million or less it would help stimulate small business activity.
Residential, while volume has not changed – my comments are the same as above. Many small businesses use their residential home as collateral to secure their loans. It would greatly help the small business borrower to have loans of $5.0 million and less fall under the IDOT law (no recordation feeds or loans of $5.0 million or less).
While the volume of commercial real estate has not changed, demand is relatively low for commercial real estate loans.
Note: 25/25 respondents answered this survey question. When asked what geographic areas (urban, suburban, or rural) will be most affected by the new law, 64% of respondents indicated that all three areas would be uniformly impacted. One out of five survey respondents thought that the suburban areas would be most affected. Additionally, respondents noted that areas that boarder other states with lower recordation taxes will be more affected. • 64% reported all areas – urban, suburban and rural would be affected. • 20% thought suburban areas would be most affected. • 16% responded that they did not know what geographical areas would be most
affected. • 4% indicated that rural areas would be most affected.
Note: 25/25 respondents answered this survey question. Almost half of the survey respondents (48%) reported that the new law is negatively impacting their business clients’ access to credit. Fifty-two percent of respondents indicated that business access to credit was not negatively impacted. Related comments follow.
o Cost to settle a loan today is becoming a higher percentage of the loan amount.
o Businesses are uneasy with the increased cost. o Some customers have decided not to refinance or buy because of
additional costs. However, the volume decrease is more based on economy.
o Clients are thinking twice about purchasing a property or refinancing a property over $1 million.
APPENDIX G
5
o We have already had situations where businesses are refinancing and they will have to pay the recordation tax. It has not yet killed a deal that I am aware of, but it is diverting business dollars that could otherwise be used to hire new employees.
o Many small businesses use the equity in their real estate as collateral. Any law that causes more expenses to the small business owner could negatively impact their ability to borrow.
o In the past, they could secure their requests with IDOTs to help alleviate excessive costs at settlement. Now this option has vanished leaving some customers unable to grow their businesses.
o Costs are too high. Also affects existing transactions that are being increased. If not structured properly,

APPENDIX J
IDOT Work Group Report
Results from Surveying the
Economic Development Community
The Work Group surveyed members from the economic development community to determine the impact from their perspective. The purpose of the survey was to solicit a response primarily from those organizations that represent a public economic development enterprise at the state, county and city or municipal level. The contact list was obtained from the Maryland Economic Development Associations and represented active members within that organization. The survey was also sent to other members (Others) who are considered active in economic development and did not represent a public body. Members in the association directly involved with private commercial development were intentionally omitted as they were being survey by other parties within the IDOT work group. A total of 55 surveys were sent and the parties survey are broken down into 4 categories; State organizations, a County or Baltimore city, a public municipality within a County and Others and the numbers of survey send per category were 8, 23, 15 and 9, respectively. The surveys were distributed by email and a second request was sent a couple of week’s after the first was sent. The number of surveys sent was adjusted downward to reflect those that were returned undelivered. The survey obtained seven reply’s or a 12.7% response rate.
Results from State Entities:
One entity responded and characterized their market as being 99% rural and 1% suburban. The respondent was aware of the use of IDOTs in the extension of credit to the business community.
The segment of business that they saw the use of IDOT’s b was represented 100% by small businesses.
The respondent was not aware of any business terminating or deferring a capital project due to the imposition of the recordation tax.
The respondent was not aware of any residential developments that are proposed to be financed by IDOT’s as being cancelled or deferred.
The respondent was not aware of any changes in business borrowings because of the increase in transaction costs.
The respondent was not aware of any banks or lenders that lost or did not proceed with a transaction due to the new requirement.
Results from the Counties and Baltimore City
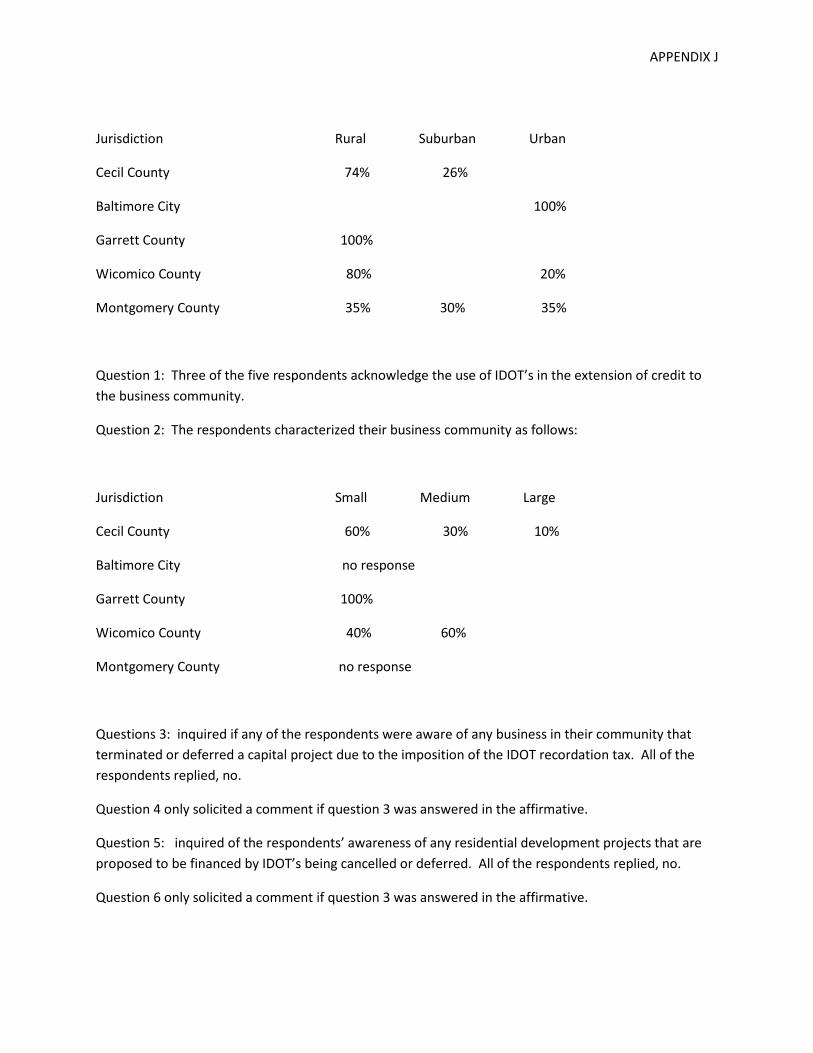
Five jurisdictions responded and characterized their markets as follows:
APPENDIX J
Jurisdiction Rural Suburban Urban
Cecil County 74% 26%
Baltimore City 100%
Garrett County 100%
Wicomico County 80% 20%
Montgomery County 35% 30% 35%
Question 1: Three of the five respondents acknowledge the use of IDOT’s in the extension of credit to the business community.
Question 2: The respondents characterized their business community as follows:
Jurisdiction Small Medium Large
Cecil County 60% 30% 10%
Baltimore City no response
Garrett County 100%
Wicomico County 40% 60%
Montgomery County no response
Questions 3: inquired if any of the respondents were aware of any business in their community that terminated or deferred a capital project due to the imposition of the IDOT recordation tax. All of the respondents replied, no.
Question 4 only solicited a comment if question 3 was answered in the affirmative.
Question 5: inquired of the respondents’ awareness of any residential development projects that are proposed to be financed by IDOT’s being cancelled or deferred. All of the respondents replied, no.
Question 6 only solicited a comment if question 3 was answered in the affirmative.
APPENDIX J
Questions 7 asked if any of the respondents were aware of any change in business borrowing because of the increase in transaction cost. Four of the five responded, no, one responded NA.
Question 8 asked the respondents if they were aware of any banks or other lenders that lost or did not proceed with a transaction due to the new requirements. Four of the five responded responded, no, one responded NA.
Result from a public municipality
One entity responded and characterized their market as being 20% rural, 60% suburban and 20% urban. The respondent was aware of the use of IDOTs in the extension of credit to the business community.
The segment of business that they saw the use of IDOT’s was represented 80% by small business and 20% medium businesses.
The respondent was not aware of any business terminating or deferring a capital project due to the imposition of the recordation tax.
The respondent was not aware of any residential developments that are proposed to be financed by IDOT’s as being cancelled or deferred.
The respondent was not aware of any changes in business borrowings because of the increase in transaction costs. The respondent did provide a comment, see Bowie in the Comment section.
The respondent was not aware of any banks or lenders that lost or did not proceed with a transaction due to the new requirement.
Results from Others
No response
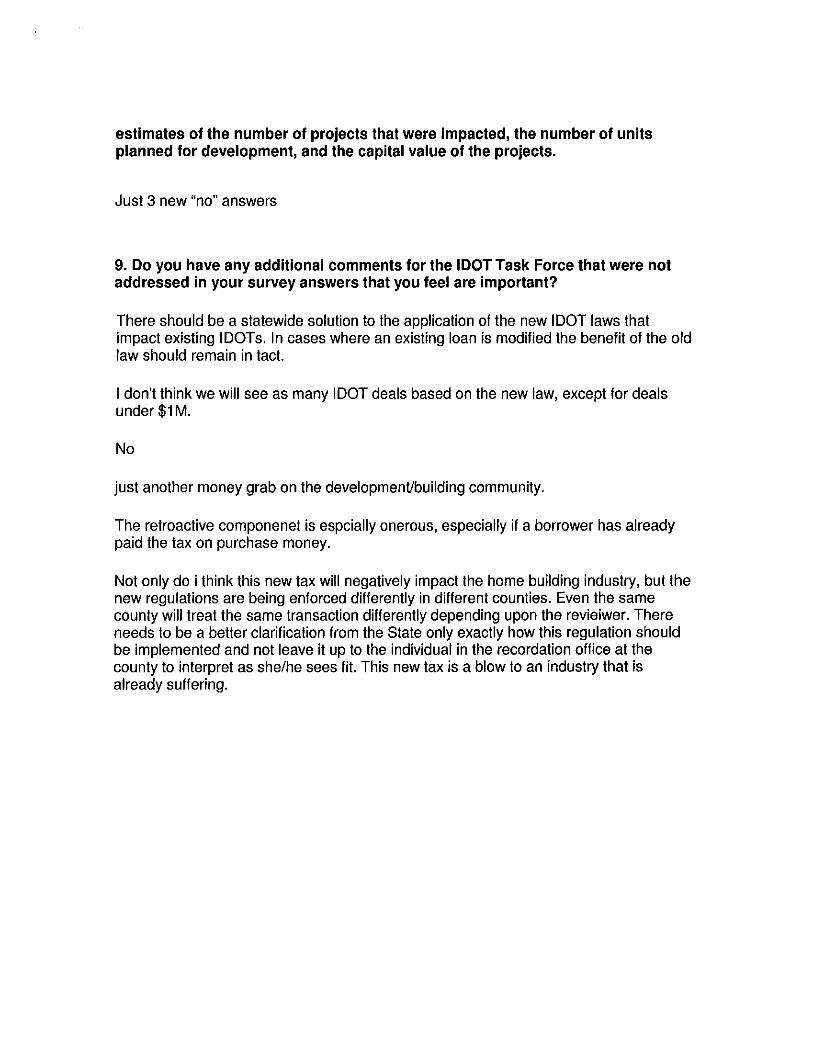
Comments
Cecil: We have not heard of any issues regarding the new law. It may be that the taxes are just being absorbed or passed down to the end user. In Cecil County, the recordation tax on a $1 million dollar transaction is $8,200.00, which is 0.82% . . . this is a very small amount.
Garrett: I can envision that enacting such a law would have a detrimental effect on the small business community. With the current state of the economy, many of the county’s small businesses are already having difficulty growing and expanding. Necessitating the recordation tax to be paid up front, i.e., at the time the actual IDOT is recorded, would simply place an additional burden on our business community, and I can foresee it impeding small business growth and expansion.

APPENDIX J
Bowie: This typically impacts the smallest businesses where the business owner is using his home as additional collateral to support a small commercial loan. For larger borrowers, IDOT’s were used to avoid recordation taxes but were not the key determinant of whether the deal went through.


![Web viewwhere a word or phrase is ... [Indemnity], 46 [Insurance], 54 ... Nothing in this Deed restricts the Department from making enquiries to the extent](https://img.pdfslide.net/doc/110x75/5a817c807f8b9aee018d3e8d/viewwhere-a-word-or-phrase-is-indemnity-46-insurance-54-nothing-in.jpg)
![[FRANCHISEE PARENT] [FRANCHISEE] · Great Western Franchise Deed of ... 8 CONTINUING LIABILITY AND INDEMNITY ... Franchisee will provide services for the carriage of passengers by](https://img.pdfslide.net/doc/110x75/5b5d6e187f8b9a16498e0f4f/franchisee-parent-franchisee-great-western-franchise-deed-of-8-continuing.jpg)