Embed Size (px)
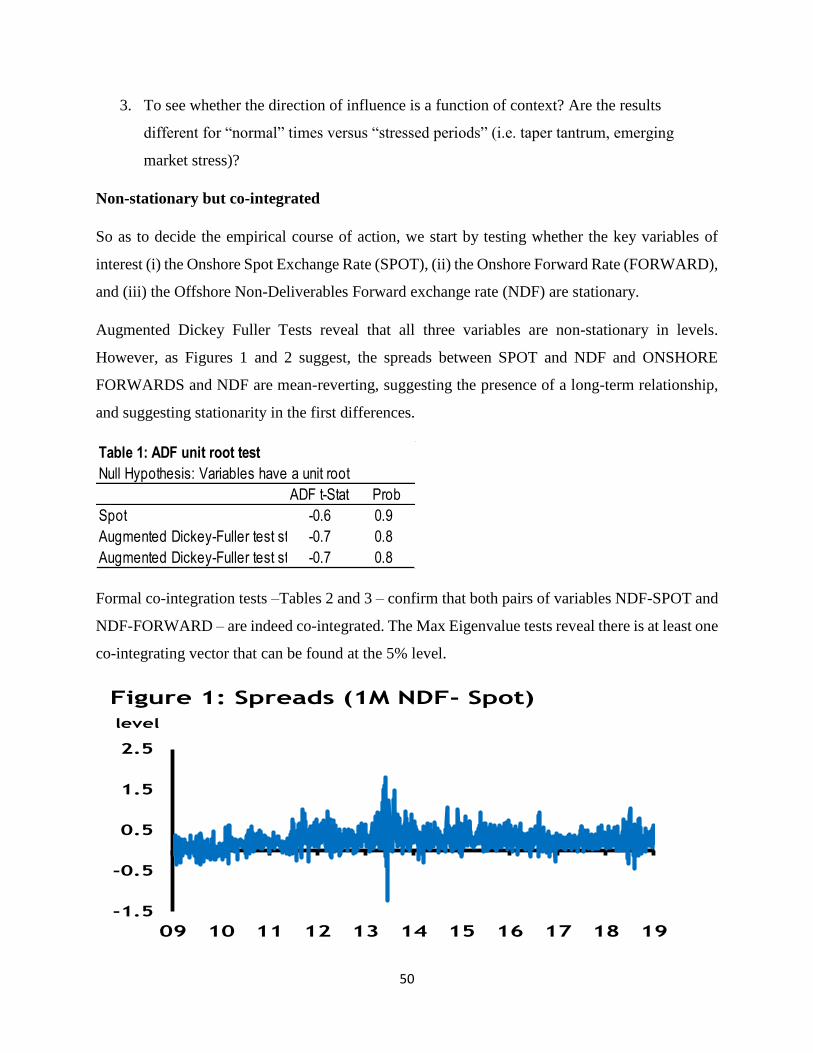
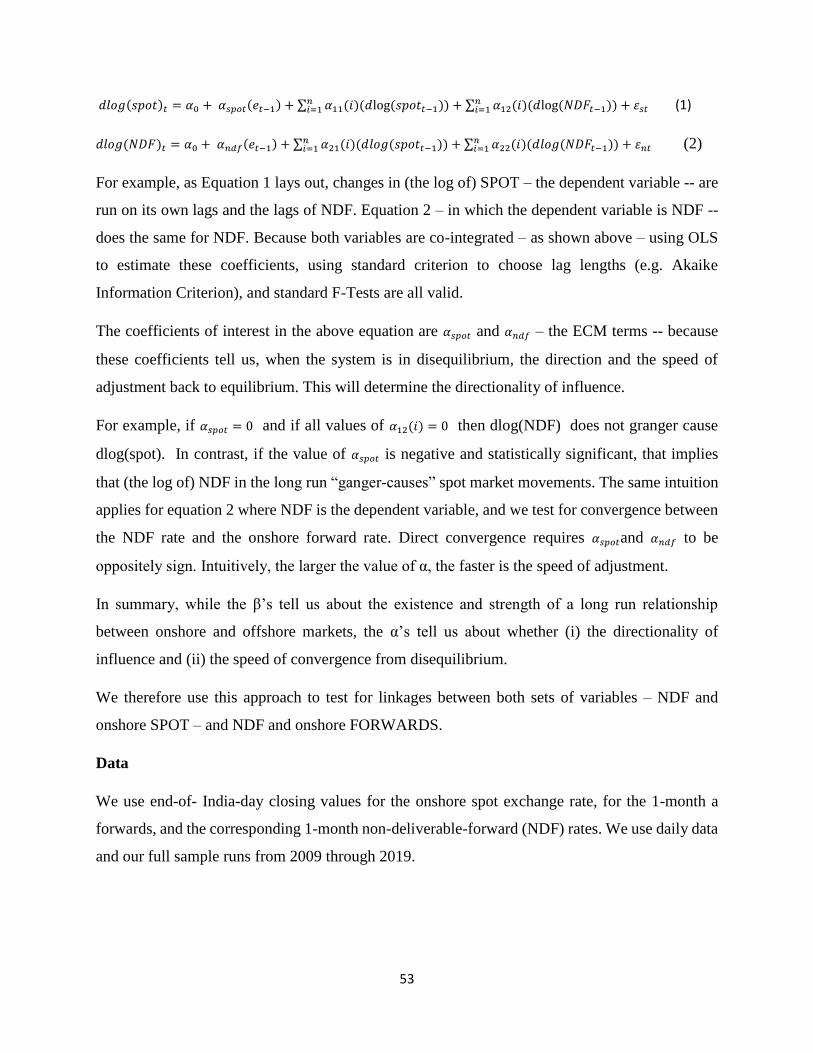
Citation preview

Report of the
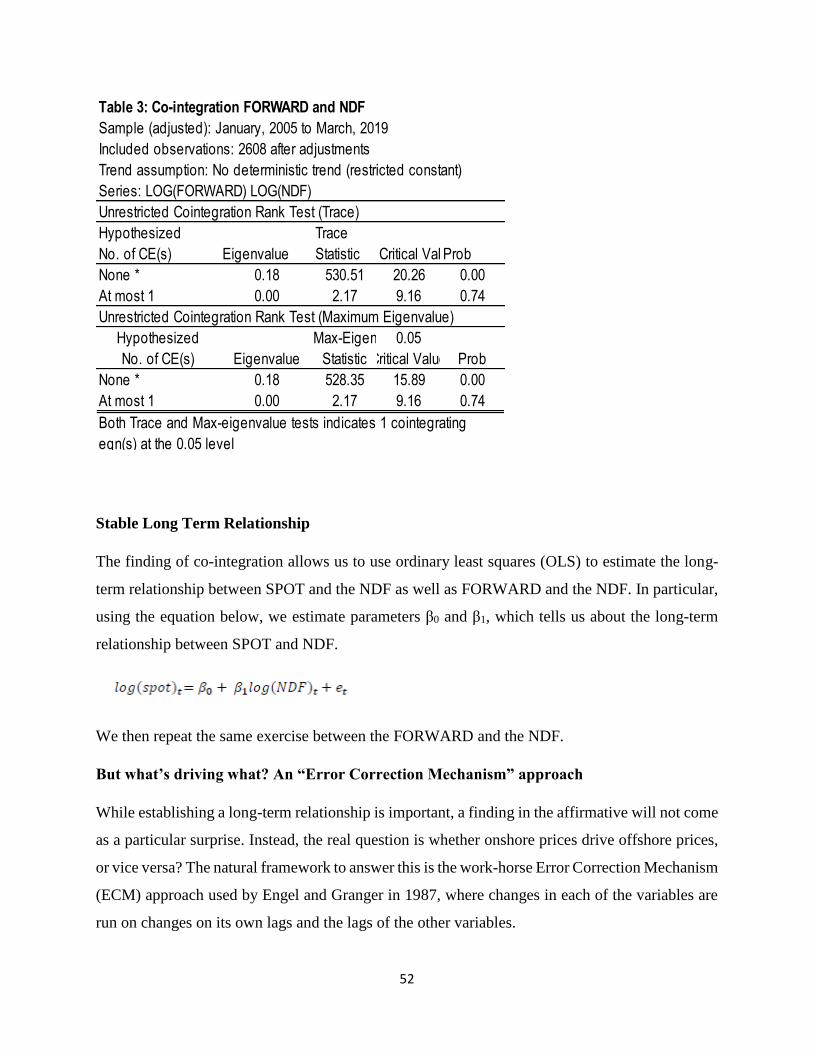
Task Force on Offshore Rupee Markets
July 2019
Reserve Bank of India
Mumbai
2
3
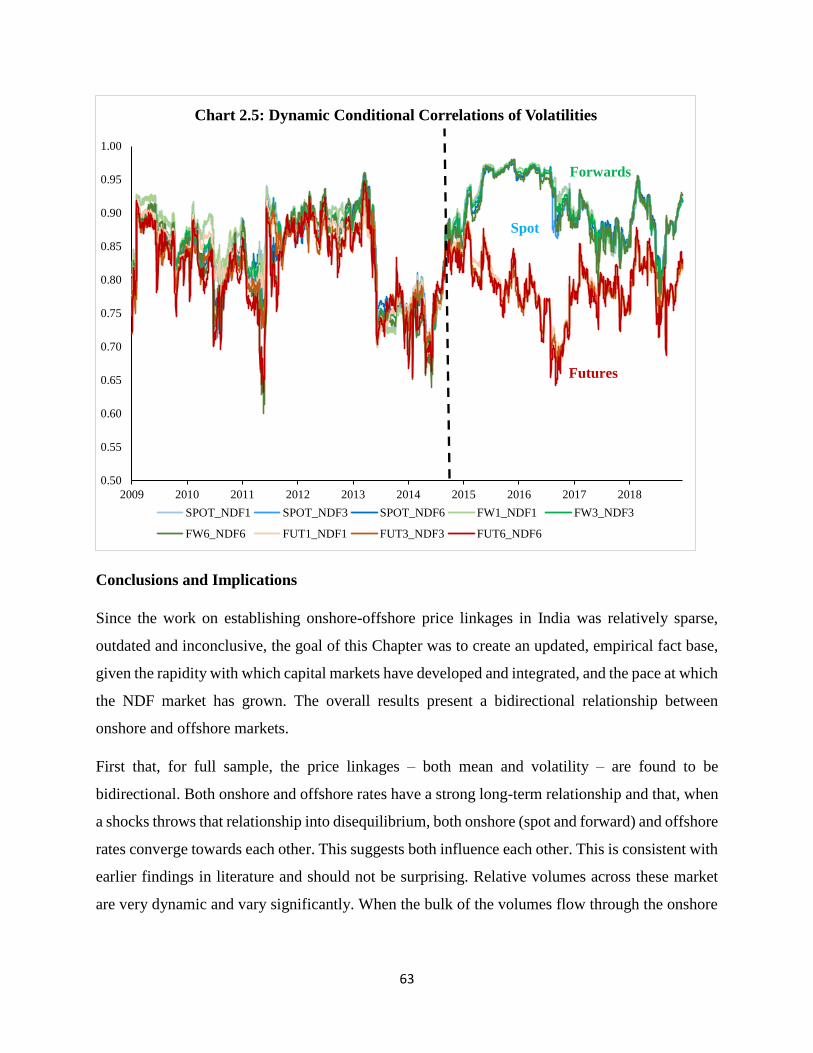
Contents
Letter of Transmittal
Abbreviations
Acknowledgements
Preface
Executive Summary
Chapters
1 Introduction 12
2 Evolution of the offshore rupee markets and cross-country experience 20
3 Linkages between offshore and onshore rupee markets New evidence 46
4 IFSC ndash Use of Rupee derivatives 65
5 Issues and Recommendation 70
Annexures
4
Abbreviations
ABS ndash Association of Banks in Singapore
AD ndash Authorised Dealer
AED ndash Arab Emirates Dirham
BI ndash Bank Indonesia
BIS ndash Bank for International Settlements
BoE ndash Bank of England
BKPM ndash Investment Coordinating Board in Indonesia
BRL ndash Brazilian Real
CAC ndash Capital Account Convertibility
CCIL ndash Clearing Corporation of India Ltd
CME ndash Chicago Mercantile Exchange
CNH ndash Chinese Yuan (Offshore)
CNY ndash Chinese Yuan (Onshore)
CPI ndash Consumer Price Index
CSA ndash Credit Support Annex
DF ndash Deliverable Forward
DGCX ndash Dubai Gold and Commodities Exchange
DNDF ndash Domestic Non-Deliverable Forward
EM ndash Emerging Market
EME ndash Emerging Market Economy
ETCD ndash Exchange Traded Currency Derivatives
EUR ndash Euro
FBIL ndash Financial Benchmarks India Ltd
FCY ndash Foreign Currency
FDI ndash Foreign Direct Investment
5
FEC ndash Foreign Exchange Committees
FED ndash Federal Reserve Board
FEMA ndash Foreign Exchange Management Act 1999
FPI ndash Foreign Portfolio Investor
FSP ndash Final Settlement Price
FSS ndash Financial Supervisory Services (FSS) in Korea
FX ndash Foreign exchange
GDP ndash Gross Domestic Product
GIFT City ndash Gujarat International Financial Tec-City
HKMA ndash Hong Kong Monetary Authority
HKTR ndash Hong Kong trade repository
IFC ndash International Finance Corporation
IFSC ndash International Financial Service Centre
IDR ndash Indonesian Rupiah
INR ndash Indian Rupee
IMF ndash International Monetary Fund
IRC ndash Investment Registration Certificate
ISDA ndash International Swaps and Derivatives Association
JISDOR ndash Jakarta Inter-bank Spot Dollar Rate
JIBOR ndash Jakarta Interbank Offered Rate
JPY ndash Japanese Yen
KRA ndash KYC Registration Agency
KRW ndash Korean Won
KYC ndash Know Your Customer
LEI ndash Legal Entity Identifier
MIFOR ndash Mumbai Interbank Forward Offer Rate
MSEI ndash Metropolitan Stock Exchange of India Ltd
MYR ndash Malaysian Ringgit
6
NDF ndash Non Deliverable Forward
NOOPL ndash Net Overnight Open Position Limit
NRI ndash Non Resident Indian
NSE ndash National Stock Exchange
OIS ndash Overnight Indexed Swaps
OTC ndash Over the Counter
PBoC ndash Peoplersquos Bank of China
RBI ndash Reserve Bank of India
RMB ndash Renminbi
SEBI ndash Securities and Exchange Board of India
SFEMC ndash The Singapore Foreign Exchange Markets Committee
SGX ndash Singapore Exchange
SNRR ndash Special Non-Resident Rupee Account
TF ndash Task Force on Offshore Rupee Market
TWD ndash Taiwanese Dollar
USD ndash United States Dollar
7
Acknowledgements
The Report of the lsquoTask Force on Offshore Rupee Marketsrsquo was made possible with the support
of a number of individuals and organisations The Task Force would like to gratefully acknowledge
representatives of various banks financial institutions large corporates in India and abroad
foreign portfolio investors asset managers industry bodies experts and practitioners who
interacted with the Task Force and provided their valuable inputs and suggestions
The Task Force greatly benefitted from the experience of Smt Shyamala Gopinath former Deputy
Governor Reserve Bank of India and Shri G Padmanabhan former Executive Director Reserve
Bank of India who took time out of their busy schedules to attend the meetings of the Task Force
as special invitees
The Task Force benefitted from the interactions with Dr T V Somanathan IAS Additional Chief
Secretary Government of Tamil Nadu Shri R Sridharan Managing Director CCIL Dr V
Anantha Nageswaran Dean IFMR Chennai Shri Ananth Narayan Associate Professor SPJIMR
Dr A K Nag Shri Himadri Bhattacharya and Shri Jamal Mecklai CEO Mecklai Financial
Services
The Task Force invited submissions from members of the public and is grateful for several helpful
suggestions received
The Task Force also places on record the assistance provided by Shri Subrat Kumar Seet Director
and Smt Priyanka Sachdeva Manager from Department of Economic and Policy Research
Reserve Bank of India and Shri Hiren Sanghvi Director and Shri Saket Banka Associate Director
from HSBC India The Task Force specifically acknowledges the contribution of Shri Harendra
Behera Assistant Adviser Department of Economic and Policy Research Reserve Bank of India
in research on lsquoLinkages between Offshore and Onshore Rupee Marketsrsquo undertaken in
collaboration with Shri Sajjid Chinoy Chief Economist J P Morgan India
Finally the Task Force would like to commend the efforts put in by the Secretariat team from the
Financial Markets Regulation Department Reserve Bank of India led by Shri Supriyo
Bhattacharjee Deputy General Manager and supported by Shri Nitin Daukia Manager
Meticulous organisation of meetings by Smt Supriya Devalekar Assistant Manager and Shri
Kaivalya Sakalgaonkar Assistant from the Secretariat team is also appreciated
8
Preface
Offshore markets in a non-convertible currency usually referred to as non-deliverable forward
(NDF) markets enable trading of the non-convertible currency outside the influence of the
domestic authorities These contracts are settled in a convertible currency usually US Dollars as
the non-convertible currency cannot be delivered offshore Historically NDF markets evolved for
currencies with foreign exchange convertibility restrictions and controlled access for non-
residents beginning with countries in South America like Mexico and Brazil and thereafter
moving on to emerging Asian economies viz Taiwan South Korea Indonesia India China
Philippines etc Apart from enabling trading in non-convertible currencies NDF markets have
also gained in prominence because of onshore regulatory controls and their ease of access
Reserve Bank has been guided by the objective of developing a deep and liquid on-shore foreign
exchange market that acts as a price setter globally With regard to non-resident entities having
legitimate exposure to the Rupee the focus of policy efforts has been to align incentives for non-
residents to gradually move to the domestic market with adequate safeguards to ensure the
external stability of the value of the Rupee
The sharp growth in the offshore trading volumes in the Rupee NDF market in recent years likely
even beyond the volumes in the onshore markets have raised concerns around the forces that are
determining the value of the rupee and the ability of authorities to ensure currency stability This
necessitates a deeper understanding of the causes underlying the growth in those markets and
identification of measures to reverse the trend
The Task Force on Offshore Rupee Markets was set up to address that concern It was mandated
to study the factors attributable to the growth of the offshore Rupee market its effects on the Rupee
exchange rate and onshore market liquidity and formulate measures to redress the concerns The
Task Force was also charged to examine the role if any that International Financial Services
Centres (IFSCs) can play in addressing these concerns
During its term the Task Force interacted with a wide variety of stakeholders including banks
financial institutions industry bodies foreign portfolio investors asset managers and
academicians
9
I trust that the Reserve Bank of India will find the recommendations made in the report useful
Usha Thorat
Chairperson
10
Executive Summary
The origin of the NDF markets may be traced back to the 1990s when a wave of capital account
liberalisation in emerging market economies (EMEs) triggered a surge in capital inflows to these
economies and consequently heightened the currency risk faced by foreign investors Under-
developed domestic markets especially the market for financial derivatives as well as controlled
access to onshore markets raised the demand for a currency market outside the reach of local
regulations Another trend that supported the growth of the NDF market was the sharp rise
globally in the size of derivatives markets in the 1980s and 1990s As derivatives markets evolved
the speculative search for underlying moved out of the developed world into more esoteric assets
Following the successful speculative attack on the Sterling in 1992 EME currencies became viable
subjects for such speculative positioning Such activity becomes particularly noticeable during
times of stress as offshore risk spills over to the domestic exchange rate through entities that have
a presence in both onshore and offshore markets usually global banks but also corporates
A study of the degree and direction of such spillovers is important to understand the role of NDF
markets and assess policy alternatives The econometric study conducted by the Task Force
observed that the influence between offshore and onshore exchange rate goes both ways in normal
times that is it is bidirectional The study also observed that during the last two stress episodes
(the taper tantrum and the 2018 emerging markets crisis) the relationship turned unidirectional
with the NDF market driving onshore exchange rate The study concludes that as NDF volumes
have increased they have begun to play an important role in both price discovery and driving
volatility particularly during heightened uncertainty period The study also shows that periods of
divergence are limited and the markets converge and that too fairly rapidly
Against this backdrop and in the light of available information results of the statistical analysis
and most importantly based on the feedback received during the various consultations the Task
Force is making following recommendations in accordance with the terms of reference
i Onshore market hours may be suitably extended to match the flexibility provided by the
offshore market and thereby incentivize non-residents to hedge in the onshore market
ii Banks may be allowed to freely offer prices to non-residents at all times out of their Indian
books either by a domestic sales team or by using staff located at overseas branches
11
iii Non-deliverable Rupee derivatives (with settlement in foreign currency) may be allowed
to be traded in the IFSC and IBUs may be allowed to deal in such derivatives with a distinct
FCY-INR position limit To start with exchange traded currency derivatives involving
Rupee may be introduced and with experience non-deliverable OTC currency derivatives
involving Rupee may be allowed subsequently
iv While requirement of underlying exposure will continue for trading in the onshore market
users may be allowed to undertake positions up to USD 100 million in OTC as well as
exchange traded currency derivative market without having to establish the underlying
exposure
v The TF endorses the principle-based regulatory approach adopted in the draft regulation
on hedging by non-residents released by the RBI on February 15 2019 Also back-to-back
hedging by non-residents proposed under these draft regulations is endorsed Further in
case of hedging of anticipated exposures gains from cancellation of contract may be
allowed to be passed on even in cases where there are no cash flows at the discretion of
the bank where the bank considers the cancellation of underlying cash flow is due to
external factors which are beyond the control of the user
vi For ease of entering into hedge transactions for non-residents the TF recommends
a Establishment of a central clearing and settlement mechanism for non-residentsrsquo
deals in the onshore market
b Implementation of margin requirement for non-centrally cleared OTC derivatives
in the onshore market at the earliest
c Allow Indian banks to post margin outside India
d Wider access to FX-Retail trading platform to non-residents
vii A technology-based solution may be explored to centrally aggregate the investments of
non-residents and derivative contracts entered into by them in the onshore market (both
OTC and exchange traded) using LEI or any other unique identifier to start with
viii The issue of taxation in respect of foreign exchange derivative contracts may be examined
with the objective of overcoming gaps between tax regime in India and other major
international financial centres to the extent possible
ix KYC registration may be centralized across the financial market with uniform
documentation requirement
12
Chapter 1
Introduction
Currency is a component of sovereign money which is legal tender issued by the state The
external value of the currency the exchange rate is one of the most important economic and policy
variables which affects economic incentives and activity The exchange rate is determined mostly
by market forces of supply and demand which influence its flows across international borders
The exchange rate has critical information value in guiding financial and economic decisions
which affect real economic variables The stability and predictability of the exchange rate also has
a critical influence on growth and financial stability
Cross-border trade in goods services and assets (or capital) necessitates exchange of one currency
into another and can be thought of as the primary reason why currency markets exist However
as in any other financial market speculative elements ndash who take positions not for settling any
underlying transactions but for benefitting from market movements ndash are important participants
who perform the function of imparting depth to the market The aggregate actions of all
participants ndash hedgers arbitrageurs as well as speculators - determine the value and fluctuation of
the exchange rate
The currency markets for rupee especially for exchange against the USD are fairly well-
developed today One can classify these markets in three categories (a) spot versus derivatives
(b) over-the-counter (OTC) versus exchange-traded and (c) onshore versus offshore Further
derivatives can be cash-settled or delivery-based The most commonly referred benchmark
exchange rate of the rupee is from the onshore spot OTC market Similarly the commonly referred
forward exchange rate of the rupee is from the onshore forward OTC market Rupee futures and
options are traded in some onshore as well as offshore exchanges
The classification of currency markets can also be in terms of the nature of contracts between
buyers and sellers - spot forwards (futures on exchanges) and options contracts A spot contract
is for standard settlement ie the second working day after the date of transaction whereas in
case of forwards and futures (as well as options) the actual exchange or delivery of currency takes
place in the future at a date later than the spot settlement date There are also non-deliverable
forward contracts which are discussed below Forward and futures contracts are used as a risk
management tool or to hedge against possible adverse fluctuation in exchange rates It is important
13
to note that hedging implies risk transfer between the contracting parties it is not elimination of
risk
The category of the currency market that forms the focus of this report is the Offshore Rupee
markets The dominant segment of this market is the Non-Deliverable Forward (NDF) market ndash
wherein foreign exchange forward contracts are traded in the OTC market at offshore locations
generally the International Finance Centres (IFCs) like Singapore Hong Kong London Dubai
and New York These contracts do not involve a physical exchange of Rupees as Rupee is not
deliverable offshore and allow counter-parties to settle profit or loss in a convertible currency
usually the US Dollar which is why it is called a non-deliverable market NDF contracts are
usually traded on currencies which are not readily available to trade globally or outside of
sovereign boundaries These are thus mainly currencies from countries which have partial or no
capital account convertibility
There are also a few exchange-traded offshore rupee markets dealing in rupee futures and options
in Chicago Singapore and Dubai Volumes in these markets have typically been far smaller in
comparison to the offshore NDF OTC market Data on transactions in exchange-traded currency
markets can be ascertained with greater certainty whereas data on transactions in offshore OTC
NDF market have to be gauged through surveys and the estimates on the same are less firm
Why do NDF Markets Exist
NDF markets are not a phenomenon peculiar to the Indian Rupee they are common for currencies
of many emerging market economies (EMEs) As per BIS data NDFs in six currencies ndash Korean
Won Indian Rupee Chinese Renminbi Brazilian Real Taiwanese Dollar and Russian Ruble ndash
account for about two-thirds of the trade in NDFs globally The total daily average volume in NDF
markets is about USD 200 billion as per Bank of International Settlements (BIS) survey1 As per
this survey the share of India was about 1822 per cent of the trade in NDFrsquos globally (see Table
2 Chapter 2) The 2016 BIS survey (the next one will be released in the later part of 2019) showed
that offshore trades in Indian rupee were more or less equal to deliverable onshore forwards
1 2016 Triennial Central Bank Survey of Foreign Exchange and OTC Derivatives Markets
14
around $16 billion daily The 2018 Bank of England reported $23 billion in offshore rupee trades
while RBI sources estimate deliverable daily onshore forwards at $21 billion for 20192
The size of an open economy is one of the primary determinants of international participation in
its currency If international participants do not have direct access to the on-shore currency market
to meet their transaction needs or to hedge their currency exposure they are likely to use the
offshore NDF market The size depth and liquidity of the offshore NDF is thus indicative of the
non-resident interest in an emerging market economy
To some extent the offshore NDF market complements the need for a deep and liquid onshore
currency market What is the appropriate size of the forex market for an emerging market
economy with partially open capital account is determined by its size the share of foreign trade
and appetite for capital flows One proxy for estimating how large the forex market ought to be is
the GDP of the economy A better estimate could be the size of the open economy the trade and
investment sector
As Indiarsquos economy has grown over the past two and a half decades it has seen a significant rise
in openness (ie trade to GDP ratio has grown from 15 in 1990 to 43 in 2018) and in cross
border capital flows This has commensurately raised non-resident interest in the Rupee whether
for risk management purposes or for speculative ends The growing size of the Rupee NDF market
points to a need to widen participation in on-shore markets
The existence and size of offshore NDF markets is also a function of the degree of difficulty that
participants in foreign exchange market (especially non-residents) ndash both speculators and other
participants with requirements arising from cross-border trade transactions ndash face in accessing the
onshore markets The difficulties in accessing onshore currency markets could span a variety of
issues including the following
bull Restrictions on foreign exchange transactions
bull Cumbersome documentation and Know-Your-Customer (KYC) requirements for
participants in the domestic market
bull Restrictions on market participants (especially non-residents) in hedging activities such as
transaction limits tenor limits other documentation etc
bull Restrictions on cancellation and re-booking of contracts
2 For comparison with offshore market the onshore data includes forwards and swaps
15
bull Restrictions on the kind of derivative products that are allowed by market regulators and
bull Inconvenient market hours for those in other time zones
These constraints exist either to curb excessive speculation or to maintain financial stability
Are Offshore Rupee Markets a Problem
When the offshore market volume is significant or larger than the onshore currency market
volume as is the case with many EME currencies it leads to two fragmented markets wherein the
price discovery on the onshore market becomes vulnerable to influences from the price discovery
in the offshore market Empirical evidence (see Chapter 3) shows that while at most times the
direction of the influence runs both ways ie from onshore market to offshore market and vice-
versa the direction of the influence is more dominant from offshore market to the onshore market
in times of high volatility This could happen especially when tidal forces from global financial
markets influence the currency markets in a synchronised manner such as during times of
Emerging Markets (EM) currency crises
There are essentially four issues with regard to offshore market that are critical for regulators ndash
i Effectiveness of exchange rate management Many central banks including the Reserve
Bank have exchange rate stability as one of their objectives and resort to market
intervention or other regulatory measures to control volatility of the exchange rate from
time to time Such influence however extends only to the onshore currency market
Presence of a large offshore market dilutes the effectiveness of the exchange rate
management by the central bank It also hinders the pursuit of the objective of financial
stability in the domestic market
ii Disjointed price discovery During periods of volatility in the currency market when
price discovery in the offshore market causes large movements in onshore currency
markets the onshore market could often open with a large gap over the previous close For
resident market participants who want to cover their positions such gaps expose them to
significant risk
iii Revenue loss Every unit of turnover in a market earns a certain revenue for the market-
making financial firms Thus turnover in the offshore market can be viewed as a potential
revenue loss for domestic financial firms and the domestic economy
16
iv Effectiveness of RBI regulations on capital account management RBIrsquos policies on
capital account have been geared towards managing the impossible trinity a ldquomanagedrdquo
exchange rate free capital movement and an independent monetary policy RBI policies
have been geared toward avoidance of undue volatility in foreign exchange markets by
having restrictions on cancellation and rebooking and excessive risk-taking by resident
entities including corporates With this objective RBI restricts participation of resident
entities in currency derivatives to the extent of their underlying exposures A large market
outside the influence of regulatory authorities undermines their effectiveness
Constitution of the Task Force
Against this backdrop it was announced in the Statement on Developmental and Regulatory Policy
dated February 7 2019 the setting up of a Task Force on Offshore Rupee Markets Accordingly
a Task Force headed by Smt Usha Thorat was constituted with following terms of reference
i Assess the causes behind the development of the offshore Rupee market
ii Study the effects of the offshore markets on the Rupee exchange rate and market liquidity
in the domestic market
iii Recommend measures to address concerns if any arising out of offshore Rupee trading
iv Propose measures to generate incentives for non-residents to access the domestic market
v Examine the role if any International Financial Services Centre (IFSC) can play in
addressing these concerns
vi Any other relevant issue(s) the Task Force considers relevant to the context
The Task Force comprises of the following
i Smt Usha Thorat former Deputy Governor Reserve Bank of India ndash Chairperson
ii Shri Anand Bajaj Joint Secretary Department of Economic Affairs Ministry of Finance
Government of India ndash Member
iii Shri G Mahalingam Whole Time Director Securities amp Exchange Board of India ndash
Member
iv Shri Ajit Ranade Chief Economist of the Aditya Birla Group ndash Member
v Shri Sajjid Chinoy Chief Economist India JP Morgan India ndash Member
17
vi Shri Surendra Rosha CEO India HSBC Bank ndash Member
vii Shri Rajiv Ranjan Adviser-in-charge Department of Economic Policy and Research
Reserve Bank of India ndash Member
viii Shri T Rabi Sankar Chief General Manager Financial Markets Regulation Department
Reserve Bank of India ndash Member Secretary
Approach of the Task Force
Among the different issues relating to offshore markets the argument concerning revenue loss is
perhaps the most simplistic and an obvious response could be for India to develop non-deliverable
Rupee derivative market in an International Finance Service Centre (such as the GIFT City) located
within the geographical boundary of India However such a market will be virtually no different
from the markets located in Singapore or London and hence the objective of bringing volumes to
the onshore market will remain unaddressed
From the standpoint of addressing the concerns arising out of the existence of large offshore
markets it would make sense to incentivise movement of as much currency market transactions
from such markets to onshore currency markets as possible However theoretically one needs to
recognise that there is a trade-off between the sizeprominence of the offshore market and the
extent of regulationsrestrictions that are placed on cross-border transactions and foreign exchange
marketsparticipants It is also important to note that even if all non-residents with underlying
exposure move their hedging transactions to onshore markets offshore markets would continue to
exist to meet the demand of participants who take a view on the exchange rate without any
underlying exposure ie the speculative demand
At one extreme of the above-mentioned trade-off if India opts for a full rupee convertibility ndash by
removing all restrictions on current and capital account transactions ndash along with removal of all
restrictions on currency derivatives then offshore markets would no longer be a relevant concept
Capital account convertibility has been a hotly debated issue in the discourse on public policy both
in India and globally The received consensus in the last couple of decades endorsed by the
International Monetary Fund (IMF) in 2012 is that while capital flows are an important aspect of
the international monetary system providing significant benefits for countries they also carry risks
for macroeconomic and financial stability especially if they are large and volatile and thus pose
a challenge for policy Hence capital flows management measures are justified to help harness the
18
benefits while managing the risks More generally some restrictions to the capital account are
necessary for India to avoid the ldquoimpossible trinityrdquo With an economy as large and diverse as
Indiarsquos which is therefore expectedly not completely synchronous to the global cycle retaining
the independence of monetary policy is imperative Similarly having some control over the
exchange rate is necessary given its occasional propensity to be excessively volatile and overshoot
with attendant feedback loops to the macro-economy Therefore capital flow management
measures become necessary to avoid the trilemma and ensure simultaneous fulfilment of the other
two objectives Based on this received consensus as well as the experiences of some emerging
market economies through the last two decades the Task Force has proceeded on the basis that
the existing framework of capital account management followed by the Government and the RBI
will continue
There is also the issue of de-jure capital account convertibility Even when speculators
arbitrageurs and traders do not have direct access to forex markets to exploit persistent interest rate
differentials or perceived mispricing of the currency there are alternative channels available in
the system which make the actual arbitrage opportunities much lower Some examples of such
instruments is the Overnight Indexed Swaps (OIS) market or the use of Mumbai Interbank
Forward Offer Rate (MIFOR) Hence the de-jure level of capital account convertibility (CAC)
could be much higher than implied by the existence of capital controls
A related issue is the internationalisation of rupee According to McCauley (2011) a currency is
internationalised when market participants ndash residents and non-residents alike ndash conveniently use
it to trade invest borrow and invoice in it Based on the experience of China to internationalise
Renminbi and the evidence of the narrowing of the gap between onshore forward rate and NDF
rates for Renminbi internationalisation of currency has been sometimes advocated as a way to
reduce the influence of offshore markets While one has witnessed issuance of rupee-denominated
bonds (ldquoMasala Bondsrdquo) in some offshore markets in the recent past internationalisation of rupee
is still a distant goalpost given the persistent current account deficit and the negative net
international debt position Thus internationalisation of rupee is not an explicit goal guiding the
recommendations of the Task Force
Further the Task Force believes that Indiarsquos approach to the trade-off between deregulation of
currency markets and tolerance of offshore market must be shaped by the specific considerations
of the Indian economy rather than following any global template blindly
19
Compared to countries like Korea Taiwan or China Indiarsquos macroeconomic structure is
significantly different India is a structurally an economy with twin deficits ndash both fiscal and
current account Nearly half of Indiarsquos consumer price index (CPI) basket comprises of food items
making Indiarsquos inflation more vulnerable to supply shocks Although Indiarsquos macroeconomic
stability has improved considerably in the last few years considering the above factors the Task
Force feels that India cannot risk macroeconomic instability through potential exchange rate
shocks by drastically lifting the restrictions on foreign exchange markets and participants
On the other hand large volumes in the offshore market also reflect the fact that the interest in
Rupee is far larger than what is evident in onshore currency markets This reflects the growing size
of the Indian economy greater role of India in the global economy and growth in trade and capital
flows Over time therefore it would be imperative for the Indian regulators to take steps to expand
the role of onshore currency markets gradually lest the disjointed price discovery issue flares up
more frequently and in larger degrees
The balanced approach of the Task Force therefore is to look at each of the difficulties faced by
market participants in accessing onshore currency markets and prioritise their resolution in such a
way that prudent regulatory considerations are least compromised For instance certain market
micro-structure issues (such as extending the market hours of onshore currency markets) can be
addressed relatively quickly without any regulatory compromise On issues related to
documentation and KYC requirements smart application of ease-of-doing-business principles
needs to be followed Economic entities which need to undertake hedging of their foreign exchange
exposure on account of genuine underlying exposures need to be given greater flexibility in
undertaking such transactions in domestic currency markets While the need for underlying
exposure in order to operate in the forward markets cannot be eliminated the way in which it is
evidenced and monitored can be simplified The Task Force has proceeded on the basis of the
existing principles of regulations of foreign exchange markets
Of course the Task Force recognises that the recommendations will not do away with the
economic imperatives for which trading of rupee forward contracts exists in offshore markets
With our recommendations the Task Force believes that regulatory concerns arising out of the
offshore markets can be reduced though not eliminated
The Task Force held nine meetings between March 2019 and July 2019 The details of the meetings
are given in Annex V
20
Chapter 2
The Evolution of NDF Markets and Cross-country Experience
The foreign exchange market in India during 1970s and 1980s was heavily controlled and closed
in nature with various kinds of restrictions in place The Indian foreign exchange market started
deepening with the transition to a market-determined exchange rate system in March 1993 and the
subsequent liberalisation of restrictions on various external transactions leading up to current
account convertibility under Article VIII of the Articles of Agreement of the International
Monetary Fund in 1994 Notwithstanding various measures taken to further deepen and broaden
the foreign exchange market in India various restrictions are still in place to limit market access
to only those with underlying exposure and prevent undue speculation As India gets increasingly
integrated with the global markets and the exchange rate is increasingly market determined a
combination of capital flows management measures and currency trading restrictions in the on
shore markets are used to manage the lsquoimpossible trinityrsquo external value of the rupee These
measures and restriction are under constant review to ensure that the overall objective of growth
through foreign trade and investment are served
Against this backdrop this chapter attempts to highlights evolution in section II a brief review of
literature on the reasons behind increase in turnover in NDF market in Asian countries has been
given in Section III Section IV highlights the developments in NDF market The country
experiences such as nature of restrictions on non-residents operating in domestic currency
forwards market liberalisation measures taken by countries and its impact in curbing offshore
market discussed in Section V
I Introduction
NDFs are foreign exchange derivative instruments on non-convertible or restricted currencies
traded over the counter (OTC) mainly at offshore centres ie outside the direct jurisdiction of the
respective national authorities It is essentially a forward contract with different settlement process
Unlike the standard forward contract which involves exchange of underlying currencies on
maturity the NDF contract is typically settled as the difference between an exchange rate agreed
months before and the actual spot rate at maturity in an international currency (deliverable) mainly
the US dollars And the other currency which is usually emerging market currency is non-
21
deliverable The settlement of the transaction is not by delivering the underlying pair of currencies
but by making a net payment in a convertible currency equal to the difference between the agreed
forward exchange rate and the subsequent spot rate (Ma et al 2004) NDF contracts can either be
traded over the counter market or at exchanges at offshore financial centres such as Hong Kong
Singapore and London Lately they have become popular derivative instruments catering to the
offshore investorsrsquo demand for hedging arbitraging and speculating including by those who look
upon currency as an asset class
The major participants in NDF market could include foreign businesses and investors doing
business in countries with complex requirements for hedging currency risk in the local markets
arbitragers who have access to both on shore and offshore markets pure speculators like hedge
funds and others who take positions in the NDF market While these are the end users there are
also market intermediaries like banks dealers and brokers who provide quotes for trading in these
currencies and custodians who provide settlement arrangements While the multinational
companies deal in both the long and short end of the market the short end of the market is
particularly dominated by the hedge funds (Misra and Behera 2006) The pricing is influenced by
a combination of factors such as interest rate differential between the two currencies supply and
demand future spot expectations foreign exchange regime and central bank policies
NDF market primarily evolved in response to under-developed onshore forward markets and
limited access to non-residents to currencies with foreign exchange convertibility restrictions An
important advantage that enhances the demand for NDF is reduced credit risk compared to onshore
counterparts since there is no exchange of principal and only the difference amount is settled thus
allowing investors to circumvent limits associated with onshore activity Other reasons which also
favoured the emergence of NDF market includes convenience of time zones location of customer
business operating from a global treasury for multinational companies short-trading hours in
onshore forex market capital controls by individual central banks position limits frictions like
registration norms and know your customer norms frequent and significant changes in regulations
and guidelines in the domestic exchanges and OTC markets Moreover credit risk is also less
relevant since mostly large foreign banks are engaged as a counterparty in NDF trading Further
offshore centres in some cases are better placed to offer competitive services compared to the
22
onshore market on account of various factors ranging from tax treatment less onerous regulations
and documentation to operational efficiency
II Evolution of NDF Markets
The origin of NDF market traces back to the 1990s when a wave of capital account liberalisation
in emerging market economies (EMEs) triggered surge in capital inflows to these economies and
consequently increased currency risk faced by the investors However under-developed domestic
forward market or restricted access to onshore forward market paved the way for evolution of NDF
market as an alternative hedging tool to these investors The widely shared concern amongst local
monetary authorities was that easy access to onshore market and availability of domestic currency
to non-residents will encourage speculative activity leading to greater exchange rate volatility and
eventually the loss of monetary control Consequently some international banks began offering
NDF contracts to meet the demand of investors willing to hedge their EM currencies exposure
during early 1990s (Higgins and Humpage 2005)
One of the earliest NDF market developed during early 1990s was in Mexican peso to speculate
on the currency ahead of the devaluation from its then fixed exchange rate against the US Dollar
The increase in trading turnover during that time was facilitated by the entrance of voice brokers
as intermediaries between inter-bank trading activities (Lipscomb 2005) The NDF market for
some Asian economies like Korean Won Taiwanese Dollar Indian rupee and Chinese Renminbi
existed since mid-1990s due to either restricted or no access to onshore forward markets by non-
residents (BIS 2004) In case of New Taiwan Dollar only onshore entities had access to onshore
markets while it was subjected to underlying requirements in case of Korean Won Indian rupee
and Chinese Renminbi For other currencies like Indonesian rupiah NDF market evolved after
the Asian financial crisis in response to re-imposition of capital restrictions which were liberalised
in early 1990s In Indonesia rapid liberalisation beginning as early as 1970s and further
internalisation of Indonesia rupiah enabled the development of deliverable offshore market for
rupiah Following the currency crisis initial measures were directed at curbing non-trade and
investment related forward transactions with non-residents and broader measures prohibiting
banks from extending loans conducting derivative transactions and transferring rupiah to non-
residents were introduced in early 2001 While Malaysia also imposed cross border restrictions
23
after the crisis evolution of NDF market in Ringgit was initially inhibited by comprehensiveness
of regulations as well as its effective enforcement by the authorities (Ishii 2001)
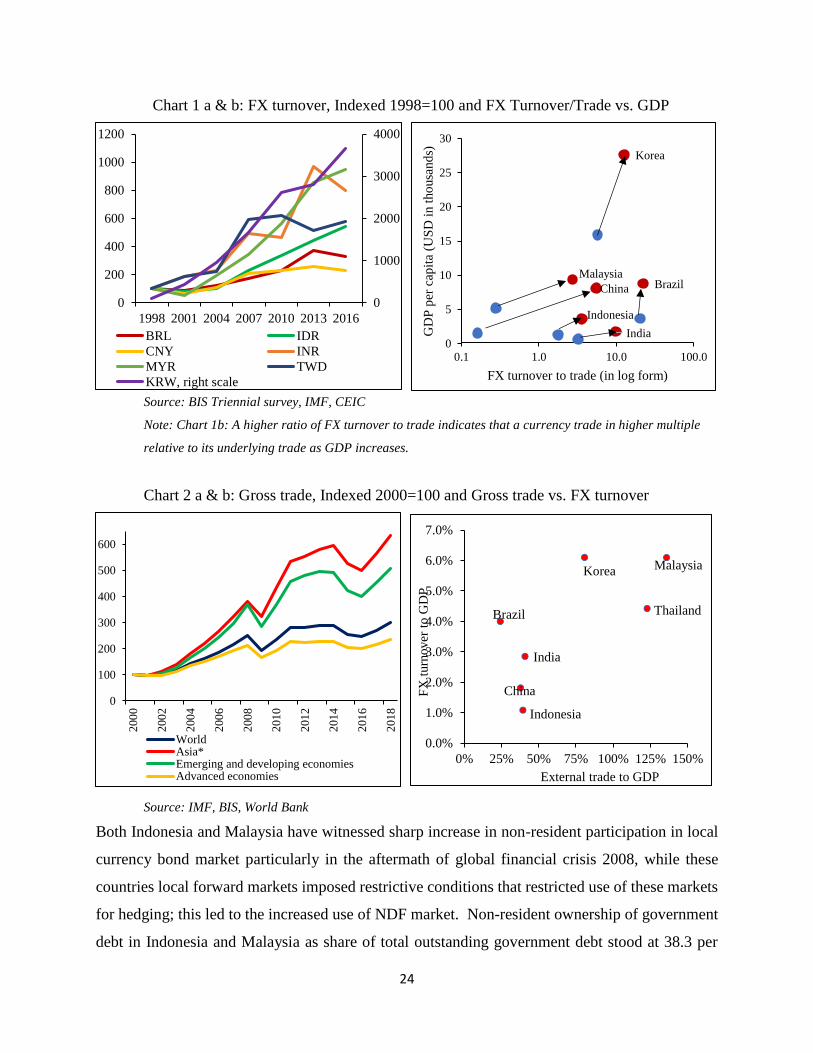
McCauley (2011) showed that as income per capita rises a currency trades in ever greater
multiples of the home economyrsquos underlying international trade (ldquofinancialisationrdquo) and trades to
an even greater extent outside its home market (ldquointernationalisationrdquo) The increasing economic
interest in emerging market economies as a result of upbeat growth scenario from 2000s spurred
greater participation in currencies of these economies (Chart 1) In this context increasing turnover
in the Indian rupee Chinese Renminbi and other Asian currencies like Indonesian rupiah
Malaysian Ringgit Korean Won and New Taiwanese Dollar is consistent with increased
investment in these economies amidst restricted access to onshore markets Both India and China
recorded phenomenal growth rates translating into increased businesses (trade and investments)
with rest of the world and resulting exposures facilitated offshore trading of their currencies (Chart
2 a amp b) During 1990s mostly non-residents with genuine exposure used NDF market to hedge
their exposures in Indian rupee However with the development of onshore market providing
reasonable hedging facilities to foreign investors amidst gradual relaxation of controls most of the
market activity seems to be driven by speculators and arbitrageurs and those who are looking at
the rupee as a separate asset class to diversify their portfolios in view of its growing international
importance As a result the size of NDF market has grown over time In the Chinarsquos case the
emergence of offshore deliverables market for Renminbi (CNH) since 2010 was mainly due to
internationalisation of Renminbi which gradually substituted the NDF market
24
Chart 1 a amp b FX turnover Indexed 1998=100 and FX TurnoverTrade vs GDP
Source BIS Triennial survey IMF CEIC
Note Chart 1b A higher ratio of FX turnover to trade indicates that a currency trade in higher multiple
relative to its underlying trade as GDP increases
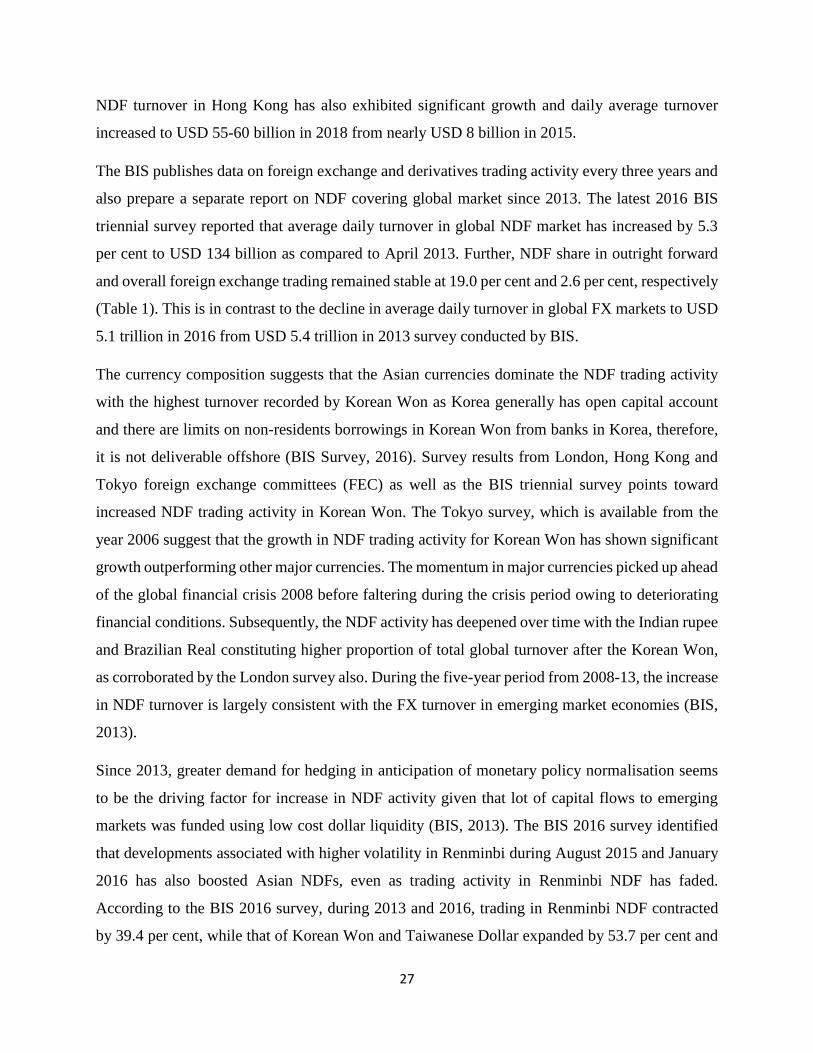
Chart 2 a amp b Gross trade Indexed 2000=100 and Gross trade vs FX turnover
Source IMF BIS World Bank
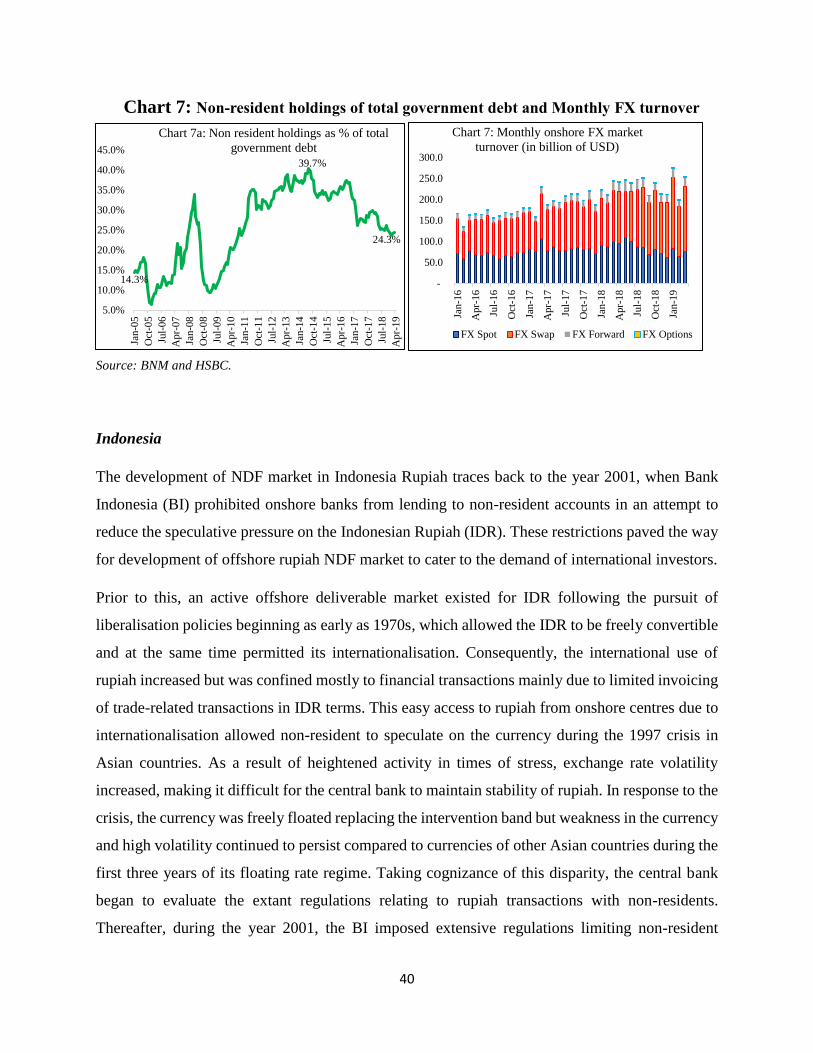
Both Indonesia and Malaysia have witnessed sharp increase in non-resident participation in local
currency bond market particularly in the aftermath of global financial crisis 2008 while these
countries local forward markets imposed restrictive conditions that restricted use of these markets
for hedging this led to the increased use of NDF market Non-resident ownership of government
debt in Indonesia and Malaysia as share of total outstanding government debt stood at 383 per
0
100
200
300
400
500
600
200
0
200
2
200
4
200
6
200
8
201
0
201
2
201
4
201
6
201
8
WorldAsiaEmerging and developing economiesAdvanced economies
0
1000
2000
3000
4000
0
200
400
600
800
1000
1200
1998 2001 2004 2007 2010 2013 2016
BRL IDR
CNY INR
MYR TWD
KRW right scale
Brazil
Korea
Indonesia
China
India
Malaysia
0
5
10
15
20
25
30
01 10 100 1000
GD
P p
er c
apit
a (U
SD
in t
ho
usa
nd
s)
FX turnover to trade (in log form)
Brazil
China
Indonesia
India
Korea Malaysia
Thailand
00
10
20
30
40
50
60
70
0 25 50 75 100 125 150
FX
turn
over
to
GD
P
External trade to GDP
25
cent and 243 per cent as at the end of March 2019 respectively highest amongst other Asian
economies However foreign participation in equity market is higher for Korea and Taiwan While
Taiwan has limits on investments in domestic bonds by non-residents foreign investors are not
subject to any investment ceiling for both aggregate and individual holdings in a listed company
except for a few restricted industries
Additionally the reason for growing NDF market could be increased carry trade activities for high
yielding currencies After examining the returns of carry trades with deliverable and non-
deliverable forwards Doukas and Zhang (2013) found that carry trades for currencies with NDF
contracts perform better compared to carry trades for currencies with deliverable forward
contracts This excess return is attributed to the compensation of risks emanating from currency
convertibility and capital controls For the Brazilian Real (BRL) derivatives offshore NDFs in
particular are the main vehicle for investors looking to implement carry trades (BIS Santaelaa
2015)
NDF market evolved mainly for emerging market economies witnessing increased economic
interest in the process of transition to high growth phase since 1990s whilst restrictions persisted
in accessing onshore markets for hedging currency risk arising out of these exposures The NDF
market also provided an opportunity to speculate on currencies which underwent notable shift in
their exchange rate regime During periods of global uncertainties like in 2013 during ldquotaper
tantrumrdquo the NDF market is used for speculative purposes arguably causing disruptions in
domestic forex market
III Size of the NDF market
Given that NDF is an over the counter (OTC) traded instrument the turnover data relies on various
surveys conducted by institutions at different time intervals In view of this issues like
comparability and continuity in data often arises However these surveys still provide useful
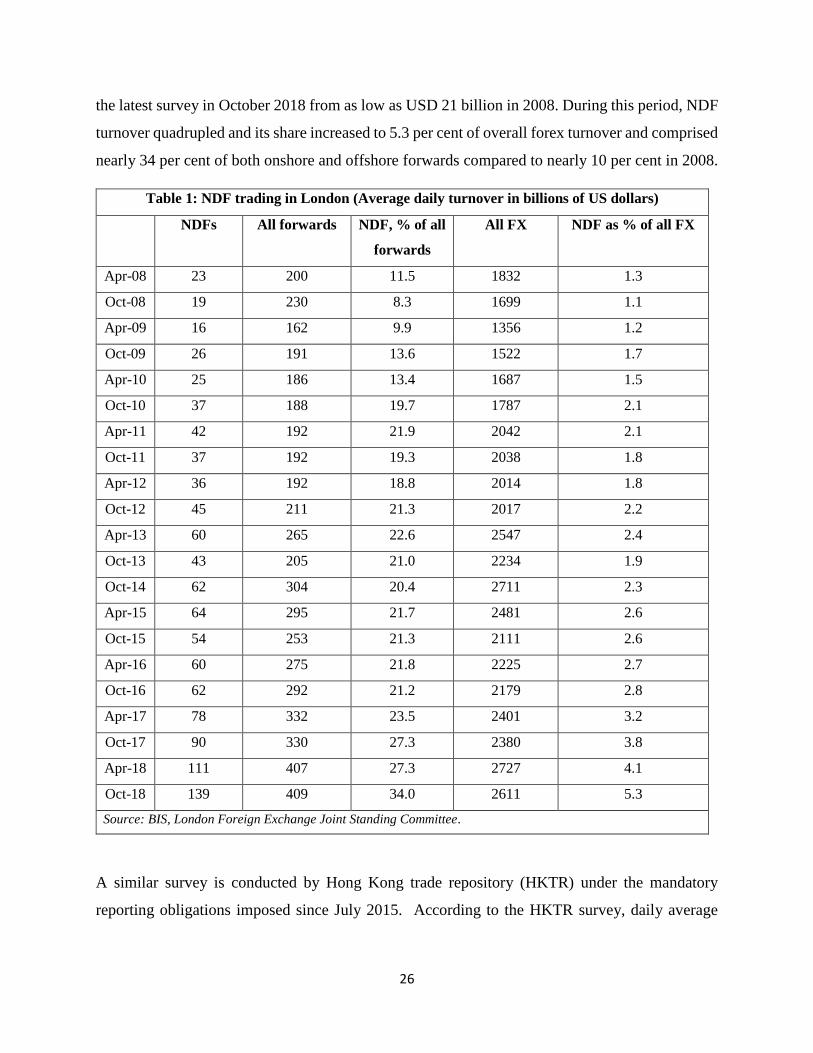
information to gauge the growth of NDF market over time Results from the semi-annual turnover
survey for the Foreign Exchange Joint Standing Committee chaired by Bank of England (BoE)
suggests that growth of NDF market has outpaced the forward market as well as overall foreign
exchange market In London the average daily NDF turnover surged to USD 139 billion as per
26
the latest survey in October 2018 from as low as USD 21 billion in 2008 During this period NDF
turnover quadrupled and its share increased to 53 per cent of overall forex turnover and comprised
nearly 34 per cent of both onshore and offshore forwards compared to nearly 10 per cent in 2008
Table 1 NDF trading in London (Average daily turnover in billions of US dollars)
NDFs All forwards NDF of all
forwards
All FX NDF as of all FX
Apr-08 23 200 115 1832 13
Oct-08 19 230 83 1699 11
Apr-09 16 162 99 1356 12
Oct-09 26 191 136 1522 17
Apr-10 25 186 134 1687 15
Oct-10 37 188 197 1787 21
Apr-11 42 192 219 2042 21
Oct-11 37 192 193 2038 18
Apr-12 36 192 188 2014 18
Oct-12 45 211 213 2017 22
Apr-13 60 265 226 2547 24
Oct-13 43 205 210 2234 19
Oct-14 62 304 204 2711 23
Apr-15 64 295 217 2481 26
Oct-15 54 253 213 2111 26
Apr-16 60 275 218 2225 27
Oct-16 62 292 212 2179 28
Apr-17 78 332 235 2401 32
Oct-17 90 330 273 2380 38
Apr-18 111 407 273 2727 41
Oct-18 139 409 340 2611 53
Source BIS London Foreign Exchange Joint Standing Committee
A similar survey is conducted by Hong Kong trade repository (HKTR) under the mandatory
reporting obligations imposed since July 2015 According to the HKTR survey daily average
27
NDF turnover in Hong Kong has also exhibited significant growth and daily average turnover
increased to USD 55-60 billion in 2018 from nearly USD 8 billion in 2015
The BIS publishes data on foreign exchange and derivatives trading activity every three years and
also prepare a separate report on NDF covering global market since 2013 The latest 2016 BIS
triennial survey reported that average daily turnover in global NDF market has increased by 53
per cent to USD 134 billion as compared to April 2013 Further NDF share in outright forward
and overall foreign exchange trading remained stable at 190 per cent and 26 per cent respectively
(Table 1) This is in contrast to the decline in average daily turnover in global FX markets to USD
51 trillion in 2016 from USD 54 trillion in 2013 survey conducted by BIS
The currency composition suggests that the Asian currencies dominate the NDF trading activity
with the highest turnover recorded by Korean Won as Korea generally has open capital account
and there are limits on non-residents borrowings in Korean Won from banks in Korea therefore
it is not deliverable offshore (BIS Survey 2016) Survey results from London Hong Kong and
Tokyo foreign exchange committees (FEC) as well as the BIS triennial survey points toward
increased NDF trading activity in Korean Won The Tokyo survey which is available from the
year 2006 suggest that the growth in NDF trading activity for Korean Won has shown significant
growth outperforming other major currencies The momentum in major currencies picked up ahead
of the global financial crisis 2008 before faltering during the crisis period owing to deteriorating
financial conditions Subsequently the NDF activity has deepened over time with the Indian rupee
and Brazilian Real constituting higher proportion of total global turnover after the Korean Won
as corroborated by the London survey also During the five-year period from 2008-13 the increase
in NDF turnover is largely consistent with the FX turnover in emerging market economies (BIS
2013)
Since 2013 greater demand for hedging in anticipation of monetary policy normalisation seems
to be the driving factor for increase in NDF activity given that lot of capital flows to emerging
markets was funded using low cost dollar liquidity (BIS 2013) The BIS 2016 survey identified
that developments associated with higher volatility in Renminbi during August 2015 and January
2016 has also boosted Asian NDFs even as trading activity in Renminbi NDF has faded
According to the BIS 2016 survey during 2013 and 2016 trading in Renminbi NDF contracted
by 394 per cent while that of Korean Won and Taiwanese Dollar expanded by 537 per cent and
28
299 per cent respectively The decline in the NDF activity for Indian rupee reflects the
depreciation of rupee against the US dollar however daily average turnover was up by 167 per
cent between 2013 and 2016 in unadjusted terms Hong Kong (HKTR) survey indicates continued
decline in NDF activity for Chinese Renminbi and Malaysian Ringgit (Table 2 and Chart 2 a amp b)
In case of China this was due to the Renminbi internationalisation policy followed after 2011
Table 2 Daily average turnover (USD billion) Spread
BIS 2013 BIS 2016
Oct- 2018
(London Survey) Bid-Ask (Latest)
NDF DF NDF DF NDF
DF
(Latest) Onshore Offshore
Chinese Renminbi 171 24 104 281 88 650 0001-0002 0003-0005
Indian Rupee 172 31 164 163 2303 214 001 002
Korean Won 196 11 301 145 295 300 010 030
Taiwanese Dollar 89 02 115 78 - 193 0005-0010 0010-0020
Brazilian Real 159 27 187 30 154 - - -
Russian Ruble 41 05 29 186 40 - - -
Source BIS London FEC BoK RBI China Foreign Exchange Trading Center Central bank of Taiwan HSBC
Note
1 DF= Deliverable forwards and include forwards and FX swaps traded onshore
2 Chinese Renminbi volumes on offshore segment are negligible after development of CNH market
3 BIS DF and DF (latest) are not directly comparable since latest numbers are taken from country sources
Chinese Yuan is for Jun-19 Indian rupee and Taiwanese Dollar is for Apr-19 Korean Won is for 2017
Chart 2 Average Daily Turnover and Change in Forex position of Asian Currencies
3 The corresponding figure for April 2019 stood at USD 28billion
0
100
200
300
400
500
US
DC
NY
US
DI
DR
US
DI
NR
US
DK
RW
US
DM
YR
US
DT
WD
Chart 2b Change in FX position of Asian
currencies (in USD billion)
29 January 2016 27 January 2017
31 January 2018 25 January 2019
0
200
400
600
800
1000
1200
Apr-
06
Apr-
07
Apr-
08
Apr-
09
Apr-
10
Apr-
11
Apr-
12
Apr-
13
Apr-
14
Apr-
15
Apr-
16
Apr-
17
Apr-
18
Chart 2a Average daily turnover USD
million
CNY INR IDR KRW
MYR TWD BRL
29
Source Tokyo FEC Hong Kong FEC
Based on latest surveys conducted by London and Hong Kong FEC which are major offshore
centres clearly it showed that the global NDF activity has surged led by Korean Won Indian
rupee Brazilian Real and Taiwanese Dollar The trend is likely to be validated by BIS 2019 survey
which encompasses global turnover and is due to release later this year
IV Review of Literature
In view of the noticeable rise in NDF activity with potential to engender distortions in local market
there exist varied literature on the emergence of NDF market and its spill-overs to onshore
counterparts One of the earliest attempts was made by Park (2001) which investigated the impact
of financial deregulation on relationship between onshore and offshore prices A key finding was
that Korean Won NDF influenced onshore prices after a shift to floating exchange rate regime
coupled with liberalisation of capital controls As part of liberalisation measures following the
Asian financial crisis in 1997 excessive regulations pertaining to foreign exchange market were
removed and measures were undertaken to improve efficiency of market by increasing liquidity
and broadening participation base (Chung et al 2000) Amongst these measures onshore entities
were allowed to participate in offshore market In this regard Lipscomb (2005) suggested that
transition to a more convertible exchange rate regime and permissible participation of onshore
counterparties in NDF transactions contributed to the increase in offshore liquidity which begets
liquidity in domestic market as well A classic example is Korean Won where both onshore and
offshore market co-exist with arbitrage opportunity exploiting any incipient price discrepancy
However NDF markets tend to disappear as the currency becomes fully convertible as stated
earlier
Wang et al (2007) also corroborated the finding that NDF market seems to be the driver for the
domestic spot market of Korean Won while the information flow is reverse for Taiwanese Dollar
where the spot market was found to have influence on NDF market Adding to this literature
Colaveccchio and Funke (2008) found Renminbi NDF to be the key driver of Asian currency
markets with varied degree of heterogeneity contingent on real and financial inter-linkages
Amongst the country specific study the one by Cadarajat and Lubis (2012) demonstrated that
Indonesia rupiah NDF tends to have influence on domestic spot and forward return
30
Studies by Hutchison (2009) Mihajek and Packer (2010) and McCauley and Scatigna (2011)
asserted that offshore trading becomes increasingly important with growing economic interest in
a particular currency amidst limited access to onshore markets and convertibility restrictions A
study by BIS (2013) analysed the directional impact for nine currencies including the Indian rupee
for the period 2005-13 along with separate analysis for 2008-09 crisis and May-August 2013 It
found the presence of two way causation for most currencies for the full sample period however
noted the increase in NDF influence during market stress Both the stress period saw noticeable
impact of NDF particularly during May-August 2013 with major exception of Malaysian Ringgit
where NDF played dominant role and there was no case of deliverable forward influencing NDF
In the Indian context the earliest study with regard to spill-overs impact was undertaken by Misra
and Behera (2006) They found onshore prices to have directional impact on NDF prices even as
volatility spillovers could exist from NDF to onshore market The subsequent research on this
subject during the period 2000-09 by Behera (2011) demonstrated the change in dynamics with
evidence of greater volatility spillover from NDF to spot market A similar finding was outlined
by Guru (2009) on the relationship between the NDF and onshore market for Indian rupee It is
argued that dynamics of relationship between onshore and offshore markets has undergone a
change with the introduction of the currency future market in 2008 and returns in NDF market
seem to be influencing the domestic spot as well as forward market
A study by Darbha (2012) finds that offshore markets plays an important role in price discovery
mechanism particularly in India and China Goyal et al (2013) after examining the period 2006-
13 found the existence of bi-directional relationship between onshore and NDF market for Indian
rupee over the long term however the directional impact turns one way from NDF to onshore
during periods of depreciating pressures ie movements in NDF markets drives adjustment in
onshore market when the currency is under depreciation pressures This asymmetric behaviour is
attributed to the fact that the Reserve bank intervenes in the foreign exchange market to stem
excessive volatility during periods of rupee depreciation
McCauley et al (2014) described two paths for evolution of the NDF markets The first one is
being followed by Chinese Renminbi which has become deliverable after the emergence of
offshore market The Indian rupee falls under the second where the NDF market has grown amidst
continued restrictions on foreign participation
31
The report of the Standing Council (Standing Council on International Competitiveness of the
Indian Financial System 2015 by Ministry of Finance Government of India enumerated factors
including capital controls position limits frictions like registration norms and know your customer
norms frequent and significant changes in regulations and guidelines in the domestic exchanges
and OTC markets as deterrent to foreign investors participation in the onshore market
IGIDR Finance Research Group (2016) made an important recommendation that domestic entities
should be permitted to participate in NDF market after outlining factors driving offshore activity
compared to onshore segment In respect of the internationalisation of rupee as one of the debated
recommendation Kumar and Patnaik (2018) argued the case for gradual internationalisation of
rupee on analysing the role of the Indian rupee in terms of official sector currency reserve currency
and trade invoicing currency
V Country Experience
China
The Chinese Renminbi (RMB) forward market can be segmented into offshore NDF market (since
1990s) an onshore Renminbi market (since 2007) and the CNH market (offshore deliverable) In
the current scenario RMB NDF has been gradually replaced by offshore deliverables after the
creation of CNH market since mid- 2010 as a by-product of promotion of international role of
RMB since 2009
Chinarsquos exchange rate regime has evolved from fixed to managed floating rates followed by
internationalisation of Renminbi (RMB) In early 1990s reforms started with the unification of
multiple exchange rate in 1994 and in 1996 China allowed the full convertibility of Yuan under
current account transactions Eventually the Peoplersquos Bank of China (PBoC) announced the
implementation of managed floating exchange rate against basket of currencies in July 2005
ending the dollar peg prevalent since 1994 Over the last decade Chinarsquos strong economic
performance and growing linkages with rest of the world prompted authorities to promote the
international role of RMB The idea of internationalisation of RMB gained prominence following
the financial crisis of 2008 which revealed the fragilities of dollar dominated global financial
system The thrust of early initiatives was RMB trade settlement premised on Chinarsquos deeper trade
32
links and its central role within Asiarsquos supply chain that supported the demand for its currency for
trade invoicing In this regard a pilot scheme permitting cross border trade settlement in RMB was
launched in 2009 which was widened to cover all current account transactions over the course of
next three years Capital account liberalisation was undertaken at a more gradual pace with the
Chinese RMB becoming officially deliverable at offshore centres in 2010 While Hong Kong
banks were permitted to accept RMB deposits as part of personal accounts in 2004 an important
milestone was the sign of Memorandum of cooperation between HKMA and PBoC in July 2010
which eliminated restrictions on Hong Kong banks in establishing Renminbi accounts and
providing related services ie payments and transfers in RMB to individuals and corporations
Moreover financial institutions were permitted to offer Yuan denominated products As a result
CNH (offshore Renminbi) began to trade actively amongst other range of products and prompted
investors to switch to deliverable market in place of NDF which was used previously Whilst CNH
can be transferred freely between offshore accounts transfer of RMB between onshore and
offshore is still confined to regulated channels to fend off potential adverse impact on onshore
markets Moreover these restrictions are skewed towards outflows form the mainland to offshore
centres
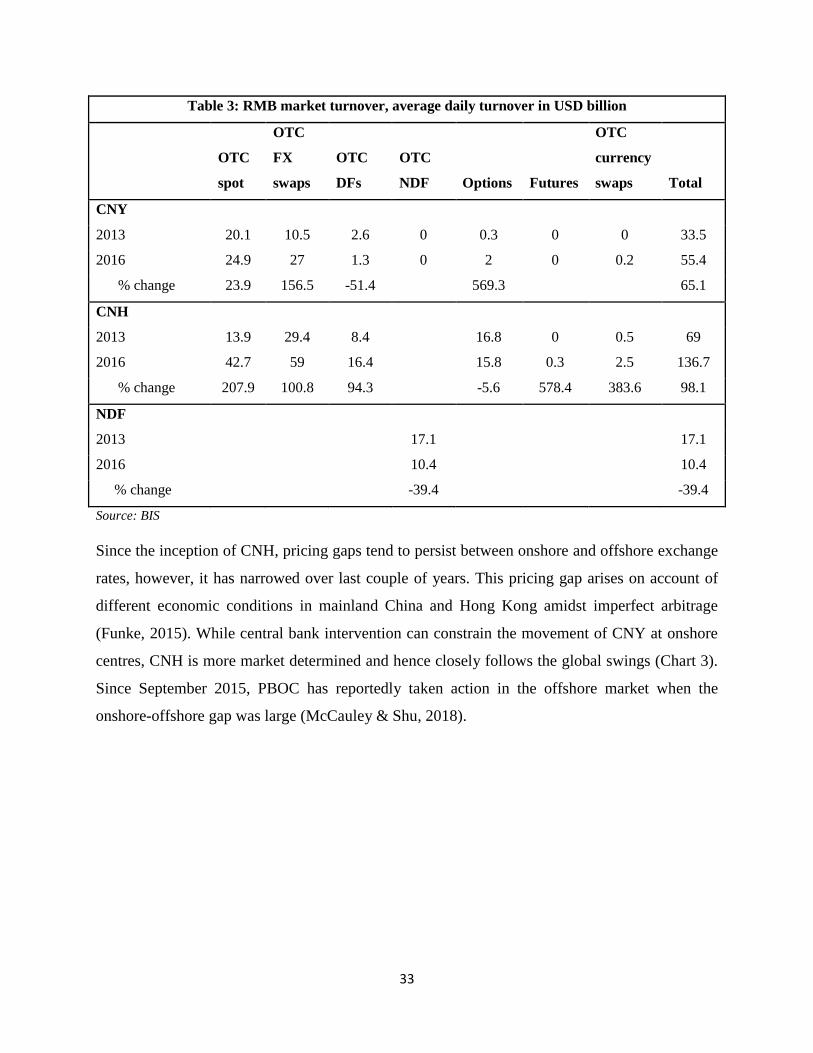
With Renminbi internationalisation the offshore CNH market has shown exponential growth
displacing the NDFs The BIS Triennial Survey showed significant decline in RMB NDF which
fell nearly 40 per cent between 2013 and 2016 driving its share in total RMB trading to 5 per cent
from 14 per cent earlier (BIS 2016) The rapid expansion of offshore market is clearly discernible
in rising FX turnover for CNH which has nearly doubled between 2013 and 2016 and forms around
67 per cent of the total RMB turnover Of the total CNH turnover average daily turnover in the
DFs in April 2016 was estimated to increase to USD 164 billion from USD 84 billion in 2013
(Table 3)
33
Table 3 RMB market turnover average daily turnover in USD billion
OTC
spot
OTC
FX
swaps
OTC
DFs
OTC
NDF Options Futures
OTC
currency
swaps Total
CNY
2013 201 105 26 0 03 0 0 335
2016 249 27 13 0 2 0 02 554
change 239 1565 -514 5693 651
CNH
2013 139 294 84
168 0 05 69
2016 427 59 164
158 03 25 1367
change 2079 1008 943 -56 5784 3836 981
NDF
2013
171
171
2016
104
104
change -394 -394
Source BIS
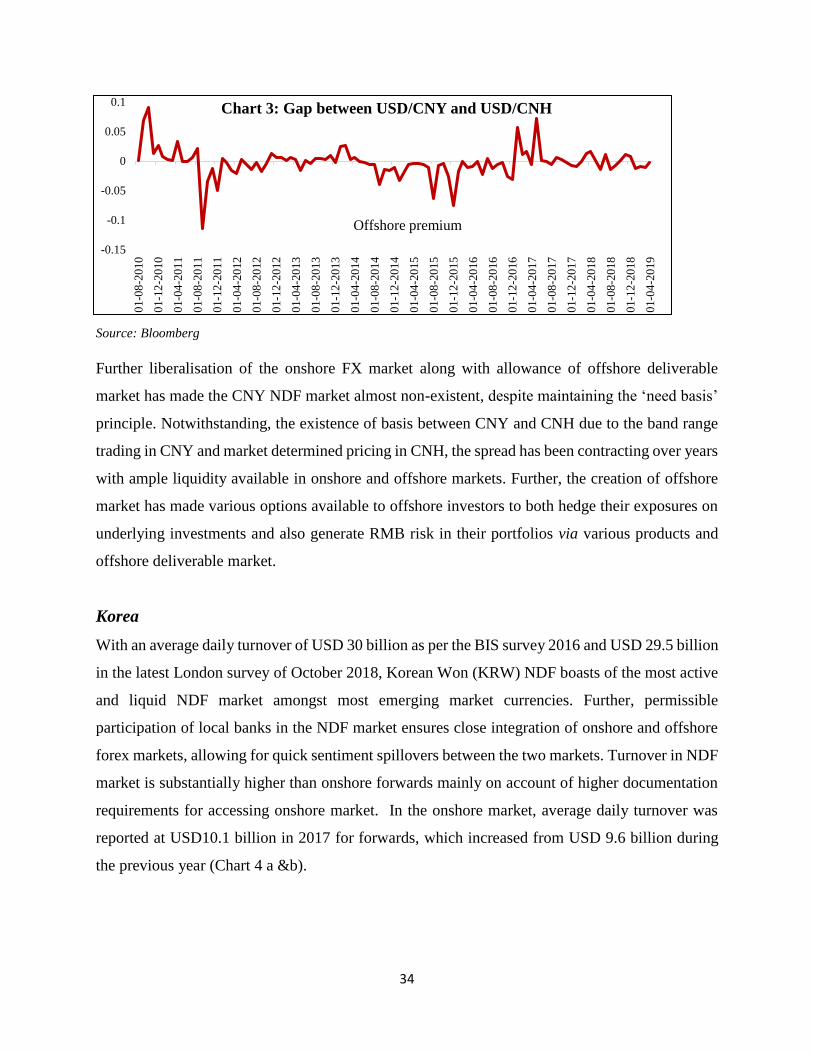
Since the inception of CNH pricing gaps tend to persist between onshore and offshore exchange
rates however it has narrowed over last couple of years This pricing gap arises on account of
different economic conditions in mainland China and Hong Kong amidst imperfect arbitrage
(Funke 2015) While central bank intervention can constrain the movement of CNY at onshore
centres CNH is more market determined and hence closely follows the global swings (Chart 3)
Since September 2015 PBOC has reportedly taken action in the offshore market when the
onshore-offshore gap was large (McCauley amp Shu 2018)
34
Source Bloomberg
Further liberalisation of the onshore FX market along with allowance of offshore deliverable
market has made the CNY NDF market almost non-existent despite maintaining the lsquoneed basisrsquo
principle Notwithstanding the existence of basis between CNY and CNH due to the band range
trading in CNY and market determined pricing in CNH the spread has been contracting over years
with ample liquidity available in onshore and offshore markets Further the creation of offshore
market has made various options available to offshore investors to both hedge their exposures on
underlying investments and also generate RMB risk in their portfolios via various products and
offshore deliverable market
Korea
With an average daily turnover of USD 30 billion as per the BIS survey 2016 and USD 295 billion
in the latest London survey of October 2018 Korean Won (KRW) NDF boasts of the most active
and liquid NDF market amongst most emerging market currencies Further permissible
participation of local banks in the NDF market ensures close integration of onshore and offshore
forex markets allowing for quick sentiment spillovers between the two markets Turnover in NDF
market is substantially higher than onshore forwards mainly on account of higher documentation
requirements for accessing onshore market In the onshore market average daily turnover was
reported at USD101 billion in 2017 for forwards which increased from USD 96 billion during
the previous year (Chart 4 a ampb)
-015
-01
-005
0
005
01
01-0
8-2
010
01-1
2-2
010
01-0
4-2
011
01-0
8-2
011
01-1
2-2
011
01-0
4-2
012
01-0
8-2
012
01-1
2-2
012
01-0
4-2
013
01-0
8-2
013
01-1
2-2
013
01-0
4-2
014
01-0
8-2
014
01-1
2-2
014
01-0
4-2
015
01-0
8-2
015
01-1
2-2
015
01-0
4-2
016
01-0
8-2
016
01-1
2-2
016
01-0
4-2
017
01-0
8-2
017
01-1
2-2
017
01-0
4-2
018
01-0
8-2
018
01-1
2-2
018
01-0
4-2
019
Chart 3 Gap between USDCNY and USDCNH
Offshore premium
35
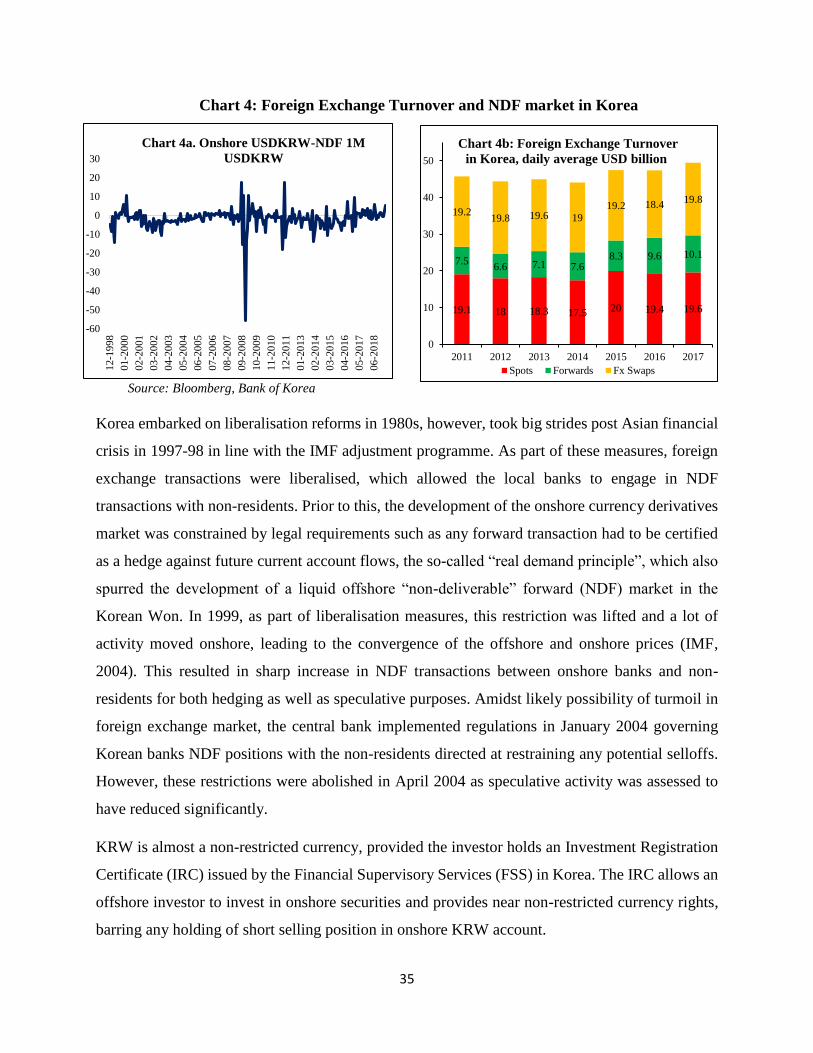
Chart 4 Foreign Exchange Turnover and NDF market in Korea
Source Bloomberg Bank of Korea
Korea embarked on liberalisation reforms in 1980s however took big strides post Asian financial
crisis in 1997-98 in line with the IMF adjustment programme As part of these measures foreign
exchange transactions were liberalised which allowed the local banks to engage in NDF
transactions with non-residents Prior to this the development of the onshore currency derivatives
market was constrained by legal requirements such as any forward transaction had to be certified
as a hedge against future current account flows the so-called ldquoreal demand principlerdquo which also
spurred the development of a liquid offshore ldquonon-deliverablerdquo forward (NDF) market in the
Korean Won In 1999 as part of liberalisation measures this restriction was lifted and a lot of
activity moved onshore leading to the convergence of the offshore and onshore prices (IMF
2004) This resulted in sharp increase in NDF transactions between onshore banks and non-
residents for both hedging as well as speculative purposes Amidst likely possibility of turmoil in
foreign exchange market the central bank implemented regulations in January 2004 governing
Korean banks NDF positions with the non-residents directed at restraining any potential selloffs
However these restrictions were abolished in April 2004 as speculative activity was assessed to
have reduced significantly
KRW is almost a non-restricted currency provided the investor holds an Investment Registration
Certificate (IRC) issued by the Financial Supervisory Services (FSS) in Korea The IRC allows an
offshore investor to invest in onshore securities and provides near non-restricted currency rights
barring any holding of short selling position in onshore KRW account
191 18 183 175 20 194 196
7566 71 76
83 96 101
192198 196 19
192 184198
0
10
20
30
40
50
2011 2012 2013 2014 2015 2016 2017
Chart 4b Foreign Exchange Turnover
in Korea daily average USD billion
Spots Forwards Fx Swaps
-60
-50
-40
-30
-20
-10
0
10
20
30
12
-19
98
01
-20
00
02
-20
01
03
-20
02
04
-20
03
05
-20
04
06
-20
05
07
-20
06
08
-20
07
09
-20
08
10
-20
09
11
-20
10
12
-20
11
01
-20
13
02
-20
14
03
-20
15
04
-20
16
05
-20
17
06
-20
18
Chart 4a Onshore USDKRW-NDF 1M
USDKRW
36
For non-residents investors who do not hold IRS USDKRW remains a highly regulated market
Any onshoreoffshore transactions need to be approved by the appropriate authorities and must
have proof of underlying For multinational clients that repatriate dividends documentation with
proof of underlying must be in place Further ceilings are imposed on foreign exchange derivatives
transactions of foreign as well as local banks which came into existence as a prudential measure
to mitigate the adverse impact of volatile capital flows
Ahead of the 2008 financial crisis Korean economy experienced huge build-up of short-term
external debt led by foreign exchange derivatives positioning of banks on account of over-hedging
undertaken by Korean corporations as well as likely carry trades in anticipation of appreciation of
domestic currency Both these activities were funded using offshore dollar borrowing and posed
serious difficulties at the time of global dollar liquidity crunch during financial crisis With a view
to prevent recurrence of the any such episode triggered by volatile capital flows which resurged
from 2009 over-hedging was specifically prohibited and limits were imposed on Foreign
exchange derivatives activity of banks in relation to their capital Liberalization in KRW has been
continuing for decades with the last one completed in December 2007 whereby prior approval
requirements for some capital account transactions was abolished Even onshore participants can
freely participate in the NDF markets thereby providing onshore liquidity to Non-Residents as
long as the hedges are booked as NDF Essentially KRW is a fully convertible currency but is
only tradable on NDF basis offshore
Malaysia
Malaysia had liberal foreign exchange policies until Asian financial crisis with regard to cross
border transactions involving Malaysian Ringgit (MYR) Following the crisis offshore trading of
MYR was banned However grace period was notified for depositors to repatriate their offshore
deposits back to Malaysia and the adoption of fixed exchange rate policy in 1998 - a significant
move whilst imposing selective capital controls All these measures were intended at ceasing
offshore activity which contributed to the excessive pressure on currency despite relatively
stronger fundamentals Although Malaysia imposed cross border restrictions after the Asian crisis
evolution of NDF market in MYR was initially inhibited by comprehensiveness of regulations as
well as its effective enforcement by the authorities (Ishii 2001) Further absence of reference rate
37
for settlement of NDF contracts and stringent controls on domestic bank to undertake forward
foreign exchange transactions with offshore counterparties also hindered the development of NDF
market (EMEAP discussion paper 2002) As the economy began to recover capital controls were
gradually relaxed and finally the currency was floated in 2005
Generally Malaysia has opened up its domestic markets for non-resident investors with no
restrictions on non-residents investing in local bond markets except having to appoint a local
custodian Most of the sectors are open for non-resident portfolio equity flows as well in Malaysia
Over the years since 2005 non-resident investorsrsquo participation in the onshore market picked up
substantially reaching record high of 397 per cent of total outstanding government bonds from
nearly 14 per cent in 2005 and in the process contributed to the growth of NDF market as well
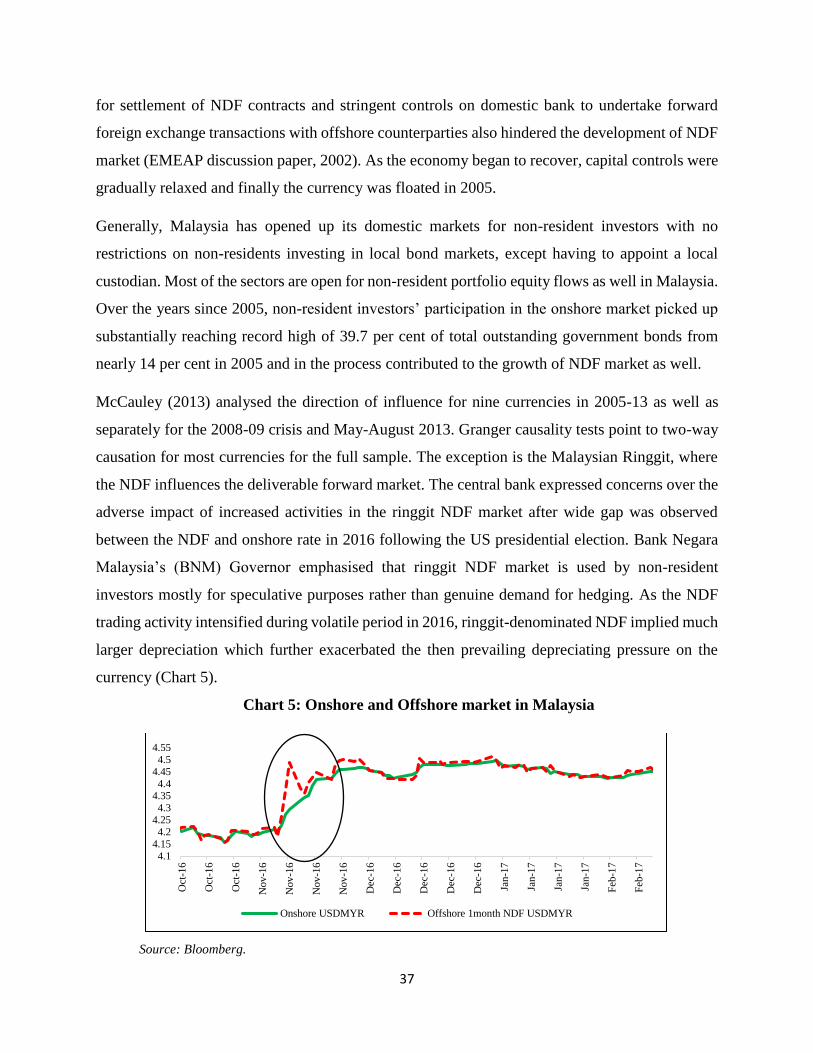
McCauley (2013) analysed the direction of influence for nine currencies in 2005-13 as well as
separately for the 2008-09 crisis and May-August 2013 Granger causality tests point to two-way
causation for most currencies for the full sample The exception is the Malaysian Ringgit where
the NDF influences the deliverable forward market The central bank expressed concerns over the
adverse impact of increased activities in the ringgit NDF market after wide gap was observed
between the NDF and onshore rate in 2016 following the US presidential election Bank Negara
Malaysiarsquos (BNM) Governor emphasised that ringgit NDF market is used by non-resident
investors mostly for speculative purposes rather than genuine demand for hedging As the NDF
trading activity intensified during volatile period in 2016 ringgit-denominated NDF implied much
larger depreciation which further exacerbated the then prevailing depreciating pressure on the
currency (Chart 5)
Chart 5 Onshore and Offshore market in Malaysia
Source Bloomberg
4141542
42543
43544
44545
455
Oct
-16
Oct
-16
Oct
-16
Nov
-16
Nov
-16
Nov
-16
Nov
-16
Dec
-16
Dec
-16
Dec
-16
Dec
-16
Dec
-16
Jan-1
7
Jan-1
7
Jan-1
7
Jan-1
7
Feb
-17
Feb
-17
Onshore USDMYR Offshore 1month NDF USDMYR
38
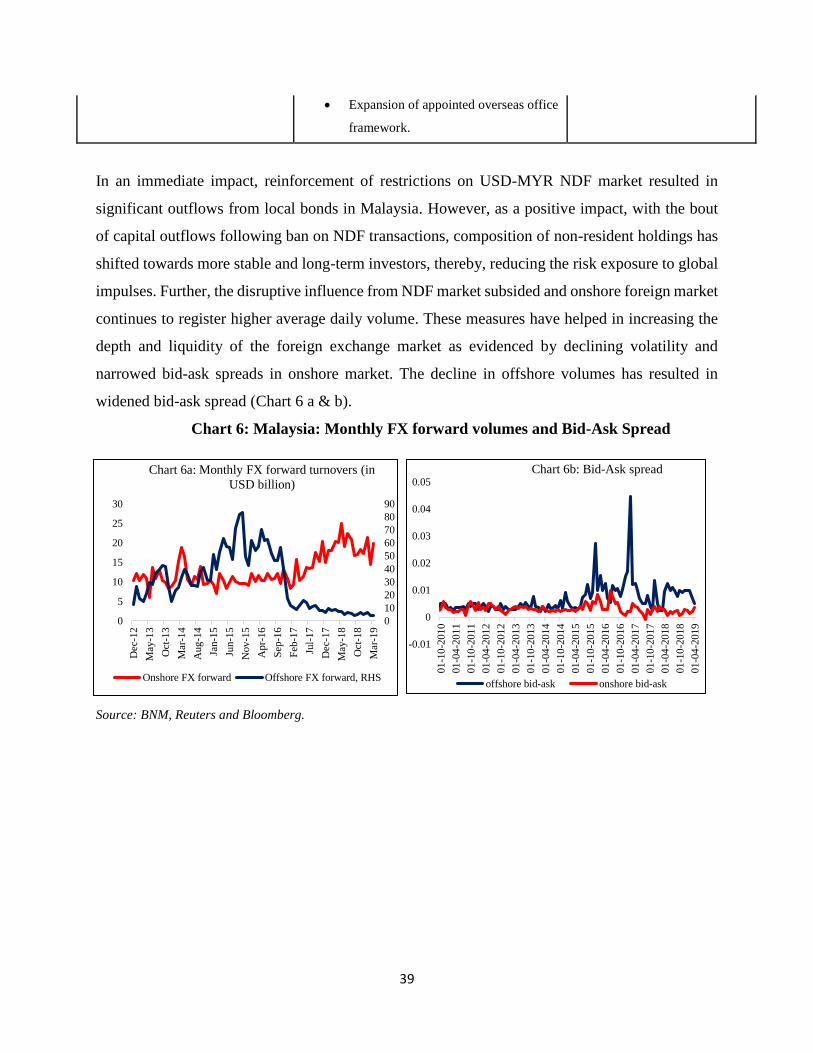
Assessing the overwhelming impact of NDF activities which has the potential to undermine
financial stability BNM took a number of measures in 2016 to eliminate speculative transactions
in order to ensure appropriate price discovery and orderly functioning of onshore market These
measures includes reinforcement of non-internationalisation policy for Ringgit steps to improve
the onshore pricing mechanism and deepen the domestic forex market After prohibiting banks
from quoting fixing orders used to settle offshore trades the central bank revised the methodology
to compute onshore reference rate to account for transacted deals from mid-2016 Further BNM
imposed a ban on ringgit NDF trading in November 2016 and reminded local banks that ringgit
remains a non-internationalised currency and therefore any offshore trading is not recognized At
the same time BNM strengthened its monitoring to ensure compliance to Foreign exchange
administration rules (FEA) rules by market participants on non-involvement in facilitating NDF
transactions Subsequently financial markets committee (FMC) instituted in mid-2016 laid down
a series of developmental measures for onshore market aimed at allowing better market access and
greater hedging facilities to market participants (Table 5)
Table 5 Developmental Measures Relating to Foreign Exchange Market
Jul-16 Dec-16 Apr-17
Adopting global best practices Rebalance onshore FX demand and supply
Additional FX risk
management practices
bull Transaction based KL
USDMYR reference rate
bull 25 retention of export proceeds in
foreign currency
bull Streamline passive and
dynamic hedging
flexibilities for
investors
bull Extension of official closing hour
for onshore Ringgit rate
bull Trade settlement among residents in
Ringgit only
bull Active hedging for
corporations
bull Streamline onshore and offshore
foreign currency investment limit
Promote FX risk management onshore
bull Active hedging below RM6t million of
net open position
bull Active hedging for institutional
investors
39
bull Expansion of appointed overseas office
framework
In an immediate impact reinforcement of restrictions on USD-MYR NDF market resulted in
significant outflows from local bonds in Malaysia However as a positive impact with the bout
of capital outflows following ban on NDF transactions composition of non-resident holdings has
shifted towards more stable and long-term investors thereby reducing the risk exposure to global
impulses Further the disruptive influence from NDF market subsided and onshore foreign market
continues to register higher average daily volume These measures have helped in increasing the
depth and liquidity of the foreign exchange market as evidenced by declining volatility and
narrowed bid-ask spreads in onshore market The decline in offshore volumes has resulted in
widened bid-ask spread (Chart 6 a amp b)
Chart 6 Malaysia Monthly FX forward volumes and Bid-Ask Spread
Source BNM Reuters and Bloomberg
-001
0
001
002
003
004
005
01
-10
-201
0
01
-04
-201
1
01
-10
-201
1
01
-04
-201
2
01
-10
-201
2
01
-04
-201
3
01
-10
-201
3
01
-04
-201
4
01
-10
-201
4
01
-04
-201
5
01
-10
-201
5
01
-04
-201
6
01
-10
-201
6
01
-04
-201
7
01
-10
-201
7
01
-04
-201
8
01
-10
-201
8
01
-04
-201
9
Chart 6b Bid-Ask spread
offshore bid-ask onshore bid-ask
0
10
20
30
40
50
60
70
80
90
0
5
10
15
20
25
30
Dec
-12
May
-13
Oct
-13
Mar
-14
Aug
-14
Jan-1
5
Jun
-15
Nov
-15
Apr-
16
Sep
-16
Feb
-17
Jul-
17
Dec
-17
May
-18
Oct
-18
Mar
-19
Chart 6a Monthly FX forward turnovers (in
USD billion)
Onshore FX forward Offshore FX forward RHS
40
Chart 7 Non-resident holdings of total government debt and Monthly FX turnover
Source BNM and HSBC
Indonesia
The development of NDF market in Indonesia Rupiah traces back to the year 2001 when Bank
Indonesia (BI) prohibited onshore banks from lending to non-resident accounts in an attempt to
reduce the speculative pressure on the Indonesian Rupiah (IDR) These restrictions paved the way
for development of offshore rupiah NDF market to cater to the demand of international investors
Prior to this an active offshore deliverable market existed for IDR following the pursuit of
liberalisation policies beginning as early as 1970s which allowed the IDR to be freely convertible
and at the same time permitted its internationalisation Consequently the international use of
rupiah increased but was confined mostly to financial transactions mainly due to limited invoicing
of trade-related transactions in IDR terms This easy access to rupiah from onshore centres due to
internationalisation allowed non-resident to speculate on the currency during the 1997 crisis in
Asian countries As a result of heightened activity in times of stress exchange rate volatility
increased making it difficult for the central bank to maintain stability of rupiah In response to the
crisis the currency was freely floated replacing the intervention band but weakness in the currency
and high volatility continued to persist compared to currencies of other Asian countries during the
first three years of its floating rate regime Taking cognizance of this disparity the central bank
began to evaluate the extant regulations relating to rupiah transactions with non-residents
Thereafter during the year 2001 the BI imposed extensive regulations limiting non-resident
143
397
243
50
100
150
200
250
300
350
400
450
Jan-0
5
Oct
-05
Jul-
06
Apr-
07
Jan-0
8
Oct
-08
Jul-
09
Apr-
10
Jan-1
1
Oct
-11
Jul-
12
Apr-
13
Jan-1
4
Oct
-14
Jul-
15
Apr-
16
Jan-1
7
Oct
-17
Jul-
18
Apr-
19
Chart 7a Non resident holdings as of total
government debt
-
500
1000
1500
2000
2500
3000
Jan-1
6
Apr-
16
Jul-
16
Oct
-16
Jan-1
7
Apr-
17
Jul-
17
Oct
-17
Jan-1
8
Apr-
18
Jul-
18
Oct
-18
Jan-1
9
Chart 7 Monthly onshore FX market
turnover (in billion of USD)
FX Spot FX Swap FX Forward FX Options
41
rupiah transactions and shrinking the pool of offshore rupiah funds with the potential to be used
for speculation identifying spill overs from offshore market as conduit of excessive volatility
In general Indonesia has opened up its domestic bond markets for non-residents completely with
no entryexit barriers except having to appoint a local custodian Foreign exchange hedging is
allowed only with underlying documentationasset in place for non-residents On the portfolio
equity investments regulation clearly provides that a listed company is exempt from any foreign
investment restrictions However there are sectoral restrictions on FDI in Indonesia which are
decided by BKPM (Investment Coordinating Board in Indonesia) which provides a DNI list
(Governmentrsquos negative investment list) The share of non-residents in Indonesia Government
Bonds has been increasing over years from a mere 1570 per cent of the total government bonds
in June 2009 to 3810 per cent in April 2019 (Chart 8)
Source HSBC
Research from BI in 2012 found disproportionate impact of NDF market to spot market during the
period 2008-11 Results suggests that there is evidence of unidirectional mean spill-over from NDF
to both spot and forward rupiah markets with an exception of Europe crisis On volatility spillover
the study obtained significant results from NDF market to spot market for entire period However
in crisis situation the study found interdependence between volatility in offshore NDF and onshore
spot rate changes while information transmission is only valid from NDF to forward rate changes
not the other way around (Cadarajat and Lubis 2012)
To reduce the unwarranted influence of NDF market on spot market BI took initiatives beginning
the year 2014 to bridge the gap between onshore and offshore rupiah rate In 2014 the central bank
381
150
200
250
300
350
400
450
Jun-0
9
Dec
-09
Jun-1
0
Dec
-10
Jun-1
1
Dec
-11
Jun-1
2
Dec
-12
Jun-1
3
Dec
-13
Jun-1
4
Dec
-14
Jun-1
5
Dec
-15
Jun-1
6
Dec
-16
Jun-1
7
Dec
-17
Jun-1
8
Dec
-18
Chart 8 Non-resident holdings as percetage to total Government
Debt
42
with the help of key offshore centre Singapore moved the foreign exchange rate fixing that is used
to settle the NDF contracts to the onshore market Earlier Association of Banks in Singapore
(ABS) and the Singapore Foreign Exchange Markets Committee (SFEMC) was publishing IDR
reference rate computed as weighted average of 1-month NDF trades done by then Singapore
based brokers Post March 27 2014 BI started publishing reference rate termed as Jakarta Inter-
bank Spot Dollar Rate (JISDOR) which was to be used to settle existing and new contracts Jakarta
Interbank Offered Rate (JIBOR) is more transparent in a way that it is based on actual transactions
being done in the inter-bank onshore market
In late 2018 BI in its efforts to further deepen the domestic foreign exchange market and to
mitigate IDR exchange rate risk BI established the Domestic Non-Deliverable market (DNDF)
for IDR It will serve as a parallel market to NDF with the key difference that it is rupiah settled
in onshore market This alternative tool will provide foreign investors additional avenues to hedge
their IDR exposure without principal exchange other than enhancing the central bankrsquos
intervention capabilities At this juncture the market is relatively new and hence significant impact
assessment of the same cannot be outlined However currently Indonesia has not been able to
move significant turnovers from offshore NDF to Domestic NDF market
Brazil
Brazilian Real is the second most actively traded currency in NDF market after the Korean Won
with an average daily turnover of USD 187 billion as per BIS and USD 154 billion according to
the London survey The growth and development of NDF market is attributed to the existence of
large and well developed foreign exchange futures market
The development of derivatives market in Brazil is attributed to the hedge culture that has been
prevalent due to periods of high and persistent inflation and exchange rate volatility amidst
political shocks During 1980s and early 1990s inflation was soaring above 100 per cent which
peaked over 2700 per cent in 1993 and thus promoted widespread indexation to manage the
inflation risks Subsequently the ldquoReal planrdquo which comprised of fiscal and monetary reform and
introduction of new currency helped to bring down inflation and stabilise the currency Amidst
stable macroeconomic conditions private sector was encouraged to borrow foreign funds at a
43
lower cost and the consequent surge in foreign indebtedness during 1994 to 1998 led the central
bank issue dollar denominated securities as a hedging instrument Following the currency crisis in
1999 the Brazilian Real was floated amongst adoption of new set of economic policies which was
also accompanied by providing unrestricted access to non-residents to financial markets (including
derivatives) in 2000
The distinguishing feature of Brazilian foreign exchange is the non-deliverable nature of
derivatives contracts without any significant limitations even though participation in deliverable
instruments ie spot outright forwards and foreign exchange swaps is constrained Only chartered
banks are authorised by the central bank to hold foreign exchange spot positions All these factors
have facilitated the growth of foreign exchange futures market over spot market which is closed
and highly restricted Against the backdrop of large and sophisticated foreign exchange derivatives
with high depth and liquidity foreign exchange futures prices have key influence on spot price as
suggested by various studies (Ventura and Gracia 2009 Kaltenbrunner 2010 and Chamon and
Gracia 2013) As pointed out by Kaltenbrunner 2010 the existence of a deep futures market has
made it possible for foreign banks with branches in Brazil to sell real offshore (NDF) and
simultaneously hedge their real exposure in the onshore futures market For the Brazilian Real
derivatives especially offshore NDFs are the main vehicle for investors looking to implement
carry trades (Santaelaa 2015)
Taiwan
The NDF market for Taiwanese Dollar (NTD) existed since 1990s and the central bank permitted
domestic and foreign legal entities to trade in NTD NDF market with authorised banks in 1995
This came after opening up of local securities market to foreign institutional investors (QFII) in
1990 which allowed FIIs meeting certain requirements to apply for investment in Taiwanrsquos stock
market Subsequently significant relaxations were made and security market was completely
opened up with the abolition of QFII scheme While onshore institutions were eligible for trading
in NTD NDF the central bank initially imposed limits on trading position in NTD NDF to one
third of their total foreign exchange position with a view to prevent speculative pressure
44
Following the Asian financial crisis in July 1997 the central bank introduced measures to regulate
NDF market with only authorized banks permitted to carry NDF trading with other authorised
counterparts and their overseas branches or headquarters This move came after the speculative
positioning which was believed to cause sharp depreciation of the NTD The central bank outlined
that although there was ceiling on NTD NDF trading positions some banks were engaged in selling
NDFs to foreign entities and simultaneously created long NDFs positions and shorted DFs with
domestic entities in a bid to offset the NDF trading positions on their balance sheets and thus
creating more room for further NDF trading (Bank of Taiwan Annual Report 2014) The central
bank has intervened in foreign exchange market to curb speculative activity also post 2008
financial crisis when emerging markets witnessed resurgence of capital flows The measures
introduced then by the central bank focused on reducing local banksrsquo foreign exchange positions
in both onshore and NDF markets including discouraging non-resident deposits by imposing
punitive reserve requirements with an intent to limit local banksrsquo capacity to provide liquidity to
NDF markets The National Supervisory Commission also took steps to limit non-resident
investments in local bank deposits and government securities
However recognising the dominance of foreign banks in NDF trading activity the central bank
announced that overseas branches of domestic banks are eligible to apply for NTD NDF business
from September 2014 In current scenario whilst there are no restrictions on the fixed income
investments in general but investments in localdomestic bonds by non-residents cannot exceed
30 per cent of their investments in equity instruments which has kept the investments in local
bonds low by non-residents who tend to take exposure in USD bonds issued by Taiwan offshore
Moreover ability for local banksrsquo to access the TWD NDF market up-to 20 per cent of each banksrsquo
net open position results in partial integration between onshore and offshore markets Since TWD
is not fully convertible any onshore spot transactions must be declared to the central bank and in
most cases require supporting documentation which keeps the differential between onshore and
offshore rate
To conclude cross county experience shows that increasing role of any economy globally is
accompanied by emergence of growing offshore trading of their currencies in the presence of
restricted access or cumbersome regulations Additionally emerging market economies cannot
afford to have unrestricted access to their onshore market as revealed by the studies of Indonesia
45
and Malaysia during the Asian crisis 1997 which exposed them to global impulses Most of these
countries have followed a gradual approach surrounding non-resident access to their forex markets
As emerging markets open up and become sophisticated in respect of forex markets the case study
of the Republic of Korea exemplify that country-specific factors have to be considered when
designing the financial regulatory toolkit aimed at curbing foreign and domestic agentsrsquo
speculative strategies in the search for yield The experience of Brazil suggests deepening onshore
hedging market will go a long way in promoting the price setting role of onshore market over its
offshore counterparts Indonesia has recently introduced domestic NDFs in line with Brazil
Additionally the experience of Korea and Taiwan suggests that the participation of domestic banks
ensures that any price differential between the two segments is arbitraged However in both the
cases participation is governed to evade any potential build-up of vulnerabilities on banksrsquo balance
sheet
46
Chapter 34
Linkages between Offshore NDF and Onshore Rupee Markets New Evidence
Overarching Motivation
Indiarsquos trade integration with the rest of the world began to rise sharply from the turn of the
millennium Between 2000 and 2012 total trade (imports + exports) as a percentage of GDP more
than doubled from 26 to 56 before moderating to 43 in 2018 as the effects of de-
globalization took over post the global financial crisis Simultaneously policymakers persevered
with gradual but consistent capital account liberalization Unsurprisingly therefore currency
markets ndash both to trade and hedge ndash rose in tandem with the growing external integration The
onshore Rupee market5 monthly average turnover has grown from USD 60 billion in 2000 to USD
687 billion in 2018 However given data limitations uncertainty still exists on the exact size of
the NDF market and how it has grown relative to the onshore market As Chapter- 2 illustrates
the BIS Triennial Survey finds average daily turnover of Rupee NDF in 2016 was USD 16 billion
However the Bank of Englandrsquos Semi-Annual Forex Turnover Survey finds average daily
turnover of Rupee NDF in London increased from USD 8 billion in October 2016 to USD 23
billion in October 2018
The idea behind trying to size the NDF market ndash and therefore implicitly compare its size and
growth to onshore markets ndash is in part to try and make sense of how important a role NDF markets
play in the ldquoprice discoveryrdquo of the Rupee6 With the Indian Rupeersquos ldquoForwardrdquo price being
determined across segmented markets ndash both the onshore deliverable forward market and the
offshore non-deliverable market -- the key is to ascertain the relative importance of each of these
markets in driving price discovery
4 This chapter is a joint work of Shri Sajjid Chinoy Chief Economist J P Morgan India and Shri Harendra Behera
Assistant Adviser Department of Economic and Policy Research Reserve Bank of India 5 Spot OTC amp ETCD
6 To be sure estimating the size of the NDF market is important not just for the influence it exerts on price discovery
but also instructive in understanding the cumulative ldquoviewrdquo on the Rupee and how much is expressed onshore versus
offshore This is because if NDF volumes are substantial policymakers may desire to shift these volumes on shore
both to (i) deepen the onshore market and (ii) move this businesseconomic activity on shore
47
However simply using (offshore versus onshore) volumes as a means to proxy relative price
discovery is imperfect at best The ability of NDF volumes to drive price discovery for any given
quantum of volumes is ultimately a function of how inter-connected onshore and offshore markets
are and the ability of economic agents ndash hedgers arbitrageurs speculators -- to link these markets
For example if NDF markets have grown sharply but it is found that price linkages between the
two markets are still tenuous or have not increased commensurately with volumes -- say because
arbitrage opportunities between the two markets have not grown in tandem -- then the growth of
NDF markets and the consequent ldquoloss of controlrdquo will be of less concern to Indian policymakers
Conversely if price linkages have grown over time ndash proportionately to volume increases ndash then
policymakers would rightly worry about the growing role of NDF markets in driving price
discovery
The fundamental motivation for this chapter is therefore to empirically examine price linkages
between the NDF and onshore markets as this is the ultimate manifestation of the influence that
NDF markets exert
The Question
This chapter seeks to ask two fundamental questions Is there a stable long-term equilibrium
relationship between onshore and offshore markets Second if so what is the directionality of
influence Do NDF markets drive onshore markets Or do onshore markets drive the NDF market
Or is the influence bi-directional
Furthermore we try and empirically answer this questions across two dimension First what is the
direction and quantum of influence during ldquonormal times versus ldquostressed timesrdquo Second what
is the relationship and how does it change when assessing ldquoaverage returnsrdquo (means) versus
ldquovolatilityrdquo (variance)
Specific Motivation to India
While there is a meaningful and growing literature trying to empirically ascertain price linkages
between the onshore and offshore markets around the world the literature that focuses on India
remains sparse dated and inconclusive This constitutes the specific motivation for this chapter
48
The literature studying NDF markets around the world has steadily grown over time For example
much work has been done on Asian NDF markets and their relationship with onshore markets
both for the region as a whole (Ma et al 2004 Colvecchio et al 2006 Wang et al 2007 Gu and
McNelis 2009) and individual currencies such as the Korean Won (Park 2001) the Indonesian
Rupiah (Cadarajat and Lubis 2012) the Chinese Yuan (Fung et al 2004 Hideki 2006
Colavecchio and Funke 2008 Huszaacuter et al 2016 Song and Gao 2016 McCauley and Shu 2018)
and the Indian Rupee (Misra and Behera 2006 Guru 2009 Behera 2011 Darbha 2012 Goyal
et al 2013)
Results remain mixed Some studies find the NDF markets influence the evidence onshore forward
market (Park 2001 Wang et al 2007 Cadarajat and Lubis 2012) others find they influence
onshore spot markets (Behera 2011 Goyal et al 2013) while some document its influence on
onshore futures markets (Behera 2011) Conversely some studies also find the direction of
influence runs from onshore markets to NDF markets (Wang et al 2007 Misra and Behera 2006)
In the case of India there are only a few studies on this subject ndash with the last one back in 2013 ndash
and the results are mixed and inconclusive For example Misra and Behera (2006) find that itrsquos
the onshore markets that influenced the NDF market between 2004 to 2007 largely because of
restricted participation of domestic players in the offshore market In a subsequent study Behera
(2011) found that there are volatility spillovers from the NDF market to spot and forward markets
in India and the magnitude of volatility spillover has become higher after the introduction of
currency futures in 2008 Guru (2009) finds qualitatively the same results and the role of currency
futures in India Darbha (2012) find that offshore markets play an important role in price discovery
Finally in the most recent work on India (Goyal et al 2013) find evidence of a long-term
relationship between NDF and onshore markets and find evidence that the relationship is
bidirectional as both markets adjust to any deviations from the equilibrium state
Whatrsquos clear however is the evidence on India is patchy inconclusive and dated with the last
study conducted more than 6 years ago
Some Theory
Recall if there are no capital controls forward rates are tied down by the no-arbitrage ldquocovered
interest parityrdquo hypothesis
49
F = S(1+r)(1+r$ )
Where F is the Forward rate S is the spot rate r is the relevant interest rate on the home currency
and r$ is the equivalent dollar rate The equation holds when (i) there is capital account
convertibility and there are no barrier for cross-border transactions and (ii) there is equivalent
credit risk in the assets across the two jurisdictions
However if there are capital-account barriers we would expect F to only be approximated by the
equation above and not hold exactly
So F ~ S(1+r)(1+r$ )
Similarly the NDF rate should be anchored by the onshore forward rate to the extent that
arbitragers can link these markets
So NDF ~ F ~ S(1+r)(1+r$ )
Furthermore the sign of the onshore-offshore yield spread can indicate the underlying market
pressure on the currency If the domestic interest rate is higher than the NDF implied yield it
implies appreciation pressures on the currency However capital controls may restrict inflows to
close the gap Similarly a lower domestic interest rate than implied by the NDF yield would
suggest depreciation pressures while a zero spread would likely reflect an absence of market
pressure on both the domestic and offshore market
All told however we would expect that both onshore and offshore markets would have a long-
run relationship and there is the likelihood of ldquomeanrdquo spillovers on a regular basis Furthermore
hedging arbitrage and speculative activities may also result in volatility spillovers from one
market to another on various occasions
Testing for ldquoMeanrdquo Spillovers
We start therefore by empirically testing for linkages between onshore (spot and forward prices)
and offshore (NDF forward prices) markets The goal is to assess
1 If there is a stable long-term relationship between onshore and offshore markets
2 Which drives which Do onshore prices drove offshore prices Or vice versa
50
3 To see whether the direction of influence is a function of context Are the results
different for ldquonormalrdquo times versus ldquostressed periodsrdquo (ie taper tantrum emerging
market stress)
Non-stationary but co-integrated
So as to decide the empirical course of action we start by testing whether the key variables of
interest (i) the Onshore Spot Exchange Rate (SPOT) (ii) the Onshore Forward Rate (FORWARD)
and (iii) the Offshore Non-Deliverables Forward exchange rate (NDF) are stationary
Augmented Dickey Fuller Tests reveal that all three variables are non-stationary in levels
However as Figures 1 and 2 suggest the spreads between SPOT and NDF and ONSHORE
FORWARDS and NDF are mean-reverting suggesting the presence of a long-term relationship
and suggesting stationarity in the first differences
Formal co-integration tests ndashTables 2 and 3 ndash confirm that both pairs of variables NDF-SPOT and
NDF-FORWARD ndash are indeed co-integrated The Max Eigenvalue tests reveal there is at least one
co-integrating vector that can be found at the 5 level
Null Hypothesis Variables have a unit root
ADF t-Stat Prob
Spot -06 09
Augmented Dickey-Fuller test statistic-07 08
Augmented Dickey-Fuller test statistic-07 08
Table 1 ADF unit root test
-15
-05
05
15
25
09 10 11 12 13 14 15 16 17 18 19
level
Figure 1 Spreads (1M NDF- Spot)
51
-25
-15
-05
05
15
25
09 10 11 12 13 14 15 16 17 18 19
level
Figure 2 Spreads (1M NDF- 1M Forward)
Table 2 Co-integration SPOT and NDF
Sample (adjusted) January 2005 to March 2019
Included observations 2608 after adjustments
Trend assumption No deterministic trend (restricted constant)
Series LOG(SPT) LOG(NDF)
Unrestricted Cointegration Rank Test (Trace)
Hypothesized Trace
No of CE(s) Eigenvalue Statistic Critical ValueProb
None 011 31310 2026 000
At most 1 000 210 916 076
Unrestricted Cointegration Rank Test (Maximum Eigenvalue)
Hypothesized Max-Eigen005
No of CE(s) Eigenvalue Statistic Critical ValueProb
None 011 31100 1589 000
At most 1 000 210 916 076
Both Trace and Max-eigenvalue tests indicates 1 cointegrating
eqn(s) at the 005 level
52
Stable Long Term Relationship
The finding of co-integration allows us to use ordinary least squares (OLS) to estimate the long-
term relationship between SPOT and the NDF as well as FORWARD and the NDF In particular
using the equation below we estimate parameters β0 and β1 which tells us about the long-term
relationship between SPOT and NDF
We then repeat the same exercise between the FORWARD and the NDF
But whatrsquos driving what An ldquoError Correction Mechanismrdquo approach
While establishing a long-term relationship is important a finding in the affirmative will not come
as a particular surprise Instead the real question is whether onshore prices drive offshore prices
or vice versa The natural framework to answer this is the work-horse Error Correction Mechanism
(ECM) approach used by Engel and Granger in 1987 where changes in each of the variables are
run on changes on its own lags and the lags of the other variables
Table 3 Co-integration FORWARD and NDF
Sample (adjusted) January 2005 to March 2019
Included observations 2608 after adjustments
Trend assumption No deterministic trend (restricted constant)
Series LOG(FORWARD) LOG(NDF)
Unrestricted Cointegration Rank Test (Trace)
Hypothesized Trace
No of CE(s) Eigenvalue Statistic Critical ValueProb
None 018 53051 2026 000
At most 1 000 217 916 074
Unrestricted Cointegration Rank Test (Maximum Eigenvalue)
Hypothesized Max-Eigen 005
No of CE(s) Eigenvalue Statistic Critical Value Prob
None 018 52835 1589 000
At most 1 000 217 916 074
Both Trace and Max-eigenvalue tests indicates 1 cointegrating
eqn(s) at the 005 level
53
119889119897119900119892(119904119901119900119905)119905 = 1205720 + 120572119904119901119900119905(119890119905minus1) + sum 12057211(119894)(119889log (119904119901119900119905119905minus1))119899119894=1 + sum 12057212(119894)(119889log (119873119863119865119905minus1)) + 120576119904119905
119899119894=1 (1)
119889119897119900119892(119873119863119865)119905 = 1205720 + 120572119899119889119891(119890119905minus1) + sum 12057221(119894)(119889119897119900119892(119904119901119900119905119905minus1))119899119894=1 + sum 12057222(119894)(119889119897119900119892(119873119863119865119905minus1)) + 120576119899119905
119899119894=1 (2)
For example as Equation 1 lays out changes in (the log of) SPOT ndash the dependent variable -- are
run on its own lags and the lags of NDF Equation 2 ndash in which the dependent variable is NDF --
does the same for NDF Because both variables are co-integrated ndash as shown above ndash using OLS
to estimate these coefficients using standard criterion to choose lag lengths (eg Akaike
Information Criterion) and standard F-Tests are all valid
The coefficients of interest in the above equation are 120572119904119901119900119905 and 120572119899119889119891 ndash the ECM terms -- because
these coefficients tell us when the system is in disequilibrium the direction and the speed of
adjustment back to equilibrium This will determine the directionality of influence
For example if 120572119904119901119900119905 = 0 and if all values of 12057212(119894) = 0 then dlog(NDF) does not granger cause
dlog(spot) In contrast if the value of 120572119904119901119900119905 is negative and statistically significant that implies
that (the log of) NDF in the long run ldquoganger-causesrdquo spot market movements The same intuition
applies for equation 2 where NDF is the dependent variable and we test for convergence between
the NDF rate and the onshore forward rate Direct convergence requires 120572119904119901119900119905and 120572119899119889119891 to be
oppositely sign Intuitively the larger the value of α the faster is the speed of adjustment
In summary while the βrsquos tell us about the existence and strength of a long run relationship
between onshore and offshore markets the αrsquos tell us about whether (i) the directionality of
influence and (ii) the speed of convergence from disequilibrium
We therefore use this approach to test for linkages between both sets of variables ndash NDF and
onshore SPOT ndash and NDF and onshore FORWARDS
Data
We use end-of- India-day closing values for the onshore spot exchange rate for the 1-month a
forwards and the corresponding 1-month non-deliverable-forward (NDF) rates We use daily data
and our full sample runs from 2009 through 2019
54
Results Full Sample
Table 4 ECM and Long run coefficients (Full sample)
The first row are the linkages between the onshore spot and NDF markets while the second row
is that of the onshore forwards and NDF market
In both cases the betas (β) are positive statistically significant and with a magnitude very close to
or at 1 implying an almost one-for-one movement between both the markets in the long run For
example the estimated β1 of 099 suggests that for a 1 increase in NDF rates there is 099
increase in spot rates in the long run Meanwhile between onshore FORWARDS and NDF there
is a complete pass-through in long run More generally a beta (β) close to 1 suggests there is no
permanent friction between onshore and offshore markets in the long run
Convergence
However the real interest is in the alphas In the first case both 120572119904119901119900119905 and 120572119899119889119891 are statistically
significant and oppositely signed This suggests that they both converge towards each other Put
differently the NDF rate moves towards the onshore SPOT rate and vice-versa In other words
there is a bi-directional relationship between both variables The magnitude of the coefficients
(007-018) suggests a moderate speed of convergence to the long-run equilibrium when a shock
causes the system to go into disequilibrium
The same results are obtained when studying linkages between the onshore forward and NDF
markets Both 120572119891119900119903119908119886119903119889 and 120572119899119889119891 are statistically significant oppositely signed (suggesting they
converge towards each other) with coefficients that are slightly larger than the SPOT-NDF pair
This suggests that both NDF and the onshore FORWARD rates influence each other and gradually
converge towards their long-term relationship when hit by a shock ndash a speed of adjustment that is
modestly faster than the NDF-SPOT relationship
Time Period April 2009 to March 2019
Onshore Spot and NDF -018 007 099
Onshore Forwards and NDF -032 023 100
55
For the full sample as a whole from 2009 to 2019 we find that there is a bi-directional relationship
on average between SPOT and NDF and FORWARD and NDF and that all variables converge
gradually to their long-term relationship
Results Stressed Times
Our results should be thought of as ldquoaveragerdquo results across the entire time period But are these
results a function of context Does the direction of influence change for example during periods
of currency stress versus periods of calm We explore this next
To test for this we start by isolating clearly-identifiable periods of stress ex post facto in our
simple Two episodes naturally come to mind the taper tantrum of 2013 (where the Rupee
depreciated 26 between May 2013 and August 2013) and the emerging market (EM) turmoil ndash
characterized both by the Fed raising rates and oil prices firming ndash such that the Rupee depreciated
almost 10 between August 2018 and October 2018
2013 The Taper Tantrum
We test interlinkages from the start of May to the end August 2013 ndash during the Taper Tantrum ndash
when the Rupee was under intense pressure and easily amongst the worst performing currencies
in the emerging market (EM) universe Results are presented in Table 5 below
Table 5 ECM and Long run coefficients
As one can observe 120572119899119889119891 in both equations is statistically insignificant What this implies is onshore
spot and forward rates were playing very little role in influencing NDF rates7 In contrast 120572119904119901119900119905 and
120572119891119900119903119908119886119903119889 are correctly signed and statistically significant (the former at the 1 level and the latter
at the 10 level) which suggests it was the NDF rate that was driving the onshore spot and forward
rates Interestingly the speed of adjustment is much faster for onshore spot rates in this sample (-
11) compared to the full sample (-018) and also relative to the onshore forward market (-08) An
7 In fact onshore spot and forward rates do not granger cause NDF as none of the lags of 12057221(119894) in equation 2 are
statistically significant during this period
Onshore Spot and NDF -11 -028 094
Onshore Forwards and NDF -08 015 097
Time Period May 2013 to August 2013
56
ECM (alpha) coefficient of greater than 1 suggests the witnesses an oscillating convergence Since
a coefficient greater than 1 is prime facie surprising we also conduct a robustness exercise
(described below) by running Granger Causality tests for this time period and find it is the NDF
that Granger-causes onshore rates and not the other way around
This finding likely reflects the growing volumes ndash potentially speculative ndash in the NDF market in
the 2013 period of stress relative to the volumes in the onshore market This also prime facie
reduced the efficacy of foreign currency intervention by the central bank because intervention was
used to shape the spot exchange rate at the end of Indiarsquos business day But because the NDF is a
24 hour market NDF rates evolved overnight and when the Indian market opened the next day
onshore rates were influenced by NDF developments overnight This rendered ineffective the
previous dayrsquos intervention because there was often little correlation between the closing exchange
rate of the previous day and the opening rate of the next day and therefore necessitated additional
intervention the next day
Visually this is evident in the ldquogap-uprdquo movements of the exchange rate when the Indian market
opened ndash vis-a-vis the previous dayrsquos close ndash during those three months Figure 3 for example
captures this for the month of August 2013
Figure 3 Gap-up opening in USDINR (August 2013)
Source Bloomberg
57
2018 More of the Same
Emerging markets came under renewed stress in the summer of 2018 against the back drop of the
Fedrsquos hiking cycle accompanied by the rally in crude pieces which had surged 50 over the course
of a year As some large emerging markets ndash Argentina Turkey ndash came under some stress there
was a contagion to all emerging markets with current account deficits of which India was one
Between May and October 2018 the Rupee depreciated almost 10 against the US Dollar
What were the offshore-onshore linkages during that period of time Results are presented in Table
6
Table 6 ECM and Long run coefficients
The linkages mimic 2013 The coefficient on whether onshore drives offshore 120572119899119889119891 is insignificant
in both regressions This re-affirms that in line with 2013 onshore spot and forwards were not
driving the NDF rate8 In contrast 120572119904119901119900119905 and 120572119891119900119903119908119886119903119889 are both correctly signed quantitatively
meaningful and statistically significant This suggests that it was the NDF rate that drove the
onshore spot and forward during this period likely reinforcing the presumption that volumes rise
sharply in NDF markets during periods of stress which then become the hub of price discovery
and influences onshore rates As Figure 4 reveals this is visible in the ldquogap-uprdquo movement of the
Rupee at the start of the day for several days in the month of August 2018
8 Onshore spot and forward rates does not granger cause NDF as none of the lags of 12057221(119894) in equation 2 are
statistically significant
Time Period August 2018 to Nov ember 2018
Onshore Spot and NDF -10 -05 096
Onshore Forw ards and NDF -115 -05 096
58
Figure 4 Gap-up opening in USDINR (August 2018)
Source Bloomberg
Our analysis also reveals that the speed of adjustment is very rapid relative to the baseline
Robustness test
The results are robust to the selection of time and tenure of the NDF For example instead of
India end-of-day (EOD) time as the NDF cut-off if we consider New York EOD as the NDF cut-
off there are no qualitative changes in the results Similarly instead of considering the 1-month-
NDF if we consider the 3-month-NDF the results essentially stay the same Furthermore given
the short time periods involved during stressed times (May to August 2013 and August to
November 2018) one can argue that co-integration equations may not be relevant We therefore
also carry out Granger causality tests for these time-periods and find the direction of causality to
be just above ie NDF rates are driving onshore rates during stress periods and not vice versa
Controlling both ldquoMeanrdquo and ldquoVolatilityrdquo spillovers
Thus far our focus has been on mean spillovers However as found by Misra and Behera (2006)
there are also potential ldquovolatilityrdquo spillovers from the NDF market to the spot and forward market
To model the coexistence of both mean and volatility spillovers we use a multivariate generalised
autoregressive conditional heteroskedasticity (MGARCH) model The degree of volatility
59
spillovers is measured by estimating dynamic conditional correlations between the markets The
empirical analysis is conducted using daily data from April 1 2009 through March 29 2019 and
using the currency pairs for (i) NDF-Spot (ii) NDF-Forwards and (iii) NDF-Futures
This model examines simultaneous interactions of conditional returns and volatilities across the
markets In this modelling framework we examine the Granger-causality in mean and variance as
discussed in Behera (2018) The results corroborate the earlier results that there is bi-directional
mean spillovers between onshore and offshore markets (Table 7)
An important finding using this approach is that the impact of price spillover from offshore to
onshore remains up to substantial lags while that from onshore to offshore dissipate after one day
(Annexure II) This ensues from the result that the individual coefficient estimates in the mean
equations of BEKK-MGARCH model are found to be statistically significant up to 5 lags in the
regression of returns in onshore market on that of offshore market while in the opposite case the
coefficient of onshore return is statistically significant only for the first lag
Table 7 Granger-causality tests in Mean
Direction of Causality Results
Spot to NDF 1-Month Yes
Spot to NDF 3-Month Yes
Spot to NDF 6-Month Yes
NDF 1-Month to Spot Yes
NDF 3-Month to Spot Yes
NDF 6-Month to Spot Yes
Forward 1-Month to NDF 1-Month Yes
Forward 3-Month to NDF 3-Month Yes
Forward 6-Month to NDF 6-Month Yes
NDF 1-Month to Forward 1-Month Yes
NDF 3-Month to Forward 3-Month Yes
NDF 6-Month to Forward 6-Month Yes
Futures 1-Month to NDF 1-Month Yes
Futures 3-Month to NDF 3-Month Yes
Futures 6-Month to NDF 6-Month Yes
NDF 1-Month to Futures 1-Month Yes
NDF 3-Month to Futures 3-Month Yes
NDF 6-Month to Futures 6-Month Yes
Note Null hypothesis is rejected if the p-value in the Wald test is less than 5 per cent
60
Volatility spillover between markets are studied by examining the statistical significance of
individual coefficients Granger causality in variance tests and estimating the dynamic conditional
correlations Beginning with granger causality test results imply a bidirectional causal relationship
between volatilities in both onshore and offshore markets of 1-month maturity segments only
(Table 8) In normal times no volatility spillovers are observed across the markets in other
maturity segments which reverses in the period of increased uncertainty (as found from Granger-
causality-in-variance tests taking into account asymmetric effects) The results from individual
coefficient estimates indicate about the presence of short-term volatility spillover between the
markets while the long-term volatility transmission is statistically significant from NDF market
to onshore spot forward and futures markets Moreover the asymmetric coefficients in variance
equation provide interesting insights ndash with the evidence of rise in volatility spillover from onshore
to offshore market in case of rupee appreciation while the opposite happens ie the volatility
spillover increases from NDF market to onshore market in the episodes of rupee depreciation
(Annexure II)
Table 8 Granger-causality tests in Variance
Direction of Causality Results
Without Asymmetry Effect With Asymmetry Effect
Spot to NDF 1-Month No Yes
Spot to NDF 3-Month No Yes
Spot to NDF 6-Month No Yes
NDF 1-Month to Spot No Yes
NDF 3-Month to Spot No Yes
NDF 6-Month to Spot No Yes
Forward 1-Month to NDF 1-Month Yes Yes
Forward 3-Month to NDF 3-Month No Yes
Forward 6-Month to NDF 6-Month No Yes
NDF 1-Month to Forward 1-Month Yes Yes
NDF 3-Month to Forward 3-Month No Yes
NDF 6-Month to Forward 6-Month No Yes
Futures 1-Month to NDF 1-Month Yes Yes
Futures 3-Month to NDF 3-Month No Yes
Futures 6-Month to NDF 6-Month No Yes
NDF 1-Month to Futures 1-Month Yes Yes
61
NDF 3-Month to Futures 3-Month No Yes
NDF 6-Month to Futures 6-Month No Yes
Note Null hypothesis is rejected if the p-value in the Wald test is less than 5 per cent
In order to understand how the volatility spillover between the markets changed over time a
variant of MGARCH model viz dynamic conditional correlation (DCC) model as proposed by
Engle (2002) is estimated taking the same pair of onshore-offshore exchange rate returns The
conditional volatility of 1-month NDF 1-month futures and their dynamic correlations are plotted
in Chart 249 The chart shows a sudden and significant rise in volatility during the episodes of
European debt crisis taper tantrum and latter part of 2018 coinciding with the rise in offshore-
onshore spreads resulting from the concerns regarding high current account deficits and large
capital outflows It is important to note that the volatility in NDF market is higher compared to
futures market and the divergence between the two gets accentuated in the times of heightened
uncertainty This in turn in conjunction with the rise in information asymmetry results in a drop
in correlations Since volatility spillover increases from offshore to onshore markets as discussed
earlier during periods of heightened uncertainty the volatility in onshore market increases
following the heightened volatility in offshore market In subsequent periods the correlation
increases indicating about the rise in spillovers A closer examination of the data on the volatilities
in two markets shows that volatility increases in offshore market first before it increase in onshore
markets with a lag of 1 to 2 days The correlations being positive and substantially higher imply a
significant degree of spillovers between the markets
9 The conditional volatilities for other pairs are qualitatively almost similar though their dynamic correlations are
different the dynamic correlations are provided in Chart 25
62
The dynamic correlations of volatilities for different pairs are presented in Chart 25 reveal that
that all the correlations were highly integrated and moving together alike until end December 2014
However the apparent structural changes in correlation process were observed since then with the
trends of correlations of NDF with spot and forward moving in one direction and that of NDF and
Futures moving on the opposite direction until mid-2017 The correlations have started coupling
though still continuing with some gaps between them since July 2017
060
065
070
075
080
085
090
095
00
05
10
15
20
25
30
2009 2010 2011 2012 2013 2014 2015 2016 2017 2018
Chart 24 Time-varying Volatility and Correlations Futures and
NDF
1-month Futures 1-month NDF DCC (right scale)
63
Conclusions and Implications
Since the work on establishing onshore-offshore price linkages in India was relatively sparse
outdated and inconclusive the goal of this Chapter was to create an updated empirical fact base
given the rapidity with which capital markets have developed and integrated and the pace at which
the NDF market has grown The overall results present a bidirectional relationship between
onshore and offshore markets
First that for full sample the price linkages ndash both mean and volatility ndash are found to be
bidirectional Both onshore and offshore rates have a strong long-term relationship and that when
a shocks throws that relationship into disequilibrium both onshore (spot and forward) and offshore
rates converge towards each other This suggests both influence each other This is consistent with
earlier findings in literature and should not be surprising Relative volumes across these market
are very dynamic and vary significantly When the bulk of the volumes flow through the onshore
050
055
060
065
070
075
080
085
090
095
100
2009 2010 2011 2012 2013 2014 2015 2016 2017 2018
Chart 25 Dynamic Conditional Correlations of Volatilities
SPOT_NDF1 SPOT_NDF3 SPOT_NDF6 FW1_NDF1 FW3_NDF3
FW6_NDF6 FUT1_NDF1 FUT3_NDF3 FUT6_NDF6
Forwards
Futures
Spot
64
market it becomes the locus of price discovery The converse is true when the bulk of volumes
are routed through the NDF market which then becomes the principle pole of price discovery
During the last two stress episodes (the taper tantrum and the 2018 EM crisis) however the
relationship turned unidirectional with the NDF market driving onshore spot and forwards and
the speed of adjustment from any disequilibrium increasing very sharply compared to ldquonormalrdquo
times Furthermore volatility spillovers also increased from offshore markets to onshore during
the periods of heightened uncertainty There is however an interesting asymmetry There is
evidence of rise in volatility spillover from onshore to offshore market in case of rupee
appreciation while the opposite happens ie the volatility spillover increases from NDF market to
onshore market in the episodes of rupee depreciation
All told as NDF volumes have increased they have begun to play an important role in both price
discovery and driving volatility particularly during heightened uncertainty periods
65
Chapter 4
International Financial Service Centre (IFSC)10 ndash Use of Rupee derivatives
The Task Force (TF) is vested to examine the role if any IFSC can play in addressing the concerns
arising out of offshore Rupee markets Presently Rupee is not permitted to be traded in the IFSC
This chapter discusses the aspects relevant to availability of non-deliverable Rupee derivatives in
the IFSC and permitting banks (IFSC Business Units or IBUs) to deal in such derivatives Before
discussing the potential benefits and concerns from the aforesaid proposition it is important to
address this issue ndash Are markets in IFSC onshore or offshore In the context of the Rupee market
a critical test for deciding the residency of the market would be applicability of capital controls in
respect of taking and exiting positions under FEMA 1999 Inter alia this is the critical aspect in
difference between the price discovered in onshore and offshore market As the IFSC functions
outside the capital controls under FEMA 1999 type of participants and the price discovered in
Rupee markets here will align with the existing offshore markets and therefore it cannot be treated
as onshore market To sum up while legally IFSC is very much an entity on the shores of India
from the point of view of Rupee markets it has to be treated as an offshore entity
Potential benefits of permitting non-deliverable Rupee derivatives in the IFSC
i Bringing NDF market volume to the IFSC Over the last decade or so a significant
market share in financial services related to India has moved to other international financial
centres like Singapore Hong Kong and London Bringing this business to India is clearly
beneficial in terms of economic activity and employment gains for India Further the size
and growth of the offshore Rupee derivative market poses a significant challenge to the
efficiency of price discovery as well as the effectiveness of exchange rate management
policy The possibility that the exchange rate of the Rupee not a fully convertible currency
being materially determined by transactions largely outside the legal and regulatory
influence of India is a matter of concern Given the favourable tax regime tax and by virtue
10
International Financial Services Centre or lsquoIFSCrsquo has the same meaning given in Section 2 (q) of the Special
Economic Zones Act 2005 (28 of 2005)
66
of it being outside the capital controls under FEMA 1999 IFSC may bring volumes and
price discovery to India
ii Complete bouquet of financial services in the IFSC Currently exchanges in IFSC are
permitted to offer a well-diversified range of products spanning various asset classes
which include derivatives on Indian indices derivatives on Indian stocks derivatives on
foreign stocks cross currency derivatives commodity futures on Gold Silver and base
metals etc Further while listing and trading of Masala Bonds is permitted in the IFSC
hedging Rupee exchange rate risk on it is not permitted Thus introduction of Rupee
derivatives will complete the entire range of asset classes available for trading in the IFSC
iii Access to market information The offshore Rupee market has been the subject matter of
interest for all stakeholders as these markets have an impact on onshore markets However
in the absence of any authentic data there are varying estimates about the volumes traded
in these markets nature of participation extent of open interest and the extent to which
these markets are used for hedging purposes If by opening up the IFSCs to Rupee trades
there is some migration of offshore Rupee market volumes it will help the cause of better
information flow regarding the market
iv Level playing field for Indian banks Foreign bankrsquos branches outside India can deal in
the offshore market as they are not bound by the RBIrsquos regulations On the other hand
overseas branches of Indian banks cannot deal in Rupee derivatives in the offshore market
By introducing Rupee derivatives in IFSC and permitting IBUs to deal in such derivatives
a more level playing field can be provided to Indian banks to service non-residents
Concerns from non-deliverable Rupee derivatives trading in the IFSC and dealing by IBUs
such derivatives
i Cannibalizing onshore business One major concern arising out of the introduction of
non-deliverable Rupee derivatives in the IFSC is whether it would cannibalize the business
of the onshore market instead of importing volumes from abroad Since the products in
both IFSC and the onshore market would be more or less similar in terms of characteristics
the domestic futures market getting gradually cannibalized by the IFSC on the face of it
appears probable But a deeper analysis of the comparative regulatory framework would
allay such concerns to a large extent The domestic currency futures market is majorly
67
made up of resident participation Non-residents are nearly absent in these markets and
hence their shift to the IFSC is more a theoretical proposition Since the Indian residents
are not permitted to participate in the IFSC they cannot contemplate a move-over It also
important to note that the onshore market settles in INR whereas derivative contracts in
the IFSC would settle in dollars and hence these markets will cater to two distinct classes
of participants
ii Impact on exchange rate management policy and development of the onshore market
Presently Indian banks are not allowed to deal in Rupee derivatives in the offshore market
A detailed discussion on the issue of allowing such dealing is presented in Chapter 5 In
consideration of the risk that participation of Indian banks may improve liquidity in the
offshore market and undermine the development of the onshore market the TF is of the
view of that Indian banks should not be permitted to deal in offshore Rupee market IFSC
being an offshore centre all concerns expressed in Chapter 5 in this regard are valid on
Rupee market in IFSC also However unlike other offshore Rupee market venues IFSC
has the potential of providing certain benefits to India as discussed earlier in this chapter
and therefore a distinction could be made between the two while examining the case of
permitting Rupee derivatives to be traded in the IFSC
iii Spillover of risks from IFSC to onshore market This is a concern since the two
markets being geographically contiguous could create porous leakage channels This
concern can be addressed by stipulating distinct net open position limits for entities
operating in both IFSC and on-shore In other words the open positions of entities
operating in the IFSC should not be permitted to be netted off with the open position on-
shore
What does a volatile Rupee exchange rate in the IFSC imply for the RBI and onshore
market
Chapter 3 establishes the linkages between the offshore and onshore Rupee market IFSC being an
offshore jurisdiction will have the same impact The RBI as the monetary authority has the
authority under RBI Act to maintain the stability of the rupee A volatile onshore foreign exchange
market could act as the trigger point of volatility in other financial markets like money bonds and
68
equities The spill over impact of financial market volatility casts its shadow on asset prices and
in turn it could have an impact on the capital flows and financial stability Given that a separate
regulator is envisaged for the IFSC the issue of RBIrsquos role in the IFSC was extensively deliberated
by the TF There are two possible approaches
i RBI plays a pivotal role in framing the Rupee derivative regulation in the IFSC In
order to allow the RBI to take measures in line with the objectives of exchange rate
management policy the sine qua non for allowing Rupee derivatives in the IFSC is to
ensure that RBI vested with the obligations to maintain financial and monetary stability
should continue to perform its statutory role in determining the regulatory framework for
Rupee market in the IFSC
ii Treat it akin to any other offshore market and maintain a hands-off approach The
objective of introducing Rupee derivatives in the IFSC is to provide an alternative to non-
residents for dealing in non-deliverable Rupee derivatives The expected transition of
investors is likely to be successful only if the IFSC functions with same freedom as other
offshore markets At the same time from an exchange rate management perspective
permitting Rupee trading in IFSC should not make a material difference to local authorities
as long as there is a barrier between the onshore market and IFSC In that case IFSC would
be exactly of the same status as any other offshore market
The TF feels that in line with the objectives of permitting Rupee derivatives in the IFSC the latter
approach - that the regulatory environment in which Rupee trades in IFSC is exactly similar to the
environment that prevails in any other offshore centre - is preferable As IFSCs are treated on par
with a foreign jurisdiction in terms of FEMA the regulation of the trade and capital flow channels
between the two jurisdictions (on-shore and IFSCs) should be so designed as to restrict the
transmission of volatility through these channels (in terms of participants products limits etc)
Recommendation
While there are concerns around impact on the onshore market due to trading in Rupee derivatives
in the IFSC there are potential benefits in terms of IFSCrsquos ability to offer complete bouquet of
financial services and availability of market information to all stakeholders Further given Indiarsquos
69
economic growth it may be appropriate to prepare for greater financial integration with the rest of
the world Sequencing and timing of measures relating to currency markets is a critical component
of such integration Although at the moment there is no definite path ahead in terms of such
integration but a thriving Rupee market in the IFSC may provide a system which can be leveraged
towards this end in the way and manner deemed fit in future IFSC being outside the capital
controls provides an opportunity to policymakers to test new regimes and products in an
environment whose repercussions may not significantly impact the stability or efficiency of the
onshore system On balance the TF is of the view that non-deliverable Rupee derivatives may be
introduced in the IFSC However a phased approach may be adopted and to start with trading
may be permitted only on exchanges due to the inherent transparency and risk management
benefits offered by it Introducing OTC contracts may be considered at a later stage after the
experience gained from trading on exchanges RBI may in its Financial Stability report assess the
impact of the functioning of IFSC on the financial stability of the country
Further the TF is of the view that entities regulated and permitted by the RBI may be permitted
to make market and run positions in Rupee derivatives market in the IFSC In order to prevent
spill over of risks from IFSC to onshore market though these entities a distinct net open position
limit may be stipulated for their operations in the IFSC In other words the open positions of
entities operating in the IFSC should not be permitted to be netted off with their open position
the onshore market
Finally given the mandate of RBI to implement exchange rate policy it may not be in benefit of
things to introduce Rupee derivatives in the IFSC without it being on board and therefore the TF
feels that Rupee derivatives may be permitted in the IFSC subject to agreement of the RBI
70
Chapter 5
Issues and Recommendations
The Task Force (TF) is entrusted to recommend measures to incentivize non-residents to access
the onshore Rupee derivative market and address concerns if any arising out of the offshore
Rupee derivative market As discussed in Chapter 1 the TF had interactions with various
categories of stakeholders to understand their perspective on the matter and identify the issues that
needs to be addressed
Chapter 2 and 3 have clearly brought out the increased importance of offshore Rupee markets
both in terms of their size and in terms of their impact on the exchange rate of the Rupee The price
and volatility spillovers from one market to the other are almost complete they are bi-directional
and when rupee is under pressure they are unidirectional from offshore markets to onshore
markets The speed of convergence of the markets is also quite quick The TFrsquos recommendations
have been made in the light of available information results of statistical analysis and most
importantly on the feedback received from various consultations
While increased participation of non-residents would be expected to enhance liquidity in the
onshore market it may also bring along with it additional volatility and transfer of incremental
risk to the domestic system This is particularly so as historically the rupee is a currency that has
generally depreciated and the demand for forward dollars is usually more than the supply
especially in times of stress Hence it is pertinent to examine the impact of incremental hedging
by non-residents in the onshore market While volatility in the rates have a clear impact on the real
sector events in the domestic derivatives markets in the late 2000s constantly remind us of issues
related to transfer of risk to entities that are not capable of understanding and managing it The big
question then is whether our system today is ready for incremental demand for hedging from non-
residents Available data is inadequate to measure the contribution of hedgers and speculators in
the offshore market turnover Using the best available information it can be estimated that an
additional daily average Rupee derivative turnover of around 08 billion ndash 24 billion could be
generated in the onshore market if all the INR NDF hedging transactions are transferred from the
offshore market (see Box 1) Such an incremental flow is not significant enough to cause any
adverse impact on volatility in the onshore market given that the user-driven deliverable forwards
market in India is quite liquid with daily average turnover of USD 163 billion (as per BIS
71
Quarterly Review December 2016) As regard transfer of risk to the domestic system the concern
is more regarding transfer of risk to the Indian companies and less towards market-makers as they
are in the business of managing risk There is a possibility that the said incremental positions
created in the onshore market may get transferred to Indian companies (in part or full depending
upon the level of these positions retained by the market-makers) However in comparison with
the late 2000s Indian companies today are only allowed to enter into Rupee derivatives depending
on their underlying exposure and no leveraged structures are permitted Also banks are bound by
stringent suitability and appropriateness norms Therefore the chances of Indian companies
acquiring unmanageable risk positions or risks due to mis-selling by market-makers are very low
Further there has been a significant growth in the external sector and consequently the foreign
exchange market has also grown (although one could argue on the incommensurate growth) To
summarize in the last decade or so the ecosystem on the whole has evolved and is less prone to
adverse impact from transfer of risks from non-residents
Box 1
Approximation of share of hedging transactions in INR NDF turnover
The graph presented below is extracted from BIS Quarterly Review December 2016
72
It can be observed from the above graph that non-financial and other financial institutions
contribute around 5 and 35 respectively to the turnover of INR NDFs in the offshore market
If one were to make an informed guess that all transaction by non-financial companies are hedging
transactions and that hedging transactions by other financial companies (eg funds) would
constitute maximum 25 of their transaction then it can be approximated that hedging transactions
constitute around 5 - 15 of the daily average turnover in INR NDF market which was reported
as USD 164 bn
Comparison of turnover in forwards in onshore and offshore market - In the same publication
it is also reported that the average daily turnover in onshore deliverable forwards is USD 163 bn
It may be noted that for fair comparison with the turnover in offshore market (where deliverable
spot and swap market doesnrsquot exist) this turnover includes both deliverable forwards and FX
swaps A comparative analysis of volumes in onshore and offshore market ndash both OTC and
exchange traded Rupee derivatives - is given in Annexure IV
Issues and recommendations
1 Market hours
An important reason for the existence of the offshore Rupee derivative market is simple geography
That domestic markets are closed when major users in certain regions (eg the United States) are
working creates a natural access for offshore markets Also significant international developments
impacting the Rupee exchange rate take place outside the onshore market hours thereby creating
a natural clientele for the offshore markets The feedback received from non-resident investors as
well as corporates highlighted the closure of the local market as an important reason for them
accessing the offshore market Exchanges have for some time been requesting an extension of
market hours citing increasing Rupee transaction volumes in offshore exchanges situated in
Singapore and Dubai A straightforward way of taking care of such requirements is to extend the
onshore market hours (both OTC and exchange traded derivative markets) While extending
market hours might involve simultaneously keeping support services (payment and settlement
systems) or support markets (funding markets) open it is also possible to treat such transactions
as part of the operations of the next day in which case the need for settlement or funding does not
73
arise In this regard the TF supports the recommendations relating to market timings outlined in
the draft Report of the Internal Working Group on Comprehensive Review of Market Timings
published by RBI on July 10 2019
Recommendation 1
The TF recommends that the onshore market hours be suitably extended to match the flexibility
provided by the offshore market and thereby incentivize non-residents to hedge in the onshore
market
2 Competitive pricing
One important feedback from foreign portfolio investors (FPIs) as well as global corporates was
that they are unable to access multiple competitive quotes in the onshore market Effectively they
are limited to using the prices of their custodian banks Generally FPIs deal only with their
custodian banks due to the existing rules whereby the custodian is responsible for tracking of
outstanding hedges vis-agrave-vis portfolio size This ldquofrictionrdquo issue can be addressed by shifting the
monitoring to a centralized agency which can use a technology solution to track exposures as well
as outstanding hedges This is further explained in recommendation no 4 ahead relating to
underlying exposure
Also the process to be setup documentation such as KYC and other trading arrangements with
multiple counterparties in India is a long and difficult exercise resulting in most FPIs either trading
with their custodian bank or using the offshore market to hedge Some of the documentation related
challenges can be minimized if the centralized KYC registration currently in place for SEBI
regulated entities is extended to all the entities ie both custodial banks as well as non-custodial
banks This is elaborated in recommendation no 11 on the KYC process
Another issue highlighted by FPIs in this context was unavailability of multi-dealer electronic
dealing platforms for them One way of making onshore prices more widely accessible to non-
residents is to allow Indian banks to freely offer prices as liquidity providers to non-resident
customers at any time whether or not the domestic market is open They can extend to non-resident
corporates the same choices that domestic corporates have in choosing among various market
makers This can be done either by a domestic sales team or by using staff located at overseas
74
branches In addition making an all-to-all trading platform (like the FX-Retail being introduced
in August 2019) available to non-residents would supplement that effort
Recommendation 2
The TF recommends that banks may be allowed to freely offer prices to non-residents at all times
out of their Indian books either by a domestic sales team or by using staff located at overseas
branches Also wide access to the FX-Retail trading platform to non-residents would be a major
incentive to use the onshore market
3 Effect of offshore Rupee derivative market on onshore price discovery and exchange rate
management policy
The size and growth of the offshore Rupee derivative market especially in the last few years poses
a significant challenge to the efficiency of price discovery as well as the effectiveness of exchange
rate management policy A comparison of onshore and offshore Rupee derivative market is given
in Annexure IV The possibility that the exchange rate of the Rupee not a fully convertible
currency will be materially determined by transactions largely outside the legal and regulatory
influence of India is a matter of concern The most straightforward approach to deal with that
concern would be to completely liberalize the onshore market and bring it at par with the offshore
market in all aspects Such a scenario would imply an effective absence of local regulation and
intervention which is incompatible with the current status of capital account convertibility
Another option is to liberalise the onshore market to the extent possible but this in itself may not
necessarily mean a fall in importance or size of the offshore market In this connection the TF
extensively discussed the proposition of creating a connection between the offshore and onshore
markets by permitting Indian banks to deal in the offshore market The various implications of
such a step are discussed below
i Reduction in volatility In theory a segmented market would be less liquid and therefore
more volatile compared to an integrated market One could also infer that offshore market
activity is maximum during onshore working hours eg almost three-fourths of the
offshore rupee futures are traded when Indian markets are open It is also observed that
75
offshore spreads are larger which indicates a relative scarcity of market-making entities
Linking the two markets may increase both the customer base as well as the liquidity
providers thereby improving liquidity as well as efficiency of the price discovery process
ii Better customer pricing through increased transparency in the offshore market
Today very little information is available regarding the offshore Rupee market other than
that of exchange traded instruments Such opacity is not in the interest of customers as
liquidity provision is limited to entities that have a presence both onshore and offshore
resulting in a premium (in terms of high bid-ask spreads) being charged for market access
Broadening this access to onshore banks would drive away such premium through wider
competition At the same time access to information improves for the local authorities
Since better information leads to better price efficiency it is in the interest of local
authorities to disseminate such information leading to an overall improvement in market
transparency
iii Level playing field for Indian banks Foreign bankrsquos branches outside India can deal in
the offshore market as they are not bound by the RBIrsquos regulations On the other hand
overseas branches of Indian banks cannot deal in Rupee derivatives in the offshore market
Allowing them access to the offshore Rupee derivative market would create a level playing
field for Indian banks
iv Impact on development of the onshore market Liquidity in onshore market is better
than the offshore market due to participation of real sector and market making by Indian
banks which obviously are the major Rupee liquidity providers Consequently non-
residents have the ability to exit positions with less impact cost in unfavourable times This
is a strong incentive for them to hedge in the onshore market (given dynamic hedging and
other operational issues are now being ironed out) Also higher liquidity in the onshore
market results in tighter bid-ask spread compared to the offshore market which allows non-
residents to get better pricing in the onshore market The aim of policy measures is to
develop the onshore market Accordingly policymakers strive to protect the advantages of
onshore market and at the same time develop and liberalise the onshore market to overcome
the gap vis-agrave-vis NDF markets in other aspects such as ease of access market infrastructure
and taxation There is of course the risk that participation of Indian banks will improve
76
liquidity in the NDF market and undermine the development of the onshore market Such
a situation will be challenging for implementing exchange rate management policy
Recommendation 3
The onshore Rupee derivatives market is currently more deep and liquid as compared to the
offshore Rupee market and participation of the Indian banks in the offshore market might over
time take away this advantage The TF feels that the downside of permitting Indian banks to deal
in the offshore Rupee derivative market outweighs the advantages and therefore recommends that
Indian banks should not be permitted to deal in the offshore Rupee derivative market for the
present
4 Requirement of underlying exposure and documentation therefor
There is no requirement of an underlying exposure to enter into a derivative contract in the offshore
Rupee derivative market Hence non-residents can freely trade in this market to hedge risk on an
underlying Rupee exposure or create exposure to Rupee However as per extant regulations non-
residents can enter into Rupee derivative contracts in the onshore market only for the purpose of
hedging risk arising from an underlying exposure Non-residents are classified into Foreign
Portfolio Investor (FPI) investors having Foreign Direct Investments Non-Resident Indian Non-
resident Exporters and Importers and Non-Resident lenders having ECBs designated in INR with
each category being subjected to a different set of rules for establishing underlying exposure
FPIs are allowed to hedge only on the basis of existence of underlying exposure with the hedge
size capped at the market value of investment in equity and debt in India as on a particular date
including any coupon receipts arising out of investment in debt securities falling due during the
following twelve months only The explicit mention of only equity and debt investments creates
regulatory ambiguity on hedging of other FPI exposures in India such as margin deposits cash
etc Hence any FPI having investment in India will be able to only buy USD forward against INR
onshore and will not be allowed to sell USD against INR in forward market as that would result in
increasing the exposure rather than hedging the exposure To prove the exposure a valuation
certificate is required to be provided by a designated AD bank (Custodian) as a proof of underlying
FPIs are also required to provide a declaration to the effect that their total outstanding hedges are
within the market value of their investments The only exception to establishing underlying
77
exposure requirement is dealing in exchange traded market where FPIs are allowed to take
positions without having to establish existence of underlying exposure up to USD 100 million
FDIs are allowed to hedge both their existing investment as well as proposed foreign direct
investments with the latter being allowed only after an AD bank ensures that all necessary
approvals for the investment have been obtained by the FDI With respect to non-resident
corporates users can hedge their exposures invoiced in INR and intercompany loans denominated
in INR (ECBs) They can book the hedge either directly with an AD bank in India or on a back-
to-back basis Prior to hedging they must furnish a declaration certifying that the underlying
exposure has not been hedged with any other AD bank(s) in India They are required to cancel the
hedge contract immediately if the underlying exposure is cancelled In case of a central treasury
an authorization from the entity having INR exposure to hedge on its behalf is also required
Irrespective of the category of the investor the requirement to establish underlying exposure
creates practical difficulties for many non-residents Funds who intend to execute macro hedge for
various schemes or MNC parents wanting to consolidate exposures across subsidiaries and
executing a single hedge find it easier to execute consolidated hedge in the offshore market Also
hedging of anticipated and economic exposures is not permitted
Recently the RBI has released11 draft regulation regarding risk management facilities for public
feedback The TF reviewed it in detail and also received feedback on it during interaction with
stakeholders The proposed regulation satisfactorily addresses a lot of pertinent issues Measures
on simplifying eligible underlying exposure criteria simplifying documentation requirement
flexibility to hedge dynamically ability to hedge anticipated exposures user classification (retail
and non-retail) and choice of products are welcome and much needed It is noted that the
requirement of having an underlying exposure for entering into Rupee derivative contract is
retained and it is felt that it is justified for effectiveness of exchange rate management policy and
ensuring financial stability Given that only hedging transactions are going to be permitted in the
onshore market there will remain a requirement to establish or declare existence of underlying
exposure to risk and also to ensure that notional of hedge contracts is in line with the value of
underlying exposure As discussed above such requirement acts as a deterrent for non-residents to
hedge in the onshore market It would be optimum if a solution can be found that fulfils the
11
Vide press release dated February 05 2019
78
requirement of verification of underlying exposure without the investors being required to
undertake the efforts to prove it This can be achieved by consolidating the existing data on
investments and hedge transactions residing with various regulated entities
Recommendation 4
The TF recommends that a technology-based solution be explored to centrally aggregate the
investments of non-residents and derivative contracts entered into by them in the onshore market
(both OTC and exchange traded) using LEI or any other unique identifier to start with ADs should
be allowed access to such aggregate data so that they can verify the quantum of derivative positions
and underlying investments of the non-residents This mechanism can potentially completely
remove the requirement of efforts from the non-residents to prove the existence of underlying
exposure to Rupee
Further to simplify procedures and provide ease of access to the exchange traded currency
derivative market the RBI has allowed users to enter exchange traded instruments (futures and
options) to take exposure up to USD 100 million without the requirement of establishing the
existence of underlying risk Such measures go a long way in encouraging users (especially
MSMEs) to hedge their exchange rate risk by making the process easier At the same time such
calibrated opening helps in addressing any concerns of systemic risk The TF feels that such an
incentive must be provided in the OTC market also as it will not only contribute to ease of doing
business but also to restore parity in regulation between OTC and exchange markets
Recommendation 5
While requirement of underlying exposure will continue for trading in the onshore market users
may be allowed to undertake positions up to USD 100 million in OTC as well as exchange traded
currency derivative market without having to establish the underlying exposure
5 Products
Non-residents can enter into only plain vanilla forwards and option contracts in the OTC foreign
exchange market Further swaps are restricted to specific case of IPO and non-resident lenders of
ECB denominated in INR Non-residents who prefer to express their hedge using structured
79
options necessarily need to execute in the offshore market as current regulations do not allow non-
residents to enter into structured options
Recommendation 6
The aforesaid draft regulation addresses this issue by allowing ADs to offer any product to the
non-residents (for non-retails users) which satisfies the purpose for which they are permitted to
enter into Rupee derivatives ie hedging of underlying exposure to Rupee In other words ADs
cannot offer any product that creates risk for the user instead of hedging the existing risk The TF
endorses this principle-based regulation approach
6 Restrictions on dynamic management of risk
Non-residents trading in the offshore market are free to cancel and rebook their trades depending
on their future expectations andor risk management policy On the other hand in the onshore
market non-residents in general are not allowed to rebook a contract once cancelled Only in the
case of FPIs rebooking up to 10 of the value of contracts cancelled is permitted Inability to
manage risk dynamically deters non-residents who look for flexibility while hedging their risks
The aforesaid draft regulation proposes to remove restrictions on rebooking of cancelled contracts
and thereby allow users to hedge dynamically For contracts entered into for hedging contracted
exposure gains (or losses) on cancellation will be passed on to the user as and when they accrue
but in case of contracts entered into for hedging anticipated exposures net gains will be transferred
only when the underlying cash flow has occurred The prime purpose of such stipulation is to curb
incentives for speculation by using the liberal position limits available under anticipated exposure
hedging However a consequent drawback is that in some instances eg contingent contracts
such as bidding for projects involving currency risk such a provision would not be equitable This
provision could be suitable amended to enable all types of hedging without compromising the
essential control that the cash flow requirement provides to ensure underlying in a hassle-free way
The TF is of the view that providing suitable discretion to banks to pass on net gains even without
cash flows in such cases would address this shortcoming This will ensure that genuine hedgers
80
will access the onshore market without worrying about retention of gains if underlying transaction
does not fructify due to reasons beyond their control
Recommendation 7
In line with the objective of bringing onshore market at par with offshore market the most obvious
path is to not have any restrictions on transfer of gains in case of anticipated exposure hedging
However a balancing act is necessary between liberalizing the market while preventing
speculative positions which can create undue volatility in the onshore market Keeping this in
mind while endorsing free dynamic hedging (without any restriction on cancellation and
rebooking) for hedging contracted exposure the TF recommends that in case of hedging of
anticipated exposures gains from cancellation of contract may be allowed to be passed on even in
cases where there are no cash flows at the discretion of the bank where the bank considers the
cancellation of underlying cash flow is due to external factors which are beyond the control of the
user
7 Gross settlement and credit risk management
In the case of offshore Rupee derivative market non-residents clear and settle OTC trades either
through a prime brokercustodian or bilaterally with the counterparty In both these cases the non-
residents usually execute a bilateral multi-currency master service agreement which includes
provisions for exchange of margin (ex- ISDA master agreement including Credit Support Annex)
with the counterparty These agreements necessitate periodic settlement of marked-to-market gains
and losses across products and provide the flexibility to net off losses against gains Hence these
agreements significantly lower credit charges and provide strong netting efficiency On the other
hand in the onshore market the non-residents in an otherwise identical situation will face
additional challenges in respect of settlement and exchange of margin due to the following reasons
Gross settlement of gains As mentioned above non-residents clear and settle OTC trades in the
offshore Rupee derivative market either through a prime broker or bilaterally with the
counterparty Typically they settle deal across assets and currencies with either of these entities
and are therefore able to net the cash flows and achieve efficiency in liquidity management
81
However as Rupee derivatives entered into in the onshore Rupee derivative market cannot be
settled under such overseas arrangements non-residents are unable to avail the benefits of netting
on their onshore transactions
Credit risk management Signing a master service agreement locally and establishing credit lines
with onshore banks increases the execution cost of hedging onshore Typically transactions of
non-residents in the offshore market are collateralized (through collateral exchange provisions
contained in the master service agreement) while those in the onshore market are non-
collateralized Depending on the credit rating of the non-resident the onshore banks may not
necessarily be open to providing exposurecredit limits on uncollateralized basis for entering into
deliverable contracts If a collateralized credit line is set up through a master service agreement
with provision for exchange of collateral in USD outside India restrictions under FEMA 1999 on
exchanging margin outside India by onshore banks poses issues If exchange of collateral is in INR
in India then the non-residents will have to either assume the exchange rate risk on the cash margin
deposited or will have to additionally hedge the margin money placed Moreover this attracts
regulatory ambiguity such as minimum tenor restrictions as per deposit regulations ability to
hedge the margin through FX swap interest to be paid on cash in SNRR account etc If interest
cannot be paid on the collateral placed with onshore counterparties it creates a strong economic
disincentive for the investor to hedge onshore
These issues can be addresses in two ways First facilitating the non-residents to utilize their
existing overseas custodianprime broker relationship and master service agreements for
settlement of their transactions onshore and exchange of collateral therefor Second by creating
the regulatory framework for exchange of margin for non-centrally cleared derivatives in India to
make it consistent with evolving clearing mechanism offshore Both the solutions are discussed
below
To help non-residents retain their economic neutrality with respect to the prevailing multi-currency
master service agreement executed offshore a central clearing and settlement mechanism may be
established for non-residentsrsquo deals with onshore counterparties along the lines of central clearing
and settlement of onshore interbank deals by the CCIL The overseas bank of the non-resident will
clear and settle the deals execute by them onshore To be sure the proposal is to introduce the
centralized clearing mechanism while retaining the existing bilateral settlement mechanism so that
82
investors who want to continue using it do not face disruption For the suggested central clearing
and settlement mechanism to be set up inter alia the following permissions would also be
required
i Permission under FEMA 1999 for CCIL to accept foreign currency denominated collateral
in India or outside India
ii Enhancement of CCILrsquos infrastructure to accept wide range of securities (foreign currency
cash securities issued by foreign governments etc) as collateral and
iii Other regulatory clearances required for non-residentsoverseas banks in other jurisdictions
to clear and settle through CCIL
Further back-to-back hedging by non-residents proposed in the aforesaid draft regulation will also
allow effective utilization of their prevailing multi-currency CSA arrangement offshore This
entails allowing non-residents to hedge their exposure with their banking counterpart overseas
which in turn will hedge the position back-to-back with an onshore bank This ensures that existing
dealing arrangements between non-residents and their overseas counterparties remain unchanged
but at the same time the market risk gets transferred to onshore banks and hence is managed locally
The overseas bank should be allowed to settle the onshore leg either bilaterally with the onshore
bank or through the proposed central clearing and settlement mechanism Also this will require
permissibility under FEMA 1999 to exchange margin with the overseas banker of non-residents
outside India In such a model the approach should be to recognize the intermediary offshore bank
as a facilitator purely for the convenience of the non-resident investor Experience from other
markets that have implemented such models like Malaysia and China suggest that putting the onus
of monitoring compliance in terms of quantum of hedge underlying documentation etc on the
intermediary bank is inefficient Such a requirement leads to the intermediary bank asking for
various indemnities from the client and these are often difficult and time consuming to negotiate
and sign The approach should be to monitor compliance by the non-residents as the regulated user
using available onshore infrastructure as well use of technology solutions to track the hedges vis-
a-vis underlying exposure as detailed in recommendation 5
With regard to regulation and infrastructure for exchange of margin for non-centrally cleared
derivatives in India the RBI released a discussion paper on this issue in May 2016 However the
final directions have not been issues yet It is understood that ambiguity in netting legislation is
83
one of the main issues holding the release of these directions Also it is understood that the GoI is
in the process of making legislative changes to address this issue
Recommendation 8
For ease of entering into hedge transactions for non-residents the TF recommends-
i Establishment of a central clearing and settlement mechanism for non-residentsrsquo deals in the
onshore market
ii Back-to-back hedging by non-residents proposed under the draft regulation is endorsed The
overseas bank should be allowed to settle the onshore leg either bilaterally with the onshore bank
or through the proposed central clearing and settlement mechanism
iii Implementation of margin requirement for non-centrally cleared OTC derivatives in the
onshore market at the earliest
iv Allowing Indian banks to post margin outside India This is not only relevant for credit risk
management for their transactions with non-resident users but also for their cross-border inter-
bank transactions
8 Taxation
Under the extant regulatory framework non-residents are permitted to enter into Rupee derivative
contracts only for hedging risk on their investmentslendingtrade in India As per discussions with
stakeholders the following position is generally adopted with regard to the gains from such
contracts
bull Where currencies under the contract are delivered ndash Not a taxable event (ie conversion of
one currency into another does not give rise to taxable income)
bull Where contract is cancelled and price difference is settled ndash If the derivative contract is
entered into for hedging exchange rate risk on a capital asset then gains on cancellation are
treated as capital gains If it is entered into for hedging exchange rate risk in relation to a
tradingbusiness asset such gains are treated as business profits
84
However it is understood that there is ambiguity in the rules in this connection and the position
taken by the Assessing Officers (AOs) differs between zones and is at variance with the aforesaid
position Oftentimes such gains on cancellation are treated as lsquoOther Incomersquo or lsquoSpeculation
Business Profitsrsquo During interaction with the non-residents it was suggested that such uncertainty
of tax treatment is one of the prime reasons why they do not access the onshore market and instead
hedge Rupee exposures in the off-shore market
Recommendation 9
The TF recommends that the competent authorities may examine the issue of taxation in respect
of foreign exchange derivative contracts with the objective of overcoming gaps between tax regime
in India and other major international financial centres (Singapore Hong Kong and London) to
the extent possible and thereby incentivizing non-residents to hedge in the onshore market
9 Allow non-deliverable Rupee derivatives in the IFSC and permit IBUs to deal in such
derivatives
The proposition of introducing non-deliverable Rupee derivatives in the IFSC and permitting
banks (IFSC Business Units or IBUs) to deal in such derivatives is discussed in detail in Chapter
4 While there are concerns around impact on the onshore market due to trading in Rupee
derivatives in the IFSC there are potential benefits in terms of IFSCrsquos ability to offer complete
bouquet of financial services and availability of market information to all stakeholders Further
given Indiarsquos economic growth it may be appropriate to prepare for greater financial integration
with the rest of the world Sequencing and timing of measures relating to currency markets is a
critical component of such integration Although at the moment there is no definite path ahead in
terms of such integration but a thriving Rupee market in the IFSC may provide a system which
can be leveraged towards this end in the way and manner deemed fit in future IFSC being outside
the capital controls provides an opportunity to policymakers to test new regimes and products in
an environment whose repercussions may not significantly impact the stability or efficiency of the
onshore system On balance the TF is of the view that non-deliverable Rupee derivatives may be
introduced in the IFSC However a phased approach may be adopted and to start with trading
may be permitted only on exchanges due to the inherent transparency and risk management
85
benefits offered by it Introducing OTC contracts may be considered at a later stage after the
experience gained from trading on exchanges RBI may in its Financial Stability report assess the
impact of the functioning of IFSC on the financial stability of the country
Further the TF is of the view that entities regulated and permitted by the RBI may be permitted to
make market and run positions in Rupee derivatives market in the IFSC In order to prevent spill
over of risks from IFSC to onshore market though these entities a distinct net open position limit
may be stipulated for their operations in the IFSC In other words the open positions of entities
operating in the IFSC should not be permitted to be netted off with their open position the onshore
market
Recommendation 10
The TF recommends that non-deliverable Rupee derivatives (with settlement in foreign currency)
may be allowed to be traded in the IFSC and IBUs may be allowed to deal in such derivatives with
a distinct FCY-INR position limit To start with exchange traded currency derivatives involving
Rupee may be introduced and with experience non-deliverable OTC currency derivatives
involving Rupee may also be allowed
10 KYC process
The extant directions issued by the Reserve Bank of India stipulates the documents required for
conducting KYC process to open accounts of non-residents Similarly SEBI has also prescribed
documents required for the granting of FPI license by Domestic Depository Participants (DDP)
Further KYC documents for FPIs are available to SEBI regulated entities through KRAs subject
to approval from either the FPIs or the domestic custodians Since access to KRAs is available
only to SEBI regulated entities most banks are not allowed to access KRA and hence seek
complete documentation from FPIs again Such repetitive submission of documents to various
financial intermediaries results in long lead time for on-boarding and makes the entire process
operationally cumbersome for non-residents
Recommendation 11
The TF recommends that the KYC registration may be centralized across the financial market with
uniform documentation requirement All regulated financial market intermediaries should be
provided access to the centralized registry and they should be allowed to rely on online registry
86
for confirmation that KYC has been completed and itrsquos valid This will ensure that non-residents
undertake the KYC process only once and not with each financial intermediary that they deal with
in the onshore market Also such a mechanism offers cost and efficiency benefits for the financial
intermediaries
87
Annexure I
Key features of currency market of major EMEs
I USD-RMB Market ndash China
Onshore Deliverable - CNY Offshore Deliverable - CNH
Market
Turnover
Daily average turnover USD 28
billion
Daily average swap and
forward turnover
USD 62
billion
Daily average options
turnover
USD 15
billion
Daily average
turnover
USD 15-20
billion
Daily average
forward turnover
USD 25-30
billion
Daily average
Options turnover
USD 5-6 billion
Spot foreign
exchange Onshore CNY foreign exchange spot is
available with documentary proof of an
underlying transaction
Participating banks in Hong Kong
provide two types of spot RMB
exchange rate transactions
- For trade service and direct
investment purposes where
resulting foreign exchange
positions can be offset with the
clearing bank or onshore
correspondent banks and
For general purposes where banks need
to warehouse the risk or offset the
position in the interbank USD-CNH
market Forward
FXSwaps CNY forwards and foreign exchange
swaps with maturities of up to five years
are available to onshore institutions to
hedge foreign exchange exposure
subject to documentary proof of the
same
Most liquid is in the tenor of one year or less
CNH deliverable offshore forwards
are available out to five years
Liquidity has improved significantly
and has surpassed turnover in the
NDF market
FX Options Onshore market participants can buy or
sell common European options of CNY
against foreign currencies on a real
needs basis
Tenors are available out to three years
with further tenors on a case-by-case
basis Most liquid is in the tenor of one
year or less
The State Administration of Foreign
Exchange (SAFE) started allowing
corporates to sell FX options from August
2014 on a real needs basis and with net
settlement allowed
Deliverable CNH options are
available without restrictions to any
non-individual counterparty that has
a physical CNH Nostro account in
Hong Kong
Options on USD-CNH and CNH crosses
are available out to five years and
beyond on a case-by-case basis
88
Access to
domestic
participants
On the current account the CNY is
convertible subject to genuine
documentation Onshore entities can
access the local forwards market
provided these contracts are used to
cover current account transactions
subject to documentary proof available
on settlement
On capital account CNY conversions
may be settled by way of voluntary
settlement in banks if these are required
in the Companiesrsquo institutionsrsquo actual
business operation Typically all capital
account transactions need to be
registered with SAFE for local forwards
Not easily accessible to onshore
residents approvals required for transfer
of funds from Onshore to Offshore
Access to
Offshore
participants
Qualified
Foreign
Institutional
Investor
All allowed subject to
principle of actual
needs (Quota
restrictions exists
on underlying
investments)
Can trade via their
custodian or domestic
financial institution
Central
Banks
No quota restrictions
ability to trade as
interbank counterparty
in the domestic market
ndash bilateral or
anonymous trading
China
Interbank
Bond market
(CIBM)Bond
Connect
For OIIs (Overseas
Institutional Investors)
accessing making
CIBM investment can
enter
into all FX products on
actual needs basis with
settlement agent banks
Change in CIBM
investment position
requires adjustment to
the FX hedges within
5 working days
All customers can open a RMB account
in Hong Kong Banks can provide
customers with general purpose RMB
accounts which allow free transfers of
funds (offshore) for any purpose In
general all FX products are allowed in
CNH for offshore investors
Trading
Hours 10 AM ndash 4 PM Local China Hours 10 AM ndash 4 PM Local China Hours
89
II USD-KRW Market - Korea
Features Onshore Deliverable Offshore Non-Deliverable
Market Turnover Average daily turnover
USD
Billion
Spot Forward Swaps
2011 191 75 192
2012 180 66 198
2013 183 71 196
2014 175 76 190
2015 200 83 192
2016 194 96 184
2017 196 101 198 Source Bank of Korea
As per London clearing house
(LCH) Ltd the daily turnover of
NDF cleared by them on April
16 2019 is a total of USD 119
billion (Source LCH)
As per SEF turnover as on April
12 2019 is USD 379 million
(Source SEF)
Daily NDF turnover has
increased from USD 195 billion
in 2013 to USD 30 billion in
2016 (Source BIS 2016 survey)
Access to
domestic
participants
Residents can hold unlimited
amounts of foreign currency in
foreign currency bank accounts and
Korean firms can maintain foreign
currency accounts abroad
Financial institutional investors
have access to the local forwards
market and can hedge their
investment exposure without
confirming the lsquoexistencersquo of the
investment
Forward position limits of foreign
bank branches (FBBs) and local
banks registered as FX Banks in
Korea as below
- For FBBs positions are
capped at 200 per cent of the
previous month-end equity
capital
- For local banks forward
positions are capped at 40 per
cent of the previous month-
end equity capital
- Corporate customer foreign
currency hedging limits are
100 per cent of customersrsquo
exposure or their transaction
of underlying real assets
Residents may hold foreign
currency accounts domestically
or abroad
Corporate investors and
individual investors are required
to confirm the existence of the
investment
In the case of capital or current
account transactions domestic
residents can remit up to USD 50
000 per year freely
Access to
Offshore
participants
Non-residents can hold KRW
locally through bank accounts
Foreign investors must open special
investment purpose accounts
No restrictions and BoK does not
regulate the same
90
Source Bank of Korea BIS HSBC Research
which consist of an exclusive
external account for investment and
an exclusive non-resident domestic
currency account for investment
Foreign investors are allowed to
freely convert foreign currency into
KRW without any underlying
securities purchases while the
converted funds are being
transferred within exclusive
external investment accounts
However the converted funds in
the exclusive external account for
investment should still be used for
the purpose of securities
investment
Non-Resident Investors holding
Investment Registration Certificates
(IRC) sale proceeds from the
investment in securities can be
freely repatriated
Central Bank
intervention
BOK is now releasing a quarterly
intervention report on a net basis
They generally only comment that
they intervene only in exceptional
basis for smoothing operations
Bank of Korea does not access the
NDF market
Trading Hours 9 AM ndash 330 PM local Korea time Available through time zones
Taxation and
Repatriation of
FX Gains
All gains on unwind of deliverable
transactions are freely repatriable
without any tax
All gains on unwind of non-
deliverable transactions with
onshore banks are freely repatriable
without any tax
91
III USD-MYR Market ndash Malaysia
Onshore Deliverable Offshore Non-Deliverable
Market Turnover - Daily inter-bank market USDMYR
spot turnover around $500 million
- Daily inter-bank market USDMYR
swap turnover around $30 billion
- As per LCH Ltd UK Clearing
house the daily turnover of
USDMYR NDF cleared by them
on April 16 2019 is a total of
USD 332 million from 82 trades
(LCH website)
- As per SEF a trading platform
USDMYR turnover as on April
12 2019 is USD 205 million
from 18 trades (SEF website)
- As per the Hong Kong exchange
the NDF turnovers in 2016 were
around USD 50 billion and have
reduced to approximately USD
20 billion in 2018 (HKMA NDF
report 2018)
Access to Domestic
participants
- Resident counterparties such as
importers and exporters can use
currency options and forward
contracts to manage their foreign
exchange risk
- Residents are allowed to enter into
hedging arrangements on committed
current account transactions and
financial account transactions
- All forward contracts must be
supported by an underlying trade or
capital account-related transaction
allowed under the Foreign Exchange
Administration Rules
- Residents are allowed to freely
hedge and un-hedge their foreign
currency exposure for USD-MYR
CNH-MYR GBP-MYR EURMYR
and JPY-MYR currency pairs
without documentary evidence up to
an aggregate net open position of
MYR 6 million per bank
Not allowed
Access to Offshore
participants
- Licensed onshore banks and
approved investment banks are
allowed to enter into FX forward
Open and not regulated by the
central bank
92
Source Bank Negara Malaysia BIS HSBC Research
contracts with non-residents as
follows
Forward FX purchase or sale
contracts against MYR for
current account transactions
Forward FX purchase or sale
contracts against MYR based on
committed purchases or sales of
MYR assets The forward
contracts can be entered into at
the point when the non-resident
commits to purchase or sell the
MYR assets
- Dynamic hedging programme offers
flexibility to actively manage FX risk
exposure via forward hedging
activities with onshore banks or
Appointed Overseas Office (AOO)
without any documentation
CCP used Malaysian Exchange Not mandatory but LCH used
regularly
Central Bank
intervention
Through appointed agent banks Not applicable
Fixing to settle
NDF
NA KL USDMYR Reference rate
Trading Hours - Trading hour is 9 AM to 6 PM Local
Time Limited FX liquidity
available for non-residents post local
trading hours
- USDMYR is also quoted by
appointed overseas offices for spot
value only for any underlying asset
trades - post local trading hours No
forward prices are quoted
Quoted across time zones
Taxation and
Repatriation of FX
Gains
All gains on cancelled FX Contracts
are freely repatriable and do not
attract taxation in Malaysia
Taxed based on jurisdiction
93
IV USD-IDR Market - Indonesia
Onshore Deliverable Offshore Non-Deliverable Onshore Non-Deliverable
Market
Turnover
Average
daily spot
turnovers
USD 1bn
Average
daily swap
turnovers
USD 500
million
As per LCH Ltd - the
daily turnover of
USDIDR NDF cleared
by them on April 16
2019 is a total of USD
41 billion from 832
trades
As per SEF USDIDR
turnover as on April 12
2019 is USD 33 million
from 11 trades (Source
SEF)
As per HKTR Jan 2018
reporting the outstanding
IDR NDF turnover on
the Hong Kong exchange
of is around USD 40
billion (Source HKMA
NDF report 2018)
NDF
average size
USD 5m
Access to
Domestic
participants
Foreign currency against IDR
transactions between banks and
domestic parties over a certain
amount must have an underlying
transaction
Not Allowed Allowed but will need to
demonstrate underlying
documents
Access to
Offshore
participants
Non-residents must have
underlying IDR
assetliabilityreceivablepayable
to be able to enter into IDR cash
FX andor FX hedge BI list all the
permissible underlying activities
along with recommended
documentation format
Open and not regulated by
Bank Indonesia
Allowed but will need to
demonstrate underlying
documents
BI published a more-
stringent list of
permissible underlying
activities
Benefits Pricing uses onshore-curve
driven by onshore participants
and BI intervention
Not regulated and no
need for underlying
documentation
Prices available across
time zones
Can generated IDR
exposures without
having an underlying
asset in IDR
Pricing uses onshore-
curve driven by onshore
participants and BI
intervention (explanation
below) BI appears to
have a much bigger-
capacity to manage since
the product is net-settled
in IDR
94
Source Bank Indonesia BIS HSBC Research
Clients with IDR FX
exposure but no urgent
need for principal-
exchange As example
long-term IDR bond
investors
Limitations Requirement for underlying
docs limit the maximum
exposure that foreign Clients
can take
BI restricts Domestic Banks
from having residual-risk
when dealing Derivatives with
Related-Parties (locally
incorporated banks only)
Convertibility risk Requirement for
underlying docs limit the
maximum exposure
Foreign Clients can take
Clients with actual need
for principal-exchange
due to basis-risk between
[JISDOR fixing] vs
[actual FX rate] eg
Coupon repatriation and
BI restricts domestic
banks from having
residual-risk when
dealing derivatives with
related parties (locally
incorporated banks only)
Central
Bank
intervention
BI intervenes only in the onshore
market via Cash FX Onshore DF
and Onshore DNDF These can
be done via auctions or bilateral
OTC trades as there is no
onshore futures market for IDR
Bank Indonesia does not
access the NDF market
BI has the ability to intervene
in the DNDF market
although the market is very
new
Fixing to
settle NDF
Not Applicable JISDOR (USD-IDR)
JISDOR (USD-IDR)
Trading
Hours
Trading hours is from 8 AM ndash
12 PM Local Time and 1 PM
ndash 4 PM (Market breaks for
lunch between 12 PM ndash 1
PM)
USD-IDR is also quoted by
banks offshore for Spot value
only for any underlying asset
trades post local trading hours
No Forward prices are quoted
Quoted across time zones 8 AM ndash 12 PM Local
Time 1 PM ndash 4 PM
(Market breaks for lunch
between 12 PM ndash 1 PM)
Taxation
and
Repatriation
of FX Gains
As per market practice gains on
any unwindcancellation of FX
hedges are not passed to Non-
Residents
Taxed as per jurisdiction As per market practice gains
on any unwindcancellation
of FX hedges are not passed
to Non-Residents
95
V USD-BRL Market - Brazil
Features Onshore Deliverable Offshore Non-Deliverable
Market Features Average daily spot USD 8 billion
Onshore B3 USD 14 billion
Average daily options
turnovers
USD 15 billion
Offshore NDF
turnover daily
USD 4
billion
Market Hours Market hours is 0900 to 1800 Hours
However liquidity is highest between 10
am ndash 12 pm and 2 pm ndash 4 pm local
hours
96
VI USD-TWD Market - Taiwan
Features Onshore Deliverable Offshore Non-Deliverable
Market
Features Average Daily
Spot
Turnovers
USD 3-4 billion
Average Daily
Swap
turnovers
USD 2-3 billion
Average
Options
Turnovers
USD 150 million
Average daily
turnovers
USD 2-4 billion
Market
Turnovers
- Onshore total Spot turnovers in
USDTWD for March 2019 were USD
31560 billion (Average daily turnover of
~ USD 10 billion)
- Data related to USDTWD swaps is not
readily available but total swaps amp
forwards dealt onshore (across currency
pairs) is ~ 5750 of the FX turnovers
USD 11504 billion in April 2016 (last
available data) [Source BIS]
Access to
Domestic
participants
There are no limits on the TWDrsquos trading
range versus other currencies but there are
convertibility limits on the capital account
- Access to domestic participants are
not allowed
- Local banksrsquo overseas branches to
participate in the TWD NDF
market These banks will also be
subject to the existing cap on net
NDF positions at 20 per cent of
each bankrsquos FX position (last
revised lower from 33 per cent in
December 2010)
Access to
Offshore
participants
Non-Resident
Foreign investors are allowed to enter
into onshore swapforward contracts for
hedging underlying investment in
Taiwan
FINIs (Foreign Institutional Investors)
can only conduct buy USDsell TWD
contract and the total contract amount
entered into by a foreign investor should
not exceed FINIs USD and TWD net
remitted-in capital (ie total remitted-in
funds minus total remitted-out funds)
Access to foreign exchange is divided
into three categories
- import and export
Open and not regulated by the central
bank
97
- cost of trade-related services
- Investments capital repatriation and
dividends
Currency options are permitted
For FINIsFIDIs all transactions must be
documented regardless of the amount
On the maturity of FX forward (or
forward leg of a swap deal) FINI may
have the following decisions
- To settle the contract on the maturity
day as originally dealt In this case
FINI needs to ensure sufficiency of
existing account balance That is
settlement of FX forward should
come from the existing funds in
Taiwan or funds from sale proceeds
of underlying investments
- To extend (ie rollover) the contract
to another period in this case on the
maturity day FINI has to settle the
difference between the original
forward contract rate and the mark-
to-market rate
If FINI rollovers the contract upon
maturity and incurs a gain upon rollover
the gain will be credited to the FINIs
account in Taiwan Such gain will be
treated as other income derived in
Taiwan
CCP used Taipei Exchange (TPEx) acts as the Central
Counter Party for and also covers all foreign
exchange transactions made by authorized
foreign exchange banks and offshore banking
units
Not mandatory but LCH used regularly
Central Bank
intervention
Central bankrsquos FX intervention is via agent
banks in the OTC market where onshore
TWD is traded One of the mechanisms
through which local currency pressure is
absorbed is through modulation of hedge
ratio of Lifers
Not applicable
Fixing to
settle NDF
NA Central bankrsquos FX intervention is via
agent banks in the OTC market where
onshore TWD is traded
Bloomberg TRY11ltIndexgt
Trading
Hours
- 9 AM ndash 4 PM Local Time
- Market breaks for lunch at 12 PM ndash 2 PM
Quoted across time zones
98
Source CBC BIS HSBC Research
Taxation and
Repatriation
of FX Gains
If FINI rollovers the contract upon
maturity and incurs a gain upon rollover
the gain will be credited to the FINIs
account in Taiwan Such gain will be
treated as other income derived in
Taiwan and therefore subject to 20
standard withholding tax In case that FX
loss incurs due to rollover FINI may
arrange funding to cover the loss if
necessary
FINI can choose one of the following
methods to calculate and pay for the
relevant tax Please however note that
the method is not changeable once it is
decided If FINI does not confirm which
method to be used the option 1) will be
applied
- Withhold related tax on FX gain
from each rollover or
- Netting FX gainslosses from
rollover within the same year or
- Netting FX gainslosses from
rollover and the total remitted-in
principals revaluation gainloss in
the year
If the foreign investor adopts option 2) or
3) above they must appoint or contact
their existing local tax agent (if any) in
Taiwan to file annual tax return
Taxed based on jurisdiction
99
Annexure II
Appendix to Chapter 3
A bivariate BEKK-GARCH (11) model as proposed by Engle and Kroner (1995) can be specified with
the system of conditional mean equations consists of VAR(p) models (p = 1 n) as given in eq (1) and
variance equation as in eq(2)
119884119905 = 120583 + sum Γ119894119884119905minus119894 + 120576119905119901119894=1 (1)
where 119884119905 = (1199101119905 1199102119905) 1199101119905 is exchange rate return in onshore market and 1199102119905 is exchange rate return in
offshore market at time t The parameter vector 120583 = (1205831 1205832) represents constants and Γ is a 2times2 matrix of
autoregressive terms The diagonal elements 120574119894119894 measure own lagged effect of the variables while the off-
diagonal elements 120574119894119895 capture the mean spillover from variable i to variable j
Taking into account the asymmetric responses of volatility ie volatility tends to increase more in response
to negative shocks (bad news) than positive shocks (good news) in the variances and covariances as
proposed by Kroner and Ng (1998) a BEKK representation of conditional variance equation can be written
as
119867119905 = 119862prime119862 + 119860prime120576119905minus1prime 120576119905minus1119860 + 119861prime119867119905minus1119861 + 119863prime120585119905minus1
prime 120585119905minus1119863 (2)
where 120585119905 would be 120576119905 if it is negative and zero otherwise The Eq (2) can be written in matrix form as
follows
119867119905 = [11988811 011988821 11988822
] + [11988611 11988612
11988621 11988622]
prime
[1205761119905minus1
2 1205761119905minus11205762119905minus1
1205762119905minus11205761119905minus1 1205762119905minus12 ] [
11988611 11988612
11988621 11988622]
+ [11988711 11988712
11988721 11988722]
prime
[ℎ11119905minus1 ℎ12119905minus1
ℎ21119905minus1 ℎ22119905minus1] [
11988711 11988712
11988721 11988722]
+ [11988911 11988912
11988921 11988922]
prime
[1205851119905minus1
2 1205851119905minus11205852119905minus1
1205852119905minus11205851119905minus1 1205852119905minus12 ] [
11988911 11988912
11988921 11988922]
In the above model the dynamic process of 119867119905 is a linear function of its own lagged values lagged squared
innovations and the cross-product of the innovations and asymmetric terms Volatility transmission
channel between onshore and offshore markets is represented by the off-diagonal parameters in matrices A
and B while the diagonal parameters in those matrices capture the effects of their own past shocks and
volatility The diagonal parameters in matrix D measure the response own past negative shocks while the
100
off-diagonal parameters 119889119894119895 show the response of one market to the negative shocks in the another market
to be called the cross-market asymmetric responses
MGARCH-BEKK Parameter Estimates
Spot and 1-Month NDF 1-Month Forward and NDF 1-Month Futures and NDF
Variable Coeff P-value Variable Coeff P-value Variable Coeff P-value
Mean Equation
DSPOT(-1) -063 000 DFW1M(-1) -064 000 DFUT1M(-1) -063 000
DSPOT(-2) -052 000 DFW1M(-2) -054 000 DFUT1M(-2) -053 000
DSPOT(-3) -031 000 DFW1M(-3) -033 000 DFUT1M(-3) -033 000
DSPOT(-4) -015 000 DFW1M(-4) -018 000 DFUT1M(-4) -019 000
DSPOT(-5) -010 000 DFW1M(-5) -012 000 DFUT1M(-5) -010 000
DNDF1M(-1) 062 000 DNDF1M(-1) 063 000 DNDF1M(-1) 062 000
DNDF1M(-2) 047 000 DNDF1M(-2) 049 000 DNDF1M(-2) 048 000
DNDF1M(-3) 030 000 DNDF1M(-3) 033 000 DNDF1M(-3) 035 000
DNDF1M(-4) 022 000 DNDF1M(-4) 023 000 DNDF1M(-4) 027 000
DNDF1M(-5) 013 000 DNDF1M(-5) 015 000 DNDF1M(-5) 016 000
Constant 001 029 Constant 001 003 Constant 001 013
DSPOT(-1) 013 000 DFW1M(-1) 013 000 DFUT1M(-1) 011 001
DSPOT(-2) 003 053 DFW1M(-2) 002 046 DFUT1M(-2) 000 098
DSPOT(-3) 005 042 DFW1M(-3) 003 033 DFUT1M(-3) 002 064
DSPOT(-4) 005 033 DFW1M(-4) 005 015 DFUT1M(-4) 004 041
DSPOT(-5) 002 067 DFW1M(-5) 001 068 DFUT1M(-5) 002 058
DNDF1M(-1) -009 000 DNDF1M(-1) -009 000 DNDF1M(-1) -009 001
DNDF1M(-2) -007 015 DNDF1M(-2) -007 003 DNDF1M(-2) -005 022
DNDF1M(-3) -005 033 DNDF1M(-3) -004 012 DNDF1M(-3) -002 065
DNDF1M(-4) 001 086 DNDF1M(-4) 001 076 DNDF1M(-4) 003 052
DNDF1M(-5) 001 079 DNDF1M(-5) 002 052 DNDF1M(-5) 001 067
Constant 001 038 Constant 001 011 Constant 001 017
Variance Equation
C(11) 005 000 C(11) 005 000 C(11) 003 000
C(21) 005 000 C(21) 005 000 C(21) 003 000
C(22) -001 004 C(22) 001 000 C(22) 005 000
A(11) 027 000 A(11) 027 000 A(11) 014 000
A(12) 004 042 A(12) 005 032 A(12) -012 004
A(21) -004 029 A(21) -004 034 A(21) 007 010
A(22) 019 000 A(22) 018 000 A(22) 029 000
B(11) 096 000 B(11) 096 000 B(11) 098 000
B(12) -001 020 B(12) -002 003 B(12) 003 004
B(21) 001 037 B(21) 001 029 B(21) -001 048
B(22) 098 000 B(22) 098 000 B(22) 094 000
D(11) -023 001 D(11) 027 000 D(11) 020 001
101
D(12) -037 000 D(12) 035 000 D(12) 024 000
D(21) 022 000 D(21) -025 000 D(21) -016 000
D(22) 028 000 D(22) -028 000 D(22) -012 006
102
Annexure III
Evolution of Onshore Exchange Traded Currency Derivatives Market
Exchange Traded Currency Derivatives (ETCD) were launched in August 2008 in India with the
introduction of futures contracts on US Dollar-Rupee currency pair as the underlying
Subsequently in the year 2010 Rupee future contracts were allowed to trade against three other
currencies viz Euro Pound sterling and Japanese yen The options contracts were introduced on
US Dollar-Rupee currency pair in year 2010 The Reserve Bank of India (RBI) and Securities
Exchange Board of India (SEBI) allowed participation for all resident individuals including
corporates Trading Members and Banks in proprietary capacity on ETCD
In the year 2012 it was decided to lower the open position limits for banks on the back of volatility
in rupee and to exclude the positions in ETCD from Net Overnight Open Position Limit (NOOPL)
Thereafter in the year 2013 the Rupee depreciated sharply against USD due to huge capital
outflows in both equity and debt markets expectation of unwinding of Quantitative Easing by US
FED and increase in current account deficit Additionally the open position limits for the
participants were decreased and banks were restricted from participating on their own accounts in
the ETCD market further the participants were also prohibited from taking positions beyond
USD 10 million
In June 2014 Banks were allowed to engage in proprietary trading in ETCD markets Domestic
participants were allowed to have open position beyond USD 15 million subject to the evidence
of underlying exposure In 2018 this limit was raised to USD 100 million across all currency pairs
involving INR put together and combined across all exchanges
Foreign Portfolio Investors (FPI) and Non-Resident Indians (NRIs) were permitted to participate
in ETCD markets for hedging currency risk arising out of their investments in India in 2014 and
2017 respectively In February 2018 SEBI and RBI permitted currency derivatives on cross
currency pairs - EURUSD GBPUSD and USDJPY- and currency options on EURINR GBPINR
and JPYINR In December 2018 weekly options on US Dollar - Indian Rupee currency pair were
permitted As on date derivatives are available on seven currency pairs - USDINR EURINR
GBPINR JPYINR EURUSD GBPUSD and USDJPY
103
The exchange traded currency derivatives draws participation from diverse categories of
participants Some of the key participant categories include banks corporates trading members
foreign investors and other investors The following are the turnover of exchanges
FY National Stock Exchange of India (All figures in USD billions)
USD-INR futures USD-INR Options
(Notional turnover)
USD-INR Options
(Premium )
2014-15 32630 12618 052
2015-16 37374 26600 092
2016-17 31887 35271 107
2017-18 33818 37714 117
2018-19 57913 54183 204
FY
BSE (All figures in USD billions)
USD-INR futures USD-INR Options
(Notional turnover)
USD-INR Options
(Premium)
2014-15 20740 9609 081
2015-16 27713 13772 044
2016-17 27521 21034 045
2017-18 30146 37552 041
2018-19 45956 59350 051
FY Metropolitan Stock Exchange of India (All figures in USD billions)
USD-INR futures USD-INR Options
( Notional turnover )
USD-INR Options
( Premium )
2014-15 18274 593 593
2015-16 8433 646 646
2016-17 8233 367 367
2017-18 3032 491 491
2018-19 1060 245 245
104
Present Regulatory Framework (client limits open interest limits need for underlying
exposure etc)
a) Position limits for different client categories for FCY-INR currency pairs
bull Position limits of clients and Category III FPIs- The gross open positions of the client
across all contracts in the respective currency pairs shall not exceed the limits as mentioned
below
Currency Pairs
Position limits
USD-INR Gross open position across all contracts shall not exceed
6 of the total open interest or USD 10 million whichever
is higher
EUR-INR Gross open position across all contracts shall not exceed
6 of the total open interest or EUR 5 million whichever
is higher
GBP-INR Gross open position across all contracts shall not exceed
6 of the total open interest or GBP 5 million whichever
is higher
JPY-INR Gross open position across all contracts shall not exceed
6 of the total open interest or JPY 200 million whichever
is higher
bull Proprietary position limits of non-bank stock brokers- The gross open positions of the
proprietary account across all contracts in the respective currency pairs shall not exceed
the limits as mentioned below
Currency Pairs
Position limits
USD-INR Gross open position across all contracts shall not exceed 15
of the total open interest or USD 50 million whichever is
higher
EUR-INR Gross open position across all contracts shall not exceed 15
of the total open interest or EUR 25 million whichever is
higher
GBP-INR Gross open position across all contracts shall not exceed 15
of the total open interest or GBP 25 million whichever is
higher
JPY-INR Gross open position across all contracts shall not exceed 15
of the total open interest or JPY 1000 million whichever is
higher
105
bull Position limits of stock brokers (bank and non-bank) Category I and II FPIs- The
gross open positions of trading members across all contracts in the respective currency
pairs shall not exceed the limits as mentioned below
Currency Pairs
Position limits
USD-INR Gross open position across all contracts shall not exceed
15 of the total open interest or USD 100 million
whichever is higher
EUR-INR Gross open position across all contracts shall not exceed
15 of the total open interest or EUR 50 million whichever
is higher
GBP-INR Gross open position across all contracts shall not exceed
15 of the total open interest or GBP 50 million whichever
is higher
JPY-INR Gross open position across all contracts shall not exceed
15 of the total open interest or JPY 2000 million
whichever is higher
Domestic clients shall ensure that the position across exchanges is within the prescribed
limit of USD 100 million equivalent If position is in excess of USD 100 million
equivalent clients are required to provide disclosure of underlying exposure to Trading
Member as per existing practice
bull Proprietary positions created in FCY-INR pairs (USD-INR EUR-INR GBP-INR
and JPY-INR)
Single INR limit for proprietary
position for bank stock broker
Single INR limit for proprietary
position for non-bank stock broker
Higher of 15 of total OI across all
FCY- INR pairs or USD 200 million
Higher of 15 of total OI across all
FCY-INR pairs or USD 100 million
b) Position limit for Cross Currency Derivatives are given below
bull Position limits for stock brokers (banks and non-bank) Category I amp II FPIs
Domestic Institutional investors (DIIs) as permitted by the respective sectoral
regulators and AD Category-I banks-
106
Currency Pairs
Position limits
EUR-USD Gross open position across all contracts shall not
exceed 15 of the total open interest or EUR 100
million whichever is higher
GBP-USD Gross open position across all contracts shall not
exceed 15 of the total open interest or GBP 100
million whichever is higher
USD-JPY Gross open position across all contracts shall not
exceed 15 of the total open interest or USD 100
million whichever is higher
The aforementioned limits shall be the total limits available to the stock brokers for
taking positions on proprietary basis and for positions of their clients
bull Position limit for proprietary position of non-bank stock brokers-
Currency Pairs
Position limits
EUR-USD Gross open position across all contracts shall not
exceed 15 of the total open interest or EUR 50
million whichever is higher
GBP-USD Gross open position across all contracts shall not
exceed 15 of the total open interest or GBP 50
million whichever is higher
USD-JPY Gross open position across all contracts shall not
exceed 15 of the total open interest or USD 50
million whichever is higher
bull Position limits for Clients and Category III FPIs-
Currency Pairs
Position limits
EUR-USD Gross open position across all contracts shall not
exceed 6 of the total open interest or EUR 10
million whichever is higher
GBP-USD Gross open position across all contracts shall not
exceed 6 of the total open interest or GBP 10
million whichever is higher
USD-JPY Gross open position across all contracts shall not
exceed 6 of the total open interest or USD 10
million whichever is higher
107
Annexure IV
Comparison of onshore and offshore Rupee derivatives volumes
1 Exchange Traded Market
All figures in USD billions
Table Comparison between onshore and offshore exchange traded INR-USD Futures
FY Onshore Offshore Market Share
BSE NSE MSEI Total DGCX SGX CME Total Onshore Offshore
2014-15 21115 32491 9433 63040 31704 3704 396 35804 6378 3622
2015-16 27904 37241 4539 69685 32725 13906 1001 47631 5940 4060
2016-17 26528 31799 4300 62626 34149 17164 1636 52949 5419 4581
2017-18 30360 33729 1761 65851 33458 28047 5232 66737 4967 5033
2018-19 44820 57237 648 102705 35452 37599 7475 80526 5605 4395
Note-
i Data for BSE NSE amp MSEI is from Exchange websites for USDINR Futures
ii Data for DGCX SGX and CME is from Bloomberg and India INX Research
iii Data for DGCX includes INRUSD Futures (including mini contract) but excludes the USDINR Index
Quanto futures
iv Data for CME includes the Mini and Micro contracts
v Data for FY 2018-19 is from April 01 2018 to March 22 2019
2 OTC Market (as per BIS Quarterly Review December 2016)
108
Annexure V
Meetings held by the Task Force
Sr No Date Venue External Participants Invited
1 March 19 2019 RBI Mumbai
2 March 25 2019 RBI Mumbai -Shri Ananth Narayan Professor SPJMIR
-FEDAI
-Select corporates
3 April 04 2019 RBI Mumbai -Shri G Padmanabhan Former Executive
Director RBI
-Dr V Anantha Nageswaran Dean IFMR
Chennai
-GIFT City IFSC
-National Stock Exchange Ltd
-BSE Ltd
4 April 23 2019 RBI Mumbai -Select FPIs (through audio conference)
5 May 14 2019 RBI Mumbai -Select FDIs (through audio conference)
6 May 31 2019 RBI Mumbai -Shri G Padmanabhan Former Executive
Director RBI
-FIMMDA
-CCIL
-IBA
7 June 20 2019 RBI Mumbai -Smt Shyamala Gopinath Former Deputy
Governor RBI
8 July 04 2019 SEBI Mumbai -Shri G Padmanabhan Former Executive
Director RBI
9 July 10 2019 RBI Mumbai -Smt Shyamala Gopinath Former Deputy
Governor RBI
109
Annexure VI
References
A Santaella Julio (2015) ldquoCurrency carry trades in Latin Americardquo Bank for International
Settlements BIS Paper No 81
Behera Harendra Kumar (2011) ldquoOnshore and offshore market for Indian rupee recent evidence
on volatility and shock spilloverrdquo Macroeconomics and Finance in Emerging Market Economies
Vol 4 No 1 March 2011 pp 43ndash55
Cadarajat Yayat and Lubis Alexander (2012) ldquoOffshore And Onshore IDR Market An Evidence
On Information Spilloverrdquo Bulletin of Monetary Economics and Banking April 2012
Capital Account Safeguard Measures in the ASEAN Context (2019) ASEAN Working Committee
on Capital Account Liberalisation Bank Indonesia Occasional Papers OP12019
Colavecchio Roberta and Funke Michael (2006) ldquoVolatility transmissions between renminbi and
Asia-Pacific onshore and offshore US dollar futuresrdquo BOFIT Discussion Papers Bank of
Finland Institute for Economies in Transition No16
Darbha Gangadhar (2012) ldquoA Tale of One Asset and Two Markets ndash Analysis of Dynamic
Interactions between On- and - Off Shore Marketsrdquo macrofinancenipfporginPDF13-
11sl_Darbha_NDFNimranapdf
DING David K Tse Y and Williams M The Price Discovery Puzzle in Offshore Yuan
Trading Different Contributions for Different Contracts (2012) Financial Management
Association International Conference Research Collection Lee Kong Chian School Of Business
Doukas J and H Zhang (2013) ldquoThe performance of NDF carry tradesrdquo Journal of International
Money and Finance vol 36 September pp 172ndash90
Goyal R R Jain and S Tewari (2013) Non deliverable forward and onshore Indian rupee market
a study on inter-linkages Reserve Bank of India Working Paper Series 112013 December
Guru Anuradha (2009) ldquoNon-Deliverable Forwards Market for Indian Rupee An Empirical
Studyrdquo Indian Journal of Economics and Business Vol 8 No 2 pp 245-260
Higgins Patrick and Owen F Humpage (2005) ldquoNondeliverable Forwards Can We Tell where
the Renminbi Is Headedrdquo Federal Reserve Bank of Cleveland September
Hutchison Michael Jake Kendall Gurnain Pasricha Nirvikar Singh (2009) ldquoIndian Capital
Control Liberalisation Evidence from NDF Marketsrdquo NIPFP Working Paper No 200960
110
Indira Gandhi Institute of Development Research (IGIDR) Finance Research Group (2016)
ldquoFeatures and trends of NDF markets for emerging economy currencies a study of the Indian
rupeerdquo IGIDR working paper March
Ishii Shogo İnci Oumltker-Robe and Li Cui 2001 Measures to Limit the Offshore Use of
Currencies Pros and Cons IMF Working Paper WP0143
Lipscomb Laura (2005) ldquoAn Overview of Non-Deliverable Foreign Exchange Forward Marketsrdquo
Federal Reserve Bank of New York May
Ma G C Ho and R McCauley (2004) The markets for non-deliverable forwards in
Asia BIS Quarterly Review June pp 81-94
Maziad Samar and Kang Joong Shik RMB Internationalization OnshoreOffshore Links (May
2012) IMF Working Paper No 12133
McCauley R C Shu and G Ma (2014) ldquoNon-deliverable forwards 2013 and beyondrdquo BIS
Quarterly Review March pp 75ndash88
McCauley RN Shu C (2016) ldquoNon-deliverable forwards impact of currency internationalisation
and derivatives reformrdquo Technical report Bank of International Settlements
McCauley Robert N and Scatigna Michela Foreign Exchange Trading in Emerging Currencies
More Financial More Offshore (March 2011) BIS Quarterly Review March 2011
Misra Sangita and Behera Harendra (2006) ldquoNon Deliverable Foreign Exchange Forward
Market An Overviewrdquo RBI Occasional Papers Vol 27 No3
Park Jinwoo (2001) ldquoInformation flows between non-deliverable forwards (NDF)and spot
markets Evidence from Korean currencyrdquo Pacific Basin Finance Journal Vol 9 (4) pp363-377
Ryoo Sangdai and Kwon Taeyong and Lee Hyejin Foreign Exchange Market Developments
and Intervention in Korea (October 2013) BIS Paper No 73o
Sarwono Hartadi A (2005) ldquoIndonesian policy on non-residentsrsquo participation in the money
market the restriction of rupiah transactions by non-residents and foreign currency credit offered
by banks to non-residentsrdquo BIS Paper No 23
Standing Council on International Competitiveness of the Indian Financial System (2015)
International competitiveness of currency equity and commodity derivatives markets Department
of Economic Affairs Ministry of Finance
Wang Kai-Li Fawson Christopher and Chen Mei-Ling (2007) ldquoInformation Flows among
Exchange Rate Markets What Do We Learn From Non-Deliverable Forward Markets in Asiardquo
Chaoyang University of Technology October
111
Watanabe K H Akama and J Mifune (2002) ldquoThe effectiveness of capital controls and
monitoring the case of non-internationalisation of emerging market currenciesrdquo EMEAP
Discussion Paper January

2
3
Contents
Letter of Transmittal
Abbreviations
Acknowledgements
Preface
Executive Summary
Chapters
1 Introduction 12
2 Evolution of the offshore rupee markets and cross-country experience 20
3 Linkages between offshore and onshore rupee markets New evidence 46
4 IFSC ndash Use of Rupee derivatives 65
5 Issues and Recommendation 70
Annexures
4
Abbreviations
ABS ndash Association of Banks in Singapore
AD ndash Authorised Dealer
AED ndash Arab Emirates Dirham
BI ndash Bank Indonesia
BIS ndash Bank for International Settlements
BoE ndash Bank of England
BKPM ndash Investment Coordinating Board in Indonesia
BRL ndash Brazilian Real
CAC ndash Capital Account Convertibility
CCIL ndash Clearing Corporation of India Ltd
CME ndash Chicago Mercantile Exchange
CNH ndash Chinese Yuan (Offshore)
CNY ndash Chinese Yuan (Onshore)
CPI ndash Consumer Price Index
CSA ndash Credit Support Annex
DF ndash Deliverable Forward
DGCX ndash Dubai Gold and Commodities Exchange
DNDF ndash Domestic Non-Deliverable Forward
EM ndash Emerging Market
EME ndash Emerging Market Economy
ETCD ndash Exchange Traded Currency Derivatives
EUR ndash Euro
FBIL ndash Financial Benchmarks India Ltd
FCY ndash Foreign Currency
FDI ndash Foreign Direct Investment
5
FEC ndash Foreign Exchange Committees
FED ndash Federal Reserve Board
FEMA ndash Foreign Exchange Management Act 1999
FPI ndash Foreign Portfolio Investor
FSP ndash Final Settlement Price
FSS ndash Financial Supervisory Services (FSS) in Korea
FX ndash Foreign exchange
GDP ndash Gross Domestic Product
GIFT City ndash Gujarat International Financial Tec-City
HKMA ndash Hong Kong Monetary Authority
HKTR ndash Hong Kong trade repository
IFC ndash International Finance Corporation
IFSC ndash International Financial Service Centre
IDR ndash Indonesian Rupiah
INR ndash Indian Rupee
IMF ndash International Monetary Fund
IRC ndash Investment Registration Certificate
ISDA ndash International Swaps and Derivatives Association
JISDOR ndash Jakarta Inter-bank Spot Dollar Rate
JIBOR ndash Jakarta Interbank Offered Rate
JPY ndash Japanese Yen
KRA ndash KYC Registration Agency
KRW ndash Korean Won
KYC ndash Know Your Customer
LEI ndash Legal Entity Identifier
MIFOR ndash Mumbai Interbank Forward Offer Rate
MSEI ndash Metropolitan Stock Exchange of India Ltd
MYR ndash Malaysian Ringgit
6
NDF ndash Non Deliverable Forward
NOOPL ndash Net Overnight Open Position Limit
NRI ndash Non Resident Indian
NSE ndash National Stock Exchange
OIS ndash Overnight Indexed Swaps
OTC ndash Over the Counter
PBoC ndash Peoplersquos Bank of China
RBI ndash Reserve Bank of India
RMB ndash Renminbi
SEBI ndash Securities and Exchange Board of India
SFEMC ndash The Singapore Foreign Exchange Markets Committee
SGX ndash Singapore Exchange
SNRR ndash Special Non-Resident Rupee Account
TF ndash Task Force on Offshore Rupee Market
TWD ndash Taiwanese Dollar
USD ndash United States Dollar
7
Acknowledgements
The Report of the lsquoTask Force on Offshore Rupee Marketsrsquo was made possible with the support
of a number of individuals and organisations The Task Force would like to gratefully acknowledge
representatives of various banks financial institutions large corporates in India and abroad
foreign portfolio investors asset managers industry bodies experts and practitioners who
interacted with the Task Force and provided their valuable inputs and suggestions
The Task Force greatly benefitted from the experience of Smt Shyamala Gopinath former Deputy
Governor Reserve Bank of India and Shri G Padmanabhan former Executive Director Reserve
Bank of India who took time out of their busy schedules to attend the meetings of the Task Force
as special invitees
The Task Force benefitted from the interactions with Dr T V Somanathan IAS Additional Chief
Secretary Government of Tamil Nadu Shri R Sridharan Managing Director CCIL Dr V
Anantha Nageswaran Dean IFMR Chennai Shri Ananth Narayan Associate Professor SPJIMR
Dr A K Nag Shri Himadri Bhattacharya and Shri Jamal Mecklai CEO Mecklai Financial
Services
The Task Force invited submissions from members of the public and is grateful for several helpful
suggestions received
The Task Force also places on record the assistance provided by Shri Subrat Kumar Seet Director
and Smt Priyanka Sachdeva Manager from Department of Economic and Policy Research
Reserve Bank of India and Shri Hiren Sanghvi Director and Shri Saket Banka Associate Director
from HSBC India The Task Force specifically acknowledges the contribution of Shri Harendra
Behera Assistant Adviser Department of Economic and Policy Research Reserve Bank of India
in research on lsquoLinkages between Offshore and Onshore Rupee Marketsrsquo undertaken in
collaboration with Shri Sajjid Chinoy Chief Economist J P Morgan India
Finally the Task Force would like to commend the efforts put in by the Secretariat team from the
Financial Markets Regulation Department Reserve Bank of India led by Shri Supriyo
Bhattacharjee Deputy General Manager and supported by Shri Nitin Daukia Manager
Meticulous organisation of meetings by Smt Supriya Devalekar Assistant Manager and Shri
Kaivalya Sakalgaonkar Assistant from the Secretariat team is also appreciated
8
Preface
Offshore markets in a non-convertible currency usually referred to as non-deliverable forward
(NDF) markets enable trading of the non-convertible currency outside the influence of the
domestic authorities These contracts are settled in a convertible currency usually US Dollars as
the non-convertible currency cannot be delivered offshore Historically NDF markets evolved for
currencies with foreign exchange convertibility restrictions and controlled access for non-
residents beginning with countries in South America like Mexico and Brazil and thereafter
moving on to emerging Asian economies viz Taiwan South Korea Indonesia India China
Philippines etc Apart from enabling trading in non-convertible currencies NDF markets have
also gained in prominence because of onshore regulatory controls and their ease of access
Reserve Bank has been guided by the objective of developing a deep and liquid on-shore foreign
exchange market that acts as a price setter globally With regard to non-resident entities having
legitimate exposure to the Rupee the focus of policy efforts has been to align incentives for non-
residents to gradually move to the domestic market with adequate safeguards to ensure the
external stability of the value of the Rupee
The sharp growth in the offshore trading volumes in the Rupee NDF market in recent years likely
even beyond the volumes in the onshore markets have raised concerns around the forces that are
determining the value of the rupee and the ability of authorities to ensure currency stability This
necessitates a deeper understanding of the causes underlying the growth in those markets and
identification of measures to reverse the trend
The Task Force on Offshore Rupee Markets was set up to address that concern It was mandated
to study the factors attributable to the growth of the offshore Rupee market its effects on the Rupee
exchange rate and onshore market liquidity and formulate measures to redress the concerns The
Task Force was also charged to examine the role if any that International Financial Services
Centres (IFSCs) can play in addressing these concerns
During its term the Task Force interacted with a wide variety of stakeholders including banks
financial institutions industry bodies foreign portfolio investors asset managers and
academicians
9
I trust that the Reserve Bank of India will find the recommendations made in the report useful
Usha Thorat
Chairperson
10
Executive Summary
The origin of the NDF markets may be traced back to the 1990s when a wave of capital account
liberalisation in emerging market economies (EMEs) triggered a surge in capital inflows to these
economies and consequently heightened the currency risk faced by foreign investors Under-
developed domestic markets especially the market for financial derivatives as well as controlled
access to onshore markets raised the demand for a currency market outside the reach of local
regulations Another trend that supported the growth of the NDF market was the sharp rise
globally in the size of derivatives markets in the 1980s and 1990s As derivatives markets evolved
the speculative search for underlying moved out of the developed world into more esoteric assets
Following the successful speculative attack on the Sterling in 1992 EME currencies became viable
subjects for such speculative positioning Such activity becomes particularly noticeable during
times of stress as offshore risk spills over to the domestic exchange rate through entities that have
a presence in both onshore and offshore markets usually global banks but also corporates
A study of the degree and direction of such spillovers is important to understand the role of NDF
markets and assess policy alternatives The econometric study conducted by the Task Force
observed that the influence between offshore and onshore exchange rate goes both ways in normal
times that is it is bidirectional The study also observed that during the last two stress episodes
(the taper tantrum and the 2018 emerging markets crisis) the relationship turned unidirectional
with the NDF market driving onshore exchange rate The study concludes that as NDF volumes
have increased they have begun to play an important role in both price discovery and driving
volatility particularly during heightened uncertainty period The study also shows that periods of
divergence are limited and the markets converge and that too fairly rapidly
Against this backdrop and in the light of available information results of the statistical analysis
and most importantly based on the feedback received during the various consultations the Task
Force is making following recommendations in accordance with the terms of reference
i Onshore market hours may be suitably extended to match the flexibility provided by the
offshore market and thereby incentivize non-residents to hedge in the onshore market
ii Banks may be allowed to freely offer prices to non-residents at all times out of their Indian
books either by a domestic sales team or by using staff located at overseas branches
11
iii Non-deliverable Rupee derivatives (with settlement in foreign currency) may be allowed
to be traded in the IFSC and IBUs may be allowed to deal in such derivatives with a distinct
FCY-INR position limit To start with exchange traded currency derivatives involving
Rupee may be introduced and with experience non-deliverable OTC currency derivatives
involving Rupee may be allowed subsequently
iv While requirement of underlying exposure will continue for trading in the onshore market
users may be allowed to undertake positions up to USD 100 million in OTC as well as
exchange traded currency derivative market without having to establish the underlying
exposure
v The TF endorses the principle-based regulatory approach adopted in the draft regulation
on hedging by non-residents released by the RBI on February 15 2019 Also back-to-back
hedging by non-residents proposed under these draft regulations is endorsed Further in
case of hedging of anticipated exposures gains from cancellation of contract may be
allowed to be passed on even in cases where there are no cash flows at the discretion of
the bank where the bank considers the cancellation of underlying cash flow is due to
external factors which are beyond the control of the user
vi For ease of entering into hedge transactions for non-residents the TF recommends
a Establishment of a central clearing and settlement mechanism for non-residentsrsquo
deals in the onshore market
b Implementation of margin requirement for non-centrally cleared OTC derivatives
in the onshore market at the earliest
c Allow Indian banks to post margin outside India
d Wider access to FX-Retail trading platform to non-residents
vii A technology-based solution may be explored to centrally aggregate the investments of
non-residents and derivative contracts entered into by them in the onshore market (both
OTC and exchange traded) using LEI or any other unique identifier to start with
viii The issue of taxation in respect of foreign exchange derivative contracts may be examined
with the objective of overcoming gaps between tax regime in India and other major
international financial centres to the extent possible
ix KYC registration may be centralized across the financial market with uniform
documentation requirement
12
Chapter 1
Introduction
Currency is a component of sovereign money which is legal tender issued by the state The
external value of the currency the exchange rate is one of the most important economic and policy
variables which affects economic incentives and activity The exchange rate is determined mostly
by market forces of supply and demand which influence its flows across international borders
The exchange rate has critical information value in guiding financial and economic decisions
which affect real economic variables The stability and predictability of the exchange rate also has
a critical influence on growth and financial stability
Cross-border trade in goods services and assets (or capital) necessitates exchange of one currency
into another and can be thought of as the primary reason why currency markets exist However
as in any other financial market speculative elements ndash who take positions not for settling any
underlying transactions but for benefitting from market movements ndash are important participants
who perform the function of imparting depth to the market The aggregate actions of all
participants ndash hedgers arbitrageurs as well as speculators - determine the value and fluctuation of
the exchange rate
The currency markets for rupee especially for exchange against the USD are fairly well-
developed today One can classify these markets in three categories (a) spot versus derivatives
(b) over-the-counter (OTC) versus exchange-traded and (c) onshore versus offshore Further
derivatives can be cash-settled or delivery-based The most commonly referred benchmark
exchange rate of the rupee is from the onshore spot OTC market Similarly the commonly referred
forward exchange rate of the rupee is from the onshore forward OTC market Rupee futures and
options are traded in some onshore as well as offshore exchanges
The classification of currency markets can also be in terms of the nature of contracts between
buyers and sellers - spot forwards (futures on exchanges) and options contracts A spot contract
is for standard settlement ie the second working day after the date of transaction whereas in
case of forwards and futures (as well as options) the actual exchange or delivery of currency takes
place in the future at a date later than the spot settlement date There are also non-deliverable
forward contracts which are discussed below Forward and futures contracts are used as a risk
management tool or to hedge against possible adverse fluctuation in exchange rates It is important
13
to note that hedging implies risk transfer between the contracting parties it is not elimination of
risk
The category of the currency market that forms the focus of this report is the Offshore Rupee
markets The dominant segment of this market is the Non-Deliverable Forward (NDF) market ndash
wherein foreign exchange forward contracts are traded in the OTC market at offshore locations
generally the International Finance Centres (IFCs) like Singapore Hong Kong London Dubai
and New York These contracts do not involve a physical exchange of Rupees as Rupee is not
deliverable offshore and allow counter-parties to settle profit or loss in a convertible currency
usually the US Dollar which is why it is called a non-deliverable market NDF contracts are
usually traded on currencies which are not readily available to trade globally or outside of
sovereign boundaries These are thus mainly currencies from countries which have partial or no
capital account convertibility
There are also a few exchange-traded offshore rupee markets dealing in rupee futures and options
in Chicago Singapore and Dubai Volumes in these markets have typically been far smaller in
comparison to the offshore NDF OTC market Data on transactions in exchange-traded currency
markets can be ascertained with greater certainty whereas data on transactions in offshore OTC
NDF market have to be gauged through surveys and the estimates on the same are less firm
Why do NDF Markets Exist
NDF markets are not a phenomenon peculiar to the Indian Rupee they are common for currencies
of many emerging market economies (EMEs) As per BIS data NDFs in six currencies ndash Korean
Won Indian Rupee Chinese Renminbi Brazilian Real Taiwanese Dollar and Russian Ruble ndash
account for about two-thirds of the trade in NDFs globally The total daily average volume in NDF
markets is about USD 200 billion as per Bank of International Settlements (BIS) survey1 As per
this survey the share of India was about 1822 per cent of the trade in NDFrsquos globally (see Table
2 Chapter 2) The 2016 BIS survey (the next one will be released in the later part of 2019) showed
that offshore trades in Indian rupee were more or less equal to deliverable onshore forwards
1 2016 Triennial Central Bank Survey of Foreign Exchange and OTC Derivatives Markets
14
around $16 billion daily The 2018 Bank of England reported $23 billion in offshore rupee trades
while RBI sources estimate deliverable daily onshore forwards at $21 billion for 20192
The size of an open economy is one of the primary determinants of international participation in
its currency If international participants do not have direct access to the on-shore currency market
to meet their transaction needs or to hedge their currency exposure they are likely to use the
offshore NDF market The size depth and liquidity of the offshore NDF is thus indicative of the
non-resident interest in an emerging market economy
To some extent the offshore NDF market complements the need for a deep and liquid onshore
currency market What is the appropriate size of the forex market for an emerging market
economy with partially open capital account is determined by its size the share of foreign trade
and appetite for capital flows One proxy for estimating how large the forex market ought to be is
the GDP of the economy A better estimate could be the size of the open economy the trade and
investment sector
As Indiarsquos economy has grown over the past two and a half decades it has seen a significant rise
in openness (ie trade to GDP ratio has grown from 15 in 1990 to 43 in 2018) and in cross
border capital flows This has commensurately raised non-resident interest in the Rupee whether
for risk management purposes or for speculative ends The growing size of the Rupee NDF market
points to a need to widen participation in on-shore markets
The existence and size of offshore NDF markets is also a function of the degree of difficulty that
participants in foreign exchange market (especially non-residents) ndash both speculators and other
participants with requirements arising from cross-border trade transactions ndash face in accessing the
onshore markets The difficulties in accessing onshore currency markets could span a variety of
issues including the following
bull Restrictions on foreign exchange transactions
bull Cumbersome documentation and Know-Your-Customer (KYC) requirements for
participants in the domestic market
bull Restrictions on market participants (especially non-residents) in hedging activities such as
transaction limits tenor limits other documentation etc
bull Restrictions on cancellation and re-booking of contracts
2 For comparison with offshore market the onshore data includes forwards and swaps
15
bull Restrictions on the kind of derivative products that are allowed by market regulators and
bull Inconvenient market hours for those in other time zones
These constraints exist either to curb excessive speculation or to maintain financial stability
Are Offshore Rupee Markets a Problem
When the offshore market volume is significant or larger than the onshore currency market
volume as is the case with many EME currencies it leads to two fragmented markets wherein the
price discovery on the onshore market becomes vulnerable to influences from the price discovery
in the offshore market Empirical evidence (see Chapter 3) shows that while at most times the
direction of the influence runs both ways ie from onshore market to offshore market and vice-
versa the direction of the influence is more dominant from offshore market to the onshore market
in times of high volatility This could happen especially when tidal forces from global financial
markets influence the currency markets in a synchronised manner such as during times of
Emerging Markets (EM) currency crises
There are essentially four issues with regard to offshore market that are critical for regulators ndash
i Effectiveness of exchange rate management Many central banks including the Reserve
Bank have exchange rate stability as one of their objectives and resort to market
intervention or other regulatory measures to control volatility of the exchange rate from
time to time Such influence however extends only to the onshore currency market
Presence of a large offshore market dilutes the effectiveness of the exchange rate
management by the central bank It also hinders the pursuit of the objective of financial
stability in the domestic market
ii Disjointed price discovery During periods of volatility in the currency market when
price discovery in the offshore market causes large movements in onshore currency
markets the onshore market could often open with a large gap over the previous close For
resident market participants who want to cover their positions such gaps expose them to
significant risk
iii Revenue loss Every unit of turnover in a market earns a certain revenue for the market-
making financial firms Thus turnover in the offshore market can be viewed as a potential
revenue loss for domestic financial firms and the domestic economy
16
iv Effectiveness of RBI regulations on capital account management RBIrsquos policies on
capital account have been geared towards managing the impossible trinity a ldquomanagedrdquo
exchange rate free capital movement and an independent monetary policy RBI policies
have been geared toward avoidance of undue volatility in foreign exchange markets by
having restrictions on cancellation and rebooking and excessive risk-taking by resident
entities including corporates With this objective RBI restricts participation of resident
entities in currency derivatives to the extent of their underlying exposures A large market
outside the influence of regulatory authorities undermines their effectiveness
Constitution of the Task Force
Against this backdrop it was announced in the Statement on Developmental and Regulatory Policy
dated February 7 2019 the setting up of a Task Force on Offshore Rupee Markets Accordingly
a Task Force headed by Smt Usha Thorat was constituted with following terms of reference
i Assess the causes behind the development of the offshore Rupee market
ii Study the effects of the offshore markets on the Rupee exchange rate and market liquidity
in the domestic market
iii Recommend measures to address concerns if any arising out of offshore Rupee trading
iv Propose measures to generate incentives for non-residents to access the domestic market
v Examine the role if any International Financial Services Centre (IFSC) can play in
addressing these concerns
vi Any other relevant issue(s) the Task Force considers relevant to the context
The Task Force comprises of the following
i Smt Usha Thorat former Deputy Governor Reserve Bank of India ndash Chairperson
ii Shri Anand Bajaj Joint Secretary Department of Economic Affairs Ministry of Finance
Government of India ndash Member
iii Shri G Mahalingam Whole Time Director Securities amp Exchange Board of India ndash
Member
iv Shri Ajit Ranade Chief Economist of the Aditya Birla Group ndash Member
v Shri Sajjid Chinoy Chief Economist India JP Morgan India ndash Member
17
vi Shri Surendra Rosha CEO India HSBC Bank ndash Member
vii Shri Rajiv Ranjan Adviser-in-charge Department of Economic Policy and Research
Reserve Bank of India ndash Member
viii Shri T Rabi Sankar Chief General Manager Financial Markets Regulation Department
Reserve Bank of India ndash Member Secretary
Approach of the Task Force
Among the different issues relating to offshore markets the argument concerning revenue loss is
perhaps the most simplistic and an obvious response could be for India to develop non-deliverable
Rupee derivative market in an International Finance Service Centre (such as the GIFT City) located
within the geographical boundary of India However such a market will be virtually no different
from the markets located in Singapore or London and hence the objective of bringing volumes to
the onshore market will remain unaddressed
From the standpoint of addressing the concerns arising out of the existence of large offshore
markets it would make sense to incentivise movement of as much currency market transactions
from such markets to onshore currency markets as possible However theoretically one needs to
recognise that there is a trade-off between the sizeprominence of the offshore market and the
extent of regulationsrestrictions that are placed on cross-border transactions and foreign exchange
marketsparticipants It is also important to note that even if all non-residents with underlying
exposure move their hedging transactions to onshore markets offshore markets would continue to
exist to meet the demand of participants who take a view on the exchange rate without any
underlying exposure ie the speculative demand
At one extreme of the above-mentioned trade-off if India opts for a full rupee convertibility ndash by
removing all restrictions on current and capital account transactions ndash along with removal of all
restrictions on currency derivatives then offshore markets would no longer be a relevant concept
Capital account convertibility has been a hotly debated issue in the discourse on public policy both
in India and globally The received consensus in the last couple of decades endorsed by the
International Monetary Fund (IMF) in 2012 is that while capital flows are an important aspect of
the international monetary system providing significant benefits for countries they also carry risks
for macroeconomic and financial stability especially if they are large and volatile and thus pose
a challenge for policy Hence capital flows management measures are justified to help harness the
18
benefits while managing the risks More generally some restrictions to the capital account are
necessary for India to avoid the ldquoimpossible trinityrdquo With an economy as large and diverse as
Indiarsquos which is therefore expectedly not completely synchronous to the global cycle retaining
the independence of monetary policy is imperative Similarly having some control over the
exchange rate is necessary given its occasional propensity to be excessively volatile and overshoot
with attendant feedback loops to the macro-economy Therefore capital flow management
measures become necessary to avoid the trilemma and ensure simultaneous fulfilment of the other
two objectives Based on this received consensus as well as the experiences of some emerging
market economies through the last two decades the Task Force has proceeded on the basis that
the existing framework of capital account management followed by the Government and the RBI
will continue
There is also the issue of de-jure capital account convertibility Even when speculators
arbitrageurs and traders do not have direct access to forex markets to exploit persistent interest rate
differentials or perceived mispricing of the currency there are alternative channels available in
the system which make the actual arbitrage opportunities much lower Some examples of such
instruments is the Overnight Indexed Swaps (OIS) market or the use of Mumbai Interbank
Forward Offer Rate (MIFOR) Hence the de-jure level of capital account convertibility (CAC)
could be much higher than implied by the existence of capital controls
A related issue is the internationalisation of rupee According to McCauley (2011) a currency is
internationalised when market participants ndash residents and non-residents alike ndash conveniently use
it to trade invest borrow and invoice in it Based on the experience of China to internationalise
Renminbi and the evidence of the narrowing of the gap between onshore forward rate and NDF
rates for Renminbi internationalisation of currency has been sometimes advocated as a way to
reduce the influence of offshore markets While one has witnessed issuance of rupee-denominated
bonds (ldquoMasala Bondsrdquo) in some offshore markets in the recent past internationalisation of rupee
is still a distant goalpost given the persistent current account deficit and the negative net
international debt position Thus internationalisation of rupee is not an explicit goal guiding the
recommendations of the Task Force
Further the Task Force believes that Indiarsquos approach to the trade-off between deregulation of
currency markets and tolerance of offshore market must be shaped by the specific considerations
of the Indian economy rather than following any global template blindly
19
Compared to countries like Korea Taiwan or China Indiarsquos macroeconomic structure is
significantly different India is a structurally an economy with twin deficits ndash both fiscal and
current account Nearly half of Indiarsquos consumer price index (CPI) basket comprises of food items
making Indiarsquos inflation more vulnerable to supply shocks Although Indiarsquos macroeconomic
stability has improved considerably in the last few years considering the above factors the Task
Force feels that India cannot risk macroeconomic instability through potential exchange rate
shocks by drastically lifting the restrictions on foreign exchange markets and participants
On the other hand large volumes in the offshore market also reflect the fact that the interest in
Rupee is far larger than what is evident in onshore currency markets This reflects the growing size
of the Indian economy greater role of India in the global economy and growth in trade and capital
flows Over time therefore it would be imperative for the Indian regulators to take steps to expand
the role of onshore currency markets gradually lest the disjointed price discovery issue flares up
more frequently and in larger degrees
The balanced approach of the Task Force therefore is to look at each of the difficulties faced by
market participants in accessing onshore currency markets and prioritise their resolution in such a
way that prudent regulatory considerations are least compromised For instance certain market
micro-structure issues (such as extending the market hours of onshore currency markets) can be
addressed relatively quickly without any regulatory compromise On issues related to
documentation and KYC requirements smart application of ease-of-doing-business principles
needs to be followed Economic entities which need to undertake hedging of their foreign exchange
exposure on account of genuine underlying exposures need to be given greater flexibility in
undertaking such transactions in domestic currency markets While the need for underlying
exposure in order to operate in the forward markets cannot be eliminated the way in which it is
evidenced and monitored can be simplified The Task Force has proceeded on the basis of the
existing principles of regulations of foreign exchange markets
Of course the Task Force recognises that the recommendations will not do away with the
economic imperatives for which trading of rupee forward contracts exists in offshore markets
With our recommendations the Task Force believes that regulatory concerns arising out of the
offshore markets can be reduced though not eliminated
The Task Force held nine meetings between March 2019 and July 2019 The details of the meetings
are given in Annex V
20
Chapter 2
The Evolution of NDF Markets and Cross-country Experience
The foreign exchange market in India during 1970s and 1980s was heavily controlled and closed
in nature with various kinds of restrictions in place The Indian foreign exchange market started
deepening with the transition to a market-determined exchange rate system in March 1993 and the
subsequent liberalisation of restrictions on various external transactions leading up to current
account convertibility under Article VIII of the Articles of Agreement of the International
Monetary Fund in 1994 Notwithstanding various measures taken to further deepen and broaden
the foreign exchange market in India various restrictions are still in place to limit market access
to only those with underlying exposure and prevent undue speculation As India gets increasingly
integrated with the global markets and the exchange rate is increasingly market determined a
combination of capital flows management measures and currency trading restrictions in the on
shore markets are used to manage the lsquoimpossible trinityrsquo external value of the rupee These
measures and restriction are under constant review to ensure that the overall objective of growth
through foreign trade and investment are served
Against this backdrop this chapter attempts to highlights evolution in section II a brief review of
literature on the reasons behind increase in turnover in NDF market in Asian countries has been
given in Section III Section IV highlights the developments in NDF market The country
experiences such as nature of restrictions on non-residents operating in domestic currency
forwards market liberalisation measures taken by countries and its impact in curbing offshore
market discussed in Section V
I Introduction
NDFs are foreign exchange derivative instruments on non-convertible or restricted currencies
traded over the counter (OTC) mainly at offshore centres ie outside the direct jurisdiction of the
respective national authorities It is essentially a forward contract with different settlement process
Unlike the standard forward contract which involves exchange of underlying currencies on
maturity the NDF contract is typically settled as the difference between an exchange rate agreed
months before and the actual spot rate at maturity in an international currency (deliverable) mainly
the US dollars And the other currency which is usually emerging market currency is non-
21
deliverable The settlement of the transaction is not by delivering the underlying pair of currencies
but by making a net payment in a convertible currency equal to the difference between the agreed
forward exchange rate and the subsequent spot rate (Ma et al 2004) NDF contracts can either be
traded over the counter market or at exchanges at offshore financial centres such as Hong Kong
Singapore and London Lately they have become popular derivative instruments catering to the
offshore investorsrsquo demand for hedging arbitraging and speculating including by those who look
upon currency as an asset class
The major participants in NDF market could include foreign businesses and investors doing
business in countries with complex requirements for hedging currency risk in the local markets
arbitragers who have access to both on shore and offshore markets pure speculators like hedge
funds and others who take positions in the NDF market While these are the end users there are
also market intermediaries like banks dealers and brokers who provide quotes for trading in these
currencies and custodians who provide settlement arrangements While the multinational
companies deal in both the long and short end of the market the short end of the market is
particularly dominated by the hedge funds (Misra and Behera 2006) The pricing is influenced by
a combination of factors such as interest rate differential between the two currencies supply and
demand future spot expectations foreign exchange regime and central bank policies
NDF market primarily evolved in response to under-developed onshore forward markets and
limited access to non-residents to currencies with foreign exchange convertibility restrictions An
important advantage that enhances the demand for NDF is reduced credit risk compared to onshore
counterparts since there is no exchange of principal and only the difference amount is settled thus
allowing investors to circumvent limits associated with onshore activity Other reasons which also
favoured the emergence of NDF market includes convenience of time zones location of customer
business operating from a global treasury for multinational companies short-trading hours in
onshore forex market capital controls by individual central banks position limits frictions like
registration norms and know your customer norms frequent and significant changes in regulations
and guidelines in the domestic exchanges and OTC markets Moreover credit risk is also less
relevant since mostly large foreign banks are engaged as a counterparty in NDF trading Further
offshore centres in some cases are better placed to offer competitive services compared to the
22
onshore market on account of various factors ranging from tax treatment less onerous regulations
and documentation to operational efficiency
II Evolution of NDF Markets
The origin of NDF market traces back to the 1990s when a wave of capital account liberalisation
in emerging market economies (EMEs) triggered surge in capital inflows to these economies and
consequently increased currency risk faced by the investors However under-developed domestic
forward market or restricted access to onshore forward market paved the way for evolution of NDF
market as an alternative hedging tool to these investors The widely shared concern amongst local
monetary authorities was that easy access to onshore market and availability of domestic currency
to non-residents will encourage speculative activity leading to greater exchange rate volatility and
eventually the loss of monetary control Consequently some international banks began offering
NDF contracts to meet the demand of investors willing to hedge their EM currencies exposure
during early 1990s (Higgins and Humpage 2005)
One of the earliest NDF market developed during early 1990s was in Mexican peso to speculate
on the currency ahead of the devaluation from its then fixed exchange rate against the US Dollar
The increase in trading turnover during that time was facilitated by the entrance of voice brokers
as intermediaries between inter-bank trading activities (Lipscomb 2005) The NDF market for
some Asian economies like Korean Won Taiwanese Dollar Indian rupee and Chinese Renminbi
existed since mid-1990s due to either restricted or no access to onshore forward markets by non-
residents (BIS 2004) In case of New Taiwan Dollar only onshore entities had access to onshore
markets while it was subjected to underlying requirements in case of Korean Won Indian rupee
and Chinese Renminbi For other currencies like Indonesian rupiah NDF market evolved after
the Asian financial crisis in response to re-imposition of capital restrictions which were liberalised
in early 1990s In Indonesia rapid liberalisation beginning as early as 1970s and further
internalisation of Indonesia rupiah enabled the development of deliverable offshore market for
rupiah Following the currency crisis initial measures were directed at curbing non-trade and
investment related forward transactions with non-residents and broader measures prohibiting
banks from extending loans conducting derivative transactions and transferring rupiah to non-
residents were introduced in early 2001 While Malaysia also imposed cross border restrictions
23
after the crisis evolution of NDF market in Ringgit was initially inhibited by comprehensiveness
of regulations as well as its effective enforcement by the authorities (Ishii 2001)
McCauley (2011) showed that as income per capita rises a currency trades in ever greater
multiples of the home economyrsquos underlying international trade (ldquofinancialisationrdquo) and trades to
an even greater extent outside its home market (ldquointernationalisationrdquo) The increasing economic
interest in emerging market economies as a result of upbeat growth scenario from 2000s spurred
greater participation in currencies of these economies (Chart 1) In this context increasing turnover
in the Indian rupee Chinese Renminbi and other Asian currencies like Indonesian rupiah
Malaysian Ringgit Korean Won and New Taiwanese Dollar is consistent with increased
investment in these economies amidst restricted access to onshore markets Both India and China
recorded phenomenal growth rates translating into increased businesses (trade and investments)
with rest of the world and resulting exposures facilitated offshore trading of their currencies (Chart
2 a amp b) During 1990s mostly non-residents with genuine exposure used NDF market to hedge
their exposures in Indian rupee However with the development of onshore market providing
reasonable hedging facilities to foreign investors amidst gradual relaxation of controls most of the
market activity seems to be driven by speculators and arbitrageurs and those who are looking at
the rupee as a separate asset class to diversify their portfolios in view of its growing international
importance As a result the size of NDF market has grown over time In the Chinarsquos case the
emergence of offshore deliverables market for Renminbi (CNH) since 2010 was mainly due to
internationalisation of Renminbi which gradually substituted the NDF market
24
Chart 1 a amp b FX turnover Indexed 1998=100 and FX TurnoverTrade vs GDP
Source BIS Triennial survey IMF CEIC
Note Chart 1b A higher ratio of FX turnover to trade indicates that a currency trade in higher multiple
relative to its underlying trade as GDP increases
Chart 2 a amp b Gross trade Indexed 2000=100 and Gross trade vs FX turnover
Source IMF BIS World Bank
Both Indonesia and Malaysia have witnessed sharp increase in non-resident participation in local
currency bond market particularly in the aftermath of global financial crisis 2008 while these
countries local forward markets imposed restrictive conditions that restricted use of these markets
for hedging this led to the increased use of NDF market Non-resident ownership of government
debt in Indonesia and Malaysia as share of total outstanding government debt stood at 383 per
0
100
200
300
400
500
600
200
0
200
2
200
4
200
6
200
8
201
0
201
2
201
4
201
6
201
8
WorldAsiaEmerging and developing economiesAdvanced economies
0
1000
2000
3000
4000
0
200
400
600
800
1000
1200
1998 2001 2004 2007 2010 2013 2016
BRL IDR
CNY INR
MYR TWD
KRW right scale
Brazil
Korea
Indonesia
China
India
Malaysia
0
5
10
15
20
25
30
01 10 100 1000
GD
P p
er c
apit
a (U
SD
in t
ho
usa
nd
s)
FX turnover to trade (in log form)
Brazil
China
Indonesia
India
Korea Malaysia
Thailand
00
10
20
30
40
50
60
70
0 25 50 75 100 125 150
FX
turn
over
to
GD
P
External trade to GDP
25
cent and 243 per cent as at the end of March 2019 respectively highest amongst other Asian
economies However foreign participation in equity market is higher for Korea and Taiwan While
Taiwan has limits on investments in domestic bonds by non-residents foreign investors are not
subject to any investment ceiling for both aggregate and individual holdings in a listed company
except for a few restricted industries
Additionally the reason for growing NDF market could be increased carry trade activities for high
yielding currencies After examining the returns of carry trades with deliverable and non-
deliverable forwards Doukas and Zhang (2013) found that carry trades for currencies with NDF
contracts perform better compared to carry trades for currencies with deliverable forward
contracts This excess return is attributed to the compensation of risks emanating from currency
convertibility and capital controls For the Brazilian Real (BRL) derivatives offshore NDFs in
particular are the main vehicle for investors looking to implement carry trades (BIS Santaelaa
2015)
NDF market evolved mainly for emerging market economies witnessing increased economic
interest in the process of transition to high growth phase since 1990s whilst restrictions persisted
in accessing onshore markets for hedging currency risk arising out of these exposures The NDF
market also provided an opportunity to speculate on currencies which underwent notable shift in
their exchange rate regime During periods of global uncertainties like in 2013 during ldquotaper
tantrumrdquo the NDF market is used for speculative purposes arguably causing disruptions in
domestic forex market
III Size of the NDF market
Given that NDF is an over the counter (OTC) traded instrument the turnover data relies on various
surveys conducted by institutions at different time intervals In view of this issues like
comparability and continuity in data often arises However these surveys still provide useful
information to gauge the growth of NDF market over time Results from the semi-annual turnover
survey for the Foreign Exchange Joint Standing Committee chaired by Bank of England (BoE)
suggests that growth of NDF market has outpaced the forward market as well as overall foreign
exchange market In London the average daily NDF turnover surged to USD 139 billion as per
26
the latest survey in October 2018 from as low as USD 21 billion in 2008 During this period NDF
turnover quadrupled and its share increased to 53 per cent of overall forex turnover and comprised
nearly 34 per cent of both onshore and offshore forwards compared to nearly 10 per cent in 2008
Table 1 NDF trading in London (Average daily turnover in billions of US dollars)
NDFs All forwards NDF of all
forwards
All FX NDF as of all FX
Apr-08 23 200 115 1832 13
Oct-08 19 230 83 1699 11
Apr-09 16 162 99 1356 12
Oct-09 26 191 136 1522 17
Apr-10 25 186 134 1687 15
Oct-10 37 188 197 1787 21
Apr-11 42 192 219 2042 21
Oct-11 37 192 193 2038 18
Apr-12 36 192 188 2014 18
Oct-12 45 211 213 2017 22
Apr-13 60 265 226 2547 24
Oct-13 43 205 210 2234 19
Oct-14 62 304 204 2711 23
Apr-15 64 295 217 2481 26
Oct-15 54 253 213 2111 26
Apr-16 60 275 218 2225 27
Oct-16 62 292 212 2179 28
Apr-17 78 332 235 2401 32
Oct-17 90 330 273 2380 38
Apr-18 111 407 273 2727 41
Oct-18 139 409 340 2611 53
Source BIS London Foreign Exchange Joint Standing Committee
A similar survey is conducted by Hong Kong trade repository (HKTR) under the mandatory
reporting obligations imposed since July 2015 According to the HKTR survey daily average
27
NDF turnover in Hong Kong has also exhibited significant growth and daily average turnover
increased to USD 55-60 billion in 2018 from nearly USD 8 billion in 2015
The BIS publishes data on foreign exchange and derivatives trading activity every three years and
also prepare a separate report on NDF covering global market since 2013 The latest 2016 BIS
triennial survey reported that average daily turnover in global NDF market has increased by 53
per cent to USD 134 billion as compared to April 2013 Further NDF share in outright forward
and overall foreign exchange trading remained stable at 190 per cent and 26 per cent respectively
(Table 1) This is in contrast to the decline in average daily turnover in global FX markets to USD
51 trillion in 2016 from USD 54 trillion in 2013 survey conducted by BIS
The currency composition suggests that the Asian currencies dominate the NDF trading activity
with the highest turnover recorded by Korean Won as Korea generally has open capital account
and there are limits on non-residents borrowings in Korean Won from banks in Korea therefore
it is not deliverable offshore (BIS Survey 2016) Survey results from London Hong Kong and
Tokyo foreign exchange committees (FEC) as well as the BIS triennial survey points toward
increased NDF trading activity in Korean Won The Tokyo survey which is available from the
year 2006 suggest that the growth in NDF trading activity for Korean Won has shown significant
growth outperforming other major currencies The momentum in major currencies picked up ahead
of the global financial crisis 2008 before faltering during the crisis period owing to deteriorating
financial conditions Subsequently the NDF activity has deepened over time with the Indian rupee
and Brazilian Real constituting higher proportion of total global turnover after the Korean Won
as corroborated by the London survey also During the five-year period from 2008-13 the increase
in NDF turnover is largely consistent with the FX turnover in emerging market economies (BIS
2013)
Since 2013 greater demand for hedging in anticipation of monetary policy normalisation seems
to be the driving factor for increase in NDF activity given that lot of capital flows to emerging
markets was funded using low cost dollar liquidity (BIS 2013) The BIS 2016 survey identified
that developments associated with higher volatility in Renminbi during August 2015 and January
2016 has also boosted Asian NDFs even as trading activity in Renminbi NDF has faded
According to the BIS 2016 survey during 2013 and 2016 trading in Renminbi NDF contracted
by 394 per cent while that of Korean Won and Taiwanese Dollar expanded by 537 per cent and
28
299 per cent respectively The decline in the NDF activity for Indian rupee reflects the
depreciation of rupee against the US dollar however daily average turnover was up by 167 per
cent between 2013 and 2016 in unadjusted terms Hong Kong (HKTR) survey indicates continued
decline in NDF activity for Chinese Renminbi and Malaysian Ringgit (Table 2 and Chart 2 a amp b)
In case of China this was due to the Renminbi internationalisation policy followed after 2011
Table 2 Daily average turnover (USD billion) Spread
BIS 2013 BIS 2016
Oct- 2018
(London Survey) Bid-Ask (Latest)
NDF DF NDF DF NDF
DF
(Latest) Onshore Offshore
Chinese Renminbi 171 24 104 281 88 650 0001-0002 0003-0005
Indian Rupee 172 31 164 163 2303 214 001 002
Korean Won 196 11 301 145 295 300 010 030
Taiwanese Dollar 89 02 115 78 - 193 0005-0010 0010-0020
Brazilian Real 159 27 187 30 154 - - -
Russian Ruble 41 05 29 186 40 - - -
Source BIS London FEC BoK RBI China Foreign Exchange Trading Center Central bank of Taiwan HSBC
Note
1 DF= Deliverable forwards and include forwards and FX swaps traded onshore
2 Chinese Renminbi volumes on offshore segment are negligible after development of CNH market
3 BIS DF and DF (latest) are not directly comparable since latest numbers are taken from country sources
Chinese Yuan is for Jun-19 Indian rupee and Taiwanese Dollar is for Apr-19 Korean Won is for 2017
Chart 2 Average Daily Turnover and Change in Forex position of Asian Currencies
3 The corresponding figure for April 2019 stood at USD 28billion
0
100
200
300
400
500
US
DC
NY
US
DI
DR
US
DI
NR
US
DK
RW
US
DM
YR
US
DT
WD
Chart 2b Change in FX position of Asian
currencies (in USD billion)
29 January 2016 27 January 2017
31 January 2018 25 January 2019
0
200
400
600
800
1000
1200
Apr-
06
Apr-
07
Apr-
08
Apr-
09
Apr-
10
Apr-
11
Apr-
12
Apr-
13
Apr-
14
Apr-
15
Apr-
16
Apr-
17
Apr-
18
Chart 2a Average daily turnover USD
million
CNY INR IDR KRW
MYR TWD BRL
29
Source Tokyo FEC Hong Kong FEC
Based on latest surveys conducted by London and Hong Kong FEC which are major offshore
centres clearly it showed that the global NDF activity has surged led by Korean Won Indian
rupee Brazilian Real and Taiwanese Dollar The trend is likely to be validated by BIS 2019 survey
which encompasses global turnover and is due to release later this year
IV Review of Literature
In view of the noticeable rise in NDF activity with potential to engender distortions in local market
there exist varied literature on the emergence of NDF market and its spill-overs to onshore
counterparts One of the earliest attempts was made by Park (2001) which investigated the impact
of financial deregulation on relationship between onshore and offshore prices A key finding was
that Korean Won NDF influenced onshore prices after a shift to floating exchange rate regime
coupled with liberalisation of capital controls As part of liberalisation measures following the
Asian financial crisis in 1997 excessive regulations pertaining to foreign exchange market were
removed and measures were undertaken to improve efficiency of market by increasing liquidity
and broadening participation base (Chung et al 2000) Amongst these measures onshore entities
were allowed to participate in offshore market In this regard Lipscomb (2005) suggested that
transition to a more convertible exchange rate regime and permissible participation of onshore
counterparties in NDF transactions contributed to the increase in offshore liquidity which begets
liquidity in domestic market as well A classic example is Korean Won where both onshore and
offshore market co-exist with arbitrage opportunity exploiting any incipient price discrepancy
However NDF markets tend to disappear as the currency becomes fully convertible as stated
earlier
Wang et al (2007) also corroborated the finding that NDF market seems to be the driver for the
domestic spot market of Korean Won while the information flow is reverse for Taiwanese Dollar
where the spot market was found to have influence on NDF market Adding to this literature
Colaveccchio and Funke (2008) found Renminbi NDF to be the key driver of Asian currency
markets with varied degree of heterogeneity contingent on real and financial inter-linkages
Amongst the country specific study the one by Cadarajat and Lubis (2012) demonstrated that
Indonesia rupiah NDF tends to have influence on domestic spot and forward return
30
Studies by Hutchison (2009) Mihajek and Packer (2010) and McCauley and Scatigna (2011)
asserted that offshore trading becomes increasingly important with growing economic interest in
a particular currency amidst limited access to onshore markets and convertibility restrictions A
study by BIS (2013) analysed the directional impact for nine currencies including the Indian rupee
for the period 2005-13 along with separate analysis for 2008-09 crisis and May-August 2013 It
found the presence of two way causation for most currencies for the full sample period however
noted the increase in NDF influence during market stress Both the stress period saw noticeable
impact of NDF particularly during May-August 2013 with major exception of Malaysian Ringgit
where NDF played dominant role and there was no case of deliverable forward influencing NDF
In the Indian context the earliest study with regard to spill-overs impact was undertaken by Misra
and Behera (2006) They found onshore prices to have directional impact on NDF prices even as
volatility spillovers could exist from NDF to onshore market The subsequent research on this
subject during the period 2000-09 by Behera (2011) demonstrated the change in dynamics with
evidence of greater volatility spillover from NDF to spot market A similar finding was outlined
by Guru (2009) on the relationship between the NDF and onshore market for Indian rupee It is
argued that dynamics of relationship between onshore and offshore markets has undergone a
change with the introduction of the currency future market in 2008 and returns in NDF market
seem to be influencing the domestic spot as well as forward market
A study by Darbha (2012) finds that offshore markets plays an important role in price discovery
mechanism particularly in India and China Goyal et al (2013) after examining the period 2006-
13 found the existence of bi-directional relationship between onshore and NDF market for Indian
rupee over the long term however the directional impact turns one way from NDF to onshore
during periods of depreciating pressures ie movements in NDF markets drives adjustment in
onshore market when the currency is under depreciation pressures This asymmetric behaviour is
attributed to the fact that the Reserve bank intervenes in the foreign exchange market to stem
excessive volatility during periods of rupee depreciation
McCauley et al (2014) described two paths for evolution of the NDF markets The first one is
being followed by Chinese Renminbi which has become deliverable after the emergence of
offshore market The Indian rupee falls under the second where the NDF market has grown amidst
continued restrictions on foreign participation
31
The report of the Standing Council (Standing Council on International Competitiveness of the
Indian Financial System 2015 by Ministry of Finance Government of India enumerated factors
including capital controls position limits frictions like registration norms and know your customer
norms frequent and significant changes in regulations and guidelines in the domestic exchanges
and OTC markets as deterrent to foreign investors participation in the onshore market
IGIDR Finance Research Group (2016) made an important recommendation that domestic entities
should be permitted to participate in NDF market after outlining factors driving offshore activity
compared to onshore segment In respect of the internationalisation of rupee as one of the debated
recommendation Kumar and Patnaik (2018) argued the case for gradual internationalisation of
rupee on analysing the role of the Indian rupee in terms of official sector currency reserve currency
and trade invoicing currency
V Country Experience
China
The Chinese Renminbi (RMB) forward market can be segmented into offshore NDF market (since
1990s) an onshore Renminbi market (since 2007) and the CNH market (offshore deliverable) In
the current scenario RMB NDF has been gradually replaced by offshore deliverables after the
creation of CNH market since mid- 2010 as a by-product of promotion of international role of
RMB since 2009
Chinarsquos exchange rate regime has evolved from fixed to managed floating rates followed by
internationalisation of Renminbi (RMB) In early 1990s reforms started with the unification of
multiple exchange rate in 1994 and in 1996 China allowed the full convertibility of Yuan under
current account transactions Eventually the Peoplersquos Bank of China (PBoC) announced the
implementation of managed floating exchange rate against basket of currencies in July 2005
ending the dollar peg prevalent since 1994 Over the last decade Chinarsquos strong economic
performance and growing linkages with rest of the world prompted authorities to promote the
international role of RMB The idea of internationalisation of RMB gained prominence following
the financial crisis of 2008 which revealed the fragilities of dollar dominated global financial
system The thrust of early initiatives was RMB trade settlement premised on Chinarsquos deeper trade
32
links and its central role within Asiarsquos supply chain that supported the demand for its currency for
trade invoicing In this regard a pilot scheme permitting cross border trade settlement in RMB was
launched in 2009 which was widened to cover all current account transactions over the course of
next three years Capital account liberalisation was undertaken at a more gradual pace with the
Chinese RMB becoming officially deliverable at offshore centres in 2010 While Hong Kong
banks were permitted to accept RMB deposits as part of personal accounts in 2004 an important
milestone was the sign of Memorandum of cooperation between HKMA and PBoC in July 2010
which eliminated restrictions on Hong Kong banks in establishing Renminbi accounts and
providing related services ie payments and transfers in RMB to individuals and corporations
Moreover financial institutions were permitted to offer Yuan denominated products As a result
CNH (offshore Renminbi) began to trade actively amongst other range of products and prompted
investors to switch to deliverable market in place of NDF which was used previously Whilst CNH
can be transferred freely between offshore accounts transfer of RMB between onshore and
offshore is still confined to regulated channels to fend off potential adverse impact on onshore
markets Moreover these restrictions are skewed towards outflows form the mainland to offshore
centres
With Renminbi internationalisation the offshore CNH market has shown exponential growth
displacing the NDFs The BIS Triennial Survey showed significant decline in RMB NDF which
fell nearly 40 per cent between 2013 and 2016 driving its share in total RMB trading to 5 per cent
from 14 per cent earlier (BIS 2016) The rapid expansion of offshore market is clearly discernible
in rising FX turnover for CNH which has nearly doubled between 2013 and 2016 and forms around
67 per cent of the total RMB turnover Of the total CNH turnover average daily turnover in the
DFs in April 2016 was estimated to increase to USD 164 billion from USD 84 billion in 2013
(Table 3)
33
Table 3 RMB market turnover average daily turnover in USD billion
OTC
spot
OTC
FX
swaps
OTC
DFs
OTC
NDF Options Futures
OTC
currency
swaps Total
CNY
2013 201 105 26 0 03 0 0 335
2016 249 27 13 0 2 0 02 554
change 239 1565 -514 5693 651
CNH
2013 139 294 84
168 0 05 69
2016 427 59 164
158 03 25 1367
change 2079 1008 943 -56 5784 3836 981
NDF
2013
171
171
2016
104
104
change -394 -394
Source BIS
Since the inception of CNH pricing gaps tend to persist between onshore and offshore exchange
rates however it has narrowed over last couple of years This pricing gap arises on account of
different economic conditions in mainland China and Hong Kong amidst imperfect arbitrage
(Funke 2015) While central bank intervention can constrain the movement of CNY at onshore
centres CNH is more market determined and hence closely follows the global swings (Chart 3)
Since September 2015 PBOC has reportedly taken action in the offshore market when the
onshore-offshore gap was large (McCauley amp Shu 2018)
34
Source Bloomberg
Further liberalisation of the onshore FX market along with allowance of offshore deliverable
market has made the CNY NDF market almost non-existent despite maintaining the lsquoneed basisrsquo
principle Notwithstanding the existence of basis between CNY and CNH due to the band range
trading in CNY and market determined pricing in CNH the spread has been contracting over years
with ample liquidity available in onshore and offshore markets Further the creation of offshore
market has made various options available to offshore investors to both hedge their exposures on
underlying investments and also generate RMB risk in their portfolios via various products and
offshore deliverable market
Korea
With an average daily turnover of USD 30 billion as per the BIS survey 2016 and USD 295 billion
in the latest London survey of October 2018 Korean Won (KRW) NDF boasts of the most active
and liquid NDF market amongst most emerging market currencies Further permissible
participation of local banks in the NDF market ensures close integration of onshore and offshore
forex markets allowing for quick sentiment spillovers between the two markets Turnover in NDF
market is substantially higher than onshore forwards mainly on account of higher documentation
requirements for accessing onshore market In the onshore market average daily turnover was
reported at USD101 billion in 2017 for forwards which increased from USD 96 billion during
the previous year (Chart 4 a ampb)
-015
-01
-005
0
005
01
01-0
8-2
010
01-1
2-2
010
01-0
4-2
011
01-0
8-2
011
01-1
2-2
011
01-0
4-2
012
01-0
8-2
012
01-1
2-2
012
01-0
4-2
013
01-0
8-2
013
01-1
2-2
013
01-0
4-2
014
01-0
8-2
014
01-1
2-2
014
01-0
4-2
015
01-0
8-2
015
01-1
2-2
015
01-0
4-2
016
01-0
8-2
016
01-1
2-2
016
01-0
4-2
017
01-0
8-2
017
01-1
2-2
017
01-0
4-2
018
01-0
8-2
018
01-1
2-2
018
01-0
4-2
019
Chart 3 Gap between USDCNY and USDCNH
Offshore premium
35
Chart 4 Foreign Exchange Turnover and NDF market in Korea
Source Bloomberg Bank of Korea
Korea embarked on liberalisation reforms in 1980s however took big strides post Asian financial
crisis in 1997-98 in line with the IMF adjustment programme As part of these measures foreign
exchange transactions were liberalised which allowed the local banks to engage in NDF
transactions with non-residents Prior to this the development of the onshore currency derivatives
market was constrained by legal requirements such as any forward transaction had to be certified
as a hedge against future current account flows the so-called ldquoreal demand principlerdquo which also
spurred the development of a liquid offshore ldquonon-deliverablerdquo forward (NDF) market in the
Korean Won In 1999 as part of liberalisation measures this restriction was lifted and a lot of
activity moved onshore leading to the convergence of the offshore and onshore prices (IMF
2004) This resulted in sharp increase in NDF transactions between onshore banks and non-
residents for both hedging as well as speculative purposes Amidst likely possibility of turmoil in
foreign exchange market the central bank implemented regulations in January 2004 governing
Korean banks NDF positions with the non-residents directed at restraining any potential selloffs
However these restrictions were abolished in April 2004 as speculative activity was assessed to
have reduced significantly
KRW is almost a non-restricted currency provided the investor holds an Investment Registration
Certificate (IRC) issued by the Financial Supervisory Services (FSS) in Korea The IRC allows an
offshore investor to invest in onshore securities and provides near non-restricted currency rights
barring any holding of short selling position in onshore KRW account
191 18 183 175 20 194 196
7566 71 76
83 96 101
192198 196 19
192 184198
0
10
20
30
40
50
2011 2012 2013 2014 2015 2016 2017
Chart 4b Foreign Exchange Turnover
in Korea daily average USD billion
Spots Forwards Fx Swaps
-60
-50
-40
-30
-20
-10
0
10
20
30
12
-19
98
01
-20
00
02
-20
01
03
-20
02
04
-20
03
05
-20
04
06
-20
05
07
-20
06
08
-20
07
09
-20
08
10
-20
09
11
-20
10
12
-20
11
01
-20
13
02
-20
14
03
-20
15
04
-20
16
05
-20
17
06
-20
18
Chart 4a Onshore USDKRW-NDF 1M
USDKRW
36
For non-residents investors who do not hold IRS USDKRW remains a highly regulated market
Any onshoreoffshore transactions need to be approved by the appropriate authorities and must
have proof of underlying For multinational clients that repatriate dividends documentation with
proof of underlying must be in place Further ceilings are imposed on foreign exchange derivatives
transactions of foreign as well as local banks which came into existence as a prudential measure
to mitigate the adverse impact of volatile capital flows
Ahead of the 2008 financial crisis Korean economy experienced huge build-up of short-term
external debt led by foreign exchange derivatives positioning of banks on account of over-hedging
undertaken by Korean corporations as well as likely carry trades in anticipation of appreciation of
domestic currency Both these activities were funded using offshore dollar borrowing and posed
serious difficulties at the time of global dollar liquidity crunch during financial crisis With a view
to prevent recurrence of the any such episode triggered by volatile capital flows which resurged
from 2009 over-hedging was specifically prohibited and limits were imposed on Foreign
exchange derivatives activity of banks in relation to their capital Liberalization in KRW has been
continuing for decades with the last one completed in December 2007 whereby prior approval
requirements for some capital account transactions was abolished Even onshore participants can
freely participate in the NDF markets thereby providing onshore liquidity to Non-Residents as
long as the hedges are booked as NDF Essentially KRW is a fully convertible currency but is
only tradable on NDF basis offshore
Malaysia
Malaysia had liberal foreign exchange policies until Asian financial crisis with regard to cross
border transactions involving Malaysian Ringgit (MYR) Following the crisis offshore trading of
MYR was banned However grace period was notified for depositors to repatriate their offshore
deposits back to Malaysia and the adoption of fixed exchange rate policy in 1998 - a significant
move whilst imposing selective capital controls All these measures were intended at ceasing
offshore activity which contributed to the excessive pressure on currency despite relatively
stronger fundamentals Although Malaysia imposed cross border restrictions after the Asian crisis
evolution of NDF market in MYR was initially inhibited by comprehensiveness of regulations as
well as its effective enforcement by the authorities (Ishii 2001) Further absence of reference rate
37
for settlement of NDF contracts and stringent controls on domestic bank to undertake forward
foreign exchange transactions with offshore counterparties also hindered the development of NDF
market (EMEAP discussion paper 2002) As the economy began to recover capital controls were
gradually relaxed and finally the currency was floated in 2005
Generally Malaysia has opened up its domestic markets for non-resident investors with no
restrictions on non-residents investing in local bond markets except having to appoint a local
custodian Most of the sectors are open for non-resident portfolio equity flows as well in Malaysia
Over the years since 2005 non-resident investorsrsquo participation in the onshore market picked up
substantially reaching record high of 397 per cent of total outstanding government bonds from
nearly 14 per cent in 2005 and in the process contributed to the growth of NDF market as well
McCauley (2013) analysed the direction of influence for nine currencies in 2005-13 as well as
separately for the 2008-09 crisis and May-August 2013 Granger causality tests point to two-way
causation for most currencies for the full sample The exception is the Malaysian Ringgit where
the NDF influences the deliverable forward market The central bank expressed concerns over the
adverse impact of increased activities in the ringgit NDF market after wide gap was observed
between the NDF and onshore rate in 2016 following the US presidential election Bank Negara
Malaysiarsquos (BNM) Governor emphasised that ringgit NDF market is used by non-resident
investors mostly for speculative purposes rather than genuine demand for hedging As the NDF
trading activity intensified during volatile period in 2016 ringgit-denominated NDF implied much
larger depreciation which further exacerbated the then prevailing depreciating pressure on the
currency (Chart 5)
Chart 5 Onshore and Offshore market in Malaysia
Source Bloomberg
4141542
42543
43544
44545
455
Oct
-16
Oct
-16
Oct
-16
Nov
-16
Nov
-16
Nov
-16
Nov
-16
Dec
-16
Dec
-16
Dec
-16
Dec
-16
Dec
-16
Jan-1
7
Jan-1
7
Jan-1
7
Jan-1
7
Feb
-17
Feb
-17
Onshore USDMYR Offshore 1month NDF USDMYR
38
Assessing the overwhelming impact of NDF activities which has the potential to undermine
financial stability BNM took a number of measures in 2016 to eliminate speculative transactions
in order to ensure appropriate price discovery and orderly functioning of onshore market These
measures includes reinforcement of non-internationalisation policy for Ringgit steps to improve
the onshore pricing mechanism and deepen the domestic forex market After prohibiting banks
from quoting fixing orders used to settle offshore trades the central bank revised the methodology
to compute onshore reference rate to account for transacted deals from mid-2016 Further BNM
imposed a ban on ringgit NDF trading in November 2016 and reminded local banks that ringgit
remains a non-internationalised currency and therefore any offshore trading is not recognized At
the same time BNM strengthened its monitoring to ensure compliance to Foreign exchange
administration rules (FEA) rules by market participants on non-involvement in facilitating NDF
transactions Subsequently financial markets committee (FMC) instituted in mid-2016 laid down
a series of developmental measures for onshore market aimed at allowing better market access and
greater hedging facilities to market participants (Table 5)
Table 5 Developmental Measures Relating to Foreign Exchange Market
Jul-16 Dec-16 Apr-17
Adopting global best practices Rebalance onshore FX demand and supply
Additional FX risk
management practices
bull Transaction based KL
USDMYR reference rate
bull 25 retention of export proceeds in
foreign currency
bull Streamline passive and
dynamic hedging
flexibilities for
investors
bull Extension of official closing hour
for onshore Ringgit rate
bull Trade settlement among residents in
Ringgit only
bull Active hedging for
corporations
bull Streamline onshore and offshore
foreign currency investment limit
Promote FX risk management onshore
bull Active hedging below RM6t million of
net open position
bull Active hedging for institutional
investors
39
bull Expansion of appointed overseas office
framework
In an immediate impact reinforcement of restrictions on USD-MYR NDF market resulted in
significant outflows from local bonds in Malaysia However as a positive impact with the bout
of capital outflows following ban on NDF transactions composition of non-resident holdings has
shifted towards more stable and long-term investors thereby reducing the risk exposure to global
impulses Further the disruptive influence from NDF market subsided and onshore foreign market
continues to register higher average daily volume These measures have helped in increasing the
depth and liquidity of the foreign exchange market as evidenced by declining volatility and
narrowed bid-ask spreads in onshore market The decline in offshore volumes has resulted in
widened bid-ask spread (Chart 6 a amp b)
Chart 6 Malaysia Monthly FX forward volumes and Bid-Ask Spread
Source BNM Reuters and Bloomberg
-001
0
001
002
003
004
005
01
-10
-201
0
01
-04
-201
1
01
-10
-201
1
01
-04
-201
2
01
-10
-201
2
01
-04
-201
3
01
-10
-201
3
01
-04
-201
4
01
-10
-201
4
01
-04
-201
5
01
-10
-201
5
01
-04
-201
6
01
-10
-201
6
01
-04
-201
7
01
-10
-201
7
01
-04
-201
8
01
-10
-201
8
01
-04
-201
9
Chart 6b Bid-Ask spread
offshore bid-ask onshore bid-ask
0
10
20
30
40
50
60
70
80
90
0
5
10
15
20
25
30
Dec
-12
May
-13
Oct
-13
Mar
-14
Aug
-14
Jan-1
5
Jun
-15
Nov
-15
Apr-
16
Sep
-16
Feb
-17
Jul-
17
Dec
-17
May
-18
Oct
-18
Mar
-19
Chart 6a Monthly FX forward turnovers (in
USD billion)
Onshore FX forward Offshore FX forward RHS
40
Chart 7 Non-resident holdings of total government debt and Monthly FX turnover
Source BNM and HSBC
Indonesia
The development of NDF market in Indonesia Rupiah traces back to the year 2001 when Bank
Indonesia (BI) prohibited onshore banks from lending to non-resident accounts in an attempt to
reduce the speculative pressure on the Indonesian Rupiah (IDR) These restrictions paved the way
for development of offshore rupiah NDF market to cater to the demand of international investors
Prior to this an active offshore deliverable market existed for IDR following the pursuit of
liberalisation policies beginning as early as 1970s which allowed the IDR to be freely convertible
and at the same time permitted its internationalisation Consequently the international use of
rupiah increased but was confined mostly to financial transactions mainly due to limited invoicing
of trade-related transactions in IDR terms This easy access to rupiah from onshore centres due to
internationalisation allowed non-resident to speculate on the currency during the 1997 crisis in
Asian countries As a result of heightened activity in times of stress exchange rate volatility
increased making it difficult for the central bank to maintain stability of rupiah In response to the
crisis the currency was freely floated replacing the intervention band but weakness in the currency
and high volatility continued to persist compared to currencies of other Asian countries during the
first three years of its floating rate regime Taking cognizance of this disparity the central bank
began to evaluate the extant regulations relating to rupiah transactions with non-residents
Thereafter during the year 2001 the BI imposed extensive regulations limiting non-resident
143
397
243
50
100
150
200
250
300
350
400
450
Jan-0
5
Oct
-05
Jul-
06
Apr-
07
Jan-0
8
Oct
-08
Jul-
09
Apr-
10
Jan-1
1
Oct
-11
Jul-
12
Apr-
13
Jan-1
4
Oct
-14
Jul-
15
Apr-
16
Jan-1
7
Oct
-17
Jul-
18
Apr-
19
Chart 7a Non resident holdings as of total
government debt
-
500
1000
1500
2000
2500
3000
Jan-1
6
Apr-
16
Jul-
16
Oct
-16
Jan-1
7
Apr-
17
Jul-
17
Oct
-17
Jan-1
8
Apr-
18
Jul-
18
Oct
-18
Jan-1
9
Chart 7 Monthly onshore FX market
turnover (in billion of USD)
FX Spot FX Swap FX Forward FX Options
41
rupiah transactions and shrinking the pool of offshore rupiah funds with the potential to be used
for speculation identifying spill overs from offshore market as conduit of excessive volatility
In general Indonesia has opened up its domestic bond markets for non-residents completely with
no entryexit barriers except having to appoint a local custodian Foreign exchange hedging is
allowed only with underlying documentationasset in place for non-residents On the portfolio
equity investments regulation clearly provides that a listed company is exempt from any foreign
investment restrictions However there are sectoral restrictions on FDI in Indonesia which are
decided by BKPM (Investment Coordinating Board in Indonesia) which provides a DNI list
(Governmentrsquos negative investment list) The share of non-residents in Indonesia Government
Bonds has been increasing over years from a mere 1570 per cent of the total government bonds
in June 2009 to 3810 per cent in April 2019 (Chart 8)
Source HSBC
Research from BI in 2012 found disproportionate impact of NDF market to spot market during the
period 2008-11 Results suggests that there is evidence of unidirectional mean spill-over from NDF
to both spot and forward rupiah markets with an exception of Europe crisis On volatility spillover
the study obtained significant results from NDF market to spot market for entire period However
in crisis situation the study found interdependence between volatility in offshore NDF and onshore
spot rate changes while information transmission is only valid from NDF to forward rate changes
not the other way around (Cadarajat and Lubis 2012)
To reduce the unwarranted influence of NDF market on spot market BI took initiatives beginning
the year 2014 to bridge the gap between onshore and offshore rupiah rate In 2014 the central bank
381
150
200
250
300
350
400
450
Jun-0
9
Dec
-09
Jun-1
0
Dec
-10
Jun-1
1
Dec
-11
Jun-1
2
Dec
-12
Jun-1
3
Dec
-13
Jun-1
4
Dec
-14
Jun-1
5
Dec
-15
Jun-1
6
Dec
-16
Jun-1
7
Dec
-17
Jun-1
8
Dec
-18
Chart 8 Non-resident holdings as percetage to total Government
Debt
42
with the help of key offshore centre Singapore moved the foreign exchange rate fixing that is used
to settle the NDF contracts to the onshore market Earlier Association of Banks in Singapore
(ABS) and the Singapore Foreign Exchange Markets Committee (SFEMC) was publishing IDR
reference rate computed as weighted average of 1-month NDF trades done by then Singapore
based brokers Post March 27 2014 BI started publishing reference rate termed as Jakarta Inter-
bank Spot Dollar Rate (JISDOR) which was to be used to settle existing and new contracts Jakarta
Interbank Offered Rate (JIBOR) is more transparent in a way that it is based on actual transactions
being done in the inter-bank onshore market
In late 2018 BI in its efforts to further deepen the domestic foreign exchange market and to
mitigate IDR exchange rate risk BI established the Domestic Non-Deliverable market (DNDF)
for IDR It will serve as a parallel market to NDF with the key difference that it is rupiah settled
in onshore market This alternative tool will provide foreign investors additional avenues to hedge
their IDR exposure without principal exchange other than enhancing the central bankrsquos
intervention capabilities At this juncture the market is relatively new and hence significant impact
assessment of the same cannot be outlined However currently Indonesia has not been able to
move significant turnovers from offshore NDF to Domestic NDF market
Brazil
Brazilian Real is the second most actively traded currency in NDF market after the Korean Won
with an average daily turnover of USD 187 billion as per BIS and USD 154 billion according to
the London survey The growth and development of NDF market is attributed to the existence of
large and well developed foreign exchange futures market
The development of derivatives market in Brazil is attributed to the hedge culture that has been
prevalent due to periods of high and persistent inflation and exchange rate volatility amidst
political shocks During 1980s and early 1990s inflation was soaring above 100 per cent which
peaked over 2700 per cent in 1993 and thus promoted widespread indexation to manage the
inflation risks Subsequently the ldquoReal planrdquo which comprised of fiscal and monetary reform and
introduction of new currency helped to bring down inflation and stabilise the currency Amidst
stable macroeconomic conditions private sector was encouraged to borrow foreign funds at a
43
lower cost and the consequent surge in foreign indebtedness during 1994 to 1998 led the central
bank issue dollar denominated securities as a hedging instrument Following the currency crisis in
1999 the Brazilian Real was floated amongst adoption of new set of economic policies which was
also accompanied by providing unrestricted access to non-residents to financial markets (including
derivatives) in 2000
The distinguishing feature of Brazilian foreign exchange is the non-deliverable nature of
derivatives contracts without any significant limitations even though participation in deliverable
instruments ie spot outright forwards and foreign exchange swaps is constrained Only chartered
banks are authorised by the central bank to hold foreign exchange spot positions All these factors
have facilitated the growth of foreign exchange futures market over spot market which is closed
and highly restricted Against the backdrop of large and sophisticated foreign exchange derivatives
with high depth and liquidity foreign exchange futures prices have key influence on spot price as
suggested by various studies (Ventura and Gracia 2009 Kaltenbrunner 2010 and Chamon and
Gracia 2013) As pointed out by Kaltenbrunner 2010 the existence of a deep futures market has
made it possible for foreign banks with branches in Brazil to sell real offshore (NDF) and
simultaneously hedge their real exposure in the onshore futures market For the Brazilian Real
derivatives especially offshore NDFs are the main vehicle for investors looking to implement
carry trades (Santaelaa 2015)
Taiwan
The NDF market for Taiwanese Dollar (NTD) existed since 1990s and the central bank permitted
domestic and foreign legal entities to trade in NTD NDF market with authorised banks in 1995
This came after opening up of local securities market to foreign institutional investors (QFII) in
1990 which allowed FIIs meeting certain requirements to apply for investment in Taiwanrsquos stock
market Subsequently significant relaxations were made and security market was completely
opened up with the abolition of QFII scheme While onshore institutions were eligible for trading
in NTD NDF the central bank initially imposed limits on trading position in NTD NDF to one
third of their total foreign exchange position with a view to prevent speculative pressure
44
Following the Asian financial crisis in July 1997 the central bank introduced measures to regulate
NDF market with only authorized banks permitted to carry NDF trading with other authorised
counterparts and their overseas branches or headquarters This move came after the speculative
positioning which was believed to cause sharp depreciation of the NTD The central bank outlined
that although there was ceiling on NTD NDF trading positions some banks were engaged in selling
NDFs to foreign entities and simultaneously created long NDFs positions and shorted DFs with
domestic entities in a bid to offset the NDF trading positions on their balance sheets and thus
creating more room for further NDF trading (Bank of Taiwan Annual Report 2014) The central
bank has intervened in foreign exchange market to curb speculative activity also post 2008
financial crisis when emerging markets witnessed resurgence of capital flows The measures
introduced then by the central bank focused on reducing local banksrsquo foreign exchange positions
in both onshore and NDF markets including discouraging non-resident deposits by imposing
punitive reserve requirements with an intent to limit local banksrsquo capacity to provide liquidity to
NDF markets The National Supervisory Commission also took steps to limit non-resident
investments in local bank deposits and government securities
However recognising the dominance of foreign banks in NDF trading activity the central bank
announced that overseas branches of domestic banks are eligible to apply for NTD NDF business
from September 2014 In current scenario whilst there are no restrictions on the fixed income
investments in general but investments in localdomestic bonds by non-residents cannot exceed
30 per cent of their investments in equity instruments which has kept the investments in local
bonds low by non-residents who tend to take exposure in USD bonds issued by Taiwan offshore
Moreover ability for local banksrsquo to access the TWD NDF market up-to 20 per cent of each banksrsquo
net open position results in partial integration between onshore and offshore markets Since TWD
is not fully convertible any onshore spot transactions must be declared to the central bank and in
most cases require supporting documentation which keeps the differential between onshore and
offshore rate
To conclude cross county experience shows that increasing role of any economy globally is
accompanied by emergence of growing offshore trading of their currencies in the presence of
restricted access or cumbersome regulations Additionally emerging market economies cannot
afford to have unrestricted access to their onshore market as revealed by the studies of Indonesia
45
and Malaysia during the Asian crisis 1997 which exposed them to global impulses Most of these
countries have followed a gradual approach surrounding non-resident access to their forex markets
As emerging markets open up and become sophisticated in respect of forex markets the case study
of the Republic of Korea exemplify that country-specific factors have to be considered when
designing the financial regulatory toolkit aimed at curbing foreign and domestic agentsrsquo
speculative strategies in the search for yield The experience of Brazil suggests deepening onshore
hedging market will go a long way in promoting the price setting role of onshore market over its
offshore counterparts Indonesia has recently introduced domestic NDFs in line with Brazil
Additionally the experience of Korea and Taiwan suggests that the participation of domestic banks
ensures that any price differential between the two segments is arbitraged However in both the
cases participation is governed to evade any potential build-up of vulnerabilities on banksrsquo balance
sheet
46
Chapter 34
Linkages between Offshore NDF and Onshore Rupee Markets New Evidence
Overarching Motivation
Indiarsquos trade integration with the rest of the world began to rise sharply from the turn of the
millennium Between 2000 and 2012 total trade (imports + exports) as a percentage of GDP more
than doubled from 26 to 56 before moderating to 43 in 2018 as the effects of de-
globalization took over post the global financial crisis Simultaneously policymakers persevered
with gradual but consistent capital account liberalization Unsurprisingly therefore currency
markets ndash both to trade and hedge ndash rose in tandem with the growing external integration The
onshore Rupee market5 monthly average turnover has grown from USD 60 billion in 2000 to USD
687 billion in 2018 However given data limitations uncertainty still exists on the exact size of
the NDF market and how it has grown relative to the onshore market As Chapter- 2 illustrates
the BIS Triennial Survey finds average daily turnover of Rupee NDF in 2016 was USD 16 billion
However the Bank of Englandrsquos Semi-Annual Forex Turnover Survey finds average daily
turnover of Rupee NDF in London increased from USD 8 billion in October 2016 to USD 23
billion in October 2018
The idea behind trying to size the NDF market ndash and therefore implicitly compare its size and
growth to onshore markets ndash is in part to try and make sense of how important a role NDF markets
play in the ldquoprice discoveryrdquo of the Rupee6 With the Indian Rupeersquos ldquoForwardrdquo price being
determined across segmented markets ndash both the onshore deliverable forward market and the
offshore non-deliverable market -- the key is to ascertain the relative importance of each of these
markets in driving price discovery
4 This chapter is a joint work of Shri Sajjid Chinoy Chief Economist J P Morgan India and Shri Harendra Behera
Assistant Adviser Department of Economic and Policy Research Reserve Bank of India 5 Spot OTC amp ETCD
6 To be sure estimating the size of the NDF market is important not just for the influence it exerts on price discovery
but also instructive in understanding the cumulative ldquoviewrdquo on the Rupee and how much is expressed onshore versus
offshore This is because if NDF volumes are substantial policymakers may desire to shift these volumes on shore
both to (i) deepen the onshore market and (ii) move this businesseconomic activity on shore
47
However simply using (offshore versus onshore) volumes as a means to proxy relative price
discovery is imperfect at best The ability of NDF volumes to drive price discovery for any given
quantum of volumes is ultimately a function of how inter-connected onshore and offshore markets
are and the ability of economic agents ndash hedgers arbitrageurs speculators -- to link these markets
For example if NDF markets have grown sharply but it is found that price linkages between the
two markets are still tenuous or have not increased commensurately with volumes -- say because
arbitrage opportunities between the two markets have not grown in tandem -- then the growth of
NDF markets and the consequent ldquoloss of controlrdquo will be of less concern to Indian policymakers
Conversely if price linkages have grown over time ndash proportionately to volume increases ndash then
policymakers would rightly worry about the growing role of NDF markets in driving price
discovery
The fundamental motivation for this chapter is therefore to empirically examine price linkages
between the NDF and onshore markets as this is the ultimate manifestation of the influence that
NDF markets exert
The Question
This chapter seeks to ask two fundamental questions Is there a stable long-term equilibrium
relationship between onshore and offshore markets Second if so what is the directionality of
influence Do NDF markets drive onshore markets Or do onshore markets drive the NDF market
Or is the influence bi-directional
Furthermore we try and empirically answer this questions across two dimension First what is the
direction and quantum of influence during ldquonormal times versus ldquostressed timesrdquo Second what
is the relationship and how does it change when assessing ldquoaverage returnsrdquo (means) versus
ldquovolatilityrdquo (variance)
Specific Motivation to India
While there is a meaningful and growing literature trying to empirically ascertain price linkages
between the onshore and offshore markets around the world the literature that focuses on India
remains sparse dated and inconclusive This constitutes the specific motivation for this chapter
48
The literature studying NDF markets around the world has steadily grown over time For example
much work has been done on Asian NDF markets and their relationship with onshore markets
both for the region as a whole (Ma et al 2004 Colvecchio et al 2006 Wang et al 2007 Gu and
McNelis 2009) and individual currencies such as the Korean Won (Park 2001) the Indonesian
Rupiah (Cadarajat and Lubis 2012) the Chinese Yuan (Fung et al 2004 Hideki 2006
Colavecchio and Funke 2008 Huszaacuter et al 2016 Song and Gao 2016 McCauley and Shu 2018)
and the Indian Rupee (Misra and Behera 2006 Guru 2009 Behera 2011 Darbha 2012 Goyal
et al 2013)
Results remain mixed Some studies find the NDF markets influence the evidence onshore forward
market (Park 2001 Wang et al 2007 Cadarajat and Lubis 2012) others find they influence
onshore spot markets (Behera 2011 Goyal et al 2013) while some document its influence on
onshore futures markets (Behera 2011) Conversely some studies also find the direction of
influence runs from onshore markets to NDF markets (Wang et al 2007 Misra and Behera 2006)
In the case of India there are only a few studies on this subject ndash with the last one back in 2013 ndash
and the results are mixed and inconclusive For example Misra and Behera (2006) find that itrsquos
the onshore markets that influenced the NDF market between 2004 to 2007 largely because of
restricted participation of domestic players in the offshore market In a subsequent study Behera
(2011) found that there are volatility spillovers from the NDF market to spot and forward markets
in India and the magnitude of volatility spillover has become higher after the introduction of
currency futures in 2008 Guru (2009) finds qualitatively the same results and the role of currency
futures in India Darbha (2012) find that offshore markets play an important role in price discovery
Finally in the most recent work on India (Goyal et al 2013) find evidence of a long-term
relationship between NDF and onshore markets and find evidence that the relationship is
bidirectional as both markets adjust to any deviations from the equilibrium state
Whatrsquos clear however is the evidence on India is patchy inconclusive and dated with the last
study conducted more than 6 years ago
Some Theory
Recall if there are no capital controls forward rates are tied down by the no-arbitrage ldquocovered
interest parityrdquo hypothesis
49
F = S(1+r)(1+r$ )
Where F is the Forward rate S is the spot rate r is the relevant interest rate on the home currency
and r$ is the equivalent dollar rate The equation holds when (i) there is capital account
convertibility and there are no barrier for cross-border transactions and (ii) there is equivalent
credit risk in the assets across the two jurisdictions
However if there are capital-account barriers we would expect F to only be approximated by the
equation above and not hold exactly
So F ~ S(1+r)(1+r$ )
Similarly the NDF rate should be anchored by the onshore forward rate to the extent that
arbitragers can link these markets
So NDF ~ F ~ S(1+r)(1+r$ )
Furthermore the sign of the onshore-offshore yield spread can indicate the underlying market
pressure on the currency If the domestic interest rate is higher than the NDF implied yield it
implies appreciation pressures on the currency However capital controls may restrict inflows to
close the gap Similarly a lower domestic interest rate than implied by the NDF yield would
suggest depreciation pressures while a zero spread would likely reflect an absence of market
pressure on both the domestic and offshore market
All told however we would expect that both onshore and offshore markets would have a long-
run relationship and there is the likelihood of ldquomeanrdquo spillovers on a regular basis Furthermore
hedging arbitrage and speculative activities may also result in volatility spillovers from one
market to another on various occasions
Testing for ldquoMeanrdquo Spillovers
We start therefore by empirically testing for linkages between onshore (spot and forward prices)
and offshore (NDF forward prices) markets The goal is to assess
1 If there is a stable long-term relationship between onshore and offshore markets
2 Which drives which Do onshore prices drove offshore prices Or vice versa
50
3 To see whether the direction of influence is a function of context Are the results
different for ldquonormalrdquo times versus ldquostressed periodsrdquo (ie taper tantrum emerging
market stress)
Non-stationary but co-integrated
So as to decide the empirical course of action we start by testing whether the key variables of
interest (i) the Onshore Spot Exchange Rate (SPOT) (ii) the Onshore Forward Rate (FORWARD)
and (iii) the Offshore Non-Deliverables Forward exchange rate (NDF) are stationary
Augmented Dickey Fuller Tests reveal that all three variables are non-stationary in levels
However as Figures 1 and 2 suggest the spreads between SPOT and NDF and ONSHORE
FORWARDS and NDF are mean-reverting suggesting the presence of a long-term relationship
and suggesting stationarity in the first differences
Formal co-integration tests ndashTables 2 and 3 ndash confirm that both pairs of variables NDF-SPOT and
NDF-FORWARD ndash are indeed co-integrated The Max Eigenvalue tests reveal there is at least one
co-integrating vector that can be found at the 5 level
Null Hypothesis Variables have a unit root
ADF t-Stat Prob
Spot -06 09
Augmented Dickey-Fuller test statistic-07 08
Augmented Dickey-Fuller test statistic-07 08
Table 1 ADF unit root test
-15
-05
05
15
25
09 10 11 12 13 14 15 16 17 18 19
level
Figure 1 Spreads (1M NDF- Spot)
51
-25
-15
-05
05
15
25
09 10 11 12 13 14 15 16 17 18 19
level
Figure 2 Spreads (1M NDF- 1M Forward)
Table 2 Co-integration SPOT and NDF
Sample (adjusted) January 2005 to March 2019
Included observations 2608 after adjustments
Trend assumption No deterministic trend (restricted constant)
Series LOG(SPT) LOG(NDF)
Unrestricted Cointegration Rank Test (Trace)
Hypothesized Trace
No of CE(s) Eigenvalue Statistic Critical ValueProb
None 011 31310 2026 000
At most 1 000 210 916 076
Unrestricted Cointegration Rank Test (Maximum Eigenvalue)
Hypothesized Max-Eigen005
No of CE(s) Eigenvalue Statistic Critical ValueProb
None 011 31100 1589 000
At most 1 000 210 916 076
Both Trace and Max-eigenvalue tests indicates 1 cointegrating
eqn(s) at the 005 level
52
Stable Long Term Relationship
The finding of co-integration allows us to use ordinary least squares (OLS) to estimate the long-
term relationship between SPOT and the NDF as well as FORWARD and the NDF In particular
using the equation below we estimate parameters β0 and β1 which tells us about the long-term
relationship between SPOT and NDF
We then repeat the same exercise between the FORWARD and the NDF
But whatrsquos driving what An ldquoError Correction Mechanismrdquo approach
While establishing a long-term relationship is important a finding in the affirmative will not come
as a particular surprise Instead the real question is whether onshore prices drive offshore prices
or vice versa The natural framework to answer this is the work-horse Error Correction Mechanism
(ECM) approach used by Engel and Granger in 1987 where changes in each of the variables are
run on changes on its own lags and the lags of the other variables
Table 3 Co-integration FORWARD and NDF
Sample (adjusted) January 2005 to March 2019
Included observations 2608 after adjustments
Trend assumption No deterministic trend (restricted constant)
Series LOG(FORWARD) LOG(NDF)
Unrestricted Cointegration Rank Test (Trace)
Hypothesized Trace
No of CE(s) Eigenvalue Statistic Critical ValueProb
None 018 53051 2026 000
At most 1 000 217 916 074
Unrestricted Cointegration Rank Test (Maximum Eigenvalue)
Hypothesized Max-Eigen 005
No of CE(s) Eigenvalue Statistic Critical Value Prob
None 018 52835 1589 000
At most 1 000 217 916 074
Both Trace and Max-eigenvalue tests indicates 1 cointegrating
eqn(s) at the 005 level
53
119889119897119900119892(119904119901119900119905)119905 = 1205720 + 120572119904119901119900119905(119890119905minus1) + sum 12057211(119894)(119889log (119904119901119900119905119905minus1))119899119894=1 + sum 12057212(119894)(119889log (119873119863119865119905minus1)) + 120576119904119905
119899119894=1 (1)
119889119897119900119892(119873119863119865)119905 = 1205720 + 120572119899119889119891(119890119905minus1) + sum 12057221(119894)(119889119897119900119892(119904119901119900119905119905minus1))119899119894=1 + sum 12057222(119894)(119889119897119900119892(119873119863119865119905minus1)) + 120576119899119905
119899119894=1 (2)
For example as Equation 1 lays out changes in (the log of) SPOT ndash the dependent variable -- are
run on its own lags and the lags of NDF Equation 2 ndash in which the dependent variable is NDF --
does the same for NDF Because both variables are co-integrated ndash as shown above ndash using OLS
to estimate these coefficients using standard criterion to choose lag lengths (eg Akaike
Information Criterion) and standard F-Tests are all valid
The coefficients of interest in the above equation are 120572119904119901119900119905 and 120572119899119889119891 ndash the ECM terms -- because
these coefficients tell us when the system is in disequilibrium the direction and the speed of
adjustment back to equilibrium This will determine the directionality of influence
For example if 120572119904119901119900119905 = 0 and if all values of 12057212(119894) = 0 then dlog(NDF) does not granger cause
dlog(spot) In contrast if the value of 120572119904119901119900119905 is negative and statistically significant that implies
that (the log of) NDF in the long run ldquoganger-causesrdquo spot market movements The same intuition
applies for equation 2 where NDF is the dependent variable and we test for convergence between
the NDF rate and the onshore forward rate Direct convergence requires 120572119904119901119900119905and 120572119899119889119891 to be
oppositely sign Intuitively the larger the value of α the faster is the speed of adjustment
In summary while the βrsquos tell us about the existence and strength of a long run relationship
between onshore and offshore markets the αrsquos tell us about whether (i) the directionality of
influence and (ii) the speed of convergence from disequilibrium
We therefore use this approach to test for linkages between both sets of variables ndash NDF and
onshore SPOT ndash and NDF and onshore FORWARDS
Data
We use end-of- India-day closing values for the onshore spot exchange rate for the 1-month a
forwards and the corresponding 1-month non-deliverable-forward (NDF) rates We use daily data
and our full sample runs from 2009 through 2019
54
Results Full Sample
Table 4 ECM and Long run coefficients (Full sample)
The first row are the linkages between the onshore spot and NDF markets while the second row
is that of the onshore forwards and NDF market
In both cases the betas (β) are positive statistically significant and with a magnitude very close to
or at 1 implying an almost one-for-one movement between both the markets in the long run For
example the estimated β1 of 099 suggests that for a 1 increase in NDF rates there is 099
increase in spot rates in the long run Meanwhile between onshore FORWARDS and NDF there
is a complete pass-through in long run More generally a beta (β) close to 1 suggests there is no
permanent friction between onshore and offshore markets in the long run
Convergence
However the real interest is in the alphas In the first case both 120572119904119901119900119905 and 120572119899119889119891 are statistically
significant and oppositely signed This suggests that they both converge towards each other Put
differently the NDF rate moves towards the onshore SPOT rate and vice-versa In other words
there is a bi-directional relationship between both variables The magnitude of the coefficients
(007-018) suggests a moderate speed of convergence to the long-run equilibrium when a shock
causes the system to go into disequilibrium
The same results are obtained when studying linkages between the onshore forward and NDF
markets Both 120572119891119900119903119908119886119903119889 and 120572119899119889119891 are statistically significant oppositely signed (suggesting they
converge towards each other) with coefficients that are slightly larger than the SPOT-NDF pair
This suggests that both NDF and the onshore FORWARD rates influence each other and gradually
converge towards their long-term relationship when hit by a shock ndash a speed of adjustment that is
modestly faster than the NDF-SPOT relationship
Time Period April 2009 to March 2019
Onshore Spot and NDF -018 007 099
Onshore Forwards and NDF -032 023 100
55
For the full sample as a whole from 2009 to 2019 we find that there is a bi-directional relationship
on average between SPOT and NDF and FORWARD and NDF and that all variables converge
gradually to their long-term relationship
Results Stressed Times
Our results should be thought of as ldquoaveragerdquo results across the entire time period But are these
results a function of context Does the direction of influence change for example during periods
of currency stress versus periods of calm We explore this next
To test for this we start by isolating clearly-identifiable periods of stress ex post facto in our
simple Two episodes naturally come to mind the taper tantrum of 2013 (where the Rupee
depreciated 26 between May 2013 and August 2013) and the emerging market (EM) turmoil ndash
characterized both by the Fed raising rates and oil prices firming ndash such that the Rupee depreciated
almost 10 between August 2018 and October 2018
2013 The Taper Tantrum
We test interlinkages from the start of May to the end August 2013 ndash during the Taper Tantrum ndash
when the Rupee was under intense pressure and easily amongst the worst performing currencies
in the emerging market (EM) universe Results are presented in Table 5 below
Table 5 ECM and Long run coefficients
As one can observe 120572119899119889119891 in both equations is statistically insignificant What this implies is onshore
spot and forward rates were playing very little role in influencing NDF rates7 In contrast 120572119904119901119900119905 and
120572119891119900119903119908119886119903119889 are correctly signed and statistically significant (the former at the 1 level and the latter
at the 10 level) which suggests it was the NDF rate that was driving the onshore spot and forward
rates Interestingly the speed of adjustment is much faster for onshore spot rates in this sample (-
11) compared to the full sample (-018) and also relative to the onshore forward market (-08) An
7 In fact onshore spot and forward rates do not granger cause NDF as none of the lags of 12057221(119894) in equation 2 are
statistically significant during this period
Onshore Spot and NDF -11 -028 094
Onshore Forwards and NDF -08 015 097
Time Period May 2013 to August 2013
56
ECM (alpha) coefficient of greater than 1 suggests the witnesses an oscillating convergence Since
a coefficient greater than 1 is prime facie surprising we also conduct a robustness exercise
(described below) by running Granger Causality tests for this time period and find it is the NDF
that Granger-causes onshore rates and not the other way around
This finding likely reflects the growing volumes ndash potentially speculative ndash in the NDF market in
the 2013 period of stress relative to the volumes in the onshore market This also prime facie
reduced the efficacy of foreign currency intervention by the central bank because intervention was
used to shape the spot exchange rate at the end of Indiarsquos business day But because the NDF is a
24 hour market NDF rates evolved overnight and when the Indian market opened the next day
onshore rates were influenced by NDF developments overnight This rendered ineffective the
previous dayrsquos intervention because there was often little correlation between the closing exchange
rate of the previous day and the opening rate of the next day and therefore necessitated additional
intervention the next day
Visually this is evident in the ldquogap-uprdquo movements of the exchange rate when the Indian market
opened ndash vis-a-vis the previous dayrsquos close ndash during those three months Figure 3 for example
captures this for the month of August 2013
Figure 3 Gap-up opening in USDINR (August 2013)
Source Bloomberg
57
2018 More of the Same
Emerging markets came under renewed stress in the summer of 2018 against the back drop of the
Fedrsquos hiking cycle accompanied by the rally in crude pieces which had surged 50 over the course
of a year As some large emerging markets ndash Argentina Turkey ndash came under some stress there
was a contagion to all emerging markets with current account deficits of which India was one
Between May and October 2018 the Rupee depreciated almost 10 against the US Dollar
What were the offshore-onshore linkages during that period of time Results are presented in Table
6
Table 6 ECM and Long run coefficients
The linkages mimic 2013 The coefficient on whether onshore drives offshore 120572119899119889119891 is insignificant
in both regressions This re-affirms that in line with 2013 onshore spot and forwards were not
driving the NDF rate8 In contrast 120572119904119901119900119905 and 120572119891119900119903119908119886119903119889 are both correctly signed quantitatively
meaningful and statistically significant This suggests that it was the NDF rate that drove the
onshore spot and forward during this period likely reinforcing the presumption that volumes rise
sharply in NDF markets during periods of stress which then become the hub of price discovery
and influences onshore rates As Figure 4 reveals this is visible in the ldquogap-uprdquo movement of the
Rupee at the start of the day for several days in the month of August 2018
8 Onshore spot and forward rates does not granger cause NDF as none of the lags of 12057221(119894) in equation 2 are
statistically significant
Time Period August 2018 to Nov ember 2018
Onshore Spot and NDF -10 -05 096
Onshore Forw ards and NDF -115 -05 096
58
Figure 4 Gap-up opening in USDINR (August 2018)
Source Bloomberg
Our analysis also reveals that the speed of adjustment is very rapid relative to the baseline
Robustness test
The results are robust to the selection of time and tenure of the NDF For example instead of
India end-of-day (EOD) time as the NDF cut-off if we consider New York EOD as the NDF cut-
off there are no qualitative changes in the results Similarly instead of considering the 1-month-
NDF if we consider the 3-month-NDF the results essentially stay the same Furthermore given
the short time periods involved during stressed times (May to August 2013 and August to
November 2018) one can argue that co-integration equations may not be relevant We therefore
also carry out Granger causality tests for these time-periods and find the direction of causality to
be just above ie NDF rates are driving onshore rates during stress periods and not vice versa
Controlling both ldquoMeanrdquo and ldquoVolatilityrdquo spillovers
Thus far our focus has been on mean spillovers However as found by Misra and Behera (2006)
there are also potential ldquovolatilityrdquo spillovers from the NDF market to the spot and forward market
To model the coexistence of both mean and volatility spillovers we use a multivariate generalised
autoregressive conditional heteroskedasticity (MGARCH) model The degree of volatility
59
spillovers is measured by estimating dynamic conditional correlations between the markets The
empirical analysis is conducted using daily data from April 1 2009 through March 29 2019 and
using the currency pairs for (i) NDF-Spot (ii) NDF-Forwards and (iii) NDF-Futures
This model examines simultaneous interactions of conditional returns and volatilities across the
markets In this modelling framework we examine the Granger-causality in mean and variance as
discussed in Behera (2018) The results corroborate the earlier results that there is bi-directional
mean spillovers between onshore and offshore markets (Table 7)
An important finding using this approach is that the impact of price spillover from offshore to
onshore remains up to substantial lags while that from onshore to offshore dissipate after one day
(Annexure II) This ensues from the result that the individual coefficient estimates in the mean
equations of BEKK-MGARCH model are found to be statistically significant up to 5 lags in the
regression of returns in onshore market on that of offshore market while in the opposite case the
coefficient of onshore return is statistically significant only for the first lag
Table 7 Granger-causality tests in Mean
Direction of Causality Results
Spot to NDF 1-Month Yes
Spot to NDF 3-Month Yes
Spot to NDF 6-Month Yes
NDF 1-Month to Spot Yes
NDF 3-Month to Spot Yes
NDF 6-Month to Spot Yes
Forward 1-Month to NDF 1-Month Yes
Forward 3-Month to NDF 3-Month Yes
Forward 6-Month to NDF 6-Month Yes
NDF 1-Month to Forward 1-Month Yes
NDF 3-Month to Forward 3-Month Yes
NDF 6-Month to Forward 6-Month Yes
Futures 1-Month to NDF 1-Month Yes
Futures 3-Month to NDF 3-Month Yes
Futures 6-Month to NDF 6-Month Yes
NDF 1-Month to Futures 1-Month Yes
NDF 3-Month to Futures 3-Month Yes
NDF 6-Month to Futures 6-Month Yes
Note Null hypothesis is rejected if the p-value in the Wald test is less than 5 per cent
60
Volatility spillover between markets are studied by examining the statistical significance of
individual coefficients Granger causality in variance tests and estimating the dynamic conditional
correlations Beginning with granger causality test results imply a bidirectional causal relationship
between volatilities in both onshore and offshore markets of 1-month maturity segments only
(Table 8) In normal times no volatility spillovers are observed across the markets in other
maturity segments which reverses in the period of increased uncertainty (as found from Granger-
causality-in-variance tests taking into account asymmetric effects) The results from individual
coefficient estimates indicate about the presence of short-term volatility spillover between the
markets while the long-term volatility transmission is statistically significant from NDF market
to onshore spot forward and futures markets Moreover the asymmetric coefficients in variance
equation provide interesting insights ndash with the evidence of rise in volatility spillover from onshore
to offshore market in case of rupee appreciation while the opposite happens ie the volatility
spillover increases from NDF market to onshore market in the episodes of rupee depreciation
(Annexure II)
Table 8 Granger-causality tests in Variance
Direction of Causality Results
Without Asymmetry Effect With Asymmetry Effect
Spot to NDF 1-Month No Yes
Spot to NDF 3-Month No Yes
Spot to NDF 6-Month No Yes
NDF 1-Month to Spot No Yes
NDF 3-Month to Spot No Yes
NDF 6-Month to Spot No Yes
Forward 1-Month to NDF 1-Month Yes Yes
Forward 3-Month to NDF 3-Month No Yes
Forward 6-Month to NDF 6-Month No Yes
NDF 1-Month to Forward 1-Month Yes Yes
NDF 3-Month to Forward 3-Month No Yes
NDF 6-Month to Forward 6-Month No Yes
Futures 1-Month to NDF 1-Month Yes Yes
Futures 3-Month to NDF 3-Month No Yes
Futures 6-Month to NDF 6-Month No Yes
NDF 1-Month to Futures 1-Month Yes Yes
61
NDF 3-Month to Futures 3-Month No Yes
NDF 6-Month to Futures 6-Month No Yes
Note Null hypothesis is rejected if the p-value in the Wald test is less than 5 per cent
In order to understand how the volatility spillover between the markets changed over time a
variant of MGARCH model viz dynamic conditional correlation (DCC) model as proposed by
Engle (2002) is estimated taking the same pair of onshore-offshore exchange rate returns The
conditional volatility of 1-month NDF 1-month futures and their dynamic correlations are plotted
in Chart 249 The chart shows a sudden and significant rise in volatility during the episodes of
European debt crisis taper tantrum and latter part of 2018 coinciding with the rise in offshore-
onshore spreads resulting from the concerns regarding high current account deficits and large
capital outflows It is important to note that the volatility in NDF market is higher compared to
futures market and the divergence between the two gets accentuated in the times of heightened
uncertainty This in turn in conjunction with the rise in information asymmetry results in a drop
in correlations Since volatility spillover increases from offshore to onshore markets as discussed
earlier during periods of heightened uncertainty the volatility in onshore market increases
following the heightened volatility in offshore market In subsequent periods the correlation
increases indicating about the rise in spillovers A closer examination of the data on the volatilities
in two markets shows that volatility increases in offshore market first before it increase in onshore
markets with a lag of 1 to 2 days The correlations being positive and substantially higher imply a
significant degree of spillovers between the markets
9 The conditional volatilities for other pairs are qualitatively almost similar though their dynamic correlations are
different the dynamic correlations are provided in Chart 25
62
The dynamic correlations of volatilities for different pairs are presented in Chart 25 reveal that
that all the correlations were highly integrated and moving together alike until end December 2014
However the apparent structural changes in correlation process were observed since then with the
trends of correlations of NDF with spot and forward moving in one direction and that of NDF and
Futures moving on the opposite direction until mid-2017 The correlations have started coupling
though still continuing with some gaps between them since July 2017
060
065
070
075
080
085
090
095
00
05
10
15
20
25
30
2009 2010 2011 2012 2013 2014 2015 2016 2017 2018
Chart 24 Time-varying Volatility and Correlations Futures and
NDF
1-month Futures 1-month NDF DCC (right scale)
63
Conclusions and Implications
Since the work on establishing onshore-offshore price linkages in India was relatively sparse
outdated and inconclusive the goal of this Chapter was to create an updated empirical fact base
given the rapidity with which capital markets have developed and integrated and the pace at which
the NDF market has grown The overall results present a bidirectional relationship between
onshore and offshore markets
First that for full sample the price linkages ndash both mean and volatility ndash are found to be
bidirectional Both onshore and offshore rates have a strong long-term relationship and that when
a shocks throws that relationship into disequilibrium both onshore (spot and forward) and offshore
rates converge towards each other This suggests both influence each other This is consistent with
earlier findings in literature and should not be surprising Relative volumes across these market
are very dynamic and vary significantly When the bulk of the volumes flow through the onshore
050
055
060
065
070
075
080
085
090
095
100
2009 2010 2011 2012 2013 2014 2015 2016 2017 2018
Chart 25 Dynamic Conditional Correlations of Volatilities
SPOT_NDF1 SPOT_NDF3 SPOT_NDF6 FW1_NDF1 FW3_NDF3
FW6_NDF6 FUT1_NDF1 FUT3_NDF3 FUT6_NDF6
Forwards
Futures
Spot
64
market it becomes the locus of price discovery The converse is true when the bulk of volumes
are routed through the NDF market which then becomes the principle pole of price discovery
During the last two stress episodes (the taper tantrum and the 2018 EM crisis) however the
relationship turned unidirectional with the NDF market driving onshore spot and forwards and
the speed of adjustment from any disequilibrium increasing very sharply compared to ldquonormalrdquo
times Furthermore volatility spillovers also increased from offshore markets to onshore during
the periods of heightened uncertainty There is however an interesting asymmetry There is
evidence of rise in volatility spillover from onshore to offshore market in case of rupee
appreciation while the opposite happens ie the volatility spillover increases from NDF market to
onshore market in the episodes of rupee depreciation
All told as NDF volumes have increased they have begun to play an important role in both price
discovery and driving volatility particularly during heightened uncertainty periods
65
Chapter 4
International Financial Service Centre (IFSC)10 ndash Use of Rupee derivatives
The Task Force (TF) is vested to examine the role if any IFSC can play in addressing the concerns
arising out of offshore Rupee markets Presently Rupee is not permitted to be traded in the IFSC
This chapter discusses the aspects relevant to availability of non-deliverable Rupee derivatives in
the IFSC and permitting banks (IFSC Business Units or IBUs) to deal in such derivatives Before
discussing the potential benefits and concerns from the aforesaid proposition it is important to
address this issue ndash Are markets in IFSC onshore or offshore In the context of the Rupee market
a critical test for deciding the residency of the market would be applicability of capital controls in
respect of taking and exiting positions under FEMA 1999 Inter alia this is the critical aspect in
difference between the price discovered in onshore and offshore market As the IFSC functions
outside the capital controls under FEMA 1999 type of participants and the price discovered in
Rupee markets here will align with the existing offshore markets and therefore it cannot be treated
as onshore market To sum up while legally IFSC is very much an entity on the shores of India
from the point of view of Rupee markets it has to be treated as an offshore entity
Potential benefits of permitting non-deliverable Rupee derivatives in the IFSC
i Bringing NDF market volume to the IFSC Over the last decade or so a significant
market share in financial services related to India has moved to other international financial
centres like Singapore Hong Kong and London Bringing this business to India is clearly
beneficial in terms of economic activity and employment gains for India Further the size
and growth of the offshore Rupee derivative market poses a significant challenge to the
efficiency of price discovery as well as the effectiveness of exchange rate management
policy The possibility that the exchange rate of the Rupee not a fully convertible currency
being materially determined by transactions largely outside the legal and regulatory
influence of India is a matter of concern Given the favourable tax regime tax and by virtue
10
International Financial Services Centre or lsquoIFSCrsquo has the same meaning given in Section 2 (q) of the Special
Economic Zones Act 2005 (28 of 2005)
66
of it being outside the capital controls under FEMA 1999 IFSC may bring volumes and
price discovery to India
ii Complete bouquet of financial services in the IFSC Currently exchanges in IFSC are
permitted to offer a well-diversified range of products spanning various asset classes
which include derivatives on Indian indices derivatives on Indian stocks derivatives on
foreign stocks cross currency derivatives commodity futures on Gold Silver and base
metals etc Further while listing and trading of Masala Bonds is permitted in the IFSC
hedging Rupee exchange rate risk on it is not permitted Thus introduction of Rupee
derivatives will complete the entire range of asset classes available for trading in the IFSC
iii Access to market information The offshore Rupee market has been the subject matter of
interest for all stakeholders as these markets have an impact on onshore markets However
in the absence of any authentic data there are varying estimates about the volumes traded
in these markets nature of participation extent of open interest and the extent to which
these markets are used for hedging purposes If by opening up the IFSCs to Rupee trades
there is some migration of offshore Rupee market volumes it will help the cause of better
information flow regarding the market
iv Level playing field for Indian banks Foreign bankrsquos branches outside India can deal in
the offshore market as they are not bound by the RBIrsquos regulations On the other hand
overseas branches of Indian banks cannot deal in Rupee derivatives in the offshore market
By introducing Rupee derivatives in IFSC and permitting IBUs to deal in such derivatives
a more level playing field can be provided to Indian banks to service non-residents
Concerns from non-deliverable Rupee derivatives trading in the IFSC and dealing by IBUs
such derivatives
i Cannibalizing onshore business One major concern arising out of the introduction of
non-deliverable Rupee derivatives in the IFSC is whether it would cannibalize the business
of the onshore market instead of importing volumes from abroad Since the products in
both IFSC and the onshore market would be more or less similar in terms of characteristics
the domestic futures market getting gradually cannibalized by the IFSC on the face of it
appears probable But a deeper analysis of the comparative regulatory framework would
allay such concerns to a large extent The domestic currency futures market is majorly
67
made up of resident participation Non-residents are nearly absent in these markets and
hence their shift to the IFSC is more a theoretical proposition Since the Indian residents
are not permitted to participate in the IFSC they cannot contemplate a move-over It also
important to note that the onshore market settles in INR whereas derivative contracts in
the IFSC would settle in dollars and hence these markets will cater to two distinct classes
of participants
ii Impact on exchange rate management policy and development of the onshore market
Presently Indian banks are not allowed to deal in Rupee derivatives in the offshore market
A detailed discussion on the issue of allowing such dealing is presented in Chapter 5 In
consideration of the risk that participation of Indian banks may improve liquidity in the
offshore market and undermine the development of the onshore market the TF is of the
view of that Indian banks should not be permitted to deal in offshore Rupee market IFSC
being an offshore centre all concerns expressed in Chapter 5 in this regard are valid on
Rupee market in IFSC also However unlike other offshore Rupee market venues IFSC
has the potential of providing certain benefits to India as discussed earlier in this chapter
and therefore a distinction could be made between the two while examining the case of
permitting Rupee derivatives to be traded in the IFSC
iii Spillover of risks from IFSC to onshore market This is a concern since the two
markets being geographically contiguous could create porous leakage channels This
concern can be addressed by stipulating distinct net open position limits for entities
operating in both IFSC and on-shore In other words the open positions of entities
operating in the IFSC should not be permitted to be netted off with the open position on-
shore
What does a volatile Rupee exchange rate in the IFSC imply for the RBI and onshore
market
Chapter 3 establishes the linkages between the offshore and onshore Rupee market IFSC being an
offshore jurisdiction will have the same impact The RBI as the monetary authority has the
authority under RBI Act to maintain the stability of the rupee A volatile onshore foreign exchange
market could act as the trigger point of volatility in other financial markets like money bonds and
68
equities The spill over impact of financial market volatility casts its shadow on asset prices and
in turn it could have an impact on the capital flows and financial stability Given that a separate
regulator is envisaged for the IFSC the issue of RBIrsquos role in the IFSC was extensively deliberated
by the TF There are two possible approaches
i RBI plays a pivotal role in framing the Rupee derivative regulation in the IFSC In
order to allow the RBI to take measures in line with the objectives of exchange rate
management policy the sine qua non for allowing Rupee derivatives in the IFSC is to
ensure that RBI vested with the obligations to maintain financial and monetary stability
should continue to perform its statutory role in determining the regulatory framework for
Rupee market in the IFSC
ii Treat it akin to any other offshore market and maintain a hands-off approach The
objective of introducing Rupee derivatives in the IFSC is to provide an alternative to non-
residents for dealing in non-deliverable Rupee derivatives The expected transition of
investors is likely to be successful only if the IFSC functions with same freedom as other
offshore markets At the same time from an exchange rate management perspective
permitting Rupee trading in IFSC should not make a material difference to local authorities
as long as there is a barrier between the onshore market and IFSC In that case IFSC would
be exactly of the same status as any other offshore market
The TF feels that in line with the objectives of permitting Rupee derivatives in the IFSC the latter
approach - that the regulatory environment in which Rupee trades in IFSC is exactly similar to the
environment that prevails in any other offshore centre - is preferable As IFSCs are treated on par
with a foreign jurisdiction in terms of FEMA the regulation of the trade and capital flow channels
between the two jurisdictions (on-shore and IFSCs) should be so designed as to restrict the
transmission of volatility through these channels (in terms of participants products limits etc)
Recommendation
While there are concerns around impact on the onshore market due to trading in Rupee derivatives
in the IFSC there are potential benefits in terms of IFSCrsquos ability to offer complete bouquet of
financial services and availability of market information to all stakeholders Further given Indiarsquos
69
economic growth it may be appropriate to prepare for greater financial integration with the rest of
the world Sequencing and timing of measures relating to currency markets is a critical component
of such integration Although at the moment there is no definite path ahead in terms of such
integration but a thriving Rupee market in the IFSC may provide a system which can be leveraged
towards this end in the way and manner deemed fit in future IFSC being outside the capital
controls provides an opportunity to policymakers to test new regimes and products in an
environment whose repercussions may not significantly impact the stability or efficiency of the
onshore system On balance the TF is of the view that non-deliverable Rupee derivatives may be
introduced in the IFSC However a phased approach may be adopted and to start with trading
may be permitted only on exchanges due to the inherent transparency and risk management
benefits offered by it Introducing OTC contracts may be considered at a later stage after the
experience gained from trading on exchanges RBI may in its Financial Stability report assess the
impact of the functioning of IFSC on the financial stability of the country
Further the TF is of the view that entities regulated and permitted by the RBI may be permitted
to make market and run positions in Rupee derivatives market in the IFSC In order to prevent
spill over of risks from IFSC to onshore market though these entities a distinct net open position
limit may be stipulated for their operations in the IFSC In other words the open positions of
entities operating in the IFSC should not be permitted to be netted off with their open position
the onshore market
Finally given the mandate of RBI to implement exchange rate policy it may not be in benefit of
things to introduce Rupee derivatives in the IFSC without it being on board and therefore the TF
feels that Rupee derivatives may be permitted in the IFSC subject to agreement of the RBI
70
Chapter 5
Issues and Recommendations
The Task Force (TF) is entrusted to recommend measures to incentivize non-residents to access
the onshore Rupee derivative market and address concerns if any arising out of the offshore
Rupee derivative market As discussed in Chapter 1 the TF had interactions with various
categories of stakeholders to understand their perspective on the matter and identify the issues that
needs to be addressed
Chapter 2 and 3 have clearly brought out the increased importance of offshore Rupee markets
both in terms of their size and in terms of their impact on the exchange rate of the Rupee The price
and volatility spillovers from one market to the other are almost complete they are bi-directional
and when rupee is under pressure they are unidirectional from offshore markets to onshore
markets The speed of convergence of the markets is also quite quick The TFrsquos recommendations
have been made in the light of available information results of statistical analysis and most
importantly on the feedback received from various consultations
While increased participation of non-residents would be expected to enhance liquidity in the
onshore market it may also bring along with it additional volatility and transfer of incremental
risk to the domestic system This is particularly so as historically the rupee is a currency that has
generally depreciated and the demand for forward dollars is usually more than the supply
especially in times of stress Hence it is pertinent to examine the impact of incremental hedging
by non-residents in the onshore market While volatility in the rates have a clear impact on the real
sector events in the domestic derivatives markets in the late 2000s constantly remind us of issues
related to transfer of risk to entities that are not capable of understanding and managing it The big
question then is whether our system today is ready for incremental demand for hedging from non-
residents Available data is inadequate to measure the contribution of hedgers and speculators in
the offshore market turnover Using the best available information it can be estimated that an
additional daily average Rupee derivative turnover of around 08 billion ndash 24 billion could be
generated in the onshore market if all the INR NDF hedging transactions are transferred from the
offshore market (see Box 1) Such an incremental flow is not significant enough to cause any
adverse impact on volatility in the onshore market given that the user-driven deliverable forwards
market in India is quite liquid with daily average turnover of USD 163 billion (as per BIS
71
Quarterly Review December 2016) As regard transfer of risk to the domestic system the concern
is more regarding transfer of risk to the Indian companies and less towards market-makers as they
are in the business of managing risk There is a possibility that the said incremental positions
created in the onshore market may get transferred to Indian companies (in part or full depending
upon the level of these positions retained by the market-makers) However in comparison with
the late 2000s Indian companies today are only allowed to enter into Rupee derivatives depending
on their underlying exposure and no leveraged structures are permitted Also banks are bound by
stringent suitability and appropriateness norms Therefore the chances of Indian companies
acquiring unmanageable risk positions or risks due to mis-selling by market-makers are very low
Further there has been a significant growth in the external sector and consequently the foreign
exchange market has also grown (although one could argue on the incommensurate growth) To
summarize in the last decade or so the ecosystem on the whole has evolved and is less prone to
adverse impact from transfer of risks from non-residents
Box 1
Approximation of share of hedging transactions in INR NDF turnover
The graph presented below is extracted from BIS Quarterly Review December 2016
72
It can be observed from the above graph that non-financial and other financial institutions
contribute around 5 and 35 respectively to the turnover of INR NDFs in the offshore market
If one were to make an informed guess that all transaction by non-financial companies are hedging
transactions and that hedging transactions by other financial companies (eg funds) would
constitute maximum 25 of their transaction then it can be approximated that hedging transactions
constitute around 5 - 15 of the daily average turnover in INR NDF market which was reported
as USD 164 bn
Comparison of turnover in forwards in onshore and offshore market - In the same publication
it is also reported that the average daily turnover in onshore deliverable forwards is USD 163 bn
It may be noted that for fair comparison with the turnover in offshore market (where deliverable
spot and swap market doesnrsquot exist) this turnover includes both deliverable forwards and FX
swaps A comparative analysis of volumes in onshore and offshore market ndash both OTC and
exchange traded Rupee derivatives - is given in Annexure IV
Issues and recommendations
1 Market hours
An important reason for the existence of the offshore Rupee derivative market is simple geography
That domestic markets are closed when major users in certain regions (eg the United States) are
working creates a natural access for offshore markets Also significant international developments
impacting the Rupee exchange rate take place outside the onshore market hours thereby creating
a natural clientele for the offshore markets The feedback received from non-resident investors as
well as corporates highlighted the closure of the local market as an important reason for them
accessing the offshore market Exchanges have for some time been requesting an extension of
market hours citing increasing Rupee transaction volumes in offshore exchanges situated in
Singapore and Dubai A straightforward way of taking care of such requirements is to extend the
onshore market hours (both OTC and exchange traded derivative markets) While extending
market hours might involve simultaneously keeping support services (payment and settlement
systems) or support markets (funding markets) open it is also possible to treat such transactions
as part of the operations of the next day in which case the need for settlement or funding does not
73
arise In this regard the TF supports the recommendations relating to market timings outlined in
the draft Report of the Internal Working Group on Comprehensive Review of Market Timings
published by RBI on July 10 2019
Recommendation 1
The TF recommends that the onshore market hours be suitably extended to match the flexibility
provided by the offshore market and thereby incentivize non-residents to hedge in the onshore
market
2 Competitive pricing
One important feedback from foreign portfolio investors (FPIs) as well as global corporates was
that they are unable to access multiple competitive quotes in the onshore market Effectively they
are limited to using the prices of their custodian banks Generally FPIs deal only with their
custodian banks due to the existing rules whereby the custodian is responsible for tracking of
outstanding hedges vis-agrave-vis portfolio size This ldquofrictionrdquo issue can be addressed by shifting the
monitoring to a centralized agency which can use a technology solution to track exposures as well
as outstanding hedges This is further explained in recommendation no 4 ahead relating to
underlying exposure
Also the process to be setup documentation such as KYC and other trading arrangements with
multiple counterparties in India is a long and difficult exercise resulting in most FPIs either trading
with their custodian bank or using the offshore market to hedge Some of the documentation related
challenges can be minimized if the centralized KYC registration currently in place for SEBI
regulated entities is extended to all the entities ie both custodial banks as well as non-custodial
banks This is elaborated in recommendation no 11 on the KYC process
Another issue highlighted by FPIs in this context was unavailability of multi-dealer electronic
dealing platforms for them One way of making onshore prices more widely accessible to non-
residents is to allow Indian banks to freely offer prices as liquidity providers to non-resident
customers at any time whether or not the domestic market is open They can extend to non-resident
corporates the same choices that domestic corporates have in choosing among various market
makers This can be done either by a domestic sales team or by using staff located at overseas
74
branches In addition making an all-to-all trading platform (like the FX-Retail being introduced
in August 2019) available to non-residents would supplement that effort
Recommendation 2
The TF recommends that banks may be allowed to freely offer prices to non-residents at all times
out of their Indian books either by a domestic sales team or by using staff located at overseas
branches Also wide access to the FX-Retail trading platform to non-residents would be a major
incentive to use the onshore market
3 Effect of offshore Rupee derivative market on onshore price discovery and exchange rate
management policy
The size and growth of the offshore Rupee derivative market especially in the last few years poses
a significant challenge to the efficiency of price discovery as well as the effectiveness of exchange
rate management policy A comparison of onshore and offshore Rupee derivative market is given
in Annexure IV The possibility that the exchange rate of the Rupee not a fully convertible
currency will be materially determined by transactions largely outside the legal and regulatory
influence of India is a matter of concern The most straightforward approach to deal with that
concern would be to completely liberalize the onshore market and bring it at par with the offshore
market in all aspects Such a scenario would imply an effective absence of local regulation and
intervention which is incompatible with the current status of capital account convertibility
Another option is to liberalise the onshore market to the extent possible but this in itself may not
necessarily mean a fall in importance or size of the offshore market In this connection the TF
extensively discussed the proposition of creating a connection between the offshore and onshore
markets by permitting Indian banks to deal in the offshore market The various implications of
such a step are discussed below
i Reduction in volatility In theory a segmented market would be less liquid and therefore
more volatile compared to an integrated market One could also infer that offshore market
activity is maximum during onshore working hours eg almost three-fourths of the
offshore rupee futures are traded when Indian markets are open It is also observed that
75
offshore spreads are larger which indicates a relative scarcity of market-making entities
Linking the two markets may increase both the customer base as well as the liquidity
providers thereby improving liquidity as well as efficiency of the price discovery process
ii Better customer pricing through increased transparency in the offshore market
Today very little information is available regarding the offshore Rupee market other than
that of exchange traded instruments Such opacity is not in the interest of customers as
liquidity provision is limited to entities that have a presence both onshore and offshore
resulting in a premium (in terms of high bid-ask spreads) being charged for market access
Broadening this access to onshore banks would drive away such premium through wider
competition At the same time access to information improves for the local authorities
Since better information leads to better price efficiency it is in the interest of local
authorities to disseminate such information leading to an overall improvement in market
transparency
iii Level playing field for Indian banks Foreign bankrsquos branches outside India can deal in
the offshore market as they are not bound by the RBIrsquos regulations On the other hand
overseas branches of Indian banks cannot deal in Rupee derivatives in the offshore market
Allowing them access to the offshore Rupee derivative market would create a level playing
field for Indian banks
iv Impact on development of the onshore market Liquidity in onshore market is better
than the offshore market due to participation of real sector and market making by Indian
banks which obviously are the major Rupee liquidity providers Consequently non-
residents have the ability to exit positions with less impact cost in unfavourable times This
is a strong incentive for them to hedge in the onshore market (given dynamic hedging and
other operational issues are now being ironed out) Also higher liquidity in the onshore
market results in tighter bid-ask spread compared to the offshore market which allows non-
residents to get better pricing in the onshore market The aim of policy measures is to
develop the onshore market Accordingly policymakers strive to protect the advantages of
onshore market and at the same time develop and liberalise the onshore market to overcome
the gap vis-agrave-vis NDF markets in other aspects such as ease of access market infrastructure
and taxation There is of course the risk that participation of Indian banks will improve
76
liquidity in the NDF market and undermine the development of the onshore market Such
a situation will be challenging for implementing exchange rate management policy
Recommendation 3
The onshore Rupee derivatives market is currently more deep and liquid as compared to the
offshore Rupee market and participation of the Indian banks in the offshore market might over
time take away this advantage The TF feels that the downside of permitting Indian banks to deal
in the offshore Rupee derivative market outweighs the advantages and therefore recommends that
Indian banks should not be permitted to deal in the offshore Rupee derivative market for the
present
4 Requirement of underlying exposure and documentation therefor
There is no requirement of an underlying exposure to enter into a derivative contract in the offshore
Rupee derivative market Hence non-residents can freely trade in this market to hedge risk on an
underlying Rupee exposure or create exposure to Rupee However as per extant regulations non-
residents can enter into Rupee derivative contracts in the onshore market only for the purpose of
hedging risk arising from an underlying exposure Non-residents are classified into Foreign
Portfolio Investor (FPI) investors having Foreign Direct Investments Non-Resident Indian Non-
resident Exporters and Importers and Non-Resident lenders having ECBs designated in INR with
each category being subjected to a different set of rules for establishing underlying exposure
FPIs are allowed to hedge only on the basis of existence of underlying exposure with the hedge
size capped at the market value of investment in equity and debt in India as on a particular date
including any coupon receipts arising out of investment in debt securities falling due during the
following twelve months only The explicit mention of only equity and debt investments creates
regulatory ambiguity on hedging of other FPI exposures in India such as margin deposits cash
etc Hence any FPI having investment in India will be able to only buy USD forward against INR
onshore and will not be allowed to sell USD against INR in forward market as that would result in
increasing the exposure rather than hedging the exposure To prove the exposure a valuation
certificate is required to be provided by a designated AD bank (Custodian) as a proof of underlying
FPIs are also required to provide a declaration to the effect that their total outstanding hedges are
within the market value of their investments The only exception to establishing underlying
77
exposure requirement is dealing in exchange traded market where FPIs are allowed to take
positions without having to establish existence of underlying exposure up to USD 100 million
FDIs are allowed to hedge both their existing investment as well as proposed foreign direct
investments with the latter being allowed only after an AD bank ensures that all necessary
approvals for the investment have been obtained by the FDI With respect to non-resident
corporates users can hedge their exposures invoiced in INR and intercompany loans denominated
in INR (ECBs) They can book the hedge either directly with an AD bank in India or on a back-
to-back basis Prior to hedging they must furnish a declaration certifying that the underlying
exposure has not been hedged with any other AD bank(s) in India They are required to cancel the
hedge contract immediately if the underlying exposure is cancelled In case of a central treasury
an authorization from the entity having INR exposure to hedge on its behalf is also required
Irrespective of the category of the investor the requirement to establish underlying exposure
creates practical difficulties for many non-residents Funds who intend to execute macro hedge for
various schemes or MNC parents wanting to consolidate exposures across subsidiaries and
executing a single hedge find it easier to execute consolidated hedge in the offshore market Also
hedging of anticipated and economic exposures is not permitted
Recently the RBI has released11 draft regulation regarding risk management facilities for public
feedback The TF reviewed it in detail and also received feedback on it during interaction with
stakeholders The proposed regulation satisfactorily addresses a lot of pertinent issues Measures
on simplifying eligible underlying exposure criteria simplifying documentation requirement
flexibility to hedge dynamically ability to hedge anticipated exposures user classification (retail
and non-retail) and choice of products are welcome and much needed It is noted that the
requirement of having an underlying exposure for entering into Rupee derivative contract is
retained and it is felt that it is justified for effectiveness of exchange rate management policy and
ensuring financial stability Given that only hedging transactions are going to be permitted in the
onshore market there will remain a requirement to establish or declare existence of underlying
exposure to risk and also to ensure that notional of hedge contracts is in line with the value of
underlying exposure As discussed above such requirement acts as a deterrent for non-residents to
hedge in the onshore market It would be optimum if a solution can be found that fulfils the
11
Vide press release dated February 05 2019
78
requirement of verification of underlying exposure without the investors being required to
undertake the efforts to prove it This can be achieved by consolidating the existing data on
investments and hedge transactions residing with various regulated entities
Recommendation 4
The TF recommends that a technology-based solution be explored to centrally aggregate the
investments of non-residents and derivative contracts entered into by them in the onshore market
(both OTC and exchange traded) using LEI or any other unique identifier to start with ADs should
be allowed access to such aggregate data so that they can verify the quantum of derivative positions
and underlying investments of the non-residents This mechanism can potentially completely
remove the requirement of efforts from the non-residents to prove the existence of underlying
exposure to Rupee
Further to simplify procedures and provide ease of access to the exchange traded currency
derivative market the RBI has allowed users to enter exchange traded instruments (futures and
options) to take exposure up to USD 100 million without the requirement of establishing the
existence of underlying risk Such measures go a long way in encouraging users (especially
MSMEs) to hedge their exchange rate risk by making the process easier At the same time such
calibrated opening helps in addressing any concerns of systemic risk The TF feels that such an
incentive must be provided in the OTC market also as it will not only contribute to ease of doing
business but also to restore parity in regulation between OTC and exchange markets
Recommendation 5
While requirement of underlying exposure will continue for trading in the onshore market users
may be allowed to undertake positions up to USD 100 million in OTC as well as exchange traded
currency derivative market without having to establish the underlying exposure
5 Products
Non-residents can enter into only plain vanilla forwards and option contracts in the OTC foreign
exchange market Further swaps are restricted to specific case of IPO and non-resident lenders of
ECB denominated in INR Non-residents who prefer to express their hedge using structured
79
options necessarily need to execute in the offshore market as current regulations do not allow non-
residents to enter into structured options
Recommendation 6
The aforesaid draft regulation addresses this issue by allowing ADs to offer any product to the
non-residents (for non-retails users) which satisfies the purpose for which they are permitted to
enter into Rupee derivatives ie hedging of underlying exposure to Rupee In other words ADs
cannot offer any product that creates risk for the user instead of hedging the existing risk The TF
endorses this principle-based regulation approach
6 Restrictions on dynamic management of risk
Non-residents trading in the offshore market are free to cancel and rebook their trades depending
on their future expectations andor risk management policy On the other hand in the onshore
market non-residents in general are not allowed to rebook a contract once cancelled Only in the
case of FPIs rebooking up to 10 of the value of contracts cancelled is permitted Inability to
manage risk dynamically deters non-residents who look for flexibility while hedging their risks
The aforesaid draft regulation proposes to remove restrictions on rebooking of cancelled contracts
and thereby allow users to hedge dynamically For contracts entered into for hedging contracted
exposure gains (or losses) on cancellation will be passed on to the user as and when they accrue
but in case of contracts entered into for hedging anticipated exposures net gains will be transferred
only when the underlying cash flow has occurred The prime purpose of such stipulation is to curb
incentives for speculation by using the liberal position limits available under anticipated exposure
hedging However a consequent drawback is that in some instances eg contingent contracts
such as bidding for projects involving currency risk such a provision would not be equitable This
provision could be suitable amended to enable all types of hedging without compromising the
essential control that the cash flow requirement provides to ensure underlying in a hassle-free way
The TF is of the view that providing suitable discretion to banks to pass on net gains even without
cash flows in such cases would address this shortcoming This will ensure that genuine hedgers
80
will access the onshore market without worrying about retention of gains if underlying transaction
does not fructify due to reasons beyond their control
Recommendation 7
In line with the objective of bringing onshore market at par with offshore market the most obvious
path is to not have any restrictions on transfer of gains in case of anticipated exposure hedging
However a balancing act is necessary between liberalizing the market while preventing
speculative positions which can create undue volatility in the onshore market Keeping this in
mind while endorsing free dynamic hedging (without any restriction on cancellation and
rebooking) for hedging contracted exposure the TF recommends that in case of hedging of
anticipated exposures gains from cancellation of contract may be allowed to be passed on even in
cases where there are no cash flows at the discretion of the bank where the bank considers the
cancellation of underlying cash flow is due to external factors which are beyond the control of the
user
7 Gross settlement and credit risk management
In the case of offshore Rupee derivative market non-residents clear and settle OTC trades either
through a prime brokercustodian or bilaterally with the counterparty In both these cases the non-
residents usually execute a bilateral multi-currency master service agreement which includes
provisions for exchange of margin (ex- ISDA master agreement including Credit Support Annex)
with the counterparty These agreements necessitate periodic settlement of marked-to-market gains
and losses across products and provide the flexibility to net off losses against gains Hence these
agreements significantly lower credit charges and provide strong netting efficiency On the other
hand in the onshore market the non-residents in an otherwise identical situation will face
additional challenges in respect of settlement and exchange of margin due to the following reasons
Gross settlement of gains As mentioned above non-residents clear and settle OTC trades in the
offshore Rupee derivative market either through a prime broker or bilaterally with the
counterparty Typically they settle deal across assets and currencies with either of these entities
and are therefore able to net the cash flows and achieve efficiency in liquidity management
81
However as Rupee derivatives entered into in the onshore Rupee derivative market cannot be
settled under such overseas arrangements non-residents are unable to avail the benefits of netting
on their onshore transactions
Credit risk management Signing a master service agreement locally and establishing credit lines
with onshore banks increases the execution cost of hedging onshore Typically transactions of
non-residents in the offshore market are collateralized (through collateral exchange provisions
contained in the master service agreement) while those in the onshore market are non-
collateralized Depending on the credit rating of the non-resident the onshore banks may not
necessarily be open to providing exposurecredit limits on uncollateralized basis for entering into
deliverable contracts If a collateralized credit line is set up through a master service agreement
with provision for exchange of collateral in USD outside India restrictions under FEMA 1999 on
exchanging margin outside India by onshore banks poses issues If exchange of collateral is in INR
in India then the non-residents will have to either assume the exchange rate risk on the cash margin
deposited or will have to additionally hedge the margin money placed Moreover this attracts
regulatory ambiguity such as minimum tenor restrictions as per deposit regulations ability to
hedge the margin through FX swap interest to be paid on cash in SNRR account etc If interest
cannot be paid on the collateral placed with onshore counterparties it creates a strong economic
disincentive for the investor to hedge onshore
These issues can be addresses in two ways First facilitating the non-residents to utilize their
existing overseas custodianprime broker relationship and master service agreements for
settlement of their transactions onshore and exchange of collateral therefor Second by creating
the regulatory framework for exchange of margin for non-centrally cleared derivatives in India to
make it consistent with evolving clearing mechanism offshore Both the solutions are discussed
below
To help non-residents retain their economic neutrality with respect to the prevailing multi-currency
master service agreement executed offshore a central clearing and settlement mechanism may be
established for non-residentsrsquo deals with onshore counterparties along the lines of central clearing
and settlement of onshore interbank deals by the CCIL The overseas bank of the non-resident will
clear and settle the deals execute by them onshore To be sure the proposal is to introduce the
centralized clearing mechanism while retaining the existing bilateral settlement mechanism so that
82
investors who want to continue using it do not face disruption For the suggested central clearing
and settlement mechanism to be set up inter alia the following permissions would also be
required
i Permission under FEMA 1999 for CCIL to accept foreign currency denominated collateral
in India or outside India
ii Enhancement of CCILrsquos infrastructure to accept wide range of securities (foreign currency
cash securities issued by foreign governments etc) as collateral and
iii Other regulatory clearances required for non-residentsoverseas banks in other jurisdictions
to clear and settle through CCIL
Further back-to-back hedging by non-residents proposed in the aforesaid draft regulation will also
allow effective utilization of their prevailing multi-currency CSA arrangement offshore This
entails allowing non-residents to hedge their exposure with their banking counterpart overseas
which in turn will hedge the position back-to-back with an onshore bank This ensures that existing
dealing arrangements between non-residents and their overseas counterparties remain unchanged
but at the same time the market risk gets transferred to onshore banks and hence is managed locally
The overseas bank should be allowed to settle the onshore leg either bilaterally with the onshore
bank or through the proposed central clearing and settlement mechanism Also this will require
permissibility under FEMA 1999 to exchange margin with the overseas banker of non-residents
outside India In such a model the approach should be to recognize the intermediary offshore bank
as a facilitator purely for the convenience of the non-resident investor Experience from other
markets that have implemented such models like Malaysia and China suggest that putting the onus
of monitoring compliance in terms of quantum of hedge underlying documentation etc on the
intermediary bank is inefficient Such a requirement leads to the intermediary bank asking for
various indemnities from the client and these are often difficult and time consuming to negotiate
and sign The approach should be to monitor compliance by the non-residents as the regulated user
using available onshore infrastructure as well use of technology solutions to track the hedges vis-
a-vis underlying exposure as detailed in recommendation 5
With regard to regulation and infrastructure for exchange of margin for non-centrally cleared
derivatives in India the RBI released a discussion paper on this issue in May 2016 However the
final directions have not been issues yet It is understood that ambiguity in netting legislation is
83
one of the main issues holding the release of these directions Also it is understood that the GoI is
in the process of making legislative changes to address this issue
Recommendation 8
For ease of entering into hedge transactions for non-residents the TF recommends-
i Establishment of a central clearing and settlement mechanism for non-residentsrsquo deals in the
onshore market
ii Back-to-back hedging by non-residents proposed under the draft regulation is endorsed The
overseas bank should be allowed to settle the onshore leg either bilaterally with the onshore bank
or through the proposed central clearing and settlement mechanism
iii Implementation of margin requirement for non-centrally cleared OTC derivatives in the
onshore market at the earliest
iv Allowing Indian banks to post margin outside India This is not only relevant for credit risk
management for their transactions with non-resident users but also for their cross-border inter-
bank transactions
8 Taxation
Under the extant regulatory framework non-residents are permitted to enter into Rupee derivative
contracts only for hedging risk on their investmentslendingtrade in India As per discussions with
stakeholders the following position is generally adopted with regard to the gains from such
contracts
bull Where currencies under the contract are delivered ndash Not a taxable event (ie conversion of
one currency into another does not give rise to taxable income)
bull Where contract is cancelled and price difference is settled ndash If the derivative contract is
entered into for hedging exchange rate risk on a capital asset then gains on cancellation are
treated as capital gains If it is entered into for hedging exchange rate risk in relation to a
tradingbusiness asset such gains are treated as business profits
84
However it is understood that there is ambiguity in the rules in this connection and the position
taken by the Assessing Officers (AOs) differs between zones and is at variance with the aforesaid
position Oftentimes such gains on cancellation are treated as lsquoOther Incomersquo or lsquoSpeculation
Business Profitsrsquo During interaction with the non-residents it was suggested that such uncertainty
of tax treatment is one of the prime reasons why they do not access the onshore market and instead
hedge Rupee exposures in the off-shore market
Recommendation 9
The TF recommends that the competent authorities may examine the issue of taxation in respect
of foreign exchange derivative contracts with the objective of overcoming gaps between tax regime
in India and other major international financial centres (Singapore Hong Kong and London) to
the extent possible and thereby incentivizing non-residents to hedge in the onshore market
9 Allow non-deliverable Rupee derivatives in the IFSC and permit IBUs to deal in such
derivatives
The proposition of introducing non-deliverable Rupee derivatives in the IFSC and permitting
banks (IFSC Business Units or IBUs) to deal in such derivatives is discussed in detail in Chapter
4 While there are concerns around impact on the onshore market due to trading in Rupee
derivatives in the IFSC there are potential benefits in terms of IFSCrsquos ability to offer complete
bouquet of financial services and availability of market information to all stakeholders Further
given Indiarsquos economic growth it may be appropriate to prepare for greater financial integration
with the rest of the world Sequencing and timing of measures relating to currency markets is a
critical component of such integration Although at the moment there is no definite path ahead in
terms of such integration but a thriving Rupee market in the IFSC may provide a system which
can be leveraged towards this end in the way and manner deemed fit in future IFSC being outside
the capital controls provides an opportunity to policymakers to test new regimes and products in
an environment whose repercussions may not significantly impact the stability or efficiency of the
onshore system On balance the TF is of the view that non-deliverable Rupee derivatives may be
introduced in the IFSC However a phased approach may be adopted and to start with trading
may be permitted only on exchanges due to the inherent transparency and risk management
85
benefits offered by it Introducing OTC contracts may be considered at a later stage after the
experience gained from trading on exchanges RBI may in its Financial Stability report assess the
impact of the functioning of IFSC on the financial stability of the country
Further the TF is of the view that entities regulated and permitted by the RBI may be permitted to
make market and run positions in Rupee derivatives market in the IFSC In order to prevent spill
over of risks from IFSC to onshore market though these entities a distinct net open position limit
may be stipulated for their operations in the IFSC In other words the open positions of entities
operating in the IFSC should not be permitted to be netted off with their open position the onshore
market
Recommendation 10
The TF recommends that non-deliverable Rupee derivatives (with settlement in foreign currency)
may be allowed to be traded in the IFSC and IBUs may be allowed to deal in such derivatives with
a distinct FCY-INR position limit To start with exchange traded currency derivatives involving
Rupee may be introduced and with experience non-deliverable OTC currency derivatives
involving Rupee may also be allowed
10 KYC process
The extant directions issued by the Reserve Bank of India stipulates the documents required for
conducting KYC process to open accounts of non-residents Similarly SEBI has also prescribed
documents required for the granting of FPI license by Domestic Depository Participants (DDP)
Further KYC documents for FPIs are available to SEBI regulated entities through KRAs subject
to approval from either the FPIs or the domestic custodians Since access to KRAs is available
only to SEBI regulated entities most banks are not allowed to access KRA and hence seek
complete documentation from FPIs again Such repetitive submission of documents to various
financial intermediaries results in long lead time for on-boarding and makes the entire process
operationally cumbersome for non-residents
Recommendation 11
The TF recommends that the KYC registration may be centralized across the financial market with
uniform documentation requirement All regulated financial market intermediaries should be
provided access to the centralized registry and they should be allowed to rely on online registry
86
for confirmation that KYC has been completed and itrsquos valid This will ensure that non-residents
undertake the KYC process only once and not with each financial intermediary that they deal with
in the onshore market Also such a mechanism offers cost and efficiency benefits for the financial
intermediaries
87
Annexure I
Key features of currency market of major EMEs
I USD-RMB Market ndash China
Onshore Deliverable - CNY Offshore Deliverable - CNH
Market
Turnover
Daily average turnover USD 28
billion
Daily average swap and
forward turnover
USD 62
billion
Daily average options
turnover
USD 15
billion
Daily average
turnover
USD 15-20
billion
Daily average
forward turnover
USD 25-30
billion
Daily average
Options turnover
USD 5-6 billion
Spot foreign
exchange Onshore CNY foreign exchange spot is
available with documentary proof of an
underlying transaction
Participating banks in Hong Kong
provide two types of spot RMB
exchange rate transactions
- For trade service and direct
investment purposes where
resulting foreign exchange
positions can be offset with the
clearing bank or onshore
correspondent banks and
For general purposes where banks need
to warehouse the risk or offset the
position in the interbank USD-CNH
market Forward
FXSwaps CNY forwards and foreign exchange
swaps with maturities of up to five years
are available to onshore institutions to
hedge foreign exchange exposure
subject to documentary proof of the
same
Most liquid is in the tenor of one year or less
CNH deliverable offshore forwards
are available out to five years
Liquidity has improved significantly
and has surpassed turnover in the
NDF market
FX Options Onshore market participants can buy or
sell common European options of CNY
against foreign currencies on a real
needs basis
Tenors are available out to three years
with further tenors on a case-by-case
basis Most liquid is in the tenor of one
year or less
The State Administration of Foreign
Exchange (SAFE) started allowing
corporates to sell FX options from August
2014 on a real needs basis and with net
settlement allowed
Deliverable CNH options are
available without restrictions to any
non-individual counterparty that has
a physical CNH Nostro account in
Hong Kong
Options on USD-CNH and CNH crosses
are available out to five years and
beyond on a case-by-case basis
88
Access to
domestic
participants
On the current account the CNY is
convertible subject to genuine
documentation Onshore entities can
access the local forwards market
provided these contracts are used to
cover current account transactions
subject to documentary proof available
on settlement
On capital account CNY conversions
may be settled by way of voluntary
settlement in banks if these are required
in the Companiesrsquo institutionsrsquo actual
business operation Typically all capital
account transactions need to be
registered with SAFE for local forwards
Not easily accessible to onshore
residents approvals required for transfer
of funds from Onshore to Offshore
Access to
Offshore
participants
Qualified
Foreign
Institutional
Investor
All allowed subject to
principle of actual
needs (Quota
restrictions exists
on underlying
investments)
Can trade via their
custodian or domestic
financial institution
Central
Banks
No quota restrictions
ability to trade as
interbank counterparty
in the domestic market
ndash bilateral or
anonymous trading
China
Interbank
Bond market
(CIBM)Bond
Connect
For OIIs (Overseas
Institutional Investors)
accessing making
CIBM investment can
enter
into all FX products on
actual needs basis with
settlement agent banks
Change in CIBM
investment position
requires adjustment to
the FX hedges within
5 working days
All customers can open a RMB account
in Hong Kong Banks can provide
customers with general purpose RMB
accounts which allow free transfers of
funds (offshore) for any purpose In
general all FX products are allowed in
CNH for offshore investors
Trading
Hours 10 AM ndash 4 PM Local China Hours 10 AM ndash 4 PM Local China Hours
89
II USD-KRW Market - Korea
Features Onshore Deliverable Offshore Non-Deliverable
Market Turnover Average daily turnover
USD
Billion
Spot Forward Swaps
2011 191 75 192
2012 180 66 198
2013 183 71 196
2014 175 76 190
2015 200 83 192
2016 194 96 184
2017 196 101 198 Source Bank of Korea
As per London clearing house
(LCH) Ltd the daily turnover of
NDF cleared by them on April
16 2019 is a total of USD 119
billion (Source LCH)
As per SEF turnover as on April
12 2019 is USD 379 million
(Source SEF)
Daily NDF turnover has
increased from USD 195 billion
in 2013 to USD 30 billion in
2016 (Source BIS 2016 survey)
Access to
domestic
participants
Residents can hold unlimited
amounts of foreign currency in
foreign currency bank accounts and
Korean firms can maintain foreign
currency accounts abroad
Financial institutional investors
have access to the local forwards
market and can hedge their
investment exposure without
confirming the lsquoexistencersquo of the
investment
Forward position limits of foreign
bank branches (FBBs) and local
banks registered as FX Banks in
Korea as below
- For FBBs positions are
capped at 200 per cent of the
previous month-end equity
capital
- For local banks forward
positions are capped at 40 per
cent of the previous month-
end equity capital
- Corporate customer foreign
currency hedging limits are
100 per cent of customersrsquo
exposure or their transaction
of underlying real assets
Residents may hold foreign
currency accounts domestically
or abroad
Corporate investors and
individual investors are required
to confirm the existence of the
investment
In the case of capital or current
account transactions domestic
residents can remit up to USD 50
000 per year freely
Access to
Offshore
participants
Non-residents can hold KRW
locally through bank accounts
Foreign investors must open special
investment purpose accounts
No restrictions and BoK does not
regulate the same
90
Source Bank of Korea BIS HSBC Research
which consist of an exclusive
external account for investment and
an exclusive non-resident domestic
currency account for investment
Foreign investors are allowed to
freely convert foreign currency into
KRW without any underlying
securities purchases while the
converted funds are being
transferred within exclusive
external investment accounts
However the converted funds in
the exclusive external account for
investment should still be used for
the purpose of securities
investment
Non-Resident Investors holding
Investment Registration Certificates
(IRC) sale proceeds from the
investment in securities can be
freely repatriated
Central Bank
intervention
BOK is now releasing a quarterly
intervention report on a net basis
They generally only comment that
they intervene only in exceptional
basis for smoothing operations
Bank of Korea does not access the
NDF market
Trading Hours 9 AM ndash 330 PM local Korea time Available through time zones
Taxation and
Repatriation of
FX Gains
All gains on unwind of deliverable
transactions are freely repatriable
without any tax
All gains on unwind of non-
deliverable transactions with
onshore banks are freely repatriable
without any tax
91
III USD-MYR Market ndash Malaysia
Onshore Deliverable Offshore Non-Deliverable
Market Turnover - Daily inter-bank market USDMYR
spot turnover around $500 million
- Daily inter-bank market USDMYR
swap turnover around $30 billion
- As per LCH Ltd UK Clearing
house the daily turnover of
USDMYR NDF cleared by them
on April 16 2019 is a total of
USD 332 million from 82 trades
(LCH website)
- As per SEF a trading platform
USDMYR turnover as on April
12 2019 is USD 205 million
from 18 trades (SEF website)
- As per the Hong Kong exchange
the NDF turnovers in 2016 were
around USD 50 billion and have
reduced to approximately USD
20 billion in 2018 (HKMA NDF
report 2018)
Access to Domestic
participants
- Resident counterparties such as
importers and exporters can use
currency options and forward
contracts to manage their foreign
exchange risk
- Residents are allowed to enter into
hedging arrangements on committed
current account transactions and
financial account transactions
- All forward contracts must be
supported by an underlying trade or
capital account-related transaction
allowed under the Foreign Exchange
Administration Rules
- Residents are allowed to freely
hedge and un-hedge their foreign
currency exposure for USD-MYR
CNH-MYR GBP-MYR EURMYR
and JPY-MYR currency pairs
without documentary evidence up to
an aggregate net open position of
MYR 6 million per bank
Not allowed
Access to Offshore
participants
- Licensed onshore banks and
approved investment banks are
allowed to enter into FX forward
Open and not regulated by the
central bank
92
Source Bank Negara Malaysia BIS HSBC Research
contracts with non-residents as
follows
Forward FX purchase or sale
contracts against MYR for
current account transactions
Forward FX purchase or sale
contracts against MYR based on
committed purchases or sales of
MYR assets The forward
contracts can be entered into at
the point when the non-resident
commits to purchase or sell the
MYR assets
- Dynamic hedging programme offers
flexibility to actively manage FX risk
exposure via forward hedging
activities with onshore banks or
Appointed Overseas Office (AOO)
without any documentation
CCP used Malaysian Exchange Not mandatory but LCH used
regularly
Central Bank
intervention
Through appointed agent banks Not applicable
Fixing to settle
NDF
NA KL USDMYR Reference rate
Trading Hours - Trading hour is 9 AM to 6 PM Local
Time Limited FX liquidity
available for non-residents post local
trading hours
- USDMYR is also quoted by
appointed overseas offices for spot
value only for any underlying asset
trades - post local trading hours No
forward prices are quoted
Quoted across time zones
Taxation and
Repatriation of FX
Gains
All gains on cancelled FX Contracts
are freely repatriable and do not
attract taxation in Malaysia
Taxed based on jurisdiction
93
IV USD-IDR Market - Indonesia
Onshore Deliverable Offshore Non-Deliverable Onshore Non-Deliverable
Market
Turnover
Average
daily spot
turnovers
USD 1bn
Average
daily swap
turnovers
USD 500
million
As per LCH Ltd - the
daily turnover of
USDIDR NDF cleared
by them on April 16
2019 is a total of USD
41 billion from 832
trades
As per SEF USDIDR
turnover as on April 12
2019 is USD 33 million
from 11 trades (Source
SEF)
As per HKTR Jan 2018
reporting the outstanding
IDR NDF turnover on
the Hong Kong exchange
of is around USD 40
billion (Source HKMA
NDF report 2018)
NDF
average size
USD 5m
Access to
Domestic
participants
Foreign currency against IDR
transactions between banks and
domestic parties over a certain
amount must have an underlying
transaction
Not Allowed Allowed but will need to
demonstrate underlying
documents
Access to
Offshore
participants
Non-residents must have
underlying IDR
assetliabilityreceivablepayable
to be able to enter into IDR cash
FX andor FX hedge BI list all the
permissible underlying activities
along with recommended
documentation format
Open and not regulated by
Bank Indonesia
Allowed but will need to
demonstrate underlying
documents
BI published a more-
stringent list of
permissible underlying
activities
Benefits Pricing uses onshore-curve
driven by onshore participants
and BI intervention
Not regulated and no
need for underlying
documentation
Prices available across
time zones
Can generated IDR
exposures without
having an underlying
asset in IDR
Pricing uses onshore-
curve driven by onshore
participants and BI
intervention (explanation
below) BI appears to
have a much bigger-
capacity to manage since
the product is net-settled
in IDR
94
Source Bank Indonesia BIS HSBC Research
Clients with IDR FX
exposure but no urgent
need for principal-
exchange As example
long-term IDR bond
investors
Limitations Requirement for underlying
docs limit the maximum
exposure that foreign Clients
can take
BI restricts Domestic Banks
from having residual-risk
when dealing Derivatives with
Related-Parties (locally
incorporated banks only)
Convertibility risk Requirement for
underlying docs limit the
maximum exposure
Foreign Clients can take
Clients with actual need
for principal-exchange
due to basis-risk between
[JISDOR fixing] vs
[actual FX rate] eg
Coupon repatriation and
BI restricts domestic
banks from having
residual-risk when
dealing derivatives with
related parties (locally
incorporated banks only)
Central
Bank
intervention
BI intervenes only in the onshore
market via Cash FX Onshore DF
and Onshore DNDF These can
be done via auctions or bilateral
OTC trades as there is no
onshore futures market for IDR
Bank Indonesia does not
access the NDF market
BI has the ability to intervene
in the DNDF market
although the market is very
new
Fixing to
settle NDF
Not Applicable JISDOR (USD-IDR)
JISDOR (USD-IDR)
Trading
Hours
Trading hours is from 8 AM ndash
12 PM Local Time and 1 PM
ndash 4 PM (Market breaks for
lunch between 12 PM ndash 1
PM)
USD-IDR is also quoted by
banks offshore for Spot value
only for any underlying asset
trades post local trading hours
No Forward prices are quoted
Quoted across time zones 8 AM ndash 12 PM Local
Time 1 PM ndash 4 PM
(Market breaks for lunch
between 12 PM ndash 1 PM)
Taxation
and
Repatriation
of FX Gains
As per market practice gains on
any unwindcancellation of FX
hedges are not passed to Non-
Residents
Taxed as per jurisdiction As per market practice gains
on any unwindcancellation
of FX hedges are not passed
to Non-Residents
95
V USD-BRL Market - Brazil
Features Onshore Deliverable Offshore Non-Deliverable
Market Features Average daily spot USD 8 billion
Onshore B3 USD 14 billion
Average daily options
turnovers
USD 15 billion
Offshore NDF
turnover daily
USD 4
billion
Market Hours Market hours is 0900 to 1800 Hours
However liquidity is highest between 10
am ndash 12 pm and 2 pm ndash 4 pm local
hours
96
VI USD-TWD Market - Taiwan
Features Onshore Deliverable Offshore Non-Deliverable
Market
Features Average Daily
Spot
Turnovers
USD 3-4 billion
Average Daily
Swap
turnovers
USD 2-3 billion
Average
Options
Turnovers
USD 150 million
Average daily
turnovers
USD 2-4 billion
Market
Turnovers
- Onshore total Spot turnovers in
USDTWD for March 2019 were USD
31560 billion (Average daily turnover of
~ USD 10 billion)
- Data related to USDTWD swaps is not
readily available but total swaps amp
forwards dealt onshore (across currency
pairs) is ~ 5750 of the FX turnovers
USD 11504 billion in April 2016 (last
available data) [Source BIS]
Access to
Domestic
participants
There are no limits on the TWDrsquos trading
range versus other currencies but there are
convertibility limits on the capital account
- Access to domestic participants are
not allowed
- Local banksrsquo overseas branches to
participate in the TWD NDF
market These banks will also be
subject to the existing cap on net
NDF positions at 20 per cent of
each bankrsquos FX position (last
revised lower from 33 per cent in
December 2010)
Access to
Offshore
participants
Non-Resident
Foreign investors are allowed to enter
into onshore swapforward contracts for
hedging underlying investment in
Taiwan
FINIs (Foreign Institutional Investors)
can only conduct buy USDsell TWD
contract and the total contract amount
entered into by a foreign investor should
not exceed FINIs USD and TWD net
remitted-in capital (ie total remitted-in
funds minus total remitted-out funds)
Access to foreign exchange is divided
into three categories
- import and export
Open and not regulated by the central
bank
97
- cost of trade-related services
- Investments capital repatriation and
dividends
Currency options are permitted
For FINIsFIDIs all transactions must be
documented regardless of the amount
On the maturity of FX forward (or
forward leg of a swap deal) FINI may
have the following decisions
- To settle the contract on the maturity
day as originally dealt In this case
FINI needs to ensure sufficiency of
existing account balance That is
settlement of FX forward should
come from the existing funds in
Taiwan or funds from sale proceeds
of underlying investments
- To extend (ie rollover) the contract
to another period in this case on the
maturity day FINI has to settle the
difference between the original
forward contract rate and the mark-
to-market rate
If FINI rollovers the contract upon
maturity and incurs a gain upon rollover
the gain will be credited to the FINIs
account in Taiwan Such gain will be
treated as other income derived in
Taiwan
CCP used Taipei Exchange (TPEx) acts as the Central
Counter Party for and also covers all foreign
exchange transactions made by authorized
foreign exchange banks and offshore banking
units
Not mandatory but LCH used regularly
Central Bank
intervention
Central bankrsquos FX intervention is via agent
banks in the OTC market where onshore
TWD is traded One of the mechanisms
through which local currency pressure is
absorbed is through modulation of hedge
ratio of Lifers
Not applicable
Fixing to
settle NDF
NA Central bankrsquos FX intervention is via
agent banks in the OTC market where
onshore TWD is traded
Bloomberg TRY11ltIndexgt
Trading
Hours
- 9 AM ndash 4 PM Local Time
- Market breaks for lunch at 12 PM ndash 2 PM
Quoted across time zones
98
Source CBC BIS HSBC Research
Taxation and
Repatriation
of FX Gains
If FINI rollovers the contract upon
maturity and incurs a gain upon rollover
the gain will be credited to the FINIs
account in Taiwan Such gain will be
treated as other income derived in
Taiwan and therefore subject to 20
standard withholding tax In case that FX
loss incurs due to rollover FINI may
arrange funding to cover the loss if
necessary
FINI can choose one of the following
methods to calculate and pay for the
relevant tax Please however note that
the method is not changeable once it is
decided If FINI does not confirm which
method to be used the option 1) will be
applied
- Withhold related tax on FX gain
from each rollover or
- Netting FX gainslosses from
rollover within the same year or
- Netting FX gainslosses from
rollover and the total remitted-in
principals revaluation gainloss in
the year
If the foreign investor adopts option 2) or
3) above they must appoint or contact
their existing local tax agent (if any) in
Taiwan to file annual tax return
Taxed based on jurisdiction
99
Annexure II
Appendix to Chapter 3
A bivariate BEKK-GARCH (11) model as proposed by Engle and Kroner (1995) can be specified with
the system of conditional mean equations consists of VAR(p) models (p = 1 n) as given in eq (1) and
variance equation as in eq(2)
119884119905 = 120583 + sum Γ119894119884119905minus119894 + 120576119905119901119894=1 (1)
where 119884119905 = (1199101119905 1199102119905) 1199101119905 is exchange rate return in onshore market and 1199102119905 is exchange rate return in
offshore market at time t The parameter vector 120583 = (1205831 1205832) represents constants and Γ is a 2times2 matrix of
autoregressive terms The diagonal elements 120574119894119894 measure own lagged effect of the variables while the off-
diagonal elements 120574119894119895 capture the mean spillover from variable i to variable j
Taking into account the asymmetric responses of volatility ie volatility tends to increase more in response
to negative shocks (bad news) than positive shocks (good news) in the variances and covariances as
proposed by Kroner and Ng (1998) a BEKK representation of conditional variance equation can be written
as
119867119905 = 119862prime119862 + 119860prime120576119905minus1prime 120576119905minus1119860 + 119861prime119867119905minus1119861 + 119863prime120585119905minus1
prime 120585119905minus1119863 (2)
where 120585119905 would be 120576119905 if it is negative and zero otherwise The Eq (2) can be written in matrix form as
follows
119867119905 = [11988811 011988821 11988822
] + [11988611 11988612
11988621 11988622]
prime
[1205761119905minus1
2 1205761119905minus11205762119905minus1
1205762119905minus11205761119905minus1 1205762119905minus12 ] [
11988611 11988612
11988621 11988622]
+ [11988711 11988712
11988721 11988722]
prime
[ℎ11119905minus1 ℎ12119905minus1
ℎ21119905minus1 ℎ22119905minus1] [
11988711 11988712
11988721 11988722]
+ [11988911 11988912
11988921 11988922]
prime
[1205851119905minus1
2 1205851119905minus11205852119905minus1
1205852119905minus11205851119905minus1 1205852119905minus12 ] [
11988911 11988912
11988921 11988922]
In the above model the dynamic process of 119867119905 is a linear function of its own lagged values lagged squared
innovations and the cross-product of the innovations and asymmetric terms Volatility transmission
channel between onshore and offshore markets is represented by the off-diagonal parameters in matrices A
and B while the diagonal parameters in those matrices capture the effects of their own past shocks and
volatility The diagonal parameters in matrix D measure the response own past negative shocks while the
100
off-diagonal parameters 119889119894119895 show the response of one market to the negative shocks in the another market
to be called the cross-market asymmetric responses
MGARCH-BEKK Parameter Estimates
Spot and 1-Month NDF 1-Month Forward and NDF 1-Month Futures and NDF
Variable Coeff P-value Variable Coeff P-value Variable Coeff P-value
Mean Equation
DSPOT(-1) -063 000 DFW1M(-1) -064 000 DFUT1M(-1) -063 000
DSPOT(-2) -052 000 DFW1M(-2) -054 000 DFUT1M(-2) -053 000
DSPOT(-3) -031 000 DFW1M(-3) -033 000 DFUT1M(-3) -033 000
DSPOT(-4) -015 000 DFW1M(-4) -018 000 DFUT1M(-4) -019 000
DSPOT(-5) -010 000 DFW1M(-5) -012 000 DFUT1M(-5) -010 000
DNDF1M(-1) 062 000 DNDF1M(-1) 063 000 DNDF1M(-1) 062 000
DNDF1M(-2) 047 000 DNDF1M(-2) 049 000 DNDF1M(-2) 048 000
DNDF1M(-3) 030 000 DNDF1M(-3) 033 000 DNDF1M(-3) 035 000
DNDF1M(-4) 022 000 DNDF1M(-4) 023 000 DNDF1M(-4) 027 000
DNDF1M(-5) 013 000 DNDF1M(-5) 015 000 DNDF1M(-5) 016 000
Constant 001 029 Constant 001 003 Constant 001 013
DSPOT(-1) 013 000 DFW1M(-1) 013 000 DFUT1M(-1) 011 001
DSPOT(-2) 003 053 DFW1M(-2) 002 046 DFUT1M(-2) 000 098
DSPOT(-3) 005 042 DFW1M(-3) 003 033 DFUT1M(-3) 002 064
DSPOT(-4) 005 033 DFW1M(-4) 005 015 DFUT1M(-4) 004 041
DSPOT(-5) 002 067 DFW1M(-5) 001 068 DFUT1M(-5) 002 058
DNDF1M(-1) -009 000 DNDF1M(-1) -009 000 DNDF1M(-1) -009 001
DNDF1M(-2) -007 015 DNDF1M(-2) -007 003 DNDF1M(-2) -005 022
DNDF1M(-3) -005 033 DNDF1M(-3) -004 012 DNDF1M(-3) -002 065
DNDF1M(-4) 001 086 DNDF1M(-4) 001 076 DNDF1M(-4) 003 052
DNDF1M(-5) 001 079 DNDF1M(-5) 002 052 DNDF1M(-5) 001 067
Constant 001 038 Constant 001 011 Constant 001 017
Variance Equation
C(11) 005 000 C(11) 005 000 C(11) 003 000
C(21) 005 000 C(21) 005 000 C(21) 003 000
C(22) -001 004 C(22) 001 000 C(22) 005 000
A(11) 027 000 A(11) 027 000 A(11) 014 000
A(12) 004 042 A(12) 005 032 A(12) -012 004
A(21) -004 029 A(21) -004 034 A(21) 007 010
A(22) 019 000 A(22) 018 000 A(22) 029 000
B(11) 096 000 B(11) 096 000 B(11) 098 000
B(12) -001 020 B(12) -002 003 B(12) 003 004
B(21) 001 037 B(21) 001 029 B(21) -001 048
B(22) 098 000 B(22) 098 000 B(22) 094 000
D(11) -023 001 D(11) 027 000 D(11) 020 001
101
D(12) -037 000 D(12) 035 000 D(12) 024 000
D(21) 022 000 D(21) -025 000 D(21) -016 000
D(22) 028 000 D(22) -028 000 D(22) -012 006
102
Annexure III
Evolution of Onshore Exchange Traded Currency Derivatives Market
Exchange Traded Currency Derivatives (ETCD) were launched in August 2008 in India with the
introduction of futures contracts on US Dollar-Rupee currency pair as the underlying
Subsequently in the year 2010 Rupee future contracts were allowed to trade against three other
currencies viz Euro Pound sterling and Japanese yen The options contracts were introduced on
US Dollar-Rupee currency pair in year 2010 The Reserve Bank of India (RBI) and Securities
Exchange Board of India (SEBI) allowed participation for all resident individuals including
corporates Trading Members and Banks in proprietary capacity on ETCD
In the year 2012 it was decided to lower the open position limits for banks on the back of volatility
in rupee and to exclude the positions in ETCD from Net Overnight Open Position Limit (NOOPL)
Thereafter in the year 2013 the Rupee depreciated sharply against USD due to huge capital
outflows in both equity and debt markets expectation of unwinding of Quantitative Easing by US
FED and increase in current account deficit Additionally the open position limits for the
participants were decreased and banks were restricted from participating on their own accounts in
the ETCD market further the participants were also prohibited from taking positions beyond
USD 10 million
In June 2014 Banks were allowed to engage in proprietary trading in ETCD markets Domestic
participants were allowed to have open position beyond USD 15 million subject to the evidence
of underlying exposure In 2018 this limit was raised to USD 100 million across all currency pairs
involving INR put together and combined across all exchanges
Foreign Portfolio Investors (FPI) and Non-Resident Indians (NRIs) were permitted to participate
in ETCD markets for hedging currency risk arising out of their investments in India in 2014 and
2017 respectively In February 2018 SEBI and RBI permitted currency derivatives on cross
currency pairs - EURUSD GBPUSD and USDJPY- and currency options on EURINR GBPINR
and JPYINR In December 2018 weekly options on US Dollar - Indian Rupee currency pair were
permitted As on date derivatives are available on seven currency pairs - USDINR EURINR
GBPINR JPYINR EURUSD GBPUSD and USDJPY
103
The exchange traded currency derivatives draws participation from diverse categories of
participants Some of the key participant categories include banks corporates trading members
foreign investors and other investors The following are the turnover of exchanges
FY National Stock Exchange of India (All figures in USD billions)
USD-INR futures USD-INR Options
(Notional turnover)
USD-INR Options
(Premium )
2014-15 32630 12618 052
2015-16 37374 26600 092
2016-17 31887 35271 107
2017-18 33818 37714 117
2018-19 57913 54183 204
FY
BSE (All figures in USD billions)
USD-INR futures USD-INR Options
(Notional turnover)
USD-INR Options
(Premium)
2014-15 20740 9609 081
2015-16 27713 13772 044
2016-17 27521 21034 045
2017-18 30146 37552 041
2018-19 45956 59350 051
FY Metropolitan Stock Exchange of India (All figures in USD billions)
USD-INR futures USD-INR Options
( Notional turnover )
USD-INR Options
( Premium )
2014-15 18274 593 593
2015-16 8433 646 646
2016-17 8233 367 367
2017-18 3032 491 491
2018-19 1060 245 245
104
Present Regulatory Framework (client limits open interest limits need for underlying
exposure etc)
a) Position limits for different client categories for FCY-INR currency pairs
bull Position limits of clients and Category III FPIs- The gross open positions of the client
across all contracts in the respective currency pairs shall not exceed the limits as mentioned
below
Currency Pairs
Position limits
USD-INR Gross open position across all contracts shall not exceed
6 of the total open interest or USD 10 million whichever
is higher
EUR-INR Gross open position across all contracts shall not exceed
6 of the total open interest or EUR 5 million whichever
is higher
GBP-INR Gross open position across all contracts shall not exceed
6 of the total open interest or GBP 5 million whichever
is higher
JPY-INR Gross open position across all contracts shall not exceed
6 of the total open interest or JPY 200 million whichever
is higher
bull Proprietary position limits of non-bank stock brokers- The gross open positions of the
proprietary account across all contracts in the respective currency pairs shall not exceed
the limits as mentioned below
Currency Pairs
Position limits
USD-INR Gross open position across all contracts shall not exceed 15
of the total open interest or USD 50 million whichever is
higher
EUR-INR Gross open position across all contracts shall not exceed 15
of the total open interest or EUR 25 million whichever is
higher
GBP-INR Gross open position across all contracts shall not exceed 15
of the total open interest or GBP 25 million whichever is
higher
JPY-INR Gross open position across all contracts shall not exceed 15
of the total open interest or JPY 1000 million whichever is
higher
105
bull Position limits of stock brokers (bank and non-bank) Category I and II FPIs- The
gross open positions of trading members across all contracts in the respective currency
pairs shall not exceed the limits as mentioned below
Currency Pairs
Position limits
USD-INR Gross open position across all contracts shall not exceed
15 of the total open interest or USD 100 million
whichever is higher
EUR-INR Gross open position across all contracts shall not exceed
15 of the total open interest or EUR 50 million whichever
is higher
GBP-INR Gross open position across all contracts shall not exceed
15 of the total open interest or GBP 50 million whichever
is higher
JPY-INR Gross open position across all contracts shall not exceed
15 of the total open interest or JPY 2000 million
whichever is higher
Domestic clients shall ensure that the position across exchanges is within the prescribed
limit of USD 100 million equivalent If position is in excess of USD 100 million
equivalent clients are required to provide disclosure of underlying exposure to Trading
Member as per existing practice
bull Proprietary positions created in FCY-INR pairs (USD-INR EUR-INR GBP-INR
and JPY-INR)
Single INR limit for proprietary
position for bank stock broker
Single INR limit for proprietary
position for non-bank stock broker
Higher of 15 of total OI across all
FCY- INR pairs or USD 200 million
Higher of 15 of total OI across all
FCY-INR pairs or USD 100 million
b) Position limit for Cross Currency Derivatives are given below
bull Position limits for stock brokers (banks and non-bank) Category I amp II FPIs
Domestic Institutional investors (DIIs) as permitted by the respective sectoral
regulators and AD Category-I banks-
106
Currency Pairs
Position limits
EUR-USD Gross open position across all contracts shall not
exceed 15 of the total open interest or EUR 100
million whichever is higher
GBP-USD Gross open position across all contracts shall not
exceed 15 of the total open interest or GBP 100
million whichever is higher
USD-JPY Gross open position across all contracts shall not
exceed 15 of the total open interest or USD 100
million whichever is higher
The aforementioned limits shall be the total limits available to the stock brokers for
taking positions on proprietary basis and for positions of their clients
bull Position limit for proprietary position of non-bank stock brokers-
Currency Pairs
Position limits
EUR-USD Gross open position across all contracts shall not
exceed 15 of the total open interest or EUR 50
million whichever is higher
GBP-USD Gross open position across all contracts shall not
exceed 15 of the total open interest or GBP 50
million whichever is higher
USD-JPY Gross open position across all contracts shall not
exceed 15 of the total open interest or USD 50
million whichever is higher
bull Position limits for Clients and Category III FPIs-
Currency Pairs
Position limits
EUR-USD Gross open position across all contracts shall not
exceed 6 of the total open interest or EUR 10
million whichever is higher
GBP-USD Gross open position across all contracts shall not
exceed 6 of the total open interest or GBP 10
million whichever is higher
USD-JPY Gross open position across all contracts shall not
exceed 6 of the total open interest or USD 10
million whichever is higher
107
Annexure IV
Comparison of onshore and offshore Rupee derivatives volumes
1 Exchange Traded Market
All figures in USD billions
Table Comparison between onshore and offshore exchange traded INR-USD Futures
FY Onshore Offshore Market Share
BSE NSE MSEI Total DGCX SGX CME Total Onshore Offshore
2014-15 21115 32491 9433 63040 31704 3704 396 35804 6378 3622
2015-16 27904 37241 4539 69685 32725 13906 1001 47631 5940 4060
2016-17 26528 31799 4300 62626 34149 17164 1636 52949 5419 4581
2017-18 30360 33729 1761 65851 33458 28047 5232 66737 4967 5033
2018-19 44820 57237 648 102705 35452 37599 7475 80526 5605 4395
Note-
i Data for BSE NSE amp MSEI is from Exchange websites for USDINR Futures
ii Data for DGCX SGX and CME is from Bloomberg and India INX Research
iii Data for DGCX includes INRUSD Futures (including mini contract) but excludes the USDINR Index
Quanto futures
iv Data for CME includes the Mini and Micro contracts
v Data for FY 2018-19 is from April 01 2018 to March 22 2019
2 OTC Market (as per BIS Quarterly Review December 2016)
108
Annexure V
Meetings held by the Task Force
Sr No Date Venue External Participants Invited
1 March 19 2019 RBI Mumbai
2 March 25 2019 RBI Mumbai -Shri Ananth Narayan Professor SPJMIR
-FEDAI
-Select corporates
3 April 04 2019 RBI Mumbai -Shri G Padmanabhan Former Executive
Director RBI
-Dr V Anantha Nageswaran Dean IFMR
Chennai
-GIFT City IFSC
-National Stock Exchange Ltd
-BSE Ltd
4 April 23 2019 RBI Mumbai -Select FPIs (through audio conference)
5 May 14 2019 RBI Mumbai -Select FDIs (through audio conference)
6 May 31 2019 RBI Mumbai -Shri G Padmanabhan Former Executive
Director RBI
-FIMMDA
-CCIL
-IBA
7 June 20 2019 RBI Mumbai -Smt Shyamala Gopinath Former Deputy
Governor RBI
8 July 04 2019 SEBI Mumbai -Shri G Padmanabhan Former Executive
Director RBI
9 July 10 2019 RBI Mumbai -Smt Shyamala Gopinath Former Deputy
Governor RBI
109
Annexure VI
References
A Santaella Julio (2015) ldquoCurrency carry trades in Latin Americardquo Bank for International
Settlements BIS Paper No 81
Behera Harendra Kumar (2011) ldquoOnshore and offshore market for Indian rupee recent evidence
on volatility and shock spilloverrdquo Macroeconomics and Finance in Emerging Market Economies
Vol 4 No 1 March 2011 pp 43ndash55
Cadarajat Yayat and Lubis Alexander (2012) ldquoOffshore And Onshore IDR Market An Evidence
On Information Spilloverrdquo Bulletin of Monetary Economics and Banking April 2012
Capital Account Safeguard Measures in the ASEAN Context (2019) ASEAN Working Committee
on Capital Account Liberalisation Bank Indonesia Occasional Papers OP12019
Colavecchio Roberta and Funke Michael (2006) ldquoVolatility transmissions between renminbi and
Asia-Pacific onshore and offshore US dollar futuresrdquo BOFIT Discussion Papers Bank of
Finland Institute for Economies in Transition No16
Darbha Gangadhar (2012) ldquoA Tale of One Asset and Two Markets ndash Analysis of Dynamic
Interactions between On- and - Off Shore Marketsrdquo macrofinancenipfporginPDF13-
11sl_Darbha_NDFNimranapdf
DING David K Tse Y and Williams M The Price Discovery Puzzle in Offshore Yuan
Trading Different Contributions for Different Contracts (2012) Financial Management
Association International Conference Research Collection Lee Kong Chian School Of Business
Doukas J and H Zhang (2013) ldquoThe performance of NDF carry tradesrdquo Journal of International
Money and Finance vol 36 September pp 172ndash90
Goyal R R Jain and S Tewari (2013) Non deliverable forward and onshore Indian rupee market
a study on inter-linkages Reserve Bank of India Working Paper Series 112013 December
Guru Anuradha (2009) ldquoNon-Deliverable Forwards Market for Indian Rupee An Empirical
Studyrdquo Indian Journal of Economics and Business Vol 8 No 2 pp 245-260
Higgins Patrick and Owen F Humpage (2005) ldquoNondeliverable Forwards Can We Tell where
the Renminbi Is Headedrdquo Federal Reserve Bank of Cleveland September
Hutchison Michael Jake Kendall Gurnain Pasricha Nirvikar Singh (2009) ldquoIndian Capital
Control Liberalisation Evidence from NDF Marketsrdquo NIPFP Working Paper No 200960
110
Indira Gandhi Institute of Development Research (IGIDR) Finance Research Group (2016)
ldquoFeatures and trends of NDF markets for emerging economy currencies a study of the Indian
rupeerdquo IGIDR working paper March
Ishii Shogo İnci Oumltker-Robe and Li Cui 2001 Measures to Limit the Offshore Use of
Currencies Pros and Cons IMF Working Paper WP0143
Lipscomb Laura (2005) ldquoAn Overview of Non-Deliverable Foreign Exchange Forward Marketsrdquo
Federal Reserve Bank of New York May
Ma G C Ho and R McCauley (2004) The markets for non-deliverable forwards in
Asia BIS Quarterly Review June pp 81-94
Maziad Samar and Kang Joong Shik RMB Internationalization OnshoreOffshore Links (May
2012) IMF Working Paper No 12133
McCauley R C Shu and G Ma (2014) ldquoNon-deliverable forwards 2013 and beyondrdquo BIS
Quarterly Review March pp 75ndash88
McCauley RN Shu C (2016) ldquoNon-deliverable forwards impact of currency internationalisation
and derivatives reformrdquo Technical report Bank of International Settlements
McCauley Robert N and Scatigna Michela Foreign Exchange Trading in Emerging Currencies
More Financial More Offshore (March 2011) BIS Quarterly Review March 2011
Misra Sangita and Behera Harendra (2006) ldquoNon Deliverable Foreign Exchange Forward
Market An Overviewrdquo RBI Occasional Papers Vol 27 No3
Park Jinwoo (2001) ldquoInformation flows between non-deliverable forwards (NDF)and spot
markets Evidence from Korean currencyrdquo Pacific Basin Finance Journal Vol 9 (4) pp363-377
Ryoo Sangdai and Kwon Taeyong and Lee Hyejin Foreign Exchange Market Developments
and Intervention in Korea (October 2013) BIS Paper No 73o
Sarwono Hartadi A (2005) ldquoIndonesian policy on non-residentsrsquo participation in the money
market the restriction of rupiah transactions by non-residents and foreign currency credit offered
by banks to non-residentsrdquo BIS Paper No 23
Standing Council on International Competitiveness of the Indian Financial System (2015)
International competitiveness of currency equity and commodity derivatives markets Department
of Economic Affairs Ministry of Finance
Wang Kai-Li Fawson Christopher and Chen Mei-Ling (2007) ldquoInformation Flows among
Exchange Rate Markets What Do We Learn From Non-Deliverable Forward Markets in Asiardquo
Chaoyang University of Technology October
111
Watanabe K H Akama and J Mifune (2002) ldquoThe effectiveness of capital controls and
monitoring the case of non-internationalisation of emerging market currenciesrdquo EMEAP
Discussion Paper January
3
Contents
Letter of Transmittal
Abbreviations
Acknowledgements
Preface
Executive Summary
Chapters
1 Introduction 12
2 Evolution of the offshore rupee markets and cross-country experience 20
3 Linkages between offshore and onshore rupee markets New evidence 46
4 IFSC ndash Use of Rupee derivatives 65
5 Issues and Recommendation 70
Annexures
4
Abbreviations
ABS ndash Association of Banks in Singapore
AD ndash Authorised Dealer
AED ndash Arab Emirates Dirham
BI ndash Bank Indonesia
BIS ndash Bank for International Settlements
BoE ndash Bank of England
BKPM ndash Investment Coordinating Board in Indonesia
BRL ndash Brazilian Real
CAC ndash Capital Account Convertibility
CCIL ndash Clearing Corporation of India Ltd
CME ndash Chicago Mercantile Exchange
CNH ndash Chinese Yuan (Offshore)
CNY ndash Chinese Yuan (Onshore)
CPI ndash Consumer Price Index
CSA ndash Credit Support Annex
DF ndash Deliverable Forward
DGCX ndash Dubai Gold and Commodities Exchange
DNDF ndash Domestic Non-Deliverable Forward
EM ndash Emerging Market
EME ndash Emerging Market Economy
ETCD ndash Exchange Traded Currency Derivatives
EUR ndash Euro
FBIL ndash Financial Benchmarks India Ltd
FCY ndash Foreign Currency
FDI ndash Foreign Direct Investment
5
FEC ndash Foreign Exchange Committees
FED ndash Federal Reserve Board
FEMA ndash Foreign Exchange Management Act 1999
FPI ndash Foreign Portfolio Investor
FSP ndash Final Settlement Price
FSS ndash Financial Supervisory Services (FSS) in Korea
FX ndash Foreign exchange
GDP ndash Gross Domestic Product
GIFT City ndash Gujarat International Financial Tec-City
HKMA ndash Hong Kong Monetary Authority
HKTR ndash Hong Kong trade repository
IFC ndash International Finance Corporation
IFSC ndash International Financial Service Centre
IDR ndash Indonesian Rupiah
INR ndash Indian Rupee
IMF ndash International Monetary Fund
IRC ndash Investment Registration Certificate
ISDA ndash International Swaps and Derivatives Association
JISDOR ndash Jakarta Inter-bank Spot Dollar Rate
JIBOR ndash Jakarta Interbank Offered Rate
JPY ndash Japanese Yen
KRA ndash KYC Registration Agency
KRW ndash Korean Won
KYC ndash Know Your Customer
LEI ndash Legal Entity Identifier
MIFOR ndash Mumbai Interbank Forward Offer Rate
MSEI ndash Metropolitan Stock Exchange of India Ltd
MYR ndash Malaysian Ringgit
6
NDF ndash Non Deliverable Forward
NOOPL ndash Net Overnight Open Position Limit
NRI ndash Non Resident Indian
NSE ndash National Stock Exchange
OIS ndash Overnight Indexed Swaps
OTC ndash Over the Counter
PBoC ndash Peoplersquos Bank of China
RBI ndash Reserve Bank of India
RMB ndash Renminbi
SEBI ndash Securities and Exchange Board of India
SFEMC ndash The Singapore Foreign Exchange Markets Committee
SGX ndash Singapore Exchange
SNRR ndash Special Non-Resident Rupee Account
TF ndash Task Force on Offshore Rupee Market
TWD ndash Taiwanese Dollar
USD ndash United States Dollar
7
Acknowledgements
The Report of the lsquoTask Force on Offshore Rupee Marketsrsquo was made possible with the support
of a number of individuals and organisations The Task Force would like to gratefully acknowledge
representatives of various banks financial institutions large corporates in India and abroad
foreign portfolio investors asset managers industry bodies experts and practitioners who
interacted with the Task Force and provided their valuable inputs and suggestions
The Task Force greatly benefitted from the experience of Smt Shyamala Gopinath former Deputy
Governor Reserve Bank of India and Shri G Padmanabhan former Executive Director Reserve
Bank of India who took time out of their busy schedules to attend the meetings of the Task Force
as special invitees
The Task Force benefitted from the interactions with Dr T V Somanathan IAS Additional Chief
Secretary Government of Tamil Nadu Shri R Sridharan Managing Director CCIL Dr V
Anantha Nageswaran Dean IFMR Chennai Shri Ananth Narayan Associate Professor SPJIMR
Dr A K Nag Shri Himadri Bhattacharya and Shri Jamal Mecklai CEO Mecklai Financial
Services
The Task Force invited submissions from members of the public and is grateful for several helpful
suggestions received
The Task Force also places on record the assistance provided by Shri Subrat Kumar Seet Director
and Smt Priyanka Sachdeva Manager from Department of Economic and Policy Research
Reserve Bank of India and Shri Hiren Sanghvi Director and Shri Saket Banka Associate Director
from HSBC India The Task Force specifically acknowledges the contribution of Shri Harendra
Behera Assistant Adviser Department of Economic and Policy Research Reserve Bank of India
in research on lsquoLinkages between Offshore and Onshore Rupee Marketsrsquo undertaken in
collaboration with Shri Sajjid Chinoy Chief Economist J P Morgan India
Finally the Task Force would like to commend the efforts put in by the Secretariat team from the
Financial Markets Regulation Department Reserve Bank of India led by Shri Supriyo
Bhattacharjee Deputy General Manager and supported by Shri Nitin Daukia Manager
Meticulous organisation of meetings by Smt Supriya Devalekar Assistant Manager and Shri
Kaivalya Sakalgaonkar Assistant from the Secretariat team is also appreciated
8
Preface
Offshore markets in a non-convertible currency usually referred to as non-deliverable forward
(NDF) markets enable trading of the non-convertible currency outside the influence of the
domestic authorities These contracts are settled in a convertible currency usually US Dollars as
the non-convertible currency cannot be delivered offshore Historically NDF markets evolved for
currencies with foreign exchange convertibility restrictions and controlled access for non-
residents beginning with countries in South America like Mexico and Brazil and thereafter
moving on to emerging Asian economies viz Taiwan South Korea Indonesia India China
Philippines etc Apart from enabling trading in non-convertible currencies NDF markets have
also gained in prominence because of onshore regulatory controls and their ease of access
Reserve Bank has been guided by the objective of developing a deep and liquid on-shore foreign
exchange market that acts as a price setter globally With regard to non-resident entities having
legitimate exposure to the Rupee the focus of policy efforts has been to align incentives for non-
residents to gradually move to the domestic market with adequate safeguards to ensure the
external stability of the value of the Rupee
The sharp growth in the offshore trading volumes in the Rupee NDF market in recent years likely
even beyond the volumes in the onshore markets have raised concerns around the forces that are
determining the value of the rupee and the ability of authorities to ensure currency stability This
necessitates a deeper understanding of the causes underlying the growth in those markets and
identification of measures to reverse the trend
The Task Force on Offshore Rupee Markets was set up to address that concern It was mandated
to study the factors attributable to the growth of the offshore Rupee market its effects on the Rupee
exchange rate and onshore market liquidity and formulate measures to redress the concerns The
Task Force was also charged to examine the role if any that International Financial Services
Centres (IFSCs) can play in addressing these concerns
During its term the Task Force interacted with a wide variety of stakeholders including banks
financial institutions industry bodies foreign portfolio investors asset managers and
academicians
9
I trust that the Reserve Bank of India will find the recommendations made in the report useful
Usha Thorat
Chairperson
10
Executive Summary
The origin of the NDF markets may be traced back to the 1990s when a wave of capital account
liberalisation in emerging market economies (EMEs) triggered a surge in capital inflows to these
economies and consequently heightened the currency risk faced by foreign investors Under-
developed domestic markets especially the market for financial derivatives as well as controlled
access to onshore markets raised the demand for a currency market outside the reach of local
regulations Another trend that supported the growth of the NDF market was the sharp rise
globally in the size of derivatives markets in the 1980s and 1990s As derivatives markets evolved
the speculative search for underlying moved out of the developed world into more esoteric assets
Following the successful speculative attack on the Sterling in 1992 EME currencies became viable
subjects for such speculative positioning Such activity becomes particularly noticeable during
times of stress as offshore risk spills over to the domestic exchange rate through entities that have
a presence in both onshore and offshore markets usually global banks but also corporates
A study of the degree and direction of such spillovers is important to understand the role of NDF
markets and assess policy alternatives The econometric study conducted by the Task Force
observed that the influence between offshore and onshore exchange rate goes both ways in normal
times that is it is bidirectional The study also observed that during the last two stress episodes
(the taper tantrum and the 2018 emerging markets crisis) the relationship turned unidirectional
with the NDF market driving onshore exchange rate The study concludes that as NDF volumes
have increased they have begun to play an important role in both price discovery and driving
volatility particularly during heightened uncertainty period The study also shows that periods of
divergence are limited and the markets converge and that too fairly rapidly
Against this backdrop and in the light of available information results of the statistical analysis
and most importantly based on the feedback received during the various consultations the Task
Force is making following recommendations in accordance with the terms of reference
i Onshore market hours may be suitably extended to match the flexibility provided by the
offshore market and thereby incentivize non-residents to hedge in the onshore market
ii Banks may be allowed to freely offer prices to non-residents at all times out of their Indian
books either by a domestic sales team or by using staff located at overseas branches
11
iii Non-deliverable Rupee derivatives (with settlement in foreign currency) may be allowed
to be traded in the IFSC and IBUs may be allowed to deal in such derivatives with a distinct
FCY-INR position limit To start with exchange traded currency derivatives involving
Rupee may be introduced and with experience non-deliverable OTC currency derivatives
involving Rupee may be allowed subsequently
iv While requirement of underlying exposure will continue for trading in the onshore market
users may be allowed to undertake positions up to USD 100 million in OTC as well as
exchange traded currency derivative market without having to establish the underlying
exposure
v The TF endorses the principle-based regulatory approach adopted in the draft regulation
on hedging by non-residents released by the RBI on February 15 2019 Also back-to-back
hedging by non-residents proposed under these draft regulations is endorsed Further in
case of hedging of anticipated exposures gains from cancellation of contract may be
allowed to be passed on even in cases where there are no cash flows at the discretion of
the bank where the bank considers the cancellation of underlying cash flow is due to
external factors which are beyond the control of the user
vi For ease of entering into hedge transactions for non-residents the TF recommends
a Establishment of a central clearing and settlement mechanism for non-residentsrsquo
deals in the onshore market
b Implementation of margin requirement for non-centrally cleared OTC derivatives
in the onshore market at the earliest
c Allow Indian banks to post margin outside India
d Wider access to FX-Retail trading platform to non-residents
vii A technology-based solution may be explored to centrally aggregate the investments of
non-residents and derivative contracts entered into by them in the onshore market (both
OTC and exchange traded) using LEI or any other unique identifier to start with
viii The issue of taxation in respect of foreign exchange derivative contracts may be examined
with the objective of overcoming gaps between tax regime in India and other major
international financial centres to the extent possible
ix KYC registration may be centralized across the financial market with uniform
documentation requirement
12
Chapter 1
Introduction
Currency is a component of sovereign money which is legal tender issued by the state The
external value of the currency the exchange rate is one of the most important economic and policy
variables which affects economic incentives and activity The exchange rate is determined mostly
by market forces of supply and demand which influence its flows across international borders
The exchange rate has critical information value in guiding financial and economic decisions
which affect real economic variables The stability and predictability of the exchange rate also has
a critical influence on growth and financial stability
Cross-border trade in goods services and assets (or capital) necessitates exchange of one currency
into another and can be thought of as the primary reason why currency markets exist However
as in any other financial market speculative elements ndash who take positions not for settling any
underlying transactions but for benefitting from market movements ndash are important participants
who perform the function of imparting depth to the market The aggregate actions of all
participants ndash hedgers arbitrageurs as well as speculators - determine the value and fluctuation of
the exchange rate
The currency markets for rupee especially for exchange against the USD are fairly well-
developed today One can classify these markets in three categories (a) spot versus derivatives
(b) over-the-counter (OTC) versus exchange-traded and (c) onshore versus offshore Further
derivatives can be cash-settled or delivery-based The most commonly referred benchmark
exchange rate of the rupee is from the onshore spot OTC market Similarly the commonly referred
forward exchange rate of the rupee is from the onshore forward OTC market Rupee futures and
options are traded in some onshore as well as offshore exchanges
The classification of currency markets can also be in terms of the nature of contracts between
buyers and sellers - spot forwards (futures on exchanges) and options contracts A spot contract
is for standard settlement ie the second working day after the date of transaction whereas in
case of forwards and futures (as well as options) the actual exchange or delivery of currency takes
place in the future at a date later than the spot settlement date There are also non-deliverable
forward contracts which are discussed below Forward and futures contracts are used as a risk
management tool or to hedge against possible adverse fluctuation in exchange rates It is important
13
to note that hedging implies risk transfer between the contracting parties it is not elimination of
risk
The category of the currency market that forms the focus of this report is the Offshore Rupee
markets The dominant segment of this market is the Non-Deliverable Forward (NDF) market ndash
wherein foreign exchange forward contracts are traded in the OTC market at offshore locations
generally the International Finance Centres (IFCs) like Singapore Hong Kong London Dubai
and New York These contracts do not involve a physical exchange of Rupees as Rupee is not
deliverable offshore and allow counter-parties to settle profit or loss in a convertible currency
usually the US Dollar which is why it is called a non-deliverable market NDF contracts are
usually traded on currencies which are not readily available to trade globally or outside of
sovereign boundaries These are thus mainly currencies from countries which have partial or no
capital account convertibility
There are also a few exchange-traded offshore rupee markets dealing in rupee futures and options
in Chicago Singapore and Dubai Volumes in these markets have typically been far smaller in
comparison to the offshore NDF OTC market Data on transactions in exchange-traded currency
markets can be ascertained with greater certainty whereas data on transactions in offshore OTC
NDF market have to be gauged through surveys and the estimates on the same are less firm
Why do NDF Markets Exist
NDF markets are not a phenomenon peculiar to the Indian Rupee they are common for currencies
of many emerging market economies (EMEs) As per BIS data NDFs in six currencies ndash Korean
Won Indian Rupee Chinese Renminbi Brazilian Real Taiwanese Dollar and Russian Ruble ndash
account for about two-thirds of the trade in NDFs globally The total daily average volume in NDF
markets is about USD 200 billion as per Bank of International Settlements (BIS) survey1 As per
this survey the share of India was about 1822 per cent of the trade in NDFrsquos globally (see Table
2 Chapter 2) The 2016 BIS survey (the next one will be released in the later part of 2019) showed
that offshore trades in Indian rupee were more or less equal to deliverable onshore forwards
1 2016 Triennial Central Bank Survey of Foreign Exchange and OTC Derivatives Markets
14
around $16 billion daily The 2018 Bank of England reported $23 billion in offshore rupee trades
while RBI sources estimate deliverable daily onshore forwards at $21 billion for 20192
The size of an open economy is one of the primary determinants of international participation in
its currency If international participants do not have direct access to the on-shore currency market
to meet their transaction needs or to hedge their currency exposure they are likely to use the
offshore NDF market The size depth and liquidity of the offshore NDF is thus indicative of the
non-resident interest in an emerging market economy
To some extent the offshore NDF market complements the need for a deep and liquid onshore
currency market What is the appropriate size of the forex market for an emerging market
economy with partially open capital account is determined by its size the share of foreign trade
and appetite for capital flows One proxy for estimating how large the forex market ought to be is
the GDP of the economy A better estimate could be the size of the open economy the trade and
investment sector
As Indiarsquos economy has grown over the past two and a half decades it has seen a significant rise
in openness (ie trade to GDP ratio has grown from 15 in 1990 to 43 in 2018) and in cross
border capital flows This has commensurately raised non-resident interest in the Rupee whether
for risk management purposes or for speculative ends The growing size of the Rupee NDF market
points to a need to widen participation in on-shore markets
The existence and size of offshore NDF markets is also a function of the degree of difficulty that
participants in foreign exchange market (especially non-residents) ndash both speculators and other
participants with requirements arising from cross-border trade transactions ndash face in accessing the
onshore markets The difficulties in accessing onshore currency markets could span a variety of
issues including the following
bull Restrictions on foreign exchange transactions
bull Cumbersome documentation and Know-Your-Customer (KYC) requirements for
participants in the domestic market
bull Restrictions on market participants (especially non-residents) in hedging activities such as
transaction limits tenor limits other documentation etc
bull Restrictions on cancellation and re-booking of contracts
2 For comparison with offshore market the onshore data includes forwards and swaps
15
bull Restrictions on the kind of derivative products that are allowed by market regulators and
bull Inconvenient market hours for those in other time zones
These constraints exist either to curb excessive speculation or to maintain financial stability
Are Offshore Rupee Markets a Problem
When the offshore market volume is significant or larger than the onshore currency market
volume as is the case with many EME currencies it leads to two fragmented markets wherein the
price discovery on the onshore market becomes vulnerable to influences from the price discovery
in the offshore market Empirical evidence (see Chapter 3) shows that while at most times the
direction of the influence runs both ways ie from onshore market to offshore market and vice-
versa the direction of the influence is more dominant from offshore market to the onshore market
in times of high volatility This could happen especially when tidal forces from global financial
markets influence the currency markets in a synchronised manner such as during times of
Emerging Markets (EM) currency crises
There are essentially four issues with regard to offshore market that are critical for regulators ndash
i Effectiveness of exchange rate management Many central banks including the Reserve
Bank have exchange rate stability as one of their objectives and resort to market
intervention or other regulatory measures to control volatility of the exchange rate from
time to time Such influence however extends only to the onshore currency market
Presence of a large offshore market dilutes the effectiveness of the exchange rate
management by the central bank It also hinders the pursuit of the objective of financial
stability in the domestic market
ii Disjointed price discovery During periods of volatility in the currency market when
price discovery in the offshore market causes large movements in onshore currency
markets the onshore market could often open with a large gap over the previous close For
resident market participants who want to cover their positions such gaps expose them to
significant risk
iii Revenue loss Every unit of turnover in a market earns a certain revenue for the market-
making financial firms Thus turnover in the offshore market can be viewed as a potential
revenue loss for domestic financial firms and the domestic economy
16
iv Effectiveness of RBI regulations on capital account management RBIrsquos policies on
capital account have been geared towards managing the impossible trinity a ldquomanagedrdquo
exchange rate free capital movement and an independent monetary policy RBI policies
have been geared toward avoidance of undue volatility in foreign exchange markets by
having restrictions on cancellation and rebooking and excessive risk-taking by resident
entities including corporates With this objective RBI restricts participation of resident
entities in currency derivatives to the extent of their underlying exposures A large market
outside the influence of regulatory authorities undermines their effectiveness
Constitution of the Task Force
Against this backdrop it was announced in the Statement on Developmental and Regulatory Policy
dated February 7 2019 the setting up of a Task Force on Offshore Rupee Markets Accordingly
a Task Force headed by Smt Usha Thorat was constituted with following terms of reference
i Assess the causes behind the development of the offshore Rupee market
ii Study the effects of the offshore markets on the Rupee exchange rate and market liquidity
in the domestic market
iii Recommend measures to address concerns if any arising out of offshore Rupee trading
iv Propose measures to generate incentives for non-residents to access the domestic market
v Examine the role if any International Financial Services Centre (IFSC) can play in
addressing these concerns
vi Any other relevant issue(s) the Task Force considers relevant to the context
The Task Force comprises of the following
i Smt Usha Thorat former Deputy Governor Reserve Bank of India ndash Chairperson
ii Shri Anand Bajaj Joint Secretary Department of Economic Affairs Ministry of Finance
Government of India ndash Member
iii Shri G Mahalingam Whole Time Director Securities amp Exchange Board of India ndash
Member
iv Shri Ajit Ranade Chief Economist of the Aditya Birla Group ndash Member
v Shri Sajjid Chinoy Chief Economist India JP Morgan India ndash Member
17
vi Shri Surendra Rosha CEO India HSBC Bank ndash Member
vii Shri Rajiv Ranjan Adviser-in-charge Department of Economic Policy and Research
Reserve Bank of India ndash Member
viii Shri T Rabi Sankar Chief General Manager Financial Markets Regulation Department
Reserve Bank of India ndash Member Secretary
Approach of the Task Force
Among the different issues relating to offshore markets the argument concerning revenue loss is
perhaps the most simplistic and an obvious response could be for India to develop non-deliverable
Rupee derivative market in an International Finance Service Centre (such as the GIFT City) located
within the geographical boundary of India However such a market will be virtually no different
from the markets located in Singapore or London and hence the objective of bringing volumes to
the onshore market will remain unaddressed
From the standpoint of addressing the concerns arising out of the existence of large offshore
markets it would make sense to incentivise movement of as much currency market transactions
from such markets to onshore currency markets as possible However theoretically one needs to
recognise that there is a trade-off between the sizeprominence of the offshore market and the
extent of regulationsrestrictions that are placed on cross-border transactions and foreign exchange
marketsparticipants It is also important to note that even if all non-residents with underlying
exposure move their hedging transactions to onshore markets offshore markets would continue to
exist to meet the demand of participants who take a view on the exchange rate without any
underlying exposure ie the speculative demand
At one extreme of the above-mentioned trade-off if India opts for a full rupee convertibility ndash by
removing all restrictions on current and capital account transactions ndash along with removal of all
restrictions on currency derivatives then offshore markets would no longer be a relevant concept
Capital account convertibility has been a hotly debated issue in the discourse on public policy both
in India and globally The received consensus in the last couple of decades endorsed by the
International Monetary Fund (IMF) in 2012 is that while capital flows are an important aspect of
the international monetary system providing significant benefits for countries they also carry risks
for macroeconomic and financial stability especially if they are large and volatile and thus pose
a challenge for policy Hence capital flows management measures are justified to help harness the
18
benefits while managing the risks More generally some restrictions to the capital account are
necessary for India to avoid the ldquoimpossible trinityrdquo With an economy as large and diverse as
Indiarsquos which is therefore expectedly not completely synchronous to the global cycle retaining
the independence of monetary policy is imperative Similarly having some control over the
exchange rate is necessary given its occasional propensity to be excessively volatile and overshoot
with attendant feedback loops to the macro-economy Therefore capital flow management
measures become necessary to avoid the trilemma and ensure simultaneous fulfilment of the other
two objectives Based on this received consensus as well as the experiences of some emerging
market economies through the last two decades the Task Force has proceeded on the basis that
the existing framework of capital account management followed by the Government and the RBI
will continue
There is also the issue of de-jure capital account convertibility Even when speculators
arbitrageurs and traders do not have direct access to forex markets to exploit persistent interest rate
differentials or perceived mispricing of the currency there are alternative channels available in
the system which make the actual arbitrage opportunities much lower Some examples of such
instruments is the Overnight Indexed Swaps (OIS) market or the use of Mumbai Interbank
Forward Offer Rate (MIFOR) Hence the de-jure level of capital account convertibility (CAC)
could be much higher than implied by the existence of capital controls
A related issue is the internationalisation of rupee According to McCauley (2011) a currency is
internationalised when market participants ndash residents and non-residents alike ndash conveniently use
it to trade invest borrow and invoice in it Based on the experience of China to internationalise
Renminbi and the evidence of the narrowing of the gap between onshore forward rate and NDF
rates for Renminbi internationalisation of currency has been sometimes advocated as a way to
reduce the influence of offshore markets While one has witnessed issuance of rupee-denominated
bonds (ldquoMasala Bondsrdquo) in some offshore markets in the recent past internationalisation of rupee
is still a distant goalpost given the persistent current account deficit and the negative net
international debt position Thus internationalisation of rupee is not an explicit goal guiding the
recommendations of the Task Force
Further the Task Force believes that Indiarsquos approach to the trade-off between deregulation of
currency markets and tolerance of offshore market must be shaped by the specific considerations
of the Indian economy rather than following any global template blindly
19
Compared to countries like Korea Taiwan or China Indiarsquos macroeconomic structure is
significantly different India is a structurally an economy with twin deficits ndash both fiscal and
current account Nearly half of Indiarsquos consumer price index (CPI) basket comprises of food items
making Indiarsquos inflation more vulnerable to supply shocks Although Indiarsquos macroeconomic
stability has improved considerably in the last few years considering the above factors the Task
Force feels that India cannot risk macroeconomic instability through potential exchange rate
shocks by drastically lifting the restrictions on foreign exchange markets and participants
On the other hand large volumes in the offshore market also reflect the fact that the interest in
Rupee is far larger than what is evident in onshore currency markets This reflects the growing size
of the Indian economy greater role of India in the global economy and growth in trade and capital
flows Over time therefore it would be imperative for the Indian regulators to take steps to expand
the role of onshore currency markets gradually lest the disjointed price discovery issue flares up
more frequently and in larger degrees
The balanced approach of the Task Force therefore is to look at each of the difficulties faced by
market participants in accessing onshore currency markets and prioritise their resolution in such a
way that prudent regulatory considerations are least compromised For instance certain market
micro-structure issues (such as extending the market hours of onshore currency markets) can be
addressed relatively quickly without any regulatory compromise On issues related to
documentation and KYC requirements smart application of ease-of-doing-business principles
needs to be followed Economic entities which need to undertake hedging of their foreign exchange
exposure on account of genuine underlying exposures need to be given greater flexibility in
undertaking such transactions in domestic currency markets While the need for underlying
exposure in order to operate in the forward markets cannot be eliminated the way in which it is
evidenced and monitored can be simplified The Task Force has proceeded on the basis of the
existing principles of regulations of foreign exchange markets
Of course the Task Force recognises that the recommendations will not do away with the
economic imperatives for which trading of rupee forward contracts exists in offshore markets
With our recommendations the Task Force believes that regulatory concerns arising out of the
offshore markets can be reduced though not eliminated
The Task Force held nine meetings between March 2019 and July 2019 The details of the meetings
are given in Annex V
20
Chapter 2
The Evolution of NDF Markets and Cross-country Experience
The foreign exchange market in India during 1970s and 1980s was heavily controlled and closed
in nature with various kinds of restrictions in place The Indian foreign exchange market started
deepening with the transition to a market-determined exchange rate system in March 1993 and the
subsequent liberalisation of restrictions on various external transactions leading up to current
account convertibility under Article VIII of the Articles of Agreement of the International
Monetary Fund in 1994 Notwithstanding various measures taken to further deepen and broaden
the foreign exchange market in India various restrictions are still in place to limit market access
to only those with underlying exposure and prevent undue speculation As India gets increasingly
integrated with the global markets and the exchange rate is increasingly market determined a
combination of capital flows management measures and currency trading restrictions in the on
shore markets are used to manage the lsquoimpossible trinityrsquo external value of the rupee These
measures and restriction are under constant review to ensure that the overall objective of growth
through foreign trade and investment are served
Against this backdrop this chapter attempts to highlights evolution in section II a brief review of
literature on the reasons behind increase in turnover in NDF market in Asian countries has been
given in Section III Section IV highlights the developments in NDF market The country
experiences such as nature of restrictions on non-residents operating in domestic currency
forwards market liberalisation measures taken by countries and its impact in curbing offshore
market discussed in Section V
I Introduction
NDFs are foreign exchange derivative instruments on non-convertible or restricted currencies
traded over the counter (OTC) mainly at offshore centres ie outside the direct jurisdiction of the
respective national authorities It is essentially a forward contract with different settlement process
Unlike the standard forward contract which involves exchange of underlying currencies on
maturity the NDF contract is typically settled as the difference between an exchange rate agreed
months before and the actual spot rate at maturity in an international currency (deliverable) mainly
the US dollars And the other currency which is usually emerging market currency is non-
21
deliverable The settlement of the transaction is not by delivering the underlying pair of currencies
but by making a net payment in a convertible currency equal to the difference between the agreed
forward exchange rate and the subsequent spot rate (Ma et al 2004) NDF contracts can either be
traded over the counter market or at exchanges at offshore financial centres such as Hong Kong
Singapore and London Lately they have become popular derivative instruments catering to the
offshore investorsrsquo demand for hedging arbitraging and speculating including by those who look
upon currency as an asset class
The major participants in NDF market could include foreign businesses and investors doing
business in countries with complex requirements for hedging currency risk in the local markets
arbitragers who have access to both on shore and offshore markets pure speculators like hedge
funds and others who take positions in the NDF market While these are the end users there are
also market intermediaries like banks dealers and brokers who provide quotes for trading in these
currencies and custodians who provide settlement arrangements While the multinational
companies deal in both the long and short end of the market the short end of the market is
particularly dominated by the hedge funds (Misra and Behera 2006) The pricing is influenced by
a combination of factors such as interest rate differential between the two currencies supply and
demand future spot expectations foreign exchange regime and central bank policies
NDF market primarily evolved in response to under-developed onshore forward markets and
limited access to non-residents to currencies with foreign exchange convertibility restrictions An
important advantage that enhances the demand for NDF is reduced credit risk compared to onshore
counterparts since there is no exchange of principal and only the difference amount is settled thus
allowing investors to circumvent limits associated with onshore activity Other reasons which also
favoured the emergence of NDF market includes convenience of time zones location of customer
business operating from a global treasury for multinational companies short-trading hours in
onshore forex market capital controls by individual central banks position limits frictions like
registration norms and know your customer norms frequent and significant changes in regulations
and guidelines in the domestic exchanges and OTC markets Moreover credit risk is also less
relevant since mostly large foreign banks are engaged as a counterparty in NDF trading Further
offshore centres in some cases are better placed to offer competitive services compared to the
22
onshore market on account of various factors ranging from tax treatment less onerous regulations
and documentation to operational efficiency
II Evolution of NDF Markets
The origin of NDF market traces back to the 1990s when a wave of capital account liberalisation
in emerging market economies (EMEs) triggered surge in capital inflows to these economies and
consequently increased currency risk faced by the investors However under-developed domestic
forward market or restricted access to onshore forward market paved the way for evolution of NDF
market as an alternative hedging tool to these investors The widely shared concern amongst local
monetary authorities was that easy access to onshore market and availability of domestic currency
to non-residents will encourage speculative activity leading to greater exchange rate volatility and
eventually the loss of monetary control Consequently some international banks began offering
NDF contracts to meet the demand of investors willing to hedge their EM currencies exposure
during early 1990s (Higgins and Humpage 2005)
One of the earliest NDF market developed during early 1990s was in Mexican peso to speculate
on the currency ahead of the devaluation from its then fixed exchange rate against the US Dollar
The increase in trading turnover during that time was facilitated by the entrance of voice brokers
as intermediaries between inter-bank trading activities (Lipscomb 2005) The NDF market for
some Asian economies like Korean Won Taiwanese Dollar Indian rupee and Chinese Renminbi
existed since mid-1990s due to either restricted or no access to onshore forward markets by non-
residents (BIS 2004) In case of New Taiwan Dollar only onshore entities had access to onshore
markets while it was subjected to underlying requirements in case of Korean Won Indian rupee
and Chinese Renminbi For other currencies like Indonesian rupiah NDF market evolved after
the Asian financial crisis in response to re-imposition of capital restrictions which were liberalised
in early 1990s In Indonesia rapid liberalisation beginning as early as 1970s and further
internalisation of Indonesia rupiah enabled the development of deliverable offshore market for
rupiah Following the currency crisis initial measures were directed at curbing non-trade and
investment related forward transactions with non-residents and broader measures prohibiting
banks from extending loans conducting derivative transactions and transferring rupiah to non-
residents were introduced in early 2001 While Malaysia also imposed cross border restrictions
23
after the crisis evolution of NDF market in Ringgit was initially inhibited by comprehensiveness
of regulations as well as its effective enforcement by the authorities (Ishii 2001)
McCauley (2011) showed that as income per capita rises a currency trades in ever greater
multiples of the home economyrsquos underlying international trade (ldquofinancialisationrdquo) and trades to
an even greater extent outside its home market (ldquointernationalisationrdquo) The increasing economic
interest in emerging market economies as a result of upbeat growth scenario from 2000s spurred
greater participation in currencies of these economies (Chart 1) In this context increasing turnover
in the Indian rupee Chinese Renminbi and other Asian currencies like Indonesian rupiah
Malaysian Ringgit Korean Won and New Taiwanese Dollar is consistent with increased
investment in these economies amidst restricted access to onshore markets Both India and China
recorded phenomenal growth rates translating into increased businesses (trade and investments)
with rest of the world and resulting exposures facilitated offshore trading of their currencies (Chart
2 a amp b) During 1990s mostly non-residents with genuine exposure used NDF market to hedge
their exposures in Indian rupee However with the development of onshore market providing
reasonable hedging facilities to foreign investors amidst gradual relaxation of controls most of the
market activity seems to be driven by speculators and arbitrageurs and those who are looking at
the rupee as a separate asset class to diversify their portfolios in view of its growing international
importance As a result the size of NDF market has grown over time In the Chinarsquos case the
emergence of offshore deliverables market for Renminbi (CNH) since 2010 was mainly due to
internationalisation of Renminbi which gradually substituted the NDF market
24
Chart 1 a amp b FX turnover Indexed 1998=100 and FX TurnoverTrade vs GDP
Source BIS Triennial survey IMF CEIC
Note Chart 1b A higher ratio of FX turnover to trade indicates that a currency trade in higher multiple
relative to its underlying trade as GDP increases
Chart 2 a amp b Gross trade Indexed 2000=100 and Gross trade vs FX turnover
Source IMF BIS World Bank
Both Indonesia and Malaysia have witnessed sharp increase in non-resident participation in local
currency bond market particularly in the aftermath of global financial crisis 2008 while these
countries local forward markets imposed restrictive conditions that restricted use of these markets
for hedging this led to the increased use of NDF market Non-resident ownership of government
debt in Indonesia and Malaysia as share of total outstanding government debt stood at 383 per
0
100
200
300
400
500
600
200
0
200
2
200
4
200
6
200
8
201
0
201
2
201
4
201
6
201
8
WorldAsiaEmerging and developing economiesAdvanced economies
0
1000
2000
3000
4000
0
200
400
600
800
1000
1200
1998 2001 2004 2007 2010 2013 2016
BRL IDR
CNY INR
MYR TWD
KRW right scale
Brazil
Korea
Indonesia
China
India
Malaysia
0
5
10
15
20
25
30
01 10 100 1000
GD
P p
er c
apit
a (U
SD
in t
ho
usa
nd
s)
FX turnover to trade (in log form)
Brazil
China
Indonesia
India
Korea Malaysia
Thailand
00
10
20
30
40
50
60
70
0 25 50 75 100 125 150
FX
turn
over
to
GD
P
External trade to GDP
25
cent and 243 per cent as at the end of March 2019 respectively highest amongst other Asian
economies However foreign participation in equity market is higher for Korea and Taiwan While
Taiwan has limits on investments in domestic bonds by non-residents foreign investors are not
subject to any investment ceiling for both aggregate and individual holdings in a listed company
except for a few restricted industries
Additionally the reason for growing NDF market could be increased carry trade activities for high
yielding currencies After examining the returns of carry trades with deliverable and non-
deliverable forwards Doukas and Zhang (2013) found that carry trades for currencies with NDF
contracts perform better compared to carry trades for currencies with deliverable forward
contracts This excess return is attributed to the compensation of risks emanating from currency
convertibility and capital controls For the Brazilian Real (BRL) derivatives offshore NDFs in
particular are the main vehicle for investors looking to implement carry trades (BIS Santaelaa
2015)
NDF market evolved mainly for emerging market economies witnessing increased economic
interest in the process of transition to high growth phase since 1990s whilst restrictions persisted
in accessing onshore markets for hedging currency risk arising out of these exposures The NDF
market also provided an opportunity to speculate on currencies which underwent notable shift in
their exchange rate regime During periods of global uncertainties like in 2013 during ldquotaper
tantrumrdquo the NDF market is used for speculative purposes arguably causing disruptions in
domestic forex market
III Size of the NDF market
Given that NDF is an over the counter (OTC) traded instrument the turnover data relies on various
surveys conducted by institutions at different time intervals In view of this issues like
comparability and continuity in data often arises However these surveys still provide useful
information to gauge the growth of NDF market over time Results from the semi-annual turnover
survey for the Foreign Exchange Joint Standing Committee chaired by Bank of England (BoE)
suggests that growth of NDF market has outpaced the forward market as well as overall foreign
exchange market In London the average daily NDF turnover surged to USD 139 billion as per
26
the latest survey in October 2018 from as low as USD 21 billion in 2008 During this period NDF
turnover quadrupled and its share increased to 53 per cent of overall forex turnover and comprised
nearly 34 per cent of both onshore and offshore forwards compared to nearly 10 per cent in 2008
Table 1 NDF trading in London (Average daily turnover in billions of US dollars)
NDFs All forwards NDF of all
forwards
All FX NDF as of all FX
Apr-08 23 200 115 1832 13
Oct-08 19 230 83 1699 11
Apr-09 16 162 99 1356 12
Oct-09 26 191 136 1522 17
Apr-10 25 186 134 1687 15
Oct-10 37 188 197 1787 21
Apr-11 42 192 219 2042 21
Oct-11 37 192 193 2038 18
Apr-12 36 192 188 2014 18
Oct-12 45 211 213 2017 22
Apr-13 60 265 226 2547 24
Oct-13 43 205 210 2234 19
Oct-14 62 304 204 2711 23
Apr-15 64 295 217 2481 26
Oct-15 54 253 213 2111 26
Apr-16 60 275 218 2225 27
Oct-16 62 292 212 2179 28
Apr-17 78 332 235 2401 32
Oct-17 90 330 273 2380 38
Apr-18 111 407 273 2727 41
Oct-18 139 409 340 2611 53
Source BIS London Foreign Exchange Joint Standing Committee
A similar survey is conducted by Hong Kong trade repository (HKTR) under the mandatory
reporting obligations imposed since July 2015 According to the HKTR survey daily average
27
NDF turnover in Hong Kong has also exhibited significant growth and daily average turnover
increased to USD 55-60 billion in 2018 from nearly USD 8 billion in 2015
The BIS publishes data on foreign exchange and derivatives trading activity every three years and
also prepare a separate report on NDF covering global market since 2013 The latest 2016 BIS
triennial survey reported that average daily turnover in global NDF market has increased by 53
per cent to USD 134 billion as compared to April 2013 Further NDF share in outright forward
and overall foreign exchange trading remained stable at 190 per cent and 26 per cent respectively
(Table 1) This is in contrast to the decline in average daily turnover in global FX markets to USD
51 trillion in 2016 from USD 54 trillion in 2013 survey conducted by BIS
The currency composition suggests that the Asian currencies dominate the NDF trading activity
with the highest turnover recorded by Korean Won as Korea generally has open capital account
and there are limits on non-residents borrowings in Korean Won from banks in Korea therefore
it is not deliverable offshore (BIS Survey 2016) Survey results from London Hong Kong and
Tokyo foreign exchange committees (FEC) as well as the BIS triennial survey points toward
increased NDF trading activity in Korean Won The Tokyo survey which is available from the
year 2006 suggest that the growth in NDF trading activity for Korean Won has shown significant
growth outperforming other major currencies The momentum in major currencies picked up ahead
of the global financial crisis 2008 before faltering during the crisis period owing to deteriorating
financial conditions Subsequently the NDF activity has deepened over time with the Indian rupee
and Brazilian Real constituting higher proportion of total global turnover after the Korean Won
as corroborated by the London survey also During the five-year period from 2008-13 the increase
in NDF turnover is largely consistent with the FX turnover in emerging market economies (BIS
2013)
Since 2013 greater demand for hedging in anticipation of monetary policy normalisation seems
to be the driving factor for increase in NDF activity given that lot of capital flows to emerging
markets was funded using low cost dollar liquidity (BIS 2013) The BIS 2016 survey identified
that developments associated with higher volatility in Renminbi during August 2015 and January
2016 has also boosted Asian NDFs even as trading activity in Renminbi NDF has faded
According to the BIS 2016 survey during 2013 and 2016 trading in Renminbi NDF contracted
by 394 per cent while that of Korean Won and Taiwanese Dollar expanded by 537 per cent and
28
299 per cent respectively The decline in the NDF activity for Indian rupee reflects the
depreciation of rupee against the US dollar however daily average turnover was up by 167 per
cent between 2013 and 2016 in unadjusted terms Hong Kong (HKTR) survey indicates continued
decline in NDF activity for Chinese Renminbi and Malaysian Ringgit (Table 2 and Chart 2 a amp b)
In case of China this was due to the Renminbi internationalisation policy followed after 2011
Table 2 Daily average turnover (USD billion) Spread
BIS 2013 BIS 2016
Oct- 2018
(London Survey) Bid-Ask (Latest)
NDF DF NDF DF NDF
DF
(Latest) Onshore Offshore
Chinese Renminbi 171 24 104 281 88 650 0001-0002 0003-0005
Indian Rupee 172 31 164 163 2303 214 001 002
Korean Won 196 11 301 145 295 300 010 030
Taiwanese Dollar 89 02 115 78 - 193 0005-0010 0010-0020
Brazilian Real 159 27 187 30 154 - - -
Russian Ruble 41 05 29 186 40 - - -
Source BIS London FEC BoK RBI China Foreign Exchange Trading Center Central bank of Taiwan HSBC
Note
1 DF= Deliverable forwards and include forwards and FX swaps traded onshore
2 Chinese Renminbi volumes on offshore segment are negligible after development of CNH market
3 BIS DF and DF (latest) are not directly comparable since latest numbers are taken from country sources
Chinese Yuan is for Jun-19 Indian rupee and Taiwanese Dollar is for Apr-19 Korean Won is for 2017
Chart 2 Average Daily Turnover and Change in Forex position of Asian Currencies
3 The corresponding figure for April 2019 stood at USD 28billion
0
100
200
300
400
500
US
DC
NY
US
DI
DR
US
DI
NR
US
DK
RW
US
DM
YR
US
DT
WD
Chart 2b Change in FX position of Asian
currencies (in USD billion)
29 January 2016 27 January 2017
31 January 2018 25 January 2019
0
200
400
600
800
1000
1200
Apr-
06
Apr-
07
Apr-
08
Apr-
09
Apr-
10
Apr-
11
Apr-
12
Apr-
13
Apr-
14
Apr-
15
Apr-
16
Apr-
17
Apr-
18
Chart 2a Average daily turnover USD
million
CNY INR IDR KRW
MYR TWD BRL
29
Source Tokyo FEC Hong Kong FEC
Based on latest surveys conducted by London and Hong Kong FEC which are major offshore
centres clearly it showed that the global NDF activity has surged led by Korean Won Indian
rupee Brazilian Real and Taiwanese Dollar The trend is likely to be validated by BIS 2019 survey
which encompasses global turnover and is due to release later this year
IV Review of Literature
In view of the noticeable rise in NDF activity with potential to engender distortions in local market
there exist varied literature on the emergence of NDF market and its spill-overs to onshore
counterparts One of the earliest attempts was made by Park (2001) which investigated the impact
of financial deregulation on relationship between onshore and offshore prices A key finding was
that Korean Won NDF influenced onshore prices after a shift to floating exchange rate regime
coupled with liberalisation of capital controls As part of liberalisation measures following the
Asian financial crisis in 1997 excessive regulations pertaining to foreign exchange market were
removed and measures were undertaken to improve efficiency of market by increasing liquidity
and broadening participation base (Chung et al 2000) Amongst these measures onshore entities
were allowed to participate in offshore market In this regard Lipscomb (2005) suggested that
transition to a more convertible exchange rate regime and permissible participation of onshore
counterparties in NDF transactions contributed to the increase in offshore liquidity which begets
liquidity in domestic market as well A classic example is Korean Won where both onshore and
offshore market co-exist with arbitrage opportunity exploiting any incipient price discrepancy
However NDF markets tend to disappear as the currency becomes fully convertible as stated
earlier
Wang et al (2007) also corroborated the finding that NDF market seems to be the driver for the
domestic spot market of Korean Won while the information flow is reverse for Taiwanese Dollar
where the spot market was found to have influence on NDF market Adding to this literature
Colaveccchio and Funke (2008) found Renminbi NDF to be the key driver of Asian currency
markets with varied degree of heterogeneity contingent on real and financial inter-linkages
Amongst the country specific study the one by Cadarajat and Lubis (2012) demonstrated that
Indonesia rupiah NDF tends to have influence on domestic spot and forward return
30
Studies by Hutchison (2009) Mihajek and Packer (2010) and McCauley and Scatigna (2011)
asserted that offshore trading becomes increasingly important with growing economic interest in
a particular currency amidst limited access to onshore markets and convertibility restrictions A
study by BIS (2013) analysed the directional impact for nine currencies including the Indian rupee
for the period 2005-13 along with separate analysis for 2008-09 crisis and May-August 2013 It
found the presence of two way causation for most currencies for the full sample period however
noted the increase in NDF influence during market stress Both the stress period saw noticeable
impact of NDF particularly during May-August 2013 with major exception of Malaysian Ringgit
where NDF played dominant role and there was no case of deliverable forward influencing NDF
In the Indian context the earliest study with regard to spill-overs impact was undertaken by Misra
and Behera (2006) They found onshore prices to have directional impact on NDF prices even as
volatility spillovers could exist from NDF to onshore market The subsequent research on this
subject during the period 2000-09 by Behera (2011) demonstrated the change in dynamics with
evidence of greater volatility spillover from NDF to spot market A similar finding was outlined
by Guru (2009) on the relationship between the NDF and onshore market for Indian rupee It is
argued that dynamics of relationship between onshore and offshore markets has undergone a
change with the introduction of the currency future market in 2008 and returns in NDF market
seem to be influencing the domestic spot as well as forward market
A study by Darbha (2012) finds that offshore markets plays an important role in price discovery
mechanism particularly in India and China Goyal et al (2013) after examining the period 2006-
13 found the existence of bi-directional relationship between onshore and NDF market for Indian
rupee over the long term however the directional impact turns one way from NDF to onshore
during periods of depreciating pressures ie movements in NDF markets drives adjustment in
onshore market when the currency is under depreciation pressures This asymmetric behaviour is
attributed to the fact that the Reserve bank intervenes in the foreign exchange market to stem
excessive volatility during periods of rupee depreciation
McCauley et al (2014) described two paths for evolution of the NDF markets The first one is
being followed by Chinese Renminbi which has become deliverable after the emergence of
offshore market The Indian rupee falls under the second where the NDF market has grown amidst
continued restrictions on foreign participation
31
The report of the Standing Council (Standing Council on International Competitiveness of the
Indian Financial System 2015 by Ministry of Finance Government of India enumerated factors
including capital controls position limits frictions like registration norms and know your customer
norms frequent and significant changes in regulations and guidelines in the domestic exchanges
and OTC markets as deterrent to foreign investors participation in the onshore market
IGIDR Finance Research Group (2016) made an important recommendation that domestic entities
should be permitted to participate in NDF market after outlining factors driving offshore activity
compared to onshore segment In respect of the internationalisation of rupee as one of the debated
recommendation Kumar and Patnaik (2018) argued the case for gradual internationalisation of
rupee on analysing the role of the Indian rupee in terms of official sector currency reserve currency
and trade invoicing currency
V Country Experience
China
The Chinese Renminbi (RMB) forward market can be segmented into offshore NDF market (since
1990s) an onshore Renminbi market (since 2007) and the CNH market (offshore deliverable) In
the current scenario RMB NDF has been gradually replaced by offshore deliverables after the
creation of CNH market since mid- 2010 as a by-product of promotion of international role of
RMB since 2009
Chinarsquos exchange rate regime has evolved from fixed to managed floating rates followed by
internationalisation of Renminbi (RMB) In early 1990s reforms started with the unification of
multiple exchange rate in 1994 and in 1996 China allowed the full convertibility of Yuan under
current account transactions Eventually the Peoplersquos Bank of China (PBoC) announced the
implementation of managed floating exchange rate against basket of currencies in July 2005
ending the dollar peg prevalent since 1994 Over the last decade Chinarsquos strong economic
performance and growing linkages with rest of the world prompted authorities to promote the
international role of RMB The idea of internationalisation of RMB gained prominence following
the financial crisis of 2008 which revealed the fragilities of dollar dominated global financial
system The thrust of early initiatives was RMB trade settlement premised on Chinarsquos deeper trade
32
links and its central role within Asiarsquos supply chain that supported the demand for its currency for
trade invoicing In this regard a pilot scheme permitting cross border trade settlement in RMB was
launched in 2009 which was widened to cover all current account transactions over the course of
next three years Capital account liberalisation was undertaken at a more gradual pace with the
Chinese RMB becoming officially deliverable at offshore centres in 2010 While Hong Kong
banks were permitted to accept RMB deposits as part of personal accounts in 2004 an important
milestone was the sign of Memorandum of cooperation between HKMA and PBoC in July 2010
which eliminated restrictions on Hong Kong banks in establishing Renminbi accounts and
providing related services ie payments and transfers in RMB to individuals and corporations
Moreover financial institutions were permitted to offer Yuan denominated products As a result
CNH (offshore Renminbi) began to trade actively amongst other range of products and prompted
investors to switch to deliverable market in place of NDF which was used previously Whilst CNH
can be transferred freely between offshore accounts transfer of RMB between onshore and
offshore is still confined to regulated channels to fend off potential adverse impact on onshore
markets Moreover these restrictions are skewed towards outflows form the mainland to offshore
centres
With Renminbi internationalisation the offshore CNH market has shown exponential growth
displacing the NDFs The BIS Triennial Survey showed significant decline in RMB NDF which
fell nearly 40 per cent between 2013 and 2016 driving its share in total RMB trading to 5 per cent
from 14 per cent earlier (BIS 2016) The rapid expansion of offshore market is clearly discernible
in rising FX turnover for CNH which has nearly doubled between 2013 and 2016 and forms around
67 per cent of the total RMB turnover Of the total CNH turnover average daily turnover in the
DFs in April 2016 was estimated to increase to USD 164 billion from USD 84 billion in 2013
(Table 3)
33
Table 3 RMB market turnover average daily turnover in USD billion
OTC
spot
OTC
FX
swaps
OTC
DFs
OTC
NDF Options Futures
OTC
currency
swaps Total
CNY
2013 201 105 26 0 03 0 0 335
2016 249 27 13 0 2 0 02 554
change 239 1565 -514 5693 651
CNH
2013 139 294 84
168 0 05 69
2016 427 59 164
158 03 25 1367
change 2079 1008 943 -56 5784 3836 981
NDF
2013
171
171
2016
104
104
change -394 -394
Source BIS
Since the inception of CNH pricing gaps tend to persist between onshore and offshore exchange
rates however it has narrowed over last couple of years This pricing gap arises on account of
different economic conditions in mainland China and Hong Kong amidst imperfect arbitrage
(Funke 2015) While central bank intervention can constrain the movement of CNY at onshore
centres CNH is more market determined and hence closely follows the global swings (Chart 3)
Since September 2015 PBOC has reportedly taken action in the offshore market when the
onshore-offshore gap was large (McCauley amp Shu 2018)
34
Source Bloomberg
Further liberalisation of the onshore FX market along with allowance of offshore deliverable
market has made the CNY NDF market almost non-existent despite maintaining the lsquoneed basisrsquo
principle Notwithstanding the existence of basis between CNY and CNH due to the band range
trading in CNY and market determined pricing in CNH the spread has been contracting over years
with ample liquidity available in onshore and offshore markets Further the creation of offshore
market has made various options available to offshore investors to both hedge their exposures on
underlying investments and also generate RMB risk in their portfolios via various products and
offshore deliverable market
Korea
With an average daily turnover of USD 30 billion as per the BIS survey 2016 and USD 295 billion
in the latest London survey of October 2018 Korean Won (KRW) NDF boasts of the most active
and liquid NDF market amongst most emerging market currencies Further permissible
participation of local banks in the NDF market ensures close integration of onshore and offshore
forex markets allowing for quick sentiment spillovers between the two markets Turnover in NDF
market is substantially higher than onshore forwards mainly on account of higher documentation
requirements for accessing onshore market In the onshore market average daily turnover was
reported at USD101 billion in 2017 for forwards which increased from USD 96 billion during
the previous year (Chart 4 a ampb)
-015
-01
-005
0
005
01
01-0
8-2
010
01-1
2-2
010
01-0
4-2
011
01-0
8-2
011
01-1
2-2
011
01-0
4-2
012
01-0
8-2
012
01-1
2-2
012
01-0
4-2
013
01-0
8-2
013
01-1
2-2
013
01-0
4-2
014
01-0
8-2
014
01-1
2-2
014
01-0
4-2
015
01-0
8-2
015
01-1
2-2
015
01-0
4-2
016
01-0
8-2
016
01-1
2-2
016
01-0
4-2
017
01-0
8-2
017
01-1
2-2
017
01-0
4-2
018
01-0
8-2
018
01-1
2-2
018
01-0
4-2
019
Chart 3 Gap between USDCNY and USDCNH
Offshore premium
35
Chart 4 Foreign Exchange Turnover and NDF market in Korea
Source Bloomberg Bank of Korea
Korea embarked on liberalisation reforms in 1980s however took big strides post Asian financial
crisis in 1997-98 in line with the IMF adjustment programme As part of these measures foreign
exchange transactions were liberalised which allowed the local banks to engage in NDF
transactions with non-residents Prior to this the development of the onshore currency derivatives
market was constrained by legal requirements such as any forward transaction had to be certified
as a hedge against future current account flows the so-called ldquoreal demand principlerdquo which also
spurred the development of a liquid offshore ldquonon-deliverablerdquo forward (NDF) market in the
Korean Won In 1999 as part of liberalisation measures this restriction was lifted and a lot of
activity moved onshore leading to the convergence of the offshore and onshore prices (IMF
2004) This resulted in sharp increase in NDF transactions between onshore banks and non-
residents for both hedging as well as speculative purposes Amidst likely possibility of turmoil in
foreign exchange market the central bank implemented regulations in January 2004 governing
Korean banks NDF positions with the non-residents directed at restraining any potential selloffs
However these restrictions were abolished in April 2004 as speculative activity was assessed to
have reduced significantly
KRW is almost a non-restricted currency provided the investor holds an Investment Registration
Certificate (IRC) issued by the Financial Supervisory Services (FSS) in Korea The IRC allows an
offshore investor to invest in onshore securities and provides near non-restricted currency rights
barring any holding of short selling position in onshore KRW account
191 18 183 175 20 194 196
7566 71 76
83 96 101
192198 196 19
192 184198
0
10
20
30
40
50
2011 2012 2013 2014 2015 2016 2017
Chart 4b Foreign Exchange Turnover
in Korea daily average USD billion
Spots Forwards Fx Swaps
-60
-50
-40
-30
-20
-10
0
10
20
30
12
-19
98
01
-20
00
02
-20
01
03
-20
02
04
-20
03
05
-20
04
06
-20
05
07
-20
06
08
-20
07
09
-20
08
10
-20
09
11
-20
10
12
-20
11
01
-20
13
02
-20
14
03
-20
15
04
-20
16
05
-20
17
06
-20
18
Chart 4a Onshore USDKRW-NDF 1M
USDKRW
36
For non-residents investors who do not hold IRS USDKRW remains a highly regulated market
Any onshoreoffshore transactions need to be approved by the appropriate authorities and must
have proof of underlying For multinational clients that repatriate dividends documentation with
proof of underlying must be in place Further ceilings are imposed on foreign exchange derivatives
transactions of foreign as well as local banks which came into existence as a prudential measure
to mitigate the adverse impact of volatile capital flows
Ahead of the 2008 financial crisis Korean economy experienced huge build-up of short-term
external debt led by foreign exchange derivatives positioning of banks on account of over-hedging
undertaken by Korean corporations as well as likely carry trades in anticipation of appreciation of
domestic currency Both these activities were funded using offshore dollar borrowing and posed
serious difficulties at the time of global dollar liquidity crunch during financial crisis With a view
to prevent recurrence of the any such episode triggered by volatile capital flows which resurged
from 2009 over-hedging was specifically prohibited and limits were imposed on Foreign
exchange derivatives activity of banks in relation to their capital Liberalization in KRW has been
continuing for decades with the last one completed in December 2007 whereby prior approval
requirements for some capital account transactions was abolished Even onshore participants can
freely participate in the NDF markets thereby providing onshore liquidity to Non-Residents as
long as the hedges are booked as NDF Essentially KRW is a fully convertible currency but is
only tradable on NDF basis offshore
Malaysia
Malaysia had liberal foreign exchange policies until Asian financial crisis with regard to cross
border transactions involving Malaysian Ringgit (MYR) Following the crisis offshore trading of
MYR was banned However grace period was notified for depositors to repatriate their offshore
deposits back to Malaysia and the adoption of fixed exchange rate policy in 1998 - a significant
move whilst imposing selective capital controls All these measures were intended at ceasing
offshore activity which contributed to the excessive pressure on currency despite relatively
stronger fundamentals Although Malaysia imposed cross border restrictions after the Asian crisis
evolution of NDF market in MYR was initially inhibited by comprehensiveness of regulations as
well as its effective enforcement by the authorities (Ishii 2001) Further absence of reference rate
37
for settlement of NDF contracts and stringent controls on domestic bank to undertake forward
foreign exchange transactions with offshore counterparties also hindered the development of NDF
market (EMEAP discussion paper 2002) As the economy began to recover capital controls were
gradually relaxed and finally the currency was floated in 2005
Generally Malaysia has opened up its domestic markets for non-resident investors with no
restrictions on non-residents investing in local bond markets except having to appoint a local
custodian Most of the sectors are open for non-resident portfolio equity flows as well in Malaysia
Over the years since 2005 non-resident investorsrsquo participation in the onshore market picked up
substantially reaching record high of 397 per cent of total outstanding government bonds from
nearly 14 per cent in 2005 and in the process contributed to the growth of NDF market as well
McCauley (2013) analysed the direction of influence for nine currencies in 2005-13 as well as
separately for the 2008-09 crisis and May-August 2013 Granger causality tests point to two-way
causation for most currencies for the full sample The exception is the Malaysian Ringgit where
the NDF influences the deliverable forward market The central bank expressed concerns over the
adverse impact of increased activities in the ringgit NDF market after wide gap was observed
between the NDF and onshore rate in 2016 following the US presidential election Bank Negara
Malaysiarsquos (BNM) Governor emphasised that ringgit NDF market is used by non-resident
investors mostly for speculative purposes rather than genuine demand for hedging As the NDF
trading activity intensified during volatile period in 2016 ringgit-denominated NDF implied much
larger depreciation which further exacerbated the then prevailing depreciating pressure on the
currency (Chart 5)
Chart 5 Onshore and Offshore market in Malaysia
Source Bloomberg
4141542
42543
43544
44545
455
Oct
-16
Oct
-16
Oct
-16
Nov
-16
Nov
-16
Nov
-16
Nov
-16
Dec
-16
Dec
-16
Dec
-16
Dec
-16
Dec
-16
Jan-1
7
Jan-1
7
Jan-1
7
Jan-1
7
Feb
-17
Feb
-17
Onshore USDMYR Offshore 1month NDF USDMYR
38
Assessing the overwhelming impact of NDF activities which has the potential to undermine
financial stability BNM took a number of measures in 2016 to eliminate speculative transactions
in order to ensure appropriate price discovery and orderly functioning of onshore market These
measures includes reinforcement of non-internationalisation policy for Ringgit steps to improve
the onshore pricing mechanism and deepen the domestic forex market After prohibiting banks
from quoting fixing orders used to settle offshore trades the central bank revised the methodology
to compute onshore reference rate to account for transacted deals from mid-2016 Further BNM
imposed a ban on ringgit NDF trading in November 2016 and reminded local banks that ringgit
remains a non-internationalised currency and therefore any offshore trading is not recognized At
the same time BNM strengthened its monitoring to ensure compliance to Foreign exchange
administration rules (FEA) rules by market participants on non-involvement in facilitating NDF
transactions Subsequently financial markets committee (FMC) instituted in mid-2016 laid down
a series of developmental measures for onshore market aimed at allowing better market access and
greater hedging facilities to market participants (Table 5)
Table 5 Developmental Measures Relating to Foreign Exchange Market
Jul-16 Dec-16 Apr-17
Adopting global best practices Rebalance onshore FX demand and supply
Additional FX risk
management practices
bull Transaction based KL
USDMYR reference rate
bull 25 retention of export proceeds in
foreign currency
bull Streamline passive and
dynamic hedging
flexibilities for
investors
bull Extension of official closing hour
for onshore Ringgit rate
bull Trade settlement among residents in
Ringgit only
bull Active hedging for
corporations
bull Streamline onshore and offshore
foreign currency investment limit
Promote FX risk management onshore
bull Active hedging below RM6t million of
net open position
bull Active hedging for institutional
investors
39
bull Expansion of appointed overseas office
framework
In an immediate impact reinforcement of restrictions on USD-MYR NDF market resulted in
significant outflows from local bonds in Malaysia However as a positive impact with the bout
of capital outflows following ban on NDF transactions composition of non-resident holdings has
shifted towards more stable and long-term investors thereby reducing the risk exposure to global
impulses Further the disruptive influence from NDF market subsided and onshore foreign market
continues to register higher average daily volume These measures have helped in increasing the
depth and liquidity of the foreign exchange market as evidenced by declining volatility and
narrowed bid-ask spreads in onshore market The decline in offshore volumes has resulted in
widened bid-ask spread (Chart 6 a amp b)
Chart 6 Malaysia Monthly FX forward volumes and Bid-Ask Spread
Source BNM Reuters and Bloomberg
-001
0
001
002
003
004
005
01
-10
-201
0
01
-04
-201
1
01
-10
-201
1
01
-04
-201
2
01
-10
-201
2
01
-04
-201
3
01
-10
-201
3
01
-04
-201
4
01
-10
-201
4
01
-04
-201
5
01
-10
-201
5
01
-04
-201
6
01
-10
-201
6
01
-04
-201
7
01
-10
-201
7
01
-04
-201
8
01
-10
-201
8
01
-04
-201
9
Chart 6b Bid-Ask spread
offshore bid-ask onshore bid-ask
0
10
20
30
40
50
60
70
80
90
0
5
10
15
20
25
30
Dec
-12
May
-13
Oct
-13
Mar
-14
Aug
-14
Jan-1
5
Jun
-15
Nov
-15
Apr-
16
Sep
-16
Feb
-17
Jul-
17
Dec
-17
May
-18
Oct
-18
Mar
-19
Chart 6a Monthly FX forward turnovers (in
USD billion)
Onshore FX forward Offshore FX forward RHS
40
Chart 7 Non-resident holdings of total government debt and Monthly FX turnover
Source BNM and HSBC
Indonesia
The development of NDF market in Indonesia Rupiah traces back to the year 2001 when Bank
Indonesia (BI) prohibited onshore banks from lending to non-resident accounts in an attempt to
reduce the speculative pressure on the Indonesian Rupiah (IDR) These restrictions paved the way
for development of offshore rupiah NDF market to cater to the demand of international investors
Prior to this an active offshore deliverable market existed for IDR following the pursuit of
liberalisation policies beginning as early as 1970s which allowed the IDR to be freely convertible
and at the same time permitted its internationalisation Consequently the international use of
rupiah increased but was confined mostly to financial transactions mainly due to limited invoicing
of trade-related transactions in IDR terms This easy access to rupiah from onshore centres due to
internationalisation allowed non-resident to speculate on the currency during the 1997 crisis in
Asian countries As a result of heightened activity in times of stress exchange rate volatility
increased making it difficult for the central bank to maintain stability of rupiah In response to the
crisis the currency was freely floated replacing the intervention band but weakness in the currency
and high volatility continued to persist compared to currencies of other Asian countries during the
first three years of its floating rate regime Taking cognizance of this disparity the central bank
began to evaluate the extant regulations relating to rupiah transactions with non-residents
Thereafter during the year 2001 the BI imposed extensive regulations limiting non-resident
143
397
243
50
100
150
200
250
300
350
400
450
Jan-0
5
Oct
-05
Jul-
06
Apr-
07
Jan-0
8
Oct
-08
Jul-
09
Apr-
10
Jan-1
1
Oct
-11
Jul-
12
Apr-
13
Jan-1
4
Oct
-14
Jul-
15
Apr-
16
Jan-1
7
Oct
-17
Jul-
18
Apr-
19
Chart 7a Non resident holdings as of total
government debt
-
500
1000
1500
2000
2500
3000
Jan-1
6
Apr-
16
Jul-
16
Oct
-16
Jan-1
7
Apr-
17
Jul-
17
Oct
-17
Jan-1
8
Apr-
18
Jul-
18
Oct
-18
Jan-1
9
Chart 7 Monthly onshore FX market
turnover (in billion of USD)
FX Spot FX Swap FX Forward FX Options
41
rupiah transactions and shrinking the pool of offshore rupiah funds with the potential to be used
for speculation identifying spill overs from offshore market as conduit of excessive volatility
In general Indonesia has opened up its domestic bond markets for non-residents completely with
no entryexit barriers except having to appoint a local custodian Foreign exchange hedging is
allowed only with underlying documentationasset in place for non-residents On the portfolio
equity investments regulation clearly provides that a listed company is exempt from any foreign
investment restrictions However there are sectoral restrictions on FDI in Indonesia which are
decided by BKPM (Investment Coordinating Board in Indonesia) which provides a DNI list
(Governmentrsquos negative investment list) The share of non-residents in Indonesia Government
Bonds has been increasing over years from a mere 1570 per cent of the total government bonds
in June 2009 to 3810 per cent in April 2019 (Chart 8)
Source HSBC
Research from BI in 2012 found disproportionate impact of NDF market to spot market during the
period 2008-11 Results suggests that there is evidence of unidirectional mean spill-over from NDF
to both spot and forward rupiah markets with an exception of Europe crisis On volatility spillover
the study obtained significant results from NDF market to spot market for entire period However
in crisis situation the study found interdependence between volatility in offshore NDF and onshore
spot rate changes while information transmission is only valid from NDF to forward rate changes
not the other way around (Cadarajat and Lubis 2012)
To reduce the unwarranted influence of NDF market on spot market BI took initiatives beginning
the year 2014 to bridge the gap between onshore and offshore rupiah rate In 2014 the central bank
381
150
200
250
300
350
400
450
Jun-0
9
Dec
-09
Jun-1
0
Dec
-10
Jun-1
1
Dec
-11
Jun-1
2
Dec
-12
Jun-1
3
Dec
-13
Jun-1
4
Dec
-14
Jun-1
5
Dec
-15
Jun-1
6
Dec
-16
Jun-1
7
Dec
-17
Jun-1
8
Dec
-18
Chart 8 Non-resident holdings as percetage to total Government
Debt
42
with the help of key offshore centre Singapore moved the foreign exchange rate fixing that is used
to settle the NDF contracts to the onshore market Earlier Association of Banks in Singapore
(ABS) and the Singapore Foreign Exchange Markets Committee (SFEMC) was publishing IDR
reference rate computed as weighted average of 1-month NDF trades done by then Singapore
based brokers Post March 27 2014 BI started publishing reference rate termed as Jakarta Inter-
bank Spot Dollar Rate (JISDOR) which was to be used to settle existing and new contracts Jakarta
Interbank Offered Rate (JIBOR) is more transparent in a way that it is based on actual transactions
being done in the inter-bank onshore market
In late 2018 BI in its efforts to further deepen the domestic foreign exchange market and to
mitigate IDR exchange rate risk BI established the Domestic Non-Deliverable market (DNDF)
for IDR It will serve as a parallel market to NDF with the key difference that it is rupiah settled
in onshore market This alternative tool will provide foreign investors additional avenues to hedge
their IDR exposure without principal exchange other than enhancing the central bankrsquos
intervention capabilities At this juncture the market is relatively new and hence significant impact
assessment of the same cannot be outlined However currently Indonesia has not been able to
move significant turnovers from offshore NDF to Domestic NDF market
Brazil
Brazilian Real is the second most actively traded currency in NDF market after the Korean Won
with an average daily turnover of USD 187 billion as per BIS and USD 154 billion according to
the London survey The growth and development of NDF market is attributed to the existence of
large and well developed foreign exchange futures market
The development of derivatives market in Brazil is attributed to the hedge culture that has been
prevalent due to periods of high and persistent inflation and exchange rate volatility amidst
political shocks During 1980s and early 1990s inflation was soaring above 100 per cent which
peaked over 2700 per cent in 1993 and thus promoted widespread indexation to manage the
inflation risks Subsequently the ldquoReal planrdquo which comprised of fiscal and monetary reform and
introduction of new currency helped to bring down inflation and stabilise the currency Amidst
stable macroeconomic conditions private sector was encouraged to borrow foreign funds at a
43
lower cost and the consequent surge in foreign indebtedness during 1994 to 1998 led the central
bank issue dollar denominated securities as a hedging instrument Following the currency crisis in
1999 the Brazilian Real was floated amongst adoption of new set of economic policies which was
also accompanied by providing unrestricted access to non-residents to financial markets (including
derivatives) in 2000
The distinguishing feature of Brazilian foreign exchange is the non-deliverable nature of
derivatives contracts without any significant limitations even though participation in deliverable
instruments ie spot outright forwards and foreign exchange swaps is constrained Only chartered
banks are authorised by the central bank to hold foreign exchange spot positions All these factors
have facilitated the growth of foreign exchange futures market over spot market which is closed
and highly restricted Against the backdrop of large and sophisticated foreign exchange derivatives
with high depth and liquidity foreign exchange futures prices have key influence on spot price as
suggested by various studies (Ventura and Gracia 2009 Kaltenbrunner 2010 and Chamon and
Gracia 2013) As pointed out by Kaltenbrunner 2010 the existence of a deep futures market has
made it possible for foreign banks with branches in Brazil to sell real offshore (NDF) and
simultaneously hedge their real exposure in the onshore futures market For the Brazilian Real
derivatives especially offshore NDFs are the main vehicle for investors looking to implement
carry trades (Santaelaa 2015)
Taiwan
The NDF market for Taiwanese Dollar (NTD) existed since 1990s and the central bank permitted
domestic and foreign legal entities to trade in NTD NDF market with authorised banks in 1995
This came after opening up of local securities market to foreign institutional investors (QFII) in
1990 which allowed FIIs meeting certain requirements to apply for investment in Taiwanrsquos stock
market Subsequently significant relaxations were made and security market was completely
opened up with the abolition of QFII scheme While onshore institutions were eligible for trading
in NTD NDF the central bank initially imposed limits on trading position in NTD NDF to one
third of their total foreign exchange position with a view to prevent speculative pressure
44
Following the Asian financial crisis in July 1997 the central bank introduced measures to regulate
NDF market with only authorized banks permitted to carry NDF trading with other authorised
counterparts and their overseas branches or headquarters This move came after the speculative
positioning which was believed to cause sharp depreciation of the NTD The central bank outlined
that although there was ceiling on NTD NDF trading positions some banks were engaged in selling
NDFs to foreign entities and simultaneously created long NDFs positions and shorted DFs with
domestic entities in a bid to offset the NDF trading positions on their balance sheets and thus
creating more room for further NDF trading (Bank of Taiwan Annual Report 2014) The central
bank has intervened in foreign exchange market to curb speculative activity also post 2008
financial crisis when emerging markets witnessed resurgence of capital flows The measures
introduced then by the central bank focused on reducing local banksrsquo foreign exchange positions
in both onshore and NDF markets including discouraging non-resident deposits by imposing
punitive reserve requirements with an intent to limit local banksrsquo capacity to provide liquidity to
NDF markets The National Supervisory Commission also took steps to limit non-resident
investments in local bank deposits and government securities
However recognising the dominance of foreign banks in NDF trading activity the central bank
announced that overseas branches of domestic banks are eligible to apply for NTD NDF business
from September 2014 In current scenario whilst there are no restrictions on the fixed income
investments in general but investments in localdomestic bonds by non-residents cannot exceed
30 per cent of their investments in equity instruments which has kept the investments in local
bonds low by non-residents who tend to take exposure in USD bonds issued by Taiwan offshore
Moreover ability for local banksrsquo to access the TWD NDF market up-to 20 per cent of each banksrsquo
net open position results in partial integration between onshore and offshore markets Since TWD
is not fully convertible any onshore spot transactions must be declared to the central bank and in
most cases require supporting documentation which keeps the differential between onshore and
offshore rate
To conclude cross county experience shows that increasing role of any economy globally is
accompanied by emergence of growing offshore trading of their currencies in the presence of
restricted access or cumbersome regulations Additionally emerging market economies cannot
afford to have unrestricted access to their onshore market as revealed by the studies of Indonesia
45
and Malaysia during the Asian crisis 1997 which exposed them to global impulses Most of these
countries have followed a gradual approach surrounding non-resident access to their forex markets
As emerging markets open up and become sophisticated in respect of forex markets the case study
of the Republic of Korea exemplify that country-specific factors have to be considered when
designing the financial regulatory toolkit aimed at curbing foreign and domestic agentsrsquo
speculative strategies in the search for yield The experience of Brazil suggests deepening onshore
hedging market will go a long way in promoting the price setting role of onshore market over its
offshore counterparts Indonesia has recently introduced domestic NDFs in line with Brazil
Additionally the experience of Korea and Taiwan suggests that the participation of domestic banks
ensures that any price differential between the two segments is arbitraged However in both the
cases participation is governed to evade any potential build-up of vulnerabilities on banksrsquo balance
sheet
46
Chapter 34
Linkages between Offshore NDF and Onshore Rupee Markets New Evidence
Overarching Motivation
Indiarsquos trade integration with the rest of the world began to rise sharply from the turn of the
millennium Between 2000 and 2012 total trade (imports + exports) as a percentage of GDP more
than doubled from 26 to 56 before moderating to 43 in 2018 as the effects of de-
globalization took over post the global financial crisis Simultaneously policymakers persevered
with gradual but consistent capital account liberalization Unsurprisingly therefore currency
markets ndash both to trade and hedge ndash rose in tandem with the growing external integration The
onshore Rupee market5 monthly average turnover has grown from USD 60 billion in 2000 to USD
687 billion in 2018 However given data limitations uncertainty still exists on the exact size of
the NDF market and how it has grown relative to the onshore market As Chapter- 2 illustrates
the BIS Triennial Survey finds average daily turnover of Rupee NDF in 2016 was USD 16 billion
However the Bank of Englandrsquos Semi-Annual Forex Turnover Survey finds average daily
turnover of Rupee NDF in London increased from USD 8 billion in October 2016 to USD 23
billion in October 2018
The idea behind trying to size the NDF market ndash and therefore implicitly compare its size and
growth to onshore markets ndash is in part to try and make sense of how important a role NDF markets
play in the ldquoprice discoveryrdquo of the Rupee6 With the Indian Rupeersquos ldquoForwardrdquo price being
determined across segmented markets ndash both the onshore deliverable forward market and the
offshore non-deliverable market -- the key is to ascertain the relative importance of each of these
markets in driving price discovery
4 This chapter is a joint work of Shri Sajjid Chinoy Chief Economist J P Morgan India and Shri Harendra Behera
Assistant Adviser Department of Economic and Policy Research Reserve Bank of India 5 Spot OTC amp ETCD
6 To be sure estimating the size of the NDF market is important not just for the influence it exerts on price discovery
but also instructive in understanding the cumulative ldquoviewrdquo on the Rupee and how much is expressed onshore versus
offshore This is because if NDF volumes are substantial policymakers may desire to shift these volumes on shore
both to (i) deepen the onshore market and (ii) move this businesseconomic activity on shore
47
However simply using (offshore versus onshore) volumes as a means to proxy relative price
discovery is imperfect at best The ability of NDF volumes to drive price discovery for any given
quantum of volumes is ultimately a function of how inter-connected onshore and offshore markets
are and the ability of economic agents ndash hedgers arbitrageurs speculators -- to link these markets
For example if NDF markets have grown sharply but it is found that price linkages between the
two markets are still tenuous or have not increased commensurately with volumes -- say because
arbitrage opportunities between the two markets have not grown in tandem -- then the growth of
NDF markets and the consequent ldquoloss of controlrdquo will be of less concern to Indian policymakers
Conversely if price linkages have grown over time ndash proportionately to volume increases ndash then
policymakers would rightly worry about the growing role of NDF markets in driving price
discovery
The fundamental motivation for this chapter is therefore to empirically examine price linkages
between the NDF and onshore markets as this is the ultimate manifestation of the influence that
NDF markets exert
The Question
This chapter seeks to ask two fundamental questions Is there a stable long-term equilibrium
relationship between onshore and offshore markets Second if so what is the directionality of
influence Do NDF markets drive onshore markets Or do onshore markets drive the NDF market
Or is the influence bi-directional
Furthermore we try and empirically answer this questions across two dimension First what is the
direction and quantum of influence during ldquonormal times versus ldquostressed timesrdquo Second what
is the relationship and how does it change when assessing ldquoaverage returnsrdquo (means) versus
ldquovolatilityrdquo (variance)
Specific Motivation to India
While there is a meaningful and growing literature trying to empirically ascertain price linkages
between the onshore and offshore markets around the world the literature that focuses on India
remains sparse dated and inconclusive This constitutes the specific motivation for this chapter
48
The literature studying NDF markets around the world has steadily grown over time For example
much work has been done on Asian NDF markets and their relationship with onshore markets
both for the region as a whole (Ma et al 2004 Colvecchio et al 2006 Wang et al 2007 Gu and
McNelis 2009) and individual currencies such as the Korean Won (Park 2001) the Indonesian
Rupiah (Cadarajat and Lubis 2012) the Chinese Yuan (Fung et al 2004 Hideki 2006
Colavecchio and Funke 2008 Huszaacuter et al 2016 Song and Gao 2016 McCauley and Shu 2018)
and the Indian Rupee (Misra and Behera 2006 Guru 2009 Behera 2011 Darbha 2012 Goyal
et al 2013)
Results remain mixed Some studies find the NDF markets influence the evidence onshore forward
market (Park 2001 Wang et al 2007 Cadarajat and Lubis 2012) others find they influence
onshore spot markets (Behera 2011 Goyal et al 2013) while some document its influence on
onshore futures markets (Behera 2011) Conversely some studies also find the direction of
influence runs from onshore markets to NDF markets (Wang et al 2007 Misra and Behera 2006)
In the case of India there are only a few studies on this subject ndash with the last one back in 2013 ndash
and the results are mixed and inconclusive For example Misra and Behera (2006) find that itrsquos
the onshore markets that influenced the NDF market between 2004 to 2007 largely because of
restricted participation of domestic players in the offshore market In a subsequent study Behera
(2011) found that there are volatility spillovers from the NDF market to spot and forward markets
in India and the magnitude of volatility spillover has become higher after the introduction of
currency futures in 2008 Guru (2009) finds qualitatively the same results and the role of currency
futures in India Darbha (2012) find that offshore markets play an important role in price discovery
Finally in the most recent work on India (Goyal et al 2013) find evidence of a long-term
relationship between NDF and onshore markets and find evidence that the relationship is
bidirectional as both markets adjust to any deviations from the equilibrium state
Whatrsquos clear however is the evidence on India is patchy inconclusive and dated with the last
study conducted more than 6 years ago
Some Theory
Recall if there are no capital controls forward rates are tied down by the no-arbitrage ldquocovered
interest parityrdquo hypothesis
49
F = S(1+r)(1+r$ )
Where F is the Forward rate S is the spot rate r is the relevant interest rate on the home currency
and r$ is the equivalent dollar rate The equation holds when (i) there is capital account
convertibility and there are no barrier for cross-border transactions and (ii) there is equivalent
credit risk in the assets across the two jurisdictions
However if there are capital-account barriers we would expect F to only be approximated by the
equation above and not hold exactly
So F ~ S(1+r)(1+r$ )
Similarly the NDF rate should be anchored by the onshore forward rate to the extent that
arbitragers can link these markets
So NDF ~ F ~ S(1+r)(1+r$ )
Furthermore the sign of the onshore-offshore yield spread can indicate the underlying market
pressure on the currency If the domestic interest rate is higher than the NDF implied yield it
implies appreciation pressures on the currency However capital controls may restrict inflows to
close the gap Similarly a lower domestic interest rate than implied by the NDF yield would
suggest depreciation pressures while a zero spread would likely reflect an absence of market
pressure on both the domestic and offshore market
All told however we would expect that both onshore and offshore markets would have a long-
run relationship and there is the likelihood of ldquomeanrdquo spillovers on a regular basis Furthermore
hedging arbitrage and speculative activities may also result in volatility spillovers from one
market to another on various occasions
Testing for ldquoMeanrdquo Spillovers
We start therefore by empirically testing for linkages between onshore (spot and forward prices)
and offshore (NDF forward prices) markets The goal is to assess
1 If there is a stable long-term relationship between onshore and offshore markets
2 Which drives which Do onshore prices drove offshore prices Or vice versa
50
3 To see whether the direction of influence is a function of context Are the results
different for ldquonormalrdquo times versus ldquostressed periodsrdquo (ie taper tantrum emerging
market stress)
Non-stationary but co-integrated
So as to decide the empirical course of action we start by testing whether the key variables of
interest (i) the Onshore Spot Exchange Rate (SPOT) (ii) the Onshore Forward Rate (FORWARD)
and (iii) the Offshore Non-Deliverables Forward exchange rate (NDF) are stationary
Augmented Dickey Fuller Tests reveal that all three variables are non-stationary in levels
However as Figures 1 and 2 suggest the spreads between SPOT and NDF and ONSHORE
FORWARDS and NDF are mean-reverting suggesting the presence of a long-term relationship
and suggesting stationarity in the first differences
Formal co-integration tests ndashTables 2 and 3 ndash confirm that both pairs of variables NDF-SPOT and
NDF-FORWARD ndash are indeed co-integrated The Max Eigenvalue tests reveal there is at least one
co-integrating vector that can be found at the 5 level
Null Hypothesis Variables have a unit root
ADF t-Stat Prob
Spot -06 09
Augmented Dickey-Fuller test statistic-07 08
Augmented Dickey-Fuller test statistic-07 08
Table 1 ADF unit root test
-15
-05
05
15
25
09 10 11 12 13 14 15 16 17 18 19
level
Figure 1 Spreads (1M NDF- Spot)
51
-25
-15
-05
05
15
25
09 10 11 12 13 14 15 16 17 18 19
level
Figure 2 Spreads (1M NDF- 1M Forward)
Table 2 Co-integration SPOT and NDF
Sample (adjusted) January 2005 to March 2019
Included observations 2608 after adjustments
Trend assumption No deterministic trend (restricted constant)
Series LOG(SPT) LOG(NDF)
Unrestricted Cointegration Rank Test (Trace)
Hypothesized Trace
No of CE(s) Eigenvalue Statistic Critical ValueProb
None 011 31310 2026 000
At most 1 000 210 916 076
Unrestricted Cointegration Rank Test (Maximum Eigenvalue)
Hypothesized Max-Eigen005
No of CE(s) Eigenvalue Statistic Critical ValueProb
None 011 31100 1589 000
At most 1 000 210 916 076
Both Trace and Max-eigenvalue tests indicates 1 cointegrating
eqn(s) at the 005 level
52
Stable Long Term Relationship
The finding of co-integration allows us to use ordinary least squares (OLS) to estimate the long-
term relationship between SPOT and the NDF as well as FORWARD and the NDF In particular
using the equation below we estimate parameters β0 and β1 which tells us about the long-term
relationship between SPOT and NDF
We then repeat the same exercise between the FORWARD and the NDF
But whatrsquos driving what An ldquoError Correction Mechanismrdquo approach
While establishing a long-term relationship is important a finding in the affirmative will not come
as a particular surprise Instead the real question is whether onshore prices drive offshore prices
or vice versa The natural framework to answer this is the work-horse Error Correction Mechanism
(ECM) approach used by Engel and Granger in 1987 where changes in each of the variables are
run on changes on its own lags and the lags of the other variables
Table 3 Co-integration FORWARD and NDF
Sample (adjusted) January 2005 to March 2019
Included observations 2608 after adjustments
Trend assumption No deterministic trend (restricted constant)
Series LOG(FORWARD) LOG(NDF)
Unrestricted Cointegration Rank Test (Trace)
Hypothesized Trace
No of CE(s) Eigenvalue Statistic Critical ValueProb
None 018 53051 2026 000
At most 1 000 217 916 074
Unrestricted Cointegration Rank Test (Maximum Eigenvalue)
Hypothesized Max-Eigen 005
No of CE(s) Eigenvalue Statistic Critical Value Prob
None 018 52835 1589 000
At most 1 000 217 916 074
Both Trace and Max-eigenvalue tests indicates 1 cointegrating
eqn(s) at the 005 level
53
119889119897119900119892(119904119901119900119905)119905 = 1205720 + 120572119904119901119900119905(119890119905minus1) + sum 12057211(119894)(119889log (119904119901119900119905119905minus1))119899119894=1 + sum 12057212(119894)(119889log (119873119863119865119905minus1)) + 120576119904119905
119899119894=1 (1)
119889119897119900119892(119873119863119865)119905 = 1205720 + 120572119899119889119891(119890119905minus1) + sum 12057221(119894)(119889119897119900119892(119904119901119900119905119905minus1))119899119894=1 + sum 12057222(119894)(119889119897119900119892(119873119863119865119905minus1)) + 120576119899119905
119899119894=1 (2)
For example as Equation 1 lays out changes in (the log of) SPOT ndash the dependent variable -- are
run on its own lags and the lags of NDF Equation 2 ndash in which the dependent variable is NDF --
does the same for NDF Because both variables are co-integrated ndash as shown above ndash using OLS
to estimate these coefficients using standard criterion to choose lag lengths (eg Akaike
Information Criterion) and standard F-Tests are all valid
The coefficients of interest in the above equation are 120572119904119901119900119905 and 120572119899119889119891 ndash the ECM terms -- because
these coefficients tell us when the system is in disequilibrium the direction and the speed of
adjustment back to equilibrium This will determine the directionality of influence
For example if 120572119904119901119900119905 = 0 and if all values of 12057212(119894) = 0 then dlog(NDF) does not granger cause
dlog(spot) In contrast if the value of 120572119904119901119900119905 is negative and statistically significant that implies
that (the log of) NDF in the long run ldquoganger-causesrdquo spot market movements The same intuition
applies for equation 2 where NDF is the dependent variable and we test for convergence between
the NDF rate and the onshore forward rate Direct convergence requires 120572119904119901119900119905and 120572119899119889119891 to be
oppositely sign Intuitively the larger the value of α the faster is the speed of adjustment
In summary while the βrsquos tell us about the existence and strength of a long run relationship
between onshore and offshore markets the αrsquos tell us about whether (i) the directionality of
influence and (ii) the speed of convergence from disequilibrium
We therefore use this approach to test for linkages between both sets of variables ndash NDF and
onshore SPOT ndash and NDF and onshore FORWARDS
Data
We use end-of- India-day closing values for the onshore spot exchange rate for the 1-month a
forwards and the corresponding 1-month non-deliverable-forward (NDF) rates We use daily data
and our full sample runs from 2009 through 2019
54
Results Full Sample
Table 4 ECM and Long run coefficients (Full sample)
The first row are the linkages between the onshore spot and NDF markets while the second row
is that of the onshore forwards and NDF market
In both cases the betas (β) are positive statistically significant and with a magnitude very close to
or at 1 implying an almost one-for-one movement between both the markets in the long run For
example the estimated β1 of 099 suggests that for a 1 increase in NDF rates there is 099
increase in spot rates in the long run Meanwhile between onshore FORWARDS and NDF there
is a complete pass-through in long run More generally a beta (β) close to 1 suggests there is no
permanent friction between onshore and offshore markets in the long run
Convergence
However the real interest is in the alphas In the first case both 120572119904119901119900119905 and 120572119899119889119891 are statistically
significant and oppositely signed This suggests that they both converge towards each other Put
differently the NDF rate moves towards the onshore SPOT rate and vice-versa In other words
there is a bi-directional relationship between both variables The magnitude of the coefficients
(007-018) suggests a moderate speed of convergence to the long-run equilibrium when a shock
causes the system to go into disequilibrium
The same results are obtained when studying linkages between the onshore forward and NDF
markets Both 120572119891119900119903119908119886119903119889 and 120572119899119889119891 are statistically significant oppositely signed (suggesting they
converge towards each other) with coefficients that are slightly larger than the SPOT-NDF pair
This suggests that both NDF and the onshore FORWARD rates influence each other and gradually
converge towards their long-term relationship when hit by a shock ndash a speed of adjustment that is
modestly faster than the NDF-SPOT relationship
Time Period April 2009 to March 2019
Onshore Spot and NDF -018 007 099
Onshore Forwards and NDF -032 023 100
55
For the full sample as a whole from 2009 to 2019 we find that there is a bi-directional relationship
on average between SPOT and NDF and FORWARD and NDF and that all variables converge
gradually to their long-term relationship
Results Stressed Times
Our results should be thought of as ldquoaveragerdquo results across the entire time period But are these
results a function of context Does the direction of influence change for example during periods
of currency stress versus periods of calm We explore this next
To test for this we start by isolating clearly-identifiable periods of stress ex post facto in our
simple Two episodes naturally come to mind the taper tantrum of 2013 (where the Rupee
depreciated 26 between May 2013 and August 2013) and the emerging market (EM) turmoil ndash
characterized both by the Fed raising rates and oil prices firming ndash such that the Rupee depreciated
almost 10 between August 2018 and October 2018
2013 The Taper Tantrum
We test interlinkages from the start of May to the end August 2013 ndash during the Taper Tantrum ndash
when the Rupee was under intense pressure and easily amongst the worst performing currencies
in the emerging market (EM) universe Results are presented in Table 5 below
Table 5 ECM and Long run coefficients
As one can observe 120572119899119889119891 in both equations is statistically insignificant What this implies is onshore
spot and forward rates were playing very little role in influencing NDF rates7 In contrast 120572119904119901119900119905 and
120572119891119900119903119908119886119903119889 are correctly signed and statistically significant (the former at the 1 level and the latter
at the 10 level) which suggests it was the NDF rate that was driving the onshore spot and forward
rates Interestingly the speed of adjustment is much faster for onshore spot rates in this sample (-
11) compared to the full sample (-018) and also relative to the onshore forward market (-08) An
7 In fact onshore spot and forward rates do not granger cause NDF as none of the lags of 12057221(119894) in equation 2 are
statistically significant during this period
Onshore Spot and NDF -11 -028 094
Onshore Forwards and NDF -08 015 097
Time Period May 2013 to August 2013
56
ECM (alpha) coefficient of greater than 1 suggests the witnesses an oscillating convergence Since
a coefficient greater than 1 is prime facie surprising we also conduct a robustness exercise
(described below) by running Granger Causality tests for this time period and find it is the NDF
that Granger-causes onshore rates and not the other way around
This finding likely reflects the growing volumes ndash potentially speculative ndash in the NDF market in
the 2013 period of stress relative to the volumes in the onshore market This also prime facie
reduced the efficacy of foreign currency intervention by the central bank because intervention was
used to shape the spot exchange rate at the end of Indiarsquos business day But because the NDF is a
24 hour market NDF rates evolved overnight and when the Indian market opened the next day
onshore rates were influenced by NDF developments overnight This rendered ineffective the
previous dayrsquos intervention because there was often little correlation between the closing exchange
rate of the previous day and the opening rate of the next day and therefore necessitated additional
intervention the next day
Visually this is evident in the ldquogap-uprdquo movements of the exchange rate when the Indian market
opened ndash vis-a-vis the previous dayrsquos close ndash during those three months Figure 3 for example
captures this for the month of August 2013
Figure 3 Gap-up opening in USDINR (August 2013)
Source Bloomberg
57
2018 More of the Same
Emerging markets came under renewed stress in the summer of 2018 against the back drop of the
Fedrsquos hiking cycle accompanied by the rally in crude pieces which had surged 50 over the course
of a year As some large emerging markets ndash Argentina Turkey ndash came under some stress there
was a contagion to all emerging markets with current account deficits of which India was one
Between May and October 2018 the Rupee depreciated almost 10 against the US Dollar
What were the offshore-onshore linkages during that period of time Results are presented in Table
6
Table 6 ECM and Long run coefficients
The linkages mimic 2013 The coefficient on whether onshore drives offshore 120572119899119889119891 is insignificant
in both regressions This re-affirms that in line with 2013 onshore spot and forwards were not
driving the NDF rate8 In contrast 120572119904119901119900119905 and 120572119891119900119903119908119886119903119889 are both correctly signed quantitatively
meaningful and statistically significant This suggests that it was the NDF rate that drove the
onshore spot and forward during this period likely reinforcing the presumption that volumes rise
sharply in NDF markets during periods of stress which then become the hub of price discovery
and influences onshore rates As Figure 4 reveals this is visible in the ldquogap-uprdquo movement of the
Rupee at the start of the day for several days in the month of August 2018
8 Onshore spot and forward rates does not granger cause NDF as none of the lags of 12057221(119894) in equation 2 are
statistically significant
Time Period August 2018 to Nov ember 2018
Onshore Spot and NDF -10 -05 096
Onshore Forw ards and NDF -115 -05 096
58
Figure 4 Gap-up opening in USDINR (August 2018)
Source Bloomberg
Our analysis also reveals that the speed of adjustment is very rapid relative to the baseline
Robustness test
The results are robust to the selection of time and tenure of the NDF For example instead of
India end-of-day (EOD) time as the NDF cut-off if we consider New York EOD as the NDF cut-
off there are no qualitative changes in the results Similarly instead of considering the 1-month-
NDF if we consider the 3-month-NDF the results essentially stay the same Furthermore given
the short time periods involved during stressed times (May to August 2013 and August to
November 2018) one can argue that co-integration equations may not be relevant We therefore
also carry out Granger causality tests for these time-periods and find the direction of causality to
be just above ie NDF rates are driving onshore rates during stress periods and not vice versa
Controlling both ldquoMeanrdquo and ldquoVolatilityrdquo spillovers
Thus far our focus has been on mean spillovers However as found by Misra and Behera (2006)
there are also potential ldquovolatilityrdquo spillovers from the NDF market to the spot and forward market
To model the coexistence of both mean and volatility spillovers we use a multivariate generalised
autoregressive conditional heteroskedasticity (MGARCH) model The degree of volatility
59
spillovers is measured by estimating dynamic conditional correlations between the markets The
empirical analysis is conducted using daily data from April 1 2009 through March 29 2019 and
using the currency pairs for (i) NDF-Spot (ii) NDF-Forwards and (iii) NDF-Futures
This model examines simultaneous interactions of conditional returns and volatilities across the
markets In this modelling framework we examine the Granger-causality in mean and variance as
discussed in Behera (2018) The results corroborate the earlier results that there is bi-directional
mean spillovers between onshore and offshore markets (Table 7)
An important finding using this approach is that the impact of price spillover from offshore to
onshore remains up to substantial lags while that from onshore to offshore dissipate after one day
(Annexure II) This ensues from the result that the individual coefficient estimates in the mean
equations of BEKK-MGARCH model are found to be statistically significant up to 5 lags in the
regression of returns in onshore market on that of offshore market while in the opposite case the
coefficient of onshore return is statistically significant only for the first lag
Table 7 Granger-causality tests in Mean
Direction of Causality Results
Spot to NDF 1-Month Yes
Spot to NDF 3-Month Yes
Spot to NDF 6-Month Yes
NDF 1-Month to Spot Yes
NDF 3-Month to Spot Yes
NDF 6-Month to Spot Yes
Forward 1-Month to NDF 1-Month Yes
Forward 3-Month to NDF 3-Month Yes
Forward 6-Month to NDF 6-Month Yes
NDF 1-Month to Forward 1-Month Yes
NDF 3-Month to Forward 3-Month Yes
NDF 6-Month to Forward 6-Month Yes
Futures 1-Month to NDF 1-Month Yes
Futures 3-Month to NDF 3-Month Yes
Futures 6-Month to NDF 6-Month Yes
NDF 1-Month to Futures 1-Month Yes
NDF 3-Month to Futures 3-Month Yes
NDF 6-Month to Futures 6-Month Yes
Note Null hypothesis is rejected if the p-value in the Wald test is less than 5 per cent
60
Volatility spillover between markets are studied by examining the statistical significance of
individual coefficients Granger causality in variance tests and estimating the dynamic conditional
correlations Beginning with granger causality test results imply a bidirectional causal relationship
between volatilities in both onshore and offshore markets of 1-month maturity segments only
(Table 8) In normal times no volatility spillovers are observed across the markets in other
maturity segments which reverses in the period of increased uncertainty (as found from Granger-
causality-in-variance tests taking into account asymmetric effects) The results from individual
coefficient estimates indicate about the presence of short-term volatility spillover between the
markets while the long-term volatility transmission is statistically significant from NDF market
to onshore spot forward and futures markets Moreover the asymmetric coefficients in variance
equation provide interesting insights ndash with the evidence of rise in volatility spillover from onshore
to offshore market in case of rupee appreciation while the opposite happens ie the volatility
spillover increases from NDF market to onshore market in the episodes of rupee depreciation
(Annexure II)
Table 8 Granger-causality tests in Variance
Direction of Causality Results
Without Asymmetry Effect With Asymmetry Effect
Spot to NDF 1-Month No Yes
Spot to NDF 3-Month No Yes
Spot to NDF 6-Month No Yes
NDF 1-Month to Spot No Yes
NDF 3-Month to Spot No Yes
NDF 6-Month to Spot No Yes
Forward 1-Month to NDF 1-Month Yes Yes
Forward 3-Month to NDF 3-Month No Yes
Forward 6-Month to NDF 6-Month No Yes
NDF 1-Month to Forward 1-Month Yes Yes
NDF 3-Month to Forward 3-Month No Yes
NDF 6-Month to Forward 6-Month No Yes
Futures 1-Month to NDF 1-Month Yes Yes
Futures 3-Month to NDF 3-Month No Yes
Futures 6-Month to NDF 6-Month No Yes
NDF 1-Month to Futures 1-Month Yes Yes
61
NDF 3-Month to Futures 3-Month No Yes
NDF 6-Month to Futures 6-Month No Yes
Note Null hypothesis is rejected if the p-value in the Wald test is less than 5 per cent
In order to understand how the volatility spillover between the markets changed over time a
variant of MGARCH model viz dynamic conditional correlation (DCC) model as proposed by
Engle (2002) is estimated taking the same pair of onshore-offshore exchange rate returns The
conditional volatility of 1-month NDF 1-month futures and their dynamic correlations are plotted
in Chart 249 The chart shows a sudden and significant rise in volatility during the episodes of
European debt crisis taper tantrum and latter part of 2018 coinciding with the rise in offshore-
onshore spreads resulting from the concerns regarding high current account deficits and large
capital outflows It is important to note that the volatility in NDF market is higher compared to
futures market and the divergence between the two gets accentuated in the times of heightened
uncertainty This in turn in conjunction with the rise in information asymmetry results in a drop
in correlations Since volatility spillover increases from offshore to onshore markets as discussed
earlier during periods of heightened uncertainty the volatility in onshore market increases
following the heightened volatility in offshore market In subsequent periods the correlation
increases indicating about the rise in spillovers A closer examination of the data on the volatilities
in two markets shows that volatility increases in offshore market first before it increase in onshore
markets with a lag of 1 to 2 days The correlations being positive and substantially higher imply a
significant degree of spillovers between the markets
9 The conditional volatilities for other pairs are qualitatively almost similar though their dynamic correlations are
different the dynamic correlations are provided in Chart 25
62
The dynamic correlations of volatilities for different pairs are presented in Chart 25 reveal that
that all the correlations were highly integrated and moving together alike until end December 2014
However the apparent structural changes in correlation process were observed since then with the
trends of correlations of NDF with spot and forward moving in one direction and that of NDF and
Futures moving on the opposite direction until mid-2017 The correlations have started coupling
though still continuing with some gaps between them since July 2017
060
065
070
075
080
085
090
095
00
05
10
15
20
25
30
2009 2010 2011 2012 2013 2014 2015 2016 2017 2018
Chart 24 Time-varying Volatility and Correlations Futures and
NDF
1-month Futures 1-month NDF DCC (right scale)
63
Conclusions and Implications
Since the work on establishing onshore-offshore price linkages in India was relatively sparse
outdated and inconclusive the goal of this Chapter was to create an updated empirical fact base
given the rapidity with which capital markets have developed and integrated and the pace at which
the NDF market has grown The overall results present a bidirectional relationship between
onshore and offshore markets
First that for full sample the price linkages ndash both mean and volatility ndash are found to be
bidirectional Both onshore and offshore rates have a strong long-term relationship and that when
a shocks throws that relationship into disequilibrium both onshore (spot and forward) and offshore
rates converge towards each other This suggests both influence each other This is consistent with
earlier findings in literature and should not be surprising Relative volumes across these market
are very dynamic and vary significantly When the bulk of the volumes flow through the onshore
050
055
060
065
070
075
080
085
090
095
100
2009 2010 2011 2012 2013 2014 2015 2016 2017 2018
Chart 25 Dynamic Conditional Correlations of Volatilities
SPOT_NDF1 SPOT_NDF3 SPOT_NDF6 FW1_NDF1 FW3_NDF3
FW6_NDF6 FUT1_NDF1 FUT3_NDF3 FUT6_NDF6
Forwards
Futures
Spot
64
market it becomes the locus of price discovery The converse is true when the bulk of volumes
are routed through the NDF market which then becomes the principle pole of price discovery
During the last two stress episodes (the taper tantrum and the 2018 EM crisis) however the
relationship turned unidirectional with the NDF market driving onshore spot and forwards and
the speed of adjustment from any disequilibrium increasing very sharply compared to ldquonormalrdquo
times Furthermore volatility spillovers also increased from offshore markets to onshore during
the periods of heightened uncertainty There is however an interesting asymmetry There is
evidence of rise in volatility spillover from onshore to offshore market in case of rupee
appreciation while the opposite happens ie the volatility spillover increases from NDF market to
onshore market in the episodes of rupee depreciation
All told as NDF volumes have increased they have begun to play an important role in both price
discovery and driving volatility particularly during heightened uncertainty periods
65
Chapter 4
International Financial Service Centre (IFSC)10 ndash Use of Rupee derivatives
The Task Force (TF) is vested to examine the role if any IFSC can play in addressing the concerns
arising out of offshore Rupee markets Presently Rupee is not permitted to be traded in the IFSC
This chapter discusses the aspects relevant to availability of non-deliverable Rupee derivatives in
the IFSC and permitting banks (IFSC Business Units or IBUs) to deal in such derivatives Before
discussing the potential benefits and concerns from the aforesaid proposition it is important to
address this issue ndash Are markets in IFSC onshore or offshore In the context of the Rupee market
a critical test for deciding the residency of the market would be applicability of capital controls in
respect of taking and exiting positions under FEMA 1999 Inter alia this is the critical aspect in
difference between the price discovered in onshore and offshore market As the IFSC functions
outside the capital controls under FEMA 1999 type of participants and the price discovered in
Rupee markets here will align with the existing offshore markets and therefore it cannot be treated
as onshore market To sum up while legally IFSC is very much an entity on the shores of India
from the point of view of Rupee markets it has to be treated as an offshore entity
Potential benefits of permitting non-deliverable Rupee derivatives in the IFSC
i Bringing NDF market volume to the IFSC Over the last decade or so a significant
market share in financial services related to India has moved to other international financial
centres like Singapore Hong Kong and London Bringing this business to India is clearly
beneficial in terms of economic activity and employment gains for India Further the size
and growth of the offshore Rupee derivative market poses a significant challenge to the
efficiency of price discovery as well as the effectiveness of exchange rate management
policy The possibility that the exchange rate of the Rupee not a fully convertible currency
being materially determined by transactions largely outside the legal and regulatory
influence of India is a matter of concern Given the favourable tax regime tax and by virtue
10
International Financial Services Centre or lsquoIFSCrsquo has the same meaning given in Section 2 (q) of the Special
Economic Zones Act 2005 (28 of 2005)
66
of it being outside the capital controls under FEMA 1999 IFSC may bring volumes and
price discovery to India
ii Complete bouquet of financial services in the IFSC Currently exchanges in IFSC are
permitted to offer a well-diversified range of products spanning various asset classes
which include derivatives on Indian indices derivatives on Indian stocks derivatives on
foreign stocks cross currency derivatives commodity futures on Gold Silver and base
metals etc Further while listing and trading of Masala Bonds is permitted in the IFSC
hedging Rupee exchange rate risk on it is not permitted Thus introduction of Rupee
derivatives will complete the entire range of asset classes available for trading in the IFSC
iii Access to market information The offshore Rupee market has been the subject matter of
interest for all stakeholders as these markets have an impact on onshore markets However
in the absence of any authentic data there are varying estimates about the volumes traded
in these markets nature of participation extent of open interest and the extent to which
these markets are used for hedging purposes If by opening up the IFSCs to Rupee trades
there is some migration of offshore Rupee market volumes it will help the cause of better
information flow regarding the market
iv Level playing field for Indian banks Foreign bankrsquos branches outside India can deal in
the offshore market as they are not bound by the RBIrsquos regulations On the other hand
overseas branches of Indian banks cannot deal in Rupee derivatives in the offshore market
By introducing Rupee derivatives in IFSC and permitting IBUs to deal in such derivatives
a more level playing field can be provided to Indian banks to service non-residents
Concerns from non-deliverable Rupee derivatives trading in the IFSC and dealing by IBUs
such derivatives
i Cannibalizing onshore business One major concern arising out of the introduction of
non-deliverable Rupee derivatives in the IFSC is whether it would cannibalize the business
of the onshore market instead of importing volumes from abroad Since the products in
both IFSC and the onshore market would be more or less similar in terms of characteristics
the domestic futures market getting gradually cannibalized by the IFSC on the face of it
appears probable But a deeper analysis of the comparative regulatory framework would
allay such concerns to a large extent The domestic currency futures market is majorly
67
made up of resident participation Non-residents are nearly absent in these markets and
hence their shift to the IFSC is more a theoretical proposition Since the Indian residents
are not permitted to participate in the IFSC they cannot contemplate a move-over It also
important to note that the onshore market settles in INR whereas derivative contracts in
the IFSC would settle in dollars and hence these markets will cater to two distinct classes
of participants
ii Impact on exchange rate management policy and development of the onshore market
Presently Indian banks are not allowed to deal in Rupee derivatives in the offshore market
A detailed discussion on the issue of allowing such dealing is presented in Chapter 5 In
consideration of the risk that participation of Indian banks may improve liquidity in the
offshore market and undermine the development of the onshore market the TF is of the
view of that Indian banks should not be permitted to deal in offshore Rupee market IFSC
being an offshore centre all concerns expressed in Chapter 5 in this regard are valid on
Rupee market in IFSC also However unlike other offshore Rupee market venues IFSC
has the potential of providing certain benefits to India as discussed earlier in this chapter
and therefore a distinction could be made between the two while examining the case of
permitting Rupee derivatives to be traded in the IFSC
iii Spillover of risks from IFSC to onshore market This is a concern since the two
markets being geographically contiguous could create porous leakage channels This
concern can be addressed by stipulating distinct net open position limits for entities
operating in both IFSC and on-shore In other words the open positions of entities
operating in the IFSC should not be permitted to be netted off with the open position on-
shore
What does a volatile Rupee exchange rate in the IFSC imply for the RBI and onshore
market
Chapter 3 establishes the linkages between the offshore and onshore Rupee market IFSC being an
offshore jurisdiction will have the same impact The RBI as the monetary authority has the
authority under RBI Act to maintain the stability of the rupee A volatile onshore foreign exchange
market could act as the trigger point of volatility in other financial markets like money bonds and
68
equities The spill over impact of financial market volatility casts its shadow on asset prices and
in turn it could have an impact on the capital flows and financial stability Given that a separate
regulator is envisaged for the IFSC the issue of RBIrsquos role in the IFSC was extensively deliberated
by the TF There are two possible approaches
i RBI plays a pivotal role in framing the Rupee derivative regulation in the IFSC In
order to allow the RBI to take measures in line with the objectives of exchange rate
management policy the sine qua non for allowing Rupee derivatives in the IFSC is to
ensure that RBI vested with the obligations to maintain financial and monetary stability
should continue to perform its statutory role in determining the regulatory framework for
Rupee market in the IFSC
ii Treat it akin to any other offshore market and maintain a hands-off approach The
objective of introducing Rupee derivatives in the IFSC is to provide an alternative to non-
residents for dealing in non-deliverable Rupee derivatives The expected transition of
investors is likely to be successful only if the IFSC functions with same freedom as other
offshore markets At the same time from an exchange rate management perspective
permitting Rupee trading in IFSC should not make a material difference to local authorities
as long as there is a barrier between the onshore market and IFSC In that case IFSC would
be exactly of the same status as any other offshore market
The TF feels that in line with the objectives of permitting Rupee derivatives in the IFSC the latter
approach - that the regulatory environment in which Rupee trades in IFSC is exactly similar to the
environment that prevails in any other offshore centre - is preferable As IFSCs are treated on par
with a foreign jurisdiction in terms of FEMA the regulation of the trade and capital flow channels
between the two jurisdictions (on-shore and IFSCs) should be so designed as to restrict the
transmission of volatility through these channels (in terms of participants products limits etc)
Recommendation
While there are concerns around impact on the onshore market due to trading in Rupee derivatives
in the IFSC there are potential benefits in terms of IFSCrsquos ability to offer complete bouquet of
financial services and availability of market information to all stakeholders Further given Indiarsquos
69
economic growth it may be appropriate to prepare for greater financial integration with the rest of
the world Sequencing and timing of measures relating to currency markets is a critical component
of such integration Although at the moment there is no definite path ahead in terms of such
integration but a thriving Rupee market in the IFSC may provide a system which can be leveraged
towards this end in the way and manner deemed fit in future IFSC being outside the capital
controls provides an opportunity to policymakers to test new regimes and products in an
environment whose repercussions may not significantly impact the stability or efficiency of the
onshore system On balance the TF is of the view that non-deliverable Rupee derivatives may be
introduced in the IFSC However a phased approach may be adopted and to start with trading
may be permitted only on exchanges due to the inherent transparency and risk management
benefits offered by it Introducing OTC contracts may be considered at a later stage after the
experience gained from trading on exchanges RBI may in its Financial Stability report assess the
impact of the functioning of IFSC on the financial stability of the country
Further the TF is of the view that entities regulated and permitted by the RBI may be permitted
to make market and run positions in Rupee derivatives market in the IFSC In order to prevent
spill over of risks from IFSC to onshore market though these entities a distinct net open position
limit may be stipulated for their operations in the IFSC In other words the open positions of
entities operating in the IFSC should not be permitted to be netted off with their open position
the onshore market
Finally given the mandate of RBI to implement exchange rate policy it may not be in benefit of
things to introduce Rupee derivatives in the IFSC without it being on board and therefore the TF
feels that Rupee derivatives may be permitted in the IFSC subject to agreement of the RBI
70
Chapter 5
Issues and Recommendations
The Task Force (TF) is entrusted to recommend measures to incentivize non-residents to access
the onshore Rupee derivative market and address concerns if any arising out of the offshore
Rupee derivative market As discussed in Chapter 1 the TF had interactions with various
categories of stakeholders to understand their perspective on the matter and identify the issues that
needs to be addressed
Chapter 2 and 3 have clearly brought out the increased importance of offshore Rupee markets
both in terms of their size and in terms of their impact on the exchange rate of the Rupee The price
and volatility spillovers from one market to the other are almost complete they are bi-directional
and when rupee is under pressure they are unidirectional from offshore markets to onshore
markets The speed of convergence of the markets is also quite quick The TFrsquos recommendations
have been made in the light of available information results of statistical analysis and most
importantly on the feedback received from various consultations
While increased participation of non-residents would be expected to enhance liquidity in the
onshore market it may also bring along with it additional volatility and transfer of incremental
risk to the domestic system This is particularly so as historically the rupee is a currency that has
generally depreciated and the demand for forward dollars is usually more than the supply
especially in times of stress Hence it is pertinent to examine the impact of incremental hedging
by non-residents in the onshore market While volatility in the rates have a clear impact on the real
sector events in the domestic derivatives markets in the late 2000s constantly remind us of issues
related to transfer of risk to entities that are not capable of understanding and managing it The big
question then is whether our system today is ready for incremental demand for hedging from non-
residents Available data is inadequate to measure the contribution of hedgers and speculators in
the offshore market turnover Using the best available information it can be estimated that an
additional daily average Rupee derivative turnover of around 08 billion ndash 24 billion could be
generated in the onshore market if all the INR NDF hedging transactions are transferred from the
offshore market (see Box 1) Such an incremental flow is not significant enough to cause any
adverse impact on volatility in the onshore market given that the user-driven deliverable forwards
market in India is quite liquid with daily average turnover of USD 163 billion (as per BIS
71
Quarterly Review December 2016) As regard transfer of risk to the domestic system the concern
is more regarding transfer of risk to the Indian companies and less towards market-makers as they
are in the business of managing risk There is a possibility that the said incremental positions
created in the onshore market may get transferred to Indian companies (in part or full depending
upon the level of these positions retained by the market-makers) However in comparison with
the late 2000s Indian companies today are only allowed to enter into Rupee derivatives depending
on their underlying exposure and no leveraged structures are permitted Also banks are bound by
stringent suitability and appropriateness norms Therefore the chances of Indian companies
acquiring unmanageable risk positions or risks due to mis-selling by market-makers are very low
Further there has been a significant growth in the external sector and consequently the foreign
exchange market has also grown (although one could argue on the incommensurate growth) To
summarize in the last decade or so the ecosystem on the whole has evolved and is less prone to
adverse impact from transfer of risks from non-residents
Box 1
Approximation of share of hedging transactions in INR NDF turnover
The graph presented below is extracted from BIS Quarterly Review December 2016
72
It can be observed from the above graph that non-financial and other financial institutions
contribute around 5 and 35 respectively to the turnover of INR NDFs in the offshore market
If one were to make an informed guess that all transaction by non-financial companies are hedging
transactions and that hedging transactions by other financial companies (eg funds) would
constitute maximum 25 of their transaction then it can be approximated that hedging transactions
constitute around 5 - 15 of the daily average turnover in INR NDF market which was reported
as USD 164 bn
Comparison of turnover in forwards in onshore and offshore market - In the same publication
it is also reported that the average daily turnover in onshore deliverable forwards is USD 163 bn
It may be noted that for fair comparison with the turnover in offshore market (where deliverable
spot and swap market doesnrsquot exist) this turnover includes both deliverable forwards and FX
swaps A comparative analysis of volumes in onshore and offshore market ndash both OTC and
exchange traded Rupee derivatives - is given in Annexure IV
Issues and recommendations
1 Market hours
An important reason for the existence of the offshore Rupee derivative market is simple geography
That domestic markets are closed when major users in certain regions (eg the United States) are
working creates a natural access for offshore markets Also significant international developments
impacting the Rupee exchange rate take place outside the onshore market hours thereby creating
a natural clientele for the offshore markets The feedback received from non-resident investors as
well as corporates highlighted the closure of the local market as an important reason for them
accessing the offshore market Exchanges have for some time been requesting an extension of
market hours citing increasing Rupee transaction volumes in offshore exchanges situated in
Singapore and Dubai A straightforward way of taking care of such requirements is to extend the
onshore market hours (both OTC and exchange traded derivative markets) While extending
market hours might involve simultaneously keeping support services (payment and settlement
systems) or support markets (funding markets) open it is also possible to treat such transactions
as part of the operations of the next day in which case the need for settlement or funding does not
73
arise In this regard the TF supports the recommendations relating to market timings outlined in
the draft Report of the Internal Working Group on Comprehensive Review of Market Timings
published by RBI on July 10 2019
Recommendation 1
The TF recommends that the onshore market hours be suitably extended to match the flexibility
provided by the offshore market and thereby incentivize non-residents to hedge in the onshore
market
2 Competitive pricing
One important feedback from foreign portfolio investors (FPIs) as well as global corporates was
that they are unable to access multiple competitive quotes in the onshore market Effectively they
are limited to using the prices of their custodian banks Generally FPIs deal only with their
custodian banks due to the existing rules whereby the custodian is responsible for tracking of
outstanding hedges vis-agrave-vis portfolio size This ldquofrictionrdquo issue can be addressed by shifting the
monitoring to a centralized agency which can use a technology solution to track exposures as well
as outstanding hedges This is further explained in recommendation no 4 ahead relating to
underlying exposure
Also the process to be setup documentation such as KYC and other trading arrangements with
multiple counterparties in India is a long and difficult exercise resulting in most FPIs either trading
with their custodian bank or using the offshore market to hedge Some of the documentation related
challenges can be minimized if the centralized KYC registration currently in place for SEBI
regulated entities is extended to all the entities ie both custodial banks as well as non-custodial
banks This is elaborated in recommendation no 11 on the KYC process
Another issue highlighted by FPIs in this context was unavailability of multi-dealer electronic
dealing platforms for them One way of making onshore prices more widely accessible to non-
residents is to allow Indian banks to freely offer prices as liquidity providers to non-resident
customers at any time whether or not the domestic market is open They can extend to non-resident
corporates the same choices that domestic corporates have in choosing among various market
makers This can be done either by a domestic sales team or by using staff located at overseas
74
branches In addition making an all-to-all trading platform (like the FX-Retail being introduced
in August 2019) available to non-residents would supplement that effort
Recommendation 2
The TF recommends that banks may be allowed to freely offer prices to non-residents at all times
out of their Indian books either by a domestic sales team or by using staff located at overseas
branches Also wide access to the FX-Retail trading platform to non-residents would be a major
incentive to use the onshore market
3 Effect of offshore Rupee derivative market on onshore price discovery and exchange rate
management policy
The size and growth of the offshore Rupee derivative market especially in the last few years poses
a significant challenge to the efficiency of price discovery as well as the effectiveness of exchange
rate management policy A comparison of onshore and offshore Rupee derivative market is given
in Annexure IV The possibility that the exchange rate of the Rupee not a fully convertible
currency will be materially determined by transactions largely outside the legal and regulatory
influence of India is a matter of concern The most straightforward approach to deal with that
concern would be to completely liberalize the onshore market and bring it at par with the offshore
market in all aspects Such a scenario would imply an effective absence of local regulation and
intervention which is incompatible with the current status of capital account convertibility
Another option is to liberalise the onshore market to the extent possible but this in itself may not
necessarily mean a fall in importance or size of the offshore market In this connection the TF
extensively discussed the proposition of creating a connection between the offshore and onshore
markets by permitting Indian banks to deal in the offshore market The various implications of
such a step are discussed below
i Reduction in volatility In theory a segmented market would be less liquid and therefore
more volatile compared to an integrated market One could also infer that offshore market
activity is maximum during onshore working hours eg almost three-fourths of the
offshore rupee futures are traded when Indian markets are open It is also observed that
75
offshore spreads are larger which indicates a relative scarcity of market-making entities
Linking the two markets may increase both the customer base as well as the liquidity
providers thereby improving liquidity as well as efficiency of the price discovery process
ii Better customer pricing through increased transparency in the offshore market
Today very little information is available regarding the offshore Rupee market other than
that of exchange traded instruments Such opacity is not in the interest of customers as
liquidity provision is limited to entities that have a presence both onshore and offshore
resulting in a premium (in terms of high bid-ask spreads) being charged for market access
Broadening this access to onshore banks would drive away such premium through wider
competition At the same time access to information improves for the local authorities
Since better information leads to better price efficiency it is in the interest of local
authorities to disseminate such information leading to an overall improvement in market
transparency
iii Level playing field for Indian banks Foreign bankrsquos branches outside India can deal in
the offshore market as they are not bound by the RBIrsquos regulations On the other hand
overseas branches of Indian banks cannot deal in Rupee derivatives in the offshore market
Allowing them access to the offshore Rupee derivative market would create a level playing
field for Indian banks
iv Impact on development of the onshore market Liquidity in onshore market is better
than the offshore market due to participation of real sector and market making by Indian
banks which obviously are the major Rupee liquidity providers Consequently non-
residents have the ability to exit positions with less impact cost in unfavourable times This
is a strong incentive for them to hedge in the onshore market (given dynamic hedging and
other operational issues are now being ironed out) Also higher liquidity in the onshore
market results in tighter bid-ask spread compared to the offshore market which allows non-
residents to get better pricing in the onshore market The aim of policy measures is to
develop the onshore market Accordingly policymakers strive to protect the advantages of
onshore market and at the same time develop and liberalise the onshore market to overcome
the gap vis-agrave-vis NDF markets in other aspects such as ease of access market infrastructure
and taxation There is of course the risk that participation of Indian banks will improve
76
liquidity in the NDF market and undermine the development of the onshore market Such
a situation will be challenging for implementing exchange rate management policy
Recommendation 3
The onshore Rupee derivatives market is currently more deep and liquid as compared to the
offshore Rupee market and participation of the Indian banks in the offshore market might over
time take away this advantage The TF feels that the downside of permitting Indian banks to deal
in the offshore Rupee derivative market outweighs the advantages and therefore recommends that
Indian banks should not be permitted to deal in the offshore Rupee derivative market for the
present
4 Requirement of underlying exposure and documentation therefor
There is no requirement of an underlying exposure to enter into a derivative contract in the offshore
Rupee derivative market Hence non-residents can freely trade in this market to hedge risk on an
underlying Rupee exposure or create exposure to Rupee However as per extant regulations non-
residents can enter into Rupee derivative contracts in the onshore market only for the purpose of
hedging risk arising from an underlying exposure Non-residents are classified into Foreign
Portfolio Investor (FPI) investors having Foreign Direct Investments Non-Resident Indian Non-
resident Exporters and Importers and Non-Resident lenders having ECBs designated in INR with
each category being subjected to a different set of rules for establishing underlying exposure
FPIs are allowed to hedge only on the basis of existence of underlying exposure with the hedge
size capped at the market value of investment in equity and debt in India as on a particular date
including any coupon receipts arising out of investment in debt securities falling due during the
following twelve months only The explicit mention of only equity and debt investments creates
regulatory ambiguity on hedging of other FPI exposures in India such as margin deposits cash
etc Hence any FPI having investment in India will be able to only buy USD forward against INR
onshore and will not be allowed to sell USD against INR in forward market as that would result in
increasing the exposure rather than hedging the exposure To prove the exposure a valuation
certificate is required to be provided by a designated AD bank (Custodian) as a proof of underlying
FPIs are also required to provide a declaration to the effect that their total outstanding hedges are
within the market value of their investments The only exception to establishing underlying
77
exposure requirement is dealing in exchange traded market where FPIs are allowed to take
positions without having to establish existence of underlying exposure up to USD 100 million
FDIs are allowed to hedge both their existing investment as well as proposed foreign direct
investments with the latter being allowed only after an AD bank ensures that all necessary
approvals for the investment have been obtained by the FDI With respect to non-resident
corporates users can hedge their exposures invoiced in INR and intercompany loans denominated
in INR (ECBs) They can book the hedge either directly with an AD bank in India or on a back-
to-back basis Prior to hedging they must furnish a declaration certifying that the underlying
exposure has not been hedged with any other AD bank(s) in India They are required to cancel the
hedge contract immediately if the underlying exposure is cancelled In case of a central treasury
an authorization from the entity having INR exposure to hedge on its behalf is also required
Irrespective of the category of the investor the requirement to establish underlying exposure
creates practical difficulties for many non-residents Funds who intend to execute macro hedge for
various schemes or MNC parents wanting to consolidate exposures across subsidiaries and
executing a single hedge find it easier to execute consolidated hedge in the offshore market Also
hedging of anticipated and economic exposures is not permitted
Recently the RBI has released11 draft regulation regarding risk management facilities for public
feedback The TF reviewed it in detail and also received feedback on it during interaction with
stakeholders The proposed regulation satisfactorily addresses a lot of pertinent issues Measures
on simplifying eligible underlying exposure criteria simplifying documentation requirement
flexibility to hedge dynamically ability to hedge anticipated exposures user classification (retail
and non-retail) and choice of products are welcome and much needed It is noted that the
requirement of having an underlying exposure for entering into Rupee derivative contract is
retained and it is felt that it is justified for effectiveness of exchange rate management policy and
ensuring financial stability Given that only hedging transactions are going to be permitted in the
onshore market there will remain a requirement to establish or declare existence of underlying
exposure to risk and also to ensure that notional of hedge contracts is in line with the value of
underlying exposure As discussed above such requirement acts as a deterrent for non-residents to
hedge in the onshore market It would be optimum if a solution can be found that fulfils the
11
Vide press release dated February 05 2019
78
requirement of verification of underlying exposure without the investors being required to
undertake the efforts to prove it This can be achieved by consolidating the existing data on
investments and hedge transactions residing with various regulated entities
Recommendation 4
The TF recommends that a technology-based solution be explored to centrally aggregate the
investments of non-residents and derivative contracts entered into by them in the onshore market
(both OTC and exchange traded) using LEI or any other unique identifier to start with ADs should
be allowed access to such aggregate data so that they can verify the quantum of derivative positions
and underlying investments of the non-residents This mechanism can potentially completely
remove the requirement of efforts from the non-residents to prove the existence of underlying
exposure to Rupee
Further to simplify procedures and provide ease of access to the exchange traded currency
derivative market the RBI has allowed users to enter exchange traded instruments (futures and
options) to take exposure up to USD 100 million without the requirement of establishing the
existence of underlying risk Such measures go a long way in encouraging users (especially
MSMEs) to hedge their exchange rate risk by making the process easier At the same time such
calibrated opening helps in addressing any concerns of systemic risk The TF feels that such an
incentive must be provided in the OTC market also as it will not only contribute to ease of doing
business but also to restore parity in regulation between OTC and exchange markets
Recommendation 5
While requirement of underlying exposure will continue for trading in the onshore market users
may be allowed to undertake positions up to USD 100 million in OTC as well as exchange traded
currency derivative market without having to establish the underlying exposure
5 Products
Non-residents can enter into only plain vanilla forwards and option contracts in the OTC foreign
exchange market Further swaps are restricted to specific case of IPO and non-resident lenders of
ECB denominated in INR Non-residents who prefer to express their hedge using structured
79
options necessarily need to execute in the offshore market as current regulations do not allow non-
residents to enter into structured options
Recommendation 6
The aforesaid draft regulation addresses this issue by allowing ADs to offer any product to the
non-residents (for non-retails users) which satisfies the purpose for which they are permitted to
enter into Rupee derivatives ie hedging of underlying exposure to Rupee In other words ADs
cannot offer any product that creates risk for the user instead of hedging the existing risk The TF
endorses this principle-based regulation approach
6 Restrictions on dynamic management of risk
Non-residents trading in the offshore market are free to cancel and rebook their trades depending
on their future expectations andor risk management policy On the other hand in the onshore
market non-residents in general are not allowed to rebook a contract once cancelled Only in the
case of FPIs rebooking up to 10 of the value of contracts cancelled is permitted Inability to
manage risk dynamically deters non-residents who look for flexibility while hedging their risks
The aforesaid draft regulation proposes to remove restrictions on rebooking of cancelled contracts
and thereby allow users to hedge dynamically For contracts entered into for hedging contracted
exposure gains (or losses) on cancellation will be passed on to the user as and when they accrue
but in case of contracts entered into for hedging anticipated exposures net gains will be transferred
only when the underlying cash flow has occurred The prime purpose of such stipulation is to curb
incentives for speculation by using the liberal position limits available under anticipated exposure
hedging However a consequent drawback is that in some instances eg contingent contracts
such as bidding for projects involving currency risk such a provision would not be equitable This
provision could be suitable amended to enable all types of hedging without compromising the
essential control that the cash flow requirement provides to ensure underlying in a hassle-free way
The TF is of the view that providing suitable discretion to banks to pass on net gains even without
cash flows in such cases would address this shortcoming This will ensure that genuine hedgers
80
will access the onshore market without worrying about retention of gains if underlying transaction
does not fructify due to reasons beyond their control
Recommendation 7
In line with the objective of bringing onshore market at par with offshore market the most obvious
path is to not have any restrictions on transfer of gains in case of anticipated exposure hedging
However a balancing act is necessary between liberalizing the market while preventing
speculative positions which can create undue volatility in the onshore market Keeping this in
mind while endorsing free dynamic hedging (without any restriction on cancellation and
rebooking) for hedging contracted exposure the TF recommends that in case of hedging of
anticipated exposures gains from cancellation of contract may be allowed to be passed on even in
cases where there are no cash flows at the discretion of the bank where the bank considers the
cancellation of underlying cash flow is due to external factors which are beyond the control of the
user
7 Gross settlement and credit risk management
In the case of offshore Rupee derivative market non-residents clear and settle OTC trades either
through a prime brokercustodian or bilaterally with the counterparty In both these cases the non-
residents usually execute a bilateral multi-currency master service agreement which includes
provisions for exchange of margin (ex- ISDA master agreement including Credit Support Annex)
with the counterparty These agreements necessitate periodic settlement of marked-to-market gains
and losses across products and provide the flexibility to net off losses against gains Hence these
agreements significantly lower credit charges and provide strong netting efficiency On the other
hand in the onshore market the non-residents in an otherwise identical situation will face
additional challenges in respect of settlement and exchange of margin due to the following reasons
Gross settlement of gains As mentioned above non-residents clear and settle OTC trades in the
offshore Rupee derivative market either through a prime broker or bilaterally with the
counterparty Typically they settle deal across assets and currencies with either of these entities
and are therefore able to net the cash flows and achieve efficiency in liquidity management
81
However as Rupee derivatives entered into in the onshore Rupee derivative market cannot be
settled under such overseas arrangements non-residents are unable to avail the benefits of netting
on their onshore transactions
Credit risk management Signing a master service agreement locally and establishing credit lines
with onshore banks increases the execution cost of hedging onshore Typically transactions of
non-residents in the offshore market are collateralized (through collateral exchange provisions
contained in the master service agreement) while those in the onshore market are non-
collateralized Depending on the credit rating of the non-resident the onshore banks may not
necessarily be open to providing exposurecredit limits on uncollateralized basis for entering into
deliverable contracts If a collateralized credit line is set up through a master service agreement
with provision for exchange of collateral in USD outside India restrictions under FEMA 1999 on
exchanging margin outside India by onshore banks poses issues If exchange of collateral is in INR
in India then the non-residents will have to either assume the exchange rate risk on the cash margin
deposited or will have to additionally hedge the margin money placed Moreover this attracts
regulatory ambiguity such as minimum tenor restrictions as per deposit regulations ability to
hedge the margin through FX swap interest to be paid on cash in SNRR account etc If interest
cannot be paid on the collateral placed with onshore counterparties it creates a strong economic
disincentive for the investor to hedge onshore
These issues can be addresses in two ways First facilitating the non-residents to utilize their
existing overseas custodianprime broker relationship and master service agreements for
settlement of their transactions onshore and exchange of collateral therefor Second by creating
the regulatory framework for exchange of margin for non-centrally cleared derivatives in India to
make it consistent with evolving clearing mechanism offshore Both the solutions are discussed
below
To help non-residents retain their economic neutrality with respect to the prevailing multi-currency
master service agreement executed offshore a central clearing and settlement mechanism may be
established for non-residentsrsquo deals with onshore counterparties along the lines of central clearing
and settlement of onshore interbank deals by the CCIL The overseas bank of the non-resident will
clear and settle the deals execute by them onshore To be sure the proposal is to introduce the
centralized clearing mechanism while retaining the existing bilateral settlement mechanism so that
82
investors who want to continue using it do not face disruption For the suggested central clearing
and settlement mechanism to be set up inter alia the following permissions would also be
required
i Permission under FEMA 1999 for CCIL to accept foreign currency denominated collateral
in India or outside India
ii Enhancement of CCILrsquos infrastructure to accept wide range of securities (foreign currency
cash securities issued by foreign governments etc) as collateral and
iii Other regulatory clearances required for non-residentsoverseas banks in other jurisdictions
to clear and settle through CCIL
Further back-to-back hedging by non-residents proposed in the aforesaid draft regulation will also
allow effective utilization of their prevailing multi-currency CSA arrangement offshore This
entails allowing non-residents to hedge their exposure with their banking counterpart overseas
which in turn will hedge the position back-to-back with an onshore bank This ensures that existing
dealing arrangements between non-residents and their overseas counterparties remain unchanged
but at the same time the market risk gets transferred to onshore banks and hence is managed locally
The overseas bank should be allowed to settle the onshore leg either bilaterally with the onshore
bank or through the proposed central clearing and settlement mechanism Also this will require
permissibility under FEMA 1999 to exchange margin with the overseas banker of non-residents
outside India In such a model the approach should be to recognize the intermediary offshore bank
as a facilitator purely for the convenience of the non-resident investor Experience from other
markets that have implemented such models like Malaysia and China suggest that putting the onus
of monitoring compliance in terms of quantum of hedge underlying documentation etc on the
intermediary bank is inefficient Such a requirement leads to the intermediary bank asking for
various indemnities from the client and these are often difficult and time consuming to negotiate
and sign The approach should be to monitor compliance by the non-residents as the regulated user
using available onshore infrastructure as well use of technology solutions to track the hedges vis-
a-vis underlying exposure as detailed in recommendation 5
With regard to regulation and infrastructure for exchange of margin for non-centrally cleared
derivatives in India the RBI released a discussion paper on this issue in May 2016 However the
final directions have not been issues yet It is understood that ambiguity in netting legislation is
83
one of the main issues holding the release of these directions Also it is understood that the GoI is
in the process of making legislative changes to address this issue
Recommendation 8
For ease of entering into hedge transactions for non-residents the TF recommends-
i Establishment of a central clearing and settlement mechanism for non-residentsrsquo deals in the
onshore market
ii Back-to-back hedging by non-residents proposed under the draft regulation is endorsed The
overseas bank should be allowed to settle the onshore leg either bilaterally with the onshore bank
or through the proposed central clearing and settlement mechanism
iii Implementation of margin requirement for non-centrally cleared OTC derivatives in the
onshore market at the earliest
iv Allowing Indian banks to post margin outside India This is not only relevant for credit risk
management for their transactions with non-resident users but also for their cross-border inter-
bank transactions
8 Taxation
Under the extant regulatory framework non-residents are permitted to enter into Rupee derivative
contracts only for hedging risk on their investmentslendingtrade in India As per discussions with
stakeholders the following position is generally adopted with regard to the gains from such
contracts
bull Where currencies under the contract are delivered ndash Not a taxable event (ie conversion of
one currency into another does not give rise to taxable income)
bull Where contract is cancelled and price difference is settled ndash If the derivative contract is
entered into for hedging exchange rate risk on a capital asset then gains on cancellation are
treated as capital gains If it is entered into for hedging exchange rate risk in relation to a
tradingbusiness asset such gains are treated as business profits
84
However it is understood that there is ambiguity in the rules in this connection and the position
taken by the Assessing Officers (AOs) differs between zones and is at variance with the aforesaid
position Oftentimes such gains on cancellation are treated as lsquoOther Incomersquo or lsquoSpeculation
Business Profitsrsquo During interaction with the non-residents it was suggested that such uncertainty
of tax treatment is one of the prime reasons why they do not access the onshore market and instead
hedge Rupee exposures in the off-shore market
Recommendation 9
The TF recommends that the competent authorities may examine the issue of taxation in respect
of foreign exchange derivative contracts with the objective of overcoming gaps between tax regime
in India and other major international financial centres (Singapore Hong Kong and London) to
the extent possible and thereby incentivizing non-residents to hedge in the onshore market
9 Allow non-deliverable Rupee derivatives in the IFSC and permit IBUs to deal in such
derivatives
The proposition of introducing non-deliverable Rupee derivatives in the IFSC and permitting
banks (IFSC Business Units or IBUs) to deal in such derivatives is discussed in detail in Chapter
4 While there are concerns around impact on the onshore market due to trading in Rupee
derivatives in the IFSC there are potential benefits in terms of IFSCrsquos ability to offer complete
bouquet of financial services and availability of market information to all stakeholders Further
given Indiarsquos economic growth it may be appropriate to prepare for greater financial integration
with the rest of the world Sequencing and timing of measures relating to currency markets is a
critical component of such integration Although at the moment there is no definite path ahead in
terms of such integration but a thriving Rupee market in the IFSC may provide a system which
can be leveraged towards this end in the way and manner deemed fit in future IFSC being outside
the capital controls provides an opportunity to policymakers to test new regimes and products in
an environment whose repercussions may not significantly impact the stability or efficiency of the
onshore system On balance the TF is of the view that non-deliverable Rupee derivatives may be
introduced in the IFSC However a phased approach may be adopted and to start with trading
may be permitted only on exchanges due to the inherent transparency and risk management
85
benefits offered by it Introducing OTC contracts may be considered at a later stage after the
experience gained from trading on exchanges RBI may in its Financial Stability report assess the
impact of the functioning of IFSC on the financial stability of the country
Further the TF is of the view that entities regulated and permitted by the RBI may be permitted to
make market and run positions in Rupee derivatives market in the IFSC In order to prevent spill
over of risks from IFSC to onshore market though these entities a distinct net open position limit
may be stipulated for their operations in the IFSC In other words the open positions of entities
operating in the IFSC should not be permitted to be netted off with their open position the onshore
market
Recommendation 10
The TF recommends that non-deliverable Rupee derivatives (with settlement in foreign currency)
may be allowed to be traded in the IFSC and IBUs may be allowed to deal in such derivatives with
a distinct FCY-INR position limit To start with exchange traded currency derivatives involving
Rupee may be introduced and with experience non-deliverable OTC currency derivatives
involving Rupee may also be allowed
10 KYC process
The extant directions issued by the Reserve Bank of India stipulates the documents required for
conducting KYC process to open accounts of non-residents Similarly SEBI has also prescribed
documents required for the granting of FPI license by Domestic Depository Participants (DDP)
Further KYC documents for FPIs are available to SEBI regulated entities through KRAs subject
to approval from either the FPIs or the domestic custodians Since access to KRAs is available
only to SEBI regulated entities most banks are not allowed to access KRA and hence seek
complete documentation from FPIs again Such repetitive submission of documents to various
financial intermediaries results in long lead time for on-boarding and makes the entire process
operationally cumbersome for non-residents
Recommendation 11
The TF recommends that the KYC registration may be centralized across the financial market with
uniform documentation requirement All regulated financial market intermediaries should be
provided access to the centralized registry and they should be allowed to rely on online registry
86
for confirmation that KYC has been completed and itrsquos valid This will ensure that non-residents
undertake the KYC process only once and not with each financial intermediary that they deal with
in the onshore market Also such a mechanism offers cost and efficiency benefits for the financial
intermediaries
87
Annexure I
Key features of currency market of major EMEs
I USD-RMB Market ndash China
Onshore Deliverable - CNY Offshore Deliverable - CNH
Market
Turnover
Daily average turnover USD 28
billion
Daily average swap and
forward turnover
USD 62
billion
Daily average options
turnover
USD 15
billion
Daily average
turnover
USD 15-20
billion
Daily average
forward turnover
USD 25-30
billion
Daily average
Options turnover
USD 5-6 billion
Spot foreign
exchange Onshore CNY foreign exchange spot is
available with documentary proof of an
underlying transaction
Participating banks in Hong Kong
provide two types of spot RMB
exchange rate transactions
- For trade service and direct
investment purposes where
resulting foreign exchange
positions can be offset with the
clearing bank or onshore
correspondent banks and
For general purposes where banks need
to warehouse the risk or offset the
position in the interbank USD-CNH
market Forward
FXSwaps CNY forwards and foreign exchange
swaps with maturities of up to five years
are available to onshore institutions to
hedge foreign exchange exposure
subject to documentary proof of the
same
Most liquid is in the tenor of one year or less
CNH deliverable offshore forwards
are available out to five years
Liquidity has improved significantly
and has surpassed turnover in the
NDF market
FX Options Onshore market participants can buy or
sell common European options of CNY
against foreign currencies on a real
needs basis
Tenors are available out to three years
with further tenors on a case-by-case
basis Most liquid is in the tenor of one
year or less
The State Administration of Foreign
Exchange (SAFE) started allowing
corporates to sell FX options from August
2014 on a real needs basis and with net
settlement allowed
Deliverable CNH options are
available without restrictions to any
non-individual counterparty that has
a physical CNH Nostro account in
Hong Kong
Options on USD-CNH and CNH crosses
are available out to five years and
beyond on a case-by-case basis
88
Access to
domestic
participants
On the current account the CNY is
convertible subject to genuine
documentation Onshore entities can
access the local forwards market
provided these contracts are used to
cover current account transactions
subject to documentary proof available
on settlement
On capital account CNY conversions
may be settled by way of voluntary
settlement in banks if these are required
in the Companiesrsquo institutionsrsquo actual
business operation Typically all capital
account transactions need to be
registered with SAFE for local forwards
Not easily accessible to onshore
residents approvals required for transfer
of funds from Onshore to Offshore
Access to
Offshore
participants
Qualified
Foreign
Institutional
Investor
All allowed subject to
principle of actual
needs (Quota
restrictions exists
on underlying
investments)
Can trade via their
custodian or domestic
financial institution
Central
Banks
No quota restrictions
ability to trade as
interbank counterparty
in the domestic market
ndash bilateral or
anonymous trading
China
Interbank
Bond market
(CIBM)Bond
Connect
For OIIs (Overseas
Institutional Investors)
accessing making
CIBM investment can
enter
into all FX products on
actual needs basis with
settlement agent banks
Change in CIBM
investment position
requires adjustment to
the FX hedges within
5 working days
All customers can open a RMB account
in Hong Kong Banks can provide
customers with general purpose RMB
accounts which allow free transfers of
funds (offshore) for any purpose In
general all FX products are allowed in
CNH for offshore investors
Trading
Hours 10 AM ndash 4 PM Local China Hours 10 AM ndash 4 PM Local China Hours
89
II USD-KRW Market - Korea
Features Onshore Deliverable Offshore Non-Deliverable
Market Turnover Average daily turnover
USD
Billion
Spot Forward Swaps
2011 191 75 192
2012 180 66 198
2013 183 71 196
2014 175 76 190
2015 200 83 192
2016 194 96 184
2017 196 101 198 Source Bank of Korea
As per London clearing house
(LCH) Ltd the daily turnover of
NDF cleared by them on April
16 2019 is a total of USD 119
billion (Source LCH)
As per SEF turnover as on April
12 2019 is USD 379 million
(Source SEF)
Daily NDF turnover has
increased from USD 195 billion
in 2013 to USD 30 billion in
2016 (Source BIS 2016 survey)
Access to
domestic
participants
Residents can hold unlimited
amounts of foreign currency in
foreign currency bank accounts and
Korean firms can maintain foreign
currency accounts abroad
Financial institutional investors
have access to the local forwards
market and can hedge their
investment exposure without
confirming the lsquoexistencersquo of the
investment
Forward position limits of foreign
bank branches (FBBs) and local
banks registered as FX Banks in
Korea as below
- For FBBs positions are
capped at 200 per cent of the
previous month-end equity
capital
- For local banks forward
positions are capped at 40 per
cent of the previous month-
end equity capital
- Corporate customer foreign
currency hedging limits are
100 per cent of customersrsquo
exposure or their transaction
of underlying real assets
Residents may hold foreign
currency accounts domestically
or abroad
Corporate investors and
individual investors are required
to confirm the existence of the
investment
In the case of capital or current
account transactions domestic
residents can remit up to USD 50
000 per year freely
Access to
Offshore
participants
Non-residents can hold KRW
locally through bank accounts
Foreign investors must open special
investment purpose accounts
No restrictions and BoK does not
regulate the same
90
Source Bank of Korea BIS HSBC Research
which consist of an exclusive
external account for investment and
an exclusive non-resident domestic
currency account for investment
Foreign investors are allowed to
freely convert foreign currency into
KRW without any underlying
securities purchases while the
converted funds are being
transferred within exclusive
external investment accounts
However the converted funds in
the exclusive external account for
investment should still be used for
the purpose of securities
investment
Non-Resident Investors holding
Investment Registration Certificates
(IRC) sale proceeds from the
investment in securities can be
freely repatriated
Central Bank
intervention
BOK is now releasing a quarterly
intervention report on a net basis
They generally only comment that
they intervene only in exceptional
basis for smoothing operations
Bank of Korea does not access the
NDF market
Trading Hours 9 AM ndash 330 PM local Korea time Available through time zones
Taxation and
Repatriation of
FX Gains
All gains on unwind of deliverable
transactions are freely repatriable
without any tax
All gains on unwind of non-
deliverable transactions with
onshore banks are freely repatriable
without any tax
91
III USD-MYR Market ndash Malaysia
Onshore Deliverable Offshore Non-Deliverable
Market Turnover - Daily inter-bank market USDMYR
spot turnover around $500 million
- Daily inter-bank market USDMYR
swap turnover around $30 billion
- As per LCH Ltd UK Clearing
house the daily turnover of
USDMYR NDF cleared by them
on April 16 2019 is a total of
USD 332 million from 82 trades
(LCH website)
- As per SEF a trading platform
USDMYR turnover as on April
12 2019 is USD 205 million
from 18 trades (SEF website)
- As per the Hong Kong exchange
the NDF turnovers in 2016 were
around USD 50 billion and have
reduced to approximately USD
20 billion in 2018 (HKMA NDF
report 2018)
Access to Domestic
participants
- Resident counterparties such as
importers and exporters can use
currency options and forward
contracts to manage their foreign
exchange risk
- Residents are allowed to enter into
hedging arrangements on committed
current account transactions and
financial account transactions
- All forward contracts must be
supported by an underlying trade or
capital account-related transaction
allowed under the Foreign Exchange
Administration Rules
- Residents are allowed to freely
hedge and un-hedge their foreign
currency exposure for USD-MYR
CNH-MYR GBP-MYR EURMYR
and JPY-MYR currency pairs
without documentary evidence up to
an aggregate net open position of
MYR 6 million per bank
Not allowed
Access to Offshore
participants
- Licensed onshore banks and
approved investment banks are
allowed to enter into FX forward
Open and not regulated by the
central bank
92
Source Bank Negara Malaysia BIS HSBC Research
contracts with non-residents as
follows
Forward FX purchase or sale
contracts against MYR for
current account transactions
Forward FX purchase or sale
contracts against MYR based on
committed purchases or sales of
MYR assets The forward
contracts can be entered into at
the point when the non-resident
commits to purchase or sell the
MYR assets
- Dynamic hedging programme offers
flexibility to actively manage FX risk
exposure via forward hedging
activities with onshore banks or
Appointed Overseas Office (AOO)
without any documentation
CCP used Malaysian Exchange Not mandatory but LCH used
regularly
Central Bank
intervention
Through appointed agent banks Not applicable
Fixing to settle
NDF
NA KL USDMYR Reference rate
Trading Hours - Trading hour is 9 AM to 6 PM Local
Time Limited FX liquidity
available for non-residents post local
trading hours
- USDMYR is also quoted by
appointed overseas offices for spot
value only for any underlying asset
trades - post local trading hours No
forward prices are quoted
Quoted across time zones
Taxation and
Repatriation of FX
Gains
All gains on cancelled FX Contracts
are freely repatriable and do not
attract taxation in Malaysia
Taxed based on jurisdiction
93
IV USD-IDR Market - Indonesia
Onshore Deliverable Offshore Non-Deliverable Onshore Non-Deliverable
Market
Turnover
Average
daily spot
turnovers
USD 1bn
Average
daily swap
turnovers
USD 500
million
As per LCH Ltd - the
daily turnover of
USDIDR NDF cleared
by them on April 16
2019 is a total of USD
41 billion from 832
trades
As per SEF USDIDR
turnover as on April 12
2019 is USD 33 million
from 11 trades (Source
SEF)
As per HKTR Jan 2018
reporting the outstanding
IDR NDF turnover on
the Hong Kong exchange
of is around USD 40
billion (Source HKMA
NDF report 2018)
NDF
average size
USD 5m
Access to
Domestic
participants
Foreign currency against IDR
transactions between banks and
domestic parties over a certain
amount must have an underlying
transaction
Not Allowed Allowed but will need to
demonstrate underlying
documents
Access to
Offshore
participants
Non-residents must have
underlying IDR
assetliabilityreceivablepayable
to be able to enter into IDR cash
FX andor FX hedge BI list all the
permissible underlying activities
along with recommended
documentation format
Open and not regulated by
Bank Indonesia
Allowed but will need to
demonstrate underlying
documents
BI published a more-
stringent list of
permissible underlying
activities
Benefits Pricing uses onshore-curve
driven by onshore participants
and BI intervention
Not regulated and no
need for underlying
documentation
Prices available across
time zones
Can generated IDR
exposures without
having an underlying
asset in IDR
Pricing uses onshore-
curve driven by onshore
participants and BI
intervention (explanation
below) BI appears to
have a much bigger-
capacity to manage since
the product is net-settled
in IDR
94
Source Bank Indonesia BIS HSBC Research
Clients with IDR FX
exposure but no urgent
need for principal-
exchange As example
long-term IDR bond
investors
Limitations Requirement for underlying
docs limit the maximum
exposure that foreign Clients
can take
BI restricts Domestic Banks
from having residual-risk
when dealing Derivatives with
Related-Parties (locally
incorporated banks only)
Convertibility risk Requirement for
underlying docs limit the
maximum exposure
Foreign Clients can take
Clients with actual need
for principal-exchange
due to basis-risk between
[JISDOR fixing] vs
[actual FX rate] eg
Coupon repatriation and
BI restricts domestic
banks from having
residual-risk when
dealing derivatives with
related parties (locally
incorporated banks only)
Central
Bank
intervention
BI intervenes only in the onshore
market via Cash FX Onshore DF
and Onshore DNDF These can
be done via auctions or bilateral
OTC trades as there is no
onshore futures market for IDR
Bank Indonesia does not
access the NDF market
BI has the ability to intervene
in the DNDF market
although the market is very
new
Fixing to
settle NDF
Not Applicable JISDOR (USD-IDR)
JISDOR (USD-IDR)
Trading
Hours
Trading hours is from 8 AM ndash
12 PM Local Time and 1 PM
ndash 4 PM (Market breaks for
lunch between 12 PM ndash 1
PM)
USD-IDR is also quoted by
banks offshore for Spot value
only for any underlying asset
trades post local trading hours
No Forward prices are quoted
Quoted across time zones 8 AM ndash 12 PM Local
Time 1 PM ndash 4 PM
(Market breaks for lunch
between 12 PM ndash 1 PM)
Taxation
and
Repatriation
of FX Gains
As per market practice gains on
any unwindcancellation of FX
hedges are not passed to Non-
Residents
Taxed as per jurisdiction As per market practice gains
on any unwindcancellation
of FX hedges are not passed
to Non-Residents
95
V USD-BRL Market - Brazil
Features Onshore Deliverable Offshore Non-Deliverable
Market Features Average daily spot USD 8 billion
Onshore B3 USD 14 billion
Average daily options
turnovers
USD 15 billion
Offshore NDF
turnover daily
USD 4
billion
Market Hours Market hours is 0900 to 1800 Hours
However liquidity is highest between 10
am ndash 12 pm and 2 pm ndash 4 pm local
hours
96
VI USD-TWD Market - Taiwan
Features Onshore Deliverable Offshore Non-Deliverable
Market
Features Average Daily
Spot
Turnovers
USD 3-4 billion
Average Daily
Swap
turnovers
USD 2-3 billion
Average
Options
Turnovers
USD 150 million
Average daily
turnovers
USD 2-4 billion
Market
Turnovers
- Onshore total Spot turnovers in
USDTWD for March 2019 were USD
31560 billion (Average daily turnover of
~ USD 10 billion)
- Data related to USDTWD swaps is not
readily available but total swaps amp
forwards dealt onshore (across currency
pairs) is ~ 5750 of the FX turnovers
USD 11504 billion in April 2016 (last
available data) [Source BIS]
Access to
Domestic
participants
There are no limits on the TWDrsquos trading
range versus other currencies but there are
convertibility limits on the capital account
- Access to domestic participants are
not allowed
- Local banksrsquo overseas branches to
participate in the TWD NDF
market These banks will also be
subject to the existing cap on net
NDF positions at 20 per cent of
each bankrsquos FX position (last
revised lower from 33 per cent in
December 2010)
Access to
Offshore
participants
Non-Resident
Foreign investors are allowed to enter
into onshore swapforward contracts for
hedging underlying investment in
Taiwan
FINIs (Foreign Institutional Investors)
can only conduct buy USDsell TWD
contract and the total contract amount
entered into by a foreign investor should
not exceed FINIs USD and TWD net
remitted-in capital (ie total remitted-in
funds minus total remitted-out funds)
Access to foreign exchange is divided
into three categories
- import and export
Open and not regulated by the central
bank
97
- cost of trade-related services
- Investments capital repatriation and
dividends
Currency options are permitted
For FINIsFIDIs all transactions must be
documented regardless of the amount
On the maturity of FX forward (or
forward leg of a swap deal) FINI may
have the following decisions
- To settle the contract on the maturity
day as originally dealt In this case
FINI needs to ensure sufficiency of
existing account balance That is
settlement of FX forward should
come from the existing funds in
Taiwan or funds from sale proceeds
of underlying investments
- To extend (ie rollover) the contract
to another period in this case on the
maturity day FINI has to settle the
difference between the original
forward contract rate and the mark-
to-market rate
If FINI rollovers the contract upon
maturity and incurs a gain upon rollover
the gain will be credited to the FINIs
account in Taiwan Such gain will be
treated as other income derived in
Taiwan
CCP used Taipei Exchange (TPEx) acts as the Central
Counter Party for and also covers all foreign
exchange transactions made by authorized
foreign exchange banks and offshore banking
units
Not mandatory but LCH used regularly
Central Bank
intervention
Central bankrsquos FX intervention is via agent
banks in the OTC market where onshore
TWD is traded One of the mechanisms
through which local currency pressure is
absorbed is through modulation of hedge
ratio of Lifers
Not applicable
Fixing to
settle NDF
NA Central bankrsquos FX intervention is via
agent banks in the OTC market where
onshore TWD is traded
Bloomberg TRY11ltIndexgt
Trading
Hours
- 9 AM ndash 4 PM Local Time
- Market breaks for lunch at 12 PM ndash 2 PM
Quoted across time zones
98
Source CBC BIS HSBC Research
Taxation and
Repatriation
of FX Gains
If FINI rollovers the contract upon
maturity and incurs a gain upon rollover
the gain will be credited to the FINIs
account in Taiwan Such gain will be
treated as other income derived in
Taiwan and therefore subject to 20
standard withholding tax In case that FX
loss incurs due to rollover FINI may
arrange funding to cover the loss if
necessary
FINI can choose one of the following
methods to calculate and pay for the
relevant tax Please however note that
the method is not changeable once it is
decided If FINI does not confirm which
method to be used the option 1) will be
applied
- Withhold related tax on FX gain
from each rollover or
- Netting FX gainslosses from
rollover within the same year or
- Netting FX gainslosses from
rollover and the total remitted-in
principals revaluation gainloss in
the year
If the foreign investor adopts option 2) or
3) above they must appoint or contact
their existing local tax agent (if any) in
Taiwan to file annual tax return
Taxed based on jurisdiction
99
Annexure II
Appendix to Chapter 3
A bivariate BEKK-GARCH (11) model as proposed by Engle and Kroner (1995) can be specified with
the system of conditional mean equations consists of VAR(p) models (p = 1 n) as given in eq (1) and
variance equation as in eq(2)
119884119905 = 120583 + sum Γ119894119884119905minus119894 + 120576119905119901119894=1 (1)
where 119884119905 = (1199101119905 1199102119905) 1199101119905 is exchange rate return in onshore market and 1199102119905 is exchange rate return in
offshore market at time t The parameter vector 120583 = (1205831 1205832) represents constants and Γ is a 2times2 matrix of
autoregressive terms The diagonal elements 120574119894119894 measure own lagged effect of the variables while the off-
diagonal elements 120574119894119895 capture the mean spillover from variable i to variable j
Taking into account the asymmetric responses of volatility ie volatility tends to increase more in response
to negative shocks (bad news) than positive shocks (good news) in the variances and covariances as
proposed by Kroner and Ng (1998) a BEKK representation of conditional variance equation can be written
as
119867119905 = 119862prime119862 + 119860prime120576119905minus1prime 120576119905minus1119860 + 119861prime119867119905minus1119861 + 119863prime120585119905minus1
prime 120585119905minus1119863 (2)
where 120585119905 would be 120576119905 if it is negative and zero otherwise The Eq (2) can be written in matrix form as
follows
119867119905 = [11988811 011988821 11988822
] + [11988611 11988612
11988621 11988622]
prime
[1205761119905minus1
2 1205761119905minus11205762119905minus1
1205762119905minus11205761119905minus1 1205762119905minus12 ] [
11988611 11988612
11988621 11988622]
+ [11988711 11988712
11988721 11988722]
prime
[ℎ11119905minus1 ℎ12119905minus1
ℎ21119905minus1 ℎ22119905minus1] [
11988711 11988712
11988721 11988722]
+ [11988911 11988912
11988921 11988922]
prime
[1205851119905minus1
2 1205851119905minus11205852119905minus1
1205852119905minus11205851119905minus1 1205852119905minus12 ] [
11988911 11988912
11988921 11988922]
In the above model the dynamic process of 119867119905 is a linear function of its own lagged values lagged squared
innovations and the cross-product of the innovations and asymmetric terms Volatility transmission
channel between onshore and offshore markets is represented by the off-diagonal parameters in matrices A
and B while the diagonal parameters in those matrices capture the effects of their own past shocks and
volatility The diagonal parameters in matrix D measure the response own past negative shocks while the
100
off-diagonal parameters 119889119894119895 show the response of one market to the negative shocks in the another market
to be called the cross-market asymmetric responses
MGARCH-BEKK Parameter Estimates
Spot and 1-Month NDF 1-Month Forward and NDF 1-Month Futures and NDF
Variable Coeff P-value Variable Coeff P-value Variable Coeff P-value
Mean Equation
DSPOT(-1) -063 000 DFW1M(-1) -064 000 DFUT1M(-1) -063 000
DSPOT(-2) -052 000 DFW1M(-2) -054 000 DFUT1M(-2) -053 000
DSPOT(-3) -031 000 DFW1M(-3) -033 000 DFUT1M(-3) -033 000
DSPOT(-4) -015 000 DFW1M(-4) -018 000 DFUT1M(-4) -019 000
DSPOT(-5) -010 000 DFW1M(-5) -012 000 DFUT1M(-5) -010 000
DNDF1M(-1) 062 000 DNDF1M(-1) 063 000 DNDF1M(-1) 062 000
DNDF1M(-2) 047 000 DNDF1M(-2) 049 000 DNDF1M(-2) 048 000
DNDF1M(-3) 030 000 DNDF1M(-3) 033 000 DNDF1M(-3) 035 000
DNDF1M(-4) 022 000 DNDF1M(-4) 023 000 DNDF1M(-4) 027 000
DNDF1M(-5) 013 000 DNDF1M(-5) 015 000 DNDF1M(-5) 016 000
Constant 001 029 Constant 001 003 Constant 001 013
DSPOT(-1) 013 000 DFW1M(-1) 013 000 DFUT1M(-1) 011 001
DSPOT(-2) 003 053 DFW1M(-2) 002 046 DFUT1M(-2) 000 098
DSPOT(-3) 005 042 DFW1M(-3) 003 033 DFUT1M(-3) 002 064
DSPOT(-4) 005 033 DFW1M(-4) 005 015 DFUT1M(-4) 004 041
DSPOT(-5) 002 067 DFW1M(-5) 001 068 DFUT1M(-5) 002 058
DNDF1M(-1) -009 000 DNDF1M(-1) -009 000 DNDF1M(-1) -009 001
DNDF1M(-2) -007 015 DNDF1M(-2) -007 003 DNDF1M(-2) -005 022
DNDF1M(-3) -005 033 DNDF1M(-3) -004 012 DNDF1M(-3) -002 065
DNDF1M(-4) 001 086 DNDF1M(-4) 001 076 DNDF1M(-4) 003 052
DNDF1M(-5) 001 079 DNDF1M(-5) 002 052 DNDF1M(-5) 001 067
Constant 001 038 Constant 001 011 Constant 001 017
Variance Equation
C(11) 005 000 C(11) 005 000 C(11) 003 000
C(21) 005 000 C(21) 005 000 C(21) 003 000
C(22) -001 004 C(22) 001 000 C(22) 005 000
A(11) 027 000 A(11) 027 000 A(11) 014 000
A(12) 004 042 A(12) 005 032 A(12) -012 004
A(21) -004 029 A(21) -004 034 A(21) 007 010
A(22) 019 000 A(22) 018 000 A(22) 029 000
B(11) 096 000 B(11) 096 000 B(11) 098 000
B(12) -001 020 B(12) -002 003 B(12) 003 004
B(21) 001 037 B(21) 001 029 B(21) -001 048
B(22) 098 000 B(22) 098 000 B(22) 094 000
D(11) -023 001 D(11) 027 000 D(11) 020 001
101
D(12) -037 000 D(12) 035 000 D(12) 024 000
D(21) 022 000 D(21) -025 000 D(21) -016 000
D(22) 028 000 D(22) -028 000 D(22) -012 006
102
Annexure III
Evolution of Onshore Exchange Traded Currency Derivatives Market
Exchange Traded Currency Derivatives (ETCD) were launched in August 2008 in India with the
introduction of futures contracts on US Dollar-Rupee currency pair as the underlying
Subsequently in the year 2010 Rupee future contracts were allowed to trade against three other
currencies viz Euro Pound sterling and Japanese yen The options contracts were introduced on
US Dollar-Rupee currency pair in year 2010 The Reserve Bank of India (RBI) and Securities
Exchange Board of India (SEBI) allowed participation for all resident individuals including
corporates Trading Members and Banks in proprietary capacity on ETCD
In the year 2012 it was decided to lower the open position limits for banks on the back of volatility
in rupee and to exclude the positions in ETCD from Net Overnight Open Position Limit (NOOPL)
Thereafter in the year 2013 the Rupee depreciated sharply against USD due to huge capital
outflows in both equity and debt markets expectation of unwinding of Quantitative Easing by US
FED and increase in current account deficit Additionally the open position limits for the
participants were decreased and banks were restricted from participating on their own accounts in
the ETCD market further the participants were also prohibited from taking positions beyond
USD 10 million
In June 2014 Banks were allowed to engage in proprietary trading in ETCD markets Domestic
participants were allowed to have open position beyond USD 15 million subject to the evidence
of underlying exposure In 2018 this limit was raised to USD 100 million across all currency pairs
involving INR put together and combined across all exchanges
Foreign Portfolio Investors (FPI) and Non-Resident Indians (NRIs) were permitted to participate
in ETCD markets for hedging currency risk arising out of their investments in India in 2014 and
2017 respectively In February 2018 SEBI and RBI permitted currency derivatives on cross
currency pairs - EURUSD GBPUSD and USDJPY- and currency options on EURINR GBPINR
and JPYINR In December 2018 weekly options on US Dollar - Indian Rupee currency pair were
permitted As on date derivatives are available on seven currency pairs - USDINR EURINR
GBPINR JPYINR EURUSD GBPUSD and USDJPY
103
The exchange traded currency derivatives draws participation from diverse categories of
participants Some of the key participant categories include banks corporates trading members
foreign investors and other investors The following are the turnover of exchanges
FY National Stock Exchange of India (All figures in USD billions)
USD-INR futures USD-INR Options
(Notional turnover)
USD-INR Options
(Premium )
2014-15 32630 12618 052
2015-16 37374 26600 092
2016-17 31887 35271 107
2017-18 33818 37714 117
2018-19 57913 54183 204
FY
BSE (All figures in USD billions)
USD-INR futures USD-INR Options
(Notional turnover)
USD-INR Options
(Premium)
2014-15 20740 9609 081
2015-16 27713 13772 044
2016-17 27521 21034 045
2017-18 30146 37552 041
2018-19 45956 59350 051
FY Metropolitan Stock Exchange of India (All figures in USD billions)
USD-INR futures USD-INR Options
( Notional turnover )
USD-INR Options
( Premium )
2014-15 18274 593 593
2015-16 8433 646 646
2016-17 8233 367 367
2017-18 3032 491 491
2018-19 1060 245 245
104
Present Regulatory Framework (client limits open interest limits need for underlying
exposure etc)
a) Position limits for different client categories for FCY-INR currency pairs
bull Position limits of clients and Category III FPIs- The gross open positions of the client
across all contracts in the respective currency pairs shall not exceed the limits as mentioned
below
Currency Pairs
Position limits
USD-INR Gross open position across all contracts shall not exceed
6 of the total open interest or USD 10 million whichever
is higher
EUR-INR Gross open position across all contracts shall not exceed
6 of the total open interest or EUR 5 million whichever
is higher
GBP-INR Gross open position across all contracts shall not exceed
6 of the total open interest or GBP 5 million whichever
is higher
JPY-INR Gross open position across all contracts shall not exceed
6 of the total open interest or JPY 200 million whichever
is higher
bull Proprietary position limits of non-bank stock brokers- The gross open positions of the
proprietary account across all contracts in the respective currency pairs shall not exceed
the limits as mentioned below
Currency Pairs
Position limits
USD-INR Gross open position across all contracts shall not exceed 15
of the total open interest or USD 50 million whichever is
higher
EUR-INR Gross open position across all contracts shall not exceed 15
of the total open interest or EUR 25 million whichever is
higher
GBP-INR Gross open position across all contracts shall not exceed 15
of the total open interest or GBP 25 million whichever is
higher
JPY-INR Gross open position across all contracts shall not exceed 15
of the total open interest or JPY 1000 million whichever is
higher
105
bull Position limits of stock brokers (bank and non-bank) Category I and II FPIs- The
gross open positions of trading members across all contracts in the respective currency
pairs shall not exceed the limits as mentioned below
Currency Pairs
Position limits
USD-INR Gross open position across all contracts shall not exceed
15 of the total open interest or USD 100 million
whichever is higher
EUR-INR Gross open position across all contracts shall not exceed
15 of the total open interest or EUR 50 million whichever
is higher
GBP-INR Gross open position across all contracts shall not exceed
15 of the total open interest or GBP 50 million whichever
is higher
JPY-INR Gross open position across all contracts shall not exceed
15 of the total open interest or JPY 2000 million
whichever is higher
Domestic clients shall ensure that the position across exchanges is within the prescribed
limit of USD 100 million equivalent If position is in excess of USD 100 million
equivalent clients are required to provide disclosure of underlying exposure to Trading
Member as per existing practice
bull Proprietary positions created in FCY-INR pairs (USD-INR EUR-INR GBP-INR
and JPY-INR)
Single INR limit for proprietary
position for bank stock broker
Single INR limit for proprietary
position for non-bank stock broker
Higher of 15 of total OI across all
FCY- INR pairs or USD 200 million
Higher of 15 of total OI across all
FCY-INR pairs or USD 100 million
b) Position limit for Cross Currency Derivatives are given below
bull Position limits for stock brokers (banks and non-bank) Category I amp II FPIs
Domestic Institutional investors (DIIs) as permitted by the respective sectoral
regulators and AD Category-I banks-
106
Currency Pairs
Position limits
EUR-USD Gross open position across all contracts shall not
exceed 15 of the total open interest or EUR 100
million whichever is higher
GBP-USD Gross open position across all contracts shall not
exceed 15 of the total open interest or GBP 100
million whichever is higher
USD-JPY Gross open position across all contracts shall not
exceed 15 of the total open interest or USD 100
million whichever is higher
The aforementioned limits shall be the total limits available to the stock brokers for
taking positions on proprietary basis and for positions of their clients
bull Position limit for proprietary position of non-bank stock brokers-
Currency Pairs
Position limits
EUR-USD Gross open position across all contracts shall not
exceed 15 of the total open interest or EUR 50
million whichever is higher
GBP-USD Gross open position across all contracts shall not
exceed 15 of the total open interest or GBP 50
million whichever is higher
USD-JPY Gross open position across all contracts shall not
exceed 15 of the total open interest or USD 50
million whichever is higher
bull Position limits for Clients and Category III FPIs-
Currency Pairs
Position limits
EUR-USD Gross open position across all contracts shall not
exceed 6 of the total open interest or EUR 10
million whichever is higher
GBP-USD Gross open position across all contracts shall not
exceed 6 of the total open interest or GBP 10
million whichever is higher
USD-JPY Gross open position across all contracts shall not
exceed 6 of the total open interest or USD 10
million whichever is higher
107
Annexure IV
Comparison of onshore and offshore Rupee derivatives volumes
1 Exchange Traded Market
All figures in USD billions
Table Comparison between onshore and offshore exchange traded INR-USD Futures
FY Onshore Offshore Market Share
BSE NSE MSEI Total DGCX SGX CME Total Onshore Offshore
2014-15 21115 32491 9433 63040 31704 3704 396 35804 6378 3622
2015-16 27904 37241 4539 69685 32725 13906 1001 47631 5940 4060
2016-17 26528 31799 4300 62626 34149 17164 1636 52949 5419 4581
2017-18 30360 33729 1761 65851 33458 28047 5232 66737 4967 5033
2018-19 44820 57237 648 102705 35452 37599 7475 80526 5605 4395
Note-
i Data for BSE NSE amp MSEI is from Exchange websites for USDINR Futures
ii Data for DGCX SGX and CME is from Bloomberg and India INX Research
iii Data for DGCX includes INRUSD Futures (including mini contract) but excludes the USDINR Index
Quanto futures
iv Data for CME includes the Mini and Micro contracts
v Data for FY 2018-19 is from April 01 2018 to March 22 2019
2 OTC Market (as per BIS Quarterly Review December 2016)
108
Annexure V
Meetings held by the Task Force
Sr No Date Venue External Participants Invited
1 March 19 2019 RBI Mumbai
2 March 25 2019 RBI Mumbai -Shri Ananth Narayan Professor SPJMIR
-FEDAI
-Select corporates
3 April 04 2019 RBI Mumbai -Shri G Padmanabhan Former Executive
Director RBI
-Dr V Anantha Nageswaran Dean IFMR
Chennai
-GIFT City IFSC
-National Stock Exchange Ltd
-BSE Ltd
4 April 23 2019 RBI Mumbai -Select FPIs (through audio conference)
5 May 14 2019 RBI Mumbai -Select FDIs (through audio conference)
6 May 31 2019 RBI Mumbai -Shri G Padmanabhan Former Executive
Director RBI
-FIMMDA
-CCIL
-IBA
7 June 20 2019 RBI Mumbai -Smt Shyamala Gopinath Former Deputy
Governor RBI
8 July 04 2019 SEBI Mumbai -Shri G Padmanabhan Former Executive
Director RBI
9 July 10 2019 RBI Mumbai -Smt Shyamala Gopinath Former Deputy
Governor RBI
109
Annexure VI
References
A Santaella Julio (2015) ldquoCurrency carry trades in Latin Americardquo Bank for International
Settlements BIS Paper No 81
Behera Harendra Kumar (2011) ldquoOnshore and offshore market for Indian rupee recent evidence
on volatility and shock spilloverrdquo Macroeconomics and Finance in Emerging Market Economies
Vol 4 No 1 March 2011 pp 43ndash55
Cadarajat Yayat and Lubis Alexander (2012) ldquoOffshore And Onshore IDR Market An Evidence
On Information Spilloverrdquo Bulletin of Monetary Economics and Banking April 2012
Capital Account Safeguard Measures in the ASEAN Context (2019) ASEAN Working Committee
on Capital Account Liberalisation Bank Indonesia Occasional Papers OP12019
Colavecchio Roberta and Funke Michael (2006) ldquoVolatility transmissions between renminbi and
Asia-Pacific onshore and offshore US dollar futuresrdquo BOFIT Discussion Papers Bank of
Finland Institute for Economies in Transition No16
Darbha Gangadhar (2012) ldquoA Tale of One Asset and Two Markets ndash Analysis of Dynamic
Interactions between On- and - Off Shore Marketsrdquo macrofinancenipfporginPDF13-
11sl_Darbha_NDFNimranapdf
DING David K Tse Y and Williams M The Price Discovery Puzzle in Offshore Yuan
Trading Different Contributions for Different Contracts (2012) Financial Management
Association International Conference Research Collection Lee Kong Chian School Of Business
Doukas J and H Zhang (2013) ldquoThe performance of NDF carry tradesrdquo Journal of International
Money and Finance vol 36 September pp 172ndash90
Goyal R R Jain and S Tewari (2013) Non deliverable forward and onshore Indian rupee market
a study on inter-linkages Reserve Bank of India Working Paper Series 112013 December
Guru Anuradha (2009) ldquoNon-Deliverable Forwards Market for Indian Rupee An Empirical
Studyrdquo Indian Journal of Economics and Business Vol 8 No 2 pp 245-260
Higgins Patrick and Owen F Humpage (2005) ldquoNondeliverable Forwards Can We Tell where
the Renminbi Is Headedrdquo Federal Reserve Bank of Cleveland September
Hutchison Michael Jake Kendall Gurnain Pasricha Nirvikar Singh (2009) ldquoIndian Capital
Control Liberalisation Evidence from NDF Marketsrdquo NIPFP Working Paper No 200960
110
Indira Gandhi Institute of Development Research (IGIDR) Finance Research Group (2016)
ldquoFeatures and trends of NDF markets for emerging economy currencies a study of the Indian
rupeerdquo IGIDR working paper March
Ishii Shogo İnci Oumltker-Robe and Li Cui 2001 Measures to Limit the Offshore Use of
Currencies Pros and Cons IMF Working Paper WP0143
Lipscomb Laura (2005) ldquoAn Overview of Non-Deliverable Foreign Exchange Forward Marketsrdquo
Federal Reserve Bank of New York May
Ma G C Ho and R McCauley (2004) The markets for non-deliverable forwards in
Asia BIS Quarterly Review June pp 81-94
Maziad Samar and Kang Joong Shik RMB Internationalization OnshoreOffshore Links (May
2012) IMF Working Paper No 12133
McCauley R C Shu and G Ma (2014) ldquoNon-deliverable forwards 2013 and beyondrdquo BIS
Quarterly Review March pp 75ndash88
McCauley RN Shu C (2016) ldquoNon-deliverable forwards impact of currency internationalisation
and derivatives reformrdquo Technical report Bank of International Settlements
McCauley Robert N and Scatigna Michela Foreign Exchange Trading in Emerging Currencies
More Financial More Offshore (March 2011) BIS Quarterly Review March 2011
Misra Sangita and Behera Harendra (2006) ldquoNon Deliverable Foreign Exchange Forward
Market An Overviewrdquo RBI Occasional Papers Vol 27 No3
Park Jinwoo (2001) ldquoInformation flows between non-deliverable forwards (NDF)and spot
markets Evidence from Korean currencyrdquo Pacific Basin Finance Journal Vol 9 (4) pp363-377
Ryoo Sangdai and Kwon Taeyong and Lee Hyejin Foreign Exchange Market Developments
and Intervention in Korea (October 2013) BIS Paper No 73o
Sarwono Hartadi A (2005) ldquoIndonesian policy on non-residentsrsquo participation in the money
market the restriction of rupiah transactions by non-residents and foreign currency credit offered
by banks to non-residentsrdquo BIS Paper No 23
Standing Council on International Competitiveness of the Indian Financial System (2015)
International competitiveness of currency equity and commodity derivatives markets Department
of Economic Affairs Ministry of Finance
Wang Kai-Li Fawson Christopher and Chen Mei-Ling (2007) ldquoInformation Flows among
Exchange Rate Markets What Do We Learn From Non-Deliverable Forward Markets in Asiardquo
Chaoyang University of Technology October
111
Watanabe K H Akama and J Mifune (2002) ldquoThe effectiveness of capital controls and
monitoring the case of non-internationalisation of emerging market currenciesrdquo EMEAP
Discussion Paper January

4
Abbreviations
ABS ndash Association of Banks in Singapore
AD ndash Authorised Dealer
AED ndash Arab Emirates Dirham
BI ndash Bank Indonesia
BIS ndash Bank for International Settlements
BoE ndash Bank of England
BKPM ndash Investment Coordinating Board in Indonesia
BRL ndash Brazilian Real
CAC ndash Capital Account Convertibility
CCIL ndash Clearing Corporation of India Ltd
CME ndash Chicago Mercantile Exchange
CNH ndash Chinese Yuan (Offshore)
CNY ndash Chinese Yuan (Onshore)
CPI ndash Consumer Price Index
CSA ndash Credit Support Annex
DF ndash Deliverable Forward
DGCX ndash Dubai Gold and Commodities Exchange
DNDF ndash Domestic Non-Deliverable Forward
EM ndash Emerging Market
EME ndash Emerging Market Economy
ETCD ndash Exchange Traded Currency Derivatives
EUR ndash Euro
FBIL ndash Financial Benchmarks India Ltd
FCY ndash Foreign Currency
FDI ndash Foreign Direct Investment
5
FEC ndash Foreign Exchange Committees
FED ndash Federal Reserve Board
FEMA ndash Foreign Exchange Management Act 1999
FPI ndash Foreign Portfolio Investor
FSP ndash Final Settlement Price
FSS ndash Financial Supervisory Services (FSS) in Korea
FX ndash Foreign exchange
GDP ndash Gross Domestic Product
GIFT City ndash Gujarat International Financial Tec-City
HKMA ndash Hong Kong Monetary Authority
HKTR ndash Hong Kong trade repository
IFC ndash International Finance Corporation
IFSC ndash International Financial Service Centre
IDR ndash Indonesian Rupiah
INR ndash Indian Rupee
IMF ndash International Monetary Fund
IRC ndash Investment Registration Certificate
ISDA ndash International Swaps and Derivatives Association
JISDOR ndash Jakarta Inter-bank Spot Dollar Rate
JIBOR ndash Jakarta Interbank Offered Rate
JPY ndash Japanese Yen
KRA ndash KYC Registration Agency
KRW ndash Korean Won
KYC ndash Know Your Customer
LEI ndash Legal Entity Identifier
MIFOR ndash Mumbai Interbank Forward Offer Rate
MSEI ndash Metropolitan Stock Exchange of India Ltd
MYR ndash Malaysian Ringgit
6
NDF ndash Non Deliverable Forward
NOOPL ndash Net Overnight Open Position Limit
NRI ndash Non Resident Indian
NSE ndash National Stock Exchange
OIS ndash Overnight Indexed Swaps
OTC ndash Over the Counter
PBoC ndash Peoplersquos Bank of China
RBI ndash Reserve Bank of India
RMB ndash Renminbi
SEBI ndash Securities and Exchange Board of India
SFEMC ndash The Singapore Foreign Exchange Markets Committee
SGX ndash Singapore Exchange
SNRR ndash Special Non-Resident Rupee Account
TF ndash Task Force on Offshore Rupee Market
TWD ndash Taiwanese Dollar
USD ndash United States Dollar
7
Acknowledgements
The Report of the lsquoTask Force on Offshore Rupee Marketsrsquo was made possible with the support
of a number of individuals and organisations The Task Force would like to gratefully acknowledge
representatives of various banks financial institutions large corporates in India and abroad
foreign portfolio investors asset managers industry bodies experts and practitioners who
interacted with the Task Force and provided their valuable inputs and suggestions
The Task Force greatly benefitted from the experience of Smt Shyamala Gopinath former Deputy
Governor Reserve Bank of India and Shri G Padmanabhan former Executive Director Reserve
Bank of India who took time out of their busy schedules to attend the meetings of the Task Force
as special invitees
The Task Force benefitted from the interactions with Dr T V Somanathan IAS Additional Chief
Secretary Government of Tamil Nadu Shri R Sridharan Managing Director CCIL Dr V
Anantha Nageswaran Dean IFMR Chennai Shri Ananth Narayan Associate Professor SPJIMR
Dr A K Nag Shri Himadri Bhattacharya and Shri Jamal Mecklai CEO Mecklai Financial
Services
The Task Force invited submissions from members of the public and is grateful for several helpful
suggestions received
The Task Force also places on record the assistance provided by Shri Subrat Kumar Seet Director
and Smt Priyanka Sachdeva Manager from Department of Economic and Policy Research
Reserve Bank of India and Shri Hiren Sanghvi Director and Shri Saket Banka Associate Director
from HSBC India The Task Force specifically acknowledges the contribution of Shri Harendra
Behera Assistant Adviser Department of Economic and Policy Research Reserve Bank of India
in research on lsquoLinkages between Offshore and Onshore Rupee Marketsrsquo undertaken in
collaboration with Shri Sajjid Chinoy Chief Economist J P Morgan India
Finally the Task Force would like to commend the efforts put in by the Secretariat team from the
Financial Markets Regulation Department Reserve Bank of India led by Shri Supriyo
Bhattacharjee Deputy General Manager and supported by Shri Nitin Daukia Manager
Meticulous organisation of meetings by Smt Supriya Devalekar Assistant Manager and Shri
Kaivalya Sakalgaonkar Assistant from the Secretariat team is also appreciated
8
Preface
Offshore markets in a non-convertible currency usually referred to as non-deliverable forward
(NDF) markets enable trading of the non-convertible currency outside the influence of the
domestic authorities These contracts are settled in a convertible currency usually US Dollars as
the non-convertible currency cannot be delivered offshore Historically NDF markets evolved for
currencies with foreign exchange convertibility restrictions and controlled access for non-
residents beginning with countries in South America like Mexico and Brazil and thereafter
moving on to emerging Asian economies viz Taiwan South Korea Indonesia India China
Philippines etc Apart from enabling trading in non-convertible currencies NDF markets have
also gained in prominence because of onshore regulatory controls and their ease of access
Reserve Bank has been guided by the objective of developing a deep and liquid on-shore foreign
exchange market that acts as a price setter globally With regard to non-resident entities having
legitimate exposure to the Rupee the focus of policy efforts has been to align incentives for non-
residents to gradually move to the domestic market with adequate safeguards to ensure the
external stability of the value of the Rupee
The sharp growth in the offshore trading volumes in the Rupee NDF market in recent years likely
even beyond the volumes in the onshore markets have raised concerns around the forces that are
determining the value of the rupee and the ability of authorities to ensure currency stability This
necessitates a deeper understanding of the causes underlying the growth in those markets and
identification of measures to reverse the trend
The Task Force on Offshore Rupee Markets was set up to address that concern It was mandated
to study the factors attributable to the growth of the offshore Rupee market its effects on the Rupee
exchange rate and onshore market liquidity and formulate measures to redress the concerns The
Task Force was also charged to examine the role if any that International Financial Services
Centres (IFSCs) can play in addressing these concerns
During its term the Task Force interacted with a wide variety of stakeholders including banks
financial institutions industry bodies foreign portfolio investors asset managers and
academicians
9
I trust that the Reserve Bank of India will find the recommendations made in the report useful
Usha Thorat
Chairperson
10
Executive Summary
The origin of the NDF markets may be traced back to the 1990s when a wave of capital account
liberalisation in emerging market economies (EMEs) triggered a surge in capital inflows to these
economies and consequently heightened the currency risk faced by foreign investors Under-
developed domestic markets especially the market for financial derivatives as well as controlled
access to onshore markets raised the demand for a currency market outside the reach of local
regulations Another trend that supported the growth of the NDF market was the sharp rise
globally in the size of derivatives markets in the 1980s and 1990s As derivatives markets evolved
the speculative search for underlying moved out of the developed world into more esoteric assets
Following the successful speculative attack on the Sterling in 1992 EME currencies became viable
subjects for such speculative positioning Such activity becomes particularly noticeable during
times of stress as offshore risk spills over to the domestic exchange rate through entities that have
a presence in both onshore and offshore markets usually global banks but also corporates
A study of the degree and direction of such spillovers is important to understand the role of NDF
markets and assess policy alternatives The econometric study conducted by the Task Force
observed that the influence between offshore and onshore exchange rate goes both ways in normal
times that is it is bidirectional The study also observed that during the last two stress episodes
(the taper tantrum and the 2018 emerging markets crisis) the relationship turned unidirectional
with the NDF market driving onshore exchange rate The study concludes that as NDF volumes
have increased they have begun to play an important role in both price discovery and driving
volatility particularly during heightened uncertainty period The study also shows that periods of
divergence are limited and the markets converge and that too fairly rapidly
Against this backdrop and in the light of available information results of the statistical analysis
and most importantly based on the feedback received during the various consultations the Task
Force is making following recommendations in accordance with the terms of reference
i Onshore market hours may be suitably extended to match the flexibility provided by the
offshore market and thereby incentivize non-residents to hedge in the onshore market
ii Banks may be allowed to freely offer prices to non-residents at all times out of their Indian
books either by a domestic sales team or by using staff located at overseas branches
11
iii Non-deliverable Rupee derivatives (with settlement in foreign currency) may be allowed
to be traded in the IFSC and IBUs may be allowed to deal in such derivatives with a distinct
FCY-INR position limit To start with exchange traded currency derivatives involving
Rupee may be introduced and with experience non-deliverable OTC currency derivatives
involving Rupee may be allowed subsequently
iv While requirement of underlying exposure will continue for trading in the onshore market
users may be allowed to undertake positions up to USD 100 million in OTC as well as
exchange traded currency derivative market without having to establish the underlying
exposure
v The TF endorses the principle-based regulatory approach adopted in the draft regulation
on hedging by non-residents released by the RBI on February 15 2019 Also back-to-back
hedging by non-residents proposed under these draft regulations is endorsed Further in
case of hedging of anticipated exposures gains from cancellation of contract may be
allowed to be passed on even in cases where there are no cash flows at the discretion of
the bank where the bank considers the cancellation of underlying cash flow is due to
external factors which are beyond the control of the user
vi For ease of entering into hedge transactions for non-residents the TF recommends
a Establishment of a central clearing and settlement mechanism for non-residentsrsquo
deals in the onshore market
b Implementation of margin requirement for non-centrally cleared OTC derivatives
in the onshore market at the earliest
c Allow Indian banks to post margin outside India
d Wider access to FX-Retail trading platform to non-residents
vii A technology-based solution may be explored to centrally aggregate the investments of
non-residents and derivative contracts entered into by them in the onshore market (both
OTC and exchange traded) using LEI or any other unique identifier to start with
viii The issue of taxation in respect of foreign exchange derivative contracts may be examined
with the objective of overcoming gaps between tax regime in India and other major
international financial centres to the extent possible
ix KYC registration may be centralized across the financial market with uniform
documentation requirement
12
Chapter 1
Introduction
Currency is a component of sovereign money which is legal tender issued by the state The
external value of the currency the exchange rate is one of the most important economic and policy
variables which affects economic incentives and activity The exchange rate is determined mostly
by market forces of supply and demand which influence its flows across international borders
The exchange rate has critical information value in guiding financial and economic decisions
which affect real economic variables The stability and predictability of the exchange rate also has
a critical influence on growth and financial stability
Cross-border trade in goods services and assets (or capital) necessitates exchange of one currency
into another and can be thought of as the primary reason why currency markets exist However
as in any other financial market speculative elements ndash who take positions not for settling any
underlying transactions but for benefitting from market movements ndash are important participants
who perform the function of imparting depth to the market The aggregate actions of all
participants ndash hedgers arbitrageurs as well as speculators - determine the value and fluctuation of
the exchange rate
The currency markets for rupee especially for exchange against the USD are fairly well-
developed today One can classify these markets in three categories (a) spot versus derivatives
(b) over-the-counter (OTC) versus exchange-traded and (c) onshore versus offshore Further
derivatives can be cash-settled or delivery-based The most commonly referred benchmark
exchange rate of the rupee is from the onshore spot OTC market Similarly the commonly referred
forward exchange rate of the rupee is from the onshore forward OTC market Rupee futures and
options are traded in some onshore as well as offshore exchanges
The classification of currency markets can also be in terms of the nature of contracts between
buyers and sellers - spot forwards (futures on exchanges) and options contracts A spot contract
is for standard settlement ie the second working day after the date of transaction whereas in
case of forwards and futures (as well as options) the actual exchange or delivery of currency takes
place in the future at a date later than the spot settlement date There are also non-deliverable
forward contracts which are discussed below Forward and futures contracts are used as a risk
management tool or to hedge against possible adverse fluctuation in exchange rates It is important
13
to note that hedging implies risk transfer between the contracting parties it is not elimination of
risk
The category of the currency market that forms the focus of this report is the Offshore Rupee
markets The dominant segment of this market is the Non-Deliverable Forward (NDF) market ndash
wherein foreign exchange forward contracts are traded in the OTC market at offshore locations
generally the International Finance Centres (IFCs) like Singapore Hong Kong London Dubai
and New York These contracts do not involve a physical exchange of Rupees as Rupee is not
deliverable offshore and allow counter-parties to settle profit or loss in a convertible currency
usually the US Dollar which is why it is called a non-deliverable market NDF contracts are
usually traded on currencies which are not readily available to trade globally or outside of
sovereign boundaries These are thus mainly currencies from countries which have partial or no
capital account convertibility
There are also a few exchange-traded offshore rupee markets dealing in rupee futures and options
in Chicago Singapore and Dubai Volumes in these markets have typically been far smaller in
comparison to the offshore NDF OTC market Data on transactions in exchange-traded currency
markets can be ascertained with greater certainty whereas data on transactions in offshore OTC
NDF market have to be gauged through surveys and the estimates on the same are less firm
Why do NDF Markets Exist
NDF markets are not a phenomenon peculiar to the Indian Rupee they are common for currencies
of many emerging market economies (EMEs) As per BIS data NDFs in six currencies ndash Korean
Won Indian Rupee Chinese Renminbi Brazilian Real Taiwanese Dollar and Russian Ruble ndash
account for about two-thirds of the trade in NDFs globally The total daily average volume in NDF
markets is about USD 200 billion as per Bank of International Settlements (BIS) survey1 As per
this survey the share of India was about 1822 per cent of the trade in NDFrsquos globally (see Table
2 Chapter 2) The 2016 BIS survey (the next one will be released in the later part of 2019) showed
that offshore trades in Indian rupee were more or less equal to deliverable onshore forwards
1 2016 Triennial Central Bank Survey of Foreign Exchange and OTC Derivatives Markets
14
around $16 billion daily The 2018 Bank of England reported $23 billion in offshore rupee trades
while RBI sources estimate deliverable daily onshore forwards at $21 billion for 20192
The size of an open economy is one of the primary determinants of international participation in
its currency If international participants do not have direct access to the on-shore currency market
to meet their transaction needs or to hedge their currency exposure they are likely to use the
offshore NDF market The size depth and liquidity of the offshore NDF is thus indicative of the
non-resident interest in an emerging market economy
To some extent the offshore NDF market complements the need for a deep and liquid onshore
currency market What is the appropriate size of the forex market for an emerging market
economy with partially open capital account is determined by its size the share of foreign trade
and appetite for capital flows One proxy for estimating how large the forex market ought to be is
the GDP of the economy A better estimate could be the size of the open economy the trade and
investment sector
As Indiarsquos economy has grown over the past two and a half decades it has seen a significant rise
in openness (ie trade to GDP ratio has grown from 15 in 1990 to 43 in 2018) and in cross
border capital flows This has commensurately raised non-resident interest in the Rupee whether
for risk management purposes or for speculative ends The growing size of the Rupee NDF market
points to a need to widen participation in on-shore markets
The existence and size of offshore NDF markets is also a function of the degree of difficulty that
participants in foreign exchange market (especially non-residents) ndash both speculators and other
participants with requirements arising from cross-border trade transactions ndash face in accessing the
onshore markets The difficulties in accessing onshore currency markets could span a variety of
issues including the following
bull Restrictions on foreign exchange transactions
bull Cumbersome documentation and Know-Your-Customer (KYC) requirements for
participants in the domestic market
bull Restrictions on market participants (especially non-residents) in hedging activities such as
transaction limits tenor limits other documentation etc
bull Restrictions on cancellation and re-booking of contracts
2 For comparison with offshore market the onshore data includes forwards and swaps
15
bull Restrictions on the kind of derivative products that are allowed by market regulators and
bull Inconvenient market hours for those in other time zones
These constraints exist either to curb excessive speculation or to maintain financial stability
Are Offshore Rupee Markets a Problem
When the offshore market volume is significant or larger than the onshore currency market
volume as is the case with many EME currencies it leads to two fragmented markets wherein the
price discovery on the onshore market becomes vulnerable to influences from the price discovery
in the offshore market Empirical evidence (see Chapter 3) shows that while at most times the
direction of the influence runs both ways ie from onshore market to offshore market and vice-
versa the direction of the influence is more dominant from offshore market to the onshore market
in times of high volatility This could happen especially when tidal forces from global financial
markets influence the currency markets in a synchronised manner such as during times of
Emerging Markets (EM) currency crises
There are essentially four issues with regard to offshore market that are critical for regulators ndash
i Effectiveness of exchange rate management Many central banks including the Reserve
Bank have exchange rate stability as one of their objectives and resort to market
intervention or other regulatory measures to control volatility of the exchange rate from
time to time Such influence however extends only to the onshore currency market
Presence of a large offshore market dilutes the effectiveness of the exchange rate
management by the central bank It also hinders the pursuit of the objective of financial
stability in the domestic market
ii Disjointed price discovery During periods of volatility in the currency market when
price discovery in the offshore market causes large movements in onshore currency
markets the onshore market could often open with a large gap over the previous close For
resident market participants who want to cover their positions such gaps expose them to
significant risk
iii Revenue loss Every unit of turnover in a market earns a certain revenue for the market-
making financial firms Thus turnover in the offshore market can be viewed as a potential
revenue loss for domestic financial firms and the domestic economy
16
iv Effectiveness of RBI regulations on capital account management RBIrsquos policies on
capital account have been geared towards managing the impossible trinity a ldquomanagedrdquo
exchange rate free capital movement and an independent monetary policy RBI policies
have been geared toward avoidance of undue volatility in foreign exchange markets by
having restrictions on cancellation and rebooking and excessive risk-taking by resident
entities including corporates With this objective RBI restricts participation of resident
entities in currency derivatives to the extent of their underlying exposures A large market
outside the influence of regulatory authorities undermines their effectiveness
Constitution of the Task Force
Against this backdrop it was announced in the Statement on Developmental and Regulatory Policy
dated February 7 2019 the setting up of a Task Force on Offshore Rupee Markets Accordingly
a Task Force headed by Smt Usha Thorat was constituted with following terms of reference
i Assess the causes behind the development of the offshore Rupee market
ii Study the effects of the offshore markets on the Rupee exchange rate and market liquidity
in the domestic market
iii Recommend measures to address concerns if any arising out of offshore Rupee trading
iv Propose measures to generate incentives for non-residents to access the domestic market
v Examine the role if any International Financial Services Centre (IFSC) can play in
addressing these concerns
vi Any other relevant issue(s) the Task Force considers relevant to the context
The Task Force comprises of the following
i Smt Usha Thorat former Deputy Governor Reserve Bank of India ndash Chairperson
ii Shri Anand Bajaj Joint Secretary Department of Economic Affairs Ministry of Finance
Government of India ndash Member
iii Shri G Mahalingam Whole Time Director Securities amp Exchange Board of India ndash
Member
iv Shri Ajit Ranade Chief Economist of the Aditya Birla Group ndash Member
v Shri Sajjid Chinoy Chief Economist India JP Morgan India ndash Member
17
vi Shri Surendra Rosha CEO India HSBC Bank ndash Member
vii Shri Rajiv Ranjan Adviser-in-charge Department of Economic Policy and Research
Reserve Bank of India ndash Member
viii Shri T Rabi Sankar Chief General Manager Financial Markets Regulation Department
Reserve Bank of India ndash Member Secretary
Approach of the Task Force
Among the different issues relating to offshore markets the argument concerning revenue loss is
perhaps the most simplistic and an obvious response could be for India to develop non-deliverable
Rupee derivative market in an International Finance Service Centre (such as the GIFT City) located
within the geographical boundary of India However such a market will be virtually no different
from the markets located in Singapore or London and hence the objective of bringing volumes to
the onshore market will remain unaddressed
From the standpoint of addressing the concerns arising out of the existence of large offshore
markets it would make sense to incentivise movement of as much currency market transactions
from such markets to onshore currency markets as possible However theoretically one needs to
recognise that there is a trade-off between the sizeprominence of the offshore market and the
extent of regulationsrestrictions that are placed on cross-border transactions and foreign exchange
marketsparticipants It is also important to note that even if all non-residents with underlying
exposure move their hedging transactions to onshore markets offshore markets would continue to
exist to meet the demand of participants who take a view on the exchange rate without any
underlying exposure ie the speculative demand
At one extreme of the above-mentioned trade-off if India opts for a full rupee convertibility ndash by
removing all restrictions on current and capital account transactions ndash along with removal of all
restrictions on currency derivatives then offshore markets would no longer be a relevant concept
Capital account convertibility has been a hotly debated issue in the discourse on public policy both
in India and globally The received consensus in the last couple of decades endorsed by the
International Monetary Fund (IMF) in 2012 is that while capital flows are an important aspect of
the international monetary system providing significant benefits for countries they also carry risks
for macroeconomic and financial stability especially if they are large and volatile and thus pose
a challenge for policy Hence capital flows management measures are justified to help harness the
18
benefits while managing the risks More generally some restrictions to the capital account are
necessary for India to avoid the ldquoimpossible trinityrdquo With an economy as large and diverse as
Indiarsquos which is therefore expectedly not completely synchronous to the global cycle retaining
the independence of monetary policy is imperative Similarly having some control over the
exchange rate is necessary given its occasional propensity to be excessively volatile and overshoot
with attendant feedback loops to the macro-economy Therefore capital flow management
measures become necessary to avoid the trilemma and ensure simultaneous fulfilment of the other
two objectives Based on this received consensus as well as the experiences of some emerging
market economies through the last two decades the Task Force has proceeded on the basis that
the existing framework of capital account management followed by the Government and the RBI
will continue
There is also the issue of de-jure capital account convertibility Even when speculators
arbitrageurs and traders do not have direct access to forex markets to exploit persistent interest rate
differentials or perceived mispricing of the currency there are alternative channels available in
the system which make the actual arbitrage opportunities much lower Some examples of such
instruments is the Overnight Indexed Swaps (OIS) market or the use of Mumbai Interbank
Forward Offer Rate (MIFOR) Hence the de-jure level of capital account convertibility (CAC)
could be much higher than implied by the existence of capital controls
A related issue is the internationalisation of rupee According to McCauley (2011) a currency is
internationalised when market participants ndash residents and non-residents alike ndash conveniently use
it to trade invest borrow and invoice in it Based on the experience of China to internationalise
Renminbi and the evidence of the narrowing of the gap between onshore forward rate and NDF
rates for Renminbi internationalisation of currency has been sometimes advocated as a way to
reduce the influence of offshore markets While one has witnessed issuance of rupee-denominated
bonds (ldquoMasala Bondsrdquo) in some offshore markets in the recent past internationalisation of rupee
is still a distant goalpost given the persistent current account deficit and the negative net
international debt position Thus internationalisation of rupee is not an explicit goal guiding the
recommendations of the Task Force
Further the Task Force believes that Indiarsquos approach to the trade-off between deregulation of
currency markets and tolerance of offshore market must be shaped by the specific considerations
of the Indian economy rather than following any global template blindly
19
Compared to countries like Korea Taiwan or China Indiarsquos macroeconomic structure is
significantly different India is a structurally an economy with twin deficits ndash both fiscal and
current account Nearly half of Indiarsquos consumer price index (CPI) basket comprises of food items
making Indiarsquos inflation more vulnerable to supply shocks Although Indiarsquos macroeconomic
stability has improved considerably in the last few years considering the above factors the Task
Force feels that India cannot risk macroeconomic instability through potential exchange rate
shocks by drastically lifting the restrictions on foreign exchange markets and participants
On the other hand large volumes in the offshore market also reflect the fact that the interest in
Rupee is far larger than what is evident in onshore currency markets This reflects the growing size
of the Indian economy greater role of India in the global economy and growth in trade and capital
flows Over time therefore it would be imperative for the Indian regulators to take steps to expand
the role of onshore currency markets gradually lest the disjointed price discovery issue flares up
more frequently and in larger degrees
The balanced approach of the Task Force therefore is to look at each of the difficulties faced by
market participants in accessing onshore currency markets and prioritise their resolution in such a
way that prudent regulatory considerations are least compromised For instance certain market
micro-structure issues (such as extending the market hours of onshore currency markets) can be
addressed relatively quickly without any regulatory compromise On issues related to
documentation and KYC requirements smart application of ease-of-doing-business principles
needs to be followed Economic entities which need to undertake hedging of their foreign exchange
exposure on account of genuine underlying exposures need to be given greater flexibility in
undertaking such transactions in domestic currency markets While the need for underlying
exposure in order to operate in the forward markets cannot be eliminated the way in which it is
evidenced and monitored can be simplified The Task Force has proceeded on the basis of the
existing principles of regulations of foreign exchange markets
Of course the Task Force recognises that the recommendations will not do away with the
economic imperatives for which trading of rupee forward contracts exists in offshore markets
With our recommendations the Task Force believes that regulatory concerns arising out of the
offshore markets can be reduced though not eliminated
The Task Force held nine meetings between March 2019 and July 2019 The details of the meetings
are given in Annex V
20
Chapter 2
The Evolution of NDF Markets and Cross-country Experience
The foreign exchange market in India during 1970s and 1980s was heavily controlled and closed
in nature with various kinds of restrictions in place The Indian foreign exchange market started
deepening with the transition to a market-determined exchange rate system in March 1993 and the
subsequent liberalisation of restrictions on various external transactions leading up to current
account convertibility under Article VIII of the Articles of Agreement of the International
Monetary Fund in 1994 Notwithstanding various measures taken to further deepen and broaden
the foreign exchange market in India various restrictions are still in place to limit market access
to only those with underlying exposure and prevent undue speculation As India gets increasingly
integrated with the global markets and the exchange rate is increasingly market determined a
combination of capital flows management measures and currency trading restrictions in the on
shore markets are used to manage the lsquoimpossible trinityrsquo external value of the rupee These
measures and restriction are under constant review to ensure that the overall objective of growth
through foreign trade and investment are served
Against this backdrop this chapter attempts to highlights evolution in section II a brief review of
literature on the reasons behind increase in turnover in NDF market in Asian countries has been
given in Section III Section IV highlights the developments in NDF market The country
experiences such as nature of restrictions on non-residents operating in domestic currency
forwards market liberalisation measures taken by countries and its impact in curbing offshore
market discussed in Section V
I Introduction
NDFs are foreign exchange derivative instruments on non-convertible or restricted currencies
traded over the counter (OTC) mainly at offshore centres ie outside the direct jurisdiction of the
respective national authorities It is essentially a forward contract with different settlement process
Unlike the standard forward contract which involves exchange of underlying currencies on
maturity the NDF contract is typically settled as the difference between an exchange rate agreed
months before and the actual spot rate at maturity in an international currency (deliverable) mainly
the US dollars And the other currency which is usually emerging market currency is non-
21
deliverable The settlement of the transaction is not by delivering the underlying pair of currencies
but by making a net payment in a convertible currency equal to the difference between the agreed
forward exchange rate and the subsequent spot rate (Ma et al 2004) NDF contracts can either be
traded over the counter market or at exchanges at offshore financial centres such as Hong Kong
Singapore and London Lately they have become popular derivative instruments catering to the
offshore investorsrsquo demand for hedging arbitraging and speculating including by those who look
upon currency as an asset class
The major participants in NDF market could include foreign businesses and investors doing
business in countries with complex requirements for hedging currency risk in the local markets
arbitragers who have access to both on shore and offshore markets pure speculators like hedge
funds and others who take positions in the NDF market While these are the end users there are
also market intermediaries like banks dealers and brokers who provide quotes for trading in these
currencies and custodians who provide settlement arrangements While the multinational
companies deal in both the long and short end of the market the short end of the market is
particularly dominated by the hedge funds (Misra and Behera 2006) The pricing is influenced by
a combination of factors such as interest rate differential between the two currencies supply and
demand future spot expectations foreign exchange regime and central bank policies
NDF market primarily evolved in response to under-developed onshore forward markets and
limited access to non-residents to currencies with foreign exchange convertibility restrictions An
important advantage that enhances the demand for NDF is reduced credit risk compared to onshore
counterparts since there is no exchange of principal and only the difference amount is settled thus
allowing investors to circumvent limits associated with onshore activity Other reasons which also
favoured the emergence of NDF market includes convenience of time zones location of customer
business operating from a global treasury for multinational companies short-trading hours in
onshore forex market capital controls by individual central banks position limits frictions like
registration norms and know your customer norms frequent and significant changes in regulations
and guidelines in the domestic exchanges and OTC markets Moreover credit risk is also less
relevant since mostly large foreign banks are engaged as a counterparty in NDF trading Further
offshore centres in some cases are better placed to offer competitive services compared to the
22
onshore market on account of various factors ranging from tax treatment less onerous regulations
and documentation to operational efficiency
II Evolution of NDF Markets
The origin of NDF market traces back to the 1990s when a wave of capital account liberalisation
in emerging market economies (EMEs) triggered surge in capital inflows to these economies and
consequently increased currency risk faced by the investors However under-developed domestic
forward market or restricted access to onshore forward market paved the way for evolution of NDF
market as an alternative hedging tool to these investors The widely shared concern amongst local
monetary authorities was that easy access to onshore market and availability of domestic currency
to non-residents will encourage speculative activity leading to greater exchange rate volatility and
eventually the loss of monetary control Consequently some international banks began offering
NDF contracts to meet the demand of investors willing to hedge their EM currencies exposure
during early 1990s (Higgins and Humpage 2005)
One of the earliest NDF market developed during early 1990s was in Mexican peso to speculate
on the currency ahead of the devaluation from its then fixed exchange rate against the US Dollar
The increase in trading turnover during that time was facilitated by the entrance of voice brokers
as intermediaries between inter-bank trading activities (Lipscomb 2005) The NDF market for
some Asian economies like Korean Won Taiwanese Dollar Indian rupee and Chinese Renminbi
existed since mid-1990s due to either restricted or no access to onshore forward markets by non-
residents (BIS 2004) In case of New Taiwan Dollar only onshore entities had access to onshore
markets while it was subjected to underlying requirements in case of Korean Won Indian rupee
and Chinese Renminbi For other currencies like Indonesian rupiah NDF market evolved after
the Asian financial crisis in response to re-imposition of capital restrictions which were liberalised
in early 1990s In Indonesia rapid liberalisation beginning as early as 1970s and further
internalisation of Indonesia rupiah enabled the development of deliverable offshore market for
rupiah Following the currency crisis initial measures were directed at curbing non-trade and
investment related forward transactions with non-residents and broader measures prohibiting
banks from extending loans conducting derivative transactions and transferring rupiah to non-
residents were introduced in early 2001 While Malaysia also imposed cross border restrictions
23
after the crisis evolution of NDF market in Ringgit was initially inhibited by comprehensiveness
of regulations as well as its effective enforcement by the authorities (Ishii 2001)
McCauley (2011) showed that as income per capita rises a currency trades in ever greater
multiples of the home economyrsquos underlying international trade (ldquofinancialisationrdquo) and trades to
an even greater extent outside its home market (ldquointernationalisationrdquo) The increasing economic
interest in emerging market economies as a result of upbeat growth scenario from 2000s spurred
greater participation in currencies of these economies (Chart 1) In this context increasing turnover
in the Indian rupee Chinese Renminbi and other Asian currencies like Indonesian rupiah
Malaysian Ringgit Korean Won and New Taiwanese Dollar is consistent with increased
investment in these economies amidst restricted access to onshore markets Both India and China
recorded phenomenal growth rates translating into increased businesses (trade and investments)
with rest of the world and resulting exposures facilitated offshore trading of their currencies (Chart
2 a amp b) During 1990s mostly non-residents with genuine exposure used NDF market to hedge
their exposures in Indian rupee However with the development of onshore market providing
reasonable hedging facilities to foreign investors amidst gradual relaxation of controls most of the
market activity seems to be driven by speculators and arbitrageurs and those who are looking at
the rupee as a separate asset class to diversify their portfolios in view of its growing international
importance As a result the size of NDF market has grown over time In the Chinarsquos case the
emergence of offshore deliverables market for Renminbi (CNH) since 2010 was mainly due to
internationalisation of Renminbi which gradually substituted the NDF market
24
Chart 1 a amp b FX turnover Indexed 1998=100 and FX TurnoverTrade vs GDP
Source BIS Triennial survey IMF CEIC
Note Chart 1b A higher ratio of FX turnover to trade indicates that a currency trade in higher multiple
relative to its underlying trade as GDP increases
Chart 2 a amp b Gross trade Indexed 2000=100 and Gross trade vs FX turnover
Source IMF BIS World Bank
Both Indonesia and Malaysia have witnessed sharp increase in non-resident participation in local
currency bond market particularly in the aftermath of global financial crisis 2008 while these
countries local forward markets imposed restrictive conditions that restricted use of these markets
for hedging this led to the increased use of NDF market Non-resident ownership of government
debt in Indonesia and Malaysia as share of total outstanding government debt stood at 383 per
0
100
200
300
400
500
600
200
0
200
2
200
4
200
6
200
8
201
0
201
2
201
4
201
6
201
8
WorldAsiaEmerging and developing economiesAdvanced economies
0
1000
2000
3000
4000
0
200
400
600
800
1000
1200
1998 2001 2004 2007 2010 2013 2016
BRL IDR
CNY INR
MYR TWD
KRW right scale
Brazil
Korea
Indonesia
China
India
Malaysia
0
5
10
15
20
25
30
01 10 100 1000
GD
P p
er c
apit
a (U
SD
in t
ho
usa
nd
s)
FX turnover to trade (in log form)
Brazil
China
Indonesia
India
Korea Malaysia
Thailand
00
10
20
30
40
50
60
70
0 25 50 75 100 125 150
FX
turn
over
to
GD
P
External trade to GDP
25
cent and 243 per cent as at the end of March 2019 respectively highest amongst other Asian
economies However foreign participation in equity market is higher for Korea and Taiwan While
Taiwan has limits on investments in domestic bonds by non-residents foreign investors are not
subject to any investment ceiling for both aggregate and individual holdings in a listed company
except for a few restricted industries
Additionally the reason for growing NDF market could be increased carry trade activities for high
yielding currencies After examining the returns of carry trades with deliverable and non-
deliverable forwards Doukas and Zhang (2013) found that carry trades for currencies with NDF
contracts perform better compared to carry trades for currencies with deliverable forward
contracts This excess return is attributed to the compensation of risks emanating from currency
convertibility and capital controls For the Brazilian Real (BRL) derivatives offshore NDFs in
particular are the main vehicle for investors looking to implement carry trades (BIS Santaelaa
2015)
NDF market evolved mainly for emerging market economies witnessing increased economic
interest in the process of transition to high growth phase since 1990s whilst restrictions persisted
in accessing onshore markets for hedging currency risk arising out of these exposures The NDF
market also provided an opportunity to speculate on currencies which underwent notable shift in
their exchange rate regime During periods of global uncertainties like in 2013 during ldquotaper
tantrumrdquo the NDF market is used for speculative purposes arguably causing disruptions in
domestic forex market
III Size of the NDF market
Given that NDF is an over the counter (OTC) traded instrument the turnover data relies on various
surveys conducted by institutions at different time intervals In view of this issues like
comparability and continuity in data often arises However these surveys still provide useful
information to gauge the growth of NDF market over time Results from the semi-annual turnover
survey for the Foreign Exchange Joint Standing Committee chaired by Bank of England (BoE)
suggests that growth of NDF market has outpaced the forward market as well as overall foreign
exchange market In London the average daily NDF turnover surged to USD 139 billion as per
26
the latest survey in October 2018 from as low as USD 21 billion in 2008 During this period NDF
turnover quadrupled and its share increased to 53 per cent of overall forex turnover and comprised
nearly 34 per cent of both onshore and offshore forwards compared to nearly 10 per cent in 2008
Table 1 NDF trading in London (Average daily turnover in billions of US dollars)
NDFs All forwards NDF of all
forwards
All FX NDF as of all FX
Apr-08 23 200 115 1832 13
Oct-08 19 230 83 1699 11
Apr-09 16 162 99 1356 12
Oct-09 26 191 136 1522 17
Apr-10 25 186 134 1687 15
Oct-10 37 188 197 1787 21
Apr-11 42 192 219 2042 21
Oct-11 37 192 193 2038 18
Apr-12 36 192 188 2014 18
Oct-12 45 211 213 2017 22
Apr-13 60 265 226 2547 24
Oct-13 43 205 210 2234 19
Oct-14 62 304 204 2711 23
Apr-15 64 295 217 2481 26
Oct-15 54 253 213 2111 26
Apr-16 60 275 218 2225 27
Oct-16 62 292 212 2179 28
Apr-17 78 332 235 2401 32
Oct-17 90 330 273 2380 38
Apr-18 111 407 273 2727 41
Oct-18 139 409 340 2611 53
Source BIS London Foreign Exchange Joint Standing Committee
A similar survey is conducted by Hong Kong trade repository (HKTR) under the mandatory
reporting obligations imposed since July 2015 According to the HKTR survey daily average
27
NDF turnover in Hong Kong has also exhibited significant growth and daily average turnover
increased to USD 55-60 billion in 2018 from nearly USD 8 billion in 2015
The BIS publishes data on foreign exchange and derivatives trading activity every three years and
also prepare a separate report on NDF covering global market since 2013 The latest 2016 BIS
triennial survey reported that average daily turnover in global NDF market has increased by 53
per cent to USD 134 billion as compared to April 2013 Further NDF share in outright forward
and overall foreign exchange trading remained stable at 190 per cent and 26 per cent respectively
(Table 1) This is in contrast to the decline in average daily turnover in global FX markets to USD
51 trillion in 2016 from USD 54 trillion in 2013 survey conducted by BIS
The currency composition suggests that the Asian currencies dominate the NDF trading activity
with the highest turnover recorded by Korean Won as Korea generally has open capital account
and there are limits on non-residents borrowings in Korean Won from banks in Korea therefore
it is not deliverable offshore (BIS Survey 2016) Survey results from London Hong Kong and
Tokyo foreign exchange committees (FEC) as well as the BIS triennial survey points toward
increased NDF trading activity in Korean Won The Tokyo survey which is available from the
year 2006 suggest that the growth in NDF trading activity for Korean Won has shown significant
growth outperforming other major currencies The momentum in major currencies picked up ahead
of the global financial crisis 2008 before faltering during the crisis period owing to deteriorating
financial conditions Subsequently the NDF activity has deepened over time with the Indian rupee
and Brazilian Real constituting higher proportion of total global turnover after the Korean Won
as corroborated by the London survey also During the five-year period from 2008-13 the increase
in NDF turnover is largely consistent with the FX turnover in emerging market economies (BIS
2013)
Since 2013 greater demand for hedging in anticipation of monetary policy normalisation seems
to be the driving factor for increase in NDF activity given that lot of capital flows to emerging
markets was funded using low cost dollar liquidity (BIS 2013) The BIS 2016 survey identified
that developments associated with higher volatility in Renminbi during August 2015 and January
2016 has also boosted Asian NDFs even as trading activity in Renminbi NDF has faded
According to the BIS 2016 survey during 2013 and 2016 trading in Renminbi NDF contracted
by 394 per cent while that of Korean Won and Taiwanese Dollar expanded by 537 per cent and
28
299 per cent respectively The decline in the NDF activity for Indian rupee reflects the
depreciation of rupee against the US dollar however daily average turnover was up by 167 per
cent between 2013 and 2016 in unadjusted terms Hong Kong (HKTR) survey indicates continued
decline in NDF activity for Chinese Renminbi and Malaysian Ringgit (Table 2 and Chart 2 a amp b)
In case of China this was due to the Renminbi internationalisation policy followed after 2011
Table 2 Daily average turnover (USD billion) Spread
BIS 2013 BIS 2016
Oct- 2018
(London Survey) Bid-Ask (Latest)
NDF DF NDF DF NDF
DF
(Latest) Onshore Offshore
Chinese Renminbi 171 24 104 281 88 650 0001-0002 0003-0005
Indian Rupee 172 31 164 163 2303 214 001 002
Korean Won 196 11 301 145 295 300 010 030
Taiwanese Dollar 89 02 115 78 - 193 0005-0010 0010-0020
Brazilian Real 159 27 187 30 154 - - -
Russian Ruble 41 05 29 186 40 - - -
Source BIS London FEC BoK RBI China Foreign Exchange Trading Center Central bank of Taiwan HSBC
Note
1 DF= Deliverable forwards and include forwards and FX swaps traded onshore
2 Chinese Renminbi volumes on offshore segment are negligible after development of CNH market
3 BIS DF and DF (latest) are not directly comparable since latest numbers are taken from country sources
Chinese Yuan is for Jun-19 Indian rupee and Taiwanese Dollar is for Apr-19 Korean Won is for 2017
Chart 2 Average Daily Turnover and Change in Forex position of Asian Currencies
3 The corresponding figure for April 2019 stood at USD 28billion
0
100
200
300
400
500
US
DC
NY
US
DI
DR
US
DI
NR
US
DK
RW
US
DM
YR
US
DT
WD
Chart 2b Change in FX position of Asian
currencies (in USD billion)
29 January 2016 27 January 2017
31 January 2018 25 January 2019
0
200
400
600
800
1000
1200
Apr-
06
Apr-
07
Apr-
08
Apr-
09
Apr-
10
Apr-
11
Apr-
12
Apr-
13
Apr-
14
Apr-
15
Apr-
16
Apr-
17
Apr-
18
Chart 2a Average daily turnover USD
million
CNY INR IDR KRW
MYR TWD BRL
29
Source Tokyo FEC Hong Kong FEC
Based on latest surveys conducted by London and Hong Kong FEC which are major offshore
centres clearly it showed that the global NDF activity has surged led by Korean Won Indian
rupee Brazilian Real and Taiwanese Dollar The trend is likely to be validated by BIS 2019 survey
which encompasses global turnover and is due to release later this year
IV Review of Literature
In view of the noticeable rise in NDF activity with potential to engender distortions in local market
there exist varied literature on the emergence of NDF market and its spill-overs to onshore
counterparts One of the earliest attempts was made by Park (2001) which investigated the impact
of financial deregulation on relationship between onshore and offshore prices A key finding was
that Korean Won NDF influenced onshore prices after a shift to floating exchange rate regime
coupled with liberalisation of capital controls As part of liberalisation measures following the
Asian financial crisis in 1997 excessive regulations pertaining to foreign exchange market were
removed and measures were undertaken to improve efficiency of market by increasing liquidity
and broadening participation base (Chung et al 2000) Amongst these measures onshore entities
were allowed to participate in offshore market In this regard Lipscomb (2005) suggested that
transition to a more convertible exchange rate regime and permissible participation of onshore
counterparties in NDF transactions contributed to the increase in offshore liquidity which begets
liquidity in domestic market as well A classic example is Korean Won where both onshore and
offshore market co-exist with arbitrage opportunity exploiting any incipient price discrepancy
However NDF markets tend to disappear as the currency becomes fully convertible as stated
earlier
Wang et al (2007) also corroborated the finding that NDF market seems to be the driver for the
domestic spot market of Korean Won while the information flow is reverse for Taiwanese Dollar
where the spot market was found to have influence on NDF market Adding to this literature
Colaveccchio and Funke (2008) found Renminbi NDF to be the key driver of Asian currency
markets with varied degree of heterogeneity contingent on real and financial inter-linkages
Amongst the country specific study the one by Cadarajat and Lubis (2012) demonstrated that
Indonesia rupiah NDF tends to have influence on domestic spot and forward return
30
Studies by Hutchison (2009) Mihajek and Packer (2010) and McCauley and Scatigna (2011)
asserted that offshore trading becomes increasingly important with growing economic interest in
a particular currency amidst limited access to onshore markets and convertibility restrictions A
study by BIS (2013) analysed the directional impact for nine currencies including the Indian rupee
for the period 2005-13 along with separate analysis for 2008-09 crisis and May-August 2013 It
found the presence of two way causation for most currencies for the full sample period however
noted the increase in NDF influence during market stress Both the stress period saw noticeable
impact of NDF particularly during May-August 2013 with major exception of Malaysian Ringgit
where NDF played dominant role and there was no case of deliverable forward influencing NDF
In the Indian context the earliest study with regard to spill-overs impact was undertaken by Misra
and Behera (2006) They found onshore prices to have directional impact on NDF prices even as
volatility spillovers could exist from NDF to onshore market The subsequent research on this
subject during the period 2000-09 by Behera (2011) demonstrated the change in dynamics with
evidence of greater volatility spillover from NDF to spot market A similar finding was outlined
by Guru (2009) on the relationship between the NDF and onshore market for Indian rupee It is
argued that dynamics of relationship between onshore and offshore markets has undergone a
change with the introduction of the currency future market in 2008 and returns in NDF market
seem to be influencing the domestic spot as well as forward market
A study by Darbha (2012) finds that offshore markets plays an important role in price discovery
mechanism particularly in India and China Goyal et al (2013) after examining the period 2006-
13 found the existence of bi-directional relationship between onshore and NDF market for Indian
rupee over the long term however the directional impact turns one way from NDF to onshore
during periods of depreciating pressures ie movements in NDF markets drives adjustment in
onshore market when the currency is under depreciation pressures This asymmetric behaviour is
attributed to the fact that the Reserve bank intervenes in the foreign exchange market to stem
excessive volatility during periods of rupee depreciation
McCauley et al (2014) described two paths for evolution of the NDF markets The first one is
being followed by Chinese Renminbi which has become deliverable after the emergence of
offshore market The Indian rupee falls under the second where the NDF market has grown amidst
continued restrictions on foreign participation
31
The report of the Standing Council (Standing Council on International Competitiveness of the
Indian Financial System 2015 by Ministry of Finance Government of India enumerated factors
including capital controls position limits frictions like registration norms and know your customer
norms frequent and significant changes in regulations and guidelines in the domestic exchanges
and OTC markets as deterrent to foreign investors participation in the onshore market
IGIDR Finance Research Group (2016) made an important recommendation that domestic entities
should be permitted to participate in NDF market after outlining factors driving offshore activity
compared to onshore segment In respect of the internationalisation of rupee as one of the debated
recommendation Kumar and Patnaik (2018) argued the case for gradual internationalisation of
rupee on analysing the role of the Indian rupee in terms of official sector currency reserve currency
and trade invoicing currency
V Country Experience
China
The Chinese Renminbi (RMB) forward market can be segmented into offshore NDF market (since
1990s) an onshore Renminbi market (since 2007) and the CNH market (offshore deliverable) In
the current scenario RMB NDF has been gradually replaced by offshore deliverables after the
creation of CNH market since mid- 2010 as a by-product of promotion of international role of
RMB since 2009
Chinarsquos exchange rate regime has evolved from fixed to managed floating rates followed by
internationalisation of Renminbi (RMB) In early 1990s reforms started with the unification of
multiple exchange rate in 1994 and in 1996 China allowed the full convertibility of Yuan under
current account transactions Eventually the Peoplersquos Bank of China (PBoC) announced the
implementation of managed floating exchange rate against basket of currencies in July 2005
ending the dollar peg prevalent since 1994 Over the last decade Chinarsquos strong economic
performance and growing linkages with rest of the world prompted authorities to promote the
international role of RMB The idea of internationalisation of RMB gained prominence following
the financial crisis of 2008 which revealed the fragilities of dollar dominated global financial
system The thrust of early initiatives was RMB trade settlement premised on Chinarsquos deeper trade
32
links and its central role within Asiarsquos supply chain that supported the demand for its currency for
trade invoicing In this regard a pilot scheme permitting cross border trade settlement in RMB was
launched in 2009 which was widened to cover all current account transactions over the course of
next three years Capital account liberalisation was undertaken at a more gradual pace with the
Chinese RMB becoming officially deliverable at offshore centres in 2010 While Hong Kong
banks were permitted to accept RMB deposits as part of personal accounts in 2004 an important
milestone was the sign of Memorandum of cooperation between HKMA and PBoC in July 2010
which eliminated restrictions on Hong Kong banks in establishing Renminbi accounts and
providing related services ie payments and transfers in RMB to individuals and corporations
Moreover financial institutions were permitted to offer Yuan denominated products As a result
CNH (offshore Renminbi) began to trade actively amongst other range of products and prompted
investors to switch to deliverable market in place of NDF which was used previously Whilst CNH
can be transferred freely between offshore accounts transfer of RMB between onshore and
offshore is still confined to regulated channels to fend off potential adverse impact on onshore
markets Moreover these restrictions are skewed towards outflows form the mainland to offshore
centres
With Renminbi internationalisation the offshore CNH market has shown exponential growth
displacing the NDFs The BIS Triennial Survey showed significant decline in RMB NDF which
fell nearly 40 per cent between 2013 and 2016 driving its share in total RMB trading to 5 per cent
from 14 per cent earlier (BIS 2016) The rapid expansion of offshore market is clearly discernible
in rising FX turnover for CNH which has nearly doubled between 2013 and 2016 and forms around
67 per cent of the total RMB turnover Of the total CNH turnover average daily turnover in the
DFs in April 2016 was estimated to increase to USD 164 billion from USD 84 billion in 2013
(Table 3)
33
Table 3 RMB market turnover average daily turnover in USD billion
OTC
spot
OTC
FX
swaps
OTC
DFs
OTC
NDF Options Futures
OTC
currency
swaps Total
CNY
2013 201 105 26 0 03 0 0 335
2016 249 27 13 0 2 0 02 554
change 239 1565 -514 5693 651
CNH
2013 139 294 84
168 0 05 69
2016 427 59 164
158 03 25 1367
change 2079 1008 943 -56 5784 3836 981
NDF
2013
171
171
2016
104
104
change -394 -394
Source BIS
Since the inception of CNH pricing gaps tend to persist between onshore and offshore exchange
rates however it has narrowed over last couple of years This pricing gap arises on account of
different economic conditions in mainland China and Hong Kong amidst imperfect arbitrage
(Funke 2015) While central bank intervention can constrain the movement of CNY at onshore
centres CNH is more market determined and hence closely follows the global swings (Chart 3)
Since September 2015 PBOC has reportedly taken action in the offshore market when the
onshore-offshore gap was large (McCauley amp Shu 2018)
34
Source Bloomberg
Further liberalisation of the onshore FX market along with allowance of offshore deliverable
market has made the CNY NDF market almost non-existent despite maintaining the lsquoneed basisrsquo
principle Notwithstanding the existence of basis between CNY and CNH due to the band range
trading in CNY and market determined pricing in CNH the spread has been contracting over years
with ample liquidity available in onshore and offshore markets Further the creation of offshore
market has made various options available to offshore investors to both hedge their exposures on
underlying investments and also generate RMB risk in their portfolios via various products and
offshore deliverable market
Korea
With an average daily turnover of USD 30 billion as per the BIS survey 2016 and USD 295 billion
in the latest London survey of October 2018 Korean Won (KRW) NDF boasts of the most active
and liquid NDF market amongst most emerging market currencies Further permissible
participation of local banks in the NDF market ensures close integration of onshore and offshore
forex markets allowing for quick sentiment spillovers between the two markets Turnover in NDF
market is substantially higher than onshore forwards mainly on account of higher documentation
requirements for accessing onshore market In the onshore market average daily turnover was
reported at USD101 billion in 2017 for forwards which increased from USD 96 billion during
the previous year (Chart 4 a ampb)
-015
-01
-005
0
005
01
01-0
8-2
010
01-1
2-2
010
01-0
4-2
011
01-0
8-2
011
01-1
2-2
011
01-0
4-2
012
01-0
8-2
012
01-1
2-2
012
01-0
4-2
013
01-0
8-2
013
01-1
2-2
013
01-0
4-2
014
01-0
8-2
014
01-1
2-2
014
01-0
4-2
015
01-0
8-2
015
01-1
2-2
015
01-0
4-2
016
01-0
8-2
016
01-1
2-2
016
01-0
4-2
017
01-0
8-2
017
01-1
2-2
017
01-0
4-2
018
01-0
8-2
018
01-1
2-2
018
01-0
4-2
019
Chart 3 Gap between USDCNY and USDCNH
Offshore premium
35
Chart 4 Foreign Exchange Turnover and NDF market in Korea
Source Bloomberg Bank of Korea
Korea embarked on liberalisation reforms in 1980s however took big strides post Asian financial
crisis in 1997-98 in line with the IMF adjustment programme As part of these measures foreign
exchange transactions were liberalised which allowed the local banks to engage in NDF
transactions with non-residents Prior to this the development of the onshore currency derivatives
market was constrained by legal requirements such as any forward transaction had to be certified
as a hedge against future current account flows the so-called ldquoreal demand principlerdquo which also
spurred the development of a liquid offshore ldquonon-deliverablerdquo forward (NDF) market in the
Korean Won In 1999 as part of liberalisation measures this restriction was lifted and a lot of
activity moved onshore leading to the convergence of the offshore and onshore prices (IMF
2004) This resulted in sharp increase in NDF transactions between onshore banks and non-
residents for both hedging as well as speculative purposes Amidst likely possibility of turmoil in
foreign exchange market the central bank implemented regulations in January 2004 governing
Korean banks NDF positions with the non-residents directed at restraining any potential selloffs
However these restrictions were abolished in April 2004 as speculative activity was assessed to
have reduced significantly
KRW is almost a non-restricted currency provided the investor holds an Investment Registration
Certificate (IRC) issued by the Financial Supervisory Services (FSS) in Korea The IRC allows an
offshore investor to invest in onshore securities and provides near non-restricted currency rights
barring any holding of short selling position in onshore KRW account
191 18 183 175 20 194 196
7566 71 76
83 96 101
192198 196 19
192 184198
0
10
20
30
40
50
2011 2012 2013 2014 2015 2016 2017
Chart 4b Foreign Exchange Turnover
in Korea daily average USD billion
Spots Forwards Fx Swaps
-60
-50
-40
-30
-20
-10
0
10
20
30
12
-19
98
01
-20
00
02
-20
01
03
-20
02
04
-20
03
05
-20
04
06
-20
05
07
-20
06
08
-20
07
09
-20
08
10
-20
09
11
-20
10
12
-20
11
01
-20
13
02
-20
14
03
-20
15
04
-20
16
05
-20
17
06
-20
18
Chart 4a Onshore USDKRW-NDF 1M
USDKRW
36
For non-residents investors who do not hold IRS USDKRW remains a highly regulated market
Any onshoreoffshore transactions need to be approved by the appropriate authorities and must
have proof of underlying For multinational clients that repatriate dividends documentation with
proof of underlying must be in place Further ceilings are imposed on foreign exchange derivatives
transactions of foreign as well as local banks which came into existence as a prudential measure
to mitigate the adverse impact of volatile capital flows
Ahead of the 2008 financial crisis Korean economy experienced huge build-up of short-term
external debt led by foreign exchange derivatives positioning of banks on account of over-hedging
undertaken by Korean corporations as well as likely carry trades in anticipation of appreciation of
domestic currency Both these activities were funded using offshore dollar borrowing and posed
serious difficulties at the time of global dollar liquidity crunch during financial crisis With a view
to prevent recurrence of the any such episode triggered by volatile capital flows which resurged
from 2009 over-hedging was specifically prohibited and limits were imposed on Foreign
exchange derivatives activity of banks in relation to their capital Liberalization in KRW has been
continuing for decades with the last one completed in December 2007 whereby prior approval
requirements for some capital account transactions was abolished Even onshore participants can
freely participate in the NDF markets thereby providing onshore liquidity to Non-Residents as
long as the hedges are booked as NDF Essentially KRW is a fully convertible currency but is
only tradable on NDF basis offshore
Malaysia
Malaysia had liberal foreign exchange policies until Asian financial crisis with regard to cross
border transactions involving Malaysian Ringgit (MYR) Following the crisis offshore trading of
MYR was banned However grace period was notified for depositors to repatriate their offshore
deposits back to Malaysia and the adoption of fixed exchange rate policy in 1998 - a significant
move whilst imposing selective capital controls All these measures were intended at ceasing
offshore activity which contributed to the excessive pressure on currency despite relatively
stronger fundamentals Although Malaysia imposed cross border restrictions after the Asian crisis
evolution of NDF market in MYR was initially inhibited by comprehensiveness of regulations as
well as its effective enforcement by the authorities (Ishii 2001) Further absence of reference rate
37
for settlement of NDF contracts and stringent controls on domestic bank to undertake forward
foreign exchange transactions with offshore counterparties also hindered the development of NDF
market (EMEAP discussion paper 2002) As the economy began to recover capital controls were
gradually relaxed and finally the currency was floated in 2005
Generally Malaysia has opened up its domestic markets for non-resident investors with no
restrictions on non-residents investing in local bond markets except having to appoint a local
custodian Most of the sectors are open for non-resident portfolio equity flows as well in Malaysia
Over the years since 2005 non-resident investorsrsquo participation in the onshore market picked up
substantially reaching record high of 397 per cent of total outstanding government bonds from
nearly 14 per cent in 2005 and in the process contributed to the growth of NDF market as well
McCauley (2013) analysed the direction of influence for nine currencies in 2005-13 as well as
separately for the 2008-09 crisis and May-August 2013 Granger causality tests point to two-way
causation for most currencies for the full sample The exception is the Malaysian Ringgit where
the NDF influences the deliverable forward market The central bank expressed concerns over the
adverse impact of increased activities in the ringgit NDF market after wide gap was observed
between the NDF and onshore rate in 2016 following the US presidential election Bank Negara
Malaysiarsquos (BNM) Governor emphasised that ringgit NDF market is used by non-resident
investors mostly for speculative purposes rather than genuine demand for hedging As the NDF
trading activity intensified during volatile period in 2016 ringgit-denominated NDF implied much
larger depreciation which further exacerbated the then prevailing depreciating pressure on the
currency (Chart 5)
Chart 5 Onshore and Offshore market in Malaysia
Source Bloomberg
4141542
42543
43544
44545
455
Oct
-16
Oct
-16
Oct
-16
Nov
-16
Nov
-16
Nov
-16
Nov
-16
Dec
-16
Dec
-16
Dec
-16
Dec
-16
Dec
-16
Jan-1
7
Jan-1
7
Jan-1
7
Jan-1
7
Feb
-17
Feb
-17
Onshore USDMYR Offshore 1month NDF USDMYR
38
Assessing the overwhelming impact of NDF activities which has the potential to undermine
financial stability BNM took a number of measures in 2016 to eliminate speculative transactions
in order to ensure appropriate price discovery and orderly functioning of onshore market These
measures includes reinforcement of non-internationalisation policy for Ringgit steps to improve
the onshore pricing mechanism and deepen the domestic forex market After prohibiting banks
from quoting fixing orders used to settle offshore trades the central bank revised the methodology
to compute onshore reference rate to account for transacted deals from mid-2016 Further BNM
imposed a ban on ringgit NDF trading in November 2016 and reminded local banks that ringgit
remains a non-internationalised currency and therefore any offshore trading is not recognized At
the same time BNM strengthened its monitoring to ensure compliance to Foreign exchange
administration rules (FEA) rules by market participants on non-involvement in facilitating NDF
transactions Subsequently financial markets committee (FMC) instituted in mid-2016 laid down
a series of developmental measures for onshore market aimed at allowing better market access and
greater hedging facilities to market participants (Table 5)
Table 5 Developmental Measures Relating to Foreign Exchange Market
Jul-16 Dec-16 Apr-17
Adopting global best practices Rebalance onshore FX demand and supply
Additional FX risk
management practices
bull Transaction based KL
USDMYR reference rate
bull 25 retention of export proceeds in
foreign currency
bull Streamline passive and
dynamic hedging
flexibilities for
investors
bull Extension of official closing hour
for onshore Ringgit rate
bull Trade settlement among residents in
Ringgit only
bull Active hedging for
corporations
bull Streamline onshore and offshore
foreign currency investment limit
Promote FX risk management onshore
bull Active hedging below RM6t million of
net open position
bull Active hedging for institutional
investors
39
bull Expansion of appointed overseas office
framework
In an immediate impact reinforcement of restrictions on USD-MYR NDF market resulted in
significant outflows from local bonds in Malaysia However as a positive impact with the bout
of capital outflows following ban on NDF transactions composition of non-resident holdings has
shifted towards more stable and long-term investors thereby reducing the risk exposure to global
impulses Further the disruptive influence from NDF market subsided and onshore foreign market
continues to register higher average daily volume These measures have helped in increasing the
depth and liquidity of the foreign exchange market as evidenced by declining volatility and
narrowed bid-ask spreads in onshore market The decline in offshore volumes has resulted in
widened bid-ask spread (Chart 6 a amp b)
Chart 6 Malaysia Monthly FX forward volumes and Bid-Ask Spread
Source BNM Reuters and Bloomberg
-001
0
001
002
003
004
005
01
-10
-201
0
01
-04
-201
1
01
-10
-201
1
01
-04
-201
2
01
-10
-201
2
01
-04
-201
3
01
-10
-201
3
01
-04
-201
4
01
-10
-201
4
01
-04
-201
5
01
-10
-201
5
01
-04
-201
6
01
-10
-201
6
01
-04
-201
7
01
-10
-201
7
01
-04
-201
8
01
-10
-201
8
01
-04
-201
9
Chart 6b Bid-Ask spread
offshore bid-ask onshore bid-ask
0
10
20
30
40
50
60
70
80
90
0
5
10
15
20
25
30
Dec
-12
May
-13
Oct
-13
Mar
-14
Aug
-14
Jan-1
5
Jun
-15
Nov
-15
Apr-
16
Sep
-16
Feb
-17
Jul-
17
Dec
-17
May
-18
Oct
-18
Mar
-19
Chart 6a Monthly FX forward turnovers (in
USD billion)
Onshore FX forward Offshore FX forward RHS
40
Chart 7 Non-resident holdings of total government debt and Monthly FX turnover
Source BNM and HSBC
Indonesia
The development of NDF market in Indonesia Rupiah traces back to the year 2001 when Bank
Indonesia (BI) prohibited onshore banks from lending to non-resident accounts in an attempt to
reduce the speculative pressure on the Indonesian Rupiah (IDR) These restrictions paved the way
for development of offshore rupiah NDF market to cater to the demand of international investors
Prior to this an active offshore deliverable market existed for IDR following the pursuit of
liberalisation policies beginning as early as 1970s which allowed the IDR to be freely convertible
and at the same time permitted its internationalisation Consequently the international use of
rupiah increased but was confined mostly to financial transactions mainly due to limited invoicing
of trade-related transactions in IDR terms This easy access to rupiah from onshore centres due to
internationalisation allowed non-resident to speculate on the currency during the 1997 crisis in
Asian countries As a result of heightened activity in times of stress exchange rate volatility
increased making it difficult for the central bank to maintain stability of rupiah In response to the
crisis the currency was freely floated replacing the intervention band but weakness in the currency
and high volatility continued to persist compared to currencies of other Asian countries during the
first three years of its floating rate regime Taking cognizance of this disparity the central bank
began to evaluate the extant regulations relating to rupiah transactions with non-residents
Thereafter during the year 2001 the BI imposed extensive regulations limiting non-resident
143
397
243
50
100
150
200
250
300
350
400
450
Jan-0
5
Oct
-05
Jul-
06
Apr-
07
Jan-0
8
Oct
-08
Jul-
09
Apr-
10
Jan-1
1
Oct
-11
Jul-
12
Apr-
13
Jan-1
4
Oct
-14
Jul-
15
Apr-
16
Jan-1
7
Oct
-17
Jul-
18
Apr-
19
Chart 7a Non resident holdings as of total
government debt
-
500
1000
1500
2000
2500
3000
Jan-1
6
Apr-
16
Jul-
16
Oct
-16
Jan-1
7
Apr-
17
Jul-
17
Oct
-17
Jan-1
8
Apr-
18
Jul-
18
Oct
-18
Jan-1
9
Chart 7 Monthly onshore FX market
turnover (in billion of USD)
FX Spot FX Swap FX Forward FX Options
41
rupiah transactions and shrinking the pool of offshore rupiah funds with the potential to be used
for speculation identifying spill overs from offshore market as conduit of excessive volatility
In general Indonesia has opened up its domestic bond markets for non-residents completely with
no entryexit barriers except having to appoint a local custodian Foreign exchange hedging is
allowed only with underlying documentationasset in place for non-residents On the portfolio
equity investments regulation clearly provides that a listed company is exempt from any foreign
investment restrictions However there are sectoral restrictions on FDI in Indonesia which are
decided by BKPM (Investment Coordinating Board in Indonesia) which provides a DNI list
(Governmentrsquos negative investment list) The share of non-residents in Indonesia Government
Bonds has been increasing over years from a mere 1570 per cent of the total government bonds
in June 2009 to 3810 per cent in April 2019 (Chart 8)
Source HSBC
Research from BI in 2012 found disproportionate impact of NDF market to spot market during the
period 2008-11 Results suggests that there is evidence of unidirectional mean spill-over from NDF
to both spot and forward rupiah markets with an exception of Europe crisis On volatility spillover
the study obtained significant results from NDF market to spot market for entire period However
in crisis situation the study found interdependence between volatility in offshore NDF and onshore
spot rate changes while information transmission is only valid from NDF to forward rate changes
not the other way around (Cadarajat and Lubis 2012)
To reduce the unwarranted influence of NDF market on spot market BI took initiatives beginning
the year 2014 to bridge the gap between onshore and offshore rupiah rate In 2014 the central bank
381
150
200
250
300
350
400
450
Jun-0
9
Dec
-09
Jun-1
0
Dec
-10
Jun-1
1
Dec
-11
Jun-1
2
Dec
-12
Jun-1
3
Dec
-13
Jun-1
4
Dec
-14
Jun-1
5
Dec
-15
Jun-1
6
Dec
-16
Jun-1
7
Dec
-17
Jun-1
8
Dec
-18
Chart 8 Non-resident holdings as percetage to total Government
Debt
42
with the help of key offshore centre Singapore moved the foreign exchange rate fixing that is used
to settle the NDF contracts to the onshore market Earlier Association of Banks in Singapore
(ABS) and the Singapore Foreign Exchange Markets Committee (SFEMC) was publishing IDR
reference rate computed as weighted average of 1-month NDF trades done by then Singapore
based brokers Post March 27 2014 BI started publishing reference rate termed as Jakarta Inter-
bank Spot Dollar Rate (JISDOR) which was to be used to settle existing and new contracts Jakarta
Interbank Offered Rate (JIBOR) is more transparent in a way that it is based on actual transactions
being done in the inter-bank onshore market
In late 2018 BI in its efforts to further deepen the domestic foreign exchange market and to
mitigate IDR exchange rate risk BI established the Domestic Non-Deliverable market (DNDF)
for IDR It will serve as a parallel market to NDF with the key difference that it is rupiah settled
in onshore market This alternative tool will provide foreign investors additional avenues to hedge
their IDR exposure without principal exchange other than enhancing the central bankrsquos
intervention capabilities At this juncture the market is relatively new and hence significant impact
assessment of the same cannot be outlined However currently Indonesia has not been able to
move significant turnovers from offshore NDF to Domestic NDF market
Brazil
Brazilian Real is the second most actively traded currency in NDF market after the Korean Won
with an average daily turnover of USD 187 billion as per BIS and USD 154 billion according to
the London survey The growth and development of NDF market is attributed to the existence of
large and well developed foreign exchange futures market
The development of derivatives market in Brazil is attributed to the hedge culture that has been
prevalent due to periods of high and persistent inflation and exchange rate volatility amidst
political shocks During 1980s and early 1990s inflation was soaring above 100 per cent which
peaked over 2700 per cent in 1993 and thus promoted widespread indexation to manage the
inflation risks Subsequently the ldquoReal planrdquo which comprised of fiscal and monetary reform and
introduction of new currency helped to bring down inflation and stabilise the currency Amidst
stable macroeconomic conditions private sector was encouraged to borrow foreign funds at a
43
lower cost and the consequent surge in foreign indebtedness during 1994 to 1998 led the central
bank issue dollar denominated securities as a hedging instrument Following the currency crisis in
1999 the Brazilian Real was floated amongst adoption of new set of economic policies which was
also accompanied by providing unrestricted access to non-residents to financial markets (including
derivatives) in 2000
The distinguishing feature of Brazilian foreign exchange is the non-deliverable nature of
derivatives contracts without any significant limitations even though participation in deliverable
instruments ie spot outright forwards and foreign exchange swaps is constrained Only chartered
banks are authorised by the central bank to hold foreign exchange spot positions All these factors
have facilitated the growth of foreign exchange futures market over spot market which is closed
and highly restricted Against the backdrop of large and sophisticated foreign exchange derivatives
with high depth and liquidity foreign exchange futures prices have key influence on spot price as
suggested by various studies (Ventura and Gracia 2009 Kaltenbrunner 2010 and Chamon and
Gracia 2013) As pointed out by Kaltenbrunner 2010 the existence of a deep futures market has
made it possible for foreign banks with branches in Brazil to sell real offshore (NDF) and
simultaneously hedge their real exposure in the onshore futures market For the Brazilian Real
derivatives especially offshore NDFs are the main vehicle for investors looking to implement
carry trades (Santaelaa 2015)
Taiwan
The NDF market for Taiwanese Dollar (NTD) existed since 1990s and the central bank permitted
domestic and foreign legal entities to trade in NTD NDF market with authorised banks in 1995
This came after opening up of local securities market to foreign institutional investors (QFII) in
1990 which allowed FIIs meeting certain requirements to apply for investment in Taiwanrsquos stock
market Subsequently significant relaxations were made and security market was completely
opened up with the abolition of QFII scheme While onshore institutions were eligible for trading
in NTD NDF the central bank initially imposed limits on trading position in NTD NDF to one
third of their total foreign exchange position with a view to prevent speculative pressure
44
Following the Asian financial crisis in July 1997 the central bank introduced measures to regulate
NDF market with only authorized banks permitted to carry NDF trading with other authorised
counterparts and their overseas branches or headquarters This move came after the speculative
positioning which was believed to cause sharp depreciation of the NTD The central bank outlined
that although there was ceiling on NTD NDF trading positions some banks were engaged in selling
NDFs to foreign entities and simultaneously created long NDFs positions and shorted DFs with
domestic entities in a bid to offset the NDF trading positions on their balance sheets and thus
creating more room for further NDF trading (Bank of Taiwan Annual Report 2014) The central
bank has intervened in foreign exchange market to curb speculative activity also post 2008
financial crisis when emerging markets witnessed resurgence of capital flows The measures
introduced then by the central bank focused on reducing local banksrsquo foreign exchange positions
in both onshore and NDF markets including discouraging non-resident deposits by imposing
punitive reserve requirements with an intent to limit local banksrsquo capacity to provide liquidity to
NDF markets The National Supervisory Commission also took steps to limit non-resident
investments in local bank deposits and government securities
However recognising the dominance of foreign banks in NDF trading activity the central bank
announced that overseas branches of domestic banks are eligible to apply for NTD NDF business
from September 2014 In current scenario whilst there are no restrictions on the fixed income
investments in general but investments in localdomestic bonds by non-residents cannot exceed
30 per cent of their investments in equity instruments which has kept the investments in local
bonds low by non-residents who tend to take exposure in USD bonds issued by Taiwan offshore
Moreover ability for local banksrsquo to access the TWD NDF market up-to 20 per cent of each banksrsquo
net open position results in partial integration between onshore and offshore markets Since TWD
is not fully convertible any onshore spot transactions must be declared to the central bank and in
most cases require supporting documentation which keeps the differential between onshore and
offshore rate
To conclude cross county experience shows that increasing role of any economy globally is
accompanied by emergence of growing offshore trading of their currencies in the presence of
restricted access or cumbersome regulations Additionally emerging market economies cannot
afford to have unrestricted access to their onshore market as revealed by the studies of Indonesia
45
and Malaysia during the Asian crisis 1997 which exposed them to global impulses Most of these
countries have followed a gradual approach surrounding non-resident access to their forex markets
As emerging markets open up and become sophisticated in respect of forex markets the case study
of the Republic of Korea exemplify that country-specific factors have to be considered when
designing the financial regulatory toolkit aimed at curbing foreign and domestic agentsrsquo
speculative strategies in the search for yield The experience of Brazil suggests deepening onshore
hedging market will go a long way in promoting the price setting role of onshore market over its
offshore counterparts Indonesia has recently introduced domestic NDFs in line with Brazil
Additionally the experience of Korea and Taiwan suggests that the participation of domestic banks
ensures that any price differential between the two segments is arbitraged However in both the
cases participation is governed to evade any potential build-up of vulnerabilities on banksrsquo balance
sheet
46
Chapter 34
Linkages between Offshore NDF and Onshore Rupee Markets New Evidence
Overarching Motivation
Indiarsquos trade integration with the rest of the world began to rise sharply from the turn of the
millennium Between 2000 and 2012 total trade (imports + exports) as a percentage of GDP more
than doubled from 26 to 56 before moderating to 43 in 2018 as the effects of de-
globalization took over post the global financial crisis Simultaneously policymakers persevered
with gradual but consistent capital account liberalization Unsurprisingly therefore currency
markets ndash both to trade and hedge ndash rose in tandem with the growing external integration The
onshore Rupee market5 monthly average turnover has grown from USD 60 billion in 2000 to USD
687 billion in 2018 However given data limitations uncertainty still exists on the exact size of
the NDF market and how it has grown relative to the onshore market As Chapter- 2 illustrates
the BIS Triennial Survey finds average daily turnover of Rupee NDF in 2016 was USD 16 billion
However the Bank of Englandrsquos Semi-Annual Forex Turnover Survey finds average daily
turnover of Rupee NDF in London increased from USD 8 billion in October 2016 to USD 23
billion in October 2018
The idea behind trying to size the NDF market ndash and therefore implicitly compare its size and
growth to onshore markets ndash is in part to try and make sense of how important a role NDF markets
play in the ldquoprice discoveryrdquo of the Rupee6 With the Indian Rupeersquos ldquoForwardrdquo price being
determined across segmented markets ndash both the onshore deliverable forward market and the
offshore non-deliverable market -- the key is to ascertain the relative importance of each of these
markets in driving price discovery
4 This chapter is a joint work of Shri Sajjid Chinoy Chief Economist J P Morgan India and Shri Harendra Behera
Assistant Adviser Department of Economic and Policy Research Reserve Bank of India 5 Spot OTC amp ETCD
6 To be sure estimating the size of the NDF market is important not just for the influence it exerts on price discovery
but also instructive in understanding the cumulative ldquoviewrdquo on the Rupee and how much is expressed onshore versus
offshore This is because if NDF volumes are substantial policymakers may desire to shift these volumes on shore
both to (i) deepen the onshore market and (ii) move this businesseconomic activity on shore
47
However simply using (offshore versus onshore) volumes as a means to proxy relative price
discovery is imperfect at best The ability of NDF volumes to drive price discovery for any given
quantum of volumes is ultimately a function of how inter-connected onshore and offshore markets
are and the ability of economic agents ndash hedgers arbitrageurs speculators -- to link these markets
For example if NDF markets have grown sharply but it is found that price linkages between the
two markets are still tenuous or have not increased commensurately with volumes -- say because
arbitrage opportunities between the two markets have not grown in tandem -- then the growth of
NDF markets and the consequent ldquoloss of controlrdquo will be of less concern to Indian policymakers
Conversely if price linkages have grown over time ndash proportionately to volume increases ndash then
policymakers would rightly worry about the growing role of NDF markets in driving price
discovery
The fundamental motivation for this chapter is therefore to empirically examine price linkages
between the NDF and onshore markets as this is the ultimate manifestation of the influence that
NDF markets exert
The Question
This chapter seeks to ask two fundamental questions Is there a stable long-term equilibrium
relationship between onshore and offshore markets Second if so what is the directionality of
influence Do NDF markets drive onshore markets Or do onshore markets drive the NDF market
Or is the influence bi-directional
Furthermore we try and empirically answer this questions across two dimension First what is the
direction and quantum of influence during ldquonormal times versus ldquostressed timesrdquo Second what
is the relationship and how does it change when assessing ldquoaverage returnsrdquo (means) versus
ldquovolatilityrdquo (variance)
Specific Motivation to India
While there is a meaningful and growing literature trying to empirically ascertain price linkages
between the onshore and offshore markets around the world the literature that focuses on India
remains sparse dated and inconclusive This constitutes the specific motivation for this chapter
48
The literature studying NDF markets around the world has steadily grown over time For example
much work has been done on Asian NDF markets and their relationship with onshore markets
both for the region as a whole (Ma et al 2004 Colvecchio et al 2006 Wang et al 2007 Gu and
McNelis 2009) and individual currencies such as the Korean Won (Park 2001) the Indonesian
Rupiah (Cadarajat and Lubis 2012) the Chinese Yuan (Fung et al 2004 Hideki 2006
Colavecchio and Funke 2008 Huszaacuter et al 2016 Song and Gao 2016 McCauley and Shu 2018)
and the Indian Rupee (Misra and Behera 2006 Guru 2009 Behera 2011 Darbha 2012 Goyal
et al 2013)
Results remain mixed Some studies find the NDF markets influence the evidence onshore forward
market (Park 2001 Wang et al 2007 Cadarajat and Lubis 2012) others find they influence
onshore spot markets (Behera 2011 Goyal et al 2013) while some document its influence on
onshore futures markets (Behera 2011) Conversely some studies also find the direction of
influence runs from onshore markets to NDF markets (Wang et al 2007 Misra and Behera 2006)
In the case of India there are only a few studies on this subject ndash with the last one back in 2013 ndash
and the results are mixed and inconclusive For example Misra and Behera (2006) find that itrsquos
the onshore markets that influenced the NDF market between 2004 to 2007 largely because of
restricted participation of domestic players in the offshore market In a subsequent study Behera
(2011) found that there are volatility spillovers from the NDF market to spot and forward markets
in India and the magnitude of volatility spillover has become higher after the introduction of
currency futures in 2008 Guru (2009) finds qualitatively the same results and the role of currency
futures in India Darbha (2012) find that offshore markets play an important role in price discovery
Finally in the most recent work on India (Goyal et al 2013) find evidence of a long-term
relationship between NDF and onshore markets and find evidence that the relationship is
bidirectional as both markets adjust to any deviations from the equilibrium state
Whatrsquos clear however is the evidence on India is patchy inconclusive and dated with the last
study conducted more than 6 years ago
Some Theory
Recall if there are no capital controls forward rates are tied down by the no-arbitrage ldquocovered
interest parityrdquo hypothesis
49
F = S(1+r)(1+r$ )
Where F is the Forward rate S is the spot rate r is the relevant interest rate on the home currency
and r$ is the equivalent dollar rate The equation holds when (i) there is capital account
convertibility and there are no barrier for cross-border transactions and (ii) there is equivalent
credit risk in the assets across the two jurisdictions
However if there are capital-account barriers we would expect F to only be approximated by the
equation above and not hold exactly
So F ~ S(1+r)(1+r$ )
Similarly the NDF rate should be anchored by the onshore forward rate to the extent that
arbitragers can link these markets
So NDF ~ F ~ S(1+r)(1+r$ )
Furthermore the sign of the onshore-offshore yield spread can indicate the underlying market
pressure on the currency If the domestic interest rate is higher than the NDF implied yield it
implies appreciation pressures on the currency However capital controls may restrict inflows to
close the gap Similarly a lower domestic interest rate than implied by the NDF yield would
suggest depreciation pressures while a zero spread would likely reflect an absence of market
pressure on both the domestic and offshore market
All told however we would expect that both onshore and offshore markets would have a long-
run relationship and there is the likelihood of ldquomeanrdquo spillovers on a regular basis Furthermore
hedging arbitrage and speculative activities may also result in volatility spillovers from one
market to another on various occasions
Testing for ldquoMeanrdquo Spillovers
We start therefore by empirically testing for linkages between onshore (spot and forward prices)
and offshore (NDF forward prices) markets The goal is to assess
1 If there is a stable long-term relationship between onshore and offshore markets
2 Which drives which Do onshore prices drove offshore prices Or vice versa
50
3 To see whether the direction of influence is a function of context Are the results
different for ldquonormalrdquo times versus ldquostressed periodsrdquo (ie taper tantrum emerging
market stress)
Non-stationary but co-integrated
So as to decide the empirical course of action we start by testing whether the key variables of
interest (i) the Onshore Spot Exchange Rate (SPOT) (ii) the Onshore Forward Rate (FORWARD)
and (iii) the Offshore Non-Deliverables Forward exchange rate (NDF) are stationary
Augmented Dickey Fuller Tests reveal that all three variables are non-stationary in levels
However as Figures 1 and 2 suggest the spreads between SPOT and NDF and ONSHORE
FORWARDS and NDF are mean-reverting suggesting the presence of a long-term relationship
and suggesting stationarity in the first differences
Formal co-integration tests ndashTables 2 and 3 ndash confirm that both pairs of variables NDF-SPOT and
NDF-FORWARD ndash are indeed co-integrated The Max Eigenvalue tests reveal there is at least one
co-integrating vector that can be found at the 5 level
Null Hypothesis Variables have a unit root
ADF t-Stat Prob
Spot -06 09
Augmented Dickey-Fuller test statistic-07 08
Augmented Dickey-Fuller test statistic-07 08
Table 1 ADF unit root test
-15
-05
05
15
25
09 10 11 12 13 14 15 16 17 18 19
level
Figure 1 Spreads (1M NDF- Spot)
51
-25
-15
-05
05
15
25
09 10 11 12 13 14 15 16 17 18 19
level
Figure 2 Spreads (1M NDF- 1M Forward)
Table 2 Co-integration SPOT and NDF
Sample (adjusted) January 2005 to March 2019
Included observations 2608 after adjustments
Trend assumption No deterministic trend (restricted constant)
Series LOG(SPT) LOG(NDF)
Unrestricted Cointegration Rank Test (Trace)
Hypothesized Trace
No of CE(s) Eigenvalue Statistic Critical ValueProb
None 011 31310 2026 000
At most 1 000 210 916 076
Unrestricted Cointegration Rank Test (Maximum Eigenvalue)
Hypothesized Max-Eigen005
No of CE(s) Eigenvalue Statistic Critical ValueProb
None 011 31100 1589 000
At most 1 000 210 916 076
Both Trace and Max-eigenvalue tests indicates 1 cointegrating
eqn(s) at the 005 level
52
Stable Long Term Relationship
The finding of co-integration allows us to use ordinary least squares (OLS) to estimate the long-
term relationship between SPOT and the NDF as well as FORWARD and the NDF In particular
using the equation below we estimate parameters β0 and β1 which tells us about the long-term
relationship between SPOT and NDF
We then repeat the same exercise between the FORWARD and the NDF
But whatrsquos driving what An ldquoError Correction Mechanismrdquo approach
While establishing a long-term relationship is important a finding in the affirmative will not come
as a particular surprise Instead the real question is whether onshore prices drive offshore prices
or vice versa The natural framework to answer this is the work-horse Error Correction Mechanism
(ECM) approach used by Engel and Granger in 1987 where changes in each of the variables are
run on changes on its own lags and the lags of the other variables
Table 3 Co-integration FORWARD and NDF
Sample (adjusted) January 2005 to March 2019
Included observations 2608 after adjustments
Trend assumption No deterministic trend (restricted constant)
Series LOG(FORWARD) LOG(NDF)
Unrestricted Cointegration Rank Test (Trace)
Hypothesized Trace
No of CE(s) Eigenvalue Statistic Critical ValueProb
None 018 53051 2026 000
At most 1 000 217 916 074
Unrestricted Cointegration Rank Test (Maximum Eigenvalue)
Hypothesized Max-Eigen 005
No of CE(s) Eigenvalue Statistic Critical Value Prob
None 018 52835 1589 000
At most 1 000 217 916 074
Both Trace and Max-eigenvalue tests indicates 1 cointegrating
eqn(s) at the 005 level
53
119889119897119900119892(119904119901119900119905)119905 = 1205720 + 120572119904119901119900119905(119890119905minus1) + sum 12057211(119894)(119889log (119904119901119900119905119905minus1))119899119894=1 + sum 12057212(119894)(119889log (119873119863119865119905minus1)) + 120576119904119905
119899119894=1 (1)
119889119897119900119892(119873119863119865)119905 = 1205720 + 120572119899119889119891(119890119905minus1) + sum 12057221(119894)(119889119897119900119892(119904119901119900119905119905minus1))119899119894=1 + sum 12057222(119894)(119889119897119900119892(119873119863119865119905minus1)) + 120576119899119905
119899119894=1 (2)
For example as Equation 1 lays out changes in (the log of) SPOT ndash the dependent variable -- are
run on its own lags and the lags of NDF Equation 2 ndash in which the dependent variable is NDF --
does the same for NDF Because both variables are co-integrated ndash as shown above ndash using OLS
to estimate these coefficients using standard criterion to choose lag lengths (eg Akaike
Information Criterion) and standard F-Tests are all valid
The coefficients of interest in the above equation are 120572119904119901119900119905 and 120572119899119889119891 ndash the ECM terms -- because
these coefficients tell us when the system is in disequilibrium the direction and the speed of
adjustment back to equilibrium This will determine the directionality of influence
For example if 120572119904119901119900119905 = 0 and if all values of 12057212(119894) = 0 then dlog(NDF) does not granger cause
dlog(spot) In contrast if the value of 120572119904119901119900119905 is negative and statistically significant that implies
that (the log of) NDF in the long run ldquoganger-causesrdquo spot market movements The same intuition
applies for equation 2 where NDF is the dependent variable and we test for convergence between
the NDF rate and the onshore forward rate Direct convergence requires 120572119904119901119900119905and 120572119899119889119891 to be
oppositely sign Intuitively the larger the value of α the faster is the speed of adjustment
In summary while the βrsquos tell us about the existence and strength of a long run relationship
between onshore and offshore markets the αrsquos tell us about whether (i) the directionality of
influence and (ii) the speed of convergence from disequilibrium
We therefore use this approach to test for linkages between both sets of variables ndash NDF and
onshore SPOT ndash and NDF and onshore FORWARDS
Data
We use end-of- India-day closing values for the onshore spot exchange rate for the 1-month a
forwards and the corresponding 1-month non-deliverable-forward (NDF) rates We use daily data
and our full sample runs from 2009 through 2019
54
Results Full Sample
Table 4 ECM and Long run coefficients (Full sample)
The first row are the linkages between the onshore spot and NDF markets while the second row
is that of the onshore forwards and NDF market
In both cases the betas (β) are positive statistically significant and with a magnitude very close to
or at 1 implying an almost one-for-one movement between both the markets in the long run For
example the estimated β1 of 099 suggests that for a 1 increase in NDF rates there is 099
increase in spot rates in the long run Meanwhile between onshore FORWARDS and NDF there
is a complete pass-through in long run More generally a beta (β) close to 1 suggests there is no
permanent friction between onshore and offshore markets in the long run
Convergence
However the real interest is in the alphas In the first case both 120572119904119901119900119905 and 120572119899119889119891 are statistically
significant and oppositely signed This suggests that they both converge towards each other Put
differently the NDF rate moves towards the onshore SPOT rate and vice-versa In other words
there is a bi-directional relationship between both variables The magnitude of the coefficients
(007-018) suggests a moderate speed of convergence to the long-run equilibrium when a shock
causes the system to go into disequilibrium
The same results are obtained when studying linkages between the onshore forward and NDF
markets Both 120572119891119900119903119908119886119903119889 and 120572119899119889119891 are statistically significant oppositely signed (suggesting they
converge towards each other) with coefficients that are slightly larger than the SPOT-NDF pair
This suggests that both NDF and the onshore FORWARD rates influence each other and gradually
converge towards their long-term relationship when hit by a shock ndash a speed of adjustment that is
modestly faster than the NDF-SPOT relationship
Time Period April 2009 to March 2019
Onshore Spot and NDF -018 007 099
Onshore Forwards and NDF -032 023 100
55
For the full sample as a whole from 2009 to 2019 we find that there is a bi-directional relationship
on average between SPOT and NDF and FORWARD and NDF and that all variables converge
gradually to their long-term relationship
Results Stressed Times
Our results should be thought of as ldquoaveragerdquo results across the entire time period But are these
results a function of context Does the direction of influence change for example during periods
of currency stress versus periods of calm We explore this next
To test for this we start by isolating clearly-identifiable periods of stress ex post facto in our
simple Two episodes naturally come to mind the taper tantrum of 2013 (where the Rupee
depreciated 26 between May 2013 and August 2013) and the emerging market (EM) turmoil ndash
characterized both by the Fed raising rates and oil prices firming ndash such that the Rupee depreciated
almost 10 between August 2018 and October 2018
2013 The Taper Tantrum
We test interlinkages from the start of May to the end August 2013 ndash during the Taper Tantrum ndash
when the Rupee was under intense pressure and easily amongst the worst performing currencies
in the emerging market (EM) universe Results are presented in Table 5 below
Table 5 ECM and Long run coefficients
As one can observe 120572119899119889119891 in both equations is statistically insignificant What this implies is onshore
spot and forward rates were playing very little role in influencing NDF rates7 In contrast 120572119904119901119900119905 and
120572119891119900119903119908119886119903119889 are correctly signed and statistically significant (the former at the 1 level and the latter
at the 10 level) which suggests it was the NDF rate that was driving the onshore spot and forward
rates Interestingly the speed of adjustment is much faster for onshore spot rates in this sample (-
11) compared to the full sample (-018) and also relative to the onshore forward market (-08) An
7 In fact onshore spot and forward rates do not granger cause NDF as none of the lags of 12057221(119894) in equation 2 are
statistically significant during this period
Onshore Spot and NDF -11 -028 094
Onshore Forwards and NDF -08 015 097
Time Period May 2013 to August 2013
56
ECM (alpha) coefficient of greater than 1 suggests the witnesses an oscillating convergence Since
a coefficient greater than 1 is prime facie surprising we also conduct a robustness exercise
(described below) by running Granger Causality tests for this time period and find it is the NDF
that Granger-causes onshore rates and not the other way around
This finding likely reflects the growing volumes ndash potentially speculative ndash in the NDF market in
the 2013 period of stress relative to the volumes in the onshore market This also prime facie
reduced the efficacy of foreign currency intervention by the central bank because intervention was
used to shape the spot exchange rate at the end of Indiarsquos business day But because the NDF is a
24 hour market NDF rates evolved overnight and when the Indian market opened the next day
onshore rates were influenced by NDF developments overnight This rendered ineffective the
previous dayrsquos intervention because there was often little correlation between the closing exchange
rate of the previous day and the opening rate of the next day and therefore necessitated additional
intervention the next day
Visually this is evident in the ldquogap-uprdquo movements of the exchange rate when the Indian market
opened ndash vis-a-vis the previous dayrsquos close ndash during those three months Figure 3 for example
captures this for the month of August 2013
Figure 3 Gap-up opening in USDINR (August 2013)
Source Bloomberg
57
2018 More of the Same
Emerging markets came under renewed stress in the summer of 2018 against the back drop of the
Fedrsquos hiking cycle accompanied by the rally in crude pieces which had surged 50 over the course
of a year As some large emerging markets ndash Argentina Turkey ndash came under some stress there
was a contagion to all emerging markets with current account deficits of which India was one
Between May and October 2018 the Rupee depreciated almost 10 against the US Dollar
What were the offshore-onshore linkages during that period of time Results are presented in Table
6
Table 6 ECM and Long run coefficients
The linkages mimic 2013 The coefficient on whether onshore drives offshore 120572119899119889119891 is insignificant
in both regressions This re-affirms that in line with 2013 onshore spot and forwards were not
driving the NDF rate8 In contrast 120572119904119901119900119905 and 120572119891119900119903119908119886119903119889 are both correctly signed quantitatively
meaningful and statistically significant This suggests that it was the NDF rate that drove the
onshore spot and forward during this period likely reinforcing the presumption that volumes rise
sharply in NDF markets during periods of stress which then become the hub of price discovery
and influences onshore rates As Figure 4 reveals this is visible in the ldquogap-uprdquo movement of the
Rupee at the start of the day for several days in the month of August 2018
8 Onshore spot and forward rates does not granger cause NDF as none of the lags of 12057221(119894) in equation 2 are
statistically significant
Time Period August 2018 to Nov ember 2018
Onshore Spot and NDF -10 -05 096
Onshore Forw ards and NDF -115 -05 096
58
Figure 4 Gap-up opening in USDINR (August 2018)
Source Bloomberg
Our analysis also reveals that the speed of adjustment is very rapid relative to the baseline
Robustness test
The results are robust to the selection of time and tenure of the NDF For example instead of
India end-of-day (EOD) time as the NDF cut-off if we consider New York EOD as the NDF cut-
off there are no qualitative changes in the results Similarly instead of considering the 1-month-
NDF if we consider the 3-month-NDF the results essentially stay the same Furthermore given
the short time periods involved during stressed times (May to August 2013 and August to
November 2018) one can argue that co-integration equations may not be relevant We therefore
also carry out Granger causality tests for these time-periods and find the direction of causality to
be just above ie NDF rates are driving onshore rates during stress periods and not vice versa
Controlling both ldquoMeanrdquo and ldquoVolatilityrdquo spillovers
Thus far our focus has been on mean spillovers However as found by Misra and Behera (2006)
there are also potential ldquovolatilityrdquo spillovers from the NDF market to the spot and forward market
To model the coexistence of both mean and volatility spillovers we use a multivariate generalised
autoregressive conditional heteroskedasticity (MGARCH) model The degree of volatility
59
spillovers is measured by estimating dynamic conditional correlations between the markets The
empirical analysis is conducted using daily data from April 1 2009 through March 29 2019 and
using the currency pairs for (i) NDF-Spot (ii) NDF-Forwards and (iii) NDF-Futures
This model examines simultaneous interactions of conditional returns and volatilities across the
markets In this modelling framework we examine the Granger-causality in mean and variance as
discussed in Behera (2018) The results corroborate the earlier results that there is bi-directional
mean spillovers between onshore and offshore markets (Table 7)
An important finding using this approach is that the impact of price spillover from offshore to
onshore remains up to substantial lags while that from onshore to offshore dissipate after one day
(Annexure II) This ensues from the result that the individual coefficient estimates in the mean
equations of BEKK-MGARCH model are found to be statistically significant up to 5 lags in the
regression of returns in onshore market on that of offshore market while in the opposite case the
coefficient of onshore return is statistically significant only for the first lag
Table 7 Granger-causality tests in Mean
Direction of Causality Results
Spot to NDF 1-Month Yes
Spot to NDF 3-Month Yes
Spot to NDF 6-Month Yes
NDF 1-Month to Spot Yes
NDF 3-Month to Spot Yes
NDF 6-Month to Spot Yes
Forward 1-Month to NDF 1-Month Yes
Forward 3-Month to NDF 3-Month Yes
Forward 6-Month to NDF 6-Month Yes
NDF 1-Month to Forward 1-Month Yes
NDF 3-Month to Forward 3-Month Yes
NDF 6-Month to Forward 6-Month Yes
Futures 1-Month to NDF 1-Month Yes
Futures 3-Month to NDF 3-Month Yes
Futures 6-Month to NDF 6-Month Yes
NDF 1-Month to Futures 1-Month Yes
NDF 3-Month to Futures 3-Month Yes
NDF 6-Month to Futures 6-Month Yes
Note Null hypothesis is rejected if the p-value in the Wald test is less than 5 per cent
60
Volatility spillover between markets are studied by examining the statistical significance of
individual coefficients Granger causality in variance tests and estimating the dynamic conditional
correlations Beginning with granger causality test results imply a bidirectional causal relationship
between volatilities in both onshore and offshore markets of 1-month maturity segments only
(Table 8) In normal times no volatility spillovers are observed across the markets in other
maturity segments which reverses in the period of increased uncertainty (as found from Granger-
causality-in-variance tests taking into account asymmetric effects) The results from individual
coefficient estimates indicate about the presence of short-term volatility spillover between the
markets while the long-term volatility transmission is statistically significant from NDF market
to onshore spot forward and futures markets Moreover the asymmetric coefficients in variance
equation provide interesting insights ndash with the evidence of rise in volatility spillover from onshore
to offshore market in case of rupee appreciation while the opposite happens ie the volatility
spillover increases from NDF market to onshore market in the episodes of rupee depreciation
(Annexure II)
Table 8 Granger-causality tests in Variance
Direction of Causality Results
Without Asymmetry Effect With Asymmetry Effect
Spot to NDF 1-Month No Yes
Spot to NDF 3-Month No Yes
Spot to NDF 6-Month No Yes
NDF 1-Month to Spot No Yes
NDF 3-Month to Spot No Yes
NDF 6-Month to Spot No Yes
Forward 1-Month to NDF 1-Month Yes Yes
Forward 3-Month to NDF 3-Month No Yes
Forward 6-Month to NDF 6-Month No Yes
NDF 1-Month to Forward 1-Month Yes Yes
NDF 3-Month to Forward 3-Month No Yes
NDF 6-Month to Forward 6-Month No Yes
Futures 1-Month to NDF 1-Month Yes Yes
Futures 3-Month to NDF 3-Month No Yes
Futures 6-Month to NDF 6-Month No Yes
NDF 1-Month to Futures 1-Month Yes Yes
61
NDF 3-Month to Futures 3-Month No Yes
NDF 6-Month to Futures 6-Month No Yes
Note Null hypothesis is rejected if the p-value in the Wald test is less than 5 per cent
In order to understand how the volatility spillover between the markets changed over time a
variant of MGARCH model viz dynamic conditional correlation (DCC) model as proposed by
Engle (2002) is estimated taking the same pair of onshore-offshore exchange rate returns The
conditional volatility of 1-month NDF 1-month futures and their dynamic correlations are plotted
in Chart 249 The chart shows a sudden and significant rise in volatility during the episodes of
European debt crisis taper tantrum and latter part of 2018 coinciding with the rise in offshore-
onshore spreads resulting from the concerns regarding high current account deficits and large
capital outflows It is important to note that the volatility in NDF market is higher compared to
futures market and the divergence between the two gets accentuated in the times of heightened
uncertainty This in turn in conjunction with the rise in information asymmetry results in a drop
in correlations Since volatility spillover increases from offshore to onshore markets as discussed
earlier during periods of heightened uncertainty the volatility in onshore market increases
following the heightened volatility in offshore market In subsequent periods the correlation
increases indicating about the rise in spillovers A closer examination of the data on the volatilities
in two markets shows that volatility increases in offshore market first before it increase in onshore
markets with a lag of 1 to 2 days The correlations being positive and substantially higher imply a
significant degree of spillovers between the markets
9 The conditional volatilities for other pairs are qualitatively almost similar though their dynamic correlations are
different the dynamic correlations are provided in Chart 25
62
The dynamic correlations of volatilities for different pairs are presented in Chart 25 reveal that
that all the correlations were highly integrated and moving together alike until end December 2014
However the apparent structural changes in correlation process were observed since then with the
trends of correlations of NDF with spot and forward moving in one direction and that of NDF and
Futures moving on the opposite direction until mid-2017 The correlations have started coupling
though still continuing with some gaps between them since July 2017
060
065
070
075
080
085
090
095
00
05
10
15
20
25
30
2009 2010 2011 2012 2013 2014 2015 2016 2017 2018
Chart 24 Time-varying Volatility and Correlations Futures and
NDF
1-month Futures 1-month NDF DCC (right scale)
63
Conclusions and Implications
Since the work on establishing onshore-offshore price linkages in India was relatively sparse
outdated and inconclusive the goal of this Chapter was to create an updated empirical fact base
given the rapidity with which capital markets have developed and integrated and the pace at which
the NDF market has grown The overall results present a bidirectional relationship between
onshore and offshore markets
First that for full sample the price linkages ndash both mean and volatility ndash are found to be
bidirectional Both onshore and offshore rates have a strong long-term relationship and that when
a shocks throws that relationship into disequilibrium both onshore (spot and forward) and offshore
rates converge towards each other This suggests both influence each other This is consistent with
earlier findings in literature and should not be surprising Relative volumes across these market
are very dynamic and vary significantly When the bulk of the volumes flow through the onshore
050
055
060
065
070
075
080
085
090
095
100
2009 2010 2011 2012 2013 2014 2015 2016 2017 2018
Chart 25 Dynamic Conditional Correlations of Volatilities
SPOT_NDF1 SPOT_NDF3 SPOT_NDF6 FW1_NDF1 FW3_NDF3
FW6_NDF6 FUT1_NDF1 FUT3_NDF3 FUT6_NDF6
Forwards
Futures
Spot
64
market it becomes the locus of price discovery The converse is true when the bulk of volumes
are routed through the NDF market which then becomes the principle pole of price discovery
During the last two stress episodes (the taper tantrum and the 2018 EM crisis) however the
relationship turned unidirectional with the NDF market driving onshore spot and forwards and
the speed of adjustment from any disequilibrium increasing very sharply compared to ldquonormalrdquo
times Furthermore volatility spillovers also increased from offshore markets to onshore during
the periods of heightened uncertainty There is however an interesting asymmetry There is
evidence of rise in volatility spillover from onshore to offshore market in case of rupee
appreciation while the opposite happens ie the volatility spillover increases from NDF market to
onshore market in the episodes of rupee depreciation
All told as NDF volumes have increased they have begun to play an important role in both price
discovery and driving volatility particularly during heightened uncertainty periods
65
Chapter 4
International Financial Service Centre (IFSC)10 ndash Use of Rupee derivatives
The Task Force (TF) is vested to examine the role if any IFSC can play in addressing the concerns
arising out of offshore Rupee markets Presently Rupee is not permitted to be traded in the IFSC
This chapter discusses the aspects relevant to availability of non-deliverable Rupee derivatives in
the IFSC and permitting banks (IFSC Business Units or IBUs) to deal in such derivatives Before
discussing the potential benefits and concerns from the aforesaid proposition it is important to
address this issue ndash Are markets in IFSC onshore or offshore In the context of the Rupee market
a critical test for deciding the residency of the market would be applicability of capital controls in
respect of taking and exiting positions under FEMA 1999 Inter alia this is the critical aspect in
difference between the price discovered in onshore and offshore market As the IFSC functions
outside the capital controls under FEMA 1999 type of participants and the price discovered in
Rupee markets here will align with the existing offshore markets and therefore it cannot be treated
as onshore market To sum up while legally IFSC is very much an entity on the shores of India
from the point of view of Rupee markets it has to be treated as an offshore entity
Potential benefits of permitting non-deliverable Rupee derivatives in the IFSC
i Bringing NDF market volume to the IFSC Over the last decade or so a significant
market share in financial services related to India has moved to other international financial
centres like Singapore Hong Kong and London Bringing this business to India is clearly
beneficial in terms of economic activity and employment gains for India Further the size
and growth of the offshore Rupee derivative market poses a significant challenge to the
efficiency of price discovery as well as the effectiveness of exchange rate management
policy The possibility that the exchange rate of the Rupee not a fully convertible currency
being materially determined by transactions largely outside the legal and regulatory
influence of India is a matter of concern Given the favourable tax regime tax and by virtue
10
International Financial Services Centre or lsquoIFSCrsquo has the same meaning given in Section 2 (q) of the Special
Economic Zones Act 2005 (28 of 2005)
66
of it being outside the capital controls under FEMA 1999 IFSC may bring volumes and
price discovery to India
ii Complete bouquet of financial services in the IFSC Currently exchanges in IFSC are
permitted to offer a well-diversified range of products spanning various asset classes
which include derivatives on Indian indices derivatives on Indian stocks derivatives on
foreign stocks cross currency derivatives commodity futures on Gold Silver and base
metals etc Further while listing and trading of Masala Bonds is permitted in the IFSC
hedging Rupee exchange rate risk on it is not permitted Thus introduction of Rupee
derivatives will complete the entire range of asset classes available for trading in the IFSC
iii Access to market information The offshore Rupee market has been the subject matter of
interest for all stakeholders as these markets have an impact on onshore markets However
in the absence of any authentic data there are varying estimates about the volumes traded
in these markets nature of participation extent of open interest and the extent to which
these markets are used for hedging purposes If by opening up the IFSCs to Rupee trades
there is some migration of offshore Rupee market volumes it will help the cause of better
information flow regarding the market
iv Level playing field for Indian banks Foreign bankrsquos branches outside India can deal in
the offshore market as they are not bound by the RBIrsquos regulations On the other hand
overseas branches of Indian banks cannot deal in Rupee derivatives in the offshore market
By introducing Rupee derivatives in IFSC and permitting IBUs to deal in such derivatives
a more level playing field can be provided to Indian banks to service non-residents
Concerns from non-deliverable Rupee derivatives trading in the IFSC and dealing by IBUs
such derivatives
i Cannibalizing onshore business One major concern arising out of the introduction of
non-deliverable Rupee derivatives in the IFSC is whether it would cannibalize the business
of the onshore market instead of importing volumes from abroad Since the products in
both IFSC and the onshore market would be more or less similar in terms of characteristics
the domestic futures market getting gradually cannibalized by the IFSC on the face of it
appears probable But a deeper analysis of the comparative regulatory framework would
allay such concerns to a large extent The domestic currency futures market is majorly
67
made up of resident participation Non-residents are nearly absent in these markets and
hence their shift to the IFSC is more a theoretical proposition Since the Indian residents
are not permitted to participate in the IFSC they cannot contemplate a move-over It also
important to note that the onshore market settles in INR whereas derivative contracts in
the IFSC would settle in dollars and hence these markets will cater to two distinct classes
of participants
ii Impact on exchange rate management policy and development of the onshore market
Presently Indian banks are not allowed to deal in Rupee derivatives in the offshore market
A detailed discussion on the issue of allowing such dealing is presented in Chapter 5 In
consideration of the risk that participation of Indian banks may improve liquidity in the
offshore market and undermine the development of the onshore market the TF is of the
view of that Indian banks should not be permitted to deal in offshore Rupee market IFSC
being an offshore centre all concerns expressed in Chapter 5 in this regard are valid on
Rupee market in IFSC also However unlike other offshore Rupee market venues IFSC
has the potential of providing certain benefits to India as discussed earlier in this chapter
and therefore a distinction could be made between the two while examining the case of
permitting Rupee derivatives to be traded in the IFSC
iii Spillover of risks from IFSC to onshore market This is a concern since the two
markets being geographically contiguous could create porous leakage channels This
concern can be addressed by stipulating distinct net open position limits for entities
operating in both IFSC and on-shore In other words the open positions of entities
operating in the IFSC should not be permitted to be netted off with the open position on-
shore
What does a volatile Rupee exchange rate in the IFSC imply for the RBI and onshore
market
Chapter 3 establishes the linkages between the offshore and onshore Rupee market IFSC being an
offshore jurisdiction will have the same impact The RBI as the monetary authority has the
authority under RBI Act to maintain the stability of the rupee A volatile onshore foreign exchange
market could act as the trigger point of volatility in other financial markets like money bonds and
68
equities The spill over impact of financial market volatility casts its shadow on asset prices and
in turn it could have an impact on the capital flows and financial stability Given that a separate
regulator is envisaged for the IFSC the issue of RBIrsquos role in the IFSC was extensively deliberated
by the TF There are two possible approaches
i RBI plays a pivotal role in framing the Rupee derivative regulation in the IFSC In
order to allow the RBI to take measures in line with the objectives of exchange rate
management policy the sine qua non for allowing Rupee derivatives in the IFSC is to
ensure that RBI vested with the obligations to maintain financial and monetary stability
should continue to perform its statutory role in determining the regulatory framework for
Rupee market in the IFSC
ii Treat it akin to any other offshore market and maintain a hands-off approach The
objective of introducing Rupee derivatives in the IFSC is to provide an alternative to non-
residents for dealing in non-deliverable Rupee derivatives The expected transition of
investors is likely to be successful only if the IFSC functions with same freedom as other
offshore markets At the same time from an exchange rate management perspective
permitting Rupee trading in IFSC should not make a material difference to local authorities
as long as there is a barrier between the onshore market and IFSC In that case IFSC would
be exactly of the same status as any other offshore market
The TF feels that in line with the objectives of permitting Rupee derivatives in the IFSC the latter
approach - that the regulatory environment in which Rupee trades in IFSC is exactly similar to the
environment that prevails in any other offshore centre - is preferable As IFSCs are treated on par
with a foreign jurisdiction in terms of FEMA the regulation of the trade and capital flow channels
between the two jurisdictions (on-shore and IFSCs) should be so designed as to restrict the
transmission of volatility through these channels (in terms of participants products limits etc)
Recommendation
While there are concerns around impact on the onshore market due to trading in Rupee derivatives
in the IFSC there are potential benefits in terms of IFSCrsquos ability to offer complete bouquet of
financial services and availability of market information to all stakeholders Further given Indiarsquos
69
economic growth it may be appropriate to prepare for greater financial integration with the rest of
the world Sequencing and timing of measures relating to currency markets is a critical component
of such integration Although at the moment there is no definite path ahead in terms of such
integration but a thriving Rupee market in the IFSC may provide a system which can be leveraged
towards this end in the way and manner deemed fit in future IFSC being outside the capital
controls provides an opportunity to policymakers to test new regimes and products in an
environment whose repercussions may not significantly impact the stability or efficiency of the
onshore system On balance the TF is of the view that non-deliverable Rupee derivatives may be
introduced in the IFSC However a phased approach may be adopted and to start with trading
may be permitted only on exchanges due to the inherent transparency and risk management
benefits offered by it Introducing OTC contracts may be considered at a later stage after the
experience gained from trading on exchanges RBI may in its Financial Stability report assess the
impact of the functioning of IFSC on the financial stability of the country
Further the TF is of the view that entities regulated and permitted by the RBI may be permitted
to make market and run positions in Rupee derivatives market in the IFSC In order to prevent
spill over of risks from IFSC to onshore market though these entities a distinct net open position
limit may be stipulated for their operations in the IFSC In other words the open positions of
entities operating in the IFSC should not be permitted to be netted off with their open position
the onshore market
Finally given the mandate of RBI to implement exchange rate policy it may not be in benefit of
things to introduce Rupee derivatives in the IFSC without it being on board and therefore the TF
feels that Rupee derivatives may be permitted in the IFSC subject to agreement of the RBI
70
Chapter 5
Issues and Recommendations
The Task Force (TF) is entrusted to recommend measures to incentivize non-residents to access
the onshore Rupee derivative market and address concerns if any arising out of the offshore
Rupee derivative market As discussed in Chapter 1 the TF had interactions with various
categories of stakeholders to understand their perspective on the matter and identify the issues that
needs to be addressed
Chapter 2 and 3 have clearly brought out the increased importance of offshore Rupee markets
both in terms of their size and in terms of their impact on the exchange rate of the Rupee The price
and volatility spillovers from one market to the other are almost complete they are bi-directional
and when rupee is under pressure they are unidirectional from offshore markets to onshore
markets The speed of convergence of the markets is also quite quick The TFrsquos recommendations
have been made in the light of available information results of statistical analysis and most
importantly on the feedback received from various consultations
While increased participation of non-residents would be expected to enhance liquidity in the
onshore market it may also bring along with it additional volatility and transfer of incremental
risk to the domestic system This is particularly so as historically the rupee is a currency that has
generally depreciated and the demand for forward dollars is usually more than the supply
especially in times of stress Hence it is pertinent to examine the impact of incremental hedging
by non-residents in the onshore market While volatility in the rates have a clear impact on the real
sector events in the domestic derivatives markets in the late 2000s constantly remind us of issues
related to transfer of risk to entities that are not capable of understanding and managing it The big
question then is whether our system today is ready for incremental demand for hedging from non-
residents Available data is inadequate to measure the contribution of hedgers and speculators in
the offshore market turnover Using the best available information it can be estimated that an
additional daily average Rupee derivative turnover of around 08 billion ndash 24 billion could be
generated in the onshore market if all the INR NDF hedging transactions are transferred from the
offshore market (see Box 1) Such an incremental flow is not significant enough to cause any
adverse impact on volatility in the onshore market given that the user-driven deliverable forwards
market in India is quite liquid with daily average turnover of USD 163 billion (as per BIS
71
Quarterly Review December 2016) As regard transfer of risk to the domestic system the concern
is more regarding transfer of risk to the Indian companies and less towards market-makers as they
are in the business of managing risk There is a possibility that the said incremental positions
created in the onshore market may get transferred to Indian companies (in part or full depending
upon the level of these positions retained by the market-makers) However in comparison with
the late 2000s Indian companies today are only allowed to enter into Rupee derivatives depending
on their underlying exposure and no leveraged structures are permitted Also banks are bound by
stringent suitability and appropriateness norms Therefore the chances of Indian companies
acquiring unmanageable risk positions or risks due to mis-selling by market-makers are very low
Further there has been a significant growth in the external sector and consequently the foreign
exchange market has also grown (although one could argue on the incommensurate growth) To
summarize in the last decade or so the ecosystem on the whole has evolved and is less prone to
adverse impact from transfer of risks from non-residents
Box 1
Approximation of share of hedging transactions in INR NDF turnover
The graph presented below is extracted from BIS Quarterly Review December 2016
72
It can be observed from the above graph that non-financial and other financial institutions
contribute around 5 and 35 respectively to the turnover of INR NDFs in the offshore market
If one were to make an informed guess that all transaction by non-financial companies are hedging
transactions and that hedging transactions by other financial companies (eg funds) would
constitute maximum 25 of their transaction then it can be approximated that hedging transactions
constitute around 5 - 15 of the daily average turnover in INR NDF market which was reported
as USD 164 bn
Comparison of turnover in forwards in onshore and offshore market - In the same publication
it is also reported that the average daily turnover in onshore deliverable forwards is USD 163 bn
It may be noted that for fair comparison with the turnover in offshore market (where deliverable
spot and swap market doesnrsquot exist) this turnover includes both deliverable forwards and FX
swaps A comparative analysis of volumes in onshore and offshore market ndash both OTC and
exchange traded Rupee derivatives - is given in Annexure IV
Issues and recommendations
1 Market hours
An important reason for the existence of the offshore Rupee derivative market is simple geography
That domestic markets are closed when major users in certain regions (eg the United States) are
working creates a natural access for offshore markets Also significant international developments
impacting the Rupee exchange rate take place outside the onshore market hours thereby creating
a natural clientele for the offshore markets The feedback received from non-resident investors as
well as corporates highlighted the closure of the local market as an important reason for them
accessing the offshore market Exchanges have for some time been requesting an extension of
market hours citing increasing Rupee transaction volumes in offshore exchanges situated in
Singapore and Dubai A straightforward way of taking care of such requirements is to extend the
onshore market hours (both OTC and exchange traded derivative markets) While extending
market hours might involve simultaneously keeping support services (payment and settlement
systems) or support markets (funding markets) open it is also possible to treat such transactions
as part of the operations of the next day in which case the need for settlement or funding does not
73
arise In this regard the TF supports the recommendations relating to market timings outlined in
the draft Report of the Internal Working Group on Comprehensive Review of Market Timings
published by RBI on July 10 2019
Recommendation 1
The TF recommends that the onshore market hours be suitably extended to match the flexibility
provided by the offshore market and thereby incentivize non-residents to hedge in the onshore
market
2 Competitive pricing
One important feedback from foreign portfolio investors (FPIs) as well as global corporates was
that they are unable to access multiple competitive quotes in the onshore market Effectively they
are limited to using the prices of their custodian banks Generally FPIs deal only with their
custodian banks due to the existing rules whereby the custodian is responsible for tracking of
outstanding hedges vis-agrave-vis portfolio size This ldquofrictionrdquo issue can be addressed by shifting the
monitoring to a centralized agency which can use a technology solution to track exposures as well
as outstanding hedges This is further explained in recommendation no 4 ahead relating to
underlying exposure
Also the process to be setup documentation such as KYC and other trading arrangements with
multiple counterparties in India is a long and difficult exercise resulting in most FPIs either trading
with their custodian bank or using the offshore market to hedge Some of the documentation related
challenges can be minimized if the centralized KYC registration currently in place for SEBI
regulated entities is extended to all the entities ie both custodial banks as well as non-custodial
banks This is elaborated in recommendation no 11 on the KYC process
Another issue highlighted by FPIs in this context was unavailability of multi-dealer electronic
dealing platforms for them One way of making onshore prices more widely accessible to non-
residents is to allow Indian banks to freely offer prices as liquidity providers to non-resident
customers at any time whether or not the domestic market is open They can extend to non-resident
corporates the same choices that domestic corporates have in choosing among various market
makers This can be done either by a domestic sales team or by using staff located at overseas
74
branches In addition making an all-to-all trading platform (like the FX-Retail being introduced
in August 2019) available to non-residents would supplement that effort
Recommendation 2
The TF recommends that banks may be allowed to freely offer prices to non-residents at all times
out of their Indian books either by a domestic sales team or by using staff located at overseas
branches Also wide access to the FX-Retail trading platform to non-residents would be a major
incentive to use the onshore market
3 Effect of offshore Rupee derivative market on onshore price discovery and exchange rate
management policy
The size and growth of the offshore Rupee derivative market especially in the last few years poses
a significant challenge to the efficiency of price discovery as well as the effectiveness of exchange
rate management policy A comparison of onshore and offshore Rupee derivative market is given
in Annexure IV The possibility that the exchange rate of the Rupee not a fully convertible
currency will be materially determined by transactions largely outside the legal and regulatory
influence of India is a matter of concern The most straightforward approach to deal with that
concern would be to completely liberalize the onshore market and bring it at par with the offshore
market in all aspects Such a scenario would imply an effective absence of local regulation and
intervention which is incompatible with the current status of capital account convertibility
Another option is to liberalise the onshore market to the extent possible but this in itself may not
necessarily mean a fall in importance or size of the offshore market In this connection the TF
extensively discussed the proposition of creating a connection between the offshore and onshore
markets by permitting Indian banks to deal in the offshore market The various implications of
such a step are discussed below
i Reduction in volatility In theory a segmented market would be less liquid and therefore
more volatile compared to an integrated market One could also infer that offshore market
activity is maximum during onshore working hours eg almost three-fourths of the
offshore rupee futures are traded when Indian markets are open It is also observed that
75
offshore spreads are larger which indicates a relative scarcity of market-making entities
Linking the two markets may increase both the customer base as well as the liquidity
providers thereby improving liquidity as well as efficiency of the price discovery process
ii Better customer pricing through increased transparency in the offshore market
Today very little information is available regarding the offshore Rupee market other than
that of exchange traded instruments Such opacity is not in the interest of customers as
liquidity provision is limited to entities that have a presence both onshore and offshore
resulting in a premium (in terms of high bid-ask spreads) being charged for market access
Broadening this access to onshore banks would drive away such premium through wider
competition At the same time access to information improves for the local authorities
Since better information leads to better price efficiency it is in the interest of local
authorities to disseminate such information leading to an overall improvement in market
transparency
iii Level playing field for Indian banks Foreign bankrsquos branches outside India can deal in
the offshore market as they are not bound by the RBIrsquos regulations On the other hand
overseas branches of Indian banks cannot deal in Rupee derivatives in the offshore market
Allowing them access to the offshore Rupee derivative market would create a level playing
field for Indian banks
iv Impact on development of the onshore market Liquidity in onshore market is better
than the offshore market due to participation of real sector and market making by Indian
banks which obviously are the major Rupee liquidity providers Consequently non-
residents have the ability to exit positions with less impact cost in unfavourable times This
is a strong incentive for them to hedge in the onshore market (given dynamic hedging and
other operational issues are now being ironed out) Also higher liquidity in the onshore
market results in tighter bid-ask spread compared to the offshore market which allows non-
residents to get better pricing in the onshore market The aim of policy measures is to
develop the onshore market Accordingly policymakers strive to protect the advantages of
onshore market and at the same time develop and liberalise the onshore market to overcome
the gap vis-agrave-vis NDF markets in other aspects such as ease of access market infrastructure
and taxation There is of course the risk that participation of Indian banks will improve
76
liquidity in the NDF market and undermine the development of the onshore market Such
a situation will be challenging for implementing exchange rate management policy
Recommendation 3
The onshore Rupee derivatives market is currently more deep and liquid as compared to the
offshore Rupee market and participation of the Indian banks in the offshore market might over
time take away this advantage The TF feels that the downside of permitting Indian banks to deal
in the offshore Rupee derivative market outweighs the advantages and therefore recommends that
Indian banks should not be permitted to deal in the offshore Rupee derivative market for the
present
4 Requirement of underlying exposure and documentation therefor
There is no requirement of an underlying exposure to enter into a derivative contract in the offshore
Rupee derivative market Hence non-residents can freely trade in this market to hedge risk on an
underlying Rupee exposure or create exposure to Rupee However as per extant regulations non-
residents can enter into Rupee derivative contracts in the onshore market only for the purpose of
hedging risk arising from an underlying exposure Non-residents are classified into Foreign
Portfolio Investor (FPI) investors having Foreign Direct Investments Non-Resident Indian Non-
resident Exporters and Importers and Non-Resident lenders having ECBs designated in INR with
each category being subjected to a different set of rules for establishing underlying exposure
FPIs are allowed to hedge only on the basis of existence of underlying exposure with the hedge
size capped at the market value of investment in equity and debt in India as on a particular date
including any coupon receipts arising out of investment in debt securities falling due during the
following twelve months only The explicit mention of only equity and debt investments creates
regulatory ambiguity on hedging of other FPI exposures in India such as margin deposits cash
etc Hence any FPI having investment in India will be able to only buy USD forward against INR
onshore and will not be allowed to sell USD against INR in forward market as that would result in
increasing the exposure rather than hedging the exposure To prove the exposure a valuation
certificate is required to be provided by a designated AD bank (Custodian) as a proof of underlying
FPIs are also required to provide a declaration to the effect that their total outstanding hedges are
within the market value of their investments The only exception to establishing underlying
77
exposure requirement is dealing in exchange traded market where FPIs are allowed to take
positions without having to establish existence of underlying exposure up to USD 100 million
FDIs are allowed to hedge both their existing investment as well as proposed foreign direct
investments with the latter being allowed only after an AD bank ensures that all necessary
approvals for the investment have been obtained by the FDI With respect to non-resident
corporates users can hedge their exposures invoiced in INR and intercompany loans denominated
in INR (ECBs) They can book the hedge either directly with an AD bank in India or on a back-
to-back basis Prior to hedging they must furnish a declaration certifying that the underlying
exposure has not been hedged with any other AD bank(s) in India They are required to cancel the
hedge contract immediately if the underlying exposure is cancelled In case of a central treasury
an authorization from the entity having INR exposure to hedge on its behalf is also required
Irrespective of the category of the investor the requirement to establish underlying exposure
creates practical difficulties for many non-residents Funds who intend to execute macro hedge for
various schemes or MNC parents wanting to consolidate exposures across subsidiaries and
executing a single hedge find it easier to execute consolidated hedge in the offshore market Also
hedging of anticipated and economic exposures is not permitted
Recently the RBI has released11 draft regulation regarding risk management facilities for public
feedback The TF reviewed it in detail and also received feedback on it during interaction with
stakeholders The proposed regulation satisfactorily addresses a lot of pertinent issues Measures
on simplifying eligible underlying exposure criteria simplifying documentation requirement
flexibility to hedge dynamically ability to hedge anticipated exposures user classification (retail
and non-retail) and choice of products are welcome and much needed It is noted that the
requirement of having an underlying exposure for entering into Rupee derivative contract is
retained and it is felt that it is justified for effectiveness of exchange rate management policy and
ensuring financial stability Given that only hedging transactions are going to be permitted in the
onshore market there will remain a requirement to establish or declare existence of underlying
exposure to risk and also to ensure that notional of hedge contracts is in line with the value of
underlying exposure As discussed above such requirement acts as a deterrent for non-residents to
hedge in the onshore market It would be optimum if a solution can be found that fulfils the
11
Vide press release dated February 05 2019
78
requirement of verification of underlying exposure without the investors being required to
undertake the efforts to prove it This can be achieved by consolidating the existing data on
investments and hedge transactions residing with various regulated entities
Recommendation 4
The TF recommends that a technology-based solution be explored to centrally aggregate the
investments of non-residents and derivative contracts entered into by them in the onshore market
(both OTC and exchange traded) using LEI or any other unique identifier to start with ADs should
be allowed access to such aggregate data so that they can verify the quantum of derivative positions
and underlying investments of the non-residents This mechanism can potentially completely
remove the requirement of efforts from the non-residents to prove the existence of underlying
exposure to Rupee
Further to simplify procedures and provide ease of access to the exchange traded currency
derivative market the RBI has allowed users to enter exchange traded instruments (futures and
options) to take exposure up to USD 100 million without the requirement of establishing the
existence of underlying risk Such measures go a long way in encouraging users (especially
MSMEs) to hedge their exchange rate risk by making the process easier At the same time such
calibrated opening helps in addressing any concerns of systemic risk The TF feels that such an
incentive must be provided in the OTC market also as it will not only contribute to ease of doing
business but also to restore parity in regulation between OTC and exchange markets
Recommendation 5
While requirement of underlying exposure will continue for trading in the onshore market users
may be allowed to undertake positions up to USD 100 million in OTC as well as exchange traded
currency derivative market without having to establish the underlying exposure
5 Products
Non-residents can enter into only plain vanilla forwards and option contracts in the OTC foreign
exchange market Further swaps are restricted to specific case of IPO and non-resident lenders of
ECB denominated in INR Non-residents who prefer to express their hedge using structured
79
options necessarily need to execute in the offshore market as current regulations do not allow non-
residents to enter into structured options
Recommendation 6
The aforesaid draft regulation addresses this issue by allowing ADs to offer any product to the
non-residents (for non-retails users) which satisfies the purpose for which they are permitted to
enter into Rupee derivatives ie hedging of underlying exposure to Rupee In other words ADs
cannot offer any product that creates risk for the user instead of hedging the existing risk The TF
endorses this principle-based regulation approach
6 Restrictions on dynamic management of risk
Non-residents trading in the offshore market are free to cancel and rebook their trades depending
on their future expectations andor risk management policy On the other hand in the onshore
market non-residents in general are not allowed to rebook a contract once cancelled Only in the
case of FPIs rebooking up to 10 of the value of contracts cancelled is permitted Inability to
manage risk dynamically deters non-residents who look for flexibility while hedging their risks
The aforesaid draft regulation proposes to remove restrictions on rebooking of cancelled contracts
and thereby allow users to hedge dynamically For contracts entered into for hedging contracted
exposure gains (or losses) on cancellation will be passed on to the user as and when they accrue
but in case of contracts entered into for hedging anticipated exposures net gains will be transferred
only when the underlying cash flow has occurred The prime purpose of such stipulation is to curb
incentives for speculation by using the liberal position limits available under anticipated exposure
hedging However a consequent drawback is that in some instances eg contingent contracts
such as bidding for projects involving currency risk such a provision would not be equitable This
provision could be suitable amended to enable all types of hedging without compromising the
essential control that the cash flow requirement provides to ensure underlying in a hassle-free way
The TF is of the view that providing suitable discretion to banks to pass on net gains even without
cash flows in such cases would address this shortcoming This will ensure that genuine hedgers
80
will access the onshore market without worrying about retention of gains if underlying transaction
does not fructify due to reasons beyond their control
Recommendation 7
In line with the objective of bringing onshore market at par with offshore market the most obvious
path is to not have any restrictions on transfer of gains in case of anticipated exposure hedging
However a balancing act is necessary between liberalizing the market while preventing
speculative positions which can create undue volatility in the onshore market Keeping this in
mind while endorsing free dynamic hedging (without any restriction on cancellation and
rebooking) for hedging contracted exposure the TF recommends that in case of hedging of
anticipated exposures gains from cancellation of contract may be allowed to be passed on even in
cases where there are no cash flows at the discretion of the bank where the bank considers the
cancellation of underlying cash flow is due to external factors which are beyond the control of the
user
7 Gross settlement and credit risk management
In the case of offshore Rupee derivative market non-residents clear and settle OTC trades either
through a prime brokercustodian or bilaterally with the counterparty In both these cases the non-
residents usually execute a bilateral multi-currency master service agreement which includes
provisions for exchange of margin (ex- ISDA master agreement including Credit Support Annex)
with the counterparty These agreements necessitate periodic settlement of marked-to-market gains
and losses across products and provide the flexibility to net off losses against gains Hence these
agreements significantly lower credit charges and provide strong netting efficiency On the other
hand in the onshore market the non-residents in an otherwise identical situation will face
additional challenges in respect of settlement and exchange of margin due to the following reasons
Gross settlement of gains As mentioned above non-residents clear and settle OTC trades in the
offshore Rupee derivative market either through a prime broker or bilaterally with the
counterparty Typically they settle deal across assets and currencies with either of these entities
and are therefore able to net the cash flows and achieve efficiency in liquidity management
81
However as Rupee derivatives entered into in the onshore Rupee derivative market cannot be
settled under such overseas arrangements non-residents are unable to avail the benefits of netting
on their onshore transactions
Credit risk management Signing a master service agreement locally and establishing credit lines
with onshore banks increases the execution cost of hedging onshore Typically transactions of
non-residents in the offshore market are collateralized (through collateral exchange provisions
contained in the master service agreement) while those in the onshore market are non-
collateralized Depending on the credit rating of the non-resident the onshore banks may not
necessarily be open to providing exposurecredit limits on uncollateralized basis for entering into
deliverable contracts If a collateralized credit line is set up through a master service agreement
with provision for exchange of collateral in USD outside India restrictions under FEMA 1999 on
exchanging margin outside India by onshore banks poses issues If exchange of collateral is in INR
in India then the non-residents will have to either assume the exchange rate risk on the cash margin
deposited or will have to additionally hedge the margin money placed Moreover this attracts
regulatory ambiguity such as minimum tenor restrictions as per deposit regulations ability to
hedge the margin through FX swap interest to be paid on cash in SNRR account etc If interest
cannot be paid on the collateral placed with onshore counterparties it creates a strong economic
disincentive for the investor to hedge onshore
These issues can be addresses in two ways First facilitating the non-residents to utilize their
existing overseas custodianprime broker relationship and master service agreements for
settlement of their transactions onshore and exchange of collateral therefor Second by creating
the regulatory framework for exchange of margin for non-centrally cleared derivatives in India to
make it consistent with evolving clearing mechanism offshore Both the solutions are discussed
below
To help non-residents retain their economic neutrality with respect to the prevailing multi-currency
master service agreement executed offshore a central clearing and settlement mechanism may be
established for non-residentsrsquo deals with onshore counterparties along the lines of central clearing
and settlement of onshore interbank deals by the CCIL The overseas bank of the non-resident will
clear and settle the deals execute by them onshore To be sure the proposal is to introduce the
centralized clearing mechanism while retaining the existing bilateral settlement mechanism so that
82
investors who want to continue using it do not face disruption For the suggested central clearing
and settlement mechanism to be set up inter alia the following permissions would also be
required
i Permission under FEMA 1999 for CCIL to accept foreign currency denominated collateral
in India or outside India
ii Enhancement of CCILrsquos infrastructure to accept wide range of securities (foreign currency
cash securities issued by foreign governments etc) as collateral and
iii Other regulatory clearances required for non-residentsoverseas banks in other jurisdictions
to clear and settle through CCIL
Further back-to-back hedging by non-residents proposed in the aforesaid draft regulation will also
allow effective utilization of their prevailing multi-currency CSA arrangement offshore This
entails allowing non-residents to hedge their exposure with their banking counterpart overseas
which in turn will hedge the position back-to-back with an onshore bank This ensures that existing
dealing arrangements between non-residents and their overseas counterparties remain unchanged
but at the same time the market risk gets transferred to onshore banks and hence is managed locally
The overseas bank should be allowed to settle the onshore leg either bilaterally with the onshore
bank or through the proposed central clearing and settlement mechanism Also this will require
permissibility under FEMA 1999 to exchange margin with the overseas banker of non-residents
outside India In such a model the approach should be to recognize the intermediary offshore bank
as a facilitator purely for the convenience of the non-resident investor Experience from other
markets that have implemented such models like Malaysia and China suggest that putting the onus
of monitoring compliance in terms of quantum of hedge underlying documentation etc on the
intermediary bank is inefficient Such a requirement leads to the intermediary bank asking for
various indemnities from the client and these are often difficult and time consuming to negotiate
and sign The approach should be to monitor compliance by the non-residents as the regulated user
using available onshore infrastructure as well use of technology solutions to track the hedges vis-
a-vis underlying exposure as detailed in recommendation 5
With regard to regulation and infrastructure for exchange of margin for non-centrally cleared
derivatives in India the RBI released a discussion paper on this issue in May 2016 However the
final directions have not been issues yet It is understood that ambiguity in netting legislation is
83
one of the main issues holding the release of these directions Also it is understood that the GoI is
in the process of making legislative changes to address this issue
Recommendation 8
For ease of entering into hedge transactions for non-residents the TF recommends-
i Establishment of a central clearing and settlement mechanism for non-residentsrsquo deals in the
onshore market
ii Back-to-back hedging by non-residents proposed under the draft regulation is endorsed The
overseas bank should be allowed to settle the onshore leg either bilaterally with the onshore bank
or through the proposed central clearing and settlement mechanism
iii Implementation of margin requirement for non-centrally cleared OTC derivatives in the
onshore market at the earliest
iv Allowing Indian banks to post margin outside India This is not only relevant for credit risk
management for their transactions with non-resident users but also for their cross-border inter-
bank transactions
8 Taxation
Under the extant regulatory framework non-residents are permitted to enter into Rupee derivative
contracts only for hedging risk on their investmentslendingtrade in India As per discussions with
stakeholders the following position is generally adopted with regard to the gains from such
contracts
bull Where currencies under the contract are delivered ndash Not a taxable event (ie conversion of
one currency into another does not give rise to taxable income)
bull Where contract is cancelled and price difference is settled ndash If the derivative contract is
entered into for hedging exchange rate risk on a capital asset then gains on cancellation are
treated as capital gains If it is entered into for hedging exchange rate risk in relation to a
tradingbusiness asset such gains are treated as business profits
84
However it is understood that there is ambiguity in the rules in this connection and the position
taken by the Assessing Officers (AOs) differs between zones and is at variance with the aforesaid
position Oftentimes such gains on cancellation are treated as lsquoOther Incomersquo or lsquoSpeculation
Business Profitsrsquo During interaction with the non-residents it was suggested that such uncertainty
of tax treatment is one of the prime reasons why they do not access the onshore market and instead
hedge Rupee exposures in the off-shore market
Recommendation 9
The TF recommends that the competent authorities may examine the issue of taxation in respect
of foreign exchange derivative contracts with the objective of overcoming gaps between tax regime
in India and other major international financial centres (Singapore Hong Kong and London) to
the extent possible and thereby incentivizing non-residents to hedge in the onshore market
9 Allow non-deliverable Rupee derivatives in the IFSC and permit IBUs to deal in such
derivatives
The proposition of introducing non-deliverable Rupee derivatives in the IFSC and permitting
banks (IFSC Business Units or IBUs) to deal in such derivatives is discussed in detail in Chapter
4 While there are concerns around impact on the onshore market due to trading in Rupee
derivatives in the IFSC there are potential benefits in terms of IFSCrsquos ability to offer complete
bouquet of financial services and availability of market information to all stakeholders Further
given Indiarsquos economic growth it may be appropriate to prepare for greater financial integration
with the rest of the world Sequencing and timing of measures relating to currency markets is a
critical component of such integration Although at the moment there is no definite path ahead in
terms of such integration but a thriving Rupee market in the IFSC may provide a system which
can be leveraged towards this end in the way and manner deemed fit in future IFSC being outside
the capital controls provides an opportunity to policymakers to test new regimes and products in
an environment whose repercussions may not significantly impact the stability or efficiency of the
onshore system On balance the TF is of the view that non-deliverable Rupee derivatives may be
introduced in the IFSC However a phased approach may be adopted and to start with trading
may be permitted only on exchanges due to the inherent transparency and risk management
85
benefits offered by it Introducing OTC contracts may be considered at a later stage after the
experience gained from trading on exchanges RBI may in its Financial Stability report assess the
impact of the functioning of IFSC on the financial stability of the country
Further the TF is of the view that entities regulated and permitted by the RBI may be permitted to
make market and run positions in Rupee derivatives market in the IFSC In order to prevent spill
over of risks from IFSC to onshore market though these entities a distinct net open position limit
may be stipulated for their operations in the IFSC In other words the open positions of entities
operating in the IFSC should not be permitted to be netted off with their open position the onshore
market
Recommendation 10
The TF recommends that non-deliverable Rupee derivatives (with settlement in foreign currency)
may be allowed to be traded in the IFSC and IBUs may be allowed to deal in such derivatives with
a distinct FCY-INR position limit To start with exchange traded currency derivatives involving
Rupee may be introduced and with experience non-deliverable OTC currency derivatives
involving Rupee may also be allowed
10 KYC process
The extant directions issued by the Reserve Bank of India stipulates the documents required for
conducting KYC process to open accounts of non-residents Similarly SEBI has also prescribed
documents required for the granting of FPI license by Domestic Depository Participants (DDP)
Further KYC documents for FPIs are available to SEBI regulated entities through KRAs subject
to approval from either the FPIs or the domestic custodians Since access to KRAs is available
only to SEBI regulated entities most banks are not allowed to access KRA and hence seek
complete documentation from FPIs again Such repetitive submission of documents to various
financial intermediaries results in long lead time for on-boarding and makes the entire process
operationally cumbersome for non-residents
Recommendation 11
The TF recommends that the KYC registration may be centralized across the financial market with
uniform documentation requirement All regulated financial market intermediaries should be
provided access to the centralized registry and they should be allowed to rely on online registry
86
for confirmation that KYC has been completed and itrsquos valid This will ensure that non-residents
undertake the KYC process only once and not with each financial intermediary that they deal with
in the onshore market Also such a mechanism offers cost and efficiency benefits for the financial
intermediaries
87
Annexure I
Key features of currency market of major EMEs
I USD-RMB Market ndash China
Onshore Deliverable - CNY Offshore Deliverable - CNH
Market
Turnover
Daily average turnover USD 28
billion
Daily average swap and
forward turnover
USD 62
billion
Daily average options
turnover
USD 15
billion
Daily average
turnover
USD 15-20
billion
Daily average
forward turnover
USD 25-30
billion
Daily average
Options turnover
USD 5-6 billion
Spot foreign
exchange Onshore CNY foreign exchange spot is
available with documentary proof of an
underlying transaction
Participating banks in Hong Kong
provide two types of spot RMB
exchange rate transactions
- For trade service and direct
investment purposes where
resulting foreign exchange
positions can be offset with the
clearing bank or onshore
correspondent banks and
For general purposes where banks need
to warehouse the risk or offset the
position in the interbank USD-CNH
market Forward
FXSwaps CNY forwards and foreign exchange
swaps with maturities of up to five years
are available to onshore institutions to
hedge foreign exchange exposure
subject to documentary proof of the
same
Most liquid is in the tenor of one year or less
CNH deliverable offshore forwards
are available out to five years
Liquidity has improved significantly
and has surpassed turnover in the
NDF market
FX Options Onshore market participants can buy or
sell common European options of CNY
against foreign currencies on a real
needs basis
Tenors are available out to three years
with further tenors on a case-by-case
basis Most liquid is in the tenor of one
year or less
The State Administration of Foreign
Exchange (SAFE) started allowing
corporates to sell FX options from August
2014 on a real needs basis and with net
settlement allowed
Deliverable CNH options are
available without restrictions to any
non-individual counterparty that has
a physical CNH Nostro account in
Hong Kong
Options on USD-CNH and CNH crosses
are available out to five years and
beyond on a case-by-case basis
88
Access to
domestic
participants
On the current account the CNY is
convertible subject to genuine
documentation Onshore entities can
access the local forwards market
provided these contracts are used to
cover current account transactions
subject to documentary proof available
on settlement
On capital account CNY conversions
may be settled by way of voluntary
settlement in banks if these are required
in the Companiesrsquo institutionsrsquo actual
business operation Typically all capital
account transactions need to be
registered with SAFE for local forwards
Not easily accessible to onshore
residents approvals required for transfer
of funds from Onshore to Offshore
Access to
Offshore
participants
Qualified
Foreign
Institutional
Investor
All allowed subject to
principle of actual
needs (Quota
restrictions exists
on underlying
investments)
Can trade via their
custodian or domestic
financial institution
Central
Banks
No quota restrictions
ability to trade as
interbank counterparty
in the domestic market
ndash bilateral or
anonymous trading
China
Interbank
Bond market
(CIBM)Bond
Connect
For OIIs (Overseas
Institutional Investors)
accessing making
CIBM investment can
enter
into all FX products on
actual needs basis with
settlement agent banks
Change in CIBM
investment position
requires adjustment to
the FX hedges within
5 working days
All customers can open a RMB account
in Hong Kong Banks can provide
customers with general purpose RMB
accounts which allow free transfers of
funds (offshore) for any purpose In
general all FX products are allowed in
CNH for offshore investors
Trading
Hours 10 AM ndash 4 PM Local China Hours 10 AM ndash 4 PM Local China Hours
89
II USD-KRW Market - Korea
Features Onshore Deliverable Offshore Non-Deliverable
Market Turnover Average daily turnover
USD
Billion
Spot Forward Swaps
2011 191 75 192
2012 180 66 198
2013 183 71 196
2014 175 76 190
2015 200 83 192
2016 194 96 184
2017 196 101 198 Source Bank of Korea
As per London clearing house
(LCH) Ltd the daily turnover of
NDF cleared by them on April
16 2019 is a total of USD 119
billion (Source LCH)
As per SEF turnover as on April
12 2019 is USD 379 million
(Source SEF)
Daily NDF turnover has
increased from USD 195 billion
in 2013 to USD 30 billion in
2016 (Source BIS 2016 survey)
Access to
domestic
participants
Residents can hold unlimited
amounts of foreign currency in
foreign currency bank accounts and
Korean firms can maintain foreign
currency accounts abroad
Financial institutional investors
have access to the local forwards
market and can hedge their
investment exposure without
confirming the lsquoexistencersquo of the
investment
Forward position limits of foreign
bank branches (FBBs) and local
banks registered as FX Banks in
Korea as below
- For FBBs positions are
capped at 200 per cent of the
previous month-end equity
capital
- For local banks forward
positions are capped at 40 per
cent of the previous month-
end equity capital
- Corporate customer foreign
currency hedging limits are
100 per cent of customersrsquo
exposure or their transaction
of underlying real assets
Residents may hold foreign
currency accounts domestically
or abroad
Corporate investors and
individual investors are required
to confirm the existence of the
investment
In the case of capital or current
account transactions domestic
residents can remit up to USD 50
000 per year freely
Access to
Offshore
participants
Non-residents can hold KRW
locally through bank accounts
Foreign investors must open special
investment purpose accounts
No restrictions and BoK does not
regulate the same
90
Source Bank of Korea BIS HSBC Research
which consist of an exclusive
external account for investment and
an exclusive non-resident domestic
currency account for investment
Foreign investors are allowed to
freely convert foreign currency into
KRW without any underlying
securities purchases while the
converted funds are being
transferred within exclusive
external investment accounts
However the converted funds in
the exclusive external account for
investment should still be used for
the purpose of securities
investment
Non-Resident Investors holding
Investment Registration Certificates
(IRC) sale proceeds from the
investment in securities can be
freely repatriated
Central Bank
intervention
BOK is now releasing a quarterly
intervention report on a net basis
They generally only comment that
they intervene only in exceptional
basis for smoothing operations
Bank of Korea does not access the
NDF market
Trading Hours 9 AM ndash 330 PM local Korea time Available through time zones
Taxation and
Repatriation of
FX Gains
All gains on unwind of deliverable
transactions are freely repatriable
without any tax
All gains on unwind of non-
deliverable transactions with
onshore banks are freely repatriable
without any tax
91
III USD-MYR Market ndash Malaysia
Onshore Deliverable Offshore Non-Deliverable
Market Turnover - Daily inter-bank market USDMYR
spot turnover around $500 million
- Daily inter-bank market USDMYR
swap turnover around $30 billion
- As per LCH Ltd UK Clearing
house the daily turnover of
USDMYR NDF cleared by them
on April 16 2019 is a total of
USD 332 million from 82 trades
(LCH website)
- As per SEF a trading platform
USDMYR turnover as on April
12 2019 is USD 205 million
from 18 trades (SEF website)
- As per the Hong Kong exchange
the NDF turnovers in 2016 were
around USD 50 billion and have
reduced to approximately USD
20 billion in 2018 (HKMA NDF
report 2018)
Access to Domestic
participants
- Resident counterparties such as
importers and exporters can use
currency options and forward
contracts to manage their foreign
exchange risk
- Residents are allowed to enter into
hedging arrangements on committed
current account transactions and
financial account transactions
- All forward contracts must be
supported by an underlying trade or
capital account-related transaction
allowed under the Foreign Exchange
Administration Rules
- Residents are allowed to freely
hedge and un-hedge their foreign
currency exposure for USD-MYR
CNH-MYR GBP-MYR EURMYR
and JPY-MYR currency pairs
without documentary evidence up to
an aggregate net open position of
MYR 6 million per bank
Not allowed
Access to Offshore
participants
- Licensed onshore banks and
approved investment banks are
allowed to enter into FX forward
Open and not regulated by the
central bank
92
Source Bank Negara Malaysia BIS HSBC Research
contracts with non-residents as
follows
Forward FX purchase or sale
contracts against MYR for
current account transactions
Forward FX purchase or sale
contracts against MYR based on
committed purchases or sales of
MYR assets The forward
contracts can be entered into at
the point when the non-resident
commits to purchase or sell the
MYR assets
- Dynamic hedging programme offers
flexibility to actively manage FX risk
exposure via forward hedging
activities with onshore banks or
Appointed Overseas Office (AOO)
without any documentation
CCP used Malaysian Exchange Not mandatory but LCH used
regularly
Central Bank
intervention
Through appointed agent banks Not applicable
Fixing to settle
NDF
NA KL USDMYR Reference rate
Trading Hours - Trading hour is 9 AM to 6 PM Local
Time Limited FX liquidity
available for non-residents post local
trading hours
- USDMYR is also quoted by
appointed overseas offices for spot
value only for any underlying asset
trades - post local trading hours No
forward prices are quoted
Quoted across time zones
Taxation and
Repatriation of FX
Gains
All gains on cancelled FX Contracts
are freely repatriable and do not
attract taxation in Malaysia
Taxed based on jurisdiction
93
IV USD-IDR Market - Indonesia
Onshore Deliverable Offshore Non-Deliverable Onshore Non-Deliverable
Market
Turnover
Average
daily spot
turnovers
USD 1bn
Average
daily swap
turnovers
USD 500
million
As per LCH Ltd - the
daily turnover of
USDIDR NDF cleared
by them on April 16
2019 is a total of USD
41 billion from 832
trades
As per SEF USDIDR
turnover as on April 12
2019 is USD 33 million
from 11 trades (Source
SEF)
As per HKTR Jan 2018
reporting the outstanding
IDR NDF turnover on
the Hong Kong exchange
of is around USD 40
billion (Source HKMA
NDF report 2018)
NDF
average size
USD 5m
Access to
Domestic
participants
Foreign currency against IDR
transactions between banks and
domestic parties over a certain
amount must have an underlying
transaction
Not Allowed Allowed but will need to
demonstrate underlying
documents
Access to
Offshore
participants
Non-residents must have
underlying IDR
assetliabilityreceivablepayable
to be able to enter into IDR cash
FX andor FX hedge BI list all the
permissible underlying activities
along with recommended
documentation format
Open and not regulated by
Bank Indonesia
Allowed but will need to
demonstrate underlying
documents
BI published a more-
stringent list of
permissible underlying
activities
Benefits Pricing uses onshore-curve
driven by onshore participants
and BI intervention
Not regulated and no
need for underlying
documentation
Prices available across
time zones
Can generated IDR
exposures without
having an underlying
asset in IDR
Pricing uses onshore-
curve driven by onshore
participants and BI
intervention (explanation
below) BI appears to
have a much bigger-
capacity to manage since
the product is net-settled
in IDR
94
Source Bank Indonesia BIS HSBC Research
Clients with IDR FX
exposure but no urgent
need for principal-
exchange As example
long-term IDR bond
investors
Limitations Requirement for underlying
docs limit the maximum
exposure that foreign Clients
can take
BI restricts Domestic Banks
from having residual-risk
when dealing Derivatives with
Related-Parties (locally
incorporated banks only)
Convertibility risk Requirement for
underlying docs limit the
maximum exposure
Foreign Clients can take
Clients with actual need
for principal-exchange
due to basis-risk between
[JISDOR fixing] vs
[actual FX rate] eg
Coupon repatriation and
BI restricts domestic
banks from having
residual-risk when
dealing derivatives with
related parties (locally
incorporated banks only)
Central
Bank
intervention
BI intervenes only in the onshore
market via Cash FX Onshore DF
and Onshore DNDF These can
be done via auctions or bilateral
OTC trades as there is no
onshore futures market for IDR
Bank Indonesia does not
access the NDF market
BI has the ability to intervene
in the DNDF market
although the market is very
new
Fixing to
settle NDF
Not Applicable JISDOR (USD-IDR)
JISDOR (USD-IDR)
Trading
Hours
Trading hours is from 8 AM ndash
12 PM Local Time and 1 PM
ndash 4 PM (Market breaks for
lunch between 12 PM ndash 1
PM)
USD-IDR is also quoted by
banks offshore for Spot value
only for any underlying asset
trades post local trading hours
No Forward prices are quoted
Quoted across time zones 8 AM ndash 12 PM Local
Time 1 PM ndash 4 PM
(Market breaks for lunch
between 12 PM ndash 1 PM)
Taxation
and
Repatriation
of FX Gains
As per market practice gains on
any unwindcancellation of FX
hedges are not passed to Non-
Residents
Taxed as per jurisdiction As per market practice gains
on any unwindcancellation
of FX hedges are not passed
to Non-Residents
95
V USD-BRL Market - Brazil
Features Onshore Deliverable Offshore Non-Deliverable
Market Features Average daily spot USD 8 billion
Onshore B3 USD 14 billion
Average daily options
turnovers
USD 15 billion
Offshore NDF
turnover daily
USD 4
billion
Market Hours Market hours is 0900 to 1800 Hours
However liquidity is highest between 10
am ndash 12 pm and 2 pm ndash 4 pm local
hours
96
VI USD-TWD Market - Taiwan
Features Onshore Deliverable Offshore Non-Deliverable
Market
Features Average Daily
Spot
Turnovers
USD 3-4 billion
Average Daily
Swap
turnovers
USD 2-3 billion
Average
Options
Turnovers
USD 150 million
Average daily
turnovers
USD 2-4 billion
Market
Turnovers
- Onshore total Spot turnovers in
USDTWD for March 2019 were USD
31560 billion (Average daily turnover of
~ USD 10 billion)
- Data related to USDTWD swaps is not
readily available but total swaps amp
forwards dealt onshore (across currency
pairs) is ~ 5750 of the FX turnovers
USD 11504 billion in April 2016 (last
available data) [Source BIS]
Access to
Domestic
participants
There are no limits on the TWDrsquos trading
range versus other currencies but there are
convertibility limits on the capital account
- Access to domestic participants are
not allowed
- Local banksrsquo overseas branches to
participate in the TWD NDF
market These banks will also be
subject to the existing cap on net
NDF positions at 20 per cent of
each bankrsquos FX position (last
revised lower from 33 per cent in
December 2010)
Access to
Offshore
participants
Non-Resident
Foreign investors are allowed to enter
into onshore swapforward contracts for
hedging underlying investment in
Taiwan
FINIs (Foreign Institutional Investors)
can only conduct buy USDsell TWD
contract and the total contract amount
entered into by a foreign investor should
not exceed FINIs USD and TWD net
remitted-in capital (ie total remitted-in
funds minus total remitted-out funds)
Access to foreign exchange is divided
into three categories
- import and export
Open and not regulated by the central
bank
97
- cost of trade-related services
- Investments capital repatriation and
dividends
Currency options are permitted
For FINIsFIDIs all transactions must be
documented regardless of the amount
On the maturity of FX forward (or
forward leg of a swap deal) FINI may
have the following decisions
- To settle the contract on the maturity
day as originally dealt In this case
FINI needs to ensure sufficiency of
existing account balance That is
settlement of FX forward should
come from the existing funds in
Taiwan or funds from sale proceeds
of underlying investments
- To extend (ie rollover) the contract
to another period in this case on the
maturity day FINI has to settle the
difference between the original
forward contract rate and the mark-
to-market rate
If FINI rollovers the contract upon
maturity and incurs a gain upon rollover
the gain will be credited to the FINIs
account in Taiwan Such gain will be
treated as other income derived in
Taiwan
CCP used Taipei Exchange (TPEx) acts as the Central
Counter Party for and also covers all foreign
exchange transactions made by authorized
foreign exchange banks and offshore banking
units
Not mandatory but LCH used regularly
Central Bank
intervention
Central bankrsquos FX intervention is via agent
banks in the OTC market where onshore
TWD is traded One of the mechanisms
through which local currency pressure is
absorbed is through modulation of hedge
ratio of Lifers
Not applicable
Fixing to
settle NDF
NA Central bankrsquos FX intervention is via
agent banks in the OTC market where
onshore TWD is traded
Bloomberg TRY11ltIndexgt
Trading
Hours
- 9 AM ndash 4 PM Local Time
- Market breaks for lunch at 12 PM ndash 2 PM
Quoted across time zones
98
Source CBC BIS HSBC Research
Taxation and
Repatriation
of FX Gains
If FINI rollovers the contract upon
maturity and incurs a gain upon rollover
the gain will be credited to the FINIs
account in Taiwan Such gain will be
treated as other income derived in
Taiwan and therefore subject to 20
standard withholding tax In case that FX
loss incurs due to rollover FINI may
arrange funding to cover the loss if
necessary
FINI can choose one of the following
methods to calculate and pay for the
relevant tax Please however note that
the method is not changeable once it is
decided If FINI does not confirm which
method to be used the option 1) will be
applied
- Withhold related tax on FX gain
from each rollover or
- Netting FX gainslosses from
rollover within the same year or
- Netting FX gainslosses from
rollover and the total remitted-in
principals revaluation gainloss in
the year
If the foreign investor adopts option 2) or
3) above they must appoint or contact
their existing local tax agent (if any) in
Taiwan to file annual tax return
Taxed based on jurisdiction
99
Annexure II
Appendix to Chapter 3
A bivariate BEKK-GARCH (11) model as proposed by Engle and Kroner (1995) can be specified with
the system of conditional mean equations consists of VAR(p) models (p = 1 n) as given in eq (1) and
variance equation as in eq(2)
119884119905 = 120583 + sum Γ119894119884119905minus119894 + 120576119905119901119894=1 (1)
where 119884119905 = (1199101119905 1199102119905) 1199101119905 is exchange rate return in onshore market and 1199102119905 is exchange rate return in
offshore market at time t The parameter vector 120583 = (1205831 1205832) represents constants and Γ is a 2times2 matrix of
autoregressive terms The diagonal elements 120574119894119894 measure own lagged effect of the variables while the off-
diagonal elements 120574119894119895 capture the mean spillover from variable i to variable j
Taking into account the asymmetric responses of volatility ie volatility tends to increase more in response
to negative shocks (bad news) than positive shocks (good news) in the variances and covariances as
proposed by Kroner and Ng (1998) a BEKK representation of conditional variance equation can be written
as
119867119905 = 119862prime119862 + 119860prime120576119905minus1prime 120576119905minus1119860 + 119861prime119867119905minus1119861 + 119863prime120585119905minus1
prime 120585119905minus1119863 (2)
where 120585119905 would be 120576119905 if it is negative and zero otherwise The Eq (2) can be written in matrix form as
follows
119867119905 = [11988811 011988821 11988822
] + [11988611 11988612
11988621 11988622]
prime
[1205761119905minus1
2 1205761119905minus11205762119905minus1
1205762119905minus11205761119905minus1 1205762119905minus12 ] [
11988611 11988612
11988621 11988622]
+ [11988711 11988712
11988721 11988722]
prime
[ℎ11119905minus1 ℎ12119905minus1
ℎ21119905minus1 ℎ22119905minus1] [
11988711 11988712
11988721 11988722]
+ [11988911 11988912
11988921 11988922]
prime
[1205851119905minus1
2 1205851119905minus11205852119905minus1
1205852119905minus11205851119905minus1 1205852119905minus12 ] [
11988911 11988912
11988921 11988922]
In the above model the dynamic process of 119867119905 is a linear function of its own lagged values lagged squared
innovations and the cross-product of the innovations and asymmetric terms Volatility transmission
channel between onshore and offshore markets is represented by the off-diagonal parameters in matrices A
and B while the diagonal parameters in those matrices capture the effects of their own past shocks and
volatility The diagonal parameters in matrix D measure the response own past negative shocks while the
100
off-diagonal parameters 119889119894119895 show the response of one market to the negative shocks in the another market
to be called the cross-market asymmetric responses
MGARCH-BEKK Parameter Estimates
Spot and 1-Month NDF 1-Month Forward and NDF 1-Month Futures and NDF
Variable Coeff P-value Variable Coeff P-value Variable Coeff P-value
Mean Equation
DSPOT(-1) -063 000 DFW1M(-1) -064 000 DFUT1M(-1) -063 000
DSPOT(-2) -052 000 DFW1M(-2) -054 000 DFUT1M(-2) -053 000
DSPOT(-3) -031 000 DFW1M(-3) -033 000 DFUT1M(-3) -033 000
DSPOT(-4) -015 000 DFW1M(-4) -018 000 DFUT1M(-4) -019 000
DSPOT(-5) -010 000 DFW1M(-5) -012 000 DFUT1M(-5) -010 000
DNDF1M(-1) 062 000 DNDF1M(-1) 063 000 DNDF1M(-1) 062 000
DNDF1M(-2) 047 000 DNDF1M(-2) 049 000 DNDF1M(-2) 048 000
DNDF1M(-3) 030 000 DNDF1M(-3) 033 000 DNDF1M(-3) 035 000
DNDF1M(-4) 022 000 DNDF1M(-4) 023 000 DNDF1M(-4) 027 000
DNDF1M(-5) 013 000 DNDF1M(-5) 015 000 DNDF1M(-5) 016 000
Constant 001 029 Constant 001 003 Constant 001 013
DSPOT(-1) 013 000 DFW1M(-1) 013 000 DFUT1M(-1) 011 001
DSPOT(-2) 003 053 DFW1M(-2) 002 046 DFUT1M(-2) 000 098
DSPOT(-3) 005 042 DFW1M(-3) 003 033 DFUT1M(-3) 002 064
DSPOT(-4) 005 033 DFW1M(-4) 005 015 DFUT1M(-4) 004 041
DSPOT(-5) 002 067 DFW1M(-5) 001 068 DFUT1M(-5) 002 058
DNDF1M(-1) -009 000 DNDF1M(-1) -009 000 DNDF1M(-1) -009 001
DNDF1M(-2) -007 015 DNDF1M(-2) -007 003 DNDF1M(-2) -005 022
DNDF1M(-3) -005 033 DNDF1M(-3) -004 012 DNDF1M(-3) -002 065
DNDF1M(-4) 001 086 DNDF1M(-4) 001 076 DNDF1M(-4) 003 052
DNDF1M(-5) 001 079 DNDF1M(-5) 002 052 DNDF1M(-5) 001 067
Constant 001 038 Constant 001 011 Constant 001 017
Variance Equation
C(11) 005 000 C(11) 005 000 C(11) 003 000
C(21) 005 000 C(21) 005 000 C(21) 003 000
C(22) -001 004 C(22) 001 000 C(22) 005 000
A(11) 027 000 A(11) 027 000 A(11) 014 000
A(12) 004 042 A(12) 005 032 A(12) -012 004
A(21) -004 029 A(21) -004 034 A(21) 007 010
A(22) 019 000 A(22) 018 000 A(22) 029 000
B(11) 096 000 B(11) 096 000 B(11) 098 000
B(12) -001 020 B(12) -002 003 B(12) 003 004
B(21) 001 037 B(21) 001 029 B(21) -001 048
B(22) 098 000 B(22) 098 000 B(22) 094 000
D(11) -023 001 D(11) 027 000 D(11) 020 001
101
D(12) -037 000 D(12) 035 000 D(12) 024 000
D(21) 022 000 D(21) -025 000 D(21) -016 000
D(22) 028 000 D(22) -028 000 D(22) -012 006
102
Annexure III
Evolution of Onshore Exchange Traded Currency Derivatives Market
Exchange Traded Currency Derivatives (ETCD) were launched in August 2008 in India with the
introduction of futures contracts on US Dollar-Rupee currency pair as the underlying
Subsequently in the year 2010 Rupee future contracts were allowed to trade against three other
currencies viz Euro Pound sterling and Japanese yen The options contracts were introduced on
US Dollar-Rupee currency pair in year 2010 The Reserve Bank of India (RBI) and Securities
Exchange Board of India (SEBI) allowed participation for all resident individuals including
corporates Trading Members and Banks in proprietary capacity on ETCD
In the year 2012 it was decided to lower the open position limits for banks on the back of volatility
in rupee and to exclude the positions in ETCD from Net Overnight Open Position Limit (NOOPL)
Thereafter in the year 2013 the Rupee depreciated sharply against USD due to huge capital
outflows in both equity and debt markets expectation of unwinding of Quantitative Easing by US
FED and increase in current account deficit Additionally the open position limits for the
participants were decreased and banks were restricted from participating on their own accounts in
the ETCD market further the participants were also prohibited from taking positions beyond
USD 10 million
In June 2014 Banks were allowed to engage in proprietary trading in ETCD markets Domestic
participants were allowed to have open position beyond USD 15 million subject to the evidence
of underlying exposure In 2018 this limit was raised to USD 100 million across all currency pairs
involving INR put together and combined across all exchanges
Foreign Portfolio Investors (FPI) and Non-Resident Indians (NRIs) were permitted to participate
in ETCD markets for hedging currency risk arising out of their investments in India in 2014 and
2017 respectively In February 2018 SEBI and RBI permitted currency derivatives on cross
currency pairs - EURUSD GBPUSD and USDJPY- and currency options on EURINR GBPINR
and JPYINR In December 2018 weekly options on US Dollar - Indian Rupee currency pair were
permitted As on date derivatives are available on seven currency pairs - USDINR EURINR
GBPINR JPYINR EURUSD GBPUSD and USDJPY
103
The exchange traded currency derivatives draws participation from diverse categories of
participants Some of the key participant categories include banks corporates trading members
foreign investors and other investors The following are the turnover of exchanges
FY National Stock Exchange of India (All figures in USD billions)
USD-INR futures USD-INR Options
(Notional turnover)
USD-INR Options
(Premium )
2014-15 32630 12618 052
2015-16 37374 26600 092
2016-17 31887 35271 107
2017-18 33818 37714 117
2018-19 57913 54183 204
FY
BSE (All figures in USD billions)
USD-INR futures USD-INR Options
(Notional turnover)
USD-INR Options
(Premium)
2014-15 20740 9609 081
2015-16 27713 13772 044
2016-17 27521 21034 045
2017-18 30146 37552 041
2018-19 45956 59350 051
FY Metropolitan Stock Exchange of India (All figures in USD billions)
USD-INR futures USD-INR Options
( Notional turnover )
USD-INR Options
( Premium )
2014-15 18274 593 593
2015-16 8433 646 646
2016-17 8233 367 367
2017-18 3032 491 491
2018-19 1060 245 245
104
Present Regulatory Framework (client limits open interest limits need for underlying
exposure etc)
a) Position limits for different client categories for FCY-INR currency pairs
bull Position limits of clients and Category III FPIs- The gross open positions of the client
across all contracts in the respective currency pairs shall not exceed the limits as mentioned
below
Currency Pairs
Position limits
USD-INR Gross open position across all contracts shall not exceed
6 of the total open interest or USD 10 million whichever
is higher
EUR-INR Gross open position across all contracts shall not exceed
6 of the total open interest or EUR 5 million whichever
is higher
GBP-INR Gross open position across all contracts shall not exceed
6 of the total open interest or GBP 5 million whichever
is higher
JPY-INR Gross open position across all contracts shall not exceed
6 of the total open interest or JPY 200 million whichever
is higher
bull Proprietary position limits of non-bank stock brokers- The gross open positions of the
proprietary account across all contracts in the respective currency pairs shall not exceed
the limits as mentioned below
Currency Pairs
Position limits
USD-INR Gross open position across all contracts shall not exceed 15
of the total open interest or USD 50 million whichever is
higher
EUR-INR Gross open position across all contracts shall not exceed 15
of the total open interest or EUR 25 million whichever is
higher
GBP-INR Gross open position across all contracts shall not exceed 15
of the total open interest or GBP 25 million whichever is
higher
JPY-INR Gross open position across all contracts shall not exceed 15
of the total open interest or JPY 1000 million whichever is
higher
105
bull Position limits of stock brokers (bank and non-bank) Category I and II FPIs- The
gross open positions of trading members across all contracts in the respective currency
pairs shall not exceed the limits as mentioned below
Currency Pairs
Position limits
USD-INR Gross open position across all contracts shall not exceed
15 of the total open interest or USD 100 million
whichever is higher
EUR-INR Gross open position across all contracts shall not exceed
15 of the total open interest or EUR 50 million whichever
is higher
GBP-INR Gross open position across all contracts shall not exceed
15 of the total open interest or GBP 50 million whichever
is higher
JPY-INR Gross open position across all contracts shall not exceed
15 of the total open interest or JPY 2000 million
whichever is higher
Domestic clients shall ensure that the position across exchanges is within the prescribed
limit of USD 100 million equivalent If position is in excess of USD 100 million
equivalent clients are required to provide disclosure of underlying exposure to Trading
Member as per existing practice
bull Proprietary positions created in FCY-INR pairs (USD-INR EUR-INR GBP-INR
and JPY-INR)
Single INR limit for proprietary
position for bank stock broker
Single INR limit for proprietary
position for non-bank stock broker
Higher of 15 of total OI across all
FCY- INR pairs or USD 200 million
Higher of 15 of total OI across all
FCY-INR pairs or USD 100 million
b) Position limit for Cross Currency Derivatives are given below
bull Position limits for stock brokers (banks and non-bank) Category I amp II FPIs
Domestic Institutional investors (DIIs) as permitted by the respective sectoral
regulators and AD Category-I banks-
106
Currency Pairs
Position limits
EUR-USD Gross open position across all contracts shall not
exceed 15 of the total open interest or EUR 100
million whichever is higher
GBP-USD Gross open position across all contracts shall not
exceed 15 of the total open interest or GBP 100
million whichever is higher
USD-JPY Gross open position across all contracts shall not
exceed 15 of the total open interest or USD 100
million whichever is higher
The aforementioned limits shall be the total limits available to the stock brokers for
taking positions on proprietary basis and for positions of their clients
bull Position limit for proprietary position of non-bank stock brokers-
Currency Pairs
Position limits
EUR-USD Gross open position across all contracts shall not
exceed 15 of the total open interest or EUR 50
million whichever is higher
GBP-USD Gross open position across all contracts shall not
exceed 15 of the total open interest or GBP 50
million whichever is higher
USD-JPY Gross open position across all contracts shall not
exceed 15 of the total open interest or USD 50
million whichever is higher
bull Position limits for Clients and Category III FPIs-
Currency Pairs
Position limits
EUR-USD Gross open position across all contracts shall not
exceed 6 of the total open interest or EUR 10
million whichever is higher
GBP-USD Gross open position across all contracts shall not
exceed 6 of the total open interest or GBP 10
million whichever is higher
USD-JPY Gross open position across all contracts shall not
exceed 6 of the total open interest or USD 10
million whichever is higher
107
Annexure IV
Comparison of onshore and offshore Rupee derivatives volumes
1 Exchange Traded Market
All figures in USD billions
Table Comparison between onshore and offshore exchange traded INR-USD Futures
FY Onshore Offshore Market Share
BSE NSE MSEI Total DGCX SGX CME Total Onshore Offshore
2014-15 21115 32491 9433 63040 31704 3704 396 35804 6378 3622
2015-16 27904 37241 4539 69685 32725 13906 1001 47631 5940 4060
2016-17 26528 31799 4300 62626 34149 17164 1636 52949 5419 4581
2017-18 30360 33729 1761 65851 33458 28047 5232 66737 4967 5033
2018-19 44820 57237 648 102705 35452 37599 7475 80526 5605 4395
Note-
i Data for BSE NSE amp MSEI is from Exchange websites for USDINR Futures
ii Data for DGCX SGX and CME is from Bloomberg and India INX Research
iii Data for DGCX includes INRUSD Futures (including mini contract) but excludes the USDINR Index
Quanto futures
iv Data for CME includes the Mini and Micro contracts
v Data for FY 2018-19 is from April 01 2018 to March 22 2019
2 OTC Market (as per BIS Quarterly Review December 2016)
108
Annexure V
Meetings held by the Task Force
Sr No Date Venue External Participants Invited
1 March 19 2019 RBI Mumbai
2 March 25 2019 RBI Mumbai -Shri Ananth Narayan Professor SPJMIR
-FEDAI
-Select corporates
3 April 04 2019 RBI Mumbai -Shri G Padmanabhan Former Executive
Director RBI
-Dr V Anantha Nageswaran Dean IFMR
Chennai
-GIFT City IFSC
-National Stock Exchange Ltd
-BSE Ltd
4 April 23 2019 RBI Mumbai -Select FPIs (through audio conference)
5 May 14 2019 RBI Mumbai -Select FDIs (through audio conference)
6 May 31 2019 RBI Mumbai -Shri G Padmanabhan Former Executive
Director RBI
-FIMMDA
-CCIL
-IBA
7 June 20 2019 RBI Mumbai -Smt Shyamala Gopinath Former Deputy
Governor RBI
8 July 04 2019 SEBI Mumbai -Shri G Padmanabhan Former Executive
Director RBI
9 July 10 2019 RBI Mumbai -Smt Shyamala Gopinath Former Deputy
Governor RBI
109
Annexure VI
References
A Santaella Julio (2015) ldquoCurrency carry trades in Latin Americardquo Bank for International
Settlements BIS Paper No 81
Behera Harendra Kumar (2011) ldquoOnshore and offshore market for Indian rupee recent evidence
on volatility and shock spilloverrdquo Macroeconomics and Finance in Emerging Market Economies
Vol 4 No 1 March 2011 pp 43ndash55
Cadarajat Yayat and Lubis Alexander (2012) ldquoOffshore And Onshore IDR Market An Evidence
On Information Spilloverrdquo Bulletin of Monetary Economics and Banking April 2012
Capital Account Safeguard Measures in the ASEAN Context (2019) ASEAN Working Committee
on Capital Account Liberalisation Bank Indonesia Occasional Papers OP12019
Colavecchio Roberta and Funke Michael (2006) ldquoVolatility transmissions between renminbi and
Asia-Pacific onshore and offshore US dollar futuresrdquo BOFIT Discussion Papers Bank of
Finland Institute for Economies in Transition No16
Darbha Gangadhar (2012) ldquoA Tale of One Asset and Two Markets ndash Analysis of Dynamic
Interactions between On- and - Off Shore Marketsrdquo macrofinancenipfporginPDF13-
11sl_Darbha_NDFNimranapdf
DING David K Tse Y and Williams M The Price Discovery Puzzle in Offshore Yuan
Trading Different Contributions for Different Contracts (2012) Financial Management
Association International Conference Research Collection Lee Kong Chian School Of Business
Doukas J and H Zhang (2013) ldquoThe performance of NDF carry tradesrdquo Journal of International
Money and Finance vol 36 September pp 172ndash90
Goyal R R Jain and S Tewari (2013) Non deliverable forward and onshore Indian rupee market
a study on inter-linkages Reserve Bank of India Working Paper Series 112013 December
Guru Anuradha (2009) ldquoNon-Deliverable Forwards Market for Indian Rupee An Empirical
Studyrdquo Indian Journal of Economics and Business Vol 8 No 2 pp 245-260
Higgins Patrick and Owen F Humpage (2005) ldquoNondeliverable Forwards Can We Tell where
the Renminbi Is Headedrdquo Federal Reserve Bank of Cleveland September
Hutchison Michael Jake Kendall Gurnain Pasricha Nirvikar Singh (2009) ldquoIndian Capital
Control Liberalisation Evidence from NDF Marketsrdquo NIPFP Working Paper No 200960
110
Indira Gandhi Institute of Development Research (IGIDR) Finance Research Group (2016)
ldquoFeatures and trends of NDF markets for emerging economy currencies a study of the Indian
rupeerdquo IGIDR working paper March
Ishii Shogo İnci Oumltker-Robe and Li Cui 2001 Measures to Limit the Offshore Use of
Currencies Pros and Cons IMF Working Paper WP0143
Lipscomb Laura (2005) ldquoAn Overview of Non-Deliverable Foreign Exchange Forward Marketsrdquo
Federal Reserve Bank of New York May
Ma G C Ho and R McCauley (2004) The markets for non-deliverable forwards in
Asia BIS Quarterly Review June pp 81-94
Maziad Samar and Kang Joong Shik RMB Internationalization OnshoreOffshore Links (May
2012) IMF Working Paper No 12133
McCauley R C Shu and G Ma (2014) ldquoNon-deliverable forwards 2013 and beyondrdquo BIS
Quarterly Review March pp 75ndash88
McCauley RN Shu C (2016) ldquoNon-deliverable forwards impact of currency internationalisation
and derivatives reformrdquo Technical report Bank of International Settlements
McCauley Robert N and Scatigna Michela Foreign Exchange Trading in Emerging Currencies
More Financial More Offshore (March 2011) BIS Quarterly Review March 2011
Misra Sangita and Behera Harendra (2006) ldquoNon Deliverable Foreign Exchange Forward
Market An Overviewrdquo RBI Occasional Papers Vol 27 No3
Park Jinwoo (2001) ldquoInformation flows between non-deliverable forwards (NDF)and spot
markets Evidence from Korean currencyrdquo Pacific Basin Finance Journal Vol 9 (4) pp363-377
Ryoo Sangdai and Kwon Taeyong and Lee Hyejin Foreign Exchange Market Developments
and Intervention in Korea (October 2013) BIS Paper No 73o
Sarwono Hartadi A (2005) ldquoIndonesian policy on non-residentsrsquo participation in the money
market the restriction of rupiah transactions by non-residents and foreign currency credit offered
by banks to non-residentsrdquo BIS Paper No 23
Standing Council on International Competitiveness of the Indian Financial System (2015)
International competitiveness of currency equity and commodity derivatives markets Department
of Economic Affairs Ministry of Finance
Wang Kai-Li Fawson Christopher and Chen Mei-Ling (2007) ldquoInformation Flows among
Exchange Rate Markets What Do We Learn From Non-Deliverable Forward Markets in Asiardquo
Chaoyang University of Technology October
111
Watanabe K H Akama and J Mifune (2002) ldquoThe effectiveness of capital controls and
monitoring the case of non-internationalisation of emerging market currenciesrdquo EMEAP
Discussion Paper January
5
FEC ndash Foreign Exchange Committees
FED ndash Federal Reserve Board
FEMA ndash Foreign Exchange Management Act 1999
FPI ndash Foreign Portfolio Investor
FSP ndash Final Settlement Price
FSS ndash Financial Supervisory Services (FSS) in Korea
FX ndash Foreign exchange
GDP ndash Gross Domestic Product
GIFT City ndash Gujarat International Financial Tec-City
HKMA ndash Hong Kong Monetary Authority
HKTR ndash Hong Kong trade repository
IFC ndash International Finance Corporation
IFSC ndash International Financial Service Centre
IDR ndash Indonesian Rupiah
INR ndash Indian Rupee
IMF ndash International Monetary Fund
IRC ndash Investment Registration Certificate
ISDA ndash International Swaps and Derivatives Association
JISDOR ndash Jakarta Inter-bank Spot Dollar Rate
JIBOR ndash Jakarta Interbank Offered Rate
JPY ndash Japanese Yen
KRA ndash KYC Registration Agency
KRW ndash Korean Won
KYC ndash Know Your Customer
LEI ndash Legal Entity Identifier
MIFOR ndash Mumbai Interbank Forward Offer Rate
MSEI ndash Metropolitan Stock Exchange of India Ltd
MYR ndash Malaysian Ringgit
6
NDF ndash Non Deliverable Forward
NOOPL ndash Net Overnight Open Position Limit
NRI ndash Non Resident Indian
NSE ndash National Stock Exchange
OIS ndash Overnight Indexed Swaps
OTC ndash Over the Counter
PBoC ndash Peoplersquos Bank of China
RBI ndash Reserve Bank of India
RMB ndash Renminbi
SEBI ndash Securities and Exchange Board of India
SFEMC ndash The Singapore Foreign Exchange Markets Committee
SGX ndash Singapore Exchange
SNRR ndash Special Non-Resident Rupee Account
TF ndash Task Force on Offshore Rupee Market
TWD ndash Taiwanese Dollar
USD ndash United States Dollar
7
Acknowledgements
The Report of the lsquoTask Force on Offshore Rupee Marketsrsquo was made possible with the support
of a number of individuals and organisations The Task Force would like to gratefully acknowledge
representatives of various banks financial institutions large corporates in India and abroad
foreign portfolio investors asset managers industry bodies experts and practitioners who
interacted with the Task Force and provided their valuable inputs and suggestions
The Task Force greatly benefitted from the experience of Smt Shyamala Gopinath former Deputy
Governor Reserve Bank of India and Shri G Padmanabhan former Executive Director Reserve
Bank of India who took time out of their busy schedules to attend the meetings of the Task Force
as special invitees
The Task Force benefitted from the interactions with Dr T V Somanathan IAS Additional Chief
Secretary Government of Tamil Nadu Shri R Sridharan Managing Director CCIL Dr V
Anantha Nageswaran Dean IFMR Chennai Shri Ananth Narayan Associate Professor SPJIMR
Dr A K Nag Shri Himadri Bhattacharya and Shri Jamal Mecklai CEO Mecklai Financial
Services
The Task Force invited submissions from members of the public and is grateful for several helpful
suggestions received
The Task Force also places on record the assistance provided by Shri Subrat Kumar Seet Director
and Smt Priyanka Sachdeva Manager from Department of Economic and Policy Research
Reserve Bank of India and Shri Hiren Sanghvi Director and Shri Saket Banka Associate Director
from HSBC India The Task Force specifically acknowledges the contribution of Shri Harendra
Behera Assistant Adviser Department of Economic and Policy Research Reserve Bank of India
in research on lsquoLinkages between Offshore and Onshore Rupee Marketsrsquo undertaken in
collaboration with Shri Sajjid Chinoy Chief Economist J P Morgan India
Finally the Task Force would like to commend the efforts put in by the Secretariat team from the
Financial Markets Regulation Department Reserve Bank of India led by Shri Supriyo
Bhattacharjee Deputy General Manager and supported by Shri Nitin Daukia Manager
Meticulous organisation of meetings by Smt Supriya Devalekar Assistant Manager and Shri
Kaivalya Sakalgaonkar Assistant from the Secretariat team is also appreciated
8
Preface
Offshore markets in a non-convertible currency usually referred to as non-deliverable forward
(NDF) markets enable trading of the non-convertible currency outside the influence of the
domestic authorities These contracts are settled in a convertible currency usually US Dollars as
the non-convertible currency cannot be delivered offshore Historically NDF markets evolved for
currencies with foreign exchange convertibility restrictions and controlled access for non-
residents beginning with countries in South America like Mexico and Brazil and thereafter
moving on to emerging Asian economies viz Taiwan South Korea Indonesia India China
Philippines etc Apart from enabling trading in non-convertible currencies NDF markets have
also gained in prominence because of onshore regulatory controls and their ease of access
Reserve Bank has been guided by the objective of developing a deep and liquid on-shore foreign
exchange market that acts as a price setter globally With regard to non-resident entities having
legitimate exposure to the Rupee the focus of policy efforts has been to align incentives for non-
residents to gradually move to the domestic market with adequate safeguards to ensure the
external stability of the value of the Rupee
The sharp growth in the offshore trading volumes in the Rupee NDF market in recent years likely
even beyond the volumes in the onshore markets have raised concerns around the forces that are
determining the value of the rupee and the ability of authorities to ensure currency stability This
necessitates a deeper understanding of the causes underlying the growth in those markets and
identification of measures to reverse the trend
The Task Force on Offshore Rupee Markets was set up to address that concern It was mandated
to study the factors attributable to the growth of the offshore Rupee market its effects on the Rupee
exchange rate and onshore market liquidity and formulate measures to redress the concerns The
Task Force was also charged to examine the role if any that International Financial Services
Centres (IFSCs) can play in addressing these concerns
During its term the Task Force interacted with a wide variety of stakeholders including banks
financial institutions industry bodies foreign portfolio investors asset managers and
academicians
9
I trust that the Reserve Bank of India will find the recommendations made in the report useful
Usha Thorat
Chairperson
10
Executive Summary
The origin of the NDF markets may be traced back to the 1990s when a wave of capital account
liberalisation in emerging market economies (EMEs) triggered a surge in capital inflows to these
economies and consequently heightened the currency risk faced by foreign investors Under-
developed domestic markets especially the market for financial derivatives as well as controlled
access to onshore markets raised the demand for a currency market outside the reach of local
regulations Another trend that supported the growth of the NDF market was the sharp rise
globally in the size of derivatives markets in the 1980s and 1990s As derivatives markets evolved
the speculative search for underlying moved out of the developed world into more esoteric assets
Following the successful speculative attack on the Sterling in 1992 EME currencies became viable
subjects for such speculative positioning Such activity becomes particularly noticeable during
times of stress as offshore risk spills over to the domestic exchange rate through entities that have
a presence in both onshore and offshore markets usually global banks but also corporates
A study of the degree and direction of such spillovers is important to understand the role of NDF
markets and assess policy alternatives The econometric study conducted by the Task Force
observed that the influence between offshore and onshore exchange rate goes both ways in normal
times that is it is bidirectional The study also observed that during the last two stress episodes
(the taper tantrum and the 2018 emerging markets crisis) the relationship turned unidirectional
with the NDF market driving onshore exchange rate The study concludes that as NDF volumes
have increased they have begun to play an important role in both price discovery and driving
volatility particularly during heightened uncertainty period The study also shows that periods of
divergence are limited and the markets converge and that too fairly rapidly
Against this backdrop and in the light of available information results of the statistical analysis
and most importantly based on the feedback received during the various consultations the Task
Force is making following recommendations in accordance with the terms of reference
i Onshore market hours may be suitably extended to match the flexibility provided by the
offshore market and thereby incentivize non-residents to hedge in the onshore market
ii Banks may be allowed to freely offer prices to non-residents at all times out of their Indian
books either by a domestic sales team or by using staff located at overseas branches
11
iii Non-deliverable Rupee derivatives (with settlement in foreign currency) may be allowed
to be traded in the IFSC and IBUs may be allowed to deal in such derivatives with a distinct
FCY-INR position limit To start with exchange traded currency derivatives involving
Rupee may be introduced and with experience non-deliverable OTC currency derivatives
involving Rupee may be allowed subsequently
iv While requirement of underlying exposure will continue for trading in the onshore market
users may be allowed to undertake positions up to USD 100 million in OTC as well as
exchange traded currency derivative market without having to establish the underlying
exposure
v The TF endorses the principle-based regulatory approach adopted in the draft regulation
on hedging by non-residents released by the RBI on February 15 2019 Also back-to-back
hedging by non-residents proposed under these draft regulations is endorsed Further in
case of hedging of anticipated exposures gains from cancellation of contract may be
allowed to be passed on even in cases where there are no cash flows at the discretion of
the bank where the bank considers the cancellation of underlying cash flow is due to
external factors which are beyond the control of the user
vi For ease of entering into hedge transactions for non-residents the TF recommends
a Establishment of a central clearing and settlement mechanism for non-residentsrsquo
deals in the onshore market
b Implementation of margin requirement for non-centrally cleared OTC derivatives
in the onshore market at the earliest
c Allow Indian banks to post margin outside India
d Wider access to FX-Retail trading platform to non-residents
vii A technology-based solution may be explored to centrally aggregate the investments of
non-residents and derivative contracts entered into by them in the onshore market (both
OTC and exchange traded) using LEI or any other unique identifier to start with
viii The issue of taxation in respect of foreign exchange derivative contracts may be examined
with the objective of overcoming gaps between tax regime in India and other major
international financial centres to the extent possible
ix KYC registration may be centralized across the financial market with uniform
documentation requirement
12
Chapter 1
Introduction
Currency is a component of sovereign money which is legal tender issued by the state The
external value of the currency the exchange rate is one of the most important economic and policy
variables which affects economic incentives and activity The exchange rate is determined mostly
by market forces of supply and demand which influence its flows across international borders
The exchange rate has critical information value in guiding financial and economic decisions
which affect real economic variables The stability and predictability of the exchange rate also has
a critical influence on growth and financial stability
Cross-border trade in goods services and assets (or capital) necessitates exchange of one currency
into another and can be thought of as the primary reason why currency markets exist However
as in any other financial market speculative elements ndash who take positions not for settling any
underlying transactions but for benefitting from market movements ndash are important participants
who perform the function of imparting depth to the market The aggregate actions of all
participants ndash hedgers arbitrageurs as well as speculators - determine the value and fluctuation of
the exchange rate
The currency markets for rupee especially for exchange against the USD are fairly well-
developed today One can classify these markets in three categories (a) spot versus derivatives
(b) over-the-counter (OTC) versus exchange-traded and (c) onshore versus offshore Further
derivatives can be cash-settled or delivery-based The most commonly referred benchmark
exchange rate of the rupee is from the onshore spot OTC market Similarly the commonly referred
forward exchange rate of the rupee is from the onshore forward OTC market Rupee futures and
options are traded in some onshore as well as offshore exchanges
The classification of currency markets can also be in terms of the nature of contracts between
buyers and sellers - spot forwards (futures on exchanges) and options contracts A spot contract
is for standard settlement ie the second working day after the date of transaction whereas in
case of forwards and futures (as well as options) the actual exchange or delivery of currency takes
place in the future at a date later than the spot settlement date There are also non-deliverable
forward contracts which are discussed below Forward and futures contracts are used as a risk
management tool or to hedge against possible adverse fluctuation in exchange rates It is important
13
to note that hedging implies risk transfer between the contracting parties it is not elimination of
risk
The category of the currency market that forms the focus of this report is the Offshore Rupee
markets The dominant segment of this market is the Non-Deliverable Forward (NDF) market ndash
wherein foreign exchange forward contracts are traded in the OTC market at offshore locations
generally the International Finance Centres (IFCs) like Singapore Hong Kong London Dubai
and New York These contracts do not involve a physical exchange of Rupees as Rupee is not
deliverable offshore and allow counter-parties to settle profit or loss in a convertible currency
usually the US Dollar which is why it is called a non-deliverable market NDF contracts are
usually traded on currencies which are not readily available to trade globally or outside of
sovereign boundaries These are thus mainly currencies from countries which have partial or no
capital account convertibility
There are also a few exchange-traded offshore rupee markets dealing in rupee futures and options
in Chicago Singapore and Dubai Volumes in these markets have typically been far smaller in
comparison to the offshore NDF OTC market Data on transactions in exchange-traded currency
markets can be ascertained with greater certainty whereas data on transactions in offshore OTC
NDF market have to be gauged through surveys and the estimates on the same are less firm
Why do NDF Markets Exist
NDF markets are not a phenomenon peculiar to the Indian Rupee they are common for currencies
of many emerging market economies (EMEs) As per BIS data NDFs in six currencies ndash Korean
Won Indian Rupee Chinese Renminbi Brazilian Real Taiwanese Dollar and Russian Ruble ndash
account for about two-thirds of the trade in NDFs globally The total daily average volume in NDF
markets is about USD 200 billion as per Bank of International Settlements (BIS) survey1 As per
this survey the share of India was about 1822 per cent of the trade in NDFrsquos globally (see Table
2 Chapter 2) The 2016 BIS survey (the next one will be released in the later part of 2019) showed
that offshore trades in Indian rupee were more or less equal to deliverable onshore forwards
1 2016 Triennial Central Bank Survey of Foreign Exchange and OTC Derivatives Markets
14
around $16 billion daily The 2018 Bank of England reported $23 billion in offshore rupee trades
while RBI sources estimate deliverable daily onshore forwards at $21 billion for 20192
The size of an open economy is one of the primary determinants of international participation in
its currency If international participants do not have direct access to the on-shore currency market
to meet their transaction needs or to hedge their currency exposure they are likely to use the
offshore NDF market The size depth and liquidity of the offshore NDF is thus indicative of the
non-resident interest in an emerging market economy
To some extent the offshore NDF market complements the need for a deep and liquid onshore
currency market What is the appropriate size of the forex market for an emerging market
economy with partially open capital account is determined by its size the share of foreign trade
and appetite for capital flows One proxy for estimating how large the forex market ought to be is
the GDP of the economy A better estimate could be the size of the open economy the trade and
investment sector
As Indiarsquos economy has grown over the past two and a half decades it has seen a significant rise
in openness (ie trade to GDP ratio has grown from 15 in 1990 to 43 in 2018) and in cross
border capital flows This has commensurately raised non-resident interest in the Rupee whether
for risk management purposes or for speculative ends The growing size of the Rupee NDF market
points to a need to widen participation in on-shore markets
The existence and size of offshore NDF markets is also a function of the degree of difficulty that
participants in foreign exchange market (especially non-residents) ndash both speculators and other
participants with requirements arising from cross-border trade transactions ndash face in accessing the
onshore markets The difficulties in accessing onshore currency markets could span a variety of
issues including the following
bull Restrictions on foreign exchange transactions
bull Cumbersome documentation and Know-Your-Customer (KYC) requirements for
participants in the domestic market
bull Restrictions on market participants (especially non-residents) in hedging activities such as
transaction limits tenor limits other documentation etc
bull Restrictions on cancellation and re-booking of contracts
2 For comparison with offshore market the onshore data includes forwards and swaps
15
bull Restrictions on the kind of derivative products that are allowed by market regulators and
bull Inconvenient market hours for those in other time zones
These constraints exist either to curb excessive speculation or to maintain financial stability
Are Offshore Rupee Markets a Problem
When the offshore market volume is significant or larger than the onshore currency market
volume as is the case with many EME currencies it leads to two fragmented markets wherein the
price discovery on the onshore market becomes vulnerable to influences from the price discovery
in the offshore market Empirical evidence (see Chapter 3) shows that while at most times the
direction of the influence runs both ways ie from onshore market to offshore market and vice-
versa the direction of the influence is more dominant from offshore market to the onshore market
in times of high volatility This could happen especially when tidal forces from global financial
markets influence the currency markets in a synchronised manner such as during times of
Emerging Markets (EM) currency crises
There are essentially four issues with regard to offshore market that are critical for regulators ndash
i Effectiveness of exchange rate management Many central banks including the Reserve
Bank have exchange rate stability as one of their objectives and resort to market
intervention or other regulatory measures to control volatility of the exchange rate from
time to time Such influence however extends only to the onshore currency market
Presence of a large offshore market dilutes the effectiveness of the exchange rate
management by the central bank It also hinders the pursuit of the objective of financial
stability in the domestic market
ii Disjointed price discovery During periods of volatility in the currency market when
price discovery in the offshore market causes large movements in onshore currency
markets the onshore market could often open with a large gap over the previous close For
resident market participants who want to cover their positions such gaps expose them to
significant risk
iii Revenue loss Every unit of turnover in a market earns a certain revenue for the market-
making financial firms Thus turnover in the offshore market can be viewed as a potential
revenue loss for domestic financial firms and the domestic economy
16
iv Effectiveness of RBI regulations on capital account management RBIrsquos policies on
capital account have been geared towards managing the impossible trinity a ldquomanagedrdquo
exchange rate free capital movement and an independent monetary policy RBI policies
have been geared toward avoidance of undue volatility in foreign exchange markets by
having restrictions on cancellation and rebooking and excessive risk-taking by resident
entities including corporates With this objective RBI restricts participation of resident
entities in currency derivatives to the extent of their underlying exposures A large market
outside the influence of regulatory authorities undermines their effectiveness
Constitution of the Task Force
Against this backdrop it was announced in the Statement on Developmental and Regulatory Policy
dated February 7 2019 the setting up of a Task Force on Offshore Rupee Markets Accordingly
a Task Force headed by Smt Usha Thorat was constituted with following terms of reference
i Assess the causes behind the development of the offshore Rupee market
ii Study the effects of the offshore markets on the Rupee exchange rate and market liquidity
in the domestic market
iii Recommend measures to address concerns if any arising out of offshore Rupee trading
iv Propose measures to generate incentives for non-residents to access the domestic market
v Examine the role if any International Financial Services Centre (IFSC) can play in
addressing these concerns
vi Any other relevant issue(s) the Task Force considers relevant to the context
The Task Force comprises of the following
i Smt Usha Thorat former Deputy Governor Reserve Bank of India ndash Chairperson
ii Shri Anand Bajaj Joint Secretary Department of Economic Affairs Ministry of Finance
Government of India ndash Member
iii Shri G Mahalingam Whole Time Director Securities amp Exchange Board of India ndash
Member
iv Shri Ajit Ranade Chief Economist of the Aditya Birla Group ndash Member
v Shri Sajjid Chinoy Chief Economist India JP Morgan India ndash Member
17
vi Shri Surendra Rosha CEO India HSBC Bank ndash Member
vii Shri Rajiv Ranjan Adviser-in-charge Department of Economic Policy and Research
Reserve Bank of India ndash Member
viii Shri T Rabi Sankar Chief General Manager Financial Markets Regulation Department
Reserve Bank of India ndash Member Secretary
Approach of the Task Force
Among the different issues relating to offshore markets the argument concerning revenue loss is
perhaps the most simplistic and an obvious response could be for India to develop non-deliverable
Rupee derivative market in an International Finance Service Centre (such as the GIFT City) located
within the geographical boundary of India However such a market will be virtually no different
from the markets located in Singapore or London and hence the objective of bringing volumes to
the onshore market will remain unaddressed
From the standpoint of addressing the concerns arising out of the existence of large offshore
markets it would make sense to incentivise movement of as much currency market transactions
from such markets to onshore currency markets as possible However theoretically one needs to
recognise that there is a trade-off between the sizeprominence of the offshore market and the
extent of regulationsrestrictions that are placed on cross-border transactions and foreign exchange
marketsparticipants It is also important to note that even if all non-residents with underlying
exposure move their hedging transactions to onshore markets offshore markets would continue to
exist to meet the demand of participants who take a view on the exchange rate without any
underlying exposure ie the speculative demand
At one extreme of the above-mentioned trade-off if India opts for a full rupee convertibility ndash by
removing all restrictions on current and capital account transactions ndash along with removal of all
restrictions on currency derivatives then offshore markets would no longer be a relevant concept
Capital account convertibility has been a hotly debated issue in the discourse on public policy both
in India and globally The received consensus in the last couple of decades endorsed by the
International Monetary Fund (IMF) in 2012 is that while capital flows are an important aspect of
the international monetary system providing significant benefits for countries they also carry risks
for macroeconomic and financial stability especially if they are large and volatile and thus pose
a challenge for policy Hence capital flows management measures are justified to help harness the
18
benefits while managing the risks More generally some restrictions to the capital account are
necessary for India to avoid the ldquoimpossible trinityrdquo With an economy as large and diverse as
Indiarsquos which is therefore expectedly not completely synchronous to the global cycle retaining
the independence of monetary policy is imperative Similarly having some control over the
exchange rate is necessary given its occasional propensity to be excessively volatile and overshoot
with attendant feedback loops to the macro-economy Therefore capital flow management
measures become necessary to avoid the trilemma and ensure simultaneous fulfilment of the other
two objectives Based on this received consensus as well as the experiences of some emerging
market economies through the last two decades the Task Force has proceeded on the basis that
the existing framework of capital account management followed by the Government and the RBI
will continue
There is also the issue of de-jure capital account convertibility Even when speculators
arbitrageurs and traders do not have direct access to forex markets to exploit persistent interest rate
differentials or perceived mispricing of the currency there are alternative channels available in
the system which make the actual arbitrage opportunities much lower Some examples of such
instruments is the Overnight Indexed Swaps (OIS) market or the use of Mumbai Interbank
Forward Offer Rate (MIFOR) Hence the de-jure level of capital account convertibility (CAC)
could be much higher than implied by the existence of capital controls
A related issue is the internationalisation of rupee According to McCauley (2011) a currency is
internationalised when market participants ndash residents and non-residents alike ndash conveniently use
it to trade invest borrow and invoice in it Based on the experience of China to internationalise
Renminbi and the evidence of the narrowing of the gap between onshore forward rate and NDF
rates for Renminbi internationalisation of currency has been sometimes advocated as a way to
reduce the influence of offshore markets While one has witnessed issuance of rupee-denominated
bonds (ldquoMasala Bondsrdquo) in some offshore markets in the recent past internationalisation of rupee
is still a distant goalpost given the persistent current account deficit and the negative net
international debt position Thus internationalisation of rupee is not an explicit goal guiding the
recommendations of the Task Force
Further the Task Force believes that Indiarsquos approach to the trade-off between deregulation of
currency markets and tolerance of offshore market must be shaped by the specific considerations
of the Indian economy rather than following any global template blindly
19
Compared to countries like Korea Taiwan or China Indiarsquos macroeconomic structure is
significantly different India is a structurally an economy with twin deficits ndash both fiscal and
current account Nearly half of Indiarsquos consumer price index (CPI) basket comprises of food items
making Indiarsquos inflation more vulnerable to supply shocks Although Indiarsquos macroeconomic
stability has improved considerably in the last few years considering the above factors the Task
Force feels that India cannot risk macroeconomic instability through potential exchange rate
shocks by drastically lifting the restrictions on foreign exchange markets and participants
On the other hand large volumes in the offshore market also reflect the fact that the interest in
Rupee is far larger than what is evident in onshore currency markets This reflects the growing size
of the Indian economy greater role of India in the global economy and growth in trade and capital
flows Over time therefore it would be imperative for the Indian regulators to take steps to expand
the role of onshore currency markets gradually lest the disjointed price discovery issue flares up
more frequently and in larger degrees
The balanced approach of the Task Force therefore is to look at each of the difficulties faced by
market participants in accessing onshore currency markets and prioritise their resolution in such a
way that prudent regulatory considerations are least compromised For instance certain market
micro-structure issues (such as extending the market hours of onshore currency markets) can be
addressed relatively quickly without any regulatory compromise On issues related to
documentation and KYC requirements smart application of ease-of-doing-business principles
needs to be followed Economic entities which need to undertake hedging of their foreign exchange
exposure on account of genuine underlying exposures need to be given greater flexibility in
undertaking such transactions in domestic currency markets While the need for underlying
exposure in order to operate in the forward markets cannot be eliminated the way in which it is
evidenced and monitored can be simplified The Task Force has proceeded on the basis of the
existing principles of regulations of foreign exchange markets
Of course the Task Force recognises that the recommendations will not do away with the
economic imperatives for which trading of rupee forward contracts exists in offshore markets
With our recommendations the Task Force believes that regulatory concerns arising out of the
offshore markets can be reduced though not eliminated
The Task Force held nine meetings between March 2019 and July 2019 The details of the meetings
are given in Annex V
20
Chapter 2
The Evolution of NDF Markets and Cross-country Experience
The foreign exchange market in India during 1970s and 1980s was heavily controlled and closed
in nature with various kinds of restrictions in place The Indian foreign exchange market started
deepening with the transition to a market-determined exchange rate system in March 1993 and the
subsequent liberalisation of restrictions on various external transactions leading up to current
account convertibility under Article VIII of the Articles of Agreement of the International
Monetary Fund in 1994 Notwithstanding various measures taken to further deepen and broaden
the foreign exchange market in India various restrictions are still in place to limit market access
to only those with underlying exposure and prevent undue speculation As India gets increasingly
integrated with the global markets and the exchange rate is increasingly market determined a
combination of capital flows management measures and currency trading restrictions in the on
shore markets are used to manage the lsquoimpossible trinityrsquo external value of the rupee These
measures and restriction are under constant review to ensure that the overall objective of growth
through foreign trade and investment are served
Against this backdrop this chapter attempts to highlights evolution in section II a brief review of
literature on the reasons behind increase in turnover in NDF market in Asian countries has been
given in Section III Section IV highlights the developments in NDF market The country
experiences such as nature of restrictions on non-residents operating in domestic currency
forwards market liberalisation measures taken by countries and its impact in curbing offshore
market discussed in Section V
I Introduction
NDFs are foreign exchange derivative instruments on non-convertible or restricted currencies
traded over the counter (OTC) mainly at offshore centres ie outside the direct jurisdiction of the
respective national authorities It is essentially a forward contract with different settlement process
Unlike the standard forward contract which involves exchange of underlying currencies on
maturity the NDF contract is typically settled as the difference between an exchange rate agreed
months before and the actual spot rate at maturity in an international currency (deliverable) mainly
the US dollars And the other currency which is usually emerging market currency is non-
21
deliverable The settlement of the transaction is not by delivering the underlying pair of currencies
but by making a net payment in a convertible currency equal to the difference between the agreed
forward exchange rate and the subsequent spot rate (Ma et al 2004) NDF contracts can either be
traded over the counter market or at exchanges at offshore financial centres such as Hong Kong
Singapore and London Lately they have become popular derivative instruments catering to the
offshore investorsrsquo demand for hedging arbitraging and speculating including by those who look
upon currency as an asset class
The major participants in NDF market could include foreign businesses and investors doing
business in countries with complex requirements for hedging currency risk in the local markets
arbitragers who have access to both on shore and offshore markets pure speculators like hedge
funds and others who take positions in the NDF market While these are the end users there are
also market intermediaries like banks dealers and brokers who provide quotes for trading in these
currencies and custodians who provide settlement arrangements While the multinational
companies deal in both the long and short end of the market the short end of the market is
particularly dominated by the hedge funds (Misra and Behera 2006) The pricing is influenced by
a combination of factors such as interest rate differential between the two currencies supply and
demand future spot expectations foreign exchange regime and central bank policies
NDF market primarily evolved in response to under-developed onshore forward markets and
limited access to non-residents to currencies with foreign exchange convertibility restrictions An
important advantage that enhances the demand for NDF is reduced credit risk compared to onshore
counterparts since there is no exchange of principal and only the difference amount is settled thus
allowing investors to circumvent limits associated with onshore activity Other reasons which also
favoured the emergence of NDF market includes convenience of time zones location of customer
business operating from a global treasury for multinational companies short-trading hours in
onshore forex market capital controls by individual central banks position limits frictions like
registration norms and know your customer norms frequent and significant changes in regulations
and guidelines in the domestic exchanges and OTC markets Moreover credit risk is also less
relevant since mostly large foreign banks are engaged as a counterparty in NDF trading Further
offshore centres in some cases are better placed to offer competitive services compared to the
22
onshore market on account of various factors ranging from tax treatment less onerous regulations
and documentation to operational efficiency
II Evolution of NDF Markets
The origin of NDF market traces back to the 1990s when a wave of capital account liberalisation
in emerging market economies (EMEs) triggered surge in capital inflows to these economies and
consequently increased currency risk faced by the investors However under-developed domestic
forward market or restricted access to onshore forward market paved the way for evolution of NDF
market as an alternative hedging tool to these investors The widely shared concern amongst local
monetary authorities was that easy access to onshore market and availability of domestic currency
to non-residents will encourage speculative activity leading to greater exchange rate volatility and
eventually the loss of monetary control Consequently some international banks began offering
NDF contracts to meet the demand of investors willing to hedge their EM currencies exposure
during early 1990s (Higgins and Humpage 2005)
One of the earliest NDF market developed during early 1990s was in Mexican peso to speculate
on the currency ahead of the devaluation from its then fixed exchange rate against the US Dollar
The increase in trading turnover during that time was facilitated by the entrance of voice brokers
as intermediaries between inter-bank trading activities (Lipscomb 2005) The NDF market for
some Asian economies like Korean Won Taiwanese Dollar Indian rupee and Chinese Renminbi
existed since mid-1990s due to either restricted or no access to onshore forward markets by non-
residents (BIS 2004) In case of New Taiwan Dollar only onshore entities had access to onshore
markets while it was subjected to underlying requirements in case of Korean Won Indian rupee
and Chinese Renminbi For other currencies like Indonesian rupiah NDF market evolved after
the Asian financial crisis in response to re-imposition of capital restrictions which were liberalised
in early 1990s In Indonesia rapid liberalisation beginning as early as 1970s and further
internalisation of Indonesia rupiah enabled the development of deliverable offshore market for
rupiah Following the currency crisis initial measures were directed at curbing non-trade and
investment related forward transactions with non-residents and broader measures prohibiting
banks from extending loans conducting derivative transactions and transferring rupiah to non-
residents were introduced in early 2001 While Malaysia also imposed cross border restrictions
23
after the crisis evolution of NDF market in Ringgit was initially inhibited by comprehensiveness
of regulations as well as its effective enforcement by the authorities (Ishii 2001)
McCauley (2011) showed that as income per capita rises a currency trades in ever greater
multiples of the home economyrsquos underlying international trade (ldquofinancialisationrdquo) and trades to
an even greater extent outside its home market (ldquointernationalisationrdquo) The increasing economic
interest in emerging market economies as a result of upbeat growth scenario from 2000s spurred
greater participation in currencies of these economies (Chart 1) In this context increasing turnover
in the Indian rupee Chinese Renminbi and other Asian currencies like Indonesian rupiah
Malaysian Ringgit Korean Won and New Taiwanese Dollar is consistent with increased
investment in these economies amidst restricted access to onshore markets Both India and China
recorded phenomenal growth rates translating into increased businesses (trade and investments)
with rest of the world and resulting exposures facilitated offshore trading of their currencies (Chart
2 a amp b) During 1990s mostly non-residents with genuine exposure used NDF market to hedge
their exposures in Indian rupee However with the development of onshore market providing
reasonable hedging facilities to foreign investors amidst gradual relaxation of controls most of the
market activity seems to be driven by speculators and arbitrageurs and those who are looking at
the rupee as a separate asset class to diversify their portfolios in view of its growing international
importance As a result the size of NDF market has grown over time In the Chinarsquos case the
emergence of offshore deliverables market for Renminbi (CNH) since 2010 was mainly due to
internationalisation of Renminbi which gradually substituted the NDF market
24
Chart 1 a amp b FX turnover Indexed 1998=100 and FX TurnoverTrade vs GDP
Source BIS Triennial survey IMF CEIC
Note Chart 1b A higher ratio of FX turnover to trade indicates that a currency trade in higher multiple
relative to its underlying trade as GDP increases
Chart 2 a amp b Gross trade Indexed 2000=100 and Gross trade vs FX turnover
Source IMF BIS World Bank
Both Indonesia and Malaysia have witnessed sharp increase in non-resident participation in local
currency bond market particularly in the aftermath of global financial crisis 2008 while these
countries local forward markets imposed restrictive conditions that restricted use of these markets
for hedging this led to the increased use of NDF market Non-resident ownership of government
debt in Indonesia and Malaysia as share of total outstanding government debt stood at 383 per
0
100
200
300
400
500
600
200
0
200
2
200
4
200
6
200
8
201
0
201
2
201
4
201
6
201
8
WorldAsiaEmerging and developing economiesAdvanced economies
0
1000
2000
3000
4000
0
200
400
600
800
1000
1200
1998 2001 2004 2007 2010 2013 2016
BRL IDR
CNY INR
MYR TWD
KRW right scale
Brazil
Korea
Indonesia
China
India
Malaysia
0
5
10
15
20
25
30
01 10 100 1000
GD
P p
er c
apit
a (U
SD
in t
ho
usa
nd
s)
FX turnover to trade (in log form)
Brazil
China
Indonesia
India
Korea Malaysia
Thailand
00
10
20
30
40
50
60
70
0 25 50 75 100 125 150
FX
turn
over
to
GD
P
External trade to GDP
25
cent and 243 per cent as at the end of March 2019 respectively highest amongst other Asian
economies However foreign participation in equity market is higher for Korea and Taiwan While
Taiwan has limits on investments in domestic bonds by non-residents foreign investors are not
subject to any investment ceiling for both aggregate and individual holdings in a listed company
except for a few restricted industries
Additionally the reason for growing NDF market could be increased carry trade activities for high
yielding currencies After examining the returns of carry trades with deliverable and non-
deliverable forwards Doukas and Zhang (2013) found that carry trades for currencies with NDF
contracts perform better compared to carry trades for currencies with deliverable forward
contracts This excess return is attributed to the compensation of risks emanating from currency
convertibility and capital controls For the Brazilian Real (BRL) derivatives offshore NDFs in
particular are the main vehicle for investors looking to implement carry trades (BIS Santaelaa
2015)
NDF market evolved mainly for emerging market economies witnessing increased economic
interest in the process of transition to high growth phase since 1990s whilst restrictions persisted
in accessing onshore markets for hedging currency risk arising out of these exposures The NDF
market also provided an opportunity to speculate on currencies which underwent notable shift in
their exchange rate regime During periods of global uncertainties like in 2013 during ldquotaper
tantrumrdquo the NDF market is used for speculative purposes arguably causing disruptions in
domestic forex market
III Size of the NDF market
Given that NDF is an over the counter (OTC) traded instrument the turnover data relies on various
surveys conducted by institutions at different time intervals In view of this issues like
comparability and continuity in data often arises However these surveys still provide useful
information to gauge the growth of NDF market over time Results from the semi-annual turnover
survey for the Foreign Exchange Joint Standing Committee chaired by Bank of England (BoE)
suggests that growth of NDF market has outpaced the forward market as well as overall foreign
exchange market In London the average daily NDF turnover surged to USD 139 billion as per
26
the latest survey in October 2018 from as low as USD 21 billion in 2008 During this period NDF
turnover quadrupled and its share increased to 53 per cent of overall forex turnover and comprised
nearly 34 per cent of both onshore and offshore forwards compared to nearly 10 per cent in 2008
Table 1 NDF trading in London (Average daily turnover in billions of US dollars)
NDFs All forwards NDF of all
forwards
All FX NDF as of all FX
Apr-08 23 200 115 1832 13
Oct-08 19 230 83 1699 11
Apr-09 16 162 99 1356 12
Oct-09 26 191 136 1522 17
Apr-10 25 186 134 1687 15
Oct-10 37 188 197 1787 21
Apr-11 42 192 219 2042 21
Oct-11 37 192 193 2038 18
Apr-12 36 192 188 2014 18
Oct-12 45 211 213 2017 22
Apr-13 60 265 226 2547 24
Oct-13 43 205 210 2234 19
Oct-14 62 304 204 2711 23
Apr-15 64 295 217 2481 26
Oct-15 54 253 213 2111 26
Apr-16 60 275 218 2225 27
Oct-16 62 292 212 2179 28
Apr-17 78 332 235 2401 32
Oct-17 90 330 273 2380 38
Apr-18 111 407 273 2727 41
Oct-18 139 409 340 2611 53
Source BIS London Foreign Exchange Joint Standing Committee
A similar survey is conducted by Hong Kong trade repository (HKTR) under the mandatory
reporting obligations imposed since July 2015 According to the HKTR survey daily average
27
NDF turnover in Hong Kong has also exhibited significant growth and daily average turnover
increased to USD 55-60 billion in 2018 from nearly USD 8 billion in 2015
The BIS publishes data on foreign exchange and derivatives trading activity every three years and
also prepare a separate report on NDF covering global market since 2013 The latest 2016 BIS
triennial survey reported that average daily turnover in global NDF market has increased by 53
per cent to USD 134 billion as compared to April 2013 Further NDF share in outright forward
and overall foreign exchange trading remained stable at 190 per cent and 26 per cent respectively
(Table 1) This is in contrast to the decline in average daily turnover in global FX markets to USD
51 trillion in 2016 from USD 54 trillion in 2013 survey conducted by BIS
The currency composition suggests that the Asian currencies dominate the NDF trading activity
with the highest turnover recorded by Korean Won as Korea generally has open capital account
and there are limits on non-residents borrowings in Korean Won from banks in Korea therefore
it is not deliverable offshore (BIS Survey 2016) Survey results from London Hong Kong and
Tokyo foreign exchange committees (FEC) as well as the BIS triennial survey points toward
increased NDF trading activity in Korean Won The Tokyo survey which is available from the
year 2006 suggest that the growth in NDF trading activity for Korean Won has shown significant
growth outperforming other major currencies The momentum in major currencies picked up ahead
of the global financial crisis 2008 before faltering during the crisis period owing to deteriorating
financial conditions Subsequently the NDF activity has deepened over time with the Indian rupee
and Brazilian Real constituting higher proportion of total global turnover after the Korean Won
as corroborated by the London survey also During the five-year period from 2008-13 the increase
in NDF turnover is largely consistent with the FX turnover in emerging market economies (BIS
2013)
Since 2013 greater demand for hedging in anticipation of monetary policy normalisation seems
to be the driving factor for increase in NDF activity given that lot of capital flows to emerging
markets was funded using low cost dollar liquidity (BIS 2013) The BIS 2016 survey identified
that developments associated with higher volatility in Renminbi during August 2015 and January
2016 has also boosted Asian NDFs even as trading activity in Renminbi NDF has faded
According to the BIS 2016 survey during 2013 and 2016 trading in Renminbi NDF contracted
by 394 per cent while that of Korean Won and Taiwanese Dollar expanded by 537 per cent and
28
299 per cent respectively The decline in the NDF activity for Indian rupee reflects the
depreciation of rupee against the US dollar however daily average turnover was up by 167 per
cent between 2013 and 2016 in unadjusted terms Hong Kong (HKTR) survey indicates continued
decline in NDF activity for Chinese Renminbi and Malaysian Ringgit (Table 2 and Chart 2 a amp b)
In case of China this was due to the Renminbi internationalisation policy followed after 2011
Table 2 Daily average turnover (USD billion) Spread
BIS 2013 BIS 2016
Oct- 2018
(London Survey) Bid-Ask (Latest)
NDF DF NDF DF NDF
DF
(Latest) Onshore Offshore
Chinese Renminbi 171 24 104 281 88 650 0001-0002 0003-0005
Indian Rupee 172 31 164 163 2303 214 001 002
Korean Won 196 11 301 145 295 300 010 030
Taiwanese Dollar 89 02 115 78 - 193 0005-0010 0010-0020
Brazilian Real 159 27 187 30 154 - - -
Russian Ruble 41 05 29 186 40 - - -
Source BIS London FEC BoK RBI China Foreign Exchange Trading Center Central bank of Taiwan HSBC
Note
1 DF= Deliverable forwards and include forwards and FX swaps traded onshore
2 Chinese Renminbi volumes on offshore segment are negligible after development of CNH market
3 BIS DF and DF (latest) are not directly comparable since latest numbers are taken from country sources
Chinese Yuan is for Jun-19 Indian rupee and Taiwanese Dollar is for Apr-19 Korean Won is for 2017
Chart 2 Average Daily Turnover and Change in Forex position of Asian Currencies
3 The corresponding figure for April 2019 stood at USD 28billion
0
100
200
300
400
500
US
DC
NY
US
DI
DR
US
DI
NR
US
DK
RW
US
DM
YR
US
DT
WD
Chart 2b Change in FX position of Asian
currencies (in USD billion)
29 January 2016 27 January 2017
31 January 2018 25 January 2019
0
200
400
600
800
1000
1200
Apr-
06
Apr-
07
Apr-
08
Apr-
09
Apr-
10
Apr-
11
Apr-
12
Apr-
13
Apr-
14
Apr-
15
Apr-
16
Apr-
17
Apr-
18
Chart 2a Average daily turnover USD
million
CNY INR IDR KRW
MYR TWD BRL
29
Source Tokyo FEC Hong Kong FEC
Based on latest surveys conducted by London and Hong Kong FEC which are major offshore
centres clearly it showed that the global NDF activity has surged led by Korean Won Indian
rupee Brazilian Real and Taiwanese Dollar The trend is likely to be validated by BIS 2019 survey
which encompasses global turnover and is due to release later this year
IV Review of Literature
In view of the noticeable rise in NDF activity with potential to engender distortions in local market
there exist varied literature on the emergence of NDF market and its spill-overs to onshore
counterparts One of the earliest attempts was made by Park (2001) which investigated the impact
of financial deregulation on relationship between onshore and offshore prices A key finding was
that Korean Won NDF influenced onshore prices after a shift to floating exchange rate regime
coupled with liberalisation of capital controls As part of liberalisation measures following the
Asian financial crisis in 1997 excessive regulations pertaining to foreign exchange market were
removed and measures were undertaken to improve efficiency of market by increasing liquidity
and broadening participation base (Chung et al 2000) Amongst these measures onshore entities
were allowed to participate in offshore market In this regard Lipscomb (2005) suggested that
transition to a more convertible exchange rate regime and permissible participation of onshore
counterparties in NDF transactions contributed to the increase in offshore liquidity which begets
liquidity in domestic market as well A classic example is Korean Won where both onshore and
offshore market co-exist with arbitrage opportunity exploiting any incipient price discrepancy
However NDF markets tend to disappear as the currency becomes fully convertible as stated
earlier
Wang et al (2007) also corroborated the finding that NDF market seems to be the driver for the
domestic spot market of Korean Won while the information flow is reverse for Taiwanese Dollar
where the spot market was found to have influence on NDF market Adding to this literature
Colaveccchio and Funke (2008) found Renminbi NDF to be the key driver of Asian currency
markets with varied degree of heterogeneity contingent on real and financial inter-linkages
Amongst the country specific study the one by Cadarajat and Lubis (2012) demonstrated that
Indonesia rupiah NDF tends to have influence on domestic spot and forward return
30
Studies by Hutchison (2009) Mihajek and Packer (2010) and McCauley and Scatigna (2011)
asserted that offshore trading becomes increasingly important with growing economic interest in
a particular currency amidst limited access to onshore markets and convertibility restrictions A
study by BIS (2013) analysed the directional impact for nine currencies including the Indian rupee
for the period 2005-13 along with separate analysis for 2008-09 crisis and May-August 2013 It
found the presence of two way causation for most currencies for the full sample period however
noted the increase in NDF influence during market stress Both the stress period saw noticeable
impact of NDF particularly during May-August 2013 with major exception of Malaysian Ringgit
where NDF played dominant role and there was no case of deliverable forward influencing NDF
In the Indian context the earliest study with regard to spill-overs impact was undertaken by Misra
and Behera (2006) They found onshore prices to have directional impact on NDF prices even as
volatility spillovers could exist from NDF to onshore market The subsequent research on this
subject during the period 2000-09 by Behera (2011) demonstrated the change in dynamics with
evidence of greater volatility spillover from NDF to spot market A similar finding was outlined
by Guru (2009) on the relationship between the NDF and onshore market for Indian rupee It is
argued that dynamics of relationship between onshore and offshore markets has undergone a
change with the introduction of the currency future market in 2008 and returns in NDF market
seem to be influencing the domestic spot as well as forward market
A study by Darbha (2012) finds that offshore markets plays an important role in price discovery
mechanism particularly in India and China Goyal et al (2013) after examining the period 2006-
13 found the existence of bi-directional relationship between onshore and NDF market for Indian
rupee over the long term however the directional impact turns one way from NDF to onshore
during periods of depreciating pressures ie movements in NDF markets drives adjustment in
onshore market when the currency is under depreciation pressures This asymmetric behaviour is
attributed to the fact that the Reserve bank intervenes in the foreign exchange market to stem
excessive volatility during periods of rupee depreciation
McCauley et al (2014) described two paths for evolution of the NDF markets The first one is
being followed by Chinese Renminbi which has become deliverable after the emergence of
offshore market The Indian rupee falls under the second where the NDF market has grown amidst
continued restrictions on foreign participation
31
The report of the Standing Council (Standing Council on International Competitiveness of the
Indian Financial System 2015 by Ministry of Finance Government of India enumerated factors
including capital controls position limits frictions like registration norms and know your customer
norms frequent and significant changes in regulations and guidelines in the domestic exchanges
and OTC markets as deterrent to foreign investors participation in the onshore market
IGIDR Finance Research Group (2016) made an important recommendation that domestic entities
should be permitted to participate in NDF market after outlining factors driving offshore activity
compared to onshore segment In respect of the internationalisation of rupee as one of the debated
recommendation Kumar and Patnaik (2018) argued the case for gradual internationalisation of
rupee on analysing the role of the Indian rupee in terms of official sector currency reserve currency
and trade invoicing currency
V Country Experience
China
The Chinese Renminbi (RMB) forward market can be segmented into offshore NDF market (since
1990s) an onshore Renminbi market (since 2007) and the CNH market (offshore deliverable) In
the current scenario RMB NDF has been gradually replaced by offshore deliverables after the
creation of CNH market since mid- 2010 as a by-product of promotion of international role of
RMB since 2009
Chinarsquos exchange rate regime has evolved from fixed to managed floating rates followed by
internationalisation of Renminbi (RMB) In early 1990s reforms started with the unification of
multiple exchange rate in 1994 and in 1996 China allowed the full convertibility of Yuan under
current account transactions Eventually the Peoplersquos Bank of China (PBoC) announced the
implementation of managed floating exchange rate against basket of currencies in July 2005
ending the dollar peg prevalent since 1994 Over the last decade Chinarsquos strong economic
performance and growing linkages with rest of the world prompted authorities to promote the
international role of RMB The idea of internationalisation of RMB gained prominence following
the financial crisis of 2008 which revealed the fragilities of dollar dominated global financial
system The thrust of early initiatives was RMB trade settlement premised on Chinarsquos deeper trade
32
links and its central role within Asiarsquos supply chain that supported the demand for its currency for
trade invoicing In this regard a pilot scheme permitting cross border trade settlement in RMB was
launched in 2009 which was widened to cover all current account transactions over the course of
next three years Capital account liberalisation was undertaken at a more gradual pace with the
Chinese RMB becoming officially deliverable at offshore centres in 2010 While Hong Kong
banks were permitted to accept RMB deposits as part of personal accounts in 2004 an important
milestone was the sign of Memorandum of cooperation between HKMA and PBoC in July 2010
which eliminated restrictions on Hong Kong banks in establishing Renminbi accounts and
providing related services ie payments and transfers in RMB to individuals and corporations
Moreover financial institutions were permitted to offer Yuan denominated products As a result
CNH (offshore Renminbi) began to trade actively amongst other range of products and prompted
investors to switch to deliverable market in place of NDF which was used previously Whilst CNH
can be transferred freely between offshore accounts transfer of RMB between onshore and
offshore is still confined to regulated channels to fend off potential adverse impact on onshore
markets Moreover these restrictions are skewed towards outflows form the mainland to offshore
centres
With Renminbi internationalisation the offshore CNH market has shown exponential growth
displacing the NDFs The BIS Triennial Survey showed significant decline in RMB NDF which
fell nearly 40 per cent between 2013 and 2016 driving its share in total RMB trading to 5 per cent
from 14 per cent earlier (BIS 2016) The rapid expansion of offshore market is clearly discernible
in rising FX turnover for CNH which has nearly doubled between 2013 and 2016 and forms around
67 per cent of the total RMB turnover Of the total CNH turnover average daily turnover in the
DFs in April 2016 was estimated to increase to USD 164 billion from USD 84 billion in 2013
(Table 3)
33
Table 3 RMB market turnover average daily turnover in USD billion
OTC
spot
OTC
FX
swaps
OTC
DFs
OTC
NDF Options Futures
OTC
currency
swaps Total
CNY
2013 201 105 26 0 03 0 0 335
2016 249 27 13 0 2 0 02 554
change 239 1565 -514 5693 651
CNH
2013 139 294 84
168 0 05 69
2016 427 59 164
158 03 25 1367
change 2079 1008 943 -56 5784 3836 981
NDF
2013
171
171
2016
104
104
change -394 -394
Source BIS
Since the inception of CNH pricing gaps tend to persist between onshore and offshore exchange
rates however it has narrowed over last couple of years This pricing gap arises on account of
different economic conditions in mainland China and Hong Kong amidst imperfect arbitrage
(Funke 2015) While central bank intervention can constrain the movement of CNY at onshore
centres CNH is more market determined and hence closely follows the global swings (Chart 3)
Since September 2015 PBOC has reportedly taken action in the offshore market when the
onshore-offshore gap was large (McCauley amp Shu 2018)
34
Source Bloomberg
Further liberalisation of the onshore FX market along with allowance of offshore deliverable
market has made the CNY NDF market almost non-existent despite maintaining the lsquoneed basisrsquo
principle Notwithstanding the existence of basis between CNY and CNH due to the band range
trading in CNY and market determined pricing in CNH the spread has been contracting over years
with ample liquidity available in onshore and offshore markets Further the creation of offshore
market has made various options available to offshore investors to both hedge their exposures on
underlying investments and also generate RMB risk in their portfolios via various products and
offshore deliverable market
Korea
With an average daily turnover of USD 30 billion as per the BIS survey 2016 and USD 295 billion
in the latest London survey of October 2018 Korean Won (KRW) NDF boasts of the most active
and liquid NDF market amongst most emerging market currencies Further permissible
participation of local banks in the NDF market ensures close integration of onshore and offshore
forex markets allowing for quick sentiment spillovers between the two markets Turnover in NDF
market is substantially higher than onshore forwards mainly on account of higher documentation
requirements for accessing onshore market In the onshore market average daily turnover was
reported at USD101 billion in 2017 for forwards which increased from USD 96 billion during
the previous year (Chart 4 a ampb)
-015
-01
-005
0
005
01
01-0
8-2
010
01-1
2-2
010
01-0
4-2
011
01-0
8-2
011
01-1
2-2
011
01-0
4-2
012
01-0
8-2
012
01-1
2-2
012
01-0
4-2
013
01-0
8-2
013
01-1
2-2
013
01-0
4-2
014
01-0
8-2
014
01-1
2-2
014
01-0
4-2
015
01-0
8-2
015
01-1
2-2
015
01-0
4-2
016
01-0
8-2
016
01-1
2-2
016
01-0
4-2
017
01-0
8-2
017
01-1
2-2
017
01-0
4-2
018
01-0
8-2
018
01-1
2-2
018
01-0
4-2
019
Chart 3 Gap between USDCNY and USDCNH
Offshore premium
35
Chart 4 Foreign Exchange Turnover and NDF market in Korea
Source Bloomberg Bank of Korea
Korea embarked on liberalisation reforms in 1980s however took big strides post Asian financial
crisis in 1997-98 in line with the IMF adjustment programme As part of these measures foreign
exchange transactions were liberalised which allowed the local banks to engage in NDF
transactions with non-residents Prior to this the development of the onshore currency derivatives
market was constrained by legal requirements such as any forward transaction had to be certified
as a hedge against future current account flows the so-called ldquoreal demand principlerdquo which also
spurred the development of a liquid offshore ldquonon-deliverablerdquo forward (NDF) market in the
Korean Won In 1999 as part of liberalisation measures this restriction was lifted and a lot of
activity moved onshore leading to the convergence of the offshore and onshore prices (IMF
2004) This resulted in sharp increase in NDF transactions between onshore banks and non-
residents for both hedging as well as speculative purposes Amidst likely possibility of turmoil in
foreign exchange market the central bank implemented regulations in January 2004 governing
Korean banks NDF positions with the non-residents directed at restraining any potential selloffs
However these restrictions were abolished in April 2004 as speculative activity was assessed to
have reduced significantly
KRW is almost a non-restricted currency provided the investor holds an Investment Registration
Certificate (IRC) issued by the Financial Supervisory Services (FSS) in Korea The IRC allows an
offshore investor to invest in onshore securities and provides near non-restricted currency rights
barring any holding of short selling position in onshore KRW account
191 18 183 175 20 194 196
7566 71 76
83 96 101
192198 196 19
192 184198
0
10
20
30
40
50
2011 2012 2013 2014 2015 2016 2017
Chart 4b Foreign Exchange Turnover
in Korea daily average USD billion
Spots Forwards Fx Swaps
-60
-50
-40
-30
-20
-10
0
10
20
30
12
-19
98
01
-20
00
02
-20
01
03
-20
02
04
-20
03
05
-20
04
06
-20
05
07
-20
06
08
-20
07
09
-20
08
10
-20
09
11
-20
10
12
-20
11
01
-20
13
02
-20
14
03
-20
15
04
-20
16
05
-20
17
06
-20
18
Chart 4a Onshore USDKRW-NDF 1M
USDKRW
36
For non-residents investors who do not hold IRS USDKRW remains a highly regulated market
Any onshoreoffshore transactions need to be approved by the appropriate authorities and must
have proof of underlying For multinational clients that repatriate dividends documentation with
proof of underlying must be in place Further ceilings are imposed on foreign exchange derivatives
transactions of foreign as well as local banks which came into existence as a prudential measure
to mitigate the adverse impact of volatile capital flows
Ahead of the 2008 financial crisis Korean economy experienced huge build-up of short-term
external debt led by foreign exchange derivatives positioning of banks on account of over-hedging
undertaken by Korean corporations as well as likely carry trades in anticipation of appreciation of
domestic currency Both these activities were funded using offshore dollar borrowing and posed
serious difficulties at the time of global dollar liquidity crunch during financial crisis With a view
to prevent recurrence of the any such episode triggered by volatile capital flows which resurged
from 2009 over-hedging was specifically prohibited and limits were imposed on Foreign
exchange derivatives activity of banks in relation to their capital Liberalization in KRW has been
continuing for decades with the last one completed in December 2007 whereby prior approval
requirements for some capital account transactions was abolished Even onshore participants can
freely participate in the NDF markets thereby providing onshore liquidity to Non-Residents as
long as the hedges are booked as NDF Essentially KRW is a fully convertible currency but is
only tradable on NDF basis offshore
Malaysia
Malaysia had liberal foreign exchange policies until Asian financial crisis with regard to cross
border transactions involving Malaysian Ringgit (MYR) Following the crisis offshore trading of
MYR was banned However grace period was notified for depositors to repatriate their offshore
deposits back to Malaysia and the adoption of fixed exchange rate policy in 1998 - a significant
move whilst imposing selective capital controls All these measures were intended at ceasing
offshore activity which contributed to the excessive pressure on currency despite relatively
stronger fundamentals Although Malaysia imposed cross border restrictions after the Asian crisis
evolution of NDF market in MYR was initially inhibited by comprehensiveness of regulations as
well as its effective enforcement by the authorities (Ishii 2001) Further absence of reference rate
37
for settlement of NDF contracts and stringent controls on domestic bank to undertake forward
foreign exchange transactions with offshore counterparties also hindered the development of NDF
market (EMEAP discussion paper 2002) As the economy began to recover capital controls were
gradually relaxed and finally the currency was floated in 2005
Generally Malaysia has opened up its domestic markets for non-resident investors with no
restrictions on non-residents investing in local bond markets except having to appoint a local
custodian Most of the sectors are open for non-resident portfolio equity flows as well in Malaysia
Over the years since 2005 non-resident investorsrsquo participation in the onshore market picked up
substantially reaching record high of 397 per cent of total outstanding government bonds from
nearly 14 per cent in 2005 and in the process contributed to the growth of NDF market as well
McCauley (2013) analysed the direction of influence for nine currencies in 2005-13 as well as
separately for the 2008-09 crisis and May-August 2013 Granger causality tests point to two-way
causation for most currencies for the full sample The exception is the Malaysian Ringgit where
the NDF influences the deliverable forward market The central bank expressed concerns over the
adverse impact of increased activities in the ringgit NDF market after wide gap was observed
between the NDF and onshore rate in 2016 following the US presidential election Bank Negara
Malaysiarsquos (BNM) Governor emphasised that ringgit NDF market is used by non-resident
investors mostly for speculative purposes rather than genuine demand for hedging As the NDF
trading activity intensified during volatile period in 2016 ringgit-denominated NDF implied much
larger depreciation which further exacerbated the then prevailing depreciating pressure on the
currency (Chart 5)
Chart 5 Onshore and Offshore market in Malaysia
Source Bloomberg
4141542
42543
43544
44545
455
Oct
-16
Oct
-16
Oct
-16
Nov
-16
Nov
-16
Nov
-16
Nov
-16
Dec
-16
Dec
-16
Dec
-16
Dec
-16
Dec
-16
Jan-1
7
Jan-1
7
Jan-1
7
Jan-1
7
Feb
-17
Feb
-17
Onshore USDMYR Offshore 1month NDF USDMYR
38
Assessing the overwhelming impact of NDF activities which has the potential to undermine
financial stability BNM took a number of measures in 2016 to eliminate speculative transactions
in order to ensure appropriate price discovery and orderly functioning of onshore market These
measures includes reinforcement of non-internationalisation policy for Ringgit steps to improve
the onshore pricing mechanism and deepen the domestic forex market After prohibiting banks
from quoting fixing orders used to settle offshore trades the central bank revised the methodology
to compute onshore reference rate to account for transacted deals from mid-2016 Further BNM
imposed a ban on ringgit NDF trading in November 2016 and reminded local banks that ringgit
remains a non-internationalised currency and therefore any offshore trading is not recognized At
the same time BNM strengthened its monitoring to ensure compliance to Foreign exchange
administration rules (FEA) rules by market participants on non-involvement in facilitating NDF
transactions Subsequently financial markets committee (FMC) instituted in mid-2016 laid down
a series of developmental measures for onshore market aimed at allowing better market access and
greater hedging facilities to market participants (Table 5)
Table 5 Developmental Measures Relating to Foreign Exchange Market
Jul-16 Dec-16 Apr-17
Adopting global best practices Rebalance onshore FX demand and supply
Additional FX risk
management practices
bull Transaction based KL
USDMYR reference rate
bull 25 retention of export proceeds in
foreign currency
bull Streamline passive and
dynamic hedging
flexibilities for
investors
bull Extension of official closing hour
for onshore Ringgit rate
bull Trade settlement among residents in
Ringgit only
bull Active hedging for
corporations
bull Streamline onshore and offshore
foreign currency investment limit
Promote FX risk management onshore
bull Active hedging below RM6t million of
net open position
bull Active hedging for institutional
investors
39
bull Expansion of appointed overseas office
framework
In an immediate impact reinforcement of restrictions on USD-MYR NDF market resulted in
significant outflows from local bonds in Malaysia However as a positive impact with the bout
of capital outflows following ban on NDF transactions composition of non-resident holdings has
shifted towards more stable and long-term investors thereby reducing the risk exposure to global
impulses Further the disruptive influence from NDF market subsided and onshore foreign market
continues to register higher average daily volume These measures have helped in increasing the
depth and liquidity of the foreign exchange market as evidenced by declining volatility and
narrowed bid-ask spreads in onshore market The decline in offshore volumes has resulted in
widened bid-ask spread (Chart 6 a amp b)
Chart 6 Malaysia Monthly FX forward volumes and Bid-Ask Spread
Source BNM Reuters and Bloomberg
-001
0
001
002
003
004
005
01
-10
-201
0
01
-04
-201
1
01
-10
-201
1
01
-04
-201
2
01
-10
-201
2
01
-04
-201
3
01
-10
-201
3
01
-04
-201
4
01
-10
-201
4
01
-04
-201
5
01
-10
-201
5
01
-04
-201
6
01
-10
-201
6
01
-04
-201
7
01
-10
-201
7
01
-04
-201
8
01
-10
-201
8
01
-04
-201
9
Chart 6b Bid-Ask spread
offshore bid-ask onshore bid-ask
0
10
20
30
40
50
60
70
80
90
0
5
10
15
20
25
30
Dec
-12
May
-13
Oct
-13
Mar
-14
Aug
-14
Jan-1
5
Jun
-15
Nov
-15
Apr-
16
Sep
-16
Feb
-17
Jul-
17
Dec
-17
May
-18
Oct
-18
Mar
-19
Chart 6a Monthly FX forward turnovers (in
USD billion)
Onshore FX forward Offshore FX forward RHS
40
Chart 7 Non-resident holdings of total government debt and Monthly FX turnover
Source BNM and HSBC
Indonesia
The development of NDF market in Indonesia Rupiah traces back to the year 2001 when Bank
Indonesia (BI) prohibited onshore banks from lending to non-resident accounts in an attempt to
reduce the speculative pressure on the Indonesian Rupiah (IDR) These restrictions paved the way
for development of offshore rupiah NDF market to cater to the demand of international investors
Prior to this an active offshore deliverable market existed for IDR following the pursuit of
liberalisation policies beginning as early as 1970s which allowed the IDR to be freely convertible
and at the same time permitted its internationalisation Consequently the international use of
rupiah increased but was confined mostly to financial transactions mainly due to limited invoicing
of trade-related transactions in IDR terms This easy access to rupiah from onshore centres due to
internationalisation allowed non-resident to speculate on the currency during the 1997 crisis in
Asian countries As a result of heightened activity in times of stress exchange rate volatility
increased making it difficult for the central bank to maintain stability of rupiah In response to the
crisis the currency was freely floated replacing the intervention band but weakness in the currency
and high volatility continued to persist compared to currencies of other Asian countries during the
first three years of its floating rate regime Taking cognizance of this disparity the central bank
began to evaluate the extant regulations relating to rupiah transactions with non-residents
Thereafter during the year 2001 the BI imposed extensive regulations limiting non-resident
143
397
243
50
100
150
200
250
300
350
400
450
Jan-0
5
Oct
-05
Jul-
06
Apr-
07
Jan-0
8
Oct
-08
Jul-
09
Apr-
10
Jan-1
1
Oct
-11
Jul-
12
Apr-
13
Jan-1
4
Oct
-14
Jul-
15
Apr-
16
Jan-1
7
Oct
-17
Jul-
18
Apr-
19
Chart 7a Non resident holdings as of total
government debt
-
500
1000
1500
2000
2500
3000
Jan-1
6
Apr-
16
Jul-
16
Oct
-16
Jan-1
7
Apr-
17
Jul-
17
Oct
-17
Jan-1
8
Apr-
18
Jul-
18
Oct
-18
Jan-1
9
Chart 7 Monthly onshore FX market
turnover (in billion of USD)
FX Spot FX Swap FX Forward FX Options
41
rupiah transactions and shrinking the pool of offshore rupiah funds with the potential to be used
for speculation identifying spill overs from offshore market as conduit of excessive volatility
In general Indonesia has opened up its domestic bond markets for non-residents completely with
no entryexit barriers except having to appoint a local custodian Foreign exchange hedging is
allowed only with underlying documentationasset in place for non-residents On the portfolio
equity investments regulation clearly provides that a listed company is exempt from any foreign
investment restrictions However there are sectoral restrictions on FDI in Indonesia which are
decided by BKPM (Investment Coordinating Board in Indonesia) which provides a DNI list
(Governmentrsquos negative investment list) The share of non-residents in Indonesia Government
Bonds has been increasing over years from a mere 1570 per cent of the total government bonds
in June 2009 to 3810 per cent in April 2019 (Chart 8)
Source HSBC
Research from BI in 2012 found disproportionate impact of NDF market to spot market during the
period 2008-11 Results suggests that there is evidence of unidirectional mean spill-over from NDF
to both spot and forward rupiah markets with an exception of Europe crisis On volatility spillover
the study obtained significant results from NDF market to spot market for entire period However
in crisis situation the study found interdependence between volatility in offshore NDF and onshore
spot rate changes while information transmission is only valid from NDF to forward rate changes
not the other way around (Cadarajat and Lubis 2012)
To reduce the unwarranted influence of NDF market on spot market BI took initiatives beginning
the year 2014 to bridge the gap between onshore and offshore rupiah rate In 2014 the central bank
381
150
200
250
300
350
400
450
Jun-0
9
Dec
-09
Jun-1
0
Dec
-10
Jun-1
1
Dec
-11
Jun-1
2
Dec
-12
Jun-1
3
Dec
-13
Jun-1
4
Dec
-14
Jun-1
5
Dec
-15
Jun-1
6
Dec
-16
Jun-1
7
Dec
-17
Jun-1
8
Dec
-18
Chart 8 Non-resident holdings as percetage to total Government
Debt
42
with the help of key offshore centre Singapore moved the foreign exchange rate fixing that is used
to settle the NDF contracts to the onshore market Earlier Association of Banks in Singapore
(ABS) and the Singapore Foreign Exchange Markets Committee (SFEMC) was publishing IDR
reference rate computed as weighted average of 1-month NDF trades done by then Singapore
based brokers Post March 27 2014 BI started publishing reference rate termed as Jakarta Inter-
bank Spot Dollar Rate (JISDOR) which was to be used to settle existing and new contracts Jakarta
Interbank Offered Rate (JIBOR) is more transparent in a way that it is based on actual transactions
being done in the inter-bank onshore market
In late 2018 BI in its efforts to further deepen the domestic foreign exchange market and to
mitigate IDR exchange rate risk BI established the Domestic Non-Deliverable market (DNDF)
for IDR It will serve as a parallel market to NDF with the key difference that it is rupiah settled
in onshore market This alternative tool will provide foreign investors additional avenues to hedge
their IDR exposure without principal exchange other than enhancing the central bankrsquos
intervention capabilities At this juncture the market is relatively new and hence significant impact
assessment of the same cannot be outlined However currently Indonesia has not been able to
move significant turnovers from offshore NDF to Domestic NDF market
Brazil
Brazilian Real is the second most actively traded currency in NDF market after the Korean Won
with an average daily turnover of USD 187 billion as per BIS and USD 154 billion according to
the London survey The growth and development of NDF market is attributed to the existence of
large and well developed foreign exchange futures market
The development of derivatives market in Brazil is attributed to the hedge culture that has been
prevalent due to periods of high and persistent inflation and exchange rate volatility amidst
political shocks During 1980s and early 1990s inflation was soaring above 100 per cent which
peaked over 2700 per cent in 1993 and thus promoted widespread indexation to manage the
inflation risks Subsequently the ldquoReal planrdquo which comprised of fiscal and monetary reform and
introduction of new currency helped to bring down inflation and stabilise the currency Amidst
stable macroeconomic conditions private sector was encouraged to borrow foreign funds at a
43
lower cost and the consequent surge in foreign indebtedness during 1994 to 1998 led the central
bank issue dollar denominated securities as a hedging instrument Following the currency crisis in
1999 the Brazilian Real was floated amongst adoption of new set of economic policies which was
also accompanied by providing unrestricted access to non-residents to financial markets (including
derivatives) in 2000
The distinguishing feature of Brazilian foreign exchange is the non-deliverable nature of
derivatives contracts without any significant limitations even though participation in deliverable
instruments ie spot outright forwards and foreign exchange swaps is constrained Only chartered
banks are authorised by the central bank to hold foreign exchange spot positions All these factors
have facilitated the growth of foreign exchange futures market over spot market which is closed
and highly restricted Against the backdrop of large and sophisticated foreign exchange derivatives
with high depth and liquidity foreign exchange futures prices have key influence on spot price as
suggested by various studies (Ventura and Gracia 2009 Kaltenbrunner 2010 and Chamon and
Gracia 2013) As pointed out by Kaltenbrunner 2010 the existence of a deep futures market has
made it possible for foreign banks with branches in Brazil to sell real offshore (NDF) and
simultaneously hedge their real exposure in the onshore futures market For the Brazilian Real
derivatives especially offshore NDFs are the main vehicle for investors looking to implement
carry trades (Santaelaa 2015)
Taiwan
The NDF market for Taiwanese Dollar (NTD) existed since 1990s and the central bank permitted
domestic and foreign legal entities to trade in NTD NDF market with authorised banks in 1995
This came after opening up of local securities market to foreign institutional investors (QFII) in
1990 which allowed FIIs meeting certain requirements to apply for investment in Taiwanrsquos stock
market Subsequently significant relaxations were made and security market was completely
opened up with the abolition of QFII scheme While onshore institutions were eligible for trading
in NTD NDF the central bank initially imposed limits on trading position in NTD NDF to one
third of their total foreign exchange position with a view to prevent speculative pressure
44
Following the Asian financial crisis in July 1997 the central bank introduced measures to regulate
NDF market with only authorized banks permitted to carry NDF trading with other authorised
counterparts and their overseas branches or headquarters This move came after the speculative
positioning which was believed to cause sharp depreciation of the NTD The central bank outlined
that although there was ceiling on NTD NDF trading positions some banks were engaged in selling
NDFs to foreign entities and simultaneously created long NDFs positions and shorted DFs with
domestic entities in a bid to offset the NDF trading positions on their balance sheets and thus
creating more room for further NDF trading (Bank of Taiwan Annual Report 2014) The central
bank has intervened in foreign exchange market to curb speculative activity also post 2008
financial crisis when emerging markets witnessed resurgence of capital flows The measures
introduced then by the central bank focused on reducing local banksrsquo foreign exchange positions
in both onshore and NDF markets including discouraging non-resident deposits by imposing
punitive reserve requirements with an intent to limit local banksrsquo capacity to provide liquidity to
NDF markets The National Supervisory Commission also took steps to limit non-resident
investments in local bank deposits and government securities
However recognising the dominance of foreign banks in NDF trading activity the central bank
announced that overseas branches of domestic banks are eligible to apply for NTD NDF business
from September 2014 In current scenario whilst there are no restrictions on the fixed income
investments in general but investments in localdomestic bonds by non-residents cannot exceed
30 per cent of their investments in equity instruments which has kept the investments in local
bonds low by non-residents who tend to take exposure in USD bonds issued by Taiwan offshore
Moreover ability for local banksrsquo to access the TWD NDF market up-to 20 per cent of each banksrsquo
net open position results in partial integration between onshore and offshore markets Since TWD
is not fully convertible any onshore spot transactions must be declared to the central bank and in
most cases require supporting documentation which keeps the differential between onshore and
offshore rate
To conclude cross county experience shows that increasing role of any economy globally is
accompanied by emergence of growing offshore trading of their currencies in the presence of
restricted access or cumbersome regulations Additionally emerging market economies cannot
afford to have unrestricted access to their onshore market as revealed by the studies of Indonesia
45
and Malaysia during the Asian crisis 1997 which exposed them to global impulses Most of these
countries have followed a gradual approach surrounding non-resident access to their forex markets
As emerging markets open up and become sophisticated in respect of forex markets the case study
of the Republic of Korea exemplify that country-specific factors have to be considered when
designing the financial regulatory toolkit aimed at curbing foreign and domestic agentsrsquo
speculative strategies in the search for yield The experience of Brazil suggests deepening onshore
hedging market will go a long way in promoting the price setting role of onshore market over its
offshore counterparts Indonesia has recently introduced domestic NDFs in line with Brazil
Additionally the experience of Korea and Taiwan suggests that the participation of domestic banks
ensures that any price differential between the two segments is arbitraged However in both the
cases participation is governed to evade any potential build-up of vulnerabilities on banksrsquo balance
sheet
46
Chapter 34
Linkages between Offshore NDF and Onshore Rupee Markets New Evidence
Overarching Motivation
Indiarsquos trade integration with the rest of the world began to rise sharply from the turn of the
millennium Between 2000 and 2012 total trade (imports + exports) as a percentage of GDP more
than doubled from 26 to 56 before moderating to 43 in 2018 as the effects of de-
globalization took over post the global financial crisis Simultaneously policymakers persevered
with gradual but consistent capital account liberalization Unsurprisingly therefore currency
markets ndash both to trade and hedge ndash rose in tandem with the growing external integration The
onshore Rupee market5 monthly average turnover has grown from USD 60 billion in 2000 to USD
687 billion in 2018 However given data limitations uncertainty still exists on the exact size of
the NDF market and how it has grown relative to the onshore market As Chapter- 2 illustrates
the BIS Triennial Survey finds average daily turnover of Rupee NDF in 2016 was USD 16 billion
However the Bank of Englandrsquos Semi-Annual Forex Turnover Survey finds average daily
turnover of Rupee NDF in London increased from USD 8 billion in October 2016 to USD 23
billion in October 2018
The idea behind trying to size the NDF market ndash and therefore implicitly compare its size and
growth to onshore markets ndash is in part to try and make sense of how important a role NDF markets
play in the ldquoprice discoveryrdquo of the Rupee6 With the Indian Rupeersquos ldquoForwardrdquo price being
determined across segmented markets ndash both the onshore deliverable forward market and the
offshore non-deliverable market -- the key is to ascertain the relative importance of each of these
markets in driving price discovery
4 This chapter is a joint work of Shri Sajjid Chinoy Chief Economist J P Morgan India and Shri Harendra Behera
Assistant Adviser Department of Economic and Policy Research Reserve Bank of India 5 Spot OTC amp ETCD
6 To be sure estimating the size of the NDF market is important not just for the influence it exerts on price discovery
but also instructive in understanding the cumulative ldquoviewrdquo on the Rupee and how much is expressed onshore versus
offshore This is because if NDF volumes are substantial policymakers may desire to shift these volumes on shore
both to (i) deepen the onshore market and (ii) move this businesseconomic activity on shore
47
However simply using (offshore versus onshore) volumes as a means to proxy relative price
discovery is imperfect at best The ability of NDF volumes to drive price discovery for any given
quantum of volumes is ultimately a function of how inter-connected onshore and offshore markets
are and the ability of economic agents ndash hedgers arbitrageurs speculators -- to link these markets
For example if NDF markets have grown sharply but it is found that price linkages between the
two markets are still tenuous or have not increased commensurately with volumes -- say because
arbitrage opportunities between the two markets have not grown in tandem -- then the growth of
NDF markets and the consequent ldquoloss of controlrdquo will be of less concern to Indian policymakers
Conversely if price linkages have grown over time ndash proportionately to volume increases ndash then
policymakers would rightly worry about the growing role of NDF markets in driving price
discovery
The fundamental motivation for this chapter is therefore to empirically examine price linkages
between the NDF and onshore markets as this is the ultimate manifestation of the influence that
NDF markets exert
The Question
This chapter seeks to ask two fundamental questions Is there a stable long-term equilibrium
relationship between onshore and offshore markets Second if so what is the directionality of
influence Do NDF markets drive onshore markets Or do onshore markets drive the NDF market
Or is the influence bi-directional
Furthermore we try and empirically answer this questions across two dimension First what is the
direction and quantum of influence during ldquonormal times versus ldquostressed timesrdquo Second what
is the relationship and how does it change when assessing ldquoaverage returnsrdquo (means) versus
ldquovolatilityrdquo (variance)
Specific Motivation to India
While there is a meaningful and growing literature trying to empirically ascertain price linkages
between the onshore and offshore markets around the world the literature that focuses on India
remains sparse dated and inconclusive This constitutes the specific motivation for this chapter
48
The literature studying NDF markets around the world has steadily grown over time For example
much work has been done on Asian NDF markets and their relationship with onshore markets
both for the region as a whole (Ma et al 2004 Colvecchio et al 2006 Wang et al 2007 Gu and
McNelis 2009) and individual currencies such as the Korean Won (Park 2001) the Indonesian
Rupiah (Cadarajat and Lubis 2012) the Chinese Yuan (Fung et al 2004 Hideki 2006
Colavecchio and Funke 2008 Huszaacuter et al 2016 Song and Gao 2016 McCauley and Shu 2018)
and the Indian Rupee (Misra and Behera 2006 Guru 2009 Behera 2011 Darbha 2012 Goyal
et al 2013)
Results remain mixed Some studies find the NDF markets influence the evidence onshore forward
market (Park 2001 Wang et al 2007 Cadarajat and Lubis 2012) others find they influence
onshore spot markets (Behera 2011 Goyal et al 2013) while some document its influence on
onshore futures markets (Behera 2011) Conversely some studies also find the direction of
influence runs from onshore markets to NDF markets (Wang et al 2007 Misra and Behera 2006)
In the case of India there are only a few studies on this subject ndash with the last one back in 2013 ndash
and the results are mixed and inconclusive For example Misra and Behera (2006) find that itrsquos
the onshore markets that influenced the NDF market between 2004 to 2007 largely because of
restricted participation of domestic players in the offshore market In a subsequent study Behera
(2011) found that there are volatility spillovers from the NDF market to spot and forward markets
in India and the magnitude of volatility spillover has become higher after the introduction of
currency futures in 2008 Guru (2009) finds qualitatively the same results and the role of currency
futures in India Darbha (2012) find that offshore markets play an important role in price discovery
Finally in the most recent work on India (Goyal et al 2013) find evidence of a long-term
relationship between NDF and onshore markets and find evidence that the relationship is
bidirectional as both markets adjust to any deviations from the equilibrium state
Whatrsquos clear however is the evidence on India is patchy inconclusive and dated with the last
study conducted more than 6 years ago
Some Theory
Recall if there are no capital controls forward rates are tied down by the no-arbitrage ldquocovered
interest parityrdquo hypothesis
49
F = S(1+r)(1+r$ )
Where F is the Forward rate S is the spot rate r is the relevant interest rate on the home currency
and r$ is the equivalent dollar rate The equation holds when (i) there is capital account
convertibility and there are no barrier for cross-border transactions and (ii) there is equivalent
credit risk in the assets across the two jurisdictions
However if there are capital-account barriers we would expect F to only be approximated by the
equation above and not hold exactly
So F ~ S(1+r)(1+r$ )
Similarly the NDF rate should be anchored by the onshore forward rate to the extent that
arbitragers can link these markets
So NDF ~ F ~ S(1+r)(1+r$ )
Furthermore the sign of the onshore-offshore yield spread can indicate the underlying market
pressure on the currency If the domestic interest rate is higher than the NDF implied yield it
implies appreciation pressures on the currency However capital controls may restrict inflows to
close the gap Similarly a lower domestic interest rate than implied by the NDF yield would
suggest depreciation pressures while a zero spread would likely reflect an absence of market
pressure on both the domestic and offshore market
All told however we would expect that both onshore and offshore markets would have a long-
run relationship and there is the likelihood of ldquomeanrdquo spillovers on a regular basis Furthermore
hedging arbitrage and speculative activities may also result in volatility spillovers from one
market to another on various occasions
Testing for ldquoMeanrdquo Spillovers
We start therefore by empirically testing for linkages between onshore (spot and forward prices)
and offshore (NDF forward prices) markets The goal is to assess
1 If there is a stable long-term relationship between onshore and offshore markets
2 Which drives which Do onshore prices drove offshore prices Or vice versa
50
3 To see whether the direction of influence is a function of context Are the results
different for ldquonormalrdquo times versus ldquostressed periodsrdquo (ie taper tantrum emerging
market stress)
Non-stationary but co-integrated
So as to decide the empirical course of action we start by testing whether the key variables of
interest (i) the Onshore Spot Exchange Rate (SPOT) (ii) the Onshore Forward Rate (FORWARD)
and (iii) the Offshore Non-Deliverables Forward exchange rate (NDF) are stationary
Augmented Dickey Fuller Tests reveal that all three variables are non-stationary in levels
However as Figures 1 and 2 suggest the spreads between SPOT and NDF and ONSHORE
FORWARDS and NDF are mean-reverting suggesting the presence of a long-term relationship
and suggesting stationarity in the first differences
Formal co-integration tests ndashTables 2 and 3 ndash confirm that both pairs of variables NDF-SPOT and
NDF-FORWARD ndash are indeed co-integrated The Max Eigenvalue tests reveal there is at least one
co-integrating vector that can be found at the 5 level
Null Hypothesis Variables have a unit root
ADF t-Stat Prob
Spot -06 09
Augmented Dickey-Fuller test statistic-07 08
Augmented Dickey-Fuller test statistic-07 08
Table 1 ADF unit root test
-15
-05
05
15
25
09 10 11 12 13 14 15 16 17 18 19
level
Figure 1 Spreads (1M NDF- Spot)
51
-25
-15
-05
05
15
25
09 10 11 12 13 14 15 16 17 18 19
level
Figure 2 Spreads (1M NDF- 1M Forward)
Table 2 Co-integration SPOT and NDF
Sample (adjusted) January 2005 to March 2019
Included observations 2608 after adjustments
Trend assumption No deterministic trend (restricted constant)
Series LOG(SPT) LOG(NDF)
Unrestricted Cointegration Rank Test (Trace)
Hypothesized Trace
No of CE(s) Eigenvalue Statistic Critical ValueProb
None 011 31310 2026 000
At most 1 000 210 916 076
Unrestricted Cointegration Rank Test (Maximum Eigenvalue)
Hypothesized Max-Eigen005
No of CE(s) Eigenvalue Statistic Critical ValueProb
None 011 31100 1589 000
At most 1 000 210 916 076
Both Trace and Max-eigenvalue tests indicates 1 cointegrating
eqn(s) at the 005 level
52
Stable Long Term Relationship
The finding of co-integration allows us to use ordinary least squares (OLS) to estimate the long-
term relationship between SPOT and the NDF as well as FORWARD and the NDF In particular
using the equation below we estimate parameters β0 and β1 which tells us about the long-term
relationship between SPOT and NDF
We then repeat the same exercise between the FORWARD and the NDF
But whatrsquos driving what An ldquoError Correction Mechanismrdquo approach
While establishing a long-term relationship is important a finding in the affirmative will not come
as a particular surprise Instead the real question is whether onshore prices drive offshore prices
or vice versa The natural framework to answer this is the work-horse Error Correction Mechanism
(ECM) approach used by Engel and Granger in 1987 where changes in each of the variables are
run on changes on its own lags and the lags of the other variables
Table 3 Co-integration FORWARD and NDF
Sample (adjusted) January 2005 to March 2019
Included observations 2608 after adjustments
Trend assumption No deterministic trend (restricted constant)
Series LOG(FORWARD) LOG(NDF)
Unrestricted Cointegration Rank Test (Trace)
Hypothesized Trace
No of CE(s) Eigenvalue Statistic Critical ValueProb
None 018 53051 2026 000
At most 1 000 217 916 074
Unrestricted Cointegration Rank Test (Maximum Eigenvalue)
Hypothesized Max-Eigen 005
No of CE(s) Eigenvalue Statistic Critical Value Prob
None 018 52835 1589 000
At most 1 000 217 916 074
Both Trace and Max-eigenvalue tests indicates 1 cointegrating
eqn(s) at the 005 level
53
119889119897119900119892(119904119901119900119905)119905 = 1205720 + 120572119904119901119900119905(119890119905minus1) + sum 12057211(119894)(119889log (119904119901119900119905119905minus1))119899119894=1 + sum 12057212(119894)(119889log (119873119863119865119905minus1)) + 120576119904119905
119899119894=1 (1)
119889119897119900119892(119873119863119865)119905 = 1205720 + 120572119899119889119891(119890119905minus1) + sum 12057221(119894)(119889119897119900119892(119904119901119900119905119905minus1))119899119894=1 + sum 12057222(119894)(119889119897119900119892(119873119863119865119905minus1)) + 120576119899119905
119899119894=1 (2)
For example as Equation 1 lays out changes in (the log of) SPOT ndash the dependent variable -- are
run on its own lags and the lags of NDF Equation 2 ndash in which the dependent variable is NDF --
does the same for NDF Because both variables are co-integrated ndash as shown above ndash using OLS
to estimate these coefficients using standard criterion to choose lag lengths (eg Akaike
Information Criterion) and standard F-Tests are all valid
The coefficients of interest in the above equation are 120572119904119901119900119905 and 120572119899119889119891 ndash the ECM terms -- because
these coefficients tell us when the system is in disequilibrium the direction and the speed of
adjustment back to equilibrium This will determine the directionality of influence
For example if 120572119904119901119900119905 = 0 and if all values of 12057212(119894) = 0 then dlog(NDF) does not granger cause
dlog(spot) In contrast if the value of 120572119904119901119900119905 is negative and statistically significant that implies
that (the log of) NDF in the long run ldquoganger-causesrdquo spot market movements The same intuition
applies for equation 2 where NDF is the dependent variable and we test for convergence between
the NDF rate and the onshore forward rate Direct convergence requires 120572119904119901119900119905and 120572119899119889119891 to be
oppositely sign Intuitively the larger the value of α the faster is the speed of adjustment
In summary while the βrsquos tell us about the existence and strength of a long run relationship
between onshore and offshore markets the αrsquos tell us about whether (i) the directionality of
influence and (ii) the speed of convergence from disequilibrium
We therefore use this approach to test for linkages between both sets of variables ndash NDF and
onshore SPOT ndash and NDF and onshore FORWARDS
Data
We use end-of- India-day closing values for the onshore spot exchange rate for the 1-month a
forwards and the corresponding 1-month non-deliverable-forward (NDF) rates We use daily data
and our full sample runs from 2009 through 2019
54
Results Full Sample
Table 4 ECM and Long run coefficients (Full sample)
The first row are the linkages between the onshore spot and NDF markets while the second row
is that of the onshore forwards and NDF market
In both cases the betas (β) are positive statistically significant and with a magnitude very close to
or at 1 implying an almost one-for-one movement between both the markets in the long run For
example the estimated β1 of 099 suggests that for a 1 increase in NDF rates there is 099
increase in spot rates in the long run Meanwhile between onshore FORWARDS and NDF there
is a complete pass-through in long run More generally a beta (β) close to 1 suggests there is no
permanent friction between onshore and offshore markets in the long run
Convergence
However the real interest is in the alphas In the first case both 120572119904119901119900119905 and 120572119899119889119891 are statistically
significant and oppositely signed This suggests that they both converge towards each other Put
differently the NDF rate moves towards the onshore SPOT rate and vice-versa In other words
there is a bi-directional relationship between both variables The magnitude of the coefficients
(007-018) suggests a moderate speed of convergence to the long-run equilibrium when a shock
causes the system to go into disequilibrium
The same results are obtained when studying linkages between the onshore forward and NDF
markets Both 120572119891119900119903119908119886119903119889 and 120572119899119889119891 are statistically significant oppositely signed (suggesting they
converge towards each other) with coefficients that are slightly larger than the SPOT-NDF pair
This suggests that both NDF and the onshore FORWARD rates influence each other and gradually
converge towards their long-term relationship when hit by a shock ndash a speed of adjustment that is
modestly faster than the NDF-SPOT relationship
Time Period April 2009 to March 2019
Onshore Spot and NDF -018 007 099
Onshore Forwards and NDF -032 023 100
55
For the full sample as a whole from 2009 to 2019 we find that there is a bi-directional relationship
on average between SPOT and NDF and FORWARD and NDF and that all variables converge
gradually to their long-term relationship
Results Stressed Times
Our results should be thought of as ldquoaveragerdquo results across the entire time period But are these
results a function of context Does the direction of influence change for example during periods
of currency stress versus periods of calm We explore this next
To test for this we start by isolating clearly-identifiable periods of stress ex post facto in our
simple Two episodes naturally come to mind the taper tantrum of 2013 (where the Rupee
depreciated 26 between May 2013 and August 2013) and the emerging market (EM) turmoil ndash
characterized both by the Fed raising rates and oil prices firming ndash such that the Rupee depreciated
almost 10 between August 2018 and October 2018
2013 The Taper Tantrum
We test interlinkages from the start of May to the end August 2013 ndash during the Taper Tantrum ndash
when the Rupee was under intense pressure and easily amongst the worst performing currencies
in the emerging market (EM) universe Results are presented in Table 5 below
Table 5 ECM and Long run coefficients
As one can observe 120572119899119889119891 in both equations is statistically insignificant What this implies is onshore
spot and forward rates were playing very little role in influencing NDF rates7 In contrast 120572119904119901119900119905 and
120572119891119900119903119908119886119903119889 are correctly signed and statistically significant (the former at the 1 level and the latter
at the 10 level) which suggests it was the NDF rate that was driving the onshore spot and forward
rates Interestingly the speed of adjustment is much faster for onshore spot rates in this sample (-
11) compared to the full sample (-018) and also relative to the onshore forward market (-08) An
7 In fact onshore spot and forward rates do not granger cause NDF as none of the lags of 12057221(119894) in equation 2 are
statistically significant during this period
Onshore Spot and NDF -11 -028 094
Onshore Forwards and NDF -08 015 097
Time Period May 2013 to August 2013
56
ECM (alpha) coefficient of greater than 1 suggests the witnesses an oscillating convergence Since
a coefficient greater than 1 is prime facie surprising we also conduct a robustness exercise
(described below) by running Granger Causality tests for this time period and find it is the NDF
that Granger-causes onshore rates and not the other way around
This finding likely reflects the growing volumes ndash potentially speculative ndash in the NDF market in
the 2013 period of stress relative to the volumes in the onshore market This also prime facie
reduced the efficacy of foreign currency intervention by the central bank because intervention was
used to shape the spot exchange rate at the end of Indiarsquos business day But because the NDF is a
24 hour market NDF rates evolved overnight and when the Indian market opened the next day
onshore rates were influenced by NDF developments overnight This rendered ineffective the
previous dayrsquos intervention because there was often little correlation between the closing exchange
rate of the previous day and the opening rate of the next day and therefore necessitated additional
intervention the next day
Visually this is evident in the ldquogap-uprdquo movements of the exchange rate when the Indian market
opened ndash vis-a-vis the previous dayrsquos close ndash during those three months Figure 3 for example
captures this for the month of August 2013
Figure 3 Gap-up opening in USDINR (August 2013)
Source Bloomberg
57
2018 More of the Same
Emerging markets came under renewed stress in the summer of 2018 against the back drop of the
Fedrsquos hiking cycle accompanied by the rally in crude pieces which had surged 50 over the course
of a year As some large emerging markets ndash Argentina Turkey ndash came under some stress there
was a contagion to all emerging markets with current account deficits of which India was one
Between May and October 2018 the Rupee depreciated almost 10 against the US Dollar
What were the offshore-onshore linkages during that period of time Results are presented in Table
6
Table 6 ECM and Long run coefficients
The linkages mimic 2013 The coefficient on whether onshore drives offshore 120572119899119889119891 is insignificant
in both regressions This re-affirms that in line with 2013 onshore spot and forwards were not
driving the NDF rate8 In contrast 120572119904119901119900119905 and 120572119891119900119903119908119886119903119889 are both correctly signed quantitatively
meaningful and statistically significant This suggests that it was the NDF rate that drove the
onshore spot and forward during this period likely reinforcing the presumption that volumes rise
sharply in NDF markets during periods of stress which then become the hub of price discovery
and influences onshore rates As Figure 4 reveals this is visible in the ldquogap-uprdquo movement of the
Rupee at the start of the day for several days in the month of August 2018
8 Onshore spot and forward rates does not granger cause NDF as none of the lags of 12057221(119894) in equation 2 are
statistically significant
Time Period August 2018 to Nov ember 2018
Onshore Spot and NDF -10 -05 096
Onshore Forw ards and NDF -115 -05 096
58
Figure 4 Gap-up opening in USDINR (August 2018)
Source Bloomberg
Our analysis also reveals that the speed of adjustment is very rapid relative to the baseline
Robustness test
The results are robust to the selection of time and tenure of the NDF For example instead of
India end-of-day (EOD) time as the NDF cut-off if we consider New York EOD as the NDF cut-
off there are no qualitative changes in the results Similarly instead of considering the 1-month-
NDF if we consider the 3-month-NDF the results essentially stay the same Furthermore given
the short time periods involved during stressed times (May to August 2013 and August to
November 2018) one can argue that co-integration equations may not be relevant We therefore
also carry out Granger causality tests for these time-periods and find the direction of causality to
be just above ie NDF rates are driving onshore rates during stress periods and not vice versa
Controlling both ldquoMeanrdquo and ldquoVolatilityrdquo spillovers
Thus far our focus has been on mean spillovers However as found by Misra and Behera (2006)
there are also potential ldquovolatilityrdquo spillovers from the NDF market to the spot and forward market
To model the coexistence of both mean and volatility spillovers we use a multivariate generalised
autoregressive conditional heteroskedasticity (MGARCH) model The degree of volatility
59
spillovers is measured by estimating dynamic conditional correlations between the markets The
empirical analysis is conducted using daily data from April 1 2009 through March 29 2019 and
using the currency pairs for (i) NDF-Spot (ii) NDF-Forwards and (iii) NDF-Futures
This model examines simultaneous interactions of conditional returns and volatilities across the
markets In this modelling framework we examine the Granger-causality in mean and variance as
discussed in Behera (2018) The results corroborate the earlier results that there is bi-directional
mean spillovers between onshore and offshore markets (Table 7)
An important finding using this approach is that the impact of price spillover from offshore to
onshore remains up to substantial lags while that from onshore to offshore dissipate after one day
(Annexure II) This ensues from the result that the individual coefficient estimates in the mean
equations of BEKK-MGARCH model are found to be statistically significant up to 5 lags in the
regression of returns in onshore market on that of offshore market while in the opposite case the
coefficient of onshore return is statistically significant only for the first lag
Table 7 Granger-causality tests in Mean
Direction of Causality Results
Spot to NDF 1-Month Yes
Spot to NDF 3-Month Yes
Spot to NDF 6-Month Yes
NDF 1-Month to Spot Yes
NDF 3-Month to Spot Yes
NDF 6-Month to Spot Yes
Forward 1-Month to NDF 1-Month Yes
Forward 3-Month to NDF 3-Month Yes
Forward 6-Month to NDF 6-Month Yes
NDF 1-Month to Forward 1-Month Yes
NDF 3-Month to Forward 3-Month Yes
NDF 6-Month to Forward 6-Month Yes
Futures 1-Month to NDF 1-Month Yes
Futures 3-Month to NDF 3-Month Yes
Futures 6-Month to NDF 6-Month Yes
NDF 1-Month to Futures 1-Month Yes
NDF 3-Month to Futures 3-Month Yes
NDF 6-Month to Futures 6-Month Yes
Note Null hypothesis is rejected if the p-value in the Wald test is less than 5 per cent
60
Volatility spillover between markets are studied by examining the statistical significance of
individual coefficients Granger causality in variance tests and estimating the dynamic conditional
correlations Beginning with granger causality test results imply a bidirectional causal relationship
between volatilities in both onshore and offshore markets of 1-month maturity segments only
(Table 8) In normal times no volatility spillovers are observed across the markets in other
maturity segments which reverses in the period of increased uncertainty (as found from Granger-
causality-in-variance tests taking into account asymmetric effects) The results from individual
coefficient estimates indicate about the presence of short-term volatility spillover between the
markets while the long-term volatility transmission is statistically significant from NDF market
to onshore spot forward and futures markets Moreover the asymmetric coefficients in variance
equation provide interesting insights ndash with the evidence of rise in volatility spillover from onshore
to offshore market in case of rupee appreciation while the opposite happens ie the volatility
spillover increases from NDF market to onshore market in the episodes of rupee depreciation
(Annexure II)
Table 8 Granger-causality tests in Variance
Direction of Causality Results
Without Asymmetry Effect With Asymmetry Effect
Spot to NDF 1-Month No Yes
Spot to NDF 3-Month No Yes
Spot to NDF 6-Month No Yes
NDF 1-Month to Spot No Yes
NDF 3-Month to Spot No Yes
NDF 6-Month to Spot No Yes
Forward 1-Month to NDF 1-Month Yes Yes
Forward 3-Month to NDF 3-Month No Yes
Forward 6-Month to NDF 6-Month No Yes
NDF 1-Month to Forward 1-Month Yes Yes
NDF 3-Month to Forward 3-Month No Yes
NDF 6-Month to Forward 6-Month No Yes
Futures 1-Month to NDF 1-Month Yes Yes
Futures 3-Month to NDF 3-Month No Yes
Futures 6-Month to NDF 6-Month No Yes
NDF 1-Month to Futures 1-Month Yes Yes
61
NDF 3-Month to Futures 3-Month No Yes
NDF 6-Month to Futures 6-Month No Yes
Note Null hypothesis is rejected if the p-value in the Wald test is less than 5 per cent
In order to understand how the volatility spillover between the markets changed over time a
variant of MGARCH model viz dynamic conditional correlation (DCC) model as proposed by
Engle (2002) is estimated taking the same pair of onshore-offshore exchange rate returns The
conditional volatility of 1-month NDF 1-month futures and their dynamic correlations are plotted
in Chart 249 The chart shows a sudden and significant rise in volatility during the episodes of
European debt crisis taper tantrum and latter part of 2018 coinciding with the rise in offshore-
onshore spreads resulting from the concerns regarding high current account deficits and large
capital outflows It is important to note that the volatility in NDF market is higher compared to
futures market and the divergence between the two gets accentuated in the times of heightened
uncertainty This in turn in conjunction with the rise in information asymmetry results in a drop
in correlations Since volatility spillover increases from offshore to onshore markets as discussed
earlier during periods of heightened uncertainty the volatility in onshore market increases
following the heightened volatility in offshore market In subsequent periods the correlation
increases indicating about the rise in spillovers A closer examination of the data on the volatilities
in two markets shows that volatility increases in offshore market first before it increase in onshore
markets with a lag of 1 to 2 days The correlations being positive and substantially higher imply a
significant degree of spillovers between the markets
9 The conditional volatilities for other pairs are qualitatively almost similar though their dynamic correlations are
different the dynamic correlations are provided in Chart 25
62
The dynamic correlations of volatilities for different pairs are presented in Chart 25 reveal that
that all the correlations were highly integrated and moving together alike until end December 2014
However the apparent structural changes in correlation process were observed since then with the
trends of correlations of NDF with spot and forward moving in one direction and that of NDF and
Futures moving on the opposite direction until mid-2017 The correlations have started coupling
though still continuing with some gaps between them since July 2017
060
065
070
075
080
085
090
095
00
05
10
15
20
25
30
2009 2010 2011 2012 2013 2014 2015 2016 2017 2018
Chart 24 Time-varying Volatility and Correlations Futures and
NDF
1-month Futures 1-month NDF DCC (right scale)
63
Conclusions and Implications
Since the work on establishing onshore-offshore price linkages in India was relatively sparse
outdated and inconclusive the goal of this Chapter was to create an updated empirical fact base
given the rapidity with which capital markets have developed and integrated and the pace at which
the NDF market has grown The overall results present a bidirectional relationship between
onshore and offshore markets
First that for full sample the price linkages ndash both mean and volatility ndash are found to be
bidirectional Both onshore and offshore rates have a strong long-term relationship and that when
a shocks throws that relationship into disequilibrium both onshore (spot and forward) and offshore
rates converge towards each other This suggests both influence each other This is consistent with
earlier findings in literature and should not be surprising Relative volumes across these market
are very dynamic and vary significantly When the bulk of the volumes flow through the onshore
050
055
060
065
070
075
080
085
090
095
100
2009 2010 2011 2012 2013 2014 2015 2016 2017 2018
Chart 25 Dynamic Conditional Correlations of Volatilities
SPOT_NDF1 SPOT_NDF3 SPOT_NDF6 FW1_NDF1 FW3_NDF3
FW6_NDF6 FUT1_NDF1 FUT3_NDF3 FUT6_NDF6
Forwards
Futures
Spot
64
market it becomes the locus of price discovery The converse is true when the bulk of volumes
are routed through the NDF market which then becomes the principle pole of price discovery
During the last two stress episodes (the taper tantrum and the 2018 EM crisis) however the
relationship turned unidirectional with the NDF market driving onshore spot and forwards and
the speed of adjustment from any disequilibrium increasing very sharply compared to ldquonormalrdquo
times Furthermore volatility spillovers also increased from offshore markets to onshore during
the periods of heightened uncertainty There is however an interesting asymmetry There is
evidence of rise in volatility spillover from onshore to offshore market in case of rupee
appreciation while the opposite happens ie the volatility spillover increases from NDF market to
onshore market in the episodes of rupee depreciation
All told as NDF volumes have increased they have begun to play an important role in both price
discovery and driving volatility particularly during heightened uncertainty periods
65
Chapter 4
International Financial Service Centre (IFSC)10 ndash Use of Rupee derivatives
The Task Force (TF) is vested to examine the role if any IFSC can play in addressing the concerns
arising out of offshore Rupee markets Presently Rupee is not permitted to be traded in the IFSC
This chapter discusses the aspects relevant to availability of non-deliverable Rupee derivatives in
the IFSC and permitting banks (IFSC Business Units or IBUs) to deal in such derivatives Before
discussing the potential benefits and concerns from the aforesaid proposition it is important to
address this issue ndash Are markets in IFSC onshore or offshore In the context of the Rupee market
a critical test for deciding the residency of the market would be applicability of capital controls in
respect of taking and exiting positions under FEMA 1999 Inter alia this is the critical aspect in
difference between the price discovered in onshore and offshore market As the IFSC functions
outside the capital controls under FEMA 1999 type of participants and the price discovered in
Rupee markets here will align with the existing offshore markets and therefore it cannot be treated
as onshore market To sum up while legally IFSC is very much an entity on the shores of India
from the point of view of Rupee markets it has to be treated as an offshore entity
Potential benefits of permitting non-deliverable Rupee derivatives in the IFSC
i Bringing NDF market volume to the IFSC Over the last decade or so a significant
market share in financial services related to India has moved to other international financial
centres like Singapore Hong Kong and London Bringing this business to India is clearly
beneficial in terms of economic activity and employment gains for India Further the size
and growth of the offshore Rupee derivative market poses a significant challenge to the
efficiency of price discovery as well as the effectiveness of exchange rate management
policy The possibility that the exchange rate of the Rupee not a fully convertible currency
being materially determined by transactions largely outside the legal and regulatory
influence of India is a matter of concern Given the favourable tax regime tax and by virtue
10
International Financial Services Centre or lsquoIFSCrsquo has the same meaning given in Section 2 (q) of the Special
Economic Zones Act 2005 (28 of 2005)
66
of it being outside the capital controls under FEMA 1999 IFSC may bring volumes and
price discovery to India
ii Complete bouquet of financial services in the IFSC Currently exchanges in IFSC are
permitted to offer a well-diversified range of products spanning various asset classes
which include derivatives on Indian indices derivatives on Indian stocks derivatives on
foreign stocks cross currency derivatives commodity futures on Gold Silver and base
metals etc Further while listing and trading of Masala Bonds is permitted in the IFSC
hedging Rupee exchange rate risk on it is not permitted Thus introduction of Rupee
derivatives will complete the entire range of asset classes available for trading in the IFSC
iii Access to market information The offshore Rupee market has been the subject matter of
interest for all stakeholders as these markets have an impact on onshore markets However
in the absence of any authentic data there are varying estimates about the volumes traded
in these markets nature of participation extent of open interest and the extent to which
these markets are used for hedging purposes If by opening up the IFSCs to Rupee trades
there is some migration of offshore Rupee market volumes it will help the cause of better
information flow regarding the market
iv Level playing field for Indian banks Foreign bankrsquos branches outside India can deal in
the offshore market as they are not bound by the RBIrsquos regulations On the other hand
overseas branches of Indian banks cannot deal in Rupee derivatives in the offshore market
By introducing Rupee derivatives in IFSC and permitting IBUs to deal in such derivatives
a more level playing field can be provided to Indian banks to service non-residents
Concerns from non-deliverable Rupee derivatives trading in the IFSC and dealing by IBUs
such derivatives
i Cannibalizing onshore business One major concern arising out of the introduction of
non-deliverable Rupee derivatives in the IFSC is whether it would cannibalize the business
of the onshore market instead of importing volumes from abroad Since the products in
both IFSC and the onshore market would be more or less similar in terms of characteristics
the domestic futures market getting gradually cannibalized by the IFSC on the face of it
appears probable But a deeper analysis of the comparative regulatory framework would
allay such concerns to a large extent The domestic currency futures market is majorly
67
made up of resident participation Non-residents are nearly absent in these markets and
hence their shift to the IFSC is more a theoretical proposition Since the Indian residents
are not permitted to participate in the IFSC they cannot contemplate a move-over It also
important to note that the onshore market settles in INR whereas derivative contracts in
the IFSC would settle in dollars and hence these markets will cater to two distinct classes
of participants
ii Impact on exchange rate management policy and development of the onshore market
Presently Indian banks are not allowed to deal in Rupee derivatives in the offshore market
A detailed discussion on the issue of allowing such dealing is presented in Chapter 5 In
consideration of the risk that participation of Indian banks may improve liquidity in the
offshore market and undermine the development of the onshore market the TF is of the
view of that Indian banks should not be permitted to deal in offshore Rupee market IFSC
being an offshore centre all concerns expressed in Chapter 5 in this regard are valid on
Rupee market in IFSC also However unlike other offshore Rupee market venues IFSC
has the potential of providing certain benefits to India as discussed earlier in this chapter
and therefore a distinction could be made between the two while examining the case of
permitting Rupee derivatives to be traded in the IFSC
iii Spillover of risks from IFSC to onshore market This is a concern since the two
markets being geographically contiguous could create porous leakage channels This
concern can be addressed by stipulating distinct net open position limits for entities
operating in both IFSC and on-shore In other words the open positions of entities
operating in the IFSC should not be permitted to be netted off with the open position on-
shore
What does a volatile Rupee exchange rate in the IFSC imply for the RBI and onshore
market
Chapter 3 establishes the linkages between the offshore and onshore Rupee market IFSC being an
offshore jurisdiction will have the same impact The RBI as the monetary authority has the
authority under RBI Act to maintain the stability of the rupee A volatile onshore foreign exchange
market could act as the trigger point of volatility in other financial markets like money bonds and
68
equities The spill over impact of financial market volatility casts its shadow on asset prices and
in turn it could have an impact on the capital flows and financial stability Given that a separate
regulator is envisaged for the IFSC the issue of RBIrsquos role in the IFSC was extensively deliberated
by the TF There are two possible approaches
i RBI plays a pivotal role in framing the Rupee derivative regulation in the IFSC In
order to allow the RBI to take measures in line with the objectives of exchange rate
management policy the sine qua non for allowing Rupee derivatives in the IFSC is to
ensure that RBI vested with the obligations to maintain financial and monetary stability
should continue to perform its statutory role in determining the regulatory framework for
Rupee market in the IFSC
ii Treat it akin to any other offshore market and maintain a hands-off approach The
objective of introducing Rupee derivatives in the IFSC is to provide an alternative to non-
residents for dealing in non-deliverable Rupee derivatives The expected transition of
investors is likely to be successful only if the IFSC functions with same freedom as other
offshore markets At the same time from an exchange rate management perspective
permitting Rupee trading in IFSC should not make a material difference to local authorities
as long as there is a barrier between the onshore market and IFSC In that case IFSC would
be exactly of the same status as any other offshore market
The TF feels that in line with the objectives of permitting Rupee derivatives in the IFSC the latter
approach - that the regulatory environment in which Rupee trades in IFSC is exactly similar to the
environment that prevails in any other offshore centre - is preferable As IFSCs are treated on par
with a foreign jurisdiction in terms of FEMA the regulation of the trade and capital flow channels
between the two jurisdictions (on-shore and IFSCs) should be so designed as to restrict the
transmission of volatility through these channels (in terms of participants products limits etc)
Recommendation
While there are concerns around impact on the onshore market due to trading in Rupee derivatives
in the IFSC there are potential benefits in terms of IFSCrsquos ability to offer complete bouquet of
financial services and availability of market information to all stakeholders Further given Indiarsquos
69
economic growth it may be appropriate to prepare for greater financial integration with the rest of
the world Sequencing and timing of measures relating to currency markets is a critical component
of such integration Although at the moment there is no definite path ahead in terms of such
integration but a thriving Rupee market in the IFSC may provide a system which can be leveraged
towards this end in the way and manner deemed fit in future IFSC being outside the capital
controls provides an opportunity to policymakers to test new regimes and products in an
environment whose repercussions may not significantly impact the stability or efficiency of the
onshore system On balance the TF is of the view that non-deliverable Rupee derivatives may be
introduced in the IFSC However a phased approach may be adopted and to start with trading
may be permitted only on exchanges due to the inherent transparency and risk management
benefits offered by it Introducing OTC contracts may be considered at a later stage after the
experience gained from trading on exchanges RBI may in its Financial Stability report assess the
impact of the functioning of IFSC on the financial stability of the country
Further the TF is of the view that entities regulated and permitted by the RBI may be permitted
to make market and run positions in Rupee derivatives market in the IFSC In order to prevent
spill over of risks from IFSC to onshore market though these entities a distinct net open position
limit may be stipulated for their operations in the IFSC In other words the open positions of
entities operating in the IFSC should not be permitted to be netted off with their open position
the onshore market
Finally given the mandate of RBI to implement exchange rate policy it may not be in benefit of
things to introduce Rupee derivatives in the IFSC without it being on board and therefore the TF
feels that Rupee derivatives may be permitted in the IFSC subject to agreement of the RBI
70
Chapter 5
Issues and Recommendations
The Task Force (TF) is entrusted to recommend measures to incentivize non-residents to access
the onshore Rupee derivative market and address concerns if any arising out of the offshore
Rupee derivative market As discussed in Chapter 1 the TF had interactions with various
categories of stakeholders to understand their perspective on the matter and identify the issues that
needs to be addressed
Chapter 2 and 3 have clearly brought out the increased importance of offshore Rupee markets
both in terms of their size and in terms of their impact on the exchange rate of the Rupee The price
and volatility spillovers from one market to the other are almost complete they are bi-directional
and when rupee is under pressure they are unidirectional from offshore markets to onshore
markets The speed of convergence of the markets is also quite quick The TFrsquos recommendations
have been made in the light of available information results of statistical analysis and most
importantly on the feedback received from various consultations
While increased participation of non-residents would be expected to enhance liquidity in the
onshore market it may also bring along with it additional volatility and transfer of incremental
risk to the domestic system This is particularly so as historically the rupee is a currency that has
generally depreciated and the demand for forward dollars is usually more than the supply
especially in times of stress Hence it is pertinent to examine the impact of incremental hedging
by non-residents in the onshore market While volatility in the rates have a clear impact on the real
sector events in the domestic derivatives markets in the late 2000s constantly remind us of issues
related to transfer of risk to entities that are not capable of understanding and managing it The big
question then is whether our system today is ready for incremental demand for hedging from non-
residents Available data is inadequate to measure the contribution of hedgers and speculators in
the offshore market turnover Using the best available information it can be estimated that an
additional daily average Rupee derivative turnover of around 08 billion ndash 24 billion could be
generated in the onshore market if all the INR NDF hedging transactions are transferred from the
offshore market (see Box 1) Such an incremental flow is not significant enough to cause any
adverse impact on volatility in the onshore market given that the user-driven deliverable forwards
market in India is quite liquid with daily average turnover of USD 163 billion (as per BIS
71
Quarterly Review December 2016) As regard transfer of risk to the domestic system the concern
is more regarding transfer of risk to the Indian companies and less towards market-makers as they
are in the business of managing risk There is a possibility that the said incremental positions
created in the onshore market may get transferred to Indian companies (in part or full depending
upon the level of these positions retained by the market-makers) However in comparison with
the late 2000s Indian companies today are only allowed to enter into Rupee derivatives depending
on their underlying exposure and no leveraged structures are permitted Also banks are bound by
stringent suitability and appropriateness norms Therefore the chances of Indian companies
acquiring unmanageable risk positions or risks due to mis-selling by market-makers are very low
Further there has been a significant growth in the external sector and consequently the foreign
exchange market has also grown (although one could argue on the incommensurate growth) To
summarize in the last decade or so the ecosystem on the whole has evolved and is less prone to
adverse impact from transfer of risks from non-residents
Box 1
Approximation of share of hedging transactions in INR NDF turnover
The graph presented below is extracted from BIS Quarterly Review December 2016
72
It can be observed from the above graph that non-financial and other financial institutions
contribute around 5 and 35 respectively to the turnover of INR NDFs in the offshore market
If one were to make an informed guess that all transaction by non-financial companies are hedging
transactions and that hedging transactions by other financial companies (eg funds) would
constitute maximum 25 of their transaction then it can be approximated that hedging transactions
constitute around 5 - 15 of the daily average turnover in INR NDF market which was reported
as USD 164 bn
Comparison of turnover in forwards in onshore and offshore market - In the same publication
it is also reported that the average daily turnover in onshore deliverable forwards is USD 163 bn
It may be noted that for fair comparison with the turnover in offshore market (where deliverable
spot and swap market doesnrsquot exist) this turnover includes both deliverable forwards and FX
swaps A comparative analysis of volumes in onshore and offshore market ndash both OTC and
exchange traded Rupee derivatives - is given in Annexure IV
Issues and recommendations
1 Market hours
An important reason for the existence of the offshore Rupee derivative market is simple geography
That domestic markets are closed when major users in certain regions (eg the United States) are
working creates a natural access for offshore markets Also significant international developments
impacting the Rupee exchange rate take place outside the onshore market hours thereby creating
a natural clientele for the offshore markets The feedback received from non-resident investors as
well as corporates highlighted the closure of the local market as an important reason for them
accessing the offshore market Exchanges have for some time been requesting an extension of
market hours citing increasing Rupee transaction volumes in offshore exchanges situated in
Singapore and Dubai A straightforward way of taking care of such requirements is to extend the
onshore market hours (both OTC and exchange traded derivative markets) While extending
market hours might involve simultaneously keeping support services (payment and settlement
systems) or support markets (funding markets) open it is also possible to treat such transactions
as part of the operations of the next day in which case the need for settlement or funding does not
73
arise In this regard the TF supports the recommendations relating to market timings outlined in
the draft Report of the Internal Working Group on Comprehensive Review of Market Timings
published by RBI on July 10 2019
Recommendation 1
The TF recommends that the onshore market hours be suitably extended to match the flexibility
provided by the offshore market and thereby incentivize non-residents to hedge in the onshore
market
2 Competitive pricing
One important feedback from foreign portfolio investors (FPIs) as well as global corporates was
that they are unable to access multiple competitive quotes in the onshore market Effectively they
are limited to using the prices of their custodian banks Generally FPIs deal only with their
custodian banks due to the existing rules whereby the custodian is responsible for tracking of
outstanding hedges vis-agrave-vis portfolio size This ldquofrictionrdquo issue can be addressed by shifting the
monitoring to a centralized agency which can use a technology solution to track exposures as well
as outstanding hedges This is further explained in recommendation no 4 ahead relating to
underlying exposure
Also the process to be setup documentation such as KYC and other trading arrangements with
multiple counterparties in India is a long and difficult exercise resulting in most FPIs either trading
with their custodian bank or using the offshore market to hedge Some of the documentation related
challenges can be minimized if the centralized KYC registration currently in place for SEBI
regulated entities is extended to all the entities ie both custodial banks as well as non-custodial
banks This is elaborated in recommendation no 11 on the KYC process
Another issue highlighted by FPIs in this context was unavailability of multi-dealer electronic
dealing platforms for them One way of making onshore prices more widely accessible to non-
residents is to allow Indian banks to freely offer prices as liquidity providers to non-resident
customers at any time whether or not the domestic market is open They can extend to non-resident
corporates the same choices that domestic corporates have in choosing among various market
makers This can be done either by a domestic sales team or by using staff located at overseas
74
branches In addition making an all-to-all trading platform (like the FX-Retail being introduced
in August 2019) available to non-residents would supplement that effort
Recommendation 2
The TF recommends that banks may be allowed to freely offer prices to non-residents at all times
out of their Indian books either by a domestic sales team or by using staff located at overseas
branches Also wide access to the FX-Retail trading platform to non-residents would be a major
incentive to use the onshore market
3 Effect of offshore Rupee derivative market on onshore price discovery and exchange rate
management policy
The size and growth of the offshore Rupee derivative market especially in the last few years poses
a significant challenge to the efficiency of price discovery as well as the effectiveness of exchange
rate management policy A comparison of onshore and offshore Rupee derivative market is given
in Annexure IV The possibility that the exchange rate of the Rupee not a fully convertible
currency will be materially determined by transactions largely outside the legal and regulatory
influence of India is a matter of concern The most straightforward approach to deal with that
concern would be to completely liberalize the onshore market and bring it at par with the offshore
market in all aspects Such a scenario would imply an effective absence of local regulation and
intervention which is incompatible with the current status of capital account convertibility
Another option is to liberalise the onshore market to the extent possible but this in itself may not
necessarily mean a fall in importance or size of the offshore market In this connection the TF
extensively discussed the proposition of creating a connection between the offshore and onshore
markets by permitting Indian banks to deal in the offshore market The various implications of
such a step are discussed below
i Reduction in volatility In theory a segmented market would be less liquid and therefore
more volatile compared to an integrated market One could also infer that offshore market
activity is maximum during onshore working hours eg almost three-fourths of the
offshore rupee futures are traded when Indian markets are open It is also observed that
75
offshore spreads are larger which indicates a relative scarcity of market-making entities
Linking the two markets may increase both the customer base as well as the liquidity
providers thereby improving liquidity as well as efficiency of the price discovery process
ii Better customer pricing through increased transparency in the offshore market
Today very little information is available regarding the offshore Rupee market other than
that of exchange traded instruments Such opacity is not in the interest of customers as
liquidity provision is limited to entities that have a presence both onshore and offshore
resulting in a premium (in terms of high bid-ask spreads) being charged for market access
Broadening this access to onshore banks would drive away such premium through wider
competition At the same time access to information improves for the local authorities
Since better information leads to better price efficiency it is in the interest of local
authorities to disseminate such information leading to an overall improvement in market
transparency
iii Level playing field for Indian banks Foreign bankrsquos branches outside India can deal in
the offshore market as they are not bound by the RBIrsquos regulations On the other hand
overseas branches of Indian banks cannot deal in Rupee derivatives in the offshore market
Allowing them access to the offshore Rupee derivative market would create a level playing
field for Indian banks
iv Impact on development of the onshore market Liquidity in onshore market is better
than the offshore market due to participation of real sector and market making by Indian
banks which obviously are the major Rupee liquidity providers Consequently non-
residents have the ability to exit positions with less impact cost in unfavourable times This
is a strong incentive for them to hedge in the onshore market (given dynamic hedging and
other operational issues are now being ironed out) Also higher liquidity in the onshore
market results in tighter bid-ask spread compared to the offshore market which allows non-
residents to get better pricing in the onshore market The aim of policy measures is to
develop the onshore market Accordingly policymakers strive to protect the advantages of
onshore market and at the same time develop and liberalise the onshore market to overcome
the gap vis-agrave-vis NDF markets in other aspects such as ease of access market infrastructure
and taxation There is of course the risk that participation of Indian banks will improve
76
liquidity in the NDF market and undermine the development of the onshore market Such
a situation will be challenging for implementing exchange rate management policy
Recommendation 3
The onshore Rupee derivatives market is currently more deep and liquid as compared to the
offshore Rupee market and participation of the Indian banks in the offshore market might over
time take away this advantage The TF feels that the downside of permitting Indian banks to deal
in the offshore Rupee derivative market outweighs the advantages and therefore recommends that
Indian banks should not be permitted to deal in the offshore Rupee derivative market for the
present
4 Requirement of underlying exposure and documentation therefor
There is no requirement of an underlying exposure to enter into a derivative contract in the offshore
Rupee derivative market Hence non-residents can freely trade in this market to hedge risk on an
underlying Rupee exposure or create exposure to Rupee However as per extant regulations non-
residents can enter into Rupee derivative contracts in the onshore market only for the purpose of
hedging risk arising from an underlying exposure Non-residents are classified into Foreign
Portfolio Investor (FPI) investors having Foreign Direct Investments Non-Resident Indian Non-
resident Exporters and Importers and Non-Resident lenders having ECBs designated in INR with
each category being subjected to a different set of rules for establishing underlying exposure
FPIs are allowed to hedge only on the basis of existence of underlying exposure with the hedge
size capped at the market value of investment in equity and debt in India as on a particular date
including any coupon receipts arising out of investment in debt securities falling due during the
following twelve months only The explicit mention of only equity and debt investments creates
regulatory ambiguity on hedging of other FPI exposures in India such as margin deposits cash
etc Hence any FPI having investment in India will be able to only buy USD forward against INR
onshore and will not be allowed to sell USD against INR in forward market as that would result in
increasing the exposure rather than hedging the exposure To prove the exposure a valuation
certificate is required to be provided by a designated AD bank (Custodian) as a proof of underlying
FPIs are also required to provide a declaration to the effect that their total outstanding hedges are
within the market value of their investments The only exception to establishing underlying
77
exposure requirement is dealing in exchange traded market where FPIs are allowed to take
positions without having to establish existence of underlying exposure up to USD 100 million
FDIs are allowed to hedge both their existing investment as well as proposed foreign direct
investments with the latter being allowed only after an AD bank ensures that all necessary
approvals for the investment have been obtained by the FDI With respect to non-resident
corporates users can hedge their exposures invoiced in INR and intercompany loans denominated
in INR (ECBs) They can book the hedge either directly with an AD bank in India or on a back-
to-back basis Prior to hedging they must furnish a declaration certifying that the underlying
exposure has not been hedged with any other AD bank(s) in India They are required to cancel the
hedge contract immediately if the underlying exposure is cancelled In case of a central treasury
an authorization from the entity having INR exposure to hedge on its behalf is also required
Irrespective of the category of the investor the requirement to establish underlying exposure
creates practical difficulties for many non-residents Funds who intend to execute macro hedge for
various schemes or MNC parents wanting to consolidate exposures across subsidiaries and
executing a single hedge find it easier to execute consolidated hedge in the offshore market Also
hedging of anticipated and economic exposures is not permitted
Recently the RBI has released11 draft regulation regarding risk management facilities for public
feedback The TF reviewed it in detail and also received feedback on it during interaction with
stakeholders The proposed regulation satisfactorily addresses a lot of pertinent issues Measures
on simplifying eligible underlying exposure criteria simplifying documentation requirement
flexibility to hedge dynamically ability to hedge anticipated exposures user classification (retail
and non-retail) and choice of products are welcome and much needed It is noted that the
requirement of having an underlying exposure for entering into Rupee derivative contract is
retained and it is felt that it is justified for effectiveness of exchange rate management policy and
ensuring financial stability Given that only hedging transactions are going to be permitted in the
onshore market there will remain a requirement to establish or declare existence of underlying
exposure to risk and also to ensure that notional of hedge contracts is in line with the value of
underlying exposure As discussed above such requirement acts as a deterrent for non-residents to
hedge in the onshore market It would be optimum if a solution can be found that fulfils the
11
Vide press release dated February 05 2019
78
requirement of verification of underlying exposure without the investors being required to
undertake the efforts to prove it This can be achieved by consolidating the existing data on
investments and hedge transactions residing with various regulated entities
Recommendation 4
The TF recommends that a technology-based solution be explored to centrally aggregate the
investments of non-residents and derivative contracts entered into by them in the onshore market
(both OTC and exchange traded) using LEI or any other unique identifier to start with ADs should
be allowed access to such aggregate data so that they can verify the quantum of derivative positions
and underlying investments of the non-residents This mechanism can potentially completely
remove the requirement of efforts from the non-residents to prove the existence of underlying
exposure to Rupee
Further to simplify procedures and provide ease of access to the exchange traded currency
derivative market the RBI has allowed users to enter exchange traded instruments (futures and
options) to take exposure up to USD 100 million without the requirement of establishing the
existence of underlying risk Such measures go a long way in encouraging users (especially
MSMEs) to hedge their exchange rate risk by making the process easier At the same time such
calibrated opening helps in addressing any concerns of systemic risk The TF feels that such an
incentive must be provided in the OTC market also as it will not only contribute to ease of doing
business but also to restore parity in regulation between OTC and exchange markets
Recommendation 5
While requirement of underlying exposure will continue for trading in the onshore market users
may be allowed to undertake positions up to USD 100 million in OTC as well as exchange traded
currency derivative market without having to establish the underlying exposure
5 Products
Non-residents can enter into only plain vanilla forwards and option contracts in the OTC foreign
exchange market Further swaps are restricted to specific case of IPO and non-resident lenders of
ECB denominated in INR Non-residents who prefer to express their hedge using structured
79
options necessarily need to execute in the offshore market as current regulations do not allow non-
residents to enter into structured options
Recommendation 6
The aforesaid draft regulation addresses this issue by allowing ADs to offer any product to the
non-residents (for non-retails users) which satisfies the purpose for which they are permitted to
enter into Rupee derivatives ie hedging of underlying exposure to Rupee In other words ADs
cannot offer any product that creates risk for the user instead of hedging the existing risk The TF
endorses this principle-based regulation approach
6 Restrictions on dynamic management of risk
Non-residents trading in the offshore market are free to cancel and rebook their trades depending
on their future expectations andor risk management policy On the other hand in the onshore
market non-residents in general are not allowed to rebook a contract once cancelled Only in the
case of FPIs rebooking up to 10 of the value of contracts cancelled is permitted Inability to
manage risk dynamically deters non-residents who look for flexibility while hedging their risks
The aforesaid draft regulation proposes to remove restrictions on rebooking of cancelled contracts
and thereby allow users to hedge dynamically For contracts entered into for hedging contracted
exposure gains (or losses) on cancellation will be passed on to the user as and when they accrue
but in case of contracts entered into for hedging anticipated exposures net gains will be transferred
only when the underlying cash flow has occurred The prime purpose of such stipulation is to curb
incentives for speculation by using the liberal position limits available under anticipated exposure
hedging However a consequent drawback is that in some instances eg contingent contracts
such as bidding for projects involving currency risk such a provision would not be equitable This
provision could be suitable amended to enable all types of hedging without compromising the
essential control that the cash flow requirement provides to ensure underlying in a hassle-free way
The TF is of the view that providing suitable discretion to banks to pass on net gains even without
cash flows in such cases would address this shortcoming This will ensure that genuine hedgers
80
will access the onshore market without worrying about retention of gains if underlying transaction
does not fructify due to reasons beyond their control
Recommendation 7
In line with the objective of bringing onshore market at par with offshore market the most obvious
path is to not have any restrictions on transfer of gains in case of anticipated exposure hedging
However a balancing act is necessary between liberalizing the market while preventing
speculative positions which can create undue volatility in the onshore market Keeping this in
mind while endorsing free dynamic hedging (without any restriction on cancellation and
rebooking) for hedging contracted exposure the TF recommends that in case of hedging of
anticipated exposures gains from cancellation of contract may be allowed to be passed on even in
cases where there are no cash flows at the discretion of the bank where the bank considers the
cancellation of underlying cash flow is due to external factors which are beyond the control of the
user
7 Gross settlement and credit risk management
In the case of offshore Rupee derivative market non-residents clear and settle OTC trades either
through a prime brokercustodian or bilaterally with the counterparty In both these cases the non-
residents usually execute a bilateral multi-currency master service agreement which includes
provisions for exchange of margin (ex- ISDA master agreement including Credit Support Annex)
with the counterparty These agreements necessitate periodic settlement of marked-to-market gains
and losses across products and provide the flexibility to net off losses against gains Hence these
agreements significantly lower credit charges and provide strong netting efficiency On the other
hand in the onshore market the non-residents in an otherwise identical situation will face
additional challenges in respect of settlement and exchange of margin due to the following reasons
Gross settlement of gains As mentioned above non-residents clear and settle OTC trades in the
offshore Rupee derivative market either through a prime broker or bilaterally with the
counterparty Typically they settle deal across assets and currencies with either of these entities
and are therefore able to net the cash flows and achieve efficiency in liquidity management
81
However as Rupee derivatives entered into in the onshore Rupee derivative market cannot be
settled under such overseas arrangements non-residents are unable to avail the benefits of netting
on their onshore transactions
Credit risk management Signing a master service agreement locally and establishing credit lines
with onshore banks increases the execution cost of hedging onshore Typically transactions of
non-residents in the offshore market are collateralized (through collateral exchange provisions
contained in the master service agreement) while those in the onshore market are non-
collateralized Depending on the credit rating of the non-resident the onshore banks may not
necessarily be open to providing exposurecredit limits on uncollateralized basis for entering into
deliverable contracts If a collateralized credit line is set up through a master service agreement
with provision for exchange of collateral in USD outside India restrictions under FEMA 1999 on
exchanging margin outside India by onshore banks poses issues If exchange of collateral is in INR
in India then the non-residents will have to either assume the exchange rate risk on the cash margin
deposited or will have to additionally hedge the margin money placed Moreover this attracts
regulatory ambiguity such as minimum tenor restrictions as per deposit regulations ability to
hedge the margin through FX swap interest to be paid on cash in SNRR account etc If interest
cannot be paid on the collateral placed with onshore counterparties it creates a strong economic
disincentive for the investor to hedge onshore
These issues can be addresses in two ways First facilitating the non-residents to utilize their
existing overseas custodianprime broker relationship and master service agreements for
settlement of their transactions onshore and exchange of collateral therefor Second by creating
the regulatory framework for exchange of margin for non-centrally cleared derivatives in India to
make it consistent with evolving clearing mechanism offshore Both the solutions are discussed
below
To help non-residents retain their economic neutrality with respect to the prevailing multi-currency
master service agreement executed offshore a central clearing and settlement mechanism may be
established for non-residentsrsquo deals with onshore counterparties along the lines of central clearing
and settlement of onshore interbank deals by the CCIL The overseas bank of the non-resident will
clear and settle the deals execute by them onshore To be sure the proposal is to introduce the
centralized clearing mechanism while retaining the existing bilateral settlement mechanism so that
82
investors who want to continue using it do not face disruption For the suggested central clearing
and settlement mechanism to be set up inter alia the following permissions would also be
required
i Permission under FEMA 1999 for CCIL to accept foreign currency denominated collateral
in India or outside India
ii Enhancement of CCILrsquos infrastructure to accept wide range of securities (foreign currency
cash securities issued by foreign governments etc) as collateral and
iii Other regulatory clearances required for non-residentsoverseas banks in other jurisdictions
to clear and settle through CCIL
Further back-to-back hedging by non-residents proposed in the aforesaid draft regulation will also
allow effective utilization of their prevailing multi-currency CSA arrangement offshore This
entails allowing non-residents to hedge their exposure with their banking counterpart overseas
which in turn will hedge the position back-to-back with an onshore bank This ensures that existing
dealing arrangements between non-residents and their overseas counterparties remain unchanged
but at the same time the market risk gets transferred to onshore banks and hence is managed locally
The overseas bank should be allowed to settle the onshore leg either bilaterally with the onshore
bank or through the proposed central clearing and settlement mechanism Also this will require
permissibility under FEMA 1999 to exchange margin with the overseas banker of non-residents
outside India In such a model the approach should be to recognize the intermediary offshore bank
as a facilitator purely for the convenience of the non-resident investor Experience from other
markets that have implemented such models like Malaysia and China suggest that putting the onus
of monitoring compliance in terms of quantum of hedge underlying documentation etc on the
intermediary bank is inefficient Such a requirement leads to the intermediary bank asking for
various indemnities from the client and these are often difficult and time consuming to negotiate
and sign The approach should be to monitor compliance by the non-residents as the regulated user
using available onshore infrastructure as well use of technology solutions to track the hedges vis-
a-vis underlying exposure as detailed in recommendation 5
With regard to regulation and infrastructure for exchange of margin for non-centrally cleared
derivatives in India the RBI released a discussion paper on this issue in May 2016 However the
final directions have not been issues yet It is understood that ambiguity in netting legislation is
83
one of the main issues holding the release of these directions Also it is understood that the GoI is
in the process of making legislative changes to address this issue
Recommendation 8
For ease of entering into hedge transactions for non-residents the TF recommends-
i Establishment of a central clearing and settlement mechanism for non-residentsrsquo deals in the
onshore market
ii Back-to-back hedging by non-residents proposed under the draft regulation is endorsed The
overseas bank should be allowed to settle the onshore leg either bilaterally with the onshore bank
or through the proposed central clearing and settlement mechanism
iii Implementation of margin requirement for non-centrally cleared OTC derivatives in the
onshore market at the earliest
iv Allowing Indian banks to post margin outside India This is not only relevant for credit risk
management for their transactions with non-resident users but also for their cross-border inter-
bank transactions
8 Taxation
Under the extant regulatory framework non-residents are permitted to enter into Rupee derivative
contracts only for hedging risk on their investmentslendingtrade in India As per discussions with
stakeholders the following position is generally adopted with regard to the gains from such
contracts
bull Where currencies under the contract are delivered ndash Not a taxable event (ie conversion of
one currency into another does not give rise to taxable income)
bull Where contract is cancelled and price difference is settled ndash If the derivative contract is
entered into for hedging exchange rate risk on a capital asset then gains on cancellation are
treated as capital gains If it is entered into for hedging exchange rate risk in relation to a
tradingbusiness asset such gains are treated as business profits
84
However it is understood that there is ambiguity in the rules in this connection and the position
taken by the Assessing Officers (AOs) differs between zones and is at variance with the aforesaid
position Oftentimes such gains on cancellation are treated as lsquoOther Incomersquo or lsquoSpeculation
Business Profitsrsquo During interaction with the non-residents it was suggested that such uncertainty
of tax treatment is one of the prime reasons why they do not access the onshore market and instead
hedge Rupee exposures in the off-shore market
Recommendation 9
The TF recommends that the competent authorities may examine the issue of taxation in respect
of foreign exchange derivative contracts with the objective of overcoming gaps between tax regime
in India and other major international financial centres (Singapore Hong Kong and London) to
the extent possible and thereby incentivizing non-residents to hedge in the onshore market
9 Allow non-deliverable Rupee derivatives in the IFSC and permit IBUs to deal in such
derivatives
The proposition of introducing non-deliverable Rupee derivatives in the IFSC and permitting
banks (IFSC Business Units or IBUs) to deal in such derivatives is discussed in detail in Chapter
4 While there are concerns around impact on the onshore market due to trading in Rupee
derivatives in the IFSC there are potential benefits in terms of IFSCrsquos ability to offer complete
bouquet of financial services and availability of market information to all stakeholders Further
given Indiarsquos economic growth it may be appropriate to prepare for greater financial integration
with the rest of the world Sequencing and timing of measures relating to currency markets is a
critical component of such integration Although at the moment there is no definite path ahead in
terms of such integration but a thriving Rupee market in the IFSC may provide a system which
can be leveraged towards this end in the way and manner deemed fit in future IFSC being outside
the capital controls provides an opportunity to policymakers to test new regimes and products in
an environment whose repercussions may not significantly impact the stability or efficiency of the
onshore system On balance the TF is of the view that non-deliverable Rupee derivatives may be
introduced in the IFSC However a phased approach may be adopted and to start with trading
may be permitted only on exchanges due to the inherent transparency and risk management
85
benefits offered by it Introducing OTC contracts may be considered at a later stage after the
experience gained from trading on exchanges RBI may in its Financial Stability report assess the
impact of the functioning of IFSC on the financial stability of the country
Further the TF is of the view that entities regulated and permitted by the RBI may be permitted to
make market and run positions in Rupee derivatives market in the IFSC In order to prevent spill
over of risks from IFSC to onshore market though these entities a distinct net open position limit
may be stipulated for their operations in the IFSC In other words the open positions of entities
operating in the IFSC should not be permitted to be netted off with their open position the onshore
market
Recommendation 10
The TF recommends that non-deliverable Rupee derivatives (with settlement in foreign currency)
may be allowed to be traded in the IFSC and IBUs may be allowed to deal in such derivatives with
a distinct FCY-INR position limit To start with exchange traded currency derivatives involving
Rupee may be introduced and with experience non-deliverable OTC currency derivatives
involving Rupee may also be allowed
10 KYC process
The extant directions issued by the Reserve Bank of India stipulates the documents required for
conducting KYC process to open accounts of non-residents Similarly SEBI has also prescribed
documents required for the granting of FPI license by Domestic Depository Participants (DDP)
Further KYC documents for FPIs are available to SEBI regulated entities through KRAs subject
to approval from either the FPIs or the domestic custodians Since access to KRAs is available
only to SEBI regulated entities most banks are not allowed to access KRA and hence seek
complete documentation from FPIs again Such repetitive submission of documents to various
financial intermediaries results in long lead time for on-boarding and makes the entire process
operationally cumbersome for non-residents
Recommendation 11
The TF recommends that the KYC registration may be centralized across the financial market with
uniform documentation requirement All regulated financial market intermediaries should be
provided access to the centralized registry and they should be allowed to rely on online registry
86
for confirmation that KYC has been completed and itrsquos valid This will ensure that non-residents
undertake the KYC process only once and not with each financial intermediary that they deal with
in the onshore market Also such a mechanism offers cost and efficiency benefits for the financial
intermediaries
87
Annexure I
Key features of currency market of major EMEs
I USD-RMB Market ndash China
Onshore Deliverable - CNY Offshore Deliverable - CNH
Market
Turnover
Daily average turnover USD 28
billion
Daily average swap and
forward turnover
USD 62
billion
Daily average options
turnover
USD 15
billion
Daily average
turnover
USD 15-20
billion
Daily average
forward turnover
USD 25-30
billion
Daily average
Options turnover
USD 5-6 billion
Spot foreign
exchange Onshore CNY foreign exchange spot is
available with documentary proof of an
underlying transaction
Participating banks in Hong Kong
provide two types of spot RMB
exchange rate transactions
- For trade service and direct
investment purposes where
resulting foreign exchange
positions can be offset with the
clearing bank or onshore
correspondent banks and
For general purposes where banks need
to warehouse the risk or offset the
position in the interbank USD-CNH
market Forward
FXSwaps CNY forwards and foreign exchange
swaps with maturities of up to five years
are available to onshore institutions to
hedge foreign exchange exposure
subject to documentary proof of the
same
Most liquid is in the tenor of one year or less
CNH deliverable offshore forwards
are available out to five years
Liquidity has improved significantly
and has surpassed turnover in the
NDF market
FX Options Onshore market participants can buy or
sell common European options of CNY
against foreign currencies on a real
needs basis
Tenors are available out to three years
with further tenors on a case-by-case
basis Most liquid is in the tenor of one
year or less
The State Administration of Foreign
Exchange (SAFE) started allowing
corporates to sell FX options from August
2014 on a real needs basis and with net
settlement allowed
Deliverable CNH options are
available without restrictions to any
non-individual counterparty that has
a physical CNH Nostro account in
Hong Kong
Options on USD-CNH and CNH crosses
are available out to five years and
beyond on a case-by-case basis
88
Access to
domestic
participants
On the current account the CNY is
convertible subject to genuine
documentation Onshore entities can
access the local forwards market
provided these contracts are used to
cover current account transactions
subject to documentary proof available
on settlement
On capital account CNY conversions
may be settled by way of voluntary
settlement in banks if these are required
in the Companiesrsquo institutionsrsquo actual
business operation Typically all capital
account transactions need to be
registered with SAFE for local forwards
Not easily accessible to onshore
residents approvals required for transfer
of funds from Onshore to Offshore
Access to
Offshore
participants
Qualified
Foreign
Institutional
Investor
All allowed subject to
principle of actual
needs (Quota
restrictions exists
on underlying
investments)
Can trade via their
custodian or domestic
financial institution
Central
Banks
No quota restrictions
ability to trade as
interbank counterparty
in the domestic market
ndash bilateral or
anonymous trading
China
Interbank
Bond market
(CIBM)Bond
Connect
For OIIs (Overseas
Institutional Investors)
accessing making
CIBM investment can
enter
into all FX products on
actual needs basis with
settlement agent banks
Change in CIBM
investment position
requires adjustment to
the FX hedges within
5 working days
All customers can open a RMB account
in Hong Kong Banks can provide
customers with general purpose RMB
accounts which allow free transfers of
funds (offshore) for any purpose In
general all FX products are allowed in
CNH for offshore investors
Trading
Hours 10 AM ndash 4 PM Local China Hours 10 AM ndash 4 PM Local China Hours
89
II USD-KRW Market - Korea
Features Onshore Deliverable Offshore Non-Deliverable
Market Turnover Average daily turnover
USD
Billion
Spot Forward Swaps
2011 191 75 192
2012 180 66 198
2013 183 71 196
2014 175 76 190
2015 200 83 192
2016 194 96 184
2017 196 101 198 Source Bank of Korea
As per London clearing house
(LCH) Ltd the daily turnover of
NDF cleared by them on April
16 2019 is a total of USD 119
billion (Source LCH)
As per SEF turnover as on April
12 2019 is USD 379 million
(Source SEF)
Daily NDF turnover has
increased from USD 195 billion
in 2013 to USD 30 billion in
2016 (Source BIS 2016 survey)
Access to
domestic
participants
Residents can hold unlimited
amounts of foreign currency in
foreign currency bank accounts and
Korean firms can maintain foreign
currency accounts abroad
Financial institutional investors
have access to the local forwards
market and can hedge their
investment exposure without
confirming the lsquoexistencersquo of the
investment
Forward position limits of foreign
bank branches (FBBs) and local
banks registered as FX Banks in
Korea as below
- For FBBs positions are
capped at 200 per cent of the
previous month-end equity
capital
- For local banks forward
positions are capped at 40 per
cent of the previous month-
end equity capital
- Corporate customer foreign
currency hedging limits are
100 per cent of customersrsquo
exposure or their transaction
of underlying real assets
Residents may hold foreign
currency accounts domestically
or abroad
Corporate investors and
individual investors are required
to confirm the existence of the
investment
In the case of capital or current
account transactions domestic
residents can remit up to USD 50
000 per year freely
Access to
Offshore
participants
Non-residents can hold KRW
locally through bank accounts
Foreign investors must open special
investment purpose accounts
No restrictions and BoK does not
regulate the same
90
Source Bank of Korea BIS HSBC Research
which consist of an exclusive
external account for investment and
an exclusive non-resident domestic
currency account for investment
Foreign investors are allowed to
freely convert foreign currency into
KRW without any underlying
securities purchases while the
converted funds are being
transferred within exclusive
external investment accounts
However the converted funds in
the exclusive external account for
investment should still be used for
the purpose of securities
investment
Non-Resident Investors holding
Investment Registration Certificates
(IRC) sale proceeds from the
investment in securities can be
freely repatriated
Central Bank
intervention
BOK is now releasing a quarterly
intervention report on a net basis
They generally only comment that
they intervene only in exceptional
basis for smoothing operations
Bank of Korea does not access the
NDF market
Trading Hours 9 AM ndash 330 PM local Korea time Available through time zones
Taxation and
Repatriation of
FX Gains
All gains on unwind of deliverable
transactions are freely repatriable
without any tax
All gains on unwind of non-
deliverable transactions with
onshore banks are freely repatriable
without any tax
91
III USD-MYR Market ndash Malaysia
Onshore Deliverable Offshore Non-Deliverable
Market Turnover - Daily inter-bank market USDMYR
spot turnover around $500 million
- Daily inter-bank market USDMYR
swap turnover around $30 billion
- As per LCH Ltd UK Clearing
house the daily turnover of
USDMYR NDF cleared by them
on April 16 2019 is a total of
USD 332 million from 82 trades
(LCH website)
- As per SEF a trading platform
USDMYR turnover as on April
12 2019 is USD 205 million
from 18 trades (SEF website)
- As per the Hong Kong exchange
the NDF turnovers in 2016 were
around USD 50 billion and have
reduced to approximately USD
20 billion in 2018 (HKMA NDF
report 2018)
Access to Domestic
participants
- Resident counterparties such as
importers and exporters can use
currency options and forward
contracts to manage their foreign
exchange risk
- Residents are allowed to enter into
hedging arrangements on committed
current account transactions and
financial account transactions
- All forward contracts must be
supported by an underlying trade or
capital account-related transaction
allowed under the Foreign Exchange
Administration Rules
- Residents are allowed to freely
hedge and un-hedge their foreign
currency exposure for USD-MYR
CNH-MYR GBP-MYR EURMYR
and JPY-MYR currency pairs
without documentary evidence up to
an aggregate net open position of
MYR 6 million per bank
Not allowed
Access to Offshore
participants
- Licensed onshore banks and
approved investment banks are
allowed to enter into FX forward
Open and not regulated by the
central bank
92
Source Bank Negara Malaysia BIS HSBC Research
contracts with non-residents as
follows
Forward FX purchase or sale
contracts against MYR for
current account transactions
Forward FX purchase or sale
contracts against MYR based on
committed purchases or sales of
MYR assets The forward
contracts can be entered into at
the point when the non-resident
commits to purchase or sell the
MYR assets
- Dynamic hedging programme offers
flexibility to actively manage FX risk
exposure via forward hedging
activities with onshore banks or
Appointed Overseas Office (AOO)
without any documentation
CCP used Malaysian Exchange Not mandatory but LCH used
regularly
Central Bank
intervention
Through appointed agent banks Not applicable
Fixing to settle
NDF
NA KL USDMYR Reference rate
Trading Hours - Trading hour is 9 AM to 6 PM Local
Time Limited FX liquidity
available for non-residents post local
trading hours
- USDMYR is also quoted by
appointed overseas offices for spot
value only for any underlying asset
trades - post local trading hours No
forward prices are quoted
Quoted across time zones
Taxation and
Repatriation of FX
Gains
All gains on cancelled FX Contracts
are freely repatriable and do not
attract taxation in Malaysia
Taxed based on jurisdiction
93
IV USD-IDR Market - Indonesia
Onshore Deliverable Offshore Non-Deliverable Onshore Non-Deliverable
Market
Turnover
Average
daily spot
turnovers
USD 1bn
Average
daily swap
turnovers
USD 500
million
As per LCH Ltd - the
daily turnover of
USDIDR NDF cleared
by them on April 16
2019 is a total of USD
41 billion from 832
trades
As per SEF USDIDR
turnover as on April 12
2019 is USD 33 million
from 11 trades (Source
SEF)
As per HKTR Jan 2018
reporting the outstanding
IDR NDF turnover on
the Hong Kong exchange
of is around USD 40
billion (Source HKMA
NDF report 2018)
NDF
average size
USD 5m
Access to
Domestic
participants
Foreign currency against IDR
transactions between banks and
domestic parties over a certain
amount must have an underlying
transaction
Not Allowed Allowed but will need to
demonstrate underlying
documents
Access to
Offshore
participants
Non-residents must have
underlying IDR
assetliabilityreceivablepayable
to be able to enter into IDR cash
FX andor FX hedge BI list all the
permissible underlying activities
along with recommended
documentation format
Open and not regulated by
Bank Indonesia
Allowed but will need to
demonstrate underlying
documents
BI published a more-
stringent list of
permissible underlying
activities
Benefits Pricing uses onshore-curve
driven by onshore participants
and BI intervention
Not regulated and no
need for underlying
documentation
Prices available across
time zones
Can generated IDR
exposures without
having an underlying
asset in IDR
Pricing uses onshore-
curve driven by onshore
participants and BI
intervention (explanation
below) BI appears to
have a much bigger-
capacity to manage since
the product is net-settled
in IDR
94
Source Bank Indonesia BIS HSBC Research
Clients with IDR FX
exposure but no urgent
need for principal-
exchange As example
long-term IDR bond
investors
Limitations Requirement for underlying
docs limit the maximum
exposure that foreign Clients
can take
BI restricts Domestic Banks
from having residual-risk
when dealing Derivatives with
Related-Parties (locally
incorporated banks only)
Convertibility risk Requirement for
underlying docs limit the
maximum exposure
Foreign Clients can take
Clients with actual need
for principal-exchange
due to basis-risk between
[JISDOR fixing] vs
[actual FX rate] eg
Coupon repatriation and
BI restricts domestic
banks from having
residual-risk when
dealing derivatives with
related parties (locally
incorporated banks only)
Central
Bank
intervention
BI intervenes only in the onshore
market via Cash FX Onshore DF
and Onshore DNDF These can
be done via auctions or bilateral
OTC trades as there is no
onshore futures market for IDR
Bank Indonesia does not
access the NDF market
BI has the ability to intervene
in the DNDF market
although the market is very
new
Fixing to
settle NDF
Not Applicable JISDOR (USD-IDR)
JISDOR (USD-IDR)
Trading
Hours
Trading hours is from 8 AM ndash
12 PM Local Time and 1 PM
ndash 4 PM (Market breaks for
lunch between 12 PM ndash 1
PM)
USD-IDR is also quoted by
banks offshore for Spot value
only for any underlying asset
trades post local trading hours
No Forward prices are quoted
Quoted across time zones 8 AM ndash 12 PM Local
Time 1 PM ndash 4 PM
(Market breaks for lunch
between 12 PM ndash 1 PM)
Taxation
and
Repatriation
of FX Gains
As per market practice gains on
any unwindcancellation of FX
hedges are not passed to Non-
Residents
Taxed as per jurisdiction As per market practice gains
on any unwindcancellation
of FX hedges are not passed
to Non-Residents
95
V USD-BRL Market - Brazil
Features Onshore Deliverable Offshore Non-Deliverable
Market Features Average daily spot USD 8 billion
Onshore B3 USD 14 billion
Average daily options
turnovers
USD 15 billion
Offshore NDF
turnover daily
USD 4
billion
Market Hours Market hours is 0900 to 1800 Hours
However liquidity is highest between 10
am ndash 12 pm and 2 pm ndash 4 pm local
hours
96
VI USD-TWD Market - Taiwan
Features Onshore Deliverable Offshore Non-Deliverable
Market
Features Average Daily
Spot
Turnovers
USD 3-4 billion
Average Daily
Swap
turnovers
USD 2-3 billion
Average
Options
Turnovers
USD 150 million
Average daily
turnovers
USD 2-4 billion
Market
Turnovers
- Onshore total Spot turnovers in
USDTWD for March 2019 were USD
31560 billion (Average daily turnover of
~ USD 10 billion)
- Data related to USDTWD swaps is not
readily available but total swaps amp
forwards dealt onshore (across currency
pairs) is ~ 5750 of the FX turnovers
USD 11504 billion in April 2016 (last
available data) [Source BIS]
Access to
Domestic
participants
There are no limits on the TWDrsquos trading
range versus other currencies but there are
convertibility limits on the capital account
- Access to domestic participants are
not allowed
- Local banksrsquo overseas branches to
participate in the TWD NDF
market These banks will also be
subject to the existing cap on net
NDF positions at 20 per cent of
each bankrsquos FX position (last
revised lower from 33 per cent in
December 2010)
Access to
Offshore
participants
Non-Resident
Foreign investors are allowed to enter
into onshore swapforward contracts for
hedging underlying investment in
Taiwan
FINIs (Foreign Institutional Investors)
can only conduct buy USDsell TWD
contract and the total contract amount
entered into by a foreign investor should
not exceed FINIs USD and TWD net
remitted-in capital (ie total remitted-in
funds minus total remitted-out funds)
Access to foreign exchange is divided
into three categories
- import and export
Open and not regulated by the central
bank
97
- cost of trade-related services
- Investments capital repatriation and
dividends
Currency options are permitted
For FINIsFIDIs all transactions must be
documented regardless of the amount
On the maturity of FX forward (or
forward leg of a swap deal) FINI may
have the following decisions
- To settle the contract on the maturity
day as originally dealt In this case
FINI needs to ensure sufficiency of
existing account balance That is
settlement of FX forward should
come from the existing funds in
Taiwan or funds from sale proceeds
of underlying investments
- To extend (ie rollover) the contract
to another period in this case on the
maturity day FINI has to settle the
difference between the original
forward contract rate and the mark-
to-market rate
If FINI rollovers the contract upon
maturity and incurs a gain upon rollover
the gain will be credited to the FINIs
account in Taiwan Such gain will be
treated as other income derived in
Taiwan
CCP used Taipei Exchange (TPEx) acts as the Central
Counter Party for and also covers all foreign
exchange transactions made by authorized
foreign exchange banks and offshore banking
units
Not mandatory but LCH used regularly
Central Bank
intervention
Central bankrsquos FX intervention is via agent
banks in the OTC market where onshore
TWD is traded One of the mechanisms
through which local currency pressure is
absorbed is through modulation of hedge
ratio of Lifers
Not applicable
Fixing to
settle NDF
NA Central bankrsquos FX intervention is via
agent banks in the OTC market where
onshore TWD is traded
Bloomberg TRY11ltIndexgt
Trading
Hours
- 9 AM ndash 4 PM Local Time
- Market breaks for lunch at 12 PM ndash 2 PM
Quoted across time zones
98
Source CBC BIS HSBC Research
Taxation and
Repatriation
of FX Gains
If FINI rollovers the contract upon
maturity and incurs a gain upon rollover
the gain will be credited to the FINIs
account in Taiwan Such gain will be
treated as other income derived in
Taiwan and therefore subject to 20
standard withholding tax In case that FX
loss incurs due to rollover FINI may
arrange funding to cover the loss if
necessary
FINI can choose one of the following
methods to calculate and pay for the
relevant tax Please however note that
the method is not changeable once it is
decided If FINI does not confirm which
method to be used the option 1) will be
applied
- Withhold related tax on FX gain
from each rollover or
- Netting FX gainslosses from
rollover within the same year or
- Netting FX gainslosses from
rollover and the total remitted-in
principals revaluation gainloss in
the year
If the foreign investor adopts option 2) or
3) above they must appoint or contact
their existing local tax agent (if any) in
Taiwan to file annual tax return
Taxed based on jurisdiction
99
Annexure II
Appendix to Chapter 3
A bivariate BEKK-GARCH (11) model as proposed by Engle and Kroner (1995) can be specified with
the system of conditional mean equations consists of VAR(p) models (p = 1 n) as given in eq (1) and
variance equation as in eq(2)
119884119905 = 120583 + sum Γ119894119884119905minus119894 + 120576119905119901119894=1 (1)
where 119884119905 = (1199101119905 1199102119905) 1199101119905 is exchange rate return in onshore market and 1199102119905 is exchange rate return in
offshore market at time t The parameter vector 120583 = (1205831 1205832) represents constants and Γ is a 2times2 matrix of
autoregressive terms The diagonal elements 120574119894119894 measure own lagged effect of the variables while the off-
diagonal elements 120574119894119895 capture the mean spillover from variable i to variable j
Taking into account the asymmetric responses of volatility ie volatility tends to increase more in response
to negative shocks (bad news) than positive shocks (good news) in the variances and covariances as
proposed by Kroner and Ng (1998) a BEKK representation of conditional variance equation can be written
as
119867119905 = 119862prime119862 + 119860prime120576119905minus1prime 120576119905minus1119860 + 119861prime119867119905minus1119861 + 119863prime120585119905minus1
prime 120585119905minus1119863 (2)
where 120585119905 would be 120576119905 if it is negative and zero otherwise The Eq (2) can be written in matrix form as
follows
119867119905 = [11988811 011988821 11988822
] + [11988611 11988612
11988621 11988622]
prime
[1205761119905minus1
2 1205761119905minus11205762119905minus1
1205762119905minus11205761119905minus1 1205762119905minus12 ] [
11988611 11988612
11988621 11988622]
+ [11988711 11988712
11988721 11988722]
prime
[ℎ11119905minus1 ℎ12119905minus1
ℎ21119905minus1 ℎ22119905minus1] [
11988711 11988712
11988721 11988722]
+ [11988911 11988912
11988921 11988922]
prime
[1205851119905minus1
2 1205851119905minus11205852119905minus1
1205852119905minus11205851119905minus1 1205852119905minus12 ] [
11988911 11988912
11988921 11988922]
In the above model the dynamic process of 119867119905 is a linear function of its own lagged values lagged squared
innovations and the cross-product of the innovations and asymmetric terms Volatility transmission
channel between onshore and offshore markets is represented by the off-diagonal parameters in matrices A
and B while the diagonal parameters in those matrices capture the effects of their own past shocks and
volatility The diagonal parameters in matrix D measure the response own past negative shocks while the
100
off-diagonal parameters 119889119894119895 show the response of one market to the negative shocks in the another market
to be called the cross-market asymmetric responses
MGARCH-BEKK Parameter Estimates
Spot and 1-Month NDF 1-Month Forward and NDF 1-Month Futures and NDF
Variable Coeff P-value Variable Coeff P-value Variable Coeff P-value
Mean Equation
DSPOT(-1) -063 000 DFW1M(-1) -064 000 DFUT1M(-1) -063 000
DSPOT(-2) -052 000 DFW1M(-2) -054 000 DFUT1M(-2) -053 000
DSPOT(-3) -031 000 DFW1M(-3) -033 000 DFUT1M(-3) -033 000
DSPOT(-4) -015 000 DFW1M(-4) -018 000 DFUT1M(-4) -019 000
DSPOT(-5) -010 000 DFW1M(-5) -012 000 DFUT1M(-5) -010 000
DNDF1M(-1) 062 000 DNDF1M(-1) 063 000 DNDF1M(-1) 062 000
DNDF1M(-2) 047 000 DNDF1M(-2) 049 000 DNDF1M(-2) 048 000
DNDF1M(-3) 030 000 DNDF1M(-3) 033 000 DNDF1M(-3) 035 000
DNDF1M(-4) 022 000 DNDF1M(-4) 023 000 DNDF1M(-4) 027 000
DNDF1M(-5) 013 000 DNDF1M(-5) 015 000 DNDF1M(-5) 016 000
Constant 001 029 Constant 001 003 Constant 001 013
DSPOT(-1) 013 000 DFW1M(-1) 013 000 DFUT1M(-1) 011 001
DSPOT(-2) 003 053 DFW1M(-2) 002 046 DFUT1M(-2) 000 098
DSPOT(-3) 005 042 DFW1M(-3) 003 033 DFUT1M(-3) 002 064
DSPOT(-4) 005 033 DFW1M(-4) 005 015 DFUT1M(-4) 004 041
DSPOT(-5) 002 067 DFW1M(-5) 001 068 DFUT1M(-5) 002 058
DNDF1M(-1) -009 000 DNDF1M(-1) -009 000 DNDF1M(-1) -009 001
DNDF1M(-2) -007 015 DNDF1M(-2) -007 003 DNDF1M(-2) -005 022
DNDF1M(-3) -005 033 DNDF1M(-3) -004 012 DNDF1M(-3) -002 065
DNDF1M(-4) 001 086 DNDF1M(-4) 001 076 DNDF1M(-4) 003 052
DNDF1M(-5) 001 079 DNDF1M(-5) 002 052 DNDF1M(-5) 001 067
Constant 001 038 Constant 001 011 Constant 001 017
Variance Equation
C(11) 005 000 C(11) 005 000 C(11) 003 000
C(21) 005 000 C(21) 005 000 C(21) 003 000
C(22) -001 004 C(22) 001 000 C(22) 005 000
A(11) 027 000 A(11) 027 000 A(11) 014 000
A(12) 004 042 A(12) 005 032 A(12) -012 004
A(21) -004 029 A(21) -004 034 A(21) 007 010
A(22) 019 000 A(22) 018 000 A(22) 029 000
B(11) 096 000 B(11) 096 000 B(11) 098 000
B(12) -001 020 B(12) -002 003 B(12) 003 004
B(21) 001 037 B(21) 001 029 B(21) -001 048
B(22) 098 000 B(22) 098 000 B(22) 094 000
D(11) -023 001 D(11) 027 000 D(11) 020 001
101
D(12) -037 000 D(12) 035 000 D(12) 024 000
D(21) 022 000 D(21) -025 000 D(21) -016 000
D(22) 028 000 D(22) -028 000 D(22) -012 006
102
Annexure III
Evolution of Onshore Exchange Traded Currency Derivatives Market
Exchange Traded Currency Derivatives (ETCD) were launched in August 2008 in India with the
introduction of futures contracts on US Dollar-Rupee currency pair as the underlying
Subsequently in the year 2010 Rupee future contracts were allowed to trade against three other
currencies viz Euro Pound sterling and Japanese yen The options contracts were introduced on
US Dollar-Rupee currency pair in year 2010 The Reserve Bank of India (RBI) and Securities
Exchange Board of India (SEBI) allowed participation for all resident individuals including
corporates Trading Members and Banks in proprietary capacity on ETCD
In the year 2012 it was decided to lower the open position limits for banks on the back of volatility
in rupee and to exclude the positions in ETCD from Net Overnight Open Position Limit (NOOPL)
Thereafter in the year 2013 the Rupee depreciated sharply against USD due to huge capital
outflows in both equity and debt markets expectation of unwinding of Quantitative Easing by US
FED and increase in current account deficit Additionally the open position limits for the
participants were decreased and banks were restricted from participating on their own accounts in
the ETCD market further the participants were also prohibited from taking positions beyond
USD 10 million
In June 2014 Banks were allowed to engage in proprietary trading in ETCD markets Domestic
participants were allowed to have open position beyond USD 15 million subject to the evidence
of underlying exposure In 2018 this limit was raised to USD 100 million across all currency pairs
involving INR put together and combined across all exchanges
Foreign Portfolio Investors (FPI) and Non-Resident Indians (NRIs) were permitted to participate
in ETCD markets for hedging currency risk arising out of their investments in India in 2014 and
2017 respectively In February 2018 SEBI and RBI permitted currency derivatives on cross
currency pairs - EURUSD GBPUSD and USDJPY- and currency options on EURINR GBPINR
and JPYINR In December 2018 weekly options on US Dollar - Indian Rupee currency pair were
permitted As on date derivatives are available on seven currency pairs - USDINR EURINR
GBPINR JPYINR EURUSD GBPUSD and USDJPY
103
The exchange traded currency derivatives draws participation from diverse categories of
participants Some of the key participant categories include banks corporates trading members
foreign investors and other investors The following are the turnover of exchanges
FY National Stock Exchange of India (All figures in USD billions)
USD-INR futures USD-INR Options
(Notional turnover)
USD-INR Options
(Premium )
2014-15 32630 12618 052
2015-16 37374 26600 092
2016-17 31887 35271 107
2017-18 33818 37714 117
2018-19 57913 54183 204
FY
BSE (All figures in USD billions)
USD-INR futures USD-INR Options
(Notional turnover)
USD-INR Options
(Premium)
2014-15 20740 9609 081
2015-16 27713 13772 044
2016-17 27521 21034 045
2017-18 30146 37552 041
2018-19 45956 59350 051
FY Metropolitan Stock Exchange of India (All figures in USD billions)
USD-INR futures USD-INR Options
( Notional turnover )
USD-INR Options
( Premium )
2014-15 18274 593 593
2015-16 8433 646 646
2016-17 8233 367 367
2017-18 3032 491 491
2018-19 1060 245 245
104
Present Regulatory Framework (client limits open interest limits need for underlying
exposure etc)
a) Position limits for different client categories for FCY-INR currency pairs
bull Position limits of clients and Category III FPIs- The gross open positions of the client
across all contracts in the respective currency pairs shall not exceed the limits as mentioned
below
Currency Pairs
Position limits
USD-INR Gross open position across all contracts shall not exceed
6 of the total open interest or USD 10 million whichever
is higher
EUR-INR Gross open position across all contracts shall not exceed
6 of the total open interest or EUR 5 million whichever
is higher
GBP-INR Gross open position across all contracts shall not exceed
6 of the total open interest or GBP 5 million whichever
is higher
JPY-INR Gross open position across all contracts shall not exceed
6 of the total open interest or JPY 200 million whichever
is higher
bull Proprietary position limits of non-bank stock brokers- The gross open positions of the
proprietary account across all contracts in the respective currency pairs shall not exceed
the limits as mentioned below
Currency Pairs
Position limits
USD-INR Gross open position across all contracts shall not exceed 15
of the total open interest or USD 50 million whichever is
higher
EUR-INR Gross open position across all contracts shall not exceed 15
of the total open interest or EUR 25 million whichever is
higher
GBP-INR Gross open position across all contracts shall not exceed 15
of the total open interest or GBP 25 million whichever is
higher
JPY-INR Gross open position across all contracts shall not exceed 15
of the total open interest or JPY 1000 million whichever is
higher
105
bull Position limits of stock brokers (bank and non-bank) Category I and II FPIs- The
gross open positions of trading members across all contracts in the respective currency
pairs shall not exceed the limits as mentioned below
Currency Pairs
Position limits
USD-INR Gross open position across all contracts shall not exceed
15 of the total open interest or USD 100 million
whichever is higher
EUR-INR Gross open position across all contracts shall not exceed
15 of the total open interest or EUR 50 million whichever
is higher
GBP-INR Gross open position across all contracts shall not exceed
15 of the total open interest or GBP 50 million whichever
is higher
JPY-INR Gross open position across all contracts shall not exceed
15 of the total open interest or JPY 2000 million
whichever is higher
Domestic clients shall ensure that the position across exchanges is within the prescribed
limit of USD 100 million equivalent If position is in excess of USD 100 million
equivalent clients are required to provide disclosure of underlying exposure to Trading
Member as per existing practice
bull Proprietary positions created in FCY-INR pairs (USD-INR EUR-INR GBP-INR
and JPY-INR)
Single INR limit for proprietary
position for bank stock broker
Single INR limit for proprietary
position for non-bank stock broker
Higher of 15 of total OI across all
FCY- INR pairs or USD 200 million
Higher of 15 of total OI across all
FCY-INR pairs or USD 100 million
b) Position limit for Cross Currency Derivatives are given below
bull Position limits for stock brokers (banks and non-bank) Category I amp II FPIs
Domestic Institutional investors (DIIs) as permitted by the respective sectoral
regulators and AD Category-I banks-
106
Currency Pairs
Position limits
EUR-USD Gross open position across all contracts shall not
exceed 15 of the total open interest or EUR 100
million whichever is higher
GBP-USD Gross open position across all contracts shall not
exceed 15 of the total open interest or GBP 100
million whichever is higher
USD-JPY Gross open position across all contracts shall not
exceed 15 of the total open interest or USD 100
million whichever is higher
The aforementioned limits shall be the total limits available to the stock brokers for
taking positions on proprietary basis and for positions of their clients
bull Position limit for proprietary position of non-bank stock brokers-
Currency Pairs
Position limits
EUR-USD Gross open position across all contracts shall not
exceed 15 of the total open interest or EUR 50
million whichever is higher
GBP-USD Gross open position across all contracts shall not
exceed 15 of the total open interest or GBP 50
million whichever is higher
USD-JPY Gross open position across all contracts shall not
exceed 15 of the total open interest or USD 50
million whichever is higher
bull Position limits for Clients and Category III FPIs-
Currency Pairs
Position limits
EUR-USD Gross open position across all contracts shall not
exceed 6 of the total open interest or EUR 10
million whichever is higher
GBP-USD Gross open position across all contracts shall not
exceed 6 of the total open interest or GBP 10
million whichever is higher
USD-JPY Gross open position across all contracts shall not
exceed 6 of the total open interest or USD 10
million whichever is higher
107
Annexure IV
Comparison of onshore and offshore Rupee derivatives volumes
1 Exchange Traded Market
All figures in USD billions
Table Comparison between onshore and offshore exchange traded INR-USD Futures
FY Onshore Offshore Market Share
BSE NSE MSEI Total DGCX SGX CME Total Onshore Offshore
2014-15 21115 32491 9433 63040 31704 3704 396 35804 6378 3622
2015-16 27904 37241 4539 69685 32725 13906 1001 47631 5940 4060
2016-17 26528 31799 4300 62626 34149 17164 1636 52949 5419 4581
2017-18 30360 33729 1761 65851 33458 28047 5232 66737 4967 5033
2018-19 44820 57237 648 102705 35452 37599 7475 80526 5605 4395
Note-
i Data for BSE NSE amp MSEI is from Exchange websites for USDINR Futures
ii Data for DGCX SGX and CME is from Bloomberg and India INX Research
iii Data for DGCX includes INRUSD Futures (including mini contract) but excludes the USDINR Index
Quanto futures
iv Data for CME includes the Mini and Micro contracts
v Data for FY 2018-19 is from April 01 2018 to March 22 2019
2 OTC Market (as per BIS Quarterly Review December 2016)
108
Annexure V
Meetings held by the Task Force
Sr No Date Venue External Participants Invited
1 March 19 2019 RBI Mumbai
2 March 25 2019 RBI Mumbai -Shri Ananth Narayan Professor SPJMIR
-FEDAI
-Select corporates
3 April 04 2019 RBI Mumbai -Shri G Padmanabhan Former Executive
Director RBI
-Dr V Anantha Nageswaran Dean IFMR
Chennai
-GIFT City IFSC
-National Stock Exchange Ltd
-BSE Ltd
4 April 23 2019 RBI Mumbai -Select FPIs (through audio conference)
5 May 14 2019 RBI Mumbai -Select FDIs (through audio conference)
6 May 31 2019 RBI Mumbai -Shri G Padmanabhan Former Executive
Director RBI
-FIMMDA
-CCIL
-IBA
7 June 20 2019 RBI Mumbai -Smt Shyamala Gopinath Former Deputy
Governor RBI
8 July 04 2019 SEBI Mumbai -Shri G Padmanabhan Former Executive
Director RBI
9 July 10 2019 RBI Mumbai -Smt Shyamala Gopinath Former Deputy
Governor RBI
109
Annexure VI
References
A Santaella Julio (2015) ldquoCurrency carry trades in Latin Americardquo Bank for International
Settlements BIS Paper No 81
Behera Harendra Kumar (2011) ldquoOnshore and offshore market for Indian rupee recent evidence
on volatility and shock spilloverrdquo Macroeconomics and Finance in Emerging Market Economies
Vol 4 No 1 March 2011 pp 43ndash55
Cadarajat Yayat and Lubis Alexander (2012) ldquoOffshore And Onshore IDR Market An Evidence
On Information Spilloverrdquo Bulletin of Monetary Economics and Banking April 2012
Capital Account Safeguard Measures in the ASEAN Context (2019) ASEAN Working Committee
on Capital Account Liberalisation Bank Indonesia Occasional Papers OP12019
Colavecchio Roberta and Funke Michael (2006) ldquoVolatility transmissions between renminbi and
Asia-Pacific onshore and offshore US dollar futuresrdquo BOFIT Discussion Papers Bank of
Finland Institute for Economies in Transition No16
Darbha Gangadhar (2012) ldquoA Tale of One Asset and Two Markets ndash Analysis of Dynamic
Interactions between On- and - Off Shore Marketsrdquo macrofinancenipfporginPDF13-
11sl_Darbha_NDFNimranapdf
DING David K Tse Y and Williams M The Price Discovery Puzzle in Offshore Yuan
Trading Different Contributions for Different Contracts (2012) Financial Management
Association International Conference Research Collection Lee Kong Chian School Of Business
Doukas J and H Zhang (2013) ldquoThe performance of NDF carry tradesrdquo Journal of International
Money and Finance vol 36 September pp 172ndash90
Goyal R R Jain and S Tewari (2013) Non deliverable forward and onshore Indian rupee market
a study on inter-linkages Reserve Bank of India Working Paper Series 112013 December
Guru Anuradha (2009) ldquoNon-Deliverable Forwards Market for Indian Rupee An Empirical
Studyrdquo Indian Journal of Economics and Business Vol 8 No 2 pp 245-260
Higgins Patrick and Owen F Humpage (2005) ldquoNondeliverable Forwards Can We Tell where
the Renminbi Is Headedrdquo Federal Reserve Bank of Cleveland September
Hutchison Michael Jake Kendall Gurnain Pasricha Nirvikar Singh (2009) ldquoIndian Capital
Control Liberalisation Evidence from NDF Marketsrdquo NIPFP Working Paper No 200960
110
Indira Gandhi Institute of Development Research (IGIDR) Finance Research Group (2016)
ldquoFeatures and trends of NDF markets for emerging economy currencies a study of the Indian
rupeerdquo IGIDR working paper March
Ishii Shogo İnci Oumltker-Robe and Li Cui 2001 Measures to Limit the Offshore Use of
Currencies Pros and Cons IMF Working Paper WP0143
Lipscomb Laura (2005) ldquoAn Overview of Non-Deliverable Foreign Exchange Forward Marketsrdquo
Federal Reserve Bank of New York May
Ma G C Ho and R McCauley (2004) The markets for non-deliverable forwards in
Asia BIS Quarterly Review June pp 81-94
Maziad Samar and Kang Joong Shik RMB Internationalization OnshoreOffshore Links (May
2012) IMF Working Paper No 12133
McCauley R C Shu and G Ma (2014) ldquoNon-deliverable forwards 2013 and beyondrdquo BIS
Quarterly Review March pp 75ndash88
McCauley RN Shu C (2016) ldquoNon-deliverable forwards impact of currency internationalisation
and derivatives reformrdquo Technical report Bank of International Settlements
McCauley Robert N and Scatigna Michela Foreign Exchange Trading in Emerging Currencies
More Financial More Offshore (March 2011) BIS Quarterly Review March 2011
Misra Sangita and Behera Harendra (2006) ldquoNon Deliverable Foreign Exchange Forward
Market An Overviewrdquo RBI Occasional Papers Vol 27 No3
Park Jinwoo (2001) ldquoInformation flows between non-deliverable forwards (NDF)and spot
markets Evidence from Korean currencyrdquo Pacific Basin Finance Journal Vol 9 (4) pp363-377
Ryoo Sangdai and Kwon Taeyong and Lee Hyejin Foreign Exchange Market Developments
and Intervention in Korea (October 2013) BIS Paper No 73o
Sarwono Hartadi A (2005) ldquoIndonesian policy on non-residentsrsquo participation in the money
market the restriction of rupiah transactions by non-residents and foreign currency credit offered
by banks to non-residentsrdquo BIS Paper No 23
Standing Council on International Competitiveness of the Indian Financial System (2015)
International competitiveness of currency equity and commodity derivatives markets Department
of Economic Affairs Ministry of Finance
Wang Kai-Li Fawson Christopher and Chen Mei-Ling (2007) ldquoInformation Flows among
Exchange Rate Markets What Do We Learn From Non-Deliverable Forward Markets in Asiardquo
Chaoyang University of Technology October
111
Watanabe K H Akama and J Mifune (2002) ldquoThe effectiveness of capital controls and
monitoring the case of non-internationalisation of emerging market currenciesrdquo EMEAP
Discussion Paper January
6
NDF ndash Non Deliverable Forward
NOOPL ndash Net Overnight Open Position Limit
NRI ndash Non Resident Indian
NSE ndash National Stock Exchange
OIS ndash Overnight Indexed Swaps
OTC ndash Over the Counter
PBoC ndash Peoplersquos Bank of China
RBI ndash Reserve Bank of India
RMB ndash Renminbi
SEBI ndash Securities and Exchange Board of India
SFEMC ndash The Singapore Foreign Exchange Markets Committee
SGX ndash Singapore Exchange
SNRR ndash Special Non-Resident Rupee Account
TF ndash Task Force on Offshore Rupee Market
TWD ndash Taiwanese Dollar
USD ndash United States Dollar
7
Acknowledgements
The Report of the lsquoTask Force on Offshore Rupee Marketsrsquo was made possible with the support
of a number of individuals and organisations The Task Force would like to gratefully acknowledge
representatives of various banks financial institutions large corporates in India and abroad
foreign portfolio investors asset managers industry bodies experts and practitioners who
interacted with the Task Force and provided their valuable inputs and suggestions
The Task Force greatly benefitted from the experience of Smt Shyamala Gopinath former Deputy
Governor Reserve Bank of India and Shri G Padmanabhan former Executive Director Reserve
Bank of India who took time out of their busy schedules to attend the meetings of the Task Force
as special invitees
The Task Force benefitted from the interactions with Dr T V Somanathan IAS Additional Chief
Secretary Government of Tamil Nadu Shri R Sridharan Managing Director CCIL Dr V
Anantha Nageswaran Dean IFMR Chennai Shri Ananth Narayan Associate Professor SPJIMR
Dr A K Nag Shri Himadri Bhattacharya and Shri Jamal Mecklai CEO Mecklai Financial
Services
The Task Force invited submissions from members of the public and is grateful for several helpful
suggestions received
The Task Force also places on record the assistance provided by Shri Subrat Kumar Seet Director
and Smt Priyanka Sachdeva Manager from Department of Economic and Policy Research
Reserve Bank of India and Shri Hiren Sanghvi Director and Shri Saket Banka Associate Director
from HSBC India The Task Force specifically acknowledges the contribution of Shri Harendra
Behera Assistant Adviser Department of Economic and Policy Research Reserve Bank of India
in research on lsquoLinkages between Offshore and Onshore Rupee Marketsrsquo undertaken in
collaboration with Shri Sajjid Chinoy Chief Economist J P Morgan India
Finally the Task Force would like to commend the efforts put in by the Secretariat team from the
Financial Markets Regulation Department Reserve Bank of India led by Shri Supriyo
Bhattacharjee Deputy General Manager and supported by Shri Nitin Daukia Manager
Meticulous organisation of meetings by Smt Supriya Devalekar Assistant Manager and Shri
Kaivalya Sakalgaonkar Assistant from the Secretariat team is also appreciated
8
Preface
Offshore markets in a non-convertible currency usually referred to as non-deliverable forward
(NDF) markets enable trading of the non-convertible currency outside the influence of the
domestic authorities These contracts are settled in a convertible currency usually US Dollars as
the non-convertible currency cannot be delivered offshore Historically NDF markets evolved for
currencies with foreign exchange convertibility restrictions and controlled access for non-
residents beginning with countries in South America like Mexico and Brazil and thereafter
moving on to emerging Asian economies viz Taiwan South Korea Indonesia India China
Philippines etc Apart from enabling trading in non-convertible currencies NDF markets have
also gained in prominence because of onshore regulatory controls and their ease of access
Reserve Bank has been guided by the objective of developing a deep and liquid on-shore foreign
exchange market that acts as a price setter globally With regard to non-resident entities having
legitimate exposure to the Rupee the focus of policy efforts has been to align incentives for non-
residents to gradually move to the domestic market with adequate safeguards to ensure the
external stability of the value of the Rupee
The sharp growth in the offshore trading volumes in the Rupee NDF market in recent years likely
even beyond the volumes in the onshore markets have raised concerns around the forces that are
determining the value of the rupee and the ability of authorities to ensure currency stability This
necessitates a deeper understanding of the causes underlying the growth in those markets and
identification of measures to reverse the trend
The Task Force on Offshore Rupee Markets was set up to address that concern It was mandated
to study the factors attributable to the growth of the offshore Rupee market its effects on the Rupee
exchange rate and onshore market liquidity and formulate measures to redress the concerns The
Task Force was also charged to examine the role if any that International Financial Services
Centres (IFSCs) can play in addressing these concerns
During its term the Task Force interacted with a wide variety of stakeholders including banks
financial institutions industry bodies foreign portfolio investors asset managers and
academicians
9
I trust that the Reserve Bank of India will find the recommendations made in the report useful
Usha Thorat
Chairperson
10
Executive Summary
The origin of the NDF markets may be traced back to the 1990s when a wave of capital account
liberalisation in emerging market economies (EMEs) triggered a surge in capital inflows to these
economies and consequently heightened the currency risk faced by foreign investors Under-
developed domestic markets especially the market for financial derivatives as well as controlled
access to onshore markets raised the demand for a currency market outside the reach of local
regulations Another trend that supported the growth of the NDF market was the sharp rise
globally in the size of derivatives markets in the 1980s and 1990s As derivatives markets evolved
the speculative search for underlying moved out of the developed world into more esoteric assets
Following the successful speculative attack on the Sterling in 1992 EME currencies became viable
subjects for such speculative positioning Such activity becomes particularly noticeable during
times of stress as offshore risk spills over to the domestic exchange rate through entities that have
a presence in both onshore and offshore markets usually global banks but also corporates
A study of the degree and direction of such spillovers is important to understand the role of NDF
markets and assess policy alternatives The econometric study conducted by the Task Force
observed that the influence between offshore and onshore exchange rate goes both ways in normal
times that is it is bidirectional The study also observed that during the last two stress episodes
(the taper tantrum and the 2018 emerging markets crisis) the relationship turned unidirectional
with the NDF market driving onshore exchange rate The study concludes that as NDF volumes
have increased they have begun to play an important role in both price discovery and driving
volatility particularly during heightened uncertainty period The study also shows that periods of
divergence are limited and the markets converge and that too fairly rapidly
Against this backdrop and in the light of available information results of the statistical analysis
and most importantly based on the feedback received during the various consultations the Task
Force is making following recommendations in accordance with the terms of reference
i Onshore market hours may be suitably extended to match the flexibility provided by the
offshore market and thereby incentivize non-residents to hedge in the onshore market
ii Banks may be allowed to freely offer prices to non-residents at all times out of their Indian
books either by a domestic sales team or by using staff located at overseas branches
11
iii Non-deliverable Rupee derivatives (with settlement in foreign currency) may be allowed
to be traded in the IFSC and IBUs may be allowed to deal in such derivatives with a distinct
FCY-INR position limit To start with exchange traded currency derivatives involving
Rupee may be introduced and with experience non-deliverable OTC currency derivatives
involving Rupee may be allowed subsequently
iv While requirement of underlying exposure will continue for trading in the onshore market
users may be allowed to undertake positions up to USD 100 million in OTC as well as
exchange traded currency derivative market without having to establish the underlying
exposure
v The TF endorses the principle-based regulatory approach adopted in the draft regulation
on hedging by non-residents released by the RBI on February 15 2019 Also back-to-back
hedging by non-residents proposed under these draft regulations is endorsed Further in
case of hedging of anticipated exposures gains from cancellation of contract may be
allowed to be passed on even in cases where there are no cash flows at the discretion of
the bank where the bank considers the cancellation of underlying cash flow is due to
external factors which are beyond the control of the user
vi For ease of entering into hedge transactions for non-residents the TF recommends
a Establishment of a central clearing and settlement mechanism for non-residentsrsquo
deals in the onshore market
b Implementation of margin requirement for non-centrally cleared OTC derivatives
in the onshore market at the earliest
c Allow Indian banks to post margin outside India
d Wider access to FX-Retail trading platform to non-residents
vii A technology-based solution may be explored to centrally aggregate the investments of
non-residents and derivative contracts entered into by them in the onshore market (both
OTC and exchange traded) using LEI or any other unique identifier to start with
viii The issue of taxation in respect of foreign exchange derivative contracts may be examined
with the objective of overcoming gaps between tax regime in India and other major
international financial centres to the extent possible
ix KYC registration may be centralized across the financial market with uniform
documentation requirement
12
Chapter 1
Introduction
Currency is a component of sovereign money which is legal tender issued by the state The
external value of the currency the exchange rate is one of the most important economic and policy
variables which affects economic incentives and activity The exchange rate is determined mostly
by market forces of supply and demand which influence its flows across international borders
The exchange rate has critical information value in guiding financial and economic decisions
which affect real economic variables The stability and predictability of the exchange rate also has
a critical influence on growth and financial stability
Cross-border trade in goods services and assets (or capital) necessitates exchange of one currency
into another and can be thought of as the primary reason why currency markets exist However
as in any other financial market speculative elements ndash who take positions not for settling any
underlying transactions but for benefitting from market movements ndash are important participants
who perform the function of imparting depth to the market The aggregate actions of all
participants ndash hedgers arbitrageurs as well as speculators - determine the value and fluctuation of
the exchange rate
The currency markets for rupee especially for exchange against the USD are fairly well-
developed today One can classify these markets in three categories (a) spot versus derivatives
(b) over-the-counter (OTC) versus exchange-traded and (c) onshore versus offshore Further
derivatives can be cash-settled or delivery-based The most commonly referred benchmark
exchange rate of the rupee is from the onshore spot OTC market Similarly the commonly referred
forward exchange rate of the rupee is from the onshore forward OTC market Rupee futures and
options are traded in some onshore as well as offshore exchanges
The classification of currency markets can also be in terms of the nature of contracts between
buyers and sellers - spot forwards (futures on exchanges) and options contracts A spot contract
is for standard settlement ie the second working day after the date of transaction whereas in
case of forwards and futures (as well as options) the actual exchange or delivery of currency takes
place in the future at a date later than the spot settlement date There are also non-deliverable
forward contracts which are discussed below Forward and futures contracts are used as a risk
management tool or to hedge against possible adverse fluctuation in exchange rates It is important
13
to note that hedging implies risk transfer between the contracting parties it is not elimination of
risk
The category of the currency market that forms the focus of this report is the Offshore Rupee
markets The dominant segment of this market is the Non-Deliverable Forward (NDF) market ndash
wherein foreign exchange forward contracts are traded in the OTC market at offshore locations
generally the International Finance Centres (IFCs) like Singapore Hong Kong London Dubai
and New York These contracts do not involve a physical exchange of Rupees as Rupee is not
deliverable offshore and allow counter-parties to settle profit or loss in a convertible currency
usually the US Dollar which is why it is called a non-deliverable market NDF contracts are
usually traded on currencies which are not readily available to trade globally or outside of
sovereign boundaries These are thus mainly currencies from countries which have partial or no
capital account convertibility
There are also a few exchange-traded offshore rupee markets dealing in rupee futures and options
in Chicago Singapore and Dubai Volumes in these markets have typically been far smaller in
comparison to the offshore NDF OTC market Data on transactions in exchange-traded currency
markets can be ascertained with greater certainty whereas data on transactions in offshore OTC
NDF market have to be gauged through surveys and the estimates on the same are less firm
Why do NDF Markets Exist
NDF markets are not a phenomenon peculiar to the Indian Rupee they are common for currencies
of many emerging market economies (EMEs) As per BIS data NDFs in six currencies ndash Korean
Won Indian Rupee Chinese Renminbi Brazilian Real Taiwanese Dollar and Russian Ruble ndash
account for about two-thirds of the trade in NDFs globally The total daily average volume in NDF
markets is about USD 200 billion as per Bank of International Settlements (BIS) survey1 As per
this survey the share of India was about 1822 per cent of the trade in NDFrsquos globally (see Table
2 Chapter 2) The 2016 BIS survey (the next one will be released in the later part of 2019) showed
that offshore trades in Indian rupee were more or less equal to deliverable onshore forwards
1 2016 Triennial Central Bank Survey of Foreign Exchange and OTC Derivatives Markets
14
around $16 billion daily The 2018 Bank of England reported $23 billion in offshore rupee trades
while RBI sources estimate deliverable daily onshore forwards at $21 billion for 20192
The size of an open economy is one of the primary determinants of international participation in
its currency If international participants do not have direct access to the on-shore currency market
to meet their transaction needs or to hedge their currency exposure they are likely to use the
offshore NDF market The size depth and liquidity of the offshore NDF is thus indicative of the
non-resident interest in an emerging market economy
To some extent the offshore NDF market complements the need for a deep and liquid onshore
currency market What is the appropriate size of the forex market for an emerging market
economy with partially open capital account is determined by its size the share of foreign trade
and appetite for capital flows One proxy for estimating how large the forex market ought to be is
the GDP of the economy A better estimate could be the size of the open economy the trade and
investment sector
As Indiarsquos economy has grown over the past two and a half decades it has seen a significant rise
in openness (ie trade to GDP ratio has grown from 15 in 1990 to 43 in 2018) and in cross
border capital flows This has commensurately raised non-resident interest in the Rupee whether
for risk management purposes or for speculative ends The growing size of the Rupee NDF market
points to a need to widen participation in on-shore markets
The existence and size of offshore NDF markets is also a function of the degree of difficulty that
participants in foreign exchange market (especially non-residents) ndash both speculators and other
participants with requirements arising from cross-border trade transactions ndash face in accessing the
onshore markets The difficulties in accessing onshore currency markets could span a variety of
issues including the following
bull Restrictions on foreign exchange transactions
bull Cumbersome documentation and Know-Your-Customer (KYC) requirements for
participants in the domestic market
bull Restrictions on market participants (especially non-residents) in hedging activities such as
transaction limits tenor limits other documentation etc
bull Restrictions on cancellation and re-booking of contracts
2 For comparison with offshore market the onshore data includes forwards and swaps
15
bull Restrictions on the kind of derivative products that are allowed by market regulators and
bull Inconvenient market hours for those in other time zones
These constraints exist either to curb excessive speculation or to maintain financial stability
Are Offshore Rupee Markets a Problem
When the offshore market volume is significant or larger than the onshore currency market
volume as is the case with many EME currencies it leads to two fragmented markets wherein the
price discovery on the onshore market becomes vulnerable to influences from the price discovery
in the offshore market Empirical evidence (see Chapter 3) shows that while at most times the
direction of the influence runs both ways ie from onshore market to offshore market and vice-
versa the direction of the influence is more dominant from offshore market to the onshore market
in times of high volatility This could happen especially when tidal forces from global financial
markets influence the currency markets in a synchronised manner such as during times of
Emerging Markets (EM) currency crises
There are essentially four issues with regard to offshore market that are critical for regulators ndash
i Effectiveness of exchange rate management Many central banks including the Reserve
Bank have exchange rate stability as one of their objectives and resort to market
intervention or other regulatory measures to control volatility of the exchange rate from
time to time Such influence however extends only to the onshore currency market
Presence of a large offshore market dilutes the effectiveness of the exchange rate
management by the central bank It also hinders the pursuit of the objective of financial
stability in the domestic market
ii Disjointed price discovery During periods of volatility in the currency market when
price discovery in the offshore market causes large movements in onshore currency
markets the onshore market could often open with a large gap over the previous close For
resident market participants who want to cover their positions such gaps expose them to
significant risk
iii Revenue loss Every unit of turnover in a market earns a certain revenue for the market-
making financial firms Thus turnover in the offshore market can be viewed as a potential
revenue loss for domestic financial firms and the domestic economy
16
iv Effectiveness of RBI regulations on capital account management RBIrsquos policies on
capital account have been geared towards managing the impossible trinity a ldquomanagedrdquo
exchange rate free capital movement and an independent monetary policy RBI policies
have been geared toward avoidance of undue volatility in foreign exchange markets by
having restrictions on cancellation and rebooking and excessive risk-taking by resident
entities including corporates With this objective RBI restricts participation of resident
entities in currency derivatives to the extent of their underlying exposures A large market
outside the influence of regulatory authorities undermines their effectiveness
Constitution of the Task Force
Against this backdrop it was announced in the Statement on Developmental and Regulatory Policy
dated February 7 2019 the setting up of a Task Force on Offshore Rupee Markets Accordingly
a Task Force headed by Smt Usha Thorat was constituted with following terms of reference
i Assess the causes behind the development of the offshore Rupee market
ii Study the effects of the offshore markets on the Rupee exchange rate and market liquidity
in the domestic market
iii Recommend measures to address concerns if any arising out of offshore Rupee trading
iv Propose measures to generate incentives for non-residents to access the domestic market
v Examine the role if any International Financial Services Centre (IFSC) can play in
addressing these concerns
vi Any other relevant issue(s) the Task Force considers relevant to the context
The Task Force comprises of the following
i Smt Usha Thorat former Deputy Governor Reserve Bank of India ndash Chairperson
ii Shri Anand Bajaj Joint Secretary Department of Economic Affairs Ministry of Finance
Government of India ndash Member
iii Shri G Mahalingam Whole Time Director Securities amp Exchange Board of India ndash
Member
iv Shri Ajit Ranade Chief Economist of the Aditya Birla Group ndash Member
v Shri Sajjid Chinoy Chief Economist India JP Morgan India ndash Member
17
vi Shri Surendra Rosha CEO India HSBC Bank ndash Member
vii Shri Rajiv Ranjan Adviser-in-charge Department of Economic Policy and Research
Reserve Bank of India ndash Member
viii Shri T Rabi Sankar Chief General Manager Financial Markets Regulation Department
Reserve Bank of India ndash Member Secretary
Approach of the Task Force
Among the different issues relating to offshore markets the argument concerning revenue loss is
perhaps the most simplistic and an obvious response could be for India to develop non-deliverable
Rupee derivative market in an International Finance Service Centre (such as the GIFT City) located
within the geographical boundary of India However such a market will be virtually no different
from the markets located in Singapore or London and hence the objective of bringing volumes to
the onshore market will remain unaddressed
From the standpoint of addressing the concerns arising out of the existence of large offshore
markets it would make sense to incentivise movement of as much currency market transactions
from such markets to onshore currency markets as possible However theoretically one needs to
recognise that there is a trade-off between the sizeprominence of the offshore market and the
extent of regulationsrestrictions that are placed on cross-border transactions and foreign exchange
marketsparticipants It is also important to note that even if all non-residents with underlying
exposure move their hedging transactions to onshore markets offshore markets would continue to
exist to meet the demand of participants who take a view on the exchange rate without any
underlying exposure ie the speculative demand
At one extreme of the above-mentioned trade-off if India opts for a full rupee convertibility ndash by
removing all restrictions on current and capital account transactions ndash along with removal of all
restrictions on currency derivatives then offshore markets would no longer be a relevant concept
Capital account convertibility has been a hotly debated issue in the discourse on public policy both
in India and globally The received consensus in the last couple of decades endorsed by the
International Monetary Fund (IMF) in 2012 is that while capital flows are an important aspect of
the international monetary system providing significant benefits for countries they also carry risks
for macroeconomic and financial stability especially if they are large and volatile and thus pose
a challenge for policy Hence capital flows management measures are justified to help harness the
18
benefits while managing the risks More generally some restrictions to the capital account are
necessary for India to avoid the ldquoimpossible trinityrdquo With an economy as large and diverse as
Indiarsquos which is therefore expectedly not completely synchronous to the global cycle retaining
the independence of monetary policy is imperative Similarly having some control over the
exchange rate is necessary given its occasional propensity to be excessively volatile and overshoot
with attendant feedback loops to the macro-economy Therefore capital flow management
measures become necessary to avoid the trilemma and ensure simultaneous fulfilment of the other
two objectives Based on this received consensus as well as the experiences of some emerging
market economies through the last two decades the Task Force has proceeded on the basis that
the existing framework of capital account management followed by the Government and the RBI
will continue
There is also the issue of de-jure capital account convertibility Even when speculators
arbitrageurs and traders do not have direct access to forex markets to exploit persistent interest rate
differentials or perceived mispricing of the currency there are alternative channels available in
the system which make the actual arbitrage opportunities much lower Some examples of such
instruments is the Overnight Indexed Swaps (OIS) market or the use of Mumbai Interbank
Forward Offer Rate (MIFOR) Hence the de-jure level of capital account convertibility (CAC)
could be much higher than implied by the existence of capital controls
A related issue is the internationalisation of rupee According to McCauley (2011) a currency is
internationalised when market participants ndash residents and non-residents alike ndash conveniently use
it to trade invest borrow and invoice in it Based on the experience of China to internationalise
Renminbi and the evidence of the narrowing of the gap between onshore forward rate and NDF
rates for Renminbi internationalisation of currency has been sometimes advocated as a way to
reduce the influence of offshore markets While one has witnessed issuance of rupee-denominated
bonds (ldquoMasala Bondsrdquo) in some offshore markets in the recent past internationalisation of rupee
is still a distant goalpost given the persistent current account deficit and the negative net
international debt position Thus internationalisation of rupee is not an explicit goal guiding the
recommendations of the Task Force
Further the Task Force believes that Indiarsquos approach to the trade-off between deregulation of
currency markets and tolerance of offshore market must be shaped by the specific considerations
of the Indian economy rather than following any global template blindly
19
Compared to countries like Korea Taiwan or China Indiarsquos macroeconomic structure is
significantly different India is a structurally an economy with twin deficits ndash both fiscal and
current account Nearly half of Indiarsquos consumer price index (CPI) basket comprises of food items
making Indiarsquos inflation more vulnerable to supply shocks Although Indiarsquos macroeconomic
stability has improved considerably in the last few years considering the above factors the Task
Force feels that India cannot risk macroeconomic instability through potential exchange rate
shocks by drastically lifting the restrictions on foreign exchange markets and participants
On the other hand large volumes in the offshore market also reflect the fact that the interest in
Rupee is far larger than what is evident in onshore currency markets This reflects the growing size
of the Indian economy greater role of India in the global economy and growth in trade and capital
flows Over time therefore it would be imperative for the Indian regulators to take steps to expand
the role of onshore currency markets gradually lest the disjointed price discovery issue flares up
more frequently and in larger degrees
The balanced approach of the Task Force therefore is to look at each of the difficulties faced by
market participants in accessing onshore currency markets and prioritise their resolution in such a
way that prudent regulatory considerations are least compromised For instance certain market
micro-structure issues (such as extending the market hours of onshore currency markets) can be
addressed relatively quickly without any regulatory compromise On issues related to
documentation and KYC requirements smart application of ease-of-doing-business principles
needs to be followed Economic entities which need to undertake hedging of their foreign exchange
exposure on account of genuine underlying exposures need to be given greater flexibility in
undertaking such transactions in domestic currency markets While the need for underlying
exposure in order to operate in the forward markets cannot be eliminated the way in which it is
evidenced and monitored can be simplified The Task Force has proceeded on the basis of the
existing principles of regulations of foreign exchange markets
Of course the Task Force recognises that the recommendations will not do away with the
economic imperatives for which trading of rupee forward contracts exists in offshore markets
With our recommendations the Task Force believes that regulatory concerns arising out of the
offshore markets can be reduced though not eliminated
The Task Force held nine meetings between March 2019 and July 2019 The details of the meetings
are given in Annex V
20
Chapter 2
The Evolution of NDF Markets and Cross-country Experience
The foreign exchange market in India during 1970s and 1980s was heavily controlled and closed
in nature with various kinds of restrictions in place The Indian foreign exchange market started
deepening with the transition to a market-determined exchange rate system in March 1993 and the
subsequent liberalisation of restrictions on various external transactions leading up to current
account convertibility under Article VIII of the Articles of Agreement of the International
Monetary Fund in 1994 Notwithstanding various measures taken to further deepen and broaden
the foreign exchange market in India various restrictions are still in place to limit market access
to only those with underlying exposure and prevent undue speculation As India gets increasingly
integrated with the global markets and the exchange rate is increasingly market determined a
combination of capital flows management measures and currency trading restrictions in the on
shore markets are used to manage the lsquoimpossible trinityrsquo external value of the rupee These
measures and restriction are under constant review to ensure that the overall objective of growth
through foreign trade and investment are served
Against this backdrop this chapter attempts to highlights evolution in section II a brief review of
literature on the reasons behind increase in turnover in NDF market in Asian countries has been
given in Section III Section IV highlights the developments in NDF market The country
experiences such as nature of restrictions on non-residents operating in domestic currency
forwards market liberalisation measures taken by countries and its impact in curbing offshore
market discussed in Section V
I Introduction
NDFs are foreign exchange derivative instruments on non-convertible or restricted currencies
traded over the counter (OTC) mainly at offshore centres ie outside the direct jurisdiction of the
respective national authorities It is essentially a forward contract with different settlement process
Unlike the standard forward contract which involves exchange of underlying currencies on
maturity the NDF contract is typically settled as the difference between an exchange rate agreed
months before and the actual spot rate at maturity in an international currency (deliverable) mainly
the US dollars And the other currency which is usually emerging market currency is non-
21
deliverable The settlement of the transaction is not by delivering the underlying pair of currencies
but by making a net payment in a convertible currency equal to the difference between the agreed
forward exchange rate and the subsequent spot rate (Ma et al 2004) NDF contracts can either be
traded over the counter market or at exchanges at offshore financial centres such as Hong Kong
Singapore and London Lately they have become popular derivative instruments catering to the
offshore investorsrsquo demand for hedging arbitraging and speculating including by those who look
upon currency as an asset class
The major participants in NDF market could include foreign businesses and investors doing
business in countries with complex requirements for hedging currency risk in the local markets
arbitragers who have access to both on shore and offshore markets pure speculators like hedge
funds and others who take positions in the NDF market While these are the end users there are
also market intermediaries like banks dealers and brokers who provide quotes for trading in these
currencies and custodians who provide settlement arrangements While the multinational
companies deal in both the long and short end of the market the short end of the market is
particularly dominated by the hedge funds (Misra and Behera 2006) The pricing is influenced by
a combination of factors such as interest rate differential between the two currencies supply and
demand future spot expectations foreign exchange regime and central bank policies
NDF market primarily evolved in response to under-developed onshore forward markets and
limited access to non-residents to currencies with foreign exchange convertibility restrictions An
important advantage that enhances the demand for NDF is reduced credit risk compared to onshore
counterparts since there is no exchange of principal and only the difference amount is settled thus
allowing investors to circumvent limits associated with onshore activity Other reasons which also
favoured the emergence of NDF market includes convenience of time zones location of customer
business operating from a global treasury for multinational companies short-trading hours in
onshore forex market capital controls by individual central banks position limits frictions like
registration norms and know your customer norms frequent and significant changes in regulations
and guidelines in the domestic exchanges and OTC markets Moreover credit risk is also less
relevant since mostly large foreign banks are engaged as a counterparty in NDF trading Further
offshore centres in some cases are better placed to offer competitive services compared to the
22
onshore market on account of various factors ranging from tax treatment less onerous regulations
and documentation to operational efficiency
II Evolution of NDF Markets
The origin of NDF market traces back to the 1990s when a wave of capital account liberalisation
in emerging market economies (EMEs) triggered surge in capital inflows to these economies and
consequently increased currency risk faced by the investors However under-developed domestic
forward market or restricted access to onshore forward market paved the way for evolution of NDF
market as an alternative hedging tool to these investors The widely shared concern amongst local
monetary authorities was that easy access to onshore market and availability of domestic currency
to non-residents will encourage speculative activity leading to greater exchange rate volatility and
eventually the loss of monetary control Consequently some international banks began offering
NDF contracts to meet the demand of investors willing to hedge their EM currencies exposure
during early 1990s (Higgins and Humpage 2005)
One of the earliest NDF market developed during early 1990s was in Mexican peso to speculate
on the currency ahead of the devaluation from its then fixed exchange rate against the US Dollar
The increase in trading turnover during that time was facilitated by the entrance of voice brokers
as intermediaries between inter-bank trading activities (Lipscomb 2005) The NDF market for
some Asian economies like Korean Won Taiwanese Dollar Indian rupee and Chinese Renminbi
existed since mid-1990s due to either restricted or no access to onshore forward markets by non-
residents (BIS 2004) In case of New Taiwan Dollar only onshore entities had access to onshore
markets while it was subjected to underlying requirements in case of Korean Won Indian rupee
and Chinese Renminbi For other currencies like Indonesian rupiah NDF market evolved after
the Asian financial crisis in response to re-imposition of capital restrictions which were liberalised
in early 1990s In Indonesia rapid liberalisation beginning as early as 1970s and further
internalisation of Indonesia rupiah enabled the development of deliverable offshore market for
rupiah Following the currency crisis initial measures were directed at curbing non-trade and
investment related forward transactions with non-residents and broader measures prohibiting
banks from extending loans conducting derivative transactions and transferring rupiah to non-
residents were introduced in early 2001 While Malaysia also imposed cross border restrictions
23
after the crisis evolution of NDF market in Ringgit was initially inhibited by comprehensiveness
of regulations as well as its effective enforcement by the authorities (Ishii 2001)
McCauley (2011) showed that as income per capita rises a currency trades in ever greater
multiples of the home economyrsquos underlying international trade (ldquofinancialisationrdquo) and trades to
an even greater extent outside its home market (ldquointernationalisationrdquo) The increasing economic
interest in emerging market economies as a result of upbeat growth scenario from 2000s spurred
greater participation in currencies of these economies (Chart 1) In this context increasing turnover
in the Indian rupee Chinese Renminbi and other Asian currencies like Indonesian rupiah
Malaysian Ringgit Korean Won and New Taiwanese Dollar is consistent with increased
investment in these economies amidst restricted access to onshore markets Both India and China
recorded phenomenal growth rates translating into increased businesses (trade and investments)
with rest of the world and resulting exposures facilitated offshore trading of their currencies (Chart
2 a amp b) During 1990s mostly non-residents with genuine exposure used NDF market to hedge
their exposures in Indian rupee However with the development of onshore market providing
reasonable hedging facilities to foreign investors amidst gradual relaxation of controls most of the
market activity seems to be driven by speculators and arbitrageurs and those who are looking at
the rupee as a separate asset class to diversify their portfolios in view of its growing international
importance As a result the size of NDF market has grown over time In the Chinarsquos case the
emergence of offshore deliverables market for Renminbi (CNH) since 2010 was mainly due to
internationalisation of Renminbi which gradually substituted the NDF market
24
Chart 1 a amp b FX turnover Indexed 1998=100 and FX TurnoverTrade vs GDP
Source BIS Triennial survey IMF CEIC
Note Chart 1b A higher ratio of FX turnover to trade indicates that a currency trade in higher multiple
relative to its underlying trade as GDP increases
Chart 2 a amp b Gross trade Indexed 2000=100 and Gross trade vs FX turnover
Source IMF BIS World Bank
Both Indonesia and Malaysia have witnessed sharp increase in non-resident participation in local
currency bond market particularly in the aftermath of global financial crisis 2008 while these
countries local forward markets imposed restrictive conditions that restricted use of these markets
for hedging this led to the increased use of NDF market Non-resident ownership of government
debt in Indonesia and Malaysia as share of total outstanding government debt stood at 383 per
0
100
200
300
400
500
600
200
0
200
2
200
4
200
6
200
8
201
0
201
2
201
4
201
6
201
8
WorldAsiaEmerging and developing economiesAdvanced economies
0
1000
2000
3000
4000
0
200
400
600
800
1000
1200
1998 2001 2004 2007 2010 2013 2016
BRL IDR
CNY INR
MYR TWD
KRW right scale
Brazil
Korea
Indonesia
China
India
Malaysia
0
5
10
15
20
25
30
01 10 100 1000
GD
P p
er c
apit
a (U
SD
in t
ho
usa
nd
s)
FX turnover to trade (in log form)
Brazil
China
Indonesia
India
Korea Malaysia
Thailand
00
10
20
30
40
50
60
70
0 25 50 75 100 125 150
FX
turn
over
to
GD
P
External trade to GDP
25
cent and 243 per cent as at the end of March 2019 respectively highest amongst other Asian
economies However foreign participation in equity market is higher for Korea and Taiwan While
Taiwan has limits on investments in domestic bonds by non-residents foreign investors are not
subject to any investment ceiling for both aggregate and individual holdings in a listed company
except for a few restricted industries
Additionally the reason for growing NDF market could be increased carry trade activities for high
yielding currencies After examining the returns of carry trades with deliverable and non-
deliverable forwards Doukas and Zhang (2013) found that carry trades for currencies with NDF
contracts perform better compared to carry trades for currencies with deliverable forward
contracts This excess return is attributed to the compensation of risks emanating from currency
convertibility and capital controls For the Brazilian Real (BRL) derivatives offshore NDFs in
particular are the main vehicle for investors looking to implement carry trades (BIS Santaelaa
2015)
NDF market evolved mainly for emerging market economies witnessing increased economic
interest in the process of transition to high growth phase since 1990s whilst restrictions persisted
in accessing onshore markets for hedging currency risk arising out of these exposures The NDF
market also provided an opportunity to speculate on currencies which underwent notable shift in
their exchange rate regime During periods of global uncertainties like in 2013 during ldquotaper
tantrumrdquo the NDF market is used for speculative purposes arguably causing disruptions in
domestic forex market
III Size of the NDF market
Given that NDF is an over the counter (OTC) traded instrument the turnover data relies on various
surveys conducted by institutions at different time intervals In view of this issues like
comparability and continuity in data often arises However these surveys still provide useful
information to gauge the growth of NDF market over time Results from the semi-annual turnover
survey for the Foreign Exchange Joint Standing Committee chaired by Bank of England (BoE)
suggests that growth of NDF market has outpaced the forward market as well as overall foreign
exchange market In London the average daily NDF turnover surged to USD 139 billion as per
26
the latest survey in October 2018 from as low as USD 21 billion in 2008 During this period NDF
turnover quadrupled and its share increased to 53 per cent of overall forex turnover and comprised
nearly 34 per cent of both onshore and offshore forwards compared to nearly 10 per cent in 2008
Table 1 NDF trading in London (Average daily turnover in billions of US dollars)
NDFs All forwards NDF of all
forwards
All FX NDF as of all FX
Apr-08 23 200 115 1832 13
Oct-08 19 230 83 1699 11
Apr-09 16 162 99 1356 12
Oct-09 26 191 136 1522 17
Apr-10 25 186 134 1687 15
Oct-10 37 188 197 1787 21
Apr-11 42 192 219 2042 21
Oct-11 37 192 193 2038 18
Apr-12 36 192 188 2014 18
Oct-12 45 211 213 2017 22
Apr-13 60 265 226 2547 24
Oct-13 43 205 210 2234 19
Oct-14 62 304 204 2711 23
Apr-15 64 295 217 2481 26
Oct-15 54 253 213 2111 26
Apr-16 60 275 218 2225 27
Oct-16 62 292 212 2179 28
Apr-17 78 332 235 2401 32
Oct-17 90 330 273 2380 38
Apr-18 111 407 273 2727 41
Oct-18 139 409 340 2611 53
Source BIS London Foreign Exchange Joint Standing Committee
A similar survey is conducted by Hong Kong trade repository (HKTR) under the mandatory
reporting obligations imposed since July 2015 According to the HKTR survey daily average
27
NDF turnover in Hong Kong has also exhibited significant growth and daily average turnover
increased to USD 55-60 billion in 2018 from nearly USD 8 billion in 2015
The BIS publishes data on foreign exchange and derivatives trading activity every three years and
also prepare a separate report on NDF covering global market since 2013 The latest 2016 BIS
triennial survey reported that average daily turnover in global NDF market has increased by 53
per cent to USD 134 billion as compared to April 2013 Further NDF share in outright forward
and overall foreign exchange trading remained stable at 190 per cent and 26 per cent respectively
(Table 1) This is in contrast to the decline in average daily turnover in global FX markets to USD
51 trillion in 2016 from USD 54 trillion in 2013 survey conducted by BIS
The currency composition suggests that the Asian currencies dominate the NDF trading activity
with the highest turnover recorded by Korean Won as Korea generally has open capital account
and there are limits on non-residents borrowings in Korean Won from banks in Korea therefore
it is not deliverable offshore (BIS Survey 2016) Survey results from London Hong Kong and
Tokyo foreign exchange committees (FEC) as well as the BIS triennial survey points toward
increased NDF trading activity in Korean Won The Tokyo survey which is available from the
year 2006 suggest that the growth in NDF trading activity for Korean Won has shown significant
growth outperforming other major currencies The momentum in major currencies picked up ahead
of the global financial crisis 2008 before faltering during the crisis period owing to deteriorating
financial conditions Subsequently the NDF activity has deepened over time with the Indian rupee
and Brazilian Real constituting higher proportion of total global turnover after the Korean Won
as corroborated by the London survey also During the five-year period from 2008-13 the increase
in NDF turnover is largely consistent with the FX turnover in emerging market economies (BIS
2013)
Since 2013 greater demand for hedging in anticipation of monetary policy normalisation seems
to be the driving factor for increase in NDF activity given that lot of capital flows to emerging
markets was funded using low cost dollar liquidity (BIS 2013) The BIS 2016 survey identified
that developments associated with higher volatility in Renminbi during August 2015 and January
2016 has also boosted Asian NDFs even as trading activity in Renminbi NDF has faded
According to the BIS 2016 survey during 2013 and 2016 trading in Renminbi NDF contracted
by 394 per cent while that of Korean Won and Taiwanese Dollar expanded by 537 per cent and
28
299 per cent respectively The decline in the NDF activity for Indian rupee reflects the
depreciation of rupee against the US dollar however daily average turnover was up by 167 per
cent between 2013 and 2016 in unadjusted terms Hong Kong (HKTR) survey indicates continued
decline in NDF activity for Chinese Renminbi and Malaysian Ringgit (Table 2 and Chart 2 a amp b)
In case of China this was due to the Renminbi internationalisation policy followed after 2011
Table 2 Daily average turnover (USD billion) Spread
BIS 2013 BIS 2016
Oct- 2018
(London Survey) Bid-Ask (Latest)
NDF DF NDF DF NDF
DF
(Latest) Onshore Offshore
Chinese Renminbi 171 24 104 281 88 650 0001-0002 0003-0005
Indian Rupee 172 31 164 163 2303 214 001 002
Korean Won 196 11 301 145 295 300 010 030
Taiwanese Dollar 89 02 115 78 - 193 0005-0010 0010-0020
Brazilian Real 159 27 187 30 154 - - -
Russian Ruble 41 05 29 186 40 - - -
Source BIS London FEC BoK RBI China Foreign Exchange Trading Center Central bank of Taiwan HSBC
Note
1 DF= Deliverable forwards and include forwards and FX swaps traded onshore
2 Chinese Renminbi volumes on offshore segment are negligible after development of CNH market
3 BIS DF and DF (latest) are not directly comparable since latest numbers are taken from country sources
Chinese Yuan is for Jun-19 Indian rupee and Taiwanese Dollar is for Apr-19 Korean Won is for 2017
Chart 2 Average Daily Turnover and Change in Forex position of Asian Currencies
3 The corresponding figure for April 2019 stood at USD 28billion
0
100
200
300
400
500
US
DC
NY
US
DI
DR
US
DI
NR
US
DK
RW
US
DM
YR
US
DT
WD
Chart 2b Change in FX position of Asian
currencies (in USD billion)
29 January 2016 27 January 2017
31 January 2018 25 January 2019
0
200
400
600
800
1000
1200
Apr-
06
Apr-
07
Apr-
08
Apr-
09
Apr-
10
Apr-
11
Apr-
12
Apr-
13
Apr-
14
Apr-
15
Apr-
16
Apr-
17
Apr-
18
Chart 2a Average daily turnover USD
million
CNY INR IDR KRW
MYR TWD BRL
29
Source Tokyo FEC Hong Kong FEC
Based on latest surveys conducted by London and Hong Kong FEC which are major offshore
centres clearly it showed that the global NDF activity has surged led by Korean Won Indian
rupee Brazilian Real and Taiwanese Dollar The trend is likely to be validated by BIS 2019 survey
which encompasses global turnover and is due to release later this year
IV Review of Literature
In view of the noticeable rise in NDF activity with potential to engender distortions in local market
there exist varied literature on the emergence of NDF market and its spill-overs to onshore
counterparts One of the earliest attempts was made by Park (2001) which investigated the impact
of financial deregulation on relationship between onshore and offshore prices A key finding was
that Korean Won NDF influenced onshore prices after a shift to floating exchange rate regime
coupled with liberalisation of capital controls As part of liberalisation measures following the
Asian financial crisis in 1997 excessive regulations pertaining to foreign exchange market were
removed and measures were undertaken to improve efficiency of market by increasing liquidity
and broadening participation base (Chung et al 2000) Amongst these measures onshore entities
were allowed to participate in offshore market In this regard Lipscomb (2005) suggested that
transition to a more convertible exchange rate regime and permissible participation of onshore
counterparties in NDF transactions contributed to the increase in offshore liquidity which begets
liquidity in domestic market as well A classic example is Korean Won where both onshore and
offshore market co-exist with arbitrage opportunity exploiting any incipient price discrepancy
However NDF markets tend to disappear as the currency becomes fully convertible as stated
earlier
Wang et al (2007) also corroborated the finding that NDF market seems to be the driver for the
domestic spot market of Korean Won while the information flow is reverse for Taiwanese Dollar
where the spot market was found to have influence on NDF market Adding to this literature
Colaveccchio and Funke (2008) found Renminbi NDF to be the key driver of Asian currency
markets with varied degree of heterogeneity contingent on real and financial inter-linkages
Amongst the country specific study the one by Cadarajat and Lubis (2012) demonstrated that
Indonesia rupiah NDF tends to have influence on domestic spot and forward return
30
Studies by Hutchison (2009) Mihajek and Packer (2010) and McCauley and Scatigna (2011)
asserted that offshore trading becomes increasingly important with growing economic interest in
a particular currency amidst limited access to onshore markets and convertibility restrictions A
study by BIS (2013) analysed the directional impact for nine currencies including the Indian rupee
for the period 2005-13 along with separate analysis for 2008-09 crisis and May-August 2013 It
found the presence of two way causation for most currencies for the full sample period however
noted the increase in NDF influence during market stress Both the stress period saw noticeable
impact of NDF particularly during May-August 2013 with major exception of Malaysian Ringgit
where NDF played dominant role and there was no case of deliverable forward influencing NDF
In the Indian context the earliest study with regard to spill-overs impact was undertaken by Misra
and Behera (2006) They found onshore prices to have directional impact on NDF prices even as
volatility spillovers could exist from NDF to onshore market The subsequent research on this
subject during the period 2000-09 by Behera (2011) demonstrated the change in dynamics with
evidence of greater volatility spillover from NDF to spot market A similar finding was outlined
by Guru (2009) on the relationship between the NDF and onshore market for Indian rupee It is
argued that dynamics of relationship between onshore and offshore markets has undergone a
change with the introduction of the currency future market in 2008 and returns in NDF market
seem to be influencing the domestic spot as well as forward market
A study by Darbha (2012) finds that offshore markets plays an important role in price discovery
mechanism particularly in India and China Goyal et al (2013) after examining the period 2006-
13 found the existence of bi-directional relationship between onshore and NDF market for Indian
rupee over the long term however the directional impact turns one way from NDF to onshore
during periods of depreciating pressures ie movements in NDF markets drives adjustment in
onshore market when the currency is under depreciation pressures This asymmetric behaviour is
attributed to the fact that the Reserve bank intervenes in the foreign exchange market to stem
excessive volatility during periods of rupee depreciation
McCauley et al (2014) described two paths for evolution of the NDF markets The first one is
being followed by Chinese Renminbi which has become deliverable after the emergence of
offshore market The Indian rupee falls under the second where the NDF market has grown amidst
continued restrictions on foreign participation
31
The report of the Standing Council (Standing Council on International Competitiveness of the
Indian Financial System 2015 by Ministry of Finance Government of India enumerated factors
including capital controls position limits frictions like registration norms and know your customer
norms frequent and significant changes in regulations and guidelines in the domestic exchanges
and OTC markets as deterrent to foreign investors participation in the onshore market
IGIDR Finance Research Group (2016) made an important recommendation that domestic entities
should be permitted to participate in NDF market after outlining factors driving offshore activity
compared to onshore segment In respect of the internationalisation of rupee as one of the debated
recommendation Kumar and Patnaik (2018) argued the case for gradual internationalisation of
rupee on analysing the role of the Indian rupee in terms of official sector currency reserve currency
and trade invoicing currency
V Country Experience
China
The Chinese Renminbi (RMB) forward market can be segmented into offshore NDF market (since
1990s) an onshore Renminbi market (since 2007) and the CNH market (offshore deliverable) In
the current scenario RMB NDF has been gradually replaced by offshore deliverables after the
creation of CNH market since mid- 2010 as a by-product of promotion of international role of
RMB since 2009
Chinarsquos exchange rate regime has evolved from fixed to managed floating rates followed by
internationalisation of Renminbi (RMB) In early 1990s reforms started with the unification of
multiple exchange rate in 1994 and in 1996 China allowed the full convertibility of Yuan under
current account transactions Eventually the Peoplersquos Bank of China (PBoC) announced the
implementation of managed floating exchange rate against basket of currencies in July 2005
ending the dollar peg prevalent since 1994 Over the last decade Chinarsquos strong economic
performance and growing linkages with rest of the world prompted authorities to promote the
international role of RMB The idea of internationalisation of RMB gained prominence following
the financial crisis of 2008 which revealed the fragilities of dollar dominated global financial
system The thrust of early initiatives was RMB trade settlement premised on Chinarsquos deeper trade
32
links and its central role within Asiarsquos supply chain that supported the demand for its currency for
trade invoicing In this regard a pilot scheme permitting cross border trade settlement in RMB was
launched in 2009 which was widened to cover all current account transactions over the course of
next three years Capital account liberalisation was undertaken at a more gradual pace with the
Chinese RMB becoming officially deliverable at offshore centres in 2010 While Hong Kong
banks were permitted to accept RMB deposits as part of personal accounts in 2004 an important
milestone was the sign of Memorandum of cooperation between HKMA and PBoC in July 2010
which eliminated restrictions on Hong Kong banks in establishing Renminbi accounts and
providing related services ie payments and transfers in RMB to individuals and corporations
Moreover financial institutions were permitted to offer Yuan denominated products As a result
CNH (offshore Renminbi) began to trade actively amongst other range of products and prompted
investors to switch to deliverable market in place of NDF which was used previously Whilst CNH
can be transferred freely between offshore accounts transfer of RMB between onshore and
offshore is still confined to regulated channels to fend off potential adverse impact on onshore
markets Moreover these restrictions are skewed towards outflows form the mainland to offshore
centres
With Renminbi internationalisation the offshore CNH market has shown exponential growth
displacing the NDFs The BIS Triennial Survey showed significant decline in RMB NDF which
fell nearly 40 per cent between 2013 and 2016 driving its share in total RMB trading to 5 per cent
from 14 per cent earlier (BIS 2016) The rapid expansion of offshore market is clearly discernible
in rising FX turnover for CNH which has nearly doubled between 2013 and 2016 and forms around
67 per cent of the total RMB turnover Of the total CNH turnover average daily turnover in the
DFs in April 2016 was estimated to increase to USD 164 billion from USD 84 billion in 2013
(Table 3)
33
Table 3 RMB market turnover average daily turnover in USD billion
OTC
spot
OTC
FX
swaps
OTC
DFs
OTC
NDF Options Futures
OTC
currency
swaps Total
CNY
2013 201 105 26 0 03 0 0 335
2016 249 27 13 0 2 0 02 554
change 239 1565 -514 5693 651
CNH
2013 139 294 84
168 0 05 69
2016 427 59 164
158 03 25 1367
change 2079 1008 943 -56 5784 3836 981
NDF
2013
171
171
2016
104
104
change -394 -394
Source BIS
Since the inception of CNH pricing gaps tend to persist between onshore and offshore exchange
rates however it has narrowed over last couple of years This pricing gap arises on account of
different economic conditions in mainland China and Hong Kong amidst imperfect arbitrage
(Funke 2015) While central bank intervention can constrain the movement of CNY at onshore
centres CNH is more market determined and hence closely follows the global swings (Chart 3)
Since September 2015 PBOC has reportedly taken action in the offshore market when the
onshore-offshore gap was large (McCauley amp Shu 2018)
34
Source Bloomberg
Further liberalisation of the onshore FX market along with allowance of offshore deliverable
market has made the CNY NDF market almost non-existent despite maintaining the lsquoneed basisrsquo
principle Notwithstanding the existence of basis between CNY and CNH due to the band range
trading in CNY and market determined pricing in CNH the spread has been contracting over years
with ample liquidity available in onshore and offshore markets Further the creation of offshore
market has made various options available to offshore investors to both hedge their exposures on
underlying investments and also generate RMB risk in their portfolios via various products and
offshore deliverable market
Korea
With an average daily turnover of USD 30 billion as per the BIS survey 2016 and USD 295 billion
in the latest London survey of October 2018 Korean Won (KRW) NDF boasts of the most active
and liquid NDF market amongst most emerging market currencies Further permissible
participation of local banks in the NDF market ensures close integration of onshore and offshore
forex markets allowing for quick sentiment spillovers between the two markets Turnover in NDF
market is substantially higher than onshore forwards mainly on account of higher documentation
requirements for accessing onshore market In the onshore market average daily turnover was
reported at USD101 billion in 2017 for forwards which increased from USD 96 billion during
the previous year (Chart 4 a ampb)
-015
-01
-005
0
005
01
01-0
8-2
010
01-1
2-2
010
01-0
4-2
011
01-0
8-2
011
01-1
2-2
011
01-0
4-2
012
01-0
8-2
012
01-1
2-2
012
01-0
4-2
013
01-0
8-2
013
01-1
2-2
013
01-0
4-2
014
01-0
8-2
014
01-1
2-2
014
01-0
4-2
015
01-0
8-2
015
01-1
2-2
015
01-0
4-2
016
01-0
8-2
016
01-1
2-2
016
01-0
4-2
017
01-0
8-2
017
01-1
2-2
017
01-0
4-2
018
01-0
8-2
018
01-1
2-2
018
01-0
4-2
019
Chart 3 Gap between USDCNY and USDCNH
Offshore premium
35
Chart 4 Foreign Exchange Turnover and NDF market in Korea
Source Bloomberg Bank of Korea
Korea embarked on liberalisation reforms in 1980s however took big strides post Asian financial
crisis in 1997-98 in line with the IMF adjustment programme As part of these measures foreign
exchange transactions were liberalised which allowed the local banks to engage in NDF
transactions with non-residents Prior to this the development of the onshore currency derivatives
market was constrained by legal requirements such as any forward transaction had to be certified
as a hedge against future current account flows the so-called ldquoreal demand principlerdquo which also
spurred the development of a liquid offshore ldquonon-deliverablerdquo forward (NDF) market in the
Korean Won In 1999 as part of liberalisation measures this restriction was lifted and a lot of
activity moved onshore leading to the convergence of the offshore and onshore prices (IMF
2004) This resulted in sharp increase in NDF transactions between onshore banks and non-
residents for both hedging as well as speculative purposes Amidst likely possibility of turmoil in
foreign exchange market the central bank implemented regulations in January 2004 governing
Korean banks NDF positions with the non-residents directed at restraining any potential selloffs
However these restrictions were abolished in April 2004 as speculative activity was assessed to
have reduced significantly
KRW is almost a non-restricted currency provided the investor holds an Investment Registration
Certificate (IRC) issued by the Financial Supervisory Services (FSS) in Korea The IRC allows an
offshore investor to invest in onshore securities and provides near non-restricted currency rights
barring any holding of short selling position in onshore KRW account
191 18 183 175 20 194 196
7566 71 76
83 96 101
192198 196 19
192 184198
0
10
20
30
40
50
2011 2012 2013 2014 2015 2016 2017
Chart 4b Foreign Exchange Turnover
in Korea daily average USD billion
Spots Forwards Fx Swaps
-60
-50
-40
-30
-20
-10
0
10
20
30
12
-19
98
01
-20
00
02
-20
01
03
-20
02
04
-20
03
05
-20
04
06
-20
05
07
-20
06
08
-20
07
09
-20
08
10
-20
09
11
-20
10
12
-20
11
01
-20
13
02
-20
14
03
-20
15
04
-20
16
05
-20
17
06
-20
18
Chart 4a Onshore USDKRW-NDF 1M
USDKRW
36
For non-residents investors who do not hold IRS USDKRW remains a highly regulated market
Any onshoreoffshore transactions need to be approved by the appropriate authorities and must
have proof of underlying For multinational clients that repatriate dividends documentation with
proof of underlying must be in place Further ceilings are imposed on foreign exchange derivatives
transactions of foreign as well as local banks which came into existence as a prudential measure
to mitigate the adverse impact of volatile capital flows
Ahead of the 2008 financial crisis Korean economy experienced huge build-up of short-term
external debt led by foreign exchange derivatives positioning of banks on account of over-hedging
undertaken by Korean corporations as well as likely carry trades in anticipation of appreciation of
domestic currency Both these activities were funded using offshore dollar borrowing and posed
serious difficulties at the time of global dollar liquidity crunch during financial crisis With a view
to prevent recurrence of the any such episode triggered by volatile capital flows which resurged
from 2009 over-hedging was specifically prohibited and limits were imposed on Foreign
exchange derivatives activity of banks in relation to their capital Liberalization in KRW has been
continuing for decades with the last one completed in December 2007 whereby prior approval
requirements for some capital account transactions was abolished Even onshore participants can
freely participate in the NDF markets thereby providing onshore liquidity to Non-Residents as
long as the hedges are booked as NDF Essentially KRW is a fully convertible currency but is
only tradable on NDF basis offshore
Malaysia
Malaysia had liberal foreign exchange policies until Asian financial crisis with regard to cross
border transactions involving Malaysian Ringgit (MYR) Following the crisis offshore trading of
MYR was banned However grace period was notified for depositors to repatriate their offshore
deposits back to Malaysia and the adoption of fixed exchange rate policy in 1998 - a significant
move whilst imposing selective capital controls All these measures were intended at ceasing
offshore activity which contributed to the excessive pressure on currency despite relatively
stronger fundamentals Although Malaysia imposed cross border restrictions after the Asian crisis
evolution of NDF market in MYR was initially inhibited by comprehensiveness of regulations as
well as its effective enforcement by the authorities (Ishii 2001) Further absence of reference rate
37
for settlement of NDF contracts and stringent controls on domestic bank to undertake forward
foreign exchange transactions with offshore counterparties also hindered the development of NDF
market (EMEAP discussion paper 2002) As the economy began to recover capital controls were
gradually relaxed and finally the currency was floated in 2005
Generally Malaysia has opened up its domestic markets for non-resident investors with no
restrictions on non-residents investing in local bond markets except having to appoint a local
custodian Most of the sectors are open for non-resident portfolio equity flows as well in Malaysia
Over the years since 2005 non-resident investorsrsquo participation in the onshore market picked up
substantially reaching record high of 397 per cent of total outstanding government bonds from
nearly 14 per cent in 2005 and in the process contributed to the growth of NDF market as well
McCauley (2013) analysed the direction of influence for nine currencies in 2005-13 as well as
separately for the 2008-09 crisis and May-August 2013 Granger causality tests point to two-way
causation for most currencies for the full sample The exception is the Malaysian Ringgit where
the NDF influences the deliverable forward market The central bank expressed concerns over the
adverse impact of increased activities in the ringgit NDF market after wide gap was observed
between the NDF and onshore rate in 2016 following the US presidential election Bank Negara
Malaysiarsquos (BNM) Governor emphasised that ringgit NDF market is used by non-resident
investors mostly for speculative purposes rather than genuine demand for hedging As the NDF
trading activity intensified during volatile period in 2016 ringgit-denominated NDF implied much
larger depreciation which further exacerbated the then prevailing depreciating pressure on the
currency (Chart 5)
Chart 5 Onshore and Offshore market in Malaysia
Source Bloomberg
4141542
42543
43544
44545
455
Oct
-16
Oct
-16
Oct
-16
Nov
-16
Nov
-16
Nov
-16
Nov
-16
Dec
-16
Dec
-16
Dec
-16
Dec
-16
Dec
-16
Jan-1
7
Jan-1
7
Jan-1
7
Jan-1
7
Feb
-17
Feb
-17
Onshore USDMYR Offshore 1month NDF USDMYR
38
Assessing the overwhelming impact of NDF activities which has the potential to undermine
financial stability BNM took a number of measures in 2016 to eliminate speculative transactions
in order to ensure appropriate price discovery and orderly functioning of onshore market These
measures includes reinforcement of non-internationalisation policy for Ringgit steps to improve
the onshore pricing mechanism and deepen the domestic forex market After prohibiting banks
from quoting fixing orders used to settle offshore trades the central bank revised the methodology
to compute onshore reference rate to account for transacted deals from mid-2016 Further BNM
imposed a ban on ringgit NDF trading in November 2016 and reminded local banks that ringgit
remains a non-internationalised currency and therefore any offshore trading is not recognized At
the same time BNM strengthened its monitoring to ensure compliance to Foreign exchange
administration rules (FEA) rules by market participants on non-involvement in facilitating NDF
transactions Subsequently financial markets committee (FMC) instituted in mid-2016 laid down
a series of developmental measures for onshore market aimed at allowing better market access and
greater hedging facilities to market participants (Table 5)
Table 5 Developmental Measures Relating to Foreign Exchange Market
Jul-16 Dec-16 Apr-17
Adopting global best practices Rebalance onshore FX demand and supply
Additional FX risk
management practices
bull Transaction based KL
USDMYR reference rate
bull 25 retention of export proceeds in
foreign currency
bull Streamline passive and
dynamic hedging
flexibilities for
investors
bull Extension of official closing hour
for onshore Ringgit rate
bull Trade settlement among residents in
Ringgit only
bull Active hedging for
corporations
bull Streamline onshore and offshore
foreign currency investment limit
Promote FX risk management onshore
bull Active hedging below RM6t million of
net open position
bull Active hedging for institutional
investors
39
bull Expansion of appointed overseas office
framework
In an immediate impact reinforcement of restrictions on USD-MYR NDF market resulted in
significant outflows from local bonds in Malaysia However as a positive impact with the bout
of capital outflows following ban on NDF transactions composition of non-resident holdings has
shifted towards more stable and long-term investors thereby reducing the risk exposure to global
impulses Further the disruptive influence from NDF market subsided and onshore foreign market
continues to register higher average daily volume These measures have helped in increasing the
depth and liquidity of the foreign exchange market as evidenced by declining volatility and
narrowed bid-ask spreads in onshore market The decline in offshore volumes has resulted in
widened bid-ask spread (Chart 6 a amp b)
Chart 6 Malaysia Monthly FX forward volumes and Bid-Ask Spread
Source BNM Reuters and Bloomberg
-001
0
001
002
003
004
005
01
-10
-201
0
01
-04
-201
1
01
-10
-201
1
01
-04
-201
2
01
-10
-201
2
01
-04
-201
3
01
-10
-201
3
01
-04
-201
4
01
-10
-201
4
01
-04
-201
5
01
-10
-201
5
01
-04
-201
6
01
-10
-201
6
01
-04
-201
7
01
-10
-201
7
01
-04
-201
8
01
-10
-201
8
01
-04
-201
9
Chart 6b Bid-Ask spread
offshore bid-ask onshore bid-ask
0
10
20
30
40
50
60
70
80
90
0
5
10
15
20
25
30
Dec
-12
May
-13
Oct
-13
Mar
-14
Aug
-14
Jan-1
5
Jun
-15
Nov
-15
Apr-
16
Sep
-16
Feb
-17
Jul-
17
Dec
-17
May
-18
Oct
-18
Mar
-19
Chart 6a Monthly FX forward turnovers (in
USD billion)
Onshore FX forward Offshore FX forward RHS
40
Chart 7 Non-resident holdings of total government debt and Monthly FX turnover
Source BNM and HSBC
Indonesia
The development of NDF market in Indonesia Rupiah traces back to the year 2001 when Bank
Indonesia (BI) prohibited onshore banks from lending to non-resident accounts in an attempt to
reduce the speculative pressure on the Indonesian Rupiah (IDR) These restrictions paved the way
for development of offshore rupiah NDF market to cater to the demand of international investors
Prior to this an active offshore deliverable market existed for IDR following the pursuit of
liberalisation policies beginning as early as 1970s which allowed the IDR to be freely convertible
and at the same time permitted its internationalisation Consequently the international use of
rupiah increased but was confined mostly to financial transactions mainly due to limited invoicing
of trade-related transactions in IDR terms This easy access to rupiah from onshore centres due to
internationalisation allowed non-resident to speculate on the currency during the 1997 crisis in
Asian countries As a result of heightened activity in times of stress exchange rate volatility
increased making it difficult for the central bank to maintain stability of rupiah In response to the
crisis the currency was freely floated replacing the intervention band but weakness in the currency
and high volatility continued to persist compared to currencies of other Asian countries during the
first three years of its floating rate regime Taking cognizance of this disparity the central bank
began to evaluate the extant regulations relating to rupiah transactions with non-residents
Thereafter during the year 2001 the BI imposed extensive regulations limiting non-resident
143
397
243
50
100
150
200
250
300
350
400
450
Jan-0
5
Oct
-05
Jul-
06
Apr-
07
Jan-0
8
Oct
-08
Jul-
09
Apr-
10
Jan-1
1
Oct
-11
Jul-
12
Apr-
13
Jan-1
4
Oct
-14
Jul-
15
Apr-
16
Jan-1
7
Oct
-17
Jul-
18
Apr-
19
Chart 7a Non resident holdings as of total
government debt
-
500
1000
1500
2000
2500
3000
Jan-1
6
Apr-
16
Jul-
16
Oct
-16
Jan-1
7
Apr-
17
Jul-
17
Oct
-17
Jan-1
8
Apr-
18
Jul-
18
Oct
-18
Jan-1
9
Chart 7 Monthly onshore FX market
turnover (in billion of USD)
FX Spot FX Swap FX Forward FX Options
41
rupiah transactions and shrinking the pool of offshore rupiah funds with the potential to be used
for speculation identifying spill overs from offshore market as conduit of excessive volatility
In general Indonesia has opened up its domestic bond markets for non-residents completely with
no entryexit barriers except having to appoint a local custodian Foreign exchange hedging is
allowed only with underlying documentationasset in place for non-residents On the portfolio
equity investments regulation clearly provides that a listed company is exempt from any foreign
investment restrictions However there are sectoral restrictions on FDI in Indonesia which are
decided by BKPM (Investment Coordinating Board in Indonesia) which provides a DNI list
(Governmentrsquos negative investment list) The share of non-residents in Indonesia Government
Bonds has been increasing over years from a mere 1570 per cent of the total government bonds
in June 2009 to 3810 per cent in April 2019 (Chart 8)
Source HSBC
Research from BI in 2012 found disproportionate impact of NDF market to spot market during the
period 2008-11 Results suggests that there is evidence of unidirectional mean spill-over from NDF
to both spot and forward rupiah markets with an exception of Europe crisis On volatility spillover
the study obtained significant results from NDF market to spot market for entire period However
in crisis situation the study found interdependence between volatility in offshore NDF and onshore
spot rate changes while information transmission is only valid from NDF to forward rate changes
not the other way around (Cadarajat and Lubis 2012)
To reduce the unwarranted influence of NDF market on spot market BI took initiatives beginning
the year 2014 to bridge the gap between onshore and offshore rupiah rate In 2014 the central bank
381
150
200
250
300
350
400
450
Jun-0
9
Dec
-09
Jun-1
0
Dec
-10
Jun-1
1
Dec
-11
Jun-1
2
Dec
-12
Jun-1
3
Dec
-13
Jun-1
4
Dec
-14
Jun-1
5
Dec
-15
Jun-1
6
Dec
-16
Jun-1
7
Dec
-17
Jun-1
8
Dec
-18
Chart 8 Non-resident holdings as percetage to total Government
Debt
42
with the help of key offshore centre Singapore moved the foreign exchange rate fixing that is used
to settle the NDF contracts to the onshore market Earlier Association of Banks in Singapore
(ABS) and the Singapore Foreign Exchange Markets Committee (SFEMC) was publishing IDR
reference rate computed as weighted average of 1-month NDF trades done by then Singapore
based brokers Post March 27 2014 BI started publishing reference rate termed as Jakarta Inter-
bank Spot Dollar Rate (JISDOR) which was to be used to settle existing and new contracts Jakarta
Interbank Offered Rate (JIBOR) is more transparent in a way that it is based on actual transactions
being done in the inter-bank onshore market
In late 2018 BI in its efforts to further deepen the domestic foreign exchange market and to
mitigate IDR exchange rate risk BI established the Domestic Non-Deliverable market (DNDF)
for IDR It will serve as a parallel market to NDF with the key difference that it is rupiah settled
in onshore market This alternative tool will provide foreign investors additional avenues to hedge
their IDR exposure without principal exchange other than enhancing the central bankrsquos
intervention capabilities At this juncture the market is relatively new and hence significant impact
assessment of the same cannot be outlined However currently Indonesia has not been able to
move significant turnovers from offshore NDF to Domestic NDF market
Brazil
Brazilian Real is the second most actively traded currency in NDF market after the Korean Won
with an average daily turnover of USD 187 billion as per BIS and USD 154 billion according to
the London survey The growth and development of NDF market is attributed to the existence of
large and well developed foreign exchange futures market
The development of derivatives market in Brazil is attributed to the hedge culture that has been
prevalent due to periods of high and persistent inflation and exchange rate volatility amidst
political shocks During 1980s and early 1990s inflation was soaring above 100 per cent which
peaked over 2700 per cent in 1993 and thus promoted widespread indexation to manage the
inflation risks Subsequently the ldquoReal planrdquo which comprised of fiscal and monetary reform and
introduction of new currency helped to bring down inflation and stabilise the currency Amidst
stable macroeconomic conditions private sector was encouraged to borrow foreign funds at a
43
lower cost and the consequent surge in foreign indebtedness during 1994 to 1998 led the central
bank issue dollar denominated securities as a hedging instrument Following the currency crisis in
1999 the Brazilian Real was floated amongst adoption of new set of economic policies which was
also accompanied by providing unrestricted access to non-residents to financial markets (including
derivatives) in 2000
The distinguishing feature of Brazilian foreign exchange is the non-deliverable nature of
derivatives contracts without any significant limitations even though participation in deliverable
instruments ie spot outright forwards and foreign exchange swaps is constrained Only chartered
banks are authorised by the central bank to hold foreign exchange spot positions All these factors
have facilitated the growth of foreign exchange futures market over spot market which is closed
and highly restricted Against the backdrop of large and sophisticated foreign exchange derivatives
with high depth and liquidity foreign exchange futures prices have key influence on spot price as
suggested by various studies (Ventura and Gracia 2009 Kaltenbrunner 2010 and Chamon and
Gracia 2013) As pointed out by Kaltenbrunner 2010 the existence of a deep futures market has
made it possible for foreign banks with branches in Brazil to sell real offshore (NDF) and
simultaneously hedge their real exposure in the onshore futures market For the Brazilian Real
derivatives especially offshore NDFs are the main vehicle for investors looking to implement
carry trades (Santaelaa 2015)
Taiwan
The NDF market for Taiwanese Dollar (NTD) existed since 1990s and the central bank permitted
domestic and foreign legal entities to trade in NTD NDF market with authorised banks in 1995
This came after opening up of local securities market to foreign institutional investors (QFII) in
1990 which allowed FIIs meeting certain requirements to apply for investment in Taiwanrsquos stock
market Subsequently significant relaxations were made and security market was completely
opened up with the abolition of QFII scheme While onshore institutions were eligible for trading
in NTD NDF the central bank initially imposed limits on trading position in NTD NDF to one
third of their total foreign exchange position with a view to prevent speculative pressure
44
Following the Asian financial crisis in July 1997 the central bank introduced measures to regulate
NDF market with only authorized banks permitted to carry NDF trading with other authorised
counterparts and their overseas branches or headquarters This move came after the speculative
positioning which was believed to cause sharp depreciation of the NTD The central bank outlined
that although there was ceiling on NTD NDF trading positions some banks were engaged in selling
NDFs to foreign entities and simultaneously created long NDFs positions and shorted DFs with
domestic entities in a bid to offset the NDF trading positions on their balance sheets and thus
creating more room for further NDF trading (Bank of Taiwan Annual Report 2014) The central
bank has intervened in foreign exchange market to curb speculative activity also post 2008
financial crisis when emerging markets witnessed resurgence of capital flows The measures
introduced then by the central bank focused on reducing local banksrsquo foreign exchange positions
in both onshore and NDF markets including discouraging non-resident deposits by imposing
punitive reserve requirements with an intent to limit local banksrsquo capacity to provide liquidity to
NDF markets The National Supervisory Commission also took steps to limit non-resident
investments in local bank deposits and government securities
However recognising the dominance of foreign banks in NDF trading activity the central bank
announced that overseas branches of domestic banks are eligible to apply for NTD NDF business
from September 2014 In current scenario whilst there are no restrictions on the fixed income
investments in general but investments in localdomestic bonds by non-residents cannot exceed
30 per cent of their investments in equity instruments which has kept the investments in local
bonds low by non-residents who tend to take exposure in USD bonds issued by Taiwan offshore
Moreover ability for local banksrsquo to access the TWD NDF market up-to 20 per cent of each banksrsquo
net open position results in partial integration between onshore and offshore markets Since TWD
is not fully convertible any onshore spot transactions must be declared to the central bank and in
most cases require supporting documentation which keeps the differential between onshore and
offshore rate
To conclude cross county experience shows that increasing role of any economy globally is
accompanied by emergence of growing offshore trading of their currencies in the presence of
restricted access or cumbersome regulations Additionally emerging market economies cannot
afford to have unrestricted access to their onshore market as revealed by the studies of Indonesia
45
and Malaysia during the Asian crisis 1997 which exposed them to global impulses Most of these
countries have followed a gradual approach surrounding non-resident access to their forex markets
As emerging markets open up and become sophisticated in respect of forex markets the case study
of the Republic of Korea exemplify that country-specific factors have to be considered when
designing the financial regulatory toolkit aimed at curbing foreign and domestic agentsrsquo
speculative strategies in the search for yield The experience of Brazil suggests deepening onshore
hedging market will go a long way in promoting the price setting role of onshore market over its
offshore counterparts Indonesia has recently introduced domestic NDFs in line with Brazil
Additionally the experience of Korea and Taiwan suggests that the participation of domestic banks
ensures that any price differential between the two segments is arbitraged However in both the
cases participation is governed to evade any potential build-up of vulnerabilities on banksrsquo balance
sheet
46
Chapter 34
Linkages between Offshore NDF and Onshore Rupee Markets New Evidence
Overarching Motivation
Indiarsquos trade integration with the rest of the world began to rise sharply from the turn of the
millennium Between 2000 and 2012 total trade (imports + exports) as a percentage of GDP more
than doubled from 26 to 56 before moderating to 43 in 2018 as the effects of de-
globalization took over post the global financial crisis Simultaneously policymakers persevered
with gradual but consistent capital account liberalization Unsurprisingly therefore currency
markets ndash both to trade and hedge ndash rose in tandem with the growing external integration The
onshore Rupee market5 monthly average turnover has grown from USD 60 billion in 2000 to USD
687 billion in 2018 However given data limitations uncertainty still exists on the exact size of
the NDF market and how it has grown relative to the onshore market As Chapter- 2 illustrates
the BIS Triennial Survey finds average daily turnover of Rupee NDF in 2016 was USD 16 billion
However the Bank of Englandrsquos Semi-Annual Forex Turnover Survey finds average daily
turnover of Rupee NDF in London increased from USD 8 billion in October 2016 to USD 23
billion in October 2018
The idea behind trying to size the NDF market ndash and therefore implicitly compare its size and
growth to onshore markets ndash is in part to try and make sense of how important a role NDF markets
play in the ldquoprice discoveryrdquo of the Rupee6 With the Indian Rupeersquos ldquoForwardrdquo price being
determined across segmented markets ndash both the onshore deliverable forward market and the
offshore non-deliverable market -- the key is to ascertain the relative importance of each of these
markets in driving price discovery
4 This chapter is a joint work of Shri Sajjid Chinoy Chief Economist J P Morgan India and Shri Harendra Behera
Assistant Adviser Department of Economic and Policy Research Reserve Bank of India 5 Spot OTC amp ETCD
6 To be sure estimating the size of the NDF market is important not just for the influence it exerts on price discovery
but also instructive in understanding the cumulative ldquoviewrdquo on the Rupee and how much is expressed onshore versus
offshore This is because if NDF volumes are substantial policymakers may desire to shift these volumes on shore
both to (i) deepen the onshore market and (ii) move this businesseconomic activity on shore
47
However simply using (offshore versus onshore) volumes as a means to proxy relative price
discovery is imperfect at best The ability of NDF volumes to drive price discovery for any given
quantum of volumes is ultimately a function of how inter-connected onshore and offshore markets
are and the ability of economic agents ndash hedgers arbitrageurs speculators -- to link these markets
For example if NDF markets have grown sharply but it is found that price linkages between the
two markets are still tenuous or have not increased commensurately with volumes -- say because
arbitrage opportunities between the two markets have not grown in tandem -- then the growth of
NDF markets and the consequent ldquoloss of controlrdquo will be of less concern to Indian policymakers
Conversely if price linkages have grown over time ndash proportionately to volume increases ndash then
policymakers would rightly worry about the growing role of NDF markets in driving price
discovery
The fundamental motivation for this chapter is therefore to empirically examine price linkages
between the NDF and onshore markets as this is the ultimate manifestation of the influence that
NDF markets exert
The Question
This chapter seeks to ask two fundamental questions Is there a stable long-term equilibrium
relationship between onshore and offshore markets Second if so what is the directionality of
influence Do NDF markets drive onshore markets Or do onshore markets drive the NDF market
Or is the influence bi-directional
Furthermore we try and empirically answer this questions across two dimension First what is the
direction and quantum of influence during ldquonormal times versus ldquostressed timesrdquo Second what
is the relationship and how does it change when assessing ldquoaverage returnsrdquo (means) versus
ldquovolatilityrdquo (variance)
Specific Motivation to India
While there is a meaningful and growing literature trying to empirically ascertain price linkages
between the onshore and offshore markets around the world the literature that focuses on India
remains sparse dated and inconclusive This constitutes the specific motivation for this chapter
48
The literature studying NDF markets around the world has steadily grown over time For example
much work has been done on Asian NDF markets and their relationship with onshore markets
both for the region as a whole (Ma et al 2004 Colvecchio et al 2006 Wang et al 2007 Gu and
McNelis 2009) and individual currencies such as the Korean Won (Park 2001) the Indonesian
Rupiah (Cadarajat and Lubis 2012) the Chinese Yuan (Fung et al 2004 Hideki 2006
Colavecchio and Funke 2008 Huszaacuter et al 2016 Song and Gao 2016 McCauley and Shu 2018)
and the Indian Rupee (Misra and Behera 2006 Guru 2009 Behera 2011 Darbha 2012 Goyal
et al 2013)
Results remain mixed Some studies find the NDF markets influence the evidence onshore forward
market (Park 2001 Wang et al 2007 Cadarajat and Lubis 2012) others find they influence
onshore spot markets (Behera 2011 Goyal et al 2013) while some document its influence on
onshore futures markets (Behera 2011) Conversely some studies also find the direction of
influence runs from onshore markets to NDF markets (Wang et al 2007 Misra and Behera 2006)
In the case of India there are only a few studies on this subject ndash with the last one back in 2013 ndash
and the results are mixed and inconclusive For example Misra and Behera (2006) find that itrsquos
the onshore markets that influenced the NDF market between 2004 to 2007 largely because of
restricted participation of domestic players in the offshore market In a subsequent study Behera
(2011) found that there are volatility spillovers from the NDF market to spot and forward markets
in India and the magnitude of volatility spillover has become higher after the introduction of
currency futures in 2008 Guru (2009) finds qualitatively the same results and the role of currency
futures in India Darbha (2012) find that offshore markets play an important role in price discovery
Finally in the most recent work on India (Goyal et al 2013) find evidence of a long-term
relationship between NDF and onshore markets and find evidence that the relationship is
bidirectional as both markets adjust to any deviations from the equilibrium state
Whatrsquos clear however is the evidence on India is patchy inconclusive and dated with the last
study conducted more than 6 years ago
Some Theory
Recall if there are no capital controls forward rates are tied down by the no-arbitrage ldquocovered
interest parityrdquo hypothesis
49
F = S(1+r)(1+r$ )
Where F is the Forward rate S is the spot rate r is the relevant interest rate on the home currency
and r$ is the equivalent dollar rate The equation holds when (i) there is capital account
convertibility and there are no barrier for cross-border transactions and (ii) there is equivalent
credit risk in the assets across the two jurisdictions
However if there are capital-account barriers we would expect F to only be approximated by the
equation above and not hold exactly
So F ~ S(1+r)(1+r$ )
Similarly the NDF rate should be anchored by the onshore forward rate to the extent that
arbitragers can link these markets
So NDF ~ F ~ S(1+r)(1+r$ )
Furthermore the sign of the onshore-offshore yield spread can indicate the underlying market
pressure on the currency If the domestic interest rate is higher than the NDF implied yield it
implies appreciation pressures on the currency However capital controls may restrict inflows to
close the gap Similarly a lower domestic interest rate than implied by the NDF yield would
suggest depreciation pressures while a zero spread would likely reflect an absence of market
pressure on both the domestic and offshore market
All told however we would expect that both onshore and offshore markets would have a long-
run relationship and there is the likelihood of ldquomeanrdquo spillovers on a regular basis Furthermore
hedging arbitrage and speculative activities may also result in volatility spillovers from one
market to another on various occasions
Testing for ldquoMeanrdquo Spillovers
We start therefore by empirically testing for linkages between onshore (spot and forward prices)
and offshore (NDF forward prices) markets The goal is to assess
1 If there is a stable long-term relationship between onshore and offshore markets
2 Which drives which Do onshore prices drove offshore prices Or vice versa
50
3 To see whether the direction of influence is a function of context Are the results
different for ldquonormalrdquo times versus ldquostressed periodsrdquo (ie taper tantrum emerging
market stress)
Non-stationary but co-integrated
So as to decide the empirical course of action we start by testing whether the key variables of
interest (i) the Onshore Spot Exchange Rate (SPOT) (ii) the Onshore Forward Rate (FORWARD)
and (iii) the Offshore Non-Deliverables Forward exchange rate (NDF) are stationary
Augmented Dickey Fuller Tests reveal that all three variables are non-stationary in levels
However as Figures 1 and 2 suggest the spreads between SPOT and NDF and ONSHORE
FORWARDS and NDF are mean-reverting suggesting the presence of a long-term relationship
and suggesting stationarity in the first differences
Formal co-integration tests ndashTables 2 and 3 ndash confirm that both pairs of variables NDF-SPOT and
NDF-FORWARD ndash are indeed co-integrated The Max Eigenvalue tests reveal there is at least one
co-integrating vector that can be found at the 5 level
Null Hypothesis Variables have a unit root
ADF t-Stat Prob
Spot -06 09
Augmented Dickey-Fuller test statistic-07 08
Augmented Dickey-Fuller test statistic-07 08
Table 1 ADF unit root test
-15
-05
05
15
25
09 10 11 12 13 14 15 16 17 18 19
level
Figure 1 Spreads (1M NDF- Spot)
51
-25
-15
-05
05
15
25
09 10 11 12 13 14 15 16 17 18 19
level
Figure 2 Spreads (1M NDF- 1M Forward)
Table 2 Co-integration SPOT and NDF
Sample (adjusted) January 2005 to March 2019
Included observations 2608 after adjustments
Trend assumption No deterministic trend (restricted constant)
Series LOG(SPT) LOG(NDF)
Unrestricted Cointegration Rank Test (Trace)
Hypothesized Trace
No of CE(s) Eigenvalue Statistic Critical ValueProb
None 011 31310 2026 000
At most 1 000 210 916 076
Unrestricted Cointegration Rank Test (Maximum Eigenvalue)
Hypothesized Max-Eigen005
No of CE(s) Eigenvalue Statistic Critical ValueProb
None 011 31100 1589 000
At most 1 000 210 916 076
Both Trace and Max-eigenvalue tests indicates 1 cointegrating
eqn(s) at the 005 level
52
Stable Long Term Relationship
The finding of co-integration allows us to use ordinary least squares (OLS) to estimate the long-
term relationship between SPOT and the NDF as well as FORWARD and the NDF In particular
using the equation below we estimate parameters β0 and β1 which tells us about the long-term
relationship between SPOT and NDF
We then repeat the same exercise between the FORWARD and the NDF
But whatrsquos driving what An ldquoError Correction Mechanismrdquo approach
While establishing a long-term relationship is important a finding in the affirmative will not come
as a particular surprise Instead the real question is whether onshore prices drive offshore prices
or vice versa The natural framework to answer this is the work-horse Error Correction Mechanism
(ECM) approach used by Engel and Granger in 1987 where changes in each of the variables are
run on changes on its own lags and the lags of the other variables
Table 3 Co-integration FORWARD and NDF
Sample (adjusted) January 2005 to March 2019
Included observations 2608 after adjustments
Trend assumption No deterministic trend (restricted constant)
Series LOG(FORWARD) LOG(NDF)
Unrestricted Cointegration Rank Test (Trace)
Hypothesized Trace
No of CE(s) Eigenvalue Statistic Critical ValueProb
None 018 53051 2026 000
At most 1 000 217 916 074
Unrestricted Cointegration Rank Test (Maximum Eigenvalue)
Hypothesized Max-Eigen 005
No of CE(s) Eigenvalue Statistic Critical Value Prob
None 018 52835 1589 000
At most 1 000 217 916 074
Both Trace and Max-eigenvalue tests indicates 1 cointegrating
eqn(s) at the 005 level
53
119889119897119900119892(119904119901119900119905)119905 = 1205720 + 120572119904119901119900119905(119890119905minus1) + sum 12057211(119894)(119889log (119904119901119900119905119905minus1))119899119894=1 + sum 12057212(119894)(119889log (119873119863119865119905minus1)) + 120576119904119905
119899119894=1 (1)
119889119897119900119892(119873119863119865)119905 = 1205720 + 120572119899119889119891(119890119905minus1) + sum 12057221(119894)(119889119897119900119892(119904119901119900119905119905minus1))119899119894=1 + sum 12057222(119894)(119889119897119900119892(119873119863119865119905minus1)) + 120576119899119905
119899119894=1 (2)
For example as Equation 1 lays out changes in (the log of) SPOT ndash the dependent variable -- are
run on its own lags and the lags of NDF Equation 2 ndash in which the dependent variable is NDF --
does the same for NDF Because both variables are co-integrated ndash as shown above ndash using OLS
to estimate these coefficients using standard criterion to choose lag lengths (eg Akaike
Information Criterion) and standard F-Tests are all valid
The coefficients of interest in the above equation are 120572119904119901119900119905 and 120572119899119889119891 ndash the ECM terms -- because
these coefficients tell us when the system is in disequilibrium the direction and the speed of
adjustment back to equilibrium This will determine the directionality of influence
For example if 120572119904119901119900119905 = 0 and if all values of 12057212(119894) = 0 then dlog(NDF) does not granger cause
dlog(spot) In contrast if the value of 120572119904119901119900119905 is negative and statistically significant that implies
that (the log of) NDF in the long run ldquoganger-causesrdquo spot market movements The same intuition
applies for equation 2 where NDF is the dependent variable and we test for convergence between
the NDF rate and the onshore forward rate Direct convergence requires 120572119904119901119900119905and 120572119899119889119891 to be
oppositely sign Intuitively the larger the value of α the faster is the speed of adjustment
In summary while the βrsquos tell us about the existence and strength of a long run relationship
between onshore and offshore markets the αrsquos tell us about whether (i) the directionality of
influence and (ii) the speed of convergence from disequilibrium
We therefore use this approach to test for linkages between both sets of variables ndash NDF and
onshore SPOT ndash and NDF and onshore FORWARDS
Data
We use end-of- India-day closing values for the onshore spot exchange rate for the 1-month a
forwards and the corresponding 1-month non-deliverable-forward (NDF) rates We use daily data
and our full sample runs from 2009 through 2019
54
Results Full Sample
Table 4 ECM and Long run coefficients (Full sample)
The first row are the linkages between the onshore spot and NDF markets while the second row
is that of the onshore forwards and NDF market
In both cases the betas (β) are positive statistically significant and with a magnitude very close to
or at 1 implying an almost one-for-one movement between both the markets in the long run For
example the estimated β1 of 099 suggests that for a 1 increase in NDF rates there is 099
increase in spot rates in the long run Meanwhile between onshore FORWARDS and NDF there
is a complete pass-through in long run More generally a beta (β) close to 1 suggests there is no
permanent friction between onshore and offshore markets in the long run
Convergence
However the real interest is in the alphas In the first case both 120572119904119901119900119905 and 120572119899119889119891 are statistically
significant and oppositely signed This suggests that they both converge towards each other Put
differently the NDF rate moves towards the onshore SPOT rate and vice-versa In other words
there is a bi-directional relationship between both variables The magnitude of the coefficients
(007-018) suggests a moderate speed of convergence to the long-run equilibrium when a shock
causes the system to go into disequilibrium
The same results are obtained when studying linkages between the onshore forward and NDF
markets Both 120572119891119900119903119908119886119903119889 and 120572119899119889119891 are statistically significant oppositely signed (suggesting they
converge towards each other) with coefficients that are slightly larger than the SPOT-NDF pair
This suggests that both NDF and the onshore FORWARD rates influence each other and gradually
converge towards their long-term relationship when hit by a shock ndash a speed of adjustment that is
modestly faster than the NDF-SPOT relationship
Time Period April 2009 to March 2019
Onshore Spot and NDF -018 007 099
Onshore Forwards and NDF -032 023 100
55
For the full sample as a whole from 2009 to 2019 we find that there is a bi-directional relationship
on average between SPOT and NDF and FORWARD and NDF and that all variables converge
gradually to their long-term relationship
Results Stressed Times
Our results should be thought of as ldquoaveragerdquo results across the entire time period But are these
results a function of context Does the direction of influence change for example during periods
of currency stress versus periods of calm We explore this next
To test for this we start by isolating clearly-identifiable periods of stress ex post facto in our
simple Two episodes naturally come to mind the taper tantrum of 2013 (where the Rupee
depreciated 26 between May 2013 and August 2013) and the emerging market (EM) turmoil ndash
characterized both by the Fed raising rates and oil prices firming ndash such that the Rupee depreciated
almost 10 between August 2018 and October 2018
2013 The Taper Tantrum
We test interlinkages from the start of May to the end August 2013 ndash during the Taper Tantrum ndash
when the Rupee was under intense pressure and easily amongst the worst performing currencies
in the emerging market (EM) universe Results are presented in Table 5 below
Table 5 ECM and Long run coefficients
As one can observe 120572119899119889119891 in both equations is statistically insignificant What this implies is onshore
spot and forward rates were playing very little role in influencing NDF rates7 In contrast 120572119904119901119900119905 and
120572119891119900119903119908119886119903119889 are correctly signed and statistically significant (the former at the 1 level and the latter
at the 10 level) which suggests it was the NDF rate that was driving the onshore spot and forward
rates Interestingly the speed of adjustment is much faster for onshore spot rates in this sample (-
11) compared to the full sample (-018) and also relative to the onshore forward market (-08) An
7 In fact onshore spot and forward rates do not granger cause NDF as none of the lags of 12057221(119894) in equation 2 are
statistically significant during this period
Onshore Spot and NDF -11 -028 094
Onshore Forwards and NDF -08 015 097
Time Period May 2013 to August 2013
56
ECM (alpha) coefficient of greater than 1 suggests the witnesses an oscillating convergence Since
a coefficient greater than 1 is prime facie surprising we also conduct a robustness exercise
(described below) by running Granger Causality tests for this time period and find it is the NDF
that Granger-causes onshore rates and not the other way around
This finding likely reflects the growing volumes ndash potentially speculative ndash in the NDF market in
the 2013 period of stress relative to the volumes in the onshore market This also prime facie
reduced the efficacy of foreign currency intervention by the central bank because intervention was
used to shape the spot exchange rate at the end of Indiarsquos business day But because the NDF is a
24 hour market NDF rates evolved overnight and when the Indian market opened the next day
onshore rates were influenced by NDF developments overnight This rendered ineffective the
previous dayrsquos intervention because there was often little correlation between the closing exchange
rate of the previous day and the opening rate of the next day and therefore necessitated additional
intervention the next day
Visually this is evident in the ldquogap-uprdquo movements of the exchange rate when the Indian market
opened ndash vis-a-vis the previous dayrsquos close ndash during those three months Figure 3 for example
captures this for the month of August 2013
Figure 3 Gap-up opening in USDINR (August 2013)
Source Bloomberg
57
2018 More of the Same
Emerging markets came under renewed stress in the summer of 2018 against the back drop of the
Fedrsquos hiking cycle accompanied by the rally in crude pieces which had surged 50 over the course
of a year As some large emerging markets ndash Argentina Turkey ndash came under some stress there
was a contagion to all emerging markets with current account deficits of which India was one
Between May and October 2018 the Rupee depreciated almost 10 against the US Dollar
What were the offshore-onshore linkages during that period of time Results are presented in Table
6
Table 6 ECM and Long run coefficients
The linkages mimic 2013 The coefficient on whether onshore drives offshore 120572119899119889119891 is insignificant
in both regressions This re-affirms that in line with 2013 onshore spot and forwards were not
driving the NDF rate8 In contrast 120572119904119901119900119905 and 120572119891119900119903119908119886119903119889 are both correctly signed quantitatively
meaningful and statistically significant This suggests that it was the NDF rate that drove the
onshore spot and forward during this period likely reinforcing the presumption that volumes rise
sharply in NDF markets during periods of stress which then become the hub of price discovery
and influences onshore rates As Figure 4 reveals this is visible in the ldquogap-uprdquo movement of the
Rupee at the start of the day for several days in the month of August 2018
8 Onshore spot and forward rates does not granger cause NDF as none of the lags of 12057221(119894) in equation 2 are
statistically significant
Time Period August 2018 to Nov ember 2018
Onshore Spot and NDF -10 -05 096
Onshore Forw ards and NDF -115 -05 096
58
Figure 4 Gap-up opening in USDINR (August 2018)
Source Bloomberg
Our analysis also reveals that the speed of adjustment is very rapid relative to the baseline
Robustness test
The results are robust to the selection of time and tenure of the NDF For example instead of
India end-of-day (EOD) time as the NDF cut-off if we consider New York EOD as the NDF cut-
off there are no qualitative changes in the results Similarly instead of considering the 1-month-
NDF if we consider the 3-month-NDF the results essentially stay the same Furthermore given
the short time periods involved during stressed times (May to August 2013 and August to
November 2018) one can argue that co-integration equations may not be relevant We therefore
also carry out Granger causality tests for these time-periods and find the direction of causality to
be just above ie NDF rates are driving onshore rates during stress periods and not vice versa
Controlling both ldquoMeanrdquo and ldquoVolatilityrdquo spillovers
Thus far our focus has been on mean spillovers However as found by Misra and Behera (2006)
there are also potential ldquovolatilityrdquo spillovers from the NDF market to the spot and forward market
To model the coexistence of both mean and volatility spillovers we use a multivariate generalised
autoregressive conditional heteroskedasticity (MGARCH) model The degree of volatility
59
spillovers is measured by estimating dynamic conditional correlations between the markets The
empirical analysis is conducted using daily data from April 1 2009 through March 29 2019 and
using the currency pairs for (i) NDF-Spot (ii) NDF-Forwards and (iii) NDF-Futures
This model examines simultaneous interactions of conditional returns and volatilities across the
markets In this modelling framework we examine the Granger-causality in mean and variance as
discussed in Behera (2018) The results corroborate the earlier results that there is bi-directional
mean spillovers between onshore and offshore markets (Table 7)
An important finding using this approach is that the impact of price spillover from offshore to
onshore remains up to substantial lags while that from onshore to offshore dissipate after one day
(Annexure II) This ensues from the result that the individual coefficient estimates in the mean
equations of BEKK-MGARCH model are found to be statistically significant up to 5 lags in the
regression of returns in onshore market on that of offshore market while in the opposite case the
coefficient of onshore return is statistically significant only for the first lag
Table 7 Granger-causality tests in Mean
Direction of Causality Results
Spot to NDF 1-Month Yes
Spot to NDF 3-Month Yes
Spot to NDF 6-Month Yes
NDF 1-Month to Spot Yes
NDF 3-Month to Spot Yes
NDF 6-Month to Spot Yes
Forward 1-Month to NDF 1-Month Yes
Forward 3-Month to NDF 3-Month Yes
Forward 6-Month to NDF 6-Month Yes
NDF 1-Month to Forward 1-Month Yes
NDF 3-Month to Forward 3-Month Yes
NDF 6-Month to Forward 6-Month Yes
Futures 1-Month to NDF 1-Month Yes
Futures 3-Month to NDF 3-Month Yes
Futures 6-Month to NDF 6-Month Yes
NDF 1-Month to Futures 1-Month Yes
NDF 3-Month to Futures 3-Month Yes
NDF 6-Month to Futures 6-Month Yes
Note Null hypothesis is rejected if the p-value in the Wald test is less than 5 per cent
60
Volatility spillover between markets are studied by examining the statistical significance of
individual coefficients Granger causality in variance tests and estimating the dynamic conditional
correlations Beginning with granger causality test results imply a bidirectional causal relationship
between volatilities in both onshore and offshore markets of 1-month maturity segments only
(Table 8) In normal times no volatility spillovers are observed across the markets in other
maturity segments which reverses in the period of increased uncertainty (as found from Granger-
causality-in-variance tests taking into account asymmetric effects) The results from individual
coefficient estimates indicate about the presence of short-term volatility spillover between the
markets while the long-term volatility transmission is statistically significant from NDF market
to onshore spot forward and futures markets Moreover the asymmetric coefficients in variance
equation provide interesting insights ndash with the evidence of rise in volatility spillover from onshore
to offshore market in case of rupee appreciation while the opposite happens ie the volatility
spillover increases from NDF market to onshore market in the episodes of rupee depreciation
(Annexure II)
Table 8 Granger-causality tests in Variance
Direction of Causality Results
Without Asymmetry Effect With Asymmetry Effect
Spot to NDF 1-Month No Yes
Spot to NDF 3-Month No Yes
Spot to NDF 6-Month No Yes
NDF 1-Month to Spot No Yes
NDF 3-Month to Spot No Yes
NDF 6-Month to Spot No Yes
Forward 1-Month to NDF 1-Month Yes Yes
Forward 3-Month to NDF 3-Month No Yes
Forward 6-Month to NDF 6-Month No Yes
NDF 1-Month to Forward 1-Month Yes Yes
NDF 3-Month to Forward 3-Month No Yes
NDF 6-Month to Forward 6-Month No Yes
Futures 1-Month to NDF 1-Month Yes Yes
Futures 3-Month to NDF 3-Month No Yes
Futures 6-Month to NDF 6-Month No Yes
NDF 1-Month to Futures 1-Month Yes Yes
61
NDF 3-Month to Futures 3-Month No Yes
NDF 6-Month to Futures 6-Month No Yes
Note Null hypothesis is rejected if the p-value in the Wald test is less than 5 per cent
In order to understand how the volatility spillover between the markets changed over time a
variant of MGARCH model viz dynamic conditional correlation (DCC) model as proposed by
Engle (2002) is estimated taking the same pair of onshore-offshore exchange rate returns The
conditional volatility of 1-month NDF 1-month futures and their dynamic correlations are plotted
in Chart 249 The chart shows a sudden and significant rise in volatility during the episodes of
European debt crisis taper tantrum and latter part of 2018 coinciding with the rise in offshore-
onshore spreads resulting from the concerns regarding high current account deficits and large
capital outflows It is important to note that the volatility in NDF market is higher compared to
futures market and the divergence between the two gets accentuated in the times of heightened
uncertainty This in turn in conjunction with the rise in information asymmetry results in a drop
in correlations Since volatility spillover increases from offshore to onshore markets as discussed
earlier during periods of heightened uncertainty the volatility in onshore market increases
following the heightened volatility in offshore market In subsequent periods the correlation
increases indicating about the rise in spillovers A closer examination of the data on the volatilities
in two markets shows that volatility increases in offshore market first before it increase in onshore
markets with a lag of 1 to 2 days The correlations being positive and substantially higher imply a
significant degree of spillovers between the markets
9 The conditional volatilities for other pairs are qualitatively almost similar though their dynamic correlations are
different the dynamic correlations are provided in Chart 25
62
The dynamic correlations of volatilities for different pairs are presented in Chart 25 reveal that
that all the correlations were highly integrated and moving together alike until end December 2014
However the apparent structural changes in correlation process were observed since then with the
trends of correlations of NDF with spot and forward moving in one direction and that of NDF and
Futures moving on the opposite direction until mid-2017 The correlations have started coupling
though still continuing with some gaps between them since July 2017
060
065
070
075
080
085
090
095
00
05
10
15
20
25
30
2009 2010 2011 2012 2013 2014 2015 2016 2017 2018
Chart 24 Time-varying Volatility and Correlations Futures and
NDF
1-month Futures 1-month NDF DCC (right scale)
63
Conclusions and Implications
Since the work on establishing onshore-offshore price linkages in India was relatively sparse
outdated and inconclusive the goal of this Chapter was to create an updated empirical fact base
given the rapidity with which capital markets have developed and integrated and the pace at which
the NDF market has grown The overall results present a bidirectional relationship between
onshore and offshore markets
First that for full sample the price linkages ndash both mean and volatility ndash are found to be
bidirectional Both onshore and offshore rates have a strong long-term relationship and that when
a shocks throws that relationship into disequilibrium both onshore (spot and forward) and offshore
rates converge towards each other This suggests both influence each other This is consistent with
earlier findings in literature and should not be surprising Relative volumes across these market
are very dynamic and vary significantly When the bulk of the volumes flow through the onshore
050
055
060
065
070
075
080
085
090
095
100
2009 2010 2011 2012 2013 2014 2015 2016 2017 2018
Chart 25 Dynamic Conditional Correlations of Volatilities
SPOT_NDF1 SPOT_NDF3 SPOT_NDF6 FW1_NDF1 FW3_NDF3
FW6_NDF6 FUT1_NDF1 FUT3_NDF3 FUT6_NDF6
Forwards
Futures
Spot
64
market it becomes the locus of price discovery The converse is true when the bulk of volumes
are routed through the NDF market which then becomes the principle pole of price discovery
During the last two stress episodes (the taper tantrum and the 2018 EM crisis) however the
relationship turned unidirectional with the NDF market driving onshore spot and forwards and
the speed of adjustment from any disequilibrium increasing very sharply compared to ldquonormalrdquo
times Furthermore volatility spillovers also increased from offshore markets to onshore during
the periods of heightened uncertainty There is however an interesting asymmetry There is
evidence of rise in volatility spillover from onshore to offshore market in case of rupee
appreciation while the opposite happens ie the volatility spillover increases from NDF market to
onshore market in the episodes of rupee depreciation
All told as NDF volumes have increased they have begun to play an important role in both price
discovery and driving volatility particularly during heightened uncertainty periods
65
Chapter 4
International Financial Service Centre (IFSC)10 ndash Use of Rupee derivatives
The Task Force (TF) is vested to examine the role if any IFSC can play in addressing the concerns
arising out of offshore Rupee markets Presently Rupee is not permitted to be traded in the IFSC
This chapter discusses the aspects relevant to availability of non-deliverable Rupee derivatives in
the IFSC and permitting banks (IFSC Business Units or IBUs) to deal in such derivatives Before
discussing the potential benefits and concerns from the aforesaid proposition it is important to
address this issue ndash Are markets in IFSC onshore or offshore In the context of the Rupee market
a critical test for deciding the residency of the market would be applicability of capital controls in
respect of taking and exiting positions under FEMA 1999 Inter alia this is the critical aspect in
difference between the price discovered in onshore and offshore market As the IFSC functions
outside the capital controls under FEMA 1999 type of participants and the price discovered in
Rupee markets here will align with the existing offshore markets and therefore it cannot be treated
as onshore market To sum up while legally IFSC is very much an entity on the shores of India
from the point of view of Rupee markets it has to be treated as an offshore entity
Potential benefits of permitting non-deliverable Rupee derivatives in the IFSC
i Bringing NDF market volume to the IFSC Over the last decade or so a significant
market share in financial services related to India has moved to other international financial
centres like Singapore Hong Kong and London Bringing this business to India is clearly
beneficial in terms of economic activity and employment gains for India Further the size
and growth of the offshore Rupee derivative market poses a significant challenge to the
efficiency of price discovery as well as the effectiveness of exchange rate management
policy The possibility that the exchange rate of the Rupee not a fully convertible currency
being materially determined by transactions largely outside the legal and regulatory
influence of India is a matter of concern Given the favourable tax regime tax and by virtue
10
International Financial Services Centre or lsquoIFSCrsquo has the same meaning given in Section 2 (q) of the Special
Economic Zones Act 2005 (28 of 2005)
66
of it being outside the capital controls under FEMA 1999 IFSC may bring volumes and
price discovery to India
ii Complete bouquet of financial services in the IFSC Currently exchanges in IFSC are
permitted to offer a well-diversified range of products spanning various asset classes
which include derivatives on Indian indices derivatives on Indian stocks derivatives on
foreign stocks cross currency derivatives commodity futures on Gold Silver and base
metals etc Further while listing and trading of Masala Bonds is permitted in the IFSC
hedging Rupee exchange rate risk on it is not permitted Thus introduction of Rupee
derivatives will complete the entire range of asset classes available for trading in the IFSC
iii Access to market information The offshore Rupee market has been the subject matter of
interest for all stakeholders as these markets have an impact on onshore markets However
in the absence of any authentic data there are varying estimates about the volumes traded
in these markets nature of participation extent of open interest and the extent to which
these markets are used for hedging purposes If by opening up the IFSCs to Rupee trades
there is some migration of offshore Rupee market volumes it will help the cause of better
information flow regarding the market
iv Level playing field for Indian banks Foreign bankrsquos branches outside India can deal in
the offshore market as they are not bound by the RBIrsquos regulations On the other hand
overseas branches of Indian banks cannot deal in Rupee derivatives in the offshore market
By introducing Rupee derivatives in IFSC and permitting IBUs to deal in such derivatives
a more level playing field can be provided to Indian banks to service non-residents
Concerns from non-deliverable Rupee derivatives trading in the IFSC and dealing by IBUs
such derivatives
i Cannibalizing onshore business One major concern arising out of the introduction of
non-deliverable Rupee derivatives in the IFSC is whether it would cannibalize the business
of the onshore market instead of importing volumes from abroad Since the products in
both IFSC and the onshore market would be more or less similar in terms of characteristics
the domestic futures market getting gradually cannibalized by the IFSC on the face of it
appears probable But a deeper analysis of the comparative regulatory framework would
allay such concerns to a large extent The domestic currency futures market is majorly
67
made up of resident participation Non-residents are nearly absent in these markets and
hence their shift to the IFSC is more a theoretical proposition Since the Indian residents
are not permitted to participate in the IFSC they cannot contemplate a move-over It also
important to note that the onshore market settles in INR whereas derivative contracts in
the IFSC would settle in dollars and hence these markets will cater to two distinct classes
of participants
ii Impact on exchange rate management policy and development of the onshore market
Presently Indian banks are not allowed to deal in Rupee derivatives in the offshore market
A detailed discussion on the issue of allowing such dealing is presented in Chapter 5 In
consideration of the risk that participation of Indian banks may improve liquidity in the
offshore market and undermine the development of the onshore market the TF is of the
view of that Indian banks should not be permitted to deal in offshore Rupee market IFSC
being an offshore centre all concerns expressed in Chapter 5 in this regard are valid on
Rupee market in IFSC also However unlike other offshore Rupee market venues IFSC
has the potential of providing certain benefits to India as discussed earlier in this chapter
and therefore a distinction could be made between the two while examining the case of
permitting Rupee derivatives to be traded in the IFSC
iii Spillover of risks from IFSC to onshore market This is a concern since the two
markets being geographically contiguous could create porous leakage channels This
concern can be addressed by stipulating distinct net open position limits for entities
operating in both IFSC and on-shore In other words the open positions of entities
operating in the IFSC should not be permitted to be netted off with the open position on-
shore
What does a volatile Rupee exchange rate in the IFSC imply for the RBI and onshore
market
Chapter 3 establishes the linkages between the offshore and onshore Rupee market IFSC being an
offshore jurisdiction will have the same impact The RBI as the monetary authority has the
authority under RBI Act to maintain the stability of the rupee A volatile onshore foreign exchange
market could act as the trigger point of volatility in other financial markets like money bonds and
68
equities The spill over impact of financial market volatility casts its shadow on asset prices and
in turn it could have an impact on the capital flows and financial stability Given that a separate
regulator is envisaged for the IFSC the issue of RBIrsquos role in the IFSC was extensively deliberated
by the TF There are two possible approaches
i RBI plays a pivotal role in framing the Rupee derivative regulation in the IFSC In
order to allow the RBI to take measures in line with the objectives of exchange rate
management policy the sine qua non for allowing Rupee derivatives in the IFSC is to
ensure that RBI vested with the obligations to maintain financial and monetary stability
should continue to perform its statutory role in determining the regulatory framework for
Rupee market in the IFSC
ii Treat it akin to any other offshore market and maintain a hands-off approach The
objective of introducing Rupee derivatives in the IFSC is to provide an alternative to non-
residents for dealing in non-deliverable Rupee derivatives The expected transition of
investors is likely to be successful only if the IFSC functions with same freedom as other
offshore markets At the same time from an exchange rate management perspective
permitting Rupee trading in IFSC should not make a material difference to local authorities
as long as there is a barrier between the onshore market and IFSC In that case IFSC would
be exactly of the same status as any other offshore market
The TF feels that in line with the objectives of permitting Rupee derivatives in the IFSC the latter
approach - that the regulatory environment in which Rupee trades in IFSC is exactly similar to the
environment that prevails in any other offshore centre - is preferable As IFSCs are treated on par
with a foreign jurisdiction in terms of FEMA the regulation of the trade and capital flow channels
between the two jurisdictions (on-shore and IFSCs) should be so designed as to restrict the
transmission of volatility through these channels (in terms of participants products limits etc)
Recommendation
While there are concerns around impact on the onshore market due to trading in Rupee derivatives
in the IFSC there are potential benefits in terms of IFSCrsquos ability to offer complete bouquet of
financial services and availability of market information to all stakeholders Further given Indiarsquos
69
economic growth it may be appropriate to prepare for greater financial integration with the rest of
the world Sequencing and timing of measures relating to currency markets is a critical component
of such integration Although at the moment there is no definite path ahead in terms of such
integration but a thriving Rupee market in the IFSC may provide a system which can be leveraged
towards this end in the way and manner deemed fit in future IFSC being outside the capital
controls provides an opportunity to policymakers to test new regimes and products in an
environment whose repercussions may not significantly impact the stability or efficiency of the
onshore system On balance the TF is of the view that non-deliverable Rupee derivatives may be
introduced in the IFSC However a phased approach may be adopted and to start with trading
may be permitted only on exchanges due to the inherent transparency and risk management
benefits offered by it Introducing OTC contracts may be considered at a later stage after the
experience gained from trading on exchanges RBI may in its Financial Stability report assess the
impact of the functioning of IFSC on the financial stability of the country
Further the TF is of the view that entities regulated and permitted by the RBI may be permitted
to make market and run positions in Rupee derivatives market in the IFSC In order to prevent
spill over of risks from IFSC to onshore market though these entities a distinct net open position
limit may be stipulated for their operations in the IFSC In other words the open positions of
entities operating in the IFSC should not be permitted to be netted off with their open position
the onshore market
Finally given the mandate of RBI to implement exchange rate policy it may not be in benefit of
things to introduce Rupee derivatives in the IFSC without it being on board and therefore the TF
feels that Rupee derivatives may be permitted in the IFSC subject to agreement of the RBI
70
Chapter 5
Issues and Recommendations
The Task Force (TF) is entrusted to recommend measures to incentivize non-residents to access
the onshore Rupee derivative market and address concerns if any arising out of the offshore
Rupee derivative market As discussed in Chapter 1 the TF had interactions with various
categories of stakeholders to understand their perspective on the matter and identify the issues that
needs to be addressed
Chapter 2 and 3 have clearly brought out the increased importance of offshore Rupee markets
both in terms of their size and in terms of their impact on the exchange rate of the Rupee The price
and volatility spillovers from one market to the other are almost complete they are bi-directional
and when rupee is under pressure they are unidirectional from offshore markets to onshore
markets The speed of convergence of the markets is also quite quick The TFrsquos recommendations
have been made in the light of available information results of statistical analysis and most
importantly on the feedback received from various consultations
While increased participation of non-residents would be expected to enhance liquidity in the
onshore market it may also bring along with it additional volatility and transfer of incremental
risk to the domestic system This is particularly so as historically the rupee is a currency that has
generally depreciated and the demand for forward dollars is usually more than the supply
especially in times of stress Hence it is pertinent to examine the impact of incremental hedging
by non-residents in the onshore market While volatility in the rates have a clear impact on the real
sector events in the domestic derivatives markets in the late 2000s constantly remind us of issues
related to transfer of risk to entities that are not capable of understanding and managing it The big
question then is whether our system today is ready for incremental demand for hedging from non-
residents Available data is inadequate to measure the contribution of hedgers and speculators in
the offshore market turnover Using the best available information it can be estimated that an
additional daily average Rupee derivative turnover of around 08 billion ndash 24 billion could be
generated in the onshore market if all the INR NDF hedging transactions are transferred from the
offshore market (see Box 1) Such an incremental flow is not significant enough to cause any
adverse impact on volatility in the onshore market given that the user-driven deliverable forwards
market in India is quite liquid with daily average turnover of USD 163 billion (as per BIS
71
Quarterly Review December 2016) As regard transfer of risk to the domestic system the concern
is more regarding transfer of risk to the Indian companies and less towards market-makers as they
are in the business of managing risk There is a possibility that the said incremental positions
created in the onshore market may get transferred to Indian companies (in part or full depending
upon the level of these positions retained by the market-makers) However in comparison with
the late 2000s Indian companies today are only allowed to enter into Rupee derivatives depending
on their underlying exposure and no leveraged structures are permitted Also banks are bound by
stringent suitability and appropriateness norms Therefore the chances of Indian companies
acquiring unmanageable risk positions or risks due to mis-selling by market-makers are very low
Further there has been a significant growth in the external sector and consequently the foreign
exchange market has also grown (although one could argue on the incommensurate growth) To
summarize in the last decade or so the ecosystem on the whole has evolved and is less prone to
adverse impact from transfer of risks from non-residents
Box 1
Approximation of share of hedging transactions in INR NDF turnover
The graph presented below is extracted from BIS Quarterly Review December 2016
72
It can be observed from the above graph that non-financial and other financial institutions
contribute around 5 and 35 respectively to the turnover of INR NDFs in the offshore market
If one were to make an informed guess that all transaction by non-financial companies are hedging
transactions and that hedging transactions by other financial companies (eg funds) would
constitute maximum 25 of their transaction then it can be approximated that hedging transactions
constitute around 5 - 15 of the daily average turnover in INR NDF market which was reported
as USD 164 bn
Comparison of turnover in forwards in onshore and offshore market - In the same publication
it is also reported that the average daily turnover in onshore deliverable forwards is USD 163 bn
It may be noted that for fair comparison with the turnover in offshore market (where deliverable
spot and swap market doesnrsquot exist) this turnover includes both deliverable forwards and FX
swaps A comparative analysis of volumes in onshore and offshore market ndash both OTC and
exchange traded Rupee derivatives - is given in Annexure IV
Issues and recommendations
1 Market hours
An important reason for the existence of the offshore Rupee derivative market is simple geography
That domestic markets are closed when major users in certain regions (eg the United States) are
working creates a natural access for offshore markets Also significant international developments
impacting the Rupee exchange rate take place outside the onshore market hours thereby creating
a natural clientele for the offshore markets The feedback received from non-resident investors as
well as corporates highlighted the closure of the local market as an important reason for them
accessing the offshore market Exchanges have for some time been requesting an extension of
market hours citing increasing Rupee transaction volumes in offshore exchanges situated in
Singapore and Dubai A straightforward way of taking care of such requirements is to extend the
onshore market hours (both OTC and exchange traded derivative markets) While extending
market hours might involve simultaneously keeping support services (payment and settlement
systems) or support markets (funding markets) open it is also possible to treat such transactions
as part of the operations of the next day in which case the need for settlement or funding does not
73
arise In this regard the TF supports the recommendations relating to market timings outlined in
the draft Report of the Internal Working Group on Comprehensive Review of Market Timings
published by RBI on July 10 2019
Recommendation 1
The TF recommends that the onshore market hours be suitably extended to match the flexibility
provided by the offshore market and thereby incentivize non-residents to hedge in the onshore
market
2 Competitive pricing
One important feedback from foreign portfolio investors (FPIs) as well as global corporates was
that they are unable to access multiple competitive quotes in the onshore market Effectively they
are limited to using the prices of their custodian banks Generally FPIs deal only with their
custodian banks due to the existing rules whereby the custodian is responsible for tracking of
outstanding hedges vis-agrave-vis portfolio size This ldquofrictionrdquo issue can be addressed by shifting the
monitoring to a centralized agency which can use a technology solution to track exposures as well
as outstanding hedges This is further explained in recommendation no 4 ahead relating to
underlying exposure
Also the process to be setup documentation such as KYC and other trading arrangements with
multiple counterparties in India is a long and difficult exercise resulting in most FPIs either trading
with their custodian bank or using the offshore market to hedge Some of the documentation related
challenges can be minimized if the centralized KYC registration currently in place for SEBI
regulated entities is extended to all the entities ie both custodial banks as well as non-custodial
banks This is elaborated in recommendation no 11 on the KYC process
Another issue highlighted by FPIs in this context was unavailability of multi-dealer electronic
dealing platforms for them One way of making onshore prices more widely accessible to non-
residents is to allow Indian banks to freely offer prices as liquidity providers to non-resident
customers at any time whether or not the domestic market is open They can extend to non-resident
corporates the same choices that domestic corporates have in choosing among various market
makers This can be done either by a domestic sales team or by using staff located at overseas
74
branches In addition making an all-to-all trading platform (like the FX-Retail being introduced
in August 2019) available to non-residents would supplement that effort
Recommendation 2
The TF recommends that banks may be allowed to freely offer prices to non-residents at all times
out of their Indian books either by a domestic sales team or by using staff located at overseas
branches Also wide access to the FX-Retail trading platform to non-residents would be a major
incentive to use the onshore market
3 Effect of offshore Rupee derivative market on onshore price discovery and exchange rate
management policy
The size and growth of the offshore Rupee derivative market especially in the last few years poses
a significant challenge to the efficiency of price discovery as well as the effectiveness of exchange
rate management policy A comparison of onshore and offshore Rupee derivative market is given
in Annexure IV The possibility that the exchange rate of the Rupee not a fully convertible
currency will be materially determined by transactions largely outside the legal and regulatory
influence of India is a matter of concern The most straightforward approach to deal with that
concern would be to completely liberalize the onshore market and bring it at par with the offshore
market in all aspects Such a scenario would imply an effective absence of local regulation and
intervention which is incompatible with the current status of capital account convertibility
Another option is to liberalise the onshore market to the extent possible but this in itself may not
necessarily mean a fall in importance or size of the offshore market In this connection the TF
extensively discussed the proposition of creating a connection between the offshore and onshore
markets by permitting Indian banks to deal in the offshore market The various implications of
such a step are discussed below
i Reduction in volatility In theory a segmented market would be less liquid and therefore
more volatile compared to an integrated market One could also infer that offshore market
activity is maximum during onshore working hours eg almost three-fourths of the
offshore rupee futures are traded when Indian markets are open It is also observed that
75
offshore spreads are larger which indicates a relative scarcity of market-making entities
Linking the two markets may increase both the customer base as well as the liquidity
providers thereby improving liquidity as well as efficiency of the price discovery process
ii Better customer pricing through increased transparency in the offshore market
Today very little information is available regarding the offshore Rupee market other than
that of exchange traded instruments Such opacity is not in the interest of customers as
liquidity provision is limited to entities that have a presence both onshore and offshore
resulting in a premium (in terms of high bid-ask spreads) being charged for market access
Broadening this access to onshore banks would drive away such premium through wider
competition At the same time access to information improves for the local authorities
Since better information leads to better price efficiency it is in the interest of local
authorities to disseminate such information leading to an overall improvement in market
transparency
iii Level playing field for Indian banks Foreign bankrsquos branches outside India can deal in
the offshore market as they are not bound by the RBIrsquos regulations On the other hand
overseas branches of Indian banks cannot deal in Rupee derivatives in the offshore market
Allowing them access to the offshore Rupee derivative market would create a level playing
field for Indian banks
iv Impact on development of the onshore market Liquidity in onshore market is better
than the offshore market due to participation of real sector and market making by Indian
banks which obviously are the major Rupee liquidity providers Consequently non-
residents have the ability to exit positions with less impact cost in unfavourable times This
is a strong incentive for them to hedge in the onshore market (given dynamic hedging and
other operational issues are now being ironed out) Also higher liquidity in the onshore
market results in tighter bid-ask spread compared to the offshore market which allows non-
residents to get better pricing in the onshore market The aim of policy measures is to
develop the onshore market Accordingly policymakers strive to protect the advantages of
onshore market and at the same time develop and liberalise the onshore market to overcome
the gap vis-agrave-vis NDF markets in other aspects such as ease of access market infrastructure
and taxation There is of course the risk that participation of Indian banks will improve
76
liquidity in the NDF market and undermine the development of the onshore market Such
a situation will be challenging for implementing exchange rate management policy
Recommendation 3
The onshore Rupee derivatives market is currently more deep and liquid as compared to the
offshore Rupee market and participation of the Indian banks in the offshore market might over
time take away this advantage The TF feels that the downside of permitting Indian banks to deal
in the offshore Rupee derivative market outweighs the advantages and therefore recommends that
Indian banks should not be permitted to deal in the offshore Rupee derivative market for the
present
4 Requirement of underlying exposure and documentation therefor
There is no requirement of an underlying exposure to enter into a derivative contract in the offshore
Rupee derivative market Hence non-residents can freely trade in this market to hedge risk on an
underlying Rupee exposure or create exposure to Rupee However as per extant regulations non-
residents can enter into Rupee derivative contracts in the onshore market only for the purpose of
hedging risk arising from an underlying exposure Non-residents are classified into Foreign
Portfolio Investor (FPI) investors having Foreign Direct Investments Non-Resident Indian Non-
resident Exporters and Importers and Non-Resident lenders having ECBs designated in INR with
each category being subjected to a different set of rules for establishing underlying exposure
FPIs are allowed to hedge only on the basis of existence of underlying exposure with the hedge
size capped at the market value of investment in equity and debt in India as on a particular date
including any coupon receipts arising out of investment in debt securities falling due during the
following twelve months only The explicit mention of only equity and debt investments creates
regulatory ambiguity on hedging of other FPI exposures in India such as margin deposits cash
etc Hence any FPI having investment in India will be able to only buy USD forward against INR
onshore and will not be allowed to sell USD against INR in forward market as that would result in
increasing the exposure rather than hedging the exposure To prove the exposure a valuation
certificate is required to be provided by a designated AD bank (Custodian) as a proof of underlying
FPIs are also required to provide a declaration to the effect that their total outstanding hedges are
within the market value of their investments The only exception to establishing underlying
77
exposure requirement is dealing in exchange traded market where FPIs are allowed to take
positions without having to establish existence of underlying exposure up to USD 100 million
FDIs are allowed to hedge both their existing investment as well as proposed foreign direct
investments with the latter being allowed only after an AD bank ensures that all necessary
approvals for the investment have been obtained by the FDI With respect to non-resident
corporates users can hedge their exposures invoiced in INR and intercompany loans denominated
in INR (ECBs) They can book the hedge either directly with an AD bank in India or on a back-
to-back basis Prior to hedging they must furnish a declaration certifying that the underlying
exposure has not been hedged with any other AD bank(s) in India They are required to cancel the
hedge contract immediately if the underlying exposure is cancelled In case of a central treasury
an authorization from the entity having INR exposure to hedge on its behalf is also required
Irrespective of the category of the investor the requirement to establish underlying exposure
creates practical difficulties for many non-residents Funds who intend to execute macro hedge for
various schemes or MNC parents wanting to consolidate exposures across subsidiaries and
executing a single hedge find it easier to execute consolidated hedge in the offshore market Also
hedging of anticipated and economic exposures is not permitted
Recently the RBI has released11 draft regulation regarding risk management facilities for public
feedback The TF reviewed it in detail and also received feedback on it during interaction with
stakeholders The proposed regulation satisfactorily addresses a lot of pertinent issues Measures
on simplifying eligible underlying exposure criteria simplifying documentation requirement
flexibility to hedge dynamically ability to hedge anticipated exposures user classification (retail
and non-retail) and choice of products are welcome and much needed It is noted that the
requirement of having an underlying exposure for entering into Rupee derivative contract is
retained and it is felt that it is justified for effectiveness of exchange rate management policy and
ensuring financial stability Given that only hedging transactions are going to be permitted in the
onshore market there will remain a requirement to establish or declare existence of underlying
exposure to risk and also to ensure that notional of hedge contracts is in line with the value of
underlying exposure As discussed above such requirement acts as a deterrent for non-residents to
hedge in the onshore market It would be optimum if a solution can be found that fulfils the
11
Vide press release dated February 05 2019
78
requirement of verification of underlying exposure without the investors being required to
undertake the efforts to prove it This can be achieved by consolidating the existing data on
investments and hedge transactions residing with various regulated entities
Recommendation 4
The TF recommends that a technology-based solution be explored to centrally aggregate the
investments of non-residents and derivative contracts entered into by them in the onshore market
(both OTC and exchange traded) using LEI or any other unique identifier to start with ADs should
be allowed access to such aggregate data so that they can verify the quantum of derivative positions
and underlying investments of the non-residents This mechanism can potentially completely
remove the requirement of efforts from the non-residents to prove the existence of underlying
exposure to Rupee
Further to simplify procedures and provide ease of access to the exchange traded currency
derivative market the RBI has allowed users to enter exchange traded instruments (futures and
options) to take exposure up to USD 100 million without the requirement of establishing the
existence of underlying risk Such measures go a long way in encouraging users (especially
MSMEs) to hedge their exchange rate risk by making the process easier At the same time such
calibrated opening helps in addressing any concerns of systemic risk The TF feels that such an
incentive must be provided in the OTC market also as it will not only contribute to ease of doing
business but also to restore parity in regulation between OTC and exchange markets
Recommendation 5
While requirement of underlying exposure will continue for trading in the onshore market users
may be allowed to undertake positions up to USD 100 million in OTC as well as exchange traded
currency derivative market without having to establish the underlying exposure
5 Products
Non-residents can enter into only plain vanilla forwards and option contracts in the OTC foreign
exchange market Further swaps are restricted to specific case of IPO and non-resident lenders of
ECB denominated in INR Non-residents who prefer to express their hedge using structured
79
options necessarily need to execute in the offshore market as current regulations do not allow non-
residents to enter into structured options
Recommendation 6
The aforesaid draft regulation addresses this issue by allowing ADs to offer any product to the
non-residents (for non-retails users) which satisfies the purpose for which they are permitted to
enter into Rupee derivatives ie hedging of underlying exposure to Rupee In other words ADs
cannot offer any product that creates risk for the user instead of hedging the existing risk The TF
endorses this principle-based regulation approach
6 Restrictions on dynamic management of risk
Non-residents trading in the offshore market are free to cancel and rebook their trades depending
on their future expectations andor risk management policy On the other hand in the onshore
market non-residents in general are not allowed to rebook a contract once cancelled Only in the
case of FPIs rebooking up to 10 of the value of contracts cancelled is permitted Inability to
manage risk dynamically deters non-residents who look for flexibility while hedging their risks
The aforesaid draft regulation proposes to remove restrictions on rebooking of cancelled contracts
and thereby allow users to hedge dynamically For contracts entered into for hedging contracted
exposure gains (or losses) on cancellation will be passed on to the user as and when they accrue
but in case of contracts entered into for hedging anticipated exposures net gains will be transferred
only when the underlying cash flow has occurred The prime purpose of such stipulation is to curb
incentives for speculation by using the liberal position limits available under anticipated exposure
hedging However a consequent drawback is that in some instances eg contingent contracts
such as bidding for projects involving currency risk such a provision would not be equitable This
provision could be suitable amended to enable all types of hedging without compromising the
essential control that the cash flow requirement provides to ensure underlying in a hassle-free way
The TF is of the view that providing suitable discretion to banks to pass on net gains even without
cash flows in such cases would address this shortcoming This will ensure that genuine hedgers
80
will access the onshore market without worrying about retention of gains if underlying transaction
does not fructify due to reasons beyond their control
Recommendation 7
In line with the objective of bringing onshore market at par with offshore market the most obvious
path is to not have any restrictions on transfer of gains in case of anticipated exposure hedging
However a balancing act is necessary between liberalizing the market while preventing
speculative positions which can create undue volatility in the onshore market Keeping this in
mind while endorsing free dynamic hedging (without any restriction on cancellation and
rebooking) for hedging contracted exposure the TF recommends that in case of hedging of
anticipated exposures gains from cancellation of contract may be allowed to be passed on even in
cases where there are no cash flows at the discretion of the bank where the bank considers the
cancellation of underlying cash flow is due to external factors which are beyond the control of the
user
7 Gross settlement and credit risk management
In the case of offshore Rupee derivative market non-residents clear and settle OTC trades either
through a prime brokercustodian or bilaterally with the counterparty In both these cases the non-
residents usually execute a bilateral multi-currency master service agreement which includes
provisions for exchange of margin (ex- ISDA master agreement including Credit Support Annex)
with the counterparty These agreements necessitate periodic settlement of marked-to-market gains
and losses across products and provide the flexibility to net off losses against gains Hence these
agreements significantly lower credit charges and provide strong netting efficiency On the other
hand in the onshore market the non-residents in an otherwise identical situation will face
additional challenges in respect of settlement and exchange of margin due to the following reasons
Gross settlement of gains As mentioned above non-residents clear and settle OTC trades in the
offshore Rupee derivative market either through a prime broker or bilaterally with the
counterparty Typically they settle deal across assets and currencies with either of these entities
and are therefore able to net the cash flows and achieve efficiency in liquidity management
81
However as Rupee derivatives entered into in the onshore Rupee derivative market cannot be
settled under such overseas arrangements non-residents are unable to avail the benefits of netting
on their onshore transactions
Credit risk management Signing a master service agreement locally and establishing credit lines
with onshore banks increases the execution cost of hedging onshore Typically transactions of
non-residents in the offshore market are collateralized (through collateral exchange provisions
contained in the master service agreement) while those in the onshore market are non-
collateralized Depending on the credit rating of the non-resident the onshore banks may not
necessarily be open to providing exposurecredit limits on uncollateralized basis for entering into
deliverable contracts If a collateralized credit line is set up through a master service agreement
with provision for exchange of collateral in USD outside India restrictions under FEMA 1999 on
exchanging margin outside India by onshore banks poses issues If exchange of collateral is in INR
in India then the non-residents will have to either assume the exchange rate risk on the cash margin
deposited or will have to additionally hedge the margin money placed Moreover this attracts
regulatory ambiguity such as minimum tenor restrictions as per deposit regulations ability to
hedge the margin through FX swap interest to be paid on cash in SNRR account etc If interest
cannot be paid on the collateral placed with onshore counterparties it creates a strong economic
disincentive for the investor to hedge onshore
These issues can be addresses in two ways First facilitating the non-residents to utilize their
existing overseas custodianprime broker relationship and master service agreements for
settlement of their transactions onshore and exchange of collateral therefor Second by creating
the regulatory framework for exchange of margin for non-centrally cleared derivatives in India to
make it consistent with evolving clearing mechanism offshore Both the solutions are discussed
below
To help non-residents retain their economic neutrality with respect to the prevailing multi-currency
master service agreement executed offshore a central clearing and settlement mechanism may be
established for non-residentsrsquo deals with onshore counterparties along the lines of central clearing
and settlement of onshore interbank deals by the CCIL The overseas bank of the non-resident will
clear and settle the deals execute by them onshore To be sure the proposal is to introduce the
centralized clearing mechanism while retaining the existing bilateral settlement mechanism so that
82
investors who want to continue using it do not face disruption For the suggested central clearing
and settlement mechanism to be set up inter alia the following permissions would also be
required
i Permission under FEMA 1999 for CCIL to accept foreign currency denominated collateral
in India or outside India
ii Enhancement of CCILrsquos infrastructure to accept wide range of securities (foreign currency
cash securities issued by foreign governments etc) as collateral and
iii Other regulatory clearances required for non-residentsoverseas banks in other jurisdictions
to clear and settle through CCIL
Further back-to-back hedging by non-residents proposed in the aforesaid draft regulation will also
allow effective utilization of their prevailing multi-currency CSA arrangement offshore This
entails allowing non-residents to hedge their exposure with their banking counterpart overseas
which in turn will hedge the position back-to-back with an onshore bank This ensures that existing
dealing arrangements between non-residents and their overseas counterparties remain unchanged
but at the same time the market risk gets transferred to onshore banks and hence is managed locally
The overseas bank should be allowed to settle the onshore leg either bilaterally with the onshore
bank or through the proposed central clearing and settlement mechanism Also this will require
permissibility under FEMA 1999 to exchange margin with the overseas banker of non-residents
outside India In such a model the approach should be to recognize the intermediary offshore bank
as a facilitator purely for the convenience of the non-resident investor Experience from other
markets that have implemented such models like Malaysia and China suggest that putting the onus
of monitoring compliance in terms of quantum of hedge underlying documentation etc on the
intermediary bank is inefficient Such a requirement leads to the intermediary bank asking for
various indemnities from the client and these are often difficult and time consuming to negotiate
and sign The approach should be to monitor compliance by the non-residents as the regulated user
using available onshore infrastructure as well use of technology solutions to track the hedges vis-
a-vis underlying exposure as detailed in recommendation 5
With regard to regulation and infrastructure for exchange of margin for non-centrally cleared
derivatives in India the RBI released a discussion paper on this issue in May 2016 However the
final directions have not been issues yet It is understood that ambiguity in netting legislation is
83
one of the main issues holding the release of these directions Also it is understood that the GoI is
in the process of making legislative changes to address this issue
Recommendation 8
For ease of entering into hedge transactions for non-residents the TF recommends-
i Establishment of a central clearing and settlement mechanism for non-residentsrsquo deals in the
onshore market
ii Back-to-back hedging by non-residents proposed under the draft regulation is endorsed The
overseas bank should be allowed to settle the onshore leg either bilaterally with the onshore bank
or through the proposed central clearing and settlement mechanism
iii Implementation of margin requirement for non-centrally cleared OTC derivatives in the
onshore market at the earliest
iv Allowing Indian banks to post margin outside India This is not only relevant for credit risk
management for their transactions with non-resident users but also for their cross-border inter-
bank transactions
8 Taxation
Under the extant regulatory framework non-residents are permitted to enter into Rupee derivative
contracts only for hedging risk on their investmentslendingtrade in India As per discussions with
stakeholders the following position is generally adopted with regard to the gains from such
contracts
bull Where currencies under the contract are delivered ndash Not a taxable event (ie conversion of
one currency into another does not give rise to taxable income)
bull Where contract is cancelled and price difference is settled ndash If the derivative contract is
entered into for hedging exchange rate risk on a capital asset then gains on cancellation are
treated as capital gains If it is entered into for hedging exchange rate risk in relation to a
tradingbusiness asset such gains are treated as business profits
84
However it is understood that there is ambiguity in the rules in this connection and the position
taken by the Assessing Officers (AOs) differs between zones and is at variance with the aforesaid
position Oftentimes such gains on cancellation are treated as lsquoOther Incomersquo or lsquoSpeculation
Business Profitsrsquo During interaction with the non-residents it was suggested that such uncertainty
of tax treatment is one of the prime reasons why they do not access the onshore market and instead
hedge Rupee exposures in the off-shore market
Recommendation 9
The TF recommends that the competent authorities may examine the issue of taxation in respect
of foreign exchange derivative contracts with the objective of overcoming gaps between tax regime
in India and other major international financial centres (Singapore Hong Kong and London) to
the extent possible and thereby incentivizing non-residents to hedge in the onshore market
9 Allow non-deliverable Rupee derivatives in the IFSC and permit IBUs to deal in such
derivatives
The proposition of introducing non-deliverable Rupee derivatives in the IFSC and permitting
banks (IFSC Business Units or IBUs) to deal in such derivatives is discussed in detail in Chapter
4 While there are concerns around impact on the onshore market due to trading in Rupee
derivatives in the IFSC there are potential benefits in terms of IFSCrsquos ability to offer complete
bouquet of financial services and availability of market information to all stakeholders Further
given Indiarsquos economic growth it may be appropriate to prepare for greater financial integration
with the rest of the world Sequencing and timing of measures relating to currency markets is a
critical component of such integration Although at the moment there is no definite path ahead in
terms of such integration but a thriving Rupee market in the IFSC may provide a system which
can be leveraged towards this end in the way and manner deemed fit in future IFSC being outside
the capital controls provides an opportunity to policymakers to test new regimes and products in
an environment whose repercussions may not significantly impact the stability or efficiency of the
onshore system On balance the TF is of the view that non-deliverable Rupee derivatives may be
introduced in the IFSC However a phased approach may be adopted and to start with trading
may be permitted only on exchanges due to the inherent transparency and risk management
85
benefits offered by it Introducing OTC contracts may be considered at a later stage after the
experience gained from trading on exchanges RBI may in its Financial Stability report assess the
impact of the functioning of IFSC on the financial stability of the country
Further the TF is of the view that entities regulated and permitted by the RBI may be permitted to
make market and run positions in Rupee derivatives market in the IFSC In order to prevent spill
over of risks from IFSC to onshore market though these entities a distinct net open position limit
may be stipulated for their operations in the IFSC In other words the open positions of entities
operating in the IFSC should not be permitted to be netted off with their open position the onshore
market
Recommendation 10
The TF recommends that non-deliverable Rupee derivatives (with settlement in foreign currency)
may be allowed to be traded in the IFSC and IBUs may be allowed to deal in such derivatives with
a distinct FCY-INR position limit To start with exchange traded currency derivatives involving
Rupee may be introduced and with experience non-deliverable OTC currency derivatives
involving Rupee may also be allowed
10 KYC process
The extant directions issued by the Reserve Bank of India stipulates the documents required for
conducting KYC process to open accounts of non-residents Similarly SEBI has also prescribed
documents required for the granting of FPI license by Domestic Depository Participants (DDP)
Further KYC documents for FPIs are available to SEBI regulated entities through KRAs subject
to approval from either the FPIs or the domestic custodians Since access to KRAs is available
only to SEBI regulated entities most banks are not allowed to access KRA and hence seek
complete documentation from FPIs again Such repetitive submission of documents to various
financial intermediaries results in long lead time for on-boarding and makes the entire process
operationally cumbersome for non-residents
Recommendation 11
The TF recommends that the KYC registration may be centralized across the financial market with
uniform documentation requirement All regulated financial market intermediaries should be
provided access to the centralized registry and they should be allowed to rely on online registry
86
for confirmation that KYC has been completed and itrsquos valid This will ensure that non-residents
undertake the KYC process only once and not with each financial intermediary that they deal with
in the onshore market Also such a mechanism offers cost and efficiency benefits for the financial
intermediaries
87
Annexure I
Key features of currency market of major EMEs
I USD-RMB Market ndash China
Onshore Deliverable - CNY Offshore Deliverable - CNH
Market
Turnover
Daily average turnover USD 28
billion
Daily average swap and
forward turnover
USD 62
billion
Daily average options
turnover
USD 15
billion
Daily average
turnover
USD 15-20
billion
Daily average
forward turnover
USD 25-30
billion
Daily average
Options turnover
USD 5-6 billion
Spot foreign
exchange Onshore CNY foreign exchange spot is
available with documentary proof of an
underlying transaction
Participating banks in Hong Kong
provide two types of spot RMB
exchange rate transactions
- For trade service and direct
investment purposes where
resulting foreign exchange
positions can be offset with the
clearing bank or onshore
correspondent banks and
For general purposes where banks need
to warehouse the risk or offset the
position in the interbank USD-CNH
market Forward
FXSwaps CNY forwards and foreign exchange
swaps with maturities of up to five years
are available to onshore institutions to
hedge foreign exchange exposure
subject to documentary proof of the
same
Most liquid is in the tenor of one year or less
CNH deliverable offshore forwards
are available out to five years
Liquidity has improved significantly
and has surpassed turnover in the
NDF market
FX Options Onshore market participants can buy or
sell common European options of CNY
against foreign currencies on a real
needs basis
Tenors are available out to three years
with further tenors on a case-by-case
basis Most liquid is in the tenor of one
year or less
The State Administration of Foreign
Exchange (SAFE) started allowing
corporates to sell FX options from August
2014 on a real needs basis and with net
settlement allowed
Deliverable CNH options are
available without restrictions to any
non-individual counterparty that has
a physical CNH Nostro account in
Hong Kong
Options on USD-CNH and CNH crosses
are available out to five years and
beyond on a case-by-case basis
88
Access to
domestic
participants
On the current account the CNY is
convertible subject to genuine
documentation Onshore entities can
access the local forwards market
provided these contracts are used to
cover current account transactions
subject to documentary proof available
on settlement
On capital account CNY conversions
may be settled by way of voluntary
settlement in banks if these are required
in the Companiesrsquo institutionsrsquo actual
business operation Typically all capital
account transactions need to be
registered with SAFE for local forwards
Not easily accessible to onshore
residents approvals required for transfer
of funds from Onshore to Offshore
Access to
Offshore
participants
Qualified
Foreign
Institutional
Investor
All allowed subject to
principle of actual
needs (Quota
restrictions exists
on underlying
investments)
Can trade via their
custodian or domestic
financial institution
Central
Banks
No quota restrictions
ability to trade as
interbank counterparty
in the domestic market
ndash bilateral or
anonymous trading
China
Interbank
Bond market
(CIBM)Bond
Connect
For OIIs (Overseas
Institutional Investors)
accessing making
CIBM investment can
enter
into all FX products on
actual needs basis with
settlement agent banks
Change in CIBM
investment position
requires adjustment to
the FX hedges within
5 working days
All customers can open a RMB account
in Hong Kong Banks can provide
customers with general purpose RMB
accounts which allow free transfers of
funds (offshore) for any purpose In
general all FX products are allowed in
CNH for offshore investors
Trading
Hours 10 AM ndash 4 PM Local China Hours 10 AM ndash 4 PM Local China Hours
89
II USD-KRW Market - Korea
Features Onshore Deliverable Offshore Non-Deliverable
Market Turnover Average daily turnover
USD
Billion
Spot Forward Swaps
2011 191 75 192
2012 180 66 198
2013 183 71 196
2014 175 76 190
2015 200 83 192
2016 194 96 184
2017 196 101 198 Source Bank of Korea
As per London clearing house
(LCH) Ltd the daily turnover of
NDF cleared by them on April
16 2019 is a total of USD 119
billion (Source LCH)
As per SEF turnover as on April
12 2019 is USD 379 million
(Source SEF)
Daily NDF turnover has
increased from USD 195 billion
in 2013 to USD 30 billion in
2016 (Source BIS 2016 survey)
Access to
domestic
participants
Residents can hold unlimited
amounts of foreign currency in
foreign currency bank accounts and
Korean firms can maintain foreign
currency accounts abroad
Financial institutional investors
have access to the local forwards
market and can hedge their
investment exposure without
confirming the lsquoexistencersquo of the
investment
Forward position limits of foreign
bank branches (FBBs) and local
banks registered as FX Banks in
Korea as below
- For FBBs positions are
capped at 200 per cent of the
previous month-end equity
capital
- For local banks forward
positions are capped at 40 per
cent of the previous month-
end equity capital
- Corporate customer foreign
currency hedging limits are
100 per cent of customersrsquo
exposure or their transaction
of underlying real assets
Residents may hold foreign
currency accounts domestically
or abroad
Corporate investors and
individual investors are required
to confirm the existence of the
investment
In the case of capital or current
account transactions domestic
residents can remit up to USD 50
000 per year freely
Access to
Offshore
participants
Non-residents can hold KRW
locally through bank accounts
Foreign investors must open special
investment purpose accounts
No restrictions and BoK does not
regulate the same
90
Source Bank of Korea BIS HSBC Research
which consist of an exclusive
external account for investment and
an exclusive non-resident domestic
currency account for investment
Foreign investors are allowed to
freely convert foreign currency into
KRW without any underlying
securities purchases while the
converted funds are being
transferred within exclusive
external investment accounts
However the converted funds in
the exclusive external account for
investment should still be used for
the purpose of securities
investment
Non-Resident Investors holding
Investment Registration Certificates
(IRC) sale proceeds from the
investment in securities can be
freely repatriated
Central Bank
intervention
BOK is now releasing a quarterly
intervention report on a net basis
They generally only comment that
they intervene only in exceptional
basis for smoothing operations
Bank of Korea does not access the
NDF market
Trading Hours 9 AM ndash 330 PM local Korea time Available through time zones
Taxation and
Repatriation of
FX Gains
All gains on unwind of deliverable
transactions are freely repatriable
without any tax
All gains on unwind of non-
deliverable transactions with
onshore banks are freely repatriable
without any tax
91
III USD-MYR Market ndash Malaysia
Onshore Deliverable Offshore Non-Deliverable
Market Turnover - Daily inter-bank market USDMYR
spot turnover around $500 million
- Daily inter-bank market USDMYR
swap turnover around $30 billion
- As per LCH Ltd UK Clearing
house the daily turnover of
USDMYR NDF cleared by them
on April 16 2019 is a total of
USD 332 million from 82 trades
(LCH website)
- As per SEF a trading platform
USDMYR turnover as on April
12 2019 is USD 205 million
from 18 trades (SEF website)
- As per the Hong Kong exchange
the NDF turnovers in 2016 were
around USD 50 billion and have
reduced to approximately USD
20 billion in 2018 (HKMA NDF
report 2018)
Access to Domestic
participants
- Resident counterparties such as
importers and exporters can use
currency options and forward
contracts to manage their foreign
exchange risk
- Residents are allowed to enter into
hedging arrangements on committed
current account transactions and
financial account transactions
- All forward contracts must be
supported by an underlying trade or
capital account-related transaction
allowed under the Foreign Exchange
Administration Rules
- Residents are allowed to freely
hedge and un-hedge their foreign
currency exposure for USD-MYR
CNH-MYR GBP-MYR EURMYR
and JPY-MYR currency pairs
without documentary evidence up to
an aggregate net open position of
MYR 6 million per bank
Not allowed
Access to Offshore
participants
- Licensed onshore banks and
approved investment banks are
allowed to enter into FX forward
Open and not regulated by the
central bank
92
Source Bank Negara Malaysia BIS HSBC Research
contracts with non-residents as
follows
Forward FX purchase or sale
contracts against MYR for
current account transactions
Forward FX purchase or sale
contracts against MYR based on
committed purchases or sales of
MYR assets The forward
contracts can be entered into at
the point when the non-resident
commits to purchase or sell the
MYR assets
- Dynamic hedging programme offers
flexibility to actively manage FX risk
exposure via forward hedging
activities with onshore banks or
Appointed Overseas Office (AOO)
without any documentation
CCP used Malaysian Exchange Not mandatory but LCH used
regularly
Central Bank
intervention
Through appointed agent banks Not applicable
Fixing to settle
NDF
NA KL USDMYR Reference rate
Trading Hours - Trading hour is 9 AM to 6 PM Local
Time Limited FX liquidity
available for non-residents post local
trading hours
- USDMYR is also quoted by
appointed overseas offices for spot
value only for any underlying asset
trades - post local trading hours No
forward prices are quoted
Quoted across time zones
Taxation and
Repatriation of FX
Gains
All gains on cancelled FX Contracts
are freely repatriable and do not
attract taxation in Malaysia
Taxed based on jurisdiction
93
IV USD-IDR Market - Indonesia
Onshore Deliverable Offshore Non-Deliverable Onshore Non-Deliverable
Market
Turnover
Average
daily spot
turnovers
USD 1bn
Average
daily swap
turnovers
USD 500
million
As per LCH Ltd - the
daily turnover of
USDIDR NDF cleared
by them on April 16
2019 is a total of USD
41 billion from 832
trades
As per SEF USDIDR
turnover as on April 12
2019 is USD 33 million
from 11 trades (Source
SEF)
As per HKTR Jan 2018
reporting the outstanding
IDR NDF turnover on
the Hong Kong exchange
of is around USD 40
billion (Source HKMA
NDF report 2018)
NDF
average size
USD 5m
Access to
Domestic
participants
Foreign currency against IDR
transactions between banks and
domestic parties over a certain
amount must have an underlying
transaction
Not Allowed Allowed but will need to
demonstrate underlying
documents
Access to
Offshore
participants
Non-residents must have
underlying IDR
assetliabilityreceivablepayable
to be able to enter into IDR cash
FX andor FX hedge BI list all the
permissible underlying activities
along with recommended
documentation format
Open and not regulated by
Bank Indonesia
Allowed but will need to
demonstrate underlying
documents
BI published a more-
stringent list of
permissible underlying
activities
Benefits Pricing uses onshore-curve
driven by onshore participants
and BI intervention
Not regulated and no
need for underlying
documentation
Prices available across
time zones
Can generated IDR
exposures without
having an underlying
asset in IDR
Pricing uses onshore-
curve driven by onshore
participants and BI
intervention (explanation
below) BI appears to
have a much bigger-
capacity to manage since
the product is net-settled
in IDR
94
Source Bank Indonesia BIS HSBC Research
Clients with IDR FX
exposure but no urgent
need for principal-
exchange As example
long-term IDR bond
investors
Limitations Requirement for underlying
docs limit the maximum
exposure that foreign Clients
can take
BI restricts Domestic Banks
from having residual-risk
when dealing Derivatives with
Related-Parties (locally
incorporated banks only)
Convertibility risk Requirement for
underlying docs limit the
maximum exposure
Foreign Clients can take
Clients with actual need
for principal-exchange
due to basis-risk between
[JISDOR fixing] vs
[actual FX rate] eg
Coupon repatriation and
BI restricts domestic
banks from having
residual-risk when
dealing derivatives with
related parties (locally
incorporated banks only)
Central
Bank
intervention
BI intervenes only in the onshore
market via Cash FX Onshore DF
and Onshore DNDF These can
be done via auctions or bilateral
OTC trades as there is no
onshore futures market for IDR
Bank Indonesia does not
access the NDF market
BI has the ability to intervene
in the DNDF market
although the market is very
new
Fixing to
settle NDF
Not Applicable JISDOR (USD-IDR)
JISDOR (USD-IDR)
Trading
Hours
Trading hours is from 8 AM ndash
12 PM Local Time and 1 PM
ndash 4 PM (Market breaks for
lunch between 12 PM ndash 1
PM)
USD-IDR is also quoted by
banks offshore for Spot value
only for any underlying asset
trades post local trading hours
No Forward prices are quoted
Quoted across time zones 8 AM ndash 12 PM Local
Time 1 PM ndash 4 PM
(Market breaks for lunch
between 12 PM ndash 1 PM)
Taxation
and
Repatriation
of FX Gains
As per market practice gains on
any unwindcancellation of FX
hedges are not passed to Non-
Residents
Taxed as per jurisdiction As per market practice gains
on any unwindcancellation
of FX hedges are not passed
to Non-Residents
95
V USD-BRL Market - Brazil
Features Onshore Deliverable Offshore Non-Deliverable
Market Features Average daily spot USD 8 billion
Onshore B3 USD 14 billion
Average daily options
turnovers
USD 15 billion
Offshore NDF
turnover daily
USD 4
billion
Market Hours Market hours is 0900 to 1800 Hours
However liquidity is highest between 10
am ndash 12 pm and 2 pm ndash 4 pm local
hours
96
VI USD-TWD Market - Taiwan
Features Onshore Deliverable Offshore Non-Deliverable
Market
Features Average Daily
Spot
Turnovers
USD 3-4 billion
Average Daily
Swap
turnovers
USD 2-3 billion
Average
Options
Turnovers
USD 150 million
Average daily
turnovers
USD 2-4 billion
Market
Turnovers
- Onshore total Spot turnovers in
USDTWD for March 2019 were USD
31560 billion (Average daily turnover of
~ USD 10 billion)
- Data related to USDTWD swaps is not
readily available but total swaps amp
forwards dealt onshore (across currency
pairs) is ~ 5750 of the FX turnovers
USD 11504 billion in April 2016 (last
available data) [Source BIS]
Access to
Domestic
participants
There are no limits on the TWDrsquos trading
range versus other currencies but there are
convertibility limits on the capital account
- Access to domestic participants are
not allowed
- Local banksrsquo overseas branches to
participate in the TWD NDF
market These banks will also be
subject to the existing cap on net
NDF positions at 20 per cent of
each bankrsquos FX position (last
revised lower from 33 per cent in
December 2010)
Access to
Offshore
participants
Non-Resident
Foreign investors are allowed to enter
into onshore swapforward contracts for
hedging underlying investment in
Taiwan
FINIs (Foreign Institutional Investors)
can only conduct buy USDsell TWD
contract and the total contract amount
entered into by a foreign investor should
not exceed FINIs USD and TWD net
remitted-in capital (ie total remitted-in
funds minus total remitted-out funds)
Access to foreign exchange is divided
into three categories
- import and export
Open and not regulated by the central
bank
97
- cost of trade-related services
- Investments capital repatriation and
dividends
Currency options are permitted
For FINIsFIDIs all transactions must be
documented regardless of the amount
On the maturity of FX forward (or
forward leg of a swap deal) FINI may
have the following decisions
- To settle the contract on the maturity
day as originally dealt In this case
FINI needs to ensure sufficiency of
existing account balance That is
settlement of FX forward should
come from the existing funds in
Taiwan or funds from sale proceeds
of underlying investments
- To extend (ie rollover) the contract
to another period in this case on the
maturity day FINI has to settle the
difference between the original
forward contract rate and the mark-
to-market rate
If FINI rollovers the contract upon
maturity and incurs a gain upon rollover
the gain will be credited to the FINIs
account in Taiwan Such gain will be
treated as other income derived in
Taiwan
CCP used Taipei Exchange (TPEx) acts as the Central
Counter Party for and also covers all foreign
exchange transactions made by authorized
foreign exchange banks and offshore banking
units
Not mandatory but LCH used regularly
Central Bank
intervention
Central bankrsquos FX intervention is via agent
banks in the OTC market where onshore
TWD is traded One of the mechanisms
through which local currency pressure is
absorbed is through modulation of hedge
ratio of Lifers
Not applicable
Fixing to
settle NDF
NA Central bankrsquos FX intervention is via
agent banks in the OTC market where
onshore TWD is traded
Bloomberg TRY11ltIndexgt
Trading
Hours
- 9 AM ndash 4 PM Local Time
- Market breaks for lunch at 12 PM ndash 2 PM
Quoted across time zones
98
Source CBC BIS HSBC Research
Taxation and
Repatriation
of FX Gains
If FINI rollovers the contract upon
maturity and incurs a gain upon rollover
the gain will be credited to the FINIs
account in Taiwan Such gain will be
treated as other income derived in
Taiwan and therefore subject to 20
standard withholding tax In case that FX
loss incurs due to rollover FINI may
arrange funding to cover the loss if
necessary
FINI can choose one of the following
methods to calculate and pay for the
relevant tax Please however note that
the method is not changeable once it is
decided If FINI does not confirm which
method to be used the option 1) will be
applied
- Withhold related tax on FX gain
from each rollover or
- Netting FX gainslosses from
rollover within the same year or
- Netting FX gainslosses from
rollover and the total remitted-in
principals revaluation gainloss in
the year
If the foreign investor adopts option 2) or
3) above they must appoint or contact
their existing local tax agent (if any) in
Taiwan to file annual tax return
Taxed based on jurisdiction
99
Annexure II
Appendix to Chapter 3
A bivariate BEKK-GARCH (11) model as proposed by Engle and Kroner (1995) can be specified with
the system of conditional mean equations consists of VAR(p) models (p = 1 n) as given in eq (1) and
variance equation as in eq(2)
119884119905 = 120583 + sum Γ119894119884119905minus119894 + 120576119905119901119894=1 (1)
where 119884119905 = (1199101119905 1199102119905) 1199101119905 is exchange rate return in onshore market and 1199102119905 is exchange rate return in
offshore market at time t The parameter vector 120583 = (1205831 1205832) represents constants and Γ is a 2times2 matrix of
autoregressive terms The diagonal elements 120574119894119894 measure own lagged effect of the variables while the off-
diagonal elements 120574119894119895 capture the mean spillover from variable i to variable j
Taking into account the asymmetric responses of volatility ie volatility tends to increase more in response
to negative shocks (bad news) than positive shocks (good news) in the variances and covariances as
proposed by Kroner and Ng (1998) a BEKK representation of conditional variance equation can be written
as
119867119905 = 119862prime119862 + 119860prime120576119905minus1prime 120576119905minus1119860 + 119861prime119867119905minus1119861 + 119863prime120585119905minus1
prime 120585119905minus1119863 (2)
where 120585119905 would be 120576119905 if it is negative and zero otherwise The Eq (2) can be written in matrix form as
follows
119867119905 = [11988811 011988821 11988822
] + [11988611 11988612
11988621 11988622]
prime
[1205761119905minus1
2 1205761119905minus11205762119905minus1
1205762119905minus11205761119905minus1 1205762119905minus12 ] [
11988611 11988612
11988621 11988622]
+ [11988711 11988712
11988721 11988722]
prime
[ℎ11119905minus1 ℎ12119905minus1
ℎ21119905minus1 ℎ22119905minus1] [
11988711 11988712
11988721 11988722]
+ [11988911 11988912
11988921 11988922]
prime
[1205851119905minus1
2 1205851119905minus11205852119905minus1
1205852119905minus11205851119905minus1 1205852119905minus12 ] [
11988911 11988912
11988921 11988922]
In the above model the dynamic process of 119867119905 is a linear function of its own lagged values lagged squared
innovations and the cross-product of the innovations and asymmetric terms Volatility transmission
channel between onshore and offshore markets is represented by the off-diagonal parameters in matrices A
and B while the diagonal parameters in those matrices capture the effects of their own past shocks and
volatility The diagonal parameters in matrix D measure the response own past negative shocks while the
100
off-diagonal parameters 119889119894119895 show the response of one market to the negative shocks in the another market
to be called the cross-market asymmetric responses
MGARCH-BEKK Parameter Estimates
Spot and 1-Month NDF 1-Month Forward and NDF 1-Month Futures and NDF
Variable Coeff P-value Variable Coeff P-value Variable Coeff P-value
Mean Equation
DSPOT(-1) -063 000 DFW1M(-1) -064 000 DFUT1M(-1) -063 000
DSPOT(-2) -052 000 DFW1M(-2) -054 000 DFUT1M(-2) -053 000
DSPOT(-3) -031 000 DFW1M(-3) -033 000 DFUT1M(-3) -033 000
DSPOT(-4) -015 000 DFW1M(-4) -018 000 DFUT1M(-4) -019 000
DSPOT(-5) -010 000 DFW1M(-5) -012 000 DFUT1M(-5) -010 000
DNDF1M(-1) 062 000 DNDF1M(-1) 063 000 DNDF1M(-1) 062 000
DNDF1M(-2) 047 000 DNDF1M(-2) 049 000 DNDF1M(-2) 048 000
DNDF1M(-3) 030 000 DNDF1M(-3) 033 000 DNDF1M(-3) 035 000
DNDF1M(-4) 022 000 DNDF1M(-4) 023 000 DNDF1M(-4) 027 000
DNDF1M(-5) 013 000 DNDF1M(-5) 015 000 DNDF1M(-5) 016 000
Constant 001 029 Constant 001 003 Constant 001 013
DSPOT(-1) 013 000 DFW1M(-1) 013 000 DFUT1M(-1) 011 001
DSPOT(-2) 003 053 DFW1M(-2) 002 046 DFUT1M(-2) 000 098
DSPOT(-3) 005 042 DFW1M(-3) 003 033 DFUT1M(-3) 002 064
DSPOT(-4) 005 033 DFW1M(-4) 005 015 DFUT1M(-4) 004 041
DSPOT(-5) 002 067 DFW1M(-5) 001 068 DFUT1M(-5) 002 058
DNDF1M(-1) -009 000 DNDF1M(-1) -009 000 DNDF1M(-1) -009 001
DNDF1M(-2) -007 015 DNDF1M(-2) -007 003 DNDF1M(-2) -005 022
DNDF1M(-3) -005 033 DNDF1M(-3) -004 012 DNDF1M(-3) -002 065
DNDF1M(-4) 001 086 DNDF1M(-4) 001 076 DNDF1M(-4) 003 052
DNDF1M(-5) 001 079 DNDF1M(-5) 002 052 DNDF1M(-5) 001 067
Constant 001 038 Constant 001 011 Constant 001 017
Variance Equation
C(11) 005 000 C(11) 005 000 C(11) 003 000
C(21) 005 000 C(21) 005 000 C(21) 003 000
C(22) -001 004 C(22) 001 000 C(22) 005 000
A(11) 027 000 A(11) 027 000 A(11) 014 000
A(12) 004 042 A(12) 005 032 A(12) -012 004
A(21) -004 029 A(21) -004 034 A(21) 007 010
A(22) 019 000 A(22) 018 000 A(22) 029 000
B(11) 096 000 B(11) 096 000 B(11) 098 000
B(12) -001 020 B(12) -002 003 B(12) 003 004
B(21) 001 037 B(21) 001 029 B(21) -001 048
B(22) 098 000 B(22) 098 000 B(22) 094 000
D(11) -023 001 D(11) 027 000 D(11) 020 001
101
D(12) -037 000 D(12) 035 000 D(12) 024 000
D(21) 022 000 D(21) -025 000 D(21) -016 000
D(22) 028 000 D(22) -028 000 D(22) -012 006
102
Annexure III
Evolution of Onshore Exchange Traded Currency Derivatives Market
Exchange Traded Currency Derivatives (ETCD) were launched in August 2008 in India with the
introduction of futures contracts on US Dollar-Rupee currency pair as the underlying
Subsequently in the year 2010 Rupee future contracts were allowed to trade against three other
currencies viz Euro Pound sterling and Japanese yen The options contracts were introduced on
US Dollar-Rupee currency pair in year 2010 The Reserve Bank of India (RBI) and Securities
Exchange Board of India (SEBI) allowed participation for all resident individuals including
corporates Trading Members and Banks in proprietary capacity on ETCD
In the year 2012 it was decided to lower the open position limits for banks on the back of volatility
in rupee and to exclude the positions in ETCD from Net Overnight Open Position Limit (NOOPL)
Thereafter in the year 2013 the Rupee depreciated sharply against USD due to huge capital
outflows in both equity and debt markets expectation of unwinding of Quantitative Easing by US
FED and increase in current account deficit Additionally the open position limits for the
participants were decreased and banks were restricted from participating on their own accounts in
the ETCD market further the participants were also prohibited from taking positions beyond
USD 10 million
In June 2014 Banks were allowed to engage in proprietary trading in ETCD markets Domestic
participants were allowed to have open position beyond USD 15 million subject to the evidence
of underlying exposure In 2018 this limit was raised to USD 100 million across all currency pairs
involving INR put together and combined across all exchanges
Foreign Portfolio Investors (FPI) and Non-Resident Indians (NRIs) were permitted to participate
in ETCD markets for hedging currency risk arising out of their investments in India in 2014 and
2017 respectively In February 2018 SEBI and RBI permitted currency derivatives on cross
currency pairs - EURUSD GBPUSD and USDJPY- and currency options on EURINR GBPINR
and JPYINR In December 2018 weekly options on US Dollar - Indian Rupee currency pair were
permitted As on date derivatives are available on seven currency pairs - USDINR EURINR
GBPINR JPYINR EURUSD GBPUSD and USDJPY
103
The exchange traded currency derivatives draws participation from diverse categories of
participants Some of the key participant categories include banks corporates trading members
foreign investors and other investors The following are the turnover of exchanges
FY National Stock Exchange of India (All figures in USD billions)
USD-INR futures USD-INR Options
(Notional turnover)
USD-INR Options
(Premium )
2014-15 32630 12618 052
2015-16 37374 26600 092
2016-17 31887 35271 107
2017-18 33818 37714 117
2018-19 57913 54183 204
FY
BSE (All figures in USD billions)
USD-INR futures USD-INR Options
(Notional turnover)
USD-INR Options
(Premium)
2014-15 20740 9609 081
2015-16 27713 13772 044
2016-17 27521 21034 045
2017-18 30146 37552 041
2018-19 45956 59350 051
FY Metropolitan Stock Exchange of India (All figures in USD billions)
USD-INR futures USD-INR Options
( Notional turnover )
USD-INR Options
( Premium )
2014-15 18274 593 593
2015-16 8433 646 646
2016-17 8233 367 367
2017-18 3032 491 491
2018-19 1060 245 245
104
Present Regulatory Framework (client limits open interest limits need for underlying
exposure etc)
a) Position limits for different client categories for FCY-INR currency pairs
bull Position limits of clients and Category III FPIs- The gross open positions of the client
across all contracts in the respective currency pairs shall not exceed the limits as mentioned
below
Currency Pairs
Position limits
USD-INR Gross open position across all contracts shall not exceed
6 of the total open interest or USD 10 million whichever
is higher
EUR-INR Gross open position across all contracts shall not exceed
6 of the total open interest or EUR 5 million whichever
is higher
GBP-INR Gross open position across all contracts shall not exceed
6 of the total open interest or GBP 5 million whichever
is higher
JPY-INR Gross open position across all contracts shall not exceed
6 of the total open interest or JPY 200 million whichever
is higher
bull Proprietary position limits of non-bank stock brokers- The gross open positions of the
proprietary account across all contracts in the respective currency pairs shall not exceed
the limits as mentioned below
Currency Pairs
Position limits
USD-INR Gross open position across all contracts shall not exceed 15
of the total open interest or USD 50 million whichever is
higher
EUR-INR Gross open position across all contracts shall not exceed 15
of the total open interest or EUR 25 million whichever is
higher
GBP-INR Gross open position across all contracts shall not exceed 15
of the total open interest or GBP 25 million whichever is
higher
JPY-INR Gross open position across all contracts shall not exceed 15
of the total open interest or JPY 1000 million whichever is
higher
105
bull Position limits of stock brokers (bank and non-bank) Category I and II FPIs- The
gross open positions of trading members across all contracts in the respective currency
pairs shall not exceed the limits as mentioned below
Currency Pairs
Position limits
USD-INR Gross open position across all contracts shall not exceed
15 of the total open interest or USD 100 million
whichever is higher
EUR-INR Gross open position across all contracts shall not exceed
15 of the total open interest or EUR 50 million whichever
is higher
GBP-INR Gross open position across all contracts shall not exceed
15 of the total open interest or GBP 50 million whichever
is higher
JPY-INR Gross open position across all contracts shall not exceed
15 of the total open interest or JPY 2000 million
whichever is higher
Domestic clients shall ensure that the position across exchanges is within the prescribed
limit of USD 100 million equivalent If position is in excess of USD 100 million
equivalent clients are required to provide disclosure of underlying exposure to Trading
Member as per existing practice
bull Proprietary positions created in FCY-INR pairs (USD-INR EUR-INR GBP-INR
and JPY-INR)
Single INR limit for proprietary
position for bank stock broker
Single INR limit for proprietary
position for non-bank stock broker
Higher of 15 of total OI across all
FCY- INR pairs or USD 200 million
Higher of 15 of total OI across all
FCY-INR pairs or USD 100 million
b) Position limit for Cross Currency Derivatives are given below
bull Position limits for stock brokers (banks and non-bank) Category I amp II FPIs
Domestic Institutional investors (DIIs) as permitted by the respective sectoral
regulators and AD Category-I banks-
106
Currency Pairs
Position limits
EUR-USD Gross open position across all contracts shall not
exceed 15 of the total open interest or EUR 100
million whichever is higher
GBP-USD Gross open position across all contracts shall not
exceed 15 of the total open interest or GBP 100
million whichever is higher
USD-JPY Gross open position across all contracts shall not
exceed 15 of the total open interest or USD 100
million whichever is higher
The aforementioned limits shall be the total limits available to the stock brokers for
taking positions on proprietary basis and for positions of their clients
bull Position limit for proprietary position of non-bank stock brokers-
Currency Pairs
Position limits
EUR-USD Gross open position across all contracts shall not
exceed 15 of the total open interest or EUR 50
million whichever is higher
GBP-USD Gross open position across all contracts shall not
exceed 15 of the total open interest or GBP 50
million whichever is higher
USD-JPY Gross open position across all contracts shall not
exceed 15 of the total open interest or USD 50
million whichever is higher
bull Position limits for Clients and Category III FPIs-
Currency Pairs
Position limits
EUR-USD Gross open position across all contracts shall not
exceed 6 of the total open interest or EUR 10
million whichever is higher
GBP-USD Gross open position across all contracts shall not
exceed 6 of the total open interest or GBP 10
million whichever is higher
USD-JPY Gross open position across all contracts shall not
exceed 6 of the total open interest or USD 10
million whichever is higher
107
Annexure IV
Comparison of onshore and offshore Rupee derivatives volumes
1 Exchange Traded Market
All figures in USD billions
Table Comparison between onshore and offshore exchange traded INR-USD Futures
FY Onshore Offshore Market Share
BSE NSE MSEI Total DGCX SGX CME Total Onshore Offshore
2014-15 21115 32491 9433 63040 31704 3704 396 35804 6378 3622
2015-16 27904 37241 4539 69685 32725 13906 1001 47631 5940 4060
2016-17 26528 31799 4300 62626 34149 17164 1636 52949 5419 4581
2017-18 30360 33729 1761 65851 33458 28047 5232 66737 4967 5033
2018-19 44820 57237 648 102705 35452 37599 7475 80526 5605 4395
Note-
i Data for BSE NSE amp MSEI is from Exchange websites for USDINR Futures
ii Data for DGCX SGX and CME is from Bloomberg and India INX Research
iii Data for DGCX includes INRUSD Futures (including mini contract) but excludes the USDINR Index
Quanto futures
iv Data for CME includes the Mini and Micro contracts
v Data for FY 2018-19 is from April 01 2018 to March 22 2019
2 OTC Market (as per BIS Quarterly Review December 2016)
108
Annexure V
Meetings held by the Task Force
Sr No Date Venue External Participants Invited
1 March 19 2019 RBI Mumbai
2 March 25 2019 RBI Mumbai -Shri Ananth Narayan Professor SPJMIR
-FEDAI
-Select corporates
3 April 04 2019 RBI Mumbai -Shri G Padmanabhan Former Executive
Director RBI
-Dr V Anantha Nageswaran Dean IFMR
Chennai
-GIFT City IFSC
-National Stock Exchange Ltd
-BSE Ltd
4 April 23 2019 RBI Mumbai -Select FPIs (through audio conference)
5 May 14 2019 RBI Mumbai -Select FDIs (through audio conference)
6 May 31 2019 RBI Mumbai -Shri G Padmanabhan Former Executive
Director RBI
-FIMMDA
-CCIL
-IBA
7 June 20 2019 RBI Mumbai -Smt Shyamala Gopinath Former Deputy
Governor RBI
8 July 04 2019 SEBI Mumbai -Shri G Padmanabhan Former Executive
Director RBI
9 July 10 2019 RBI Mumbai -Smt Shyamala Gopinath Former Deputy
Governor RBI
109
Annexure VI
References
A Santaella Julio (2015) ldquoCurrency carry trades in Latin Americardquo Bank for International
Settlements BIS Paper No 81
Behera Harendra Kumar (2011) ldquoOnshore and offshore market for Indian rupee recent evidence
on volatility and shock spilloverrdquo Macroeconomics and Finance in Emerging Market Economies
Vol 4 No 1 March 2011 pp 43ndash55
Cadarajat Yayat and Lubis Alexander (2012) ldquoOffshore And Onshore IDR Market An Evidence
On Information Spilloverrdquo Bulletin of Monetary Economics and Banking April 2012
Capital Account Safeguard Measures in the ASEAN Context (2019) ASEAN Working Committee
on Capital Account Liberalisation Bank Indonesia Occasional Papers OP12019
Colavecchio Roberta and Funke Michael (2006) ldquoVolatility transmissions between renminbi and
Asia-Pacific onshore and offshore US dollar futuresrdquo BOFIT Discussion Papers Bank of
Finland Institute for Economies in Transition No16
Darbha Gangadhar (2012) ldquoA Tale of One Asset and Two Markets ndash Analysis of Dynamic
Interactions between On- and - Off Shore Marketsrdquo macrofinancenipfporginPDF13-
11sl_Darbha_NDFNimranapdf
DING David K Tse Y and Williams M The Price Discovery Puzzle in Offshore Yuan
Trading Different Contributions for Different Contracts (2012) Financial Management
Association International Conference Research Collection Lee Kong Chian School Of Business
Doukas J and H Zhang (2013) ldquoThe performance of NDF carry tradesrdquo Journal of International
Money and Finance vol 36 September pp 172ndash90
Goyal R R Jain and S Tewari (2013) Non deliverable forward and onshore Indian rupee market
a study on inter-linkages Reserve Bank of India Working Paper Series 112013 December
Guru Anuradha (2009) ldquoNon-Deliverable Forwards Market for Indian Rupee An Empirical
Studyrdquo Indian Journal of Economics and Business Vol 8 No 2 pp 245-260
Higgins Patrick and Owen F Humpage (2005) ldquoNondeliverable Forwards Can We Tell where
the Renminbi Is Headedrdquo Federal Reserve Bank of Cleveland September
Hutchison Michael Jake Kendall Gurnain Pasricha Nirvikar Singh (2009) ldquoIndian Capital
Control Liberalisation Evidence from NDF Marketsrdquo NIPFP Working Paper No 200960
110
Indira Gandhi Institute of Development Research (IGIDR) Finance Research Group (2016)
ldquoFeatures and trends of NDF markets for emerging economy currencies a study of the Indian
rupeerdquo IGIDR working paper March
Ishii Shogo İnci Oumltker-Robe and Li Cui 2001 Measures to Limit the Offshore Use of
Currencies Pros and Cons IMF Working Paper WP0143
Lipscomb Laura (2005) ldquoAn Overview of Non-Deliverable Foreign Exchange Forward Marketsrdquo
Federal Reserve Bank of New York May
Ma G C Ho and R McCauley (2004) The markets for non-deliverable forwards in
Asia BIS Quarterly Review June pp 81-94
Maziad Samar and Kang Joong Shik RMB Internationalization OnshoreOffshore Links (May
2012) IMF Working Paper No 12133
McCauley R C Shu and G Ma (2014) ldquoNon-deliverable forwards 2013 and beyondrdquo BIS
Quarterly Review March pp 75ndash88
McCauley RN Shu C (2016) ldquoNon-deliverable forwards impact of currency internationalisation
and derivatives reformrdquo Technical report Bank of International Settlements
McCauley Robert N and Scatigna Michela Foreign Exchange Trading in Emerging Currencies
More Financial More Offshore (March 2011) BIS Quarterly Review March 2011
Misra Sangita and Behera Harendra (2006) ldquoNon Deliverable Foreign Exchange Forward
Market An Overviewrdquo RBI Occasional Papers Vol 27 No3
Park Jinwoo (2001) ldquoInformation flows between non-deliverable forwards (NDF)and spot
markets Evidence from Korean currencyrdquo Pacific Basin Finance Journal Vol 9 (4) pp363-377
Ryoo Sangdai and Kwon Taeyong and Lee Hyejin Foreign Exchange Market Developments
and Intervention in Korea (October 2013) BIS Paper No 73o
Sarwono Hartadi A (2005) ldquoIndonesian policy on non-residentsrsquo participation in the money
market the restriction of rupiah transactions by non-residents and foreign currency credit offered
by banks to non-residentsrdquo BIS Paper No 23
Standing Council on International Competitiveness of the Indian Financial System (2015)
International competitiveness of currency equity and commodity derivatives markets Department
of Economic Affairs Ministry of Finance
Wang Kai-Li Fawson Christopher and Chen Mei-Ling (2007) ldquoInformation Flows among
Exchange Rate Markets What Do We Learn From Non-Deliverable Forward Markets in Asiardquo
Chaoyang University of Technology October
111
Watanabe K H Akama and J Mifune (2002) ldquoThe effectiveness of capital controls and
monitoring the case of non-internationalisation of emerging market currenciesrdquo EMEAP
Discussion Paper January

7
Acknowledgements
The Report of the lsquoTask Force on Offshore Rupee Marketsrsquo was made possible with the support
of a number of individuals and organisations The Task Force would like to gratefully acknowledge
representatives of various banks financial institutions large corporates in India and abroad
foreign portfolio investors asset managers industry bodies experts and practitioners who
interacted with the Task Force and provided their valuable inputs and suggestions
The Task Force greatly benefitted from the experience of Smt Shyamala Gopinath former Deputy
Governor Reserve Bank of India and Shri G Padmanabhan former Executive Director Reserve
Bank of India who took time out of their busy schedules to attend the meetings of the Task Force
as special invitees
The Task Force benefitted from the interactions with Dr T V Somanathan IAS Additional Chief
Secretary Government of Tamil Nadu Shri R Sridharan Managing Director CCIL Dr V
Anantha Nageswaran Dean IFMR Chennai Shri Ananth Narayan Associate Professor SPJIMR
Dr A K Nag Shri Himadri Bhattacharya and Shri Jamal Mecklai CEO Mecklai Financial
Services
The Task Force invited submissions from members of the public and is grateful for several helpful
suggestions received
The Task Force also places on record the assistance provided by Shri Subrat Kumar Seet Director
and Smt Priyanka Sachdeva Manager from Department of Economic and Policy Research
Reserve Bank of India and Shri Hiren Sanghvi Director and Shri Saket Banka Associate Director
from HSBC India The Task Force specifically acknowledges the contribution of Shri Harendra
Behera Assistant Adviser Department of Economic and Policy Research Reserve Bank of India
in research on lsquoLinkages between Offshore and Onshore Rupee Marketsrsquo undertaken in
collaboration with Shri Sajjid Chinoy Chief Economist J P Morgan India
Finally the Task Force would like to commend the efforts put in by the Secretariat team from the
Financial Markets Regulation Department Reserve Bank of India led by Shri Supriyo
Bhattacharjee Deputy General Manager and supported by Shri Nitin Daukia Manager
Meticulous organisation of meetings by Smt Supriya Devalekar Assistant Manager and Shri
Kaivalya Sakalgaonkar Assistant from the Secretariat team is also appreciated
8
Preface
Offshore markets in a non-convertible currency usually referred to as non-deliverable forward
(NDF) markets enable trading of the non-convertible currency outside the influence of the
domestic authorities These contracts are settled in a convertible currency usually US Dollars as
the non-convertible currency cannot be delivered offshore Historically NDF markets evolved for
currencies with foreign exchange convertibility restrictions and controlled access for non-
residents beginning with countries in South America like Mexico and Brazil and thereafter
moving on to emerging Asian economies viz Taiwan South Korea Indonesia India China
Philippines etc Apart from enabling trading in non-convertible currencies NDF markets have
also gained in prominence because of onshore regulatory controls and their ease of access
Reserve Bank has been guided by the objective of developing a deep and liquid on-shore foreign
exchange market that acts as a price setter globally With regard to non-resident entities having
legitimate exposure to the Rupee the focus of policy efforts has been to align incentives for non-
residents to gradually move to the domestic market with adequate safeguards to ensure the
external stability of the value of the Rupee
The sharp growth in the offshore trading volumes in the Rupee NDF market in recent years likely
even beyond the volumes in the onshore markets have raised concerns around the forces that are
determining the value of the rupee and the ability of authorities to ensure currency stability This
necessitates a deeper understanding of the causes underlying the growth in those markets and
identification of measures to reverse the trend
The Task Force on Offshore Rupee Markets was set up to address that concern It was mandated
to study the factors attributable to the growth of the offshore Rupee market its effects on the Rupee
exchange rate and onshore market liquidity and formulate measures to redress the concerns The
Task Force was also charged to examine the role if any that International Financial Services
Centres (IFSCs) can play in addressing these concerns
During its term the Task Force interacted with a wide variety of stakeholders including banks
financial institutions industry bodies foreign portfolio investors asset managers and
academicians
9
I trust that the Reserve Bank of India will find the recommendations made in the report useful
Usha Thorat
Chairperson
10
Executive Summary
The origin of the NDF markets may be traced back to the 1990s when a wave of capital account
liberalisation in emerging market economies (EMEs) triggered a surge in capital inflows to these
economies and consequently heightened the currency risk faced by foreign investors Under-
developed domestic markets especially the market for financial derivatives as well as controlled
access to onshore markets raised the demand for a currency market outside the reach of local
regulations Another trend that supported the growth of the NDF market was the sharp rise
globally in the size of derivatives markets in the 1980s and 1990s As derivatives markets evolved
the speculative search for underlying moved out of the developed world into more esoteric assets
Following the successful speculative attack on the Sterling in 1992 EME currencies became viable
subjects for such speculative positioning Such activity becomes particularly noticeable during
times of stress as offshore risk spills over to the domestic exchange rate through entities that have
a presence in both onshore and offshore markets usually global banks but also corporates
A study of the degree and direction of such spillovers is important to understand the role of NDF
markets and assess policy alternatives The econometric study conducted by the Task Force
observed that the influence between offshore and onshore exchange rate goes both ways in normal
times that is it is bidirectional The study also observed that during the last two stress episodes
(the taper tantrum and the 2018 emerging markets crisis) the relationship turned unidirectional
with the NDF market driving onshore exchange rate The study concludes that as NDF volumes
have increased they have begun to play an important role in both price discovery and driving
volatility particularly during heightened uncertainty period The study also shows that periods of
divergence are limited and the markets converge and that too fairly rapidly
Against this backdrop and in the light of available information results of the statistical analysis
and most importantly based on the feedback received during the various consultations the Task
Force is making following recommendations in accordance with the terms of reference
i Onshore market hours may be suitably extended to match the flexibility provided by the
offshore market and thereby incentivize non-residents to hedge in the onshore market
ii Banks may be allowed to freely offer prices to non-residents at all times out of their Indian
books either by a domestic sales team or by using staff located at overseas branches
11
iii Non-deliverable Rupee derivatives (with settlement in foreign currency) may be allowed
to be traded in the IFSC and IBUs may be allowed to deal in such derivatives with a distinct
FCY-INR position limit To start with exchange traded currency derivatives involving
Rupee may be introduced and with experience non-deliverable OTC currency derivatives
involving Rupee may be allowed subsequently
iv While requirement of underlying exposure will continue for trading in the onshore market
users may be allowed to undertake positions up to USD 100 million in OTC as well as
exchange traded currency derivative market without having to establish the underlying
exposure
v The TF endorses the principle-based regulatory approach adopted in the draft regulation
on hedging by non-residents released by the RBI on February 15 2019 Also back-to-back
hedging by non-residents proposed under these draft regulations is endorsed Further in
case of hedging of anticipated exposures gains from cancellation of contract may be
allowed to be passed on even in cases where there are no cash flows at the discretion of
the bank where the bank considers the cancellation of underlying cash flow is due to
external factors which are beyond the control of the user
vi For ease of entering into hedge transactions for non-residents the TF recommends
a Establishment of a central clearing and settlement mechanism for non-residentsrsquo
deals in the onshore market
b Implementation of margin requirement for non-centrally cleared OTC derivatives
in the onshore market at the earliest
c Allow Indian banks to post margin outside India
d Wider access to FX-Retail trading platform to non-residents
vii A technology-based solution may be explored to centrally aggregate the investments of
non-residents and derivative contracts entered into by them in the onshore market (both
OTC and exchange traded) using LEI or any other unique identifier to start with
viii The issue of taxation in respect of foreign exchange derivative contracts may be examined
with the objective of overcoming gaps between tax regime in India and other major
international financial centres to the extent possible
ix KYC registration may be centralized across the financial market with uniform
documentation requirement
12
Chapter 1
Introduction
Currency is a component of sovereign money which is legal tender issued by the state The
external value of the currency the exchange rate is one of the most important economic and policy
variables which affects economic incentives and activity The exchange rate is determined mostly
by market forces of supply and demand which influence its flows across international borders
The exchange rate has critical information value in guiding financial and economic decisions
which affect real economic variables The stability and predictability of the exchange rate also has
a critical influence on growth and financial stability
Cross-border trade in goods services and assets (or capital) necessitates exchange of one currency
into another and can be thought of as the primary reason why currency markets exist However
as in any other financial market speculative elements ndash who take positions not for settling any
underlying transactions but for benefitting from market movements ndash are important participants
who perform the function of imparting depth to the market The aggregate actions of all
participants ndash hedgers arbitrageurs as well as speculators - determine the value and fluctuation of
the exchange rate
The currency markets for rupee especially for exchange against the USD are fairly well-
developed today One can classify these markets in three categories (a) spot versus derivatives
(b) over-the-counter (OTC) versus exchange-traded and (c) onshore versus offshore Further
derivatives can be cash-settled or delivery-based The most commonly referred benchmark
exchange rate of the rupee is from the onshore spot OTC market Similarly the commonly referred
forward exchange rate of the rupee is from the onshore forward OTC market Rupee futures and
options are traded in some onshore as well as offshore exchanges
The classification of currency markets can also be in terms of the nature of contracts between
buyers and sellers - spot forwards (futures on exchanges) and options contracts A spot contract
is for standard settlement ie the second working day after the date of transaction whereas in
case of forwards and futures (as well as options) the actual exchange or delivery of currency takes
place in the future at a date later than the spot settlement date There are also non-deliverable
forward contracts which are discussed below Forward and futures contracts are used as a risk
management tool or to hedge against possible adverse fluctuation in exchange rates It is important
13
to note that hedging implies risk transfer between the contracting parties it is not elimination of
risk
The category of the currency market that forms the focus of this report is the Offshore Rupee
markets The dominant segment of this market is the Non-Deliverable Forward (NDF) market ndash
wherein foreign exchange forward contracts are traded in the OTC market at offshore locations
generally the International Finance Centres (IFCs) like Singapore Hong Kong London Dubai
and New York These contracts do not involve a physical exchange of Rupees as Rupee is not
deliverable offshore and allow counter-parties to settle profit or loss in a convertible currency
usually the US Dollar which is why it is called a non-deliverable market NDF contracts are
usually traded on currencies which are not readily available to trade globally or outside of
sovereign boundaries These are thus mainly currencies from countries which have partial or no
capital account convertibility
There are also a few exchange-traded offshore rupee markets dealing in rupee futures and options
in Chicago Singapore and Dubai Volumes in these markets have typically been far smaller in
comparison to the offshore NDF OTC market Data on transactions in exchange-traded currency
markets can be ascertained with greater certainty whereas data on transactions in offshore OTC
NDF market have to be gauged through surveys and the estimates on the same are less firm
Why do NDF Markets Exist
NDF markets are not a phenomenon peculiar to the Indian Rupee they are common for currencies
of many emerging market economies (EMEs) As per BIS data NDFs in six currencies ndash Korean
Won Indian Rupee Chinese Renminbi Brazilian Real Taiwanese Dollar and Russian Ruble ndash
account for about two-thirds of the trade in NDFs globally The total daily average volume in NDF
markets is about USD 200 billion as per Bank of International Settlements (BIS) survey1 As per
this survey the share of India was about 1822 per cent of the trade in NDFrsquos globally (see Table
2 Chapter 2) The 2016 BIS survey (the next one will be released in the later part of 2019) showed
that offshore trades in Indian rupee were more or less equal to deliverable onshore forwards
1 2016 Triennial Central Bank Survey of Foreign Exchange and OTC Derivatives Markets
14
around $16 billion daily The 2018 Bank of England reported $23 billion in offshore rupee trades
while RBI sources estimate deliverable daily onshore forwards at $21 billion for 20192
The size of an open economy is one of the primary determinants of international participation in
its currency If international participants do not have direct access to the on-shore currency market
to meet their transaction needs or to hedge their currency exposure they are likely to use the
offshore NDF market The size depth and liquidity of the offshore NDF is thus indicative of the
non-resident interest in an emerging market economy
To some extent the offshore NDF market complements the need for a deep and liquid onshore
currency market What is the appropriate size of the forex market for an emerging market
economy with partially open capital account is determined by its size the share of foreign trade
and appetite for capital flows One proxy for estimating how large the forex market ought to be is
the GDP of the economy A better estimate could be the size of the open economy the trade and
investment sector
As Indiarsquos economy has grown over the past two and a half decades it has seen a significant rise
in openness (ie trade to GDP ratio has grown from 15 in 1990 to 43 in 2018) and in cross
border capital flows This has commensurately raised non-resident interest in the Rupee whether
for risk management purposes or for speculative ends The growing size of the Rupee NDF market
points to a need to widen participation in on-shore markets
The existence and size of offshore NDF markets is also a function of the degree of difficulty that
participants in foreign exchange market (especially non-residents) ndash both speculators and other
participants with requirements arising from cross-border trade transactions ndash face in accessing the
onshore markets The difficulties in accessing onshore currency markets could span a variety of
issues including the following
bull Restrictions on foreign exchange transactions
bull Cumbersome documentation and Know-Your-Customer (KYC) requirements for
participants in the domestic market
bull Restrictions on market participants (especially non-residents) in hedging activities such as
transaction limits tenor limits other documentation etc
bull Restrictions on cancellation and re-booking of contracts
2 For comparison with offshore market the onshore data includes forwards and swaps
15
bull Restrictions on the kind of derivative products that are allowed by market regulators and
bull Inconvenient market hours for those in other time zones
These constraints exist either to curb excessive speculation or to maintain financial stability
Are Offshore Rupee Markets a Problem
When the offshore market volume is significant or larger than the onshore currency market
volume as is the case with many EME currencies it leads to two fragmented markets wherein the
price discovery on the onshore market becomes vulnerable to influences from the price discovery
in the offshore market Empirical evidence (see Chapter 3) shows that while at most times the
direction of the influence runs both ways ie from onshore market to offshore market and vice-
versa the direction of the influence is more dominant from offshore market to the onshore market
in times of high volatility This could happen especially when tidal forces from global financial
markets influence the currency markets in a synchronised manner such as during times of
Emerging Markets (EM) currency crises
There are essentially four issues with regard to offshore market that are critical for regulators ndash
i Effectiveness of exchange rate management Many central banks including the Reserve
Bank have exchange rate stability as one of their objectives and resort to market
intervention or other regulatory measures to control volatility of the exchange rate from
time to time Such influence however extends only to the onshore currency market
Presence of a large offshore market dilutes the effectiveness of the exchange rate
management by the central bank It also hinders the pursuit of the objective of financial
stability in the domestic market
ii Disjointed price discovery During periods of volatility in the currency market when
price discovery in the offshore market causes large movements in onshore currency
markets the onshore market could often open with a large gap over the previous close For
resident market participants who want to cover their positions such gaps expose them to
significant risk
iii Revenue loss Every unit of turnover in a market earns a certain revenue for the market-
making financial firms Thus turnover in the offshore market can be viewed as a potential
revenue loss for domestic financial firms and the domestic economy
16
iv Effectiveness of RBI regulations on capital account management RBIrsquos policies on
capital account have been geared towards managing the impossible trinity a ldquomanagedrdquo
exchange rate free capital movement and an independent monetary policy RBI policies
have been geared toward avoidance of undue volatility in foreign exchange markets by
having restrictions on cancellation and rebooking and excessive risk-taking by resident
entities including corporates With this objective RBI restricts participation of resident
entities in currency derivatives to the extent of their underlying exposures A large market
outside the influence of regulatory authorities undermines their effectiveness
Constitution of the Task Force
Against this backdrop it was announced in the Statement on Developmental and Regulatory Policy
dated February 7 2019 the setting up of a Task Force on Offshore Rupee Markets Accordingly
a Task Force headed by Smt Usha Thorat was constituted with following terms of reference
i Assess the causes behind the development of the offshore Rupee market
ii Study the effects of the offshore markets on the Rupee exchange rate and market liquidity
in the domestic market
iii Recommend measures to address concerns if any arising out of offshore Rupee trading
iv Propose measures to generate incentives for non-residents to access the domestic market
v Examine the role if any International Financial Services Centre (IFSC) can play in
addressing these concerns
vi Any other relevant issue(s) the Task Force considers relevant to the context
The Task Force comprises of the following
i Smt Usha Thorat former Deputy Governor Reserve Bank of India ndash Chairperson
ii Shri Anand Bajaj Joint Secretary Department of Economic Affairs Ministry of Finance
Government of India ndash Member
iii Shri G Mahalingam Whole Time Director Securities amp Exchange Board of India ndash
Member
iv Shri Ajit Ranade Chief Economist of the Aditya Birla Group ndash Member
v Shri Sajjid Chinoy Chief Economist India JP Morgan India ndash Member
17
vi Shri Surendra Rosha CEO India HSBC Bank ndash Member
vii Shri Rajiv Ranjan Adviser-in-charge Department of Economic Policy and Research
Reserve Bank of India ndash Member
viii Shri T Rabi Sankar Chief General Manager Financial Markets Regulation Department
Reserve Bank of India ndash Member Secretary
Approach of the Task Force
Among the different issues relating to offshore markets the argument concerning revenue loss is
perhaps the most simplistic and an obvious response could be for India to develop non-deliverable
Rupee derivative market in an International Finance Service Centre (such as the GIFT City) located
within the geographical boundary of India However such a market will be virtually no different
from the markets located in Singapore or London and hence the objective of bringing volumes to
the onshore market will remain unaddressed
From the standpoint of addressing the concerns arising out of the existence of large offshore
markets it would make sense to incentivise movement of as much currency market transactions
from such markets to onshore currency markets as possible However theoretically one needs to
recognise that there is a trade-off between the sizeprominence of the offshore market and the
extent of regulationsrestrictions that are placed on cross-border transactions and foreign exchange
marketsparticipants It is also important to note that even if all non-residents with underlying
exposure move their hedging transactions to onshore markets offshore markets would continue to
exist to meet the demand of participants who take a view on the exchange rate without any
underlying exposure ie the speculative demand
At one extreme of the above-mentioned trade-off if India opts for a full rupee convertibility ndash by
removing all restrictions on current and capital account transactions ndash along with removal of all
restrictions on currency derivatives then offshore markets would no longer be a relevant concept
Capital account convertibility has been a hotly debated issue in the discourse on public policy both
in India and globally The received consensus in the last couple of decades endorsed by the
International Monetary Fund (IMF) in 2012 is that while capital flows are an important aspect of
the international monetary system providing significant benefits for countries they also carry risks
for macroeconomic and financial stability especially if they are large and volatile and thus pose
a challenge for policy Hence capital flows management measures are justified to help harness the
18
benefits while managing the risks More generally some restrictions to the capital account are
necessary for India to avoid the ldquoimpossible trinityrdquo With an economy as large and diverse as
Indiarsquos which is therefore expectedly not completely synchronous to the global cycle retaining
the independence of monetary policy is imperative Similarly having some control over the
exchange rate is necessary given its occasional propensity to be excessively volatile and overshoot
with attendant feedback loops to the macro-economy Therefore capital flow management
measures become necessary to avoid the trilemma and ensure simultaneous fulfilment of the other
two objectives Based on this received consensus as well as the experiences of some emerging
market economies through the last two decades the Task Force has proceeded on the basis that
the existing framework of capital account management followed by the Government and the RBI
will continue
There is also the issue of de-jure capital account convertibility Even when speculators
arbitrageurs and traders do not have direct access to forex markets to exploit persistent interest rate
differentials or perceived mispricing of the currency there are alternative channels available in
the system which make the actual arbitrage opportunities much lower Some examples of such
instruments is the Overnight Indexed Swaps (OIS) market or the use of Mumbai Interbank
Forward Offer Rate (MIFOR) Hence the de-jure level of capital account convertibility (CAC)
could be much higher than implied by the existence of capital controls
A related issue is the internationalisation of rupee According to McCauley (2011) a currency is
internationalised when market participants ndash residents and non-residents alike ndash conveniently use
it to trade invest borrow and invoice in it Based on the experience of China to internationalise
Renminbi and the evidence of the narrowing of the gap between onshore forward rate and NDF
rates for Renminbi internationalisation of currency has been sometimes advocated as a way to
reduce the influence of offshore markets While one has witnessed issuance of rupee-denominated
bonds (ldquoMasala Bondsrdquo) in some offshore markets in the recent past internationalisation of rupee
is still a distant goalpost given the persistent current account deficit and the negative net
international debt position Thus internationalisation of rupee is not an explicit goal guiding the
recommendations of the Task Force
Further the Task Force believes that Indiarsquos approach to the trade-off between deregulation of
currency markets and tolerance of offshore market must be shaped by the specific considerations
of the Indian economy rather than following any global template blindly
19
Compared to countries like Korea Taiwan or China Indiarsquos macroeconomic structure is
significantly different India is a structurally an economy with twin deficits ndash both fiscal and
current account Nearly half of Indiarsquos consumer price index (CPI) basket comprises of food items
making Indiarsquos inflation more vulnerable to supply shocks Although Indiarsquos macroeconomic
stability has improved considerably in the last few years considering the above factors the Task
Force feels that India cannot risk macroeconomic instability through potential exchange rate
shocks by drastically lifting the restrictions on foreign exchange markets and participants
On the other hand large volumes in the offshore market also reflect the fact that the interest in
Rupee is far larger than what is evident in onshore currency markets This reflects the growing size
of the Indian economy greater role of India in the global economy and growth in trade and capital
flows Over time therefore it would be imperative for the Indian regulators to take steps to expand
the role of onshore currency markets gradually lest the disjointed price discovery issue flares up
more frequently and in larger degrees
The balanced approach of the Task Force therefore is to look at each of the difficulties faced by
market participants in accessing onshore currency markets and prioritise their resolution in such a
way that prudent regulatory considerations are least compromised For instance certain market
micro-structure issues (such as extending the market hours of onshore currency markets) can be
addressed relatively quickly without any regulatory compromise On issues related to
documentation and KYC requirements smart application of ease-of-doing-business principles
needs to be followed Economic entities which need to undertake hedging of their foreign exchange
exposure on account of genuine underlying exposures need to be given greater flexibility in
undertaking such transactions in domestic currency markets While the need for underlying
exposure in order to operate in the forward markets cannot be eliminated the way in which it is
evidenced and monitored can be simplified The Task Force has proceeded on the basis of the
existing principles of regulations of foreign exchange markets
Of course the Task Force recognises that the recommendations will not do away with the
economic imperatives for which trading of rupee forward contracts exists in offshore markets
With our recommendations the Task Force believes that regulatory concerns arising out of the
offshore markets can be reduced though not eliminated
The Task Force held nine meetings between March 2019 and July 2019 The details of the meetings
are given in Annex V
20
Chapter 2
The Evolution of NDF Markets and Cross-country Experience
The foreign exchange market in India during 1970s and 1980s was heavily controlled and closed
in nature with various kinds of restrictions in place The Indian foreign exchange market started
deepening with the transition to a market-determined exchange rate system in March 1993 and the
subsequent liberalisation of restrictions on various external transactions leading up to current
account convertibility under Article VIII of the Articles of Agreement of the International
Monetary Fund in 1994 Notwithstanding various measures taken to further deepen and broaden
the foreign exchange market in India various restrictions are still in place to limit market access
to only those with underlying exposure and prevent undue speculation As India gets increasingly
integrated with the global markets and the exchange rate is increasingly market determined a
combination of capital flows management measures and currency trading restrictions in the on
shore markets are used to manage the lsquoimpossible trinityrsquo external value of the rupee These
measures and restriction are under constant review to ensure that the overall objective of growth
through foreign trade and investment are served
Against this backdrop this chapter attempts to highlights evolution in section II a brief review of
literature on the reasons behind increase in turnover in NDF market in Asian countries has been
given in Section III Section IV highlights the developments in NDF market The country
experiences such as nature of restrictions on non-residents operating in domestic currency
forwards market liberalisation measures taken by countries and its impact in curbing offshore
market discussed in Section V
I Introduction
NDFs are foreign exchange derivative instruments on non-convertible or restricted currencies
traded over the counter (OTC) mainly at offshore centres ie outside the direct jurisdiction of the
respective national authorities It is essentially a forward contract with different settlement process
Unlike the standard forward contract which involves exchange of underlying currencies on
maturity the NDF contract is typically settled as the difference between an exchange rate agreed
months before and the actual spot rate at maturity in an international currency (deliverable) mainly
the US dollars And the other currency which is usually emerging market currency is non-
21
deliverable The settlement of the transaction is not by delivering the underlying pair of currencies
but by making a net payment in a convertible currency equal to the difference between the agreed
forward exchange rate and the subsequent spot rate (Ma et al 2004) NDF contracts can either be
traded over the counter market or at exchanges at offshore financial centres such as Hong Kong
Singapore and London Lately they have become popular derivative instruments catering to the
offshore investorsrsquo demand for hedging arbitraging and speculating including by those who look
upon currency as an asset class
The major participants in NDF market could include foreign businesses and investors doing
business in countries with complex requirements for hedging currency risk in the local markets
arbitragers who have access to both on shore and offshore markets pure speculators like hedge
funds and others who take positions in the NDF market While these are the end users there are
also market intermediaries like banks dealers and brokers who provide quotes for trading in these
currencies and custodians who provide settlement arrangements While the multinational
companies deal in both the long and short end of the market the short end of the market is
particularly dominated by the hedge funds (Misra and Behera 2006) The pricing is influenced by
a combination of factors such as interest rate differential between the two currencies supply and
demand future spot expectations foreign exchange regime and central bank policies
NDF market primarily evolved in response to under-developed onshore forward markets and
limited access to non-residents to currencies with foreign exchange convertibility restrictions An
important advantage that enhances the demand for NDF is reduced credit risk compared to onshore
counterparts since there is no exchange of principal and only the difference amount is settled thus
allowing investors to circumvent limits associated with onshore activity Other reasons which also
favoured the emergence of NDF market includes convenience of time zones location of customer
business operating from a global treasury for multinational companies short-trading hours in
onshore forex market capital controls by individual central banks position limits frictions like
registration norms and know your customer norms frequent and significant changes in regulations
and guidelines in the domestic exchanges and OTC markets Moreover credit risk is also less
relevant since mostly large foreign banks are engaged as a counterparty in NDF trading Further
offshore centres in some cases are better placed to offer competitive services compared to the
22
onshore market on account of various factors ranging from tax treatment less onerous regulations
and documentation to operational efficiency
II Evolution of NDF Markets
The origin of NDF market traces back to the 1990s when a wave of capital account liberalisation
in emerging market economies (EMEs) triggered surge in capital inflows to these economies and
consequently increased currency risk faced by the investors However under-developed domestic
forward market or restricted access to onshore forward market paved the way for evolution of NDF
market as an alternative hedging tool to these investors The widely shared concern amongst local
monetary authorities was that easy access to onshore market and availability of domestic currency
to non-residents will encourage speculative activity leading to greater exchange rate volatility and
eventually the loss of monetary control Consequently some international banks began offering
NDF contracts to meet the demand of investors willing to hedge their EM currencies exposure
during early 1990s (Higgins and Humpage 2005)
One of the earliest NDF market developed during early 1990s was in Mexican peso to speculate
on the currency ahead of the devaluation from its then fixed exchange rate against the US Dollar
The increase in trading turnover during that time was facilitated by the entrance of voice brokers
as intermediaries between inter-bank trading activities (Lipscomb 2005) The NDF market for
some Asian economies like Korean Won Taiwanese Dollar Indian rupee and Chinese Renminbi
existed since mid-1990s due to either restricted or no access to onshore forward markets by non-
residents (BIS 2004) In case of New Taiwan Dollar only onshore entities had access to onshore
markets while it was subjected to underlying requirements in case of Korean Won Indian rupee
and Chinese Renminbi For other currencies like Indonesian rupiah NDF market evolved after
the Asian financial crisis in response to re-imposition of capital restrictions which were liberalised
in early 1990s In Indonesia rapid liberalisation beginning as early as 1970s and further
internalisation of Indonesia rupiah enabled the development of deliverable offshore market for
rupiah Following the currency crisis initial measures were directed at curbing non-trade and
investment related forward transactions with non-residents and broader measures prohibiting
banks from extending loans conducting derivative transactions and transferring rupiah to non-
residents were introduced in early 2001 While Malaysia also imposed cross border restrictions
23
after the crisis evolution of NDF market in Ringgit was initially inhibited by comprehensiveness
of regulations as well as its effective enforcement by the authorities (Ishii 2001)
McCauley (2011) showed that as income per capita rises a currency trades in ever greater
multiples of the home economyrsquos underlying international trade (ldquofinancialisationrdquo) and trades to
an even greater extent outside its home market (ldquointernationalisationrdquo) The increasing economic
interest in emerging market economies as a result of upbeat growth scenario from 2000s spurred
greater participation in currencies of these economies (Chart 1) In this context increasing turnover
in the Indian rupee Chinese Renminbi and other Asian currencies like Indonesian rupiah
Malaysian Ringgit Korean Won and New Taiwanese Dollar is consistent with increased
investment in these economies amidst restricted access to onshore markets Both India and China
recorded phenomenal growth rates translating into increased businesses (trade and investments)
with rest of the world and resulting exposures facilitated offshore trading of their currencies (Chart
2 a amp b) During 1990s mostly non-residents with genuine exposure used NDF market to hedge
their exposures in Indian rupee However with the development of onshore market providing
reasonable hedging facilities to foreign investors amidst gradual relaxation of controls most of the
market activity seems to be driven by speculators and arbitrageurs and those who are looking at
the rupee as a separate asset class to diversify their portfolios in view of its growing international
importance As a result the size of NDF market has grown over time In the Chinarsquos case the
emergence of offshore deliverables market for Renminbi (CNH) since 2010 was mainly due to
internationalisation of Renminbi which gradually substituted the NDF market
24
Chart 1 a amp b FX turnover Indexed 1998=100 and FX TurnoverTrade vs GDP
Source BIS Triennial survey IMF CEIC
Note Chart 1b A higher ratio of FX turnover to trade indicates that a currency trade in higher multiple
relative to its underlying trade as GDP increases
Chart 2 a amp b Gross trade Indexed 2000=100 and Gross trade vs FX turnover
Source IMF BIS World Bank
Both Indonesia and Malaysia have witnessed sharp increase in non-resident participation in local
currency bond market particularly in the aftermath of global financial crisis 2008 while these
countries local forward markets imposed restrictive conditions that restricted use of these markets
for hedging this led to the increased use of NDF market Non-resident ownership of government
debt in Indonesia and Malaysia as share of total outstanding government debt stood at 383 per
0
100
200
300
400
500
600
200
0
200
2
200
4
200
6
200
8
201
0
201
2
201
4
201
6
201
8
WorldAsiaEmerging and developing economiesAdvanced economies
0
1000
2000
3000
4000
0
200
400
600
800
1000
1200
1998 2001 2004 2007 2010 2013 2016
BRL IDR
CNY INR
MYR TWD
KRW right scale
Brazil
Korea
Indonesia
China
India
Malaysia
0
5
10
15
20
25
30
01 10 100 1000
GD
P p
er c
apit
a (U
SD
in t
ho
usa
nd
s)
FX turnover to trade (in log form)
Brazil
China
Indonesia
India
Korea Malaysia
Thailand
00
10
20
30
40
50
60
70
0 25 50 75 100 125 150
FX
turn
over
to
GD
P
External trade to GDP
25
cent and 243 per cent as at the end of March 2019 respectively highest amongst other Asian
economies However foreign participation in equity market is higher for Korea and Taiwan While
Taiwan has limits on investments in domestic bonds by non-residents foreign investors are not
subject to any investment ceiling for both aggregate and individual holdings in a listed company
except for a few restricted industries
Additionally the reason for growing NDF market could be increased carry trade activities for high
yielding currencies After examining the returns of carry trades with deliverable and non-
deliverable forwards Doukas and Zhang (2013) found that carry trades for currencies with NDF
contracts perform better compared to carry trades for currencies with deliverable forward
contracts This excess return is attributed to the compensation of risks emanating from currency
convertibility and capital controls For the Brazilian Real (BRL) derivatives offshore NDFs in
particular are the main vehicle for investors looking to implement carry trades (BIS Santaelaa
2015)
NDF market evolved mainly for emerging market economies witnessing increased economic
interest in the process of transition to high growth phase since 1990s whilst restrictions persisted
in accessing onshore markets for hedging currency risk arising out of these exposures The NDF
market also provided an opportunity to speculate on currencies which underwent notable shift in
their exchange rate regime During periods of global uncertainties like in 2013 during ldquotaper
tantrumrdquo the NDF market is used for speculative purposes arguably causing disruptions in
domestic forex market
III Size of the NDF market
Given that NDF is an over the counter (OTC) traded instrument the turnover data relies on various
surveys conducted by institutions at different time intervals In view of this issues like
comparability and continuity in data often arises However these surveys still provide useful
information to gauge the growth of NDF market over time Results from the semi-annual turnover
survey for the Foreign Exchange Joint Standing Committee chaired by Bank of England (BoE)
suggests that growth of NDF market has outpaced the forward market as well as overall foreign
exchange market In London the average daily NDF turnover surged to USD 139 billion as per
26
the latest survey in October 2018 from as low as USD 21 billion in 2008 During this period NDF
turnover quadrupled and its share increased to 53 per cent of overall forex turnover and comprised
nearly 34 per cent of both onshore and offshore forwards compared to nearly 10 per cent in 2008
Table 1 NDF trading in London (Average daily turnover in billions of US dollars)
NDFs All forwards NDF of all
forwards
All FX NDF as of all FX
Apr-08 23 200 115 1832 13
Oct-08 19 230 83 1699 11
Apr-09 16 162 99 1356 12
Oct-09 26 191 136 1522 17
Apr-10 25 186 134 1687 15
Oct-10 37 188 197 1787 21
Apr-11 42 192 219 2042 21
Oct-11 37 192 193 2038 18
Apr-12 36 192 188 2014 18
Oct-12 45 211 213 2017 22
Apr-13 60 265 226 2547 24
Oct-13 43 205 210 2234 19
Oct-14 62 304 204 2711 23
Apr-15 64 295 217 2481 26
Oct-15 54 253 213 2111 26
Apr-16 60 275 218 2225 27
Oct-16 62 292 212 2179 28
Apr-17 78 332 235 2401 32
Oct-17 90 330 273 2380 38
Apr-18 111 407 273 2727 41
Oct-18 139 409 340 2611 53
Source BIS London Foreign Exchange Joint Standing Committee
A similar survey is conducted by Hong Kong trade repository (HKTR) under the mandatory
reporting obligations imposed since July 2015 According to the HKTR survey daily average
27
NDF turnover in Hong Kong has also exhibited significant growth and daily average turnover
increased to USD 55-60 billion in 2018 from nearly USD 8 billion in 2015
The BIS publishes data on foreign exchange and derivatives trading activity every three years and
also prepare a separate report on NDF covering global market since 2013 The latest 2016 BIS
triennial survey reported that average daily turnover in global NDF market has increased by 53
per cent to USD 134 billion as compared to April 2013 Further NDF share in outright forward
and overall foreign exchange trading remained stable at 190 per cent and 26 per cent respectively
(Table 1) This is in contrast to the decline in average daily turnover in global FX markets to USD
51 trillion in 2016 from USD 54 trillion in 2013 survey conducted by BIS
The currency composition suggests that the Asian currencies dominate the NDF trading activity
with the highest turnover recorded by Korean Won as Korea generally has open capital account
and there are limits on non-residents borrowings in Korean Won from banks in Korea therefore
it is not deliverable offshore (BIS Survey 2016) Survey results from London Hong Kong and
Tokyo foreign exchange committees (FEC) as well as the BIS triennial survey points toward
increased NDF trading activity in Korean Won The Tokyo survey which is available from the
year 2006 suggest that the growth in NDF trading activity for Korean Won has shown significant
growth outperforming other major currencies The momentum in major currencies picked up ahead
of the global financial crisis 2008 before faltering during the crisis period owing to deteriorating
financial conditions Subsequently the NDF activity has deepened over time with the Indian rupee
and Brazilian Real constituting higher proportion of total global turnover after the Korean Won
as corroborated by the London survey also During the five-year period from 2008-13 the increase
in NDF turnover is largely consistent with the FX turnover in emerging market economies (BIS
2013)
Since 2013 greater demand for hedging in anticipation of monetary policy normalisation seems
to be the driving factor for increase in NDF activity given that lot of capital flows to emerging
markets was funded using low cost dollar liquidity (BIS 2013) The BIS 2016 survey identified
that developments associated with higher volatility in Renminbi during August 2015 and January
2016 has also boosted Asian NDFs even as trading activity in Renminbi NDF has faded
According to the BIS 2016 survey during 2013 and 2016 trading in Renminbi NDF contracted
by 394 per cent while that of Korean Won and Taiwanese Dollar expanded by 537 per cent and
28
299 per cent respectively The decline in the NDF activity for Indian rupee reflects the
depreciation of rupee against the US dollar however daily average turnover was up by 167 per
cent between 2013 and 2016 in unadjusted terms Hong Kong (HKTR) survey indicates continued
decline in NDF activity for Chinese Renminbi and Malaysian Ringgit (Table 2 and Chart 2 a amp b)
In case of China this was due to the Renminbi internationalisation policy followed after 2011
Table 2 Daily average turnover (USD billion) Spread
BIS 2013 BIS 2016
Oct- 2018
(London Survey) Bid-Ask (Latest)
NDF DF NDF DF NDF
DF
(Latest) Onshore Offshore
Chinese Renminbi 171 24 104 281 88 650 0001-0002 0003-0005
Indian Rupee 172 31 164 163 2303 214 001 002
Korean Won 196 11 301 145 295 300 010 030
Taiwanese Dollar 89 02 115 78 - 193 0005-0010 0010-0020
Brazilian Real 159 27 187 30 154 - - -
Russian Ruble 41 05 29 186 40 - - -
Source BIS London FEC BoK RBI China Foreign Exchange Trading Center Central bank of Taiwan HSBC
Note
1 DF= Deliverable forwards and include forwards and FX swaps traded onshore
2 Chinese Renminbi volumes on offshore segment are negligible after development of CNH market
3 BIS DF and DF (latest) are not directly comparable since latest numbers are taken from country sources
Chinese Yuan is for Jun-19 Indian rupee and Taiwanese Dollar is for Apr-19 Korean Won is for 2017
Chart 2 Average Daily Turnover and Change in Forex position of Asian Currencies
3 The corresponding figure for April 2019 stood at USD 28billion
0
100
200
300
400
500
US
DC
NY
US
DI
DR
US
DI
NR
US
DK
RW
US
DM
YR
US
DT
WD
Chart 2b Change in FX position of Asian
currencies (in USD billion)
29 January 2016 27 January 2017
31 January 2018 25 January 2019
0
200
400
600
800
1000
1200
Apr-
06
Apr-
07
Apr-
08
Apr-
09
Apr-
10
Apr-
11
Apr-
12
Apr-
13
Apr-
14
Apr-
15
Apr-
16
Apr-
17
Apr-
18
Chart 2a Average daily turnover USD
million
CNY INR IDR KRW
MYR TWD BRL
29
Source Tokyo FEC Hong Kong FEC
Based on latest surveys conducted by London and Hong Kong FEC which are major offshore
centres clearly it showed that the global NDF activity has surged led by Korean Won Indian
rupee Brazilian Real and Taiwanese Dollar The trend is likely to be validated by BIS 2019 survey
which encompasses global turnover and is due to release later this year
IV Review of Literature
In view of the noticeable rise in NDF activity with potential to engender distortions in local market
there exist varied literature on the emergence of NDF market and its spill-overs to onshore
counterparts One of the earliest attempts was made by Park (2001) which investigated the impact
of financial deregulation on relationship between onshore and offshore prices A key finding was
that Korean Won NDF influenced onshore prices after a shift to floating exchange rate regime
coupled with liberalisation of capital controls As part of liberalisation measures following the
Asian financial crisis in 1997 excessive regulations pertaining to foreign exchange market were
removed and measures were undertaken to improve efficiency of market by increasing liquidity
and broadening participation base (Chung et al 2000) Amongst these measures onshore entities
were allowed to participate in offshore market In this regard Lipscomb (2005) suggested that
transition to a more convertible exchange rate regime and permissible participation of onshore
counterparties in NDF transactions contributed to the increase in offshore liquidity which begets
liquidity in domestic market as well A classic example is Korean Won where both onshore and
offshore market co-exist with arbitrage opportunity exploiting any incipient price discrepancy
However NDF markets tend to disappear as the currency becomes fully convertible as stated
earlier
Wang et al (2007) also corroborated the finding that NDF market seems to be the driver for the
domestic spot market of Korean Won while the information flow is reverse for Taiwanese Dollar
where the spot market was found to have influence on NDF market Adding to this literature
Colaveccchio and Funke (2008) found Renminbi NDF to be the key driver of Asian currency
markets with varied degree of heterogeneity contingent on real and financial inter-linkages
Amongst the country specific study the one by Cadarajat and Lubis (2012) demonstrated that
Indonesia rupiah NDF tends to have influence on domestic spot and forward return
30
Studies by Hutchison (2009) Mihajek and Packer (2010) and McCauley and Scatigna (2011)
asserted that offshore trading becomes increasingly important with growing economic interest in
a particular currency amidst limited access to onshore markets and convertibility restrictions A
study by BIS (2013) analysed the directional impact for nine currencies including the Indian rupee
for the period 2005-13 along with separate analysis for 2008-09 crisis and May-August 2013 It
found the presence of two way causation for most currencies for the full sample period however
noted the increase in NDF influence during market stress Both the stress period saw noticeable
impact of NDF particularly during May-August 2013 with major exception of Malaysian Ringgit
where NDF played dominant role and there was no case of deliverable forward influencing NDF
In the Indian context the earliest study with regard to spill-overs impact was undertaken by Misra
and Behera (2006) They found onshore prices to have directional impact on NDF prices even as
volatility spillovers could exist from NDF to onshore market The subsequent research on this
subject during the period 2000-09 by Behera (2011) demonstrated the change in dynamics with
evidence of greater volatility spillover from NDF to spot market A similar finding was outlined
by Guru (2009) on the relationship between the NDF and onshore market for Indian rupee It is
argued that dynamics of relationship between onshore and offshore markets has undergone a
change with the introduction of the currency future market in 2008 and returns in NDF market
seem to be influencing the domestic spot as well as forward market
A study by Darbha (2012) finds that offshore markets plays an important role in price discovery
mechanism particularly in India and China Goyal et al (2013) after examining the period 2006-
13 found the existence of bi-directional relationship between onshore and NDF market for Indian
rupee over the long term however the directional impact turns one way from NDF to onshore
during periods of depreciating pressures ie movements in NDF markets drives adjustment in
onshore market when the currency is under depreciation pressures This asymmetric behaviour is
attributed to the fact that the Reserve bank intervenes in the foreign exchange market to stem
excessive volatility during periods of rupee depreciation
McCauley et al (2014) described two paths for evolution of the NDF markets The first one is
being followed by Chinese Renminbi which has become deliverable after the emergence of
offshore market The Indian rupee falls under the second where the NDF market has grown amidst
continued restrictions on foreign participation
31
The report of the Standing Council (Standing Council on International Competitiveness of the
Indian Financial System 2015 by Ministry of Finance Government of India enumerated factors
including capital controls position limits frictions like registration norms and know your customer
norms frequent and significant changes in regulations and guidelines in the domestic exchanges
and OTC markets as deterrent to foreign investors participation in the onshore market
IGIDR Finance Research Group (2016) made an important recommendation that domestic entities
should be permitted to participate in NDF market after outlining factors driving offshore activity
compared to onshore segment In respect of the internationalisation of rupee as one of the debated
recommendation Kumar and Patnaik (2018) argued the case for gradual internationalisation of
rupee on analysing the role of the Indian rupee in terms of official sector currency reserve currency
and trade invoicing currency
V Country Experience
China
The Chinese Renminbi (RMB) forward market can be segmented into offshore NDF market (since
1990s) an onshore Renminbi market (since 2007) and the CNH market (offshore deliverable) In
the current scenario RMB NDF has been gradually replaced by offshore deliverables after the
creation of CNH market since mid- 2010 as a by-product of promotion of international role of
RMB since 2009
Chinarsquos exchange rate regime has evolved from fixed to managed floating rates followed by
internationalisation of Renminbi (RMB) In early 1990s reforms started with the unification of
multiple exchange rate in 1994 and in 1996 China allowed the full convertibility of Yuan under
current account transactions Eventually the Peoplersquos Bank of China (PBoC) announced the
implementation of managed floating exchange rate against basket of currencies in July 2005
ending the dollar peg prevalent since 1994 Over the last decade Chinarsquos strong economic
performance and growing linkages with rest of the world prompted authorities to promote the
international role of RMB The idea of internationalisation of RMB gained prominence following
the financial crisis of 2008 which revealed the fragilities of dollar dominated global financial
system The thrust of early initiatives was RMB trade settlement premised on Chinarsquos deeper trade
32
links and its central role within Asiarsquos supply chain that supported the demand for its currency for
trade invoicing In this regard a pilot scheme permitting cross border trade settlement in RMB was
launched in 2009 which was widened to cover all current account transactions over the course of
next three years Capital account liberalisation was undertaken at a more gradual pace with the
Chinese RMB becoming officially deliverable at offshore centres in 2010 While Hong Kong
banks were permitted to accept RMB deposits as part of personal accounts in 2004 an important
milestone was the sign of Memorandum of cooperation between HKMA and PBoC in July 2010
which eliminated restrictions on Hong Kong banks in establishing Renminbi accounts and
providing related services ie payments and transfers in RMB to individuals and corporations
Moreover financial institutions were permitted to offer Yuan denominated products As a result
CNH (offshore Renminbi) began to trade actively amongst other range of products and prompted
investors to switch to deliverable market in place of NDF which was used previously Whilst CNH
can be transferred freely between offshore accounts transfer of RMB between onshore and
offshore is still confined to regulated channels to fend off potential adverse impact on onshore
markets Moreover these restrictions are skewed towards outflows form the mainland to offshore
centres
With Renminbi internationalisation the offshore CNH market has shown exponential growth
displacing the NDFs The BIS Triennial Survey showed significant decline in RMB NDF which
fell nearly 40 per cent between 2013 and 2016 driving its share in total RMB trading to 5 per cent
from 14 per cent earlier (BIS 2016) The rapid expansion of offshore market is clearly discernible
in rising FX turnover for CNH which has nearly doubled between 2013 and 2016 and forms around
67 per cent of the total RMB turnover Of the total CNH turnover average daily turnover in the
DFs in April 2016 was estimated to increase to USD 164 billion from USD 84 billion in 2013
(Table 3)
33
Table 3 RMB market turnover average daily turnover in USD billion
OTC
spot
OTC
FX
swaps
OTC
DFs
OTC
NDF Options Futures
OTC
currency
swaps Total
CNY
2013 201 105 26 0 03 0 0 335
2016 249 27 13 0 2 0 02 554
change 239 1565 -514 5693 651
CNH
2013 139 294 84
168 0 05 69
2016 427 59 164
158 03 25 1367
change 2079 1008 943 -56 5784 3836 981
NDF
2013
171
171
2016
104
104
change -394 -394
Source BIS
Since the inception of CNH pricing gaps tend to persist between onshore and offshore exchange
rates however it has narrowed over last couple of years This pricing gap arises on account of
different economic conditions in mainland China and Hong Kong amidst imperfect arbitrage
(Funke 2015) While central bank intervention can constrain the movement of CNY at onshore
centres CNH is more market determined and hence closely follows the global swings (Chart 3)
Since September 2015 PBOC has reportedly taken action in the offshore market when the
onshore-offshore gap was large (McCauley amp Shu 2018)
34
Source Bloomberg
Further liberalisation of the onshore FX market along with allowance of offshore deliverable
market has made the CNY NDF market almost non-existent despite maintaining the lsquoneed basisrsquo
principle Notwithstanding the existence of basis between CNY and CNH due to the band range
trading in CNY and market determined pricing in CNH the spread has been contracting over years
with ample liquidity available in onshore and offshore markets Further the creation of offshore
market has made various options available to offshore investors to both hedge their exposures on
underlying investments and also generate RMB risk in their portfolios via various products and
offshore deliverable market
Korea
With an average daily turnover of USD 30 billion as per the BIS survey 2016 and USD 295 billion
in the latest London survey of October 2018 Korean Won (KRW) NDF boasts of the most active
and liquid NDF market amongst most emerging market currencies Further permissible
participation of local banks in the NDF market ensures close integration of onshore and offshore
forex markets allowing for quick sentiment spillovers between the two markets Turnover in NDF
market is substantially higher than onshore forwards mainly on account of higher documentation
requirements for accessing onshore market In the onshore market average daily turnover was
reported at USD101 billion in 2017 for forwards which increased from USD 96 billion during
the previous year (Chart 4 a ampb)
-015
-01
-005
0
005
01
01-0
8-2
010
01-1
2-2
010
01-0
4-2
011
01-0
8-2
011
01-1
2-2
011
01-0
4-2
012
01-0
8-2
012
01-1
2-2
012
01-0
4-2
013
01-0
8-2
013
01-1
2-2
013
01-0
4-2
014
01-0
8-2
014
01-1
2-2
014
01-0
4-2
015
01-0
8-2
015
01-1
2-2
015
01-0
4-2
016
01-0
8-2
016
01-1
2-2
016
01-0
4-2
017
01-0
8-2
017
01-1
2-2
017
01-0
4-2
018
01-0
8-2
018
01-1
2-2
018
01-0
4-2
019
Chart 3 Gap between USDCNY and USDCNH
Offshore premium
35
Chart 4 Foreign Exchange Turnover and NDF market in Korea
Source Bloomberg Bank of Korea
Korea embarked on liberalisation reforms in 1980s however took big strides post Asian financial
crisis in 1997-98 in line with the IMF adjustment programme As part of these measures foreign
exchange transactions were liberalised which allowed the local banks to engage in NDF
transactions with non-residents Prior to this the development of the onshore currency derivatives
market was constrained by legal requirements such as any forward transaction had to be certified
as a hedge against future current account flows the so-called ldquoreal demand principlerdquo which also
spurred the development of a liquid offshore ldquonon-deliverablerdquo forward (NDF) market in the
Korean Won In 1999 as part of liberalisation measures this restriction was lifted and a lot of
activity moved onshore leading to the convergence of the offshore and onshore prices (IMF
2004) This resulted in sharp increase in NDF transactions between onshore banks and non-
residents for both hedging as well as speculative purposes Amidst likely possibility of turmoil in
foreign exchange market the central bank implemented regulations in January 2004 governing
Korean banks NDF positions with the non-residents directed at restraining any potential selloffs
However these restrictions were abolished in April 2004 as speculative activity was assessed to
have reduced significantly
KRW is almost a non-restricted currency provided the investor holds an Investment Registration
Certificate (IRC) issued by the Financial Supervisory Services (FSS) in Korea The IRC allows an
offshore investor to invest in onshore securities and provides near non-restricted currency rights
barring any holding of short selling position in onshore KRW account
191 18 183 175 20 194 196
7566 71 76
83 96 101
192198 196 19
192 184198
0
10
20
30
40
50
2011 2012 2013 2014 2015 2016 2017
Chart 4b Foreign Exchange Turnover
in Korea daily average USD billion
Spots Forwards Fx Swaps
-60
-50
-40
-30
-20
-10
0
10
20
30
12
-19
98
01
-20
00
02
-20
01
03
-20
02
04
-20
03
05
-20
04
06
-20
05
07
-20
06
08
-20
07
09
-20
08
10
-20
09
11
-20
10
12
-20
11
01
-20
13
02
-20
14
03
-20
15
04
-20
16
05
-20
17
06
-20
18
Chart 4a Onshore USDKRW-NDF 1M
USDKRW
36
For non-residents investors who do not hold IRS USDKRW remains a highly regulated market
Any onshoreoffshore transactions need to be approved by the appropriate authorities and must
have proof of underlying For multinational clients that repatriate dividends documentation with
proof of underlying must be in place Further ceilings are imposed on foreign exchange derivatives
transactions of foreign as well as local banks which came into existence as a prudential measure
to mitigate the adverse impact of volatile capital flows
Ahead of the 2008 financial crisis Korean economy experienced huge build-up of short-term
external debt led by foreign exchange derivatives positioning of banks on account of over-hedging
undertaken by Korean corporations as well as likely carry trades in anticipation of appreciation of
domestic currency Both these activities were funded using offshore dollar borrowing and posed
serious difficulties at the time of global dollar liquidity crunch during financial crisis With a view
to prevent recurrence of the any such episode triggered by volatile capital flows which resurged
from 2009 over-hedging was specifically prohibited and limits were imposed on Foreign
exchange derivatives activity of banks in relation to their capital Liberalization in KRW has been
continuing for decades with the last one completed in December 2007 whereby prior approval
requirements for some capital account transactions was abolished Even onshore participants can
freely participate in the NDF markets thereby providing onshore liquidity to Non-Residents as
long as the hedges are booked as NDF Essentially KRW is a fully convertible currency but is
only tradable on NDF basis offshore
Malaysia
Malaysia had liberal foreign exchange policies until Asian financial crisis with regard to cross
border transactions involving Malaysian Ringgit (MYR) Following the crisis offshore trading of
MYR was banned However grace period was notified for depositors to repatriate their offshore
deposits back to Malaysia and the adoption of fixed exchange rate policy in 1998 - a significant
move whilst imposing selective capital controls All these measures were intended at ceasing
offshore activity which contributed to the excessive pressure on currency despite relatively
stronger fundamentals Although Malaysia imposed cross border restrictions after the Asian crisis
evolution of NDF market in MYR was initially inhibited by comprehensiveness of regulations as
well as its effective enforcement by the authorities (Ishii 2001) Further absence of reference rate
37
for settlement of NDF contracts and stringent controls on domestic bank to undertake forward
foreign exchange transactions with offshore counterparties also hindered the development of NDF
market (EMEAP discussion paper 2002) As the economy began to recover capital controls were
gradually relaxed and finally the currency was floated in 2005
Generally Malaysia has opened up its domestic markets for non-resident investors with no
restrictions on non-residents investing in local bond markets except having to appoint a local
custodian Most of the sectors are open for non-resident portfolio equity flows as well in Malaysia
Over the years since 2005 non-resident investorsrsquo participation in the onshore market picked up
substantially reaching record high of 397 per cent of total outstanding government bonds from
nearly 14 per cent in 2005 and in the process contributed to the growth of NDF market as well
McCauley (2013) analysed the direction of influence for nine currencies in 2005-13 as well as
separately for the 2008-09 crisis and May-August 2013 Granger causality tests point to two-way
causation for most currencies for the full sample The exception is the Malaysian Ringgit where
the NDF influences the deliverable forward market The central bank expressed concerns over the
adverse impact of increased activities in the ringgit NDF market after wide gap was observed
between the NDF and onshore rate in 2016 following the US presidential election Bank Negara
Malaysiarsquos (BNM) Governor emphasised that ringgit NDF market is used by non-resident
investors mostly for speculative purposes rather than genuine demand for hedging As the NDF
trading activity intensified during volatile period in 2016 ringgit-denominated NDF implied much
larger depreciation which further exacerbated the then prevailing depreciating pressure on the
currency (Chart 5)
Chart 5 Onshore and Offshore market in Malaysia
Source Bloomberg
4141542
42543
43544
44545
455
Oct
-16
Oct
-16
Oct
-16
Nov
-16
Nov
-16
Nov
-16
Nov
-16
Dec
-16
Dec
-16
Dec
-16
Dec
-16
Dec
-16
Jan-1
7
Jan-1
7
Jan-1
7
Jan-1
7
Feb
-17
Feb
-17
Onshore USDMYR Offshore 1month NDF USDMYR
38
Assessing the overwhelming impact of NDF activities which has the potential to undermine
financial stability BNM took a number of measures in 2016 to eliminate speculative transactions
in order to ensure appropriate price discovery and orderly functioning of onshore market These
measures includes reinforcement of non-internationalisation policy for Ringgit steps to improve
the onshore pricing mechanism and deepen the domestic forex market After prohibiting banks
from quoting fixing orders used to settle offshore trades the central bank revised the methodology
to compute onshore reference rate to account for transacted deals from mid-2016 Further BNM
imposed a ban on ringgit NDF trading in November 2016 and reminded local banks that ringgit
remains a non-internationalised currency and therefore any offshore trading is not recognized At
the same time BNM strengthened its monitoring to ensure compliance to Foreign exchange
administration rules (FEA) rules by market participants on non-involvement in facilitating NDF
transactions Subsequently financial markets committee (FMC) instituted in mid-2016 laid down
a series of developmental measures for onshore market aimed at allowing better market access and
greater hedging facilities to market participants (Table 5)
Table 5 Developmental Measures Relating to Foreign Exchange Market
Jul-16 Dec-16 Apr-17
Adopting global best practices Rebalance onshore FX demand and supply
Additional FX risk
management practices
bull Transaction based KL
USDMYR reference rate
bull 25 retention of export proceeds in
foreign currency
bull Streamline passive and
dynamic hedging
flexibilities for
investors
bull Extension of official closing hour
for onshore Ringgit rate
bull Trade settlement among residents in
Ringgit only
bull Active hedging for
corporations
bull Streamline onshore and offshore
foreign currency investment limit
Promote FX risk management onshore
bull Active hedging below RM6t million of
net open position
bull Active hedging for institutional
investors
39
bull Expansion of appointed overseas office
framework
In an immediate impact reinforcement of restrictions on USD-MYR NDF market resulted in
significant outflows from local bonds in Malaysia However as a positive impact with the bout
of capital outflows following ban on NDF transactions composition of non-resident holdings has
shifted towards more stable and long-term investors thereby reducing the risk exposure to global
impulses Further the disruptive influence from NDF market subsided and onshore foreign market
continues to register higher average daily volume These measures have helped in increasing the
depth and liquidity of the foreign exchange market as evidenced by declining volatility and
narrowed bid-ask spreads in onshore market The decline in offshore volumes has resulted in
widened bid-ask spread (Chart 6 a amp b)
Chart 6 Malaysia Monthly FX forward volumes and Bid-Ask Spread
Source BNM Reuters and Bloomberg
-001
0
001
002
003
004
005
01
-10
-201
0
01
-04
-201
1
01
-10
-201
1
01
-04
-201
2
01
-10
-201
2
01
-04
-201
3
01
-10
-201
3
01
-04
-201
4
01
-10
-201
4
01
-04
-201
5
01
-10
-201
5
01
-04
-201
6
01
-10
-201
6
01
-04
-201
7
01
-10
-201
7
01
-04
-201
8
01
-10
-201
8
01
-04
-201
9
Chart 6b Bid-Ask spread
offshore bid-ask onshore bid-ask
0
10
20
30
40
50
60
70
80
90
0
5
10
15
20
25
30
Dec
-12
May
-13
Oct
-13
Mar
-14
Aug
-14
Jan-1
5
Jun
-15
Nov
-15
Apr-
16
Sep
-16
Feb
-17
Jul-
17
Dec
-17
May
-18
Oct
-18
Mar
-19
Chart 6a Monthly FX forward turnovers (in
USD billion)
Onshore FX forward Offshore FX forward RHS
40
Chart 7 Non-resident holdings of total government debt and Monthly FX turnover
Source BNM and HSBC
Indonesia
The development of NDF market in Indonesia Rupiah traces back to the year 2001 when Bank
Indonesia (BI) prohibited onshore banks from lending to non-resident accounts in an attempt to
reduce the speculative pressure on the Indonesian Rupiah (IDR) These restrictions paved the way
for development of offshore rupiah NDF market to cater to the demand of international investors
Prior to this an active offshore deliverable market existed for IDR following the pursuit of
liberalisation policies beginning as early as 1970s which allowed the IDR to be freely convertible
and at the same time permitted its internationalisation Consequently the international use of
rupiah increased but was confined mostly to financial transactions mainly due to limited invoicing
of trade-related transactions in IDR terms This easy access to rupiah from onshore centres due to
internationalisation allowed non-resident to speculate on the currency during the 1997 crisis in
Asian countries As a result of heightened activity in times of stress exchange rate volatility
increased making it difficult for the central bank to maintain stability of rupiah In response to the
crisis the currency was freely floated replacing the intervention band but weakness in the currency
and high volatility continued to persist compared to currencies of other Asian countries during the
first three years of its floating rate regime Taking cognizance of this disparity the central bank
began to evaluate the extant regulations relating to rupiah transactions with non-residents
Thereafter during the year 2001 the BI imposed extensive regulations limiting non-resident
143
397
243
50
100
150
200
250
300
350
400
450
Jan-0
5
Oct
-05
Jul-
06
Apr-
07
Jan-0
8
Oct
-08
Jul-
09
Apr-
10
Jan-1
1
Oct
-11
Jul-
12
Apr-
13
Jan-1
4
Oct
-14
Jul-
15
Apr-
16
Jan-1
7
Oct
-17
Jul-
18
Apr-
19
Chart 7a Non resident holdings as of total
government debt
-
500
1000
1500
2000
2500
3000
Jan-1
6
Apr-
16
Jul-
16
Oct
-16
Jan-1
7
Apr-
17
Jul-
17
Oct
-17
Jan-1
8
Apr-
18
Jul-
18
Oct
-18
Jan-1
9
Chart 7 Monthly onshore FX market
turnover (in billion of USD)
FX Spot FX Swap FX Forward FX Options
41
rupiah transactions and shrinking the pool of offshore rupiah funds with the potential to be used
for speculation identifying spill overs from offshore market as conduit of excessive volatility
In general Indonesia has opened up its domestic bond markets for non-residents completely with
no entryexit barriers except having to appoint a local custodian Foreign exchange hedging is
allowed only with underlying documentationasset in place for non-residents On the portfolio
equity investments regulation clearly provides that a listed company is exempt from any foreign
investment restrictions However there are sectoral restrictions on FDI in Indonesia which are
decided by BKPM (Investment Coordinating Board in Indonesia) which provides a DNI list
(Governmentrsquos negative investment list) The share of non-residents in Indonesia Government
Bonds has been increasing over years from a mere 1570 per cent of the total government bonds
in June 2009 to 3810 per cent in April 2019 (Chart 8)
Source HSBC
Research from BI in 2012 found disproportionate impact of NDF market to spot market during the
period 2008-11 Results suggests that there is evidence of unidirectional mean spill-over from NDF
to both spot and forward rupiah markets with an exception of Europe crisis On volatility spillover
the study obtained significant results from NDF market to spot market for entire period However
in crisis situation the study found interdependence between volatility in offshore NDF and onshore
spot rate changes while information transmission is only valid from NDF to forward rate changes
not the other way around (Cadarajat and Lubis 2012)
To reduce the unwarranted influence of NDF market on spot market BI took initiatives beginning
the year 2014 to bridge the gap between onshore and offshore rupiah rate In 2014 the central bank
381
150
200
250
300
350
400
450
Jun-0
9
Dec
-09
Jun-1
0
Dec
-10
Jun-1
1
Dec
-11
Jun-1
2
Dec
-12
Jun-1
3
Dec
-13
Jun-1
4
Dec
-14
Jun-1
5
Dec
-15
Jun-1
6
Dec
-16
Jun-1
7
Dec
-17
Jun-1
8
Dec
-18
Chart 8 Non-resident holdings as percetage to total Government
Debt
42
with the help of key offshore centre Singapore moved the foreign exchange rate fixing that is used
to settle the NDF contracts to the onshore market Earlier Association of Banks in Singapore
(ABS) and the Singapore Foreign Exchange Markets Committee (SFEMC) was publishing IDR
reference rate computed as weighted average of 1-month NDF trades done by then Singapore
based brokers Post March 27 2014 BI started publishing reference rate termed as Jakarta Inter-
bank Spot Dollar Rate (JISDOR) which was to be used to settle existing and new contracts Jakarta
Interbank Offered Rate (JIBOR) is more transparent in a way that it is based on actual transactions
being done in the inter-bank onshore market
In late 2018 BI in its efforts to further deepen the domestic foreign exchange market and to
mitigate IDR exchange rate risk BI established the Domestic Non-Deliverable market (DNDF)
for IDR It will serve as a parallel market to NDF with the key difference that it is rupiah settled
in onshore market This alternative tool will provide foreign investors additional avenues to hedge
their IDR exposure without principal exchange other than enhancing the central bankrsquos
intervention capabilities At this juncture the market is relatively new and hence significant impact
assessment of the same cannot be outlined However currently Indonesia has not been able to
move significant turnovers from offshore NDF to Domestic NDF market
Brazil
Brazilian Real is the second most actively traded currency in NDF market after the Korean Won
with an average daily turnover of USD 187 billion as per BIS and USD 154 billion according to
the London survey The growth and development of NDF market is attributed to the existence of
large and well developed foreign exchange futures market
The development of derivatives market in Brazil is attributed to the hedge culture that has been
prevalent due to periods of high and persistent inflation and exchange rate volatility amidst
political shocks During 1980s and early 1990s inflation was soaring above 100 per cent which
peaked over 2700 per cent in 1993 and thus promoted widespread indexation to manage the
inflation risks Subsequently the ldquoReal planrdquo which comprised of fiscal and monetary reform and
introduction of new currency helped to bring down inflation and stabilise the currency Amidst
stable macroeconomic conditions private sector was encouraged to borrow foreign funds at a
43
lower cost and the consequent surge in foreign indebtedness during 1994 to 1998 led the central
bank issue dollar denominated securities as a hedging instrument Following the currency crisis in
1999 the Brazilian Real was floated amongst adoption of new set of economic policies which was
also accompanied by providing unrestricted access to non-residents to financial markets (including
derivatives) in 2000
The distinguishing feature of Brazilian foreign exchange is the non-deliverable nature of
derivatives contracts without any significant limitations even though participation in deliverable
instruments ie spot outright forwards and foreign exchange swaps is constrained Only chartered
banks are authorised by the central bank to hold foreign exchange spot positions All these factors
have facilitated the growth of foreign exchange futures market over spot market which is closed
and highly restricted Against the backdrop of large and sophisticated foreign exchange derivatives
with high depth and liquidity foreign exchange futures prices have key influence on spot price as
suggested by various studies (Ventura and Gracia 2009 Kaltenbrunner 2010 and Chamon and
Gracia 2013) As pointed out by Kaltenbrunner 2010 the existence of a deep futures market has
made it possible for foreign banks with branches in Brazil to sell real offshore (NDF) and
simultaneously hedge their real exposure in the onshore futures market For the Brazilian Real
derivatives especially offshore NDFs are the main vehicle for investors looking to implement
carry trades (Santaelaa 2015)
Taiwan
The NDF market for Taiwanese Dollar (NTD) existed since 1990s and the central bank permitted
domestic and foreign legal entities to trade in NTD NDF market with authorised banks in 1995
This came after opening up of local securities market to foreign institutional investors (QFII) in
1990 which allowed FIIs meeting certain requirements to apply for investment in Taiwanrsquos stock
market Subsequently significant relaxations were made and security market was completely
opened up with the abolition of QFII scheme While onshore institutions were eligible for trading
in NTD NDF the central bank initially imposed limits on trading position in NTD NDF to one
third of their total foreign exchange position with a view to prevent speculative pressure
44
Following the Asian financial crisis in July 1997 the central bank introduced measures to regulate
NDF market with only authorized banks permitted to carry NDF trading with other authorised
counterparts and their overseas branches or headquarters This move came after the speculative
positioning which was believed to cause sharp depreciation of the NTD The central bank outlined
that although there was ceiling on NTD NDF trading positions some banks were engaged in selling
NDFs to foreign entities and simultaneously created long NDFs positions and shorted DFs with
domestic entities in a bid to offset the NDF trading positions on their balance sheets and thus
creating more room for further NDF trading (Bank of Taiwan Annual Report 2014) The central
bank has intervened in foreign exchange market to curb speculative activity also post 2008
financial crisis when emerging markets witnessed resurgence of capital flows The measures
introduced then by the central bank focused on reducing local banksrsquo foreign exchange positions
in both onshore and NDF markets including discouraging non-resident deposits by imposing
punitive reserve requirements with an intent to limit local banksrsquo capacity to provide liquidity to
NDF markets The National Supervisory Commission also took steps to limit non-resident
investments in local bank deposits and government securities
However recognising the dominance of foreign banks in NDF trading activity the central bank
announced that overseas branches of domestic banks are eligible to apply for NTD NDF business
from September 2014 In current scenario whilst there are no restrictions on the fixed income
investments in general but investments in localdomestic bonds by non-residents cannot exceed
30 per cent of their investments in equity instruments which has kept the investments in local
bonds low by non-residents who tend to take exposure in USD bonds issued by Taiwan offshore
Moreover ability for local banksrsquo to access the TWD NDF market up-to 20 per cent of each banksrsquo
net open position results in partial integration between onshore and offshore markets Since TWD
is not fully convertible any onshore spot transactions must be declared to the central bank and in
most cases require supporting documentation which keeps the differential between onshore and
offshore rate
To conclude cross county experience shows that increasing role of any economy globally is
accompanied by emergence of growing offshore trading of their currencies in the presence of
restricted access or cumbersome regulations Additionally emerging market economies cannot
afford to have unrestricted access to their onshore market as revealed by the studies of Indonesia
45
and Malaysia during the Asian crisis 1997 which exposed them to global impulses Most of these
countries have followed a gradual approach surrounding non-resident access to their forex markets
As emerging markets open up and become sophisticated in respect of forex markets the case study
of the Republic of Korea exemplify that country-specific factors have to be considered when
designing the financial regulatory toolkit aimed at curbing foreign and domestic agentsrsquo
speculative strategies in the search for yield The experience of Brazil suggests deepening onshore
hedging market will go a long way in promoting the price setting role of onshore market over its
offshore counterparts Indonesia has recently introduced domestic NDFs in line with Brazil
Additionally the experience of Korea and Taiwan suggests that the participation of domestic banks
ensures that any price differential between the two segments is arbitraged However in both the
cases participation is governed to evade any potential build-up of vulnerabilities on banksrsquo balance
sheet
46
Chapter 34
Linkages between Offshore NDF and Onshore Rupee Markets New Evidence
Overarching Motivation
Indiarsquos trade integration with the rest of the world began to rise sharply from the turn of the
millennium Between 2000 and 2012 total trade (imports + exports) as a percentage of GDP more
than doubled from 26 to 56 before moderating to 43 in 2018 as the effects of de-
globalization took over post the global financial crisis Simultaneously policymakers persevered
with gradual but consistent capital account liberalization Unsurprisingly therefore currency
markets ndash both to trade and hedge ndash rose in tandem with the growing external integration The
onshore Rupee market5 monthly average turnover has grown from USD 60 billion in 2000 to USD
687 billion in 2018 However given data limitations uncertainty still exists on the exact size of
the NDF market and how it has grown relative to the onshore market As Chapter- 2 illustrates
the BIS Triennial Survey finds average daily turnover of Rupee NDF in 2016 was USD 16 billion
However the Bank of Englandrsquos Semi-Annual Forex Turnover Survey finds average daily
turnover of Rupee NDF in London increased from USD 8 billion in October 2016 to USD 23
billion in October 2018
The idea behind trying to size the NDF market ndash and therefore implicitly compare its size and
growth to onshore markets ndash is in part to try and make sense of how important a role NDF markets
play in the ldquoprice discoveryrdquo of the Rupee6 With the Indian Rupeersquos ldquoForwardrdquo price being
determined across segmented markets ndash both the onshore deliverable forward market and the
offshore non-deliverable market -- the key is to ascertain the relative importance of each of these
markets in driving price discovery
4 This chapter is a joint work of Shri Sajjid Chinoy Chief Economist J P Morgan India and Shri Harendra Behera
Assistant Adviser Department of Economic and Policy Research Reserve Bank of India 5 Spot OTC amp ETCD
6 To be sure estimating the size of the NDF market is important not just for the influence it exerts on price discovery
but also instructive in understanding the cumulative ldquoviewrdquo on the Rupee and how much is expressed onshore versus
offshore This is because if NDF volumes are substantial policymakers may desire to shift these volumes on shore
both to (i) deepen the onshore market and (ii) move this businesseconomic activity on shore
47
However simply using (offshore versus onshore) volumes as a means to proxy relative price
discovery is imperfect at best The ability of NDF volumes to drive price discovery for any given
quantum of volumes is ultimately a function of how inter-connected onshore and offshore markets
are and the ability of economic agents ndash hedgers arbitrageurs speculators -- to link these markets
For example if NDF markets have grown sharply but it is found that price linkages between the
two markets are still tenuous or have not increased commensurately with volumes -- say because
arbitrage opportunities between the two markets have not grown in tandem -- then the growth of
NDF markets and the consequent ldquoloss of controlrdquo will be of less concern to Indian policymakers
Conversely if price linkages have grown over time ndash proportionately to volume increases ndash then
policymakers would rightly worry about the growing role of NDF markets in driving price
discovery
The fundamental motivation for this chapter is therefore to empirically examine price linkages
between the NDF and onshore markets as this is the ultimate manifestation of the influence that
NDF markets exert
The Question
This chapter seeks to ask two fundamental questions Is there a stable long-term equilibrium
relationship between onshore and offshore markets Second if so what is the directionality of
influence Do NDF markets drive onshore markets Or do onshore markets drive the NDF market
Or is the influence bi-directional
Furthermore we try and empirically answer this questions across two dimension First what is the
direction and quantum of influence during ldquonormal times versus ldquostressed timesrdquo Second what
is the relationship and how does it change when assessing ldquoaverage returnsrdquo (means) versus
ldquovolatilityrdquo (variance)
Specific Motivation to India
While there is a meaningful and growing literature trying to empirically ascertain price linkages
between the onshore and offshore markets around the world the literature that focuses on India
remains sparse dated and inconclusive This constitutes the specific motivation for this chapter
48
The literature studying NDF markets around the world has steadily grown over time For example
much work has been done on Asian NDF markets and their relationship with onshore markets
both for the region as a whole (Ma et al 2004 Colvecchio et al 2006 Wang et al 2007 Gu and
McNelis 2009) and individual currencies such as the Korean Won (Park 2001) the Indonesian
Rupiah (Cadarajat and Lubis 2012) the Chinese Yuan (Fung et al 2004 Hideki 2006
Colavecchio and Funke 2008 Huszaacuter et al 2016 Song and Gao 2016 McCauley and Shu 2018)
and the Indian Rupee (Misra and Behera 2006 Guru 2009 Behera 2011 Darbha 2012 Goyal
et al 2013)
Results remain mixed Some studies find the NDF markets influence the evidence onshore forward
market (Park 2001 Wang et al 2007 Cadarajat and Lubis 2012) others find they influence
onshore spot markets (Behera 2011 Goyal et al 2013) while some document its influence on
onshore futures markets (Behera 2011) Conversely some studies also find the direction of
influence runs from onshore markets to NDF markets (Wang et al 2007 Misra and Behera 2006)
In the case of India there are only a few studies on this subject ndash with the last one back in 2013 ndash
and the results are mixed and inconclusive For example Misra and Behera (2006) find that itrsquos
the onshore markets that influenced the NDF market between 2004 to 2007 largely because of
restricted participation of domestic players in the offshore market In a subsequent study Behera
(2011) found that there are volatility spillovers from the NDF market to spot and forward markets
in India and the magnitude of volatility spillover has become higher after the introduction of
currency futures in 2008 Guru (2009) finds qualitatively the same results and the role of currency
futures in India Darbha (2012) find that offshore markets play an important role in price discovery
Finally in the most recent work on India (Goyal et al 2013) find evidence of a long-term
relationship between NDF and onshore markets and find evidence that the relationship is
bidirectional as both markets adjust to any deviations from the equilibrium state
Whatrsquos clear however is the evidence on India is patchy inconclusive and dated with the last
study conducted more than 6 years ago
Some Theory
Recall if there are no capital controls forward rates are tied down by the no-arbitrage ldquocovered
interest parityrdquo hypothesis
49
F = S(1+r)(1+r$ )
Where F is the Forward rate S is the spot rate r is the relevant interest rate on the home currency
and r$ is the equivalent dollar rate The equation holds when (i) there is capital account
convertibility and there are no barrier for cross-border transactions and (ii) there is equivalent
credit risk in the assets across the two jurisdictions
However if there are capital-account barriers we would expect F to only be approximated by the
equation above and not hold exactly
So F ~ S(1+r)(1+r$ )
Similarly the NDF rate should be anchored by the onshore forward rate to the extent that
arbitragers can link these markets
So NDF ~ F ~ S(1+r)(1+r$ )
Furthermore the sign of the onshore-offshore yield spread can indicate the underlying market
pressure on the currency If the domestic interest rate is higher than the NDF implied yield it
implies appreciation pressures on the currency However capital controls may restrict inflows to
close the gap Similarly a lower domestic interest rate than implied by the NDF yield would
suggest depreciation pressures while a zero spread would likely reflect an absence of market
pressure on both the domestic and offshore market
All told however we would expect that both onshore and offshore markets would have a long-
run relationship and there is the likelihood of ldquomeanrdquo spillovers on a regular basis Furthermore
hedging arbitrage and speculative activities may also result in volatility spillovers from one
market to another on various occasions
Testing for ldquoMeanrdquo Spillovers
We start therefore by empirically testing for linkages between onshore (spot and forward prices)
and offshore (NDF forward prices) markets The goal is to assess
1 If there is a stable long-term relationship between onshore and offshore markets
2 Which drives which Do onshore prices drove offshore prices Or vice versa
50
3 To see whether the direction of influence is a function of context Are the results
different for ldquonormalrdquo times versus ldquostressed periodsrdquo (ie taper tantrum emerging
market stress)
Non-stationary but co-integrated
So as to decide the empirical course of action we start by testing whether the key variables of
interest (i) the Onshore Spot Exchange Rate (SPOT) (ii) the Onshore Forward Rate (FORWARD)
and (iii) the Offshore Non-Deliverables Forward exchange rate (NDF) are stationary
Augmented Dickey Fuller Tests reveal that all three variables are non-stationary in levels
However as Figures 1 and 2 suggest the spreads between SPOT and NDF and ONSHORE
FORWARDS and NDF are mean-reverting suggesting the presence of a long-term relationship
and suggesting stationarity in the first differences
Formal co-integration tests ndashTables 2 and 3 ndash confirm that both pairs of variables NDF-SPOT and
NDF-FORWARD ndash are indeed co-integrated The Max Eigenvalue tests reveal there is at least one
co-integrating vector that can be found at the 5 level
Null Hypothesis Variables have a unit root
ADF t-Stat Prob
Spot -06 09
Augmented Dickey-Fuller test statistic-07 08
Augmented Dickey-Fuller test statistic-07 08
Table 1 ADF unit root test
-15
-05
05
15
25
09 10 11 12 13 14 15 16 17 18 19
level
Figure 1 Spreads (1M NDF- Spot)
51
-25
-15
-05
05
15
25
09 10 11 12 13 14 15 16 17 18 19
level
Figure 2 Spreads (1M NDF- 1M Forward)
Table 2 Co-integration SPOT and NDF
Sample (adjusted) January 2005 to March 2019
Included observations 2608 after adjustments
Trend assumption No deterministic trend (restricted constant)
Series LOG(SPT) LOG(NDF)
Unrestricted Cointegration Rank Test (Trace)
Hypothesized Trace
No of CE(s) Eigenvalue Statistic Critical ValueProb
None 011 31310 2026 000
At most 1 000 210 916 076
Unrestricted Cointegration Rank Test (Maximum Eigenvalue)
Hypothesized Max-Eigen005
No of CE(s) Eigenvalue Statistic Critical ValueProb
None 011 31100 1589 000
At most 1 000 210 916 076
Both Trace and Max-eigenvalue tests indicates 1 cointegrating
eqn(s) at the 005 level
52
Stable Long Term Relationship
The finding of co-integration allows us to use ordinary least squares (OLS) to estimate the long-
term relationship between SPOT and the NDF as well as FORWARD and the NDF In particular
using the equation below we estimate parameters β0 and β1 which tells us about the long-term
relationship between SPOT and NDF
We then repeat the same exercise between the FORWARD and the NDF
But whatrsquos driving what An ldquoError Correction Mechanismrdquo approach
While establishing a long-term relationship is important a finding in the affirmative will not come
as a particular surprise Instead the real question is whether onshore prices drive offshore prices
or vice versa The natural framework to answer this is the work-horse Error Correction Mechanism
(ECM) approach used by Engel and Granger in 1987 where changes in each of the variables are
run on changes on its own lags and the lags of the other variables
Table 3 Co-integration FORWARD and NDF
Sample (adjusted) January 2005 to March 2019
Included observations 2608 after adjustments
Trend assumption No deterministic trend (restricted constant)
Series LOG(FORWARD) LOG(NDF)
Unrestricted Cointegration Rank Test (Trace)
Hypothesized Trace
No of CE(s) Eigenvalue Statistic Critical ValueProb
None 018 53051 2026 000
At most 1 000 217 916 074
Unrestricted Cointegration Rank Test (Maximum Eigenvalue)
Hypothesized Max-Eigen 005
No of CE(s) Eigenvalue Statistic Critical Value Prob
None 018 52835 1589 000
At most 1 000 217 916 074
Both Trace and Max-eigenvalue tests indicates 1 cointegrating
eqn(s) at the 005 level
53
119889119897119900119892(119904119901119900119905)119905 = 1205720 + 120572119904119901119900119905(119890119905minus1) + sum 12057211(119894)(119889log (119904119901119900119905119905minus1))119899119894=1 + sum 12057212(119894)(119889log (119873119863119865119905minus1)) + 120576119904119905
119899119894=1 (1)
119889119897119900119892(119873119863119865)119905 = 1205720 + 120572119899119889119891(119890119905minus1) + sum 12057221(119894)(119889119897119900119892(119904119901119900119905119905minus1))119899119894=1 + sum 12057222(119894)(119889119897119900119892(119873119863119865119905minus1)) + 120576119899119905
119899119894=1 (2)
For example as Equation 1 lays out changes in (the log of) SPOT ndash the dependent variable -- are
run on its own lags and the lags of NDF Equation 2 ndash in which the dependent variable is NDF --
does the same for NDF Because both variables are co-integrated ndash as shown above ndash using OLS
to estimate these coefficients using standard criterion to choose lag lengths (eg Akaike
Information Criterion) and standard F-Tests are all valid
The coefficients of interest in the above equation are 120572119904119901119900119905 and 120572119899119889119891 ndash the ECM terms -- because
these coefficients tell us when the system is in disequilibrium the direction and the speed of
adjustment back to equilibrium This will determine the directionality of influence
For example if 120572119904119901119900119905 = 0 and if all values of 12057212(119894) = 0 then dlog(NDF) does not granger cause
dlog(spot) In contrast if the value of 120572119904119901119900119905 is negative and statistically significant that implies
that (the log of) NDF in the long run ldquoganger-causesrdquo spot market movements The same intuition
applies for equation 2 where NDF is the dependent variable and we test for convergence between
the NDF rate and the onshore forward rate Direct convergence requires 120572119904119901119900119905and 120572119899119889119891 to be
oppositely sign Intuitively the larger the value of α the faster is the speed of adjustment
In summary while the βrsquos tell us about the existence and strength of a long run relationship
between onshore and offshore markets the αrsquos tell us about whether (i) the directionality of
influence and (ii) the speed of convergence from disequilibrium
We therefore use this approach to test for linkages between both sets of variables ndash NDF and
onshore SPOT ndash and NDF and onshore FORWARDS
Data
We use end-of- India-day closing values for the onshore spot exchange rate for the 1-month a
forwards and the corresponding 1-month non-deliverable-forward (NDF) rates We use daily data
and our full sample runs from 2009 through 2019
54
Results Full Sample
Table 4 ECM and Long run coefficients (Full sample)
The first row are the linkages between the onshore spot and NDF markets while the second row
is that of the onshore forwards and NDF market
In both cases the betas (β) are positive statistically significant and with a magnitude very close to
or at 1 implying an almost one-for-one movement between both the markets in the long run For
example the estimated β1 of 099 suggests that for a 1 increase in NDF rates there is 099
increase in spot rates in the long run Meanwhile between onshore FORWARDS and NDF there
is a complete pass-through in long run More generally a beta (β) close to 1 suggests there is no
permanent friction between onshore and offshore markets in the long run
Convergence
However the real interest is in the alphas In the first case both 120572119904119901119900119905 and 120572119899119889119891 are statistically
significant and oppositely signed This suggests that they both converge towards each other Put
differently the NDF rate moves towards the onshore SPOT rate and vice-versa In other words
there is a bi-directional relationship between both variables The magnitude of the coefficients
(007-018) suggests a moderate speed of convergence to the long-run equilibrium when a shock
causes the system to go into disequilibrium
The same results are obtained when studying linkages between the onshore forward and NDF
markets Both 120572119891119900119903119908119886119903119889 and 120572119899119889119891 are statistically significant oppositely signed (suggesting they
converge towards each other) with coefficients that are slightly larger than the SPOT-NDF pair
This suggests that both NDF and the onshore FORWARD rates influence each other and gradually
converge towards their long-term relationship when hit by a shock ndash a speed of adjustment that is
modestly faster than the NDF-SPOT relationship
Time Period April 2009 to March 2019
Onshore Spot and NDF -018 007 099
Onshore Forwards and NDF -032 023 100
55
For the full sample as a whole from 2009 to 2019 we find that there is a bi-directional relationship
on average between SPOT and NDF and FORWARD and NDF and that all variables converge
gradually to their long-term relationship
Results Stressed Times
Our results should be thought of as ldquoaveragerdquo results across the entire time period But are these
results a function of context Does the direction of influence change for example during periods
of currency stress versus periods of calm We explore this next
To test for this we start by isolating clearly-identifiable periods of stress ex post facto in our
simple Two episodes naturally come to mind the taper tantrum of 2013 (where the Rupee
depreciated 26 between May 2013 and August 2013) and the emerging market (EM) turmoil ndash
characterized both by the Fed raising rates and oil prices firming ndash such that the Rupee depreciated
almost 10 between August 2018 and October 2018
2013 The Taper Tantrum
We test interlinkages from the start of May to the end August 2013 ndash during the Taper Tantrum ndash
when the Rupee was under intense pressure and easily amongst the worst performing currencies
in the emerging market (EM) universe Results are presented in Table 5 below
Table 5 ECM and Long run coefficients
As one can observe 120572119899119889119891 in both equations is statistically insignificant What this implies is onshore
spot and forward rates were playing very little role in influencing NDF rates7 In contrast 120572119904119901119900119905 and
120572119891119900119903119908119886119903119889 are correctly signed and statistically significant (the former at the 1 level and the latter
at the 10 level) which suggests it was the NDF rate that was driving the onshore spot and forward
rates Interestingly the speed of adjustment is much faster for onshore spot rates in this sample (-
11) compared to the full sample (-018) and also relative to the onshore forward market (-08) An
7 In fact onshore spot and forward rates do not granger cause NDF as none of the lags of 12057221(119894) in equation 2 are
statistically significant during this period
Onshore Spot and NDF -11 -028 094
Onshore Forwards and NDF -08 015 097
Time Period May 2013 to August 2013
56
ECM (alpha) coefficient of greater than 1 suggests the witnesses an oscillating convergence Since
a coefficient greater than 1 is prime facie surprising we also conduct a robustness exercise
(described below) by running Granger Causality tests for this time period and find it is the NDF
that Granger-causes onshore rates and not the other way around
This finding likely reflects the growing volumes ndash potentially speculative ndash in the NDF market in
the 2013 period of stress relative to the volumes in the onshore market This also prime facie
reduced the efficacy of foreign currency intervention by the central bank because intervention was
used to shape the spot exchange rate at the end of Indiarsquos business day But because the NDF is a
24 hour market NDF rates evolved overnight and when the Indian market opened the next day
onshore rates were influenced by NDF developments overnight This rendered ineffective the
previous dayrsquos intervention because there was often little correlation between the closing exchange
rate of the previous day and the opening rate of the next day and therefore necessitated additional
intervention the next day
Visually this is evident in the ldquogap-uprdquo movements of the exchange rate when the Indian market
opened ndash vis-a-vis the previous dayrsquos close ndash during those three months Figure 3 for example
captures this for the month of August 2013
Figure 3 Gap-up opening in USDINR (August 2013)
Source Bloomberg
57
2018 More of the Same
Emerging markets came under renewed stress in the summer of 2018 against the back drop of the
Fedrsquos hiking cycle accompanied by the rally in crude pieces which had surged 50 over the course
of a year As some large emerging markets ndash Argentina Turkey ndash came under some stress there
was a contagion to all emerging markets with current account deficits of which India was one
Between May and October 2018 the Rupee depreciated almost 10 against the US Dollar
What were the offshore-onshore linkages during that period of time Results are presented in Table
6
Table 6 ECM and Long run coefficients
The linkages mimic 2013 The coefficient on whether onshore drives offshore 120572119899119889119891 is insignificant
in both regressions This re-affirms that in line with 2013 onshore spot and forwards were not
driving the NDF rate8 In contrast 120572119904119901119900119905 and 120572119891119900119903119908119886119903119889 are both correctly signed quantitatively
meaningful and statistically significant This suggests that it was the NDF rate that drove the
onshore spot and forward during this period likely reinforcing the presumption that volumes rise
sharply in NDF markets during periods of stress which then become the hub of price discovery
and influences onshore rates As Figure 4 reveals this is visible in the ldquogap-uprdquo movement of the
Rupee at the start of the day for several days in the month of August 2018
8 Onshore spot and forward rates does not granger cause NDF as none of the lags of 12057221(119894) in equation 2 are
statistically significant
Time Period August 2018 to Nov ember 2018
Onshore Spot and NDF -10 -05 096
Onshore Forw ards and NDF -115 -05 096
58
Figure 4 Gap-up opening in USDINR (August 2018)
Source Bloomberg
Our analysis also reveals that the speed of adjustment is very rapid relative to the baseline
Robustness test
The results are robust to the selection of time and tenure of the NDF For example instead of
India end-of-day (EOD) time as the NDF cut-off if we consider New York EOD as the NDF cut-
off there are no qualitative changes in the results Similarly instead of considering the 1-month-
NDF if we consider the 3-month-NDF the results essentially stay the same Furthermore given
the short time periods involved during stressed times (May to August 2013 and August to
November 2018) one can argue that co-integration equations may not be relevant We therefore
also carry out Granger causality tests for these time-periods and find the direction of causality to
be just above ie NDF rates are driving onshore rates during stress periods and not vice versa
Controlling both ldquoMeanrdquo and ldquoVolatilityrdquo spillovers
Thus far our focus has been on mean spillovers However as found by Misra and Behera (2006)
there are also potential ldquovolatilityrdquo spillovers from the NDF market to the spot and forward market
To model the coexistence of both mean and volatility spillovers we use a multivariate generalised
autoregressive conditional heteroskedasticity (MGARCH) model The degree of volatility
59
spillovers is measured by estimating dynamic conditional correlations between the markets The
empirical analysis is conducted using daily data from April 1 2009 through March 29 2019 and
using the currency pairs for (i) NDF-Spot (ii) NDF-Forwards and (iii) NDF-Futures
This model examines simultaneous interactions of conditional returns and volatilities across the
markets In this modelling framework we examine the Granger-causality in mean and variance as
discussed in Behera (2018) The results corroborate the earlier results that there is bi-directional
mean spillovers between onshore and offshore markets (Table 7)
An important finding using this approach is that the impact of price spillover from offshore to
onshore remains up to substantial lags while that from onshore to offshore dissipate after one day
(Annexure II) This ensues from the result that the individual coefficient estimates in the mean
equations of BEKK-MGARCH model are found to be statistically significant up to 5 lags in the
regression of returns in onshore market on that of offshore market while in the opposite case the
coefficient of onshore return is statistically significant only for the first lag
Table 7 Granger-causality tests in Mean
Direction of Causality Results
Spot to NDF 1-Month Yes
Spot to NDF 3-Month Yes
Spot to NDF 6-Month Yes
NDF 1-Month to Spot Yes
NDF 3-Month to Spot Yes
NDF 6-Month to Spot Yes
Forward 1-Month to NDF 1-Month Yes
Forward 3-Month to NDF 3-Month Yes
Forward 6-Month to NDF 6-Month Yes
NDF 1-Month to Forward 1-Month Yes
NDF 3-Month to Forward 3-Month Yes
NDF 6-Month to Forward 6-Month Yes
Futures 1-Month to NDF 1-Month Yes
Futures 3-Month to NDF 3-Month Yes
Futures 6-Month to NDF 6-Month Yes
NDF 1-Month to Futures 1-Month Yes
NDF 3-Month to Futures 3-Month Yes
NDF 6-Month to Futures 6-Month Yes
Note Null hypothesis is rejected if the p-value in the Wald test is less than 5 per cent
60
Volatility spillover between markets are studied by examining the statistical significance of
individual coefficients Granger causality in variance tests and estimating the dynamic conditional
correlations Beginning with granger causality test results imply a bidirectional causal relationship
between volatilities in both onshore and offshore markets of 1-month maturity segments only
(Table 8) In normal times no volatility spillovers are observed across the markets in other
maturity segments which reverses in the period of increased uncertainty (as found from Granger-
causality-in-variance tests taking into account asymmetric effects) The results from individual
coefficient estimates indicate about the presence of short-term volatility spillover between the
markets while the long-term volatility transmission is statistically significant from NDF market
to onshore spot forward and futures markets Moreover the asymmetric coefficients in variance
equation provide interesting insights ndash with the evidence of rise in volatility spillover from onshore
to offshore market in case of rupee appreciation while the opposite happens ie the volatility
spillover increases from NDF market to onshore market in the episodes of rupee depreciation
(Annexure II)
Table 8 Granger-causality tests in Variance
Direction of Causality Results
Without Asymmetry Effect With Asymmetry Effect
Spot to NDF 1-Month No Yes
Spot to NDF 3-Month No Yes
Spot to NDF 6-Month No Yes
NDF 1-Month to Spot No Yes
NDF 3-Month to Spot No Yes
NDF 6-Month to Spot No Yes
Forward 1-Month to NDF 1-Month Yes Yes
Forward 3-Month to NDF 3-Month No Yes
Forward 6-Month to NDF 6-Month No Yes
NDF 1-Month to Forward 1-Month Yes Yes
NDF 3-Month to Forward 3-Month No Yes
NDF 6-Month to Forward 6-Month No Yes
Futures 1-Month to NDF 1-Month Yes Yes
Futures 3-Month to NDF 3-Month No Yes
Futures 6-Month to NDF 6-Month No Yes
NDF 1-Month to Futures 1-Month Yes Yes
61
NDF 3-Month to Futures 3-Month No Yes
NDF 6-Month to Futures 6-Month No Yes
Note Null hypothesis is rejected if the p-value in the Wald test is less than 5 per cent
In order to understand how the volatility spillover between the markets changed over time a
variant of MGARCH model viz dynamic conditional correlation (DCC) model as proposed by
Engle (2002) is estimated taking the same pair of onshore-offshore exchange rate returns The
conditional volatility of 1-month NDF 1-month futures and their dynamic correlations are plotted
in Chart 249 The chart shows a sudden and significant rise in volatility during the episodes of
European debt crisis taper tantrum and latter part of 2018 coinciding with the rise in offshore-
onshore spreads resulting from the concerns regarding high current account deficits and large
capital outflows It is important to note that the volatility in NDF market is higher compared to
futures market and the divergence between the two gets accentuated in the times of heightened
uncertainty This in turn in conjunction with the rise in information asymmetry results in a drop
in correlations Since volatility spillover increases from offshore to onshore markets as discussed
earlier during periods of heightened uncertainty the volatility in onshore market increases
following the heightened volatility in offshore market In subsequent periods the correlation
increases indicating about the rise in spillovers A closer examination of the data on the volatilities
in two markets shows that volatility increases in offshore market first before it increase in onshore
markets with a lag of 1 to 2 days The correlations being positive and substantially higher imply a
significant degree of spillovers between the markets
9 The conditional volatilities for other pairs are qualitatively almost similar though their dynamic correlations are
different the dynamic correlations are provided in Chart 25
62
The dynamic correlations of volatilities for different pairs are presented in Chart 25 reveal that
that all the correlations were highly integrated and moving together alike until end December 2014
However the apparent structural changes in correlation process were observed since then with the
trends of correlations of NDF with spot and forward moving in one direction and that of NDF and
Futures moving on the opposite direction until mid-2017 The correlations have started coupling
though still continuing with some gaps between them since July 2017
060
065
070
075
080
085
090
095
00
05
10
15
20
25
30
2009 2010 2011 2012 2013 2014 2015 2016 2017 2018
Chart 24 Time-varying Volatility and Correlations Futures and
NDF
1-month Futures 1-month NDF DCC (right scale)
63
Conclusions and Implications
Since the work on establishing onshore-offshore price linkages in India was relatively sparse
outdated and inconclusive the goal of this Chapter was to create an updated empirical fact base
given the rapidity with which capital markets have developed and integrated and the pace at which
the NDF market has grown The overall results present a bidirectional relationship between
onshore and offshore markets
First that for full sample the price linkages ndash both mean and volatility ndash are found to be
bidirectional Both onshore and offshore rates have a strong long-term relationship and that when
a shocks throws that relationship into disequilibrium both onshore (spot and forward) and offshore
rates converge towards each other This suggests both influence each other This is consistent with
earlier findings in literature and should not be surprising Relative volumes across these market
are very dynamic and vary significantly When the bulk of the volumes flow through the onshore
050
055
060
065
070
075
080
085
090
095
100
2009 2010 2011 2012 2013 2014 2015 2016 2017 2018
Chart 25 Dynamic Conditional Correlations of Volatilities
SPOT_NDF1 SPOT_NDF3 SPOT_NDF6 FW1_NDF1 FW3_NDF3
FW6_NDF6 FUT1_NDF1 FUT3_NDF3 FUT6_NDF6
Forwards
Futures
Spot
64
market it becomes the locus of price discovery The converse is true when the bulk of volumes
are routed through the NDF market which then becomes the principle pole of price discovery
During the last two stress episodes (the taper tantrum and the 2018 EM crisis) however the
relationship turned unidirectional with the NDF market driving onshore spot and forwards and
the speed of adjustment from any disequilibrium increasing very sharply compared to ldquonormalrdquo
times Furthermore volatility spillovers also increased from offshore markets to onshore during
the periods of heightened uncertainty There is however an interesting asymmetry There is
evidence of rise in volatility spillover from onshore to offshore market in case of rupee
appreciation while the opposite happens ie the volatility spillover increases from NDF market to
onshore market in the episodes of rupee depreciation
All told as NDF volumes have increased they have begun to play an important role in both price
discovery and driving volatility particularly during heightened uncertainty periods
65
Chapter 4
International Financial Service Centre (IFSC)10 ndash Use of Rupee derivatives
The Task Force (TF) is vested to examine the role if any IFSC can play in addressing the concerns
arising out of offshore Rupee markets Presently Rupee is not permitted to be traded in the IFSC
This chapter discusses the aspects relevant to availability of non-deliverable Rupee derivatives in
the IFSC and permitting banks (IFSC Business Units or IBUs) to deal in such derivatives Before
discussing the potential benefits and concerns from the aforesaid proposition it is important to
address this issue ndash Are markets in IFSC onshore or offshore In the context of the Rupee market
a critical test for deciding the residency of the market would be applicability of capital controls in
respect of taking and exiting positions under FEMA 1999 Inter alia this is the critical aspect in
difference between the price discovered in onshore and offshore market As the IFSC functions
outside the capital controls under FEMA 1999 type of participants and the price discovered in
Rupee markets here will align with the existing offshore markets and therefore it cannot be treated
as onshore market To sum up while legally IFSC is very much an entity on the shores of India
from the point of view of Rupee markets it has to be treated as an offshore entity
Potential benefits of permitting non-deliverable Rupee derivatives in the IFSC
i Bringing NDF market volume to the IFSC Over the last decade or so a significant
market share in financial services related to India has moved to other international financial
centres like Singapore Hong Kong and London Bringing this business to India is clearly
beneficial in terms of economic activity and employment gains for India Further the size
and growth of the offshore Rupee derivative market poses a significant challenge to the
efficiency of price discovery as well as the effectiveness of exchange rate management
policy The possibility that the exchange rate of the Rupee not a fully convertible currency
being materially determined by transactions largely outside the legal and regulatory
influence of India is a matter of concern Given the favourable tax regime tax and by virtue
10
International Financial Services Centre or lsquoIFSCrsquo has the same meaning given in Section 2 (q) of the Special
Economic Zones Act 2005 (28 of 2005)
66
of it being outside the capital controls under FEMA 1999 IFSC may bring volumes and
price discovery to India
ii Complete bouquet of financial services in the IFSC Currently exchanges in IFSC are
permitted to offer a well-diversified range of products spanning various asset classes
which include derivatives on Indian indices derivatives on Indian stocks derivatives on
foreign stocks cross currency derivatives commodity futures on Gold Silver and base
metals etc Further while listing and trading of Masala Bonds is permitted in the IFSC
hedging Rupee exchange rate risk on it is not permitted Thus introduction of Rupee
derivatives will complete the entire range of asset classes available for trading in the IFSC
iii Access to market information The offshore Rupee market has been the subject matter of
interest for all stakeholders as these markets have an impact on onshore markets However
in the absence of any authentic data there are varying estimates about the volumes traded
in these markets nature of participation extent of open interest and the extent to which
these markets are used for hedging purposes If by opening up the IFSCs to Rupee trades
there is some migration of offshore Rupee market volumes it will help the cause of better
information flow regarding the market
iv Level playing field for Indian banks Foreign bankrsquos branches outside India can deal in
the offshore market as they are not bound by the RBIrsquos regulations On the other hand
overseas branches of Indian banks cannot deal in Rupee derivatives in the offshore market
By introducing Rupee derivatives in IFSC and permitting IBUs to deal in such derivatives
a more level playing field can be provided to Indian banks to service non-residents
Concerns from non-deliverable Rupee derivatives trading in the IFSC and dealing by IBUs
such derivatives
i Cannibalizing onshore business One major concern arising out of the introduction of
non-deliverable Rupee derivatives in the IFSC is whether it would cannibalize the business
of the onshore market instead of importing volumes from abroad Since the products in
both IFSC and the onshore market would be more or less similar in terms of characteristics
the domestic futures market getting gradually cannibalized by the IFSC on the face of it
appears probable But a deeper analysis of the comparative regulatory framework would
allay such concerns to a large extent The domestic currency futures market is majorly
67
made up of resident participation Non-residents are nearly absent in these markets and
hence their shift to the IFSC is more a theoretical proposition Since the Indian residents
are not permitted to participate in the IFSC they cannot contemplate a move-over It also
important to note that the onshore market settles in INR whereas derivative contracts in
the IFSC would settle in dollars and hence these markets will cater to two distinct classes
of participants
ii Impact on exchange rate management policy and development of the onshore market
Presently Indian banks are not allowed to deal in Rupee derivatives in the offshore market
A detailed discussion on the issue of allowing such dealing is presented in Chapter 5 In
consideration of the risk that participation of Indian banks may improve liquidity in the
offshore market and undermine the development of the onshore market the TF is of the
view of that Indian banks should not be permitted to deal in offshore Rupee market IFSC
being an offshore centre all concerns expressed in Chapter 5 in this regard are valid on
Rupee market in IFSC also However unlike other offshore Rupee market venues IFSC
has the potential of providing certain benefits to India as discussed earlier in this chapter
and therefore a distinction could be made between the two while examining the case of
permitting Rupee derivatives to be traded in the IFSC
iii Spillover of risks from IFSC to onshore market This is a concern since the two
markets being geographically contiguous could create porous leakage channels This
concern can be addressed by stipulating distinct net open position limits for entities
operating in both IFSC and on-shore In other words the open positions of entities
operating in the IFSC should not be permitted to be netted off with the open position on-
shore
What does a volatile Rupee exchange rate in the IFSC imply for the RBI and onshore
market
Chapter 3 establishes the linkages between the offshore and onshore Rupee market IFSC being an
offshore jurisdiction will have the same impact The RBI as the monetary authority has the
authority under RBI Act to maintain the stability of the rupee A volatile onshore foreign exchange
market could act as the trigger point of volatility in other financial markets like money bonds and
68
equities The spill over impact of financial market volatility casts its shadow on asset prices and
in turn it could have an impact on the capital flows and financial stability Given that a separate
regulator is envisaged for the IFSC the issue of RBIrsquos role in the IFSC was extensively deliberated
by the TF There are two possible approaches
i RBI plays a pivotal role in framing the Rupee derivative regulation in the IFSC In
order to allow the RBI to take measures in line with the objectives of exchange rate
management policy the sine qua non for allowing Rupee derivatives in the IFSC is to
ensure that RBI vested with the obligations to maintain financial and monetary stability
should continue to perform its statutory role in determining the regulatory framework for
Rupee market in the IFSC
ii Treat it akin to any other offshore market and maintain a hands-off approach The
objective of introducing Rupee derivatives in the IFSC is to provide an alternative to non-
residents for dealing in non-deliverable Rupee derivatives The expected transition of
investors is likely to be successful only if the IFSC functions with same freedom as other
offshore markets At the same time from an exchange rate management perspective
permitting Rupee trading in IFSC should not make a material difference to local authorities
as long as there is a barrier between the onshore market and IFSC In that case IFSC would
be exactly of the same status as any other offshore market
The TF feels that in line with the objectives of permitting Rupee derivatives in the IFSC the latter
approach - that the regulatory environment in which Rupee trades in IFSC is exactly similar to the
environment that prevails in any other offshore centre - is preferable As IFSCs are treated on par
with a foreign jurisdiction in terms of FEMA the regulation of the trade and capital flow channels
between the two jurisdictions (on-shore and IFSCs) should be so designed as to restrict the
transmission of volatility through these channels (in terms of participants products limits etc)
Recommendation
While there are concerns around impact on the onshore market due to trading in Rupee derivatives
in the IFSC there are potential benefits in terms of IFSCrsquos ability to offer complete bouquet of
financial services and availability of market information to all stakeholders Further given Indiarsquos
69
economic growth it may be appropriate to prepare for greater financial integration with the rest of
the world Sequencing and timing of measures relating to currency markets is a critical component
of such integration Although at the moment there is no definite path ahead in terms of such
integration but a thriving Rupee market in the IFSC may provide a system which can be leveraged
towards this end in the way and manner deemed fit in future IFSC being outside the capital
controls provides an opportunity to policymakers to test new regimes and products in an
environment whose repercussions may not significantly impact the stability or efficiency of the
onshore system On balance the TF is of the view that non-deliverable Rupee derivatives may be
introduced in the IFSC However a phased approach may be adopted and to start with trading
may be permitted only on exchanges due to the inherent transparency and risk management
benefits offered by it Introducing OTC contracts may be considered at a later stage after the
experience gained from trading on exchanges RBI may in its Financial Stability report assess the
impact of the functioning of IFSC on the financial stability of the country
Further the TF is of the view that entities regulated and permitted by the RBI may be permitted
to make market and run positions in Rupee derivatives market in the IFSC In order to prevent
spill over of risks from IFSC to onshore market though these entities a distinct net open position
limit may be stipulated for their operations in the IFSC In other words the open positions of
entities operating in the IFSC should not be permitted to be netted off with their open position
the onshore market
Finally given the mandate of RBI to implement exchange rate policy it may not be in benefit of
things to introduce Rupee derivatives in the IFSC without it being on board and therefore the TF
feels that Rupee derivatives may be permitted in the IFSC subject to agreement of the RBI
70
Chapter 5
Issues and Recommendations
The Task Force (TF) is entrusted to recommend measures to incentivize non-residents to access
the onshore Rupee derivative market and address concerns if any arising out of the offshore
Rupee derivative market As discussed in Chapter 1 the TF had interactions with various
categories of stakeholders to understand their perspective on the matter and identify the issues that
needs to be addressed
Chapter 2 and 3 have clearly brought out the increased importance of offshore Rupee markets
both in terms of their size and in terms of their impact on the exchange rate of the Rupee The price
and volatility spillovers from one market to the other are almost complete they are bi-directional
and when rupee is under pressure they are unidirectional from offshore markets to onshore
markets The speed of convergence of the markets is also quite quick The TFrsquos recommendations
have been made in the light of available information results of statistical analysis and most
importantly on the feedback received from various consultations
While increased participation of non-residents would be expected to enhance liquidity in the
onshore market it may also bring along with it additional volatility and transfer of incremental
risk to the domestic system This is particularly so as historically the rupee is a currency that has
generally depreciated and the demand for forward dollars is usually more than the supply
especially in times of stress Hence it is pertinent to examine the impact of incremental hedging
by non-residents in the onshore market While volatility in the rates have a clear impact on the real
sector events in the domestic derivatives markets in the late 2000s constantly remind us of issues
related to transfer of risk to entities that are not capable of understanding and managing it The big
question then is whether our system today is ready for incremental demand for hedging from non-
residents Available data is inadequate to measure the contribution of hedgers and speculators in
the offshore market turnover Using the best available information it can be estimated that an
additional daily average Rupee derivative turnover of around 08 billion ndash 24 billion could be
generated in the onshore market if all the INR NDF hedging transactions are transferred from the
offshore market (see Box 1) Such an incremental flow is not significant enough to cause any
adverse impact on volatility in the onshore market given that the user-driven deliverable forwards
market in India is quite liquid with daily average turnover of USD 163 billion (as per BIS
71
Quarterly Review December 2016) As regard transfer of risk to the domestic system the concern
is more regarding transfer of risk to the Indian companies and less towards market-makers as they
are in the business of managing risk There is a possibility that the said incremental positions
created in the onshore market may get transferred to Indian companies (in part or full depending
upon the level of these positions retained by the market-makers) However in comparison with
the late 2000s Indian companies today are only allowed to enter into Rupee derivatives depending
on their underlying exposure and no leveraged structures are permitted Also banks are bound by
stringent suitability and appropriateness norms Therefore the chances of Indian companies
acquiring unmanageable risk positions or risks due to mis-selling by market-makers are very low
Further there has been a significant growth in the external sector and consequently the foreign
exchange market has also grown (although one could argue on the incommensurate growth) To
summarize in the last decade or so the ecosystem on the whole has evolved and is less prone to
adverse impact from transfer of risks from non-residents
Box 1
Approximation of share of hedging transactions in INR NDF turnover
The graph presented below is extracted from BIS Quarterly Review December 2016
72
It can be observed from the above graph that non-financial and other financial institutions
contribute around 5 and 35 respectively to the turnover of INR NDFs in the offshore market
If one were to make an informed guess that all transaction by non-financial companies are hedging
transactions and that hedging transactions by other financial companies (eg funds) would
constitute maximum 25 of their transaction then it can be approximated that hedging transactions
constitute around 5 - 15 of the daily average turnover in INR NDF market which was reported
as USD 164 bn
Comparison of turnover in forwards in onshore and offshore market - In the same publication
it is also reported that the average daily turnover in onshore deliverable forwards is USD 163 bn
It may be noted that for fair comparison with the turnover in offshore market (where deliverable
spot and swap market doesnrsquot exist) this turnover includes both deliverable forwards and FX
swaps A comparative analysis of volumes in onshore and offshore market ndash both OTC and
exchange traded Rupee derivatives - is given in Annexure IV
Issues and recommendations
1 Market hours
An important reason for the existence of the offshore Rupee derivative market is simple geography
That domestic markets are closed when major users in certain regions (eg the United States) are
working creates a natural access for offshore markets Also significant international developments
impacting the Rupee exchange rate take place outside the onshore market hours thereby creating
a natural clientele for the offshore markets The feedback received from non-resident investors as
well as corporates highlighted the closure of the local market as an important reason for them
accessing the offshore market Exchanges have for some time been requesting an extension of
market hours citing increasing Rupee transaction volumes in offshore exchanges situated in
Singapore and Dubai A straightforward way of taking care of such requirements is to extend the
onshore market hours (both OTC and exchange traded derivative markets) While extending
market hours might involve simultaneously keeping support services (payment and settlement
systems) or support markets (funding markets) open it is also possible to treat such transactions
as part of the operations of the next day in which case the need for settlement or funding does not
73
arise In this regard the TF supports the recommendations relating to market timings outlined in
the draft Report of the Internal Working Group on Comprehensive Review of Market Timings
published by RBI on July 10 2019
Recommendation 1
The TF recommends that the onshore market hours be suitably extended to match the flexibility
provided by the offshore market and thereby incentivize non-residents to hedge in the onshore
market
2 Competitive pricing
One important feedback from foreign portfolio investors (FPIs) as well as global corporates was
that they are unable to access multiple competitive quotes in the onshore market Effectively they
are limited to using the prices of their custodian banks Generally FPIs deal only with their
custodian banks due to the existing rules whereby the custodian is responsible for tracking of
outstanding hedges vis-agrave-vis portfolio size This ldquofrictionrdquo issue can be addressed by shifting the
monitoring to a centralized agency which can use a technology solution to track exposures as well
as outstanding hedges This is further explained in recommendation no 4 ahead relating to
underlying exposure
Also the process to be setup documentation such as KYC and other trading arrangements with
multiple counterparties in India is a long and difficult exercise resulting in most FPIs either trading
with their custodian bank or using the offshore market to hedge Some of the documentation related
challenges can be minimized if the centralized KYC registration currently in place for SEBI
regulated entities is extended to all the entities ie both custodial banks as well as non-custodial
banks This is elaborated in recommendation no 11 on the KYC process
Another issue highlighted by FPIs in this context was unavailability of multi-dealer electronic
dealing platforms for them One way of making onshore prices more widely accessible to non-
residents is to allow Indian banks to freely offer prices as liquidity providers to non-resident
customers at any time whether or not the domestic market is open They can extend to non-resident
corporates the same choices that domestic corporates have in choosing among various market
makers This can be done either by a domestic sales team or by using staff located at overseas
74
branches In addition making an all-to-all trading platform (like the FX-Retail being introduced
in August 2019) available to non-residents would supplement that effort
Recommendation 2
The TF recommends that banks may be allowed to freely offer prices to non-residents at all times
out of their Indian books either by a domestic sales team or by using staff located at overseas
branches Also wide access to the FX-Retail trading platform to non-residents would be a major
incentive to use the onshore market
3 Effect of offshore Rupee derivative market on onshore price discovery and exchange rate
management policy
The size and growth of the offshore Rupee derivative market especially in the last few years poses
a significant challenge to the efficiency of price discovery as well as the effectiveness of exchange
rate management policy A comparison of onshore and offshore Rupee derivative market is given
in Annexure IV The possibility that the exchange rate of the Rupee not a fully convertible
currency will be materially determined by transactions largely outside the legal and regulatory
influence of India is a matter of concern The most straightforward approach to deal with that
concern would be to completely liberalize the onshore market and bring it at par with the offshore
market in all aspects Such a scenario would imply an effective absence of local regulation and
intervention which is incompatible with the current status of capital account convertibility
Another option is to liberalise the onshore market to the extent possible but this in itself may not
necessarily mean a fall in importance or size of the offshore market In this connection the TF
extensively discussed the proposition of creating a connection between the offshore and onshore
markets by permitting Indian banks to deal in the offshore market The various implications of
such a step are discussed below
i Reduction in volatility In theory a segmented market would be less liquid and therefore
more volatile compared to an integrated market One could also infer that offshore market
activity is maximum during onshore working hours eg almost three-fourths of the
offshore rupee futures are traded when Indian markets are open It is also observed that
75
offshore spreads are larger which indicates a relative scarcity of market-making entities
Linking the two markets may increase both the customer base as well as the liquidity
providers thereby improving liquidity as well as efficiency of the price discovery process
ii Better customer pricing through increased transparency in the offshore market
Today very little information is available regarding the offshore Rupee market other than
that of exchange traded instruments Such opacity is not in the interest of customers as
liquidity provision is limited to entities that have a presence both onshore and offshore
resulting in a premium (in terms of high bid-ask spreads) being charged for market access
Broadening this access to onshore banks would drive away such premium through wider
competition At the same time access to information improves for the local authorities
Since better information leads to better price efficiency it is in the interest of local
authorities to disseminate such information leading to an overall improvement in market
transparency
iii Level playing field for Indian banks Foreign bankrsquos branches outside India can deal in
the offshore market as they are not bound by the RBIrsquos regulations On the other hand
overseas branches of Indian banks cannot deal in Rupee derivatives in the offshore market
Allowing them access to the offshore Rupee derivative market would create a level playing
field for Indian banks
iv Impact on development of the onshore market Liquidity in onshore market is better
than the offshore market due to participation of real sector and market making by Indian
banks which obviously are the major Rupee liquidity providers Consequently non-
residents have the ability to exit positions with less impact cost in unfavourable times This
is a strong incentive for them to hedge in the onshore market (given dynamic hedging and
other operational issues are now being ironed out) Also higher liquidity in the onshore
market results in tighter bid-ask spread compared to the offshore market which allows non-
residents to get better pricing in the onshore market The aim of policy measures is to
develop the onshore market Accordingly policymakers strive to protect the advantages of
onshore market and at the same time develop and liberalise the onshore market to overcome
the gap vis-agrave-vis NDF markets in other aspects such as ease of access market infrastructure
and taxation There is of course the risk that participation of Indian banks will improve
76
liquidity in the NDF market and undermine the development of the onshore market Such
a situation will be challenging for implementing exchange rate management policy
Recommendation 3
The onshore Rupee derivatives market is currently more deep and liquid as compared to the
offshore Rupee market and participation of the Indian banks in the offshore market might over
time take away this advantage The TF feels that the downside of permitting Indian banks to deal
in the offshore Rupee derivative market outweighs the advantages and therefore recommends that
Indian banks should not be permitted to deal in the offshore Rupee derivative market for the
present
4 Requirement of underlying exposure and documentation therefor
There is no requirement of an underlying exposure to enter into a derivative contract in the offshore
Rupee derivative market Hence non-residents can freely trade in this market to hedge risk on an
underlying Rupee exposure or create exposure to Rupee However as per extant regulations non-
residents can enter into Rupee derivative contracts in the onshore market only for the purpose of
hedging risk arising from an underlying exposure Non-residents are classified into Foreign
Portfolio Investor (FPI) investors having Foreign Direct Investments Non-Resident Indian Non-
resident Exporters and Importers and Non-Resident lenders having ECBs designated in INR with
each category being subjected to a different set of rules for establishing underlying exposure
FPIs are allowed to hedge only on the basis of existence of underlying exposure with the hedge
size capped at the market value of investment in equity and debt in India as on a particular date
including any coupon receipts arising out of investment in debt securities falling due during the
following twelve months only The explicit mention of only equity and debt investments creates
regulatory ambiguity on hedging of other FPI exposures in India such as margin deposits cash
etc Hence any FPI having investment in India will be able to only buy USD forward against INR
onshore and will not be allowed to sell USD against INR in forward market as that would result in
increasing the exposure rather than hedging the exposure To prove the exposure a valuation
certificate is required to be provided by a designated AD bank (Custodian) as a proof of underlying
FPIs are also required to provide a declaration to the effect that their total outstanding hedges are
within the market value of their investments The only exception to establishing underlying
77
exposure requirement is dealing in exchange traded market where FPIs are allowed to take
positions without having to establish existence of underlying exposure up to USD 100 million
FDIs are allowed to hedge both their existing investment as well as proposed foreign direct
investments with the latter being allowed only after an AD bank ensures that all necessary
approvals for the investment have been obtained by the FDI With respect to non-resident
corporates users can hedge their exposures invoiced in INR and intercompany loans denominated
in INR (ECBs) They can book the hedge either directly with an AD bank in India or on a back-
to-back basis Prior to hedging they must furnish a declaration certifying that the underlying
exposure has not been hedged with any other AD bank(s) in India They are required to cancel the
hedge contract immediately if the underlying exposure is cancelled In case of a central treasury
an authorization from the entity having INR exposure to hedge on its behalf is also required
Irrespective of the category of the investor the requirement to establish underlying exposure
creates practical difficulties for many non-residents Funds who intend to execute macro hedge for
various schemes or MNC parents wanting to consolidate exposures across subsidiaries and
executing a single hedge find it easier to execute consolidated hedge in the offshore market Also
hedging of anticipated and economic exposures is not permitted
Recently the RBI has released11 draft regulation regarding risk management facilities for public
feedback The TF reviewed it in detail and also received feedback on it during interaction with
stakeholders The proposed regulation satisfactorily addresses a lot of pertinent issues Measures
on simplifying eligible underlying exposure criteria simplifying documentation requirement
flexibility to hedge dynamically ability to hedge anticipated exposures user classification (retail
and non-retail) and choice of products are welcome and much needed It is noted that the
requirement of having an underlying exposure for entering into Rupee derivative contract is
retained and it is felt that it is justified for effectiveness of exchange rate management policy and
ensuring financial stability Given that only hedging transactions are going to be permitted in the
onshore market there will remain a requirement to establish or declare existence of underlying
exposure to risk and also to ensure that notional of hedge contracts is in line with the value of
underlying exposure As discussed above such requirement acts as a deterrent for non-residents to
hedge in the onshore market It would be optimum if a solution can be found that fulfils the
11
Vide press release dated February 05 2019
78
requirement of verification of underlying exposure without the investors being required to
undertake the efforts to prove it This can be achieved by consolidating the existing data on
investments and hedge transactions residing with various regulated entities
Recommendation 4
The TF recommends that a technology-based solution be explored to centrally aggregate the
investments of non-residents and derivative contracts entered into by them in the onshore market
(both OTC and exchange traded) using LEI or any other unique identifier to start with ADs should
be allowed access to such aggregate data so that they can verify the quantum of derivative positions
and underlying investments of the non-residents This mechanism can potentially completely
remove the requirement of efforts from the non-residents to prove the existence of underlying
exposure to Rupee
Further to simplify procedures and provide ease of access to the exchange traded currency
derivative market the RBI has allowed users to enter exchange traded instruments (futures and
options) to take exposure up to USD 100 million without the requirement of establishing the
existence of underlying risk Such measures go a long way in encouraging users (especially
MSMEs) to hedge their exchange rate risk by making the process easier At the same time such
calibrated opening helps in addressing any concerns of systemic risk The TF feels that such an
incentive must be provided in the OTC market also as it will not only contribute to ease of doing
business but also to restore parity in regulation between OTC and exchange markets
Recommendation 5
While requirement of underlying exposure will continue for trading in the onshore market users
may be allowed to undertake positions up to USD 100 million in OTC as well as exchange traded
currency derivative market without having to establish the underlying exposure
5 Products
Non-residents can enter into only plain vanilla forwards and option contracts in the OTC foreign
exchange market Further swaps are restricted to specific case of IPO and non-resident lenders of
ECB denominated in INR Non-residents who prefer to express their hedge using structured
79
options necessarily need to execute in the offshore market as current regulations do not allow non-
residents to enter into structured options
Recommendation 6
The aforesaid draft regulation addresses this issue by allowing ADs to offer any product to the
non-residents (for non-retails users) which satisfies the purpose for which they are permitted to
enter into Rupee derivatives ie hedging of underlying exposure to Rupee In other words ADs
cannot offer any product that creates risk for the user instead of hedging the existing risk The TF
endorses this principle-based regulation approach
6 Restrictions on dynamic management of risk
Non-residents trading in the offshore market are free to cancel and rebook their trades depending
on their future expectations andor risk management policy On the other hand in the onshore
market non-residents in general are not allowed to rebook a contract once cancelled Only in the
case of FPIs rebooking up to 10 of the value of contracts cancelled is permitted Inability to
manage risk dynamically deters non-residents who look for flexibility while hedging their risks
The aforesaid draft regulation proposes to remove restrictions on rebooking of cancelled contracts
and thereby allow users to hedge dynamically For contracts entered into for hedging contracted
exposure gains (or losses) on cancellation will be passed on to the user as and when they accrue
but in case of contracts entered into for hedging anticipated exposures net gains will be transferred
only when the underlying cash flow has occurred The prime purpose of such stipulation is to curb
incentives for speculation by using the liberal position limits available under anticipated exposure
hedging However a consequent drawback is that in some instances eg contingent contracts
such as bidding for projects involving currency risk such a provision would not be equitable This
provision could be suitable amended to enable all types of hedging without compromising the
essential control that the cash flow requirement provides to ensure underlying in a hassle-free way
The TF is of the view that providing suitable discretion to banks to pass on net gains even without
cash flows in such cases would address this shortcoming This will ensure that genuine hedgers
80
will access the onshore market without worrying about retention of gains if underlying transaction
does not fructify due to reasons beyond their control
Recommendation 7
In line with the objective of bringing onshore market at par with offshore market the most obvious
path is to not have any restrictions on transfer of gains in case of anticipated exposure hedging
However a balancing act is necessary between liberalizing the market while preventing
speculative positions which can create undue volatility in the onshore market Keeping this in
mind while endorsing free dynamic hedging (without any restriction on cancellation and
rebooking) for hedging contracted exposure the TF recommends that in case of hedging of
anticipated exposures gains from cancellation of contract may be allowed to be passed on even in
cases where there are no cash flows at the discretion of the bank where the bank considers the
cancellation of underlying cash flow is due to external factors which are beyond the control of the
user
7 Gross settlement and credit risk management
In the case of offshore Rupee derivative market non-residents clear and settle OTC trades either
through a prime brokercustodian or bilaterally with the counterparty In both these cases the non-
residents usually execute a bilateral multi-currency master service agreement which includes
provisions for exchange of margin (ex- ISDA master agreement including Credit Support Annex)
with the counterparty These agreements necessitate periodic settlement of marked-to-market gains
and losses across products and provide the flexibility to net off losses against gains Hence these
agreements significantly lower credit charges and provide strong netting efficiency On the other
hand in the onshore market the non-residents in an otherwise identical situation will face
additional challenges in respect of settlement and exchange of margin due to the following reasons
Gross settlement of gains As mentioned above non-residents clear and settle OTC trades in the
offshore Rupee derivative market either through a prime broker or bilaterally with the
counterparty Typically they settle deal across assets and currencies with either of these entities
and are therefore able to net the cash flows and achieve efficiency in liquidity management
81
However as Rupee derivatives entered into in the onshore Rupee derivative market cannot be
settled under such overseas arrangements non-residents are unable to avail the benefits of netting
on their onshore transactions
Credit risk management Signing a master service agreement locally and establishing credit lines
with onshore banks increases the execution cost of hedging onshore Typically transactions of
non-residents in the offshore market are collateralized (through collateral exchange provisions
contained in the master service agreement) while those in the onshore market are non-
collateralized Depending on the credit rating of the non-resident the onshore banks may not
necessarily be open to providing exposurecredit limits on uncollateralized basis for entering into
deliverable contracts If a collateralized credit line is set up through a master service agreement
with provision for exchange of collateral in USD outside India restrictions under FEMA 1999 on
exchanging margin outside India by onshore banks poses issues If exchange of collateral is in INR
in India then the non-residents will have to either assume the exchange rate risk on the cash margin
deposited or will have to additionally hedge the margin money placed Moreover this attracts
regulatory ambiguity such as minimum tenor restrictions as per deposit regulations ability to
hedge the margin through FX swap interest to be paid on cash in SNRR account etc If interest
cannot be paid on the collateral placed with onshore counterparties it creates a strong economic
disincentive for the investor to hedge onshore
These issues can be addresses in two ways First facilitating the non-residents to utilize their
existing overseas custodianprime broker relationship and master service agreements for
settlement of their transactions onshore and exchange of collateral therefor Second by creating
the regulatory framework for exchange of margin for non-centrally cleared derivatives in India to
make it consistent with evolving clearing mechanism offshore Both the solutions are discussed
below
To help non-residents retain their economic neutrality with respect to the prevailing multi-currency
master service agreement executed offshore a central clearing and settlement mechanism may be
established for non-residentsrsquo deals with onshore counterparties along the lines of central clearing
and settlement of onshore interbank deals by the CCIL The overseas bank of the non-resident will
clear and settle the deals execute by them onshore To be sure the proposal is to introduce the
centralized clearing mechanism while retaining the existing bilateral settlement mechanism so that
82
investors who want to continue using it do not face disruption For the suggested central clearing
and settlement mechanism to be set up inter alia the following permissions would also be
required
i Permission under FEMA 1999 for CCIL to accept foreign currency denominated collateral
in India or outside India
ii Enhancement of CCILrsquos infrastructure to accept wide range of securities (foreign currency
cash securities issued by foreign governments etc) as collateral and
iii Other regulatory clearances required for non-residentsoverseas banks in other jurisdictions
to clear and settle through CCIL
Further back-to-back hedging by non-residents proposed in the aforesaid draft regulation will also
allow effective utilization of their prevailing multi-currency CSA arrangement offshore This
entails allowing non-residents to hedge their exposure with their banking counterpart overseas
which in turn will hedge the position back-to-back with an onshore bank This ensures that existing
dealing arrangements between non-residents and their overseas counterparties remain unchanged
but at the same time the market risk gets transferred to onshore banks and hence is managed locally
The overseas bank should be allowed to settle the onshore leg either bilaterally with the onshore
bank or through the proposed central clearing and settlement mechanism Also this will require
permissibility under FEMA 1999 to exchange margin with the overseas banker of non-residents
outside India In such a model the approach should be to recognize the intermediary offshore bank
as a facilitator purely for the convenience of the non-resident investor Experience from other
markets that have implemented such models like Malaysia and China suggest that putting the onus
of monitoring compliance in terms of quantum of hedge underlying documentation etc on the
intermediary bank is inefficient Such a requirement leads to the intermediary bank asking for
various indemnities from the client and these are often difficult and time consuming to negotiate
and sign The approach should be to monitor compliance by the non-residents as the regulated user
using available onshore infrastructure as well use of technology solutions to track the hedges vis-
a-vis underlying exposure as detailed in recommendation 5
With regard to regulation and infrastructure for exchange of margin for non-centrally cleared
derivatives in India the RBI released a discussion paper on this issue in May 2016 However the
final directions have not been issues yet It is understood that ambiguity in netting legislation is
83
one of the main issues holding the release of these directions Also it is understood that the GoI is
in the process of making legislative changes to address this issue
Recommendation 8
For ease of entering into hedge transactions for non-residents the TF recommends-
i Establishment of a central clearing and settlement mechanism for non-residentsrsquo deals in the
onshore market
ii Back-to-back hedging by non-residents proposed under the draft regulation is endorsed The
overseas bank should be allowed to settle the onshore leg either bilaterally with the onshore bank
or through the proposed central clearing and settlement mechanism
iii Implementation of margin requirement for non-centrally cleared OTC derivatives in the
onshore market at the earliest
iv Allowing Indian banks to post margin outside India This is not only relevant for credit risk
management for their transactions with non-resident users but also for their cross-border inter-
bank transactions
8 Taxation
Under the extant regulatory framework non-residents are permitted to enter into Rupee derivative
contracts only for hedging risk on their investmentslendingtrade in India As per discussions with
stakeholders the following position is generally adopted with regard to the gains from such
contracts
bull Where currencies under the contract are delivered ndash Not a taxable event (ie conversion of
one currency into another does not give rise to taxable income)
bull Where contract is cancelled and price difference is settled ndash If the derivative contract is
entered into for hedging exchange rate risk on a capital asset then gains on cancellation are
treated as capital gains If it is entered into for hedging exchange rate risk in relation to a
tradingbusiness asset such gains are treated as business profits
84
However it is understood that there is ambiguity in the rules in this connection and the position
taken by the Assessing Officers (AOs) differs between zones and is at variance with the aforesaid
position Oftentimes such gains on cancellation are treated as lsquoOther Incomersquo or lsquoSpeculation
Business Profitsrsquo During interaction with the non-residents it was suggested that such uncertainty
of tax treatment is one of the prime reasons why they do not access the onshore market and instead
hedge Rupee exposures in the off-shore market
Recommendation 9
The TF recommends that the competent authorities may examine the issue of taxation in respect
of foreign exchange derivative contracts with the objective of overcoming gaps between tax regime
in India and other major international financial centres (Singapore Hong Kong and London) to
the extent possible and thereby incentivizing non-residents to hedge in the onshore market
9 Allow non-deliverable Rupee derivatives in the IFSC and permit IBUs to deal in such
derivatives
The proposition of introducing non-deliverable Rupee derivatives in the IFSC and permitting
banks (IFSC Business Units or IBUs) to deal in such derivatives is discussed in detail in Chapter
4 While there are concerns around impact on the onshore market due to trading in Rupee
derivatives in the IFSC there are potential benefits in terms of IFSCrsquos ability to offer complete
bouquet of financial services and availability of market information to all stakeholders Further
given Indiarsquos economic growth it may be appropriate to prepare for greater financial integration
with the rest of the world Sequencing and timing of measures relating to currency markets is a
critical component of such integration Although at the moment there is no definite path ahead in
terms of such integration but a thriving Rupee market in the IFSC may provide a system which
can be leveraged towards this end in the way and manner deemed fit in future IFSC being outside
the capital controls provides an opportunity to policymakers to test new regimes and products in
an environment whose repercussions may not significantly impact the stability or efficiency of the
onshore system On balance the TF is of the view that non-deliverable Rupee derivatives may be
introduced in the IFSC However a phased approach may be adopted and to start with trading
may be permitted only on exchanges due to the inherent transparency and risk management
85
benefits offered by it Introducing OTC contracts may be considered at a later stage after the
experience gained from trading on exchanges RBI may in its Financial Stability report assess the
impact of the functioning of IFSC on the financial stability of the country
Further the TF is of the view that entities regulated and permitted by the RBI may be permitted to
make market and run positions in Rupee derivatives market in the IFSC In order to prevent spill
over of risks from IFSC to onshore market though these entities a distinct net open position limit
may be stipulated for their operations in the IFSC In other words the open positions of entities
operating in the IFSC should not be permitted to be netted off with their open position the onshore
market
Recommendation 10
The TF recommends that non-deliverable Rupee derivatives (with settlement in foreign currency)
may be allowed to be traded in the IFSC and IBUs may be allowed to deal in such derivatives with
a distinct FCY-INR position limit To start with exchange traded currency derivatives involving
Rupee may be introduced and with experience non-deliverable OTC currency derivatives
involving Rupee may also be allowed
10 KYC process
The extant directions issued by the Reserve Bank of India stipulates the documents required for
conducting KYC process to open accounts of non-residents Similarly SEBI has also prescribed
documents required for the granting of FPI license by Domestic Depository Participants (DDP)
Further KYC documents for FPIs are available to SEBI regulated entities through KRAs subject
to approval from either the FPIs or the domestic custodians Since access to KRAs is available
only to SEBI regulated entities most banks are not allowed to access KRA and hence seek
complete documentation from FPIs again Such repetitive submission of documents to various
financial intermediaries results in long lead time for on-boarding and makes the entire process
operationally cumbersome for non-residents
Recommendation 11
The TF recommends that the KYC registration may be centralized across the financial market with
uniform documentation requirement All regulated financial market intermediaries should be
provided access to the centralized registry and they should be allowed to rely on online registry
86
for confirmation that KYC has been completed and itrsquos valid This will ensure that non-residents
undertake the KYC process only once and not with each financial intermediary that they deal with
in the onshore market Also such a mechanism offers cost and efficiency benefits for the financial
intermediaries
87
Annexure I
Key features of currency market of major EMEs
I USD-RMB Market ndash China
Onshore Deliverable - CNY Offshore Deliverable - CNH
Market
Turnover
Daily average turnover USD 28
billion
Daily average swap and
forward turnover
USD 62
billion
Daily average options
turnover
USD 15
billion
Daily average
turnover
USD 15-20
billion
Daily average
forward turnover
USD 25-30
billion
Daily average
Options turnover
USD 5-6 billion
Spot foreign
exchange Onshore CNY foreign exchange spot is
available with documentary proof of an
underlying transaction
Participating banks in Hong Kong
provide two types of spot RMB
exchange rate transactions
- For trade service and direct
investment purposes where
resulting foreign exchange
positions can be offset with the
clearing bank or onshore
correspondent banks and
For general purposes where banks need
to warehouse the risk or offset the
position in the interbank USD-CNH
market Forward
FXSwaps CNY forwards and foreign exchange
swaps with maturities of up to five years
are available to onshore institutions to
hedge foreign exchange exposure
subject to documentary proof of the
same
Most liquid is in the tenor of one year or less
CNH deliverable offshore forwards
are available out to five years
Liquidity has improved significantly
and has surpassed turnover in the
NDF market
FX Options Onshore market participants can buy or
sell common European options of CNY
against foreign currencies on a real
needs basis
Tenors are available out to three years
with further tenors on a case-by-case
basis Most liquid is in the tenor of one
year or less
The State Administration of Foreign
Exchange (SAFE) started allowing
corporates to sell FX options from August
2014 on a real needs basis and with net
settlement allowed
Deliverable CNH options are
available without restrictions to any
non-individual counterparty that has
a physical CNH Nostro account in
Hong Kong
Options on USD-CNH and CNH crosses
are available out to five years and
beyond on a case-by-case basis
88
Access to
domestic
participants
On the current account the CNY is
convertible subject to genuine
documentation Onshore entities can
access the local forwards market
provided these contracts are used to
cover current account transactions
subject to documentary proof available
on settlement
On capital account CNY conversions
may be settled by way of voluntary
settlement in banks if these are required
in the Companiesrsquo institutionsrsquo actual
business operation Typically all capital
account transactions need to be
registered with SAFE for local forwards
Not easily accessible to onshore
residents approvals required for transfer
of funds from Onshore to Offshore
Access to
Offshore
participants
Qualified
Foreign
Institutional
Investor
All allowed subject to
principle of actual
needs (Quota
restrictions exists
on underlying
investments)
Can trade via their
custodian or domestic
financial institution
Central
Banks
No quota restrictions
ability to trade as
interbank counterparty
in the domestic market
ndash bilateral or
anonymous trading
China
Interbank
Bond market
(CIBM)Bond
Connect
For OIIs (Overseas
Institutional Investors)
accessing making
CIBM investment can
enter
into all FX products on
actual needs basis with
settlement agent banks
Change in CIBM
investment position
requires adjustment to
the FX hedges within
5 working days
All customers can open a RMB account
in Hong Kong Banks can provide
customers with general purpose RMB
accounts which allow free transfers of
funds (offshore) for any purpose In
general all FX products are allowed in
CNH for offshore investors
Trading
Hours 10 AM ndash 4 PM Local China Hours 10 AM ndash 4 PM Local China Hours
89
II USD-KRW Market - Korea
Features Onshore Deliverable Offshore Non-Deliverable
Market Turnover Average daily turnover
USD
Billion
Spot Forward Swaps
2011 191 75 192
2012 180 66 198
2013 183 71 196
2014 175 76 190
2015 200 83 192
2016 194 96 184
2017 196 101 198 Source Bank of Korea
As per London clearing house
(LCH) Ltd the daily turnover of
NDF cleared by them on April
16 2019 is a total of USD 119
billion (Source LCH)
As per SEF turnover as on April
12 2019 is USD 379 million
(Source SEF)
Daily NDF turnover has
increased from USD 195 billion
in 2013 to USD 30 billion in
2016 (Source BIS 2016 survey)
Access to
domestic
participants
Residents can hold unlimited
amounts of foreign currency in
foreign currency bank accounts and
Korean firms can maintain foreign
currency accounts abroad
Financial institutional investors
have access to the local forwards
market and can hedge their
investment exposure without
confirming the lsquoexistencersquo of the
investment
Forward position limits of foreign
bank branches (FBBs) and local
banks registered as FX Banks in
Korea as below
- For FBBs positions are
capped at 200 per cent of the
previous month-end equity
capital
- For local banks forward
positions are capped at 40 per
cent of the previous month-
end equity capital
- Corporate customer foreign
currency hedging limits are
100 per cent of customersrsquo
exposure or their transaction
of underlying real assets
Residents may hold foreign
currency accounts domestically
or abroad
Corporate investors and
individual investors are required
to confirm the existence of the
investment
In the case of capital or current
account transactions domestic
residents can remit up to USD 50
000 per year freely
Access to
Offshore
participants
Non-residents can hold KRW
locally through bank accounts
Foreign investors must open special
investment purpose accounts
No restrictions and BoK does not
regulate the same
90
Source Bank of Korea BIS HSBC Research
which consist of an exclusive
external account for investment and
an exclusive non-resident domestic
currency account for investment
Foreign investors are allowed to
freely convert foreign currency into
KRW without any underlying
securities purchases while the
converted funds are being
transferred within exclusive
external investment accounts
However the converted funds in
the exclusive external account for
investment should still be used for
the purpose of securities
investment
Non-Resident Investors holding
Investment Registration Certificates
(IRC) sale proceeds from the
investment in securities can be
freely repatriated
Central Bank
intervention
BOK is now releasing a quarterly
intervention report on a net basis
They generally only comment that
they intervene only in exceptional
basis for smoothing operations
Bank of Korea does not access the
NDF market
Trading Hours 9 AM ndash 330 PM local Korea time Available through time zones
Taxation and
Repatriation of
FX Gains
All gains on unwind of deliverable
transactions are freely repatriable
without any tax
All gains on unwind of non-
deliverable transactions with
onshore banks are freely repatriable
without any tax
91
III USD-MYR Market ndash Malaysia
Onshore Deliverable Offshore Non-Deliverable
Market Turnover - Daily inter-bank market USDMYR
spot turnover around $500 million
- Daily inter-bank market USDMYR
swap turnover around $30 billion
- As per LCH Ltd UK Clearing
house the daily turnover of
USDMYR NDF cleared by them
on April 16 2019 is a total of
USD 332 million from 82 trades
(LCH website)
- As per SEF a trading platform
USDMYR turnover as on April
12 2019 is USD 205 million
from 18 trades (SEF website)
- As per the Hong Kong exchange
the NDF turnovers in 2016 were
around USD 50 billion and have
reduced to approximately USD
20 billion in 2018 (HKMA NDF
report 2018)
Access to Domestic
participants
- Resident counterparties such as
importers and exporters can use
currency options and forward
contracts to manage their foreign
exchange risk
- Residents are allowed to enter into
hedging arrangements on committed
current account transactions and
financial account transactions
- All forward contracts must be
supported by an underlying trade or
capital account-related transaction
allowed under the Foreign Exchange
Administration Rules
- Residents are allowed to freely
hedge and un-hedge their foreign
currency exposure for USD-MYR
CNH-MYR GBP-MYR EURMYR
and JPY-MYR currency pairs
without documentary evidence up to
an aggregate net open position of
MYR 6 million per bank
Not allowed
Access to Offshore
participants
- Licensed onshore banks and
approved investment banks are
allowed to enter into FX forward
Open and not regulated by the
central bank
92
Source Bank Negara Malaysia BIS HSBC Research
contracts with non-residents as
follows
Forward FX purchase or sale
contracts against MYR for
current account transactions
Forward FX purchase or sale
contracts against MYR based on
committed purchases or sales of
MYR assets The forward
contracts can be entered into at
the point when the non-resident
commits to purchase or sell the
MYR assets
- Dynamic hedging programme offers
flexibility to actively manage FX risk
exposure via forward hedging
activities with onshore banks or
Appointed Overseas Office (AOO)
without any documentation
CCP used Malaysian Exchange Not mandatory but LCH used
regularly
Central Bank
intervention
Through appointed agent banks Not applicable
Fixing to settle
NDF
NA KL USDMYR Reference rate
Trading Hours - Trading hour is 9 AM to 6 PM Local
Time Limited FX liquidity
available for non-residents post local
trading hours
- USDMYR is also quoted by
appointed overseas offices for spot
value only for any underlying asset
trades - post local trading hours No
forward prices are quoted
Quoted across time zones
Taxation and
Repatriation of FX
Gains
All gains on cancelled FX Contracts
are freely repatriable and do not
attract taxation in Malaysia
Taxed based on jurisdiction
93
IV USD-IDR Market - Indonesia
Onshore Deliverable Offshore Non-Deliverable Onshore Non-Deliverable
Market
Turnover
Average
daily spot
turnovers
USD 1bn
Average
daily swap
turnovers
USD 500
million
As per LCH Ltd - the
daily turnover of
USDIDR NDF cleared
by them on April 16
2019 is a total of USD
41 billion from 832
trades
As per SEF USDIDR
turnover as on April 12
2019 is USD 33 million
from 11 trades (Source
SEF)
As per HKTR Jan 2018
reporting the outstanding
IDR NDF turnover on
the Hong Kong exchange
of is around USD 40
billion (Source HKMA
NDF report 2018)
NDF
average size
USD 5m
Access to
Domestic
participants
Foreign currency against IDR
transactions between banks and
domestic parties over a certain
amount must have an underlying
transaction
Not Allowed Allowed but will need to
demonstrate underlying
documents
Access to
Offshore
participants
Non-residents must have
underlying IDR
assetliabilityreceivablepayable
to be able to enter into IDR cash
FX andor FX hedge BI list all the
permissible underlying activities
along with recommended
documentation format
Open and not regulated by
Bank Indonesia
Allowed but will need to
demonstrate underlying
documents
BI published a more-
stringent list of
permissible underlying
activities
Benefits Pricing uses onshore-curve
driven by onshore participants
and BI intervention
Not regulated and no
need for underlying
documentation
Prices available across
time zones
Can generated IDR
exposures without
having an underlying
asset in IDR
Pricing uses onshore-
curve driven by onshore
participants and BI
intervention (explanation
below) BI appears to
have a much bigger-
capacity to manage since
the product is net-settled
in IDR
94
Source Bank Indonesia BIS HSBC Research
Clients with IDR FX
exposure but no urgent
need for principal-
exchange As example
long-term IDR bond
investors
Limitations Requirement for underlying
docs limit the maximum
exposure that foreign Clients
can take
BI restricts Domestic Banks
from having residual-risk
when dealing Derivatives with
Related-Parties (locally
incorporated banks only)
Convertibility risk Requirement for
underlying docs limit the
maximum exposure
Foreign Clients can take
Clients with actual need
for principal-exchange
due to basis-risk between
[JISDOR fixing] vs
[actual FX rate] eg
Coupon repatriation and
BI restricts domestic
banks from having
residual-risk when
dealing derivatives with
related parties (locally
incorporated banks only)
Central
Bank
intervention
BI intervenes only in the onshore
market via Cash FX Onshore DF
and Onshore DNDF These can
be done via auctions or bilateral
OTC trades as there is no
onshore futures market for IDR
Bank Indonesia does not
access the NDF market
BI has the ability to intervene
in the DNDF market
although the market is very
new
Fixing to
settle NDF
Not Applicable JISDOR (USD-IDR)
JISDOR (USD-IDR)
Trading
Hours
Trading hours is from 8 AM ndash
12 PM Local Time and 1 PM
ndash 4 PM (Market breaks for
lunch between 12 PM ndash 1
PM)
USD-IDR is also quoted by
banks offshore for Spot value
only for any underlying asset
trades post local trading hours
No Forward prices are quoted
Quoted across time zones 8 AM ndash 12 PM Local
Time 1 PM ndash 4 PM
(Market breaks for lunch
between 12 PM ndash 1 PM)
Taxation
and
Repatriation
of FX Gains
As per market practice gains on
any unwindcancellation of FX
hedges are not passed to Non-
Residents
Taxed as per jurisdiction As per market practice gains
on any unwindcancellation
of FX hedges are not passed
to Non-Residents
95
V USD-BRL Market - Brazil
Features Onshore Deliverable Offshore Non-Deliverable
Market Features Average daily spot USD 8 billion
Onshore B3 USD 14 billion
Average daily options
turnovers
USD 15 billion
Offshore NDF
turnover daily
USD 4
billion
Market Hours Market hours is 0900 to 1800 Hours
However liquidity is highest between 10
am ndash 12 pm and 2 pm ndash 4 pm local
hours
96
VI USD-TWD Market - Taiwan
Features Onshore Deliverable Offshore Non-Deliverable
Market
Features Average Daily
Spot
Turnovers
USD 3-4 billion
Average Daily
Swap
turnovers
USD 2-3 billion
Average
Options
Turnovers
USD 150 million
Average daily
turnovers
USD 2-4 billion
Market
Turnovers
- Onshore total Spot turnovers in
USDTWD for March 2019 were USD
31560 billion (Average daily turnover of
~ USD 10 billion)
- Data related to USDTWD swaps is not
readily available but total swaps amp
forwards dealt onshore (across currency
pairs) is ~ 5750 of the FX turnovers
USD 11504 billion in April 2016 (last
available data) [Source BIS]
Access to
Domestic
participants
There are no limits on the TWDrsquos trading
range versus other currencies but there are
convertibility limits on the capital account
- Access to domestic participants are
not allowed
- Local banksrsquo overseas branches to
participate in the TWD NDF
market These banks will also be
subject to the existing cap on net
NDF positions at 20 per cent of
each bankrsquos FX position (last
revised lower from 33 per cent in
December 2010)
Access to
Offshore
participants
Non-Resident
Foreign investors are allowed to enter
into onshore swapforward contracts for
hedging underlying investment in
Taiwan
FINIs (Foreign Institutional Investors)
can only conduct buy USDsell TWD
contract and the total contract amount
entered into by a foreign investor should
not exceed FINIs USD and TWD net
remitted-in capital (ie total remitted-in
funds minus total remitted-out funds)
Access to foreign exchange is divided
into three categories
- import and export
Open and not regulated by the central
bank
97
- cost of trade-related services
- Investments capital repatriation and
dividends
Currency options are permitted
For FINIsFIDIs all transactions must be
documented regardless of the amount
On the maturity of FX forward (or
forward leg of a swap deal) FINI may
have the following decisions
- To settle the contract on the maturity
day as originally dealt In this case
FINI needs to ensure sufficiency of
existing account balance That is
settlement of FX forward should
come from the existing funds in
Taiwan or funds from sale proceeds
of underlying investments
- To extend (ie rollover) the contract
to another period in this case on the
maturity day FINI has to settle the
difference between the original
forward contract rate and the mark-
to-market rate
If FINI rollovers the contract upon
maturity and incurs a gain upon rollover
the gain will be credited to the FINIs
account in Taiwan Such gain will be
treated as other income derived in
Taiwan
CCP used Taipei Exchange (TPEx) acts as the Central
Counter Party for and also covers all foreign
exchange transactions made by authorized
foreign exchange banks and offshore banking
units
Not mandatory but LCH used regularly
Central Bank
intervention
Central bankrsquos FX intervention is via agent
banks in the OTC market where onshore
TWD is traded One of the mechanisms
through which local currency pressure is
absorbed is through modulation of hedge
ratio of Lifers
Not applicable
Fixing to
settle NDF
NA Central bankrsquos FX intervention is via
agent banks in the OTC market where
onshore TWD is traded
Bloomberg TRY11ltIndexgt
Trading
Hours
- 9 AM ndash 4 PM Local Time
- Market breaks for lunch at 12 PM ndash 2 PM
Quoted across time zones
98
Source CBC BIS HSBC Research
Taxation and
Repatriation
of FX Gains
If FINI rollovers the contract upon
maturity and incurs a gain upon rollover
the gain will be credited to the FINIs
account in Taiwan Such gain will be
treated as other income derived in
Taiwan and therefore subject to 20
standard withholding tax In case that FX
loss incurs due to rollover FINI may
arrange funding to cover the loss if
necessary
FINI can choose one of the following
methods to calculate and pay for the
relevant tax Please however note that
the method is not changeable once it is
decided If FINI does not confirm which
method to be used the option 1) will be
applied
- Withhold related tax on FX gain
from each rollover or
- Netting FX gainslosses from
rollover within the same year or
- Netting FX gainslosses from
rollover and the total remitted-in
principals revaluation gainloss in
the year
If the foreign investor adopts option 2) or
3) above they must appoint or contact
their existing local tax agent (if any) in
Taiwan to file annual tax return
Taxed based on jurisdiction
99
Annexure II
Appendix to Chapter 3
A bivariate BEKK-GARCH (11) model as proposed by Engle and Kroner (1995) can be specified with
the system of conditional mean equations consists of VAR(p) models (p = 1 n) as given in eq (1) and
variance equation as in eq(2)
119884119905 = 120583 + sum Γ119894119884119905minus119894 + 120576119905119901119894=1 (1)
where 119884119905 = (1199101119905 1199102119905) 1199101119905 is exchange rate return in onshore market and 1199102119905 is exchange rate return in
offshore market at time t The parameter vector 120583 = (1205831 1205832) represents constants and Γ is a 2times2 matrix of
autoregressive terms The diagonal elements 120574119894119894 measure own lagged effect of the variables while the off-
diagonal elements 120574119894119895 capture the mean spillover from variable i to variable j
Taking into account the asymmetric responses of volatility ie volatility tends to increase more in response
to negative shocks (bad news) than positive shocks (good news) in the variances and covariances as
proposed by Kroner and Ng (1998) a BEKK representation of conditional variance equation can be written
as
119867119905 = 119862prime119862 + 119860prime120576119905minus1prime 120576119905minus1119860 + 119861prime119867119905minus1119861 + 119863prime120585119905minus1
prime 120585119905minus1119863 (2)
where 120585119905 would be 120576119905 if it is negative and zero otherwise The Eq (2) can be written in matrix form as
follows
119867119905 = [11988811 011988821 11988822
] + [11988611 11988612
11988621 11988622]
prime
[1205761119905minus1
2 1205761119905minus11205762119905minus1
1205762119905minus11205761119905minus1 1205762119905minus12 ] [
11988611 11988612
11988621 11988622]
+ [11988711 11988712
11988721 11988722]
prime
[ℎ11119905minus1 ℎ12119905minus1
ℎ21119905minus1 ℎ22119905minus1] [
11988711 11988712
11988721 11988722]
+ [11988911 11988912
11988921 11988922]
prime
[1205851119905minus1
2 1205851119905minus11205852119905minus1
1205852119905minus11205851119905minus1 1205852119905minus12 ] [
11988911 11988912
11988921 11988922]
In the above model the dynamic process of 119867119905 is a linear function of its own lagged values lagged squared
innovations and the cross-product of the innovations and asymmetric terms Volatility transmission
channel between onshore and offshore markets is represented by the off-diagonal parameters in matrices A
and B while the diagonal parameters in those matrices capture the effects of their own past shocks and
volatility The diagonal parameters in matrix D measure the response own past negative shocks while the
100
off-diagonal parameters 119889119894119895 show the response of one market to the negative shocks in the another market
to be called the cross-market asymmetric responses
MGARCH-BEKK Parameter Estimates
Spot and 1-Month NDF 1-Month Forward and NDF 1-Month Futures and NDF
Variable Coeff P-value Variable Coeff P-value Variable Coeff P-value
Mean Equation
DSPOT(-1) -063 000 DFW1M(-1) -064 000 DFUT1M(-1) -063 000
DSPOT(-2) -052 000 DFW1M(-2) -054 000 DFUT1M(-2) -053 000
DSPOT(-3) -031 000 DFW1M(-3) -033 000 DFUT1M(-3) -033 000
DSPOT(-4) -015 000 DFW1M(-4) -018 000 DFUT1M(-4) -019 000
DSPOT(-5) -010 000 DFW1M(-5) -012 000 DFUT1M(-5) -010 000
DNDF1M(-1) 062 000 DNDF1M(-1) 063 000 DNDF1M(-1) 062 000
DNDF1M(-2) 047 000 DNDF1M(-2) 049 000 DNDF1M(-2) 048 000
DNDF1M(-3) 030 000 DNDF1M(-3) 033 000 DNDF1M(-3) 035 000
DNDF1M(-4) 022 000 DNDF1M(-4) 023 000 DNDF1M(-4) 027 000
DNDF1M(-5) 013 000 DNDF1M(-5) 015 000 DNDF1M(-5) 016 000
Constant 001 029 Constant 001 003 Constant 001 013
DSPOT(-1) 013 000 DFW1M(-1) 013 000 DFUT1M(-1) 011 001
DSPOT(-2) 003 053 DFW1M(-2) 002 046 DFUT1M(-2) 000 098
DSPOT(-3) 005 042 DFW1M(-3) 003 033 DFUT1M(-3) 002 064
DSPOT(-4) 005 033 DFW1M(-4) 005 015 DFUT1M(-4) 004 041
DSPOT(-5) 002 067 DFW1M(-5) 001 068 DFUT1M(-5) 002 058
DNDF1M(-1) -009 000 DNDF1M(-1) -009 000 DNDF1M(-1) -009 001
DNDF1M(-2) -007 015 DNDF1M(-2) -007 003 DNDF1M(-2) -005 022
DNDF1M(-3) -005 033 DNDF1M(-3) -004 012 DNDF1M(-3) -002 065
DNDF1M(-4) 001 086 DNDF1M(-4) 001 076 DNDF1M(-4) 003 052
DNDF1M(-5) 001 079 DNDF1M(-5) 002 052 DNDF1M(-5) 001 067
Constant 001 038 Constant 001 011 Constant 001 017
Variance Equation
C(11) 005 000 C(11) 005 000 C(11) 003 000
C(21) 005 000 C(21) 005 000 C(21) 003 000
C(22) -001 004 C(22) 001 000 C(22) 005 000
A(11) 027 000 A(11) 027 000 A(11) 014 000
A(12) 004 042 A(12) 005 032 A(12) -012 004
A(21) -004 029 A(21) -004 034 A(21) 007 010
A(22) 019 000 A(22) 018 000 A(22) 029 000
B(11) 096 000 B(11) 096 000 B(11) 098 000
B(12) -001 020 B(12) -002 003 B(12) 003 004
B(21) 001 037 B(21) 001 029 B(21) -001 048
B(22) 098 000 B(22) 098 000 B(22) 094 000
D(11) -023 001 D(11) 027 000 D(11) 020 001
101
D(12) -037 000 D(12) 035 000 D(12) 024 000
D(21) 022 000 D(21) -025 000 D(21) -016 000
D(22) 028 000 D(22) -028 000 D(22) -012 006
102
Annexure III
Evolution of Onshore Exchange Traded Currency Derivatives Market
Exchange Traded Currency Derivatives (ETCD) were launched in August 2008 in India with the
introduction of futures contracts on US Dollar-Rupee currency pair as the underlying
Subsequently in the year 2010 Rupee future contracts were allowed to trade against three other
currencies viz Euro Pound sterling and Japanese yen The options contracts were introduced on
US Dollar-Rupee currency pair in year 2010 The Reserve Bank of India (RBI) and Securities
Exchange Board of India (SEBI) allowed participation for all resident individuals including
corporates Trading Members and Banks in proprietary capacity on ETCD
In the year 2012 it was decided to lower the open position limits for banks on the back of volatility
in rupee and to exclude the positions in ETCD from Net Overnight Open Position Limit (NOOPL)
Thereafter in the year 2013 the Rupee depreciated sharply against USD due to huge capital
outflows in both equity and debt markets expectation of unwinding of Quantitative Easing by US
FED and increase in current account deficit Additionally the open position limits for the
participants were decreased and banks were restricted from participating on their own accounts in
the ETCD market further the participants were also prohibited from taking positions beyond
USD 10 million
In June 2014 Banks were allowed to engage in proprietary trading in ETCD markets Domestic
participants were allowed to have open position beyond USD 15 million subject to the evidence
of underlying exposure In 2018 this limit was raised to USD 100 million across all currency pairs
involving INR put together and combined across all exchanges
Foreign Portfolio Investors (FPI) and Non-Resident Indians (NRIs) were permitted to participate
in ETCD markets for hedging currency risk arising out of their investments in India in 2014 and
2017 respectively In February 2018 SEBI and RBI permitted currency derivatives on cross
currency pairs - EURUSD GBPUSD and USDJPY- and currency options on EURINR GBPINR
and JPYINR In December 2018 weekly options on US Dollar - Indian Rupee currency pair were
permitted As on date derivatives are available on seven currency pairs - USDINR EURINR
GBPINR JPYINR EURUSD GBPUSD and USDJPY
103
The exchange traded currency derivatives draws participation from diverse categories of
participants Some of the key participant categories include banks corporates trading members
foreign investors and other investors The following are the turnover of exchanges
FY National Stock Exchange of India (All figures in USD billions)
USD-INR futures USD-INR Options
(Notional turnover)
USD-INR Options
(Premium )
2014-15 32630 12618 052
2015-16 37374 26600 092
2016-17 31887 35271 107
2017-18 33818 37714 117
2018-19 57913 54183 204
FY
BSE (All figures in USD billions)
USD-INR futures USD-INR Options
(Notional turnover)
USD-INR Options
(Premium)
2014-15 20740 9609 081
2015-16 27713 13772 044
2016-17 27521 21034 045
2017-18 30146 37552 041
2018-19 45956 59350 051
FY Metropolitan Stock Exchange of India (All figures in USD billions)
USD-INR futures USD-INR Options
( Notional turnover )
USD-INR Options
( Premium )
2014-15 18274 593 593
2015-16 8433 646 646
2016-17 8233 367 367
2017-18 3032 491 491
2018-19 1060 245 245
104
Present Regulatory Framework (client limits open interest limits need for underlying
exposure etc)
a) Position limits for different client categories for FCY-INR currency pairs
bull Position limits of clients and Category III FPIs- The gross open positions of the client
across all contracts in the respective currency pairs shall not exceed the limits as mentioned
below
Currency Pairs
Position limits
USD-INR Gross open position across all contracts shall not exceed
6 of the total open interest or USD 10 million whichever
is higher
EUR-INR Gross open position across all contracts shall not exceed
6 of the total open interest or EUR 5 million whichever
is higher
GBP-INR Gross open position across all contracts shall not exceed
6 of the total open interest or GBP 5 million whichever
is higher
JPY-INR Gross open position across all contracts shall not exceed
6 of the total open interest or JPY 200 million whichever
is higher
bull Proprietary position limits of non-bank stock brokers- The gross open positions of the
proprietary account across all contracts in the respective currency pairs shall not exceed
the limits as mentioned below
Currency Pairs
Position limits
USD-INR Gross open position across all contracts shall not exceed 15
of the total open interest or USD 50 million whichever is
higher
EUR-INR Gross open position across all contracts shall not exceed 15
of the total open interest or EUR 25 million whichever is
higher
GBP-INR Gross open position across all contracts shall not exceed 15
of the total open interest or GBP 25 million whichever is
higher
JPY-INR Gross open position across all contracts shall not exceed 15
of the total open interest or JPY 1000 million whichever is
higher
105
bull Position limits of stock brokers (bank and non-bank) Category I and II FPIs- The
gross open positions of trading members across all contracts in the respective currency
pairs shall not exceed the limits as mentioned below
Currency Pairs
Position limits
USD-INR Gross open position across all contracts shall not exceed
15 of the total open interest or USD 100 million
whichever is higher
EUR-INR Gross open position across all contracts shall not exceed
15 of the total open interest or EUR 50 million whichever
is higher
GBP-INR Gross open position across all contracts shall not exceed
15 of the total open interest or GBP 50 million whichever
is higher
JPY-INR Gross open position across all contracts shall not exceed
15 of the total open interest or JPY 2000 million
whichever is higher
Domestic clients shall ensure that the position across exchanges is within the prescribed
limit of USD 100 million equivalent If position is in excess of USD 100 million
equivalent clients are required to provide disclosure of underlying exposure to Trading
Member as per existing practice
bull Proprietary positions created in FCY-INR pairs (USD-INR EUR-INR GBP-INR
and JPY-INR)
Single INR limit for proprietary
position for bank stock broker
Single INR limit for proprietary
position for non-bank stock broker
Higher of 15 of total OI across all
FCY- INR pairs or USD 200 million
Higher of 15 of total OI across all
FCY-INR pairs or USD 100 million
b) Position limit for Cross Currency Derivatives are given below
bull Position limits for stock brokers (banks and non-bank) Category I amp II FPIs
Domestic Institutional investors (DIIs) as permitted by the respective sectoral
regulators and AD Category-I banks-
106
Currency Pairs
Position limits
EUR-USD Gross open position across all contracts shall not
exceed 15 of the total open interest or EUR 100
million whichever is higher
GBP-USD Gross open position across all contracts shall not
exceed 15 of the total open interest or GBP 100
million whichever is higher
USD-JPY Gross open position across all contracts shall not
exceed 15 of the total open interest or USD 100
million whichever is higher
The aforementioned limits shall be the total limits available to the stock brokers for
taking positions on proprietary basis and for positions of their clients
bull Position limit for proprietary position of non-bank stock brokers-
Currency Pairs
Position limits
EUR-USD Gross open position across all contracts shall not
exceed 15 of the total open interest or EUR 50
million whichever is higher
GBP-USD Gross open position across all contracts shall not
exceed 15 of the total open interest or GBP 50
million whichever is higher
USD-JPY Gross open position across all contracts shall not
exceed 15 of the total open interest or USD 50
million whichever is higher
bull Position limits for Clients and Category III FPIs-
Currency Pairs
Position limits
EUR-USD Gross open position across all contracts shall not
exceed 6 of the total open interest or EUR 10
million whichever is higher
GBP-USD Gross open position across all contracts shall not
exceed 6 of the total open interest or GBP 10
million whichever is higher
USD-JPY Gross open position across all contracts shall not
exceed 6 of the total open interest or USD 10
million whichever is higher
107
Annexure IV
Comparison of onshore and offshore Rupee derivatives volumes
1 Exchange Traded Market
All figures in USD billions
Table Comparison between onshore and offshore exchange traded INR-USD Futures
FY Onshore Offshore Market Share
BSE NSE MSEI Total DGCX SGX CME Total Onshore Offshore
2014-15 21115 32491 9433 63040 31704 3704 396 35804 6378 3622
2015-16 27904 37241 4539 69685 32725 13906 1001 47631 5940 4060
2016-17 26528 31799 4300 62626 34149 17164 1636 52949 5419 4581
2017-18 30360 33729 1761 65851 33458 28047 5232 66737 4967 5033
2018-19 44820 57237 648 102705 35452 37599 7475 80526 5605 4395
Note-
i Data for BSE NSE amp MSEI is from Exchange websites for USDINR Futures
ii Data for DGCX SGX and CME is from Bloomberg and India INX Research
iii Data for DGCX includes INRUSD Futures (including mini contract) but excludes the USDINR Index
Quanto futures
iv Data for CME includes the Mini and Micro contracts
v Data for FY 2018-19 is from April 01 2018 to March 22 2019
2 OTC Market (as per BIS Quarterly Review December 2016)
108
Annexure V
Meetings held by the Task Force
Sr No Date Venue External Participants Invited
1 March 19 2019 RBI Mumbai
2 March 25 2019 RBI Mumbai -Shri Ananth Narayan Professor SPJMIR
-FEDAI
-Select corporates
3 April 04 2019 RBI Mumbai -Shri G Padmanabhan Former Executive
Director RBI
-Dr V Anantha Nageswaran Dean IFMR
Chennai
-GIFT City IFSC
-National Stock Exchange Ltd
-BSE Ltd
4 April 23 2019 RBI Mumbai -Select FPIs (through audio conference)
5 May 14 2019 RBI Mumbai -Select FDIs (through audio conference)
6 May 31 2019 RBI Mumbai -Shri G Padmanabhan Former Executive
Director RBI
-FIMMDA
-CCIL
-IBA
7 June 20 2019 RBI Mumbai -Smt Shyamala Gopinath Former Deputy
Governor RBI
8 July 04 2019 SEBI Mumbai -Shri G Padmanabhan Former Executive
Director RBI
9 July 10 2019 RBI Mumbai -Smt Shyamala Gopinath Former Deputy
Governor RBI
109
Annexure VI
References
A Santaella Julio (2015) ldquoCurrency carry trades in Latin Americardquo Bank for International
Settlements BIS Paper No 81
Behera Harendra Kumar (2011) ldquoOnshore and offshore market for Indian rupee recent evidence
on volatility and shock spilloverrdquo Macroeconomics and Finance in Emerging Market Economies
Vol 4 No 1 March 2011 pp 43ndash55
Cadarajat Yayat and Lubis Alexander (2012) ldquoOffshore And Onshore IDR Market An Evidence
On Information Spilloverrdquo Bulletin of Monetary Economics and Banking April 2012
Capital Account Safeguard Measures in the ASEAN Context (2019) ASEAN Working Committee
on Capital Account Liberalisation Bank Indonesia Occasional Papers OP12019
Colavecchio Roberta and Funke Michael (2006) ldquoVolatility transmissions between renminbi and
Asia-Pacific onshore and offshore US dollar futuresrdquo BOFIT Discussion Papers Bank of
Finland Institute for Economies in Transition No16
Darbha Gangadhar (2012) ldquoA Tale of One Asset and Two Markets ndash Analysis of Dynamic
Interactions between On- and - Off Shore Marketsrdquo macrofinancenipfporginPDF13-
11sl_Darbha_NDFNimranapdf
DING David K Tse Y and Williams M The Price Discovery Puzzle in Offshore Yuan
Trading Different Contributions for Different Contracts (2012) Financial Management
Association International Conference Research Collection Lee Kong Chian School Of Business
Doukas J and H Zhang (2013) ldquoThe performance of NDF carry tradesrdquo Journal of International
Money and Finance vol 36 September pp 172ndash90
Goyal R R Jain and S Tewari (2013) Non deliverable forward and onshore Indian rupee market
a study on inter-linkages Reserve Bank of India Working Paper Series 112013 December
Guru Anuradha (2009) ldquoNon-Deliverable Forwards Market for Indian Rupee An Empirical
Studyrdquo Indian Journal of Economics and Business Vol 8 No 2 pp 245-260
Higgins Patrick and Owen F Humpage (2005) ldquoNondeliverable Forwards Can We Tell where
the Renminbi Is Headedrdquo Federal Reserve Bank of Cleveland September
Hutchison Michael Jake Kendall Gurnain Pasricha Nirvikar Singh (2009) ldquoIndian Capital
Control Liberalisation Evidence from NDF Marketsrdquo NIPFP Working Paper No 200960
110
Indira Gandhi Institute of Development Research (IGIDR) Finance Research Group (2016)
ldquoFeatures and trends of NDF markets for emerging economy currencies a study of the Indian
rupeerdquo IGIDR working paper March
Ishii Shogo İnci Oumltker-Robe and Li Cui 2001 Measures to Limit the Offshore Use of
Currencies Pros and Cons IMF Working Paper WP0143
Lipscomb Laura (2005) ldquoAn Overview of Non-Deliverable Foreign Exchange Forward Marketsrdquo
Federal Reserve Bank of New York May
Ma G C Ho and R McCauley (2004) The markets for non-deliverable forwards in
Asia BIS Quarterly Review June pp 81-94
Maziad Samar and Kang Joong Shik RMB Internationalization OnshoreOffshore Links (May
2012) IMF Working Paper No 12133
McCauley R C Shu and G Ma (2014) ldquoNon-deliverable forwards 2013 and beyondrdquo BIS
Quarterly Review March pp 75ndash88
McCauley RN Shu C (2016) ldquoNon-deliverable forwards impact of currency internationalisation
and derivatives reformrdquo Technical report Bank of International Settlements
McCauley Robert N and Scatigna Michela Foreign Exchange Trading in Emerging Currencies
More Financial More Offshore (March 2011) BIS Quarterly Review March 2011
Misra Sangita and Behera Harendra (2006) ldquoNon Deliverable Foreign Exchange Forward
Market An Overviewrdquo RBI Occasional Papers Vol 27 No3
Park Jinwoo (2001) ldquoInformation flows between non-deliverable forwards (NDF)and spot
markets Evidence from Korean currencyrdquo Pacific Basin Finance Journal Vol 9 (4) pp363-377
Ryoo Sangdai and Kwon Taeyong and Lee Hyejin Foreign Exchange Market Developments
and Intervention in Korea (October 2013) BIS Paper No 73o
Sarwono Hartadi A (2005) ldquoIndonesian policy on non-residentsrsquo participation in the money
market the restriction of rupiah transactions by non-residents and foreign currency credit offered
by banks to non-residentsrdquo BIS Paper No 23
Standing Council on International Competitiveness of the Indian Financial System (2015)
International competitiveness of currency equity and commodity derivatives markets Department
of Economic Affairs Ministry of Finance
Wang Kai-Li Fawson Christopher and Chen Mei-Ling (2007) ldquoInformation Flows among
Exchange Rate Markets What Do We Learn From Non-Deliverable Forward Markets in Asiardquo
Chaoyang University of Technology October
111
Watanabe K H Akama and J Mifune (2002) ldquoThe effectiveness of capital controls and
monitoring the case of non-internationalisation of emerging market currenciesrdquo EMEAP
Discussion Paper January

8
Preface
Offshore markets in a non-convertible currency usually referred to as non-deliverable forward
(NDF) markets enable trading of the non-convertible currency outside the influence of the
domestic authorities These contracts are settled in a convertible currency usually US Dollars as
the non-convertible currency cannot be delivered offshore Historically NDF markets evolved for
currencies with foreign exchange convertibility restrictions and controlled access for non-
residents beginning with countries in South America like Mexico and Brazil and thereafter
moving on to emerging Asian economies viz Taiwan South Korea Indonesia India China
Philippines etc Apart from enabling trading in non-convertible currencies NDF markets have
also gained in prominence because of onshore regulatory controls and their ease of access
Reserve Bank has been guided by the objective of developing a deep and liquid on-shore foreign
exchange market that acts as a price setter globally With regard to non-resident entities having
legitimate exposure to the Rupee the focus of policy efforts has been to align incentives for non-
residents to gradually move to the domestic market with adequate safeguards to ensure the
external stability of the value of the Rupee
The sharp growth in the offshore trading volumes in the Rupee NDF market in recent years likely
even beyond the volumes in the onshore markets have raised concerns around the forces that are
determining the value of the rupee and the ability of authorities to ensure currency stability This
necessitates a deeper understanding of the causes underlying the growth in those markets and
identification of measures to reverse the trend
The Task Force on Offshore Rupee Markets was set up to address that concern It was mandated
to study the factors attributable to the growth of the offshore Rupee market its effects on the Rupee
exchange rate and onshore market liquidity and formulate measures to redress the concerns The
Task Force was also charged to examine the role if any that International Financial Services
Centres (IFSCs) can play in addressing these concerns
During its term the Task Force interacted with a wide variety of stakeholders including banks
financial institutions industry bodies foreign portfolio investors asset managers and
academicians
9
I trust that the Reserve Bank of India will find the recommendations made in the report useful
Usha Thorat
Chairperson
10
Executive Summary
The origin of the NDF markets may be traced back to the 1990s when a wave of capital account
liberalisation in emerging market economies (EMEs) triggered a surge in capital inflows to these
economies and consequently heightened the currency risk faced by foreign investors Under-
developed domestic markets especially the market for financial derivatives as well as controlled
access to onshore markets raised the demand for a currency market outside the reach of local
regulations Another trend that supported the growth of the NDF market was the sharp rise
globally in the size of derivatives markets in the 1980s and 1990s As derivatives markets evolved
the speculative search for underlying moved out of the developed world into more esoteric assets
Following the successful speculative attack on the Sterling in 1992 EME currencies became viable
subjects for such speculative positioning Such activity becomes particularly noticeable during
times of stress as offshore risk spills over to the domestic exchange rate through entities that have
a presence in both onshore and offshore markets usually global banks but also corporates
A study of the degree and direction of such spillovers is important to understand the role of NDF
markets and assess policy alternatives The econometric study conducted by the Task Force
observed that the influence between offshore and onshore exchange rate goes both ways in normal
times that is it is bidirectional The study also observed that during the last two stress episodes
(the taper tantrum and the 2018 emerging markets crisis) the relationship turned unidirectional
with the NDF market driving onshore exchange rate The study concludes that as NDF volumes
have increased they have begun to play an important role in both price discovery and driving
volatility particularly during heightened uncertainty period The study also shows that periods of
divergence are limited and the markets converge and that too fairly rapidly
Against this backdrop and in the light of available information results of the statistical analysis
and most importantly based on the feedback received during the various consultations the Task
Force is making following recommendations in accordance with the terms of reference
i Onshore market hours may be suitably extended to match the flexibility provided by the
offshore market and thereby incentivize non-residents to hedge in the onshore market
ii Banks may be allowed to freely offer prices to non-residents at all times out of their Indian
books either by a domestic sales team or by using staff located at overseas branches
11
iii Non-deliverable Rupee derivatives (with settlement in foreign currency) may be allowed
to be traded in the IFSC and IBUs may be allowed to deal in such derivatives with a distinct
FCY-INR position limit To start with exchange traded currency derivatives involving
Rupee may be introduced and with experience non-deliverable OTC currency derivatives
involving Rupee may be allowed subsequently
iv While requirement of underlying exposure will continue for trading in the onshore market
users may be allowed to undertake positions up to USD 100 million in OTC as well as
exchange traded currency derivative market without having to establish the underlying
exposure
v The TF endorses the principle-based regulatory approach adopted in the draft regulation
on hedging by non-residents released by the RBI on February 15 2019 Also back-to-back
hedging by non-residents proposed under these draft regulations is endorsed Further in
case of hedging of anticipated exposures gains from cancellation of contract may be
allowed to be passed on even in cases where there are no cash flows at the discretion of
the bank where the bank considers the cancellation of underlying cash flow is due to
external factors which are beyond the control of the user
vi For ease of entering into hedge transactions for non-residents the TF recommends
a Establishment of a central clearing and settlement mechanism for non-residentsrsquo
deals in the onshore market
b Implementation of margin requirement for non-centrally cleared OTC derivatives
in the onshore market at the earliest
c Allow Indian banks to post margin outside India
d Wider access to FX-Retail trading platform to non-residents
vii A technology-based solution may be explored to centrally aggregate the investments of
non-residents and derivative contracts entered into by them in the onshore market (both
OTC and exchange traded) using LEI or any other unique identifier to start with
viii The issue of taxation in respect of foreign exchange derivative contracts may be examined
with the objective of overcoming gaps between tax regime in India and other major
international financial centres to the extent possible
ix KYC registration may be centralized across the financial market with uniform
documentation requirement
12
Chapter 1
Introduction
Currency is a component of sovereign money which is legal tender issued by the state The
external value of the currency the exchange rate is one of the most important economic and policy
variables which affects economic incentives and activity The exchange rate is determined mostly
by market forces of supply and demand which influence its flows across international borders
The exchange rate has critical information value in guiding financial and economic decisions
which affect real economic variables The stability and predictability of the exchange rate also has
a critical influence on growth and financial stability
Cross-border trade in goods services and assets (or capital) necessitates exchange of one currency
into another and can be thought of as the primary reason why currency markets exist However
as in any other financial market speculative elements ndash who take positions not for settling any
underlying transactions but for benefitting from market movements ndash are important participants
who perform the function of imparting depth to the market The aggregate actions of all
participants ndash hedgers arbitrageurs as well as speculators - determine the value and fluctuation of
the exchange rate
The currency markets for rupee especially for exchange against the USD are fairly well-
developed today One can classify these markets in three categories (a) spot versus derivatives
(b) over-the-counter (OTC) versus exchange-traded and (c) onshore versus offshore Further
derivatives can be cash-settled or delivery-based The most commonly referred benchmark
exchange rate of the rupee is from the onshore spot OTC market Similarly the commonly referred
forward exchange rate of the rupee is from the onshore forward OTC market Rupee futures and
options are traded in some onshore as well as offshore exchanges
The classification of currency markets can also be in terms of the nature of contracts between
buyers and sellers - spot forwards (futures on exchanges) and options contracts A spot contract
is for standard settlement ie the second working day after the date of transaction whereas in
case of forwards and futures (as well as options) the actual exchange or delivery of currency takes
place in the future at a date later than the spot settlement date There are also non-deliverable
forward contracts which are discussed below Forward and futures contracts are used as a risk
management tool or to hedge against possible adverse fluctuation in exchange rates It is important
13
to note that hedging implies risk transfer between the contracting parties it is not elimination of
risk
The category of the currency market that forms the focus of this report is the Offshore Rupee
markets The dominant segment of this market is the Non-Deliverable Forward (NDF) market ndash
wherein foreign exchange forward contracts are traded in the OTC market at offshore locations
generally the International Finance Centres (IFCs) like Singapore Hong Kong London Dubai
and New York These contracts do not involve a physical exchange of Rupees as Rupee is not
deliverable offshore and allow counter-parties to settle profit or loss in a convertible currency
usually the US Dollar which is why it is called a non-deliverable market NDF contracts are
usually traded on currencies which are not readily available to trade globally or outside of
sovereign boundaries These are thus mainly currencies from countries which have partial or no
capital account convertibility
There are also a few exchange-traded offshore rupee markets dealing in rupee futures and options
in Chicago Singapore and Dubai Volumes in these markets have typically been far smaller in
comparison to the offshore NDF OTC market Data on transactions in exchange-traded currency
markets can be ascertained with greater certainty whereas data on transactions in offshore OTC
NDF market have to be gauged through surveys and the estimates on the same are less firm
Why do NDF Markets Exist
NDF markets are not a phenomenon peculiar to the Indian Rupee they are common for currencies
of many emerging market economies (EMEs) As per BIS data NDFs in six currencies ndash Korean
Won Indian Rupee Chinese Renminbi Brazilian Real Taiwanese Dollar and Russian Ruble ndash
account for about two-thirds of the trade in NDFs globally The total daily average volume in NDF
markets is about USD 200 billion as per Bank of International Settlements (BIS) survey1 As per
this survey the share of India was about 1822 per cent of the trade in NDFrsquos globally (see Table
2 Chapter 2) The 2016 BIS survey (the next one will be released in the later part of 2019) showed
that offshore trades in Indian rupee were more or less equal to deliverable onshore forwards
1 2016 Triennial Central Bank Survey of Foreign Exchange and OTC Derivatives Markets
14
around $16 billion daily The 2018 Bank of England reported $23 billion in offshore rupee trades
while RBI sources estimate deliverable daily onshore forwards at $21 billion for 20192
The size of an open economy is one of the primary determinants of international participation in
its currency If international participants do not have direct access to the on-shore currency market
to meet their transaction needs or to hedge their currency exposure they are likely to use the
offshore NDF market The size depth and liquidity of the offshore NDF is thus indicative of the
non-resident interest in an emerging market economy
To some extent the offshore NDF market complements the need for a deep and liquid onshore
currency market What is the appropriate size of the forex market for an emerging market
economy with partially open capital account is determined by its size the share of foreign trade
and appetite for capital flows One proxy for estimating how large the forex market ought to be is
the GDP of the economy A better estimate could be the size of the open economy the trade and
investment sector
As Indiarsquos economy has grown over the past two and a half decades it has seen a significant rise
in openness (ie trade to GDP ratio has grown from 15 in 1990 to 43 in 2018) and in cross
border capital flows This has commensurately raised non-resident interest in the Rupee whether
for risk management purposes or for speculative ends The growing size of the Rupee NDF market
points to a need to widen participation in on-shore markets
The existence and size of offshore NDF markets is also a function of the degree of difficulty that
participants in foreign exchange market (especially non-residents) ndash both speculators and other
participants with requirements arising from cross-border trade transactions ndash face in accessing the
onshore markets The difficulties in accessing onshore currency markets could span a variety of
issues including the following
bull Restrictions on foreign exchange transactions
bull Cumbersome documentation and Know-Your-Customer (KYC) requirements for
participants in the domestic market
bull Restrictions on market participants (especially non-residents) in hedging activities such as
transaction limits tenor limits other documentation etc
bull Restrictions on cancellation and re-booking of contracts
2 For comparison with offshore market the onshore data includes forwards and swaps
15
bull Restrictions on the kind of derivative products that are allowed by market regulators and
bull Inconvenient market hours for those in other time zones
These constraints exist either to curb excessive speculation or to maintain financial stability
Are Offshore Rupee Markets a Problem
When the offshore market volume is significant or larger than the onshore currency market
volume as is the case with many EME currencies it leads to two fragmented markets wherein the
price discovery on the onshore market becomes vulnerable to influences from the price discovery
in the offshore market Empirical evidence (see Chapter 3) shows that while at most times the
direction of the influence runs both ways ie from onshore market to offshore market and vice-
versa the direction of the influence is more dominant from offshore market to the onshore market
in times of high volatility This could happen especially when tidal forces from global financial
markets influence the currency markets in a synchronised manner such as during times of
Emerging Markets (EM) currency crises
There are essentially four issues with regard to offshore market that are critical for regulators ndash
i Effectiveness of exchange rate management Many central banks including the Reserve
Bank have exchange rate stability as one of their objectives and resort to market
intervention or other regulatory measures to control volatility of the exchange rate from
time to time Such influence however extends only to the onshore currency market
Presence of a large offshore market dilutes the effectiveness of the exchange rate
management by the central bank It also hinders the pursuit of the objective of financial
stability in the domestic market
ii Disjointed price discovery During periods of volatility in the currency market when
price discovery in the offshore market causes large movements in onshore currency
markets the onshore market could often open with a large gap over the previous close For
resident market participants who want to cover their positions such gaps expose them to
significant risk
iii Revenue loss Every unit of turnover in a market earns a certain revenue for the market-
making financial firms Thus turnover in the offshore market can be viewed as a potential
revenue loss for domestic financial firms and the domestic economy
16
iv Effectiveness of RBI regulations on capital account management RBIrsquos policies on
capital account have been geared towards managing the impossible trinity a ldquomanagedrdquo
exchange rate free capital movement and an independent monetary policy RBI policies
have been geared toward avoidance of undue volatility in foreign exchange markets by
having restrictions on cancellation and rebooking and excessive risk-taking by resident
entities including corporates With this objective RBI restricts participation of resident
entities in currency derivatives to the extent of their underlying exposures A large market
outside the influence of regulatory authorities undermines their effectiveness
Constitution of the Task Force
Against this backdrop it was announced in the Statement on Developmental and Regulatory Policy
dated February 7 2019 the setting up of a Task Force on Offshore Rupee Markets Accordingly
a Task Force headed by Smt Usha Thorat was constituted with following terms of reference
i Assess the causes behind the development of the offshore Rupee market
ii Study the effects of the offshore markets on the Rupee exchange rate and market liquidity
in the domestic market
iii Recommend measures to address concerns if any arising out of offshore Rupee trading
iv Propose measures to generate incentives for non-residents to access the domestic market
v Examine the role if any International Financial Services Centre (IFSC) can play in
addressing these concerns
vi Any other relevant issue(s) the Task Force considers relevant to the context
The Task Force comprises of the following
i Smt Usha Thorat former Deputy Governor Reserve Bank of India ndash Chairperson
ii Shri Anand Bajaj Joint Secretary Department of Economic Affairs Ministry of Finance
Government of India ndash Member
iii Shri G Mahalingam Whole Time Director Securities amp Exchange Board of India ndash
Member
iv Shri Ajit Ranade Chief Economist of the Aditya Birla Group ndash Member
v Shri Sajjid Chinoy Chief Economist India JP Morgan India ndash Member
17
vi Shri Surendra Rosha CEO India HSBC Bank ndash Member
vii Shri Rajiv Ranjan Adviser-in-charge Department of Economic Policy and Research
Reserve Bank of India ndash Member
viii Shri T Rabi Sankar Chief General Manager Financial Markets Regulation Department
Reserve Bank of India ndash Member Secretary
Approach of the Task Force
Among the different issues relating to offshore markets the argument concerning revenue loss is
perhaps the most simplistic and an obvious response could be for India to develop non-deliverable
Rupee derivative market in an International Finance Service Centre (such as the GIFT City) located
within the geographical boundary of India However such a market will be virtually no different
from the markets located in Singapore or London and hence the objective of bringing volumes to
the onshore market will remain unaddressed
From the standpoint of addressing the concerns arising out of the existence of large offshore
markets it would make sense to incentivise movement of as much currency market transactions
from such markets to onshore currency markets as possible However theoretically one needs to
recognise that there is a trade-off between the sizeprominence of the offshore market and the
extent of regulationsrestrictions that are placed on cross-border transactions and foreign exchange
marketsparticipants It is also important to note that even if all non-residents with underlying
exposure move their hedging transactions to onshore markets offshore markets would continue to
exist to meet the demand of participants who take a view on the exchange rate without any
underlying exposure ie the speculative demand
At one extreme of the above-mentioned trade-off if India opts for a full rupee convertibility ndash by
removing all restrictions on current and capital account transactions ndash along with removal of all
restrictions on currency derivatives then offshore markets would no longer be a relevant concept
Capital account convertibility has been a hotly debated issue in the discourse on public policy both
in India and globally The received consensus in the last couple of decades endorsed by the
International Monetary Fund (IMF) in 2012 is that while capital flows are an important aspect of
the international monetary system providing significant benefits for countries they also carry risks
for macroeconomic and financial stability especially if they are large and volatile and thus pose
a challenge for policy Hence capital flows management measures are justified to help harness the
18
benefits while managing the risks More generally some restrictions to the capital account are
necessary for India to avoid the ldquoimpossible trinityrdquo With an economy as large and diverse as
Indiarsquos which is therefore expectedly not completely synchronous to the global cycle retaining
the independence of monetary policy is imperative Similarly having some control over the
exchange rate is necessary given its occasional propensity to be excessively volatile and overshoot
with attendant feedback loops to the macro-economy Therefore capital flow management
measures become necessary to avoid the trilemma and ensure simultaneous fulfilment of the other
two objectives Based on this received consensus as well as the experiences of some emerging
market economies through the last two decades the Task Force has proceeded on the basis that
the existing framework of capital account management followed by the Government and the RBI
will continue
There is also the issue of de-jure capital account convertibility Even when speculators
arbitrageurs and traders do not have direct access to forex markets to exploit persistent interest rate
differentials or perceived mispricing of the currency there are alternative channels available in
the system which make the actual arbitrage opportunities much lower Some examples of such
instruments is the Overnight Indexed Swaps (OIS) market or the use of Mumbai Interbank
Forward Offer Rate (MIFOR) Hence the de-jure level of capital account convertibility (CAC)
could be much higher than implied by the existence of capital controls
A related issue is the internationalisation of rupee According to McCauley (2011) a currency is
internationalised when market participants ndash residents and non-residents alike ndash conveniently use
it to trade invest borrow and invoice in it Based on the experience of China to internationalise
Renminbi and the evidence of the narrowing of the gap between onshore forward rate and NDF
rates for Renminbi internationalisation of currency has been sometimes advocated as a way to
reduce the influence of offshore markets While one has witnessed issuance of rupee-denominated
bonds (ldquoMasala Bondsrdquo) in some offshore markets in the recent past internationalisation of rupee
is still a distant goalpost given the persistent current account deficit and the negative net
international debt position Thus internationalisation of rupee is not an explicit goal guiding the
recommendations of the Task Force
Further the Task Force believes that Indiarsquos approach to the trade-off between deregulation of
currency markets and tolerance of offshore market must be shaped by the specific considerations
of the Indian economy rather than following any global template blindly
19
Compared to countries like Korea Taiwan or China Indiarsquos macroeconomic structure is
significantly different India is a structurally an economy with twin deficits ndash both fiscal and
current account Nearly half of Indiarsquos consumer price index (CPI) basket comprises of food items
making Indiarsquos inflation more vulnerable to supply shocks Although Indiarsquos macroeconomic
stability has improved considerably in the last few years considering the above factors the Task
Force feels that India cannot risk macroeconomic instability through potential exchange rate
shocks by drastically lifting the restrictions on foreign exchange markets and participants
On the other hand large volumes in the offshore market also reflect the fact that the interest in
Rupee is far larger than what is evident in onshore currency markets This reflects the growing size
of the Indian economy greater role of India in the global economy and growth in trade and capital
flows Over time therefore it would be imperative for the Indian regulators to take steps to expand
the role of onshore currency markets gradually lest the disjointed price discovery issue flares up
more frequently and in larger degrees
The balanced approach of the Task Force therefore is to look at each of the difficulties faced by
market participants in accessing onshore currency markets and prioritise their resolution in such a
way that prudent regulatory considerations are least compromised For instance certain market
micro-structure issues (such as extending the market hours of onshore currency markets) can be
addressed relatively quickly without any regulatory compromise On issues related to
documentation and KYC requirements smart application of ease-of-doing-business principles
needs to be followed Economic entities which need to undertake hedging of their foreign exchange
exposure on account of genuine underlying exposures need to be given greater flexibility in
undertaking such transactions in domestic currency markets While the need for underlying
exposure in order to operate in the forward markets cannot be eliminated the way in which it is
evidenced and monitored can be simplified The Task Force has proceeded on the basis of the
existing principles of regulations of foreign exchange markets
Of course the Task Force recognises that the recommendations will not do away with the
economic imperatives for which trading of rupee forward contracts exists in offshore markets
With our recommendations the Task Force believes that regulatory concerns arising out of the
offshore markets can be reduced though not eliminated
The Task Force held nine meetings between March 2019 and July 2019 The details of the meetings
are given in Annex V
20
Chapter 2
The Evolution of NDF Markets and Cross-country Experience
The foreign exchange market in India during 1970s and 1980s was heavily controlled and closed
in nature with various kinds of restrictions in place The Indian foreign exchange market started
deepening with the transition to a market-determined exchange rate system in March 1993 and the
subsequent liberalisation of restrictions on various external transactions leading up to current
account convertibility under Article VIII of the Articles of Agreement of the International
Monetary Fund in 1994 Notwithstanding various measures taken to further deepen and broaden
the foreign exchange market in India various restrictions are still in place to limit market access
to only those with underlying exposure and prevent undue speculation As India gets increasingly
integrated with the global markets and the exchange rate is increasingly market determined a
combination of capital flows management measures and currency trading restrictions in the on
shore markets are used to manage the lsquoimpossible trinityrsquo external value of the rupee These
measures and restriction are under constant review to ensure that the overall objective of growth
through foreign trade and investment are served
Against this backdrop this chapter attempts to highlights evolution in section II a brief review of
literature on the reasons behind increase in turnover in NDF market in Asian countries has been
given in Section III Section IV highlights the developments in NDF market The country
experiences such as nature of restrictions on non-residents operating in domestic currency
forwards market liberalisation measures taken by countries and its impact in curbing offshore
market discussed in Section V
I Introduction
NDFs are foreign exchange derivative instruments on non-convertible or restricted currencies
traded over the counter (OTC) mainly at offshore centres ie outside the direct jurisdiction of the
respective national authorities It is essentially a forward contract with different settlement process
Unlike the standard forward contract which involves exchange of underlying currencies on
maturity the NDF contract is typically settled as the difference between an exchange rate agreed
months before and the actual spot rate at maturity in an international currency (deliverable) mainly
the US dollars And the other currency which is usually emerging market currency is non-
21
deliverable The settlement of the transaction is not by delivering the underlying pair of currencies
but by making a net payment in a convertible currency equal to the difference between the agreed
forward exchange rate and the subsequent spot rate (Ma et al 2004) NDF contracts can either be
traded over the counter market or at exchanges at offshore financial centres such as Hong Kong
Singapore and London Lately they have become popular derivative instruments catering to the
offshore investorsrsquo demand for hedging arbitraging and speculating including by those who look
upon currency as an asset class
The major participants in NDF market could include foreign businesses and investors doing
business in countries with complex requirements for hedging currency risk in the local markets
arbitragers who have access to both on shore and offshore markets pure speculators like hedge
funds and others who take positions in the NDF market While these are the end users there are
also market intermediaries like banks dealers and brokers who provide quotes for trading in these
currencies and custodians who provide settlement arrangements While the multinational
companies deal in both the long and short end of the market the short end of the market is
particularly dominated by the hedge funds (Misra and Behera 2006) The pricing is influenced by
a combination of factors such as interest rate differential between the two currencies supply and
demand future spot expectations foreign exchange regime and central bank policies
NDF market primarily evolved in response to under-developed onshore forward markets and
limited access to non-residents to currencies with foreign exchange convertibility restrictions An
important advantage that enhances the demand for NDF is reduced credit risk compared to onshore
counterparts since there is no exchange of principal and only the difference amount is settled thus
allowing investors to circumvent limits associated with onshore activity Other reasons which also
favoured the emergence of NDF market includes convenience of time zones location of customer
business operating from a global treasury for multinational companies short-trading hours in
onshore forex market capital controls by individual central banks position limits frictions like
registration norms and know your customer norms frequent and significant changes in regulations
and guidelines in the domestic exchanges and OTC markets Moreover credit risk is also less
relevant since mostly large foreign banks are engaged as a counterparty in NDF trading Further
offshore centres in some cases are better placed to offer competitive services compared to the
22
onshore market on account of various factors ranging from tax treatment less onerous regulations
and documentation to operational efficiency
II Evolution of NDF Markets
The origin of NDF market traces back to the 1990s when a wave of capital account liberalisation
in emerging market economies (EMEs) triggered surge in capital inflows to these economies and
consequently increased currency risk faced by the investors However under-developed domestic
forward market or restricted access to onshore forward market paved the way for evolution of NDF
market as an alternative hedging tool to these investors The widely shared concern amongst local
monetary authorities was that easy access to onshore market and availability of domestic currency
to non-residents will encourage speculative activity leading to greater exchange rate volatility and
eventually the loss of monetary control Consequently some international banks began offering
NDF contracts to meet the demand of investors willing to hedge their EM currencies exposure
during early 1990s (Higgins and Humpage 2005)
One of the earliest NDF market developed during early 1990s was in Mexican peso to speculate
on the currency ahead of the devaluation from its then fixed exchange rate against the US Dollar
The increase in trading turnover during that time was facilitated by the entrance of voice brokers
as intermediaries between inter-bank trading activities (Lipscomb 2005) The NDF market for
some Asian economies like Korean Won Taiwanese Dollar Indian rupee and Chinese Renminbi
existed since mid-1990s due to either restricted or no access to onshore forward markets by non-
residents (BIS 2004) In case of New Taiwan Dollar only onshore entities had access to onshore
markets while it was subjected to underlying requirements in case of Korean Won Indian rupee
and Chinese Renminbi For other currencies like Indonesian rupiah NDF market evolved after
the Asian financial crisis in response to re-imposition of capital restrictions which were liberalised
in early 1990s In Indonesia rapid liberalisation beginning as early as 1970s and further
internalisation of Indonesia rupiah enabled the development of deliverable offshore market for
rupiah Following the currency crisis initial measures were directed at curbing non-trade and
investment related forward transactions with non-residents and broader measures prohibiting
banks from extending loans conducting derivative transactions and transferring rupiah to non-
residents were introduced in early 2001 While Malaysia also imposed cross border restrictions
23
after the crisis evolution of NDF market in Ringgit was initially inhibited by comprehensiveness
of regulations as well as its effective enforcement by the authorities (Ishii 2001)
McCauley (2011) showed that as income per capita rises a currency trades in ever greater
multiples of the home economyrsquos underlying international trade (ldquofinancialisationrdquo) and trades to
an even greater extent outside its home market (ldquointernationalisationrdquo) The increasing economic
interest in emerging market economies as a result of upbeat growth scenario from 2000s spurred
greater participation in currencies of these economies (Chart 1) In this context increasing turnover
in the Indian rupee Chinese Renminbi and other Asian currencies like Indonesian rupiah
Malaysian Ringgit Korean Won and New Taiwanese Dollar is consistent with increased
investment in these economies amidst restricted access to onshore markets Both India and China
recorded phenomenal growth rates translating into increased businesses (trade and investments)
with rest of the world and resulting exposures facilitated offshore trading of their currencies (Chart
2 a amp b) During 1990s mostly non-residents with genuine exposure used NDF market to hedge
their exposures in Indian rupee However with the development of onshore market providing
reasonable hedging facilities to foreign investors amidst gradual relaxation of controls most of the
market activity seems to be driven by speculators and arbitrageurs and those who are looking at
the rupee as a separate asset class to diversify their portfolios in view of its growing international
importance As a result the size of NDF market has grown over time In the Chinarsquos case the
emergence of offshore deliverables market for Renminbi (CNH) since 2010 was mainly due to
internationalisation of Renminbi which gradually substituted the NDF market
24
Chart 1 a amp b FX turnover Indexed 1998=100 and FX TurnoverTrade vs GDP
Source BIS Triennial survey IMF CEIC
Note Chart 1b A higher ratio of FX turnover to trade indicates that a currency trade in higher multiple
relative to its underlying trade as GDP increases
Chart 2 a amp b Gross trade Indexed 2000=100 and Gross trade vs FX turnover
Source IMF BIS World Bank
Both Indonesia and Malaysia have witnessed sharp increase in non-resident participation in local
currency bond market particularly in the aftermath of global financial crisis 2008 while these
countries local forward markets imposed restrictive conditions that restricted use of these markets
for hedging this led to the increased use of NDF market Non-resident ownership of government
debt in Indonesia and Malaysia as share of total outstanding government debt stood at 383 per
0
100
200
300
400
500
600
200
0
200
2
200
4
200
6
200
8
201
0
201
2
201
4
201
6
201
8
WorldAsiaEmerging and developing economiesAdvanced economies
0
1000
2000
3000
4000
0
200
400
600
800
1000
1200
1998 2001 2004 2007 2010 2013 2016
BRL IDR
CNY INR
MYR TWD
KRW right scale
Brazil
Korea
Indonesia
China
India
Malaysia
0
5
10
15
20
25
30
01 10 100 1000
GD
P p
er c
apit
a (U
SD
in t
ho
usa
nd
s)
FX turnover to trade (in log form)
Brazil
China
Indonesia
India
Korea Malaysia
Thailand
00
10
20
30
40
50
60
70
0 25 50 75 100 125 150
FX
turn
over
to
GD
P
External trade to GDP
25
cent and 243 per cent as at the end of March 2019 respectively highest amongst other Asian
economies However foreign participation in equity market is higher for Korea and Taiwan While
Taiwan has limits on investments in domestic bonds by non-residents foreign investors are not
subject to any investment ceiling for both aggregate and individual holdings in a listed company
except for a few restricted industries
Additionally the reason for growing NDF market could be increased carry trade activities for high
yielding currencies After examining the returns of carry trades with deliverable and non-
deliverable forwards Doukas and Zhang (2013) found that carry trades for currencies with NDF
contracts perform better compared to carry trades for currencies with deliverable forward
contracts This excess return is attributed to the compensation of risks emanating from currency
convertibility and capital controls For the Brazilian Real (BRL) derivatives offshore NDFs in
particular are the main vehicle for investors looking to implement carry trades (BIS Santaelaa
2015)
NDF market evolved mainly for emerging market economies witnessing increased economic
interest in the process of transition to high growth phase since 1990s whilst restrictions persisted
in accessing onshore markets for hedging currency risk arising out of these exposures The NDF
market also provided an opportunity to speculate on currencies which underwent notable shift in
their exchange rate regime During periods of global uncertainties like in 2013 during ldquotaper
tantrumrdquo the NDF market is used for speculative purposes arguably causing disruptions in
domestic forex market
III Size of the NDF market
Given that NDF is an over the counter (OTC) traded instrument the turnover data relies on various
surveys conducted by institutions at different time intervals In view of this issues like
comparability and continuity in data often arises However these surveys still provide useful
information to gauge the growth of NDF market over time Results from the semi-annual turnover
survey for the Foreign Exchange Joint Standing Committee chaired by Bank of England (BoE)
suggests that growth of NDF market has outpaced the forward market as well as overall foreign
exchange market In London the average daily NDF turnover surged to USD 139 billion as per
26
the latest survey in October 2018 from as low as USD 21 billion in 2008 During this period NDF
turnover quadrupled and its share increased to 53 per cent of overall forex turnover and comprised
nearly 34 per cent of both onshore and offshore forwards compared to nearly 10 per cent in 2008
Table 1 NDF trading in London (Average daily turnover in billions of US dollars)
NDFs All forwards NDF of all
forwards
All FX NDF as of all FX
Apr-08 23 200 115 1832 13
Oct-08 19 230 83 1699 11
Apr-09 16 162 99 1356 12
Oct-09 26 191 136 1522 17
Apr-10 25 186 134 1687 15
Oct-10 37 188 197 1787 21
Apr-11 42 192 219 2042 21
Oct-11 37 192 193 2038 18
Apr-12 36 192 188 2014 18
Oct-12 45 211 213 2017 22
Apr-13 60 265 226 2547 24
Oct-13 43 205 210 2234 19
Oct-14 62 304 204 2711 23
Apr-15 64 295 217 2481 26
Oct-15 54 253 213 2111 26
Apr-16 60 275 218 2225 27
Oct-16 62 292 212 2179 28
Apr-17 78 332 235 2401 32
Oct-17 90 330 273 2380 38
Apr-18 111 407 273 2727 41
Oct-18 139 409 340 2611 53
Source BIS London Foreign Exchange Joint Standing Committee
A similar survey is conducted by Hong Kong trade repository (HKTR) under the mandatory
reporting obligations imposed since July 2015 According to the HKTR survey daily average
27
NDF turnover in Hong Kong has also exhibited significant growth and daily average turnover
increased to USD 55-60 billion in 2018 from nearly USD 8 billion in 2015
The BIS publishes data on foreign exchange and derivatives trading activity every three years and
also prepare a separate report on NDF covering global market since 2013 The latest 2016 BIS
triennial survey reported that average daily turnover in global NDF market has increased by 53
per cent to USD 134 billion as compared to April 2013 Further NDF share in outright forward
and overall foreign exchange trading remained stable at 190 per cent and 26 per cent respectively
(Table 1) This is in contrast to the decline in average daily turnover in global FX markets to USD
51 trillion in 2016 from USD 54 trillion in 2013 survey conducted by BIS
The currency composition suggests that the Asian currencies dominate the NDF trading activity
with the highest turnover recorded by Korean Won as Korea generally has open capital account
and there are limits on non-residents borrowings in Korean Won from banks in Korea therefore
it is not deliverable offshore (BIS Survey 2016) Survey results from London Hong Kong and
Tokyo foreign exchange committees (FEC) as well as the BIS triennial survey points toward
increased NDF trading activity in Korean Won The Tokyo survey which is available from the
year 2006 suggest that the growth in NDF trading activity for Korean Won has shown significant
growth outperforming other major currencies The momentum in major currencies picked up ahead
of the global financial crisis 2008 before faltering during the crisis period owing to deteriorating
financial conditions Subsequently the NDF activity has deepened over time with the Indian rupee
and Brazilian Real constituting higher proportion of total global turnover after the Korean Won
as corroborated by the London survey also During the five-year period from 2008-13 the increase
in NDF turnover is largely consistent with the FX turnover in emerging market economies (BIS
2013)
Since 2013 greater demand for hedging in anticipation of monetary policy normalisation seems
to be the driving factor for increase in NDF activity given that lot of capital flows to emerging
markets was funded using low cost dollar liquidity (BIS 2013) The BIS 2016 survey identified
that developments associated with higher volatility in Renminbi during August 2015 and January
2016 has also boosted Asian NDFs even as trading activity in Renminbi NDF has faded
According to the BIS 2016 survey during 2013 and 2016 trading in Renminbi NDF contracted
by 394 per cent while that of Korean Won and Taiwanese Dollar expanded by 537 per cent and
28
299 per cent respectively The decline in the NDF activity for Indian rupee reflects the
depreciation of rupee against the US dollar however daily average turnover was up by 167 per
cent between 2013 and 2016 in unadjusted terms Hong Kong (HKTR) survey indicates continued
decline in NDF activity for Chinese Renminbi and Malaysian Ringgit (Table 2 and Chart 2 a amp b)
In case of China this was due to the Renminbi internationalisation policy followed after 2011
Table 2 Daily average turnover (USD billion) Spread
BIS 2013 BIS 2016
Oct- 2018
(London Survey) Bid-Ask (Latest)
NDF DF NDF DF NDF
DF
(Latest) Onshore Offshore
Chinese Renminbi 171 24 104 281 88 650 0001-0002 0003-0005
Indian Rupee 172 31 164 163 2303 214 001 002
Korean Won 196 11 301 145 295 300 010 030
Taiwanese Dollar 89 02 115 78 - 193 0005-0010 0010-0020
Brazilian Real 159 27 187 30 154 - - -
Russian Ruble 41 05 29 186 40 - - -
Source BIS London FEC BoK RBI China Foreign Exchange Trading Center Central bank of Taiwan HSBC
Note
1 DF= Deliverable forwards and include forwards and FX swaps traded onshore
2 Chinese Renminbi volumes on offshore segment are negligible after development of CNH market
3 BIS DF and DF (latest) are not directly comparable since latest numbers are taken from country sources
Chinese Yuan is for Jun-19 Indian rupee and Taiwanese Dollar is for Apr-19 Korean Won is for 2017
Chart 2 Average Daily Turnover and Change in Forex position of Asian Currencies
3 The corresponding figure for April 2019 stood at USD 28billion
0
100
200
300
400
500
US
DC
NY
US
DI
DR
US
DI
NR
US
DK
RW
US
DM
YR
US
DT
WD
Chart 2b Change in FX position of Asian
currencies (in USD billion)
29 January 2016 27 January 2017
31 January 2018 25 January 2019
0
200
400
600
800
1000
1200
Apr-
06
Apr-
07
Apr-
08
Apr-
09
Apr-
10
Apr-
11
Apr-
12
Apr-
13
Apr-
14
Apr-
15
Apr-
16
Apr-
17
Apr-
18
Chart 2a Average daily turnover USD
million
CNY INR IDR KRW
MYR TWD BRL
29
Source Tokyo FEC Hong Kong FEC
Based on latest surveys conducted by London and Hong Kong FEC which are major offshore
centres clearly it showed that the global NDF activity has surged led by Korean Won Indian
rupee Brazilian Real and Taiwanese Dollar The trend is likely to be validated by BIS 2019 survey
which encompasses global turnover and is due to release later this year
IV Review of Literature
In view of the noticeable rise in NDF activity with potential to engender distortions in local market
there exist varied literature on the emergence of NDF market and its spill-overs to onshore
counterparts One of the earliest attempts was made by Park (2001) which investigated the impact
of financial deregulation on relationship between onshore and offshore prices A key finding was
that Korean Won NDF influenced onshore prices after a shift to floating exchange rate regime
coupled with liberalisation of capital controls As part of liberalisation measures following the
Asian financial crisis in 1997 excessive regulations pertaining to foreign exchange market were
removed and measures were undertaken to improve efficiency of market by increasing liquidity
and broadening participation base (Chung et al 2000) Amongst these measures onshore entities
were allowed to participate in offshore market In this regard Lipscomb (2005) suggested that
transition to a more convertible exchange rate regime and permissible participation of onshore
counterparties in NDF transactions contributed to the increase in offshore liquidity which begets
liquidity in domestic market as well A classic example is Korean Won where both onshore and
offshore market co-exist with arbitrage opportunity exploiting any incipient price discrepancy
However NDF markets tend to disappear as the currency becomes fully convertible as stated
earlier
Wang et al (2007) also corroborated the finding that NDF market seems to be the driver for the
domestic spot market of Korean Won while the information flow is reverse for Taiwanese Dollar
where the spot market was found to have influence on NDF market Adding to this literature
Colaveccchio and Funke (2008) found Renminbi NDF to be the key driver of Asian currency
markets with varied degree of heterogeneity contingent on real and financial inter-linkages
Amongst the country specific study the one by Cadarajat and Lubis (2012) demonstrated that
Indonesia rupiah NDF tends to have influence on domestic spot and forward return
30
Studies by Hutchison (2009) Mihajek and Packer (2010) and McCauley and Scatigna (2011)
asserted that offshore trading becomes increasingly important with growing economic interest in
a particular currency amidst limited access to onshore markets and convertibility restrictions A
study by BIS (2013) analysed the directional impact for nine currencies including the Indian rupee
for the period 2005-13 along with separate analysis for 2008-09 crisis and May-August 2013 It
found the presence of two way causation for most currencies for the full sample period however
noted the increase in NDF influence during market stress Both the stress period saw noticeable
impact of NDF particularly during May-August 2013 with major exception of Malaysian Ringgit
where NDF played dominant role and there was no case of deliverable forward influencing NDF
In the Indian context the earliest study with regard to spill-overs impact was undertaken by Misra
and Behera (2006) They found onshore prices to have directional impact on NDF prices even as
volatility spillovers could exist from NDF to onshore market The subsequent research on this
subject during the period 2000-09 by Behera (2011) demonstrated the change in dynamics with
evidence of greater volatility spillover from NDF to spot market A similar finding was outlined
by Guru (2009) on the relationship between the NDF and onshore market for Indian rupee It is
argued that dynamics of relationship between onshore and offshore markets has undergone a
change with the introduction of the currency future market in 2008 and returns in NDF market
seem to be influencing the domestic spot as well as forward market
A study by Darbha (2012) finds that offshore markets plays an important role in price discovery
mechanism particularly in India and China Goyal et al (2013) after examining the period 2006-
13 found the existence of bi-directional relationship between onshore and NDF market for Indian
rupee over the long term however the directional impact turns one way from NDF to onshore
during periods of depreciating pressures ie movements in NDF markets drives adjustment in
onshore market when the currency is under depreciation pressures This asymmetric behaviour is
attributed to the fact that the Reserve bank intervenes in the foreign exchange market to stem
excessive volatility during periods of rupee depreciation
McCauley et al (2014) described two paths for evolution of the NDF markets The first one is
being followed by Chinese Renminbi which has become deliverable after the emergence of
offshore market The Indian rupee falls under the second where the NDF market has grown amidst
continued restrictions on foreign participation
31
The report of the Standing Council (Standing Council on International Competitiveness of the
Indian Financial System 2015 by Ministry of Finance Government of India enumerated factors
including capital controls position limits frictions like registration norms and know your customer
norms frequent and significant changes in regulations and guidelines in the domestic exchanges
and OTC markets as deterrent to foreign investors participation in the onshore market
IGIDR Finance Research Group (2016) made an important recommendation that domestic entities
should be permitted to participate in NDF market after outlining factors driving offshore activity
compared to onshore segment In respect of the internationalisation of rupee as one of the debated
recommendation Kumar and Patnaik (2018) argued the case for gradual internationalisation of
rupee on analysing the role of the Indian rupee in terms of official sector currency reserve currency
and trade invoicing currency
V Country Experience
China
The Chinese Renminbi (RMB) forward market can be segmented into offshore NDF market (since
1990s) an onshore Renminbi market (since 2007) and the CNH market (offshore deliverable) In
the current scenario RMB NDF has been gradually replaced by offshore deliverables after the
creation of CNH market since mid- 2010 as a by-product of promotion of international role of
RMB since 2009
Chinarsquos exchange rate regime has evolved from fixed to managed floating rates followed by
internationalisation of Renminbi (RMB) In early 1990s reforms started with the unification of
multiple exchange rate in 1994 and in 1996 China allowed the full convertibility of Yuan under
current account transactions Eventually the Peoplersquos Bank of China (PBoC) announced the
implementation of managed floating exchange rate against basket of currencies in July 2005
ending the dollar peg prevalent since 1994 Over the last decade Chinarsquos strong economic
performance and growing linkages with rest of the world prompted authorities to promote the
international role of RMB The idea of internationalisation of RMB gained prominence following
the financial crisis of 2008 which revealed the fragilities of dollar dominated global financial
system The thrust of early initiatives was RMB trade settlement premised on Chinarsquos deeper trade
32
links and its central role within Asiarsquos supply chain that supported the demand for its currency for
trade invoicing In this regard a pilot scheme permitting cross border trade settlement in RMB was
launched in 2009 which was widened to cover all current account transactions over the course of
next three years Capital account liberalisation was undertaken at a more gradual pace with the
Chinese RMB becoming officially deliverable at offshore centres in 2010 While Hong Kong
banks were permitted to accept RMB deposits as part of personal accounts in 2004 an important
milestone was the sign of Memorandum of cooperation between HKMA and PBoC in July 2010
which eliminated restrictions on Hong Kong banks in establishing Renminbi accounts and
providing related services ie payments and transfers in RMB to individuals and corporations
Moreover financial institutions were permitted to offer Yuan denominated products As a result
CNH (offshore Renminbi) began to trade actively amongst other range of products and prompted
investors to switch to deliverable market in place of NDF which was used previously Whilst CNH
can be transferred freely between offshore accounts transfer of RMB between onshore and
offshore is still confined to regulated channels to fend off potential adverse impact on onshore
markets Moreover these restrictions are skewed towards outflows form the mainland to offshore
centres
With Renminbi internationalisation the offshore CNH market has shown exponential growth
displacing the NDFs The BIS Triennial Survey showed significant decline in RMB NDF which
fell nearly 40 per cent between 2013 and 2016 driving its share in total RMB trading to 5 per cent
from 14 per cent earlier (BIS 2016) The rapid expansion of offshore market is clearly discernible
in rising FX turnover for CNH which has nearly doubled between 2013 and 2016 and forms around
67 per cent of the total RMB turnover Of the total CNH turnover average daily turnover in the
DFs in April 2016 was estimated to increase to USD 164 billion from USD 84 billion in 2013
(Table 3)
33
Table 3 RMB market turnover average daily turnover in USD billion
OTC
spot
OTC
FX
swaps
OTC
DFs
OTC
NDF Options Futures
OTC
currency
swaps Total
CNY
2013 201 105 26 0 03 0 0 335
2016 249 27 13 0 2 0 02 554
change 239 1565 -514 5693 651
CNH
2013 139 294 84
168 0 05 69
2016 427 59 164
158 03 25 1367
change 2079 1008 943 -56 5784 3836 981
NDF
2013
171
171
2016
104
104
change -394 -394
Source BIS
Since the inception of CNH pricing gaps tend to persist between onshore and offshore exchange
rates however it has narrowed over last couple of years This pricing gap arises on account of
different economic conditions in mainland China and Hong Kong amidst imperfect arbitrage
(Funke 2015) While central bank intervention can constrain the movement of CNY at onshore
centres CNH is more market determined and hence closely follows the global swings (Chart 3)
Since September 2015 PBOC has reportedly taken action in the offshore market when the
onshore-offshore gap was large (McCauley amp Shu 2018)
34
Source Bloomberg
Further liberalisation of the onshore FX market along with allowance of offshore deliverable
market has made the CNY NDF market almost non-existent despite maintaining the lsquoneed basisrsquo
principle Notwithstanding the existence of basis between CNY and CNH due to the band range
trading in CNY and market determined pricing in CNH the spread has been contracting over years
with ample liquidity available in onshore and offshore markets Further the creation of offshore
market has made various options available to offshore investors to both hedge their exposures on
underlying investments and also generate RMB risk in their portfolios via various products and
offshore deliverable market
Korea
With an average daily turnover of USD 30 billion as per the BIS survey 2016 and USD 295 billion
in the latest London survey of October 2018 Korean Won (KRW) NDF boasts of the most active
and liquid NDF market amongst most emerging market currencies Further permissible
participation of local banks in the NDF market ensures close integration of onshore and offshore
forex markets allowing for quick sentiment spillovers between the two markets Turnover in NDF
market is substantially higher than onshore forwards mainly on account of higher documentation
requirements for accessing onshore market In the onshore market average daily turnover was
reported at USD101 billion in 2017 for forwards which increased from USD 96 billion during
the previous year (Chart 4 a ampb)
-015
-01
-005
0
005
01
01-0
8-2
010
01-1
2-2
010
01-0
4-2
011
01-0
8-2
011
01-1
2-2
011
01-0
4-2
012
01-0
8-2
012
01-1
2-2
012
01-0
4-2
013
01-0
8-2
013
01-1
2-2
013
01-0
4-2
014
01-0
8-2
014
01-1
2-2
014
01-0
4-2
015
01-0
8-2
015
01-1
2-2
015
01-0
4-2
016
01-0
8-2
016
01-1
2-2
016
01-0
4-2
017
01-0
8-2
017
01-1
2-2
017
01-0
4-2
018
01-0
8-2
018
01-1
2-2
018
01-0
4-2
019
Chart 3 Gap between USDCNY and USDCNH
Offshore premium
35
Chart 4 Foreign Exchange Turnover and NDF market in Korea
Source Bloomberg Bank of Korea
Korea embarked on liberalisation reforms in 1980s however took big strides post Asian financial
crisis in 1997-98 in line with the IMF adjustment programme As part of these measures foreign
exchange transactions were liberalised which allowed the local banks to engage in NDF
transactions with non-residents Prior to this the development of the onshore currency derivatives
market was constrained by legal requirements such as any forward transaction had to be certified
as a hedge against future current account flows the so-called ldquoreal demand principlerdquo which also
spurred the development of a liquid offshore ldquonon-deliverablerdquo forward (NDF) market in the
Korean Won In 1999 as part of liberalisation measures this restriction was lifted and a lot of
activity moved onshore leading to the convergence of the offshore and onshore prices (IMF
2004) This resulted in sharp increase in NDF transactions between onshore banks and non-
residents for both hedging as well as speculative purposes Amidst likely possibility of turmoil in
foreign exchange market the central bank implemented regulations in January 2004 governing
Korean banks NDF positions with the non-residents directed at restraining any potential selloffs
However these restrictions were abolished in April 2004 as speculative activity was assessed to
have reduced significantly
KRW is almost a non-restricted currency provided the investor holds an Investment Registration
Certificate (IRC) issued by the Financial Supervisory Services (FSS) in Korea The IRC allows an
offshore investor to invest in onshore securities and provides near non-restricted currency rights
barring any holding of short selling position in onshore KRW account
191 18 183 175 20 194 196
7566 71 76
83 96 101
192198 196 19
192 184198
0
10
20
30
40
50
2011 2012 2013 2014 2015 2016 2017
Chart 4b Foreign Exchange Turnover
in Korea daily average USD billion
Spots Forwards Fx Swaps
-60
-50
-40
-30
-20
-10
0
10
20
30
12
-19
98
01
-20
00
02
-20
01
03
-20
02
04
-20
03
05
-20
04
06
-20
05
07
-20
06
08
-20
07
09
-20
08
10
-20
09
11
-20
10
12
-20
11
01
-20
13
02
-20
14
03
-20
15
04
-20
16
05
-20
17
06
-20
18
Chart 4a Onshore USDKRW-NDF 1M
USDKRW
36
For non-residents investors who do not hold IRS USDKRW remains a highly regulated market
Any onshoreoffshore transactions need to be approved by the appropriate authorities and must
have proof of underlying For multinational clients that repatriate dividends documentation with
proof of underlying must be in place Further ceilings are imposed on foreign exchange derivatives
transactions of foreign as well as local banks which came into existence as a prudential measure
to mitigate the adverse impact of volatile capital flows
Ahead of the 2008 financial crisis Korean economy experienced huge build-up of short-term
external debt led by foreign exchange derivatives positioning of banks on account of over-hedging
undertaken by Korean corporations as well as likely carry trades in anticipation of appreciation of
domestic currency Both these activities were funded using offshore dollar borrowing and posed
serious difficulties at the time of global dollar liquidity crunch during financial crisis With a view
to prevent recurrence of the any such episode triggered by volatile capital flows which resurged
from 2009 over-hedging was specifically prohibited and limits were imposed on Foreign
exchange derivatives activity of banks in relation to their capital Liberalization in KRW has been
continuing for decades with the last one completed in December 2007 whereby prior approval
requirements for some capital account transactions was abolished Even onshore participants can
freely participate in the NDF markets thereby providing onshore liquidity to Non-Residents as
long as the hedges are booked as NDF Essentially KRW is a fully convertible currency but is
only tradable on NDF basis offshore
Malaysia
Malaysia had liberal foreign exchange policies until Asian financial crisis with regard to cross
border transactions involving Malaysian Ringgit (MYR) Following the crisis offshore trading of
MYR was banned However grace period was notified for depositors to repatriate their offshore
deposits back to Malaysia and the adoption of fixed exchange rate policy in 1998 - a significant
move whilst imposing selective capital controls All these measures were intended at ceasing
offshore activity which contributed to the excessive pressure on currency despite relatively
stronger fundamentals Although Malaysia imposed cross border restrictions after the Asian crisis
evolution of NDF market in MYR was initially inhibited by comprehensiveness of regulations as
well as its effective enforcement by the authorities (Ishii 2001) Further absence of reference rate
37
for settlement of NDF contracts and stringent controls on domestic bank to undertake forward
foreign exchange transactions with offshore counterparties also hindered the development of NDF
market (EMEAP discussion paper 2002) As the economy began to recover capital controls were
gradually relaxed and finally the currency was floated in 2005
Generally Malaysia has opened up its domestic markets for non-resident investors with no
restrictions on non-residents investing in local bond markets except having to appoint a local
custodian Most of the sectors are open for non-resident portfolio equity flows as well in Malaysia
Over the years since 2005 non-resident investorsrsquo participation in the onshore market picked up
substantially reaching record high of 397 per cent of total outstanding government bonds from
nearly 14 per cent in 2005 and in the process contributed to the growth of NDF market as well
McCauley (2013) analysed the direction of influence for nine currencies in 2005-13 as well as
separately for the 2008-09 crisis and May-August 2013 Granger causality tests point to two-way
causation for most currencies for the full sample The exception is the Malaysian Ringgit where
the NDF influences the deliverable forward market The central bank expressed concerns over the
adverse impact of increased activities in the ringgit NDF market after wide gap was observed
between the NDF and onshore rate in 2016 following the US presidential election Bank Negara
Malaysiarsquos (BNM) Governor emphasised that ringgit NDF market is used by non-resident
investors mostly for speculative purposes rather than genuine demand for hedging As the NDF
trading activity intensified during volatile period in 2016 ringgit-denominated NDF implied much
larger depreciation which further exacerbated the then prevailing depreciating pressure on the
currency (Chart 5)
Chart 5 Onshore and Offshore market in Malaysia
Source Bloomberg
4141542
42543
43544
44545
455
Oct
-16
Oct
-16
Oct
-16
Nov
-16
Nov
-16
Nov
-16
Nov
-16
Dec
-16
Dec
-16
Dec
-16
Dec
-16
Dec
-16
Jan-1
7
Jan-1
7
Jan-1
7
Jan-1
7
Feb
-17
Feb
-17
Onshore USDMYR Offshore 1month NDF USDMYR
38
Assessing the overwhelming impact of NDF activities which has the potential to undermine
financial stability BNM took a number of measures in 2016 to eliminate speculative transactions
in order to ensure appropriate price discovery and orderly functioning of onshore market These
measures includes reinforcement of non-internationalisation policy for Ringgit steps to improve
the onshore pricing mechanism and deepen the domestic forex market After prohibiting banks
from quoting fixing orders used to settle offshore trades the central bank revised the methodology
to compute onshore reference rate to account for transacted deals from mid-2016 Further BNM
imposed a ban on ringgit NDF trading in November 2016 and reminded local banks that ringgit
remains a non-internationalised currency and therefore any offshore trading is not recognized At
the same time BNM strengthened its monitoring to ensure compliance to Foreign exchange
administration rules (FEA) rules by market participants on non-involvement in facilitating NDF
transactions Subsequently financial markets committee (FMC) instituted in mid-2016 laid down
a series of developmental measures for onshore market aimed at allowing better market access and
greater hedging facilities to market participants (Table 5)
Table 5 Developmental Measures Relating to Foreign Exchange Market
Jul-16 Dec-16 Apr-17
Adopting global best practices Rebalance onshore FX demand and supply
Additional FX risk
management practices
bull Transaction based KL
USDMYR reference rate
bull 25 retention of export proceeds in
foreign currency
bull Streamline passive and
dynamic hedging
flexibilities for
investors
bull Extension of official closing hour
for onshore Ringgit rate
bull Trade settlement among residents in
Ringgit only
bull Active hedging for
corporations
bull Streamline onshore and offshore
foreign currency investment limit
Promote FX risk management onshore
bull Active hedging below RM6t million of
net open position
bull Active hedging for institutional
investors
39
bull Expansion of appointed overseas office
framework
In an immediate impact reinforcement of restrictions on USD-MYR NDF market resulted in
significant outflows from local bonds in Malaysia However as a positive impact with the bout
of capital outflows following ban on NDF transactions composition of non-resident holdings has
shifted towards more stable and long-term investors thereby reducing the risk exposure to global
impulses Further the disruptive influence from NDF market subsided and onshore foreign market
continues to register higher average daily volume These measures have helped in increasing the
depth and liquidity of the foreign exchange market as evidenced by declining volatility and
narrowed bid-ask spreads in onshore market The decline in offshore volumes has resulted in
widened bid-ask spread (Chart 6 a amp b)
Chart 6 Malaysia Monthly FX forward volumes and Bid-Ask Spread
Source BNM Reuters and Bloomberg
-001
0
001
002
003
004
005
01
-10
-201
0
01
-04
-201
1
01
-10
-201
1
01
-04
-201
2
01
-10
-201
2
01
-04
-201
3
01
-10
-201
3
01
-04
-201
4
01
-10
-201
4
01
-04
-201
5
01
-10
-201
5
01
-04
-201
6
01
-10
-201
6
01
-04
-201
7
01
-10
-201
7
01
-04
-201
8
01
-10
-201
8
01
-04
-201
9
Chart 6b Bid-Ask spread
offshore bid-ask onshore bid-ask
0
10
20
30
40
50
60
70
80
90
0
5
10
15
20
25
30
Dec
-12
May
-13
Oct
-13
Mar
-14
Aug
-14
Jan-1
5
Jun
-15
Nov
-15
Apr-
16
Sep
-16
Feb
-17
Jul-
17
Dec
-17
May
-18
Oct
-18
Mar
-19
Chart 6a Monthly FX forward turnovers (in
USD billion)
Onshore FX forward Offshore FX forward RHS
40
Chart 7 Non-resident holdings of total government debt and Monthly FX turnover
Source BNM and HSBC
Indonesia
The development of NDF market in Indonesia Rupiah traces back to the year 2001 when Bank
Indonesia (BI) prohibited onshore banks from lending to non-resident accounts in an attempt to
reduce the speculative pressure on the Indonesian Rupiah (IDR) These restrictions paved the way
for development of offshore rupiah NDF market to cater to the demand of international investors
Prior to this an active offshore deliverable market existed for IDR following the pursuit of
liberalisation policies beginning as early as 1970s which allowed the IDR to be freely convertible
and at the same time permitted its internationalisation Consequently the international use of
rupiah increased but was confined mostly to financial transactions mainly due to limited invoicing
of trade-related transactions in IDR terms This easy access to rupiah from onshore centres due to
internationalisation allowed non-resident to speculate on the currency during the 1997 crisis in
Asian countries As a result of heightened activity in times of stress exchange rate volatility
increased making it difficult for the central bank to maintain stability of rupiah In response to the
crisis the currency was freely floated replacing the intervention band but weakness in the currency
and high volatility continued to persist compared to currencies of other Asian countries during the
first three years of its floating rate regime Taking cognizance of this disparity the central bank
began to evaluate the extant regulations relating to rupiah transactions with non-residents
Thereafter during the year 2001 the BI imposed extensive regulations limiting non-resident
143
397
243
50
100
150
200
250
300
350
400
450
Jan-0
5
Oct
-05
Jul-
06
Apr-
07
Jan-0
8
Oct
-08
Jul-
09
Apr-
10
Jan-1
1
Oct
-11
Jul-
12
Apr-
13
Jan-1
4
Oct
-14
Jul-
15
Apr-
16
Jan-1
7
Oct
-17
Jul-
18
Apr-
19
Chart 7a Non resident holdings as of total
government debt
-
500
1000
1500
2000
2500
3000
Jan-1
6
Apr-
16
Jul-
16
Oct
-16
Jan-1
7
Apr-
17
Jul-
17
Oct
-17
Jan-1
8
Apr-
18
Jul-
18
Oct
-18
Jan-1
9
Chart 7 Monthly onshore FX market
turnover (in billion of USD)
FX Spot FX Swap FX Forward FX Options
41
rupiah transactions and shrinking the pool of offshore rupiah funds with the potential to be used
for speculation identifying spill overs from offshore market as conduit of excessive volatility
In general Indonesia has opened up its domestic bond markets for non-residents completely with
no entryexit barriers except having to appoint a local custodian Foreign exchange hedging is
allowed only with underlying documentationasset in place for non-residents On the portfolio
equity investments regulation clearly provides that a listed company is exempt from any foreign
investment restrictions However there are sectoral restrictions on FDI in Indonesia which are
decided by BKPM (Investment Coordinating Board in Indonesia) which provides a DNI list
(Governmentrsquos negative investment list) The share of non-residents in Indonesia Government
Bonds has been increasing over years from a mere 1570 per cent of the total government bonds
in June 2009 to 3810 per cent in April 2019 (Chart 8)
Source HSBC
Research from BI in 2012 found disproportionate impact of NDF market to spot market during the
period 2008-11 Results suggests that there is evidence of unidirectional mean spill-over from NDF
to both spot and forward rupiah markets with an exception of Europe crisis On volatility spillover
the study obtained significant results from NDF market to spot market for entire period However
in crisis situation the study found interdependence between volatility in offshore NDF and onshore
spot rate changes while information transmission is only valid from NDF to forward rate changes
not the other way around (Cadarajat and Lubis 2012)
To reduce the unwarranted influence of NDF market on spot market BI took initiatives beginning
the year 2014 to bridge the gap between onshore and offshore rupiah rate In 2014 the central bank
381
150
200
250
300
350
400
450
Jun-0
9
Dec
-09
Jun-1
0
Dec
-10
Jun-1
1
Dec
-11
Jun-1
2
Dec
-12
Jun-1
3
Dec
-13
Jun-1
4
Dec
-14
Jun-1
5
Dec
-15
Jun-1
6
Dec
-16
Jun-1
7
Dec
-17
Jun-1
8
Dec
-18
Chart 8 Non-resident holdings as percetage to total Government
Debt
42
with the help of key offshore centre Singapore moved the foreign exchange rate fixing that is used
to settle the NDF contracts to the onshore market Earlier Association of Banks in Singapore
(ABS) and the Singapore Foreign Exchange Markets Committee (SFEMC) was publishing IDR
reference rate computed as weighted average of 1-month NDF trades done by then Singapore
based brokers Post March 27 2014 BI started publishing reference rate termed as Jakarta Inter-
bank Spot Dollar Rate (JISDOR) which was to be used to settle existing and new contracts Jakarta
Interbank Offered Rate (JIBOR) is more transparent in a way that it is based on actual transactions
being done in the inter-bank onshore market
In late 2018 BI in its efforts to further deepen the domestic foreign exchange market and to
mitigate IDR exchange rate risk BI established the Domestic Non-Deliverable market (DNDF)
for IDR It will serve as a parallel market to NDF with the key difference that it is rupiah settled
in onshore market This alternative tool will provide foreign investors additional avenues to hedge
their IDR exposure without principal exchange other than enhancing the central bankrsquos
intervention capabilities At this juncture the market is relatively new and hence significant impact
assessment of the same cannot be outlined However currently Indonesia has not been able to
move significant turnovers from offshore NDF to Domestic NDF market
Brazil
Brazilian Real is the second most actively traded currency in NDF market after the Korean Won
with an average daily turnover of USD 187 billion as per BIS and USD 154 billion according to
the London survey The growth and development of NDF market is attributed to the existence of
large and well developed foreign exchange futures market
The development of derivatives market in Brazil is attributed to the hedge culture that has been
prevalent due to periods of high and persistent inflation and exchange rate volatility amidst
political shocks During 1980s and early 1990s inflation was soaring above 100 per cent which
peaked over 2700 per cent in 1993 and thus promoted widespread indexation to manage the
inflation risks Subsequently the ldquoReal planrdquo which comprised of fiscal and monetary reform and
introduction of new currency helped to bring down inflation and stabilise the currency Amidst
stable macroeconomic conditions private sector was encouraged to borrow foreign funds at a
43
lower cost and the consequent surge in foreign indebtedness during 1994 to 1998 led the central
bank issue dollar denominated securities as a hedging instrument Following the currency crisis in
1999 the Brazilian Real was floated amongst adoption of new set of economic policies which was
also accompanied by providing unrestricted access to non-residents to financial markets (including
derivatives) in 2000
The distinguishing feature of Brazilian foreign exchange is the non-deliverable nature of
derivatives contracts without any significant limitations even though participation in deliverable
instruments ie spot outright forwards and foreign exchange swaps is constrained Only chartered
banks are authorised by the central bank to hold foreign exchange spot positions All these factors
have facilitated the growth of foreign exchange futures market over spot market which is closed
and highly restricted Against the backdrop of large and sophisticated foreign exchange derivatives
with high depth and liquidity foreign exchange futures prices have key influence on spot price as
suggested by various studies (Ventura and Gracia 2009 Kaltenbrunner 2010 and Chamon and
Gracia 2013) As pointed out by Kaltenbrunner 2010 the existence of a deep futures market has
made it possible for foreign banks with branches in Brazil to sell real offshore (NDF) and
simultaneously hedge their real exposure in the onshore futures market For the Brazilian Real
derivatives especially offshore NDFs are the main vehicle for investors looking to implement
carry trades (Santaelaa 2015)
Taiwan
The NDF market for Taiwanese Dollar (NTD) existed since 1990s and the central bank permitted
domestic and foreign legal entities to trade in NTD NDF market with authorised banks in 1995
This came after opening up of local securities market to foreign institutional investors (QFII) in
1990 which allowed FIIs meeting certain requirements to apply for investment in Taiwanrsquos stock
market Subsequently significant relaxations were made and security market was completely
opened up with the abolition of QFII scheme While onshore institutions were eligible for trading
in NTD NDF the central bank initially imposed limits on trading position in NTD NDF to one
third of their total foreign exchange position with a view to prevent speculative pressure
44
Following the Asian financial crisis in July 1997 the central bank introduced measures to regulate
NDF market with only authorized banks permitted to carry NDF trading with other authorised
counterparts and their overseas branches or headquarters This move came after the speculative
positioning which was believed to cause sharp depreciation of the NTD The central bank outlined
that although there was ceiling on NTD NDF trading positions some banks were engaged in selling
NDFs to foreign entities and simultaneously created long NDFs positions and shorted DFs with
domestic entities in a bid to offset the NDF trading positions on their balance sheets and thus
creating more room for further NDF trading (Bank of Taiwan Annual Report 2014) The central
bank has intervened in foreign exchange market to curb speculative activity also post 2008
financial crisis when emerging markets witnessed resurgence of capital flows The measures
introduced then by the central bank focused on reducing local banksrsquo foreign exchange positions
in both onshore and NDF markets including discouraging non-resident deposits by imposing
punitive reserve requirements with an intent to limit local banksrsquo capacity to provide liquidity to
NDF markets The National Supervisory Commission also took steps to limit non-resident
investments in local bank deposits and government securities
However recognising the dominance of foreign banks in NDF trading activity the central bank
announced that overseas branches of domestic banks are eligible to apply for NTD NDF business
from September 2014 In current scenario whilst there are no restrictions on the fixed income
investments in general but investments in localdomestic bonds by non-residents cannot exceed
30 per cent of their investments in equity instruments which has kept the investments in local
bonds low by non-residents who tend to take exposure in USD bonds issued by Taiwan offshore
Moreover ability for local banksrsquo to access the TWD NDF market up-to 20 per cent of each banksrsquo
net open position results in partial integration between onshore and offshore markets Since TWD
is not fully convertible any onshore spot transactions must be declared to the central bank and in
most cases require supporting documentation which keeps the differential between onshore and
offshore rate
To conclude cross county experience shows that increasing role of any economy globally is
accompanied by emergence of growing offshore trading of their currencies in the presence of
restricted access or cumbersome regulations Additionally emerging market economies cannot
afford to have unrestricted access to their onshore market as revealed by the studies of Indonesia
45
and Malaysia during the Asian crisis 1997 which exposed them to global impulses Most of these
countries have followed a gradual approach surrounding non-resident access to their forex markets
As emerging markets open up and become sophisticated in respect of forex markets the case study
of the Republic of Korea exemplify that country-specific factors have to be considered when
designing the financial regulatory toolkit aimed at curbing foreign and domestic agentsrsquo
speculative strategies in the search for yield The experience of Brazil suggests deepening onshore
hedging market will go a long way in promoting the price setting role of onshore market over its
offshore counterparts Indonesia has recently introduced domestic NDFs in line with Brazil
Additionally the experience of Korea and Taiwan suggests that the participation of domestic banks
ensures that any price differential between the two segments is arbitraged However in both the
cases participation is governed to evade any potential build-up of vulnerabilities on banksrsquo balance
sheet
46
Chapter 34
Linkages between Offshore NDF and Onshore Rupee Markets New Evidence
Overarching Motivation
Indiarsquos trade integration with the rest of the world began to rise sharply from the turn of the
millennium Between 2000 and 2012 total trade (imports + exports) as a percentage of GDP more
than doubled from 26 to 56 before moderating to 43 in 2018 as the effects of de-
globalization took over post the global financial crisis Simultaneously policymakers persevered
with gradual but consistent capital account liberalization Unsurprisingly therefore currency
markets ndash both to trade and hedge ndash rose in tandem with the growing external integration The
onshore Rupee market5 monthly average turnover has grown from USD 60 billion in 2000 to USD
687 billion in 2018 However given data limitations uncertainty still exists on the exact size of
the NDF market and how it has grown relative to the onshore market As Chapter- 2 illustrates
the BIS Triennial Survey finds average daily turnover of Rupee NDF in 2016 was USD 16 billion
However the Bank of Englandrsquos Semi-Annual Forex Turnover Survey finds average daily
turnover of Rupee NDF in London increased from USD 8 billion in October 2016 to USD 23
billion in October 2018
The idea behind trying to size the NDF market ndash and therefore implicitly compare its size and
growth to onshore markets ndash is in part to try and make sense of how important a role NDF markets
play in the ldquoprice discoveryrdquo of the Rupee6 With the Indian Rupeersquos ldquoForwardrdquo price being
determined across segmented markets ndash both the onshore deliverable forward market and the
offshore non-deliverable market -- the key is to ascertain the relative importance of each of these
markets in driving price discovery
4 This chapter is a joint work of Shri Sajjid Chinoy Chief Economist J P Morgan India and Shri Harendra Behera
Assistant Adviser Department of Economic and Policy Research Reserve Bank of India 5 Spot OTC amp ETCD
6 To be sure estimating the size of the NDF market is important not just for the influence it exerts on price discovery
but also instructive in understanding the cumulative ldquoviewrdquo on the Rupee and how much is expressed onshore versus
offshore This is because if NDF volumes are substantial policymakers may desire to shift these volumes on shore
both to (i) deepen the onshore market and (ii) move this businesseconomic activity on shore
47
However simply using (offshore versus onshore) volumes as a means to proxy relative price
discovery is imperfect at best The ability of NDF volumes to drive price discovery for any given
quantum of volumes is ultimately a function of how inter-connected onshore and offshore markets
are and the ability of economic agents ndash hedgers arbitrageurs speculators -- to link these markets
For example if NDF markets have grown sharply but it is found that price linkages between the
two markets are still tenuous or have not increased commensurately with volumes -- say because
arbitrage opportunities between the two markets have not grown in tandem -- then the growth of
NDF markets and the consequent ldquoloss of controlrdquo will be of less concern to Indian policymakers
Conversely if price linkages have grown over time ndash proportionately to volume increases ndash then
policymakers would rightly worry about the growing role of NDF markets in driving price
discovery
The fundamental motivation for this chapter is therefore to empirically examine price linkages
between the NDF and onshore markets as this is the ultimate manifestation of the influence that
NDF markets exert
The Question
This chapter seeks to ask two fundamental questions Is there a stable long-term equilibrium
relationship between onshore and offshore markets Second if so what is the directionality of
influence Do NDF markets drive onshore markets Or do onshore markets drive the NDF market
Or is the influence bi-directional
Furthermore we try and empirically answer this questions across two dimension First what is the
direction and quantum of influence during ldquonormal times versus ldquostressed timesrdquo Second what
is the relationship and how does it change when assessing ldquoaverage returnsrdquo (means) versus
ldquovolatilityrdquo (variance)
Specific Motivation to India
While there is a meaningful and growing literature trying to empirically ascertain price linkages
between the onshore and offshore markets around the world the literature that focuses on India
remains sparse dated and inconclusive This constitutes the specific motivation for this chapter
48
The literature studying NDF markets around the world has steadily grown over time For example
much work has been done on Asian NDF markets and their relationship with onshore markets
both for the region as a whole (Ma et al 2004 Colvecchio et al 2006 Wang et al 2007 Gu and
McNelis 2009) and individual currencies such as the Korean Won (Park 2001) the Indonesian
Rupiah (Cadarajat and Lubis 2012) the Chinese Yuan (Fung et al 2004 Hideki 2006
Colavecchio and Funke 2008 Huszaacuter et al 2016 Song and Gao 2016 McCauley and Shu 2018)
and the Indian Rupee (Misra and Behera 2006 Guru 2009 Behera 2011 Darbha 2012 Goyal
et al 2013)
Results remain mixed Some studies find the NDF markets influence the evidence onshore forward
market (Park 2001 Wang et al 2007 Cadarajat and Lubis 2012) others find they influence
onshore spot markets (Behera 2011 Goyal et al 2013) while some document its influence on
onshore futures markets (Behera 2011) Conversely some studies also find the direction of
influence runs from onshore markets to NDF markets (Wang et al 2007 Misra and Behera 2006)
In the case of India there are only a few studies on this subject ndash with the last one back in 2013 ndash
and the results are mixed and inconclusive For example Misra and Behera (2006) find that itrsquos
the onshore markets that influenced the NDF market between 2004 to 2007 largely because of
restricted participation of domestic players in the offshore market In a subsequent study Behera
(2011) found that there are volatility spillovers from the NDF market to spot and forward markets
in India and the magnitude of volatility spillover has become higher after the introduction of
currency futures in 2008 Guru (2009) finds qualitatively the same results and the role of currency
futures in India Darbha (2012) find that offshore markets play an important role in price discovery
Finally in the most recent work on India (Goyal et al 2013) find evidence of a long-term
relationship between NDF and onshore markets and find evidence that the relationship is
bidirectional as both markets adjust to any deviations from the equilibrium state
Whatrsquos clear however is the evidence on India is patchy inconclusive and dated with the last
study conducted more than 6 years ago
Some Theory
Recall if there are no capital controls forward rates are tied down by the no-arbitrage ldquocovered
interest parityrdquo hypothesis
49
F = S(1+r)(1+r$ )
Where F is the Forward rate S is the spot rate r is the relevant interest rate on the home currency
and r$ is the equivalent dollar rate The equation holds when (i) there is capital account
convertibility and there are no barrier for cross-border transactions and (ii) there is equivalent
credit risk in the assets across the two jurisdictions
However if there are capital-account barriers we would expect F to only be approximated by the
equation above and not hold exactly
So F ~ S(1+r)(1+r$ )
Similarly the NDF rate should be anchored by the onshore forward rate to the extent that
arbitragers can link these markets
So NDF ~ F ~ S(1+r)(1+r$ )
Furthermore the sign of the onshore-offshore yield spread can indicate the underlying market
pressure on the currency If the domestic interest rate is higher than the NDF implied yield it
implies appreciation pressures on the currency However capital controls may restrict inflows to
close the gap Similarly a lower domestic interest rate than implied by the NDF yield would
suggest depreciation pressures while a zero spread would likely reflect an absence of market
pressure on both the domestic and offshore market
All told however we would expect that both onshore and offshore markets would have a long-
run relationship and there is the likelihood of ldquomeanrdquo spillovers on a regular basis Furthermore
hedging arbitrage and speculative activities may also result in volatility spillovers from one
market to another on various occasions
Testing for ldquoMeanrdquo Spillovers
We start therefore by empirically testing for linkages between onshore (spot and forward prices)
and offshore (NDF forward prices) markets The goal is to assess
1 If there is a stable long-term relationship between onshore and offshore markets
2 Which drives which Do onshore prices drove offshore prices Or vice versa
50
3 To see whether the direction of influence is a function of context Are the results
different for ldquonormalrdquo times versus ldquostressed periodsrdquo (ie taper tantrum emerging
market stress)
Non-stationary but co-integrated
So as to decide the empirical course of action we start by testing whether the key variables of
interest (i) the Onshore Spot Exchange Rate (SPOT) (ii) the Onshore Forward Rate (FORWARD)
and (iii) the Offshore Non-Deliverables Forward exchange rate (NDF) are stationary
Augmented Dickey Fuller Tests reveal that all three variables are non-stationary in levels
However as Figures 1 and 2 suggest the spreads between SPOT and NDF and ONSHORE
FORWARDS and NDF are mean-reverting suggesting the presence of a long-term relationship
and suggesting stationarity in the first differences
Formal co-integration tests ndashTables 2 and 3 ndash confirm that both pairs of variables NDF-SPOT and
NDF-FORWARD ndash are indeed co-integrated The Max Eigenvalue tests reveal there is at least one
co-integrating vector that can be found at the 5 level
Null Hypothesis Variables have a unit root
ADF t-Stat Prob
Spot -06 09
Augmented Dickey-Fuller test statistic-07 08
Augmented Dickey-Fuller test statistic-07 08
Table 1 ADF unit root test
-15
-05
05
15
25
09 10 11 12 13 14 15 16 17 18 19
level
Figure 1 Spreads (1M NDF- Spot)
51
-25
-15
-05
05
15
25
09 10 11 12 13 14 15 16 17 18 19
level
Figure 2 Spreads (1M NDF- 1M Forward)
Table 2 Co-integration SPOT and NDF
Sample (adjusted) January 2005 to March 2019
Included observations 2608 after adjustments
Trend assumption No deterministic trend (restricted constant)
Series LOG(SPT) LOG(NDF)
Unrestricted Cointegration Rank Test (Trace)
Hypothesized Trace
No of CE(s) Eigenvalue Statistic Critical ValueProb
None 011 31310 2026 000
At most 1 000 210 916 076
Unrestricted Cointegration Rank Test (Maximum Eigenvalue)
Hypothesized Max-Eigen005
No of CE(s) Eigenvalue Statistic Critical ValueProb
None 011 31100 1589 000
At most 1 000 210 916 076
Both Trace and Max-eigenvalue tests indicates 1 cointegrating
eqn(s) at the 005 level
52
Stable Long Term Relationship
The finding of co-integration allows us to use ordinary least squares (OLS) to estimate the long-
term relationship between SPOT and the NDF as well as FORWARD and the NDF In particular
using the equation below we estimate parameters β0 and β1 which tells us about the long-term
relationship between SPOT and NDF
We then repeat the same exercise between the FORWARD and the NDF
But whatrsquos driving what An ldquoError Correction Mechanismrdquo approach
While establishing a long-term relationship is important a finding in the affirmative will not come
as a particular surprise Instead the real question is whether onshore prices drive offshore prices
or vice versa The natural framework to answer this is the work-horse Error Correction Mechanism
(ECM) approach used by Engel and Granger in 1987 where changes in each of the variables are
run on changes on its own lags and the lags of the other variables
Table 3 Co-integration FORWARD and NDF
Sample (adjusted) January 2005 to March 2019
Included observations 2608 after adjustments
Trend assumption No deterministic trend (restricted constant)
Series LOG(FORWARD) LOG(NDF)
Unrestricted Cointegration Rank Test (Trace)
Hypothesized Trace
No of CE(s) Eigenvalue Statistic Critical ValueProb
None 018 53051 2026 000
At most 1 000 217 916 074
Unrestricted Cointegration Rank Test (Maximum Eigenvalue)
Hypothesized Max-Eigen 005
No of CE(s) Eigenvalue Statistic Critical Value Prob
None 018 52835 1589 000
At most 1 000 217 916 074
Both Trace and Max-eigenvalue tests indicates 1 cointegrating
eqn(s) at the 005 level
53
119889119897119900119892(119904119901119900119905)119905 = 1205720 + 120572119904119901119900119905(119890119905minus1) + sum 12057211(119894)(119889log (119904119901119900119905119905minus1))119899119894=1 + sum 12057212(119894)(119889log (119873119863119865119905minus1)) + 120576119904119905
119899119894=1 (1)
119889119897119900119892(119873119863119865)119905 = 1205720 + 120572119899119889119891(119890119905minus1) + sum 12057221(119894)(119889119897119900119892(119904119901119900119905119905minus1))119899119894=1 + sum 12057222(119894)(119889119897119900119892(119873119863119865119905minus1)) + 120576119899119905
119899119894=1 (2)
For example as Equation 1 lays out changes in (the log of) SPOT ndash the dependent variable -- are
run on its own lags and the lags of NDF Equation 2 ndash in which the dependent variable is NDF --
does the same for NDF Because both variables are co-integrated ndash as shown above ndash using OLS
to estimate these coefficients using standard criterion to choose lag lengths (eg Akaike
Information Criterion) and standard F-Tests are all valid
The coefficients of interest in the above equation are 120572119904119901119900119905 and 120572119899119889119891 ndash the ECM terms -- because
these coefficients tell us when the system is in disequilibrium the direction and the speed of
adjustment back to equilibrium This will determine the directionality of influence
For example if 120572119904119901119900119905 = 0 and if all values of 12057212(119894) = 0 then dlog(NDF) does not granger cause
dlog(spot) In contrast if the value of 120572119904119901119900119905 is negative and statistically significant that implies
that (the log of) NDF in the long run ldquoganger-causesrdquo spot market movements The same intuition
applies for equation 2 where NDF is the dependent variable and we test for convergence between
the NDF rate and the onshore forward rate Direct convergence requires 120572119904119901119900119905and 120572119899119889119891 to be
oppositely sign Intuitively the larger the value of α the faster is the speed of adjustment
In summary while the βrsquos tell us about the existence and strength of a long run relationship
between onshore and offshore markets the αrsquos tell us about whether (i) the directionality of
influence and (ii) the speed of convergence from disequilibrium
We therefore use this approach to test for linkages between both sets of variables ndash NDF and
onshore SPOT ndash and NDF and onshore FORWARDS
Data
We use end-of- India-day closing values for the onshore spot exchange rate for the 1-month a
forwards and the corresponding 1-month non-deliverable-forward (NDF) rates We use daily data
and our full sample runs from 2009 through 2019
54
Results Full Sample
Table 4 ECM and Long run coefficients (Full sample)
The first row are the linkages between the onshore spot and NDF markets while the second row
is that of the onshore forwards and NDF market
In both cases the betas (β) are positive statistically significant and with a magnitude very close to
or at 1 implying an almost one-for-one movement between both the markets in the long run For
example the estimated β1 of 099 suggests that for a 1 increase in NDF rates there is 099
increase in spot rates in the long run Meanwhile between onshore FORWARDS and NDF there
is a complete pass-through in long run More generally a beta (β) close to 1 suggests there is no
permanent friction between onshore and offshore markets in the long run
Convergence
However the real interest is in the alphas In the first case both 120572119904119901119900119905 and 120572119899119889119891 are statistically
significant and oppositely signed This suggests that they both converge towards each other Put
differently the NDF rate moves towards the onshore SPOT rate and vice-versa In other words
there is a bi-directional relationship between both variables The magnitude of the coefficients
(007-018) suggests a moderate speed of convergence to the long-run equilibrium when a shock
causes the system to go into disequilibrium
The same results are obtained when studying linkages between the onshore forward and NDF
markets Both 120572119891119900119903119908119886119903119889 and 120572119899119889119891 are statistically significant oppositely signed (suggesting they
converge towards each other) with coefficients that are slightly larger than the SPOT-NDF pair
This suggests that both NDF and the onshore FORWARD rates influence each other and gradually
converge towards their long-term relationship when hit by a shock ndash a speed of adjustment that is
modestly faster than the NDF-SPOT relationship
Time Period April 2009 to March 2019
Onshore Spot and NDF -018 007 099
Onshore Forwards and NDF -032 023 100
55
For the full sample as a whole from 2009 to 2019 we find that there is a bi-directional relationship
on average between SPOT and NDF and FORWARD and NDF and that all variables converge
gradually to their long-term relationship
Results Stressed Times
Our results should be thought of as ldquoaveragerdquo results across the entire time period But are these
results a function of context Does the direction of influence change for example during periods
of currency stress versus periods of calm We explore this next
To test for this we start by isolating clearly-identifiable periods of stress ex post facto in our
simple Two episodes naturally come to mind the taper tantrum of 2013 (where the Rupee
depreciated 26 between May 2013 and August 2013) and the emerging market (EM) turmoil ndash
characterized both by the Fed raising rates and oil prices firming ndash such that the Rupee depreciated
almost 10 between August 2018 and October 2018
2013 The Taper Tantrum
We test interlinkages from the start of May to the end August 2013 ndash during the Taper Tantrum ndash
when the Rupee was under intense pressure and easily amongst the worst performing currencies
in the emerging market (EM) universe Results are presented in Table 5 below
Table 5 ECM and Long run coefficients
As one can observe 120572119899119889119891 in both equations is statistically insignificant What this implies is onshore
spot and forward rates were playing very little role in influencing NDF rates7 In contrast 120572119904119901119900119905 and
120572119891119900119903119908119886119903119889 are correctly signed and statistically significant (the former at the 1 level and the latter
at the 10 level) which suggests it was the NDF rate that was driving the onshore spot and forward
rates Interestingly the speed of adjustment is much faster for onshore spot rates in this sample (-
11) compared to the full sample (-018) and also relative to the onshore forward market (-08) An
7 In fact onshore spot and forward rates do not granger cause NDF as none of the lags of 12057221(119894) in equation 2 are
statistically significant during this period
Onshore Spot and NDF -11 -028 094
Onshore Forwards and NDF -08 015 097
Time Period May 2013 to August 2013
56
ECM (alpha) coefficient of greater than 1 suggests the witnesses an oscillating convergence Since
a coefficient greater than 1 is prime facie surprising we also conduct a robustness exercise
(described below) by running Granger Causality tests for this time period and find it is the NDF
that Granger-causes onshore rates and not the other way around
This finding likely reflects the growing volumes ndash potentially speculative ndash in the NDF market in
the 2013 period of stress relative to the volumes in the onshore market This also prime facie
reduced the efficacy of foreign currency intervention by the central bank because intervention was
used to shape the spot exchange rate at the end of Indiarsquos business day But because the NDF is a
24 hour market NDF rates evolved overnight and when the Indian market opened the next day
onshore rates were influenced by NDF developments overnight This rendered ineffective the
previous dayrsquos intervention because there was often little correlation between the closing exchange
rate of the previous day and the opening rate of the next day and therefore necessitated additional
intervention the next day
Visually this is evident in the ldquogap-uprdquo movements of the exchange rate when the Indian market
opened ndash vis-a-vis the previous dayrsquos close ndash during those three months Figure 3 for example
captures this for the month of August 2013
Figure 3 Gap-up opening in USDINR (August 2013)
Source Bloomberg
57
2018 More of the Same
Emerging markets came under renewed stress in the summer of 2018 against the back drop of the
Fedrsquos hiking cycle accompanied by the rally in crude pieces which had surged 50 over the course
of a year As some large emerging markets ndash Argentina Turkey ndash came under some stress there
was a contagion to all emerging markets with current account deficits of which India was one
Between May and October 2018 the Rupee depreciated almost 10 against the US Dollar
What were the offshore-onshore linkages during that period of time Results are presented in Table
6
Table 6 ECM and Long run coefficients
The linkages mimic 2013 The coefficient on whether onshore drives offshore 120572119899119889119891 is insignificant
in both regressions This re-affirms that in line with 2013 onshore spot and forwards were not
driving the NDF rate8 In contrast 120572119904119901119900119905 and 120572119891119900119903119908119886119903119889 are both correctly signed quantitatively
meaningful and statistically significant This suggests that it was the NDF rate that drove the
onshore spot and forward during this period likely reinforcing the presumption that volumes rise
sharply in NDF markets during periods of stress which then become the hub of price discovery
and influences onshore rates As Figure 4 reveals this is visible in the ldquogap-uprdquo movement of the
Rupee at the start of the day for several days in the month of August 2018
8 Onshore spot and forward rates does not granger cause NDF as none of the lags of 12057221(119894) in equation 2 are
statistically significant
Time Period August 2018 to Nov ember 2018
Onshore Spot and NDF -10 -05 096
Onshore Forw ards and NDF -115 -05 096
58
Figure 4 Gap-up opening in USDINR (August 2018)
Source Bloomberg
Our analysis also reveals that the speed of adjustment is very rapid relative to the baseline
Robustness test
The results are robust to the selection of time and tenure of the NDF For example instead of
India end-of-day (EOD) time as the NDF cut-off if we consider New York EOD as the NDF cut-
off there are no qualitative changes in the results Similarly instead of considering the 1-month-
NDF if we consider the 3-month-NDF the results essentially stay the same Furthermore given
the short time periods involved during stressed times (May to August 2013 and August to
November 2018) one can argue that co-integration equations may not be relevant We therefore
also carry out Granger causality tests for these time-periods and find the direction of causality to
be just above ie NDF rates are driving onshore rates during stress periods and not vice versa
Controlling both ldquoMeanrdquo and ldquoVolatilityrdquo spillovers
Thus far our focus has been on mean spillovers However as found by Misra and Behera (2006)
there are also potential ldquovolatilityrdquo spillovers from the NDF market to the spot and forward market
To model the coexistence of both mean and volatility spillovers we use a multivariate generalised
autoregressive conditional heteroskedasticity (MGARCH) model The degree of volatility
59
spillovers is measured by estimating dynamic conditional correlations between the markets The
empirical analysis is conducted using daily data from April 1 2009 through March 29 2019 and
using the currency pairs for (i) NDF-Spot (ii) NDF-Forwards and (iii) NDF-Futures
This model examines simultaneous interactions of conditional returns and volatilities across the
markets In this modelling framework we examine the Granger-causality in mean and variance as
discussed in Behera (2018) The results corroborate the earlier results that there is bi-directional
mean spillovers between onshore and offshore markets (Table 7)
An important finding using this approach is that the impact of price spillover from offshore to
onshore remains up to substantial lags while that from onshore to offshore dissipate after one day
(Annexure II) This ensues from the result that the individual coefficient estimates in the mean
equations of BEKK-MGARCH model are found to be statistically significant up to 5 lags in the
regression of returns in onshore market on that of offshore market while in the opposite case the
coefficient of onshore return is statistically significant only for the first lag
Table 7 Granger-causality tests in Mean
Direction of Causality Results
Spot to NDF 1-Month Yes
Spot to NDF 3-Month Yes
Spot to NDF 6-Month Yes
NDF 1-Month to Spot Yes
NDF 3-Month to Spot Yes
NDF 6-Month to Spot Yes
Forward 1-Month to NDF 1-Month Yes
Forward 3-Month to NDF 3-Month Yes
Forward 6-Month to NDF 6-Month Yes
NDF 1-Month to Forward 1-Month Yes
NDF 3-Month to Forward 3-Month Yes
NDF 6-Month to Forward 6-Month Yes
Futures 1-Month to NDF 1-Month Yes
Futures 3-Month to NDF 3-Month Yes
Futures 6-Month to NDF 6-Month Yes
NDF 1-Month to Futures 1-Month Yes
NDF 3-Month to Futures 3-Month Yes
NDF 6-Month to Futures 6-Month Yes
Note Null hypothesis is rejected if the p-value in the Wald test is less than 5 per cent
60
Volatility spillover between markets are studied by examining the statistical significance of
individual coefficients Granger causality in variance tests and estimating the dynamic conditional
correlations Beginning with granger causality test results imply a bidirectional causal relationship
between volatilities in both onshore and offshore markets of 1-month maturity segments only
(Table 8) In normal times no volatility spillovers are observed across the markets in other
maturity segments which reverses in the period of increased uncertainty (as found from Granger-
causality-in-variance tests taking into account asymmetric effects) The results from individual
coefficient estimates indicate about the presence of short-term volatility spillover between the
markets while the long-term volatility transmission is statistically significant from NDF market
to onshore spot forward and futures markets Moreover the asymmetric coefficients in variance
equation provide interesting insights ndash with the evidence of rise in volatility spillover from onshore
to offshore market in case of rupee appreciation while the opposite happens ie the volatility
spillover increases from NDF market to onshore market in the episodes of rupee depreciation
(Annexure II)
Table 8 Granger-causality tests in Variance
Direction of Causality Results
Without Asymmetry Effect With Asymmetry Effect
Spot to NDF 1-Month No Yes
Spot to NDF 3-Month No Yes
Spot to NDF 6-Month No Yes
NDF 1-Month to Spot No Yes
NDF 3-Month to Spot No Yes
NDF 6-Month to Spot No Yes
Forward 1-Month to NDF 1-Month Yes Yes
Forward 3-Month to NDF 3-Month No Yes
Forward 6-Month to NDF 6-Month No Yes
NDF 1-Month to Forward 1-Month Yes Yes
NDF 3-Month to Forward 3-Month No Yes
NDF 6-Month to Forward 6-Month No Yes
Futures 1-Month to NDF 1-Month Yes Yes
Futures 3-Month to NDF 3-Month No Yes
Futures 6-Month to NDF 6-Month No Yes
NDF 1-Month to Futures 1-Month Yes Yes
61
NDF 3-Month to Futures 3-Month No Yes
NDF 6-Month to Futures 6-Month No Yes
Note Null hypothesis is rejected if the p-value in the Wald test is less than 5 per cent
In order to understand how the volatility spillover between the markets changed over time a
variant of MGARCH model viz dynamic conditional correlation (DCC) model as proposed by
Engle (2002) is estimated taking the same pair of onshore-offshore exchange rate returns The
conditional volatility of 1-month NDF 1-month futures and their dynamic correlations are plotted
in Chart 249 The chart shows a sudden and significant rise in volatility during the episodes of
European debt crisis taper tantrum and latter part of 2018 coinciding with the rise in offshore-
onshore spreads resulting from the concerns regarding high current account deficits and large
capital outflows It is important to note that the volatility in NDF market is higher compared to
futures market and the divergence between the two gets accentuated in the times of heightened
uncertainty This in turn in conjunction with the rise in information asymmetry results in a drop
in correlations Since volatility spillover increases from offshore to onshore markets as discussed
earlier during periods of heightened uncertainty the volatility in onshore market increases
following the heightened volatility in offshore market In subsequent periods the correlation
increases indicating about the rise in spillovers A closer examination of the data on the volatilities
in two markets shows that volatility increases in offshore market first before it increase in onshore
markets with a lag of 1 to 2 days The correlations being positive and substantially higher imply a
significant degree of spillovers between the markets
9 The conditional volatilities for other pairs are qualitatively almost similar though their dynamic correlations are
different the dynamic correlations are provided in Chart 25
62
The dynamic correlations of volatilities for different pairs are presented in Chart 25 reveal that
that all the correlations were highly integrated and moving together alike until end December 2014
However the apparent structural changes in correlation process were observed since then with the
trends of correlations of NDF with spot and forward moving in one direction and that of NDF and
Futures moving on the opposite direction until mid-2017 The correlations have started coupling
though still continuing with some gaps between them since July 2017
060
065
070
075
080
085
090
095
00
05
10
15
20
25
30
2009 2010 2011 2012 2013 2014 2015 2016 2017 2018
Chart 24 Time-varying Volatility and Correlations Futures and
NDF
1-month Futures 1-month NDF DCC (right scale)
63
Conclusions and Implications
Since the work on establishing onshore-offshore price linkages in India was relatively sparse
outdated and inconclusive the goal of this Chapter was to create an updated empirical fact base
given the rapidity with which capital markets have developed and integrated and the pace at which
the NDF market has grown The overall results present a bidirectional relationship between
onshore and offshore markets
First that for full sample the price linkages ndash both mean and volatility ndash are found to be
bidirectional Both onshore and offshore rates have a strong long-term relationship and that when
a shocks throws that relationship into disequilibrium both onshore (spot and forward) and offshore
rates converge towards each other This suggests both influence each other This is consistent with
earlier findings in literature and should not be surprising Relative volumes across these market
are very dynamic and vary significantly When the bulk of the volumes flow through the onshore
050
055
060
065
070
075
080
085
090
095
100
2009 2010 2011 2012 2013 2014 2015 2016 2017 2018
Chart 25 Dynamic Conditional Correlations of Volatilities
SPOT_NDF1 SPOT_NDF3 SPOT_NDF6 FW1_NDF1 FW3_NDF3
FW6_NDF6 FUT1_NDF1 FUT3_NDF3 FUT6_NDF6
Forwards
Futures
Spot
64
market it becomes the locus of price discovery The converse is true when the bulk of volumes
are routed through the NDF market which then becomes the principle pole of price discovery
During the last two stress episodes (the taper tantrum and the 2018 EM crisis) however the
relationship turned unidirectional with the NDF market driving onshore spot and forwards and
the speed of adjustment from any disequilibrium increasing very sharply compared to ldquonormalrdquo
times Furthermore volatility spillovers also increased from offshore markets to onshore during
the periods of heightened uncertainty There is however an interesting asymmetry There is
evidence of rise in volatility spillover from onshore to offshore market in case of rupee
appreciation while the opposite happens ie the volatility spillover increases from NDF market to
onshore market in the episodes of rupee depreciation
All told as NDF volumes have increased they have begun to play an important role in both price
discovery and driving volatility particularly during heightened uncertainty periods
65
Chapter 4
International Financial Service Centre (IFSC)10 ndash Use of Rupee derivatives
The Task Force (TF) is vested to examine the role if any IFSC can play in addressing the concerns
arising out of offshore Rupee markets Presently Rupee is not permitted to be traded in the IFSC
This chapter discusses the aspects relevant to availability of non-deliverable Rupee derivatives in
the IFSC and permitting banks (IFSC Business Units or IBUs) to deal in such derivatives Before
discussing the potential benefits and concerns from the aforesaid proposition it is important to
address this issue ndash Are markets in IFSC onshore or offshore In the context of the Rupee market
a critical test for deciding the residency of the market would be applicability of capital controls in
respect of taking and exiting positions under FEMA 1999 Inter alia this is the critical aspect in
difference between the price discovered in onshore and offshore market As the IFSC functions
outside the capital controls under FEMA 1999 type of participants and the price discovered in
Rupee markets here will align with the existing offshore markets and therefore it cannot be treated
as onshore market To sum up while legally IFSC is very much an entity on the shores of India
from the point of view of Rupee markets it has to be treated as an offshore entity
Potential benefits of permitting non-deliverable Rupee derivatives in the IFSC
i Bringing NDF market volume to the IFSC Over the last decade or so a significant
market share in financial services related to India has moved to other international financial
centres like Singapore Hong Kong and London Bringing this business to India is clearly
beneficial in terms of economic activity and employment gains for India Further the size
and growth of the offshore Rupee derivative market poses a significant challenge to the
efficiency of price discovery as well as the effectiveness of exchange rate management
policy The possibility that the exchange rate of the Rupee not a fully convertible currency
being materially determined by transactions largely outside the legal and regulatory
influence of India is a matter of concern Given the favourable tax regime tax and by virtue
10
International Financial Services Centre or lsquoIFSCrsquo has the same meaning given in Section 2 (q) of the Special
Economic Zones Act 2005 (28 of 2005)
66
of it being outside the capital controls under FEMA 1999 IFSC may bring volumes and
price discovery to India
ii Complete bouquet of financial services in the IFSC Currently exchanges in IFSC are
permitted to offer a well-diversified range of products spanning various asset classes
which include derivatives on Indian indices derivatives on Indian stocks derivatives on
foreign stocks cross currency derivatives commodity futures on Gold Silver and base
metals etc Further while listing and trading of Masala Bonds is permitted in the IFSC
hedging Rupee exchange rate risk on it is not permitted Thus introduction of Rupee
derivatives will complete the entire range of asset classes available for trading in the IFSC
iii Access to market information The offshore Rupee market has been the subject matter of
interest for all stakeholders as these markets have an impact on onshore markets However
in the absence of any authentic data there are varying estimates about the volumes traded
in these markets nature of participation extent of open interest and the extent to which
these markets are used for hedging purposes If by opening up the IFSCs to Rupee trades
there is some migration of offshore Rupee market volumes it will help the cause of better
information flow regarding the market
iv Level playing field for Indian banks Foreign bankrsquos branches outside India can deal in
the offshore market as they are not bound by the RBIrsquos regulations On the other hand
overseas branches of Indian banks cannot deal in Rupee derivatives in the offshore market
By introducing Rupee derivatives in IFSC and permitting IBUs to deal in such derivatives
a more level playing field can be provided to Indian banks to service non-residents
Concerns from non-deliverable Rupee derivatives trading in the IFSC and dealing by IBUs
such derivatives
i Cannibalizing onshore business One major concern arising out of the introduction of
non-deliverable Rupee derivatives in the IFSC is whether it would cannibalize the business
of the onshore market instead of importing volumes from abroad Since the products in
both IFSC and the onshore market would be more or less similar in terms of characteristics
the domestic futures market getting gradually cannibalized by the IFSC on the face of it
appears probable But a deeper analysis of the comparative regulatory framework would
allay such concerns to a large extent The domestic currency futures market is majorly
67
made up of resident participation Non-residents are nearly absent in these markets and
hence their shift to the IFSC is more a theoretical proposition Since the Indian residents
are not permitted to participate in the IFSC they cannot contemplate a move-over It also
important to note that the onshore market settles in INR whereas derivative contracts in
the IFSC would settle in dollars and hence these markets will cater to two distinct classes
of participants
ii Impact on exchange rate management policy and development of the onshore market
Presently Indian banks are not allowed to deal in Rupee derivatives in the offshore market
A detailed discussion on the issue of allowing such dealing is presented in Chapter 5 In
consideration of the risk that participation of Indian banks may improve liquidity in the
offshore market and undermine the development of the onshore market the TF is of the
view of that Indian banks should not be permitted to deal in offshore Rupee market IFSC
being an offshore centre all concerns expressed in Chapter 5 in this regard are valid on
Rupee market in IFSC also However unlike other offshore Rupee market venues IFSC
has the potential of providing certain benefits to India as discussed earlier in this chapter
and therefore a distinction could be made between the two while examining the case of
permitting Rupee derivatives to be traded in the IFSC
iii Spillover of risks from IFSC to onshore market This is a concern since the two
markets being geographically contiguous could create porous leakage channels This
concern can be addressed by stipulating distinct net open position limits for entities
operating in both IFSC and on-shore In other words the open positions of entities
operating in the IFSC should not be permitted to be netted off with the open position on-
shore
What does a volatile Rupee exchange rate in the IFSC imply for the RBI and onshore
market
Chapter 3 establishes the linkages between the offshore and onshore Rupee market IFSC being an
offshore jurisdiction will have the same impact The RBI as the monetary authority has the
authority under RBI Act to maintain the stability of the rupee A volatile onshore foreign exchange
market could act as the trigger point of volatility in other financial markets like money bonds and
68
equities The spill over impact of financial market volatility casts its shadow on asset prices and
in turn it could have an impact on the capital flows and financial stability Given that a separate
regulator is envisaged for the IFSC the issue of RBIrsquos role in the IFSC was extensively deliberated
by the TF There are two possible approaches
i RBI plays a pivotal role in framing the Rupee derivative regulation in the IFSC In
order to allow the RBI to take measures in line with the objectives of exchange rate
management policy the sine qua non for allowing Rupee derivatives in the IFSC is to
ensure that RBI vested with the obligations to maintain financial and monetary stability
should continue to perform its statutory role in determining the regulatory framework for
Rupee market in the IFSC
ii Treat it akin to any other offshore market and maintain a hands-off approach The
objective of introducing Rupee derivatives in the IFSC is to provide an alternative to non-
residents for dealing in non-deliverable Rupee derivatives The expected transition of
investors is likely to be successful only if the IFSC functions with same freedom as other
offshore markets At the same time from an exchange rate management perspective
permitting Rupee trading in IFSC should not make a material difference to local authorities
as long as there is a barrier between the onshore market and IFSC In that case IFSC would
be exactly of the same status as any other offshore market
The TF feels that in line with the objectives of permitting Rupee derivatives in the IFSC the latter
approach - that the regulatory environment in which Rupee trades in IFSC is exactly similar to the
environment that prevails in any other offshore centre - is preferable As IFSCs are treated on par
with a foreign jurisdiction in terms of FEMA the regulation of the trade and capital flow channels
between the two jurisdictions (on-shore and IFSCs) should be so designed as to restrict the
transmission of volatility through these channels (in terms of participants products limits etc)
Recommendation
While there are concerns around impact on the onshore market due to trading in Rupee derivatives
in the IFSC there are potential benefits in terms of IFSCrsquos ability to offer complete bouquet of
financial services and availability of market information to all stakeholders Further given Indiarsquos
69
economic growth it may be appropriate to prepare for greater financial integration with the rest of
the world Sequencing and timing of measures relating to currency markets is a critical component
of such integration Although at the moment there is no definite path ahead in terms of such
integration but a thriving Rupee market in the IFSC may provide a system which can be leveraged
towards this end in the way and manner deemed fit in future IFSC being outside the capital
controls provides an opportunity to policymakers to test new regimes and products in an
environment whose repercussions may not significantly impact the stability or efficiency of the
onshore system On balance the TF is of the view that non-deliverable Rupee derivatives may be
introduced in the IFSC However a phased approach may be adopted and to start with trading
may be permitted only on exchanges due to the inherent transparency and risk management
benefits offered by it Introducing OTC contracts may be considered at a later stage after the
experience gained from trading on exchanges RBI may in its Financial Stability report assess the
impact of the functioning of IFSC on the financial stability of the country
Further the TF is of the view that entities regulated and permitted by the RBI may be permitted
to make market and run positions in Rupee derivatives market in the IFSC In order to prevent
spill over of risks from IFSC to onshore market though these entities a distinct net open position
limit may be stipulated for their operations in the IFSC In other words the open positions of
entities operating in the IFSC should not be permitted to be netted off with their open position
the onshore market
Finally given the mandate of RBI to implement exchange rate policy it may not be in benefit of
things to introduce Rupee derivatives in the IFSC without it being on board and therefore the TF
feels that Rupee derivatives may be permitted in the IFSC subject to agreement of the RBI
70
Chapter 5
Issues and Recommendations
The Task Force (TF) is entrusted to recommend measures to incentivize non-residents to access
the onshore Rupee derivative market and address concerns if any arising out of the offshore
Rupee derivative market As discussed in Chapter 1 the TF had interactions with various
categories of stakeholders to understand their perspective on the matter and identify the issues that
needs to be addressed
Chapter 2 and 3 have clearly brought out the increased importance of offshore Rupee markets
both in terms of their size and in terms of their impact on the exchange rate of the Rupee The price
and volatility spillovers from one market to the other are almost complete they are bi-directional
and when rupee is under pressure they are unidirectional from offshore markets to onshore
markets The speed of convergence of the markets is also quite quick The TFrsquos recommendations
have been made in the light of available information results of statistical analysis and most
importantly on the feedback received from various consultations
While increased participation of non-residents would be expected to enhance liquidity in the
onshore market it may also bring along with it additional volatility and transfer of incremental
risk to the domestic system This is particularly so as historically the rupee is a currency that has
generally depreciated and the demand for forward dollars is usually more than the supply
especially in times of stress Hence it is pertinent to examine the impact of incremental hedging
by non-residents in the onshore market While volatility in the rates have a clear impact on the real
sector events in the domestic derivatives markets in the late 2000s constantly remind us of issues
related to transfer of risk to entities that are not capable of understanding and managing it The big
question then is whether our system today is ready for incremental demand for hedging from non-
residents Available data is inadequate to measure the contribution of hedgers and speculators in
the offshore market turnover Using the best available information it can be estimated that an
additional daily average Rupee derivative turnover of around 08 billion ndash 24 billion could be
generated in the onshore market if all the INR NDF hedging transactions are transferred from the
offshore market (see Box 1) Such an incremental flow is not significant enough to cause any
adverse impact on volatility in the onshore market given that the user-driven deliverable forwards
market in India is quite liquid with daily average turnover of USD 163 billion (as per BIS
71
Quarterly Review December 2016) As regard transfer of risk to the domestic system the concern
is more regarding transfer of risk to the Indian companies and less towards market-makers as they
are in the business of managing risk There is a possibility that the said incremental positions
created in the onshore market may get transferred to Indian companies (in part or full depending
upon the level of these positions retained by the market-makers) However in comparison with
the late 2000s Indian companies today are only allowed to enter into Rupee derivatives depending
on their underlying exposure and no leveraged structures are permitted Also banks are bound by
stringent suitability and appropriateness norms Therefore the chances of Indian companies
acquiring unmanageable risk positions or risks due to mis-selling by market-makers are very low
Further there has been a significant growth in the external sector and consequently the foreign
exchange market has also grown (although one could argue on the incommensurate growth) To
summarize in the last decade or so the ecosystem on the whole has evolved and is less prone to
adverse impact from transfer of risks from non-residents
Box 1
Approximation of share of hedging transactions in INR NDF turnover
The graph presented below is extracted from BIS Quarterly Review December 2016
72
It can be observed from the above graph that non-financial and other financial institutions
contribute around 5 and 35 respectively to the turnover of INR NDFs in the offshore market
If one were to make an informed guess that all transaction by non-financial companies are hedging
transactions and that hedging transactions by other financial companies (eg funds) would
constitute maximum 25 of their transaction then it can be approximated that hedging transactions
constitute around 5 - 15 of the daily average turnover in INR NDF market which was reported
as USD 164 bn
Comparison of turnover in forwards in onshore and offshore market - In the same publication
it is also reported that the average daily turnover in onshore deliverable forwards is USD 163 bn
It may be noted that for fair comparison with the turnover in offshore market (where deliverable
spot and swap market doesnrsquot exist) this turnover includes both deliverable forwards and FX
swaps A comparative analysis of volumes in onshore and offshore market ndash both OTC and
exchange traded Rupee derivatives - is given in Annexure IV
Issues and recommendations
1 Market hours
An important reason for the existence of the offshore Rupee derivative market is simple geography
That domestic markets are closed when major users in certain regions (eg the United States) are
working creates a natural access for offshore markets Also significant international developments
impacting the Rupee exchange rate take place outside the onshore market hours thereby creating
a natural clientele for the offshore markets The feedback received from non-resident investors as
well as corporates highlighted the closure of the local market as an important reason for them
accessing the offshore market Exchanges have for some time been requesting an extension of
market hours citing increasing Rupee transaction volumes in offshore exchanges situated in
Singapore and Dubai A straightforward way of taking care of such requirements is to extend the
onshore market hours (both OTC and exchange traded derivative markets) While extending
market hours might involve simultaneously keeping support services (payment and settlement
systems) or support markets (funding markets) open it is also possible to treat such transactions
as part of the operations of the next day in which case the need for settlement or funding does not
73
arise In this regard the TF supports the recommendations relating to market timings outlined in
the draft Report of the Internal Working Group on Comprehensive Review of Market Timings
published by RBI on July 10 2019
Recommendation 1
The TF recommends that the onshore market hours be suitably extended to match the flexibility
provided by the offshore market and thereby incentivize non-residents to hedge in the onshore
market
2 Competitive pricing
One important feedback from foreign portfolio investors (FPIs) as well as global corporates was
that they are unable to access multiple competitive quotes in the onshore market Effectively they
are limited to using the prices of their custodian banks Generally FPIs deal only with their
custodian banks due to the existing rules whereby the custodian is responsible for tracking of
outstanding hedges vis-agrave-vis portfolio size This ldquofrictionrdquo issue can be addressed by shifting the
monitoring to a centralized agency which can use a technology solution to track exposures as well
as outstanding hedges This is further explained in recommendation no 4 ahead relating to
underlying exposure
Also the process to be setup documentation such as KYC and other trading arrangements with
multiple counterparties in India is a long and difficult exercise resulting in most FPIs either trading
with their custodian bank or using the offshore market to hedge Some of the documentation related
challenges can be minimized if the centralized KYC registration currently in place for SEBI
regulated entities is extended to all the entities ie both custodial banks as well as non-custodial
banks This is elaborated in recommendation no 11 on the KYC process
Another issue highlighted by FPIs in this context was unavailability of multi-dealer electronic
dealing platforms for them One way of making onshore prices more widely accessible to non-
residents is to allow Indian banks to freely offer prices as liquidity providers to non-resident
customers at any time whether or not the domestic market is open They can extend to non-resident
corporates the same choices that domestic corporates have in choosing among various market
makers This can be done either by a domestic sales team or by using staff located at overseas
74
branches In addition making an all-to-all trading platform (like the FX-Retail being introduced
in August 2019) available to non-residents would supplement that effort
Recommendation 2
The TF recommends that banks may be allowed to freely offer prices to non-residents at all times
out of their Indian books either by a domestic sales team or by using staff located at overseas
branches Also wide access to the FX-Retail trading platform to non-residents would be a major
incentive to use the onshore market
3 Effect of offshore Rupee derivative market on onshore price discovery and exchange rate
management policy
The size and growth of the offshore Rupee derivative market especially in the last few years poses
a significant challenge to the efficiency of price discovery as well as the effectiveness of exchange
rate management policy A comparison of onshore and offshore Rupee derivative market is given
in Annexure IV The possibility that the exchange rate of the Rupee not a fully convertible
currency will be materially determined by transactions largely outside the legal and regulatory
influence of India is a matter of concern The most straightforward approach to deal with that
concern would be to completely liberalize the onshore market and bring it at par with the offshore
market in all aspects Such a scenario would imply an effective absence of local regulation and
intervention which is incompatible with the current status of capital account convertibility
Another option is to liberalise the onshore market to the extent possible but this in itself may not
necessarily mean a fall in importance or size of the offshore market In this connection the TF
extensively discussed the proposition of creating a connection between the offshore and onshore
markets by permitting Indian banks to deal in the offshore market The various implications of
such a step are discussed below
i Reduction in volatility In theory a segmented market would be less liquid and therefore
more volatile compared to an integrated market One could also infer that offshore market
activity is maximum during onshore working hours eg almost three-fourths of the
offshore rupee futures are traded when Indian markets are open It is also observed that
75
offshore spreads are larger which indicates a relative scarcity of market-making entities
Linking the two markets may increase both the customer base as well as the liquidity
providers thereby improving liquidity as well as efficiency of the price discovery process
ii Better customer pricing through increased transparency in the offshore market
Today very little information is available regarding the offshore Rupee market other than
that of exchange traded instruments Such opacity is not in the interest of customers as
liquidity provision is limited to entities that have a presence both onshore and offshore
resulting in a premium (in terms of high bid-ask spreads) being charged for market access
Broadening this access to onshore banks would drive away such premium through wider
competition At the same time access to information improves for the local authorities
Since better information leads to better price efficiency it is in the interest of local
authorities to disseminate such information leading to an overall improvement in market
transparency
iii Level playing field for Indian banks Foreign bankrsquos branches outside India can deal in
the offshore market as they are not bound by the RBIrsquos regulations On the other hand
overseas branches of Indian banks cannot deal in Rupee derivatives in the offshore market
Allowing them access to the offshore Rupee derivative market would create a level playing
field for Indian banks
iv Impact on development of the onshore market Liquidity in onshore market is better
than the offshore market due to participation of real sector and market making by Indian
banks which obviously are the major Rupee liquidity providers Consequently non-
residents have the ability to exit positions with less impact cost in unfavourable times This
is a strong incentive for them to hedge in the onshore market (given dynamic hedging and
other operational issues are now being ironed out) Also higher liquidity in the onshore
market results in tighter bid-ask spread compared to the offshore market which allows non-
residents to get better pricing in the onshore market The aim of policy measures is to
develop the onshore market Accordingly policymakers strive to protect the advantages of
onshore market and at the same time develop and liberalise the onshore market to overcome
the gap vis-agrave-vis NDF markets in other aspects such as ease of access market infrastructure
and taxation There is of course the risk that participation of Indian banks will improve
76
liquidity in the NDF market and undermine the development of the onshore market Such
a situation will be challenging for implementing exchange rate management policy
Recommendation 3
The onshore Rupee derivatives market is currently more deep and liquid as compared to the
offshore Rupee market and participation of the Indian banks in the offshore market might over
time take away this advantage The TF feels that the downside of permitting Indian banks to deal
in the offshore Rupee derivative market outweighs the advantages and therefore recommends that
Indian banks should not be permitted to deal in the offshore Rupee derivative market for the
present
4 Requirement of underlying exposure and documentation therefor
There is no requirement of an underlying exposure to enter into a derivative contract in the offshore
Rupee derivative market Hence non-residents can freely trade in this market to hedge risk on an
underlying Rupee exposure or create exposure to Rupee However as per extant regulations non-
residents can enter into Rupee derivative contracts in the onshore market only for the purpose of
hedging risk arising from an underlying exposure Non-residents are classified into Foreign
Portfolio Investor (FPI) investors having Foreign Direct Investments Non-Resident Indian Non-
resident Exporters and Importers and Non-Resident lenders having ECBs designated in INR with
each category being subjected to a different set of rules for establishing underlying exposure
FPIs are allowed to hedge only on the basis of existence of underlying exposure with the hedge
size capped at the market value of investment in equity and debt in India as on a particular date
including any coupon receipts arising out of investment in debt securities falling due during the
following twelve months only The explicit mention of only equity and debt investments creates
regulatory ambiguity on hedging of other FPI exposures in India such as margin deposits cash
etc Hence any FPI having investment in India will be able to only buy USD forward against INR
onshore and will not be allowed to sell USD against INR in forward market as that would result in
increasing the exposure rather than hedging the exposure To prove the exposure a valuation
certificate is required to be provided by a designated AD bank (Custodian) as a proof of underlying
FPIs are also required to provide a declaration to the effect that their total outstanding hedges are
within the market value of their investments The only exception to establishing underlying
77
exposure requirement is dealing in exchange traded market where FPIs are allowed to take
positions without having to establish existence of underlying exposure up to USD 100 million
FDIs are allowed to hedge both their existing investment as well as proposed foreign direct
investments with the latter being allowed only after an AD bank ensures that all necessary
approvals for the investment have been obtained by the FDI With respect to non-resident
corporates users can hedge their exposures invoiced in INR and intercompany loans denominated
in INR (ECBs) They can book the hedge either directly with an AD bank in India or on a back-
to-back basis Prior to hedging they must furnish a declaration certifying that the underlying
exposure has not been hedged with any other AD bank(s) in India They are required to cancel the
hedge contract immediately if the underlying exposure is cancelled In case of a central treasury
an authorization from the entity having INR exposure to hedge on its behalf is also required
Irrespective of the category of the investor the requirement to establish underlying exposure
creates practical difficulties for many non-residents Funds who intend to execute macro hedge for
various schemes or MNC parents wanting to consolidate exposures across subsidiaries and
executing a single hedge find it easier to execute consolidated hedge in the offshore market Also
hedging of anticipated and economic exposures is not permitted
Recently the RBI has released11 draft regulation regarding risk management facilities for public
feedback The TF reviewed it in detail and also received feedback on it during interaction with
stakeholders The proposed regulation satisfactorily addresses a lot of pertinent issues Measures
on simplifying eligible underlying exposure criteria simplifying documentation requirement
flexibility to hedge dynamically ability to hedge anticipated exposures user classification (retail
and non-retail) and choice of products are welcome and much needed It is noted that the
requirement of having an underlying exposure for entering into Rupee derivative contract is
retained and it is felt that it is justified for effectiveness of exchange rate management policy and
ensuring financial stability Given that only hedging transactions are going to be permitted in the
onshore market there will remain a requirement to establish or declare existence of underlying
exposure to risk and also to ensure that notional of hedge contracts is in line with the value of
underlying exposure As discussed above such requirement acts as a deterrent for non-residents to
hedge in the onshore market It would be optimum if a solution can be found that fulfils the
11
Vide press release dated February 05 2019
78
requirement of verification of underlying exposure without the investors being required to
undertake the efforts to prove it This can be achieved by consolidating the existing data on
investments and hedge transactions residing with various regulated entities
Recommendation 4
The TF recommends that a technology-based solution be explored to centrally aggregate the
investments of non-residents and derivative contracts entered into by them in the onshore market
(both OTC and exchange traded) using LEI or any other unique identifier to start with ADs should
be allowed access to such aggregate data so that they can verify the quantum of derivative positions
and underlying investments of the non-residents This mechanism can potentially completely
remove the requirement of efforts from the non-residents to prove the existence of underlying
exposure to Rupee
Further to simplify procedures and provide ease of access to the exchange traded currency
derivative market the RBI has allowed users to enter exchange traded instruments (futures and
options) to take exposure up to USD 100 million without the requirement of establishing the
existence of underlying risk Such measures go a long way in encouraging users (especially
MSMEs) to hedge their exchange rate risk by making the process easier At the same time such
calibrated opening helps in addressing any concerns of systemic risk The TF feels that such an
incentive must be provided in the OTC market also as it will not only contribute to ease of doing
business but also to restore parity in regulation between OTC and exchange markets
Recommendation 5
While requirement of underlying exposure will continue for trading in the onshore market users
may be allowed to undertake positions up to USD 100 million in OTC as well as exchange traded
currency derivative market without having to establish the underlying exposure
5 Products
Non-residents can enter into only plain vanilla forwards and option contracts in the OTC foreign
exchange market Further swaps are restricted to specific case of IPO and non-resident lenders of
ECB denominated in INR Non-residents who prefer to express their hedge using structured
79
options necessarily need to execute in the offshore market as current regulations do not allow non-
residents to enter into structured options
Recommendation 6
The aforesaid draft regulation addresses this issue by allowing ADs to offer any product to the
non-residents (for non-retails users) which satisfies the purpose for which they are permitted to
enter into Rupee derivatives ie hedging of underlying exposure to Rupee In other words ADs
cannot offer any product that creates risk for the user instead of hedging the existing risk The TF
endorses this principle-based regulation approach
6 Restrictions on dynamic management of risk
Non-residents trading in the offshore market are free to cancel and rebook their trades depending
on their future expectations andor risk management policy On the other hand in the onshore
market non-residents in general are not allowed to rebook a contract once cancelled Only in the
case of FPIs rebooking up to 10 of the value of contracts cancelled is permitted Inability to
manage risk dynamically deters non-residents who look for flexibility while hedging their risks
The aforesaid draft regulation proposes to remove restrictions on rebooking of cancelled contracts
and thereby allow users to hedge dynamically For contracts entered into for hedging contracted
exposure gains (or losses) on cancellation will be passed on to the user as and when they accrue
but in case of contracts entered into for hedging anticipated exposures net gains will be transferred
only when the underlying cash flow has occurred The prime purpose of such stipulation is to curb
incentives for speculation by using the liberal position limits available under anticipated exposure
hedging However a consequent drawback is that in some instances eg contingent contracts
such as bidding for projects involving currency risk such a provision would not be equitable This
provision could be suitable amended to enable all types of hedging without compromising the
essential control that the cash flow requirement provides to ensure underlying in a hassle-free way
The TF is of the view that providing suitable discretion to banks to pass on net gains even without
cash flows in such cases would address this shortcoming This will ensure that genuine hedgers
80
will access the onshore market without worrying about retention of gains if underlying transaction
does not fructify due to reasons beyond their control
Recommendation 7
In line with the objective of bringing onshore market at par with offshore market the most obvious
path is to not have any restrictions on transfer of gains in case of anticipated exposure hedging
However a balancing act is necessary between liberalizing the market while preventing
speculative positions which can create undue volatility in the onshore market Keeping this in
mind while endorsing free dynamic hedging (without any restriction on cancellation and
rebooking) for hedging contracted exposure the TF recommends that in case of hedging of
anticipated exposures gains from cancellation of contract may be allowed to be passed on even in
cases where there are no cash flows at the discretion of the bank where the bank considers the
cancellation of underlying cash flow is due to external factors which are beyond the control of the
user
7 Gross settlement and credit risk management
In the case of offshore Rupee derivative market non-residents clear and settle OTC trades either
through a prime brokercustodian or bilaterally with the counterparty In both these cases the non-
residents usually execute a bilateral multi-currency master service agreement which includes
provisions for exchange of margin (ex- ISDA master agreement including Credit Support Annex)
with the counterparty These agreements necessitate periodic settlement of marked-to-market gains
and losses across products and provide the flexibility to net off losses against gains Hence these
agreements significantly lower credit charges and provide strong netting efficiency On the other
hand in the onshore market the non-residents in an otherwise identical situation will face
additional challenges in respect of settlement and exchange of margin due to the following reasons
Gross settlement of gains As mentioned above non-residents clear and settle OTC trades in the
offshore Rupee derivative market either through a prime broker or bilaterally with the
counterparty Typically they settle deal across assets and currencies with either of these entities
and are therefore able to net the cash flows and achieve efficiency in liquidity management
81
However as Rupee derivatives entered into in the onshore Rupee derivative market cannot be
settled under such overseas arrangements non-residents are unable to avail the benefits of netting
on their onshore transactions
Credit risk management Signing a master service agreement locally and establishing credit lines
with onshore banks increases the execution cost of hedging onshore Typically transactions of
non-residents in the offshore market are collateralized (through collateral exchange provisions
contained in the master service agreement) while those in the onshore market are non-
collateralized Depending on the credit rating of the non-resident the onshore banks may not
necessarily be open to providing exposurecredit limits on uncollateralized basis for entering into
deliverable contracts If a collateralized credit line is set up through a master service agreement
with provision for exchange of collateral in USD outside India restrictions under FEMA 1999 on
exchanging margin outside India by onshore banks poses issues If exchange of collateral is in INR
in India then the non-residents will have to either assume the exchange rate risk on the cash margin
deposited or will have to additionally hedge the margin money placed Moreover this attracts
regulatory ambiguity such as minimum tenor restrictions as per deposit regulations ability to
hedge the margin through FX swap interest to be paid on cash in SNRR account etc If interest
cannot be paid on the collateral placed with onshore counterparties it creates a strong economic
disincentive for the investor to hedge onshore
These issues can be addresses in two ways First facilitating the non-residents to utilize their
existing overseas custodianprime broker relationship and master service agreements for
settlement of their transactions onshore and exchange of collateral therefor Second by creating
the regulatory framework for exchange of margin for non-centrally cleared derivatives in India to
make it consistent with evolving clearing mechanism offshore Both the solutions are discussed
below
To help non-residents retain their economic neutrality with respect to the prevailing multi-currency
master service agreement executed offshore a central clearing and settlement mechanism may be
established for non-residentsrsquo deals with onshore counterparties along the lines of central clearing
and settlement of onshore interbank deals by the CCIL The overseas bank of the non-resident will
clear and settle the deals execute by them onshore To be sure the proposal is to introduce the
centralized clearing mechanism while retaining the existing bilateral settlement mechanism so that
82
investors who want to continue using it do not face disruption For the suggested central clearing
and settlement mechanism to be set up inter alia the following permissions would also be
required
i Permission under FEMA 1999 for CCIL to accept foreign currency denominated collateral
in India or outside India
ii Enhancement of CCILrsquos infrastructure to accept wide range of securities (foreign currency
cash securities issued by foreign governments etc) as collateral and
iii Other regulatory clearances required for non-residentsoverseas banks in other jurisdictions
to clear and settle through CCIL
Further back-to-back hedging by non-residents proposed in the aforesaid draft regulation will also
allow effective utilization of their prevailing multi-currency CSA arrangement offshore This
entails allowing non-residents to hedge their exposure with their banking counterpart overseas
which in turn will hedge the position back-to-back with an onshore bank This ensures that existing
dealing arrangements between non-residents and their overseas counterparties remain unchanged
but at the same time the market risk gets transferred to onshore banks and hence is managed locally
The overseas bank should be allowed to settle the onshore leg either bilaterally with the onshore
bank or through the proposed central clearing and settlement mechanism Also this will require
permissibility under FEMA 1999 to exchange margin with the overseas banker of non-residents
outside India In such a model the approach should be to recognize the intermediary offshore bank
as a facilitator purely for the convenience of the non-resident investor Experience from other
markets that have implemented such models like Malaysia and China suggest that putting the onus
of monitoring compliance in terms of quantum of hedge underlying documentation etc on the
intermediary bank is inefficient Such a requirement leads to the intermediary bank asking for
various indemnities from the client and these are often difficult and time consuming to negotiate
and sign The approach should be to monitor compliance by the non-residents as the regulated user
using available onshore infrastructure as well use of technology solutions to track the hedges vis-
a-vis underlying exposure as detailed in recommendation 5
With regard to regulation and infrastructure for exchange of margin for non-centrally cleared
derivatives in India the RBI released a discussion paper on this issue in May 2016 However the
final directions have not been issues yet It is understood that ambiguity in netting legislation is
83
one of the main issues holding the release of these directions Also it is understood that the GoI is
in the process of making legislative changes to address this issue
Recommendation 8
For ease of entering into hedge transactions for non-residents the TF recommends-
i Establishment of a central clearing and settlement mechanism for non-residentsrsquo deals in the
onshore market
ii Back-to-back hedging by non-residents proposed under the draft regulation is endorsed The
overseas bank should be allowed to settle the onshore leg either bilaterally with the onshore bank
or through the proposed central clearing and settlement mechanism
iii Implementation of margin requirement for non-centrally cleared OTC derivatives in the
onshore market at the earliest
iv Allowing Indian banks to post margin outside India This is not only relevant for credit risk
management for their transactions with non-resident users but also for their cross-border inter-
bank transactions
8 Taxation
Under the extant regulatory framework non-residents are permitted to enter into Rupee derivative
contracts only for hedging risk on their investmentslendingtrade in India As per discussions with
stakeholders the following position is generally adopted with regard to the gains from such
contracts
bull Where currencies under the contract are delivered ndash Not a taxable event (ie conversion of
one currency into another does not give rise to taxable income)
bull Where contract is cancelled and price difference is settled ndash If the derivative contract is
entered into for hedging exchange rate risk on a capital asset then gains on cancellation are
treated as capital gains If it is entered into for hedging exchange rate risk in relation to a
tradingbusiness asset such gains are treated as business profits
84
However it is understood that there is ambiguity in the rules in this connection and the position
taken by the Assessing Officers (AOs) differs between zones and is at variance with the aforesaid
position Oftentimes such gains on cancellation are treated as lsquoOther Incomersquo or lsquoSpeculation
Business Profitsrsquo During interaction with the non-residents it was suggested that such uncertainty
of tax treatment is one of the prime reasons why they do not access the onshore market and instead
hedge Rupee exposures in the off-shore market
Recommendation 9
The TF recommends that the competent authorities may examine the issue of taxation in respect
of foreign exchange derivative contracts with the objective of overcoming gaps between tax regime
in India and other major international financial centres (Singapore Hong Kong and London) to
the extent possible and thereby incentivizing non-residents to hedge in the onshore market
9 Allow non-deliverable Rupee derivatives in the IFSC and permit IBUs to deal in such
derivatives
The proposition of introducing non-deliverable Rupee derivatives in the IFSC and permitting
banks (IFSC Business Units or IBUs) to deal in such derivatives is discussed in detail in Chapter
4 While there are concerns around impact on the onshore market due to trading in Rupee
derivatives in the IFSC there are potential benefits in terms of IFSCrsquos ability to offer complete
bouquet of financial services and availability of market information to all stakeholders Further
given Indiarsquos economic growth it may be appropriate to prepare for greater financial integration
with the rest of the world Sequencing and timing of measures relating to currency markets is a
critical component of such integration Although at the moment there is no definite path ahead in
terms of such integration but a thriving Rupee market in the IFSC may provide a system which
can be leveraged towards this end in the way and manner deemed fit in future IFSC being outside
the capital controls provides an opportunity to policymakers to test new regimes and products in
an environment whose repercussions may not significantly impact the stability or efficiency of the
onshore system On balance the TF is of the view that non-deliverable Rupee derivatives may be
introduced in the IFSC However a phased approach may be adopted and to start with trading
may be permitted only on exchanges due to the inherent transparency and risk management
85
benefits offered by it Introducing OTC contracts may be considered at a later stage after the
experience gained from trading on exchanges RBI may in its Financial Stability report assess the
impact of the functioning of IFSC on the financial stability of the country
Further the TF is of the view that entities regulated and permitted by the RBI may be permitted to
make market and run positions in Rupee derivatives market in the IFSC In order to prevent spill
over of risks from IFSC to onshore market though these entities a distinct net open position limit
may be stipulated for their operations in the IFSC In other words the open positions of entities
operating in the IFSC should not be permitted to be netted off with their open position the onshore
market
Recommendation 10
The TF recommends that non-deliverable Rupee derivatives (with settlement in foreign currency)
may be allowed to be traded in the IFSC and IBUs may be allowed to deal in such derivatives with
a distinct FCY-INR position limit To start with exchange traded currency derivatives involving
Rupee may be introduced and with experience non-deliverable OTC currency derivatives
involving Rupee may also be allowed
10 KYC process
The extant directions issued by the Reserve Bank of India stipulates the documents required for
conducting KYC process to open accounts of non-residents Similarly SEBI has also prescribed
documents required for the granting of FPI license by Domestic Depository Participants (DDP)
Further KYC documents for FPIs are available to SEBI regulated entities through KRAs subject
to approval from either the FPIs or the domestic custodians Since access to KRAs is available
only to SEBI regulated entities most banks are not allowed to access KRA and hence seek
complete documentation from FPIs again Such repetitive submission of documents to various
financial intermediaries results in long lead time for on-boarding and makes the entire process
operationally cumbersome for non-residents
Recommendation 11
The TF recommends that the KYC registration may be centralized across the financial market with
uniform documentation requirement All regulated financial market intermediaries should be
provided access to the centralized registry and they should be allowed to rely on online registry
86
for confirmation that KYC has been completed and itrsquos valid This will ensure that non-residents
undertake the KYC process only once and not with each financial intermediary that they deal with
in the onshore market Also such a mechanism offers cost and efficiency benefits for the financial
intermediaries
87
Annexure I
Key features of currency market of major EMEs
I USD-RMB Market ndash China
Onshore Deliverable - CNY Offshore Deliverable - CNH
Market
Turnover
Daily average turnover USD 28
billion
Daily average swap and
forward turnover
USD 62
billion
Daily average options
turnover
USD 15
billion
Daily average
turnover
USD 15-20
billion
Daily average
forward turnover
USD 25-30
billion
Daily average
Options turnover
USD 5-6 billion
Spot foreign
exchange Onshore CNY foreign exchange spot is
available with documentary proof of an
underlying transaction
Participating banks in Hong Kong
provide two types of spot RMB
exchange rate transactions
- For trade service and direct
investment purposes where
resulting foreign exchange
positions can be offset with the
clearing bank or onshore
correspondent banks and
For general purposes where banks need
to warehouse the risk or offset the
position in the interbank USD-CNH
market Forward
FXSwaps CNY forwards and foreign exchange
swaps with maturities of up to five years
are available to onshore institutions to
hedge foreign exchange exposure
subject to documentary proof of the
same
Most liquid is in the tenor of one year or less
CNH deliverable offshore forwards
are available out to five years
Liquidity has improved significantly
and has surpassed turnover in the
NDF market
FX Options Onshore market participants can buy or
sell common European options of CNY
against foreign currencies on a real
needs basis
Tenors are available out to three years
with further tenors on a case-by-case
basis Most liquid is in the tenor of one
year or less
The State Administration of Foreign
Exchange (SAFE) started allowing
corporates to sell FX options from August
2014 on a real needs basis and with net
settlement allowed
Deliverable CNH options are
available without restrictions to any
non-individual counterparty that has
a physical CNH Nostro account in
Hong Kong
Options on USD-CNH and CNH crosses
are available out to five years and
beyond on a case-by-case basis
88
Access to
domestic
participants
On the current account the CNY is
convertible subject to genuine
documentation Onshore entities can
access the local forwards market
provided these contracts are used to
cover current account transactions
subject to documentary proof available
on settlement
On capital account CNY conversions
may be settled by way of voluntary
settlement in banks if these are required
in the Companiesrsquo institutionsrsquo actual
business operation Typically all capital
account transactions need to be
registered with SAFE for local forwards
Not easily accessible to onshore
residents approvals required for transfer
of funds from Onshore to Offshore
Access to
Offshore
participants
Qualified
Foreign
Institutional
Investor
All allowed subject to
principle of actual
needs (Quota
restrictions exists
on underlying
investments)
Can trade via their
custodian or domestic
financial institution
Central
Banks
No quota restrictions
ability to trade as
interbank counterparty
in the domestic market
ndash bilateral or
anonymous trading
China
Interbank
Bond market
(CIBM)Bond
Connect
For OIIs (Overseas
Institutional Investors)
accessing making
CIBM investment can
enter
into all FX products on
actual needs basis with
settlement agent banks
Change in CIBM
investment position
requires adjustment to
the FX hedges within
5 working days
All customers can open a RMB account
in Hong Kong Banks can provide
customers with general purpose RMB
accounts which allow free transfers of
funds (offshore) for any purpose In
general all FX products are allowed in
CNH for offshore investors
Trading
Hours 10 AM ndash 4 PM Local China Hours 10 AM ndash 4 PM Local China Hours
89
II USD-KRW Market - Korea
Features Onshore Deliverable Offshore Non-Deliverable
Market Turnover Average daily turnover
USD
Billion
Spot Forward Swaps
2011 191 75 192
2012 180 66 198
2013 183 71 196
2014 175 76 190
2015 200 83 192
2016 194 96 184
2017 196 101 198 Source Bank of Korea
As per London clearing house
(LCH) Ltd the daily turnover of
NDF cleared by them on April
16 2019 is a total of USD 119
billion (Source LCH)
As per SEF turnover as on April
12 2019 is USD 379 million
(Source SEF)
Daily NDF turnover has
increased from USD 195 billion
in 2013 to USD 30 billion in
2016 (Source BIS 2016 survey)
Access to
domestic
participants
Residents can hold unlimited
amounts of foreign currency in
foreign currency bank accounts and
Korean firms can maintain foreign
currency accounts abroad
Financial institutional investors
have access to the local forwards
market and can hedge their
investment exposure without
confirming the lsquoexistencersquo of the
investment
Forward position limits of foreign
bank branches (FBBs) and local
banks registered as FX Banks in
Korea as below
- For FBBs positions are
capped at 200 per cent of the
previous month-end equity
capital
- For local banks forward
positions are capped at 40 per
cent of the previous month-
end equity capital
- Corporate customer foreign
currency hedging limits are
100 per cent of customersrsquo
exposure or their transaction
of underlying real assets
Residents may hold foreign
currency accounts domestically
or abroad
Corporate investors and
individual investors are required
to confirm the existence of the
investment
In the case of capital or current
account transactions domestic
residents can remit up to USD 50
000 per year freely
Access to
Offshore
participants
Non-residents can hold KRW
locally through bank accounts
Foreign investors must open special
investment purpose accounts
No restrictions and BoK does not
regulate the same
90
Source Bank of Korea BIS HSBC Research
which consist of an exclusive
external account for investment and
an exclusive non-resident domestic
currency account for investment
Foreign investors are allowed to
freely convert foreign currency into
KRW without any underlying
securities purchases while the
converted funds are being
transferred within exclusive
external investment accounts
However the converted funds in
the exclusive external account for
investment should still be used for
the purpose of securities
investment
Non-Resident Investors holding
Investment Registration Certificates
(IRC) sale proceeds from the
investment in securities can be
freely repatriated
Central Bank
intervention
BOK is now releasing a quarterly
intervention report on a net basis
They generally only comment that
they intervene only in exceptional
basis for smoothing operations
Bank of Korea does not access the
NDF market
Trading Hours 9 AM ndash 330 PM local Korea time Available through time zones
Taxation and
Repatriation of
FX Gains
All gains on unwind of deliverable
transactions are freely repatriable
without any tax
All gains on unwind of non-
deliverable transactions with
onshore banks are freely repatriable
without any tax
91
III USD-MYR Market ndash Malaysia
Onshore Deliverable Offshore Non-Deliverable
Market Turnover - Daily inter-bank market USDMYR
spot turnover around $500 million
- Daily inter-bank market USDMYR
swap turnover around $30 billion
- As per LCH Ltd UK Clearing
house the daily turnover of
USDMYR NDF cleared by them
on April 16 2019 is a total of
USD 332 million from 82 trades
(LCH website)
- As per SEF a trading platform
USDMYR turnover as on April
12 2019 is USD 205 million
from 18 trades (SEF website)
- As per the Hong Kong exchange
the NDF turnovers in 2016 were
around USD 50 billion and have
reduced to approximately USD
20 billion in 2018 (HKMA NDF
report 2018)
Access to Domestic
participants
- Resident counterparties such as
importers and exporters can use
currency options and forward
contracts to manage their foreign
exchange risk
- Residents are allowed to enter into
hedging arrangements on committed
current account transactions and
financial account transactions
- All forward contracts must be
supported by an underlying trade or
capital account-related transaction
allowed under the Foreign Exchange
Administration Rules
- Residents are allowed to freely
hedge and un-hedge their foreign
currency exposure for USD-MYR
CNH-MYR GBP-MYR EURMYR
and JPY-MYR currency pairs
without documentary evidence up to
an aggregate net open position of
MYR 6 million per bank
Not allowed
Access to Offshore
participants
- Licensed onshore banks and
approved investment banks are
allowed to enter into FX forward
Open and not regulated by the
central bank
92
Source Bank Negara Malaysia BIS HSBC Research
contracts with non-residents as
follows
Forward FX purchase or sale
contracts against MYR for
current account transactions
Forward FX purchase or sale
contracts against MYR based on
committed purchases or sales of
MYR assets The forward
contracts can be entered into at
the point when the non-resident
commits to purchase or sell the
MYR assets
- Dynamic hedging programme offers
flexibility to actively manage FX risk
exposure via forward hedging
activities with onshore banks or
Appointed Overseas Office (AOO)
without any documentation
CCP used Malaysian Exchange Not mandatory but LCH used
regularly
Central Bank
intervention
Through appointed agent banks Not applicable
Fixing to settle
NDF
NA KL USDMYR Reference rate
Trading Hours - Trading hour is 9 AM to 6 PM Local
Time Limited FX liquidity
available for non-residents post local
trading hours
- USDMYR is also quoted by
appointed overseas offices for spot
value only for any underlying asset
trades - post local trading hours No
forward prices are quoted
Quoted across time zones
Taxation and
Repatriation of FX
Gains
All gains on cancelled FX Contracts
are freely repatriable and do not
attract taxation in Malaysia
Taxed based on jurisdiction
93
IV USD-IDR Market - Indonesia
Onshore Deliverable Offshore Non-Deliverable Onshore Non-Deliverable
Market
Turnover
Average
daily spot
turnovers
USD 1bn
Average
daily swap
turnovers
USD 500
million
As per LCH Ltd - the
daily turnover of
USDIDR NDF cleared
by them on April 16
2019 is a total of USD
41 billion from 832
trades
As per SEF USDIDR
turnover as on April 12
2019 is USD 33 million
from 11 trades (Source
SEF)
As per HKTR Jan 2018
reporting the outstanding
IDR NDF turnover on
the Hong Kong exchange
of is around USD 40
billion (Source HKMA
NDF report 2018)
NDF
average size
USD 5m
Access to
Domestic
participants
Foreign currency against IDR
transactions between banks and
domestic parties over a certain
amount must have an underlying
transaction
Not Allowed Allowed but will need to
demonstrate underlying
documents
Access to
Offshore
participants
Non-residents must have
underlying IDR
assetliabilityreceivablepayable
to be able to enter into IDR cash
FX andor FX hedge BI list all the
permissible underlying activities
along with recommended
documentation format
Open and not regulated by
Bank Indonesia
Allowed but will need to
demonstrate underlying
documents
BI published a more-
stringent list of
permissible underlying
activities
Benefits Pricing uses onshore-curve
driven by onshore participants
and BI intervention
Not regulated and no
need for underlying
documentation
Prices available across
time zones
Can generated IDR
exposures without
having an underlying
asset in IDR
Pricing uses onshore-
curve driven by onshore
participants and BI
intervention (explanation
below) BI appears to
have a much bigger-
capacity to manage since
the product is net-settled
in IDR
94
Source Bank Indonesia BIS HSBC Research
Clients with IDR FX
exposure but no urgent
need for principal-
exchange As example
long-term IDR bond
investors
Limitations Requirement for underlying
docs limit the maximum
exposure that foreign Clients
can take
BI restricts Domestic Banks
from having residual-risk
when dealing Derivatives with
Related-Parties (locally
incorporated banks only)
Convertibility risk Requirement for
underlying docs limit the
maximum exposure
Foreign Clients can take
Clients with actual need
for principal-exchange
due to basis-risk between
[JISDOR fixing] vs
[actual FX rate] eg
Coupon repatriation and
BI restricts domestic
banks from having
residual-risk when
dealing derivatives with
related parties (locally
incorporated banks only)
Central
Bank
intervention
BI intervenes only in the onshore
market via Cash FX Onshore DF
and Onshore DNDF These can
be done via auctions or bilateral
OTC trades as there is no
onshore futures market for IDR
Bank Indonesia does not
access the NDF market
BI has the ability to intervene
in the DNDF market
although the market is very
new
Fixing to
settle NDF
Not Applicable JISDOR (USD-IDR)
JISDOR (USD-IDR)
Trading
Hours
Trading hours is from 8 AM ndash
12 PM Local Time and 1 PM
ndash 4 PM (Market breaks for
lunch between 12 PM ndash 1
PM)
USD-IDR is also quoted by
banks offshore for Spot value
only for any underlying asset
trades post local trading hours
No Forward prices are quoted
Quoted across time zones 8 AM ndash 12 PM Local
Time 1 PM ndash 4 PM
(Market breaks for lunch
between 12 PM ndash 1 PM)
Taxation
and
Repatriation
of FX Gains
As per market practice gains on
any unwindcancellation of FX
hedges are not passed to Non-
Residents
Taxed as per jurisdiction As per market practice gains
on any unwindcancellation
of FX hedges are not passed
to Non-Residents
95
V USD-BRL Market - Brazil
Features Onshore Deliverable Offshore Non-Deliverable
Market Features Average daily spot USD 8 billion
Onshore B3 USD 14 billion
Average daily options
turnovers
USD 15 billion
Offshore NDF
turnover daily
USD 4
billion
Market Hours Market hours is 0900 to 1800 Hours
However liquidity is highest between 10
am ndash 12 pm and 2 pm ndash 4 pm local
hours
96
VI USD-TWD Market - Taiwan
Features Onshore Deliverable Offshore Non-Deliverable
Market
Features Average Daily
Spot
Turnovers
USD 3-4 billion
Average Daily
Swap
turnovers
USD 2-3 billion
Average
Options
Turnovers
USD 150 million
Average daily
turnovers
USD 2-4 billion
Market
Turnovers
- Onshore total Spot turnovers in
USDTWD for March 2019 were USD
31560 billion (Average daily turnover of
~ USD 10 billion)
- Data related to USDTWD swaps is not
readily available but total swaps amp
forwards dealt onshore (across currency
pairs) is ~ 5750 of the FX turnovers
USD 11504 billion in April 2016 (last
available data) [Source BIS]
Access to
Domestic
participants
There are no limits on the TWDrsquos trading
range versus other currencies but there are
convertibility limits on the capital account
- Access to domestic participants are
not allowed
- Local banksrsquo overseas branches to
participate in the TWD NDF
market These banks will also be
subject to the existing cap on net
NDF positions at 20 per cent of
each bankrsquos FX position (last
revised lower from 33 per cent in
December 2010)
Access to
Offshore
participants
Non-Resident
Foreign investors are allowed to enter
into onshore swapforward contracts for
hedging underlying investment in
Taiwan
FINIs (Foreign Institutional Investors)
can only conduct buy USDsell TWD
contract and the total contract amount
entered into by a foreign investor should
not exceed FINIs USD and TWD net
remitted-in capital (ie total remitted-in
funds minus total remitted-out funds)
Access to foreign exchange is divided
into three categories
- import and export
Open and not regulated by the central
bank
97
- cost of trade-related services
- Investments capital repatriation and
dividends
Currency options are permitted
For FINIsFIDIs all transactions must be
documented regardless of the amount
On the maturity of FX forward (or
forward leg of a swap deal) FINI may
have the following decisions
- To settle the contract on the maturity
day as originally dealt In this case
FINI needs to ensure sufficiency of
existing account balance That is
settlement of FX forward should
come from the existing funds in
Taiwan or funds from sale proceeds
of underlying investments
- To extend (ie rollover) the contract
to another period in this case on the
maturity day FINI has to settle the
difference between the original
forward contract rate and the mark-
to-market rate
If FINI rollovers the contract upon
maturity and incurs a gain upon rollover
the gain will be credited to the FINIs
account in Taiwan Such gain will be
treated as other income derived in
Taiwan
CCP used Taipei Exchange (TPEx) acts as the Central
Counter Party for and also covers all foreign
exchange transactions made by authorized
foreign exchange banks and offshore banking
units
Not mandatory but LCH used regularly
Central Bank
intervention
Central bankrsquos FX intervention is via agent
banks in the OTC market where onshore
TWD is traded One of the mechanisms
through which local currency pressure is
absorbed is through modulation of hedge
ratio of Lifers
Not applicable
Fixing to
settle NDF
NA Central bankrsquos FX intervention is via
agent banks in the OTC market where
onshore TWD is traded
Bloomberg TRY11ltIndexgt
Trading
Hours
- 9 AM ndash 4 PM Local Time
- Market breaks for lunch at 12 PM ndash 2 PM
Quoted across time zones
98
Source CBC BIS HSBC Research
Taxation and
Repatriation
of FX Gains
If FINI rollovers the contract upon
maturity and incurs a gain upon rollover
the gain will be credited to the FINIs
account in Taiwan Such gain will be
treated as other income derived in
Taiwan and therefore subject to 20
standard withholding tax In case that FX
loss incurs due to rollover FINI may
arrange funding to cover the loss if
necessary
FINI can choose one of the following
methods to calculate and pay for the
relevant tax Please however note that
the method is not changeable once it is
decided If FINI does not confirm which
method to be used the option 1) will be
applied
- Withhold related tax on FX gain
from each rollover or
- Netting FX gainslosses from
rollover within the same year or
- Netting FX gainslosses from
rollover and the total remitted-in
principals revaluation gainloss in
the year
If the foreign investor adopts option 2) or
3) above they must appoint or contact
their existing local tax agent (if any) in
Taiwan to file annual tax return
Taxed based on jurisdiction
99
Annexure II
Appendix to Chapter 3
A bivariate BEKK-GARCH (11) model as proposed by Engle and Kroner (1995) can be specified with
the system of conditional mean equations consists of VAR(p) models (p = 1 n) as given in eq (1) and
variance equation as in eq(2)
119884119905 = 120583 + sum Γ119894119884119905minus119894 + 120576119905119901119894=1 (1)
where 119884119905 = (1199101119905 1199102119905) 1199101119905 is exchange rate return in onshore market and 1199102119905 is exchange rate return in
offshore market at time t The parameter vector 120583 = (1205831 1205832) represents constants and Γ is a 2times2 matrix of
autoregressive terms The diagonal elements 120574119894119894 measure own lagged effect of the variables while the off-
diagonal elements 120574119894119895 capture the mean spillover from variable i to variable j
Taking into account the asymmetric responses of volatility ie volatility tends to increase more in response
to negative shocks (bad news) than positive shocks (good news) in the variances and covariances as
proposed by Kroner and Ng (1998) a BEKK representation of conditional variance equation can be written
as
119867119905 = 119862prime119862 + 119860prime120576119905minus1prime 120576119905minus1119860 + 119861prime119867119905minus1119861 + 119863prime120585119905minus1
prime 120585119905minus1119863 (2)
where 120585119905 would be 120576119905 if it is negative and zero otherwise The Eq (2) can be written in matrix form as
follows
119867119905 = [11988811 011988821 11988822
] + [11988611 11988612
11988621 11988622]
prime
[1205761119905minus1
2 1205761119905minus11205762119905minus1
1205762119905minus11205761119905minus1 1205762119905minus12 ] [
11988611 11988612
11988621 11988622]
+ [11988711 11988712
11988721 11988722]
prime
[ℎ11119905minus1 ℎ12119905minus1
ℎ21119905minus1 ℎ22119905minus1] [
11988711 11988712
11988721 11988722]
+ [11988911 11988912
11988921 11988922]
prime
[1205851119905minus1
2 1205851119905minus11205852119905minus1
1205852119905minus11205851119905minus1 1205852119905minus12 ] [
11988911 11988912
11988921 11988922]
In the above model the dynamic process of 119867119905 is a linear function of its own lagged values lagged squared
innovations and the cross-product of the innovations and asymmetric terms Volatility transmission
channel between onshore and offshore markets is represented by the off-diagonal parameters in matrices A
and B while the diagonal parameters in those matrices capture the effects of their own past shocks and
volatility The diagonal parameters in matrix D measure the response own past negative shocks while the
100
off-diagonal parameters 119889119894119895 show the response of one market to the negative shocks in the another market
to be called the cross-market asymmetric responses
MGARCH-BEKK Parameter Estimates
Spot and 1-Month NDF 1-Month Forward and NDF 1-Month Futures and NDF
Variable Coeff P-value Variable Coeff P-value Variable Coeff P-value
Mean Equation
DSPOT(-1) -063 000 DFW1M(-1) -064 000 DFUT1M(-1) -063 000
DSPOT(-2) -052 000 DFW1M(-2) -054 000 DFUT1M(-2) -053 000
DSPOT(-3) -031 000 DFW1M(-3) -033 000 DFUT1M(-3) -033 000
DSPOT(-4) -015 000 DFW1M(-4) -018 000 DFUT1M(-4) -019 000
DSPOT(-5) -010 000 DFW1M(-5) -012 000 DFUT1M(-5) -010 000
DNDF1M(-1) 062 000 DNDF1M(-1) 063 000 DNDF1M(-1) 062 000
DNDF1M(-2) 047 000 DNDF1M(-2) 049 000 DNDF1M(-2) 048 000
DNDF1M(-3) 030 000 DNDF1M(-3) 033 000 DNDF1M(-3) 035 000
DNDF1M(-4) 022 000 DNDF1M(-4) 023 000 DNDF1M(-4) 027 000
DNDF1M(-5) 013 000 DNDF1M(-5) 015 000 DNDF1M(-5) 016 000
Constant 001 029 Constant 001 003 Constant 001 013
DSPOT(-1) 013 000 DFW1M(-1) 013 000 DFUT1M(-1) 011 001
DSPOT(-2) 003 053 DFW1M(-2) 002 046 DFUT1M(-2) 000 098
DSPOT(-3) 005 042 DFW1M(-3) 003 033 DFUT1M(-3) 002 064
DSPOT(-4) 005 033 DFW1M(-4) 005 015 DFUT1M(-4) 004 041
DSPOT(-5) 002 067 DFW1M(-5) 001 068 DFUT1M(-5) 002 058
DNDF1M(-1) -009 000 DNDF1M(-1) -009 000 DNDF1M(-1) -009 001
DNDF1M(-2) -007 015 DNDF1M(-2) -007 003 DNDF1M(-2) -005 022
DNDF1M(-3) -005 033 DNDF1M(-3) -004 012 DNDF1M(-3) -002 065
DNDF1M(-4) 001 086 DNDF1M(-4) 001 076 DNDF1M(-4) 003 052
DNDF1M(-5) 001 079 DNDF1M(-5) 002 052 DNDF1M(-5) 001 067
Constant 001 038 Constant 001 011 Constant 001 017
Variance Equation
C(11) 005 000 C(11) 005 000 C(11) 003 000
C(21) 005 000 C(21) 005 000 C(21) 003 000
C(22) -001 004 C(22) 001 000 C(22) 005 000
A(11) 027 000 A(11) 027 000 A(11) 014 000
A(12) 004 042 A(12) 005 032 A(12) -012 004
A(21) -004 029 A(21) -004 034 A(21) 007 010
A(22) 019 000 A(22) 018 000 A(22) 029 000
B(11) 096 000 B(11) 096 000 B(11) 098 000
B(12) -001 020 B(12) -002 003 B(12) 003 004
B(21) 001 037 B(21) 001 029 B(21) -001 048
B(22) 098 000 B(22) 098 000 B(22) 094 000
D(11) -023 001 D(11) 027 000 D(11) 020 001
101
D(12) -037 000 D(12) 035 000 D(12) 024 000
D(21) 022 000 D(21) -025 000 D(21) -016 000
D(22) 028 000 D(22) -028 000 D(22) -012 006
102
Annexure III
Evolution of Onshore Exchange Traded Currency Derivatives Market
Exchange Traded Currency Derivatives (ETCD) were launched in August 2008 in India with the
introduction of futures contracts on US Dollar-Rupee currency pair as the underlying
Subsequently in the year 2010 Rupee future contracts were allowed to trade against three other
currencies viz Euro Pound sterling and Japanese yen The options contracts were introduced on
US Dollar-Rupee currency pair in year 2010 The Reserve Bank of India (RBI) and Securities
Exchange Board of India (SEBI) allowed participation for all resident individuals including
corporates Trading Members and Banks in proprietary capacity on ETCD
In the year 2012 it was decided to lower the open position limits for banks on the back of volatility
in rupee and to exclude the positions in ETCD from Net Overnight Open Position Limit (NOOPL)
Thereafter in the year 2013 the Rupee depreciated sharply against USD due to huge capital
outflows in both equity and debt markets expectation of unwinding of Quantitative Easing by US
FED and increase in current account deficit Additionally the open position limits for the
participants were decreased and banks were restricted from participating on their own accounts in
the ETCD market further the participants were also prohibited from taking positions beyond
USD 10 million
In June 2014 Banks were allowed to engage in proprietary trading in ETCD markets Domestic
participants were allowed to have open position beyond USD 15 million subject to the evidence
of underlying exposure In 2018 this limit was raised to USD 100 million across all currency pairs
involving INR put together and combined across all exchanges
Foreign Portfolio Investors (FPI) and Non-Resident Indians (NRIs) were permitted to participate
in ETCD markets for hedging currency risk arising out of their investments in India in 2014 and
2017 respectively In February 2018 SEBI and RBI permitted currency derivatives on cross
currency pairs - EURUSD GBPUSD and USDJPY- and currency options on EURINR GBPINR
and JPYINR In December 2018 weekly options on US Dollar - Indian Rupee currency pair were
permitted As on date derivatives are available on seven currency pairs - USDINR EURINR
GBPINR JPYINR EURUSD GBPUSD and USDJPY
103
The exchange traded currency derivatives draws participation from diverse categories of
participants Some of the key participant categories include banks corporates trading members
foreign investors and other investors The following are the turnover of exchanges
FY National Stock Exchange of India (All figures in USD billions)
USD-INR futures USD-INR Options
(Notional turnover)
USD-INR Options
(Premium )
2014-15 32630 12618 052
2015-16 37374 26600 092
2016-17 31887 35271 107
2017-18 33818 37714 117
2018-19 57913 54183 204
FY
BSE (All figures in USD billions)
USD-INR futures USD-INR Options
(Notional turnover)
USD-INR Options
(Premium)
2014-15 20740 9609 081
2015-16 27713 13772 044
2016-17 27521 21034 045
2017-18 30146 37552 041
2018-19 45956 59350 051
FY Metropolitan Stock Exchange of India (All figures in USD billions)
USD-INR futures USD-INR Options
( Notional turnover )
USD-INR Options
( Premium )
2014-15 18274 593 593
2015-16 8433 646 646
2016-17 8233 367 367
2017-18 3032 491 491
2018-19 1060 245 245
104
Present Regulatory Framework (client limits open interest limits need for underlying
exposure etc)
a) Position limits for different client categories for FCY-INR currency pairs
bull Position limits of clients and Category III FPIs- The gross open positions of the client
across all contracts in the respective currency pairs shall not exceed the limits as mentioned
below
Currency Pairs
Position limits
USD-INR Gross open position across all contracts shall not exceed
6 of the total open interest or USD 10 million whichever
is higher
EUR-INR Gross open position across all contracts shall not exceed
6 of the total open interest or EUR 5 million whichever
is higher
GBP-INR Gross open position across all contracts shall not exceed
6 of the total open interest or GBP 5 million whichever
is higher
JPY-INR Gross open position across all contracts shall not exceed
6 of the total open interest or JPY 200 million whichever
is higher
bull Proprietary position limits of non-bank stock brokers- The gross open positions of the
proprietary account across all contracts in the respective currency pairs shall not exceed
the limits as mentioned below
Currency Pairs
Position limits
USD-INR Gross open position across all contracts shall not exceed 15
of the total open interest or USD 50 million whichever is
higher
EUR-INR Gross open position across all contracts shall not exceed 15
of the total open interest or EUR 25 million whichever is
higher
GBP-INR Gross open position across all contracts shall not exceed 15
of the total open interest or GBP 25 million whichever is
higher
JPY-INR Gross open position across all contracts shall not exceed 15
of the total open interest or JPY 1000 million whichever is
higher
105
bull Position limits of stock brokers (bank and non-bank) Category I and II FPIs- The
gross open positions of trading members across all contracts in the respective currency
pairs shall not exceed the limits as mentioned below
Currency Pairs
Position limits
USD-INR Gross open position across all contracts shall not exceed
15 of the total open interest or USD 100 million
whichever is higher
EUR-INR Gross open position across all contracts shall not exceed
15 of the total open interest or EUR 50 million whichever
is higher
GBP-INR Gross open position across all contracts shall not exceed
15 of the total open interest or GBP 50 million whichever
is higher
JPY-INR Gross open position across all contracts shall not exceed
15 of the total open interest or JPY 2000 million
whichever is higher
Domestic clients shall ensure that the position across exchanges is within the prescribed
limit of USD 100 million equivalent If position is in excess of USD 100 million
equivalent clients are required to provide disclosure of underlying exposure to Trading
Member as per existing practice
bull Proprietary positions created in FCY-INR pairs (USD-INR EUR-INR GBP-INR
and JPY-INR)
Single INR limit for proprietary
position for bank stock broker
Single INR limit for proprietary
position for non-bank stock broker
Higher of 15 of total OI across all
FCY- INR pairs or USD 200 million
Higher of 15 of total OI across all
FCY-INR pairs or USD 100 million
b) Position limit for Cross Currency Derivatives are given below
bull Position limits for stock brokers (banks and non-bank) Category I amp II FPIs
Domestic Institutional investors (DIIs) as permitted by the respective sectoral
regulators and AD Category-I banks-
106
Currency Pairs
Position limits
EUR-USD Gross open position across all contracts shall not
exceed 15 of the total open interest or EUR 100
million whichever is higher
GBP-USD Gross open position across all contracts shall not
exceed 15 of the total open interest or GBP 100
million whichever is higher
USD-JPY Gross open position across all contracts shall not
exceed 15 of the total open interest or USD 100
million whichever is higher
The aforementioned limits shall be the total limits available to the stock brokers for
taking positions on proprietary basis and for positions of their clients
bull Position limit for proprietary position of non-bank stock brokers-
Currency Pairs
Position limits
EUR-USD Gross open position across all contracts shall not
exceed 15 of the total open interest or EUR 50
million whichever is higher
GBP-USD Gross open position across all contracts shall not
exceed 15 of the total open interest or GBP 50
million whichever is higher
USD-JPY Gross open position across all contracts shall not
exceed 15 of the total open interest or USD 50
million whichever is higher
bull Position limits for Clients and Category III FPIs-
Currency Pairs
Position limits
EUR-USD Gross open position across all contracts shall not
exceed 6 of the total open interest or EUR 10
million whichever is higher
GBP-USD Gross open position across all contracts shall not
exceed 6 of the total open interest or GBP 10
million whichever is higher
USD-JPY Gross open position across all contracts shall not
exceed 6 of the total open interest or USD 10
million whichever is higher
107
Annexure IV
Comparison of onshore and offshore Rupee derivatives volumes
1 Exchange Traded Market
All figures in USD billions
Table Comparison between onshore and offshore exchange traded INR-USD Futures
FY Onshore Offshore Market Share
BSE NSE MSEI Total DGCX SGX CME Total Onshore Offshore
2014-15 21115 32491 9433 63040 31704 3704 396 35804 6378 3622
2015-16 27904 37241 4539 69685 32725 13906 1001 47631 5940 4060
2016-17 26528 31799 4300 62626 34149 17164 1636 52949 5419 4581
2017-18 30360 33729 1761 65851 33458 28047 5232 66737 4967 5033
2018-19 44820 57237 648 102705 35452 37599 7475 80526 5605 4395
Note-
i Data for BSE NSE amp MSEI is from Exchange websites for USDINR Futures
ii Data for DGCX SGX and CME is from Bloomberg and India INX Research
iii Data for DGCX includes INRUSD Futures (including mini contract) but excludes the USDINR Index
Quanto futures
iv Data for CME includes the Mini and Micro contracts
v Data for FY 2018-19 is from April 01 2018 to March 22 2019
2 OTC Market (as per BIS Quarterly Review December 2016)
108
Annexure V
Meetings held by the Task Force
Sr No Date Venue External Participants Invited
1 March 19 2019 RBI Mumbai
2 March 25 2019 RBI Mumbai -Shri Ananth Narayan Professor SPJMIR
-FEDAI
-Select corporates
3 April 04 2019 RBI Mumbai -Shri G Padmanabhan Former Executive
Director RBI
-Dr V Anantha Nageswaran Dean IFMR
Chennai
-GIFT City IFSC
-National Stock Exchange Ltd
-BSE Ltd
4 April 23 2019 RBI Mumbai -Select FPIs (through audio conference)
5 May 14 2019 RBI Mumbai -Select FDIs (through audio conference)
6 May 31 2019 RBI Mumbai -Shri G Padmanabhan Former Executive
Director RBI
-FIMMDA
-CCIL
-IBA
7 June 20 2019 RBI Mumbai -Smt Shyamala Gopinath Former Deputy
Governor RBI
8 July 04 2019 SEBI Mumbai -Shri G Padmanabhan Former Executive
Director RBI
9 July 10 2019 RBI Mumbai -Smt Shyamala Gopinath Former Deputy
Governor RBI
109
Annexure VI
References
A Santaella Julio (2015) ldquoCurrency carry trades in Latin Americardquo Bank for International
Settlements BIS Paper No 81
Behera Harendra Kumar (2011) ldquoOnshore and offshore market for Indian rupee recent evidence
on volatility and shock spilloverrdquo Macroeconomics and Finance in Emerging Market Economies
Vol 4 No 1 March 2011 pp 43ndash55
Cadarajat Yayat and Lubis Alexander (2012) ldquoOffshore And Onshore IDR Market An Evidence
On Information Spilloverrdquo Bulletin of Monetary Economics and Banking April 2012
Capital Account Safeguard Measures in the ASEAN Context (2019) ASEAN Working Committee
on Capital Account Liberalisation Bank Indonesia Occasional Papers OP12019
Colavecchio Roberta and Funke Michael (2006) ldquoVolatility transmissions between renminbi and
Asia-Pacific onshore and offshore US dollar futuresrdquo BOFIT Discussion Papers Bank of
Finland Institute for Economies in Transition No16
Darbha Gangadhar (2012) ldquoA Tale of One Asset and Two Markets ndash Analysis of Dynamic
Interactions between On- and - Off Shore Marketsrdquo macrofinancenipfporginPDF13-
11sl_Darbha_NDFNimranapdf
DING David K Tse Y and Williams M The Price Discovery Puzzle in Offshore Yuan
Trading Different Contributions for Different Contracts (2012) Financial Management
Association International Conference Research Collection Lee Kong Chian School Of Business
Doukas J and H Zhang (2013) ldquoThe performance of NDF carry tradesrdquo Journal of International
Money and Finance vol 36 September pp 172ndash90
Goyal R R Jain and S Tewari (2013) Non deliverable forward and onshore Indian rupee market
a study on inter-linkages Reserve Bank of India Working Paper Series 112013 December
Guru Anuradha (2009) ldquoNon-Deliverable Forwards Market for Indian Rupee An Empirical
Studyrdquo Indian Journal of Economics and Business Vol 8 No 2 pp 245-260
Higgins Patrick and Owen F Humpage (2005) ldquoNondeliverable Forwards Can We Tell where
the Renminbi Is Headedrdquo Federal Reserve Bank of Cleveland September
Hutchison Michael Jake Kendall Gurnain Pasricha Nirvikar Singh (2009) ldquoIndian Capital
Control Liberalisation Evidence from NDF Marketsrdquo NIPFP Working Paper No 200960
110
Indira Gandhi Institute of Development Research (IGIDR) Finance Research Group (2016)
ldquoFeatures and trends of NDF markets for emerging economy currencies a study of the Indian
rupeerdquo IGIDR working paper March
Ishii Shogo İnci Oumltker-Robe and Li Cui 2001 Measures to Limit the Offshore Use of
Currencies Pros and Cons IMF Working Paper WP0143
Lipscomb Laura (2005) ldquoAn Overview of Non-Deliverable Foreign Exchange Forward Marketsrdquo
Federal Reserve Bank of New York May
Ma G C Ho and R McCauley (2004) The markets for non-deliverable forwards in
Asia BIS Quarterly Review June pp 81-94
Maziad Samar and Kang Joong Shik RMB Internationalization OnshoreOffshore Links (May
2012) IMF Working Paper No 12133
McCauley R C Shu and G Ma (2014) ldquoNon-deliverable forwards 2013 and beyondrdquo BIS
Quarterly Review March pp 75ndash88
McCauley RN Shu C (2016) ldquoNon-deliverable forwards impact of currency internationalisation
and derivatives reformrdquo Technical report Bank of International Settlements
McCauley Robert N and Scatigna Michela Foreign Exchange Trading in Emerging Currencies
More Financial More Offshore (March 2011) BIS Quarterly Review March 2011
Misra Sangita and Behera Harendra (2006) ldquoNon Deliverable Foreign Exchange Forward
Market An Overviewrdquo RBI Occasional Papers Vol 27 No3
Park Jinwoo (2001) ldquoInformation flows between non-deliverable forwards (NDF)and spot
markets Evidence from Korean currencyrdquo Pacific Basin Finance Journal Vol 9 (4) pp363-377
Ryoo Sangdai and Kwon Taeyong and Lee Hyejin Foreign Exchange Market Developments
and Intervention in Korea (October 2013) BIS Paper No 73o
Sarwono Hartadi A (2005) ldquoIndonesian policy on non-residentsrsquo participation in the money
market the restriction of rupiah transactions by non-residents and foreign currency credit offered
by banks to non-residentsrdquo BIS Paper No 23
Standing Council on International Competitiveness of the Indian Financial System (2015)
International competitiveness of currency equity and commodity derivatives markets Department
of Economic Affairs Ministry of Finance
Wang Kai-Li Fawson Christopher and Chen Mei-Ling (2007) ldquoInformation Flows among
Exchange Rate Markets What Do We Learn From Non-Deliverable Forward Markets in Asiardquo
Chaoyang University of Technology October
111
Watanabe K H Akama and J Mifune (2002) ldquoThe effectiveness of capital controls and
monitoring the case of non-internationalisation of emerging market currenciesrdquo EMEAP
Discussion Paper January

9
I trust that the Reserve Bank of India will find the recommendations made in the report useful
Usha Thorat
Chairperson
10
Executive Summary
The origin of the NDF markets may be traced back to the 1990s when a wave of capital account
liberalisation in emerging market economies (EMEs) triggered a surge in capital inflows to these
economies and consequently heightened the currency risk faced by foreign investors Under-
developed domestic markets especially the market for financial derivatives as well as controlled
access to onshore markets raised the demand for a currency market outside the reach of local
regulations Another trend that supported the growth of the NDF market was the sharp rise
globally in the size of derivatives markets in the 1980s and 1990s As derivatives markets evolved
the speculative search for underlying moved out of the developed world into more esoteric assets
Following the successful speculative attack on the Sterling in 1992 EME currencies became viable
subjects for such speculative positioning Such activity becomes particularly noticeable during
times of stress as offshore risk spills over to the domestic exchange rate through entities that have
a presence in both onshore and offshore markets usually global banks but also corporates
A study of the degree and direction of such spillovers is important to understand the role of NDF
markets and assess policy alternatives The econometric study conducted by the Task Force
observed that the influence between offshore and onshore exchange rate goes both ways in normal
times that is it is bidirectional The study also observed that during the last two stress episodes
(the taper tantrum and the 2018 emerging markets crisis) the relationship turned unidirectional
with the NDF market driving onshore exchange rate The study concludes that as NDF volumes
have increased they have begun to play an important role in both price discovery and driving
volatility particularly during heightened uncertainty period The study also shows that periods of
divergence are limited and the markets converge and that too fairly rapidly
Against this backdrop and in the light of available information results of the statistical analysis
and most importantly based on the feedback received during the various consultations the Task
Force is making following recommendations in accordance with the terms of reference
i Onshore market hours may be suitably extended to match the flexibility provided by the
offshore market and thereby incentivize non-residents to hedge in the onshore market
ii Banks may be allowed to freely offer prices to non-residents at all times out of their Indian
books either by a domestic sales team or by using staff located at overseas branches
11
iii Non-deliverable Rupee derivatives (with settlement in foreign currency) may be allowed
to be traded in the IFSC and IBUs may be allowed to deal in such derivatives with a distinct
FCY-INR position limit To start with exchange traded currency derivatives involving
Rupee may be introduced and with experience non-deliverable OTC currency derivatives
involving Rupee may be allowed subsequently
iv While requirement of underlying exposure will continue for trading in the onshore market
users may be allowed to undertake positions up to USD 100 million in OTC as well as
exchange traded currency derivative market without having to establish the underlying
exposure
v The TF endorses the principle-based regulatory approach adopted in the draft regulation
on hedging by non-residents released by the RBI on February 15 2019 Also back-to-back
hedging by non-residents proposed under these draft regulations is endorsed Further in
case of hedging of anticipated exposures gains from cancellation of contract may be
allowed to be passed on even in cases where there are no cash flows at the discretion of
the bank where the bank considers the cancellation of underlying cash flow is due to
external factors which are beyond the control of the user
vi For ease of entering into hedge transactions for non-residents the TF recommends
a Establishment of a central clearing and settlement mechanism for non-residentsrsquo
deals in the onshore market
b Implementation of margin requirement for non-centrally cleared OTC derivatives
in the onshore market at the earliest
c Allow Indian banks to post margin outside India
d Wider access to FX-Retail trading platform to non-residents
vii A technology-based solution may be explored to centrally aggregate the investments of
non-residents and derivative contracts entered into by them in the onshore market (both
OTC and exchange traded) using LEI or any other unique identifier to start with
viii The issue of taxation in respect of foreign exchange derivative contracts may be examined
with the objective of overcoming gaps between tax regime in India and other major
international financial centres to the extent possible
ix KYC registration may be centralized across the financial market with uniform
documentation requirement
12
Chapter 1
Introduction
Currency is a component of sovereign money which is legal tender issued by the state The
external value of the currency the exchange rate is one of the most important economic and policy
variables which affects economic incentives and activity The exchange rate is determined mostly
by market forces of supply and demand which influence its flows across international borders
The exchange rate has critical information value in guiding financial and economic decisions
which affect real economic variables The stability and predictability of the exchange rate also has
a critical influence on growth and financial stability
Cross-border trade in goods services and assets (or capital) necessitates exchange of one currency
into another and can be thought of as the primary reason why currency markets exist However
as in any other financial market speculative elements ndash who take positions not for settling any
underlying transactions but for benefitting from market movements ndash are important participants
who perform the function of imparting depth to the market The aggregate actions of all
participants ndash hedgers arbitrageurs as well as speculators - determine the value and fluctuation of
the exchange rate
The currency markets for rupee especially for exchange against the USD are fairly well-
developed today One can classify these markets in three categories (a) spot versus derivatives
(b) over-the-counter (OTC) versus exchange-traded and (c) onshore versus offshore Further
derivatives can be cash-settled or delivery-based The most commonly referred benchmark
exchange rate of the rupee is from the onshore spot OTC market Similarly the commonly referred
forward exchange rate of the rupee is from the onshore forward OTC market Rupee futures and
options are traded in some onshore as well as offshore exchanges
The classification of currency markets can also be in terms of the nature of contracts between
buyers and sellers - spot forwards (futures on exchanges) and options contracts A spot contract
is for standard settlement ie the second working day after the date of transaction whereas in
case of forwards and futures (as well as options) the actual exchange or delivery of currency takes
place in the future at a date later than the spot settlement date There are also non-deliverable
forward contracts which are discussed below Forward and futures contracts are used as a risk
management tool or to hedge against possible adverse fluctuation in exchange rates It is important
13
to note that hedging implies risk transfer between the contracting parties it is not elimination of
risk
The category of the currency market that forms the focus of this report is the Offshore Rupee
markets The dominant segment of this market is the Non-Deliverable Forward (NDF) market ndash
wherein foreign exchange forward contracts are traded in the OTC market at offshore locations
generally the International Finance Centres (IFCs) like Singapore Hong Kong London Dubai
and New York These contracts do not involve a physical exchange of Rupees as Rupee is not
deliverable offshore and allow counter-parties to settle profit or loss in a convertible currency
usually the US Dollar which is why it is called a non-deliverable market NDF contracts are
usually traded on currencies which are not readily available to trade globally or outside of
sovereign boundaries These are thus mainly currencies from countries which have partial or no
capital account convertibility
There are also a few exchange-traded offshore rupee markets dealing in rupee futures and options
in Chicago Singapore and Dubai Volumes in these markets have typically been far smaller in
comparison to the offshore NDF OTC market Data on transactions in exchange-traded currency
markets can be ascertained with greater certainty whereas data on transactions in offshore OTC
NDF market have to be gauged through surveys and the estimates on the same are less firm
Why do NDF Markets Exist
NDF markets are not a phenomenon peculiar to the Indian Rupee they are common for currencies
of many emerging market economies (EMEs) As per BIS data NDFs in six currencies ndash Korean
Won Indian Rupee Chinese Renminbi Brazilian Real Taiwanese Dollar and Russian Ruble ndash
account for about two-thirds of the trade in NDFs globally The total daily average volume in NDF
markets is about USD 200 billion as per Bank of International Settlements (BIS) survey1 As per
this survey the share of India was about 1822 per cent of the trade in NDFrsquos globally (see Table
2 Chapter 2) The 2016 BIS survey (the next one will be released in the later part of 2019) showed
that offshore trades in Indian rupee were more or less equal to deliverable onshore forwards
1 2016 Triennial Central Bank Survey of Foreign Exchange and OTC Derivatives Markets
14
around $16 billion daily The 2018 Bank of England reported $23 billion in offshore rupee trades
while RBI sources estimate deliverable daily onshore forwards at $21 billion for 20192
The size of an open economy is one of the primary determinants of international participation in
its currency If international participants do not have direct access to the on-shore currency market
to meet their transaction needs or to hedge their currency exposure they are likely to use the
offshore NDF market The size depth and liquidity of the offshore NDF is thus indicative of the
non-resident interest in an emerging market economy
To some extent the offshore NDF market complements the need for a deep and liquid onshore
currency market What is the appropriate size of the forex market for an emerging market
economy with partially open capital account is determined by its size the share of foreign trade
and appetite for capital flows One proxy for estimating how large the forex market ought to be is
the GDP of the economy A better estimate could be the size of the open economy the trade and
investment sector
As Indiarsquos economy has grown over the past two and a half decades it has seen a significant rise
in openness (ie trade to GDP ratio has grown from 15 in 1990 to 43 in 2018) and in cross
border capital flows This has commensurately raised non-resident interest in the Rupee whether
for risk management purposes or for speculative ends The growing size of the Rupee NDF market
points to a need to widen participation in on-shore markets
The existence and size of offshore NDF markets is also a function of the degree of difficulty that
participants in foreign exchange market (especially non-residents) ndash both speculators and other
participants with requirements arising from cross-border trade transactions ndash face in accessing the
onshore markets The difficulties in accessing onshore currency markets could span a variety of
issues including the following
bull Restrictions on foreign exchange transactions
bull Cumbersome documentation and Know-Your-Customer (KYC) requirements for
participants in the domestic market
bull Restrictions on market participants (especially non-residents) in hedging activities such as
transaction limits tenor limits other documentation etc
bull Restrictions on cancellation and re-booking of contracts
2 For comparison with offshore market the onshore data includes forwards and swaps
15
bull Restrictions on the kind of derivative products that are allowed by market regulators and
bull Inconvenient market hours for those in other time zones
These constraints exist either to curb excessive speculation or to maintain financial stability
Are Offshore Rupee Markets a Problem
When the offshore market volume is significant or larger than the onshore currency market
volume as is the case with many EME currencies it leads to two fragmented markets wherein the
price discovery on the onshore market becomes vulnerable to influences from the price discovery
in the offshore market Empirical evidence (see Chapter 3) shows that while at most times the
direction of the influence runs both ways ie from onshore market to offshore market and vice-
versa the direction of the influence is more dominant from offshore market to the onshore market
in times of high volatility This could happen especially when tidal forces from global financial
markets influence the currency markets in a synchronised manner such as during times of
Emerging Markets (EM) currency crises
There are essentially four issues with regard to offshore market that are critical for regulators ndash
i Effectiveness of exchange rate management Many central banks including the Reserve
Bank have exchange rate stability as one of their objectives and resort to market
intervention or other regulatory measures to control volatility of the exchange rate from
time to time Such influence however extends only to the onshore currency market
Presence of a large offshore market dilutes the effectiveness of the exchange rate
management by the central bank It also hinders the pursuit of the objective of financial
stability in the domestic market
ii Disjointed price discovery During periods of volatility in the currency market when
price discovery in the offshore market causes large movements in onshore currency
markets the onshore market could often open with a large gap over the previous close For
resident market participants who want to cover their positions such gaps expose them to
significant risk
iii Revenue loss Every unit of turnover in a market earns a certain revenue for the market-
making financial firms Thus turnover in the offshore market can be viewed as a potential
revenue loss for domestic financial firms and the domestic economy
16
iv Effectiveness of RBI regulations on capital account management RBIrsquos policies on
capital account have been geared towards managing the impossible trinity a ldquomanagedrdquo
exchange rate free capital movement and an independent monetary policy RBI policies
have been geared toward avoidance of undue volatility in foreign exchange markets by
having restrictions on cancellation and rebooking and excessive risk-taking by resident
entities including corporates With this objective RBI restricts participation of resident
entities in currency derivatives to the extent of their underlying exposures A large market
outside the influence of regulatory authorities undermines their effectiveness
Constitution of the Task Force
Against this backdrop it was announced in the Statement on Developmental and Regulatory Policy
dated February 7 2019 the setting up of a Task Force on Offshore Rupee Markets Accordingly
a Task Force headed by Smt Usha Thorat was constituted with following terms of reference
i Assess the causes behind the development of the offshore Rupee market
ii Study the effects of the offshore markets on the Rupee exchange rate and market liquidity
in the domestic market
iii Recommend measures to address concerns if any arising out of offshore Rupee trading
iv Propose measures to generate incentives for non-residents to access the domestic market
v Examine the role if any International Financial Services Centre (IFSC) can play in
addressing these concerns
vi Any other relevant issue(s) the Task Force considers relevant to the context
The Task Force comprises of the following
i Smt Usha Thorat former Deputy Governor Reserve Bank of India ndash Chairperson
ii Shri Anand Bajaj Joint Secretary Department of Economic Affairs Ministry of Finance
Government of India ndash Member
iii Shri G Mahalingam Whole Time Director Securities amp Exchange Board of India ndash
Member
iv Shri Ajit Ranade Chief Economist of the Aditya Birla Group ndash Member
v Shri Sajjid Chinoy Chief Economist India JP Morgan India ndash Member
17
vi Shri Surendra Rosha CEO India HSBC Bank ndash Member
vii Shri Rajiv Ranjan Adviser-in-charge Department of Economic Policy and Research
Reserve Bank of India ndash Member
viii Shri T Rabi Sankar Chief General Manager Financial Markets Regulation Department
Reserve Bank of India ndash Member Secretary
Approach of the Task Force
Among the different issues relating to offshore markets the argument concerning revenue loss is
perhaps the most simplistic and an obvious response could be for India to develop non-deliverable
Rupee derivative market in an International Finance Service Centre (such as the GIFT City) located
within the geographical boundary of India However such a market will be virtually no different
from the markets located in Singapore or London and hence the objective of bringing volumes to
the onshore market will remain unaddressed
From the standpoint of addressing the concerns arising out of the existence of large offshore
markets it would make sense to incentivise movement of as much currency market transactions
from such markets to onshore currency markets as possible However theoretically one needs to
recognise that there is a trade-off between the sizeprominence of the offshore market and the
extent of regulationsrestrictions that are placed on cross-border transactions and foreign exchange
marketsparticipants It is also important to note that even if all non-residents with underlying
exposure move their hedging transactions to onshore markets offshore markets would continue to
exist to meet the demand of participants who take a view on the exchange rate without any
underlying exposure ie the speculative demand
At one extreme of the above-mentioned trade-off if India opts for a full rupee convertibility ndash by
removing all restrictions on current and capital account transactions ndash along with removal of all
restrictions on currency derivatives then offshore markets would no longer be a relevant concept
Capital account convertibility has been a hotly debated issue in the discourse on public policy both
in India and globally The received consensus in the last couple of decades endorsed by the
International Monetary Fund (IMF) in 2012 is that while capital flows are an important aspect of
the international monetary system providing significant benefits for countries they also carry risks
for macroeconomic and financial stability especially if they are large and volatile and thus pose
a challenge for policy Hence capital flows management measures are justified to help harness the
18
benefits while managing the risks More generally some restrictions to the capital account are
necessary for India to avoid the ldquoimpossible trinityrdquo With an economy as large and diverse as
Indiarsquos which is therefore expectedly not completely synchronous to the global cycle retaining
the independence of monetary policy is imperative Similarly having some control over the
exchange rate is necessary given its occasional propensity to be excessively volatile and overshoot
with attendant feedback loops to the macro-economy Therefore capital flow management
measures become necessary to avoid the trilemma and ensure simultaneous fulfilment of the other
two objectives Based on this received consensus as well as the experiences of some emerging
market economies through the last two decades the Task Force has proceeded on the basis that
the existing framework of capital account management followed by the Government and the RBI
will continue
There is also the issue of de-jure capital account convertibility Even when speculators
arbitrageurs and traders do not have direct access to forex markets to exploit persistent interest rate
differentials or perceived mispricing of the currency there are alternative channels available in
the system which make the actual arbitrage opportunities much lower Some examples of such
instruments is the Overnight Indexed Swaps (OIS) market or the use of Mumbai Interbank
Forward Offer Rate (MIFOR) Hence the de-jure level of capital account convertibility (CAC)
could be much higher than implied by the existence of capital controls
A related issue is the internationalisation of rupee According to McCauley (2011) a currency is
internationalised when market participants ndash residents and non-residents alike ndash conveniently use
it to trade invest borrow and invoice in it Based on the experience of China to internationalise
Renminbi and the evidence of the narrowing of the gap between onshore forward rate and NDF
rates for Renminbi internationalisation of currency has been sometimes advocated as a way to
reduce the influence of offshore markets While one has witnessed issuance of rupee-denominated
bonds (ldquoMasala Bondsrdquo) in some offshore markets in the recent past internationalisation of rupee
is still a distant goalpost given the persistent current account deficit and the negative net
international debt position Thus internationalisation of rupee is not an explicit goal guiding the
recommendations of the Task Force
Further the Task Force believes that Indiarsquos approach to the trade-off between deregulation of
currency markets and tolerance of offshore market must be shaped by the specific considerations
of the Indian economy rather than following any global template blindly
19
Compared to countries like Korea Taiwan or China Indiarsquos macroeconomic structure is
significantly different India is a structurally an economy with twin deficits ndash both fiscal and
current account Nearly half of Indiarsquos consumer price index (CPI) basket comprises of food items
making Indiarsquos inflation more vulnerable to supply shocks Although Indiarsquos macroeconomic
stability has improved considerably in the last few years considering the above factors the Task
Force feels that India cannot risk macroeconomic instability through potential exchange rate
shocks by drastically lifting the restrictions on foreign exchange markets and participants
On the other hand large volumes in the offshore market also reflect the fact that the interest in
Rupee is far larger than what is evident in onshore currency markets This reflects the growing size
of the Indian economy greater role of India in the global economy and growth in trade and capital
flows Over time therefore it would be imperative for the Indian regulators to take steps to expand
the role of onshore currency markets gradually lest the disjointed price discovery issue flares up
more frequently and in larger degrees
The balanced approach of the Task Force therefore is to look at each of the difficulties faced by
market participants in accessing onshore currency markets and prioritise their resolution in such a
way that prudent regulatory considerations are least compromised For instance certain market
micro-structure issues (such as extending the market hours of onshore currency markets) can be
addressed relatively quickly without any regulatory compromise On issues related to
documentation and KYC requirements smart application of ease-of-doing-business principles
needs to be followed Economic entities which need to undertake hedging of their foreign exchange
exposure on account of genuine underlying exposures need to be given greater flexibility in
undertaking such transactions in domestic currency markets While the need for underlying
exposure in order to operate in the forward markets cannot be eliminated the way in which it is
evidenced and monitored can be simplified The Task Force has proceeded on the basis of the
existing principles of regulations of foreign exchange markets
Of course the Task Force recognises that the recommendations will not do away with the
economic imperatives for which trading of rupee forward contracts exists in offshore markets
With our recommendations the Task Force believes that regulatory concerns arising out of the
offshore markets can be reduced though not eliminated
The Task Force held nine meetings between March 2019 and July 2019 The details of the meetings
are given in Annex V
20
Chapter 2
The Evolution of NDF Markets and Cross-country Experience
The foreign exchange market in India during 1970s and 1980s was heavily controlled and closed
in nature with various kinds of restrictions in place The Indian foreign exchange market started
deepening with the transition to a market-determined exchange rate system in March 1993 and the
subsequent liberalisation of restrictions on various external transactions leading up to current
account convertibility under Article VIII of the Articles of Agreement of the International
Monetary Fund in 1994 Notwithstanding various measures taken to further deepen and broaden
the foreign exchange market in India various restrictions are still in place to limit market access
to only those with underlying exposure and prevent undue speculation As India gets increasingly
integrated with the global markets and the exchange rate is increasingly market determined a
combination of capital flows management measures and currency trading restrictions in the on
shore markets are used to manage the lsquoimpossible trinityrsquo external value of the rupee These
measures and restriction are under constant review to ensure that the overall objective of growth
through foreign trade and investment are served
Against this backdrop this chapter attempts to highlights evolution in section II a brief review of
literature on the reasons behind increase in turnover in NDF market in Asian countries has been
given in Section III Section IV highlights the developments in NDF market The country
experiences such as nature of restrictions on non-residents operating in domestic currency
forwards market liberalisation measures taken by countries and its impact in curbing offshore
market discussed in Section V
I Introduction
NDFs are foreign exchange derivative instruments on non-convertible or restricted currencies
traded over the counter (OTC) mainly at offshore centres ie outside the direct jurisdiction of the
respective national authorities It is essentially a forward contract with different settlement process
Unlike the standard forward contract which involves exchange of underlying currencies on
maturity the NDF contract is typically settled as the difference between an exchange rate agreed
months before and the actual spot rate at maturity in an international currency (deliverable) mainly
the US dollars And the other currency which is usually emerging market currency is non-
21
deliverable The settlement of the transaction is not by delivering the underlying pair of currencies
but by making a net payment in a convertible currency equal to the difference between the agreed
forward exchange rate and the subsequent spot rate (Ma et al 2004) NDF contracts can either be
traded over the counter market or at exchanges at offshore financial centres such as Hong Kong
Singapore and London Lately they have become popular derivative instruments catering to the
offshore investorsrsquo demand for hedging arbitraging and speculating including by those who look
upon currency as an asset class
The major participants in NDF market could include foreign businesses and investors doing
business in countries with complex requirements for hedging currency risk in the local markets
arbitragers who have access to both on shore and offshore markets pure speculators like hedge
funds and others who take positions in the NDF market While these are the end users there are
also market intermediaries like banks dealers and brokers who provide quotes for trading in these
currencies and custodians who provide settlement arrangements While the multinational
companies deal in both the long and short end of the market the short end of the market is
particularly dominated by the hedge funds (Misra and Behera 2006) The pricing is influenced by
a combination of factors such as interest rate differential between the two currencies supply and
demand future spot expectations foreign exchange regime and central bank policies
NDF market primarily evolved in response to under-developed onshore forward markets and
limited access to non-residents to currencies with foreign exchange convertibility restrictions An
important advantage that enhances the demand for NDF is reduced credit risk compared to onshore
counterparts since there is no exchange of principal and only the difference amount is settled thus
allowing investors to circumvent limits associated with onshore activity Other reasons which also
favoured the emergence of NDF market includes convenience of time zones location of customer
business operating from a global treasury for multinational companies short-trading hours in
onshore forex market capital controls by individual central banks position limits frictions like
registration norms and know your customer norms frequent and significant changes in regulations
and guidelines in the domestic exchanges and OTC markets Moreover credit risk is also less
relevant since mostly large foreign banks are engaged as a counterparty in NDF trading Further
offshore centres in some cases are better placed to offer competitive services compared to the
22
onshore market on account of various factors ranging from tax treatment less onerous regulations
and documentation to operational efficiency
II Evolution of NDF Markets
The origin of NDF market traces back to the 1990s when a wave of capital account liberalisation
in emerging market economies (EMEs) triggered surge in capital inflows to these economies and
consequently increased currency risk faced by the investors However under-developed domestic
forward market or restricted access to onshore forward market paved the way for evolution of NDF
market as an alternative hedging tool to these investors The widely shared concern amongst local
monetary authorities was that easy access to onshore market and availability of domestic currency
to non-residents will encourage speculative activity leading to greater exchange rate volatility and
eventually the loss of monetary control Consequently some international banks began offering
NDF contracts to meet the demand of investors willing to hedge their EM currencies exposure
during early 1990s (Higgins and Humpage 2005)
One of the earliest NDF market developed during early 1990s was in Mexican peso to speculate
on the currency ahead of the devaluation from its then fixed exchange rate against the US Dollar
The increase in trading turnover during that time was facilitated by the entrance of voice brokers
as intermediaries between inter-bank trading activities (Lipscomb 2005) The NDF market for
some Asian economies like Korean Won Taiwanese Dollar Indian rupee and Chinese Renminbi
existed since mid-1990s due to either restricted or no access to onshore forward markets by non-
residents (BIS 2004) In case of New Taiwan Dollar only onshore entities had access to onshore
markets while it was subjected to underlying requirements in case of Korean Won Indian rupee
and Chinese Renminbi For other currencies like Indonesian rupiah NDF market evolved after
the Asian financial crisis in response to re-imposition of capital restrictions which were liberalised
in early 1990s In Indonesia rapid liberalisation beginning as early as 1970s and further
internalisation of Indonesia rupiah enabled the development of deliverable offshore market for
rupiah Following the currency crisis initial measures were directed at curbing non-trade and
investment related forward transactions with non-residents and broader measures prohibiting
banks from extending loans conducting derivative transactions and transferring rupiah to non-
residents were introduced in early 2001 While Malaysia also imposed cross border restrictions
23
after the crisis evolution of NDF market in Ringgit was initially inhibited by comprehensiveness
of regulations as well as its effective enforcement by the authorities (Ishii 2001)
McCauley (2011) showed that as income per capita rises a currency trades in ever greater
multiples of the home economyrsquos underlying international trade (ldquofinancialisationrdquo) and trades to
an even greater extent outside its home market (ldquointernationalisationrdquo) The increasing economic
interest in emerging market economies as a result of upbeat growth scenario from 2000s spurred
greater participation in currencies of these economies (Chart 1) In this context increasing turnover
in the Indian rupee Chinese Renminbi and other Asian currencies like Indonesian rupiah
Malaysian Ringgit Korean Won and New Taiwanese Dollar is consistent with increased
investment in these economies amidst restricted access to onshore markets Both India and China
recorded phenomenal growth rates translating into increased businesses (trade and investments)
with rest of the world and resulting exposures facilitated offshore trading of their currencies (Chart
2 a amp b) During 1990s mostly non-residents with genuine exposure used NDF market to hedge
their exposures in Indian rupee However with the development of onshore market providing
reasonable hedging facilities to foreign investors amidst gradual relaxation of controls most of the
market activity seems to be driven by speculators and arbitrageurs and those who are looking at
the rupee as a separate asset class to diversify their portfolios in view of its growing international
importance As a result the size of NDF market has grown over time In the Chinarsquos case the
emergence of offshore deliverables market for Renminbi (CNH) since 2010 was mainly due to
internationalisation of Renminbi which gradually substituted the NDF market
24
Chart 1 a amp b FX turnover Indexed 1998=100 and FX TurnoverTrade vs GDP
Source BIS Triennial survey IMF CEIC
Note Chart 1b A higher ratio of FX turnover to trade indicates that a currency trade in higher multiple
relative to its underlying trade as GDP increases
Chart 2 a amp b Gross trade Indexed 2000=100 and Gross trade vs FX turnover
Source IMF BIS World Bank
Both Indonesia and Malaysia have witnessed sharp increase in non-resident participation in local
currency bond market particularly in the aftermath of global financial crisis 2008 while these
countries local forward markets imposed restrictive conditions that restricted use of these markets
for hedging this led to the increased use of NDF market Non-resident ownership of government
debt in Indonesia and Malaysia as share of total outstanding government debt stood at 383 per
0
100
200
300
400
500
600
200
0
200
2
200
4
200
6
200
8
201
0
201
2
201
4
201
6
201
8
WorldAsiaEmerging and developing economiesAdvanced economies
0
1000
2000
3000
4000
0
200
400
600
800
1000
1200
1998 2001 2004 2007 2010 2013 2016
BRL IDR
CNY INR
MYR TWD
KRW right scale
Brazil
Korea
Indonesia
China
India
Malaysia
0
5
10
15
20
25
30
01 10 100 1000
GD
P p
er c
apit
a (U
SD
in t
ho
usa
nd
s)
FX turnover to trade (in log form)
Brazil
China
Indonesia
India
Korea Malaysia
Thailand
00
10
20
30
40
50
60
70
0 25 50 75 100 125 150
FX
turn
over
to
GD
P
External trade to GDP
25
cent and 243 per cent as at the end of March 2019 respectively highest amongst other Asian
economies However foreign participation in equity market is higher for Korea and Taiwan While
Taiwan has limits on investments in domestic bonds by non-residents foreign investors are not
subject to any investment ceiling for both aggregate and individual holdings in a listed company
except for a few restricted industries
Additionally the reason for growing NDF market could be increased carry trade activities for high
yielding currencies After examining the returns of carry trades with deliverable and non-
deliverable forwards Doukas and Zhang (2013) found that carry trades for currencies with NDF
contracts perform better compared to carry trades for currencies with deliverable forward
contracts This excess return is attributed to the compensation of risks emanating from currency
convertibility and capital controls For the Brazilian Real (BRL) derivatives offshore NDFs in
particular are the main vehicle for investors looking to implement carry trades (BIS Santaelaa
2015)
NDF market evolved mainly for emerging market economies witnessing increased economic
interest in the process of transition to high growth phase since 1990s whilst restrictions persisted
in accessing onshore markets for hedging currency risk arising out of these exposures The NDF
market also provided an opportunity to speculate on currencies which underwent notable shift in
their exchange rate regime During periods of global uncertainties like in 2013 during ldquotaper
tantrumrdquo the NDF market is used for speculative purposes arguably causing disruptions in
domestic forex market
III Size of the NDF market
Given that NDF is an over the counter (OTC) traded instrument the turnover data relies on various
surveys conducted by institutions at different time intervals In view of this issues like
comparability and continuity in data often arises However these surveys still provide useful
information to gauge the growth of NDF market over time Results from the semi-annual turnover
survey for the Foreign Exchange Joint Standing Committee chaired by Bank of England (BoE)
suggests that growth of NDF market has outpaced the forward market as well as overall foreign
exchange market In London the average daily NDF turnover surged to USD 139 billion as per
26
the latest survey in October 2018 from as low as USD 21 billion in 2008 During this period NDF
turnover quadrupled and its share increased to 53 per cent of overall forex turnover and comprised
nearly 34 per cent of both onshore and offshore forwards compared to nearly 10 per cent in 2008
Table 1 NDF trading in London (Average daily turnover in billions of US dollars)
NDFs All forwards NDF of all
forwards
All FX NDF as of all FX
Apr-08 23 200 115 1832 13
Oct-08 19 230 83 1699 11
Apr-09 16 162 99 1356 12
Oct-09 26 191 136 1522 17
Apr-10 25 186 134 1687 15
Oct-10 37 188 197 1787 21
Apr-11 42 192 219 2042 21
Oct-11 37 192 193 2038 18
Apr-12 36 192 188 2014 18
Oct-12 45 211 213 2017 22
Apr-13 60 265 226 2547 24
Oct-13 43 205 210 2234 19
Oct-14 62 304 204 2711 23
Apr-15 64 295 217 2481 26
Oct-15 54 253 213 2111 26
Apr-16 60 275 218 2225 27
Oct-16 62 292 212 2179 28
Apr-17 78 332 235 2401 32
Oct-17 90 330 273 2380 38
Apr-18 111 407 273 2727 41
Oct-18 139 409 340 2611 53
Source BIS London Foreign Exchange Joint Standing Committee
A similar survey is conducted by Hong Kong trade repository (HKTR) under the mandatory
reporting obligations imposed since July 2015 According to the HKTR survey daily average
27
NDF turnover in Hong Kong has also exhibited significant growth and daily average turnover
increased to USD 55-60 billion in 2018 from nearly USD 8 billion in 2015
The BIS publishes data on foreign exchange and derivatives trading activity every three years and
also prepare a separate report on NDF covering global market since 2013 The latest 2016 BIS
triennial survey reported that average daily turnover in global NDF market has increased by 53
per cent to USD 134 billion as compared to April 2013 Further NDF share in outright forward
and overall foreign exchange trading remained stable at 190 per cent and 26 per cent respectively
(Table 1) This is in contrast to the decline in average daily turnover in global FX markets to USD
51 trillion in 2016 from USD 54 trillion in 2013 survey conducted by BIS
The currency composition suggests that the Asian currencies dominate the NDF trading activity
with the highest turnover recorded by Korean Won as Korea generally has open capital account
and there are limits on non-residents borrowings in Korean Won from banks in Korea therefore
it is not deliverable offshore (BIS Survey 2016) Survey results from London Hong Kong and
Tokyo foreign exchange committees (FEC) as well as the BIS triennial survey points toward
increased NDF trading activity in Korean Won The Tokyo survey which is available from the
year 2006 suggest that the growth in NDF trading activity for Korean Won has shown significant
growth outperforming other major currencies The momentum in major currencies picked up ahead
of the global financial crisis 2008 before faltering during the crisis period owing to deteriorating
financial conditions Subsequently the NDF activity has deepened over time with the Indian rupee
and Brazilian Real constituting higher proportion of total global turnover after the Korean Won
as corroborated by the London survey also During the five-year period from 2008-13 the increase
in NDF turnover is largely consistent with the FX turnover in emerging market economies (BIS
2013)
Since 2013 greater demand for hedging in anticipation of monetary policy normalisation seems
to be the driving factor for increase in NDF activity given that lot of capital flows to emerging
markets was funded using low cost dollar liquidity (BIS 2013) The BIS 2016 survey identified
that developments associated with higher volatility in Renminbi during August 2015 and January
2016 has also boosted Asian NDFs even as trading activity in Renminbi NDF has faded
According to the BIS 2016 survey during 2013 and 2016 trading in Renminbi NDF contracted
by 394 per cent while that of Korean Won and Taiwanese Dollar expanded by 537 per cent and
28
299 per cent respectively The decline in the NDF activity for Indian rupee reflects the
depreciation of rupee against the US dollar however daily average turnover was up by 167 per
cent between 2013 and 2016 in unadjusted terms Hong Kong (HKTR) survey indicates continued
decline in NDF activity for Chinese Renminbi and Malaysian Ringgit (Table 2 and Chart 2 a amp b)
In case of China this was due to the Renminbi internationalisation policy followed after 2011
Table 2 Daily average turnover (USD billion) Spread
BIS 2013 BIS 2016
Oct- 2018
(London Survey) Bid-Ask (Latest)
NDF DF NDF DF NDF
DF
(Latest) Onshore Offshore
Chinese Renminbi 171 24 104 281 88 650 0001-0002 0003-0005
Indian Rupee 172 31 164 163 2303 214 001 002
Korean Won 196 11 301 145 295 300 010 030
Taiwanese Dollar 89 02 115 78 - 193 0005-0010 0010-0020
Brazilian Real 159 27 187 30 154 - - -
Russian Ruble 41 05 29 186 40 - - -
Source BIS London FEC BoK RBI China Foreign Exchange Trading Center Central bank of Taiwan HSBC
Note
1 DF= Deliverable forwards and include forwards and FX swaps traded onshore
2 Chinese Renminbi volumes on offshore segment are negligible after development of CNH market
3 BIS DF and DF (latest) are not directly comparable since latest numbers are taken from country sources
Chinese Yuan is for Jun-19 Indian rupee and Taiwanese Dollar is for Apr-19 Korean Won is for 2017
Chart 2 Average Daily Turnover and Change in Forex position of Asian Currencies
3 The corresponding figure for April 2019 stood at USD 28billion
0
100
200
300
400
500
US
DC
NY
US
DI
DR
US
DI
NR
US
DK
RW
US
DM
YR
US
DT
WD
Chart 2b Change in FX position of Asian
currencies (in USD billion)
29 January 2016 27 January 2017
31 January 2018 25 January 2019
0
200
400
600
800
1000
1200
Apr-
06
Apr-
07
Apr-
08
Apr-
09
Apr-
10
Apr-
11
Apr-
12
Apr-
13
Apr-
14
Apr-
15
Apr-
16
Apr-
17
Apr-
18
Chart 2a Average daily turnover USD
million
CNY INR IDR KRW
MYR TWD BRL
29
Source Tokyo FEC Hong Kong FEC
Based on latest surveys conducted by London and Hong Kong FEC which are major offshore
centres clearly it showed that the global NDF activity has surged led by Korean Won Indian
rupee Brazilian Real and Taiwanese Dollar The trend is likely to be validated by BIS 2019 survey
which encompasses global turnover and is due to release later this year
IV Review of Literature
In view of the noticeable rise in NDF activity with potential to engender distortions in local market
there exist varied literature on the emergence of NDF market and its spill-overs to onshore
counterparts One of the earliest attempts was made by Park (2001) which investigated the impact
of financial deregulation on relationship between onshore and offshore prices A key finding was
that Korean Won NDF influenced onshore prices after a shift to floating exchange rate regime
coupled with liberalisation of capital controls As part of liberalisation measures following the
Asian financial crisis in 1997 excessive regulations pertaining to foreign exchange market were
removed and measures were undertaken to improve efficiency of market by increasing liquidity
and broadening participation base (Chung et al 2000) Amongst these measures onshore entities
were allowed to participate in offshore market In this regard Lipscomb (2005) suggested that
transition to a more convertible exchange rate regime and permissible participation of onshore
counterparties in NDF transactions contributed to the increase in offshore liquidity which begets
liquidity in domestic market as well A classic example is Korean Won where both onshore and
offshore market co-exist with arbitrage opportunity exploiting any incipient price discrepancy
However NDF markets tend to disappear as the currency becomes fully convertible as stated
earlier
Wang et al (2007) also corroborated the finding that NDF market seems to be the driver for the
domestic spot market of Korean Won while the information flow is reverse for Taiwanese Dollar
where the spot market was found to have influence on NDF market Adding to this literature
Colaveccchio and Funke (2008) found Renminbi NDF to be the key driver of Asian currency
markets with varied degree of heterogeneity contingent on real and financial inter-linkages
Amongst the country specific study the one by Cadarajat and Lubis (2012) demonstrated that
Indonesia rupiah NDF tends to have influence on domestic spot and forward return
30
Studies by Hutchison (2009) Mihajek and Packer (2010) and McCauley and Scatigna (2011)
asserted that offshore trading becomes increasingly important with growing economic interest in
a particular currency amidst limited access to onshore markets and convertibility restrictions A
study by BIS (2013) analysed the directional impact for nine currencies including the Indian rupee
for the period 2005-13 along with separate analysis for 2008-09 crisis and May-August 2013 It
found the presence of two way causation for most currencies for the full sample period however
noted the increase in NDF influence during market stress Both the stress period saw noticeable
impact of NDF particularly during May-August 2013 with major exception of Malaysian Ringgit
where NDF played dominant role and there was no case of deliverable forward influencing NDF
In the Indian context the earliest study with regard to spill-overs impact was undertaken by Misra
and Behera (2006) They found onshore prices to have directional impact on NDF prices even as
volatility spillovers could exist from NDF to onshore market The subsequent research on this
subject during the period 2000-09 by Behera (2011) demonstrated the change in dynamics with
evidence of greater volatility spillover from NDF to spot market A similar finding was outlined
by Guru (2009) on the relationship between the NDF and onshore market for Indian rupee It is
argued that dynamics of relationship between onshore and offshore markets has undergone a
change with the introduction of the currency future market in 2008 and returns in NDF market
seem to be influencing the domestic spot as well as forward market
A study by Darbha (2012) finds that offshore markets plays an important role in price discovery
mechanism particularly in India and China Goyal et al (2013) after examining the period 2006-
13 found the existence of bi-directional relationship between onshore and NDF market for Indian
rupee over the long term however the directional impact turns one way from NDF to onshore
during periods of depreciating pressures ie movements in NDF markets drives adjustment in
onshore market when the currency is under depreciation pressures This asymmetric behaviour is
attributed to the fact that the Reserve bank intervenes in the foreign exchange market to stem
excessive volatility during periods of rupee depreciation
McCauley et al (2014) described two paths for evolution of the NDF markets The first one is
being followed by Chinese Renminbi which has become deliverable after the emergence of
offshore market The Indian rupee falls under the second where the NDF market has grown amidst
continued restrictions on foreign participation
31
The report of the Standing Council (Standing Council on International Competitiveness of the
Indian Financial System 2015 by Ministry of Finance Government of India enumerated factors
including capital controls position limits frictions like registration norms and know your customer
norms frequent and significant changes in regulations and guidelines in the domestic exchanges
and OTC markets as deterrent to foreign investors participation in the onshore market
IGIDR Finance Research Group (2016) made an important recommendation that domestic entities
should be permitted to participate in NDF market after outlining factors driving offshore activity
compared to onshore segment In respect of the internationalisation of rupee as one of the debated
recommendation Kumar and Patnaik (2018) argued the case for gradual internationalisation of
rupee on analysing the role of the Indian rupee in terms of official sector currency reserve currency
and trade invoicing currency
V Country Experience
China
The Chinese Renminbi (RMB) forward market can be segmented into offshore NDF market (since
1990s) an onshore Renminbi market (since 2007) and the CNH market (offshore deliverable) In
the current scenario RMB NDF has been gradually replaced by offshore deliverables after the
creation of CNH market since mid- 2010 as a by-product of promotion of international role of
RMB since 2009
Chinarsquos exchange rate regime has evolved from fixed to managed floating rates followed by
internationalisation of Renminbi (RMB) In early 1990s reforms started with the unification of
multiple exchange rate in 1994 and in 1996 China allowed the full convertibility of Yuan under
current account transactions Eventually the Peoplersquos Bank of China (PBoC) announced the
implementation of managed floating exchange rate against basket of currencies in July 2005
ending the dollar peg prevalent since 1994 Over the last decade Chinarsquos strong economic
performance and growing linkages with rest of the world prompted authorities to promote the
international role of RMB The idea of internationalisation of RMB gained prominence following
the financial crisis of 2008 which revealed the fragilities of dollar dominated global financial
system The thrust of early initiatives was RMB trade settlement premised on Chinarsquos deeper trade
32
links and its central role within Asiarsquos supply chain that supported the demand for its currency for
trade invoicing In this regard a pilot scheme permitting cross border trade settlement in RMB was
launched in 2009 which was widened to cover all current account transactions over the course of
next three years Capital account liberalisation was undertaken at a more gradual pace with the
Chinese RMB becoming officially deliverable at offshore centres in 2010 While Hong Kong
banks were permitted to accept RMB deposits as part of personal accounts in 2004 an important
milestone was the sign of Memorandum of cooperation between HKMA and PBoC in July 2010
which eliminated restrictions on Hong Kong banks in establishing Renminbi accounts and
providing related services ie payments and transfers in RMB to individuals and corporations
Moreover financial institutions were permitted to offer Yuan denominated products As a result
CNH (offshore Renminbi) began to trade actively amongst other range of products and prompted
investors to switch to deliverable market in place of NDF which was used previously Whilst CNH
can be transferred freely between offshore accounts transfer of RMB between onshore and
offshore is still confined to regulated channels to fend off potential adverse impact on onshore
markets Moreover these restrictions are skewed towards outflows form the mainland to offshore
centres
With Renminbi internationalisation the offshore CNH market has shown exponential growth
displacing the NDFs The BIS Triennial Survey showed significant decline in RMB NDF which
fell nearly 40 per cent between 2013 and 2016 driving its share in total RMB trading to 5 per cent
from 14 per cent earlier (BIS 2016) The rapid expansion of offshore market is clearly discernible
in rising FX turnover for CNH which has nearly doubled between 2013 and 2016 and forms around
67 per cent of the total RMB turnover Of the total CNH turnover average daily turnover in the
DFs in April 2016 was estimated to increase to USD 164 billion from USD 84 billion in 2013
(Table 3)
33
Table 3 RMB market turnover average daily turnover in USD billion
OTC
spot
OTC
FX
swaps
OTC
DFs
OTC
NDF Options Futures
OTC
currency
swaps Total
CNY
2013 201 105 26 0 03 0 0 335
2016 249 27 13 0 2 0 02 554
change 239 1565 -514 5693 651
CNH
2013 139 294 84
168 0 05 69
2016 427 59 164
158 03 25 1367
change 2079 1008 943 -56 5784 3836 981
NDF
2013
171
171
2016
104
104
change -394 -394
Source BIS
Since the inception of CNH pricing gaps tend to persist between onshore and offshore exchange
rates however it has narrowed over last couple of years This pricing gap arises on account of
different economic conditions in mainland China and Hong Kong amidst imperfect arbitrage
(Funke 2015) While central bank intervention can constrain the movement of CNY at onshore
centres CNH is more market determined and hence closely follows the global swings (Chart 3)
Since September 2015 PBOC has reportedly taken action in the offshore market when the
onshore-offshore gap was large (McCauley amp Shu 2018)
34
Source Bloomberg
Further liberalisation of the onshore FX market along with allowance of offshore deliverable
market has made the CNY NDF market almost non-existent despite maintaining the lsquoneed basisrsquo
principle Notwithstanding the existence of basis between CNY and CNH due to the band range
trading in CNY and market determined pricing in CNH the spread has been contracting over years
with ample liquidity available in onshore and offshore markets Further the creation of offshore
market has made various options available to offshore investors to both hedge their exposures on
underlying investments and also generate RMB risk in their portfolios via various products and
offshore deliverable market
Korea
With an average daily turnover of USD 30 billion as per the BIS survey 2016 and USD 295 billion
in the latest London survey of October 2018 Korean Won (KRW) NDF boasts of the most active
and liquid NDF market amongst most emerging market currencies Further permissible
participation of local banks in the NDF market ensures close integration of onshore and offshore
forex markets allowing for quick sentiment spillovers between the two markets Turnover in NDF
market is substantially higher than onshore forwards mainly on account of higher documentation
requirements for accessing onshore market In the onshore market average daily turnover was
reported at USD101 billion in 2017 for forwards which increased from USD 96 billion during
the previous year (Chart 4 a ampb)
-015
-01
-005
0
005
01
01-0
8-2
010
01-1
2-2
010
01-0
4-2
011
01-0
8-2
011
01-1
2-2
011
01-0
4-2
012
01-0
8-2
012
01-1
2-2
012
01-0
4-2
013
01-0
8-2
013
01-1
2-2
013
01-0
4-2
014
01-0
8-2
014
01-1
2-2
014
01-0
4-2
015
01-0
8-2
015
01-1
2-2
015
01-0
4-2
016
01-0
8-2
016
01-1
2-2
016
01-0
4-2
017
01-0
8-2
017
01-1
2-2
017
01-0
4-2
018
01-0
8-2
018
01-1
2-2
018
01-0
4-2
019
Chart 3 Gap between USDCNY and USDCNH
Offshore premium
35
Chart 4 Foreign Exchange Turnover and NDF market in Korea
Source Bloomberg Bank of Korea
Korea embarked on liberalisation reforms in 1980s however took big strides post Asian financial
crisis in 1997-98 in line with the IMF adjustment programme As part of these measures foreign
exchange transactions were liberalised which allowed the local banks to engage in NDF
transactions with non-residents Prior to this the development of the onshore currency derivatives
market was constrained by legal requirements such as any forward transaction had to be certified
as a hedge against future current account flows the so-called ldquoreal demand principlerdquo which also
spurred the development of a liquid offshore ldquonon-deliverablerdquo forward (NDF) market in the
Korean Won In 1999 as part of liberalisation measures this restriction was lifted and a lot of
activity moved onshore leading to the convergence of the offshore and onshore prices (IMF
2004) This resulted in sharp increase in NDF transactions between onshore banks and non-
residents for both hedging as well as speculative purposes Amidst likely possibility of turmoil in
foreign exchange market the central bank implemented regulations in January 2004 governing
Korean banks NDF positions with the non-residents directed at restraining any potential selloffs
However these restrictions were abolished in April 2004 as speculative activity was assessed to
have reduced significantly
KRW is almost a non-restricted currency provided the investor holds an Investment Registration
Certificate (IRC) issued by the Financial Supervisory Services (FSS) in Korea The IRC allows an
offshore investor to invest in onshore securities and provides near non-restricted currency rights
barring any holding of short selling position in onshore KRW account
191 18 183 175 20 194 196
7566 71 76
83 96 101
192198 196 19
192 184198
0
10
20
30
40
50
2011 2012 2013 2014 2015 2016 2017
Chart 4b Foreign Exchange Turnover
in Korea daily average USD billion
Spots Forwards Fx Swaps
-60
-50
-40
-30
-20
-10
0
10
20
30
12
-19
98
01
-20
00
02
-20
01
03
-20
02
04
-20
03
05
-20
04
06
-20
05
07
-20
06
08
-20
07
09
-20
08
10
-20
09
11
-20
10
12
-20
11
01
-20
13
02
-20
14
03
-20
15
04
-20
16
05
-20
17
06
-20
18
Chart 4a Onshore USDKRW-NDF 1M
USDKRW
36
For non-residents investors who do not hold IRS USDKRW remains a highly regulated market
Any onshoreoffshore transactions need to be approved by the appropriate authorities and must
have proof of underlying For multinational clients that repatriate dividends documentation with
proof of underlying must be in place Further ceilings are imposed on foreign exchange derivatives
transactions of foreign as well as local banks which came into existence as a prudential measure
to mitigate the adverse impact of volatile capital flows
Ahead of the 2008 financial crisis Korean economy experienced huge build-up of short-term
external debt led by foreign exchange derivatives positioning of banks on account of over-hedging
undertaken by Korean corporations as well as likely carry trades in anticipation of appreciation of
domestic currency Both these activities were funded using offshore dollar borrowing and posed
serious difficulties at the time of global dollar liquidity crunch during financial crisis With a view
to prevent recurrence of the any such episode triggered by volatile capital flows which resurged
from 2009 over-hedging was specifically prohibited and limits were imposed on Foreign
exchange derivatives activity of banks in relation to their capital Liberalization in KRW has been
continuing for decades with the last one completed in December 2007 whereby prior approval
requirements for some capital account transactions was abolished Even onshore participants can
freely participate in the NDF markets thereby providing onshore liquidity to Non-Residents as
long as the hedges are booked as NDF Essentially KRW is a fully convertible currency but is
only tradable on NDF basis offshore
Malaysia
Malaysia had liberal foreign exchange policies until Asian financial crisis with regard to cross
border transactions involving Malaysian Ringgit (MYR) Following the crisis offshore trading of
MYR was banned However grace period was notified for depositors to repatriate their offshore
deposits back to Malaysia and the adoption of fixed exchange rate policy in 1998 - a significant
move whilst imposing selective capital controls All these measures were intended at ceasing
offshore activity which contributed to the excessive pressure on currency despite relatively
stronger fundamentals Although Malaysia imposed cross border restrictions after the Asian crisis
evolution of NDF market in MYR was initially inhibited by comprehensiveness of regulations as
well as its effective enforcement by the authorities (Ishii 2001) Further absence of reference rate
37
for settlement of NDF contracts and stringent controls on domestic bank to undertake forward
foreign exchange transactions with offshore counterparties also hindered the development of NDF
market (EMEAP discussion paper 2002) As the economy began to recover capital controls were
gradually relaxed and finally the currency was floated in 2005
Generally Malaysia has opened up its domestic markets for non-resident investors with no
restrictions on non-residents investing in local bond markets except having to appoint a local
custodian Most of the sectors are open for non-resident portfolio equity flows as well in Malaysia
Over the years since 2005 non-resident investorsrsquo participation in the onshore market picked up
substantially reaching record high of 397 per cent of total outstanding government bonds from
nearly 14 per cent in 2005 and in the process contributed to the growth of NDF market as well
McCauley (2013) analysed the direction of influence for nine currencies in 2005-13 as well as
separately for the 2008-09 crisis and May-August 2013 Granger causality tests point to two-way
causation for most currencies for the full sample The exception is the Malaysian Ringgit where
the NDF influences the deliverable forward market The central bank expressed concerns over the
adverse impact of increased activities in the ringgit NDF market after wide gap was observed
between the NDF and onshore rate in 2016 following the US presidential election Bank Negara
Malaysiarsquos (BNM) Governor emphasised that ringgit NDF market is used by non-resident
investors mostly for speculative purposes rather than genuine demand for hedging As the NDF
trading activity intensified during volatile period in 2016 ringgit-denominated NDF implied much
larger depreciation which further exacerbated the then prevailing depreciating pressure on the
currency (Chart 5)
Chart 5 Onshore and Offshore market in Malaysia
Source Bloomberg
4141542
42543
43544
44545
455
Oct
-16
Oct
-16
Oct
-16
Nov
-16
Nov
-16
Nov
-16
Nov
-16
Dec
-16
Dec
-16
Dec
-16
Dec
-16
Dec
-16
Jan-1
7
Jan-1
7
Jan-1
7
Jan-1
7
Feb
-17
Feb
-17
Onshore USDMYR Offshore 1month NDF USDMYR
38
Assessing the overwhelming impact of NDF activities which has the potential to undermine
financial stability BNM took a number of measures in 2016 to eliminate speculative transactions
in order to ensure appropriate price discovery and orderly functioning of onshore market These
measures includes reinforcement of non-internationalisation policy for Ringgit steps to improve
the onshore pricing mechanism and deepen the domestic forex market After prohibiting banks
from quoting fixing orders used to settle offshore trades the central bank revised the methodology
to compute onshore reference rate to account for transacted deals from mid-2016 Further BNM
imposed a ban on ringgit NDF trading in November 2016 and reminded local banks that ringgit
remains a non-internationalised currency and therefore any offshore trading is not recognized At
the same time BNM strengthened its monitoring to ensure compliance to Foreign exchange
administration rules (FEA) rules by market participants on non-involvement in facilitating NDF
transactions Subsequently financial markets committee (FMC) instituted in mid-2016 laid down
a series of developmental measures for onshore market aimed at allowing better market access and
greater hedging facilities to market participants (Table 5)
Table 5 Developmental Measures Relating to Foreign Exchange Market
Jul-16 Dec-16 Apr-17
Adopting global best practices Rebalance onshore FX demand and supply
Additional FX risk
management practices
bull Transaction based KL
USDMYR reference rate
bull 25 retention of export proceeds in
foreign currency
bull Streamline passive and
dynamic hedging
flexibilities for
investors
bull Extension of official closing hour
for onshore Ringgit rate
bull Trade settlement among residents in
Ringgit only
bull Active hedging for
corporations
bull Streamline onshore and offshore
foreign currency investment limit
Promote FX risk management onshore
bull Active hedging below RM6t million of
net open position
bull Active hedging for institutional
investors
39
bull Expansion of appointed overseas office
framework
In an immediate impact reinforcement of restrictions on USD-MYR NDF market resulted in
significant outflows from local bonds in Malaysia However as a positive impact with the bout
of capital outflows following ban on NDF transactions composition of non-resident holdings has
shifted towards more stable and long-term investors thereby reducing the risk exposure to global
impulses Further the disruptive influence from NDF market subsided and onshore foreign market
continues to register higher average daily volume These measures have helped in increasing the
depth and liquidity of the foreign exchange market as evidenced by declining volatility and
narrowed bid-ask spreads in onshore market The decline in offshore volumes has resulted in
widened bid-ask spread (Chart 6 a amp b)
Chart 6 Malaysia Monthly FX forward volumes and Bid-Ask Spread
Source BNM Reuters and Bloomberg
-001
0
001
002
003
004
005
01
-10
-201
0
01
-04
-201
1
01
-10
-201
1
01
-04
-201
2
01
-10
-201
2
01
-04
-201
3
01
-10
-201
3
01
-04
-201
4
01
-10
-201
4
01
-04
-201
5
01
-10
-201
5
01
-04
-201
6
01
-10
-201
6
01
-04
-201
7
01
-10
-201
7
01
-04
-201
8
01
-10
-201
8
01
-04
-201
9
Chart 6b Bid-Ask spread
offshore bid-ask onshore bid-ask
0
10
20
30
40
50
60
70
80
90
0
5
10
15
20
25
30
Dec
-12
May
-13
Oct
-13
Mar
-14
Aug
-14
Jan-1
5
Jun
-15
Nov
-15
Apr-
16
Sep
-16
Feb
-17
Jul-
17
Dec
-17
May
-18
Oct
-18
Mar
-19
Chart 6a Monthly FX forward turnovers (in
USD billion)
Onshore FX forward Offshore FX forward RHS
40
Chart 7 Non-resident holdings of total government debt and Monthly FX turnover
Source BNM and HSBC
Indonesia
The development of NDF market in Indonesia Rupiah traces back to the year 2001 when Bank
Indonesia (BI) prohibited onshore banks from lending to non-resident accounts in an attempt to
reduce the speculative pressure on the Indonesian Rupiah (IDR) These restrictions paved the way
for development of offshore rupiah NDF market to cater to the demand of international investors
Prior to this an active offshore deliverable market existed for IDR following the pursuit of
liberalisation policies beginning as early as 1970s which allowed the IDR to be freely convertible
and at the same time permitted its internationalisation Consequently the international use of
rupiah increased but was confined mostly to financial transactions mainly due to limited invoicing
of trade-related transactions in IDR terms This easy access to rupiah from onshore centres due to
internationalisation allowed non-resident to speculate on the currency during the 1997 crisis in
Asian countries As a result of heightened activity in times of stress exchange rate volatility
increased making it difficult for the central bank to maintain stability of rupiah In response to the
crisis the currency was freely floated replacing the intervention band but weakness in the currency
and high volatility continued to persist compared to currencies of other Asian countries during the
first three years of its floating rate regime Taking cognizance of this disparity the central bank
began to evaluate the extant regulations relating to rupiah transactions with non-residents
Thereafter during the year 2001 the BI imposed extensive regulations limiting non-resident
143
397
243
50
100
150
200
250
300
350
400
450
Jan-0
5
Oct
-05
Jul-
06
Apr-
07
Jan-0
8
Oct
-08
Jul-
09
Apr-
10
Jan-1
1
Oct
-11
Jul-
12
Apr-
13
Jan-1
4
Oct
-14
Jul-
15
Apr-
16
Jan-1
7
Oct
-17
Jul-
18
Apr-
19
Chart 7a Non resident holdings as of total
government debt
-
500
1000
1500
2000
2500
3000
Jan-1
6
Apr-
16
Jul-
16
Oct
-16
Jan-1
7
Apr-
17
Jul-
17
Oct
-17
Jan-1
8
Apr-
18
Jul-
18
Oct
-18
Jan-1
9
Chart 7 Monthly onshore FX market
turnover (in billion of USD)
FX Spot FX Swap FX Forward FX Options
41
rupiah transactions and shrinking the pool of offshore rupiah funds with the potential to be used
for speculation identifying spill overs from offshore market as conduit of excessive volatility
In general Indonesia has opened up its domestic bond markets for non-residents completely with
no entryexit barriers except having to appoint a local custodian Foreign exchange hedging is
allowed only with underlying documentationasset in place for non-residents On the portfolio
equity investments regulation clearly provides that a listed company is exempt from any foreign
investment restrictions However there are sectoral restrictions on FDI in Indonesia which are
decided by BKPM (Investment Coordinating Board in Indonesia) which provides a DNI list
(Governmentrsquos negative investment list) The share of non-residents in Indonesia Government
Bonds has been increasing over years from a mere 1570 per cent of the total government bonds
in June 2009 to 3810 per cent in April 2019 (Chart 8)
Source HSBC
Research from BI in 2012 found disproportionate impact of NDF market to spot market during the
period 2008-11 Results suggests that there is evidence of unidirectional mean spill-over from NDF
to both spot and forward rupiah markets with an exception of Europe crisis On volatility spillover
the study obtained significant results from NDF market to spot market for entire period However
in crisis situation the study found interdependence between volatility in offshore NDF and onshore
spot rate changes while information transmission is only valid from NDF to forward rate changes
not the other way around (Cadarajat and Lubis 2012)
To reduce the unwarranted influence of NDF market on spot market BI took initiatives beginning
the year 2014 to bridge the gap between onshore and offshore rupiah rate In 2014 the central bank
381
150
200
250
300
350
400
450
Jun-0
9
Dec
-09
Jun-1
0
Dec
-10
Jun-1
1
Dec
-11
Jun-1
2
Dec
-12
Jun-1
3
Dec
-13
Jun-1
4
Dec
-14
Jun-1
5
Dec
-15
Jun-1
6
Dec
-16
Jun-1
7
Dec
-17
Jun-1
8
Dec
-18
Chart 8 Non-resident holdings as percetage to total Government
Debt
42
with the help of key offshore centre Singapore moved the foreign exchange rate fixing that is used
to settle the NDF contracts to the onshore market Earlier Association of Banks in Singapore
(ABS) and the Singapore Foreign Exchange Markets Committee (SFEMC) was publishing IDR
reference rate computed as weighted average of 1-month NDF trades done by then Singapore
based brokers Post March 27 2014 BI started publishing reference rate termed as Jakarta Inter-
bank Spot Dollar Rate (JISDOR) which was to be used to settle existing and new contracts Jakarta
Interbank Offered Rate (JIBOR) is more transparent in a way that it is based on actual transactions
being done in the inter-bank onshore market
In late 2018 BI in its efforts to further deepen the domestic foreign exchange market and to
mitigate IDR exchange rate risk BI established the Domestic Non-Deliverable market (DNDF)
for IDR It will serve as a parallel market to NDF with the key difference that it is rupiah settled
in onshore market This alternative tool will provide foreign investors additional avenues to hedge
their IDR exposure without principal exchange other than enhancing the central bankrsquos
intervention capabilities At this juncture the market is relatively new and hence significant impact
assessment of the same cannot be outlined However currently Indonesia has not been able to
move significant turnovers from offshore NDF to Domestic NDF market
Brazil
Brazilian Real is the second most actively traded currency in NDF market after the Korean Won
with an average daily turnover of USD 187 billion as per BIS and USD 154 billion according to
the London survey The growth and development of NDF market is attributed to the existence of
large and well developed foreign exchange futures market
The development of derivatives market in Brazil is attributed to the hedge culture that has been
prevalent due to periods of high and persistent inflation and exchange rate volatility amidst
political shocks During 1980s and early 1990s inflation was soaring above 100 per cent which
peaked over 2700 per cent in 1993 and thus promoted widespread indexation to manage the
inflation risks Subsequently the ldquoReal planrdquo which comprised of fiscal and monetary reform and
introduction of new currency helped to bring down inflation and stabilise the currency Amidst
stable macroeconomic conditions private sector was encouraged to borrow foreign funds at a
43
lower cost and the consequent surge in foreign indebtedness during 1994 to 1998 led the central
bank issue dollar denominated securities as a hedging instrument Following the currency crisis in
1999 the Brazilian Real was floated amongst adoption of new set of economic policies which was
also accompanied by providing unrestricted access to non-residents to financial markets (including
derivatives) in 2000
The distinguishing feature of Brazilian foreign exchange is the non-deliverable nature of
derivatives contracts without any significant limitations even though participation in deliverable
instruments ie spot outright forwards and foreign exchange swaps is constrained Only chartered
banks are authorised by the central bank to hold foreign exchange spot positions All these factors
have facilitated the growth of foreign exchange futures market over spot market which is closed
and highly restricted Against the backdrop of large and sophisticated foreign exchange derivatives
with high depth and liquidity foreign exchange futures prices have key influence on spot price as
suggested by various studies (Ventura and Gracia 2009 Kaltenbrunner 2010 and Chamon and
Gracia 2013) As pointed out by Kaltenbrunner 2010 the existence of a deep futures market has
made it possible for foreign banks with branches in Brazil to sell real offshore (NDF) and
simultaneously hedge their real exposure in the onshore futures market For the Brazilian Real
derivatives especially offshore NDFs are the main vehicle for investors looking to implement
carry trades (Santaelaa 2015)
Taiwan
The NDF market for Taiwanese Dollar (NTD) existed since 1990s and the central bank permitted
domestic and foreign legal entities to trade in NTD NDF market with authorised banks in 1995
This came after opening up of local securities market to foreign institutional investors (QFII) in
1990 which allowed FIIs meeting certain requirements to apply for investment in Taiwanrsquos stock
market Subsequently significant relaxations were made and security market was completely
opened up with the abolition of QFII scheme While onshore institutions were eligible for trading
in NTD NDF the central bank initially imposed limits on trading position in NTD NDF to one
third of their total foreign exchange position with a view to prevent speculative pressure
44
Following the Asian financial crisis in July 1997 the central bank introduced measures to regulate
NDF market with only authorized banks permitted to carry NDF trading with other authorised
counterparts and their overseas branches or headquarters This move came after the speculative
positioning which was believed to cause sharp depreciation of the NTD The central bank outlined
that although there was ceiling on NTD NDF trading positions some banks were engaged in selling
NDFs to foreign entities and simultaneously created long NDFs positions and shorted DFs with
domestic entities in a bid to offset the NDF trading positions on their balance sheets and thus
creating more room for further NDF trading (Bank of Taiwan Annual Report 2014) The central
bank has intervened in foreign exchange market to curb speculative activity also post 2008
financial crisis when emerging markets witnessed resurgence of capital flows The measures
introduced then by the central bank focused on reducing local banksrsquo foreign exchange positions
in both onshore and NDF markets including discouraging non-resident deposits by imposing
punitive reserve requirements with an intent to limit local banksrsquo capacity to provide liquidity to
NDF markets The National Supervisory Commission also took steps to limit non-resident
investments in local bank deposits and government securities
However recognising the dominance of foreign banks in NDF trading activity the central bank
announced that overseas branches of domestic banks are eligible to apply for NTD NDF business
from September 2014 In current scenario whilst there are no restrictions on the fixed income
investments in general but investments in localdomestic bonds by non-residents cannot exceed
30 per cent of their investments in equity instruments which has kept the investments in local
bonds low by non-residents who tend to take exposure in USD bonds issued by Taiwan offshore
Moreover ability for local banksrsquo to access the TWD NDF market up-to 20 per cent of each banksrsquo
net open position results in partial integration between onshore and offshore markets Since TWD
is not fully convertible any onshore spot transactions must be declared to the central bank and in
most cases require supporting documentation which keeps the differential between onshore and
offshore rate
To conclude cross county experience shows that increasing role of any economy globally is
accompanied by emergence of growing offshore trading of their currencies in the presence of
restricted access or cumbersome regulations Additionally emerging market economies cannot
afford to have unrestricted access to their onshore market as revealed by the studies of Indonesia
45
and Malaysia during the Asian crisis 1997 which exposed them to global impulses Most of these
countries have followed a gradual approach surrounding non-resident access to their forex markets
As emerging markets open up and become sophisticated in respect of forex markets the case study
of the Republic of Korea exemplify that country-specific factors have to be considered when
designing the financial regulatory toolkit aimed at curbing foreign and domestic agentsrsquo
speculative strategies in the search for yield The experience of Brazil suggests deepening onshore
hedging market will go a long way in promoting the price setting role of onshore market over its
offshore counterparts Indonesia has recently introduced domestic NDFs in line with Brazil
Additionally the experience of Korea and Taiwan suggests that the participation of domestic banks
ensures that any price differential between the two segments is arbitraged However in both the
cases participation is governed to evade any potential build-up of vulnerabilities on banksrsquo balance
sheet
46
Chapter 34
Linkages between Offshore NDF and Onshore Rupee Markets New Evidence
Overarching Motivation
Indiarsquos trade integration with the rest of the world began to rise sharply from the turn of the
millennium Between 2000 and 2012 total trade (imports + exports) as a percentage of GDP more
than doubled from 26 to 56 before moderating to 43 in 2018 as the effects of de-
globalization took over post the global financial crisis Simultaneously policymakers persevered
with gradual but consistent capital account liberalization Unsurprisingly therefore currency
markets ndash both to trade and hedge ndash rose in tandem with the growing external integration The
onshore Rupee market5 monthly average turnover has grown from USD 60 billion in 2000 to USD
687 billion in 2018 However given data limitations uncertainty still exists on the exact size of
the NDF market and how it has grown relative to the onshore market As Chapter- 2 illustrates
the BIS Triennial Survey finds average daily turnover of Rupee NDF in 2016 was USD 16 billion
However the Bank of Englandrsquos Semi-Annual Forex Turnover Survey finds average daily
turnover of Rupee NDF in London increased from USD 8 billion in October 2016 to USD 23
billion in October 2018
The idea behind trying to size the NDF market ndash and therefore implicitly compare its size and
growth to onshore markets ndash is in part to try and make sense of how important a role NDF markets
play in the ldquoprice discoveryrdquo of the Rupee6 With the Indian Rupeersquos ldquoForwardrdquo price being
determined across segmented markets ndash both the onshore deliverable forward market and the
offshore non-deliverable market -- the key is to ascertain the relative importance of each of these
markets in driving price discovery
4 This chapter is a joint work of Shri Sajjid Chinoy Chief Economist J P Morgan India and Shri Harendra Behera
Assistant Adviser Department of Economic and Policy Research Reserve Bank of India 5 Spot OTC amp ETCD
6 To be sure estimating the size of the NDF market is important not just for the influence it exerts on price discovery
but also instructive in understanding the cumulative ldquoviewrdquo on the Rupee and how much is expressed onshore versus
offshore This is because if NDF volumes are substantial policymakers may desire to shift these volumes on shore
both to (i) deepen the onshore market and (ii) move this businesseconomic activity on shore
47
However simply using (offshore versus onshore) volumes as a means to proxy relative price
discovery is imperfect at best The ability of NDF volumes to drive price discovery for any given
quantum of volumes is ultimately a function of how inter-connected onshore and offshore markets
are and the ability of economic agents ndash hedgers arbitrageurs speculators -- to link these markets
For example if NDF markets have grown sharply but it is found that price linkages between the
two markets are still tenuous or have not increased commensurately with volumes -- say because
arbitrage opportunities between the two markets have not grown in tandem -- then the growth of
NDF markets and the consequent ldquoloss of controlrdquo will be of less concern to Indian policymakers
Conversely if price linkages have grown over time ndash proportionately to volume increases ndash then
policymakers would rightly worry about the growing role of NDF markets in driving price
discovery
The fundamental motivation for this chapter is therefore to empirically examine price linkages
between the NDF and onshore markets as this is the ultimate manifestation of the influence that
NDF markets exert
The Question
This chapter seeks to ask two fundamental questions Is there a stable long-term equilibrium
relationship between onshore and offshore markets Second if so what is the directionality of
influence Do NDF markets drive onshore markets Or do onshore markets drive the NDF market
Or is the influence bi-directional
Furthermore we try and empirically answer this questions across two dimension First what is the
direction and quantum of influence during ldquonormal times versus ldquostressed timesrdquo Second what
is the relationship and how does it change when assessing ldquoaverage returnsrdquo (means) versus
ldquovolatilityrdquo (variance)
Specific Motivation to India
While there is a meaningful and growing literature trying to empirically ascertain price linkages
between the onshore and offshore markets around the world the literature that focuses on India
remains sparse dated and inconclusive This constitutes the specific motivation for this chapter
48
The literature studying NDF markets around the world has steadily grown over time For example
much work has been done on Asian NDF markets and their relationship with onshore markets
both for the region as a whole (Ma et al 2004 Colvecchio et al 2006 Wang et al 2007 Gu and
McNelis 2009) and individual currencies such as the Korean Won (Park 2001) the Indonesian
Rupiah (Cadarajat and Lubis 2012) the Chinese Yuan (Fung et al 2004 Hideki 2006
Colavecchio and Funke 2008 Huszaacuter et al 2016 Song and Gao 2016 McCauley and Shu 2018)
and the Indian Rupee (Misra and Behera 2006 Guru 2009 Behera 2011 Darbha 2012 Goyal
et al 2013)
Results remain mixed Some studies find the NDF markets influence the evidence onshore forward
market (Park 2001 Wang et al 2007 Cadarajat and Lubis 2012) others find they influence
onshore spot markets (Behera 2011 Goyal et al 2013) while some document its influence on
onshore futures markets (Behera 2011) Conversely some studies also find the direction of
influence runs from onshore markets to NDF markets (Wang et al 2007 Misra and Behera 2006)
In the case of India there are only a few studies on this subject ndash with the last one back in 2013 ndash
and the results are mixed and inconclusive For example Misra and Behera (2006) find that itrsquos
the onshore markets that influenced the NDF market between 2004 to 2007 largely because of
restricted participation of domestic players in the offshore market In a subsequent study Behera
(2011) found that there are volatility spillovers from the NDF market to spot and forward markets
in India and the magnitude of volatility spillover has become higher after the introduction of
currency futures in 2008 Guru (2009) finds qualitatively the same results and the role of currency
futures in India Darbha (2012) find that offshore markets play an important role in price discovery
Finally in the most recent work on India (Goyal et al 2013) find evidence of a long-term
relationship between NDF and onshore markets and find evidence that the relationship is
bidirectional as both markets adjust to any deviations from the equilibrium state
Whatrsquos clear however is the evidence on India is patchy inconclusive and dated with the last
study conducted more than 6 years ago
Some Theory
Recall if there are no capital controls forward rates are tied down by the no-arbitrage ldquocovered
interest parityrdquo hypothesis
49
F = S(1+r)(1+r$ )
Where F is the Forward rate S is the spot rate r is the relevant interest rate on the home currency
and r$ is the equivalent dollar rate The equation holds when (i) there is capital account
convertibility and there are no barrier for cross-border transactions and (ii) there is equivalent
credit risk in the assets across the two jurisdictions
However if there are capital-account barriers we would expect F to only be approximated by the
equation above and not hold exactly
So F ~ S(1+r)(1+r$ )
Similarly the NDF rate should be anchored by the onshore forward rate to the extent that
arbitragers can link these markets
So NDF ~ F ~ S(1+r)(1+r$ )
Furthermore the sign of the onshore-offshore yield spread can indicate the underlying market
pressure on the currency If the domestic interest rate is higher than the NDF implied yield it
implies appreciation pressures on the currency However capital controls may restrict inflows to
close the gap Similarly a lower domestic interest rate than implied by the NDF yield would
suggest depreciation pressures while a zero spread would likely reflect an absence of market
pressure on both the domestic and offshore market
All told however we would expect that both onshore and offshore markets would have a long-
run relationship and there is the likelihood of ldquomeanrdquo spillovers on a regular basis Furthermore
hedging arbitrage and speculative activities may also result in volatility spillovers from one
market to another on various occasions
Testing for ldquoMeanrdquo Spillovers
We start therefore by empirically testing for linkages between onshore (spot and forward prices)
and offshore (NDF forward prices) markets The goal is to assess
1 If there is a stable long-term relationship between onshore and offshore markets
2 Which drives which Do onshore prices drove offshore prices Or vice versa
50
3 To see whether the direction of influence is a function of context Are the results
different for ldquonormalrdquo times versus ldquostressed periodsrdquo (ie taper tantrum emerging
market stress)
Non-stationary but co-integrated
So as to decide the empirical course of action we start by testing whether the key variables of
interest (i) the Onshore Spot Exchange Rate (SPOT) (ii) the Onshore Forward Rate (FORWARD)
and (iii) the Offshore Non-Deliverables Forward exchange rate (NDF) are stationary
Augmented Dickey Fuller Tests reveal that all three variables are non-stationary in levels
However as Figures 1 and 2 suggest the spreads between SPOT and NDF and ONSHORE
FORWARDS and NDF are mean-reverting suggesting the presence of a long-term relationship
and suggesting stationarity in the first differences
Formal co-integration tests ndashTables 2 and 3 ndash confirm that both pairs of variables NDF-SPOT and
NDF-FORWARD ndash are indeed co-integrated The Max Eigenvalue tests reveal there is at least one
co-integrating vector that can be found at the 5 level
Null Hypothesis Variables have a unit root
ADF t-Stat Prob
Spot -06 09
Augmented Dickey-Fuller test statistic-07 08
Augmented Dickey-Fuller test statistic-07 08
Table 1 ADF unit root test
-15
-05
05
15
25
09 10 11 12 13 14 15 16 17 18 19
level
Figure 1 Spreads (1M NDF- Spot)
51
-25
-15
-05
05
15
25
09 10 11 12 13 14 15 16 17 18 19
level
Figure 2 Spreads (1M NDF- 1M Forward)
Table 2 Co-integration SPOT and NDF
Sample (adjusted) January 2005 to March 2019
Included observations 2608 after adjustments
Trend assumption No deterministic trend (restricted constant)
Series LOG(SPT) LOG(NDF)
Unrestricted Cointegration Rank Test (Trace)
Hypothesized Trace
No of CE(s) Eigenvalue Statistic Critical ValueProb
None 011 31310 2026 000
At most 1 000 210 916 076
Unrestricted Cointegration Rank Test (Maximum Eigenvalue)
Hypothesized Max-Eigen005
No of CE(s) Eigenvalue Statistic Critical ValueProb
None 011 31100 1589 000
At most 1 000 210 916 076
Both Trace and Max-eigenvalue tests indicates 1 cointegrating
eqn(s) at the 005 level
52
Stable Long Term Relationship
The finding of co-integration allows us to use ordinary least squares (OLS) to estimate the long-
term relationship between SPOT and the NDF as well as FORWARD and the NDF In particular
using the equation below we estimate parameters β0 and β1 which tells us about the long-term
relationship between SPOT and NDF
We then repeat the same exercise between the FORWARD and the NDF
But whatrsquos driving what An ldquoError Correction Mechanismrdquo approach
While establishing a long-term relationship is important a finding in the affirmative will not come
as a particular surprise Instead the real question is whether onshore prices drive offshore prices
or vice versa The natural framework to answer this is the work-horse Error Correction Mechanism
(ECM) approach used by Engel and Granger in 1987 where changes in each of the variables are
run on changes on its own lags and the lags of the other variables
Table 3 Co-integration FORWARD and NDF
Sample (adjusted) January 2005 to March 2019
Included observations 2608 after adjustments
Trend assumption No deterministic trend (restricted constant)
Series LOG(FORWARD) LOG(NDF)
Unrestricted Cointegration Rank Test (Trace)
Hypothesized Trace
No of CE(s) Eigenvalue Statistic Critical ValueProb
None 018 53051 2026 000
At most 1 000 217 916 074
Unrestricted Cointegration Rank Test (Maximum Eigenvalue)
Hypothesized Max-Eigen 005
No of CE(s) Eigenvalue Statistic Critical Value Prob
None 018 52835 1589 000
At most 1 000 217 916 074
Both Trace and Max-eigenvalue tests indicates 1 cointegrating
eqn(s) at the 005 level
53
119889119897119900119892(119904119901119900119905)119905 = 1205720 + 120572119904119901119900119905(119890119905minus1) + sum 12057211(119894)(119889log (119904119901119900119905119905minus1))119899119894=1 + sum 12057212(119894)(119889log (119873119863119865119905minus1)) + 120576119904119905
119899119894=1 (1)
119889119897119900119892(119873119863119865)119905 = 1205720 + 120572119899119889119891(119890119905minus1) + sum 12057221(119894)(119889119897119900119892(119904119901119900119905119905minus1))119899119894=1 + sum 12057222(119894)(119889119897119900119892(119873119863119865119905minus1)) + 120576119899119905
119899119894=1 (2)
For example as Equation 1 lays out changes in (the log of) SPOT ndash the dependent variable -- are
run on its own lags and the lags of NDF Equation 2 ndash in which the dependent variable is NDF --
does the same for NDF Because both variables are co-integrated ndash as shown above ndash using OLS
to estimate these coefficients using standard criterion to choose lag lengths (eg Akaike
Information Criterion) and standard F-Tests are all valid
The coefficients of interest in the above equation are 120572119904119901119900119905 and 120572119899119889119891 ndash the ECM terms -- because
these coefficients tell us when the system is in disequilibrium the direction and the speed of
adjustment back to equilibrium This will determine the directionality of influence
For example if 120572119904119901119900119905 = 0 and if all values of 12057212(119894) = 0 then dlog(NDF) does not granger cause
dlog(spot) In contrast if the value of 120572119904119901119900119905 is negative and statistically significant that implies
that (the log of) NDF in the long run ldquoganger-causesrdquo spot market movements The same intuition
applies for equation 2 where NDF is the dependent variable and we test for convergence between
the NDF rate and the onshore forward rate Direct convergence requires 120572119904119901119900119905and 120572119899119889119891 to be
oppositely sign Intuitively the larger the value of α the faster is the speed of adjustment
In summary while the βrsquos tell us about the existence and strength of a long run relationship
between onshore and offshore markets the αrsquos tell us about whether (i) the directionality of
influence and (ii) the speed of convergence from disequilibrium
We therefore use this approach to test for linkages between both sets of variables ndash NDF and
onshore SPOT ndash and NDF and onshore FORWARDS
Data
We use end-of- India-day closing values for the onshore spot exchange rate for the 1-month a
forwards and the corresponding 1-month non-deliverable-forward (NDF) rates We use daily data
and our full sample runs from 2009 through 2019
54
Results Full Sample
Table 4 ECM and Long run coefficients (Full sample)
The first row are the linkages between the onshore spot and NDF markets while the second row
is that of the onshore forwards and NDF market
In both cases the betas (β) are positive statistically significant and with a magnitude very close to
or at 1 implying an almost one-for-one movement between both the markets in the long run For
example the estimated β1 of 099 suggests that for a 1 increase in NDF rates there is 099
increase in spot rates in the long run Meanwhile between onshore FORWARDS and NDF there
is a complete pass-through in long run More generally a beta (β) close to 1 suggests there is no
permanent friction between onshore and offshore markets in the long run
Convergence
However the real interest is in the alphas In the first case both 120572119904119901119900119905 and 120572119899119889119891 are statistically
significant and oppositely signed This suggests that they both converge towards each other Put
differently the NDF rate moves towards the onshore SPOT rate and vice-versa In other words
there is a bi-directional relationship between both variables The magnitude of the coefficients
(007-018) suggests a moderate speed of convergence to the long-run equilibrium when a shock
causes the system to go into disequilibrium
The same results are obtained when studying linkages between the onshore forward and NDF
markets Both 120572119891119900119903119908119886119903119889 and 120572119899119889119891 are statistically significant oppositely signed (suggesting they
converge towards each other) with coefficients that are slightly larger than the SPOT-NDF pair
This suggests that both NDF and the onshore FORWARD rates influence each other and gradually
converge towards their long-term relationship when hit by a shock ndash a speed of adjustment that is
modestly faster than the NDF-SPOT relationship
Time Period April 2009 to March 2019
Onshore Spot and NDF -018 007 099
Onshore Forwards and NDF -032 023 100
55
For the full sample as a whole from 2009 to 2019 we find that there is a bi-directional relationship
on average between SPOT and NDF and FORWARD and NDF and that all variables converge
gradually to their long-term relationship
Results Stressed Times
Our results should be thought of as ldquoaveragerdquo results across the entire time period But are these
results a function of context Does the direction of influence change for example during periods
of currency stress versus periods of calm We explore this next
To test for this we start by isolating clearly-identifiable periods of stress ex post facto in our
simple Two episodes naturally come to mind the taper tantrum of 2013 (where the Rupee
depreciated 26 between May 2013 and August 2013) and the emerging market (EM) turmoil ndash
characterized both by the Fed raising rates and oil prices firming ndash such that the Rupee depreciated
almost 10 between August 2018 and October 2018
2013 The Taper Tantrum
We test interlinkages from the start of May to the end August 2013 ndash during the Taper Tantrum ndash
when the Rupee was under intense pressure and easily amongst the worst performing currencies
in the emerging market (EM) universe Results are presented in Table 5 below
Table 5 ECM and Long run coefficients
As one can observe 120572119899119889119891 in both equations is statistically insignificant What this implies is onshore
spot and forward rates were playing very little role in influencing NDF rates7 In contrast 120572119904119901119900119905 and
120572119891119900119903119908119886119903119889 are correctly signed and statistically significant (the former at the 1 level and the latter
at the 10 level) which suggests it was the NDF rate that was driving the onshore spot and forward
rates Interestingly the speed of adjustment is much faster for onshore spot rates in this sample (-
11) compared to the full sample (-018) and also relative to the onshore forward market (-08) An
7 In fact onshore spot and forward rates do not granger cause NDF as none of the lags of 12057221(119894) in equation 2 are
statistically significant during this period
Onshore Spot and NDF -11 -028 094
Onshore Forwards and NDF -08 015 097
Time Period May 2013 to August 2013
56
ECM (alpha) coefficient of greater than 1 suggests the witnesses an oscillating convergence Since
a coefficient greater than 1 is prime facie surprising we also conduct a robustness exercise
(described below) by running Granger Causality tests for this time period and find it is the NDF
that Granger-causes onshore rates and not the other way around
This finding likely reflects the growing volumes ndash potentially speculative ndash in the NDF market in
the 2013 period of stress relative to the volumes in the onshore market This also prime facie
reduced the efficacy of foreign currency intervention by the central bank because intervention was
used to shape the spot exchange rate at the end of Indiarsquos business day But because the NDF is a
24 hour market NDF rates evolved overnight and when the Indian market opened the next day
onshore rates were influenced by NDF developments overnight This rendered ineffective the
previous dayrsquos intervention because there was often little correlation between the closing exchange
rate of the previous day and the opening rate of the next day and therefore necessitated additional
intervention the next day
Visually this is evident in the ldquogap-uprdquo movements of the exchange rate when the Indian market
opened ndash vis-a-vis the previous dayrsquos close ndash during those three months Figure 3 for example
captures this for the month of August 2013
Figure 3 Gap-up opening in USDINR (August 2013)
Source Bloomberg
57
2018 More of the Same
Emerging markets came under renewed stress in the summer of 2018 against the back drop of the
Fedrsquos hiking cycle accompanied by the rally in crude pieces which had surged 50 over the course
of a year As some large emerging markets ndash Argentina Turkey ndash came under some stress there
was a contagion to all emerging markets with current account deficits of which India was one
Between May and October 2018 the Rupee depreciated almost 10 against the US Dollar
What were the offshore-onshore linkages during that period of time Results are presented in Table
6
Table 6 ECM and Long run coefficients
The linkages mimic 2013 The coefficient on whether onshore drives offshore 120572119899119889119891 is insignificant
in both regressions This re-affirms that in line with 2013 onshore spot and forwards were not
driving the NDF rate8 In contrast 120572119904119901119900119905 and 120572119891119900119903119908119886119903119889 are both correctly signed quantitatively
meaningful and statistically significant This suggests that it was the NDF rate that drove the
onshore spot and forward during this period likely reinforcing the presumption that volumes rise
sharply in NDF markets during periods of stress which then become the hub of price discovery
and influences onshore rates As Figure 4 reveals this is visible in the ldquogap-uprdquo movement of the
Rupee at the start of the day for several days in the month of August 2018
8 Onshore spot and forward rates does not granger cause NDF as none of the lags of 12057221(119894) in equation 2 are
statistically significant
Time Period August 2018 to Nov ember 2018
Onshore Spot and NDF -10 -05 096
Onshore Forw ards and NDF -115 -05 096
58
Figure 4 Gap-up opening in USDINR (August 2018)
Source Bloomberg
Our analysis also reveals that the speed of adjustment is very rapid relative to the baseline
Robustness test
The results are robust to the selection of time and tenure of the NDF For example instead of
India end-of-day (EOD) time as the NDF cut-off if we consider New York EOD as the NDF cut-
off there are no qualitative changes in the results Similarly instead of considering the 1-month-
NDF if we consider the 3-month-NDF the results essentially stay the same Furthermore given
the short time periods involved during stressed times (May to August 2013 and August to
November 2018) one can argue that co-integration equations may not be relevant We therefore
also carry out Granger causality tests for these time-periods and find the direction of causality to
be just above ie NDF rates are driving onshore rates during stress periods and not vice versa
Controlling both ldquoMeanrdquo and ldquoVolatilityrdquo spillovers
Thus far our focus has been on mean spillovers However as found by Misra and Behera (2006)
there are also potential ldquovolatilityrdquo spillovers from the NDF market to the spot and forward market
To model the coexistence of both mean and volatility spillovers we use a multivariate generalised
autoregressive conditional heteroskedasticity (MGARCH) model The degree of volatility
59
spillovers is measured by estimating dynamic conditional correlations between the markets The
empirical analysis is conducted using daily data from April 1 2009 through March 29 2019 and
using the currency pairs for (i) NDF-Spot (ii) NDF-Forwards and (iii) NDF-Futures
This model examines simultaneous interactions of conditional returns and volatilities across the
markets In this modelling framework we examine the Granger-causality in mean and variance as
discussed in Behera (2018) The results corroborate the earlier results that there is bi-directional
mean spillovers between onshore and offshore markets (Table 7)
An important finding using this approach is that the impact of price spillover from offshore to
onshore remains up to substantial lags while that from onshore to offshore dissipate after one day
(Annexure II) This ensues from the result that the individual coefficient estimates in the mean
equations of BEKK-MGARCH model are found to be statistically significant up to 5 lags in the
regression of returns in onshore market on that of offshore market while in the opposite case the
coefficient of onshore return is statistically significant only for the first lag
Table 7 Granger-causality tests in Mean
Direction of Causality Results
Spot to NDF 1-Month Yes
Spot to NDF 3-Month Yes
Spot to NDF 6-Month Yes
NDF 1-Month to Spot Yes
NDF 3-Month to Spot Yes
NDF 6-Month to Spot Yes
Forward 1-Month to NDF 1-Month Yes
Forward 3-Month to NDF 3-Month Yes
Forward 6-Month to NDF 6-Month Yes
NDF 1-Month to Forward 1-Month Yes
NDF 3-Month to Forward 3-Month Yes
NDF 6-Month to Forward 6-Month Yes
Futures 1-Month to NDF 1-Month Yes
Futures 3-Month to NDF 3-Month Yes
Futures 6-Month to NDF 6-Month Yes
NDF 1-Month to Futures 1-Month Yes
NDF 3-Month to Futures 3-Month Yes
NDF 6-Month to Futures 6-Month Yes
Note Null hypothesis is rejected if the p-value in the Wald test is less than 5 per cent
60
Volatility spillover between markets are studied by examining the statistical significance of
individual coefficients Granger causality in variance tests and estimating the dynamic conditional
correlations Beginning with granger causality test results imply a bidirectional causal relationship
between volatilities in both onshore and offshore markets of 1-month maturity segments only
(Table 8) In normal times no volatility spillovers are observed across the markets in other
maturity segments which reverses in the period of increased uncertainty (as found from Granger-
causality-in-variance tests taking into account asymmetric effects) The results from individual
coefficient estimates indicate about the presence of short-term volatility spillover between the
markets while the long-term volatility transmission is statistically significant from NDF market
to onshore spot forward and futures markets Moreover the asymmetric coefficients in variance
equation provide interesting insights ndash with the evidence of rise in volatility spillover from onshore
to offshore market in case of rupee appreciation while the opposite happens ie the volatility
spillover increases from NDF market to onshore market in the episodes of rupee depreciation
(Annexure II)
Table 8 Granger-causality tests in Variance
Direction of Causality Results
Without Asymmetry Effect With Asymmetry Effect
Spot to NDF 1-Month No Yes
Spot to NDF 3-Month No Yes
Spot to NDF 6-Month No Yes
NDF 1-Month to Spot No Yes
NDF 3-Month to Spot No Yes
NDF 6-Month to Spot No Yes
Forward 1-Month to NDF 1-Month Yes Yes
Forward 3-Month to NDF 3-Month No Yes
Forward 6-Month to NDF 6-Month No Yes
NDF 1-Month to Forward 1-Month Yes Yes
NDF 3-Month to Forward 3-Month No Yes
NDF 6-Month to Forward 6-Month No Yes
Futures 1-Month to NDF 1-Month Yes Yes
Futures 3-Month to NDF 3-Month No Yes
Futures 6-Month to NDF 6-Month No Yes
NDF 1-Month to Futures 1-Month Yes Yes
61
NDF 3-Month to Futures 3-Month No Yes
NDF 6-Month to Futures 6-Month No Yes
Note Null hypothesis is rejected if the p-value in the Wald test is less than 5 per cent
In order to understand how the volatility spillover between the markets changed over time a
variant of MGARCH model viz dynamic conditional correlation (DCC) model as proposed by
Engle (2002) is estimated taking the same pair of onshore-offshore exchange rate returns The
conditional volatility of 1-month NDF 1-month futures and their dynamic correlations are plotted
in Chart 249 The chart shows a sudden and significant rise in volatility during the episodes of
European debt crisis taper tantrum and latter part of 2018 coinciding with the rise in offshore-
onshore spreads resulting from the concerns regarding high current account deficits and large
capital outflows It is important to note that the volatility in NDF market is higher compared to
futures market and the divergence between the two gets accentuated in the times of heightened
uncertainty This in turn in conjunction with the rise in information asymmetry results in a drop
in correlations Since volatility spillover increases from offshore to onshore markets as discussed
earlier during periods of heightened uncertainty the volatility in onshore market increases
following the heightened volatility in offshore market In subsequent periods the correlation
increases indicating about the rise in spillovers A closer examination of the data on the volatilities
in two markets shows that volatility increases in offshore market first before it increase in onshore
markets with a lag of 1 to 2 days The correlations being positive and substantially higher imply a
significant degree of spillovers between the markets
9 The conditional volatilities for other pairs are qualitatively almost similar though their dynamic correlations are
different the dynamic correlations are provided in Chart 25
62
The dynamic correlations of volatilities for different pairs are presented in Chart 25 reveal that
that all the correlations were highly integrated and moving together alike until end December 2014
However the apparent structural changes in correlation process were observed since then with the
trends of correlations of NDF with spot and forward moving in one direction and that of NDF and
Futures moving on the opposite direction until mid-2017 The correlations have started coupling
though still continuing with some gaps between them since July 2017
060
065
070
075
080
085
090
095
00
05
10
15
20
25
30
2009 2010 2011 2012 2013 2014 2015 2016 2017 2018
Chart 24 Time-varying Volatility and Correlations Futures and
NDF
1-month Futures 1-month NDF DCC (right scale)
63
Conclusions and Implications
Since the work on establishing onshore-offshore price linkages in India was relatively sparse
outdated and inconclusive the goal of this Chapter was to create an updated empirical fact base
given the rapidity with which capital markets have developed and integrated and the pace at which
the NDF market has grown The overall results present a bidirectional relationship between
onshore and offshore markets
First that for full sample the price linkages ndash both mean and volatility ndash are found to be
bidirectional Both onshore and offshore rates have a strong long-term relationship and that when
a shocks throws that relationship into disequilibrium both onshore (spot and forward) and offshore
rates converge towards each other This suggests both influence each other This is consistent with
earlier findings in literature and should not be surprising Relative volumes across these market
are very dynamic and vary significantly When the bulk of the volumes flow through the onshore
050
055
060
065
070
075
080
085
090
095
100
2009 2010 2011 2012 2013 2014 2015 2016 2017 2018
Chart 25 Dynamic Conditional Correlations of Volatilities
SPOT_NDF1 SPOT_NDF3 SPOT_NDF6 FW1_NDF1 FW3_NDF3
FW6_NDF6 FUT1_NDF1 FUT3_NDF3 FUT6_NDF6
Forwards
Futures
Spot
64
market it becomes the locus of price discovery The converse is true when the bulk of volumes
are routed through the NDF market which then becomes the principle pole of price discovery
During the last two stress episodes (the taper tantrum and the 2018 EM crisis) however the
relationship turned unidirectional with the NDF market driving onshore spot and forwards and
the speed of adjustment from any disequilibrium increasing very sharply compared to ldquonormalrdquo
times Furthermore volatility spillovers also increased from offshore markets to onshore during
the periods of heightened uncertainty There is however an interesting asymmetry There is
evidence of rise in volatility spillover from onshore to offshore market in case of rupee
appreciation while the opposite happens ie the volatility spillover increases from NDF market to
onshore market in the episodes of rupee depreciation
All told as NDF volumes have increased they have begun to play an important role in both price
discovery and driving volatility particularly during heightened uncertainty periods
65
Chapter 4
International Financial Service Centre (IFSC)10 ndash Use of Rupee derivatives
The Task Force (TF) is vested to examine the role if any IFSC can play in addressing the concerns
arising out of offshore Rupee markets Presently Rupee is not permitted to be traded in the IFSC
This chapter discusses the aspects relevant to availability of non-deliverable Rupee derivatives in
the IFSC and permitting banks (IFSC Business Units or IBUs) to deal in such derivatives Before
discussing the potential benefits and concerns from the aforesaid proposition it is important to
address this issue ndash Are markets in IFSC onshore or offshore In the context of the Rupee market
a critical test for deciding the residency of the market would be applicability of capital controls in
respect of taking and exiting positions under FEMA 1999 Inter alia this is the critical aspect in
difference between the price discovered in onshore and offshore market As the IFSC functions
outside the capital controls under FEMA 1999 type of participants and the price discovered in
Rupee markets here will align with the existing offshore markets and therefore it cannot be treated
as onshore market To sum up while legally IFSC is very much an entity on the shores of India
from the point of view of Rupee markets it has to be treated as an offshore entity
Potential benefits of permitting non-deliverable Rupee derivatives in the IFSC
i Bringing NDF market volume to the IFSC Over the last decade or so a significant
market share in financial services related to India has moved to other international financial
centres like Singapore Hong Kong and London Bringing this business to India is clearly
beneficial in terms of economic activity and employment gains for India Further the size
and growth of the offshore Rupee derivative market poses a significant challenge to the
efficiency of price discovery as well as the effectiveness of exchange rate management
policy The possibility that the exchange rate of the Rupee not a fully convertible currency
being materially determined by transactions largely outside the legal and regulatory
influence of India is a matter of concern Given the favourable tax regime tax and by virtue
10
International Financial Services Centre or lsquoIFSCrsquo has the same meaning given in Section 2 (q) of the Special
Economic Zones Act 2005 (28 of 2005)
66
of it being outside the capital controls under FEMA 1999 IFSC may bring volumes and
price discovery to India
ii Complete bouquet of financial services in the IFSC Currently exchanges in IFSC are
permitted to offer a well-diversified range of products spanning various asset classes
which include derivatives on Indian indices derivatives on Indian stocks derivatives on
foreign stocks cross currency derivatives commodity futures on Gold Silver and base
metals etc Further while listing and trading of Masala Bonds is permitted in the IFSC
hedging Rupee exchange rate risk on it is not permitted Thus introduction of Rupee
derivatives will complete the entire range of asset classes available for trading in the IFSC
iii Access to market information The offshore Rupee market has been the subject matter of
interest for all stakeholders as these markets have an impact on onshore markets However
in the absence of any authentic data there are varying estimates about the volumes traded
in these markets nature of participation extent of open interest and the extent to which
these markets are used for hedging purposes If by opening up the IFSCs to Rupee trades
there is some migration of offshore Rupee market volumes it will help the cause of better
information flow regarding the market
iv Level playing field for Indian banks Foreign bankrsquos branches outside India can deal in
the offshore market as they are not bound by the RBIrsquos regulations On the other hand
overseas branches of Indian banks cannot deal in Rupee derivatives in the offshore market
By introducing Rupee derivatives in IFSC and permitting IBUs to deal in such derivatives
a more level playing field can be provided to Indian banks to service non-residents
Concerns from non-deliverable Rupee derivatives trading in the IFSC and dealing by IBUs
such derivatives
i Cannibalizing onshore business One major concern arising out of the introduction of
non-deliverable Rupee derivatives in the IFSC is whether it would cannibalize the business
of the onshore market instead of importing volumes from abroad Since the products in
both IFSC and the onshore market would be more or less similar in terms of characteristics
the domestic futures market getting gradually cannibalized by the IFSC on the face of it
appears probable But a deeper analysis of the comparative regulatory framework would
allay such concerns to a large extent The domestic currency futures market is majorly
67
made up of resident participation Non-residents are nearly absent in these markets and
hence their shift to the IFSC is more a theoretical proposition Since the Indian residents
are not permitted to participate in the IFSC they cannot contemplate a move-over It also
important to note that the onshore market settles in INR whereas derivative contracts in
the IFSC would settle in dollars and hence these markets will cater to two distinct classes
of participants
ii Impact on exchange rate management policy and development of the onshore market
Presently Indian banks are not allowed to deal in Rupee derivatives in the offshore market
A detailed discussion on the issue of allowing such dealing is presented in Chapter 5 In
consideration of the risk that participation of Indian banks may improve liquidity in the
offshore market and undermine the development of the onshore market the TF is of the
view of that Indian banks should not be permitted to deal in offshore Rupee market IFSC
being an offshore centre all concerns expressed in Chapter 5 in this regard are valid on
Rupee market in IFSC also However unlike other offshore Rupee market venues IFSC
has the potential of providing certain benefits to India as discussed earlier in this chapter
and therefore a distinction could be made between the two while examining the case of
permitting Rupee derivatives to be traded in the IFSC
iii Spillover of risks from IFSC to onshore market This is a concern since the two
markets being geographically contiguous could create porous leakage channels This
concern can be addressed by stipulating distinct net open position limits for entities
operating in both IFSC and on-shore In other words the open positions of entities
operating in the IFSC should not be permitted to be netted off with the open position on-
shore
What does a volatile Rupee exchange rate in the IFSC imply for the RBI and onshore
market
Chapter 3 establishes the linkages between the offshore and onshore Rupee market IFSC being an
offshore jurisdiction will have the same impact The RBI as the monetary authority has the
authority under RBI Act to maintain the stability of the rupee A volatile onshore foreign exchange
market could act as the trigger point of volatility in other financial markets like money bonds and
68
equities The spill over impact of financial market volatility casts its shadow on asset prices and
in turn it could have an impact on the capital flows and financial stability Given that a separate
regulator is envisaged for the IFSC the issue of RBIrsquos role in the IFSC was extensively deliberated
by the TF There are two possible approaches
i RBI plays a pivotal role in framing the Rupee derivative regulation in the IFSC In
order to allow the RBI to take measures in line with the objectives of exchange rate
management policy the sine qua non for allowing Rupee derivatives in the IFSC is to
ensure that RBI vested with the obligations to maintain financial and monetary stability
should continue to perform its statutory role in determining the regulatory framework for
Rupee market in the IFSC
ii Treat it akin to any other offshore market and maintain a hands-off approach The
objective of introducing Rupee derivatives in the IFSC is to provide an alternative to non-
residents for dealing in non-deliverable Rupee derivatives The expected transition of
investors is likely to be successful only if the IFSC functions with same freedom as other
offshore markets At the same time from an exchange rate management perspective
permitting Rupee trading in IFSC should not make a material difference to local authorities
as long as there is a barrier between the onshore market and IFSC In that case IFSC would
be exactly of the same status as any other offshore market
The TF feels that in line with the objectives of permitting Rupee derivatives in the IFSC the latter
approach - that the regulatory environment in which Rupee trades in IFSC is exactly similar to the
environment that prevails in any other offshore centre - is preferable As IFSCs are treated on par
with a foreign jurisdiction in terms of FEMA the regulation of the trade and capital flow channels
between the two jurisdictions (on-shore and IFSCs) should be so designed as to restrict the
transmission of volatility through these channels (in terms of participants products limits etc)
Recommendation
While there are concerns around impact on the onshore market due to trading in Rupee derivatives
in the IFSC there are potential benefits in terms of IFSCrsquos ability to offer complete bouquet of
financial services and availability of market information to all stakeholders Further given Indiarsquos
69
economic growth it may be appropriate to prepare for greater financial integration with the rest of
the world Sequencing and timing of measures relating to currency markets is a critical component
of such integration Although at the moment there is no definite path ahead in terms of such
integration but a thriving Rupee market in the IFSC may provide a system which can be leveraged
towards this end in the way and manner deemed fit in future IFSC being outside the capital
controls provides an opportunity to policymakers to test new regimes and products in an
environment whose repercussions may not significantly impact the stability or efficiency of the
onshore system On balance the TF is of the view that non-deliverable Rupee derivatives may be
introduced in the IFSC However a phased approach may be adopted and to start with trading
may be permitted only on exchanges due to the inherent transparency and risk management
benefits offered by it Introducing OTC contracts may be considered at a later stage after the
experience gained from trading on exchanges RBI may in its Financial Stability report assess the
impact of the functioning of IFSC on the financial stability of the country
Further the TF is of the view that entities regulated and permitted by the RBI may be permitted
to make market and run positions in Rupee derivatives market in the IFSC In order to prevent
spill over of risks from IFSC to onshore market though these entities a distinct net open position
limit may be stipulated for their operations in the IFSC In other words the open positions of
entities operating in the IFSC should not be permitted to be netted off with their open position
the onshore market
Finally given the mandate of RBI to implement exchange rate policy it may not be in benefit of
things to introduce Rupee derivatives in the IFSC without it being on board and therefore the TF
feels that Rupee derivatives may be permitted in the IFSC subject to agreement of the RBI
70
Chapter 5
Issues and Recommendations
The Task Force (TF) is entrusted to recommend measures to incentivize non-residents to access
the onshore Rupee derivative market and address concerns if any arising out of the offshore
Rupee derivative market As discussed in Chapter 1 the TF had interactions with various
categories of stakeholders to understand their perspective on the matter and identify the issues that
needs to be addressed
Chapter 2 and 3 have clearly brought out the increased importance of offshore Rupee markets
both in terms of their size and in terms of their impact on the exchange rate of the Rupee The price
and volatility spillovers from one market to the other are almost complete they are bi-directional
and when rupee is under pressure they are unidirectional from offshore markets to onshore
markets The speed of convergence of the markets is also quite quick The TFrsquos recommendations
have been made in the light of available information results of statistical analysis and most
importantly on the feedback received from various consultations
While increased participation of non-residents would be expected to enhance liquidity in the
onshore market it may also bring along with it additional volatility and transfer of incremental
risk to the domestic system This is particularly so as historically the rupee is a currency that has
generally depreciated and the demand for forward dollars is usually more than the supply
especially in times of stress Hence it is pertinent to examine the impact of incremental hedging
by non-residents in the onshore market While volatility in the rates have a clear impact on the real
sector events in the domestic derivatives markets in the late 2000s constantly remind us of issues
related to transfer of risk to entities that are not capable of understanding and managing it The big
question then is whether our system today is ready for incremental demand for hedging from non-
residents Available data is inadequate to measure the contribution of hedgers and speculators in
the offshore market turnover Using the best available information it can be estimated that an
additional daily average Rupee derivative turnover of around 08 billion ndash 24 billion could be
generated in the onshore market if all the INR NDF hedging transactions are transferred from the
offshore market (see Box 1) Such an incremental flow is not significant enough to cause any
adverse impact on volatility in the onshore market given that the user-driven deliverable forwards
market in India is quite liquid with daily average turnover of USD 163 billion (as per BIS
71
Quarterly Review December 2016) As regard transfer of risk to the domestic system the concern
is more regarding transfer of risk to the Indian companies and less towards market-makers as they
are in the business of managing risk There is a possibility that the said incremental positions
created in the onshore market may get transferred to Indian companies (in part or full depending
upon the level of these positions retained by the market-makers) However in comparison with
the late 2000s Indian companies today are only allowed to enter into Rupee derivatives depending
on their underlying exposure and no leveraged structures are permitted Also banks are bound by
stringent suitability and appropriateness norms Therefore the chances of Indian companies
acquiring unmanageable risk positions or risks due to mis-selling by market-makers are very low
Further there has been a significant growth in the external sector and consequently the foreign
exchange market has also grown (although one could argue on the incommensurate growth) To
summarize in the last decade or so the ecosystem on the whole has evolved and is less prone to
adverse impact from transfer of risks from non-residents
Box 1
Approximation of share of hedging transactions in INR NDF turnover
The graph presented below is extracted from BIS Quarterly Review December 2016
72
It can be observed from the above graph that non-financial and other financial institutions
contribute around 5 and 35 respectively to the turnover of INR NDFs in the offshore market
If one were to make an informed guess that all transaction by non-financial companies are hedging
transactions and that hedging transactions by other financial companies (eg funds) would
constitute maximum 25 of their transaction then it can be approximated that hedging transactions
constitute around 5 - 15 of the daily average turnover in INR NDF market which was reported
as USD 164 bn
Comparison of turnover in forwards in onshore and offshore market - In the same publication
it is also reported that the average daily turnover in onshore deliverable forwards is USD 163 bn
It may be noted that for fair comparison with the turnover in offshore market (where deliverable
spot and swap market doesnrsquot exist) this turnover includes both deliverable forwards and FX
swaps A comparative analysis of volumes in onshore and offshore market ndash both OTC and
exchange traded Rupee derivatives - is given in Annexure IV
Issues and recommendations
1 Market hours
An important reason for the existence of the offshore Rupee derivative market is simple geography
That domestic markets are closed when major users in certain regions (eg the United States) are
working creates a natural access for offshore markets Also significant international developments
impacting the Rupee exchange rate take place outside the onshore market hours thereby creating
a natural clientele for the offshore markets The feedback received from non-resident investors as
well as corporates highlighted the closure of the local market as an important reason for them
accessing the offshore market Exchanges have for some time been requesting an extension of
market hours citing increasing Rupee transaction volumes in offshore exchanges situated in
Singapore and Dubai A straightforward way of taking care of such requirements is to extend the
onshore market hours (both OTC and exchange traded derivative markets) While extending
market hours might involve simultaneously keeping support services (payment and settlement
systems) or support markets (funding markets) open it is also possible to treat such transactions
as part of the operations of the next day in which case the need for settlement or funding does not
73
arise In this regard the TF supports the recommendations relating to market timings outlined in
the draft Report of the Internal Working Group on Comprehensive Review of Market Timings
published by RBI on July 10 2019
Recommendation 1
The TF recommends that the onshore market hours be suitably extended to match the flexibility
provided by the offshore market and thereby incentivize non-residents to hedge in the onshore
market
2 Competitive pricing
One important feedback from foreign portfolio investors (FPIs) as well as global corporates was
that they are unable to access multiple competitive quotes in the onshore market Effectively they
are limited to using the prices of their custodian banks Generally FPIs deal only with their
custodian banks due to the existing rules whereby the custodian is responsible for tracking of
outstanding hedges vis-agrave-vis portfolio size This ldquofrictionrdquo issue can be addressed by shifting the
monitoring to a centralized agency which can use a technology solution to track exposures as well
as outstanding hedges This is further explained in recommendation no 4 ahead relating to
underlying exposure
Also the process to be setup documentation such as KYC and other trading arrangements with
multiple counterparties in India is a long and difficult exercise resulting in most FPIs either trading
with their custodian bank or using the offshore market to hedge Some of the documentation related
challenges can be minimized if the centralized KYC registration currently in place for SEBI
regulated entities is extended to all the entities ie both custodial banks as well as non-custodial
banks This is elaborated in recommendation no 11 on the KYC process
Another issue highlighted by FPIs in this context was unavailability of multi-dealer electronic
dealing platforms for them One way of making onshore prices more widely accessible to non-
residents is to allow Indian banks to freely offer prices as liquidity providers to non-resident
customers at any time whether or not the domestic market is open They can extend to non-resident
corporates the same choices that domestic corporates have in choosing among various market
makers This can be done either by a domestic sales team or by using staff located at overseas
74
branches In addition making an all-to-all trading platform (like the FX-Retail being introduced
in August 2019) available to non-residents would supplement that effort
Recommendation 2
The TF recommends that banks may be allowed to freely offer prices to non-residents at all times
out of their Indian books either by a domestic sales team or by using staff located at overseas
branches Also wide access to the FX-Retail trading platform to non-residents would be a major
incentive to use the onshore market
3 Effect of offshore Rupee derivative market on onshore price discovery and exchange rate
management policy
The size and growth of the offshore Rupee derivative market especially in the last few years poses
a significant challenge to the efficiency of price discovery as well as the effectiveness of exchange
rate management policy A comparison of onshore and offshore Rupee derivative market is given
in Annexure IV The possibility that the exchange rate of the Rupee not a fully convertible
currency will be materially determined by transactions largely outside the legal and regulatory
influence of India is a matter of concern The most straightforward approach to deal with that
concern would be to completely liberalize the onshore market and bring it at par with the offshore
market in all aspects Such a scenario would imply an effective absence of local regulation and
intervention which is incompatible with the current status of capital account convertibility
Another option is to liberalise the onshore market to the extent possible but this in itself may not
necessarily mean a fall in importance or size of the offshore market In this connection the TF
extensively discussed the proposition of creating a connection between the offshore and onshore
markets by permitting Indian banks to deal in the offshore market The various implications of
such a step are discussed below
i Reduction in volatility In theory a segmented market would be less liquid and therefore
more volatile compared to an integrated market One could also infer that offshore market
activity is maximum during onshore working hours eg almost three-fourths of the
offshore rupee futures are traded when Indian markets are open It is also observed that
75
offshore spreads are larger which indicates a relative scarcity of market-making entities
Linking the two markets may increase both the customer base as well as the liquidity
providers thereby improving liquidity as well as efficiency of the price discovery process
ii Better customer pricing through increased transparency in the offshore market
Today very little information is available regarding the offshore Rupee market other than
that of exchange traded instruments Such opacity is not in the interest of customers as
liquidity provision is limited to entities that have a presence both onshore and offshore
resulting in a premium (in terms of high bid-ask spreads) being charged for market access
Broadening this access to onshore banks would drive away such premium through wider
competition At the same time access to information improves for the local authorities
Since better information leads to better price efficiency it is in the interest of local
authorities to disseminate such information leading to an overall improvement in market
transparency
iii Level playing field for Indian banks Foreign bankrsquos branches outside India can deal in
the offshore market as they are not bound by the RBIrsquos regulations On the other hand
overseas branches of Indian banks cannot deal in Rupee derivatives in the offshore market
Allowing them access to the offshore Rupee derivative market would create a level playing
field for Indian banks
iv Impact on development of the onshore market Liquidity in onshore market is better
than the offshore market due to participation of real sector and market making by Indian
banks which obviously are the major Rupee liquidity providers Consequently non-
residents have the ability to exit positions with less impact cost in unfavourable times This
is a strong incentive for them to hedge in the onshore market (given dynamic hedging and
other operational issues are now being ironed out) Also higher liquidity in the onshore
market results in tighter bid-ask spread compared to the offshore market which allows non-
residents to get better pricing in the onshore market The aim of policy measures is to
develop the onshore market Accordingly policymakers strive to protect the advantages of
onshore market and at the same time develop and liberalise the onshore market to overcome
the gap vis-agrave-vis NDF markets in other aspects such as ease of access market infrastructure
and taxation There is of course the risk that participation of Indian banks will improve
76
liquidity in the NDF market and undermine the development of the onshore market Such
a situation will be challenging for implementing exchange rate management policy
Recommendation 3
The onshore Rupee derivatives market is currently more deep and liquid as compared to the
offshore Rupee market and participation of the Indian banks in the offshore market might over
time take away this advantage The TF feels that the downside of permitting Indian banks to deal
in the offshore Rupee derivative market outweighs the advantages and therefore recommends that
Indian banks should not be permitted to deal in the offshore Rupee derivative market for the
present
4 Requirement of underlying exposure and documentation therefor
There is no requirement of an underlying exposure to enter into a derivative contract in the offshore
Rupee derivative market Hence non-residents can freely trade in this market to hedge risk on an
underlying Rupee exposure or create exposure to Rupee However as per extant regulations non-
residents can enter into Rupee derivative contracts in the onshore market only for the purpose of
hedging risk arising from an underlying exposure Non-residents are classified into Foreign
Portfolio Investor (FPI) investors having Foreign Direct Investments Non-Resident Indian Non-
resident Exporters and Importers and Non-Resident lenders having ECBs designated in INR with
each category being subjected to a different set of rules for establishing underlying exposure
FPIs are allowed to hedge only on the basis of existence of underlying exposure with the hedge
size capped at the market value of investment in equity and debt in India as on a particular date
including any coupon receipts arising out of investment in debt securities falling due during the
following twelve months only The explicit mention of only equity and debt investments creates
regulatory ambiguity on hedging of other FPI exposures in India such as margin deposits cash
etc Hence any FPI having investment in India will be able to only buy USD forward against INR
onshore and will not be allowed to sell USD against INR in forward market as that would result in
increasing the exposure rather than hedging the exposure To prove the exposure a valuation
certificate is required to be provided by a designated AD bank (Custodian) as a proof of underlying
FPIs are also required to provide a declaration to the effect that their total outstanding hedges are
within the market value of their investments The only exception to establishing underlying
77
exposure requirement is dealing in exchange traded market where FPIs are allowed to take
positions without having to establish existence of underlying exposure up to USD 100 million
FDIs are allowed to hedge both their existing investment as well as proposed foreign direct
investments with the latter being allowed only after an AD bank ensures that all necessary
approvals for the investment have been obtained by the FDI With respect to non-resident
corporates users can hedge their exposures invoiced in INR and intercompany loans denominated
in INR (ECBs) They can book the hedge either directly with an AD bank in India or on a back-
to-back basis Prior to hedging they must furnish a declaration certifying that the underlying
exposure has not been hedged with any other AD bank(s) in India They are required to cancel the
hedge contract immediately if the underlying exposure is cancelled In case of a central treasury
an authorization from the entity having INR exposure to hedge on its behalf is also required
Irrespective of the category of the investor the requirement to establish underlying exposure
creates practical difficulties for many non-residents Funds who intend to execute macro hedge for
various schemes or MNC parents wanting to consolidate exposures across subsidiaries and
executing a single hedge find it easier to execute consolidated hedge in the offshore market Also
hedging of anticipated and economic exposures is not permitted
Recently the RBI has released11 draft regulation regarding risk management facilities for public
feedback The TF reviewed it in detail and also received feedback on it during interaction with
stakeholders The proposed regulation satisfactorily addresses a lot of pertinent issues Measures
on simplifying eligible underlying exposure criteria simplifying documentation requirement
flexibility to hedge dynamically ability to hedge anticipated exposures user classification (retail
and non-retail) and choice of products are welcome and much needed It is noted that the
requirement of having an underlying exposure for entering into Rupee derivative contract is
retained and it is felt that it is justified for effectiveness of exchange rate management policy and
ensuring financial stability Given that only hedging transactions are going to be permitted in the
onshore market there will remain a requirement to establish or declare existence of underlying
exposure to risk and also to ensure that notional of hedge contracts is in line with the value of
underlying exposure As discussed above such requirement acts as a deterrent for non-residents to
hedge in the onshore market It would be optimum if a solution can be found that fulfils the
11
Vide press release dated February 05 2019
78
requirement of verification of underlying exposure without the investors being required to
undertake the efforts to prove it This can be achieved by consolidating the existing data on
investments and hedge transactions residing with various regulated entities
Recommendation 4
The TF recommends that a technology-based solution be explored to centrally aggregate the
investments of non-residents and derivative contracts entered into by them in the onshore market
(both OTC and exchange traded) using LEI or any other unique identifier to start with ADs should
be allowed access to such aggregate data so that they can verify the quantum of derivative positions
and underlying investments of the non-residents This mechanism can potentially completely
remove the requirement of efforts from the non-residents to prove the existence of underlying
exposure to Rupee
Further to simplify procedures and provide ease of access to the exchange traded currency
derivative market the RBI has allowed users to enter exchange traded instruments (futures and
options) to take exposure up to USD 100 million without the requirement of establishing the
existence of underlying risk Such measures go a long way in encouraging users (especially
MSMEs) to hedge their exchange rate risk by making the process easier At the same time such
calibrated opening helps in addressing any concerns of systemic risk The TF feels that such an
incentive must be provided in the OTC market also as it will not only contribute to ease of doing
business but also to restore parity in regulation between OTC and exchange markets
Recommendation 5
While requirement of underlying exposure will continue for trading in the onshore market users
may be allowed to undertake positions up to USD 100 million in OTC as well as exchange traded
currency derivative market without having to establish the underlying exposure
5 Products
Non-residents can enter into only plain vanilla forwards and option contracts in the OTC foreign
exchange market Further swaps are restricted to specific case of IPO and non-resident lenders of
ECB denominated in INR Non-residents who prefer to express their hedge using structured
79
options necessarily need to execute in the offshore market as current regulations do not allow non-
residents to enter into structured options
Recommendation 6
The aforesaid draft regulation addresses this issue by allowing ADs to offer any product to the
non-residents (for non-retails users) which satisfies the purpose for which they are permitted to
enter into Rupee derivatives ie hedging of underlying exposure to Rupee In other words ADs
cannot offer any product that creates risk for the user instead of hedging the existing risk The TF
endorses this principle-based regulation approach
6 Restrictions on dynamic management of risk
Non-residents trading in the offshore market are free to cancel and rebook their trades depending
on their future expectations andor risk management policy On the other hand in the onshore
market non-residents in general are not allowed to rebook a contract once cancelled Only in the
case of FPIs rebooking up to 10 of the value of contracts cancelled is permitted Inability to
manage risk dynamically deters non-residents who look for flexibility while hedging their risks
The aforesaid draft regulation proposes to remove restrictions on rebooking of cancelled contracts
and thereby allow users to hedge dynamically For contracts entered into for hedging contracted
exposure gains (or losses) on cancellation will be passed on to the user as and when they accrue
but in case of contracts entered into for hedging anticipated exposures net gains will be transferred
only when the underlying cash flow has occurred The prime purpose of such stipulation is to curb
incentives for speculation by using the liberal position limits available under anticipated exposure
hedging However a consequent drawback is that in some instances eg contingent contracts
such as bidding for projects involving currency risk such a provision would not be equitable This
provision could be suitable amended to enable all types of hedging without compromising the
essential control that the cash flow requirement provides to ensure underlying in a hassle-free way
The TF is of the view that providing suitable discretion to banks to pass on net gains even without
cash flows in such cases would address this shortcoming This will ensure that genuine hedgers
80
will access the onshore market without worrying about retention of gains if underlying transaction
does not fructify due to reasons beyond their control
Recommendation 7
In line with the objective of bringing onshore market at par with offshore market the most obvious
path is to not have any restrictions on transfer of gains in case of anticipated exposure hedging
However a balancing act is necessary between liberalizing the market while preventing
speculative positions which can create undue volatility in the onshore market Keeping this in
mind while endorsing free dynamic hedging (without any restriction on cancellation and
rebooking) for hedging contracted exposure the TF recommends that in case of hedging of
anticipated exposures gains from cancellation of contract may be allowed to be passed on even in
cases where there are no cash flows at the discretion of the bank where the bank considers the
cancellation of underlying cash flow is due to external factors which are beyond the control of the
user
7 Gross settlement and credit risk management
In the case of offshore Rupee derivative market non-residents clear and settle OTC trades either
through a prime brokercustodian or bilaterally with the counterparty In both these cases the non-
residents usually execute a bilateral multi-currency master service agreement which includes
provisions for exchange of margin (ex- ISDA master agreement including Credit Support Annex)
with the counterparty These agreements necessitate periodic settlement of marked-to-market gains
and losses across products and provide the flexibility to net off losses against gains Hence these
agreements significantly lower credit charges and provide strong netting efficiency On the other
hand in the onshore market the non-residents in an otherwise identical situation will face
additional challenges in respect of settlement and exchange of margin due to the following reasons
Gross settlement of gains As mentioned above non-residents clear and settle OTC trades in the
offshore Rupee derivative market either through a prime broker or bilaterally with the
counterparty Typically they settle deal across assets and currencies with either of these entities
and are therefore able to net the cash flows and achieve efficiency in liquidity management
81
However as Rupee derivatives entered into in the onshore Rupee derivative market cannot be
settled under such overseas arrangements non-residents are unable to avail the benefits of netting
on their onshore transactions
Credit risk management Signing a master service agreement locally and establishing credit lines
with onshore banks increases the execution cost of hedging onshore Typically transactions of
non-residents in the offshore market are collateralized (through collateral exchange provisions
contained in the master service agreement) while those in the onshore market are non-
collateralized Depending on the credit rating of the non-resident the onshore banks may not
necessarily be open to providing exposurecredit limits on uncollateralized basis for entering into
deliverable contracts If a collateralized credit line is set up through a master service agreement
with provision for exchange of collateral in USD outside India restrictions under FEMA 1999 on
exchanging margin outside India by onshore banks poses issues If exchange of collateral is in INR
in India then the non-residents will have to either assume the exchange rate risk on the cash margin
deposited or will have to additionally hedge the margin money placed Moreover this attracts
regulatory ambiguity such as minimum tenor restrictions as per deposit regulations ability to
hedge the margin through FX swap interest to be paid on cash in SNRR account etc If interest
cannot be paid on the collateral placed with onshore counterparties it creates a strong economic
disincentive for the investor to hedge onshore
These issues can be addresses in two ways First facilitating the non-residents to utilize their
existing overseas custodianprime broker relationship and master service agreements for
settlement of their transactions onshore and exchange of collateral therefor Second by creating
the regulatory framework for exchange of margin for non-centrally cleared derivatives in India to
make it consistent with evolving clearing mechanism offshore Both the solutions are discussed
below
To help non-residents retain their economic neutrality with respect to the prevailing multi-currency
master service agreement executed offshore a central clearing and settlement mechanism may be
established for non-residentsrsquo deals with onshore counterparties along the lines of central clearing
and settlement of onshore interbank deals by the CCIL The overseas bank of the non-resident will
clear and settle the deals execute by them onshore To be sure the proposal is to introduce the
centralized clearing mechanism while retaining the existing bilateral settlement mechanism so that
82
investors who want to continue using it do not face disruption For the suggested central clearing
and settlement mechanism to be set up inter alia the following permissions would also be
required
i Permission under FEMA 1999 for CCIL to accept foreign currency denominated collateral
in India or outside India
ii Enhancement of CCILrsquos infrastructure to accept wide range of securities (foreign currency
cash securities issued by foreign governments etc) as collateral and
iii Other regulatory clearances required for non-residentsoverseas banks in other jurisdictions
to clear and settle through CCIL
Further back-to-back hedging by non-residents proposed in the aforesaid draft regulation will also
allow effective utilization of their prevailing multi-currency CSA arrangement offshore This
entails allowing non-residents to hedge their exposure with their banking counterpart overseas
which in turn will hedge the position back-to-back with an onshore bank This ensures that existing
dealing arrangements between non-residents and their overseas counterparties remain unchanged
but at the same time the market risk gets transferred to onshore banks and hence is managed locally
The overseas bank should be allowed to settle the onshore leg either bilaterally with the onshore
bank or through the proposed central clearing and settlement mechanism Also this will require
permissibility under FEMA 1999 to exchange margin with the overseas banker of non-residents
outside India In such a model the approach should be to recognize the intermediary offshore bank
as a facilitator purely for the convenience of the non-resident investor Experience from other
markets that have implemented such models like Malaysia and China suggest that putting the onus
of monitoring compliance in terms of quantum of hedge underlying documentation etc on the
intermediary bank is inefficient Such a requirement leads to the intermediary bank asking for
various indemnities from the client and these are often difficult and time consuming to negotiate
and sign The approach should be to monitor compliance by the non-residents as the regulated user
using available onshore infrastructure as well use of technology solutions to track the hedges vis-
a-vis underlying exposure as detailed in recommendation 5
With regard to regulation and infrastructure for exchange of margin for non-centrally cleared
derivatives in India the RBI released a discussion paper on this issue in May 2016 However the
final directions have not been issues yet It is understood that ambiguity in netting legislation is
83
one of the main issues holding the release of these directions Also it is understood that the GoI is
in the process of making legislative changes to address this issue
Recommendation 8
For ease of entering into hedge transactions for non-residents the TF recommends-
i Establishment of a central clearing and settlement mechanism for non-residentsrsquo deals in the
onshore market
ii Back-to-back hedging by non-residents proposed under the draft regulation is endorsed The
overseas bank should be allowed to settle the onshore leg either bilaterally with the onshore bank
or through the proposed central clearing and settlement mechanism
iii Implementation of margin requirement for non-centrally cleared OTC derivatives in the
onshore market at the earliest
iv Allowing Indian banks to post margin outside India This is not only relevant for credit risk
management for their transactions with non-resident users but also for their cross-border inter-
bank transactions
8 Taxation
Under the extant regulatory framework non-residents are permitted to enter into Rupee derivative
contracts only for hedging risk on their investmentslendingtrade in India As per discussions with
stakeholders the following position is generally adopted with regard to the gains from such
contracts
bull Where currencies under the contract are delivered ndash Not a taxable event (ie conversion of
one currency into another does not give rise to taxable income)
bull Where contract is cancelled and price difference is settled ndash If the derivative contract is
entered into for hedging exchange rate risk on a capital asset then gains on cancellation are
treated as capital gains If it is entered into for hedging exchange rate risk in relation to a
tradingbusiness asset such gains are treated as business profits
84
However it is understood that there is ambiguity in the rules in this connection and the position
taken by the Assessing Officers (AOs) differs between zones and is at variance with the aforesaid
position Oftentimes such gains on cancellation are treated as lsquoOther Incomersquo or lsquoSpeculation
Business Profitsrsquo During interaction with the non-residents it was suggested that such uncertainty
of tax treatment is one of the prime reasons why they do not access the onshore market and instead
hedge Rupee exposures in the off-shore market
Recommendation 9
The TF recommends that the competent authorities may examine the issue of taxation in respect
of foreign exchange derivative contracts with the objective of overcoming gaps between tax regime
in India and other major international financial centres (Singapore Hong Kong and London) to
the extent possible and thereby incentivizing non-residents to hedge in the onshore market
9 Allow non-deliverable Rupee derivatives in the IFSC and permit IBUs to deal in such
derivatives
The proposition of introducing non-deliverable Rupee derivatives in the IFSC and permitting
banks (IFSC Business Units or IBUs) to deal in such derivatives is discussed in detail in Chapter
4 While there are concerns around impact on the onshore market due to trading in Rupee
derivatives in the IFSC there are potential benefits in terms of IFSCrsquos ability to offer complete
bouquet of financial services and availability of market information to all stakeholders Further
given Indiarsquos economic growth it may be appropriate to prepare for greater financial integration
with the rest of the world Sequencing and timing of measures relating to currency markets is a
critical component of such integration Although at the moment there is no definite path ahead in
terms of such integration but a thriving Rupee market in the IFSC may provide a system which
can be leveraged towards this end in the way and manner deemed fit in future IFSC being outside
the capital controls provides an opportunity to policymakers to test new regimes and products in
an environment whose repercussions may not significantly impact the stability or efficiency of the
onshore system On balance the TF is of the view that non-deliverable Rupee derivatives may be
introduced in the IFSC However a phased approach may be adopted and to start with trading
may be permitted only on exchanges due to the inherent transparency and risk management
85
benefits offered by it Introducing OTC contracts may be considered at a later stage after the
experience gained from trading on exchanges RBI may in its Financial Stability report assess the
impact of the functioning of IFSC on the financial stability of the country
Further the TF is of the view that entities regulated and permitted by the RBI may be permitted to
make market and run positions in Rupee derivatives market in the IFSC In order to prevent spill
over of risks from IFSC to onshore market though these entities a distinct net open position limit
may be stipulated for their operations in the IFSC In other words the open positions of entities
operating in the IFSC should not be permitted to be netted off with their open position the onshore
market
Recommendation 10
The TF recommends that non-deliverable Rupee derivatives (with settlement in foreign currency)
may be allowed to be traded in the IFSC and IBUs may be allowed to deal in such derivatives with
a distinct FCY-INR position limit To start with exchange traded currency derivatives involving
Rupee may be introduced and with experience non-deliverable OTC currency derivatives
involving Rupee may also be allowed
10 KYC process
The extant directions issued by the Reserve Bank of India stipulates the documents required for
conducting KYC process to open accounts of non-residents Similarly SEBI has also prescribed
documents required for the granting of FPI license by Domestic Depository Participants (DDP)
Further KYC documents for FPIs are available to SEBI regulated entities through KRAs subject
to approval from either the FPIs or the domestic custodians Since access to KRAs is available
only to SEBI regulated entities most banks are not allowed to access KRA and hence seek
complete documentation from FPIs again Such repetitive submission of documents to various
financial intermediaries results in long lead time for on-boarding and makes the entire process
operationally cumbersome for non-residents
Recommendation 11
The TF recommends that the KYC registration may be centralized across the financial market with
uniform documentation requirement All regulated financial market intermediaries should be
provided access to the centralized registry and they should be allowed to rely on online registry
86
for confirmation that KYC has been completed and itrsquos valid This will ensure that non-residents
undertake the KYC process only once and not with each financial intermediary that they deal with
in the onshore market Also such a mechanism offers cost and efficiency benefits for the financial
intermediaries
87
Annexure I
Key features of currency market of major EMEs
I USD-RMB Market ndash China
Onshore Deliverable - CNY Offshore Deliverable - CNH
Market
Turnover
Daily average turnover USD 28
billion
Daily average swap and
forward turnover
USD 62
billion
Daily average options
turnover
USD 15
billion
Daily average
turnover
USD 15-20
billion
Daily average
forward turnover
USD 25-30
billion
Daily average
Options turnover
USD 5-6 billion
Spot foreign
exchange Onshore CNY foreign exchange spot is
available with documentary proof of an
underlying transaction
Participating banks in Hong Kong
provide two types of spot RMB
exchange rate transactions
- For trade service and direct
investment purposes where
resulting foreign exchange
positions can be offset with the
clearing bank or onshore
correspondent banks and
For general purposes where banks need
to warehouse the risk or offset the
position in the interbank USD-CNH
market Forward
FXSwaps CNY forwards and foreign exchange
swaps with maturities of up to five years
are available to onshore institutions to
hedge foreign exchange exposure
subject to documentary proof of the
same
Most liquid is in the tenor of one year or less
CNH deliverable offshore forwards
are available out to five years
Liquidity has improved significantly
and has surpassed turnover in the
NDF market
FX Options Onshore market participants can buy or
sell common European options of CNY
against foreign currencies on a real
needs basis
Tenors are available out to three years
with further tenors on a case-by-case
basis Most liquid is in the tenor of one
year or less
The State Administration of Foreign
Exchange (SAFE) started allowing
corporates to sell FX options from August
2014 on a real needs basis and with net
settlement allowed
Deliverable CNH options are
available without restrictions to any
non-individual counterparty that has
a physical CNH Nostro account in
Hong Kong
Options on USD-CNH and CNH crosses
are available out to five years and
beyond on a case-by-case basis
88
Access to
domestic
participants
On the current account the CNY is
convertible subject to genuine
documentation Onshore entities can
access the local forwards market
provided these contracts are used to
cover current account transactions
subject to documentary proof available
on settlement
On capital account CNY conversions
may be settled by way of voluntary
settlement in banks if these are required
in the Companiesrsquo institutionsrsquo actual
business operation Typically all capital
account transactions need to be
registered with SAFE for local forwards
Not easily accessible to onshore
residents approvals required for transfer
of funds from Onshore to Offshore
Access to
Offshore
participants
Qualified
Foreign
Institutional
Investor
All allowed subject to
principle of actual
needs (Quota
restrictions exists
on underlying
investments)
Can trade via their
custodian or domestic
financial institution
Central
Banks
No quota restrictions
ability to trade as
interbank counterparty
in the domestic market
ndash bilateral or
anonymous trading
China
Interbank
Bond market
(CIBM)Bond
Connect
For OIIs (Overseas
Institutional Investors)
accessing making
CIBM investment can
enter
into all FX products on
actual needs basis with
settlement agent banks
Change in CIBM
investment position
requires adjustment to
the FX hedges within
5 working days
All customers can open a RMB account
in Hong Kong Banks can provide
customers with general purpose RMB
accounts which allow free transfers of
funds (offshore) for any purpose In
general all FX products are allowed in
CNH for offshore investors
Trading
Hours 10 AM ndash 4 PM Local China Hours 10 AM ndash 4 PM Local China Hours
89
II USD-KRW Market - Korea
Features Onshore Deliverable Offshore Non-Deliverable
Market Turnover Average daily turnover
USD
Billion
Spot Forward Swaps
2011 191 75 192
2012 180 66 198
2013 183 71 196
2014 175 76 190
2015 200 83 192
2016 194 96 184
2017 196 101 198 Source Bank of Korea
As per London clearing house
(LCH) Ltd the daily turnover of
NDF cleared by them on April
16 2019 is a total of USD 119
billion (Source LCH)
As per SEF turnover as on April
12 2019 is USD 379 million
(Source SEF)
Daily NDF turnover has
increased from USD 195 billion
in 2013 to USD 30 billion in
2016 (Source BIS 2016 survey)
Access to
domestic
participants
Residents can hold unlimited
amounts of foreign currency in
foreign currency bank accounts and
Korean firms can maintain foreign
currency accounts abroad
Financial institutional investors
have access to the local forwards
market and can hedge their
investment exposure without
confirming the lsquoexistencersquo of the
investment
Forward position limits of foreign
bank branches (FBBs) and local
banks registered as FX Banks in
Korea as below
- For FBBs positions are
capped at 200 per cent of the
previous month-end equity
capital
- For local banks forward
positions are capped at 40 per
cent of the previous month-
end equity capital
- Corporate customer foreign
currency hedging limits are
100 per cent of customersrsquo
exposure or their transaction
of underlying real assets
Residents may hold foreign
currency accounts domestically
or abroad
Corporate investors and
individual investors are required
to confirm the existence of the
investment
In the case of capital or current
account transactions domestic
residents can remit up to USD 50
000 per year freely
Access to
Offshore
participants
Non-residents can hold KRW
locally through bank accounts
Foreign investors must open special
investment purpose accounts
No restrictions and BoK does not
regulate the same
90
Source Bank of Korea BIS HSBC Research
which consist of an exclusive
external account for investment and
an exclusive non-resident domestic
currency account for investment
Foreign investors are allowed to
freely convert foreign currency into
KRW without any underlying
securities purchases while the
converted funds are being
transferred within exclusive
external investment accounts
However the converted funds in
the exclusive external account for
investment should still be used for
the purpose of securities
investment
Non-Resident Investors holding
Investment Registration Certificates
(IRC) sale proceeds from the
investment in securities can be
freely repatriated
Central Bank
intervention
BOK is now releasing a quarterly
intervention report on a net basis
They generally only comment that
they intervene only in exceptional
basis for smoothing operations
Bank of Korea does not access the
NDF market
Trading Hours 9 AM ndash 330 PM local Korea time Available through time zones
Taxation and
Repatriation of
FX Gains
All gains on unwind of deliverable
transactions are freely repatriable
without any tax
All gains on unwind of non-
deliverable transactions with
onshore banks are freely repatriable
without any tax
91
III USD-MYR Market ndash Malaysia
Onshore Deliverable Offshore Non-Deliverable
Market Turnover - Daily inter-bank market USDMYR
spot turnover around $500 million
- Daily inter-bank market USDMYR
swap turnover around $30 billion
- As per LCH Ltd UK Clearing
house the daily turnover of
USDMYR NDF cleared by them
on April 16 2019 is a total of
USD 332 million from 82 trades
(LCH website)
- As per SEF a trading platform
USDMYR turnover as on April
12 2019 is USD 205 million
from 18 trades (SEF website)
- As per the Hong Kong exchange
the NDF turnovers in 2016 were
around USD 50 billion and have
reduced to approximately USD
20 billion in 2018 (HKMA NDF
report 2018)
Access to Domestic
participants
- Resident counterparties such as
importers and exporters can use
currency options and forward
contracts to manage their foreign
exchange risk
- Residents are allowed to enter into
hedging arrangements on committed
current account transactions and
financial account transactions
- All forward contracts must be
supported by an underlying trade or
capital account-related transaction
allowed under the Foreign Exchange
Administration Rules
- Residents are allowed to freely
hedge and un-hedge their foreign
currency exposure for USD-MYR
CNH-MYR GBP-MYR EURMYR
and JPY-MYR currency pairs
without documentary evidence up to
an aggregate net open position of
MYR 6 million per bank
Not allowed
Access to Offshore
participants
- Licensed onshore banks and
approved investment banks are
allowed to enter into FX forward
Open and not regulated by the
central bank
92
Source Bank Negara Malaysia BIS HSBC Research
contracts with non-residents as
follows
Forward FX purchase or sale
contracts against MYR for
current account transactions
Forward FX purchase or sale
contracts against MYR based on
committed purchases or sales of
MYR assets The forward
contracts can be entered into at
the point when the non-resident
commits to purchase or sell the
MYR assets
- Dynamic hedging programme offers
flexibility to actively manage FX risk
exposure via forward hedging
activities with onshore banks or
Appointed Overseas Office (AOO)
without any documentation
CCP used Malaysian Exchange Not mandatory but LCH used
regularly
Central Bank
intervention
Through appointed agent banks Not applicable
Fixing to settle
NDF
NA KL USDMYR Reference rate
Trading Hours - Trading hour is 9 AM to 6 PM Local
Time Limited FX liquidity
available for non-residents post local
trading hours
- USDMYR is also quoted by
appointed overseas offices for spot
value only for any underlying asset
trades - post local trading hours No
forward prices are quoted
Quoted across time zones
Taxation and
Repatriation of FX
Gains
All gains on cancelled FX Contracts
are freely repatriable and do not
attract taxation in Malaysia
Taxed based on jurisdiction
93
IV USD-IDR Market - Indonesia
Onshore Deliverable Offshore Non-Deliverable Onshore Non-Deliverable
Market
Turnover
Average
daily spot
turnovers
USD 1bn
Average
daily swap
turnovers
USD 500
million
As per LCH Ltd - the
daily turnover of
USDIDR NDF cleared
by them on April 16
2019 is a total of USD
41 billion from 832
trades
As per SEF USDIDR
turnover as on April 12
2019 is USD 33 million
from 11 trades (Source
SEF)
As per HKTR Jan 2018
reporting the outstanding
IDR NDF turnover on
the Hong Kong exchange
of is around USD 40
billion (Source HKMA
NDF report 2018)
NDF
average size
USD 5m
Access to
Domestic
participants
Foreign currency against IDR
transactions between banks and
domestic parties over a certain
amount must have an underlying
transaction
Not Allowed Allowed but will need to
demonstrate underlying
documents
Access to
Offshore
participants
Non-residents must have
underlying IDR
assetliabilityreceivablepayable
to be able to enter into IDR cash
FX andor FX hedge BI list all the
permissible underlying activities
along with recommended
documentation format
Open and not regulated by
Bank Indonesia
Allowed but will need to
demonstrate underlying
documents
BI published a more-
stringent list of
permissible underlying
activities
Benefits Pricing uses onshore-curve
driven by onshore participants
and BI intervention
Not regulated and no
need for underlying
documentation
Prices available across
time zones
Can generated IDR
exposures without
having an underlying
asset in IDR
Pricing uses onshore-
curve driven by onshore
participants and BI
intervention (explanation
below) BI appears to
have a much bigger-
capacity to manage since
the product is net-settled
in IDR
94
Source Bank Indonesia BIS HSBC Research
Clients with IDR FX
exposure but no urgent
need for principal-
exchange As example
long-term IDR bond
investors
Limitations Requirement for underlying
docs limit the maximum
exposure that foreign Clients
can take
BI restricts Domestic Banks
from having residual-risk
when dealing Derivatives with
Related-Parties (locally
incorporated banks only)
Convertibility risk Requirement for
underlying docs limit the
maximum exposure
Foreign Clients can take
Clients with actual need
for principal-exchange
due to basis-risk between
[JISDOR fixing] vs
[actual FX rate] eg
Coupon repatriation and
BI restricts domestic
banks from having
residual-risk when
dealing derivatives with
related parties (locally
incorporated banks only)
Central
Bank
intervention
BI intervenes only in the onshore
market via Cash FX Onshore DF
and Onshore DNDF These can
be done via auctions or bilateral
OTC trades as there is no
onshore futures market for IDR
Bank Indonesia does not
access the NDF market
BI has the ability to intervene
in the DNDF market
although the market is very
new
Fixing to
settle NDF
Not Applicable JISDOR (USD-IDR)
JISDOR (USD-IDR)
Trading
Hours
Trading hours is from 8 AM ndash
12 PM Local Time and 1 PM
ndash 4 PM (Market breaks for
lunch between 12 PM ndash 1
PM)
USD-IDR is also quoted by
banks offshore for Spot value
only for any underlying asset
trades post local trading hours
No Forward prices are quoted
Quoted across time zones 8 AM ndash 12 PM Local
Time 1 PM ndash 4 PM
(Market breaks for lunch
between 12 PM ndash 1 PM)
Taxation
and
Repatriation
of FX Gains
As per market practice gains on
any unwindcancellation of FX
hedges are not passed to Non-
Residents
Taxed as per jurisdiction As per market practice gains
on any unwindcancellation
of FX hedges are not passed
to Non-Residents
95
V USD-BRL Market - Brazil
Features Onshore Deliverable Offshore Non-Deliverable
Market Features Average daily spot USD 8 billion
Onshore B3 USD 14 billion
Average daily options
turnovers
USD 15 billion
Offshore NDF
turnover daily
USD 4
billion
Market Hours Market hours is 0900 to 1800 Hours
However liquidity is highest between 10
am ndash 12 pm and 2 pm ndash 4 pm local
hours
96
VI USD-TWD Market - Taiwan
Features Onshore Deliverable Offshore Non-Deliverable
Market
Features Average Daily
Spot
Turnovers
USD 3-4 billion
Average Daily
Swap
turnovers
USD 2-3 billion
Average
Options
Turnovers
USD 150 million
Average daily
turnovers
USD 2-4 billion
Market
Turnovers
- Onshore total Spot turnovers in
USDTWD for March 2019 were USD
31560 billion (Average daily turnover of
~ USD 10 billion)
- Data related to USDTWD swaps is not
readily available but total swaps amp
forwards dealt onshore (across currency
pairs) is ~ 5750 of the FX turnovers
USD 11504 billion in April 2016 (last
available data) [Source BIS]
Access to
Domestic
participants
There are no limits on the TWDrsquos trading
range versus other currencies but there are
convertibility limits on the capital account
- Access to domestic participants are
not allowed
- Local banksrsquo overseas branches to
participate in the TWD NDF
market These banks will also be
subject to the existing cap on net
NDF positions at 20 per cent of
each bankrsquos FX position (last
revised lower from 33 per cent in
December 2010)
Access to
Offshore
participants
Non-Resident
Foreign investors are allowed to enter
into onshore swapforward contracts for
hedging underlying investment in
Taiwan
FINIs (Foreign Institutional Investors)
can only conduct buy USDsell TWD
contract and the total contract amount
entered into by a foreign investor should
not exceed FINIs USD and TWD net
remitted-in capital (ie total remitted-in
funds minus total remitted-out funds)
Access to foreign exchange is divided
into three categories
- import and export
Open and not regulated by the central
bank
97
- cost of trade-related services
- Investments capital repatriation and
dividends
Currency options are permitted
For FINIsFIDIs all transactions must be
documented regardless of the amount
On the maturity of FX forward (or
forward leg of a swap deal) FINI may
have the following decisions
- To settle the contract on the maturity
day as originally dealt In this case
FINI needs to ensure sufficiency of
existing account balance That is
settlement of FX forward should
come from the existing funds in
Taiwan or funds from sale proceeds
of underlying investments
- To extend (ie rollover) the contract
to another period in this case on the
maturity day FINI has to settle the
difference between the original
forward contract rate and the mark-
to-market rate
If FINI rollovers the contract upon
maturity and incurs a gain upon rollover
the gain will be credited to the FINIs
account in Taiwan Such gain will be
treated as other income derived in
Taiwan
CCP used Taipei Exchange (TPEx) acts as the Central
Counter Party for and also covers all foreign
exchange transactions made by authorized
foreign exchange banks and offshore banking
units
Not mandatory but LCH used regularly
Central Bank
intervention
Central bankrsquos FX intervention is via agent
banks in the OTC market where onshore
TWD is traded One of the mechanisms
through which local currency pressure is
absorbed is through modulation of hedge
ratio of Lifers
Not applicable
Fixing to
settle NDF
NA Central bankrsquos FX intervention is via
agent banks in the OTC market where
onshore TWD is traded
Bloomberg TRY11ltIndexgt
Trading
Hours
- 9 AM ndash 4 PM Local Time
- Market breaks for lunch at 12 PM ndash 2 PM
Quoted across time zones
98
Source CBC BIS HSBC Research
Taxation and
Repatriation
of FX Gains
If FINI rollovers the contract upon
maturity and incurs a gain upon rollover
the gain will be credited to the FINIs
account in Taiwan Such gain will be
treated as other income derived in
Taiwan and therefore subject to 20
standard withholding tax In case that FX
loss incurs due to rollover FINI may
arrange funding to cover the loss if
necessary
FINI can choose one of the following
methods to calculate and pay for the
relevant tax Please however note that
the method is not changeable once it is
decided If FINI does not confirm which
method to be used the option 1) will be
applied
- Withhold related tax on FX gain
from each rollover or
- Netting FX gainslosses from
rollover within the same year or
- Netting FX gainslosses from
rollover and the total remitted-in
principals revaluation gainloss in
the year
If the foreign investor adopts option 2) or
3) above they must appoint or contact
their existing local tax agent (if any) in
Taiwan to file annual tax return
Taxed based on jurisdiction
99
Annexure II
Appendix to Chapter 3
A bivariate BEKK-GARCH (11) model as proposed by Engle and Kroner (1995) can be specified with
the system of conditional mean equations consists of VAR(p) models (p = 1 n) as given in eq (1) and
variance equation as in eq(2)
119884119905 = 120583 + sum Γ119894119884119905minus119894 + 120576119905119901119894=1 (1)
where 119884119905 = (1199101119905 1199102119905) 1199101119905 is exchange rate return in onshore market and 1199102119905 is exchange rate return in
offshore market at time t The parameter vector 120583 = (1205831 1205832) represents constants and Γ is a 2times2 matrix of
autoregressive terms The diagonal elements 120574119894119894 measure own lagged effect of the variables while the off-
diagonal elements 120574119894119895 capture the mean spillover from variable i to variable j
Taking into account the asymmetric responses of volatility ie volatility tends to increase more in response
to negative shocks (bad news) than positive shocks (good news) in the variances and covariances as
proposed by Kroner and Ng (1998) a BEKK representation of conditional variance equation can be written
as
119867119905 = 119862prime119862 + 119860prime120576119905minus1prime 120576119905minus1119860 + 119861prime119867119905minus1119861 + 119863prime120585119905minus1
prime 120585119905minus1119863 (2)
where 120585119905 would be 120576119905 if it is negative and zero otherwise The Eq (2) can be written in matrix form as
follows
119867119905 = [11988811 011988821 11988822
] + [11988611 11988612
11988621 11988622]
prime
[1205761119905minus1
2 1205761119905minus11205762119905minus1
1205762119905minus11205761119905minus1 1205762119905minus12 ] [
11988611 11988612
11988621 11988622]
+ [11988711 11988712
11988721 11988722]
prime
[ℎ11119905minus1 ℎ12119905minus1
ℎ21119905minus1 ℎ22119905minus1] [
11988711 11988712
11988721 11988722]
+ [11988911 11988912
11988921 11988922]
prime
[1205851119905minus1
2 1205851119905minus11205852119905minus1
1205852119905minus11205851119905minus1 1205852119905minus12 ] [
11988911 11988912
11988921 11988922]
In the above model the dynamic process of 119867119905 is a linear function of its own lagged values lagged squared
innovations and the cross-product of the innovations and asymmetric terms Volatility transmission
channel between onshore and offshore markets is represented by the off-diagonal parameters in matrices A
and B while the diagonal parameters in those matrices capture the effects of their own past shocks and
volatility The diagonal parameters in matrix D measure the response own past negative shocks while the
100
off-diagonal parameters 119889119894119895 show the response of one market to the negative shocks in the another market
to be called the cross-market asymmetric responses
MGARCH-BEKK Parameter Estimates
Spot and 1-Month NDF 1-Month Forward and NDF 1-Month Futures and NDF
Variable Coeff P-value Variable Coeff P-value Variable Coeff P-value
Mean Equation
DSPOT(-1) -063 000 DFW1M(-1) -064 000 DFUT1M(-1) -063 000
DSPOT(-2) -052 000 DFW1M(-2) -054 000 DFUT1M(-2) -053 000
DSPOT(-3) -031 000 DFW1M(-3) -033 000 DFUT1M(-3) -033 000
DSPOT(-4) -015 000 DFW1M(-4) -018 000 DFUT1M(-4) -019 000
DSPOT(-5) -010 000 DFW1M(-5) -012 000 DFUT1M(-5) -010 000
DNDF1M(-1) 062 000 DNDF1M(-1) 063 000 DNDF1M(-1) 062 000
DNDF1M(-2) 047 000 DNDF1M(-2) 049 000 DNDF1M(-2) 048 000
DNDF1M(-3) 030 000 DNDF1M(-3) 033 000 DNDF1M(-3) 035 000
DNDF1M(-4) 022 000 DNDF1M(-4) 023 000 DNDF1M(-4) 027 000
DNDF1M(-5) 013 000 DNDF1M(-5) 015 000 DNDF1M(-5) 016 000
Constant 001 029 Constant 001 003 Constant 001 013
DSPOT(-1) 013 000 DFW1M(-1) 013 000 DFUT1M(-1) 011 001
DSPOT(-2) 003 053 DFW1M(-2) 002 046 DFUT1M(-2) 000 098
DSPOT(-3) 005 042 DFW1M(-3) 003 033 DFUT1M(-3) 002 064
DSPOT(-4) 005 033 DFW1M(-4) 005 015 DFUT1M(-4) 004 041
DSPOT(-5) 002 067 DFW1M(-5) 001 068 DFUT1M(-5) 002 058
DNDF1M(-1) -009 000 DNDF1M(-1) -009 000 DNDF1M(-1) -009 001
DNDF1M(-2) -007 015 DNDF1M(-2) -007 003 DNDF1M(-2) -005 022
DNDF1M(-3) -005 033 DNDF1M(-3) -004 012 DNDF1M(-3) -002 065
DNDF1M(-4) 001 086 DNDF1M(-4) 001 076 DNDF1M(-4) 003 052
DNDF1M(-5) 001 079 DNDF1M(-5) 002 052 DNDF1M(-5) 001 067
Constant 001 038 Constant 001 011 Constant 001 017
Variance Equation
C(11) 005 000 C(11) 005 000 C(11) 003 000
C(21) 005 000 C(21) 005 000 C(21) 003 000
C(22) -001 004 C(22) 001 000 C(22) 005 000
A(11) 027 000 A(11) 027 000 A(11) 014 000
A(12) 004 042 A(12) 005 032 A(12) -012 004
A(21) -004 029 A(21) -004 034 A(21) 007 010
A(22) 019 000 A(22) 018 000 A(22) 029 000
B(11) 096 000 B(11) 096 000 B(11) 098 000
B(12) -001 020 B(12) -002 003 B(12) 003 004
B(21) 001 037 B(21) 001 029 B(21) -001 048
B(22) 098 000 B(22) 098 000 B(22) 094 000
D(11) -023 001 D(11) 027 000 D(11) 020 001
101
D(12) -037 000 D(12) 035 000 D(12) 024 000
D(21) 022 000 D(21) -025 000 D(21) -016 000
D(22) 028 000 D(22) -028 000 D(22) -012 006
102
Annexure III
Evolution of Onshore Exchange Traded Currency Derivatives Market
Exchange Traded Currency Derivatives (ETCD) were launched in August 2008 in India with the
introduction of futures contracts on US Dollar-Rupee currency pair as the underlying
Subsequently in the year 2010 Rupee future contracts were allowed to trade against three other
currencies viz Euro Pound sterling and Japanese yen The options contracts were introduced on
US Dollar-Rupee currency pair in year 2010 The Reserve Bank of India (RBI) and Securities
Exchange Board of India (SEBI) allowed participation for all resident individuals including
corporates Trading Members and Banks in proprietary capacity on ETCD
In the year 2012 it was decided to lower the open position limits for banks on the back of volatility
in rupee and to exclude the positions in ETCD from Net Overnight Open Position Limit (NOOPL)
Thereafter in the year 2013 the Rupee depreciated sharply against USD due to huge capital
outflows in both equity and debt markets expectation of unwinding of Quantitative Easing by US
FED and increase in current account deficit Additionally the open position limits for the
participants were decreased and banks were restricted from participating on their own accounts in
the ETCD market further the participants were also prohibited from taking positions beyond
USD 10 million
In June 2014 Banks were allowed to engage in proprietary trading in ETCD markets Domestic
participants were allowed to have open position beyond USD 15 million subject to the evidence
of underlying exposure In 2018 this limit was raised to USD 100 million across all currency pairs
involving INR put together and combined across all exchanges
Foreign Portfolio Investors (FPI) and Non-Resident Indians (NRIs) were permitted to participate
in ETCD markets for hedging currency risk arising out of their investments in India in 2014 and
2017 respectively In February 2018 SEBI and RBI permitted currency derivatives on cross
currency pairs - EURUSD GBPUSD and USDJPY- and currency options on EURINR GBPINR
and JPYINR In December 2018 weekly options on US Dollar - Indian Rupee currency pair were
permitted As on date derivatives are available on seven currency pairs - USDINR EURINR
GBPINR JPYINR EURUSD GBPUSD and USDJPY
103
The exchange traded currency derivatives draws participation from diverse categories of
participants Some of the key participant categories include banks corporates trading members
foreign investors and other investors The following are the turnover of exchanges
FY National Stock Exchange of India (All figures in USD billions)
USD-INR futures USD-INR Options
(Notional turnover)
USD-INR Options
(Premium )
2014-15 32630 12618 052
2015-16 37374 26600 092
2016-17 31887 35271 107
2017-18 33818 37714 117
2018-19 57913 54183 204
FY
BSE (All figures in USD billions)
USD-INR futures USD-INR Options
(Notional turnover)
USD-INR Options
(Premium)
2014-15 20740 9609 081
2015-16 27713 13772 044
2016-17 27521 21034 045
2017-18 30146 37552 041
2018-19 45956 59350 051
FY Metropolitan Stock Exchange of India (All figures in USD billions)
USD-INR futures USD-INR Options
( Notional turnover )
USD-INR Options
( Premium )
2014-15 18274 593 593
2015-16 8433 646 646
2016-17 8233 367 367
2017-18 3032 491 491
2018-19 1060 245 245
104
Present Regulatory Framework (client limits open interest limits need for underlying
exposure etc)
a) Position limits for different client categories for FCY-INR currency pairs
bull Position limits of clients and Category III FPIs- The gross open positions of the client
across all contracts in the respective currency pairs shall not exceed the limits as mentioned
below
Currency Pairs
Position limits
USD-INR Gross open position across all contracts shall not exceed
6 of the total open interest or USD 10 million whichever
is higher
EUR-INR Gross open position across all contracts shall not exceed
6 of the total open interest or EUR 5 million whichever
is higher
GBP-INR Gross open position across all contracts shall not exceed
6 of the total open interest or GBP 5 million whichever
is higher
JPY-INR Gross open position across all contracts shall not exceed
6 of the total open interest or JPY 200 million whichever
is higher
bull Proprietary position limits of non-bank stock brokers- The gross open positions of the
proprietary account across all contracts in the respective currency pairs shall not exceed
the limits as mentioned below
Currency Pairs
Position limits
USD-INR Gross open position across all contracts shall not exceed 15
of the total open interest or USD 50 million whichever is
higher
EUR-INR Gross open position across all contracts shall not exceed 15
of the total open interest or EUR 25 million whichever is
higher
GBP-INR Gross open position across all contracts shall not exceed 15
of the total open interest or GBP 25 million whichever is
higher
JPY-INR Gross open position across all contracts shall not exceed 15
of the total open interest or JPY 1000 million whichever is
higher
105
bull Position limits of stock brokers (bank and non-bank) Category I and II FPIs- The
gross open positions of trading members across all contracts in the respective currency
pairs shall not exceed the limits as mentioned below
Currency Pairs
Position limits
USD-INR Gross open position across all contracts shall not exceed
15 of the total open interest or USD 100 million
whichever is higher
EUR-INR Gross open position across all contracts shall not exceed
15 of the total open interest or EUR 50 million whichever
is higher
GBP-INR Gross open position across all contracts shall not exceed
15 of the total open interest or GBP 50 million whichever
is higher
JPY-INR Gross open position across all contracts shall not exceed
15 of the total open interest or JPY 2000 million
whichever is higher
Domestic clients shall ensure that the position across exchanges is within the prescribed
limit of USD 100 million equivalent If position is in excess of USD 100 million
equivalent clients are required to provide disclosure of underlying exposure to Trading
Member as per existing practice
bull Proprietary positions created in FCY-INR pairs (USD-INR EUR-INR GBP-INR
and JPY-INR)
Single INR limit for proprietary
position for bank stock broker
Single INR limit for proprietary
position for non-bank stock broker
Higher of 15 of total OI across all
FCY- INR pairs or USD 200 million
Higher of 15 of total OI across all
FCY-INR pairs or USD 100 million
b) Position limit for Cross Currency Derivatives are given below
bull Position limits for stock brokers (banks and non-bank) Category I amp II FPIs
Domestic Institutional investors (DIIs) as permitted by the respective sectoral
regulators and AD Category-I banks-
106
Currency Pairs
Position limits
EUR-USD Gross open position across all contracts shall not
exceed 15 of the total open interest or EUR 100
million whichever is higher
GBP-USD Gross open position across all contracts shall not
exceed 15 of the total open interest or GBP 100
million whichever is higher
USD-JPY Gross open position across all contracts shall not
exceed 15 of the total open interest or USD 100
million whichever is higher
The aforementioned limits shall be the total limits available to the stock brokers for
taking positions on proprietary basis and for positions of their clients
bull Position limit for proprietary position of non-bank stock brokers-
Currency Pairs
Position limits
EUR-USD Gross open position across all contracts shall not
exceed 15 of the total open interest or EUR 50
million whichever is higher
GBP-USD Gross open position across all contracts shall not
exceed 15 of the total open interest or GBP 50
million whichever is higher
USD-JPY Gross open position across all contracts shall not
exceed 15 of the total open interest or USD 50
million whichever is higher
bull Position limits for Clients and Category III FPIs-
Currency Pairs
Position limits
EUR-USD Gross open position across all contracts shall not
exceed 6 of the total open interest or EUR 10
million whichever is higher
GBP-USD Gross open position across all contracts shall not
exceed 6 of the total open interest or GBP 10
million whichever is higher
USD-JPY Gross open position across all contracts shall not
exceed 6 of the total open interest or USD 10
million whichever is higher
107
Annexure IV
Comparison of onshore and offshore Rupee derivatives volumes
1 Exchange Traded Market
All figures in USD billions
Table Comparison between onshore and offshore exchange traded INR-USD Futures
FY Onshore Offshore Market Share
BSE NSE MSEI Total DGCX SGX CME Total Onshore Offshore
2014-15 21115 32491 9433 63040 31704 3704 396 35804 6378 3622
2015-16 27904 37241 4539 69685 32725 13906 1001 47631 5940 4060
2016-17 26528 31799 4300 62626 34149 17164 1636 52949 5419 4581
2017-18 30360 33729 1761 65851 33458 28047 5232 66737 4967 5033
2018-19 44820 57237 648 102705 35452 37599 7475 80526 5605 4395
Note-
i Data for BSE NSE amp MSEI is from Exchange websites for USDINR Futures
ii Data for DGCX SGX and CME is from Bloomberg and India INX Research
iii Data for DGCX includes INRUSD Futures (including mini contract) but excludes the USDINR Index
Quanto futures
iv Data for CME includes the Mini and Micro contracts
v Data for FY 2018-19 is from April 01 2018 to March 22 2019
2 OTC Market (as per BIS Quarterly Review December 2016)
108
Annexure V
Meetings held by the Task Force
Sr No Date Venue External Participants Invited
1 March 19 2019 RBI Mumbai
2 March 25 2019 RBI Mumbai -Shri Ananth Narayan Professor SPJMIR
-FEDAI
-Select corporates
3 April 04 2019 RBI Mumbai -Shri G Padmanabhan Former Executive
Director RBI
-Dr V Anantha Nageswaran Dean IFMR
Chennai
-GIFT City IFSC
-National Stock Exchange Ltd
-BSE Ltd
4 April 23 2019 RBI Mumbai -Select FPIs (through audio conference)
5 May 14 2019 RBI Mumbai -Select FDIs (through audio conference)
6 May 31 2019 RBI Mumbai -Shri G Padmanabhan Former Executive
Director RBI
-FIMMDA
-CCIL
-IBA
7 June 20 2019 RBI Mumbai -Smt Shyamala Gopinath Former Deputy
Governor RBI
8 July 04 2019 SEBI Mumbai -Shri G Padmanabhan Former Executive
Director RBI
9 July 10 2019 RBI Mumbai -Smt Shyamala Gopinath Former Deputy
Governor RBI
109
Annexure VI
References
A Santaella Julio (2015) ldquoCurrency carry trades in Latin Americardquo Bank for International
Settlements BIS Paper No 81
Behera Harendra Kumar (2011) ldquoOnshore and offshore market for Indian rupee recent evidence
on volatility and shock spilloverrdquo Macroeconomics and Finance in Emerging Market Economies
Vol 4 No 1 March 2011 pp 43ndash55
Cadarajat Yayat and Lubis Alexander (2012) ldquoOffshore And Onshore IDR Market An Evidence
On Information Spilloverrdquo Bulletin of Monetary Economics and Banking April 2012
Capital Account Safeguard Measures in the ASEAN Context (2019) ASEAN Working Committee
on Capital Account Liberalisation Bank Indonesia Occasional Papers OP12019
Colavecchio Roberta and Funke Michael (2006) ldquoVolatility transmissions between renminbi and
Asia-Pacific onshore and offshore US dollar futuresrdquo BOFIT Discussion Papers Bank of
Finland Institute for Economies in Transition No16
Darbha Gangadhar (2012) ldquoA Tale of One Asset and Two Markets ndash Analysis of Dynamic
Interactions between On- and - Off Shore Marketsrdquo macrofinancenipfporginPDF13-
11sl_Darbha_NDFNimranapdf
DING David K Tse Y and Williams M The Price Discovery Puzzle in Offshore Yuan
Trading Different Contributions for Different Contracts (2012) Financial Management
Association International Conference Research Collection Lee Kong Chian School Of Business
Doukas J and H Zhang (2013) ldquoThe performance of NDF carry tradesrdquo Journal of International
Money and Finance vol 36 September pp 172ndash90
Goyal R R Jain and S Tewari (2013) Non deliverable forward and onshore Indian rupee market
a study on inter-linkages Reserve Bank of India Working Paper Series 112013 December
Guru Anuradha (2009) ldquoNon-Deliverable Forwards Market for Indian Rupee An Empirical
Studyrdquo Indian Journal of Economics and Business Vol 8 No 2 pp 245-260
Higgins Patrick and Owen F Humpage (2005) ldquoNondeliverable Forwards Can We Tell where
the Renminbi Is Headedrdquo Federal Reserve Bank of Cleveland September
Hutchison Michael Jake Kendall Gurnain Pasricha Nirvikar Singh (2009) ldquoIndian Capital
Control Liberalisation Evidence from NDF Marketsrdquo NIPFP Working Paper No 200960
110
Indira Gandhi Institute of Development Research (IGIDR) Finance Research Group (2016)
ldquoFeatures and trends of NDF markets for emerging economy currencies a study of the Indian
rupeerdquo IGIDR working paper March
Ishii Shogo İnci Oumltker-Robe and Li Cui 2001 Measures to Limit the Offshore Use of
Currencies Pros and Cons IMF Working Paper WP0143
Lipscomb Laura (2005) ldquoAn Overview of Non-Deliverable Foreign Exchange Forward Marketsrdquo
Federal Reserve Bank of New York May
Ma G C Ho and R McCauley (2004) The markets for non-deliverable forwards in
Asia BIS Quarterly Review June pp 81-94
Maziad Samar and Kang Joong Shik RMB Internationalization OnshoreOffshore Links (May
2012) IMF Working Paper No 12133
McCauley R C Shu and G Ma (2014) ldquoNon-deliverable forwards 2013 and beyondrdquo BIS
Quarterly Review March pp 75ndash88
McCauley RN Shu C (2016) ldquoNon-deliverable forwards impact of currency internationalisation
and derivatives reformrdquo Technical report Bank of International Settlements
McCauley Robert N and Scatigna Michela Foreign Exchange Trading in Emerging Currencies
More Financial More Offshore (March 2011) BIS Quarterly Review March 2011
Misra Sangita and Behera Harendra (2006) ldquoNon Deliverable Foreign Exchange Forward
Market An Overviewrdquo RBI Occasional Papers Vol 27 No3
Park Jinwoo (2001) ldquoInformation flows between non-deliverable forwards (NDF)and spot
markets Evidence from Korean currencyrdquo Pacific Basin Finance Journal Vol 9 (4) pp363-377
Ryoo Sangdai and Kwon Taeyong and Lee Hyejin Foreign Exchange Market Developments
and Intervention in Korea (October 2013) BIS Paper No 73o
Sarwono Hartadi A (2005) ldquoIndonesian policy on non-residentsrsquo participation in the money
market the restriction of rupiah transactions by non-residents and foreign currency credit offered
by banks to non-residentsrdquo BIS Paper No 23
Standing Council on International Competitiveness of the Indian Financial System (2015)
International competitiveness of currency equity and commodity derivatives markets Department
of Economic Affairs Ministry of Finance
Wang Kai-Li Fawson Christopher and Chen Mei-Ling (2007) ldquoInformation Flows among
Exchange Rate Markets What Do We Learn From Non-Deliverable Forward Markets in Asiardquo
Chaoyang University of Technology October
111
Watanabe K H Akama and J Mifune (2002) ldquoThe effectiveness of capital controls and
monitoring the case of non-internationalisation of emerging market currenciesrdquo EMEAP
Discussion Paper January