Embed Size (px)
Citation preview
Report on Existing and Potential
Electric System Constraints and Needs
December 2013

2013 Electric System Constraints and Needs December 30, 2013
ERCOT Report on Existing and Potential Electric System Constraints and
Needs
Executive Summary
The annual Electric System Constraints and Needs report is provided by the Electric Reliability
Council of Texas, Inc. (ERCOT) to identify and analyze existing and potential constraints in the
transmission system that pose reliability concerns or may increase costs to the electric power
market and ultimately, to Texas consumers. This report satisfies the annual reporting
requirements of Public Utility Regulatory Act (PURA) Section 39.155(b) and a portion of the
requirements of Public Utility Commission Substantive Rules 25.361(i)(2)(I) and 25.505(c).
ERCOT and Transmission Service Providers (TSPs) have been diligently pursuing projects to
address demand increases related to oil and natural gas exploration and production in Texas.
In 2013, the most significant constraints experienced on the ERCOT System were located in
areas that have experienced oil and natural gas correlated load growth. In West Texas the
continued expansion of oil and natural gas recovery in the Permian Basin shale play has
increased electric demand in the area causing a substantial amount of congestion on some
transmission elements. However, the congestion has decreased measurably since 2012 due to
the implementation of planned transmission system improvements in the area.
In South Texas the development of the Eagle Ford shale play has continued to cause the need
for transmission system improvements. In 2013, three sets of transmission projects in the
Eagle Ford Shale area were reviewed and accepted by the Regional Planning Group (RPG) and
ERCOT. In total, an estimated $330.8 million worth of transmission system improvements in
the Eagle Ford Shale area have been accepted by the RPG since 2012. These projects are
expected to be in service between 2014 and 2017.
The Denton area has recently experienced congestion due to an increase in load and due to
local transmission circuits being taken out of service so they could be upgraded. Several
additional improvements are planned for the area between 2014 and 2016.
Persistent load growth in the Houston area has caused transmission lines by which power is
imported into the area from the north to be highly congested in 2013 ($38.5 million in
congestion rent through October). Long-term studies have consistently identified the need to
increase the import capacity of the transmission system in the area, and more recently several

2013 Electric System Constraints and Needs December 30, 2013
TSPs have detailed reliability criteria violations by 2018 if solutions are not implemented.
ERCOT and the RPG are currently reviewing several proposals to increase the import capability
and expect to have a recommendation in early 2014.
Elsewhere on the ERCOT System, the completion of the Competitive Renewable Energy Zone
(CREZ) project at the end of 2013 is expected to resolve the West to North stability limit. The
partially completed CREZ project has already had a considerable effect in mitigating congestion
in West Texas. Through October 2013 the West to North stability limit was not even in the top
30 highest congested constraints while it had the third highest amount of congestion rent in
ERCOT in 2012 and the highest in 2011.
The Panhandle region of the CREZ project is experiencing significantly more interest from wind
generation developers as compared to what was initially planned for the area in terms of
transmission export capability. This area is also seeing the more generation interconnection
activity as compared to other areas of development on the ERCOT System. ERCOT is currently
conducting an analysis to determine the next steps for transmission system improvements in
order to meet the needs of the system. The report for this study is expected to be released in
early 2014.
In the Lower Rio Grande Valley (LRGV), a new 345 kV import line and the upgrade of the two
existing 345 kV import lines are part of a project to increase the overall import capability into
the area by 2016. Additionally, a new 345 kV line that runs from the west side of the LRGV to
the east side is planned to meet reliability needs in and around the Brownsville area. These
projects have an estimated capital cost of almost $800 million.

2013 Electric System Constraints and Needs December 30, 2013
ERCOT Report on Existing and Potential Electric System Constraints and Needs
Table of Contents
1. Introduction ................................................................................................................ 1
2. ERCOT Transmission Planning ...................................................................................... 2
3. Recent Constraints ...................................................................................................... 4
3.1 West Texas Load Growth ....................................................................................... 7
3.2 Houston Import ...................................................................................................16
3.3 Denton Area ........................................................................................................19
3.4 West-to-North Stability Limit .................................................................................21
4. Planned Improvements ...............................................................................................26
4.1 Eagle Ford Shale Oil and Natural Gas Related Projects ............................................28
4.2 Valley Import Project ............................................................................................31
4.3 Cross Valley Project ..............................................................................................32
4.4 Additional Reliability Driven Planned Improvements ................................................33
5. Projected Constraints ..................................................................................................35
5.1 2014 Reliability Constraints ...................................................................................35
5.2 2016 and 2018 Projected Constraints.....................................................................38
6. Long-Term System Assessment ...................................................................................41
7. Contacts and Links .....................................................................................................42
7.1 Contacts and Information .....................................................................................42
7.2 Internet Links ......................................................................................................42
8. Disclaimer ..................................................................................................................43

2013 Electric System Constraints and Needs December 30, 2013
1
1. Introduction
The Electric Reliability Council of Texas (ERCOT), as the independent organization (IO) under
the Public Utility Regulatory Act (PURA), is charged with nondiscriminatory coordination of
market transactions, system-wide transmission planning and network reliability, and ensuring
the reliability and adequacy of the regional electric network in accordance with ERCOT and
North American Electric Reliability Corporation (NERC) Reliability Standards. The IO ensures
access to the transmission and distribution systems for all buyers and sellers of electricity on
nondiscriminatory terms. In addition, ERCOT, as the NERC registered Planning Coordinator/
Planning Authority, is responsible for assessing the longer-term reliability for the ERCOT Region.
ERCOT supervises and exercises comprehensive independent authority of the overall planning
of transmission projects of the ERCOT Transmission System as outlined in PURA and Public
Utility Commission of Texas (PUCT) Substantive Rules. ERCOT’s authority with respect to
transmission projects that are local in nature is limited to supervising and coordinating the
planning activities of Transmission Service Providers (TSPs). The PUCT Substantive Rules
further indicate that the IO shall evaluate and make a recommendation to the PUCT as to the
need for any transmission facility over which it has comprehensive transmission planning
authority. In performing its evaluation of different transmission projects, ERCOT takes into
consideration the need for and cost-effectiveness of proposed transmission projects in meeting
the ERCOT planning criteria and NERC Reliability Standards.
Transmission planning (60 kV and above) is a complex undertaking that requires significant
work by, and coordination between, ERCOT, the TSPs, stakeholders, and other Market
Participants. ERCOT works directly with the TSPs, stakeholders, and Market Participants
through the Regional Planning Group (RPG). Each of these entities has responsibilities to
ensure the appropriate transmission planning and construction occurs.
The Protocols and Planning Guide describe the practices and procedures through which ERCOT
meets its requirements related to system planning under PURA, NERC Reliability Standards, and
PUCT Substantive Rules.
2013 Electric System Constraints and Needs December 30, 2013
2
2. ERCOT Transmission Planning
Every year ERCOT performs a planning assessment of the transmission system. This
assessment is primarily based on three sets of studies:
1. The Regional Transmission Plan (formerly known as the Five-Year Transmission Plan)
addresses region-wide reliability and economic transmission needs and includes the
recommendation of specific planned improvements to meet those needs for the
upcoming five years. The 2013 Regional Transmission Plan report is posted on the
ERCOT Planning and Operations Information website.
2. The Long-Term System Assessment (LTSA) uses scenario analysis techniques to assess
the potential needs of the ERCOT System up to 20 years into the future. The role of the
LTSA is not to recommend the construction of specific system upgrades due to the high
degree of uncertainty associated with the amount and location of loads and resources in
this timeframe. Instead, the role of the LTSA is to identify upgrades that provide
benefits across a range of scenarios or might be more economic than the upgrades that
would be determined considering only near-term needs in the Regional Transmission
Plan development. The LTSA study is conducted in even-numbered years and reviewed
in odd-numbered years. The 2012 Long-Term System Assessment report is posted on
the ERCOT website in the following location:
http://www.ercot.com/news/presentations/. In 2010 ERCOT received grant funding
from the Department of Energy (DOE) to augment and enhance the existing long-range
planning efforts for the ERCOT region. The report detailing the results of this endeavor
was published in December 2013 and can be found on the ERCOT website at the
following location: http://www.ercot.com/committees/other/lts/index.
3. Stability studies are performed to assess the angular, voltage, and frequency response
of the ERCOT System. Due to the sensitive nature of the information contained in these
study reports, they are not normally published on the ERCOT website.
These studies are conducted using models that represent expected future transmission
topology, demand, and generation. The models are tested against reliability and economic
planning criteria per NERC Standards and the ERCOT Protocols and Planning Guide. When
system simulations indicate a deficiency in meeting the criteria, a corrective action plan will be
put in place which typically includes a planned transmission improvement project. TSPs also
perform studies to assess the reliability of their portion of the ERCOT System.
Transmission improvement projects that are estimated to cost more than $15 million or that
require a Certificate of Convenience and Necessity (CCN) are reviewed by the RPG prior to

2013 Electric System Constraints and Needs December 30, 2013
3
implementation1. The RPG is a non-voting group made up of ERCOT, TSPs, Market Participants,
other stakeholders, and PUCT Staff. The RPG reviewed and accepted $349.8 million of
transmission improvement projects in 2013.
Transmission system improvements are built by TSPs and are paid for by consumers. During
the twelve month period from October 2012 through September 2013, TSPs completed $4.08
billion in transmission projects, of which $3.04 billion is related to the Competitive Renewable
Energy Zone (CREZ) project. The total includes the addition or upgrade of 4,156 miles of
transmission circuits, the addition of 6,137 MVA of autotransformer capacity, and the addition of
1,539 MVAr of reactive capability. A comprehensive list of recently completed and future
transmission projects can be found in the Transmission Project Information Tracking (TPIT)
report which is updated three times a year and can be located on the ERCOT Planning and
Operations Information website.
1 Per ERCOT Protocol Section 3.11.4 certain projects are exempt from RPG review, such as projects to serve new
generation or load customers.
2013 Electric System Constraints and Needs December 30, 2013
4
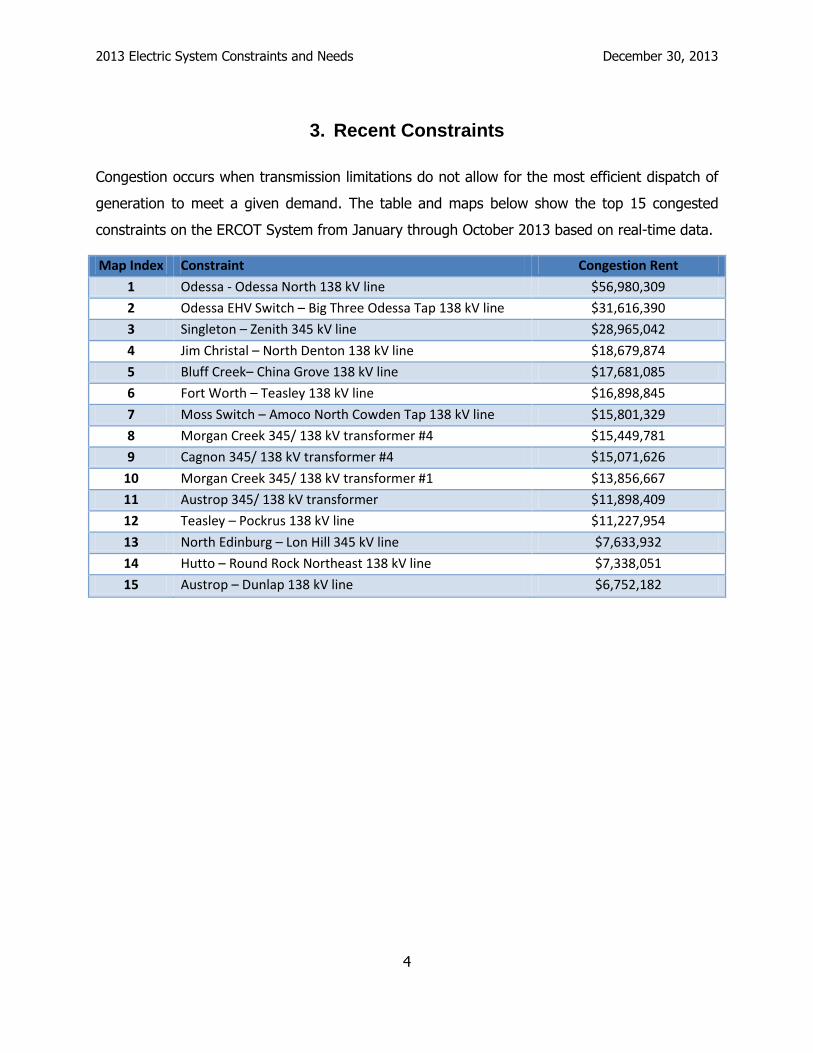
3. Recent Constraints
Congestion occurs when transmission limitations do not allow for the most efficient dispatch of
generation to meet a given demand. The table and maps below show the top 15 congested
constraints on the ERCOT System from January through October 2013 based on real-time data.
Map Index Constraint Congestion Rent
1 Odessa - Odessa North 138 kV line $56,980,309
2 Odessa EHV Switch – Big Three Odessa Tap 138 kV line $31,616,390
3 Singleton – Zenith 345 kV line $28,965,042
4 Jim Christal – North Denton 138 kV line $18,679,874
5 Bluff Creek– China Grove 138 kV line $17,681,085
6 Fort Worth – Teasley 138 kV line $16,898,845
7 Moss Switch – Amoco North Cowden Tap 138 kV line $15,801,329
8 Morgan Creek 345/ 138 kV transformer #4 $15,449,781
9 Cagnon 345/ 138 kV transformer #4 $15,071,626
10 Morgan Creek 345/ 138 kV transformer #1 $13,856,667
11 Austrop 345/ 138 kV transformer $11,898,409
12 Teasley – Pockrus 138 kV line $11,227,954
13 North Edinburg – Lon Hill 345 kV line $7,633,932
14 Hutto – Round Rock Northeast 138 kV line $7,338,051
15 Austrop – Dunlap 138 kV line $6,752,182

2013 Electric System Constraints and Needs December 30, 2013
5
Recent constraints in West Texas

2013 Electric System Constraints and Needs December 30, 2013
6
Recent constraints in North Texas
Recent constraints in Central Texas

2013 Electric System Constraints and Needs December 30, 2013
7
Recent constraints in South Texas
The following sections provide more details on recent constraints on the ERCOT System.
3.1 West Texas Load Growth
As in 2012, the most significant congestion on the ERCOT System in 2013 was experienced in
West Texas due to the growth in electric demand from the oil and natural gas industry and
2013 Electric System Constraints and Needs December 30, 2013
8
associated economic expansion in residential and commercial developments in the Permian
Basin area. However, the congestion experienced in the area in 2013 has decreased since 2012
due to the transmission improvement projects that have been put in place. Of the top 15
constraints on the ERCOT System from January 2013 through October 2013, six were related to
constraints serving West Texas load, compared to eight over the same period in 2012.
Moreover, the most constrained element on the system in 2012, the Odessa North 138/ 69 kV
transformer, had over $134 million in congestion rent before being replaced by a larger
transformer in November 2012 while the top constraint in 2013, the Odessa – Odessa North
138 kV line, experienced less than $57 million in congestion rent through the first ten months of
the year.
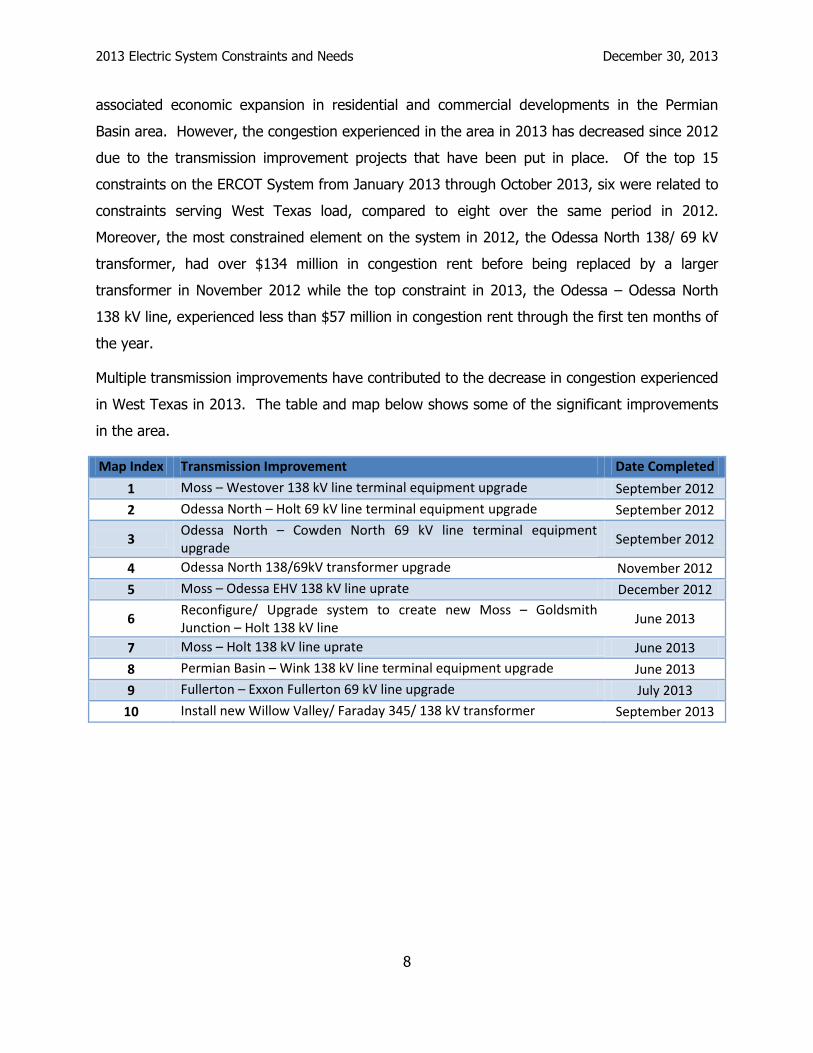
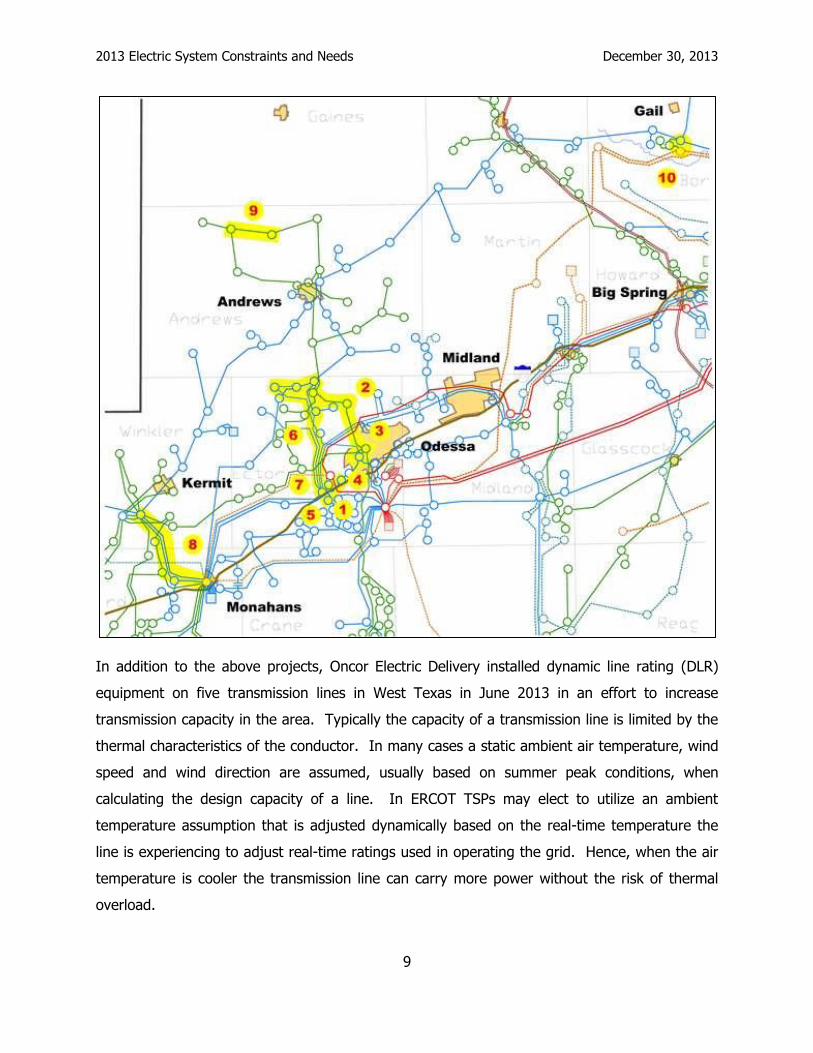
Multiple transmission improvements have contributed to the decrease in congestion experienced
in West Texas in 2013. The table and map below shows some of the significant improvements
in the area.
Map Index Transmission Improvement Date Completed
1 Moss – Westover 138 kV line terminal equipment upgrade September 2012
2 Odessa North – Holt 69 kV line terminal equipment upgrade September 2012
3 Odessa North – Cowden North 69 kV line terminal equipment upgrade
September 2012
4 Odessa North 138/69kV transformer upgrade November 2012
5 Moss – Odessa EHV 138 kV line uprate December 2012
6 Reconfigure/ Upgrade system to create new Moss – Goldsmith Junction – Holt 138 kV line
June 2013
7 Moss – Holt 138 kV line uprate June 2013
8 Permian Basin – Wink 138 kV line terminal equipment upgrade June 2013
9 Fullerton – Exxon Fullerton 69 kV line upgrade July 2013
10 Install new Willow Valley/ Faraday 345/ 138 kV transformer September 2013
2013 Electric System Constraints and Needs December 30, 2013
9
In addition to the above projects, Oncor Electric Delivery installed dynamic line rating (DLR)
equipment on five transmission lines in West Texas in June 2013 in an effort to increase
transmission capacity in the area. Typically the capacity of a transmission line is limited by the
thermal characteristics of the conductor. In many cases a static ambient air temperature, wind
speed and wind direction are assumed, usually based on summer peak conditions, when
calculating the design capacity of a line. In ERCOT TSPs may elect to utilize an ambient
temperature assumption that is adjusted dynamically based on the real-time temperature the
line is experiencing to adjust real-time ratings used in operating the grid. Hence, when the air
temperature is cooler the transmission line can carry more power without the risk of thermal
overload.

2013 Electric System Constraints and Needs December 30, 2013
10
The West Texas project that Oncor Electric Delivery pursued takes this concept a step further
by installing equipment on each line to monitor conditions in the field. The equipment not only
monitors ambient temperature, but also takes into account solar radiation and wind speed and
direction to more accurately calculate the real-time thermal capacity of a line. This has been
shown to increase the capacity of a transmission line most of the hours of the year. The
project involved installing DLR equipment on the following five transmission lines in order to
improve operating flexibility and to reduce congestion:
Odessa – Odessa North 138 kV line
Moss – Amoco Cowden North – Holt 138 kV line
Holt – Emma Tap 69 kV line
Moss – Odessa Southwest – Odessa EHV 138 kV line
Midland East – Windwood 138 kV line
The chart below shows the percent increase in line capacity due to the installation of the DLR
equipment when compared to strictly an ambient temperature adjusted rating (AAR) for the
Odessa – Odessa North 138 kV line. The data indicates that from July through September of
2013 the line capacity rating using DLR equipment was higher than the AAR about 80% of the
time (red line on chart). This illustrates the benefit that the DLR equipment can provide.

2013 Electric System Constraints and Needs December 30, 2013
11
Most of the remaining congestion in the area can be attributed to the significant increase in
demand in the Far West weather zone in ERCOT. The chart below shows the annual peak
demand increase in the Far West weather zone for years 2007 through 2013. The data shows
an average annual peak demand growth rate of 6.7% from 2010 to 2013. It should be noted
that other areas in ERCOT saw lower peak demand in 2012 and 2013 than in 2011 because
2011 had an extremely hot summer. Conversely, the Far West weather zone peak demand
continued to increase despite the relatively cooler temperatures.

2013 Electric System Constraints and Needs December 30, 2013
12
The chart below shows the total annual energy use in the Far West weather zone from 2007
through 2012. The data indicates that total energy usage grew at a faster rate than the peak
demand from 2010 to 2012.
The majority of the load increase in the area can be ascribed to the increase in the oil and
natural gas industry and the associated economic expansion in residential and commercial
developments. The chart below illustrates the increase in oil production in Texas District 8,
which encompasses much of the Permian Basin and includes the Odessa area, between 2007
and 2013. The crude oil production increase between January 2010 and summer 2013 was
nearly 40%.

2013 Electric System Constraints and Needs December 30, 2013
13
Because of the upsurge in oil and natural gas production the local economy in the area has
experienced a boom. The two largest cities in the area, Midland and Odessa, have been among
the fastest growing cities and have seen some of the lowest unemployment rates in the
country. Through July, the 2013 Midland unemployment rate has remained below 3.5% and
the Odessa rate has not exceeded 4.2%, according to the U.S. Bureau of Labor Statistics.
ERCOT and the TSPs with transmission in the area have been planning system improvements in
order to meet the growing needs in West Texas. The table and map below list some of the
significant improvements that are expected to be completed between December 2013 and the
end of 2014.

2013 Electric System Constraints and Needs December 30, 2013
14
Map Index Transmission Improvement In-service Date
1 Odessa – Odessa North 138 kV line reconductor December 2013
2 Goldsmith South – Goldsmith Junction 69 kV line rebuilt as a 138/ 69 kV double circuit line
December 2013
3 Moss – Holt 138 kV line reconductor January 2014
4 Odessa North – Goldsmith Junction 69 kV line rebuilt as a 138/ 69 kV double circuit line and Odessa North 138 kV Switch Station
May 2014
5 Odessa EHV – Big 3 Tap – Odessa Southwest – Moss 138 kV line rebuild
May 2014
6 Cactus – Fort Lancaster 69 kV line rebuild May 2014
7 Wink – Pecos 69 kV line rebuild June 2014
8 Wink – Permian Basin 138 kV line reconductor December 2014
9 Odessa – Odessa EHV 138 kV line reconductor December 2014
10 Moss – Westover 138 kV line upgrade December 2014

2013 Electric System Constraints and Needs December 30, 2013
15
The chart below shows the number of original drilling permits issued per month from January
2010 through September 2013 for Texas District 8. The chart shows that permit activity in the
Permian Basin has remained strong through summer 2013. This is one indication that demand
related to oil and natural gas production is likely to continue to increase.
The demand level utilized in the 2012 Five-Year Transmission Plan, which was completed in
December 2012, was based on a forecast dating back to the spring of 2011. In early 2013,
ERCOT asked TSPs with assets in West Texas to update the forecast based on the latest
information. The updated forecast for 2017 summer peak conditions was 9.4% higher for the
West weather zone and 62.8% higher for the Far West weather zone when compared to the
forecast used in the 2012 Five-Year Transmission Plan. The map below shows the additional
elements overloaded due to the increased load forecast and illustrates a contour map of the
increased load on a per-substation basis.

2013 Electric System Constraints and Needs December 30, 2013
16
ERCOT, in conjunction with the TSPs, performed an updated analysis to determine the needs of
the transmission system using the latest demand forecast from early 2013 and updated
transmission system expansion plans from the TSPs. Sixty-four projects were identified as
being necessary to meet the system needs in West Texas through 2017. It should be noted
that these are in addition to projects previously planned and/or under construction. As a matter
of perspective the 2012 Five-Year Transmission Plan identified 63 additional projects needed to
meet the reliability needs for the entire ERCOT System through 2017. The 2012 West Texas
Sensitivity Study Report, which details the analysis and results of this effort, can be found on
the ERCOT Planning and Operations Information website.
3.2 Houston Import
The Houston area is one of the two largest demand centers in the ERCOT System. Houston is
the fourth largest city in the United States and has been called the “Energy Capital of the

2013 Electric System Constraints and Needs December 30, 2013
17
World.” This demand is met by generation located within the area and by importing power via
high voltage lines into the area from the rest of the ERCOT System.
New generation additions in the area have not kept pace with load growth, and generation
retirements over the last decade have led to a greater need to import power from outside the
region. Siting new generation in the area is complicated by the fact that Brazoria, Chambers,
Fort Bend, Galveston, Harris, Liberty, Montgomery, and Waller Counties are listed by the
Environmental Protection Agency as nonattainment areas under the National Ambient Air
Quality Standards program.
Nearly 2,000 MW of generation in the Houston area will be 50 years old or older by 2018. This
older generation is less efficient than most of the generation fleet in ERCOT, and this has two
important implications for serving power in the Houston area. First, the generation is at risk for
retirement since it may not be economically competitive with other generation in ERCOT. Any
such retirement would increase the need to import more power from outside the area. Second,
the reliance on less efficient generation in the Houston area due to import constraints also
manifests itself as transmission congestion and higher electricity prices in the Houston region.
The third-highest congested element on the ERCOT System in 2013 through October was the
Singleton – Zenith 345 kV line. This line lies along the path used to import power into the
Houston area from the north. The Singleton – Tomball and Twin Oak – Jack Creek 345 kV lines
also lie along this path and experienced congestion in 2013. In total these north-to-Houston
import lines had $38.5 million in congestion rent through October. The table and map below
show the congestion rent and location of these lines.
Map Index Transmission Line Congestion Rent
1 Singleton – Zenith 345 kV line $28,965,042
2 Singleton – Tomball 345 kV line $5,562,728
3 Twin Oak – Jack Creek 345 kV line $3,992,196

2013 Electric System Constraints and Needs December 30, 2013
18
Prior ERCOT planning analysis, including the 2008 through 2012 Electric System Constraints and
Needs Reports, has shown that the north-to-Houston import lines may become some of the
most congested elements on the ERCOT System. The 2008 Long-Term System Assessment
(LTSA) first identified the fact that these constraints may violate reliability criteria by 2018. The
2010 and 2012 LTSAs also demonstrated a need to increase the import capability of the

2013 Electric System Constraints and Needs December 30, 2013
19
Houston area transmission system. In fact, in every future scenario studied in the 2012 LTSA
the Houston area required increased import capability within the next ten years. One scenario
examined a condition where all generation in ERCOT that was 50-years old or older retired. In
this scenario multiple new high voltage import transmission lines were required for the Houston
area.
In July and August of 2013, three separate TSPs recognized a need to increase the import
capability into the Houston area due to reliability criteria violations and proposed projects to the
RPG to meet that need. ERCOT is currently conducting an independent review of the need for a
project and which project best meets any identified need. This analysis is expected to be
completed in early 2014.
3.3 Denton Area
Three of the most binding constraints on the ERCOT System in 2013 were in the Denton area.
These include the Jim Christal – North Denton 138 kV line, the Fort Worth – Teasley 138 kV
line, and the Teasley – Pockrus 138 kV line. Through October, these lines had a total
congestion rent of $46.8 million for 2013.
In early 2012 the Texas Municipal Power Agency (TMPA) submitted a project for RPG review to
upgrade a significant portion of the Denton 138 kV loop in order to accommodate load growth
in the Denton and Corinth region, which is on the north side of the Dallas-Fort Worth
metroplex. The project was accepted by the RPG and has been progressing in phases. A scope
modification was presented to RPG in July 2013.
In 2012 the Jim Christal – West Denton and West Denton – Fort Worth 138 kV lines were
upgraded. In 2013 the Jim Christal – North Denton and Fort Worth – Teasley 138 kV lines were
upgraded. Much of the congestion that occurred in the area in 2013 was either before these
upgrades were completed or while the lines were out of service for construction.
It is expected that by May of 2014 a second circuit will be added to the existing towers from
North Denton to Teasley (through intermediary stations Jim Christal, West Denton, and Fort
Worth). Upgrades in 2015 include converting the Pockrus 138 kV station to a fully breakered
station, terminating the Corinth – Spencer 138 kV line into the Pockrus station, and converting
the existing Pockrus – Spencer 138 kV double circuit line into a single circuit line with bundled
2013 Electric System Constraints and Needs December 30, 2013
20
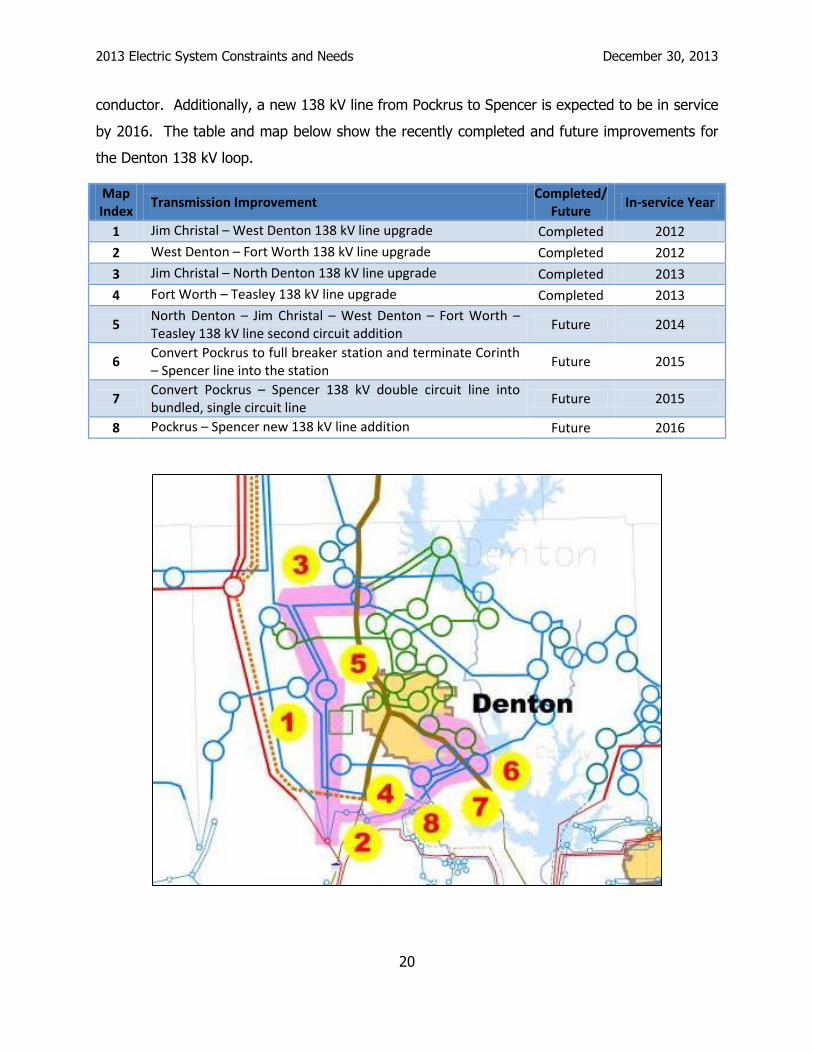
conductor. Additionally, a new 138 kV line from Pockrus to Spencer is expected to be in service
by 2016. The table and map below show the recently completed and future improvements for
the Denton 138 kV loop.
Map Index
Transmission Improvement Completed/
Future In-service Year
1 Jim Christal – West Denton 138 kV line upgrade Completed 2012
2 West Denton – Fort Worth 138 kV line upgrade Completed 2012
3 Jim Christal – North Denton 138 kV line upgrade Completed 2013
4 Fort Worth – Teasley 138 kV line upgrade Completed 2013
5 North Denton – Jim Christal – West Denton – Fort Worth – Teasley 138 kV line second circuit addition
Future 2014
6 Convert Pockrus to full breaker station and terminate Corinth – Spencer line into the station
Future 2015
7 Convert Pockrus – Spencer 138 kV double circuit line into bundled, single circuit line
Future 2015
8 Pockrus – Spencer new 138 kV line addition Future 2016

2013 Electric System Constraints and Needs December 30, 2013
21
3.4 West-to-North Stability Limit
In the mid-2000s ERCOT saw a rapid expansion of wind generation in West Texas. This growth
can be attributed to several factors including the region’s vast wind resources, wind turbine
technology and cost improvements, a deregulated, open-access electricity market, the federal
production tax credit (PTC), and the Texas Renewable Energy Credit (REC) program. The
convergence of these factors led to over 6.1 GW of wind generation capacity being added to
the ERCOT system in the three year period of 2006 through 2008. At the end of 2008 ERCOT
had approximately 8 GW of total wind generation capacity.
The West Texas transmission system was not strong enough to accommodate the large exports
of power from wind generation so the West-to-North stability limit was established to keep
power transfers from exceeding reliability thresholds. This constraint, along with other local
transmission constraints in West Texas, led to relatively lower wholesale electricity prices in
West Texas when compared to other parts of ERCOT. This is because natural gas power plants
typically set the price of power throughout ERCOT, but when the West-to-North stability limit is
constraining wind generation plants often set the real-time price of power in West Texas. Wind
generation plants usually offer to sell their power at a lower price than natural gas plants in the
real-time market because they have no fuel cost and because they receive the PTC. The chart
below shows the average real-time electricity price by zone in ERCOT from 2008 through 2011.

2013 Electric System Constraints and Needs December 30, 2013
22
The lower prices contributed to a slowdown in wind generation development in West Texas.
From 2009 through 2012 only approximately 2.4 GW of wind generation was added in ERCOT,
of which nearly half was located in South Texas. The chart below shows the wind generation
capacity installations in ERCOT by year.
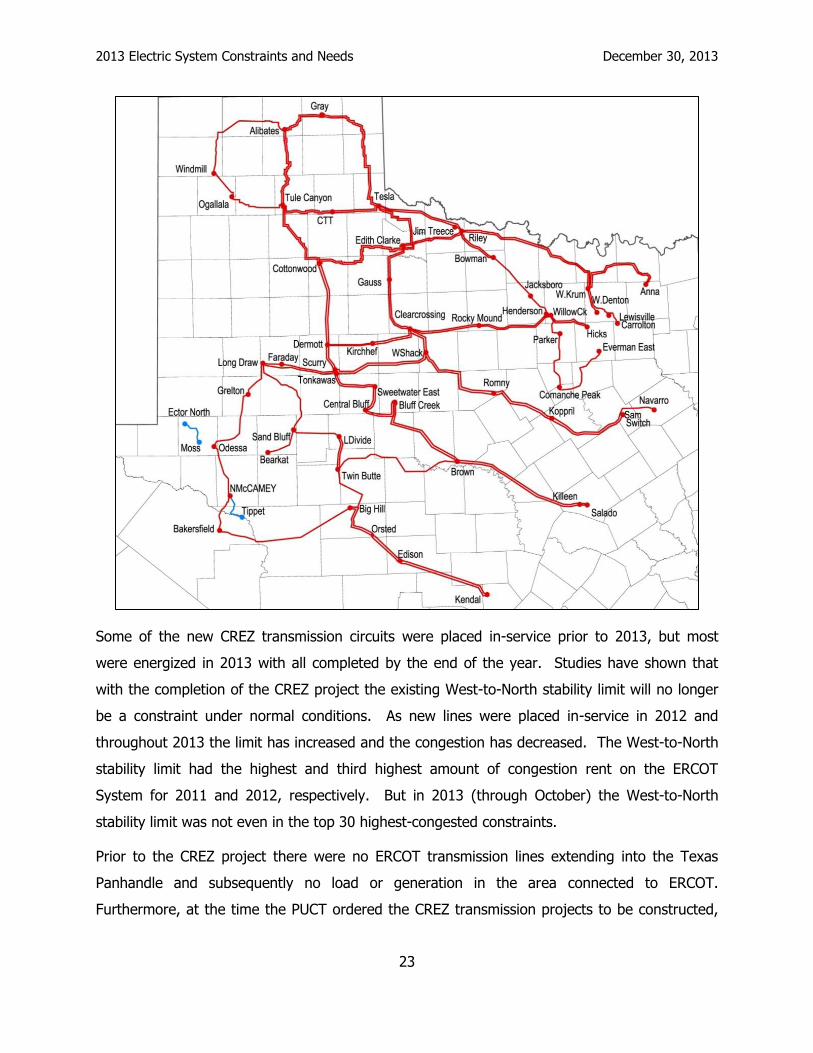
In 2008, the PUCT approved the Competitive Renewable Energy Zone (CREZ) transmission plan
which includes the construction of new 345 kV transmission circuits designed to deliver up to
18,500 MW of wind generation on the ERCOT System. The figure below shows a map of the
CREZ transmission lines.
2013 Electric System Constraints and Needs December 30, 2013
23
Some of the new CREZ transmission circuits were placed in-service prior to 2013, but most
were energized in 2013 with all completed by the end of the year. Studies have shown that
with the completion of the CREZ project the existing West-to-North stability limit will no longer
be a constraint under normal conditions. As new lines were placed in-service in 2012 and
throughout 2013 the limit has increased and the congestion has decreased. The West-to-North
stability limit had the highest and third highest amount of congestion rent on the ERCOT
System for 2011 and 2012, respectively. But in 2013 (through October) the West-to-North
stability limit was not even in the top 30 highest-congested constraints.
Prior to the CREZ project there were no ERCOT transmission lines extending into the Texas
Panhandle and subsequently no load or generation in the area connected to ERCOT.
Furthermore, at the time the PUCT ordered the CREZ transmission projects to be constructed,

2013 Electric System Constraints and Needs December 30, 2013
24
there were no generation plants with signed generation interconnection agreements for
connection to the proposed Panhandle CREZ facilities. Because of this, the reactive equipment
necessary to support the export of power from the Panhandle was only implemented for 2.4
GW of wind generation capacity, even though the transmission lines were constructed to
accommodate a much larger capacity. There were two main drivers for this decision. First, at
the time, there was not a clear indication of how much wind generation capacity would
interconnect in the area or how quickly it would develop. Second, since studies of the CREZ
system indicated that the export of power from the Panhandle will be voltage-stability
constrained, the location and amount of wind generation facilities within the area will dictate
the location and size requirements for additional reactive support devices. Hence, the details
concerning additional reactive equipment needs for the Panhandle were left for later studies
when more information would be available.
Currently, there is over 11 GW of wind generation in service on the ERCOT System. An
additional 5 GW with a signed interconnection agreement is expected to be in-service by the
end of 2015. Of that 5 GW, 3 GW is located in the Texas Panhandle. It should be noted that
as of October 2013 only 1.4 GW of the wind generation in the Panhandle area with a signed
interconnection agreement has provided a notice to proceed with construction with financial
security to the responsible TSP. Wind generation projects located in the Texas Panhandle are
expected to have higher capacity factors than those located in other areas of Texas due to
superior wind resources. At the end of October 2013, there were approximately 22.8 GW of
new wind generation projects under study in ERCOT with 11 GW located in the Texas
Panhandle.
In addition to the benefits provided by the new CREZ lines, technology improvements are also
making new wind generation plants more financially viable. These improvements include longer
blades, increased nacelle efficiency, and operating software improvements. These
improvements result in significant benefits to wind generation developers. First, they allow
wind generation plants to increase their capacity factor which means they can generate more
energy revenue and more revenue from the federal PTC. Additionally, new wind turbines can
generate at lower wind speeds. This means that wind generation plants utilizing the new
technologies located in West Texas and the Texas Panhandle will be able to generate more than
previously during summer afternoons when wind speeds average less than other times of the
2013 Electric System Constraints and Needs December 30, 2013
25
year and when power prices are higher. Both of these results should lead to increased
profitability which could drive further wind generation expansion in ERCOT.
The ERCOT 2012 Long-Term System Assessment demonstrated that, given the new turbine
technologies, ERCOT could potentially see a substantial increase in wind generation capacity
similar to what was experienced in the mid-2000s. It also showed that a significant amount of
this development would likely occur in the Texas Panhandle. As discussed previously, an
examination of the wind generation projects in the ERCOT interconnection study process
corroborates this assertion.
In early 2013 ERCOT began an analysis to determine what additional reactive equipment and
other transmission improvements would be needed in order to accommodate wind generation
capacity beyond the 2.4 GW capacity for which reactive support was initially installed. The
report that describes the study and results is expected to be completed in early 2014. Some
noteworthy preliminary findings of the study include:
Generation development activity in the Panhandle has been concentrated further to the
northern and western edges of the transmission system in the area when compared to
what was assumed in prior CREZ studies performed in the 2007 to 2010 timeframe. The
prior studies’ assumptions were based on information provided by generation developers
before the future routing process of CREZ facilities had begun. This is a meaningful
change in assumptions since transferring the power over a longer distance in a voltage-
stability constrained area will require additional support on the transmission system.
Several transmission improvements can be implemented at a relatively low cost and in a
relatively short time frame to increase the Panhandle export limitation. These include
installing a synchronous condenser(s), shunt reactors and adding the second circuit to
the following 345 kV transmission lines that were constructed to be double-circuit
capable with originally just one circuit in place: Alibates – Windmill, Windmill – Ogallala,
and Ogallala – Tule Canyon.
Additional improvements to increase export limits will include new transmission lines on
new right of way. These improvements will require significant wind generation
development commitment in order to be economically justified.

2013 Electric System Constraints and Needs December 30, 2013
26
4. Planned Improvements
Currently, there are $3.63 billion of future transmission improvement projects that are planned
to be in service between 2014 and the end of 2018. This involves the addition or upgrade of
over 3,300 miles of transmission circuits, the addition of 15,084 MVA of autotransformer
capacity, and the addition of 1,354 MVAr of reactive capability. The table and map below show
some of the significant improvements planned to be in-service within the next five years.
Map Index Transmission Improvement In-service Year
1 Mont Belvieu area upgrades 2014
2 Freeport area upgrades and conversion to 138 kV 2015
3 New Midland County Northwest 345/138 kV switching station 2015
4 Lon Hill to North Edinburg 345 kV line reconductor 2015
5 New Coleto Creek to Tuleta 138 kV line 2016
6 New Loma Alta to North Edinburg 345 kV line 2016
7 New South McAllen 345/138 kV transformer 2016
8 New Lobo to North Edinburg 345 kV line 2016
9 Kenedy Switch to Nixon to Seguin upgrade and conversion from 69 kV to 138 kV service
2016
10 New Lavon 345/138 kV transformer 2016
11 New Jack County 345/138 kV transformer 2016
12 CPS Northeast Switchyard with 345/138 kV transformer 2016
13 Add second Lobo 345/138 kV transformer 2016
14 New Fowlerton 345/138 kV transformer 2016
15 Trinidad to Tri Corner to Watermill 345 kV line upgrade 2017
16 Katy Area Upgrades with Zenith 345/138 kV transformer 2017

2013 Electric System Constraints and Needs December 30, 2013
27
The following sections detail some of the significant improvements planned on the ERCOT
System.

2013 Electric System Constraints and Needs December 30, 2013
28
4.1 Eagle Ford Shale Oil and Natural Gas Related Projects
Electric load related to oil and natural gas exploration is rapidly developing in the area of the
Eagle Ford Shale. The Eagle Ford Shale stretches from the Laredo area northeast to Gonzales
and Dewitt Counties and beyond. The maps below show the oil and gas well activity in the
Eagle Ford Shale from January 2010, February 2011, July 2012 and May 2013, respectively.
They illustrate the rapid increase in interest in oil and natural gas in the area over the last four
years.

2013 Electric System Constraints and Needs December 30, 2013
29
The chart below shows the growth in oil and natural gas production in Texas Districts 1 and 2,
which comprise most of the Eagle Ford Shale, between 2008 and summer 2013. The data
indicates that between early 2010 and summer 2012 crude oil and condensate production
climbed from under 2 million barrels per month to over 26 million barrels per month, over a
1200% increase. Meanwhile, natural gas production in the area has tripled during a time of
falling natural gas prices.
The increase in oil and natural gas activity has had a corresponding effect on electric demand in
the area. ERCOT and the TSPs in the area have been working on transmission plans to meet
the growing needs in the Eagle Ford Shale. In 2012 five sets of transmission projects, with a
total estimated capital cost of $152.4 million, were reviewed and accepted by the RPG and
ERCOT. Three additional projects, with a combined capital cost estimate of $178.4 million,
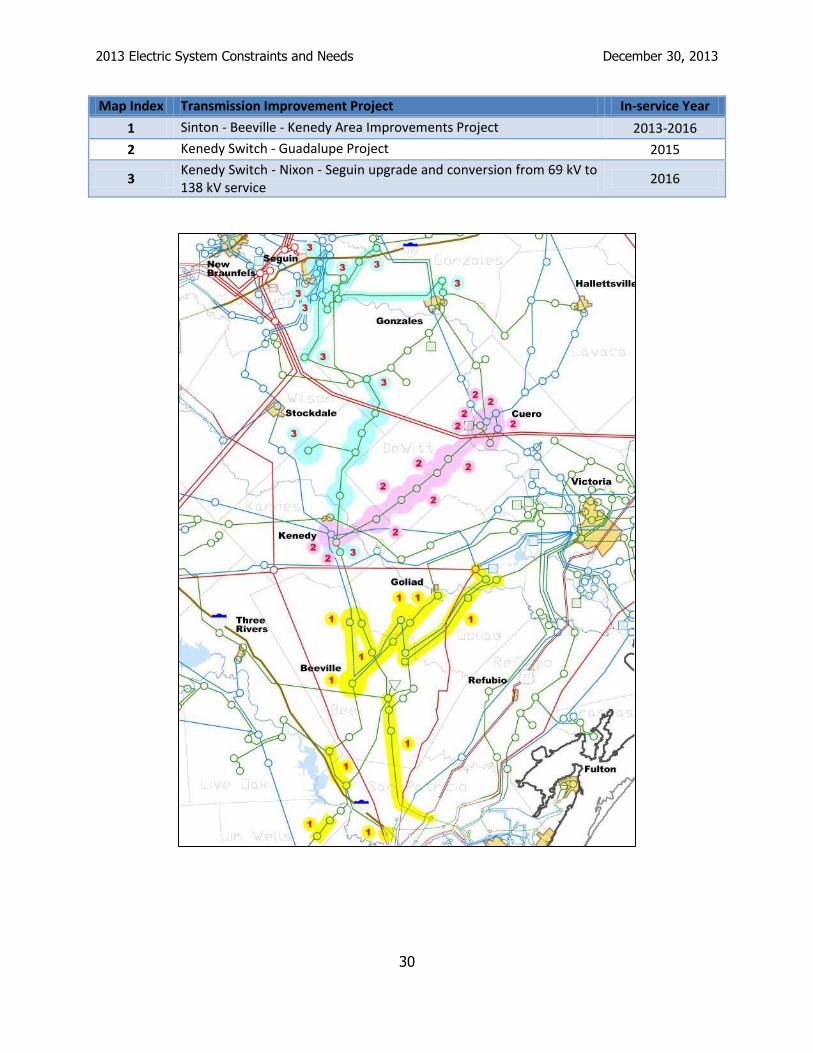
were reviewed and accepted by the RPG and ERCOT in 2013. The table and map below shows
the three projects accepted in 2013. These projects are expected to be in service between
2013 and 2016.
2013 Electric System Constraints and Needs December 30, 2013
30
Map Index Transmission Improvement Project In-service Year
1 Sinton - Beeville - Kenedy Area Improvements Project 2013-2016
2 Kenedy Switch - Guadalupe Project 2015
3 Kenedy Switch - Nixon - Seguin upgrade and conversion from 69 kV to 138 kV service
2016

2013 Electric System Constraints and Needs December 30, 2013
31
4.2 Valley Import Project
The Valley Import Project, expected to be completed by 2016, is one of the most significant
currently planned projects in ERCOT. The project includes the construction of a new,
approximately 163 mile 345 kV line from the Lobo station, near Laredo, to the North Edinburgh
station in the Lower Rio Grande Valley (LRGV). This new line will provide a third 345 kV import
circuit into the LRGV. Additionally, the project includes reconductoring both of the existing 345
kV import lines. The Lon Hill – North Edinburg 345 kV line had the 13th highest amount of
congestion rent on the ERCOT System in 2013 (through October).
Two unique aspects of the reconductoring portion of this project are the use of a new
composite core conductor and the fact that the installation of the new conductor will occur
while each of the existing 345 kV lines are energized. These circuits cannot be taken out of
service for extended periods of time due to the region’s dependence on the import capacity
they provide. Reconductoring these circuits while they remain in service will be accomplished
by constructing a temporary transmission circuit phase in parallel to the actual line, bypassing
the section the construction crews are working on.
Currently, demand in the LRGV is supported by the two existing 345 kV lines, three smaller 138
kV lines, and approximately 1,700 MW of natural gas generation at four plants. The area also
has some hydro and wind generation and an asynchronous tie with the Mexico system.
Because the area is dependent on such a small number of resources, maintenance outages
must be carefully planned in order to reliably serve the area. Likewise, the area is vulnerable to
contingency events that cause multiple pieces of equipment to be outaged due to maintenance
or equipment failure.
Such a contingency event occurred in February 2011 when extremely cold weather event forced
generation in the LRGV out of service while other generation in the area was already on a
planned maintenance outage. The extreme cold also drove demand to levels not previously
seen or forecasted for the area. ERCOT Operators were forced to order some load shed in the
LRGV in order to maintain overall reliability for the area.
This project was estimated to cost $525 million. The map below illustrates the improvements
associated with this project.

2013 Electric System Constraints and Needs December 30, 2013
32
4.3 Cross Valley Project
A new 345 kV line from the North Edinburg station, located on the west side of the LRGV, to the
Loma Alta station, located on the east side of the LRGV, is expected to be in-service before
summer peak of 2016. This new ‘Cross Valley’ 345 kV line will support load growth in the cities
along the eastern side of the LRGV, including the city of Brownsville. The city of Brownsville is
currently supported by four 138 kV lines and a small natural gas powered plant. Given load
growth projections, without the project, which also includes a new 138 kV line, the city and
surrounding area would be vulnerable to a significant amount of load shed (local rolling
blackouts) under conditions where more than one of the supporting transmission lines are
outaged. The project was estimated to cost $274.7 million and is illustrated in the map below.

2013 Electric System Constraints and Needs December 30, 2013
33
Additionally, the 2013 Regional Transmission Plan identified a reliability need to add a 345 kV to
138 kV transformer in the McAllen area by 2016. This project will accommodate the connection
of the new 345 kV line to the existing 138 kV system in the McAllen area.
4.4 Additional Reliability Driven Planned Improvements
Continued growth of load throughout the state is a key driver for transmission improvements in
the ERCOT Region. The future year planning models developed by the ERCOT Steady State
Working Group show a 7.4% overall forecasted increase in demand throughout ERCOT between
2014 and 2018.

2013 Electric System Constraints and Needs December 30, 2013
34
The recently completed 2013 Regional Transmission Plan identified more than 100 projects
needed to satisfy reliability planning criteria in the 2014 to 2018 timeframe. These projects are
in addition to those previously planned for the ERCOT System. More information on these
projects can be found in the 2013 Regional Transmission Plan report which is posted on the
ERCOT Planning and Operations Information website.

2013 Electric System Constraints and Needs December 30, 2013
35
5. Projected Constraints
The following sections describe projected future constraints on the ERCOT System.
5.1 2014 Reliability Constraints
When ERCOT develops the annual Regional Transmission Plan there are usually a number of
reliability needs that are identified where the projects designed to meet the needs will not be in
place before the reliability needs are realized. There are several reasons that this occurs, the
most common being faster-than-expected load growth and construction delays. Coordinating
construction of multiple projects and equipment outages in the same area affects the
completion of projects.
When projects needed for reliability cannot be installed prior to need, the responsible TSPs and
ERCOT work to design temporary operational solutions to resolve the reliability issue until the
transmission project can be completed. Such operational solutions may include temporarily
reconfiguring the system, running less efficient generation, or in the worst case establishing a
procedure to shed load in the event that a contingency occurs. While these actions ensure that
reliability standards are upheld they can often lead to substantial amounts of congestion on the
system if generation redispatch is needed.
The recently completed 2013 Regional Transmission Plan identified the following list of
projected 2014 reliability constraints that will not have the transmission project planned to solve
the constraint in place before the constraint occurs. A considerable number of these constraints
are located in the aforementioned Permian Basin and Eagle Ford Shale oil and natural gas
exploration and production areas where demand has increased faster than previously
anticipated.

2013 Electric System Constraints and Needs December 30, 2013
36
Map Index Transmission Element
1 Knox City - Gillespie - Munday 69 kV line and Munday - Munday 2 69 kV line
2 Collin SES - Roman Juarez, Austin Ranch - Plano Communications Parkway, and Plano Tennyson - Plano Communications Parkway 138 kV lines
3 Summerfield - Saginaw Switch and Eagle Mountain - Wagley Robertson 138 kV lines
4 Plano Tennyson - Preston Meadows 138 kV line
5 Euless - Grapevine Highway 360 138 kV line
6 Austin Ranch - Hebron 138 kV line
7 General Motors - Great Southwest - Executive Parkway 138 kV line
8 International Airport - Liggett Switch 138 kV line
9 Ben Davis - Murphy Road 138 kV line
10 Olsen 138/69 kV autotransformer
11 Bosque Switch - Olsen 138 kV line
12 Olsen - Lake Whitney 69 kV line
13 Collin Switch - Frisco 138 kV line
14 Trinidad - Watermill 345 kV line
15 Big Brown - Navarro 345 kV double circuit
16 Mountain Creek - Trinity River Authority 138 kV line
17 Northwest Carrollton - Lake Pointe 138 kV line
18 Hockley-Betka-Freeman 138 kV line
19 Asherton 138/69 kV autotransformer and Asherton - Carrizo Springs 69 kV line
20 West Batesville - Asherton 138 kV line
21 Hamilton Road - Maverick - Eagle Hydro Tap - Escondido 138 kV line
22 Duke - Azteca - SE Edinburg 138 kV line
23 North McAllen - West McAllen 138 kV line
24 Laredo Plant - Del Mar 138 kV line
25 Lobo - Freer - San Diego 69 kV line
26 Kenedy - Beeville Area 69 kV lines
27 Pleasanton 138/69 kV transformer
28 Dilley Switch - Cotulla 69 kV line
29 Kenedy Switch - Cuero 69 kV line
30 Kenedy Switch - Luling 69 kV line
31 Guadalupe and Gonzales area 69 kV lines
32 Abilene Northwest - Ely Rea Tap 69 kV line
33 Onyx - Abilene Clear Fork Tap - TEC Delk Hawley 69 kV line
34 Westover - Amoco South Foster - Odessa North 138 kV line
35 Big Spring Switch - Big Spring West 138 kV line
36 Glenhaven - CRMWD 8 Tap - Midland Airport 138 kV line
37 Midland East - Windwood 138 kV line
38 Permian Basin - Wink Sub 138 kV line
39 Stanton East - West Stanton 138 kV line

2013 Electric System Constraints and Needs December 30, 2013
37
Map Index Transmission Element
40 Morgan Creek - Barber Lake 138 kV lines
41 Uvalde 138/69 kV autotransformer
42 Salem - Colorado City 138 kV line
43 Driver Tap 1 - Driver Sub 138 kV line
44 Wink SS - TN Wink 69 kV line
45 IH 20 - Pecos 69 kV line
The maps below show the locations of these constraints.
DFW area reliability constraints for 2014

2013 Electric System Constraints and Needs December 30, 2013
38
Reliability constraints outside of DFW area for 2014
5.2 2016 and 2018 Projected Constraints
Future year constraints are also analyzed as part of the annual Regional Transmission Plan.
Projects are identified to resolve the constraints expected to cause the most congestion on the

2013 Electric System Constraints and Needs December 30, 2013
39
system. If a project meets the economic planning criteria by reducing overall system costs it is
included in the recommended project set. Many times, however, the capital cost of the project
is greater than the expected system-wide production cost savings. When this occurs, the
project will not be constructed and the congestion will persist. The table and map below show
the constraints projected to be the most congested for 2016 and 2018 based on model
simulation.
Congestion Color Key
None
Low
Medium
High
Map Index
Projected Constraining Element 2016
Congestion 2018
Congestion
1 Cico – Comfort 138 kV line
2 Dupont Switch - Dupont PP-1 (Ingleside) 138 kV line
3 Hamilton Road – Maverick 138 kV line
4 Jack Creek - Twin Oak 345 kV line
5 Kendall - Highway 46 West 345 kV line
6 Kiamichi Energy - Kiowa Switch 345 kV line
7 Morris Dido - Eagle Mountain 138 kV line
8 Randolph Field – Weiderstein 138 kV line
9 Rincon – Bonnieview 69 kV line
10 River Oaks - Highway 46 West 138 kV line
11 Singleton – Zenith 345 kV line
12 Wolfgang – Rotan 69 kV line

2013 Electric System Constraints and Needs December 30, 2013
40

2013 Electric System Constraints and Needs December 30, 2013
41
6. Long-Term System Assessment
ERCOT received grant funding from the Department of Energy (DOE) as part of the 2009
American Recovery and Reinvestment Act (ARRA) in April 2010, to conduct interconnection-
wide long-range transmission planning for the ERCOT Region. ERCOT used the funds obtained
from the DOE to augment and enhance the existing long-range planning efforts for the ERCOT
region. The analysis covered 2022 to 2032 conditions in ERCOT. The report detailing the
results of this endeavor was published in December 2013 and can be found on the ERCOT
website at the following location: http://www.ercot.com/committees/other/lts/index.
Below is a summary of noteworthy transmission-related findings from the assessment:
The Houston region will need at least one additional import path within the next ten
years.
The Dallas-Fort Worth (DFW) area will need additional import lines or several upgrades
of existing 345 kV circuits. However, the new lines and the lines that required upgrades
varied by scenario and depended primarily on the location of future generation
development. The only finding consistent across scenarios for the DFW region was the
need for expanded connections between the 345 kV and 138 kV systems to serve the
load connected to the 138 kV system.
The retirement of legacy gas-fired resources in urban areas because of future market
conditions or changing regulatory requirements would lead to an accelerated need for
both expanded import capacity and dynamic reactive resources within the DFW and
Houston regions.
Higher-voltage transmission solutions, such as 500 kV transmission lines, become
potentially cost effective in scenarios with significant increases in renewable generation,
high natural gas prices, and/or increased water costs associated with a continued
drought.
The assessment did not find any reliability criteria violations that would require long lead-time
solutions that could not be implemented within a five-year horizon.

2013 Electric System Constraints and Needs December 30, 2013
42
7. Contacts and Links
7.1 Contacts and Information
For general communications and queries, the public can submit a request for information at: http://www.ercot.com/about/contact/inforequest.cfm Media: Robbie Searcy 512-225-7213 Regulatory: Shelly Botkin 512-225-7177 Government Relations: Theresa Gage 512-225-7074
7.2 Internet Links
ERCOT Home Page: http://www.ercot.com Operations and System Planning Data Area: http://planning.ercot.com Users must register for access to this area. Folders in this area include data, procedures, reports and maps for both operations and planning purposes. Helpful information that can be found on this site includes:
Demand and Energy Reports (D&E) Monthly Actuals
Generation Project Interconnection Information
Regional Planning Group information
Steady-State Base Cases
System Protection Data
Transmission Project and Information Tracking (TPIT)
It should be noted that this website will be retired and replaced in the first quarter of 2014.

2013 Electric System Constraints and Needs December 30, 2013
43
8. Disclaimer
This report was prepared by the Electric Reliability Council of Texas (ERCOT) staff. It is intended to be a report of the status of the transmission system in the ERCOT Region and ERCOT’s recommendations to address transmission constraints. Transmission system planning is a continuous process. Conclusions reached in this report can change with the addition (or elimination) of plans for new generation, transmission facilities, equipment, or loads. Information on congestion costs presented herein is based on the most recent settlement calculations at the time of the development of this report. Future settlements as well as ERCOT Board of Directors and Public Utility Commission of Texas directives may change the figures presented herein. ALL INFORMATION CONTAINED HEREIN IS PROVIDED “AS IS” WITHOUT ANY WARRANTIES OF ANY KIND. ERCOT, ITS ELECTED AND APPOINTED OFFICIALS, EMPLOYEES AND ASSIGNS MAKE NO REPRESENTATIONS WITH RESPECT TO SAID INFORMATION AND DISCLAIM ALL EXPRESS AND IMPLIED WARRANTIES AND CONDITIONS OF ANY KIND, INCLUDING WITHOUT LIMITATION, REPRESENTATIONS, WARRANTIES OR CONDITIONS REGARDING ACCURACY, TIMELINESS, COMPLETENESS, MERCHANTABILITY, OR FITNESS FOR ANY PARTICULAR PURPOSE. The specific suitability for any use of the report and its accuracy should be confirmed by the person or entity choosing to make such use. Use of any of the information in this report is solely at the user’s risk. ERCOT ASSUMES NO RESPONSIBILITY TO YOU OR ANY THIRD PARTY FOR THE CONSEQUENCES OF ANY INTERRUPTION, INACCURACY, ERROR OR OMISSION, RESULTING FROM THE USE OF INFORMATION CONTAINED IN THIS DOCUMENT. ERCOT SHALL NOT BE LIABLE TO YOU OR ANY THIRD PARTY FOR, AND BY USING THE INFORMATION CONTAINED IN THE DOCUMENT YOU AGREE TO INDEMNIFY ERCOT, ITS DIRECTORS, OFFICERS, EMPLOYEES, AND REPRESENTATIVES FOR ANY CLAIM, DAMAGES, OR LOSSES RESULTING FROM, DAMAGE OF ANY KIND ARISING DIRECTLY OR INDIRECTLY OUT OF OR RELATING TO YOUR USE OF THE INFORMATION CONTAINED IN THIS DOCUMENT (INCLUDING ANY BREACH OF THIS AGREEMENT), INCLUDING, BUT NOT LIMITED TO, ANY LOST PROFITS, LOST OPPORTUNITIES, SPECIAL INCIDENTAL, DIRECT, INDIRECT OR CONSEQUENTIAL DAMAGES, EVEN IF ERCOT IS ADVISED OF THE POSSIBILITY OF SUCH DAMAGE OR OF A CLAIM, OR POTENTIAL CLAIM, BY ANOTHER PARTY, INCLUDING CLAIM FOR PUNITIVE DAMAGES.