Embed Size (px)
Citation preview

Texas Department of AgricultureCommissioner Todd Staples
Report on FleetPlanning &Optimization March 2012

1
The Texas Department of Agriculture (TDA) performed 20.4% more inspections with only a 3% increase in gallons of fuel consumed in 2011, compared with 2010, and with 5.1% fewer Inspectors, while maintaining demands on other activities. This equated to a 13.4%
decrease in miles driven per inspection and a 20.4% reduction in costs.
2
Introduction The Texas Department of Agriculture (TDA) performed 20.4% more inspections with only a 3% increase in gallons of fuel consumed in 2011, compared with 2010, and with 5.1% fewer Inspectors, while maintaining demands on other activities. This equated to a 13.4% decrease in miles driven per inspection and a 20.4% reduction in costs. In 2009, the Texas Legislature directed TDA to implement a Fleet Planning and Optimization Program designed to better manage TDA’s fleet operations. Specifically, the Legislature charge read:
Out of funds appropriated no later than December 31st, 2009, the Texas Department of Agriculture shall implement a Fleet Planning and Optimization Pilot Program designed to manage the Department's fleet operations. In order to implement the Pilot Program, the Department shall contract with a vendor whose qualifications include at least ten years of experience in planning, routing, scheduling, and dispatching for fleets to maximize operational performance, and the ability to enable the Department to utilize leading-edge model based artificial intelligence for fleet planning and optimization. Contract payments to the selected vendor shall be made solely out of savings to the Department that are realized out of the implementation of the Program, and such payments shall not commence until such time as the program has achieved at least a five percent reduction in the total cost of the Department's vehicle fleet management operations. The Department shall complete a report to the Office of Vehicle Fleet Management in the Office of the Comptroller of Public Accounts regarding the results of the Program.
In response, TDA contracted with MobiCorp (formerly known as Pointserve), a developer of fleet management and route optimization economic models and software. TDA’s goal was to achieve fleet-wide cost savings, streamlined delivery and field service planning processes, increased driver and asset productivity, and improved customer service. MobiCorp’s MobiPlan tool enhances the ability of the agency to more concisely and strategically schedule and plan inspections. By having a system that automatically schedules routine, follow-up and re-inspections, more attention can be focused on risk-based inspections, trend analysis, delinquent and ad-hoc needs. TDA and MobiCorp piloted the application in one of TDA’s five regional offices in January 2011, with a second in February. The remaining three regional offices went live in April 2011. The application supports five regions across the state composed of 57 inspection types encompassing approximately 50,000 inspections and 131 inspectors.

3
Methodology Under MobiCorp’s model, TDA has a daily transmission of nine months of upcoming inspections to the MobiPlan system. The system processes and optimizes the planning of these future inspections and then transmits back an optimized daily schedule for each Inspector. Transmitting nine months worth of future scheduled inspections each day helps ensure a balanced number of inspections is performed each month of the year, smoothing the peaks and troughs that occurred with TDA’s previous model of manual forecasting and planning. MobiPlan generates logical clusters of inspections and the most efficient routes, optimally assigning Inspectors by comparing Inspector skills, availability and location to the needs of the customer. MobiPlan knows which customers need inspecting, the skills each location requires, which Inspectors possess those skills, and where each Inspector resides. The system considers a broad range of inputs when considering assignments, including the economic goals of TDA, route efficiency, Inspector skill sets, estimated inspection durations, service level agreements, shift rotations, break schedules and customer preferences, such as unique business hours or days of operation. This broad range of inputs allows TDA to eliminate Inspector territorial boundaries and more efficiently assign inspections. Once MobiPlan generates the inspection assignments and routes, the assignments are transmitted to TDA’s system of record (BRIDGE). The Inspectors then receive their assignments via TDA’s mobile inspection application (PIER), which connects to BRIDGE. The Inspectors additionally receive a daily email from MobiPlan, which shows turn-by-turn driving directions to and from each inspection site, as well as predicted drive time, on-site duration and expected end times (see diagram below). While BRIDGE was modified extensively to accommodate the MobiPlan system, these modifications have allowed TDA to automate multiple business rule standards, as well as balance priorities across multiple agency programs. Note: The inspections sent to MobiPlan for optimization and planning consist of only those inspection types that exist in TDA’s system of record. There are approximately 21 additional inspection types, amounting to approximately 27,180 inspections per year, which exist outside of the system and were deemed beyond the scope of the initial optimization project. In addition, TDA has three program types (Seed Law Program, Microbiological Data Program and Pesticide Data Program), amounting to approximately 7,043 samples taken per year, that also exist outside of the system and were omitted from the initial project.

4
Daily Data Flow
Inspector (PIER)
System ofrecord
(BRIDGE)
Inspections due in next 9 monthsInspection durationsFacility hours of operationFacility necessary skillsAppointmentsComplaints
Considers: - Inspection due dates - Inspector home address, skills, availability & shift rotations - Expected inspection durations - Customer hours of operation - Route efficiency - TDA Overtime allowance
Email PDFturn-by-turndirections
MobiPlan
Completed inspection data
Inspection assignments
5
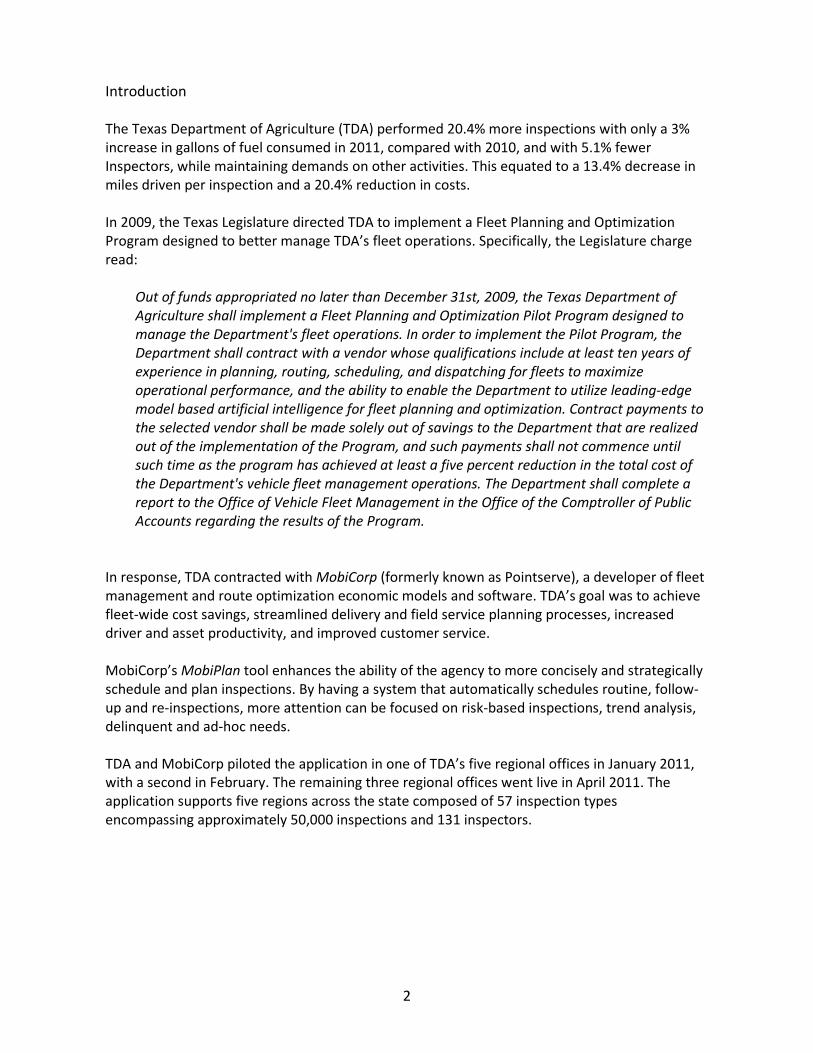
Counter-Intuitiveness: A Lesson Learned MobiPlan work strategies occasionally appear counter-intuitive at the macro level as they seem to send Inspectors out of their way for inspections. MobiCorp has investigated each case brought forth and has consistently and satisfactorily answered TDA's concerns. Following is the most obtrusive example, and MobiCorp's response. In May 2011, MobiPlan assigned an El Paso inspection to an Inspector residing in Midland, almost 300 miles away. The Inspector residing in El Paso was available (on shift) that day and had the relevant skills. Furthermore, the inspections assigned to the local El Paso inspector weren't truly due for several more months and could potentially have been fulfilled on a different day. (The notion of inspection deferment is based upon the principle that inspections are contemplated by MobiPlan several months before they're truly due, enabling seasonal load planning and logical clustering of due or nearly due inspections in that vicinity.) MobiCorp demonstrated there was an economical reason for choosing this seemingly illogical solution by first temporarily designating the local El Paso Inspector as the "Must Be Inspector" for the El Paso inspection, and then running a Test plan for that region. The existing production Master plan was superior to the Test plan in that it planned 240 inspections over a 30-day period, versus 231 inspections on the Test plan with a $7 increase in cost per inspection. For the sake of optimizing the highest number of inspections at the lowest economic cost, TDA may sporadically see an Inspector-Day route that does not appear optimal. MobiPlan is a holistic solution. While TDA may observe counter-intuitive assignments from time-to-time, as a whole, the Master plan maximizes efficient use of resources and saves more money over time. When the Midland Inspector fulfilled the El Paso inspection, it enabled the other Inspectors in that region to achieve a higher number of inspections over a 30-day period, at a lower cost.

6
Results Number of Inspections Performed
2011 shows a 20.4% increase in the total number of PIER-program inspections performed when compared with 2010. Although there is a three-month gap between the first and last TDA regional office going live with the MobiPlan system, there was sufficient report intelligence generated that an early surge of additional inspections was seen and sustained in the non-pilot regions. This increase represents an average of 4.6 more inspections performed per Inspector, per month in 2011.
Figure 1

7
Inspection Activity Outside of the System As previously stated, there are approximately 21 additional inspection types and three additional program types that exist outside of BRIDGE and deemed beyond the scope of the initial optimization project. The increase in the number of inspections performed shown in Figure 1 was not to the detriment of non-BRIDGE inspection obligations. Seed Law Samples
There was a 1.8% decrease in total Seed Law samples taken in 2011 when compared with 2010. Seed sampling is generally affected by the seasonal availability of seed offered for sale.
Figure 2
8
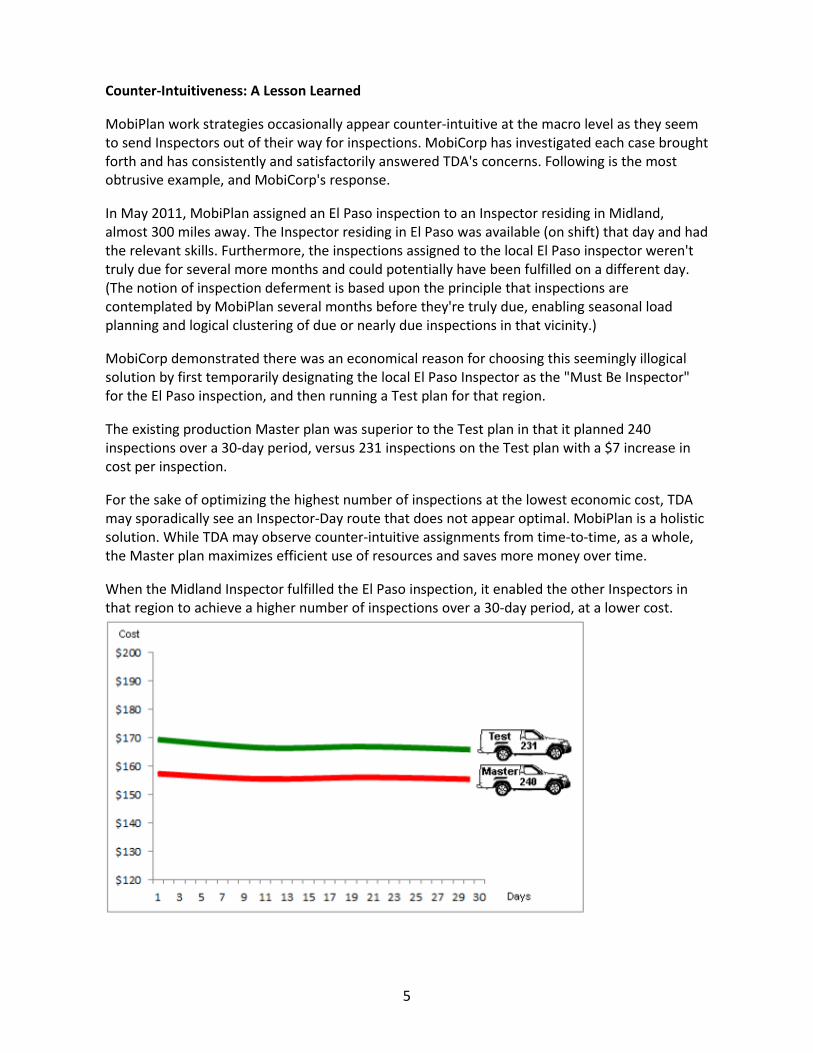
Seed Certification Acres Inspected
There was a 13.1% decrease in total Seed Certification Acres inspected in 2011 when compared with 2010. Requests for Seed Certification derive from customer demand.
Figure 3
Seed Certification Fields Inspected
There was a 1.8% decrease in the total number of Seed Certification Fields inspected in 2011 when compared with 2010. The 13.1% decrease in acreage inspected and the 1.8% decrease in total field inspections may be attributed to the 2011 drought; the worst one-year Texas drought on record.
Figure 4
9
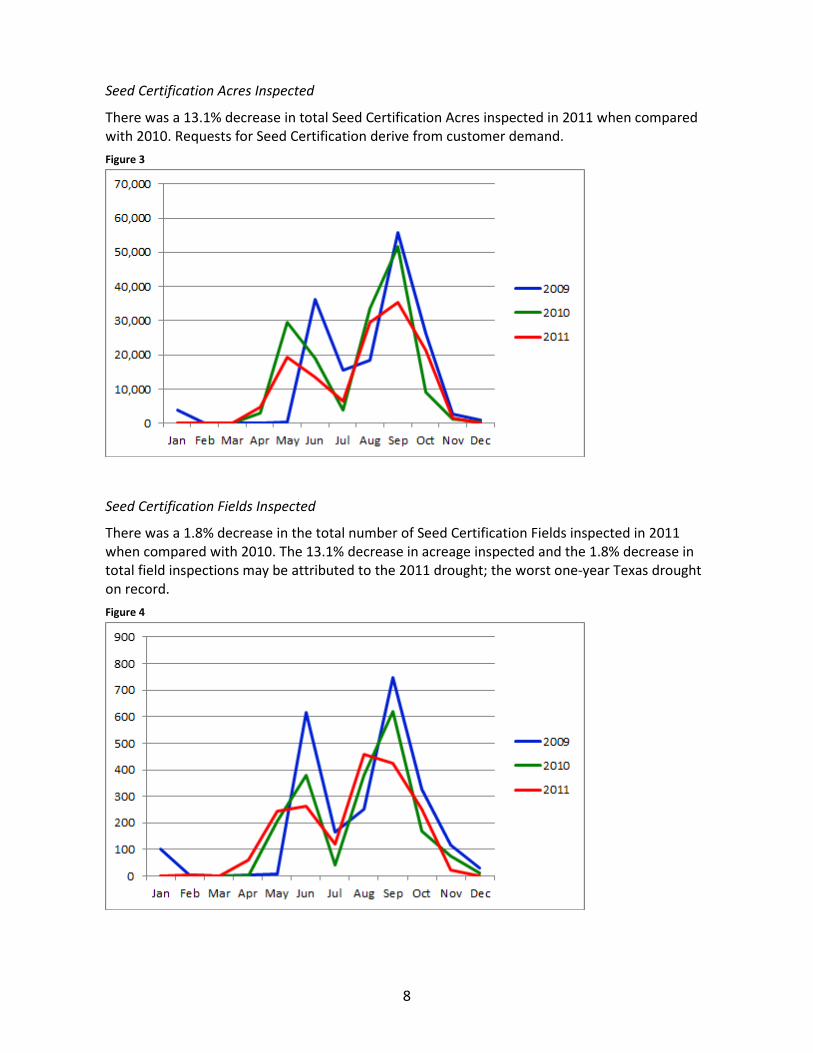
Convenience and Grocery Store Egg Inspections
There was a 23.3% increase in the total number of convenience and grocery store egg inspections in 2011 when compared with 2010.
Figure 5
Phytosanitary Inspection Hours Worked
There was a 17% decrease in hours worked in 2011 when compared with 2010. Similar to Seed Certification, the industry and climate drive the necessity of these inspections.
Figure 6

10
Road Station Inspection Hours Worked
Additional inspection staff gained through grant funding enabled a 71.1% increase in Road Station inspection hours in 2011 when compared with 2010.
Figure 7
Gallons of Fuel Consumed
The total number of gallons of fuel consumed by Inspectors’ vehicles in 2011 increased by only 3% despite the 20.4% increase in the number of inspections performed. Graphing the gallons consumed is preferable to graphing the total cost of fuel and its fluctuating value.
Figure 8
11
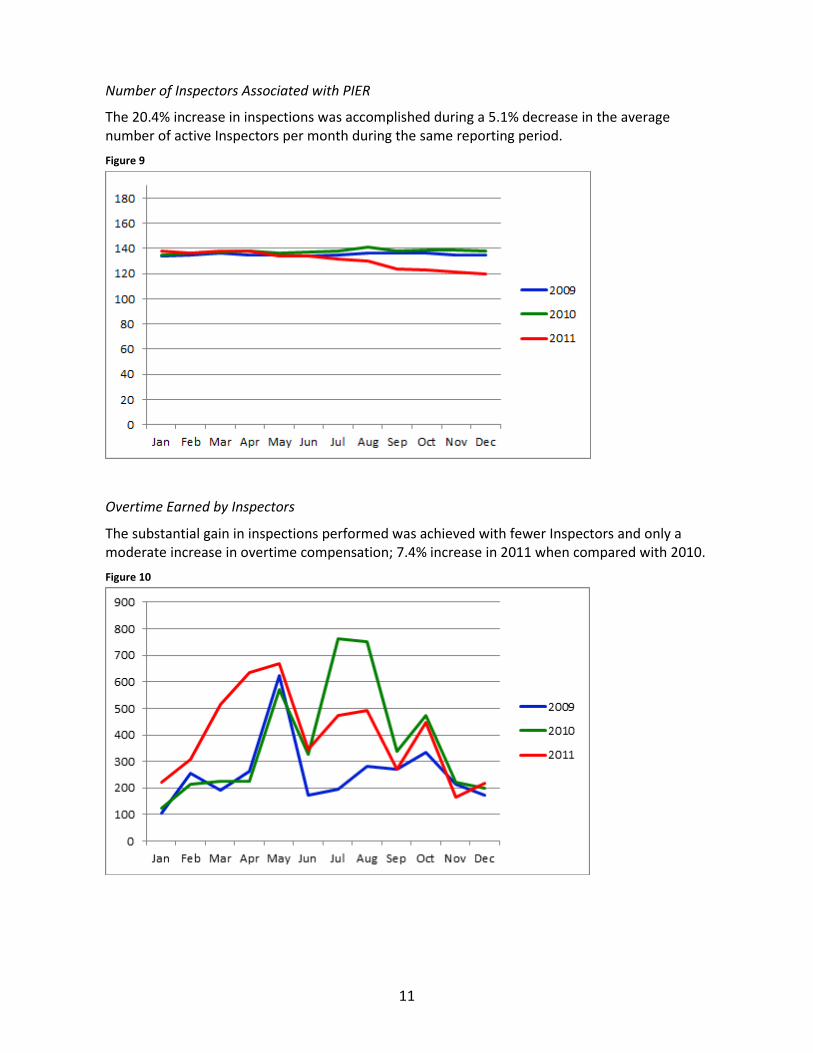
Number of Inspectors Associated with PIER
The 20.4% increase in inspections was accomplished during a 5.1% decrease in the average number of active Inspectors per month during the same reporting period.
Figure 9
Overtime Earned by Inspectors
The substantial gain in inspections performed was achieved with fewer Inspectors and only a moderate increase in overtime compensation; 7.4% increase in 2011 when compared with 2010.
Figure 10
12
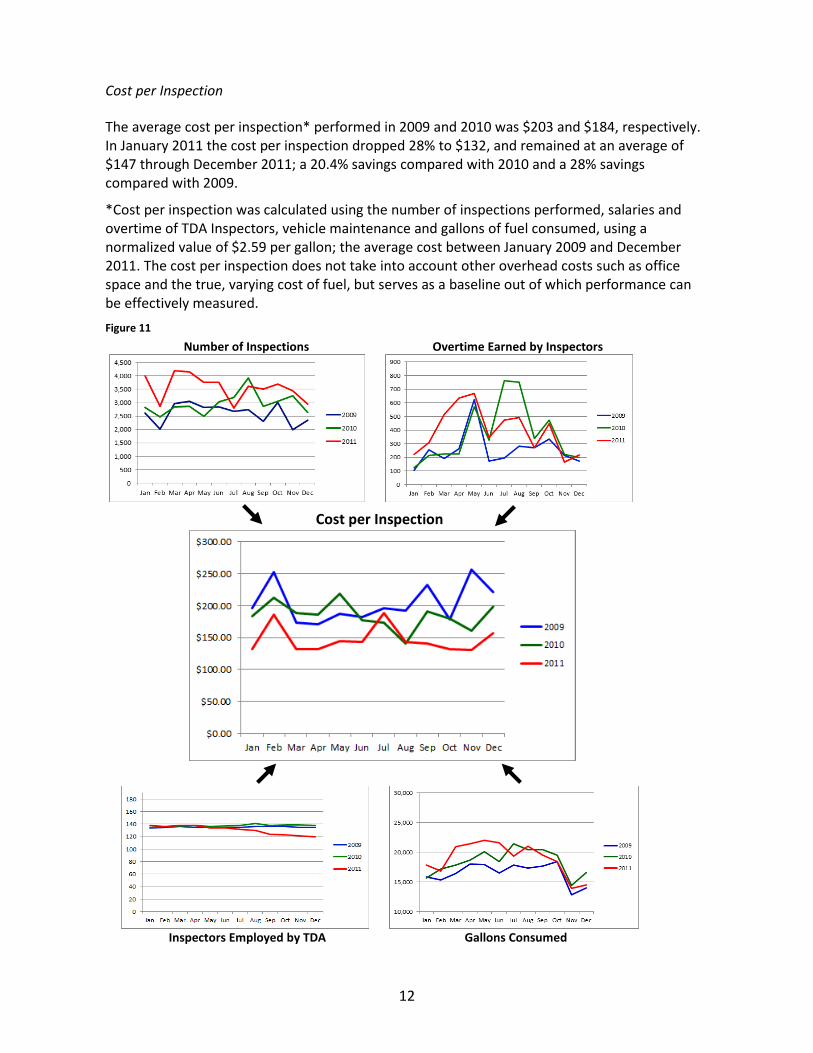
Cost per Inspection The average cost per inspection* performed in 2009 and 2010 was $203 and $184, respectively. In January 2011 the cost per inspection dropped 28% to $132, and remained at an average of $147 through December 2011; a 20.4% savings compared with 2010 and a 28% savings compared with 2009.
*Cost per inspection was calculated using the number of inspections performed, salaries and overtime of TDA Inspectors, vehicle maintenance and gallons of fuel consumed, using a normalized value of $2.59 per gallon; the average cost between January 2009 and December 2011. The cost per inspection does not take into account other overhead costs such as office space and the true, varying cost of fuel, but serves as a baseline out of which performance can be effectively measured.
Figure 11
Number of Inspections Overtime Earned by Inspectors
Cost per Inspection
Inspectors Employed by TDA Gallons Consumed

13
Conclusions The project has brought about a remarkable increase in the number of inspections being performed without a significant increase in gallons of fuel consumed, but also with a decrease in the number of Inspectors employed by TDA. Productivity gains enhance TDA’s ability to more concisely and strategically schedule inspections, yielding operational and financial savings. In fact, the return on investment was realized within the first year of the project. Balancing the inspection schedule further benefits TDA in its risk-based approach, focusing greater attention on businesses with poor compliance histories and less attention on businesses that consistently follow the law. The required centralization and automation of explicit business rules has facilitated shared goals across TDA regional operations. This has fostered a better sense of community as well as created opportunities for the program areas and compliance functions to communicate their needs. The number of inspections performed increased while the miles driven per inspection decreased, as did the overall cost per inspection. Figures 12 and 13 show the total number of miles driven and the miles driven per inspection, respectively.
Total Miles Driven
There was a 4.6% increase in total miles driven in 2011 when compared with 2010, relating to the 3% increase in gallons of fuel consumed.
Figure 12
14
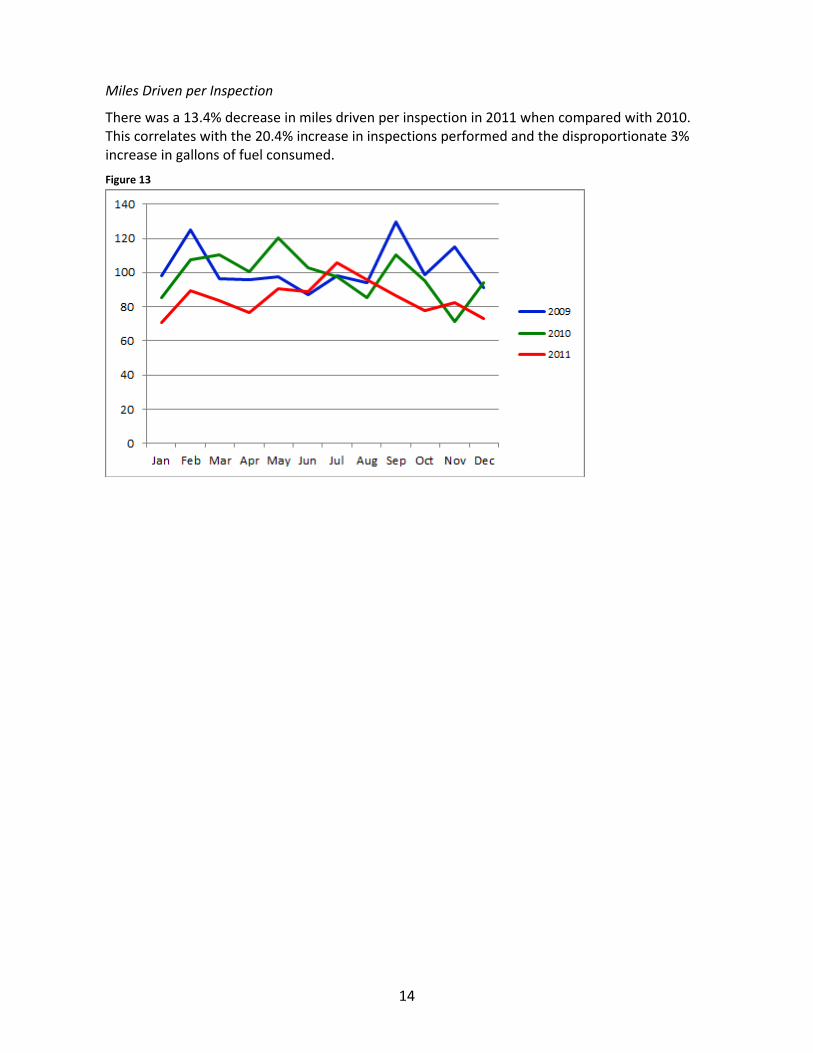
Miles Driven per Inspection
There was a 13.4% decrease in miles driven per inspection in 2011 when compared with 2010. This correlates with the 20.4% increase in inspections performed and the disproportionate 3% increase in gallons of fuel consumed.
Figure 13

15
Recommendations
• Continue to follow MobiPlan-recommended optimized plans and routes. Closer adherence is tied to an increase in productivity and a lower cost per inspection.
• Move remaining inspection types into TDA’s system of record (BRIDGE) for better regional planning, forecasting, reporting and further increases in productivity.
• Continue to monitor the cost per inspection, adjusting Inspector assignments or agency goals or rules, as applicable.
• Utilize MobiPlan data forecasting for determining the best location when hiring Inspectors.
• Evaluate other TDA programs that use a similar model for planning site visits, compliance and enforcement purposes.
Future Enhancements During the initial project, TDA discovered limitations of the system that prevented some business activities from being integrated into optimized daily plans. TDA could reap further benefits through the automatic scheduling of inspections that require specialized equipment (heavy scales, large volume provers, etc.). Currently, these must continue to be manually managed. Additionally, the MobiPlan system is not capable of computing the inspection requirements of Texas as a whole. This limitation necessitated that TDA continue to use regional boundaries. While removing regional boundaries would not necessarily yield additional savings, TDA were unable to explore this possibility. Current assignments are generated and sent out on a once-a-day frequency. Having the ability to make dynamic changes to the plans multiple times during the day (for complaints, etc.), TDA could further enhance its ability to provide even better customer service and would be more flexible in meeting ad-hoc or emergent needs. TDA continues to work with MobiCorp to understand upcoming changes and enhancements, and will evaluate other emerging technologies to determine if there is value to the TDA inspection model. Prepared by Neil Cooke, Texas Department of Agriculture. For comments or questions, please email [email protected]