Embed Size (px)
Citation preview
REPORT ON
GEOPHYSICAL SURVEYS
CARMI MINERAL CLAIMS
BEAVERDELL
BRITISH COLUMBIA
f o r
KELVIN ENERGY LIMITED
Calgary, Alberta November, 1980
Frank Dalidowicz, P.Eng.
MINERAL RESOURCES E31r;:XH
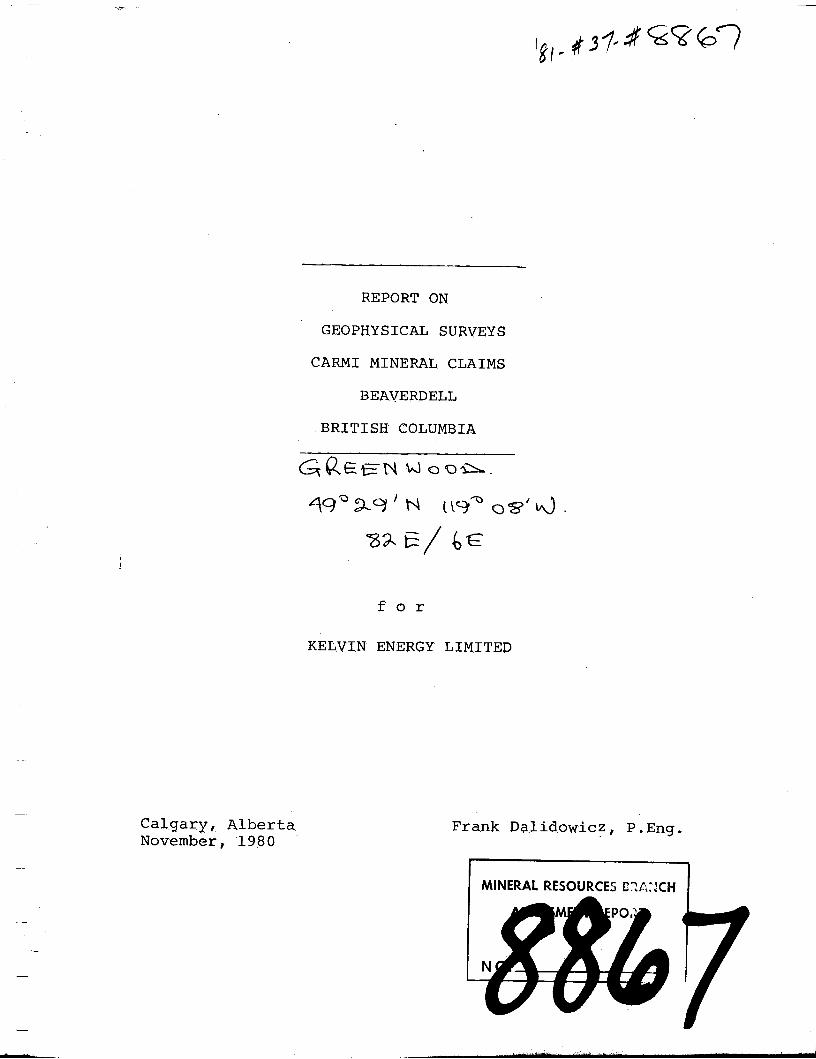
TABLE OF CONTENTS
1. SUMMARY 2. INTRODUCTION 3. LOCATION AND ACCESS
!
4 .
5 .
6.
7.
8.
9.
10
11.
PERSONNEL GEOPHYSICAL GRID INSTRUMENTATION 6 . 1 Induced Polarization Equipment 6.2 VLF Electromagnetic Unit 6.3 Magnetometer
P a g e
1
3
4
SURVEY PROCEDURES AND DATA REDUCTION 10
PRESENTATION OF RESULTS 13
8 . 1 Induced Polarization-Apparent Resis- tivity Survey 1 3
8.2 VLF Electromagnetic Survey 14 8.3 Magnetic Survey 1 7
INTERPRETATION OF RESULTS 1 8
9 . 1 Induced Polarization-Resistivity Survey 1 8
9.3 Magnetic Survey 23 9.2 VLF Electromagnetic Survey 22
CONCLUSIONS 25
RECOMMENDATIONS 26
CERTIFICATE 28
STATEMENT OF EXPENDITURES 29
FIGURES :
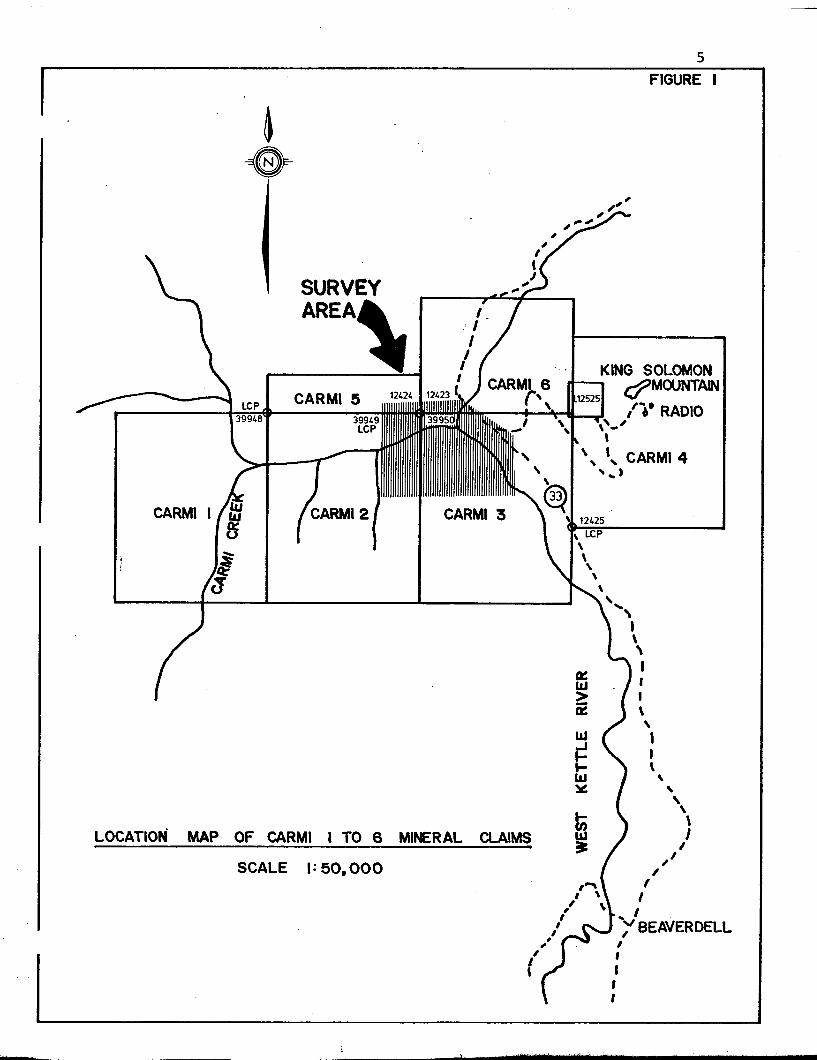
Figure 1 - Location Map-of' Carmi 1 to 6
Figure 2 - Transmitted Wave Forms Figure 3 - Dipole Dipole Array Figure 4 - Pseudo-Section - INPUT
Mineral Claims
APPENDICES:
5 1 2 1 5 1 6
Appendix I - Induced Polarization Equippent r)
Specifications 0 * '30 Appendix I1 - Geonics EM1.6 VLF Electromagne- 3 1
tic Unit Specifications Appendix 111- Geometrics Portable Proton
Magnetometer - Model G-816 32
MAPS ATTACHED TO THE BACK OF THIS REPORT
Pseudo-Sections Drawings Nos. 1 to 28 (Lines 12+00E to
6+75W inclusive and part of the Base Line.
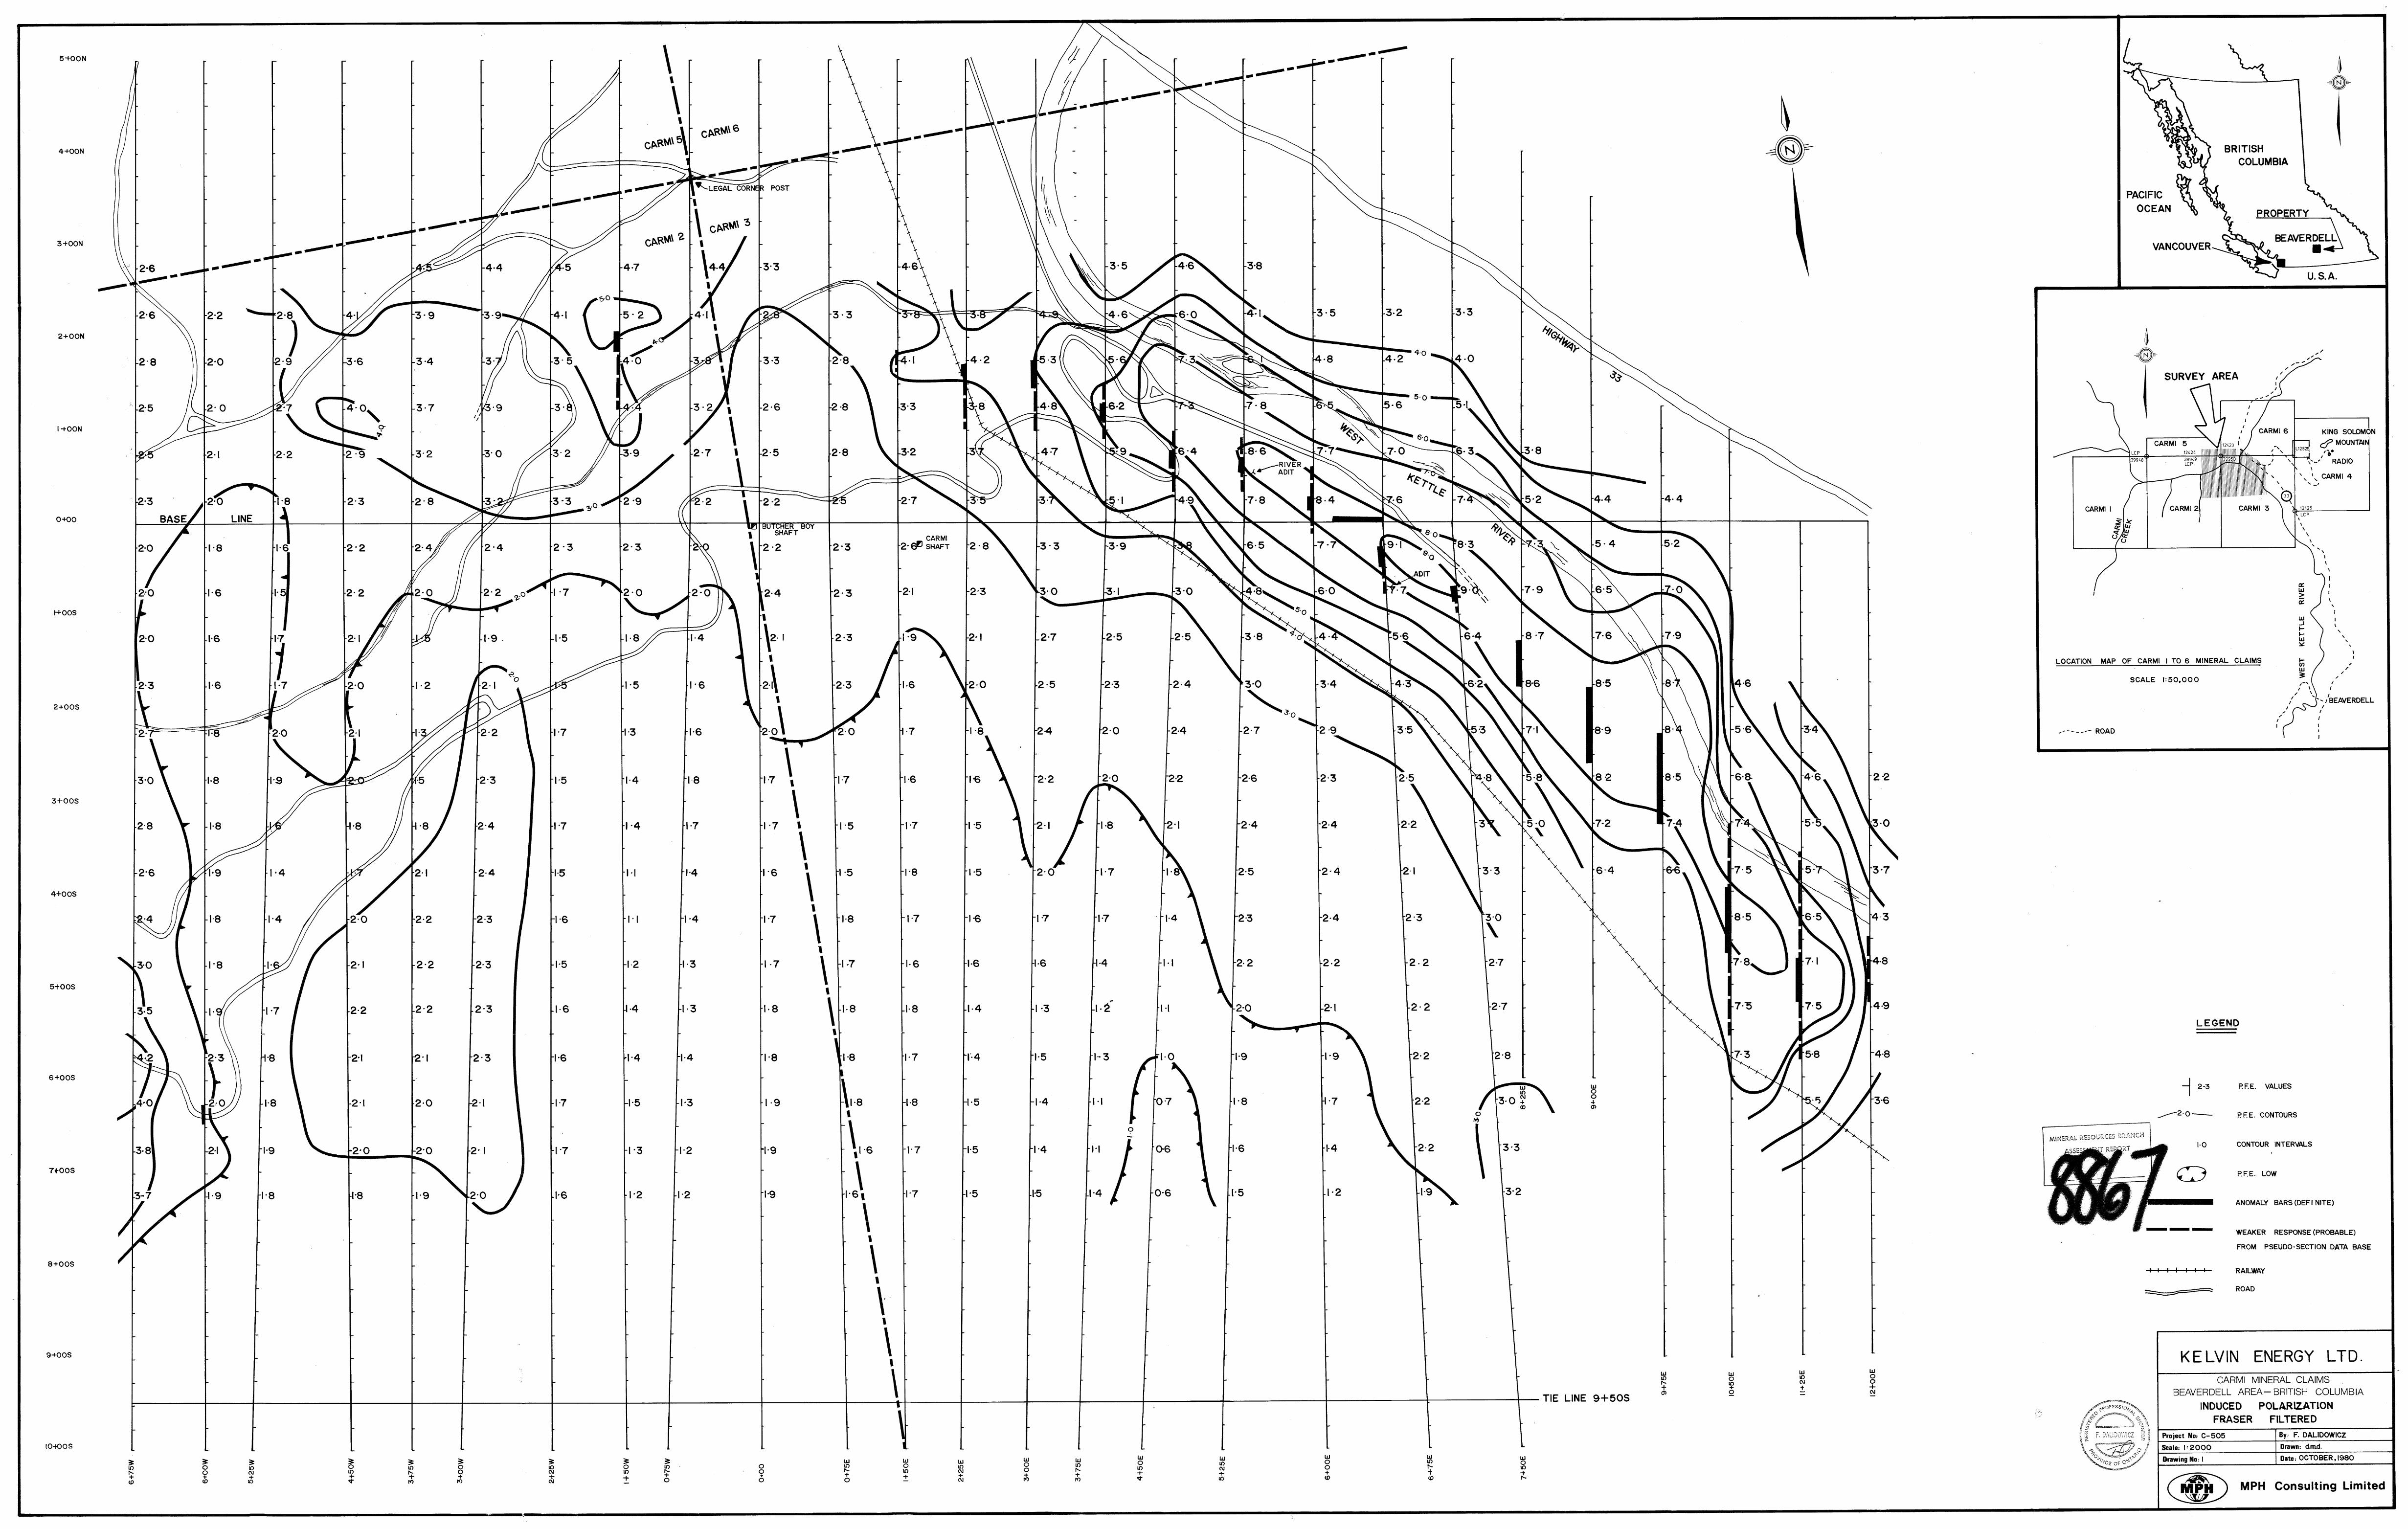
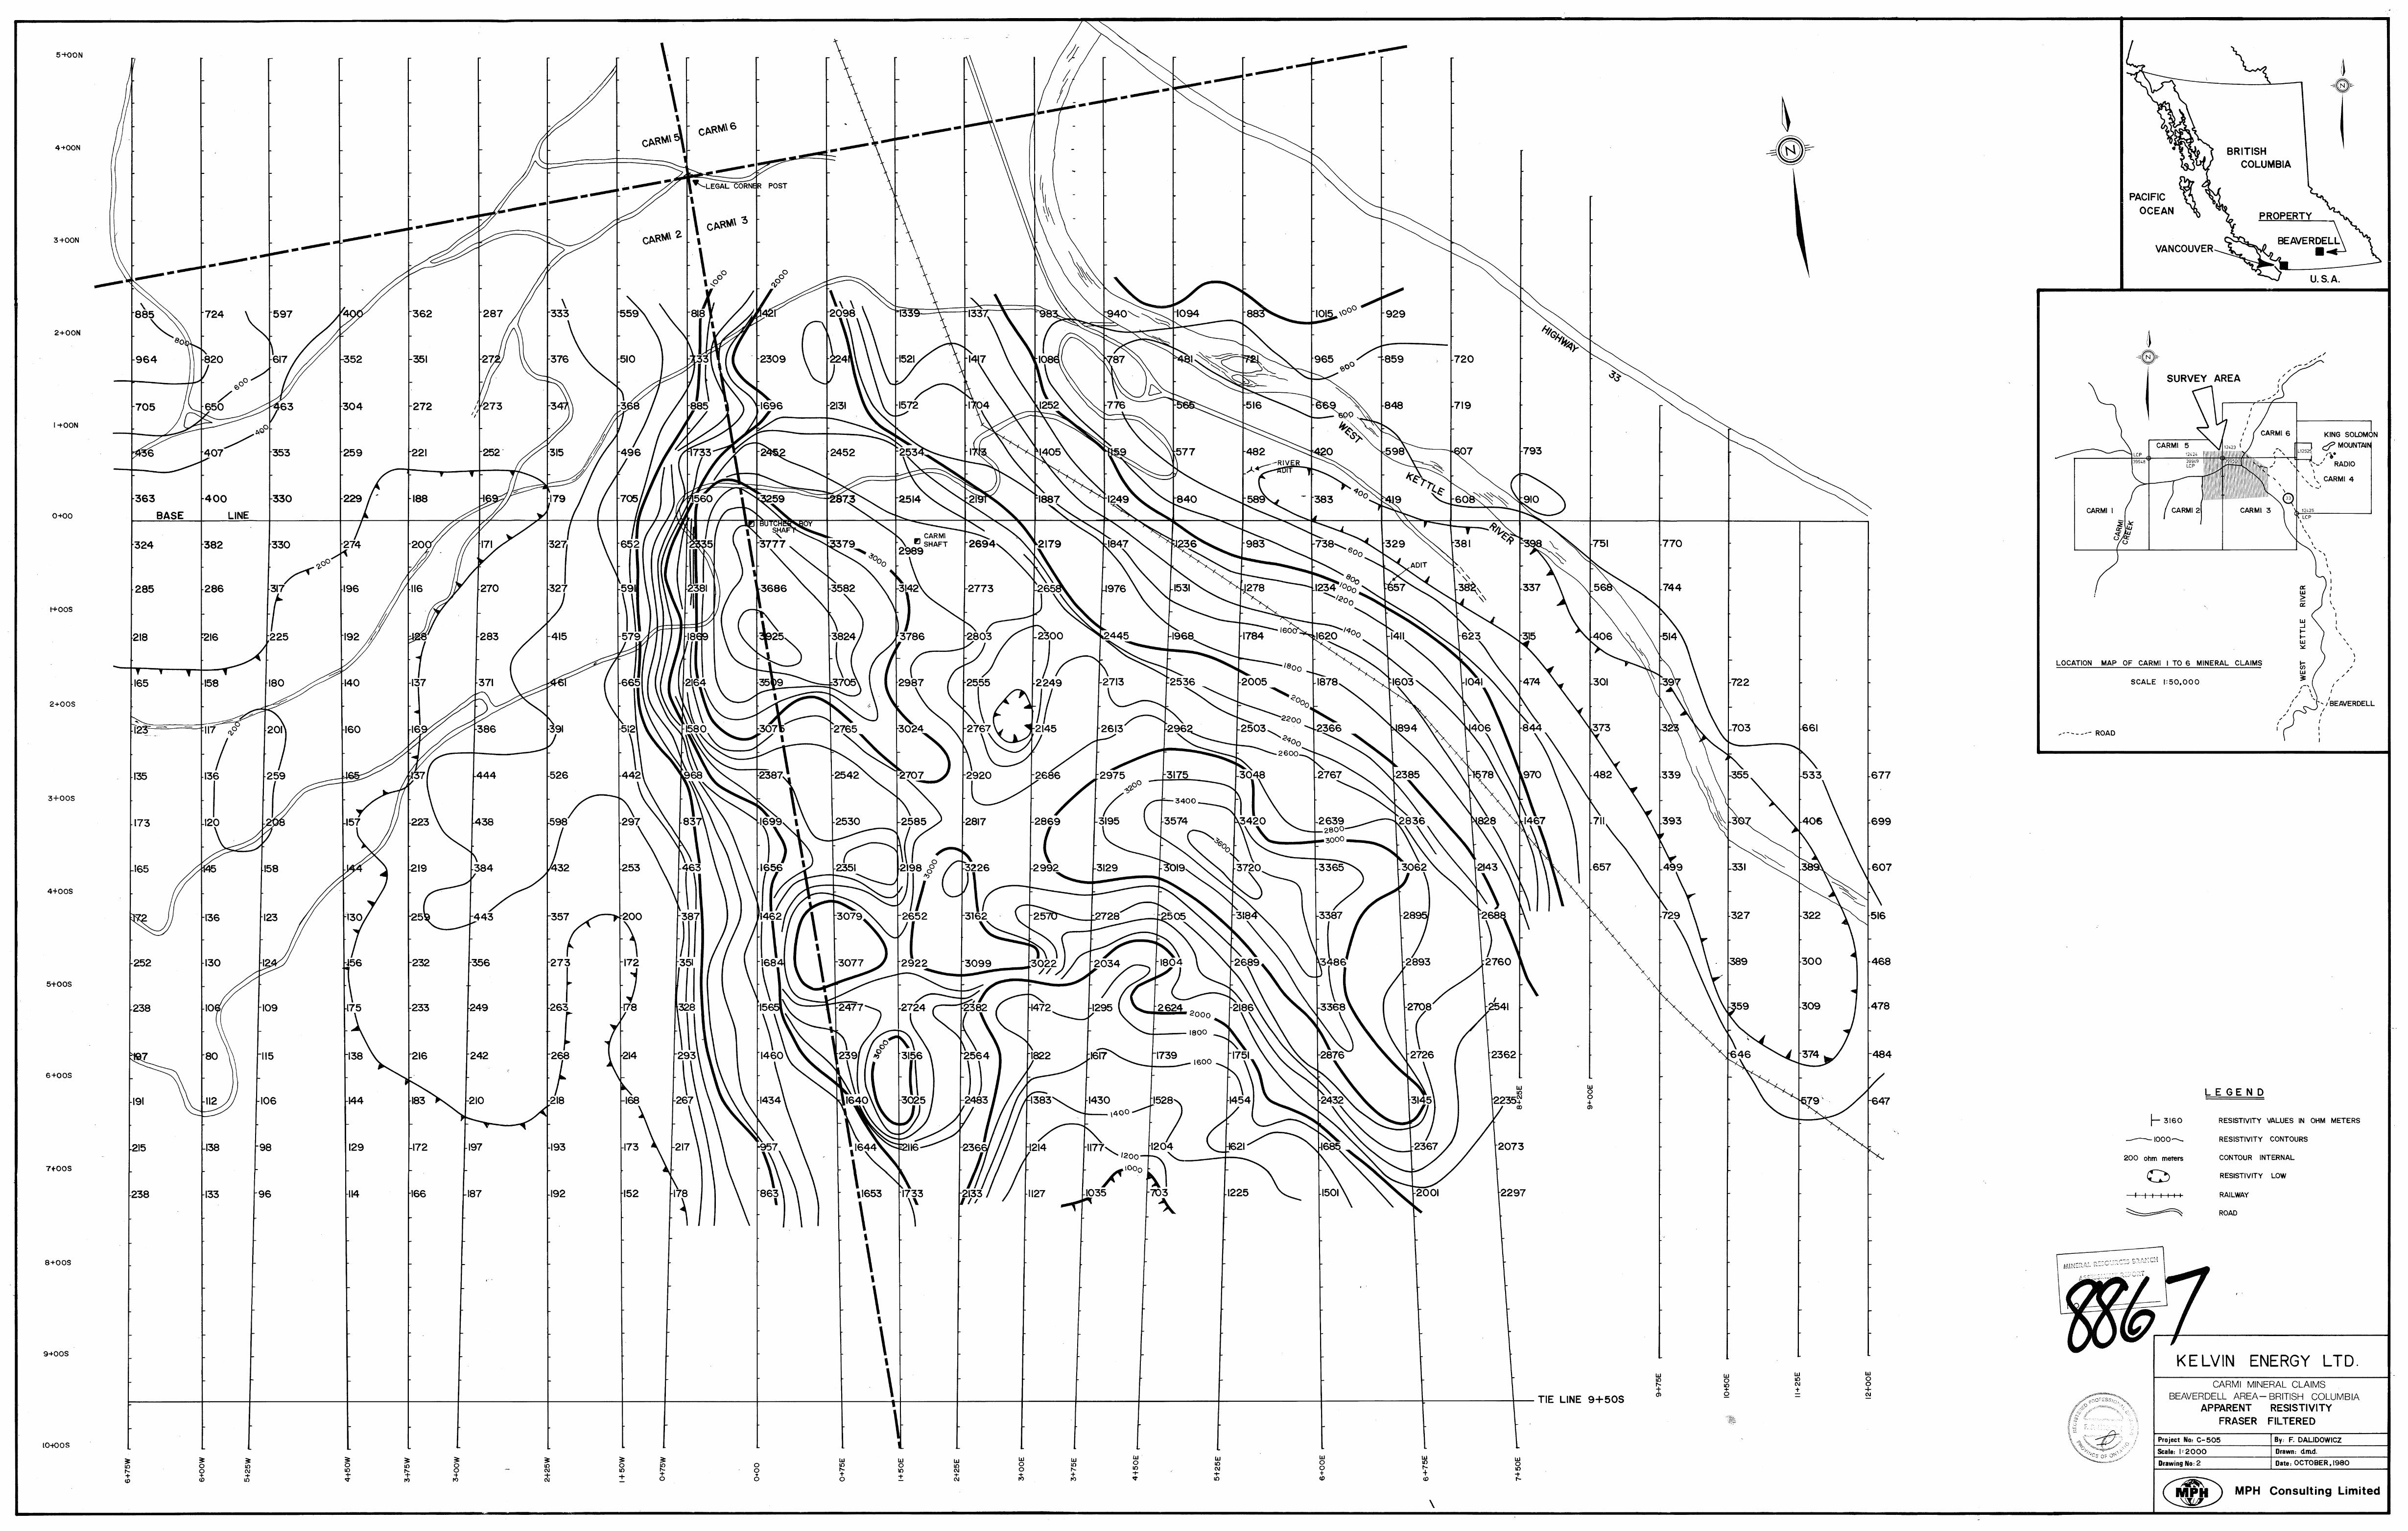
1. Induced Polarization-Fraser Filtered Contour Plan Map
2. Apparent Resistivity-Fraser Filtered Contour Plan Map
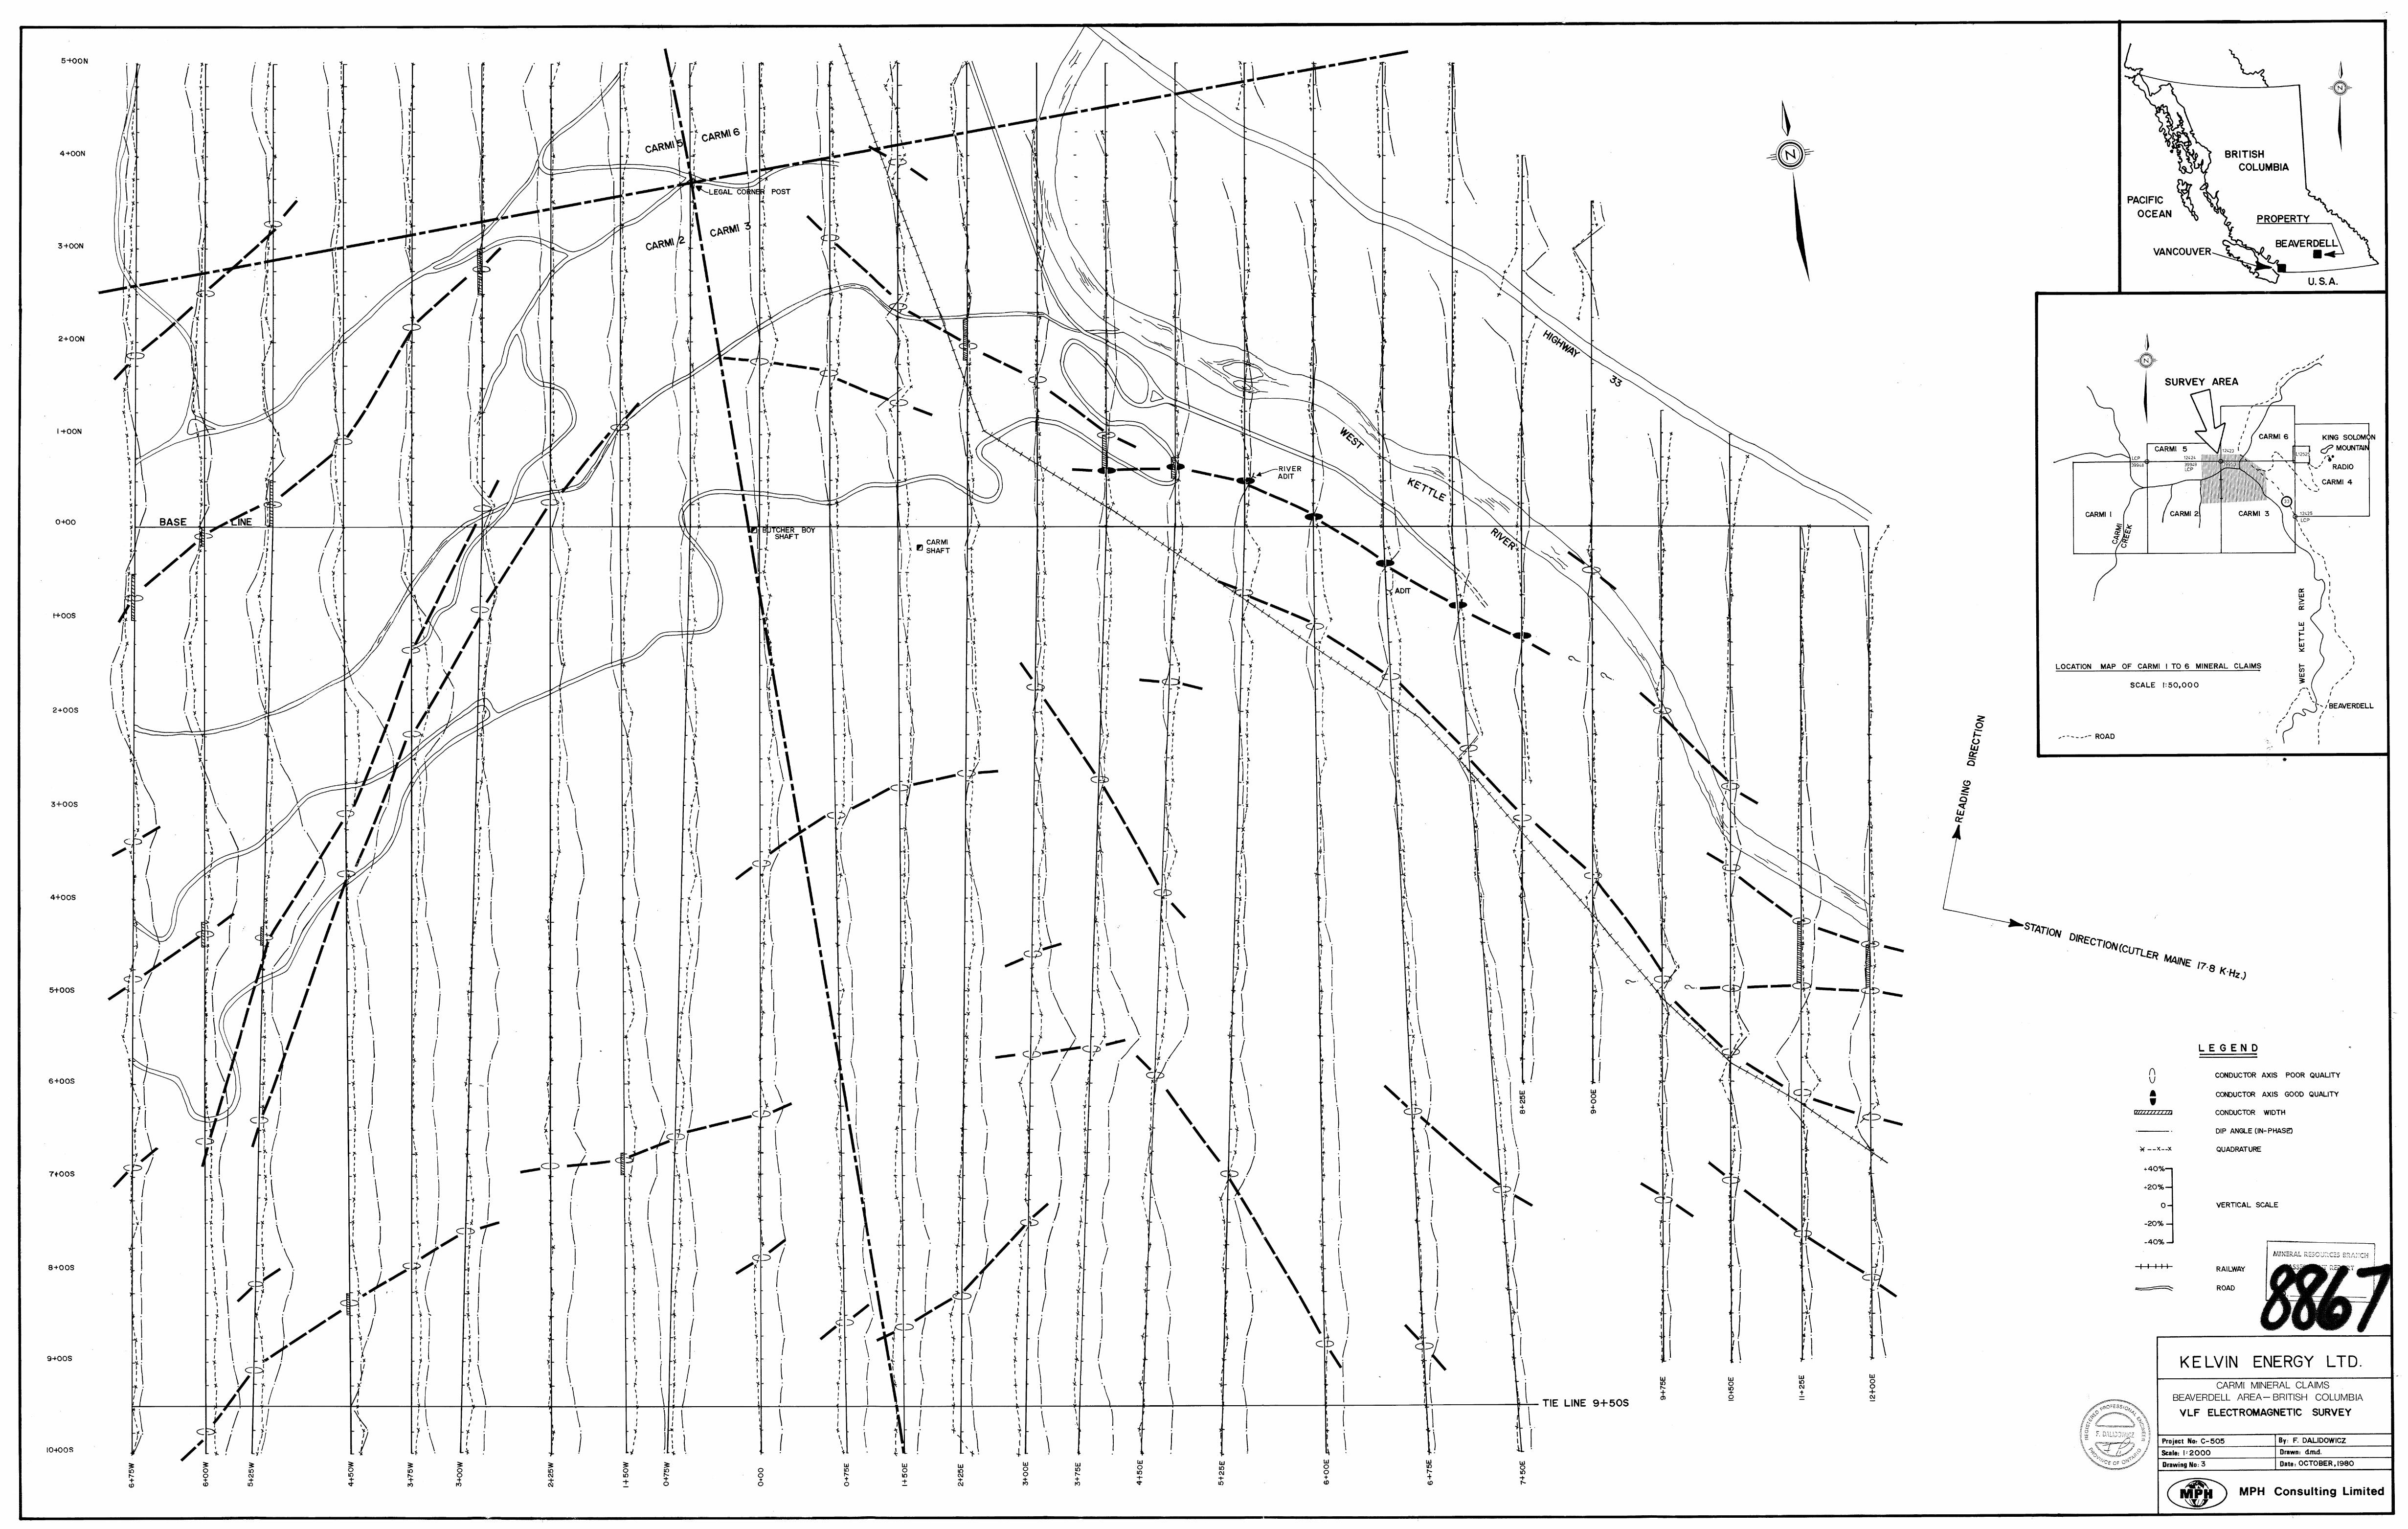
3. VLF Profile Map
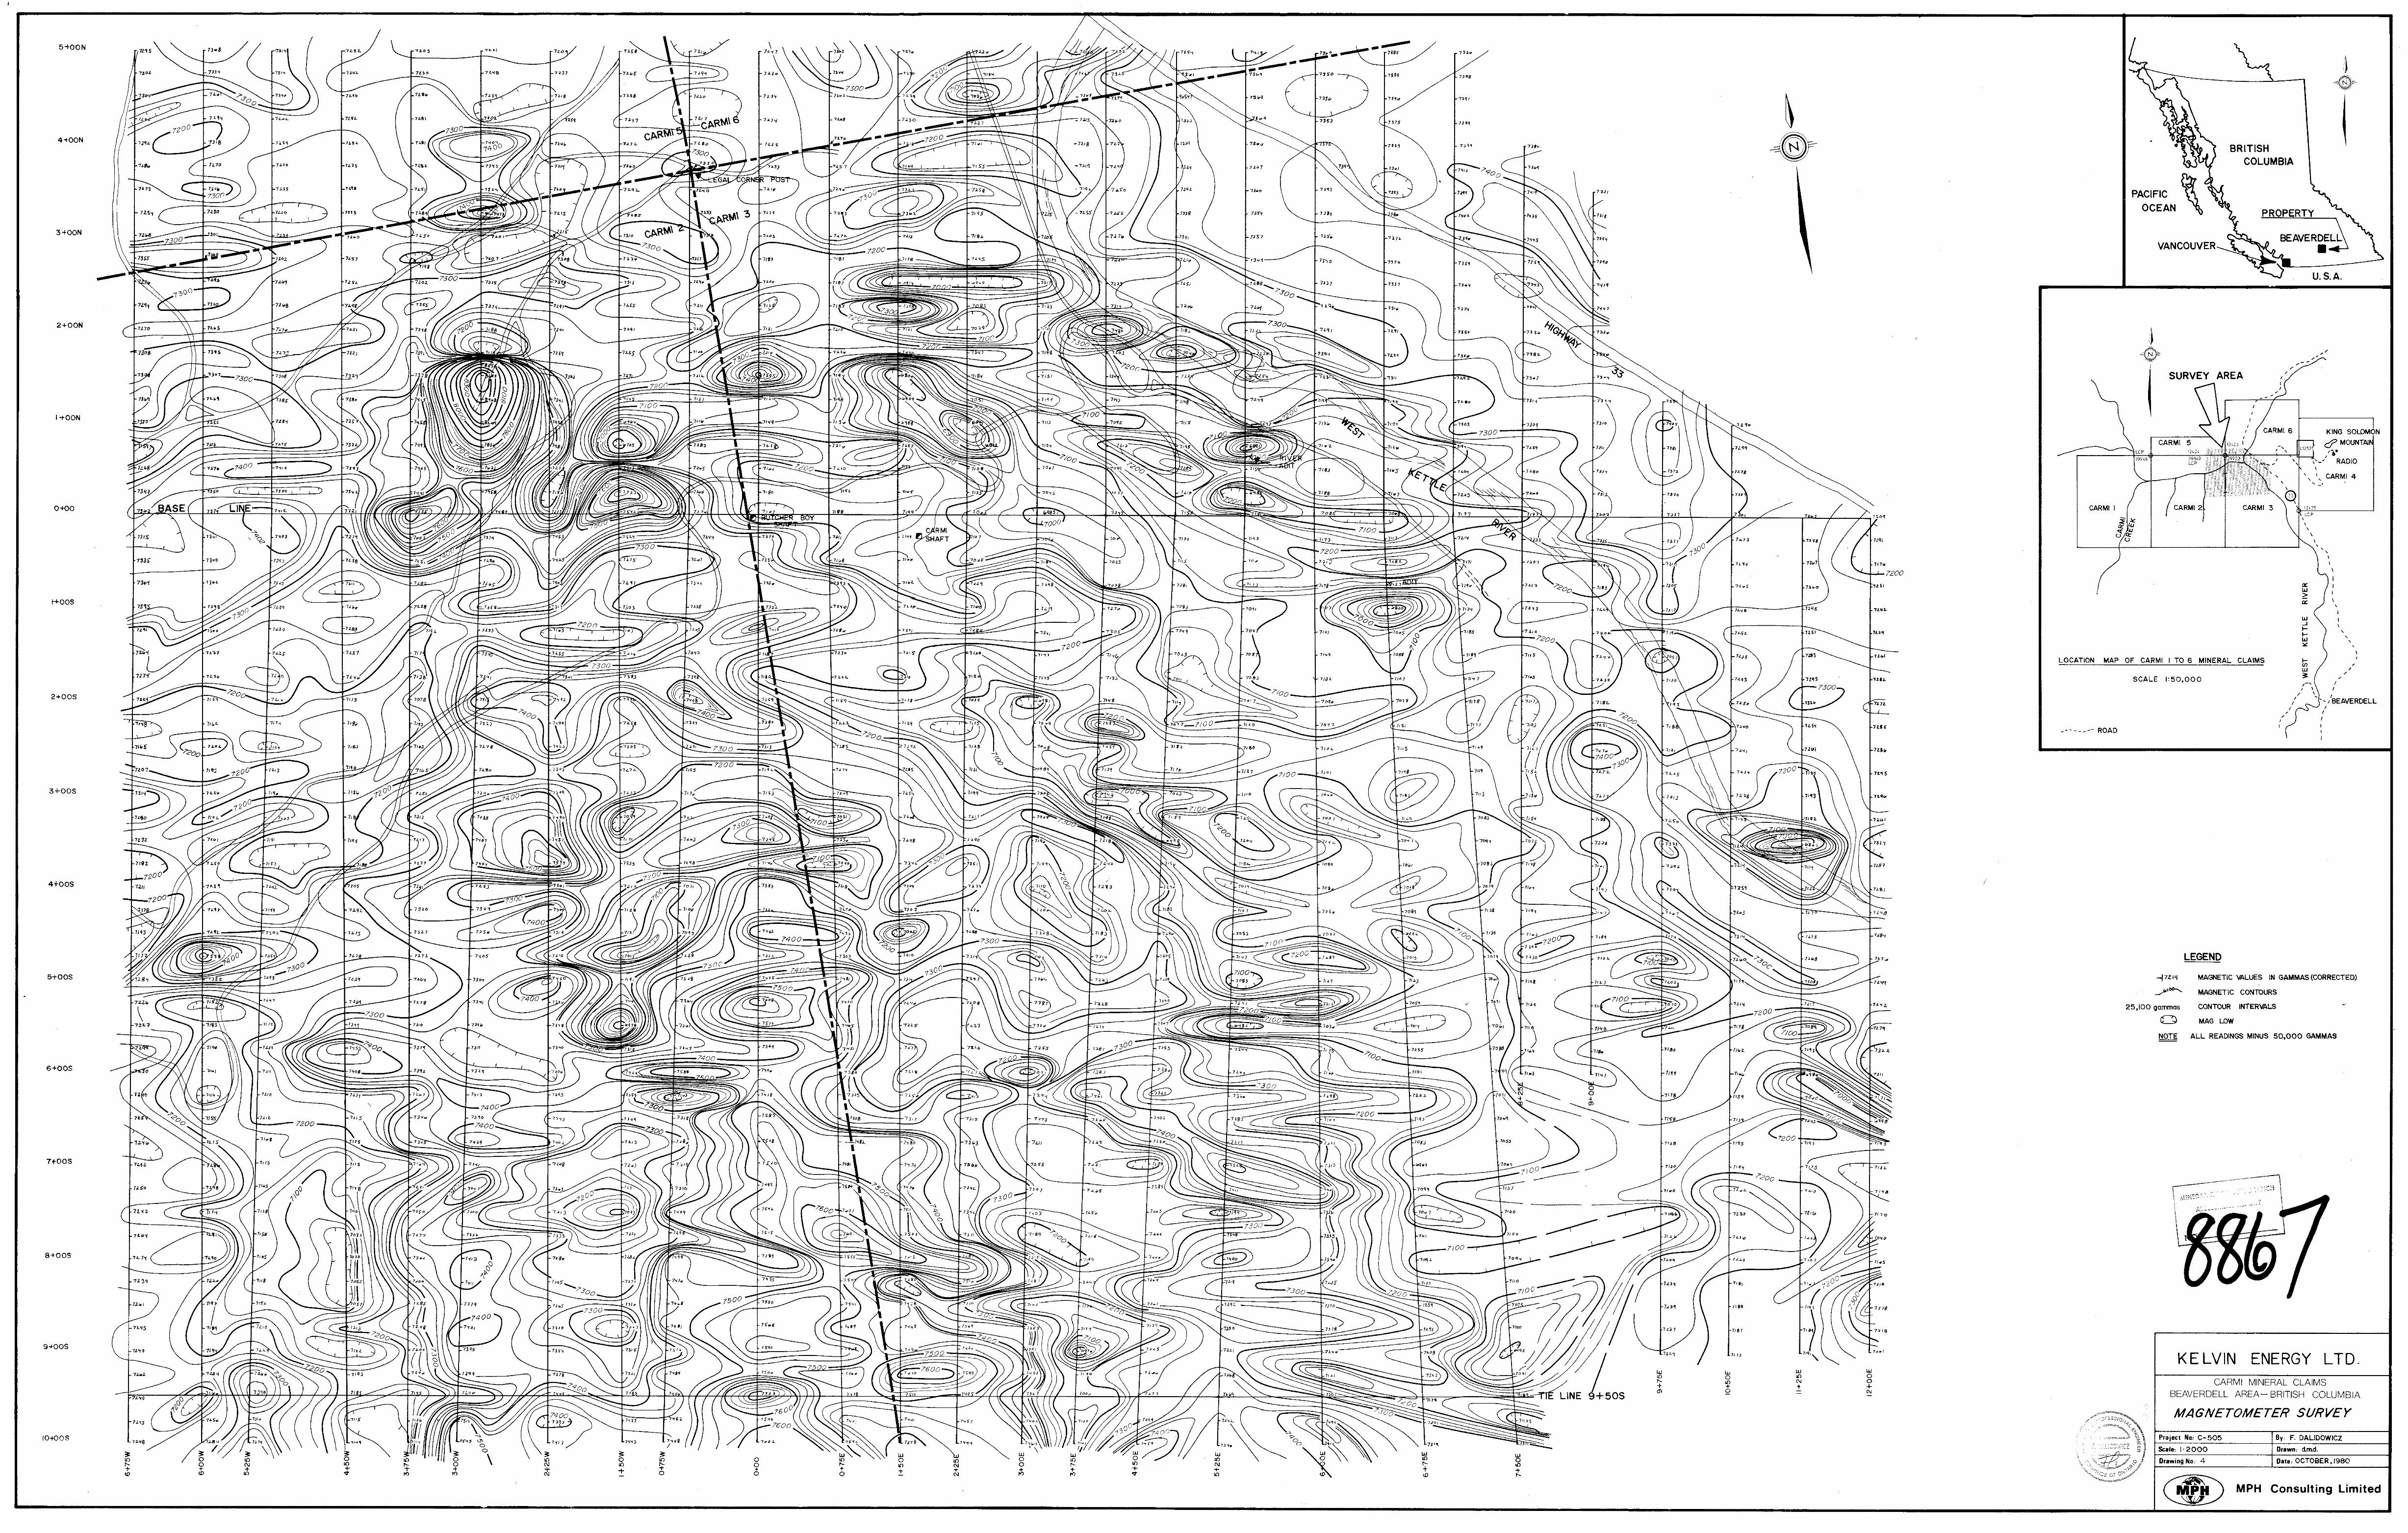
4. Magnetic Contour Map
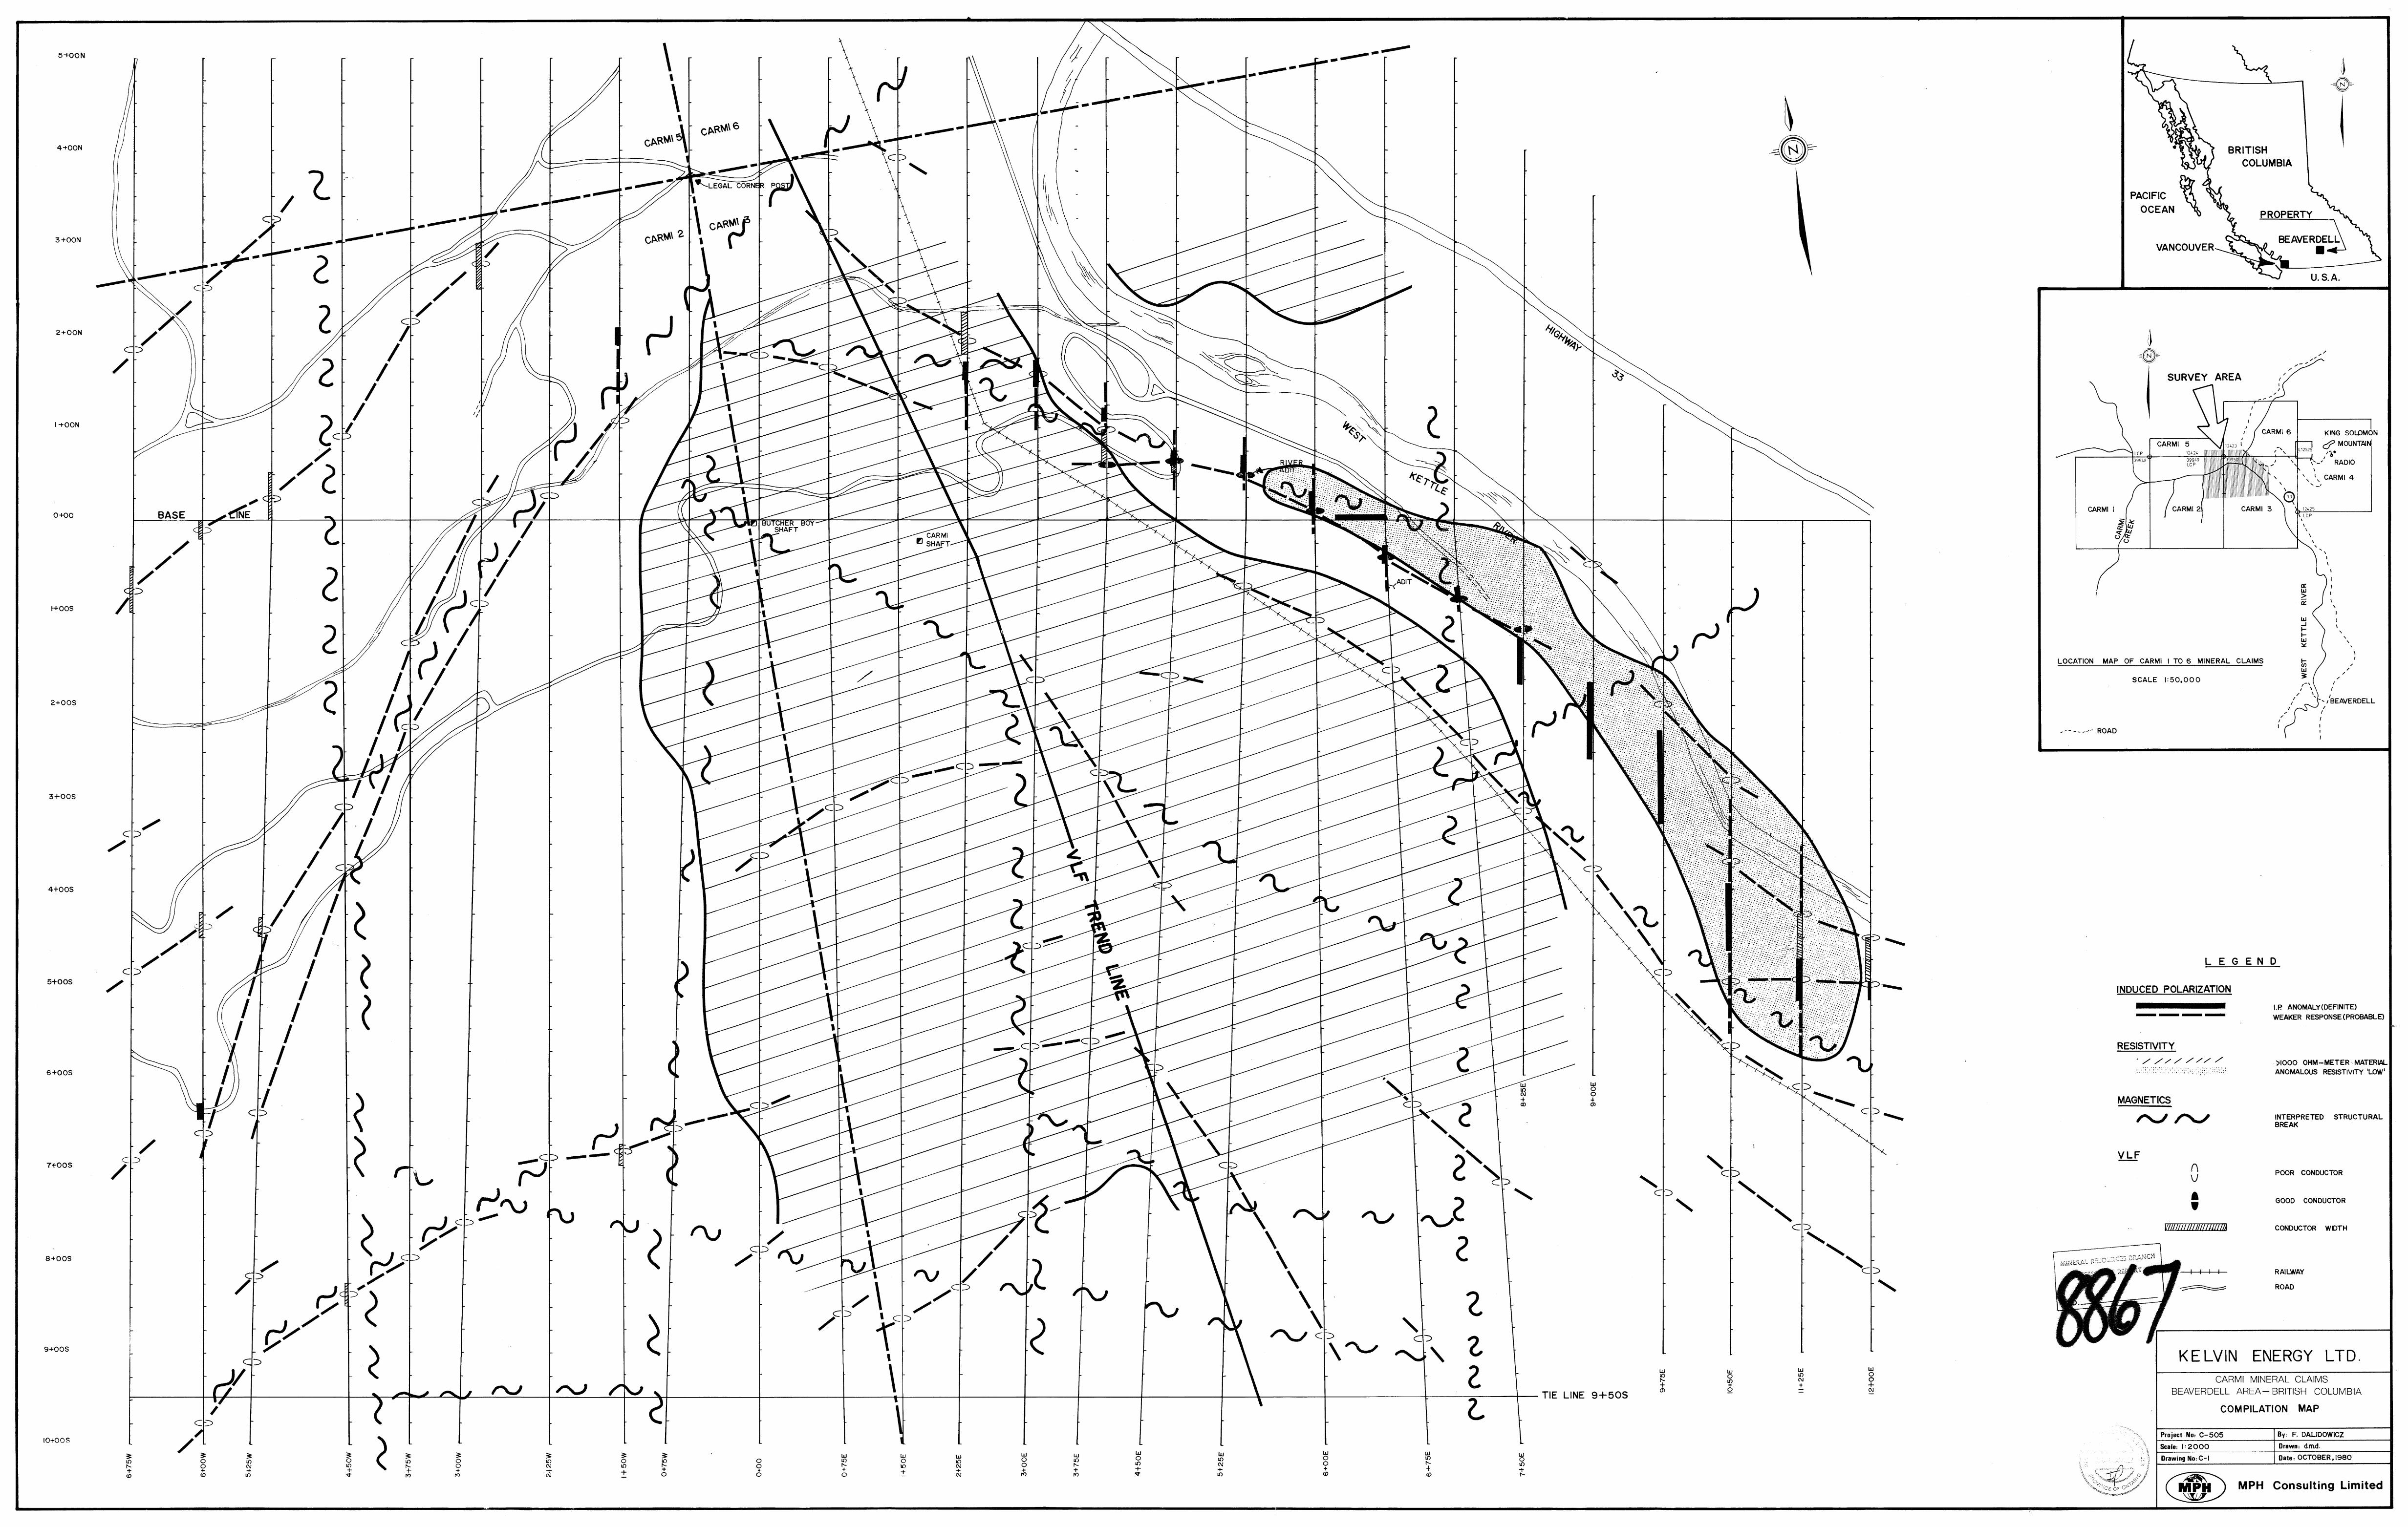
C-I Compilation Map for the four surveys
!
I
1, * i
1. SU+WRY
A programme of linecutting and geophysical surveying con-
sisting of Induced Polarization-resistivity, VLF electro-
magnetic and magnetic surveys was completed on behalf of
Kelvin Energy Ltd. over a portion of their Carmi Mineral
Claims in the Beaverdell area of southern British Columbia.
The surveys were carried out in order to map the subsur-
face distrlbution of sulphides that are known to be pre-
sent within three old gold workings present on the proper-
ty namely, the Butcher Boy Shaft, the Carmi Shaft and the
River Adit.
1 There are no anomalous volumes of sulphide mineralization
in the vicinity of the Butcher Boy and Carmi shafts, con-
sidering the IP results.
A major Induced Polarization-resistivity anomaly which has
a continuous strike length of over 8 0 0 meters was outlin-
ed over the River Adit. The resistivity ' l o w ' suggests
that the IP anomaly may be due to a core of stringer-like
to massive sulphide mineralization surrounded by a halo of
disseminated sulphides.
\
Two other anomalous but only partially defined IP zones
were mapped. One of these may relate to sulphide minera-
lization while the other is interpreted to reflect a local I
2
!
rock type having a higher polarizable background.
There are two dominant VLF conductor trends. A northwest-
southeast trend dominates the eastern sector of the survey
area and is subparallel to IP trends. A northeast-south-
west trend is predominant within the western sector.
The majority of the VLF conductors are relatively weak and
are interpreted to be due to shearin9 or faulting. Two of
the conductors are related to cultural features. One good
quality bedrock VLF conductor correlates directly with the
River Adit IP-resistivity anomaly.
The magnetic pattern is complex. There are three sets of
magnetic trends present, two of which subparallel the VLF
trends. The third magnetic feature trends north-south. One
magnetically-interpreted structural break subparallels the
western portion of the River Adit anomaly.
Three diamond drill holes totalling 290m are recommended in
an initial evaluation of the River Adit geophysical anomaly.
If there is encouragement from the drill proqramme, further
ground geophysics is also recommended.
3
2. INTRODUCTION
During the period from September.3rd to October 14th, 1980,
M P H Consulting Limited completed a programme of linecut-
ting and Induced Polarization-resistivity surveying over a
portion of Kelvin's Carmi Mineral Claims in the Beaverdell
Area of southern British Columbia.
A VLF electromagnetic and a total field magnetic survey were
also completed over the same grid by personnel of Kelvin
Energy Ltd.
The purpose of these surveys was to outline the subsurface 1
J distribution of sulphide mineralization that is known to
be present within the Butcher Boy, Carmi and the River Adit
gold workings.
The field programme was carried out under the direction of
F. Dalidowicz, P.Eng. of M P H Consulting Limited. Overall
supervision was provided by L. Bell, Senior Project Geolo-
gist, Kelvin Energy Ltd.
This report outlines the results of the geophysical surveys
and presents an interpretation of the data. Recommendations
are made for a three hole diamond drill programme and for
further ground geophysical investigations.
4
3. LOCATION AND ACCESS
The survey area is approximately 5.5 kilometers north of
the town of Beaverdell in southern British Columbia
(Figure 1).
Easiest access to the area is by road. Highway 33 crosses
the Carmi #3 and #6 claims. This highway links the city
of Kelowna to the town of Beaverdell and continues south-
ward towards the American border. 1
r 5
FIGURE I
SCALE I: 50,000
i 6
4 . PERSONNEL
The following is a list of individuals with M P H Con-
sulting Limited who were directly involved with the geo-
physical programme:
Geophysicist
Party Chief
F. Dalidowicz, M.Sc.(A), P-Eng. Calgary, Alberta
D. Morrison Toronto, Ontario
Geophysical Helper- W. Keeshig Linecutter
Geophysical Helper- M. Nadjiwan Linecutter
4 Geophysical Helper P. O'Donnell
L, Bell, B.Sc. of Kelvin Energy Ltd. was present during
the programme and assisted in the field geophysical sur-
veying. A. Bell acted as cook.
M. Archambault, B.Sc. of Kelvin Energy Ltd. carried out
the magnetic survey.
i
7
5. GEOPHYSICAL GRID
The survev grid was designed to cover three old gold work-
ings, the Butcher Boy, Carmi and the River Adit. These
three showings occur along a linear trend. A baseline
was established at an azimuth of looo in order to subparal-
lel this trend. The O+OO position on the baseline is loca-
ted over the Butcher Boy workings. A total of 3 4 . 8 kilo-
meters of crosslines was cut and chained with the cross-
lines established at 75 meter intervals. Survey stations
were picketed at 25 meter intervals. One tie-line was
I cut at 9+50S,
8
6. INSTRUMENTATION
6.1 Induced Polarization Equipment
A McPhar P660 variable frequency Induced Polarization
system was employed for the IP survey.
The transmitter is powered by a motor generator rated
at 2.5 kw and can transmit alternating currents rang-
ing in frequencies from 0.125 Hz to 5 Hz. Frequency
pairs can be selected by the operator to minimize in-
ductive coupling effects which are a function of local
ground resistivities and of the type of electrode array
used. !
The receiver is a solid state unit that has a built-in
2 mega-ohm impedence and has a detectable voltage
range between 100 microvolts and 10 volts.
The specifications for the Induced Polarization unit
are given in Appendix I.
6.2 VLF Electromaffnetic Unit
A Geonics ME-16 VLF Electromagnetic Unit was used for
the VLF surveying. Technical specifications for this
instrument are presented in Appendix 11.
9
This receiver employs fixed military transmitter sta-
tions used for submarine communications as the source
of the primary signal. The frequencies generated by
these stations vary from 15 kHz to 23 kHz.
The presence of a subsurface conductor is indicated
by a distortion of the transmitted plane wave due to
secondary EM fields generated by the conductor. The
conductor axis is indicated by a characteristic
'cross-over' or inflection in the dip angle measure-
ment recorded by the VLF receiver.
6.3 Magnetometer
1 A proton precession Geometrics G-816 magnetometer was
used for the magnetic survey. This system utilizes
the precession of spinning protons within.a hydrocar-
bon fluid. These spinning magnetic dipoles are polari-
zed by applying a magnetic field created by a current
within a coil of wire inside the instrument. When the
current is discontinued, the protons precess about the
earth's magnetic field. The absolute value of the
earth's total field can then be read directly in gammas.
The specifications for the G-816 total field magneto-
meter are presented in Appendix 111.
- ~~~
7. SURVEY PROCEDURES AND DATA REDUCTION
7.1
!
Induced Polarization-Resistivity Survey
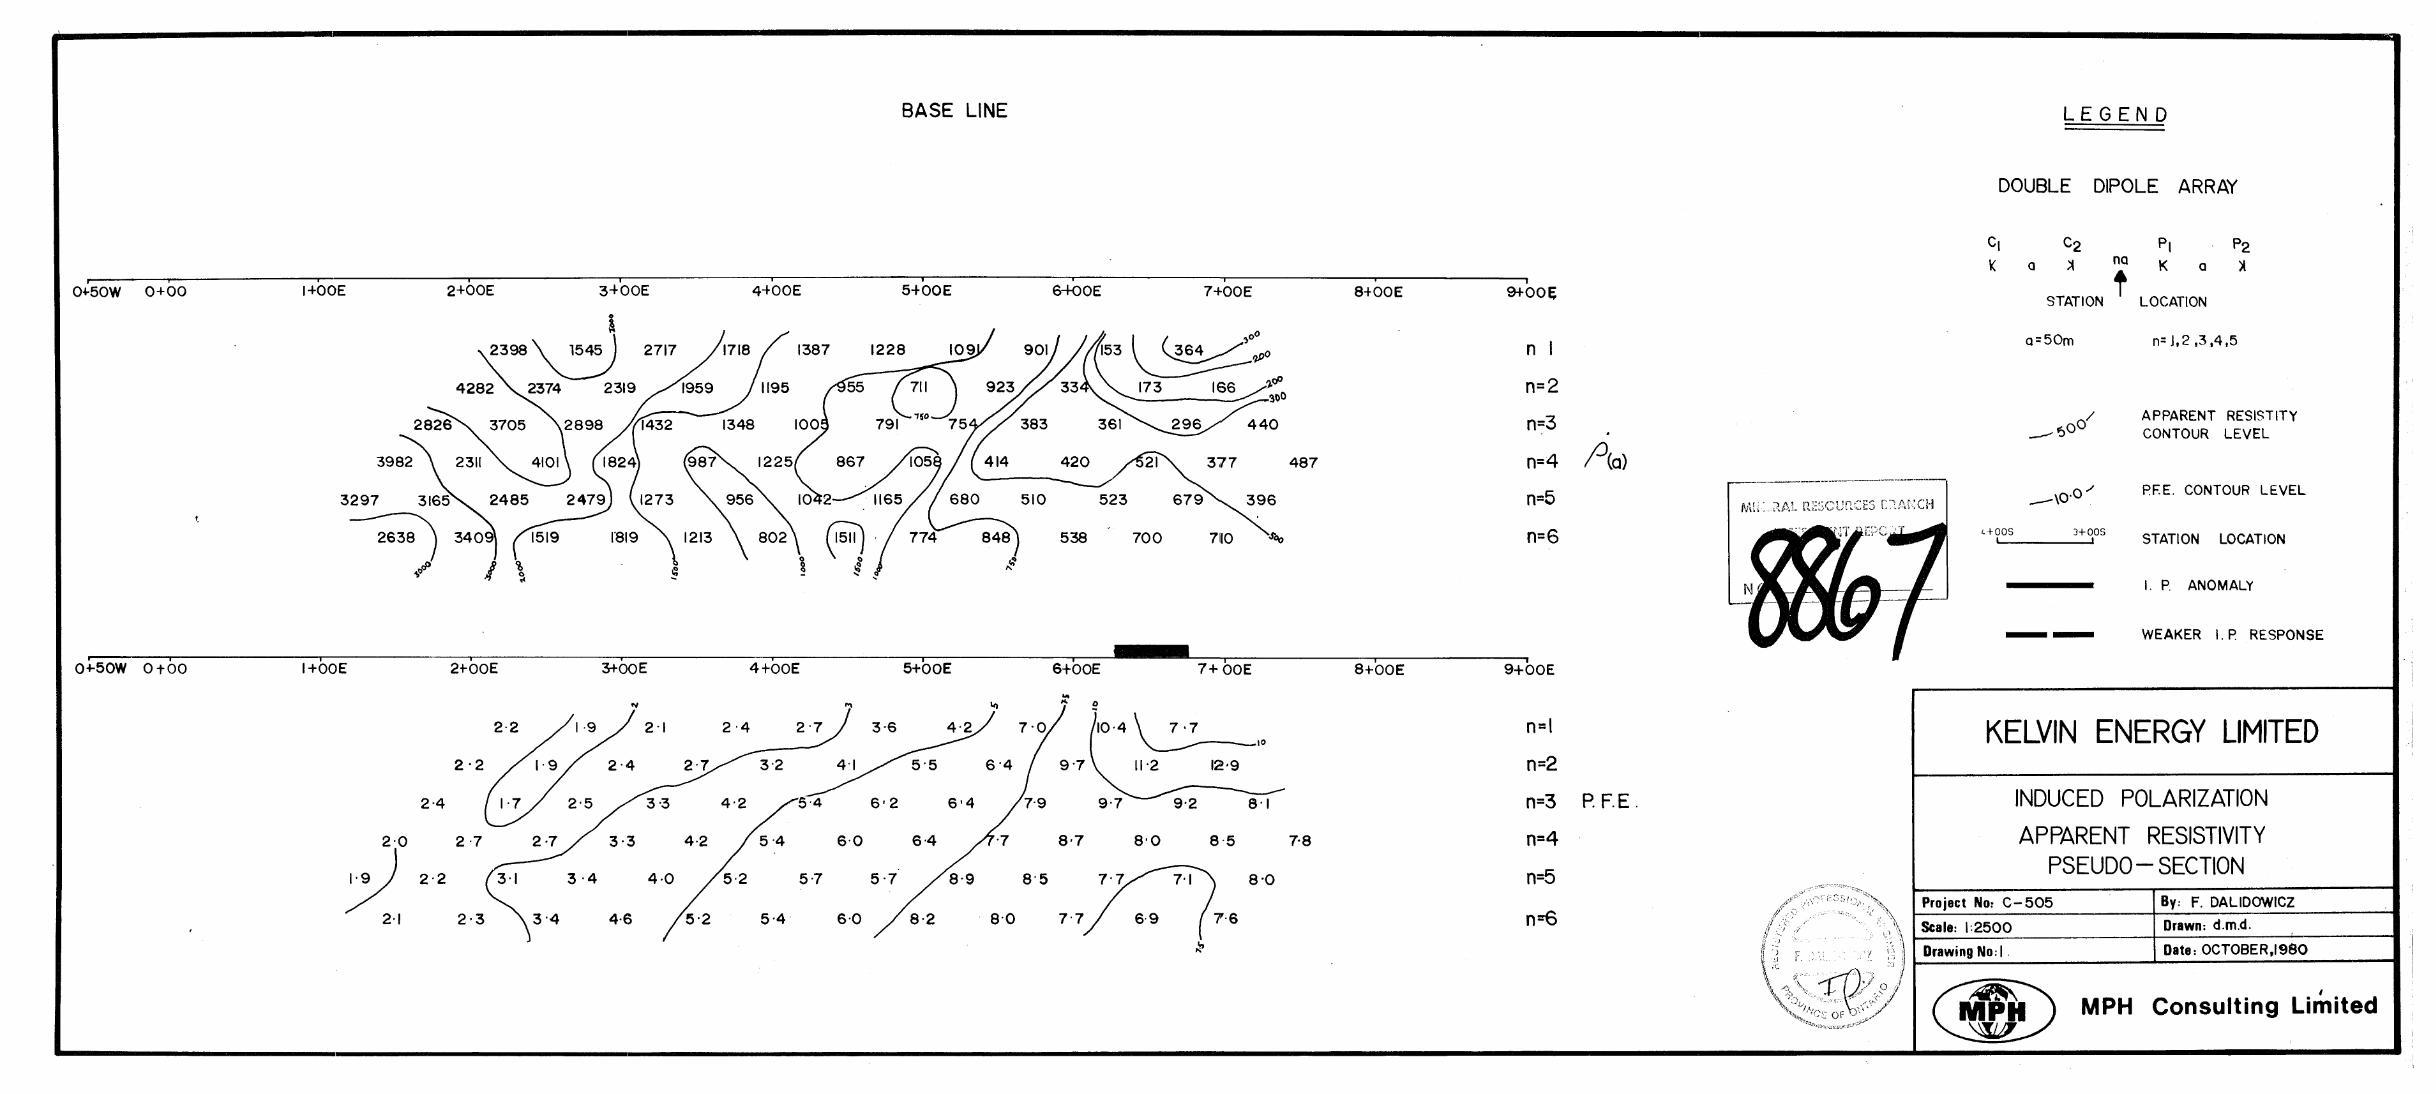
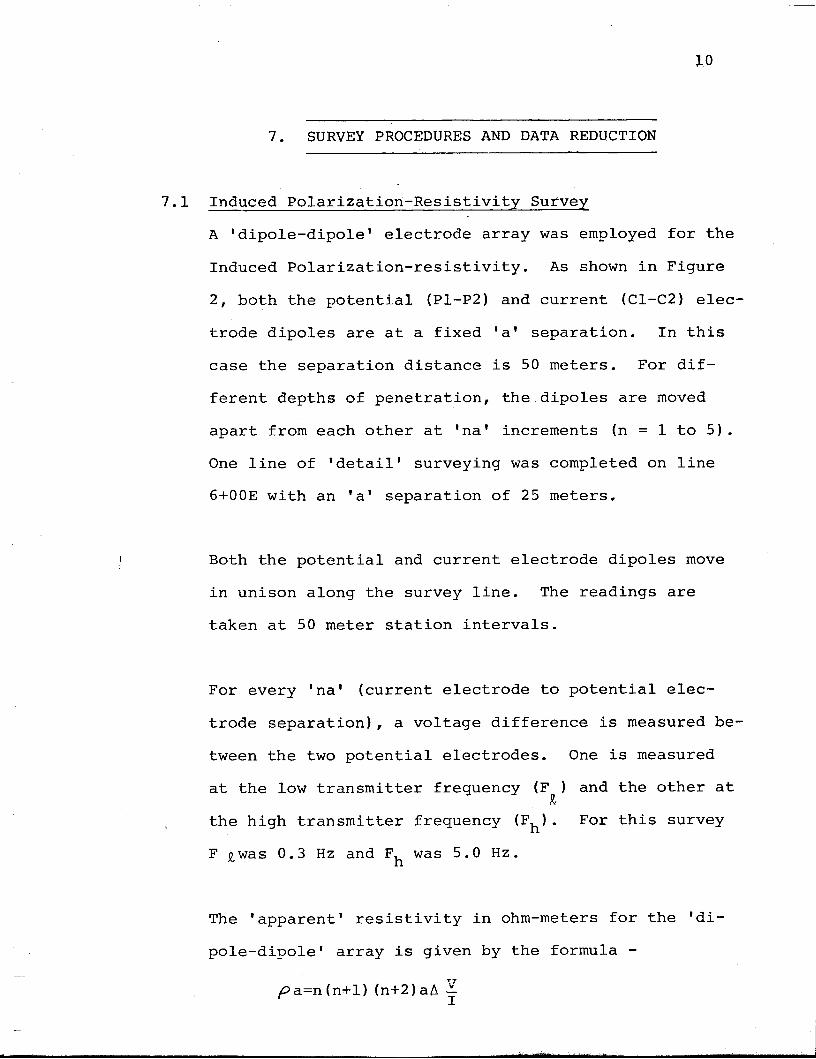
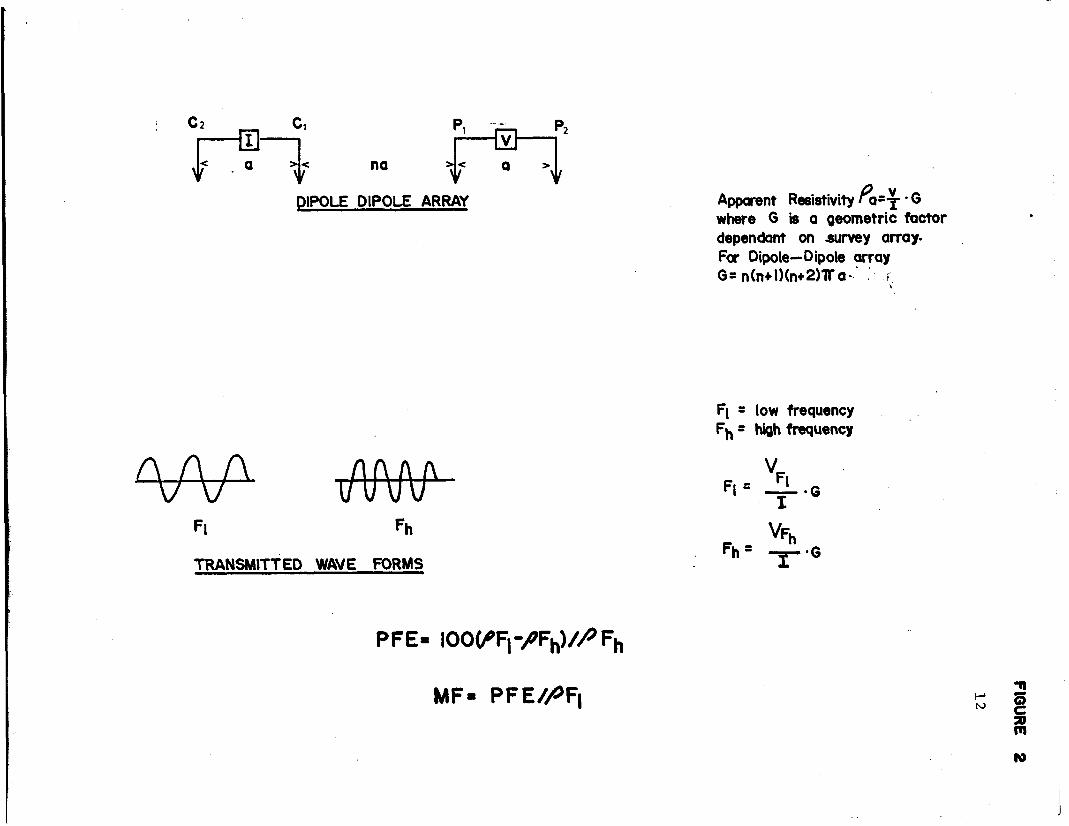
A 'dipole-dipole' electrode array was employed for the
Induced Polarization-resistivity. As shown in Figure
2, both the potential (Pl-P2) and current ( C l - C 2 ) elec-
trode dipoles are at a fixed 'a' separation. In this
case the separation distance is 50 meters. For dif-
ferent depths of penetration, the dipoles are moved
apart from each other at 'na' increments (n = 1 to 5).
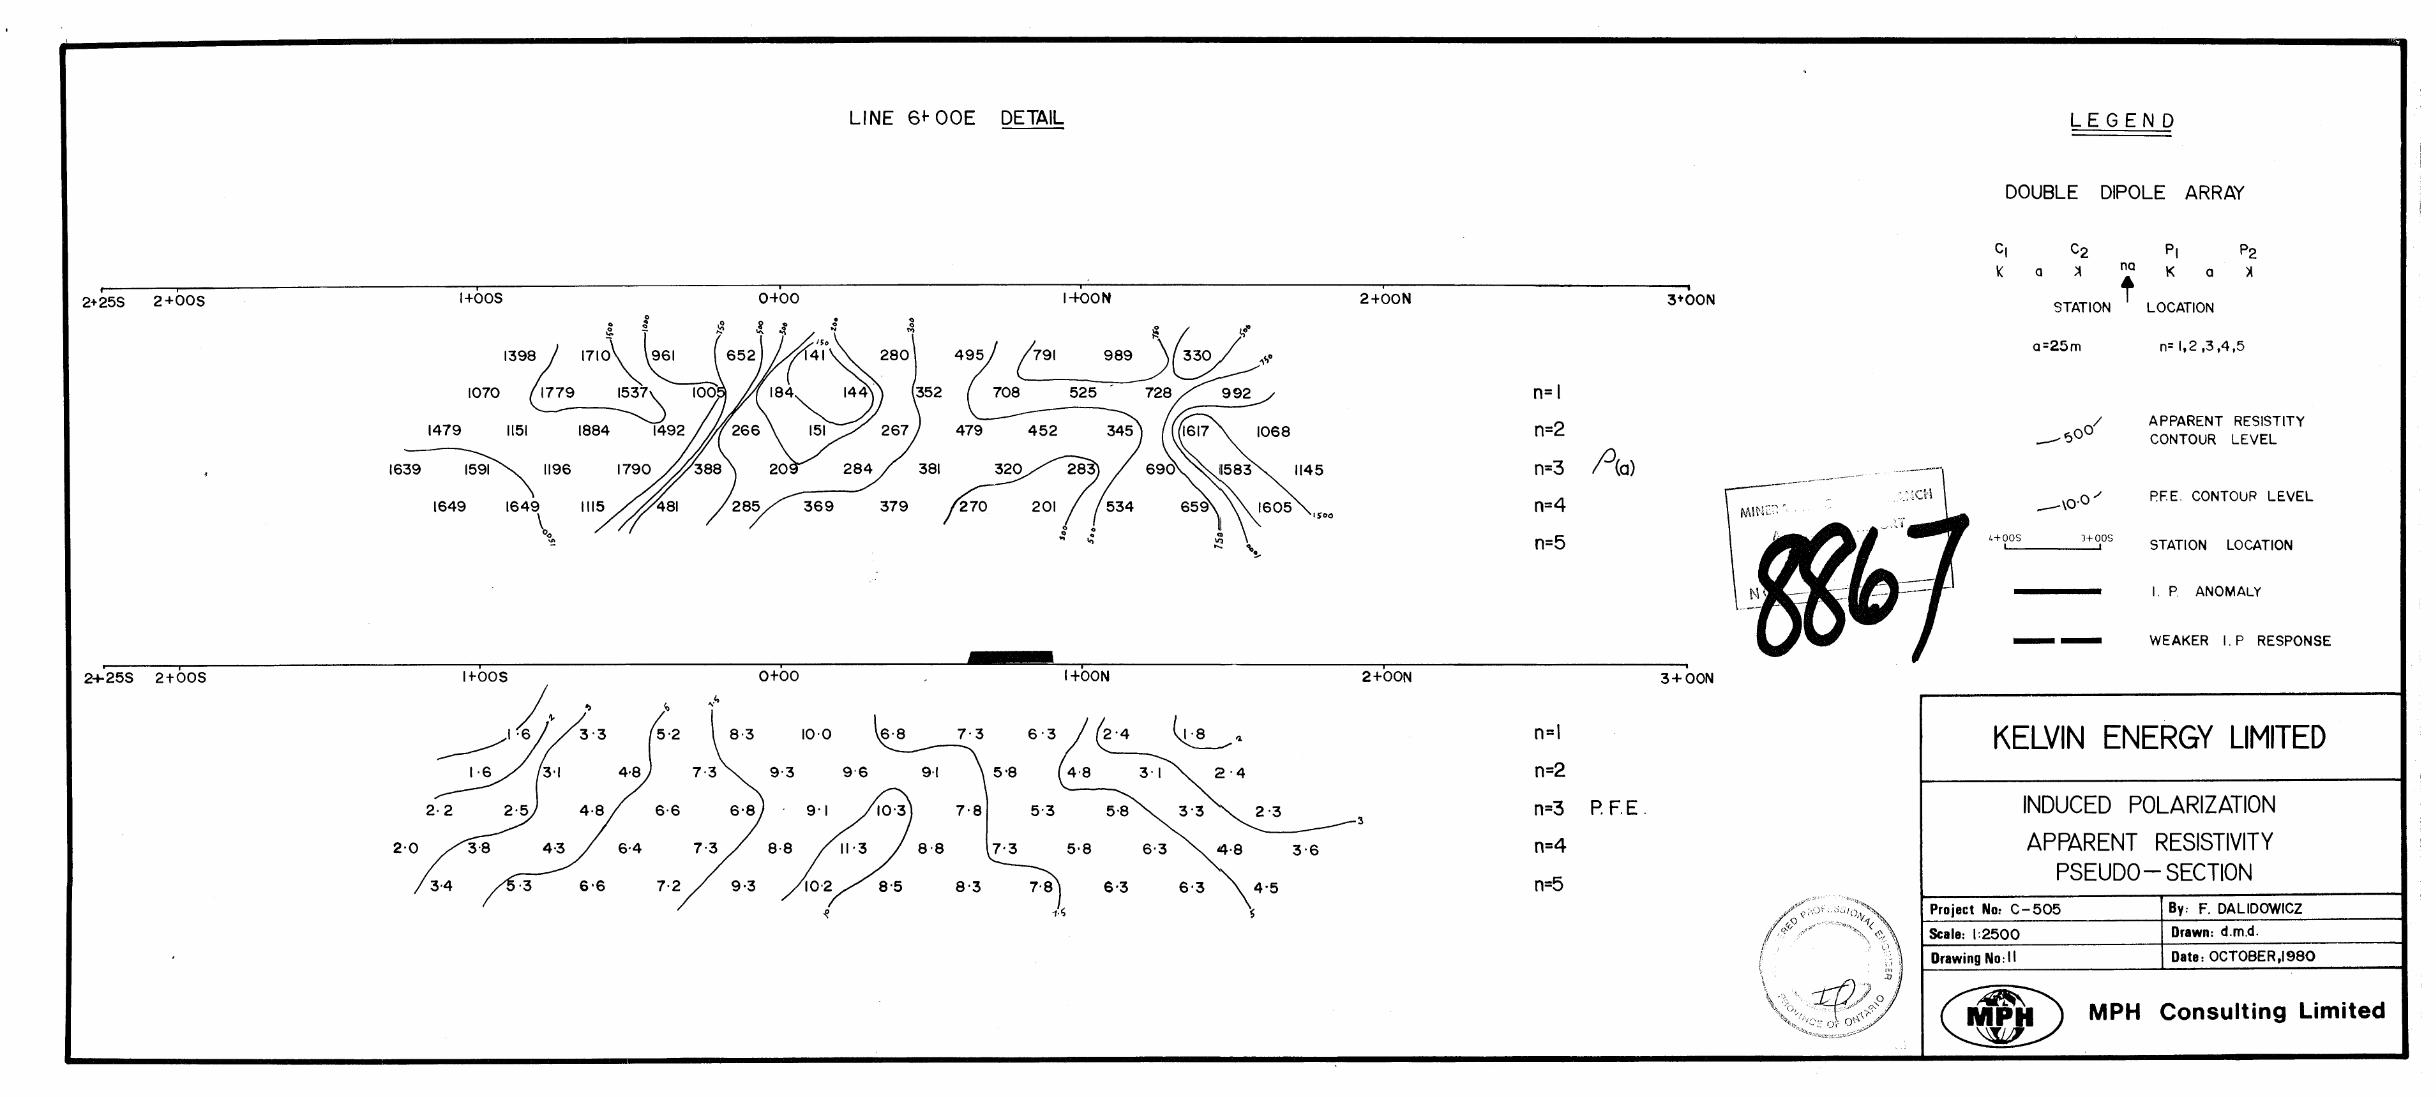
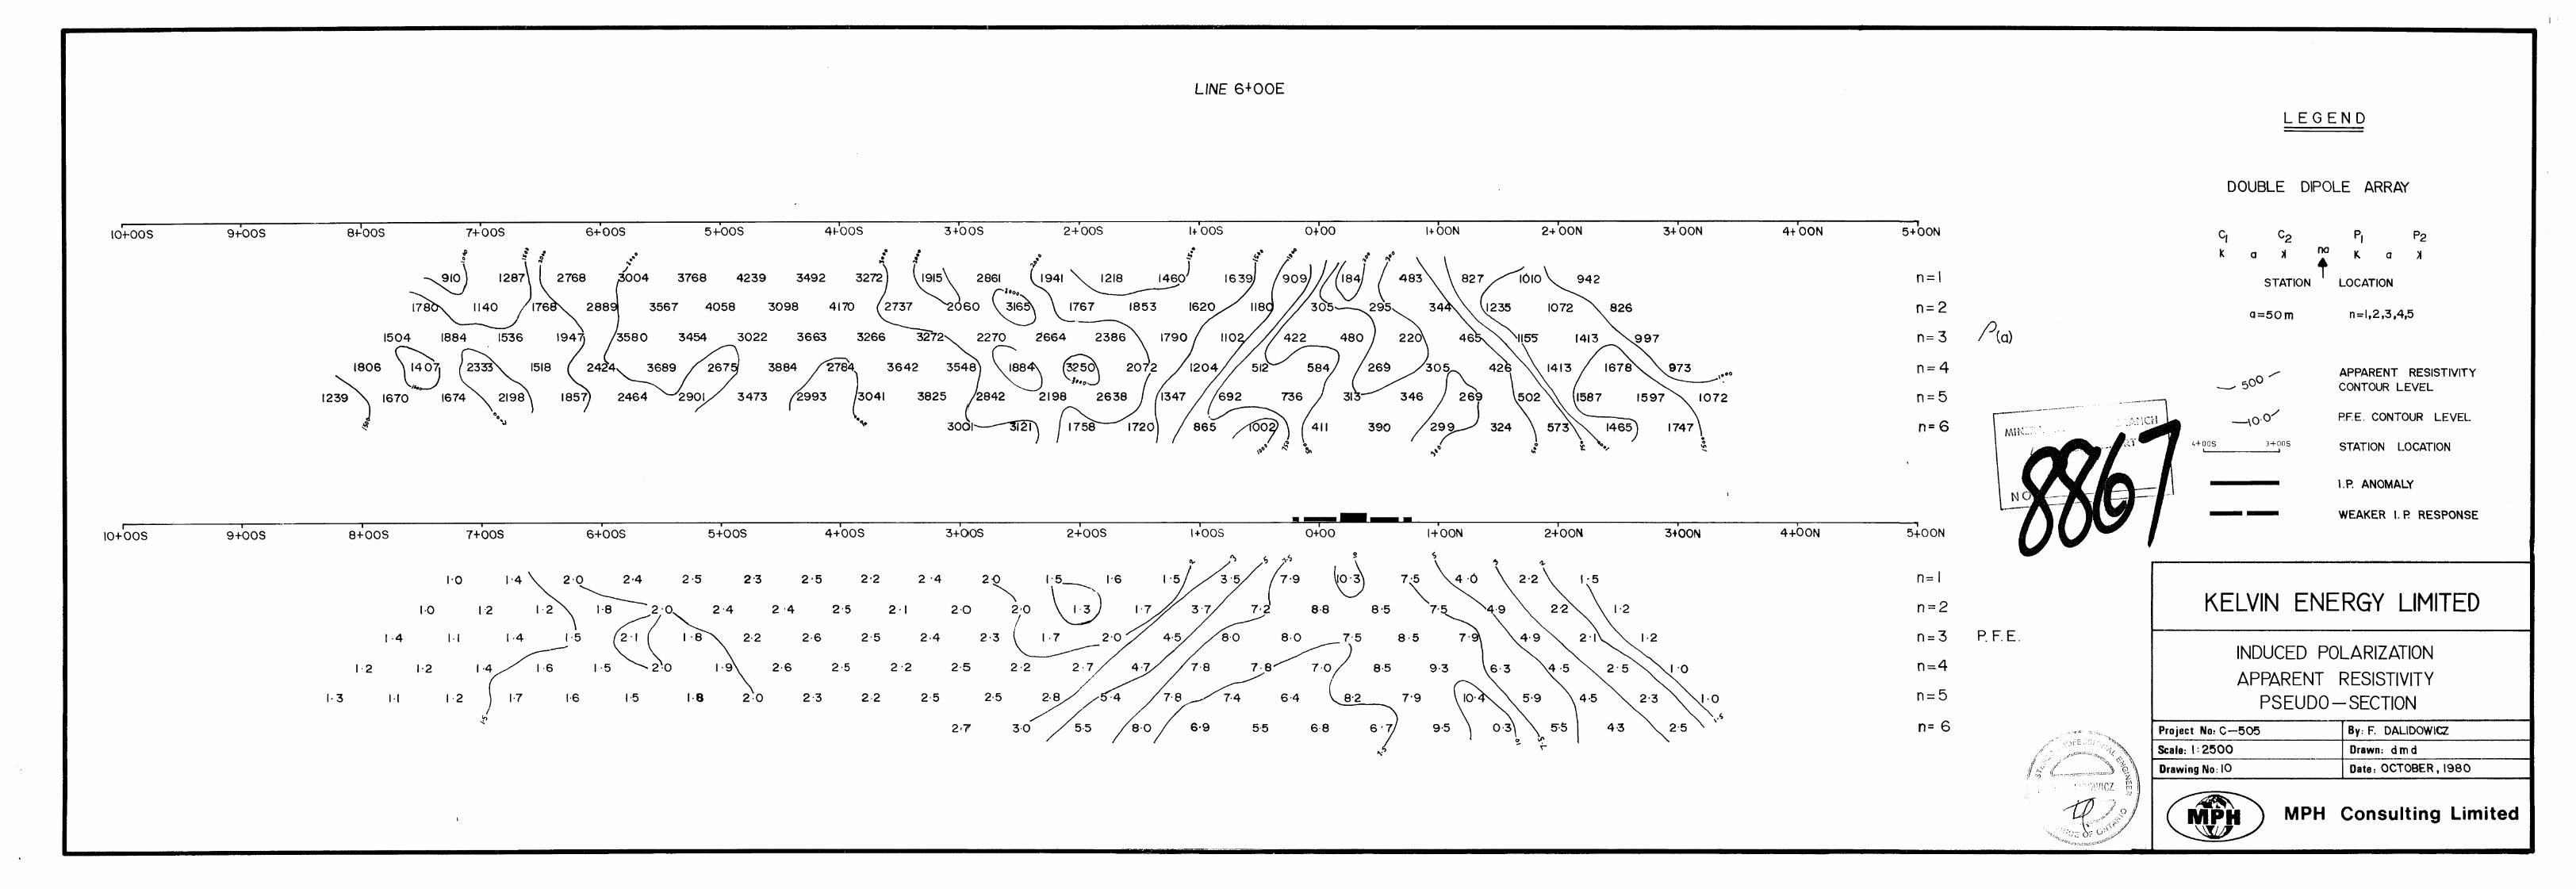
One line of 'detail' surveying was completed on line
6+00E with an 'a' separation of 25 meters.
Both the potential and current electrode dipoles move
in unison along the survey line. The readings are
taken at 50 meter station intervals.
For every 'na' (current electrode to potential elec-
trode separation), a voltage difference is measured be-
tween the two potential electrodes. One is measured
at the low transmitter frequency (F ) and the other at R the high transmitter frequency (Fh).
F Qwas 0.3 Hz and Fh was 5.0 Hz.
For this survey
The 'apparent' resistivity in ohm-meters for the 'di-
pole-dipole' array is given by the formula -
where AV is the potential difference between the(Pl-P2)
electrodes and I is the transmitted current at the
C1-C2 electrodes.
For a constant transmitting current, the voltage be-
tween the potential electrodes and hence the 'apparent'
resistivity increases as the frequency decreases.
!
> < rn 3 c2
no
PIPOLE DIPOLE ARRAY
FI fh
TRANSMITTED WAVE FORMS
MF= PFE//~FI
Apparent Resistivity P v a - ' 7 * G where G is a geometric factor dependant on sutvey array Fa Dipole-Dipole array . . G = n(n+ l)(n+2)T a - i
i
n
13
8. PRESENTATION OF RESULTS
?
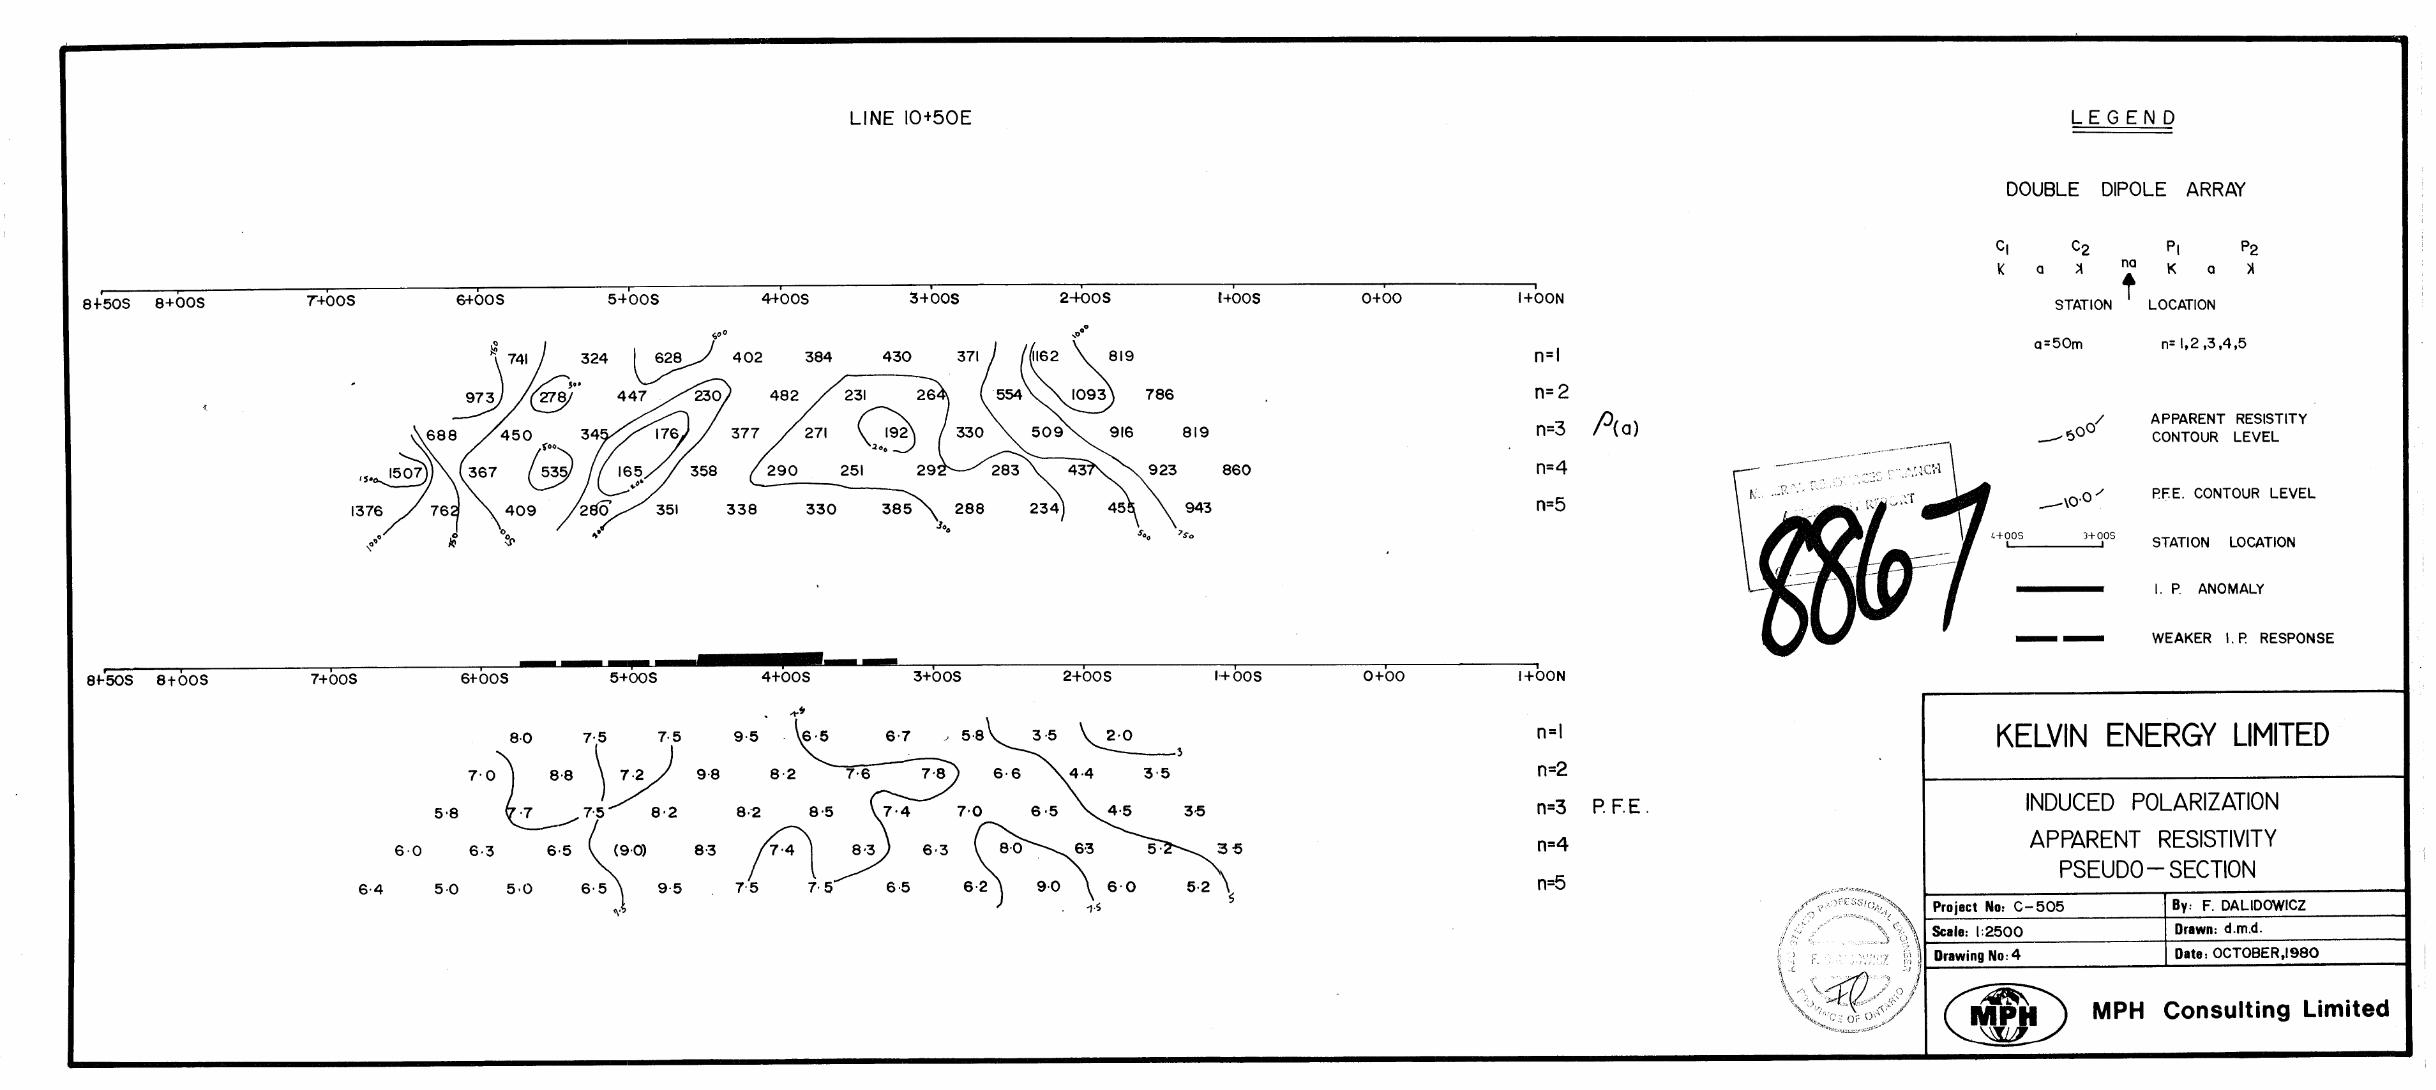
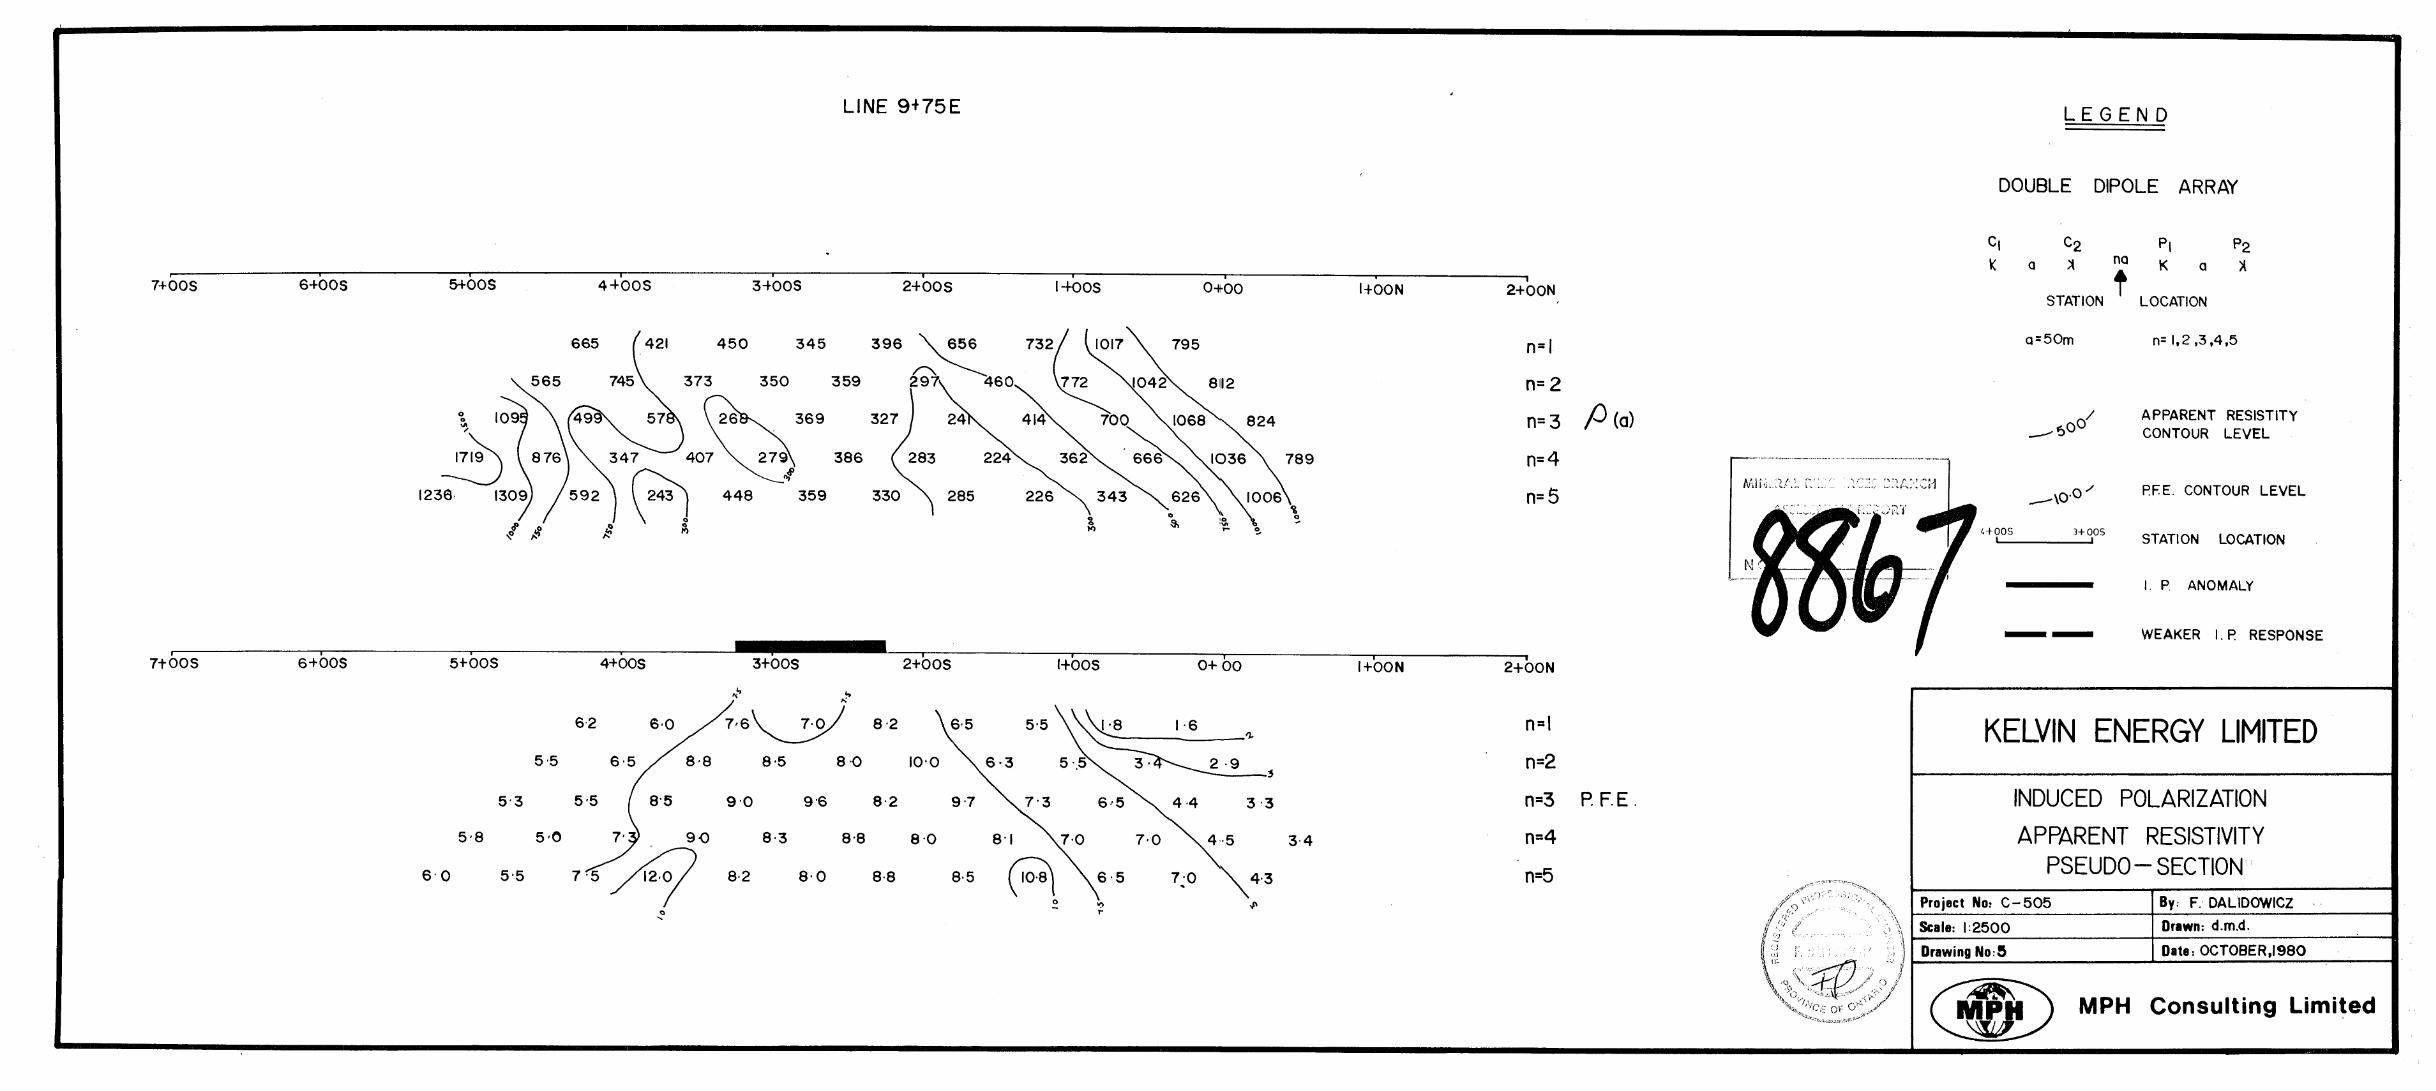
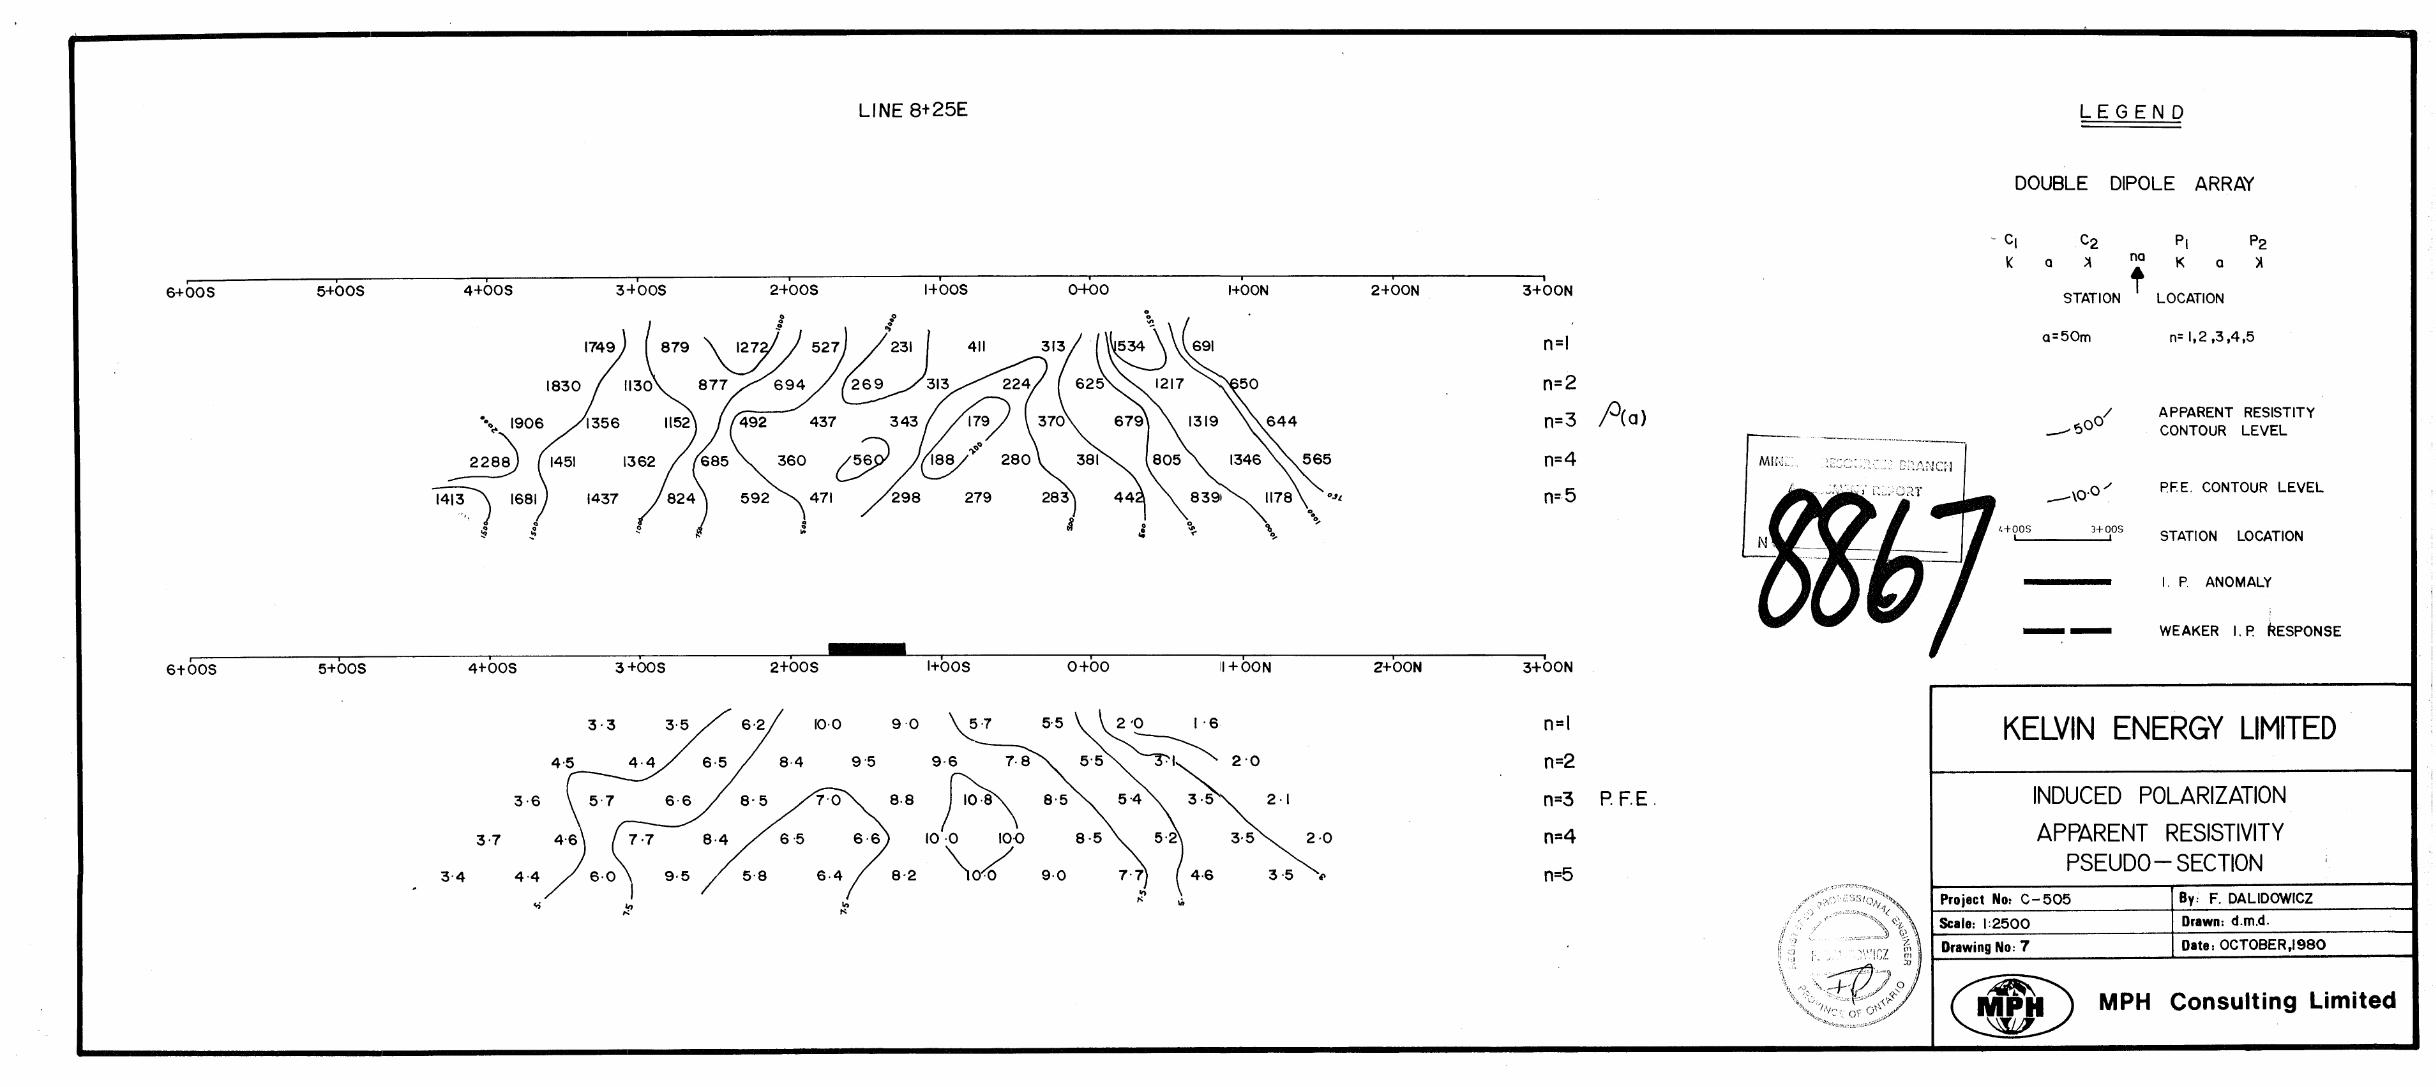
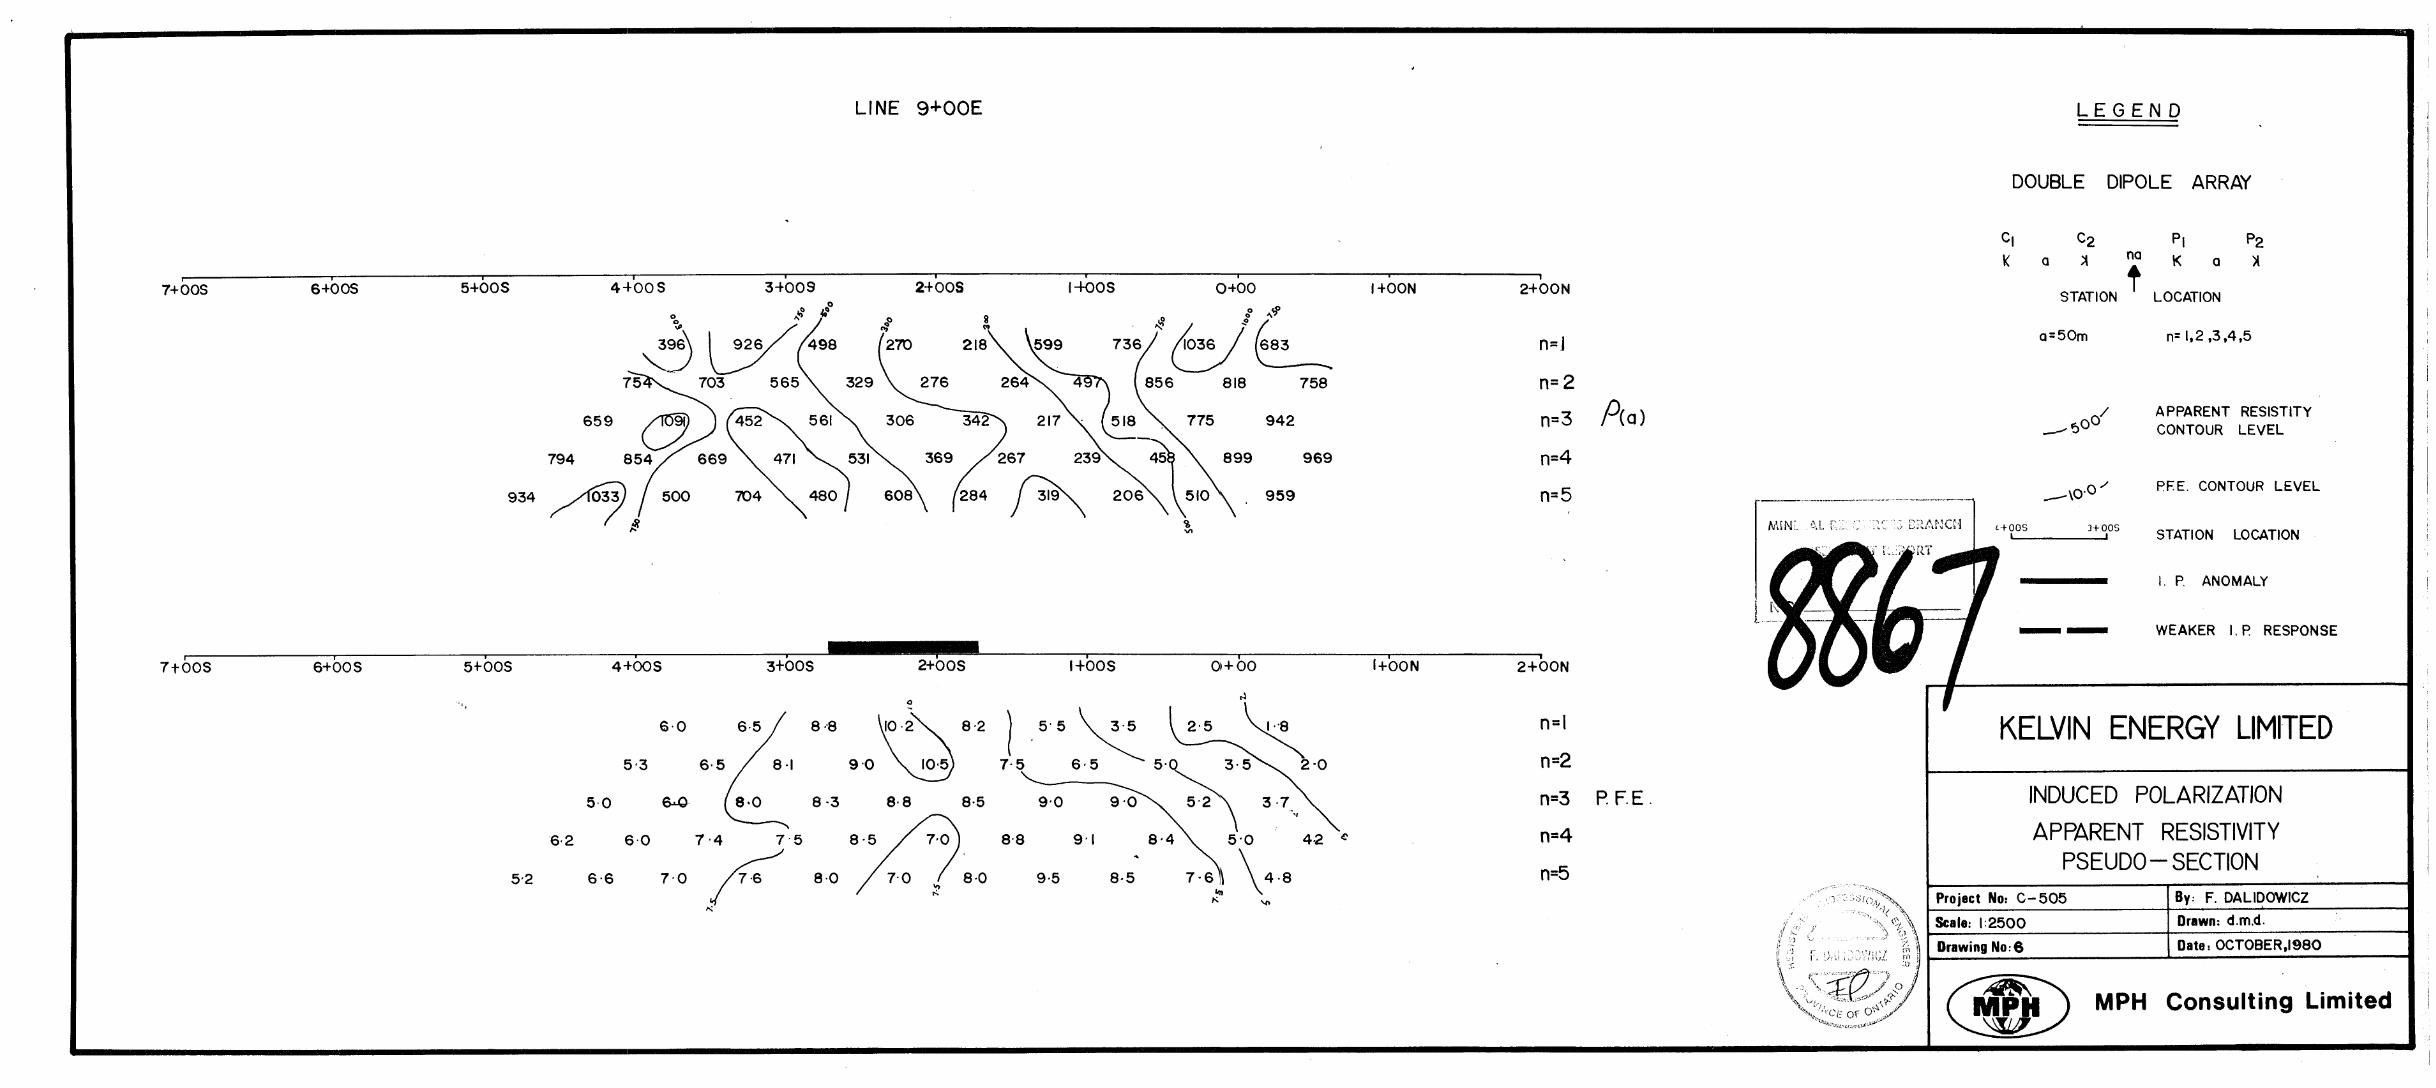
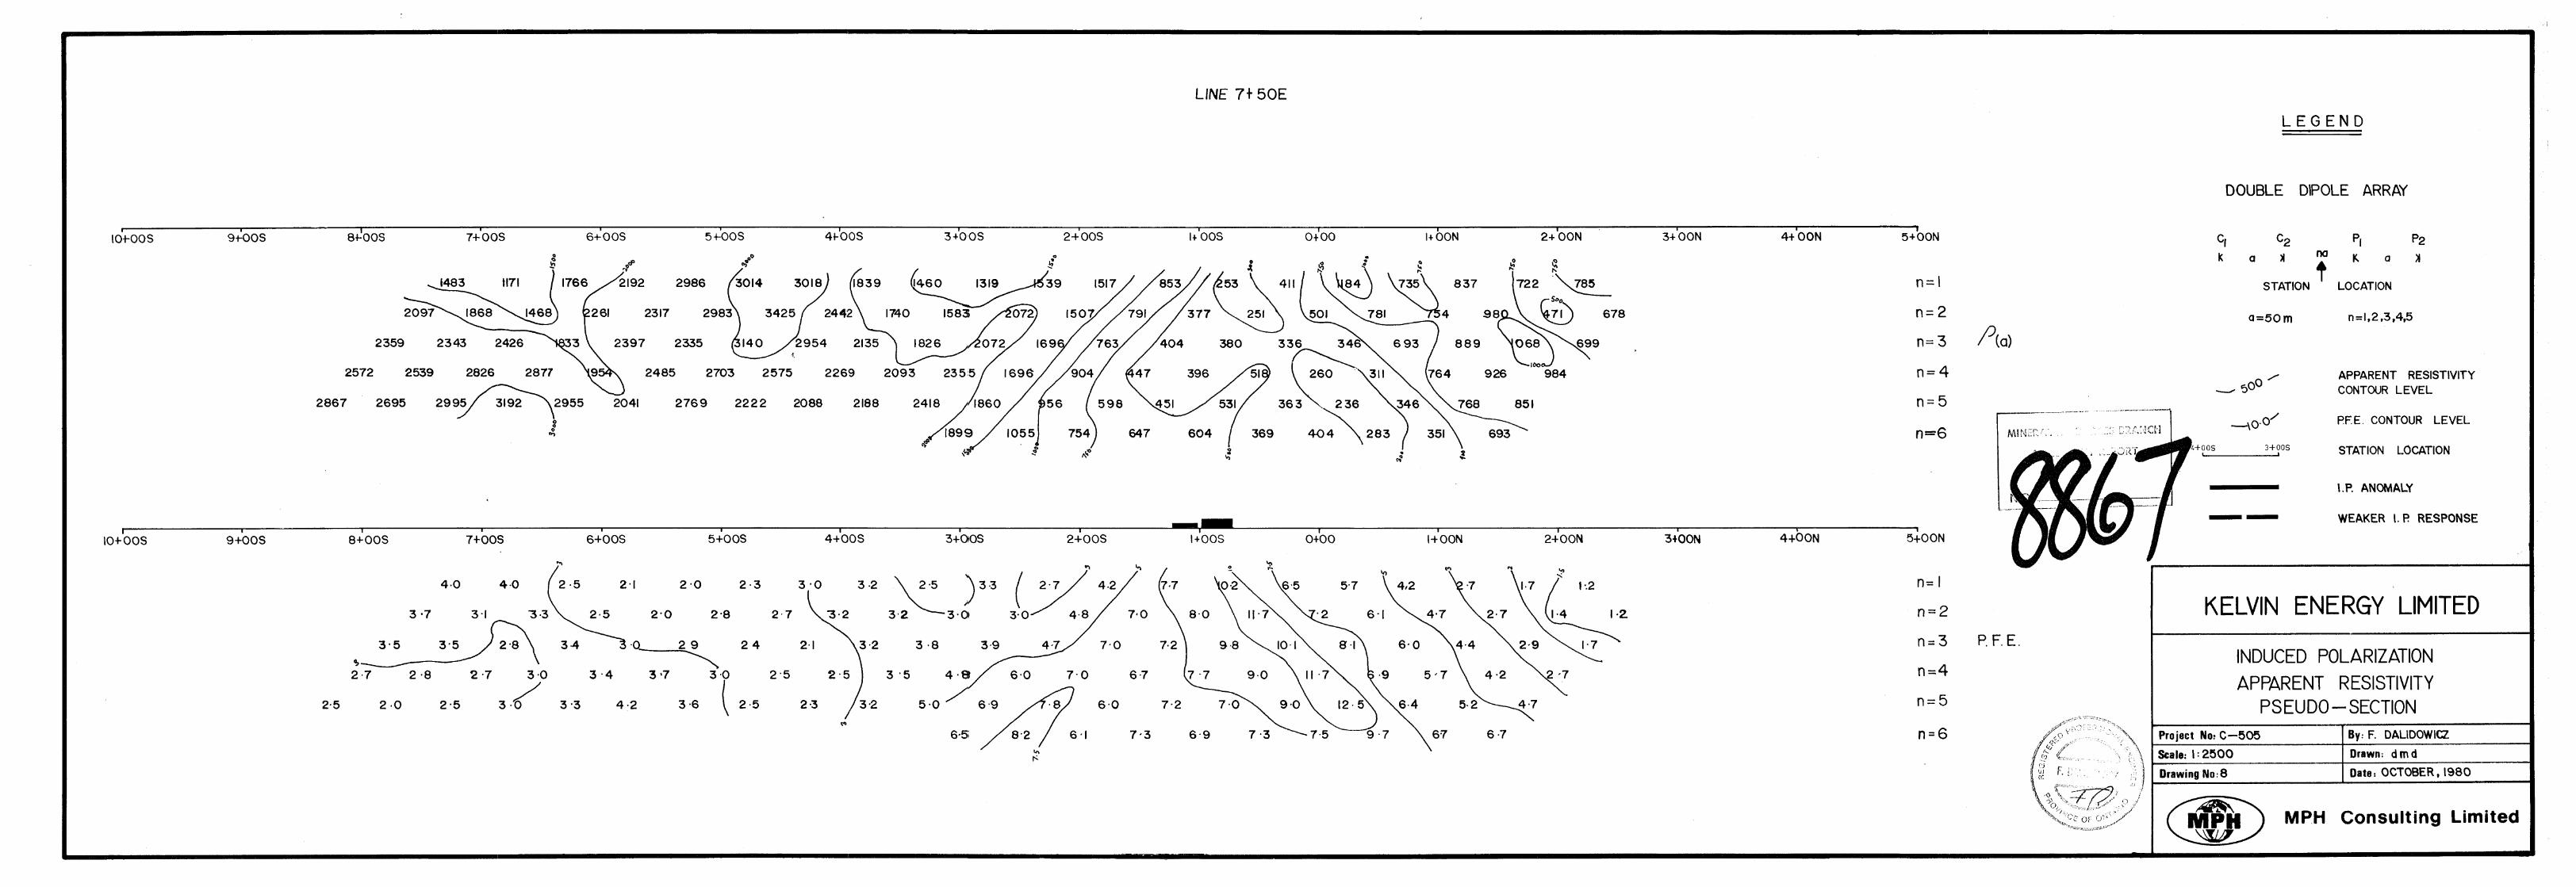
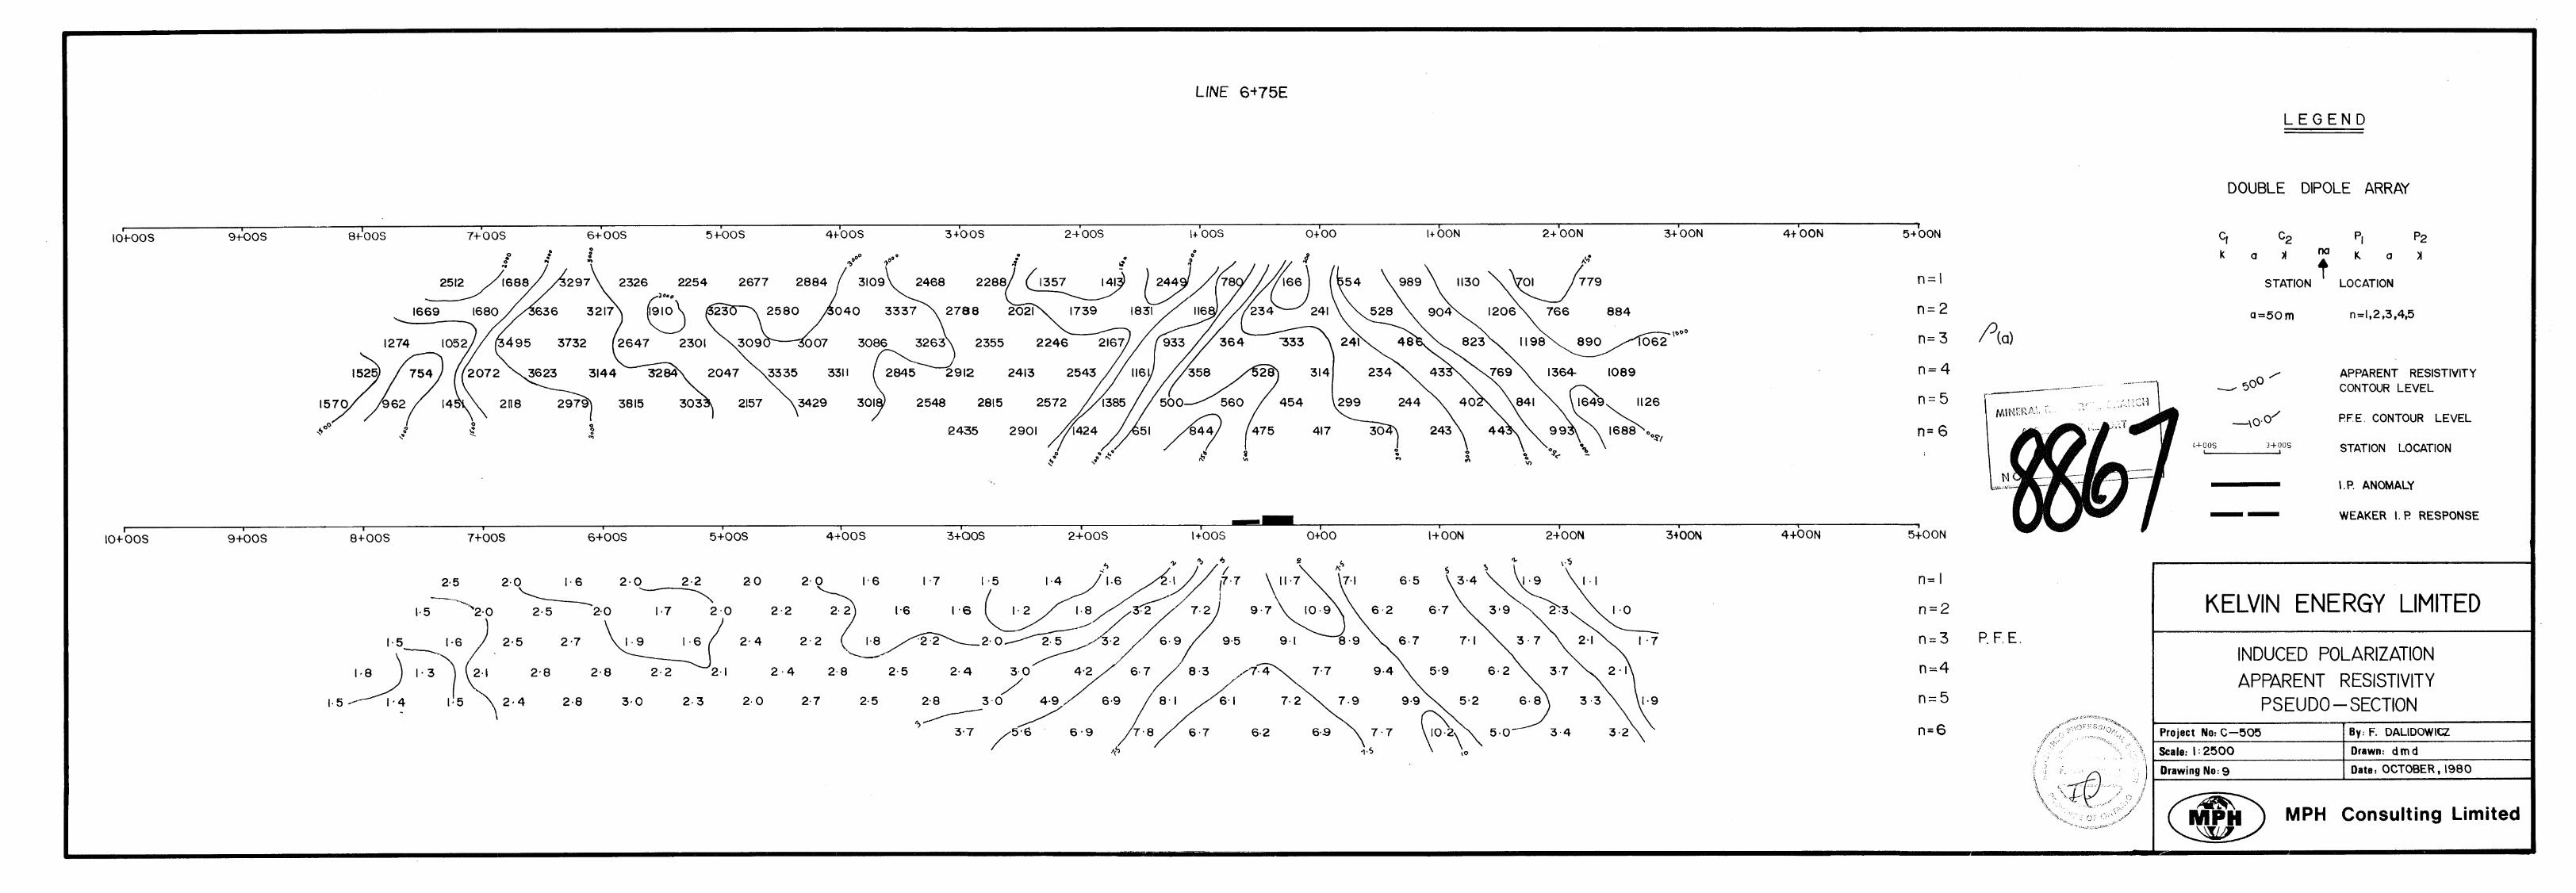
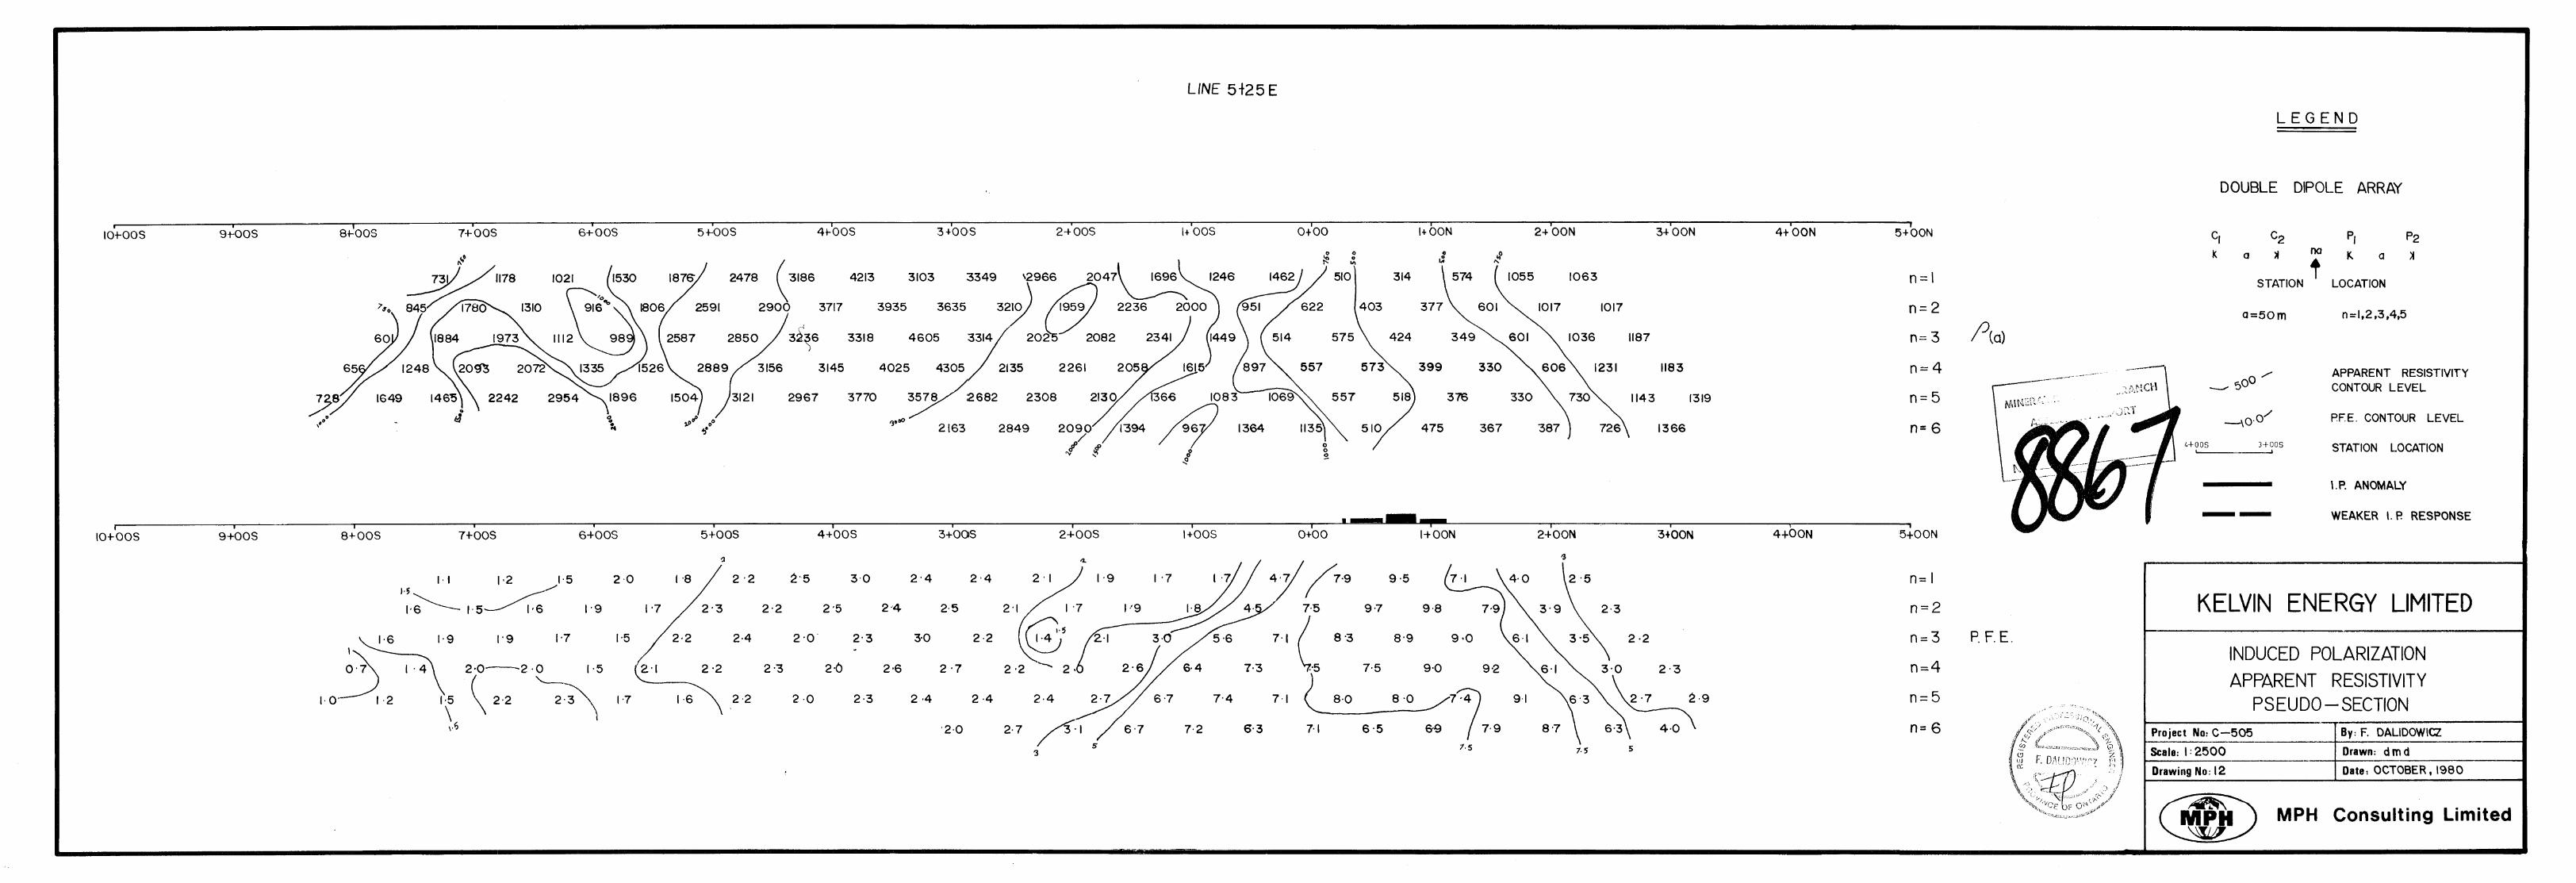
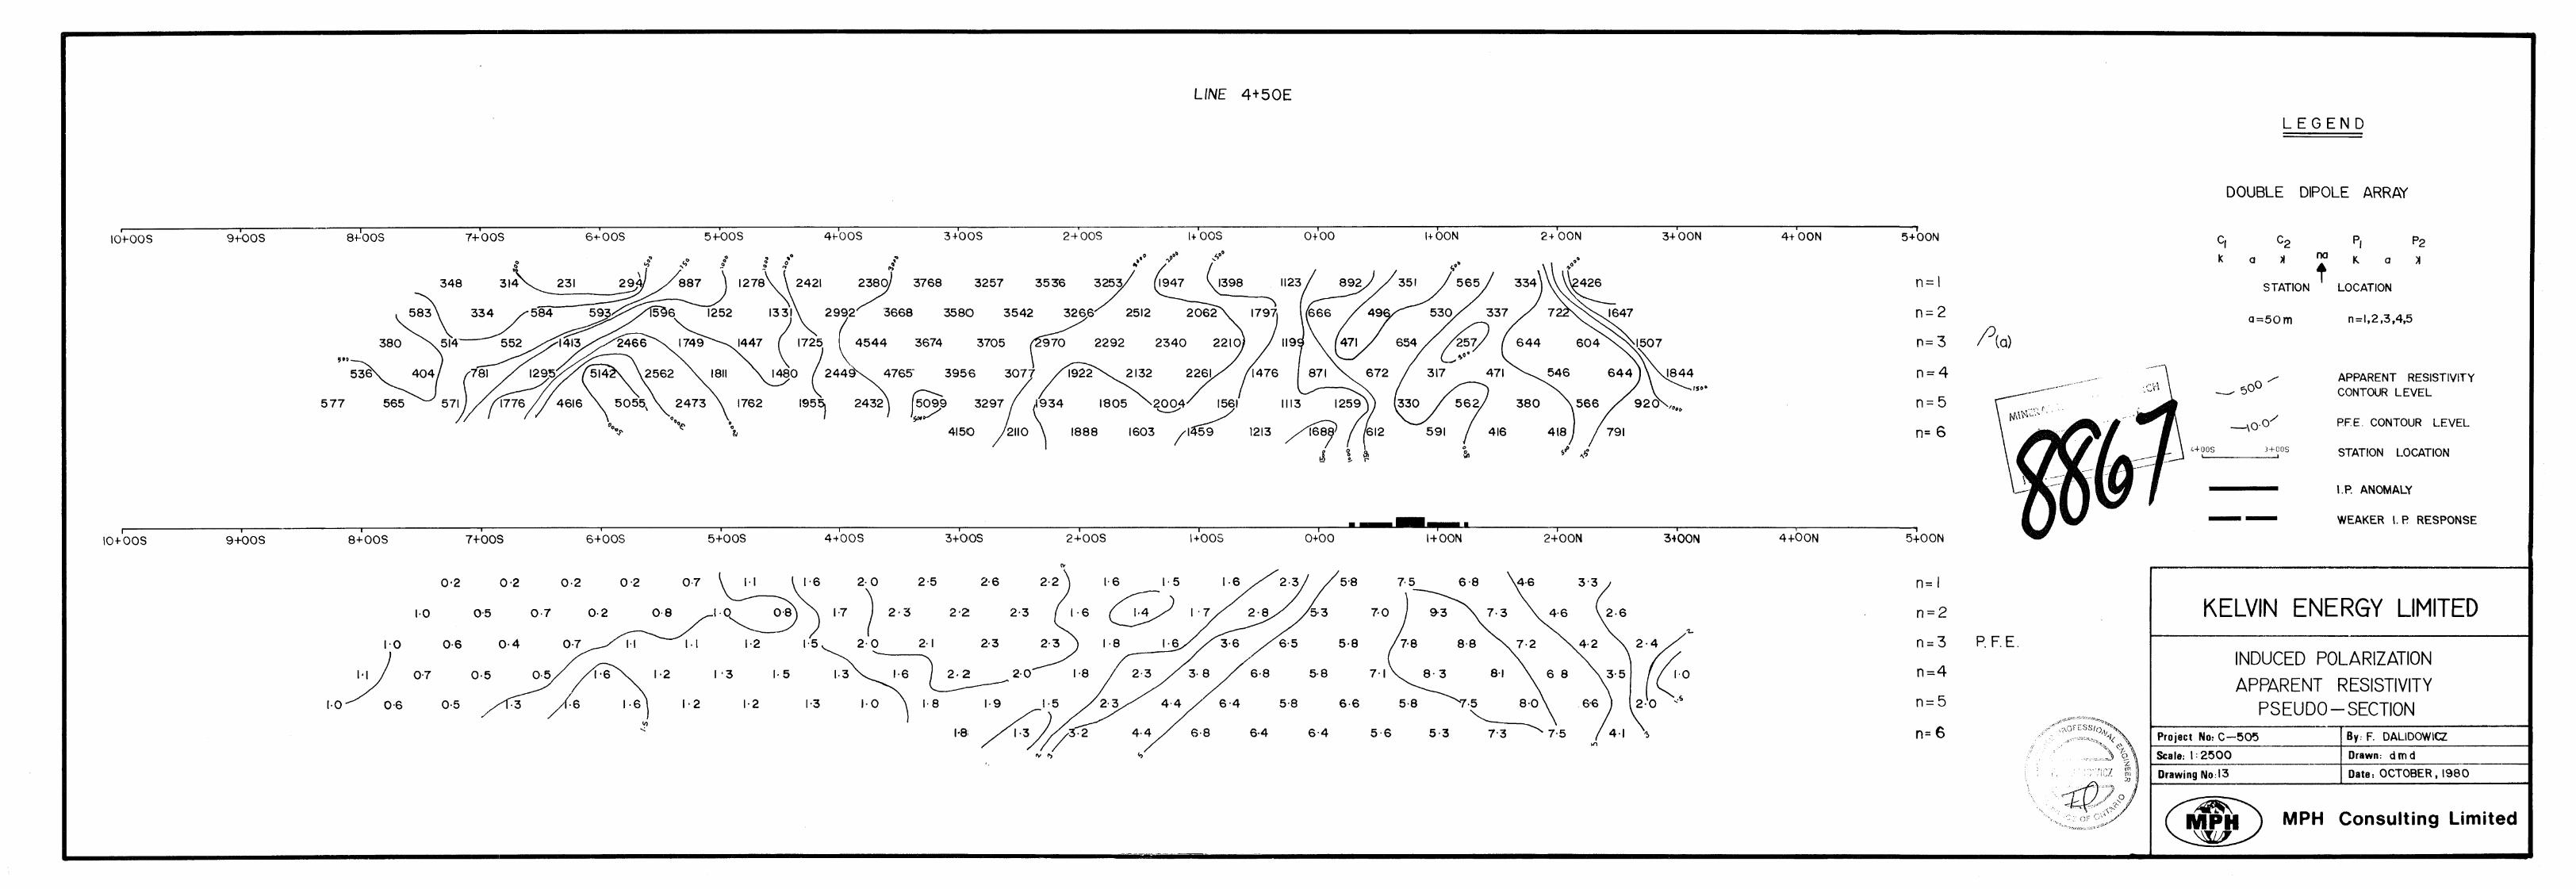
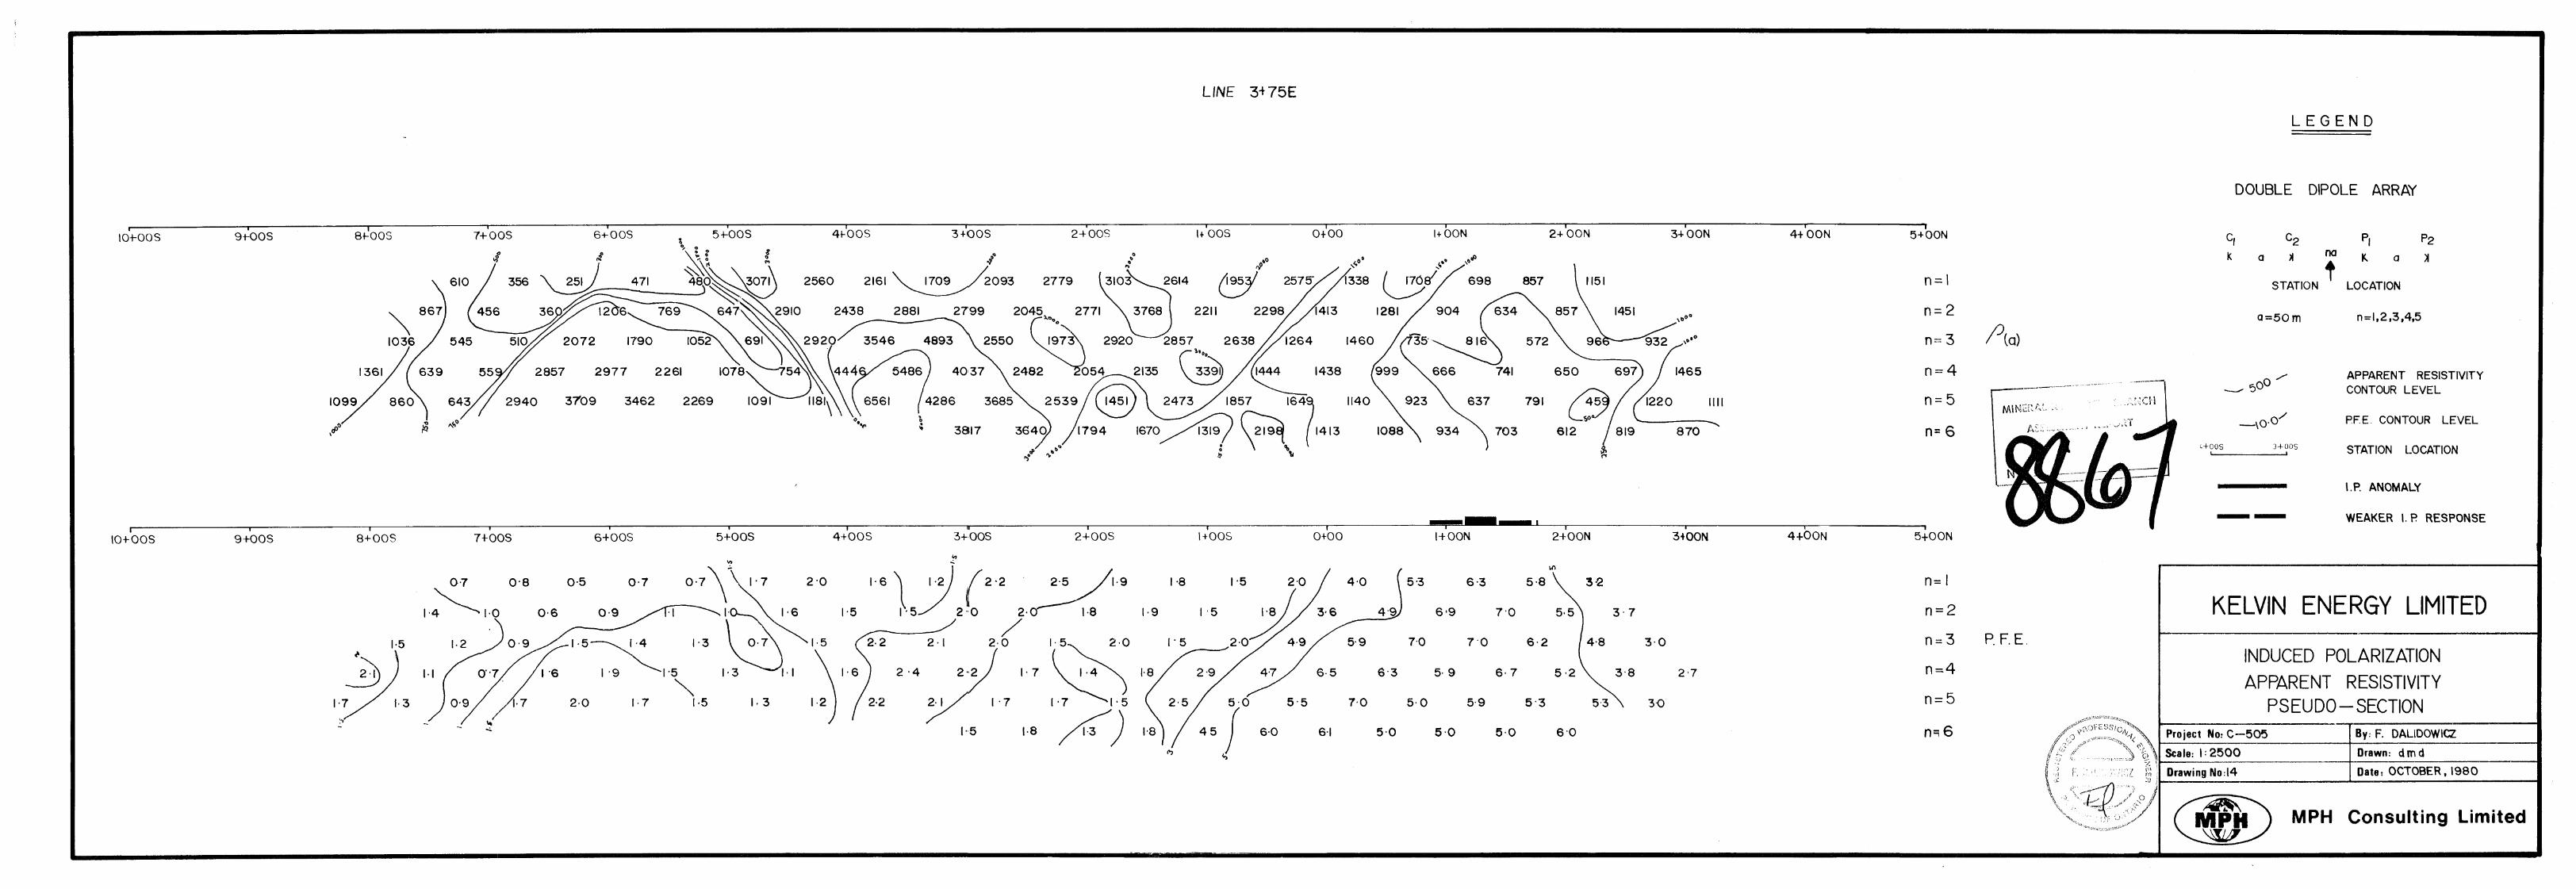
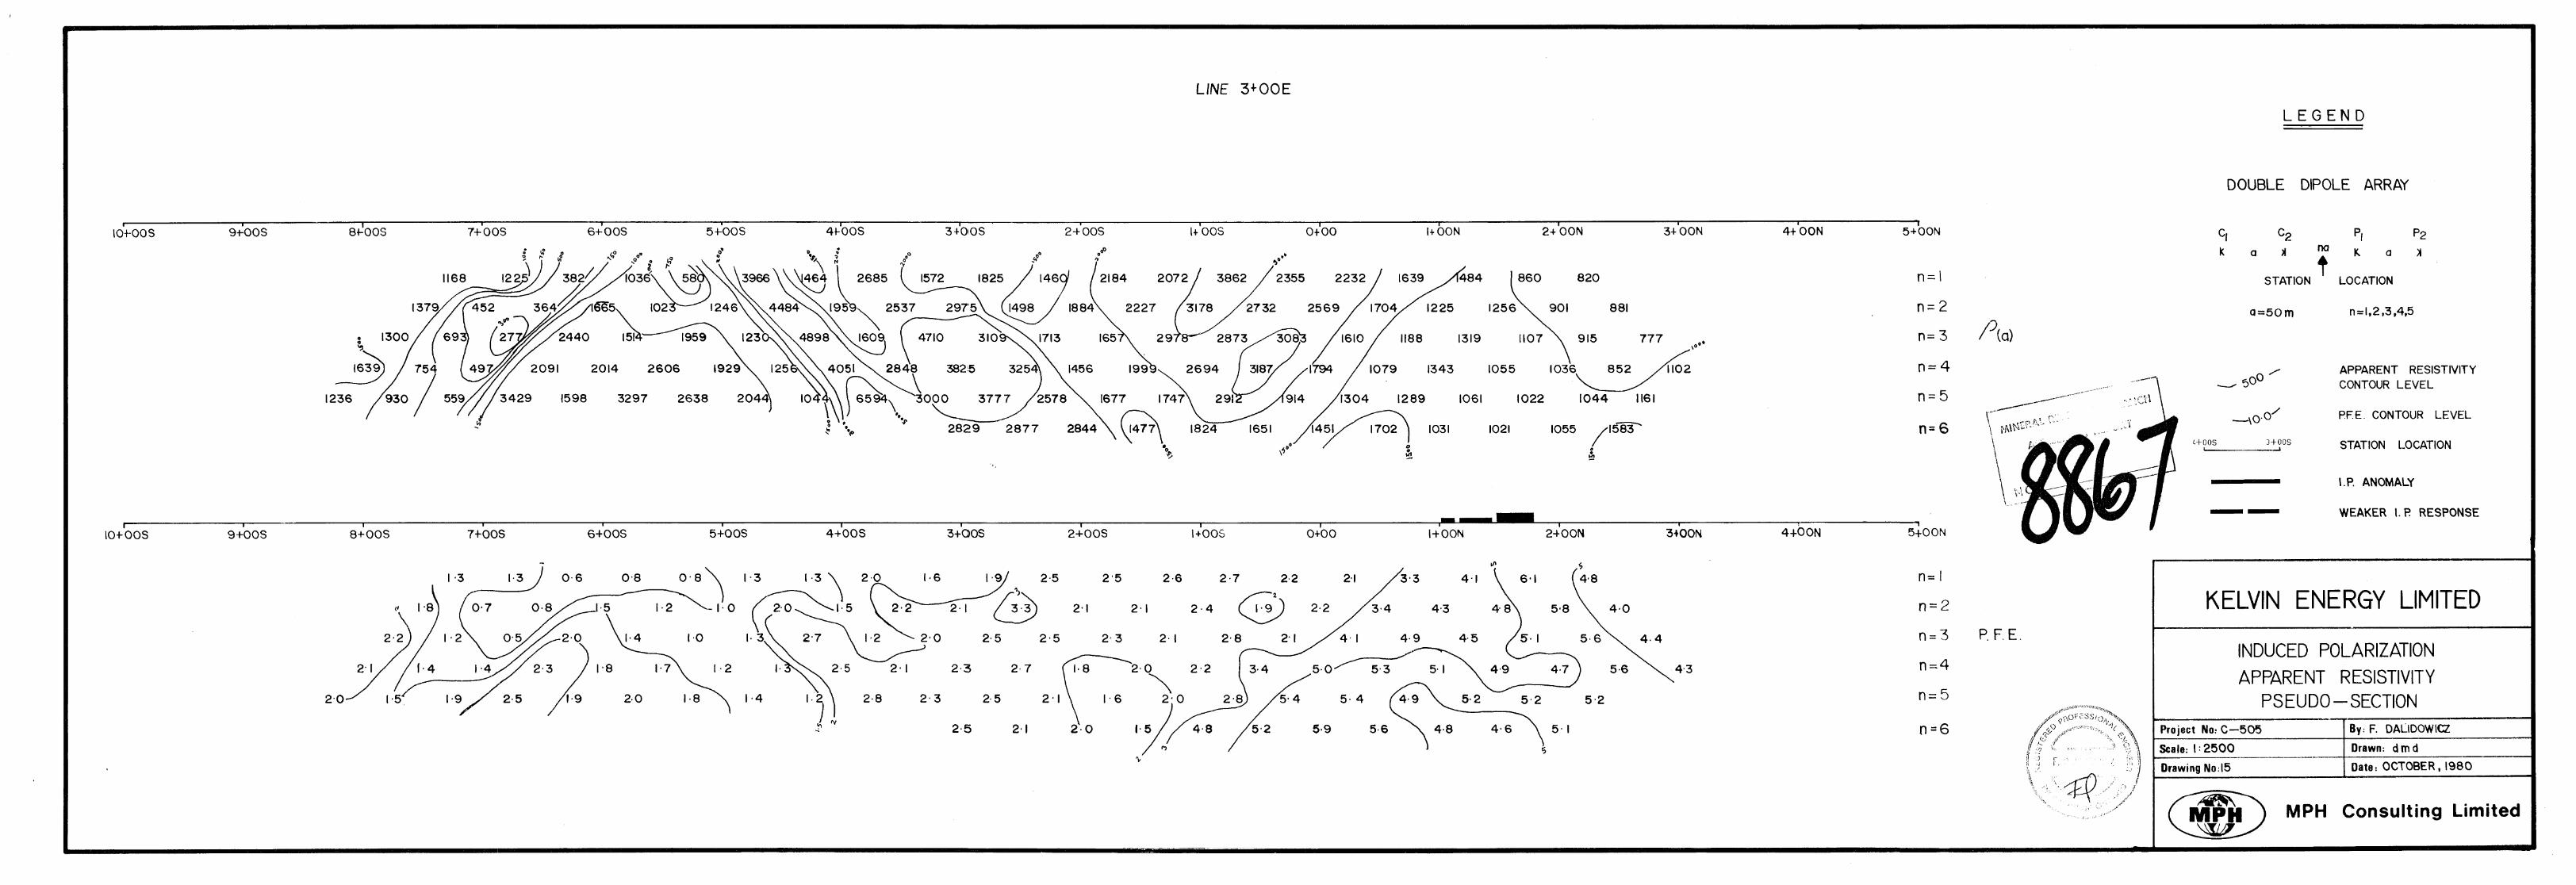
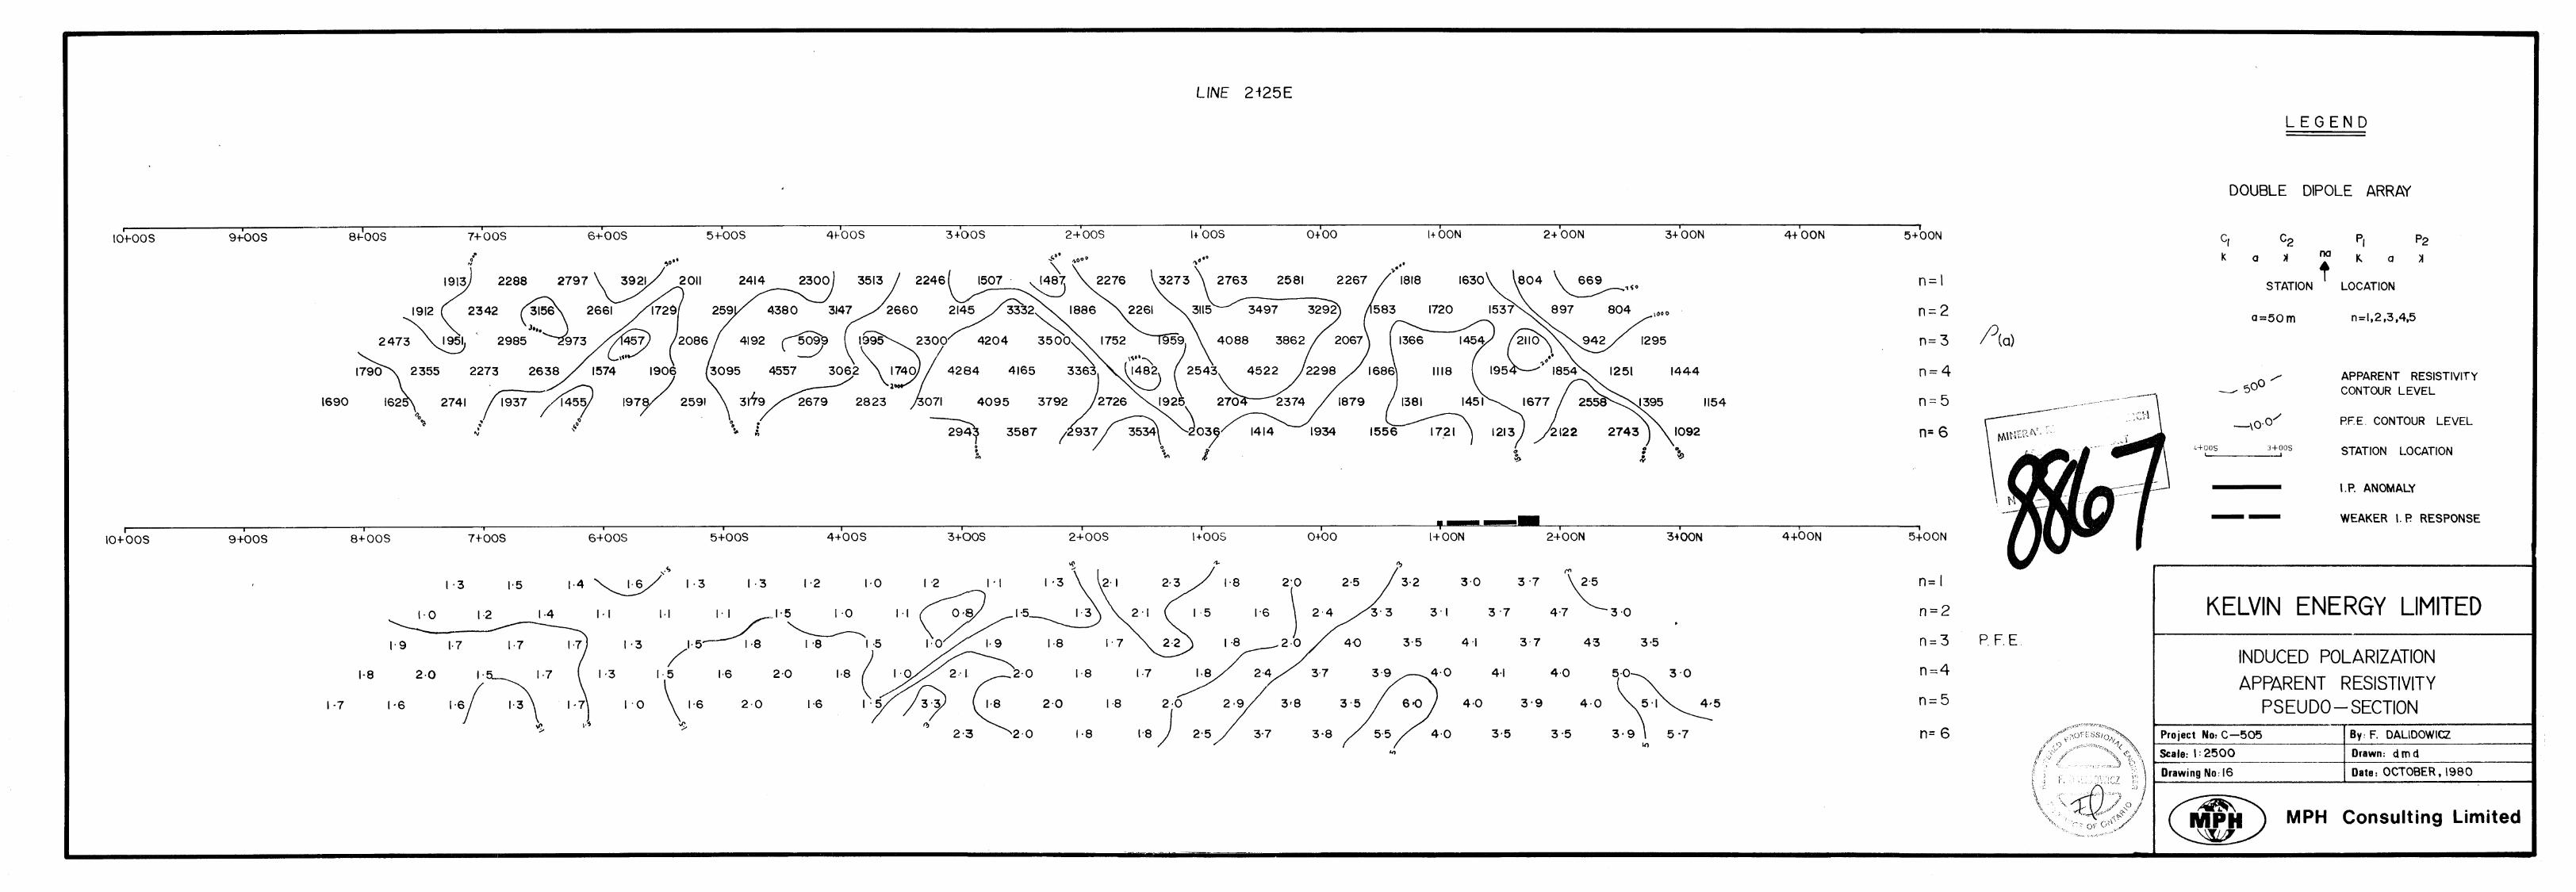
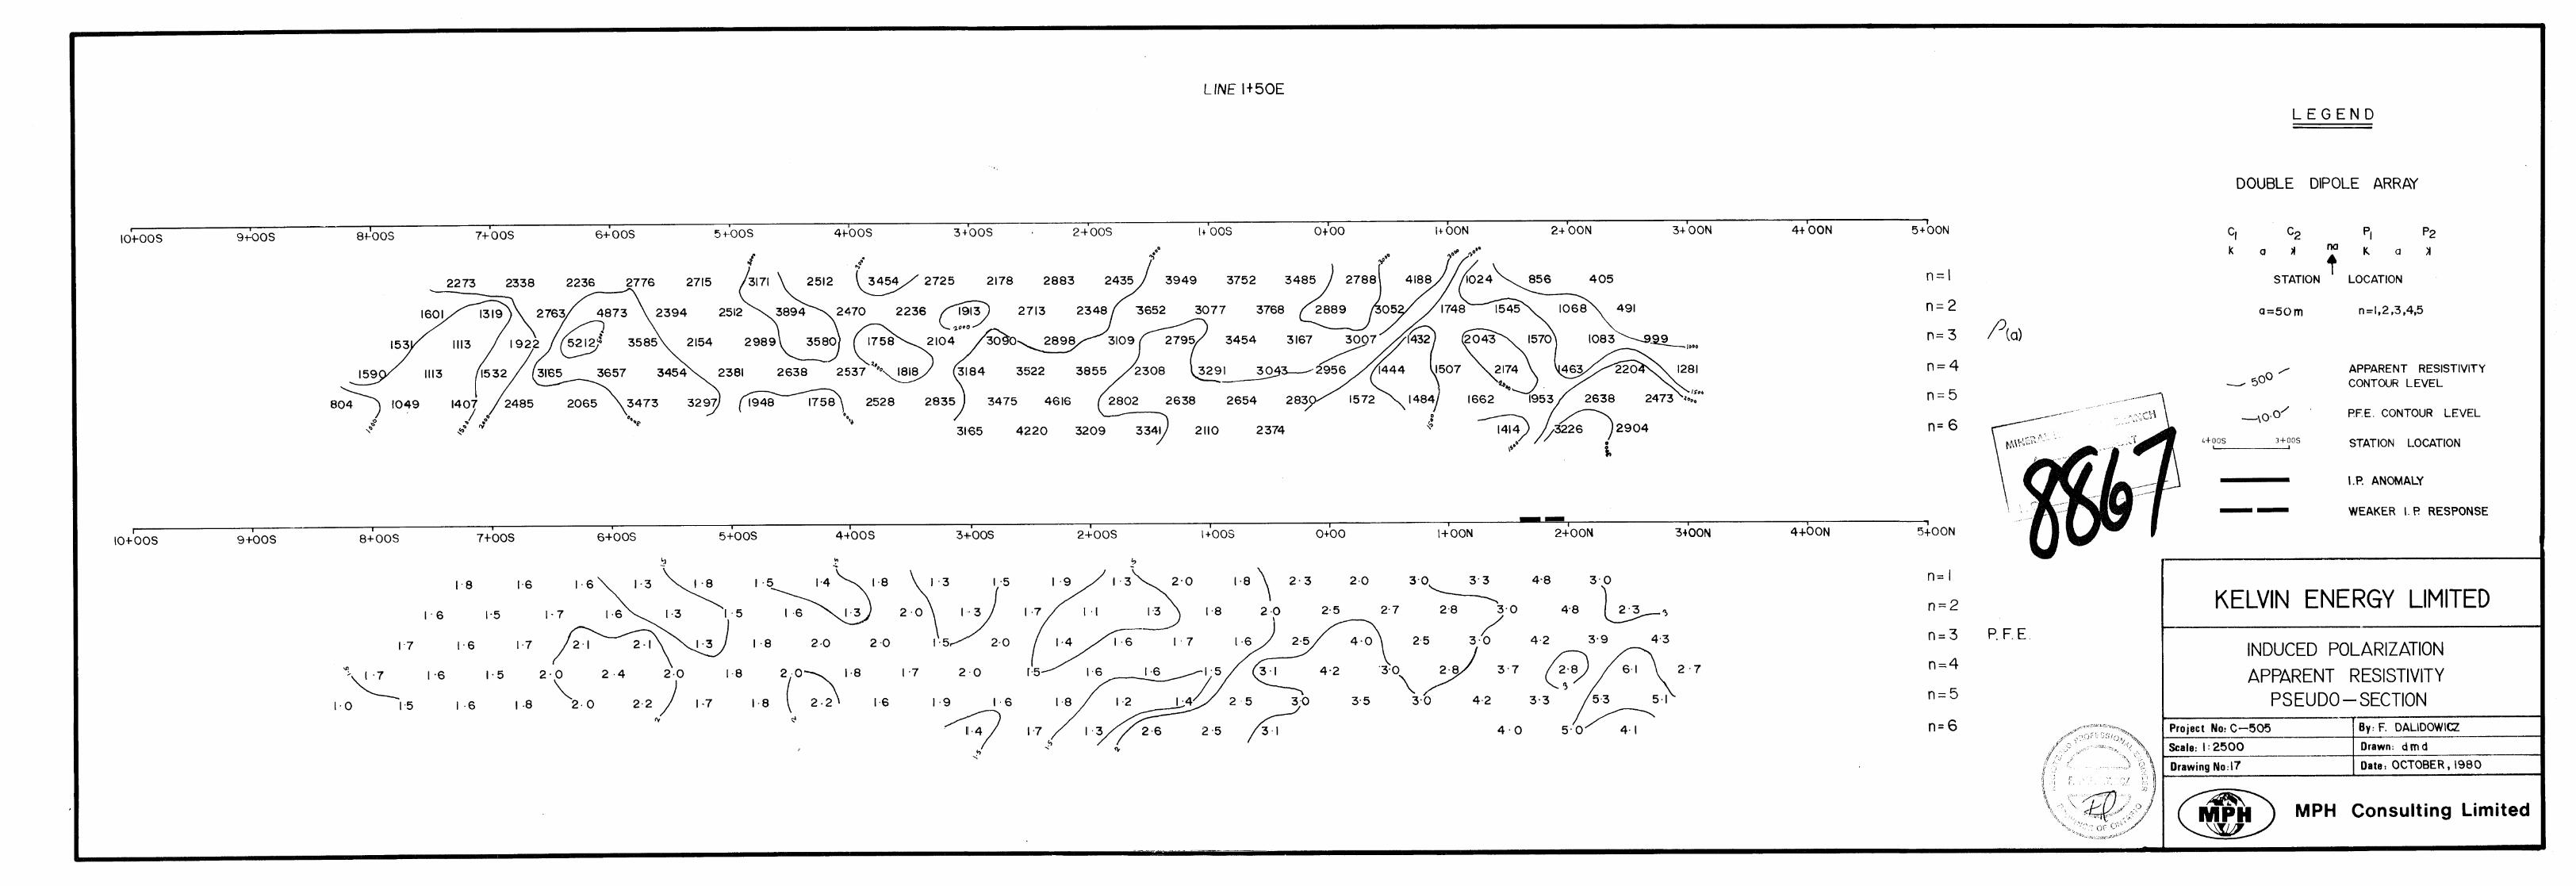
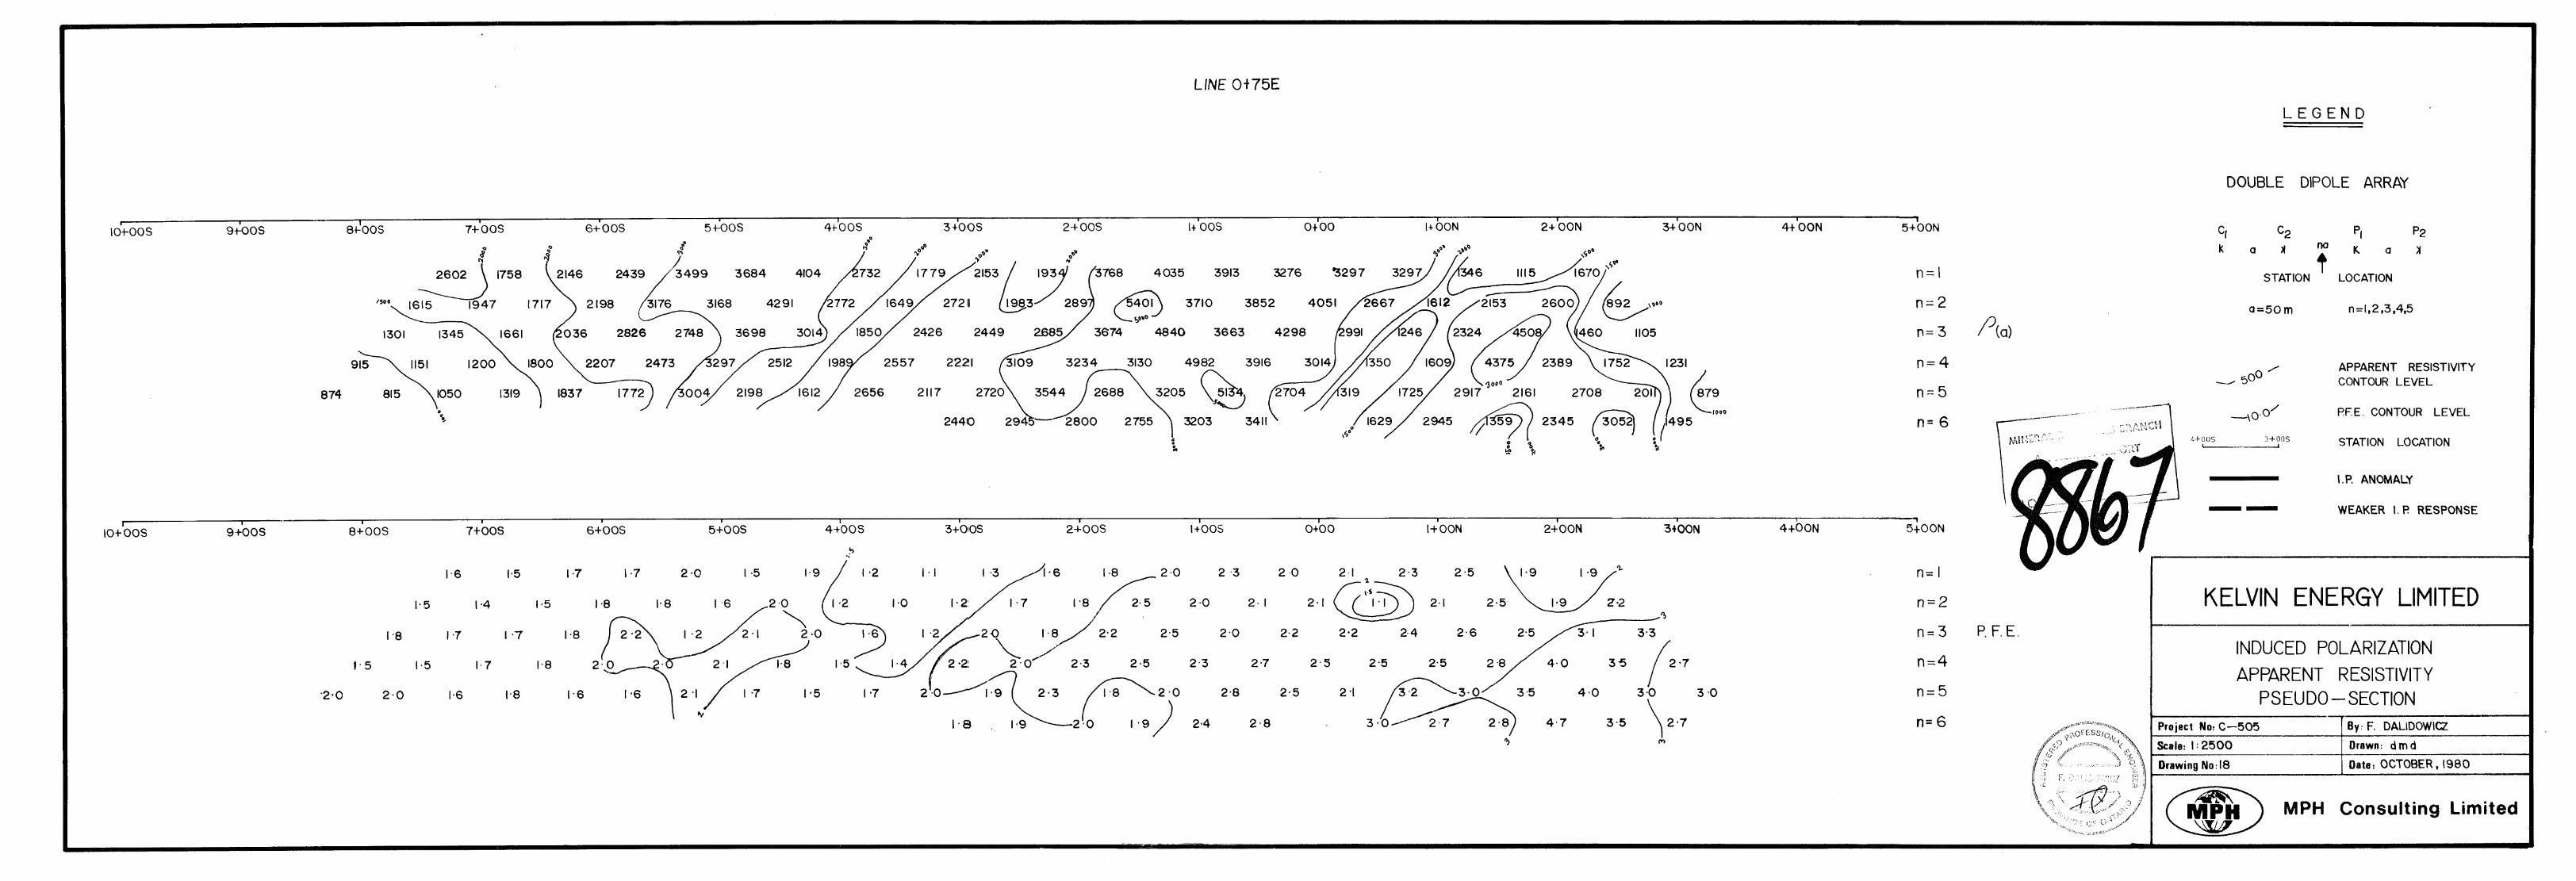
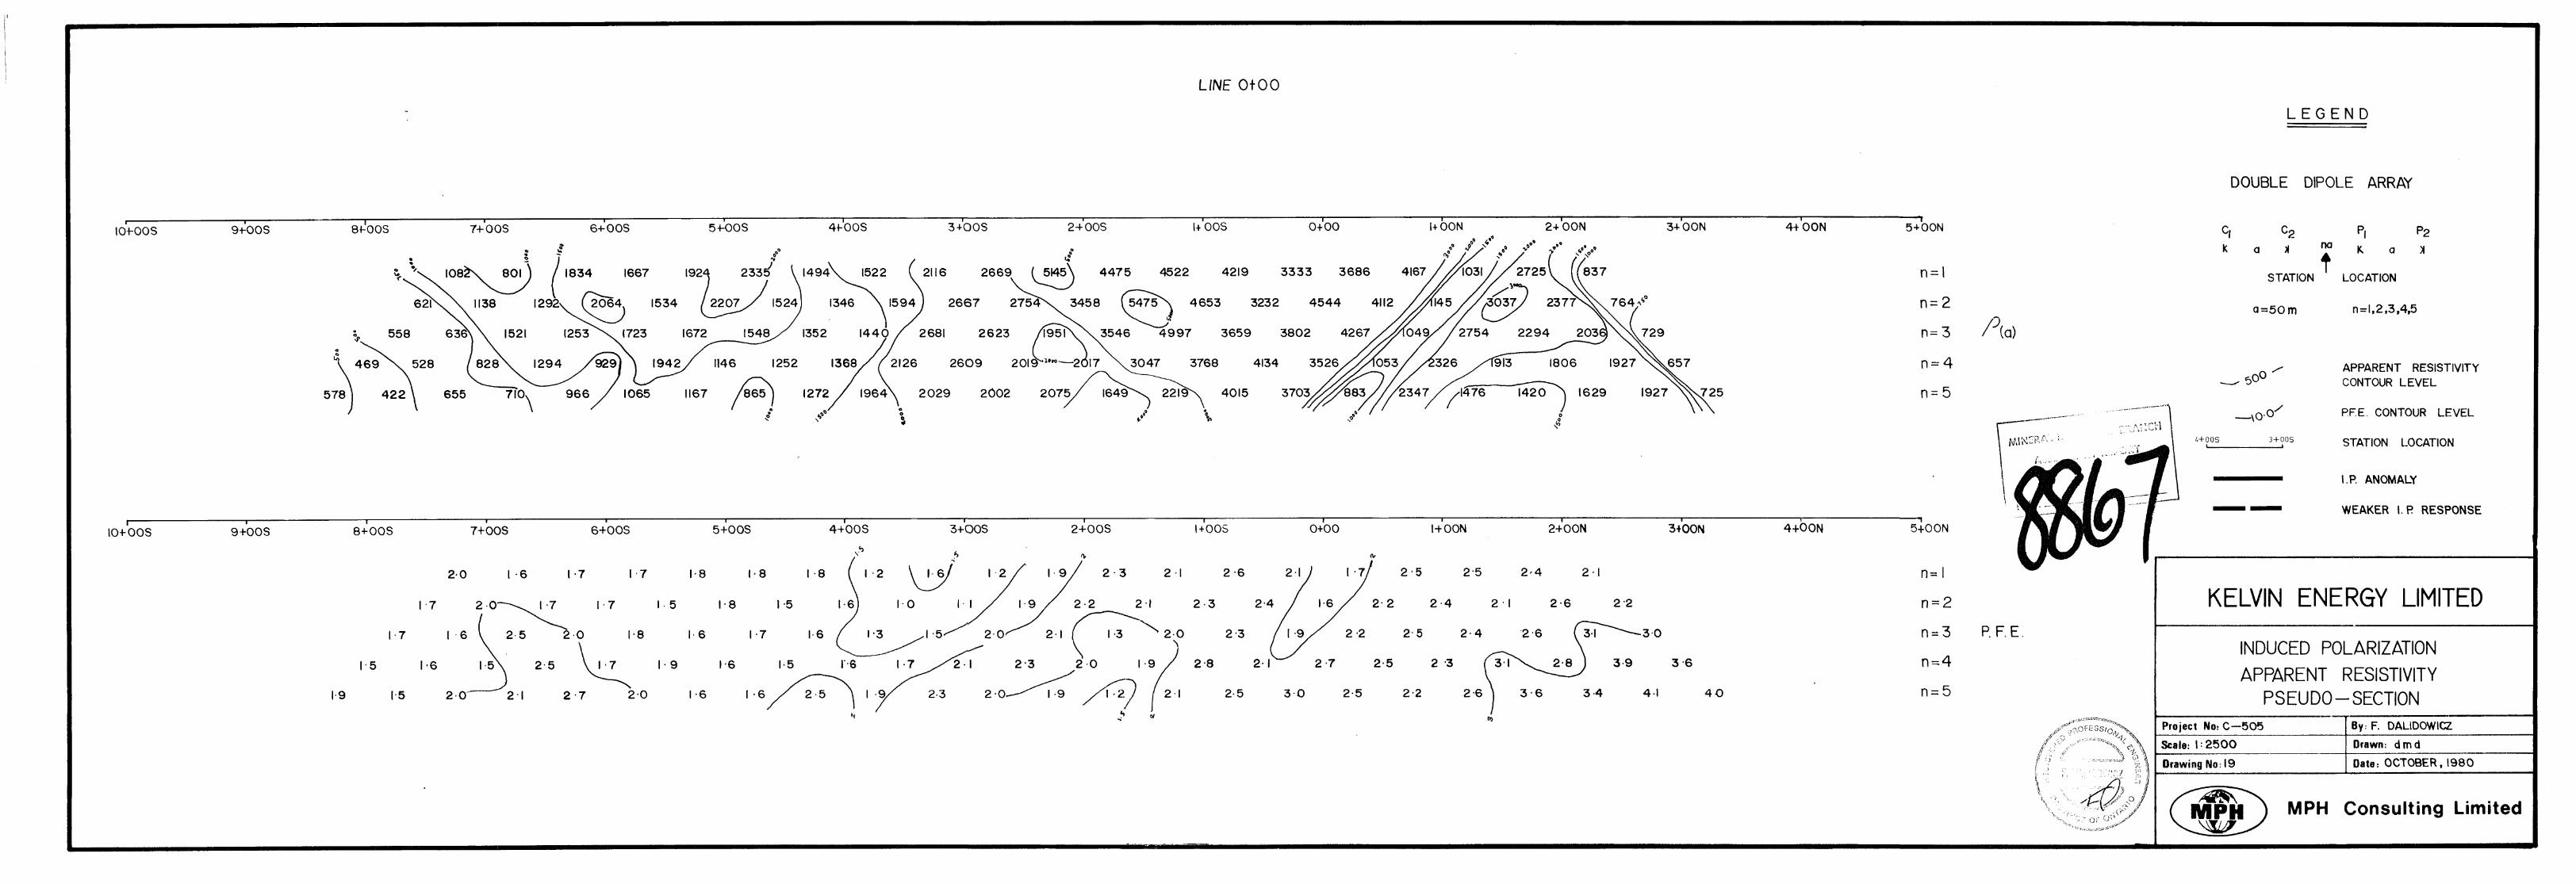
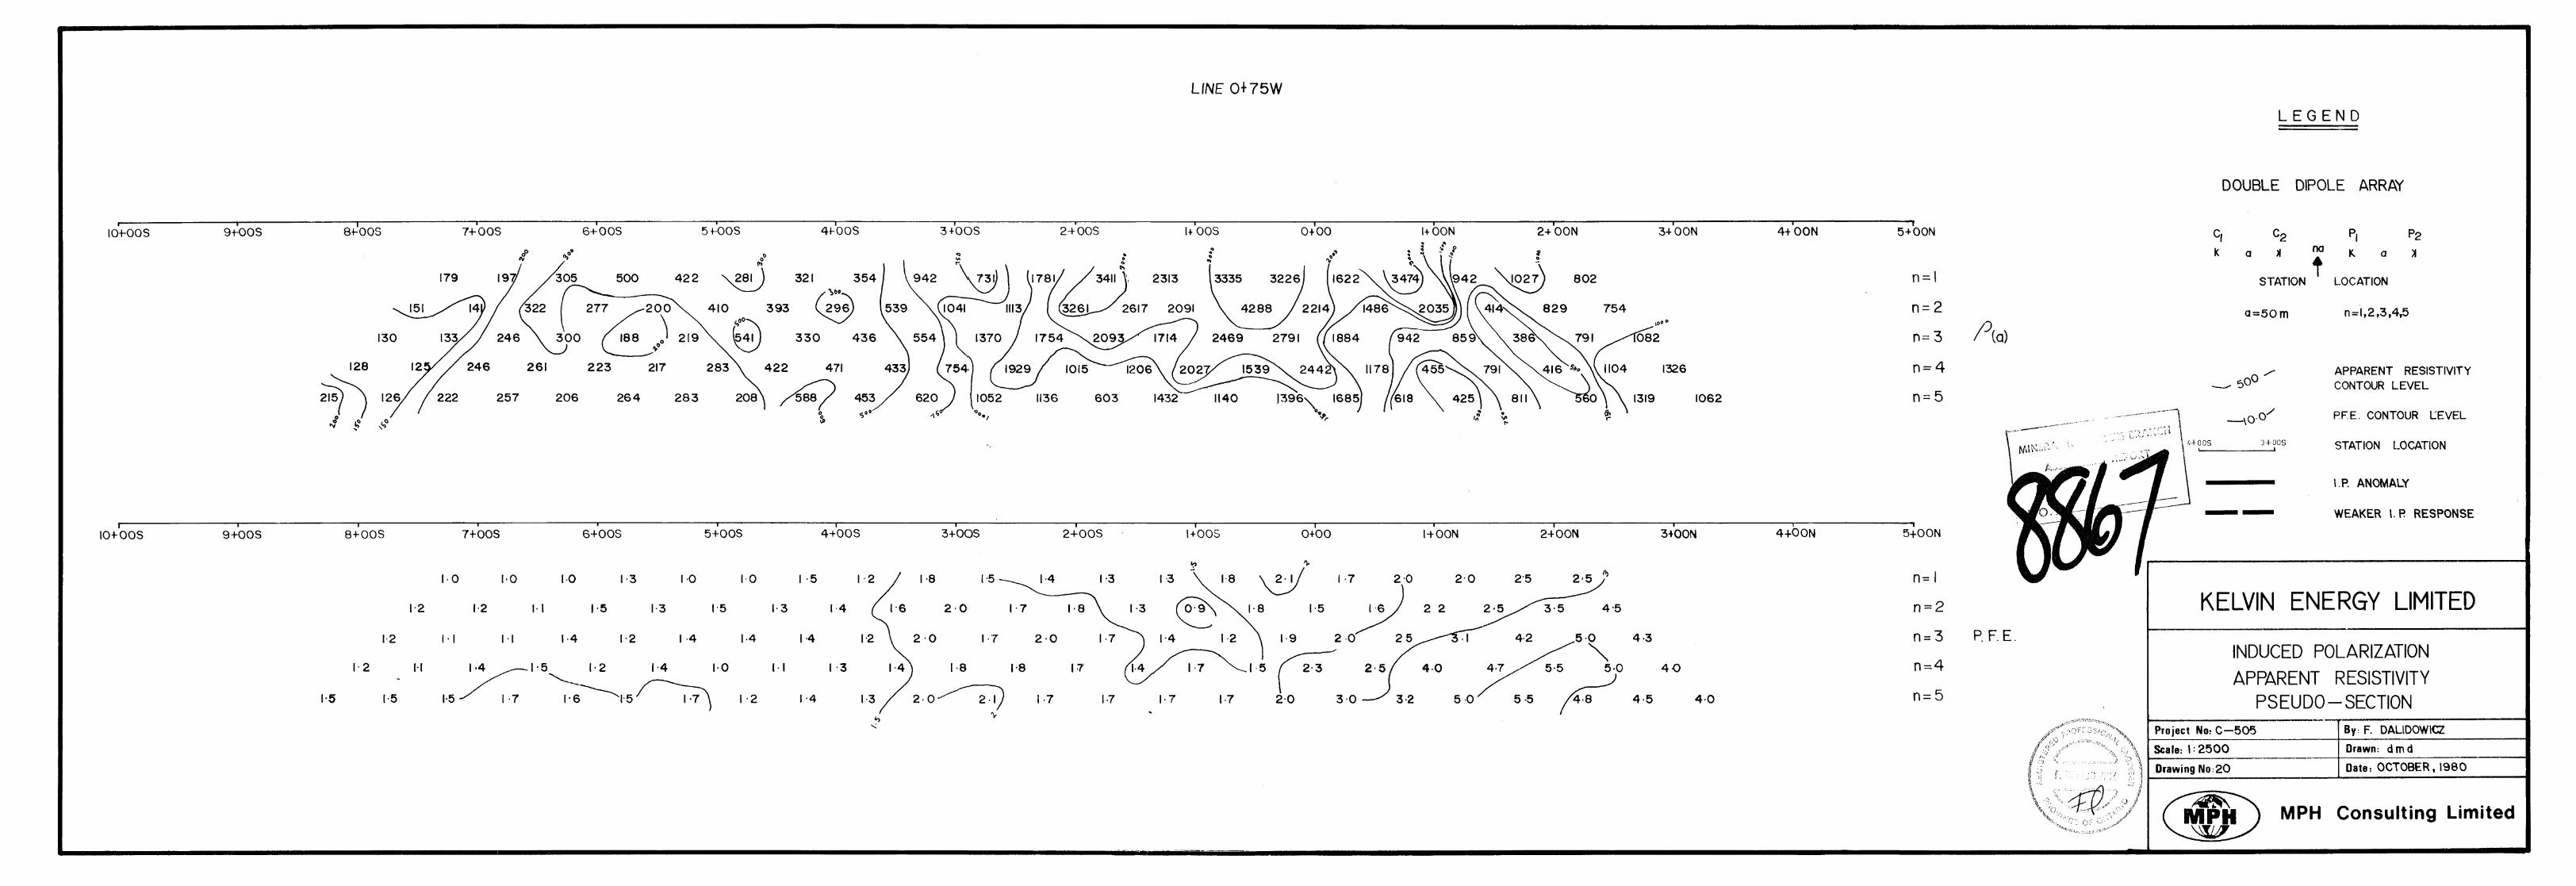
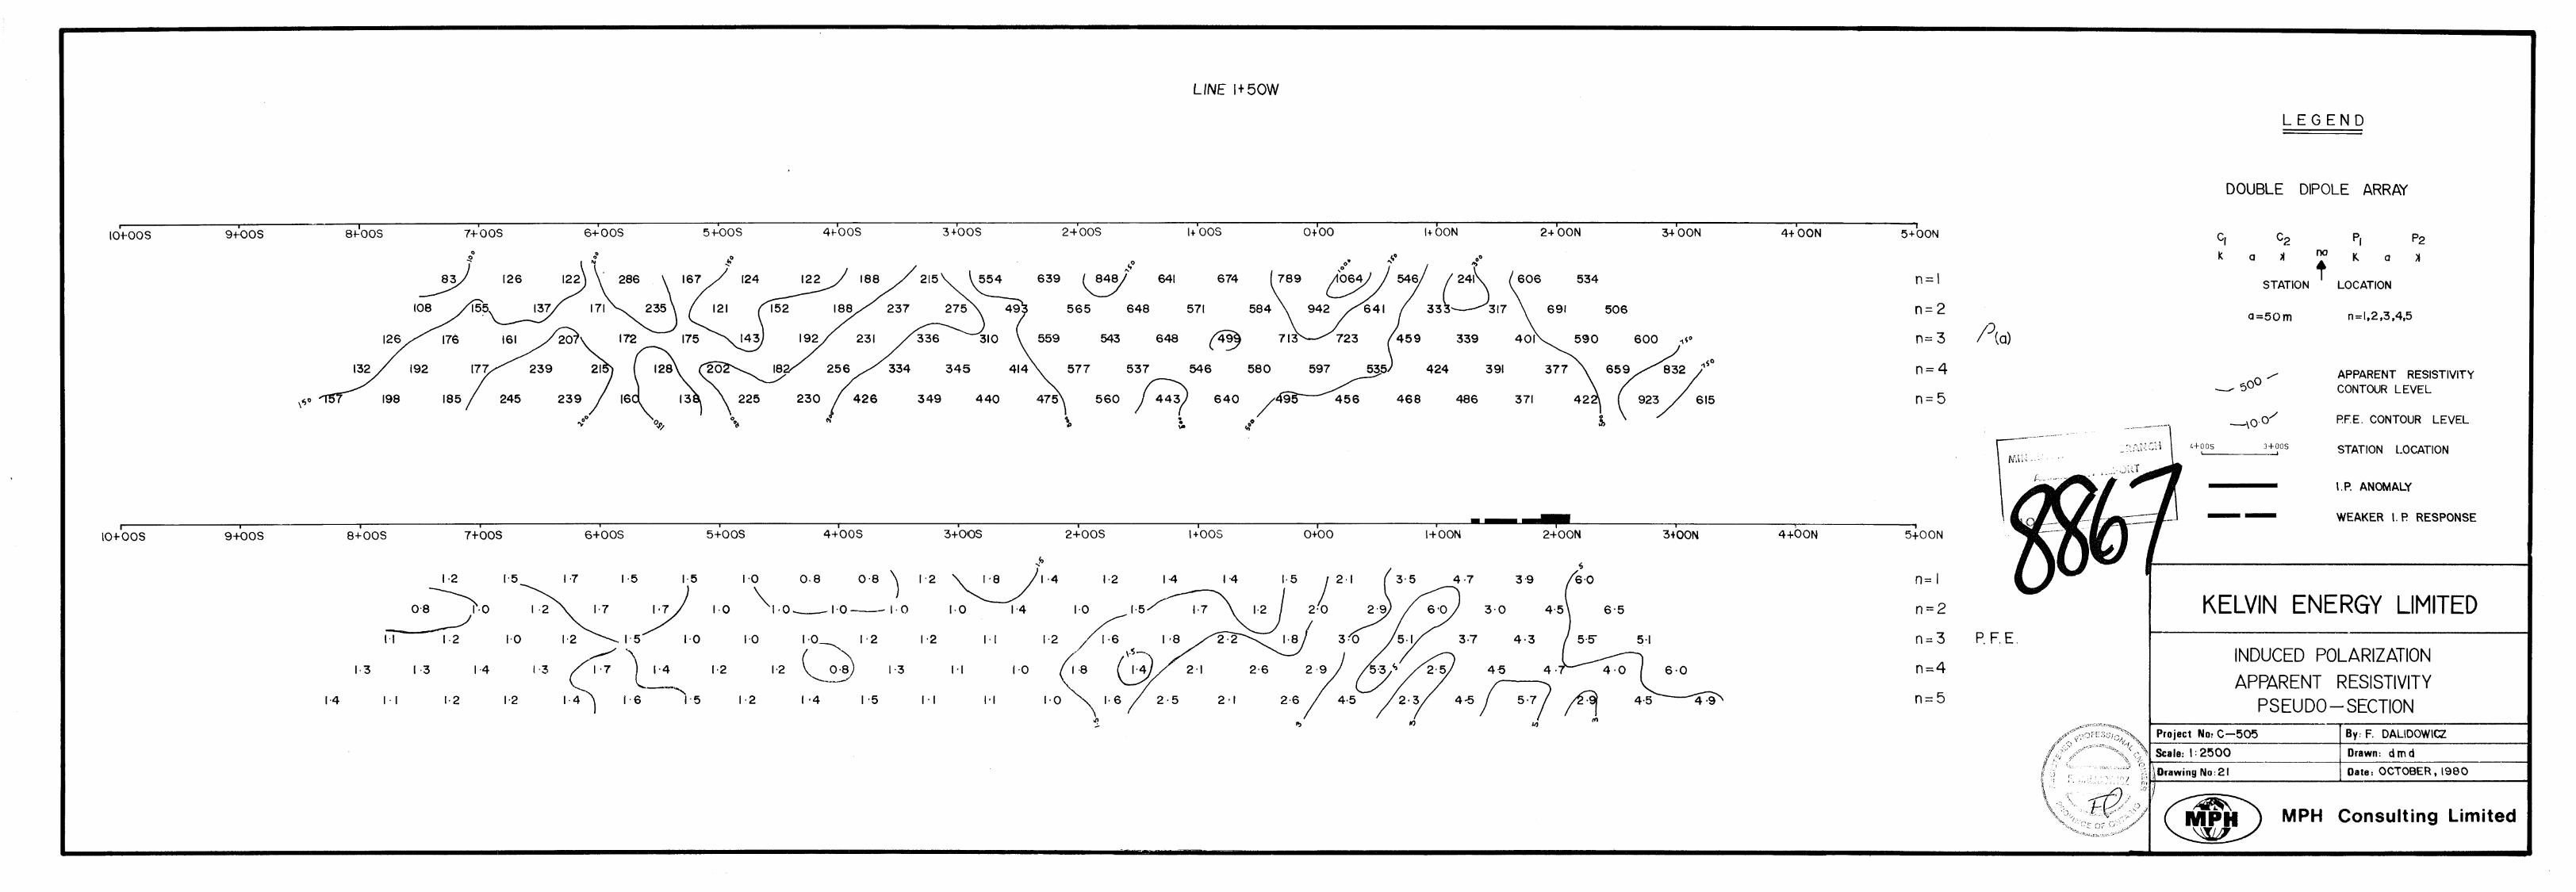
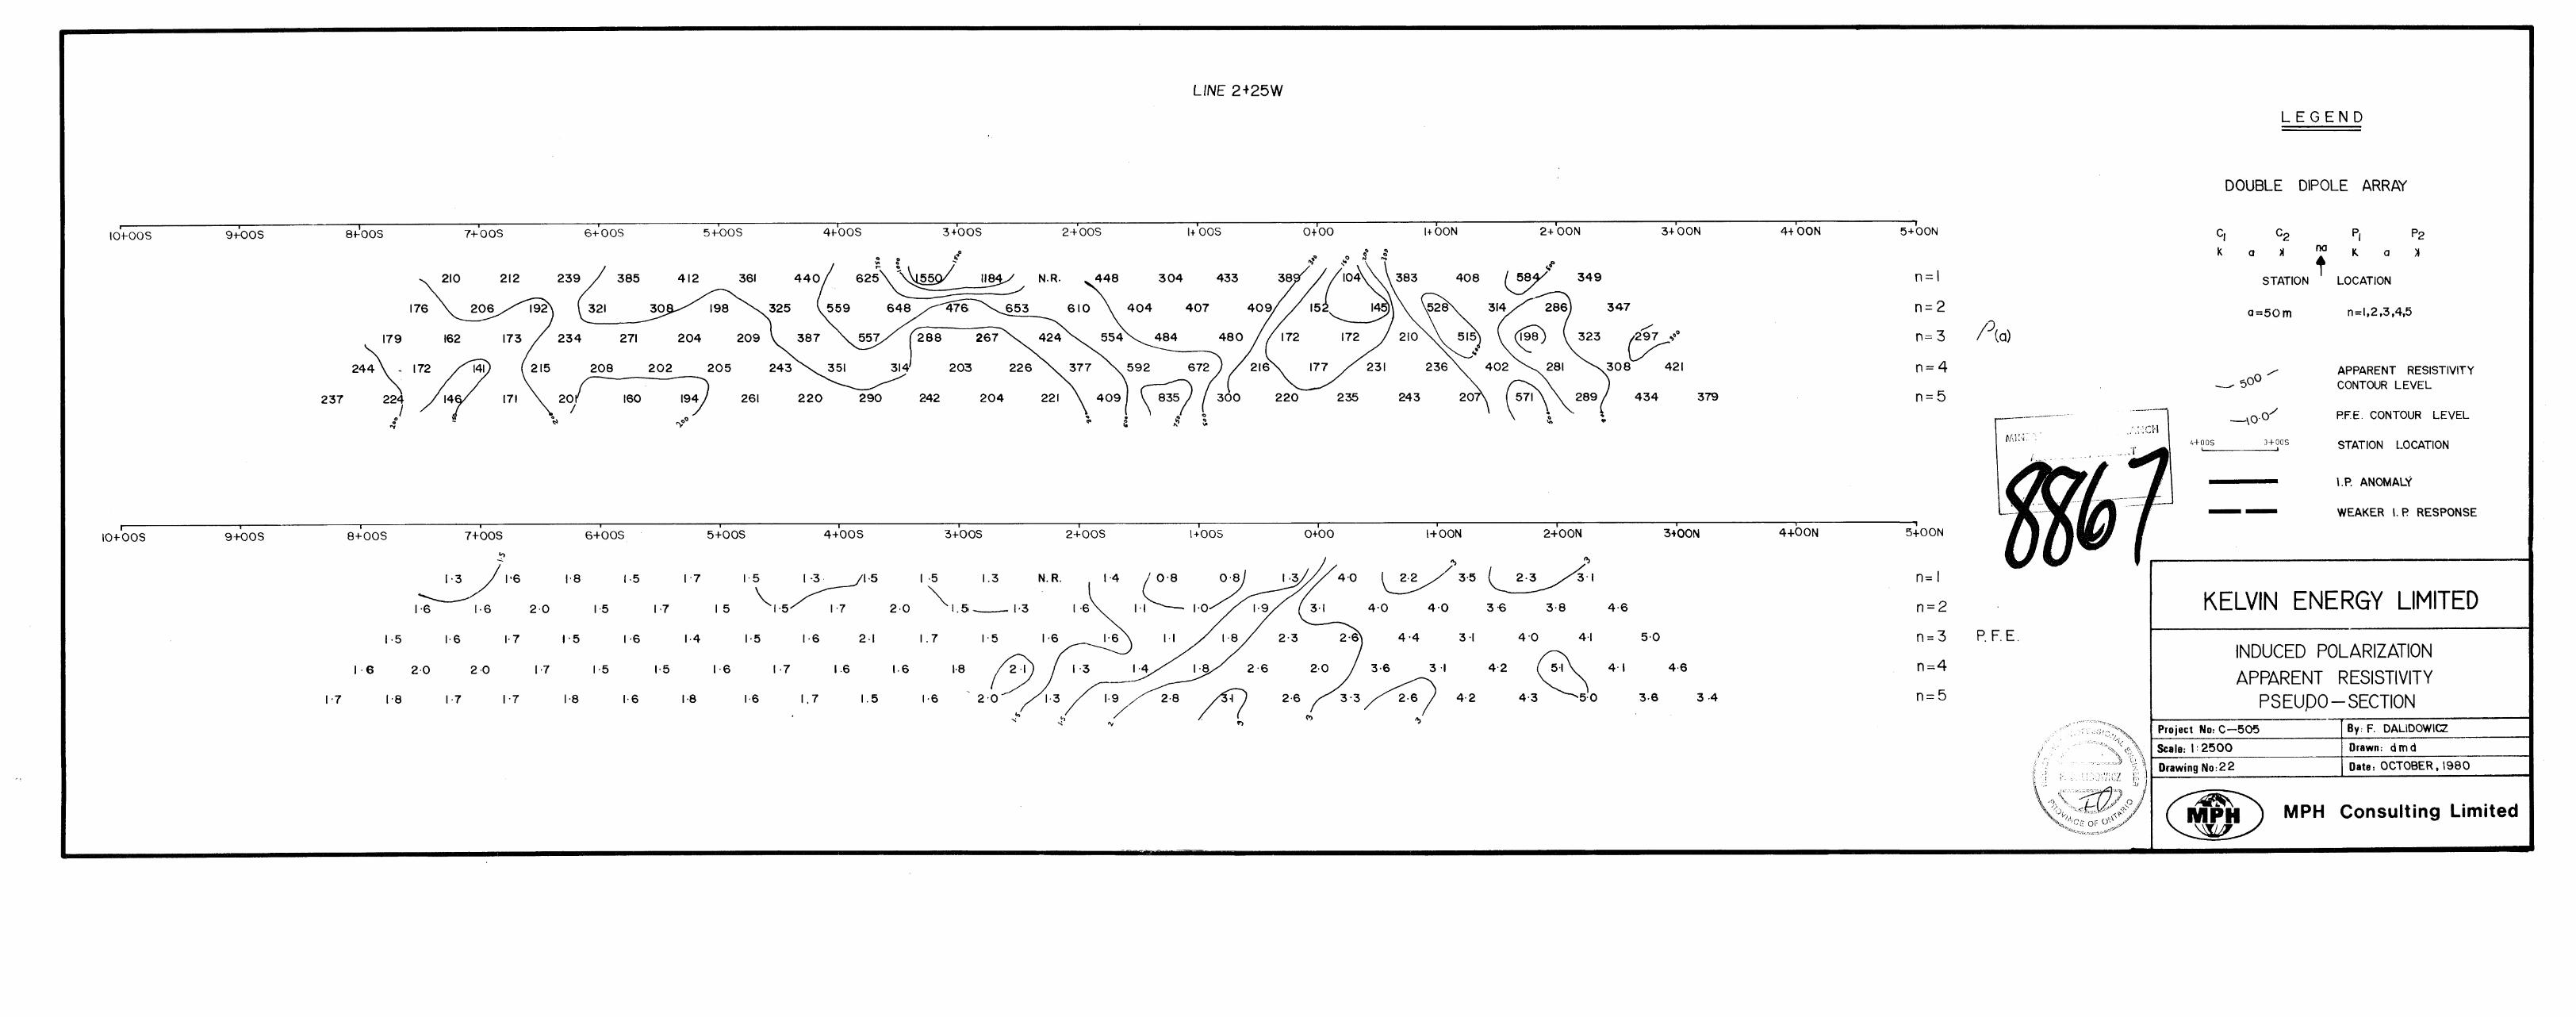
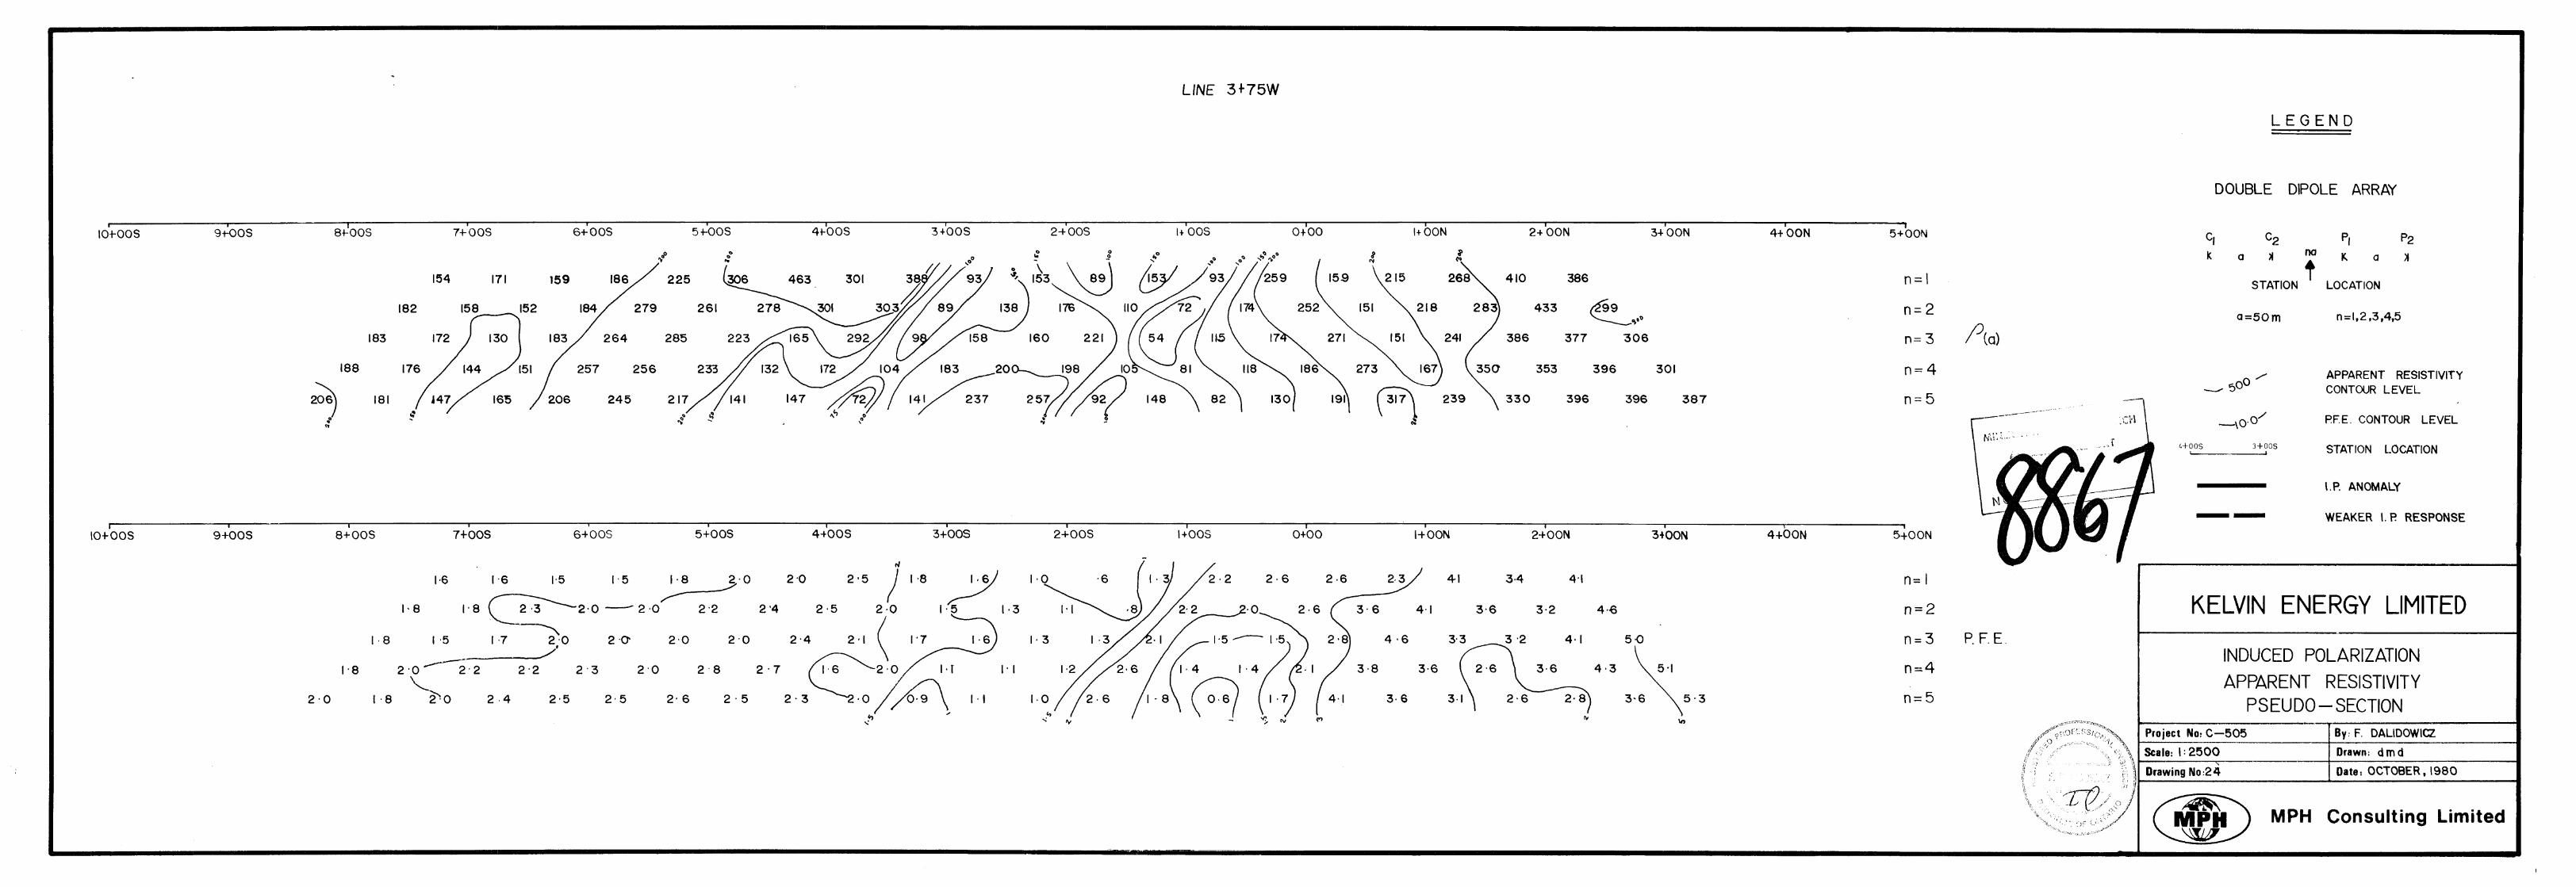
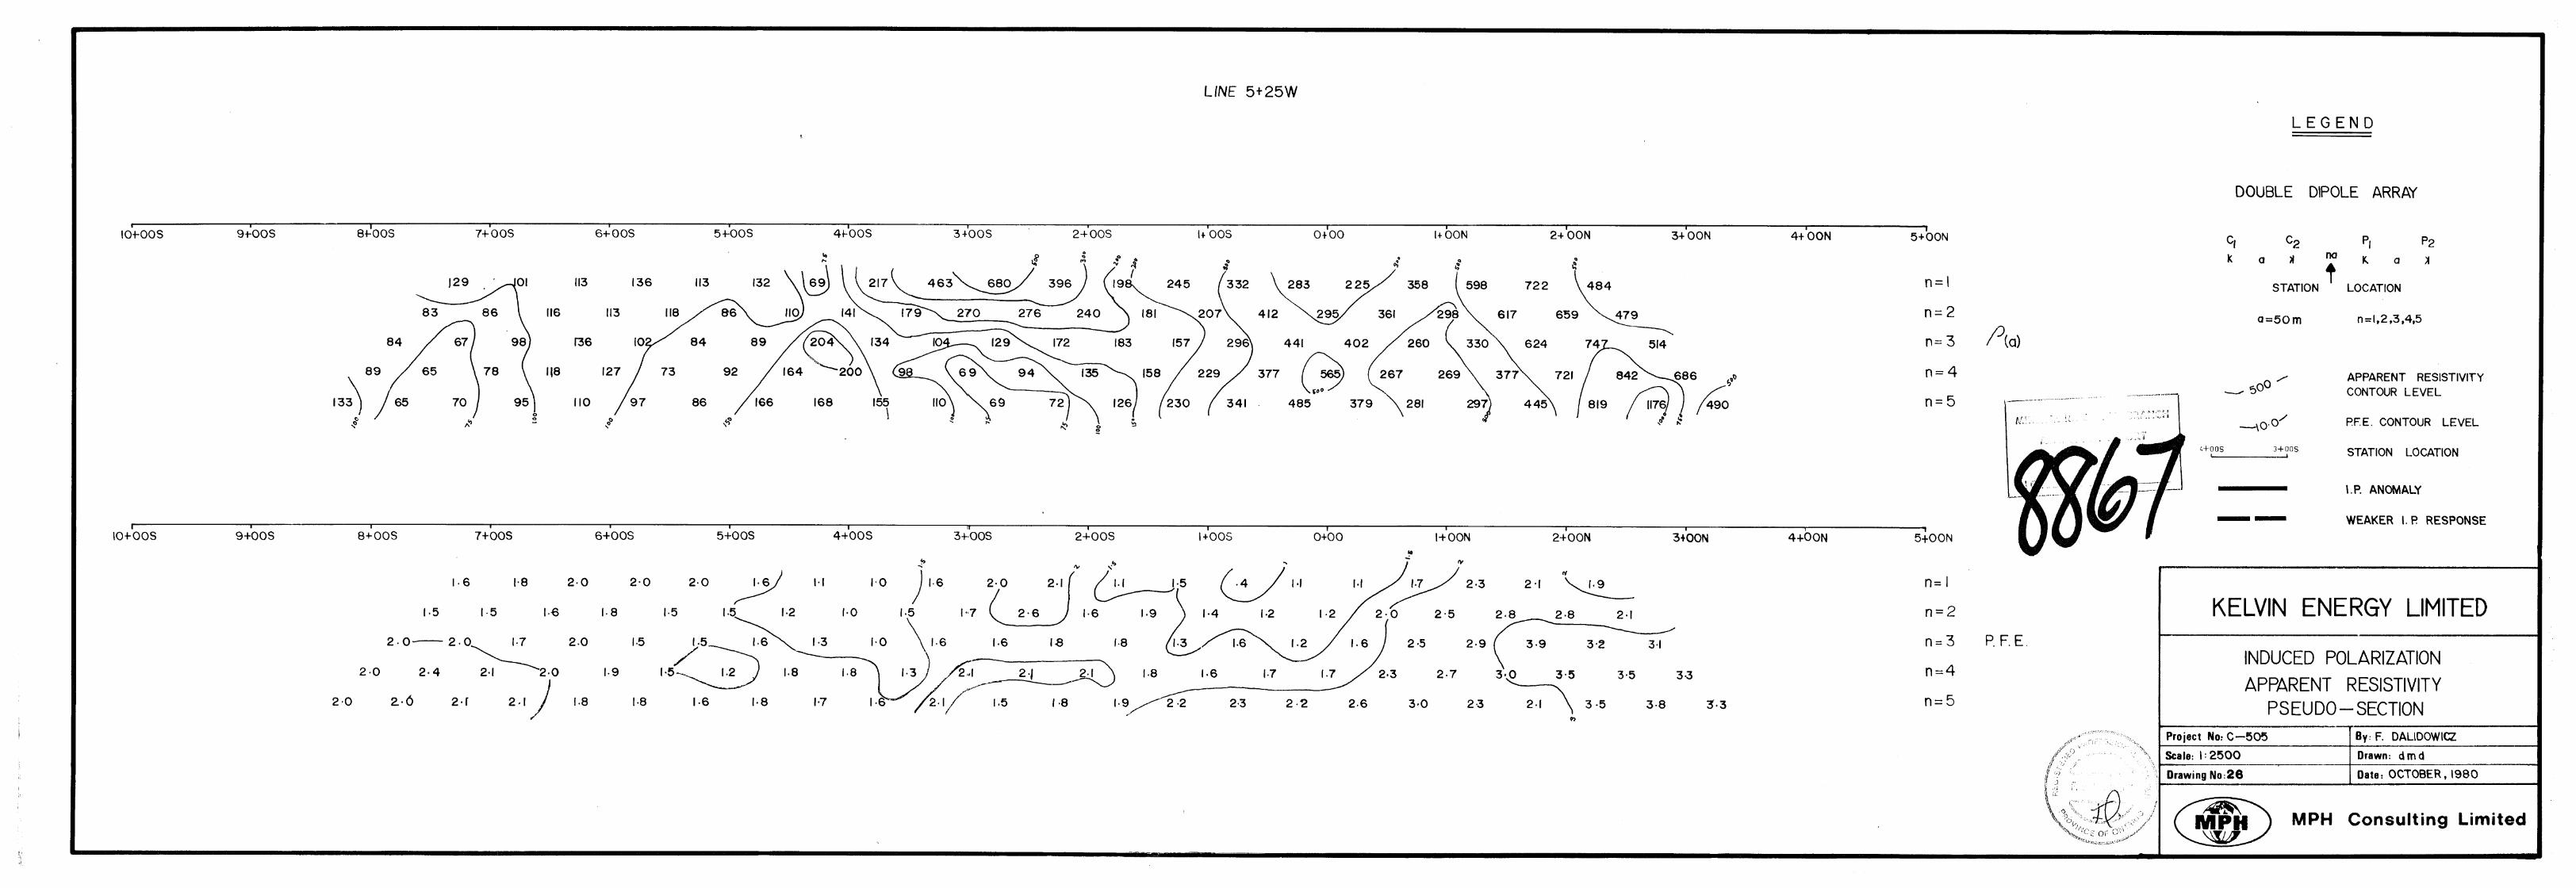
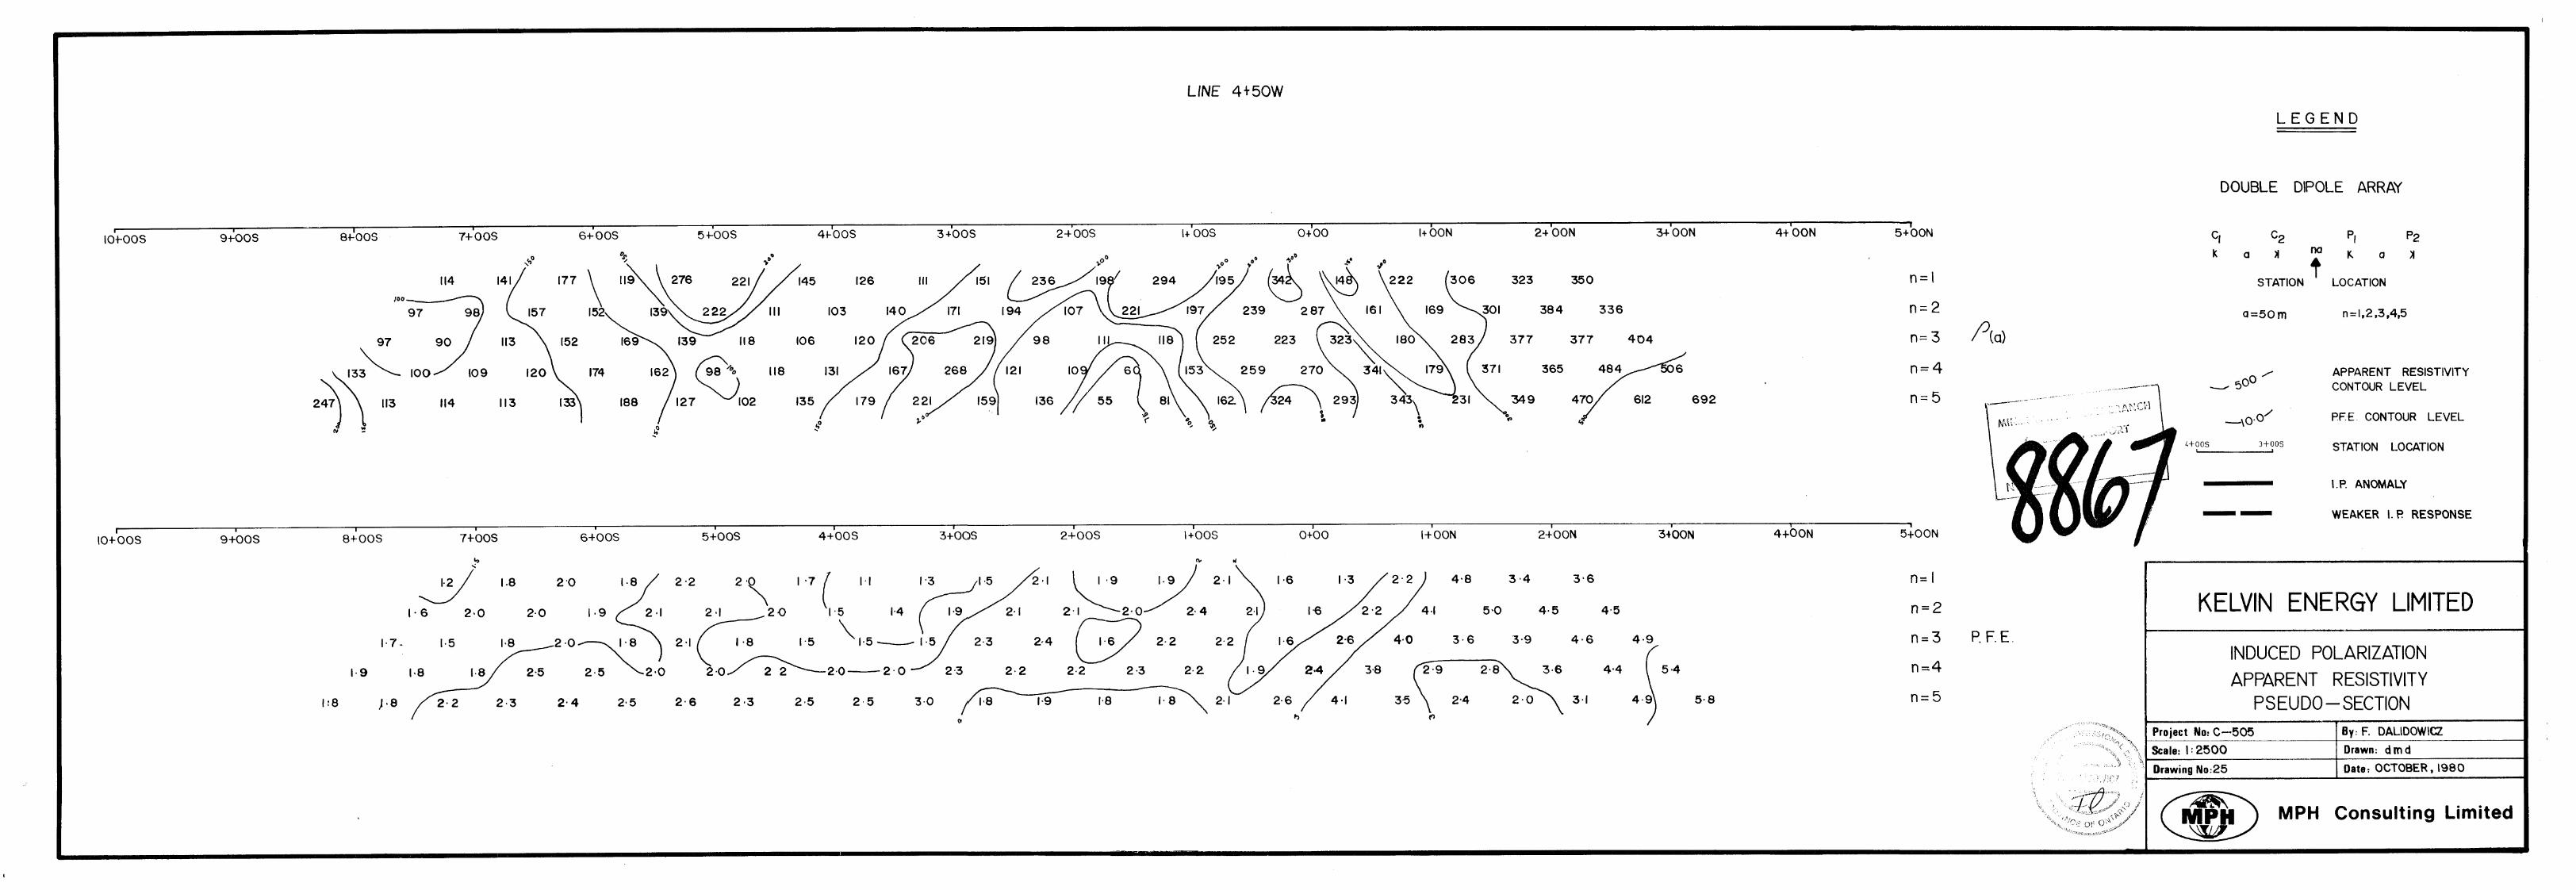
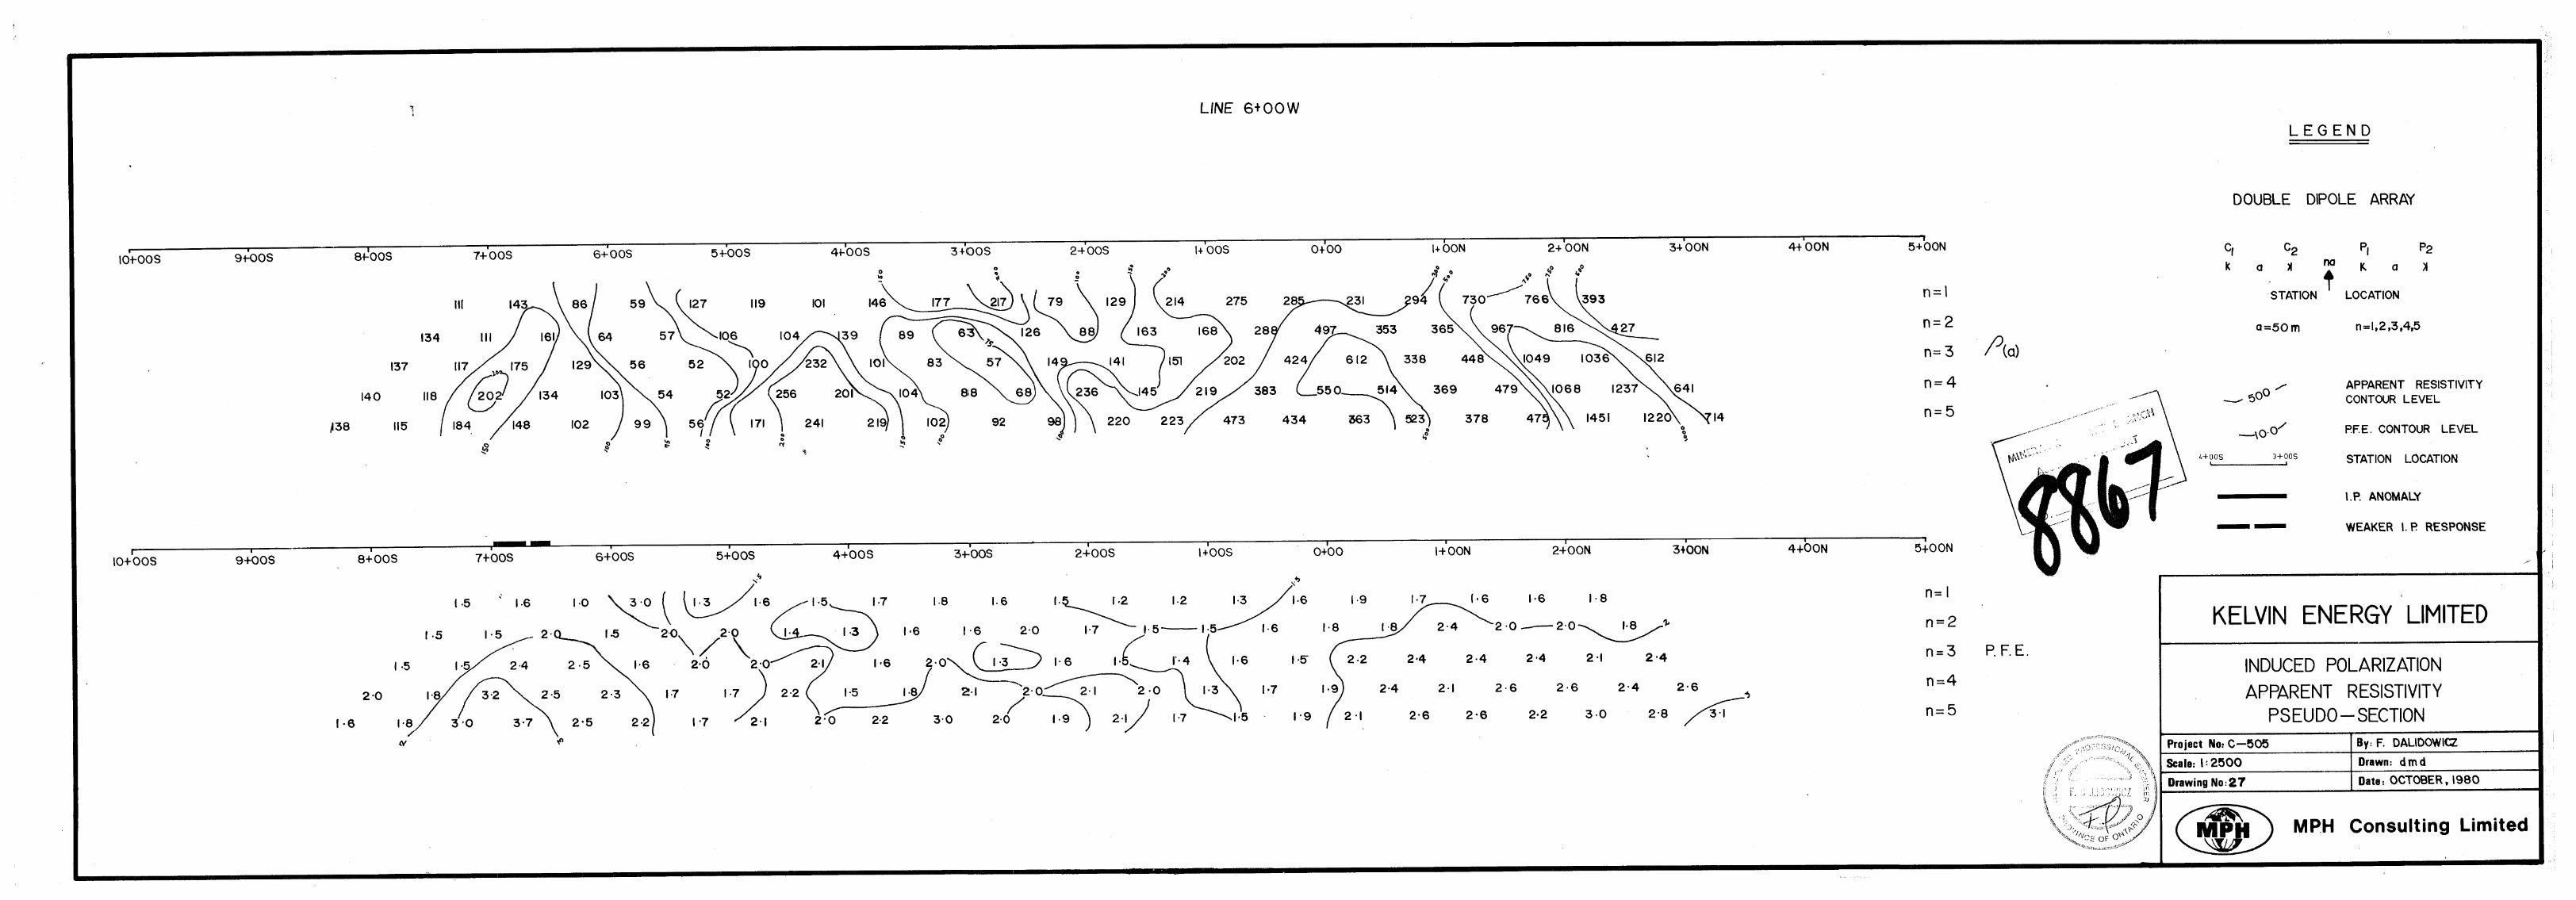
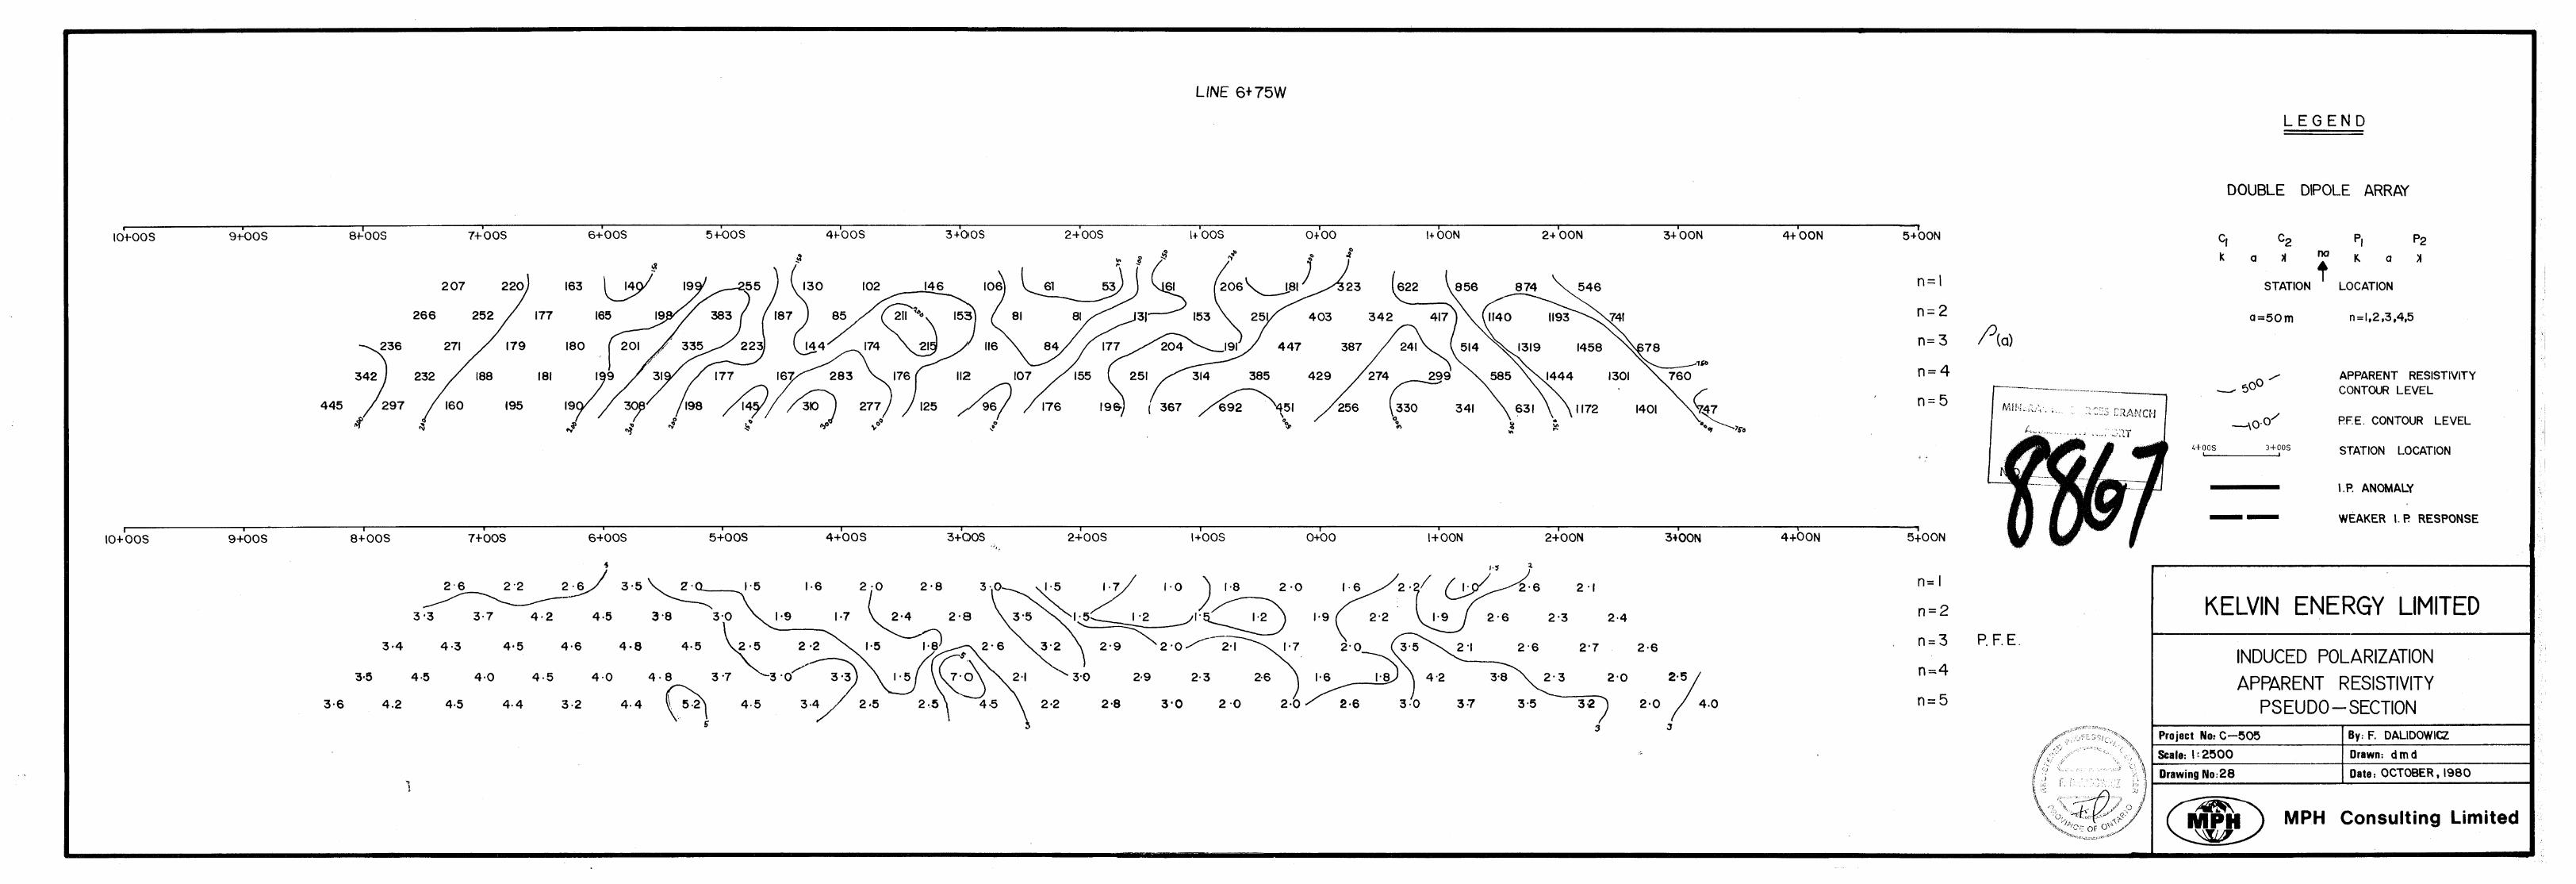
8.1 Induced Polarization-Apparent Resistivity Survey
The Induced Polarization and apparent resistivity data
are presented both as contoured pseudo-sections and con-
toured plan maps at scales of 1 :2500 and 1:2000 respec-
t ively .
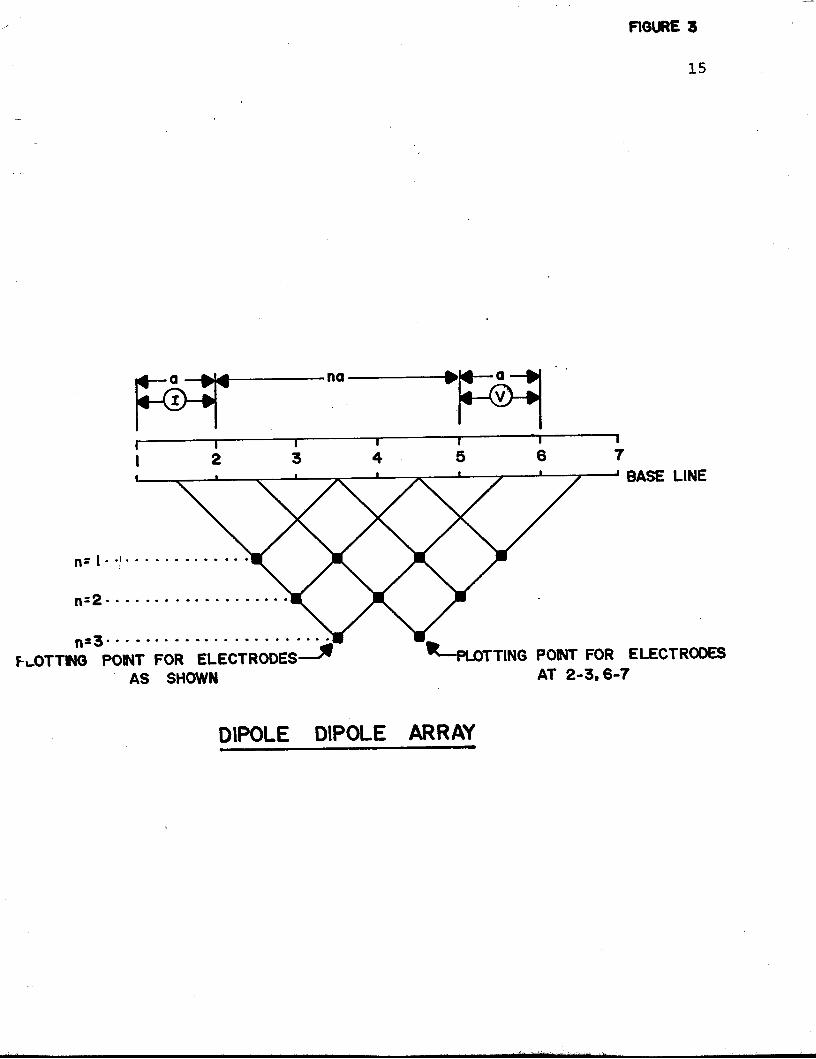
Figure 3 shows the plotting position for the IP and
resistivity data. The plotting point is midway between
the two electrode dipoles, and the section is thus a
depth sounding which outlines the IP and the 'apparent'
resistivity responses at different intervals of penetra-
tion. As the current penetration is dependent upon the
resistivities in the ground and the resistivity contrasts
between the overburden and bedrock, the depth of penetra-
tion is not a linear function of the electrode separa-
tion, but is heavily influenced by these inherent 'local'
resistivities. Thus the section is not a true vertical
representation pf the subsurface.
The presence of significant IP anomalies outlined by the
pseudosection is designated by solid anomaly bars. The
width of these bars gives a crude estimate of the width
of the polarizable zone. The dashed bars are representa-
tive of weaker or probable IP responses (see drawings
1 - 2 8 ) .
.
14
!
If the polarizable body is shallow relative to the elec-
trode separation used, the IP response from this source
will"doub1e peak" at the larger 'na' separations. Any
data contoured at these larger separations would show
two IP highs with the polarizable body centred between
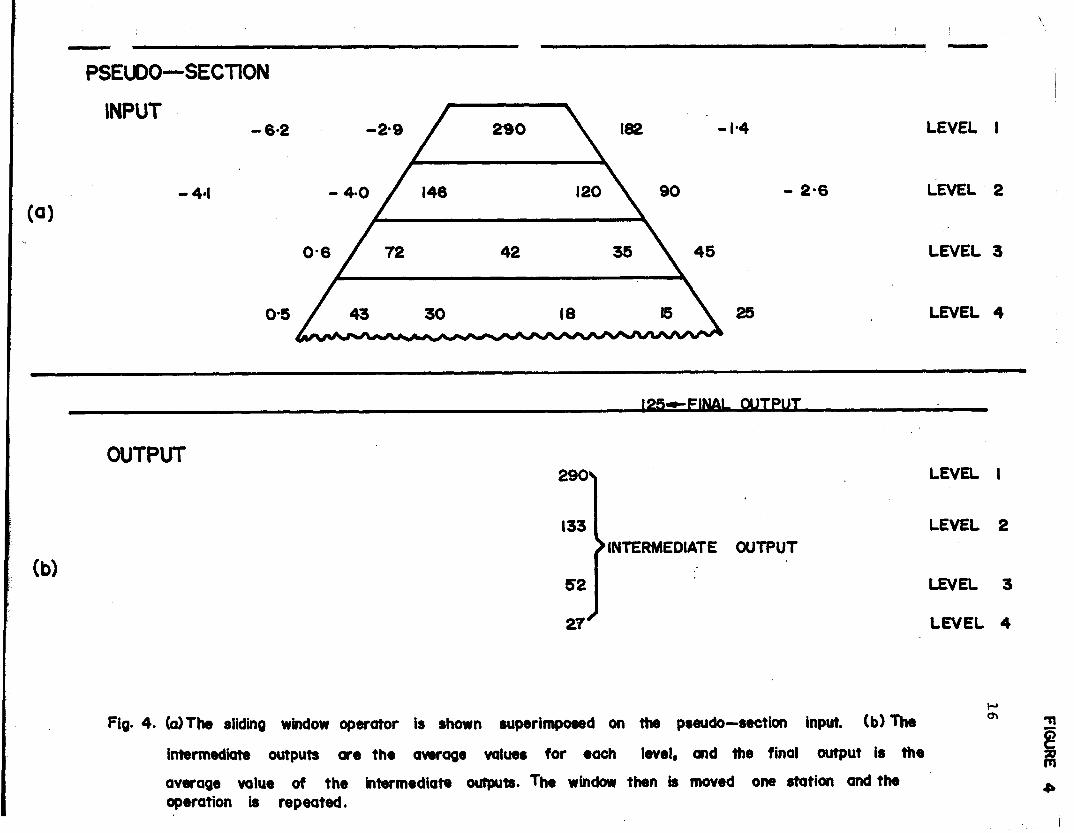
the two peaks. To clarify the data presentation, read-
ings at the various 'na' spacing for each station were
filtered for both IP and resistivity values using a
simple averaging method developed by D. C. Fraser (Nor-
thern Miner, June 19, 1980). This method yields a single
value for each station from all levels of the pseudo-
section. The most anomalous values overlie the polari-
zable body.
que.
Figure 4 describes the filtering techni-
On Maps 1 and 2, the IP data is contoured at intervals
of 1 PFE and the apparent resistivity data is contoured
at intervals of 200 ohm-meters.
The pseudo-sections are contoured in logarithmic incre-
ments.
8.2 VLF Electromagnetic Survey
Both the dip angle and the quadrature are plotted in pro-
file form at a vertical scale of 1 cm to 20 percent.
Location of conductor axes and conductor width are shown
for each interpreted conductor.
FIOUIE b
15
I I I I 1 I 1 I 2 3 4 5 6 7
7 n=3. . . . . . . . . . . . . . . * * . . . * .. -
A BASE LINE
L O T T H G POINT FOR ELECTRODES- -PLOTTING POINT FOR ELECTRUUt3 AS SHOWN AT 2-3.6-7
DIPOLE DIPOLE ARRAY
I
~
PSEUDO-SECTION
INPUT - 8.2 -2.9 /Y\ 182 - 1.4
- 2.6 - 4.1
0.5 25
LEVEL I
LEVEL 2
LEVEL 3
LEVEL 4
-FINAL OUTPUT I OUTPUT
290
133
(b) 52
2?'
1 J
LEVEL I
LEVEL 2 b INTERMEDIATE OUWUT
LEVEL 3
LEVEL 4
Fig. 4. b ) T b sliding window operotor is shown superimposed on the pseudo-section input. (b) ' h e
intermediate outputs are the mrage wlum tor each level, and the final output is the
average wlue at the htermediot9 outputs. The window then b moved one station and the operation is repeated.
17
The VLF data is presented at a horizontal scale of
1: 2000.
8 . 3 Magnetic Survey
The magnetic data are presented at a horizontal
of 1: 2000.
scale
The magnetic data are presented as isomagnetic contours
superimposed upon a plot of the corrected magnetic va-
lues at each station.
been subtracted from each reading in order to facilitate
data presentation.
except in areas of steep gradient where a 100 gamma in-
terval has been employed.
A value of 50,000 gammas has
The contour interval is 25 gammas
!
9. INTERPRETATION OF RESULTS
18
9.1 Induced Polarization-Resistivity Survey
No significant volume of polarizable material was out-
lined in the vicinity of the Butcher Boy and Carmi
showings indicating that there are no substantial sul-
phide concentrations present.
The baseline covering the two showings was also sur-
veyed (Drawing 1) but no positive response was obser-
ved. !
There is also no discernible resistivity contrast as-
sociated with these two showings.
There is a major IP anomalous zone which correlates di-
rectly with a resistivity 'low' in the vicinity of the
River Adit.
Maps 1 and 2 indicate that the River Adit anomaly is
an arcuate, northwest-southeast trending zone. It is
adjacent to a discrete zone of 1000-3000 ohm-meter ma-
terial that probably reflects a specific rock type,
possibly an intrusive.
19
!
The anomalous trend'is continuous between lines 2+25E
to 11+25E. Beyond these two limits, the zone appears
to terminate as suggested by the rapid closing of both
the PFE and resistivity contours along strike.
The IP response increases in amplitude eastward away
from the River Adit with the highest response located
between lines 6+00E to 8+253, Map 2 shows that the
lowest, i.e. most anomalous, resistivity values were
also found between lines 6+00E to 8+25E in direct corre-
lation with the increased IP response.
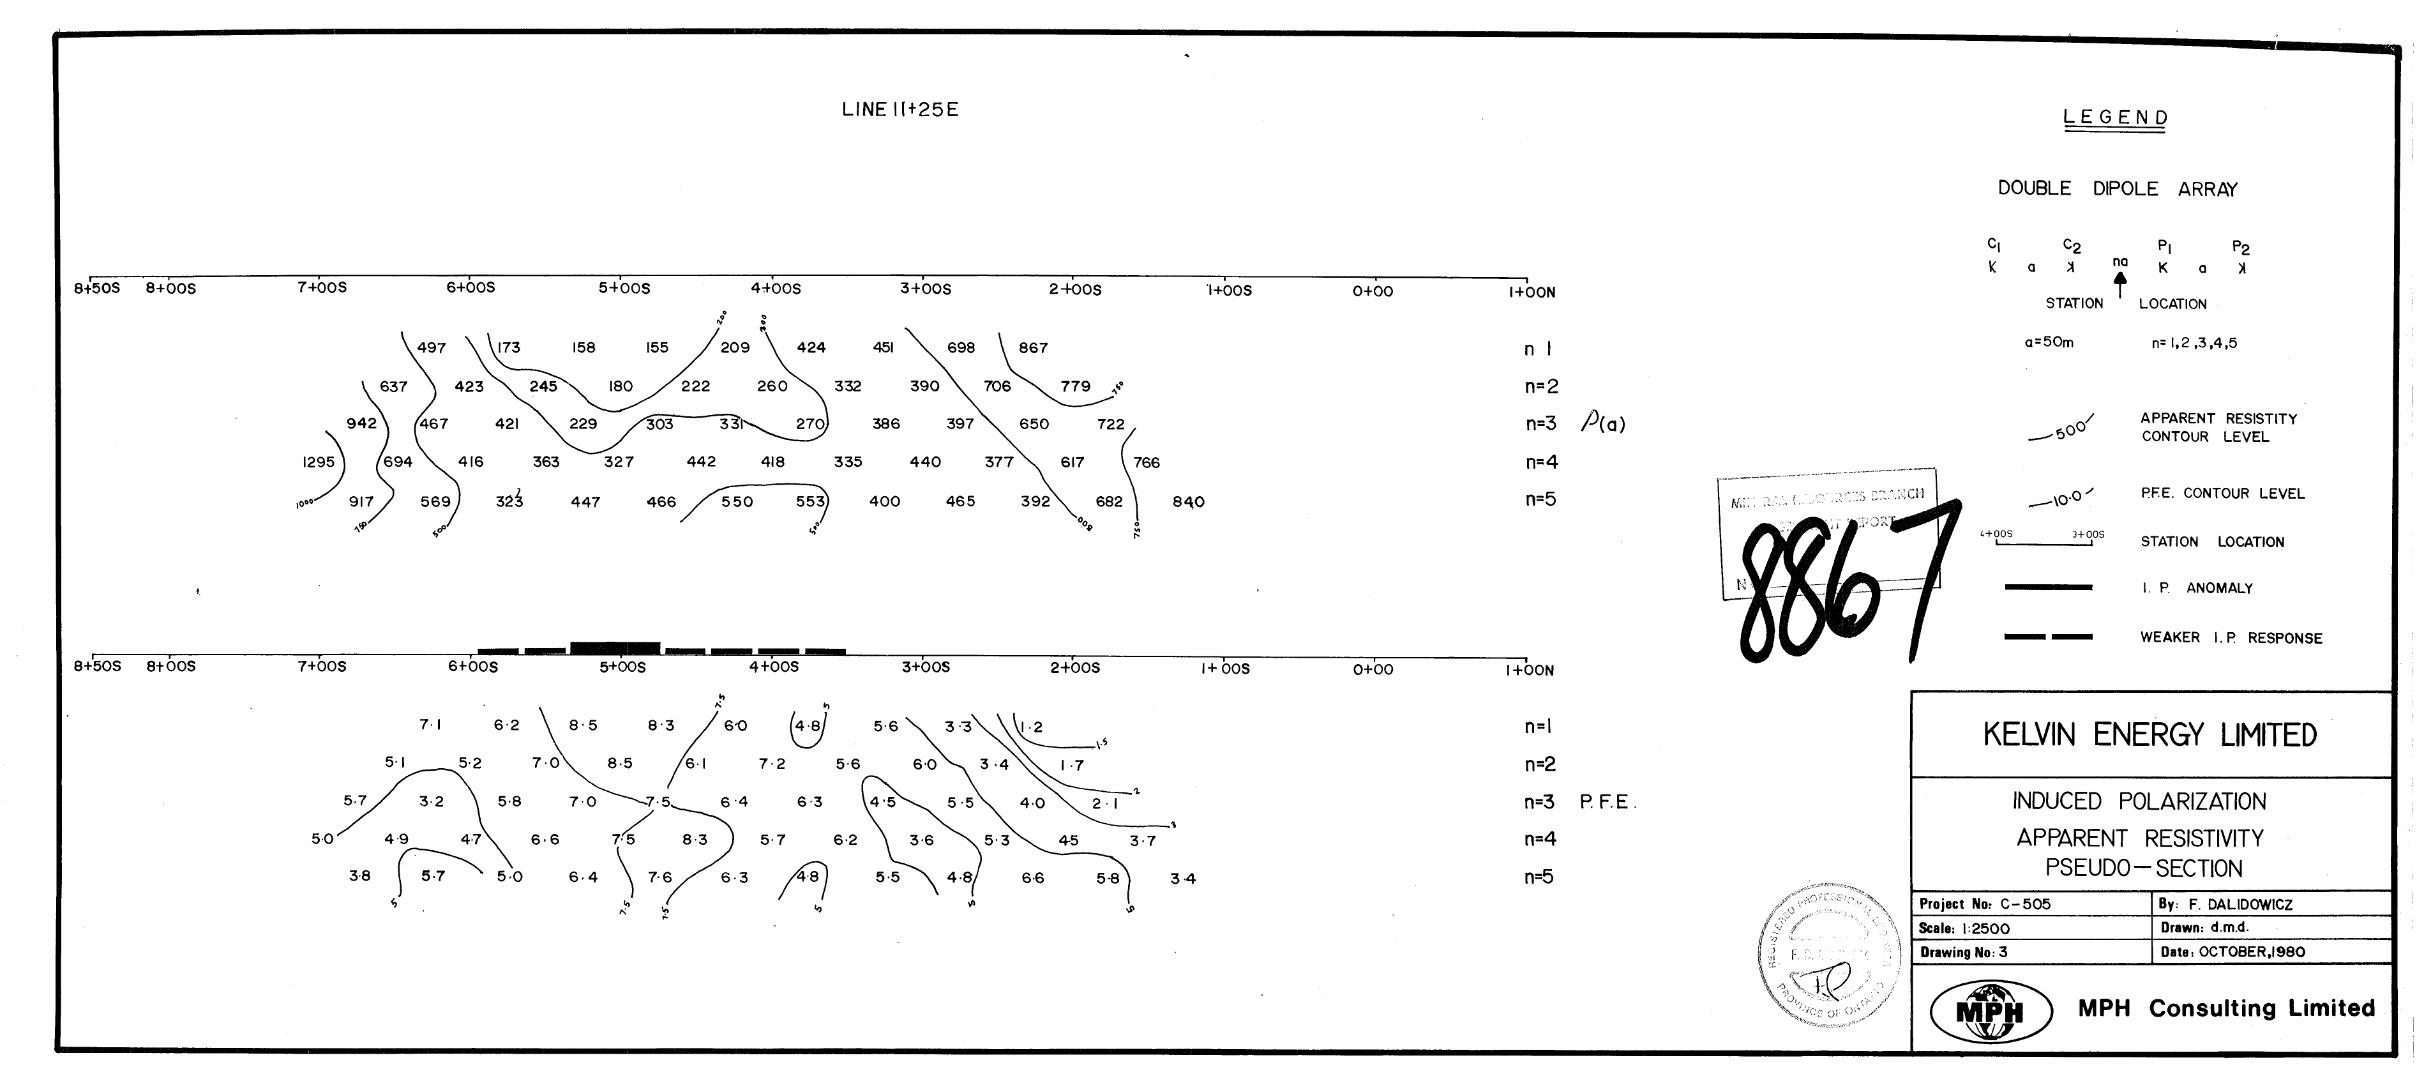
West of Line 8+25E, the polarizable body is interpreted
to be less than 25 meters in width. Eastward, anomaly
width appears to increase and is interpreted to be up to
50 meters.
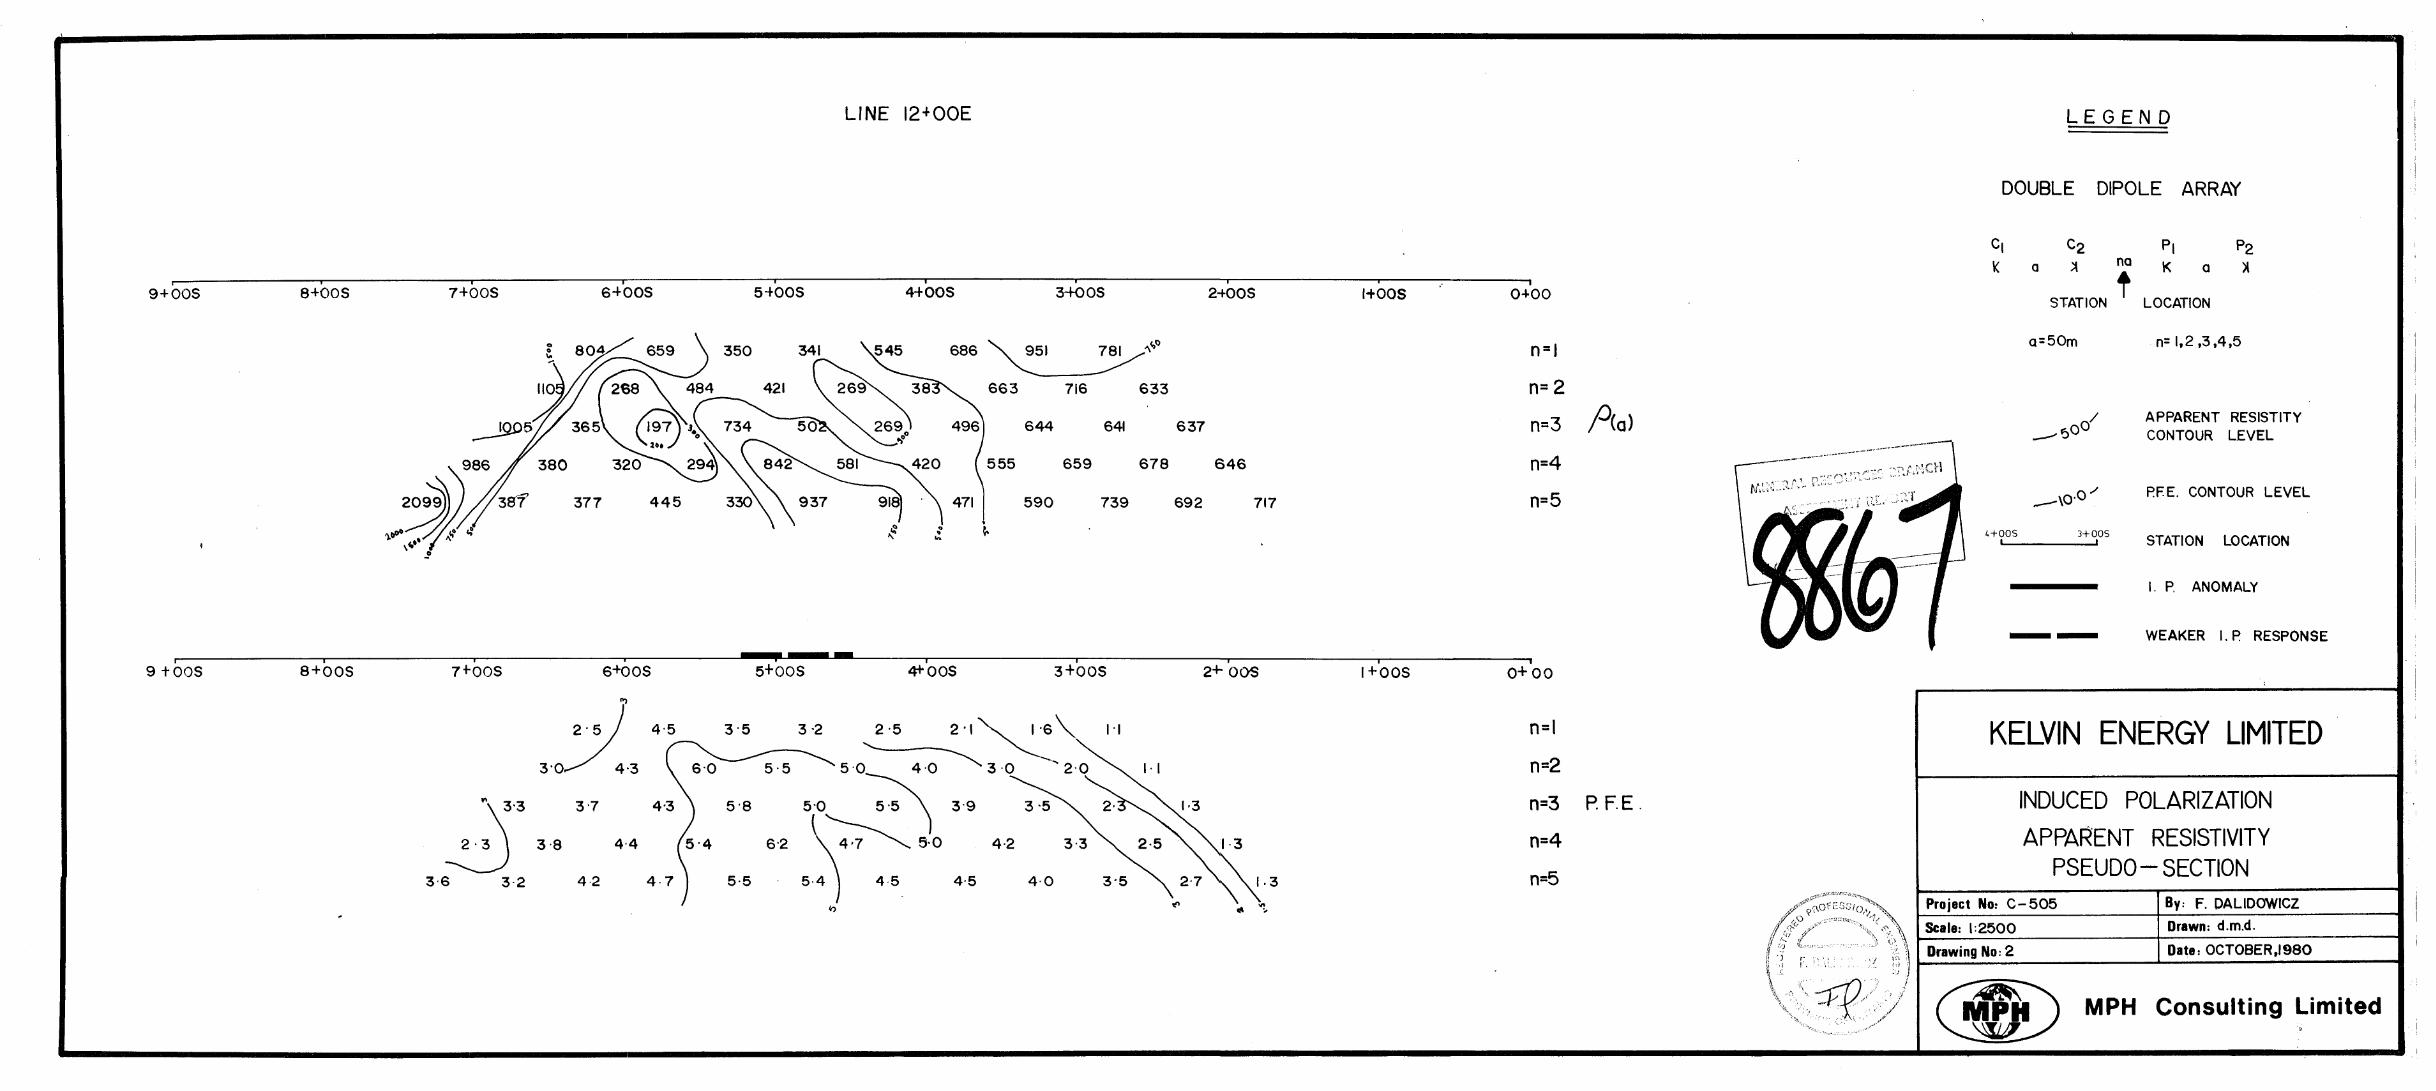
East of line 9+753 the PFE contours tend to indicate a
possible narrowing of the main polarizable zone, Alter-
natively, a second, possibly multiple, zone located at
approximately 4+00S between 10+50E and 12+00E may be pre-
sent.
The form of the River Adit IP anomaly is consistent with
that of a stringer-like to massive polarizable source
with a surrounding halo of disseminated material.
The observed presence of sulphides in the River Adit
20
suggests that sulphides are the polarizable causative
source of the IP anomaly and its previously unknown
eastern extension as mapped by the IP-resistivity sur-
vey.
The dip of the body is interpreted to be between 60°
and 90" to the south.
Depth to top is interpreted to be in the order of 25
meters between lines 4+50E to 6+75E and 35 to 50 meters
between lines 7+50E and 8+25E. East of line 8+25E,
depth to top is difficult to determine as the zone wi-
dens and is oriented oblique to the survey lines.
!
This anomalous zone appears to be continuous to depth.
The higher IP values are representative of at least 3
percent polarizable material by volume over a 50 meter
width.
There are two other partially defined IP anomalies with-
in the survey area, One zone occurs at the northern ex-
tremity of line 1+50W as outlined by the 5 PFE contour.
This IP anomaly may reflect a local change in rock type
rather than a discrete sulphide source. There is no as-
sociated resistivity contrast, The zone abuts onto the
1000-3000 ohm-meter central resistivity zone described
previously.
21
!
The third anomalous zone is partially defined by the
3 PFE contour in the southwestern extremity of the sur-
vey area between lines 6+00W and 6+75W. Inspection of
drawing Nos. 27 and 28 show that this zone widens dra-
matically between the two lines. A change in bedrock
lithologies with one having a higher polarizable back-
ground is suspected as the cause of these higher PFE
readings.
There are three major resistivity zones mapped within
the survey area. The most predominant zone is the cent-
ral core of 1000-3000 ohm-meter material. The compila-
tion map C-1 shows the approximate outline of this zone
at the 1000+ ohm-meter contour. Both the River Adit
IP zone and the northwestern ( 5 PFE Contour Levellzone
are peripheral to this resistive zone.
The second major anomaly is a large area of low resisti-
vity (200-400 ohm-meters) which borders the central resis-
tivity high at line O+OOE along a north-south trend. This
resistivity low extends to the western extent of the sur-
vey area.
Gradients between the two resistivity zones suggest the
possibility of a north-south structural break in the
vicinity of crossline O+OO. The resistivity contrast
across this postulated break indicates the presence of
two different rock units. L
1 22
9.2
?
The t h i r d r e s i s t i v i t y zone h o s t s t h e River Adi t I P t r e n d .
The I P zone a s mentioned correlates d i r e c t l y wi th a d i s -
t i n c t r e s i s t i v i t y ' l o w ' (less t h a n 400 ohm-meters).
VLF Elec t romagnet ic Survey
I n s p e c t i o n o f VLF p r o f i l e s (Map # 3 ) shows t w o prominent
sets o f conductor t r e n d s . An e a s t e r n se t s t r i k e s i n an
o v e r a l l nor thwes t -southeas t d i r e c t i o n and i s
s u b p a r a l l e l t o t h e River Ad i t IP t r e n d . The second set
i n t h e wes tern sector of t h e survey area, s t r i k e s no r th -
eas t - southwes t .
The m a j o r i t y of t h e s e VLF conductors are of poor q u a l i t y
and are i n t e r p r e t e d t o re la te t o s h e a r o r f a u l t zones.
There appea r s t o be a fundamental change i n s t r u c t u r e be-
tween t h e eas t and w e s t sectors o f t h e g r i d . The 'VLF
Trend Line ' on t h e compi l a t ion map (Map C-1) d i v i d e s t h e
area i n t o t w o i n t e r p r e t e d s t r u c t u r a l domains.
Two of t h e VLF conductors appear t o be r e l a t e d t o c u l -
t u r a l f e a t u r e s ; one VLF t r e n d fo l lows an abandoned r a i l -
way l i n e i n t h e e a s t e r n sector o f t h e area whi le t h e
second VLF t r e n d f o l l o w s Highway 3 3 . Readings taken i n
t h e v i c i n i t y of t h e highway were ex t remely no i sy due t o
t h e p re sence of a power l i n e p a r a l l e l i n g t h e highway.
One good q u a l i t y VLF bedrock conductor w a s mapped (Map
3 ) -
23
?
The 'good quality characteristic' is indicated by the
reverse quadrature profile in the vicinity of the dip
angle 'cross-over'. For the remaining poorer conduc-
tors, the quadrature is a direct image of the dip anqle
profile.
There is a direct correlation of this conductor with
the IP-resistivity anomaly between lines 4+50E, 8+253
and in the vicinity of the River Adit.
line 8+25E, this VLF anomaly is less well defined and
appears to be of poorer quality.
Eastward beyond
Between lines 111+25E and 12+00E, there is a broad conduc-
tive zone mapped between stations 4+00S and 5+00S.
broadness is interpreted to represent the presence of two
conductive zones. This area is located within the centre
of an anomalous IP zone.
The
9 . 3 Magnetic Survey
The magnetic contours (Map 4 ) indicate that the survey
area is within a complex magnetic environment. There
are no well defined magnetic signatures which could re-
late to specific structural trends or individual rock
units.
buted to the Butcher Boy, Carmi or River Adit gold work-
There are no magnetic responses directly attri-
ings.
There are relatively gentle magnetic gradients within
the western and northeastern portions of the survey
2 4
!
area. These areas are therefore probably underlain by
rocks having a lower bulk magnetic susceptibility than
the remainder of the grid.
Compilation map C-1 shows the outline of 3 weak trends
on the property interpreted from the magnetic pattern.
The northwest-southeast and northeast-southwest trends
follow a pattern similar to the VLF trends.
south set of weak magnetic trends does not correlate
with any of the remaining geophysical responses.
A north-
A magnetically-interpreted structural break crosses the
River Adit IP anomaly between lines 9+00E and 9+75E. A
structural break that subparallels the western portion
of this anomaly is also interpreted.
25
10. CONCLUSIONS
The Induced Polarization-resistivity survey has successfully
mapped a potential extension of the River Adit sulphide zone.
The anomaly extends for a minimum of 800 meters along strike.
The IP anomaly has a coincident resistivity 'low' which is
interpreted to reflect a zone of stringer to massive sul-
phides as the causative IP source.
There are no IP, resistivity or VLF electromagnetic respon-
ses over the Butcher Boy and Carmi showings, indicating the
absence of substantial amounts of any conductive/polarizable
material.
?
VLF electromagnetic conductors mainly reflect structural
trends. The western portion of the survey area is dominated
by northeast-striking conductors. Within the eastern sec-
tion, conductors are oriented predominantly in a northwest-
southeast direction. The latter set sub-parallels IP trends.
A strong VLF conductor correlates with the River Adit IP ano-
maly.
The magnetic pattern is complex. There are three sets of
shear or fracture sets interpreted. Two of these subparal-
lel VLF trends. The third appears to trend north-south.
26
11. RECOMMENDATIONS
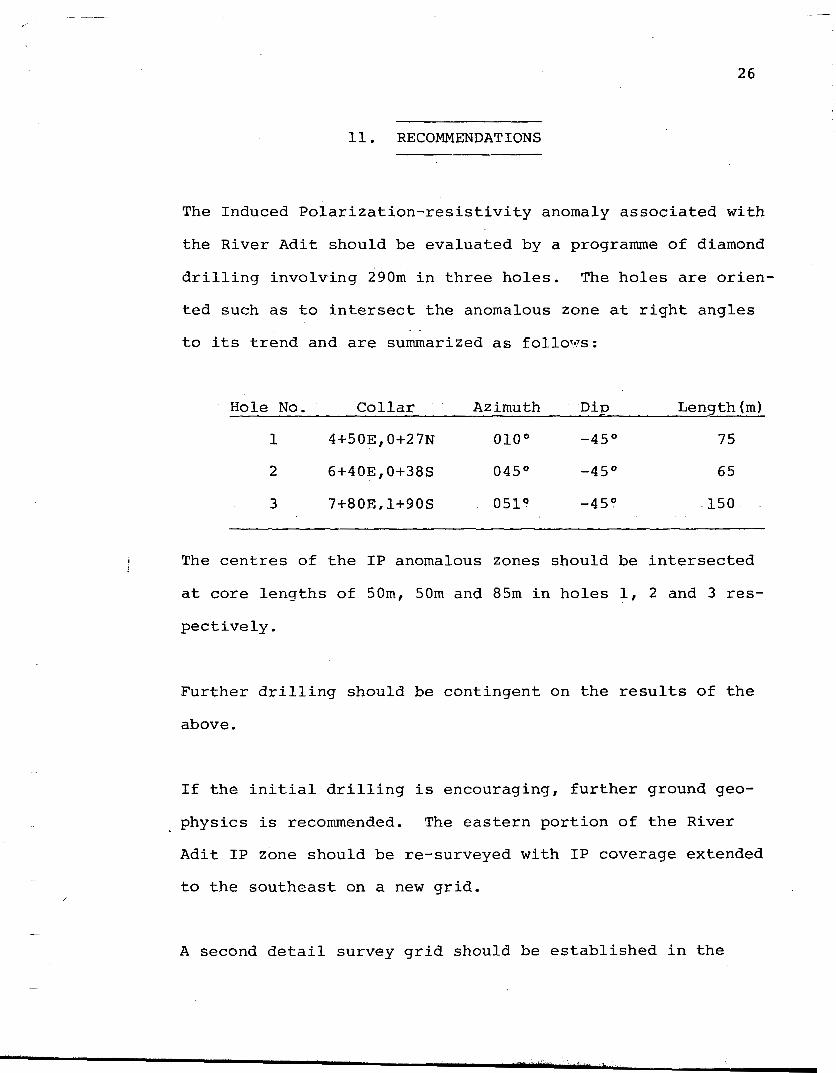
The Induced Polarization-resistivity anomaly associated with
the River Adit should be evaluated by a programme of diamond
drilling involving 290m in three holes.
ted such as to intersect the anomalous zone at right angles
The holes are orien-
to its trend and are summarized as follovs:
Hole No. Collar Azimuth Dip Length (m)
1 4+50E,0+27N o l o o -45O 75
2 6+40E,0+38S 045O -45O 65
3 .7+80E,1+90S 0510 -450 .150
I The centres of the IP anomalous zones should be intersected
at core lengths of 50m, 50m and 85m in holes 1, 2 and 3 res-
pectively.
Further drilling should be contingent on the results of the
above.
If the initial drilling is encouraging, further ground geo-
physics is recommended.
Adit IP zone should be re-surveyed with IP coverage extended
to the southeast on a new grid.
The eastern portion of the River
/
A second detail survey grid should be established in the
27
n o r t h - c e n t r a l p o r t i o n of t h e g r i d i n t h e v i c i n i t y of t h e
lega l c o r n e r p o s t f o r Minera l C l a i m N o s . 2 , 3 , 5 and 6 and
surveyed wi th I P , magnet ics ant3 VLF. Th i s area i s nea r t w o
converging s t r u c t u r a l and VLF t r e n d s and cove r s a p o r t i o n
of t h e River A d i t I P zone and a second I P zone p r e v i o u s l y
desc r ibed . Th i s area is of i n t e r e s t as s t r u c t u r e may be
of importance i n c o n t r o l l i n g s u l p h i d e d i s t r i b u t i o n .
FD:g
I
Calgary, A lbe r t a November, 1980
R e s p e c t f u l l y submi t ted ,
F. Dalidowicz, P.Eng.
28
CERTIFICATE
!
I, F. Dalidowicz of Calgary, Alberta certify that
1) I hold a Bachelor of Applied Science degree from Queen's
University in Kingston, Ontario and a Master of Science
(Applied) degree in Mineral Exploration from McGill
University in Montreal, 'Quebec.
2) I am a Member of the Association of Professional Engin-
eers of the Province of Ontario and have practised my
profession continuously since graduation.
3 ) I have based my conclusions and recommendations contain-
ed in this report on my experience and knowledge of in-
terpretation and application of geophysical methods and
on my previous experience in similar geological environ-
ments.
4 ) I hold no interest, directly or indirectly in ,this pro-
perty, other than professional fees, nor do I expect to
rest in the property or in Kelvin Energy
M 1 Frank Dalidowicz, P.Eng.
I
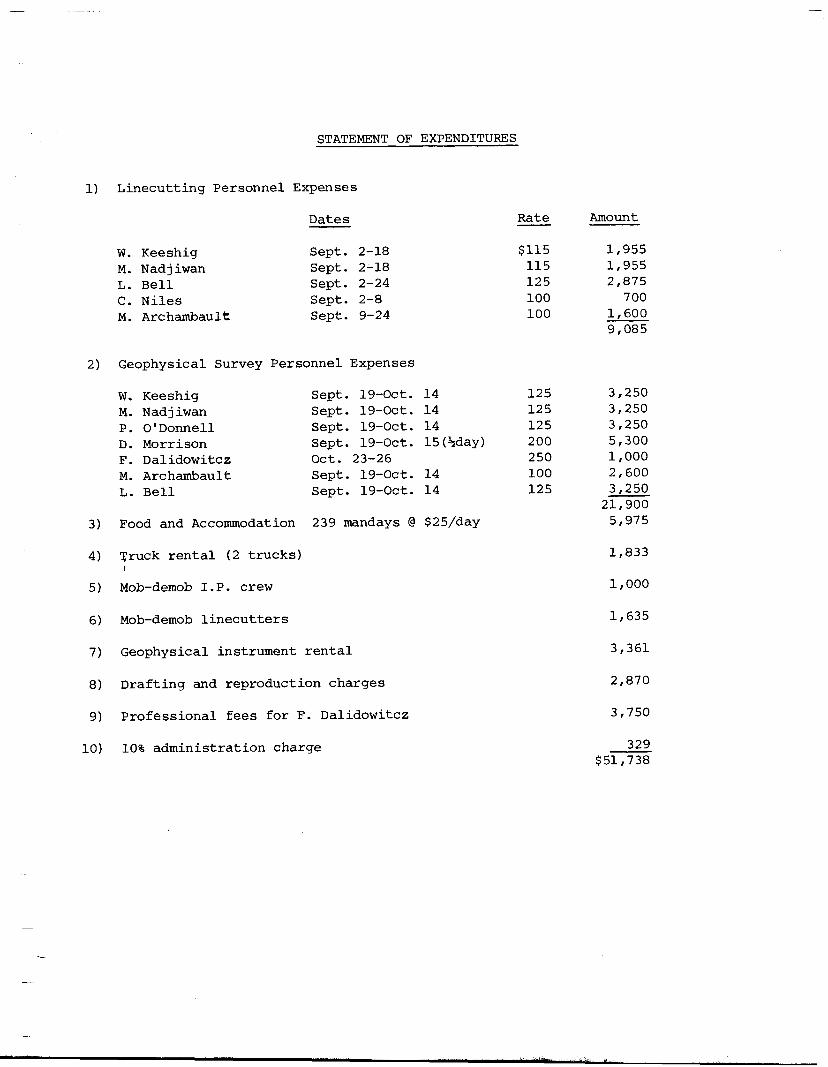
STATEMENT OF EXPENDITURES
1) Linecu t t ing Personnel Expenses
Dates
W. Keeshig Sept . 2-18 M. Nadjiwan Sept . 2-18 L. B e l l Sept. 2-24 C. N i l e s Sept . 2-8 M. Archambault Sept . 9-24
2) Geophysical Survey Personnel Expenses
R a t e - $115
115 125 100 100
W. Keeshig Sept . 19-0ct. 14 125 M. Nadjiwan Sept. 19-Oct. 14 125 P. O'Donnell Sept. 19-Oct. 14 125
F. Dalidowitcz O c t . 23-26 250
L. B e l l Sept . 19-Oct. 14 1 2 5
D. Morrison Sept . 19-Oct. 15 (%day) 200
M. Archambault Sept . 19-Oct. 14 100
3) Food and Accommodation 239 mandays @ $25/day
4) Truck r e n t a l (2 t r u c k s )
5) Mob-demob I.P. c r e w
6) Mob-demob l i n e c u b t e r s
7) Geophysical instrument r e n t a l
8) Dra f t ing and reproduct ion charges
9) P ro fes s iona l f e e s f o r F. Dalidowitcz
10) 10% admin i s t r a t ion charge
Amount
1 ,955 1 , 955 2,875
7 00 1,600 9,085
3,250 3 , 250 3,250 5 , 300 1 , 000 2,600 3,250
21,900 5,975
1,833
1,000
1,635
3,361
2,870
3 , 750
329 $51,738
APPENDIX I
30
!
Induced Polarization Equipment Specifications
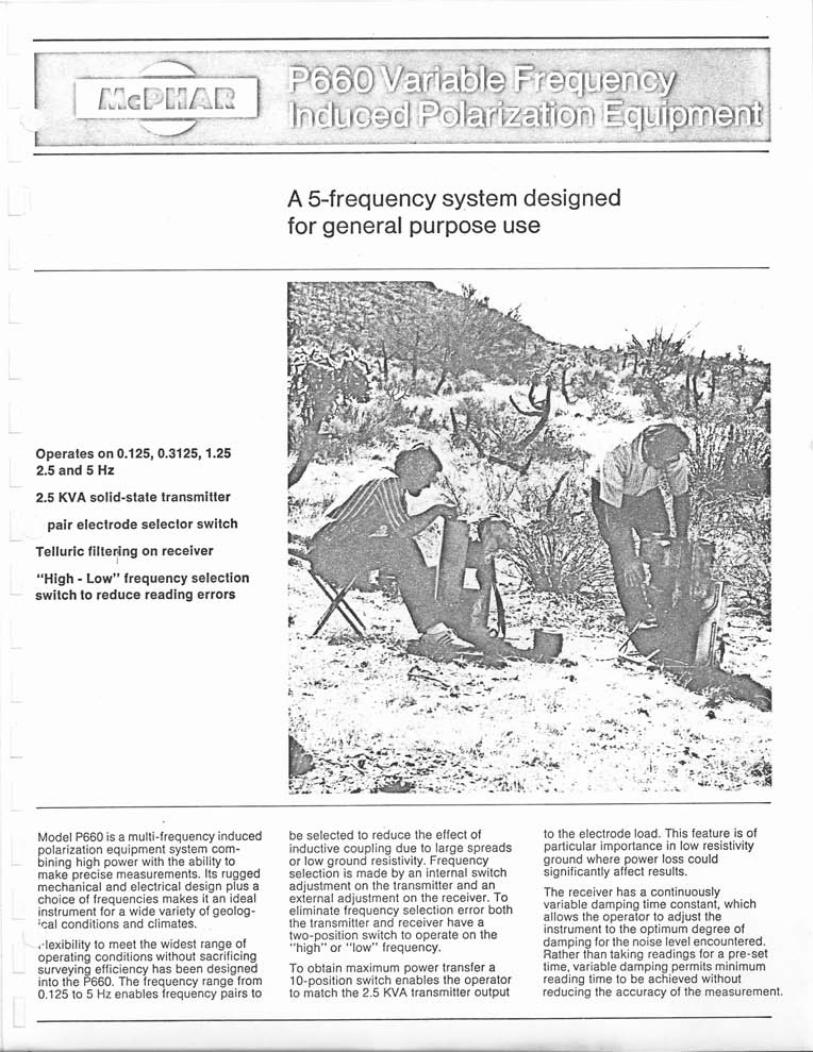
- A 5-frequency system designed for general purpose use
Operates on 0.125,0.3125,1.25 2.5 and 5 Hz
2.5 KVA solid-state transmitter
pair electrode selector switch
Telluric filte$ng on receiver
"High - Low" frequency selection switch to reduce reading errors
Model P660 is a multi-frequency induced polarization equipment system com- bining high power with the ability to make precise measurements. Its rugged mechanical and electrical design plus a choice of frequencies makes it an ideal instrument for a wide variety of geolog- 'cal conditions and climates.
.-lexibilitv to meet the widest ranae of operating conoit ons witnout saciific ng sJrveying eff'ciency has been aes gned into the P660 The IreqJency range from 0.125 to 5 Hz enables frequency pairs to
be selected to reduce the effect of inductive coupling due to large spreads or low ground resistivity. Frequency selection is made by an internal switch adjustment on the transmitier and an external adjustment on the receiver. To eliminate frequency selection error both the transmitier and receiver have a two-position switch to operate on the "high" or "low" frequency.
To obtain maximum power transfer a 10-position switch enables the operator to match the 2.5 KVA transmitter output
to the electrode load. This feature is of particular importance in low resistivity ground where power loss could significantly affect results
The receiver has a continuously variable damping time constant, which allows the operator to adjust the instrument lo the optimum degree of damping for the noise level encountered. ilather than taking readings for a pre-set time, variable damping permits minimum reading time to be achieved without reducing the accuracy of the measurement.
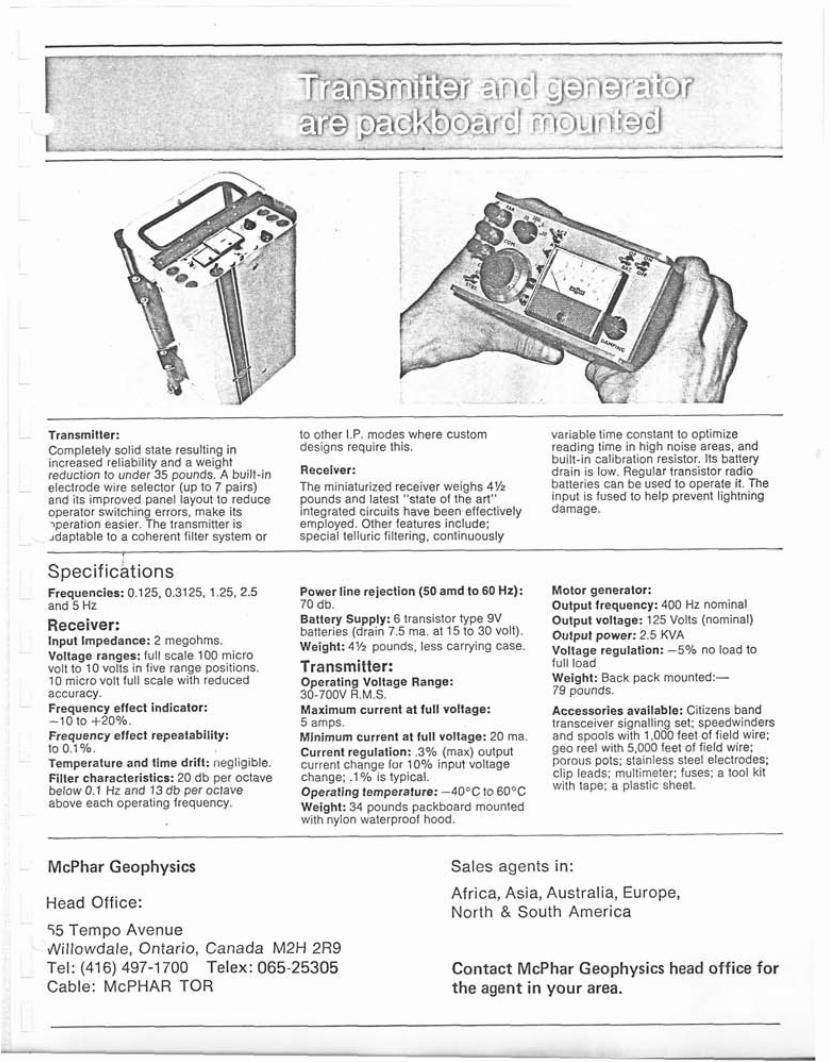
Transmitter: Completely solid state resulting in increased reliability and a weight reduction to under 35 pounds. A built-in electrode wire selector (up to 7 pairs) and its improved panel layout to reduce operator switching errors, make its ,peration easier. The transmitter is ldaptable to a coherent filter system or
to other I.P. modes where custom designs require this.
Receiver: The miniaturized receiver weighs 4% pounds and latest "state of the art" integrated circuits have been effectively employed. Other features include: special telluric filtering. continuously
variable time constant to optimize reading time in high noise areas, and built-in calibration resistor. Its battery drain is low. Regular transistor radio batteries can be used to operate it. The input is fused to help prevent lightning damage.
~
~ ~~
Specifications - Frequencies: 0,125, 0.3125, 1.25, 2.5
and 5 Hz
Receiver: batteries (drain 7.5 ma. at 15 to 30 Volt). output 2.5 KVA Input Impedance: 2 megohms. Voltage ranges: full scale 100 micro
10 micro volt full scale with reduced accuracy. 30-700V R.M.S. 79 pounds.
-10 to +20%. 5 amps. transceiver signalling set; speedwinders Frequency effect repeatability: Minimum current at full voltage: 20 ma. to 0.1 O h . Current regulation: ,301~ (max) output Temperature and time drift: negligible. current change for 10% input voltage Filler characteristics: 20 db per octave change; .1% is typical. below 0.1 Hz and 13 db per octave Operating temperature: -40'12 to 60°C above each operating frequency. Weight: 34 pounds packboard mounted
with nylon waterproof hood.
Power line rejection (50 amd to 60 Hz): 70 db. Battery Supply: 6 transistor type 9V
Weight: 4% pounds, less carrying case.
Transmitter:
Motor generator: Output frequency: 400 Hz nominal Output voltage: 125 Volts (nominal)
Voltage regulation: -5% no load to full load Weight: Back pack mounted:-
~~
volt to 10 volts in five range positions. Operating Voltage Range:
~ Frequency effect indicator: Maximum current at full voltage: Accessories available: Citizens band
and spools with 1,000 feet of field wire; geo reel with 5,000 feet of field wire; porous pots; stainless steel electrodes; clip leads; multimeter; fuses; a tool kit with tape; a plastic sheet.
~~
McPhar Geophysics Sales agents in:
Head Office: Africa, Asia, Australia, Europe, North 8. South America
~ 55 Tempo Avenue \Nillowdale, Ontario, Canada M2H 2R9 Tel: (416) 497-1700 Telex: 065-25305 Cable: McPHAR TOR
Contact McPhar Geophysics head office for the agent in your area.
31
~~
APPENDIX I1
Geonics EM16 VLF Electromagnetic Unit Specifications
VLF Electromagnetic Unit
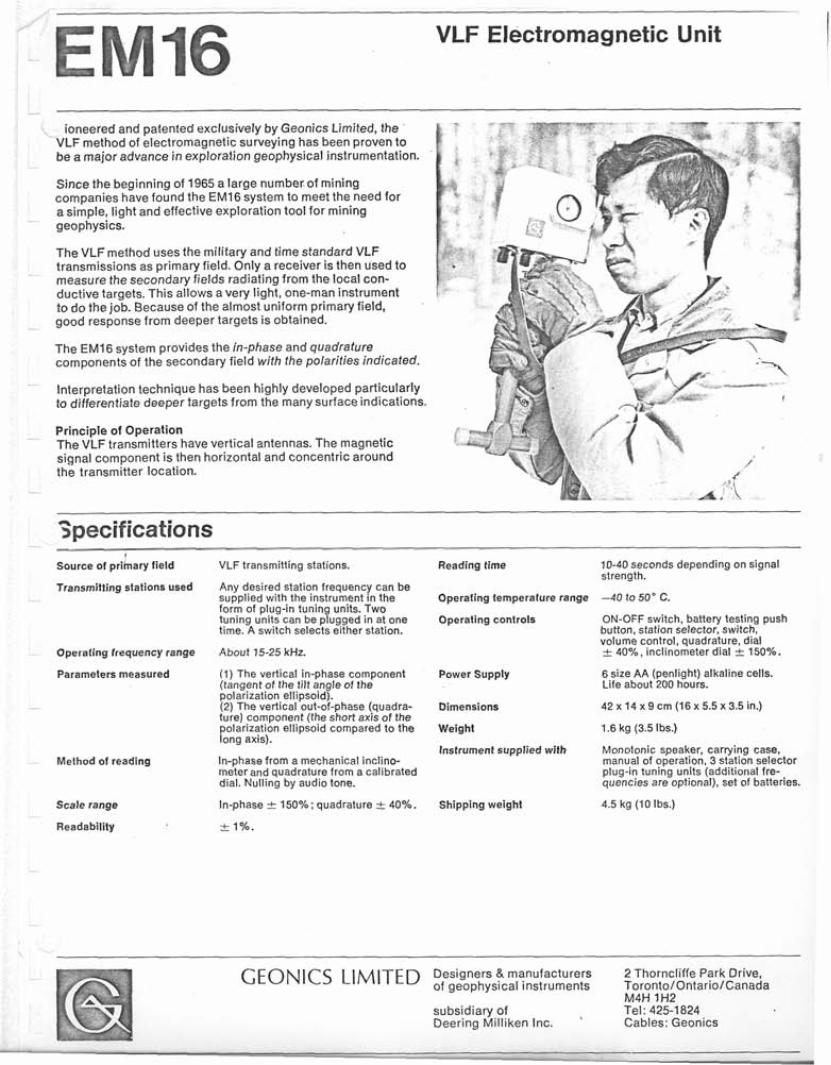
- ioneered and patented exclusively by Geonics Limited, the VLF method of electromagnetic surveying has been proven to be a major advance in exploration geophysical instrumentation.
Since the beginning of 1965 a large number of mining companies have found the EM16 system to meet the need for a simple, light and effective exploration tool for mining geophysics.
The VLF method uses the military and time standard VLF transmissions as primary field. Only a receiver is then used to measure the secondary fields radiating from the local con- ductive targets. This allows a very light, one-man instrument to do the job. Because of the almost uniform primary field, good response from deeper targets is obtained.
The EM16 system provides the in-phase and quadrature components of the secondary field with the polarities indicated.
Interpretation technique has been highly developed particularly to differentiate deeper targets from the many surface indications.
Principle of Operation The VLF transmitters have vertical antennas. The magnetic signal component is then horizontal and concentric around the transmitter location.
3ipecifications Source of priinary field
Transmitting stations used
Operaling frequency range
VLF transmitting stafions.
Any desired station frequency can be supplied with the instrument in the form of plug-in tuning units. Two tuning Units can be plugged in at one time. A switch selects either station.
About 15-25 kHz.
Reading time
Operating temperalure range
Operating controls
10-40 seconds depending on signal strength.
-40 to 50" C.
ON-OFF switch, battery testing push button, station selector. switch, volume control, quadrature, dial -t 40%, inclinometer dial -t 150%.
Parameters measured (1) The vertical in-phase component Power Supply 6 size AA (penlight) alkaline cells. (tanqent of the tilt ande of the Life about 200 hours. polahation ellipsoidj. (2) The vertical out-of-phase (quadra- lure) component (the short axis of the polarization ellipsoid compared to the lona axis).
Dimensions
Weight
42 x 14 x 9 cm (16 x 5.5x3.5 in.)
1.6 kg (3.5 Ibs.) ~~ I
Instrument supplied with Monotonic speaker, carrying case, manual of operation. 3 station selector plug-in tuning units (additional fre- quencies are optional). set of batteries.
Melhod 01 reading In-phase from a mechanical inclino- meter and quadrature from a calibrated dial. Nulling by audio tone.
Scale range
Readability
In-phase i 150%; quadrature t 40%.
r 1%.
Shipping weight 4.5 kg (10 Ibs.)
CEONlCS LIMITED Designe'rs &manufacturers 2Thorncliffe Park Drive, of geophysical instruments Toronto/Ontario/Canada
subsidiary of Tel: 425-1824 Deering Milliken Inc. ' Cables: Geonics
M4H 1 H 2
-10%
3QoX
*W'
*lo%
-
-,ox
-20%
- 3 o X
-6OX
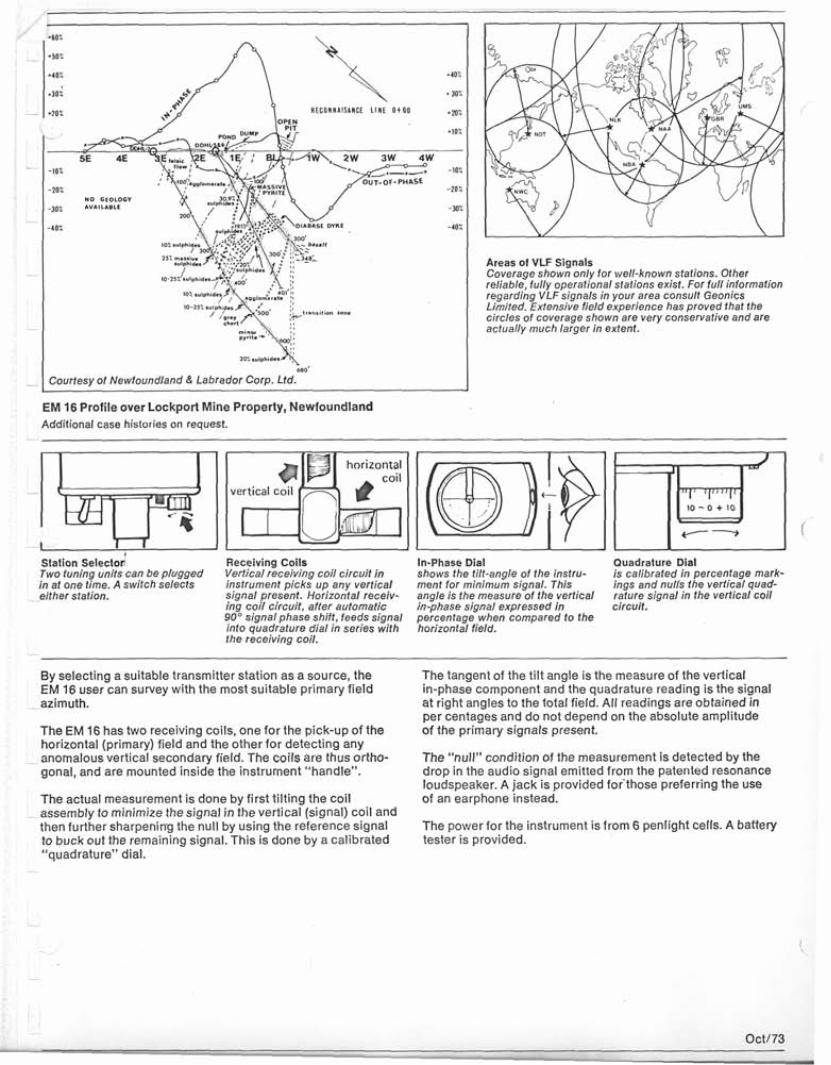
I 680' I Courtesy of Newfoundland 8. Labrador Corp. Ltd:
I
Areas of VLF Signals Coverage shown only for well-known stations. Other reliable, fully operational stations exist. For full information regarding VLF signals in your area consult Geonics Limited. Extensive Field experience has provedthat the circles of coverage shown are very conservative and are actually much larger in extent.
EM 16 Profile over Lockport Mine Property, Newfoundland Additional case histories on request.
-
Station Selector Two tuning units can be plugged in at one time. A switch selects
.either station
Receiving Coils In-Phase Dial Quadrature Dial Vertical receiving coil circuit in instrument picks up any vertical signal present. Horizontal recelv- ing coil circuit, after automatic in-phase signal expressed in circuit. 90' signalphase shift, feeds signal into quadrature dial in series with the receiving coil.
shows the tilt-angle of the instru- ment for minimum signal. This angle is the measure of the vertical
percentage when compared to the horizontal field.
is calibrated in percentage mark- ings and nulis the vertical quad- rature signal in the vertical coil
By selecting a suitable transmitter station as a source, the EM 16 user can survey with the most suitable primary field
The EM 16 has two receiving coils, one for the pick-up of the horizontal (primary) field and the other for detecting any
- anomalous vertical secondary field. The coils are thus ortho- gonal, and are mounted inside the instrument "handle".
The actual measurement is done by first tilting the coil --assembly to minimize the signal in the vertical (signal) coil and
then further sharpening the null by using the reference signal to buck out the remaining signal. This is done by a calibrated "quadrature" dial.
- azimuth.
The tangent of the tilt angle is the measure of the vertical in-phase component and the quadrature reading is the signal at right angles to the total field. All readings are obtained in per centages and do not depend on the absolute amplitude of the primary signals present.
The "null" condition of the measurement is detected by the drop in the audio signal emitted from the patented resonance loudspeaker, A jack is provided foithose preferring the use of an earphone instead.
The power for the instrument is from 6 penlight c e k A battery tester is provided.
Octl73
32
A P P E N D I X I11
Geometrics Portable Proton Magnetometer - Model G-816

~
/
- Instrument owision
PORTABLE PROTON MAGNETOMETER - MODEL G-816
.k 1 gamma sensitivity and repeatability
Very small size and weight: less than 12 Ibs complete with batteries and Sensor
* Over 10.000 readings per set of alkaline "D" cell (flashlight) batteries
*
.k Provision to attach sensor to carrying harness for use without staff
Pushbutton operation- numeric display directly in gammas
Total field rneasurernents- independent of orientation-no calibration-no leveling
The Model G-816 is a complete portable magnetometer for all man-carry field applications. As an accu- rate yet simple to operate instrument, it features an outstanding combination of one gamma sensitivity and repeatability, compact size and weight, operation on standard universally available flashlight batteries, ruggedized packaging and very low price.
The G-816 magnetometer allows precise mapping of very small or large amplitude anomalies for ground geophysical surveys, or for detail follow-up to aeromagnetic reconnaissance surveys. It is a rugged, light- weight, and versatile instrument, equally well suited for field studies in geophysics, research programs or other maqnetic mapping application where low cost, dependable operation and accurate measurements
~
~ . -
are requlred.
For marine, airborne or ground recording systems consider GeoMetrics Models G-801, G-803, and G-826A. 61978 geoMefiicr -
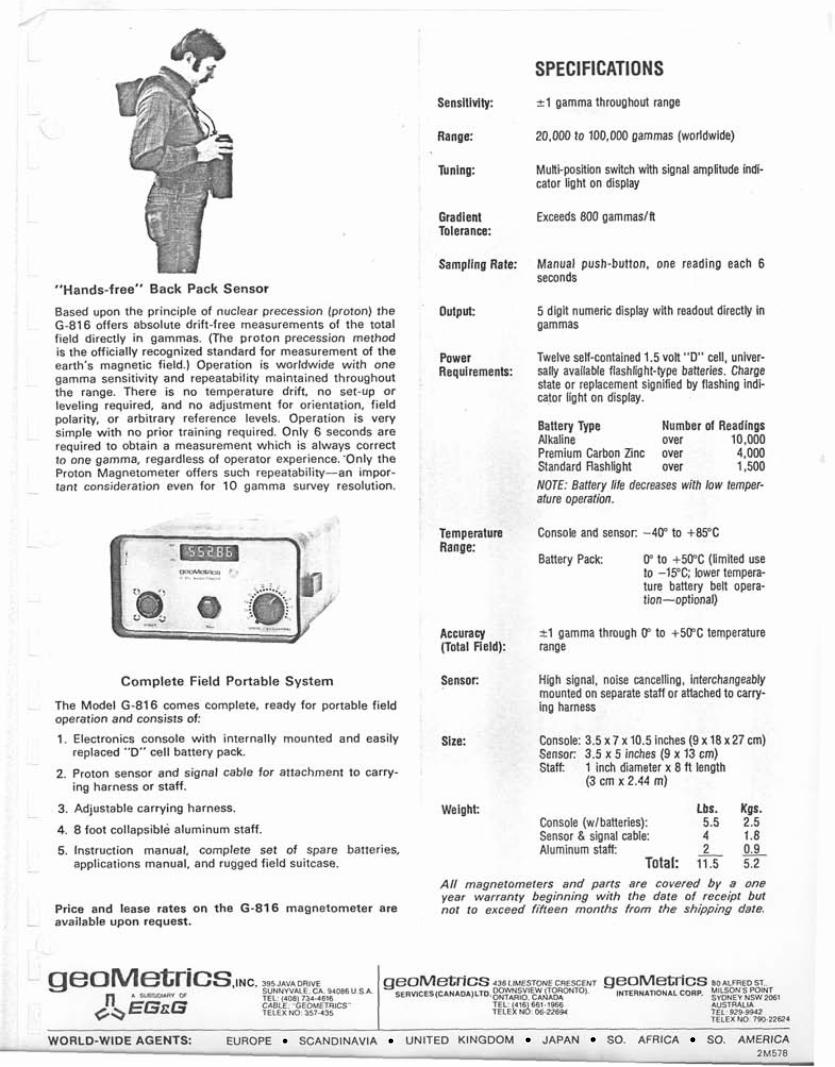
SPECIFICATIONS Sensitivity: -tl gamma throughout range
Range:
Tuning:
20,000 to 100,000 gammas (worldwide)
Multi-position switch with signal amplitude indi- cator light on display
Gradient Exceeds 800 gammaslfl Tolerance:
Sampling Rate: Manual push-button, one reading each 6 seconds
5 digit numeric display with readout directly in gammas
Twelve self-contained 1.5 voit "D" cell, univer- sally available flashlight-type batteries. Charge state or replacement signified by flashing indi- cator light on display.
Battery Type Number of Readings Alkaline over 10,000 Premium Carbon Zinc over 4,000 Standard Rashlight over 1,500 NOTE: Battery rife decreases with low temper- ature operation.
Console and sensor: -40" to +8VC
Battery Pack
output:
Power Requirements:
Temperature Range:
0" to +5PC (limited use ro -15°C; lower ternpera- ture battery belt opera- tion-optional)
Accuracy (Total Field): range
Sensor:
t 1 gamma through D" to +5D"C temperature
High signal, noise cancelling, interchangeably mounted on separate staff or attached to carry- ing harness
Console: 3.5 x 7 x 10.5 inches (9 x 18 x 27 cm) Sensor: 3.5 x 5 inches (9 x 13 cm) Stat 1 inch diameter x 8 ft length
(3 cm x 2.44 rn)
Size:
Weight: Lbs. Kgs. Console (wlbatteries): 5.5 2.5 Sensor & sianal cable: 4 1.8
SUNNYVALE. CA. 94086 U.S.A T E L (408, 734-4616 C A N E : "GEOMETRICS e* EGcG TELEX N O 351~435
geoMetrics,,,,. 395 JAVADRIVE " A S"BB1DI~P" OF
"Hands-free" B a c k Pack Sensor
Based upon the principle of nuclear precession (proton) the G-816 offers absolute drift-free measurements of the total field directly in gammas. (The proton precession method is the officially recognized standard for measurement of the earth's magnetic field.) Operation is worldwide with one gamma sensitivity and repeatability maintained throughout the range. There is no temperature drift, no set-up or leveling required, and no adjustment for orientation, field polarity, or arbitrary reference levels. Operation is very simple with no prior training required. Only 6 seconds are required to obtain a measurement which is always correct to one gamma, regardless of operator experience:Only the Proton Magnetometer offers such repeatability-an impor- tant consideration even for 10 gamma survey resolution. -
geoMetrics 436 MESTONE CRESCENT geoMetrics ~OALFREO ST.. S E R Y I C E ~ ~ C ~ I I I ~ O ~ l L ~ O , D O W N S V I E W ORONTOI. INTERNA~ONAL COR~, MILSONS SYDNEY NSW POINT 2067 ONTbRIO. C&OA
TEL: 416 661 1965 AUSTRALIA
TFI F X N" 741.12624 rEi. s 2 s - w ~ r& NA. oe:mw
C o m p l e t e Field Por tab le S y s t e m
The Model G-816 comes complete, ready for portable field operation and consists of:
1. Electronics console with internally mounted and easily
2. Proton sensor and signal cable for attachment to carry-
3. Adjustable carrying harness.
4. 8 foot collapsible aluminum staff
5. Instruction manual, complete set of spare batteries,
replaced "D" cell battery pack.
ing harness or staff.
applications manual, and rugged field suitcase.
Price and lease rates on the G-816 magnetometer are - available upon request.
2 0.9 Total: 11.5 5.2
- - Aluminum staff:
A l l magnetometers a n d parts are covered b y a one year warranty beginning with the dare of receipt but not to exceed fifleen months from the shipping date.
I ... . . .
WORLD-WIDE AGENTS EUROPE SCANDINAVIA UNITED KINGDOM JAPAN SO AFRICA SO. AMERICA 2M578
I_--_-