Embed Size (px)
Citation preview
REPORT
ON
POST ENUMERATION SURVEY (PES) OF U-DISE DATA
OF
20 SCHOOLS OF CHANDIGARH U.T (Primary to Higher Secondary)
2012-2013
Submitted to State Project Director
Sarva Shiksha Abhiyan Society U.T Chandigarh
Foundation For Developmental Research Post Box 914, Post Office, Sector 22, Chandigarh-160022 Regd. Off. SCO 415-416, Sector 35-C, Chandigarh-160022
Email: [email protected] & [email protected] Fax: 0172-2709830, Website: www.fdrchandigarh.org
Phone: 0172-2709830, 75890-77820
ii
REPORT ON
POST ENUMERATION SURVEY (PES) OF U-DISE DATA
OF
20 SCHOOLS OF CHANDIGARH U.T (Primary to Higher Secondary)
2012-2013
Submitted to State Project Director
Sarva Shiksha Abhiyan Society U.T Chandigarh
Foundation For Developmental Research Post Box 914, Post Office, Sector 22, Chandigarh-160022 Regd. Off. SCO 415-416, Sector 35-C, Chandigarh-160022
Email: [email protected] & [email protected] Fax: 0172-2709830, Website: www.fdrchandigarh.org
Phone: 0172-2709830, 75890-77820
iii
Preface The present study (Post Enumeration Survey of U-DISE Data) was sponsored by
Sarva Shiksha Abhiyan Society, Chandigarh U.T. The survey of 20 sample schools
was conducted by the staff of Foundation for Developmental Research, Chandigarh.
The collected data was compiled and analyzed by the staff of the Foundation. The
report highlights the findings on the deviation between the PES data and U-DISE
data. The PES data was collected from 20 sample schools, functioning in rural-urban
areas of U.T, Chandigarh. The sample schools are functioning under government,
private and private aided managements.
The study has been completed successfully within the stipulated period with
cooperation of Education Department and schools. Thus, we are grateful for their
kind cooperation. With respect, we express our gratitude to Shri Upkar Singh,
Director Public Instructions (DPI Schools) cum-State Project-Director (SPD), Sarva
Shiksha Abhiyan Society, U.T Chandigarh for sponsoring the study. Our sincere
thanks are also to Shri Chanchal Singh, Project Coordinator (SSA), Shri Baldev Singh,
Assistant Controller (Finance and Accounts), Shri Dilbagh Singh, Mission Coordinator
(SSA) and Shri Dinesh Kumar, Assistant Project Coordinator (EMIS) for their valuable
guidance and timely support during the study period.
Our sincere gratitude is also to all the concerned principals/head teachers and other
respondent teachers of surveyed schools, who helped us in providing authentic
information relating to PES data. Their contributions are sincerely acknowledged.
We also express our indebtedness to all of them, who made contributions directly or
indirectly for timely and successful completion of this study.
Sd/- Dr. Pritpal Singh
Project Coordinator Foundation For Developmental Research
Chandigarh
iv
Project Team
Dr. Pritpal Singh
Project Coordinator
M.Sc., Ph.D (India & UK), MRIC. C. Chem (London), MES, MACS (USA), MDCMA (USA), LMIPA (Bombay), LMIHPA (Lucknow), MIABL (USA)
Mr. Maninder Singh
Field Supervisor/Investigator
M.A. Sociology (Punjab University)
Ms. Sarbjeet Kaur
Data Analyst and Compilation
M.Com (Punjabi University), Post Graduation Diploma in Computer Application
Mr. Kishan Singh
Field Investigator
B.A. (Garhwal University).
v
Contents Preface
Project Team
Contents
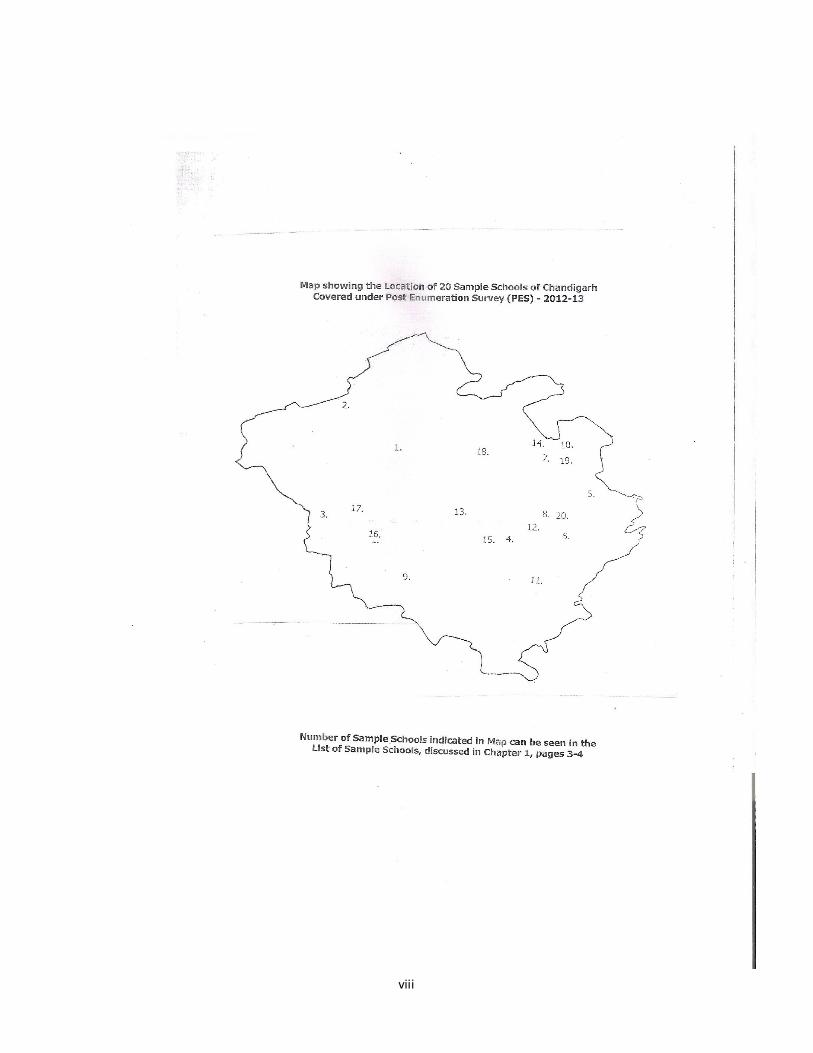
Map Showing Location of 20 Sample Schools
Abbreviations
Numeric Deviation between PES Data and U-DISE Data (Summarized)
Text and Tables Page No. Chapter-I
Introduction 1-4
Background Unified District Information System of Education (U-DISE) Study Area Sample Schools Field Agency - Foundation for Developmental Research (FDR)
Chapter-II
Objectives and Methodology 5-8
Main Objective Sample Location of Sample Schools Management Status Strategy Used for Collection of PES Data Status of Tool used for Post Enumeration Survey (PES) Data Analysis Report Writing Limitations of the Study
vi
Chapter-III
Comparative Status of PES Data with U-DISE Data 9-25
Survey Status of PES Data Location of Sample Schools under PES and U-DISE data Rural-Urban Deviation
Deviation in U-DISE Codes of PES and U-DISE data Qualification of Principal/Head teacher
Experience being Principal/Head Teacher Class-wise Status of Schools Type of Schools Management wise Deviation Year of Establishment of Sample Schools Year of Recognition of Schools Status of Shift School in PES and U-DISE Data Status of Residential Schools Status of Affiliation Board Pre-Primary Section Attached to Sample Schools CCE Status at Elementary Level Examination Results Status of Teaching Staff
Status of School Building Status of Class Rooms Availability of Furniture Condition of Class-rooms Availability Status of Land for Additional Classrooms Availability of Separate Room for Principals/ Head Teacher Functional Toilets and Urinals Main Source of Drinking Water Availability of Electricity Connection Type of Boundary Wall Facility of Library Subscription of Newspaper/Magazine Facility of Playground in Sample Schools Status of Functional Computers Status of Medical Check-up of Students Conducted Last Year Status of Ramp for Disabled Student to Access Classrooms Status of Children Enrolled in Current Academic Year (2012-13)
vii
Chapter-IV
Investigators’ Observations 27-33
Name of Investigators, U-DISE School Code and Date of Visit Was the School Open on the First Day of the Visit? Number of Visits to the Schools to Get Information Initial Reaction of the Principal/ Head Teacher Response of the Principal/ Head Teacher to Provide Information Availability of Records in School Investigators’ Observations Pertaining to Different Aspects Status of Mid-day-Meal Quality of Mid-day-Meal Status of Seating Arrangement for Children Chapter-V
Summary 34-41
(Findings and Suggestions) Annexes 42-113
PES and U-DISE data
U-DCF Format
Photos Showing Different Activities of Some Sample Schools 114…
viii
ix
Abbreviations
BRC = Block Resource Coordinator
CWSN = Children with Special Need.
CRC = Cluster Resource Coordinator
CCE = Continues and Comprehensive Evaluation
U-DCF = Unified Data Capture Format
U-DISE = Unified District Information System for Education
DPI (S) = Director Public Instruction (Schools)
EMIS = Educational Management Information System
MDM = Mid Day Meal
OBCs = Other Backward Classes
PES = Post Enumeration Survey
RMSA = Rashtriya Madhyamik Shiksha Abhiyan
SCs = Scheduled Castes
SPD = State Project Director
SEMIS = Secondary Education Management Information System
SSA = Sarva Shiksha Abhhiyan
STs = Scheduled Tribes
UT = Union Territory
SMC = School Management Committee
TLE = Teaching Learning Equipment
CAL = Computer Aided Learning
ORC = Other Reserve Class
x
Numeric Deviation between PES Data and U-DISE Data (Summarized)
Table highlights quantitative value between PES data and U-DISE data as discussed
in this report.
Deviation level of PES and U-DISE Data Variables Quantitative value Deviation
PES Data U-DISE Data Number Percentage Location of school Rural 3 3 0 0 Urban 17 17 0 0 Total Deviation 20 20 0 0 School category Government 10 10 0 0 Private Aided 2 2 0 0 Private 7 7 0 0 Other (KVS-Centre) 1 1 0 0 Total Deviation 20 20 0 0 Type of school Co-Education 19 19 0 0 Girls only 1 1 0 0 Total Deviation 20 20 0 0 Lowest class (Primary) First Class 19 19 0 0 6th Class 1 1 0 0 Total Deviation 20 20 0 0 Highest class 8th 3 3 0 0 10th 8 8 0 0 12th 9 9 0 0 Total Deviation 20 20 0 0 School management (Elementary Stage) Government 10 10 0 0 Private 7 7 0 0 Private Aided 2 2 0 0 KVS 1 1 0 0 Total Deviation 20 20 0 0 School management (Secondary Stage) Government 8 8 0 0 Private 6 6 0 0 Private Aided 2 2 0 0 KVS 1 1 0 0 Total Deviation 18 18 0 0 School management (Higher Secondary Stage) Government 4 4 0 0
xi
Private 3 3 0 0 Private Aided 2 2 0 0 KVS 1 1 0 0 Total Deviation 10 10 0 0 Establishment Year of School 1951-1960 2 2 0 0 1961-1970 2 2 0 0 1971-1980 6 5 1 5 1981-1990 3 4 1 5 1991-2000 2 2 0 0 2001-2010 5 5 0 0 Total Deviation 20 20 2 10 Shift School (used as part) Yes 6 6 0 0 No 14 14 0 0 Total Deviation 20 20 0 0 Residential School Yes 1 1 0 0 No 19 19 0 0 Total Deviation 20 20 0 0 Affiliation Board (For Secondary and Higher Secondary Stage) CBSE 17 17 0 0 ICSE 1 1 0 0 Total Deviation 18 18 0 0 Attachment of Pre-primary Section to Sample Schools Yes 18 18 0 0 No 2 2 0 0 Total Deviation 20 20 0 0 Status of CCE at Elementary Level Yes 18 18 0 0 No/NA 2 2 0 0 Total Deviation 20 20 0 0 Type of School Buildings Private 7 7 0 0 Private aided 2 2 0 0 Government + KVS 11 11 0 0 Total Deviation 20 20 0 0 Availability of Land for Additional Classrooms Yes 7 9 2 10 No 13 11 2 10 Total Deviation 20 20 2 10 Separate Room for Principals/head teachers Yes 20 20 0 0 No 0 0 0 0 Total Deviation 20 20 0 0
xii
Number of Functional Toilets and Urinals Boys 336 298 38 - Girls 291 263 28 - Total deviation 627 561 66 10.53 Source of Drinking water Tap Water 20 20 0 0 Total deviation 20 20 0 0 Availability of Electricity 20 20 0 0 Condition of Boundary Wall Pucca 19 19 0 0 Partially Pucca 1 1 0 0 Total Deviation 20 20 0 0 Library Facility Yes 18 20 2 10 No 2 0 2 10 Total Deviation 20 20 2 10 Subscription of Newspaper/Magazine
20 20 0 0
Facility of Playground 20 20 0 0 Functional Computer 720 799 79 9.9 Medical Check-up of Students 20 20 0 0 Ramp for Disabled Students needed to Access Classrooms Yes 12 12 0 0 No 8 8 0 0 Total Deviation 20 20 0 0 Children Enrolled in year 2012-13 A – General 30261 30030 231 0.76 B- SC 3276 3265 47 1.43 C- ST 43 48 5 10.41 D- OBC 742 736 36 4.85 E – Total Enrolment (A+B+C+D) 34322 34139 183 0.53 Muslim minority Out of E 1892 1936 44 2.27
*****
1
Chapter-I Introduction
I.1 Background Post Enumeration Survey (PES) Data comparing with U-DISE Data, is an inclusive
component of Sarva Shiksha Abhiyan (SSA) and Rashtriya Madhyamik Shiksha Abhiyan
(RMSA). This comparable component is implementing in all the states and Union
Territories of India. Sarva Shiksha Abhiyan (SSA) and Rashtriya Madhyamik Shiksha
Abhiyan (RMSA) are flagship programmes.
Data collection procedures of DISE for SSA and SEMIS for RMSA were different but data
collection through U-DISE was integrated for the year 2012-13. This unified data
collection revealed MIS for SSA and RMSA should be integrated into one unit though
the information will be used for different directorates. There must be one Data Capture
Format (DCF) to collect the annual information from primary classes to senior
secondary classes under heads – elementary, secondary and higher secondary. The
analysis may be made on the type of requirement relating to SSA and RMSA separately.
The U-DISE Format prescribed by NUEPA along with the software should be used from
2012-13 for data collection for the elementary school, secondary school and senior
secondary school simultaneously. Data Integration using Mapping Tool (Convert into U-
DISE), DISE and SEMIS Database for the year 2011-12 is merged with the help of
mapping tool and it should be printed either in English or in need based language.
CRCCs will make 100% data verification at school point before acceptance of the DCFS
from the Elementary Schools and submission to BRCCs. In Secondary Schools, the
School Head Master/Mistress or Principal will verify the authenticity of data before
submission to the RMSA office. Data entry, consistency checking and removal of
inconsistency by using U-DISE will be done by SSA office. Data will be submitted at
National Level with Certificate (SSA/RMSA). 5% sample checking of DISE data will be
conducted through an agency. The data will be covered from primary to higher
secondary schools to evaluate the reliability and quality of data on school education.
2
Unified District Information System of Education (U-DISE) The National University of Education Planning and Administration (NUEPA), Delhi
suggested, data to be collected through U-DISE from 2012-13 {letter no. NUEPA (EMIS-
SEMIS), 2012} to avoid duplicity of effort. The Government of India decided to
implement Unified-DISE (U-DISE) 2012-13 onwards to ensure that only one Data
Capture Format (DCF) and software will be used for collection of information from the
entire schools education sector located in either states/union territories. Thus, U-DISE
Data Capture Format (U-DISE DCF) prepared by National University of Educational
Planning and Administration (NUEPA) is used for data collection in sample schools’
study.
Study Area
The Post Enumeration Survey (PES) data was collected from 20 (5%) sample schools
functioning in rural-urban areas of Chandigarh.
The Chandigarh Administration is committed to fulfil the National Mission of ‘Education
for All’ under the Right to Education (RTE) Act. Thus, various programmes are being
implementing for strengthening the SSA-RMSA mission up to senior secondary school
level. The progress made through various programmes under 11th Five Year Plan
resulted in achieving the goals of SSA-RMSA.
During 12th Five Year Plan, U.T Chandigarh Administration has been continuing the
following efforts:
• Opening new schools and raising new sections in existing schools;
• Improving school infrastructure and teaching learning environment for enrolment
and retention;
• Strengthening of Alternative Education Centres for never enrolled and dropped
out children;
• Promoting social justice on the demand for quality basic education.
• Universal access of education upto secondary level to all students by 2015.
3
• Universal retention by 2020.
• To remove the disparity among the different social groups, the schemes (SSA-
RMSA) envisages the special incentive for students belonging to SC/ST/Minority and
other weaker sections of the society. The effectiveness of SSA-RMSA revealed rising
literacy rates, reducing drop-out rates and gender gap at school level.
Sample Schools
The PES data was collected from the following 20(5%) sample schools. These schools
were visited by the field staff of ‘Foundation for Developmental Research’ during the month of
March-April 2013. The detail of visit profile of these schools is given in annexure I.1.
Government Managed Schools
1. Government Model Senior Secondary School, Sector -10, Chandigarh
2. Government Senior Secondary School, Khuda Alisher
3. Government Model High School – Dhanas
4. Government Model Middle School, Sector-45, Chandigarh
5. Government Senior Secondary School, Mauli Jagran
6. Government Model High School, Sector -31, Chandigarh
7. Government Senior Secondary School, Mani Majra Town
8. Government Model High School, Sector -29, Chandigarh
9. Government Model Senior Secondary School, Sector 56, Chandigarh
10. Government Middle School, Indira Colony Mani Majra Private Recognised Schools
11. Ryan International School, Sector 49, Chandigarh
12. Tender Heart, Sector 33, Chandigarh
13. Manav Mangal School, Sector 21, Chandigarh
14. Gurukul Global School, IT park Manimajra
15. Chandigarh Bapist School, Sector 45, Chandigarh
16. Sri Guru Harkrishan School, Sector 38-D, Chandigarh
17. Chitkara International School, Sector 25, Chandigarh
4
Private Aided Schools
18. DAV Senior Secondary School, Sector 8, Chandigarh
19. Vedic Girls Senior Secondary School, Old Mani Majra, Chandigarh
Central School
20. Kendriya Vidyalya OCF, Sector 29, Chandigarh
Field Agency - Foundation for Developmental Research (FDR) Post Enumeration Survey (PES) of sample schools was conducted by the field staff of
Foundation for Developmental Research (FDR), Chandigarh. FDR is a non-profit making
research organization duly registered under the Societies’ Registration Act XXI of 1860
in 2000. Foundation is being promoted by a group of highly skilled professionals, who
are dedicated to promote field based research studies. Its main work is to conduct
research based evaluative studies and publications. Foundation generates funds
through sponsored projects and publications, but it is dedicated to fundamental and
empirical research in science and social science. Its thrust areas are:
• Education – Minorities’ and deprived • Public health studies – Evaluative • Gender issues • Industrial development • Environmental studies • Population and migration studies
The operational area of various kinds of studies is Northern-India - particularly the
states like Punjab, Haryana, Himachal Pradesh and Chandigarh but it is interested in
conducting research studies all over India.
****
5
Chapter-II Objectives and Methodology
The present chapter highlights objectives and methodology that was used for
conducting survey of sample schools.
II.1 Main Objective Post Enumeration Survey (PES) of U-DISE data checking exercise was the main
objective by covering:
• Verified the accuracy of U-DISE data of 2012-13 of 20 sample schools.
• Identified the gaps between PES data and U-DISE data to find out deviation level.
• Suggested appropriate remedial measures to enhance the accuracy of U-DISE data.
II.2 Sample A representative sample of 20 schools was assigned to ‘Field Agency’. These schools
were 5% sample of existing total number of schools functioning in rural-urban areas of
Chandigarh. The stratified random sampling technique was adopted. The sample
comprised elementary, secondary and senior secondary schools functioning under
government, private aided and private unaided management.
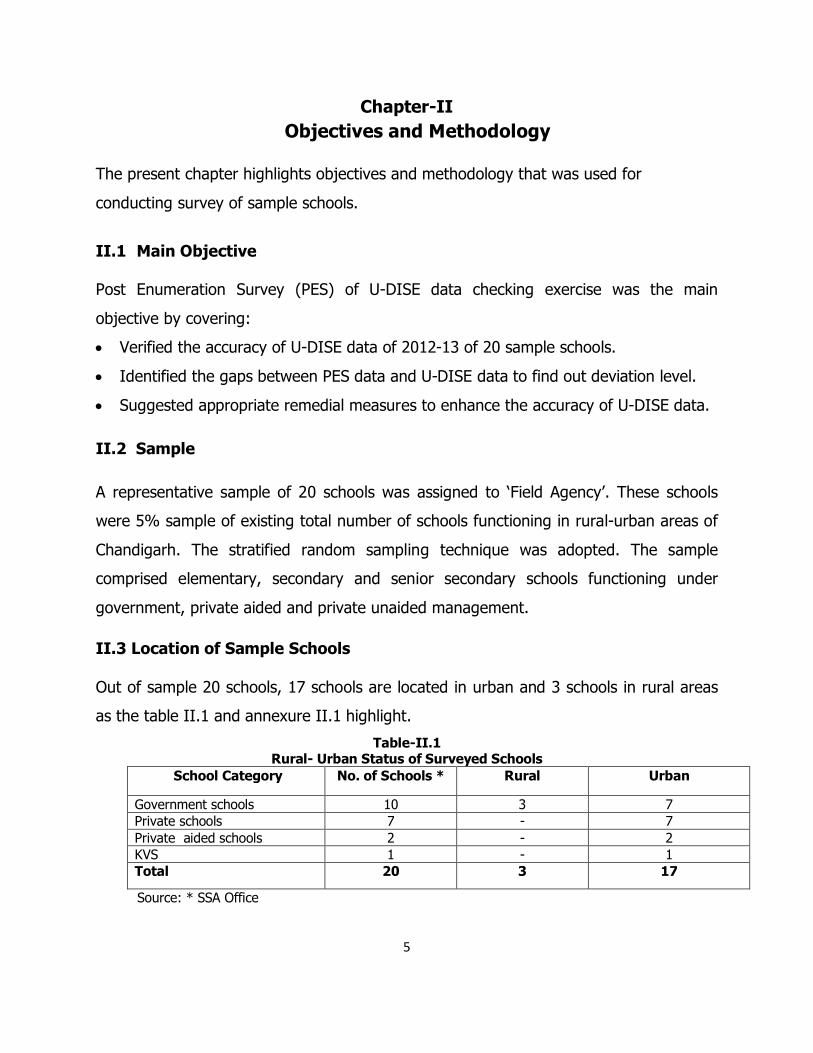
II.3 Location of Sample Schools
Out of sample 20 schools, 17 schools are located in urban and 3 schools in rural areas
as the table II.1 and annexure II.1 highlight.
Table-II.1 Rural- Urban Status of Surveyed Schools
School Category No. of Schools * Rural Urban
Government schools 10 3 7 Private schools 7 - 7 Private aided schools 2 - 2 KVS 1 - 1 Total 20
3 17
Source: * SSA Office
6
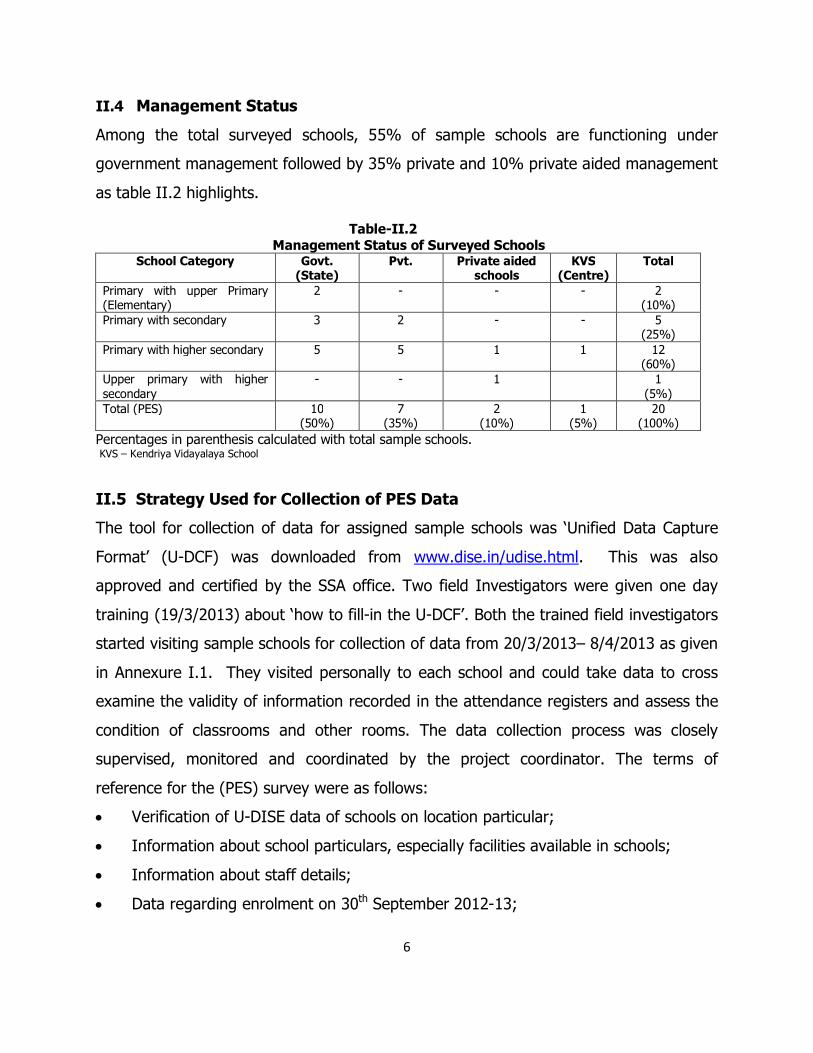
II.4 Management Status
Among the total surveyed schools, 55% of sample schools are functioning under
government management followed by 35% private and 10% private aided management
as table II.2 highlights.
Table-II.2 Management Status of Surveyed Schools
School Category Govt. (State)
Pvt. Private aided schools
KVS (Centre)
Total
Primary with upper Primary (Elementary)
2 - - - 2 (10%)
Primary with secondary 3 2 - - 5 (25%)
Primary with higher secondary 5 5 1 1 12 (60%)
Upper primary with higher secondary
- - 1 1 (5%)
Total (PES) 10 (50%)
7 (35%)
2 (10%)
1 (5%)
20 (100%)
Percentages in parenthesis calculated with total sample schools. KVS – Kendriya Vidayalaya School
II.5 Strategy Used for Collection of PES Data
The tool for collection of data for assigned sample schools was ‘Unified Data Capture
Format’ (U-DCF) was downloaded from www.dise.in/udise.html. This was also
approved and certified by the SSA office. Two field Investigators were given one day
training (19/3/2013) about ‘how to fill-in the U-DCF’. Both the trained field investigators
started visiting sample schools for collection of data from 20/3/2013– 8/4/2013 as given
in Annexure I.1. They visited personally to each school and could take data to cross
examine the validity of information recorded in the attendance registers and assess the
condition of classrooms and other rooms. The data collection process was closely
supervised, monitored and coordinated by the project coordinator. The terms of
reference for the (PES) survey were as follows:
• Verification of U-DISE data of schools on location particular;
• Information about school particulars, especially facilities available in schools;
• Information about staff details;
• Data regarding enrolment on 30th September 2012-13;
7
• Enrolment and attendance details of children on the specified survey day;
• Availability and accessibility of school records;
• Details regarding seating arrangement of children;
• Regarding display boards, provision of Mid-day-Meal with quality of food;
• Perception of investigators regarding cooperation extended by Principals/Head
Teachers in providing the required data and other information pertaining to the
schools affairs.
II.6 Status of Tool used for Post Enumeration Survey (PES)
The Unified Data Capture Formats (U-DCF), were filled-in from the record of sample
schools. Later the collected data was compared with the U-DISE Data Formats. The
data collected through U-DCF and data received from U-DISE were compared to find
out the deviation (annexure 22).
II.7 Data Analysis
The filled-in Unified Data Capture Formats were examined before compilation of data.
After clearing the data, validation checks were applied for internal inconsistency of data.
Meanwhile, U-DISE filled-in schedules of the academic year 2012-13 were obtained
from the office of SPD (SSA), UT Chandigarh. The obtained data from U-DISE was also
entered in computer. On both the data, comparative tables were prepared for further
analysis and report writing. The following Formula was used to calculate the deviation.
PES/U-DISE – U-DISE/PES (Higher Score – Lower Score) X 100
Total Sample Schools (20 Schools)
For example:
PES (10 score) – U-DISE (8 score) = 2 score x 100 = 10%
20 Schools 20
II.8 Report Writing The report is based on the comparative data of PES U-DCF and U-DISE of sample
schools. The report also covers the field observations compiled by the Investigators on
8
various aspects that came across during collection of data. Suggestions on findings and
observations were made for improving the quality of U-DISE data. The deviation exists
between PES and U-DISE data was used for analytical analysis of all the comparable
items. The deviation between both the data was calculated in percentages.
II.9 Limitations of the Study It is essential to point out that some items (information columns) given in U-DISE
Format have not been found in PES (DCF) Format. Thus, some items of U-DISE and U-
DCF remained restricted to find out the deviation on all variables. The variation status
between PES and DISE data revealed significant results on majority of the items.
The analysis of data on PES and U-DISE revealed significant comparability on most of
the variables. Conversely, slight deviation is insignificant and ignorable. The study, still,
has a scope to include suggestions for further improvement in the methodology of such
kind of comparative study.
*****
9
Chapter-III Comparative Status of PES Data with U-DISE Data
The present chapter highlights the analysis of PES data collected from sample schools
through the U-DCF (information schedule) and compared with the U-DISE data that was
received from the SPD (SSA) office. The collected data analysed various aspects,
particularly the status of basic facilities available in the schools, teachers in position,
students’ enrolment, students appeared in secondary and higher secondary exams and
their pass out status respectively.
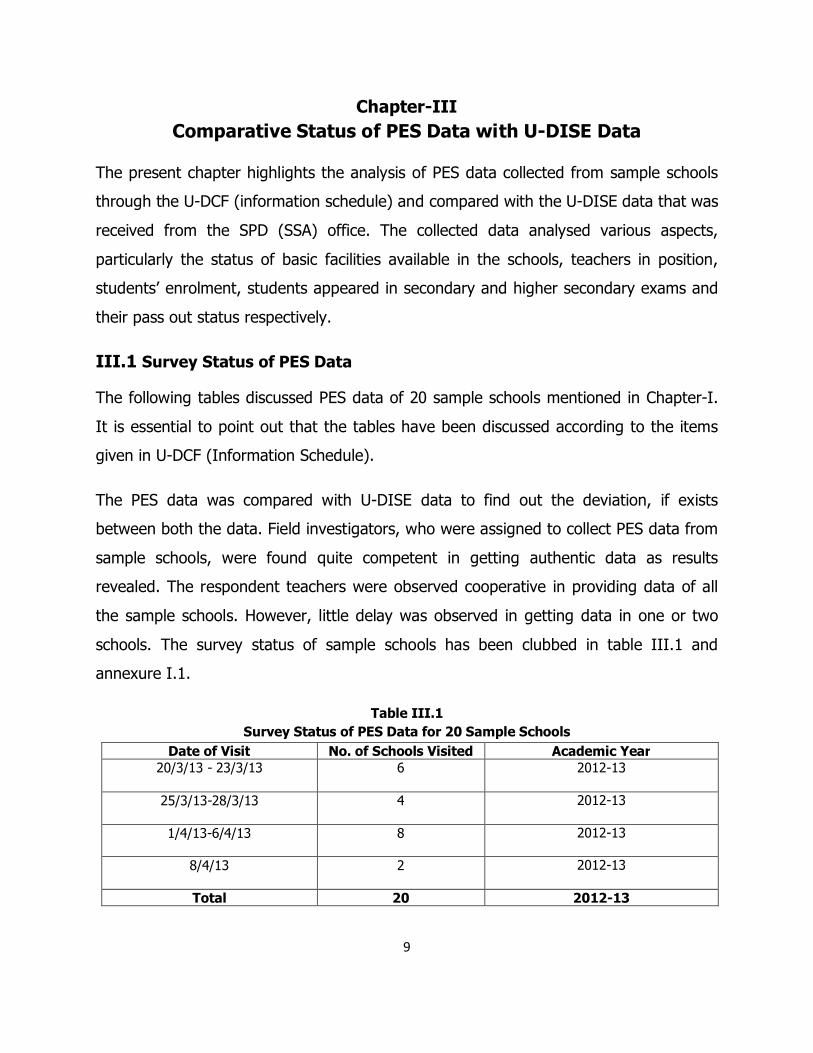
III.1 Survey Status of PES Data
The following tables discussed PES data of 20 sample schools mentioned in Chapter-I.
It is essential to point out that the tables have been discussed according to the items
given in U-DCF (Information Schedule).
The PES data was compared with U-DISE data to find out the deviation, if exists
between both the data. Field investigators, who were assigned to collect PES data from
sample schools, were found quite competent in getting authentic data as results
revealed. The respondent teachers were observed cooperative in providing data of all
the sample schools. However, little delay was observed in getting data in one or two
schools. The survey status of sample schools has been clubbed in table III.1 and
annexure I.1.
Table III.1 Survey Status of PES Data for 20 Sample Schools
Date of Visit No. of Schools Visited Academic Year 20/3/13 - 23/3/13
6 2012-13
25/3/13-28/3/13 4 2012-13
1/4/13-6/4/13 8 2012-13
8/4/13 2 2012-13
Total 20 2012-13
10
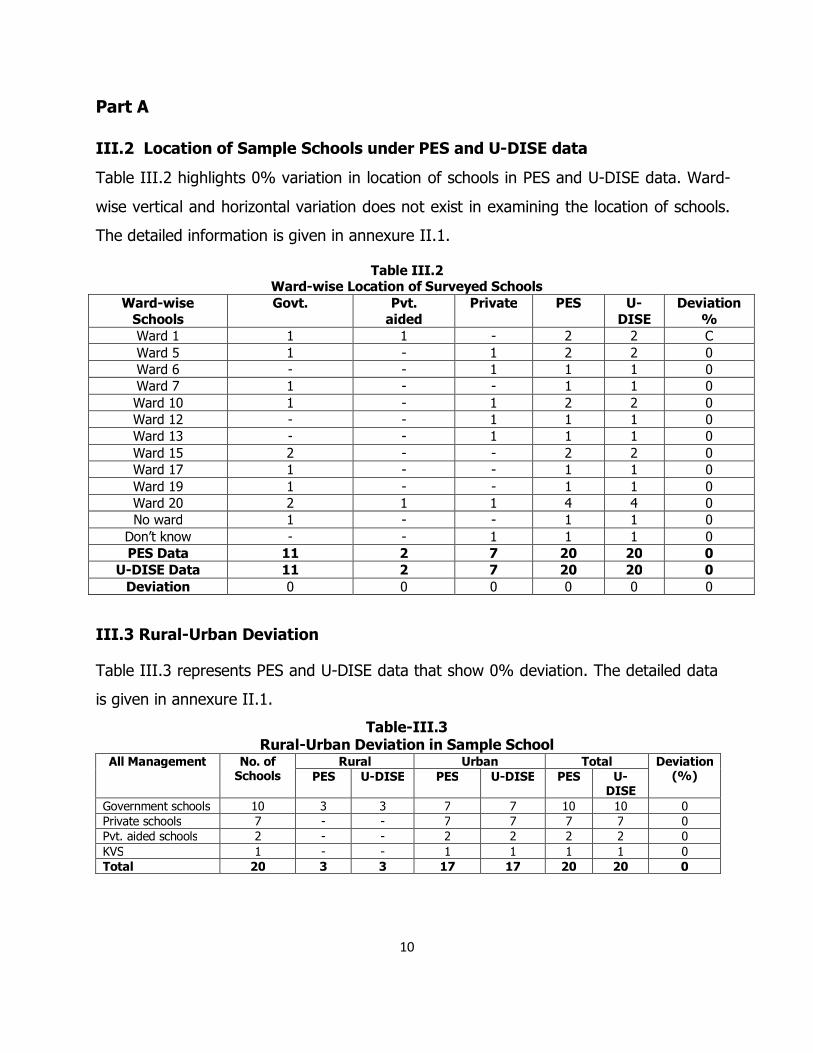
Part A
III.2 Location of Sample Schools under PES and U-DISE data
Table III.2 highlights 0% variation in location of schools in PES and U-DISE data. Ward-
wise vertical and horizontal variation does not exist in examining the location of schools.
The detailed information is given in annexure II.1.
Table III.2 Ward-wise Location of Surveyed Schools
Ward-wise Schools
Govt. Pvt. aided
Private PES U-DISE
Deviation %
Ward 1 1 1 - 2 2 C Ward 5 1 - 1 2 2 0 Ward 6 - - 1 1 1 0 Ward 7 1 - - 1 1 0 Ward 10 1 - 1 2 2 0 Ward 12 - - 1 1 1 0 Ward 13 - - 1 1 1 0 Ward 15 2 - - 2 2 0 Ward 17 1 - - 1 1 0 Ward 19 1 - - 1 1 0 Ward 20 2 1 1 4 4 0 No ward 1 - - 1 1 0
Don’t know - - 1 1 1 0 PES Data 11 2 7 20 20 0
U-DISE Data 11 2 7 20 20 0 Deviation 0 0 0 0 0 0
III.3 Rural-Urban Deviation
Table III.3 represents PES and U-DISE data that show 0% deviation. The detailed data
is given in annexure II.1.
Table-III.3 Rural-Urban Deviation in Sample School
All Management No. of Schools
Rural Urban Total Deviation (%) PES U-DISE PES U-DISE PES U-
DISE Government schools 10 3 3 7 7 10 10 0 Private schools 7 - - 7 7 7 7 0 Pvt. aided schools 2 - - 2 2 2 2 0 KVS 1 - - 1 1 1 1 0 Total 20 3 3 17 17 20 20 0
11
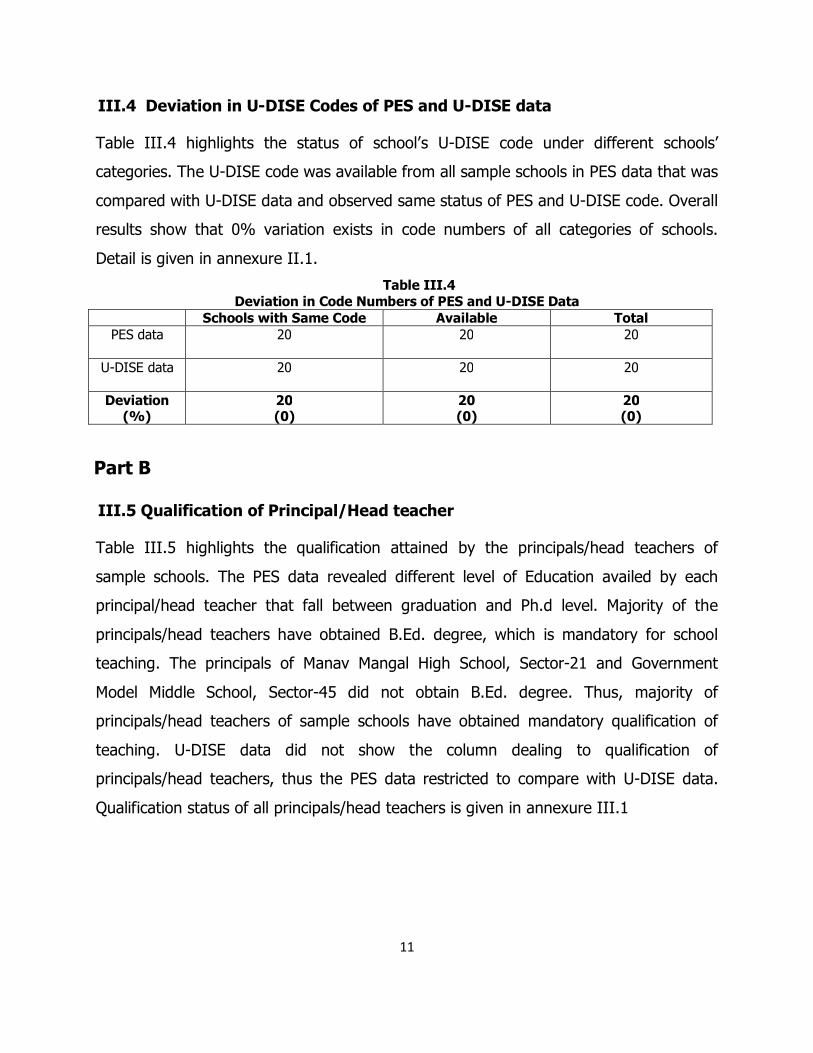
III.4 Deviation in U-DISE Codes of PES and U-DISE data
Table III.4 highlights the status of school’s U-DISE code under different schools’
categories. The U-DISE code was available from all sample schools in PES data that was
compared with U-DISE data and observed same status of PES and U-DISE code. Overall
results show that 0% variation exists in code numbers of all categories of schools.
Detail is given in annexure II.1.
Table III.4 Deviation in Code Numbers of PES and U-DISE Data
Schools with Same Code Available Total PES data 20
20 20
U-DISE data 20
20 20
Deviation (%)
20 (0)
20 (0)
20 (0)
Part B
III.5 Qualification of Principal/Head teacher
Table III.5 highlights the qualification attained by the principals/head teachers of
sample schools. The PES data revealed different level of Education availed by each
principal/head teacher that fall between graduation and Ph.d level. Majority of the
principals/head teachers have obtained B.Ed. degree, which is mandatory for school
teaching. The principals of Manav Mangal High School, Sector-21 and Government
Model Middle School, Sector-45 did not obtain B.Ed. degree. Thus, majority of
principals/head teachers of sample schools have obtained mandatory qualification of
teaching. U-DISE data did not show the column dealing to qualification of
principals/head teachers, thus the PES data restricted to compare with U-DISE data.
Qualification status of all principals/head teachers is given in annexure III.1
12
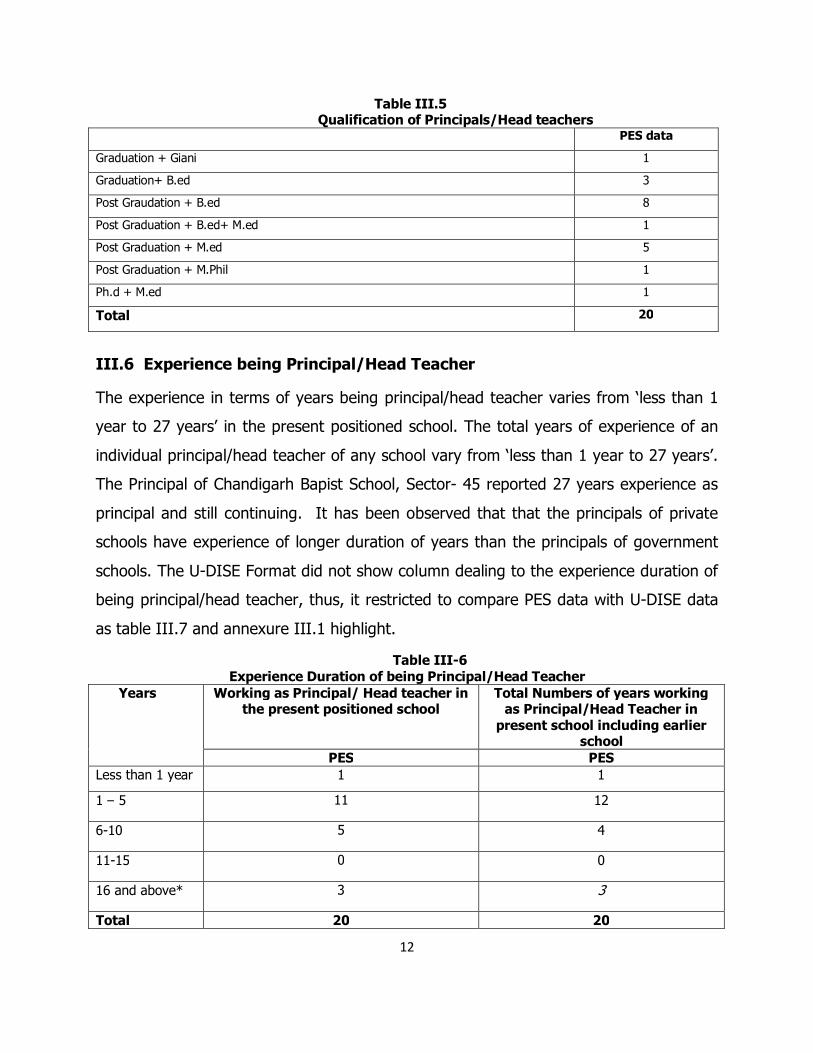
Table III.5 Qualification of Principals/Head teachers
PES data
Graduation + Giani 1
Graduation+ B.ed 3
Post Graudation + B.ed 8
Post Graduation + B.ed+ M.ed 1
Post Graduation + M.ed 5
Post Graduation + M.Phil 1
Ph.d + M.ed 1
Total 20
III.6 Experience being Principal/Head Teacher
The experience in terms of years being principal/head teacher varies from ‘less than 1
year to 27 years’ in the present positioned school. The total years of experience of an
individual principal/head teacher of any school vary from ‘less than 1 year to 27 years’.
The Principal of Chandigarh Bapist School, Sector- 45 reported 27 years experience as
principal and still continuing. It has been observed that that the principals of private
schools have experience of longer duration of years than the principals of government
schools. The U-DISE Format did not show column dealing to the experience duration of
being principal/head teacher, thus, it restricted to compare PES data with U-DISE data
as table III.7 and annexure III.1 highlight.
Table III-6 Experience Duration of being Principal/Head Teacher
Years Working as Principal/ Head teacher in the present positioned school
Total Numbers of years working as Principal/Head Teacher in
present school including earlier school
PES PES Less than 1 year 1 1
1 – 5 11 12
6-10 5 4
11-15 0 0
16 and above* 3 3
Total 20 20
13
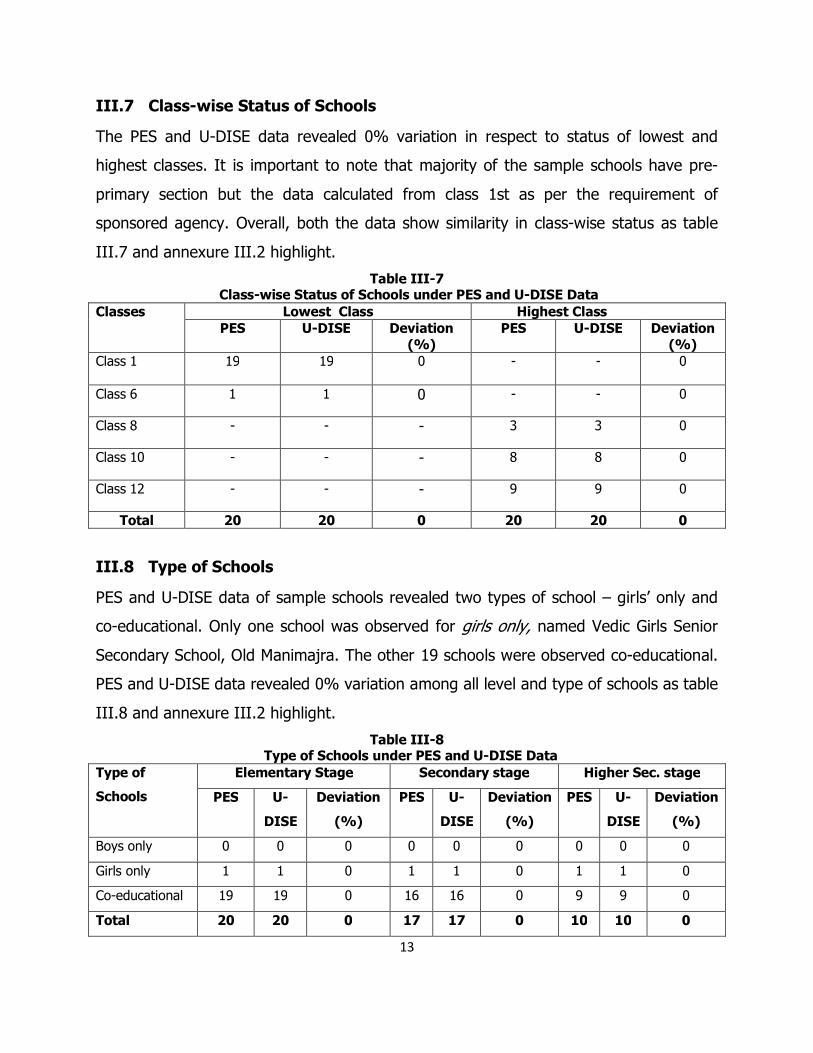
III.7 Class-wise Status of Schools
The PES and U-DISE data revealed 0% variation in respect to status of lowest and
highest classes. It is important to note that majority of the sample schools have pre-
primary section but the data calculated from class 1st as per the requirement of
sponsored agency. Overall, both the data show similarity in class-wise status as table
III.7 and annexure III.2 highlight.
Table III-7 Class-wise Status of Schools under PES and U-DISE Data
Classes Lowest Class Highest Class PES U-DISE Deviation
(%) PES U-DISE Deviation
(%) Class 1
19 19 0 - - 0
Class 6 1 1 0 - - 0
Class 8 - - - 3 3 0
Class 10 - - - 8 8 0
Class 12 - - - 9 9 0
Total 20 20 0 20 20 0
III.8 Type of Schools
PES and U-DISE data of sample schools revealed two types of school – girls’ only and
co-educational. Only one school was observed for girls only, named Vedic Girls Senior
Secondary School, Old Manimajra. The other 19 schools were observed co-educational.
PES and U-DISE data revealed 0% variation among all level and type of schools as table
III.8 and annexure III.2 highlight.
Table III-8 Type of Schools under PES and U-DISE Data
Type of
Schools
Elementary Stage Secondary stage Higher Sec. stage
PES U-
DISE
Deviation
(%)
PES U-
DISE
Deviation
(%)
PES U-
DISE
Deviation
(%)
Boys only 0 0 0 0 0 0 0 0 0
Girls only 1 1 0 1 1 0 1 1 0
Co-educational 19 19 0 16 16 0 9 9 0
Total 20 20 0 17 17 0 10 10 0
14
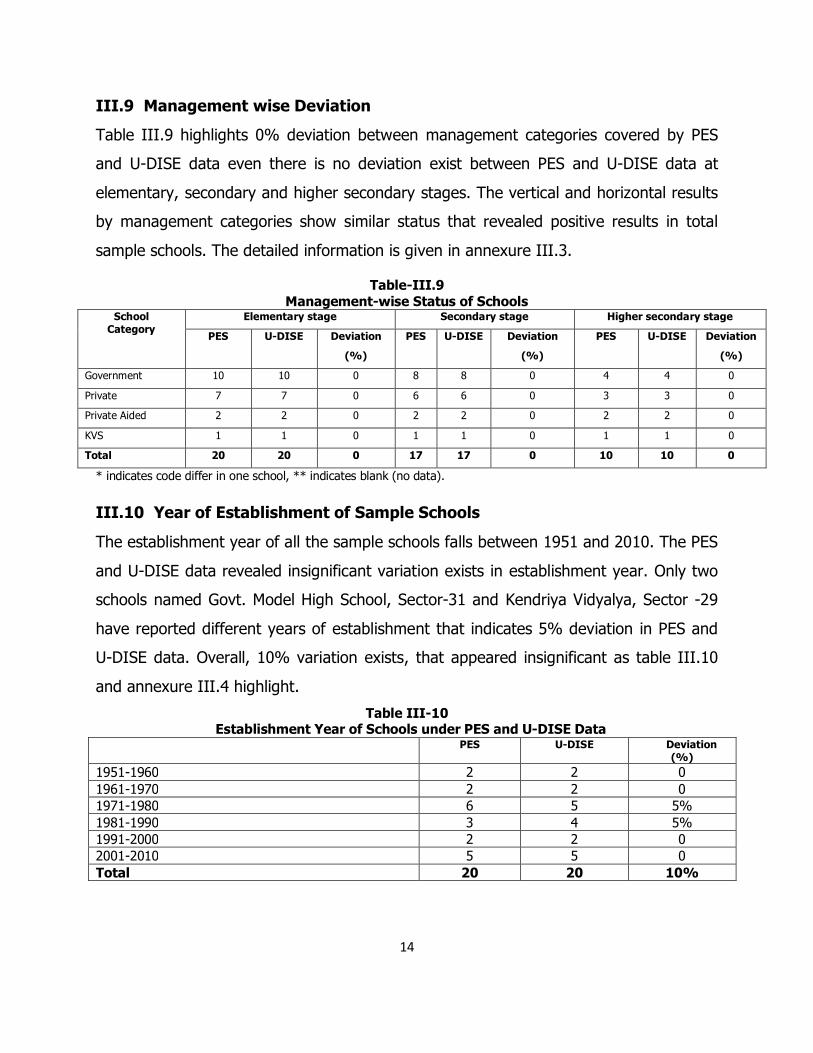
III.9 Management wise Deviation
Table III.9 highlights 0% deviation between management categories covered by PES
and U-DISE data even there is no deviation exist between PES and U-DISE data at
elementary, secondary and higher secondary stages. The vertical and horizontal results
by management categories show similar status that revealed positive results in total
sample schools. The detailed information is given in annexure III.3.
Table-III.9 Management-wise Status of Schools
School Category
Elementary stage Secondary stage Higher secondary stage
PES U-DISE Deviation
(%)
PES U-DISE Deviation
(%)
PES U-DISE Deviation
(%)
Government 10 10 0 8 8 0 4 4 0
Private 7 7 0 6 6 0 3 3 0
Private Aided 2 2 0 2 2 0 2 2 0
KVS 1 1 0 1 1 0 1 1 0
Total 20 20 0 17 17 0 10 10 0
* indicates code differ in one school, ** indicates blank (no data). III.10 Year of Establishment of Sample Schools
The establishment year of all the sample schools falls between 1951 and 2010. The PES
and U-DISE data revealed insignificant variation exists in establishment year. Only two
schools named Govt. Model High School, Sector-31 and Kendriya Vidyalya, Sector -29
have reported different years of establishment that indicates 5% deviation in PES and
U-DISE data. Overall, 10% variation exists, that appeared insignificant as table III.10
and annexure III.4 highlight.
Table III-10 Establishment Year of Schools under PES and U-DISE Data
PES U-DISE Deviation (%)
1951-1960 2 2 0 1961-1970 2 2 0 1971-1980 6 5 5% 1981-1990 3 4 5% 1991-2000 2 2 0 2001-2010 5 5 0 Total 20 20 10%
15
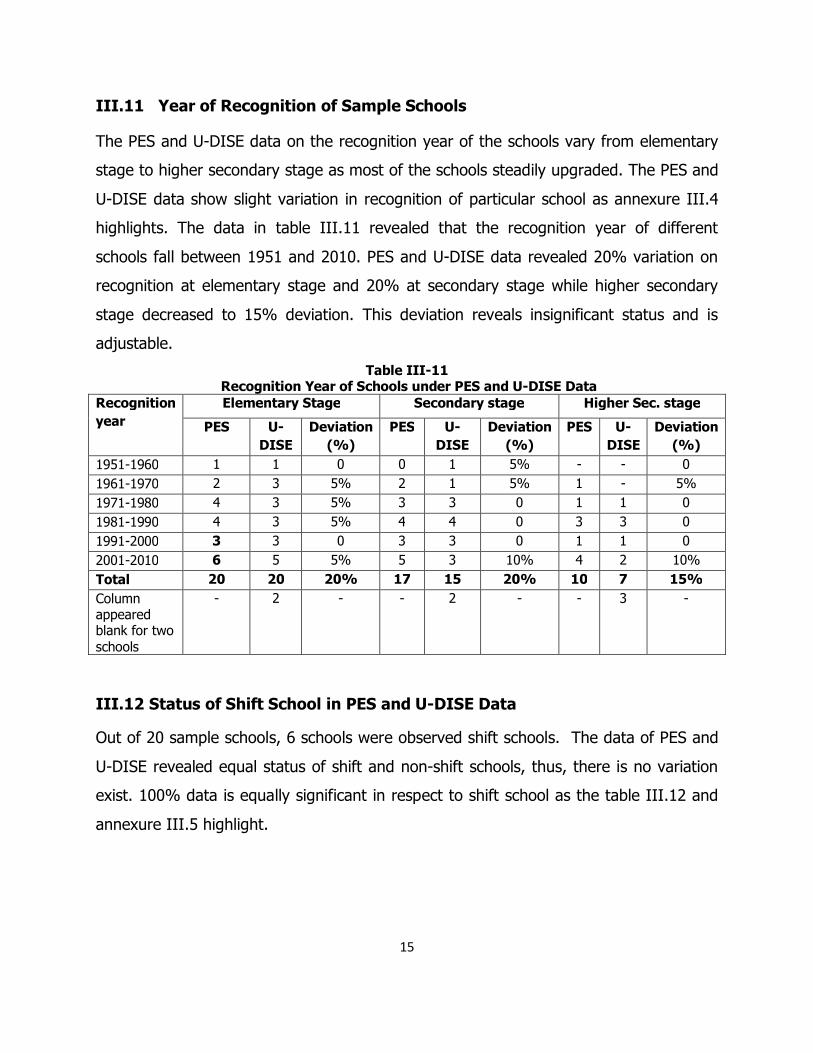
III.11 Year of Recognition of Sample Schools The PES and U-DISE data on the recognition year of the schools vary from elementary
stage to higher secondary stage as most of the schools steadily upgraded. The PES and
U-DISE data show slight variation in recognition of particular school as annexure III.4
highlights. The data in table III.11 revealed that the recognition year of different
schools fall between 1951 and 2010. PES and U-DISE data revealed 20% variation on
recognition at elementary stage and 20% at secondary stage while higher secondary
stage decreased to 15% deviation. This deviation reveals insignificant status and is
adjustable.
Table III-11 Recognition Year of Schools under PES and U-DISE Data
Recognition year
Elementary Stage Secondary stage Higher Sec. stage
PES U-DISE
Deviation (%)
PES U-DISE
Deviation (%)
PES U-DISE
Deviation (%)
1951-1960 1 1 0 0 1 5% - - 0 1961-1970 2 3 5% 2 1 5% 1 - 5% 1971-1980 4 3 5% 3 3 0 1 1 0 1981-1990 4 3 5% 4 4 0 3 3 0 1991-2000 3 3 0 3 3 0 1 1 0 2001-2010 6 5 5% 5 3 10% 4 2 10% Total 20 20 20% 17 15 20% 10 7 15% Column appeared blank for two schools
- 2 - - 2 - - 3 -
III.12 Status of Shift School in PES and U-DISE Data
Out of 20 sample schools, 6 schools were observed shift schools. The data of PES and
U-DISE revealed equal status of shift and non-shift schools, thus, there is no variation
exist. 100% data is equally significant in respect to shift school as the table III.12 and
annexure III.5 highlight.
16
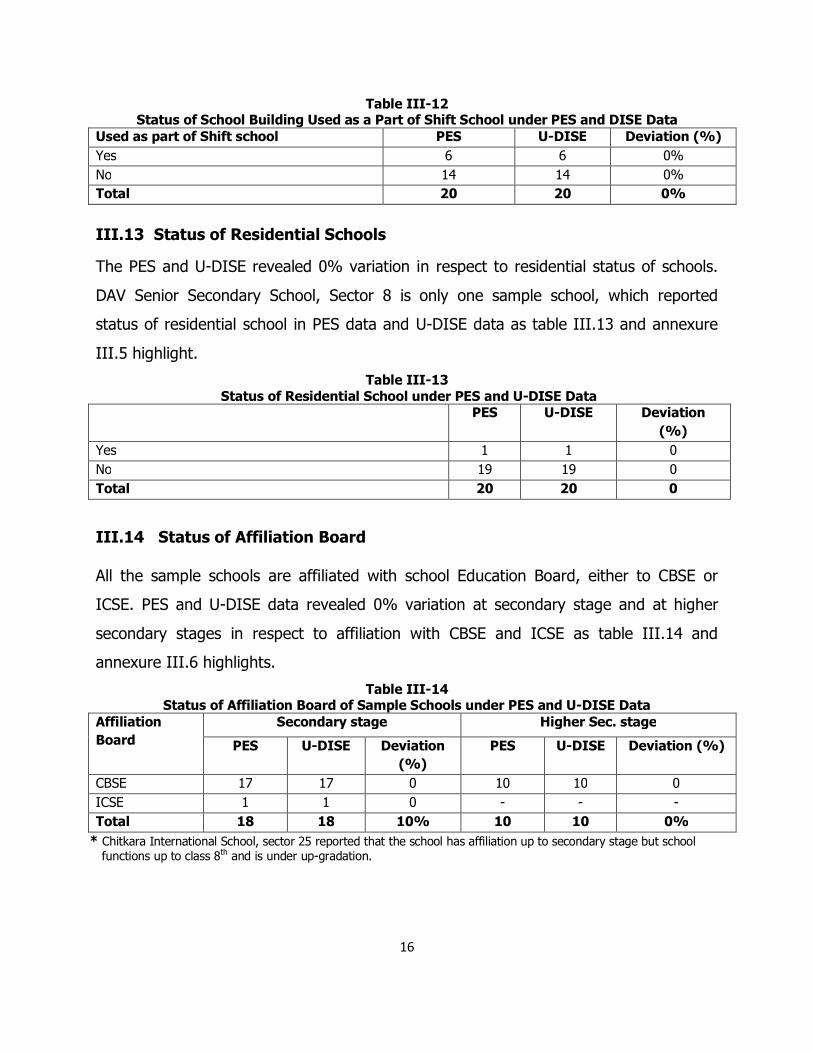
Table III-12 Status of School Building Used as a Part of Shift School under PES and DISE Data
Used as part of Shift school PES U-DISE Deviation (%) Yes 6 6 0% No 14 14 0% Total 20 20 0%
III.13 Status of Residential Schools
The PES and U-DISE revealed 0% variation in respect to residential status of schools.
DAV Senior Secondary School, Sector 8 is only one sample school, which reported
status of residential school in PES data and U-DISE data as table III.13 and annexure
III.5 highlight.
Table III-13 Status of Residential School under PES and U-DISE Data
PES U-DISE Deviation (%)
Yes 1 1 0 No 19 19 0 Total 20 20 0
III.14 Status of Affiliation Board All the sample schools are affiliated with school Education Board, either to CBSE or
ICSE. PES and U-DISE data revealed 0% variation at secondary stage and at higher
secondary stages in respect to affiliation with CBSE and ICSE as table III.14 and
annexure III.6 highlights.
Table III-14 Status of Affiliation Board of Sample Schools under PES and U-DISE Data
Affiliation Board
Secondary stage Higher Sec. stage
PES U-DISE Deviation (%)
PES U-DISE Deviation (%)
CBSE 17 17 0 10 10 0 ICSE 1 1 0 - - - Total 18 18 10% 10 10 0%
* Chitkara International School, sector 25 reported that the school has affiliation up to secondary stage but school functions up to class 8th and is under up-gradation.
17
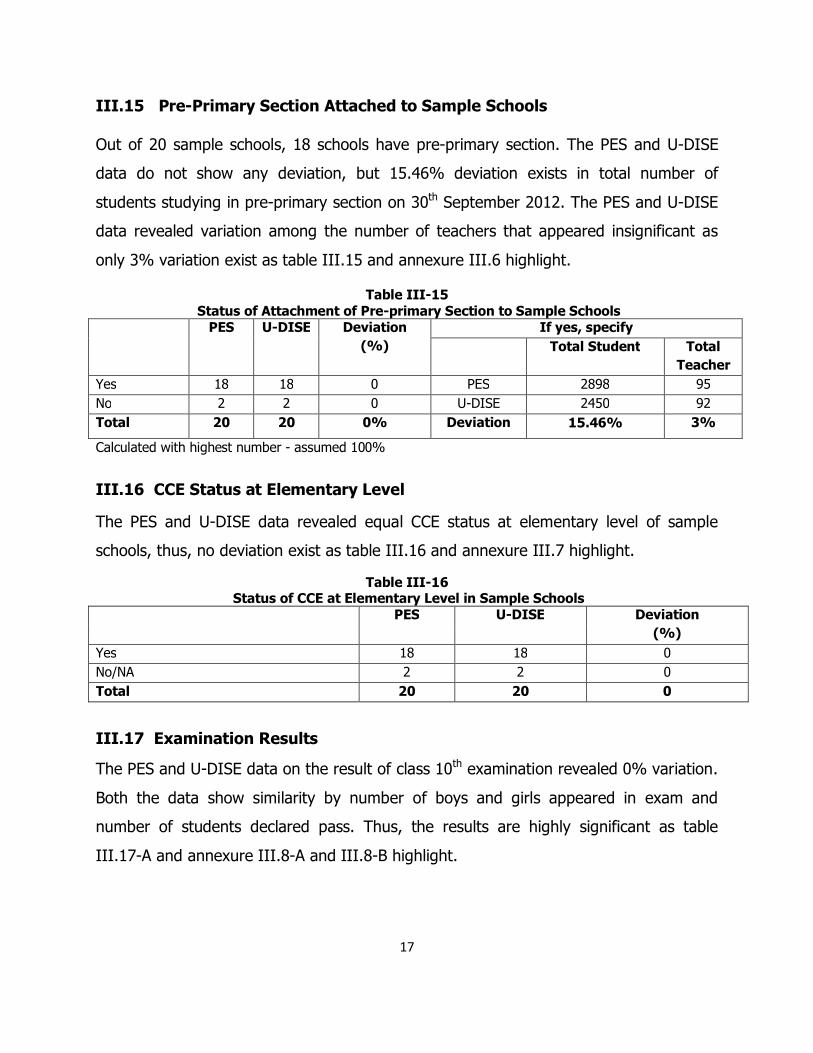
III.15 Pre-Primary Section Attached to Sample Schools Out of 20 sample schools, 18 schools have pre-primary section. The PES and U-DISE
data do not show any deviation, but 15.46% deviation exists in total number of
students studying in pre-primary section on 30th September 2012. The PES and U-DISE
data revealed variation among the number of teachers that appeared insignificant as
only 3% variation exist as table III.15 and annexure III.6 highlight.
Table III-15 Status of Attachment of Pre-primary Section to Sample Schools
PES U-DISE Deviation (%)
If yes, specify Total Student Total
Teacher Yes 18 18 0 PES 2898 95 No 2 2 0 U-DISE 2450 92 Total 20 20 0% Deviation 15.46% 3%
Calculated with highest number - assumed 100%
III.16 CCE Status at Elementary Level
The PES and U-DISE data revealed equal CCE status at elementary level of sample
schools, thus, no deviation exist as table III.16 and annexure III.7 highlight.
Table III-16 Status of CCE at Elementary Level in Sample Schools
PES U-DISE Deviation (%)
Yes 18 18 0 No/NA 2 2 0 Total 20 20 0
III.17 Examination Results
The PES and U-DISE data on the result of class 10th examination revealed 0% variation.
Both the data show similarity by number of boys and girls appeared in exam and
number of students declared pass. Thus, the results are highly significant as table
III.17-A and annexure III.8-A and III.8-B highlight.
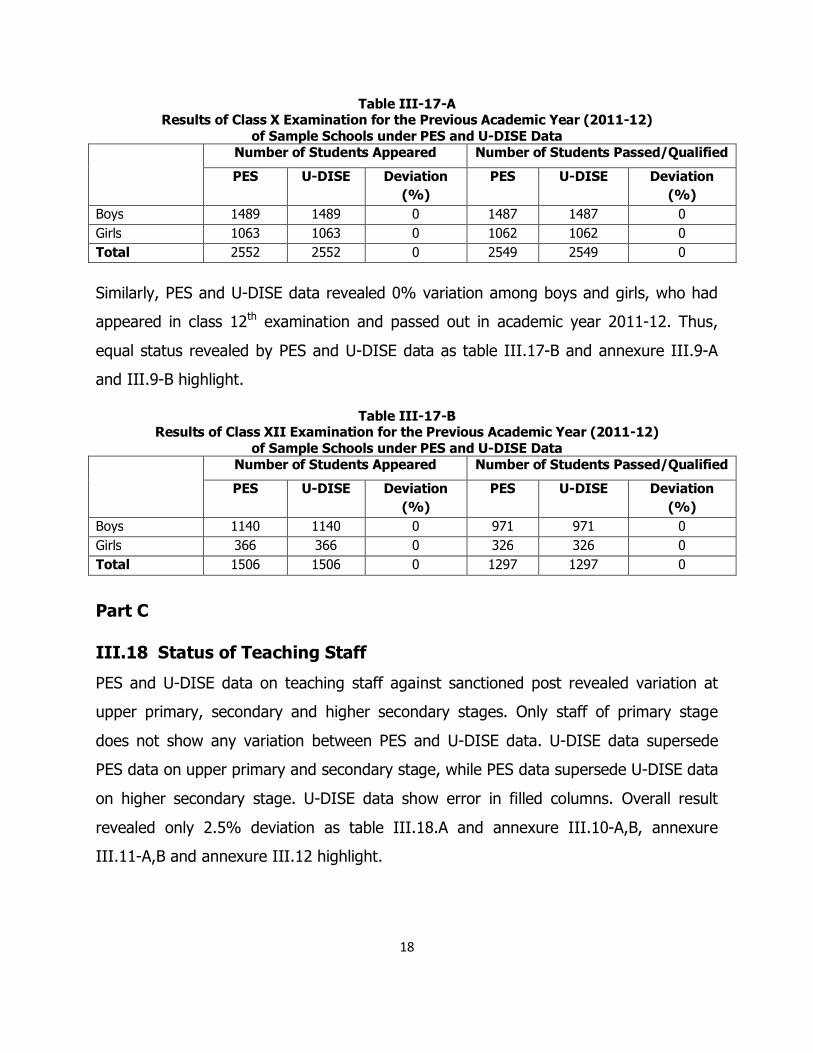
18
Table III-17-A Results of Class X Examination for the Previous Academic Year (2011-12)
of Sample Schools under PES and U-DISE Data Number of Students Appeared Number of Students Passed/Qualified
PES U-DISE Deviation (%)
PES U-DISE Deviation (%)
Boys 1489 1489 0 1487 1487 0 Girls 1063 1063 0 1062 1062 0 Total 2552 2552 0 2549 2549 0
Similarly, PES and U-DISE data revealed 0% variation among boys and girls, who had
appeared in class 12th examination and passed out in academic year 2011-12. Thus,
equal status revealed by PES and U-DISE data as table III.17-B and annexure III.9-A
and III.9-B highlight.
Table III-17-B Results of Class XII Examination for the Previous Academic Year (2011-12)
of Sample Schools under PES and U-DISE Data Number of Students Appeared Number of Students Passed/Qualified
PES U-DISE Deviation (%)
PES U-DISE Deviation (%)
Boys 1140 1140 0 971 971 0 Girls 366 366 0 326 326 0 Total 1506 1506 0 1297 1297 0
Part C III.18 Status of Teaching Staff
PES and U-DISE data on teaching staff against sanctioned post revealed variation at
upper primary, secondary and higher secondary stages. Only staff of primary stage
does not show any variation between PES and U-DISE data. U-DISE data supersede
PES data on upper primary and secondary stage, while PES data supersede U-DISE data
on higher secondary stage. U-DISE data show error in filled columns. Overall result
revealed only 2.5% deviation as table III.18.A and annexure III.10-A,B, annexure
III.11-A,B and annexure III.12 highlight.
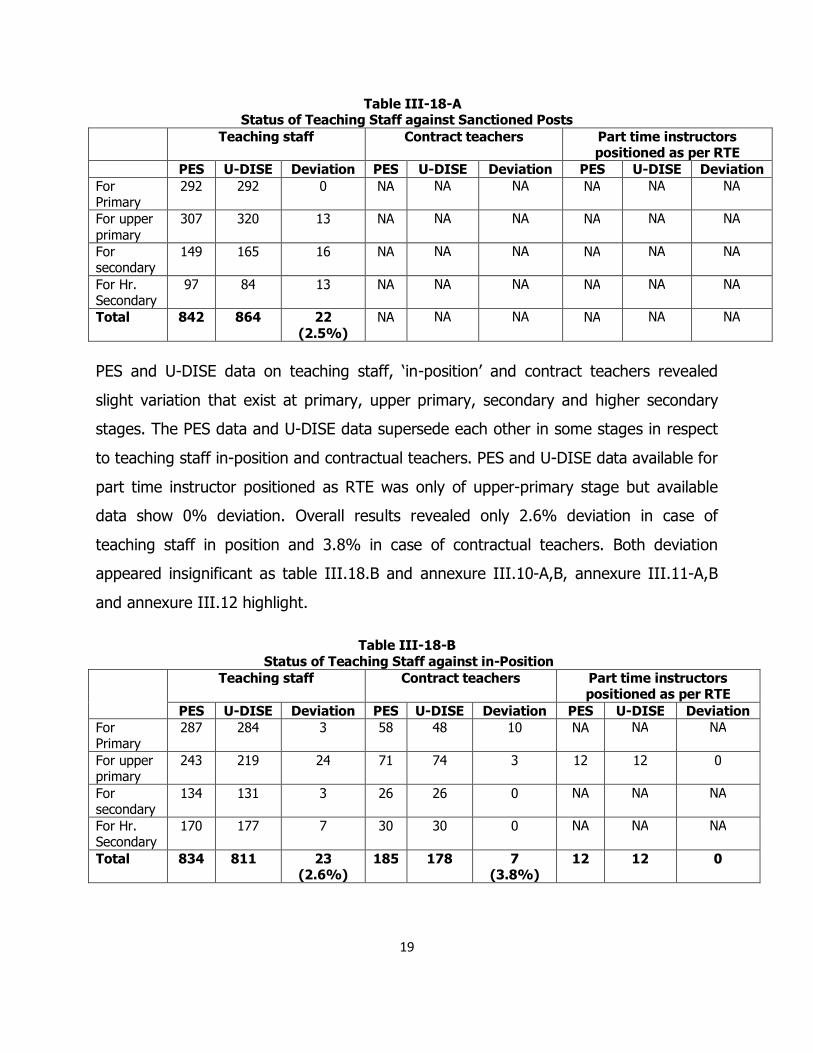
19
Table III-18-A Status of Teaching Staff against Sanctioned Posts
Teaching staff Contract teachers Part time instructors positioned as per RTE
PES U-DISE Deviation PES U-DISE Deviation PES U-DISE Deviation For Primary
292 292 0 NA NA NA NA NA NA
For upper primary
307 320 13 NA NA NA NA NA NA
For secondary
149 165 16 NA NA NA NA NA NA
For Hr. Secondary
97 84 13 NA NA NA NA NA NA
Total 842 864 22 (2.5%)
NA NA NA NA NA NA
PES and U-DISE data on teaching staff, ‘in-position’ and contract teachers revealed
slight variation that exist at primary, upper primary, secondary and higher secondary
stages. The PES data and U-DISE data supersede each other in some stages in respect
to teaching staff in-position and contractual teachers. PES and U-DISE data available for
part time instructor positioned as RTE was only of upper-primary stage but available
data show 0% deviation. Overall results revealed only 2.6% deviation in case of
teaching staff in position and 3.8% in case of contractual teachers. Both deviation
appeared insignificant as table III.18.B and annexure III.10-A,B, annexure III.11-A,B
and annexure III.12 highlight.
Table III-18-B Status of Teaching Staff against in-Position
Teaching staff Contract teachers Part time instructors positioned as per RTE
PES U-DISE Deviation PES U-DISE Deviation PES U-DISE Deviation For Primary
287 284 3 58 48 10 NA NA NA
For upper primary
243 219 24 71 74 3 12 12 0
For secondary
134
131 3 26 26 0 NA NA NA
For Hr. Secondary
170 177 7 30 30 0 NA NA NA
Total 834 811 23 (2.6%)
185 178 7 (3.8%)
12 12 0
20
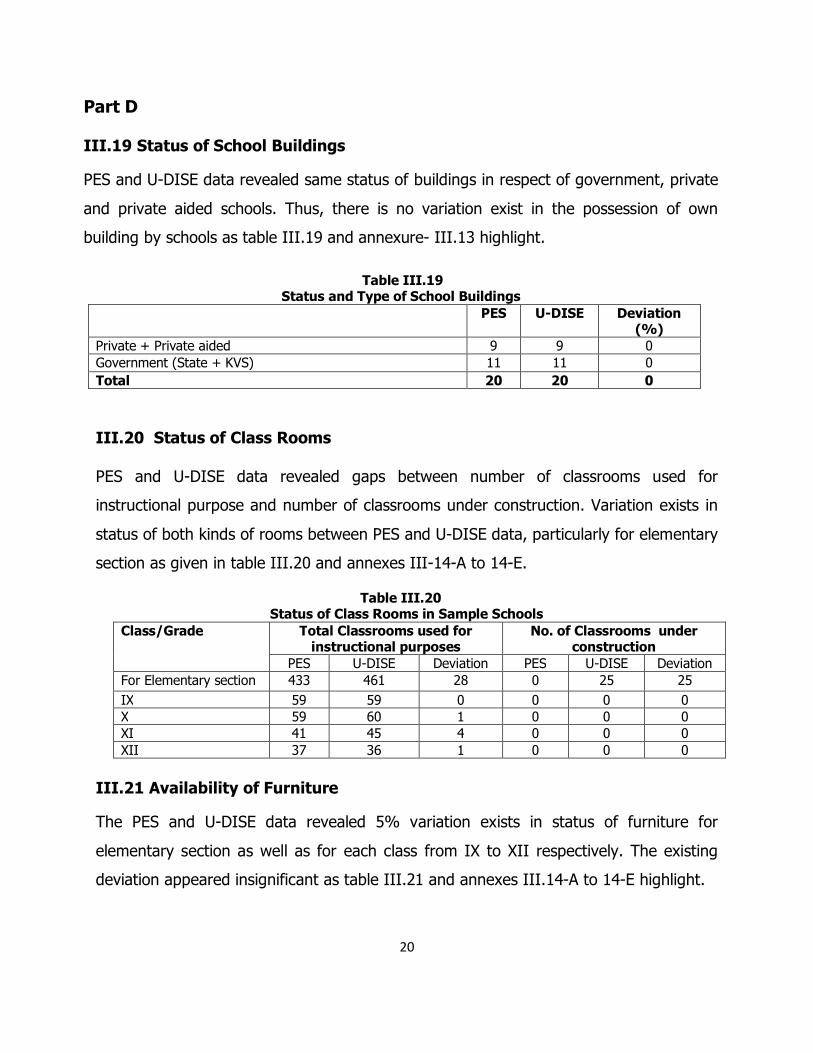
Part D III.19 Status of School Buildings
PES and U-DISE data revealed same status of buildings in respect of government, private
and private aided schools. Thus, there is no variation exist in the possession of own
building by schools as table III.19 and annexure- III.13 highlight.
Table III.19
Status and Type of School Buildings PES U-DISE Deviation
(%) Private + Private aided 9 9 0 Government (State + KVS) 11 11 0 Total 20 20 0 III.20 Status of Class Rooms PES and U-DISE data revealed gaps between number of classrooms used for
instructional purpose and number of classrooms under construction. Variation exists in
status of both kinds of rooms between PES and U-DISE data, particularly for elementary
section as given in table III.20 and annexes III-14-A to 14-E.
Table III.20 Status of Class Rooms in Sample Schools
Class/Grade Total Classrooms used for instructional purposes
No. of Classrooms under construction
PES U-DISE Deviation PES U-DISE Deviation For Elementary section 433 461 28 0 25 25 IX 59 59 0 0 0 0 X 59 60 1 0 0 0 XI 41 45 4 0 0 0 XII 37 36 1 0 0 0
III.21 Availability of Furniture The PES and U-DISE data revealed 5% variation exists in status of furniture for
elementary section as well as for each class from IX to XII respectively. The existing
deviation appeared insignificant as table III.21 and annexes III.14-A to 14-E highlight.
21
Table III.21 Status of Furniture in Sample Schools
Class/Grade PES U-DISE Deviation All Some All Some All Some
For Elementary section 19 1 18 2 1 1 IX 17 0 16 1 1 1 X 17 0 16 1 1 1 XI 10 0 9 1 1 1 XII 8 1 8 1 0 0
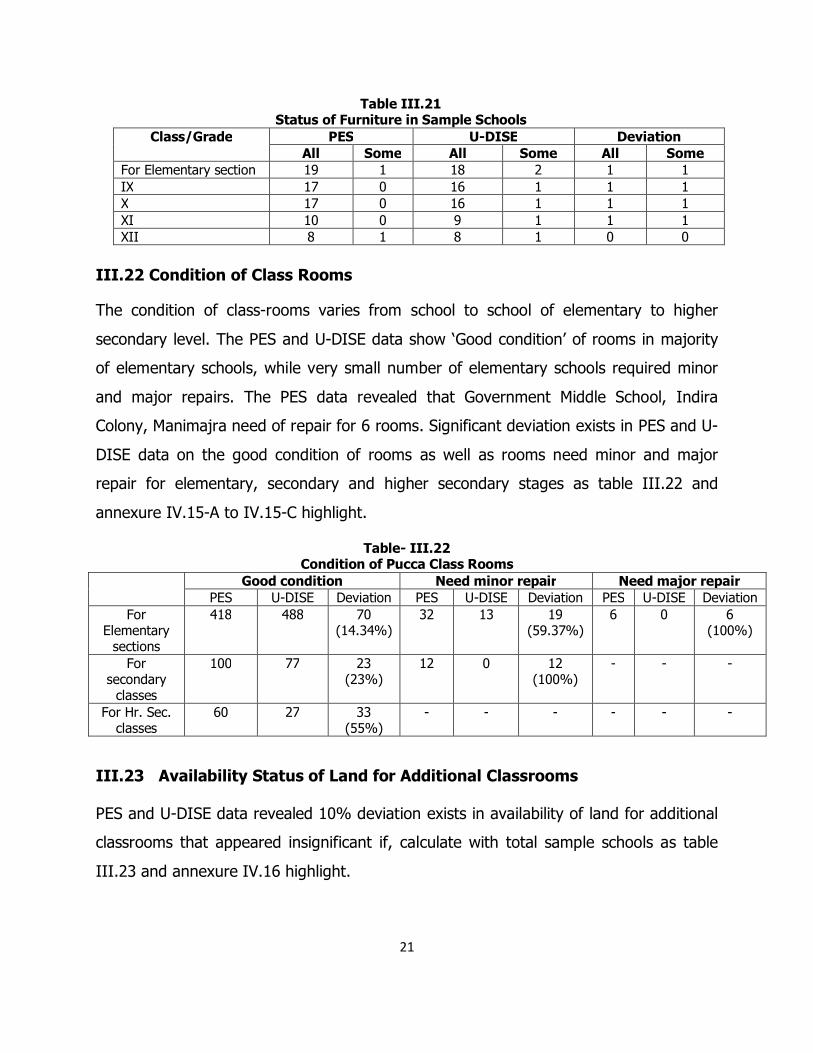
III.22 Condition of Class Rooms
The condition of class-rooms varies from school to school of elementary to higher
secondary level. The PES and U-DISE data show ‘Good condition’ of rooms in majority
of elementary schools, while very small number of elementary schools required minor
and major repairs. The PES data revealed that Government Middle School, Indira
Colony, Manimajra need of repair for 6 rooms. Significant deviation exists in PES and U-
DISE data on the good condition of rooms as well as rooms need minor and major
repair for elementary, secondary and higher secondary stages as table III.22 and
annexure IV.15-A to IV.15-C highlight.
Table- III.22 Condition of Pucca Class Rooms
Good condition Need minor repair Need major repair PES U-DISE Deviation PES U-DISE Deviation PES U-DISE Deviation
For Elementary
sections
418 488 70 (14.34%)
32 13 19 (59.37%)
6 0 6 (100%)
For secondary
classes
100 77 23 (23%)
12 0 12 (100%)
- - -
For Hr. Sec. classes
60 27 33 (55%)
- - - - - -
III.23 Availability Status of Land for Additional Classrooms
PES and U-DISE data revealed 10% deviation exists in availability of land for additional
classrooms that appeared insignificant if, calculate with total sample schools as table
III.23 and annexure IV.16 highlight.
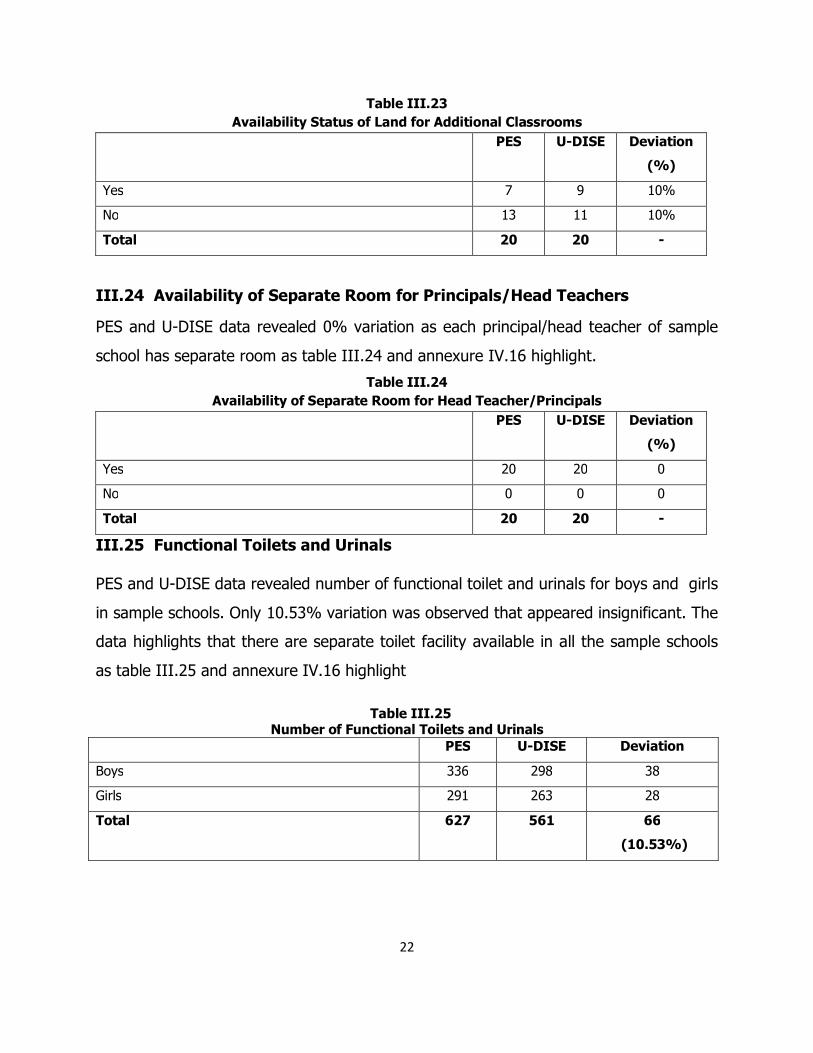
22
Table III.23 Availability Status of Land for Additional Classrooms
PES U-DISE Deviation
(%)
Yes 7 9 10%
No 13 11 10%
Total 20 20 -
III.24 Availability of Separate Room for Principals/Head Teachers
PES and U-DISE data revealed 0% variation as each principal/head teacher of sample
school has separate room as table III.24 and annexure IV.16 highlight.
Table III.24 Availability of Separate Room for Head Teacher/Principals
PES U-DISE Deviation
(%)
Yes 20 20 0
No 0 0 0
Total 20 20 -
III.25 Functional Toilets and Urinals PES and U-DISE data revealed number of functional toilet and urinals for boys and girls
in sample schools. Only 10.53% variation was observed that appeared insignificant. The
data highlights that there are separate toilet facility available in all the sample schools
as table III.25 and annexure IV.16 highlight
Table III.25
Number of Functional Toilets and Urinals PES U-DISE Deviation
Boys 336 298 38
Girls 291 263 28
Total 627 561 66
(10.53%)
23
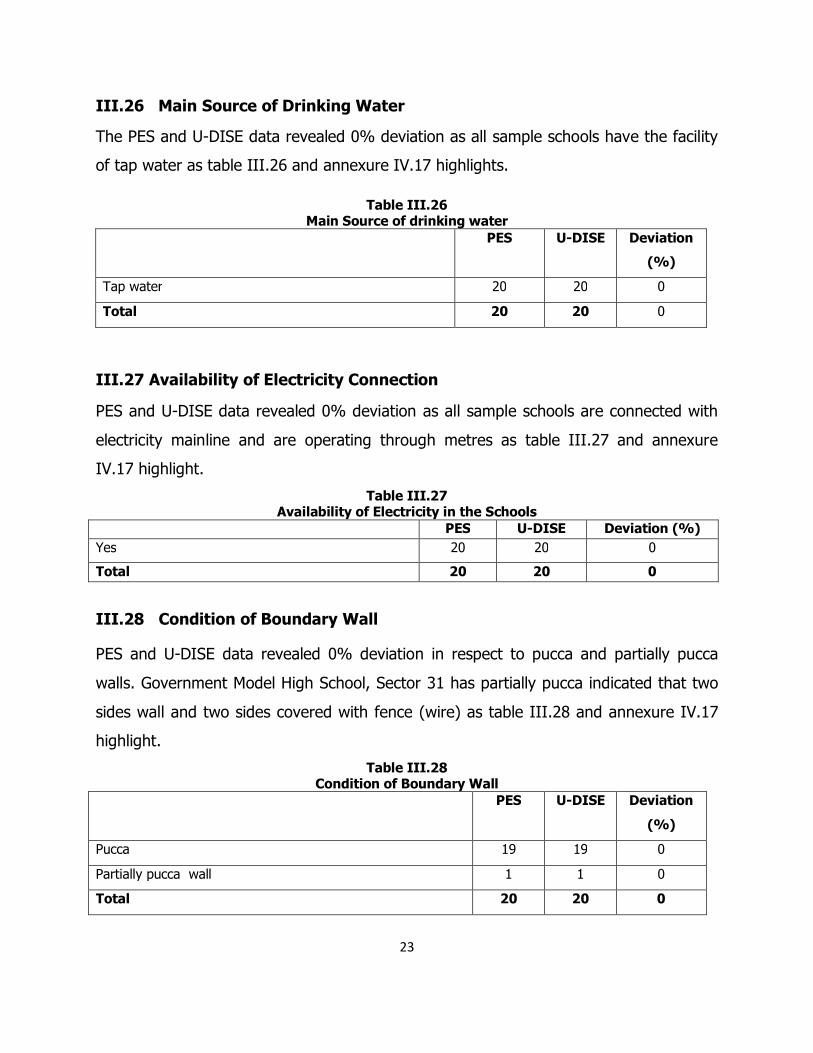
III.26 Main Source of Drinking Water
The PES and U-DISE data revealed 0% deviation as all sample schools have the facility
of tap water as table III.26 and annexure IV.17 highlights.
Table III.26 Main Source of drinking water
PES U-DISE Deviation
(%)
Tap water 20 20 0
Total 20 20 0
III.27 Availability of Electricity Connection
PES and U-DISE data revealed 0% deviation as all sample schools are connected with
electricity mainline and are operating through metres as table III.27 and annexure
IV.17 highlight.
Table III.27 Availability of Electricity in the Schools
PES U-DISE Deviation (%) Yes 20 20 0
Total 20 20 0
III.28 Condition of Boundary Wall
PES and U-DISE data revealed 0% deviation in respect to pucca and partially pucca
walls. Government Model High School, Sector 31 has partially pucca indicated that two
sides wall and two sides covered with fence (wire) as table III.28 and annexure IV.17
highlight.
Table III.28 Condition of Boundary Wall
PES U-DISE Deviation
(%)
Pucca 19 19 0
Partially pucca wall 1 1 0
Total 20 20 0
24
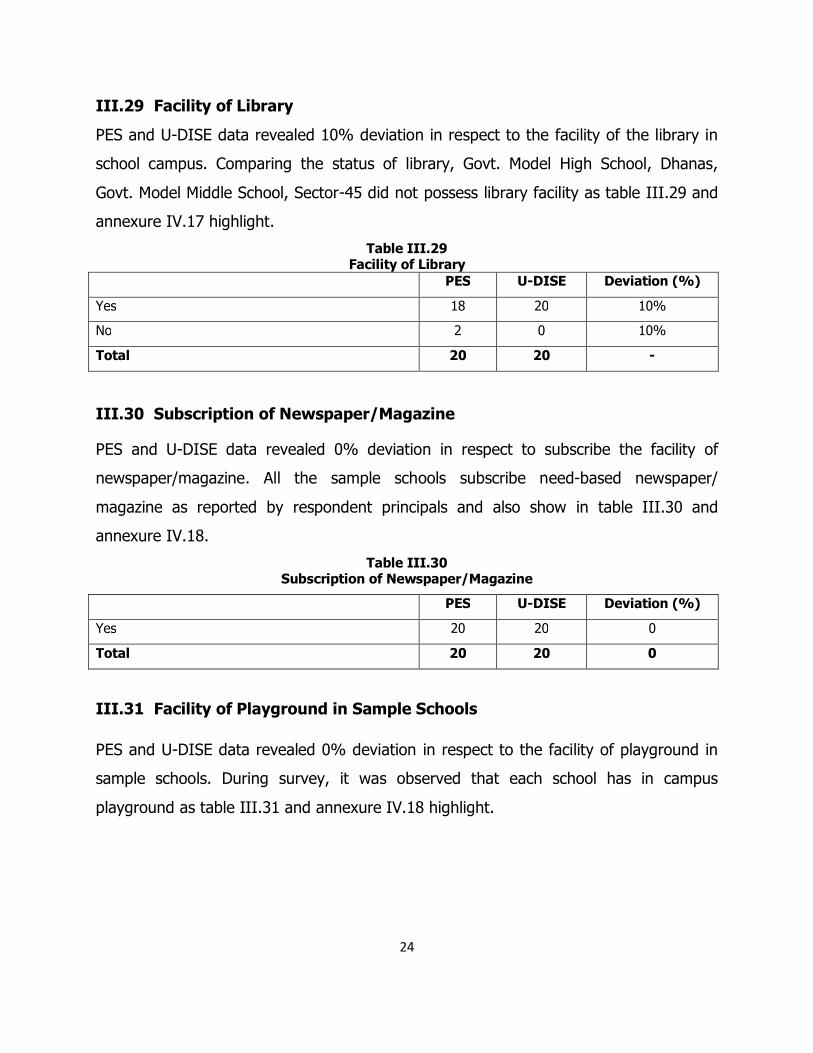
III.29 Facility of Library
PES and U-DISE data revealed 10% deviation in respect to the facility of the library in
school campus. Comparing the status of library, Govt. Model High School, Dhanas,
Govt. Model Middle School, Sector-45 did not possess library facility as table III.29 and
annexure IV.17 highlight.
Table III.29 Facility of Library
PES U-DISE Deviation (%)
Yes 18 20 10%
No 2 0 10%
Total 20 20 -
III.30 Subscription of Newspaper/Magazine
PES and U-DISE data revealed 0% deviation in respect to subscribe the facility of
newspaper/magazine. All the sample schools subscribe need-based newspaper/
magazine as reported by respondent principals and also show in table III.30 and
annexure IV.18.
Table III.30 Subscription of Newspaper/Magazine
PES U-DISE Deviation (%)
Yes 20 20 0
Total 20 20 0
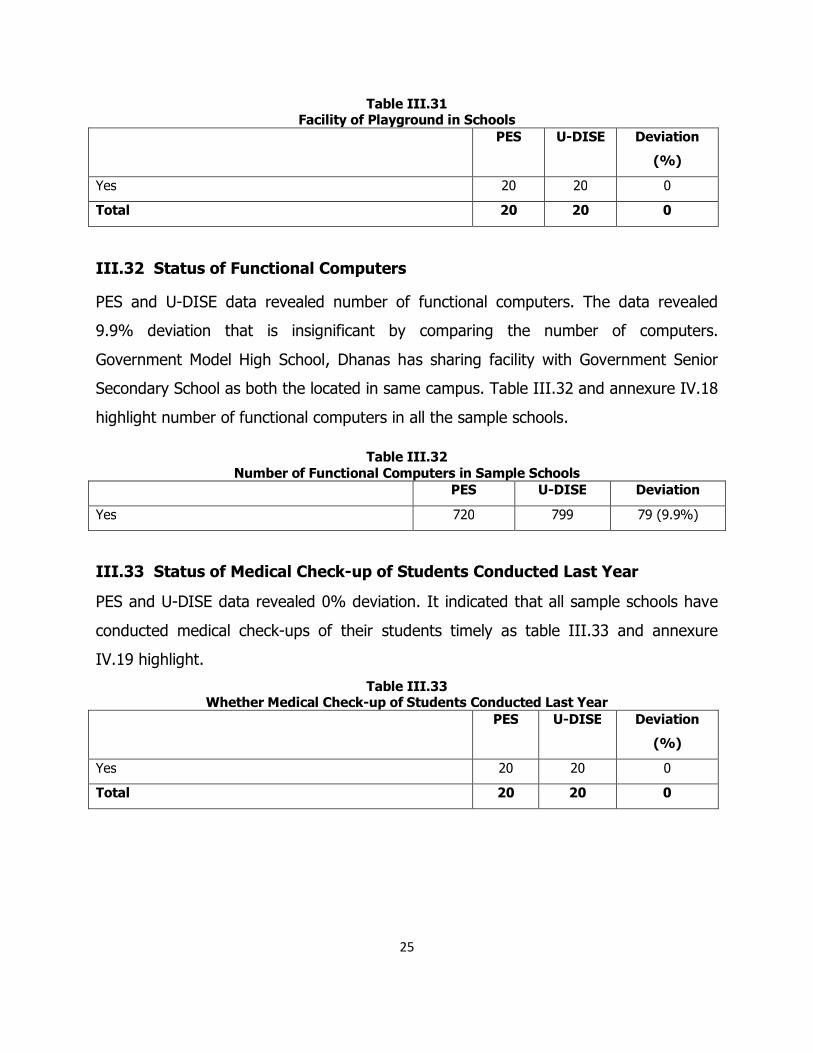
III.31 Facility of Playground in Sample Schools
PES and U-DISE data revealed 0% deviation in respect to the facility of playground in
sample schools. During survey, it was observed that each school has in campus
playground as table III.31 and annexure IV.18 highlight.
25
Table III.31 Facility of Playground in Schools
PES U-DISE Deviation
(%)
Yes 20 20 0
Total 20 20 0
III.32 Status of Functional Computers
PES and U-DISE data revealed number of functional computers. The data revealed
9.9% deviation that is insignificant by comparing the number of computers.
Government Model High School, Dhanas has sharing facility with Government Senior
Secondary School as both the located in same campus. Table III.32 and annexure IV.18
highlight number of functional computers in all the sample schools.
Table III.32 Number of Functional Computers in Sample Schools
PES U-DISE Deviation
Yes 720 799 79 (9.9%)
III.33 Status of Medical Check-up of Students Conducted Last Year
PES and U-DISE data revealed 0% deviation. It indicated that all sample schools have
conducted medical check-ups of their students timely as table III.33 and annexure
IV.19 highlight.
Table III.33 Whether Medical Check-up of Students Conducted Last Year
PES U-DISE Deviation
(%)
Yes 20 20 0
Total 20 20 0
26
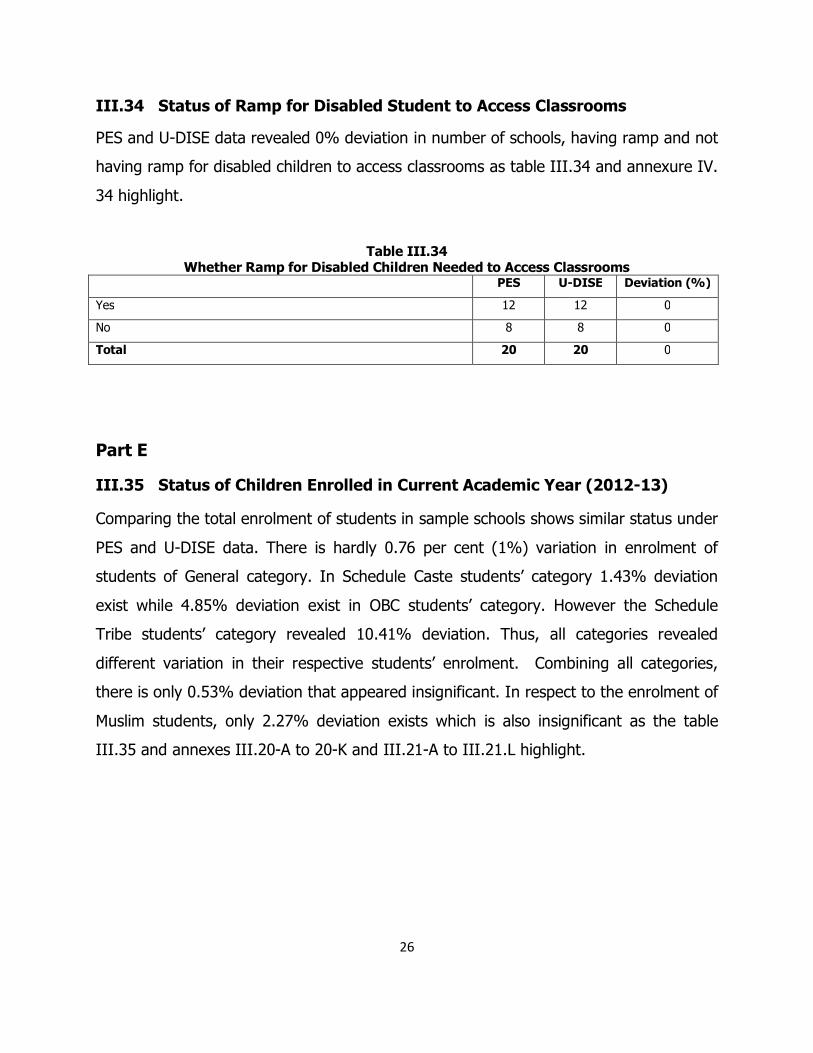
III.34 Status of Ramp for Disabled Student to Access Classrooms
PES and U-DISE data revealed 0% deviation in number of schools, having ramp and not
having ramp for disabled children to access classrooms as table III.34 and annexure IV.
34 highlight.
Table III.34 Whether Ramp for Disabled Children Needed to Access Classrooms
PES U-DISE Deviation (%)
Yes 12 12 0
No 8 8 0
Total 20 20 0
Part E
III.35 Status of Children Enrolled in Current Academic Year (2012-13) Comparing the total enrolment of students in sample schools shows similar status under
PES and U-DISE data. There is hardly 0.76 per cent (1%) variation in enrolment of
students of General category. In Schedule Caste students’ category 1.43% deviation
exist while 4.85% deviation exist in OBC students’ category. However the Schedule
Tribe students’ category revealed 10.41% deviation. Thus, all categories revealed
different variation in their respective students’ enrolment. Combining all categories,
there is only 0.53% deviation that appeared insignificant. In respect to the enrolment of
Muslim students, only 2.27% deviation exists which is also insignificant as the table
III.35 and annexes III.20-A to 20-K and III.21-A to III.21.L highlight.
27
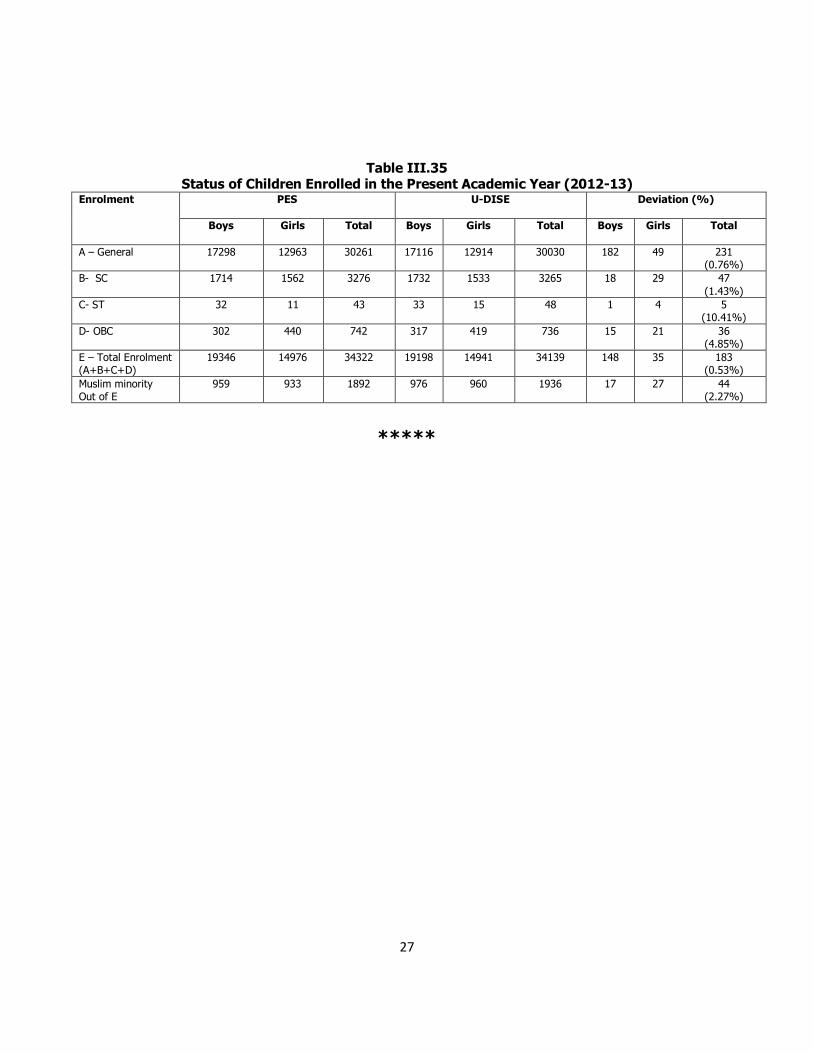
Table III.35 Status of Children Enrolled in the Present Academic Year (2012-13)
Enrolment PES U-DISE Deviation (%)
Boys Girls Total Boys Girls Total Boys Girls Total
A – General 17298 12963 30261 17116 12914 30030 182 49 231 (0.76%)
B- SC 1714 1562 3276 1732 1533 3265 18 29 47 (1.43%)
C- ST 32 11 43 33 15 48 1 4 5 (10.41%)
D- OBC 302 440 742 317 419 736 15 21 36 (4.85%)
E – Total Enrolment (A+B+C+D)
19346 14976 34322 19198 14941 34139 148 35 183 (0.53%)
Muslim minority Out of E
959 933 1892 976 960 1936 17 27 44 (2.27%)
*****
28
Chapter-IV Investigators’ Observations
This chapter highlights the observations of field investigators on specific aspects given
in ‘Investigator Feedback Schedule’. The specific aspects are: initial reaction of the
principal/head teacher towards the investigation, availability and maintenance of school
records, enrolment of students as well as teachers’ strength on 30th September 2012
and problems faced by investigators in getting required information.
IV.1 Name of Investigators, U-DISE School Code and Date of Visit
The name of the investigators, who collected PES data for comparing U-DISE data, U-
DISE school codes and date of visit in sample schools have already been discussed in
previous chapters. The detailed information is given in annexure I.1 and annexure IV.1.
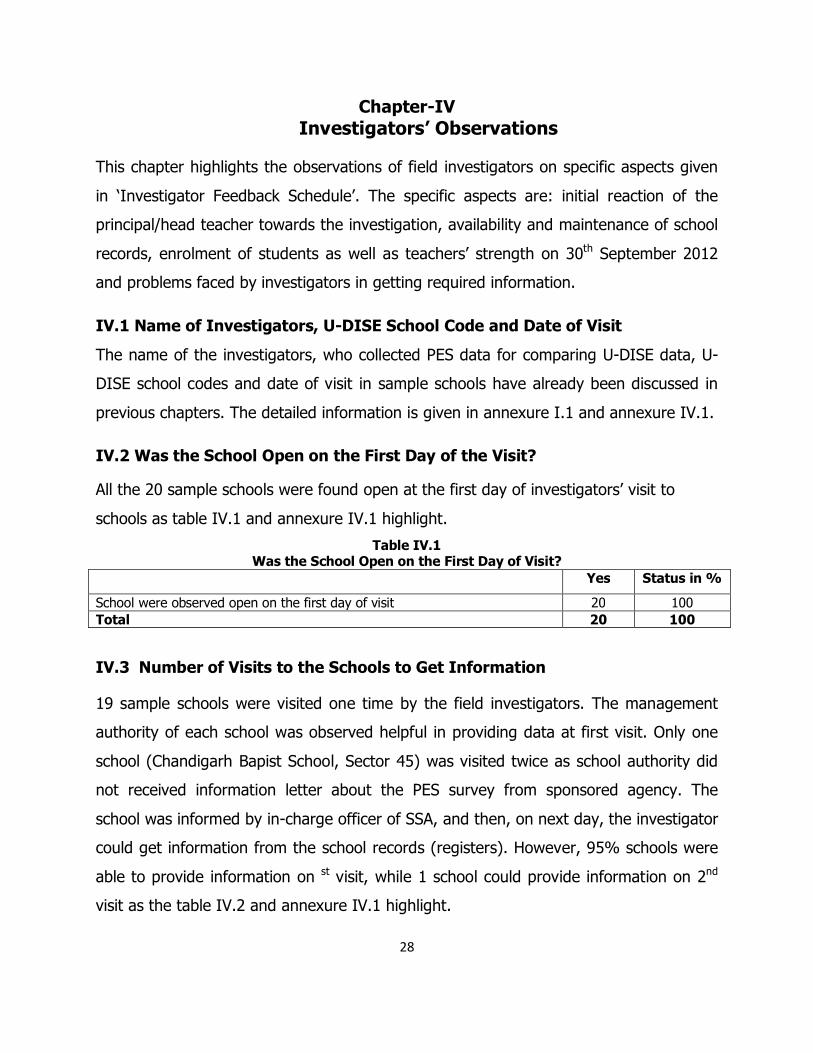
IV.2 Was the School Open on the First Day of the Visit?
All the 20 sample schools were found open at the first day of investigators’ visit to
schools as table IV.1 and annexure IV.1 highlight.
Table IV.1 Was the School Open on the First Day of Visit?
Yes Status in %
School were observed open on the first day of visit 20 100 Total 20 100
IV.3 Number of Visits to the Schools to Get Information
19 sample schools were visited one time by the field investigators. The management
authority of each school was observed helpful in providing data at first visit. Only one
school (Chandigarh Bapist School, Sector 45) was visited twice as school authority did
not received information letter about the PES survey from sponsored agency. The
school was informed by in-charge officer of SSA, and then, on next day, the investigator
could get information from the school records (registers). However, 95% schools were
able to provide information on st visit, while 1 school could provide information on 2nd
visit as the table IV.2 and annexure IV.1 highlight.
29
Table IV.2 Number of Visits to School
No. of Schools Status in % 1 visit 19 95 2 visit 1 5 Total 20 100
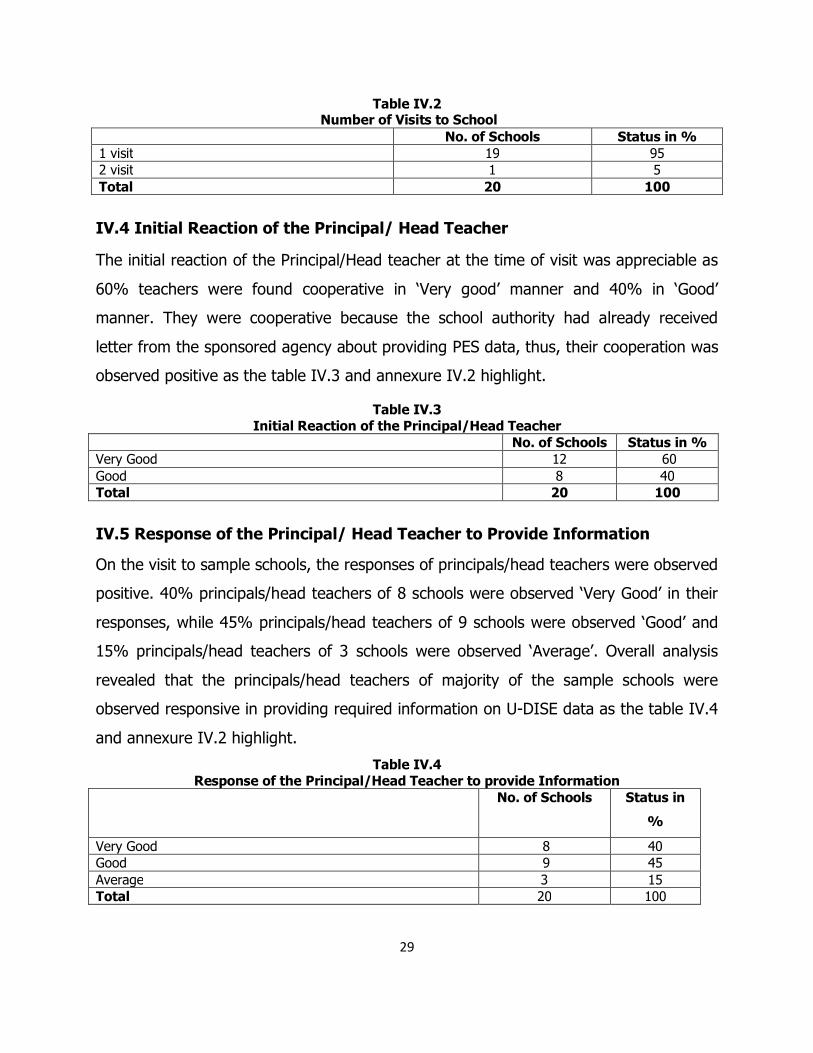
IV.4 Initial Reaction of the Principal/ Head Teacher
The initial reaction of the Principal/Head teacher at the time of visit was appreciable as
60% teachers were found cooperative in ‘Very good’ manner and 40% in ‘Good’
manner. They were cooperative because the school authority had already received
letter from the sponsored agency about providing PES data, thus, their cooperation was
observed positive as the table IV.3 and annexure IV.2 highlight.
Table IV.3 Initial Reaction of the Principal/Head Teacher
No. of Schools Status in % Very Good 12 60 Good 8 40 Total 20 100
IV.5 Response of the Principal/ Head Teacher to Provide Information
On the visit to sample schools, the responses of principals/head teachers were observed
positive. 40% principals/head teachers of 8 schools were observed ‘Very Good’ in their
responses, while 45% principals/head teachers of 9 schools were observed ‘Good’ and
15% principals/head teachers of 3 schools were observed ‘Average’. Overall analysis
revealed that the principals/head teachers of majority of the sample schools were
observed responsive in providing required information on U-DISE data as the table IV.4
and annexure IV.2 highlight.
Table IV.4 Response of the Principal/Head Teacher to provide Information
No. of Schools Status in
%
Very Good 8 40 Good 9 45 Average 3 15 Total 20 100
30
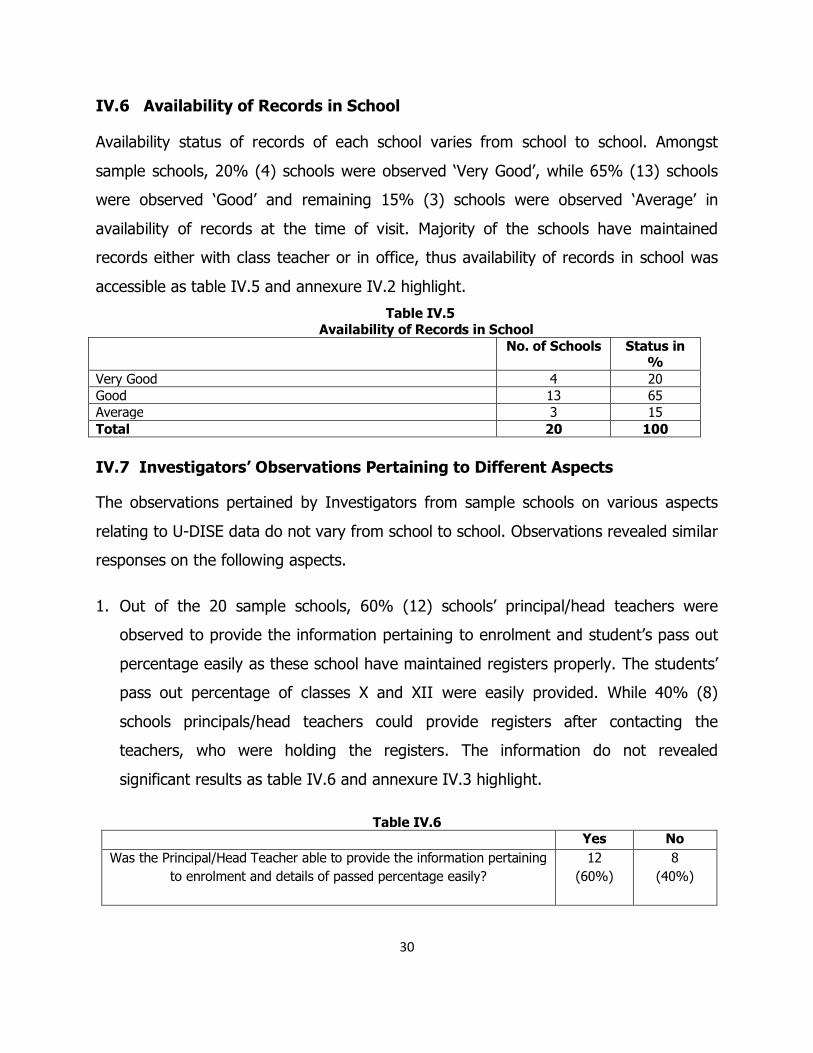
IV.6 Availability of Records in School
Availability status of records of each school varies from school to school. Amongst
sample schools, 20% (4) schools were observed ‘Very Good’, while 65% (13) schools
were observed ‘Good’ and remaining 15% (3) schools were observed ‘Average’ in
availability of records at the time of visit. Majority of the schools have maintained
records either with class teacher or in office, thus availability of records in school was
accessible as table IV.5 and annexure IV.2 highlight.
Table IV.5 Availability of Records in School
No. of Schools Status in %
Very Good 4 20 Good 13 65 Average 3 15 Total 20 100 IV.7 Investigators’ Observations Pertaining to Different Aspects The observations pertained by Investigators from sample schools on various aspects
relating to U-DISE data do not vary from school to school. Observations revealed similar
responses on the following aspects.
1. Out of the 20 sample schools, 60% (12) schools’ principal/head teachers were
observed to provide the information pertaining to enrolment and student’s pass out
percentage easily as these school have maintained registers properly. The students’
pass out percentage of classes X and XII were easily provided. While 40% (8)
schools principals/head teachers could provide registers after contacting the
teachers, who were holding the registers. The information do not revealed
significant results as table IV.6 and annexure IV.3 highlight.
Table IV.6
Yes No Was the Principal/Head Teacher able to provide the information pertaining
to enrolment and details of passed percentage easily? 12
(60%)
8 (40%)
31
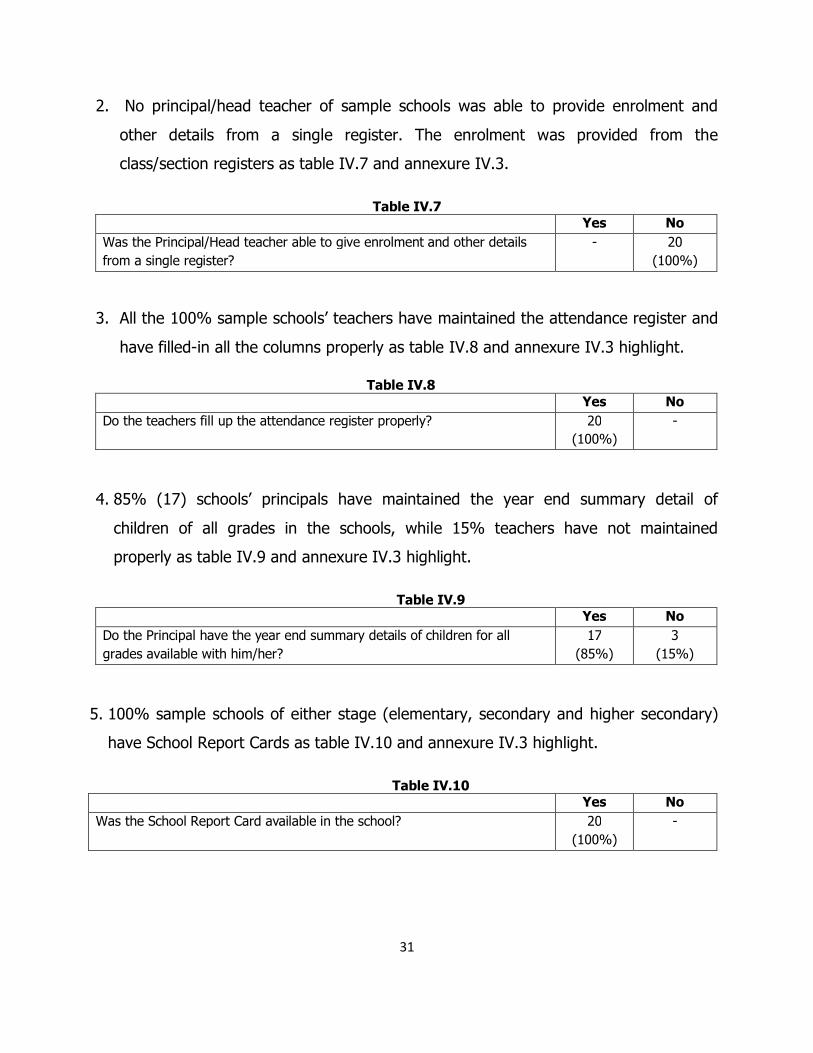
2. No principal/head teacher of sample schools was able to provide enrolment and
other details from a single register. The enrolment was provided from the
class/section registers as table IV.7 and annexure IV.3.
Table IV.7
Yes No Was the Principal/Head teacher able to give enrolment and other details from a single register?
- 20 (100%)
3. All the 100% sample schools’ teachers have maintained the attendance register and
have filled-in all the columns properly as table IV.8 and annexure IV.3 highlight.
Table IV.8 Yes No Do the teachers fill up the attendance register properly? 20
(100%) -
4. 85% (17) schools’ principals have maintained the year end summary detail of
children of all grades in the schools, while 15% teachers have not maintained
properly as table IV.9 and annexure IV.3 highlight.
Table IV.9
Yes No Do the Principal have the year end summary details of children for all grades available with him/her?
17 (85%)
3 (15%)
5. 100% sample schools of either stage (elementary, secondary and higher secondary)
have School Report Cards as table IV.10 and annexure IV.3 highlight.
Table IV.10 Yes No Was the School Report Card available in the school? 20
(100%) -
32
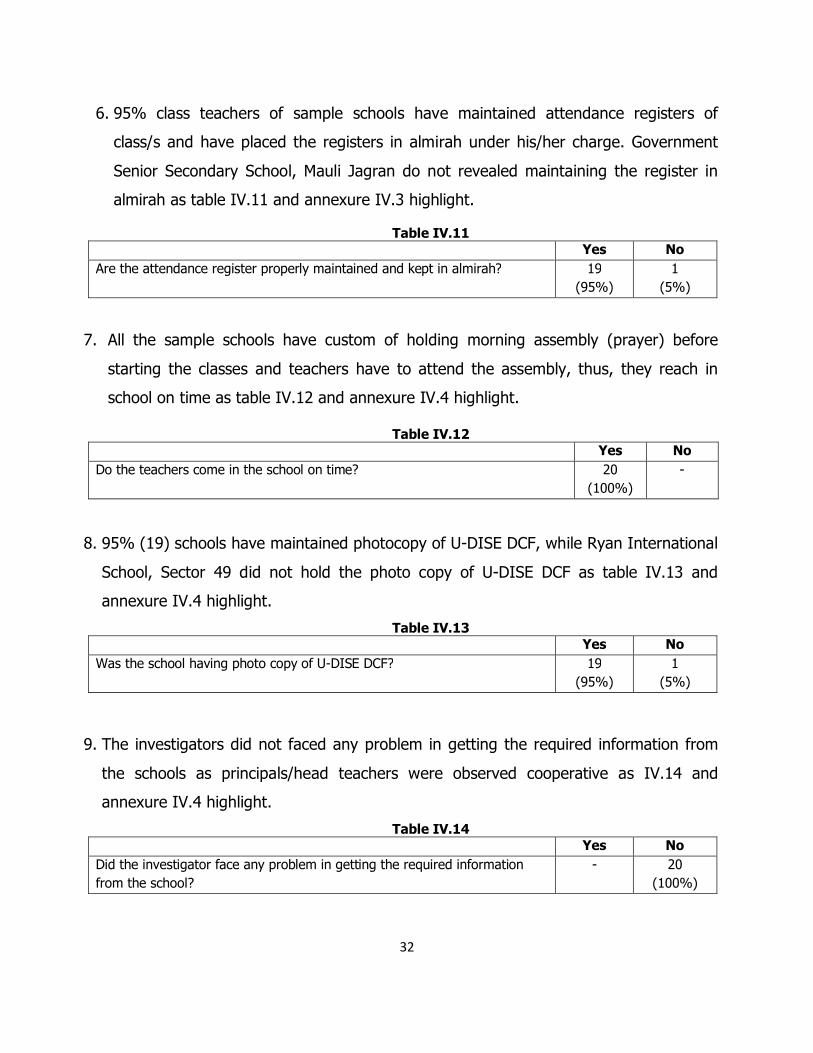
6. 95% class teachers of sample schools have maintained attendance registers of
class/s and have placed the registers in almirah under his/her charge. Government
Senior Secondary School, Mauli Jagran do not revealed maintaining the register in
almirah as table IV.11 and annexure IV.3 highlight.
Table IV.11 Yes No Are the attendance register properly maintained and kept in almirah? 19
(95%) 1
(5%)
7. All the sample schools have custom of holding morning assembly (prayer) before
starting the classes and teachers have to attend the assembly, thus, they reach in
school on time as table IV.12 and annexure IV.4 highlight.
Table IV.12 Yes No Do the teachers come in the school on time? 20
(100%) -
8. 95% (19) schools have maintained photocopy of U-DISE DCF, while Ryan International
School, Sector 49 did not hold the photo copy of U-DISE DCF as table IV.13 and
annexure IV.4 highlight.
Table IV.13 Yes No Was the school having photo copy of U-DISE DCF? 19
(95%) 1
(5%)
9. The investigators did not faced any problem in getting the required information from
the schools as principals/head teachers were observed cooperative as IV.14 and
annexure IV.4 highlight.
Table IV.14 Yes No Did the investigator face any problem in getting the required information from the school?
- 20 (100%)
33
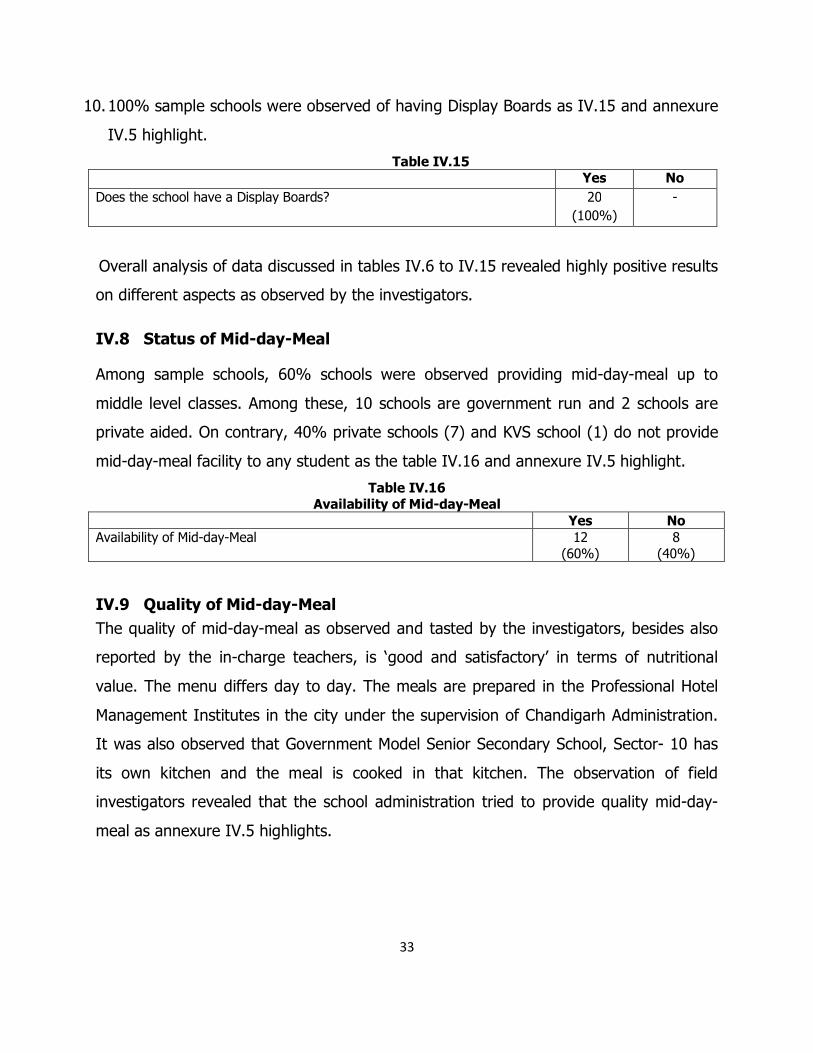
10. 100% sample schools were observed of having Display Boards as IV.15 and annexure
IV.5 highlight.
Table IV.15 Yes No Does the school have a Display Boards? 20
(100%) -
Overall analysis of data discussed in tables IV.6 to IV.15 revealed highly positive results
on different aspects as observed by the investigators.
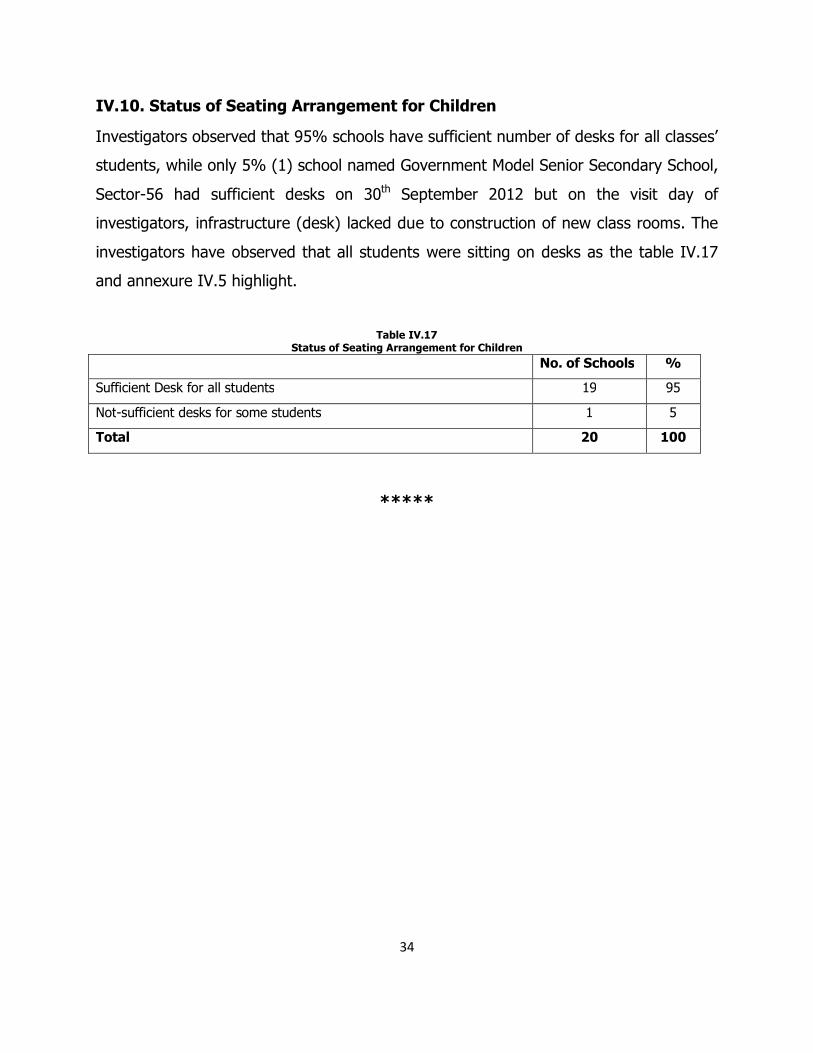
IV.8 Status of Mid-day-Meal Among sample schools, 60% schools were observed providing mid-day-meal up to
middle level classes. Among these, 10 schools are government run and 2 schools are
private aided. On contrary, 40% private schools (7) and KVS school (1) do not provide
mid-day-meal facility to any student as the table IV.16 and annexure IV.5 highlight.
Table IV.16 Availability of Mid-day-Meal
Yes No Availability of Mid-day-Meal 12
(60%) 8
(40%)
IV.9 Quality of Mid-day-Meal
The quality of mid-day-meal as observed and tasted by the investigators, besides also
reported by the in-charge teachers, is ‘good and satisfactory’ in terms of nutritional
value. The menu differs day to day. The meals are prepared in the Professional Hotel
Management Institutes in the city under the supervision of Chandigarh Administration.
It was also observed that Government Model Senior Secondary School, Sector- 10 has
its own kitchen and the meal is cooked in that kitchen. The observation of field
investigators revealed that the school administration tried to provide quality mid-day-
meal as annexure IV.5 highlights.
34
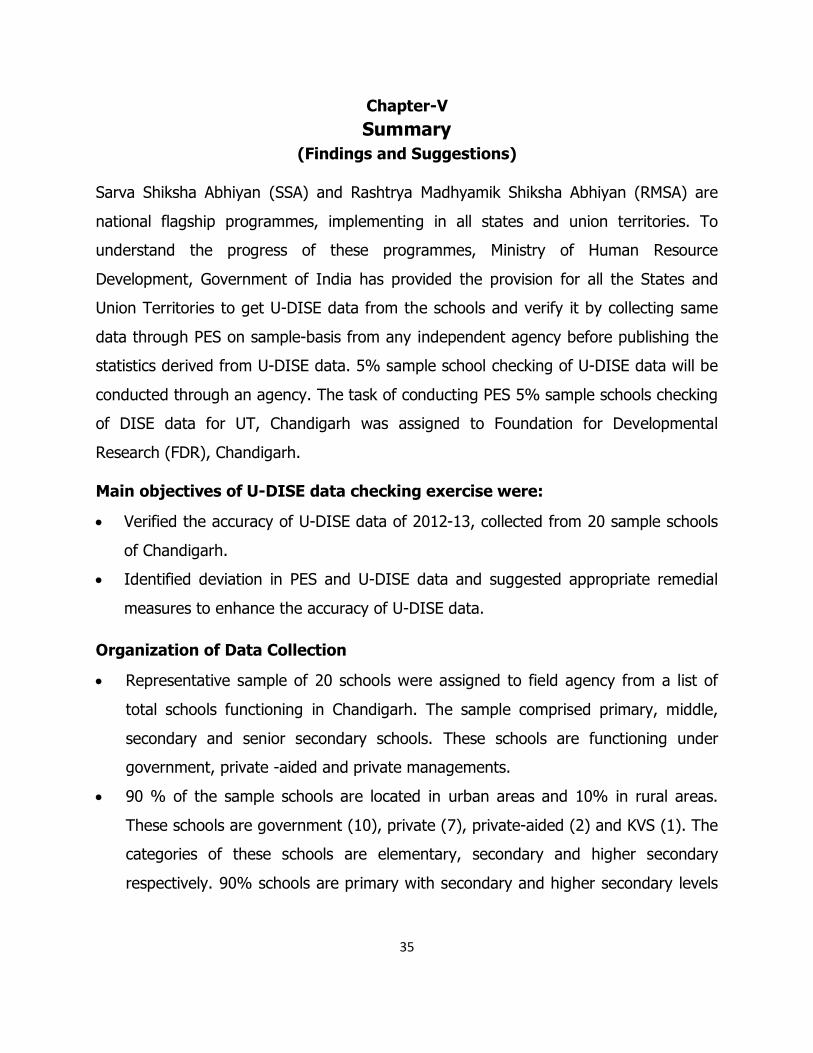
IV.10. Status of Seating Arrangement for Children
Investigators observed that 95% schools have sufficient number of desks for all classes’
students, while only 5% (1) school named Government Model Senior Secondary School,
Sector-56 had sufficient desks on 30th September 2012 but on the visit day of
investigators, infrastructure (desk) lacked due to construction of new class rooms. The
investigators have observed that all students were sitting on desks as the table IV.17
and annexure IV.5 highlight.
Table IV.17
Status of Seating Arrangement for Children No. of Schools %
Sufficient Desk for all students 19 95
Not-sufficient desks for some students 1 5
Total 20 100
*****
35
Chapter-V Summary
(Findings and Suggestions)
Sarva Shiksha Abhiyan (SSA) and Rashtrya Madhyamik Shiksha Abhiyan (RMSA) are
national flagship programmes, implementing in all states and union territories. To
understand the progress of these programmes, Ministry of Human Resource
Development, Government of India has provided the provision for all the States and
Union Territories to get U-DISE data from the schools and verify it by collecting same
data through PES on sample-basis from any independent agency before publishing the
statistics derived from U-DISE data. 5% sample school checking of U-DISE data will be
conducted through an agency. The task of conducting PES 5% sample schools checking
of DISE data for UT, Chandigarh was assigned to Foundation for Developmental
Research (FDR), Chandigarh.
Main objectives of U-DISE data checking exercise were:
• Verified the accuracy of U-DISE data of 2012-13, collected from 20 sample schools
of Chandigarh.
• Identified deviation in PES and U-DISE data and suggested appropriate remedial
measures to enhance the accuracy of U-DISE data.
Organization of Data Collection
• Representative sample of 20 schools were assigned to field agency from a list of
total schools functioning in Chandigarh. The sample comprised primary, middle,
secondary and senior secondary schools. These schools are functioning under
government, private -aided and private managements.
• 90 % of the sample schools are located in urban areas and 10% in rural areas.
These schools are government (10), private (7), private-aided (2) and KVS (1). The
categories of these schools are elementary, secondary and higher secondary
respectively. 90% schools are primary with secondary and higher secondary levels
36
followed by 10% are elementary level. The PES data of these schools was collected
during 20th March to 8th April 2013.
• Tools used for PES data was provided by the State Project Director (SSA Office)
and also verified by downloaded from www.dise.in/udise.html. For comparison of
PES data with U-DISE data, the filled-in U-DICE DCF were also collected from State
Project Director (SSA Office). To calculate deviation between PES data and U-DISE
data, the formula was prepared (see chapter-II).
• Tables were prepared by using PES and U-DISE data of same sample schools to
find out deviation between both the data. Since PES data was collected by an
agency U-data was provided by SSA office, thus compromising adjustment in data
is zilch (zero), thus, results appeared applicable.
Findings Emerged from PES and U-DISE Data
The proceeding pages highlights results emerged on various aspects relating to sample
schools, which are discussed in previous chapters. The PES and U-DISE data analysis
appeared to reveal mostly significant and insignificant deviation in some aspects. The
deviation in both the data revealed as:
• Ward-wise location of sample schools shows 0% variation between PES and U-DISE
data.
• School category-wise deviation revealed 0% that appeared insignificant.
• All the sample schools were matched by showing same school code number, thus
0% variation appeared in school code numbers.
• Education-wise 90% teachers have obtained B.Ed degree, which is mandatory for
teaching purpose. The Principal of Manav Mangal High School, Sector-21 has
obtained M.Phil and the Principal of Government Model Middle School, Sector-45
has obtained Gyani. However, 95% of the principals fulfil the qualification of
teachers.
• The working experience of principals in the present positioned schools and total
experience being principal varies from less than one year to more than 16 years but
majority of the principals’ irrespective of any category fall between 1 to 10 years
37
respectively. The Principals of government schools have lesser year’s experience
being holding the position of Principal, while Principals of private schools have
longer years’ experience being holding the position of Principal.
• Class-wise status of schools varies from class 1st to class 12th. 95% schools start
from class 1st while only one school start from class 6th. In respect of highest class
in the school, 45% schools have class 12th. Both the data revealed 0% variation in
respect to the highest class level. Thus, results are significant in respect to lowest
and highest class respectively in sample schools.
• The type of schools do not reveal any variation in elementary, secondary and
higher secondary stages. There is only one (5%) school was meant for girls only
while 19 (95%) sample schools were observed co-educational.
• Management-wise deviation revealed 0% variation. Among them 10 (50%) schools
run under government management, 7 (35%) private, 2 (10%) private-aided and
only one school run under centre government. PES and U-DISE data revealed
similar status of management.
• The establishment year of sample schools under PES and U-DISE data fall between
the year 1951 and 2010. PES and U-DISE data show 10% variation in respect to
establishment year of sample schools.
• The recognition year of sample schools under PES and U-DISE data fall between
the year 1951 and 2010. PES and U-DISE data show 15% variation in respect to
recognition year of sample schools.
• PES and U-DISE data revealed 0% deviation in respect to the status of building
being used as a part of shift school. Data revealed that the buildings of 6 schools
are used as a part of shift schools.
• Residential schools revealed 0% variation. The DAV School, Sector-8 reported
residential school in PES data and U-DISE data.
• PES and U-DISE data reveals 0% variation at secondary stage and 0% variation in
higher secondary stage in respect to the status of affiliation. The PES and U-DISE
38
data revealed that 17 (85%) sample secondary schools are affiliated with CBSE
while only one school affiliated with ICSE respectively.
• PES and U-DISE data revealed 0% deviation in the status of attachment of pre-
primary section to sample schools. 18 (90%) sample schools have pre-primary
section respectively. There is 3% variation between the number of teachers
teaching in primary section while 15.46% variation in the number of students
studying in pre-primary sections by comparing both the data.
• PES and U-DISE data revealed 0% variation in the status of CCE at elementary
level in sample schools.
• PES and U-DISE data revealed 0% deviation in number of students appeared and
number of students pass-out in classes 10th and 12th examinations for the year
2011-12.
• 2.5 % deviation exists in the ‘number of teachers positioned on sanctioned posts.
The variation is marginal. 2.6% variation exists in PES and U-DISE data on number
of teachers positioned on 2011-12. On contract-based teachers, 3.8% variation
exists, while there is no variation appeared in case of part-time instructors
positioned as per RTE. Overall results revealed insignificant variation exist by
comparing PES and U-DISE data.
• 0% variation exists in respect to status and type of school building. 100%
government and private sample schools have own school buildings.
• PES and U-DISE data revealed marginal variation in total number of classrooms
used for instructional purposes for elementary section. There is 0% variation in
respect to classrooms under construction.
• PES and DISE data revealed 5% variation in the status of furniture in sample
schools from elementary section to class 11th that appeared insignificant in overall
status of furniture.
• The condition of classrooms varies from school to school for elementary to higher
secondary classes. In respect to the good condition of pucca classrooms, the
significant variation between both the data appeared as 14.34% for elementary
39
section, 23% for secondary classes and 55% for higher secondary classes. There is
59.37% variation for elementary level classrooms and 100% variation for secondary
classes in respect to the need of minor repair. 100% variation for 6 rooms in one
elementary section exists for need of major repair. However, both the data
revealed variation in respect to good condition of rooms and need of minor or
major repairs of classrooms.
• PES and U-DISE data revealed 10% variation in the availability of land for
additional classrooms in respect to responses ‘yes’ and ‘no’.
• PES and U-DISE data revealed 0% deviation as each principal/head teacher of
sample schools has separate room.
• Each sample school has functional toilets and urinals but PES and U-DISE data
revealed 10.53% deviation in respect to boys and girls separate toilets. This
deviation is observed insignificant comparing to the number of toilets.
• 0% deviation was observed in PES and U-DISE data as each school has tap water
facility for drinking.
• 0% deviation was observed in PES and U-DISE data as each school has the
availability of electricity connection.
• PES and U-DISE data revealed 0% variation as 95% schools have pucca wall while
only one school has partially pucca wall.
• PES and U-DISE data revealed 10% variation as 2 schools did not have library
facility.
• PES and U-DISE data revealed 0% variation as all schools subscribe
newspaper/magazine.
• PES and U-DISE data revealed 0% variation as every school has playground facility
in its campus.
• Functional computers are available in all sample school but the number of
functional computers available in all sample schools revealed 9.9% variation.
• 0% deviation was observed in respect to medical check-up of students conducted
last year.
40
• There is no variation exists in respect to availability of ramp for disable children
needed to access classrooms.
• Variations exist in PES and U-DISE data in respect to enrolment of general students
(0.79%), SC student (1.43%), ST (10.41%), OBC (4.85%) respectively. Overall,
0.56% deviation exists in all categories that appeared insignificant. In respect to
Muslim minority, 2.27% deviation exists that is also insignificant by comparing the
total number of enrolled students.
Overall, 0% variation was observed in major items of school facilities comparing by PES
and U-DISE data.
Findings Observed from ‘Investigator’s Feedback Schedule’
• All sample schools were observed open on the first day of visit of investigators. • 95% schools were visited one time while only one school was visited twice. This
happened because the letter issued from SSA office for cooperation to field
investigators, was not received by the school authority.
• The initial reaction of the principals/head teachers of 60% sample schools was
observed ‘very good’ and 40% ‘good’ respectively.
• The response of principals/head teachers of 40% sample schools were observed
‘very good’, while 45% ‘good’ and 15% ‘average’ that appeared significant
responses in providing PES data.
• Availability of records in 20% schools was observed ‘very good’, 65% ‘good’ and
15% ‘average’ respectively.
• 60% principals/head teachers were able to provide the information pertaining to
enrolment and details of pass percentages easily while 40% teachers had collected
information from other teachers.
• No principal/head teacher was able to provide data on enrolment and other details
from a single register. 100% sample school teachers had maintained the attendant
register by filled-up all the columns properly
41
• 85% principals/head teachers had maintained the ‘year and summary detail of
children’ were all greats while 15% did not maintained.
• 100% sample schools were observed having school report cards.
• 95% class teachers of sample schools had maintained attendant registers of their
respective classes and have placed the registers in almirah. Government Senior
Secondary School, Mouli Jagarn did not maintain the register properly.
• Teachers of 100% sample schools were observed reaching school on-time.
• 95% sample schools had photocopy of U-DISE DCF while Rayan International
School, Sector 49 did not hold the photocopy of U-DISE.
• The investigators did not find any problem in getting required information from all
sample schools.
• 100% sample schools were observed of having Display Board.
• All the government and private-aided sample schools provide Mid-Day-Meal to
children up to elementary level. The quality of Mid-Day-Meal was observed and
tasted by investigators and appeared ‘good and satisfactory’ in terms of nutritious
value.
• 95% sample schools were observed having sufficient desks for all students, while
Government Model Senior Secondary School, Sector-56 observed ‘not sufficient’
desks for some students.
The overall observations of investigators relating to various aspects of sample schools
were found satisfactory and significant. Suggestions for Enhancing the Quality of PES and U-DISE data The deviation between PES and U-DISE data on some aspects revealed the need of
some remedial measures for enhancing the quality of U-DISE data, thus the following
suggestions are proposed:
• Definition of the term used in U-DISE DCF need to be elaborated to all the
principals/head teachers/teachers of all sample schools.
42
• The teachers, who had taken training of Data Capture Format (DCF) of U-DISE,
need to be given to fill the Format of school U-DISE and the same teacher need to
be deputed to provide the information to investigators for PES data. This strategy
may help in reducing the error in data and the PES and U-DISE data will easily be
comparable.
• The training of teachers regarding to fill-in the U-DISE DCF needs to strengthen by
involving outside subject-experts from universities, training centres and NGOs.
• The DPI (Schools) need to instruct all the government, private and aided schools to
maintain similarity in keeping the school records.
• Most of the principals/head teachers are unaware about the School’s U-DISE Code
Number, this usually creates problem in comparing the PES and U-DISE data. Thus,
it is essential to make the principals/head teachers aware about the School’s U-
DISE Code Number. This may be highlighted on Display Board of each school.
• The PES and U-DISE Formats show gaps in certain columns, thus, there is a need
to have similar ‘Formats’ for PES data and U-DISE data.
• Teachers reported that sufficient time is needed to fill-in U-DISE DCF. At least one
month is required to fill-in the U-DISE DCF as reported by the principals/head
teachers. It is difficult to approach one school in one day for collecting massive
information, therefore, the field agency is needed more than 2 months to visit 20
sample schools, analysis data and submit report.
• To verify the U-DISE data, it is necessary to collect information under PES
simultaneously. Thus, it becomes necessary that data collection time need to be
fixed in a particular month/months for both the agencies.
• The 5% sample size is too small to find out the deviation, thus the sample size
needs to be increased.
• During PES, some schools located in periphery of the city have extensive enrolment
of students, while schools located in mainstream sectors have limited enrolment. To
maintain the yardstick enrolment of each school, the strategy needs to be prepared
43
so that the over burden of enrolment in certain schools may be checked. This may
improve the quality of education.
• The mid-day-meal needs to given only to needy students instead of giving to all
students this may avoid the wastage of food. The serving methodology of mid-day-
meal need to be improved.
*****
44
Annexes
45
Annexure-I.1 Survey Profile of the Sample Schools
Sr. No. Name of the School Date of Visit to School
Academic Year Name of the person
conducting the survey
Name of the organization conducting the survey
1. Government Model Senior Secondary School, Sector -10, Chandigarh
6/4/13 2012-13 Maninder Singh/Kishan
singh
Foundation For Developmental Research
2. Government Senior Secondary School, Khuda Alisher 8/4/13 2012-13 Maninder Singh Foundation For Developmental Research
3. Government Model High School – Dhanas 5/4/13 2012-13 Kishan singh Foundation For Developmental Research
4. Government Model Middle School, Sector -45, Chandigarh
27/3/13 2012-13 Maninder Singh Foundation For Developmental Research
5. Government Senior Secondary School, Mauli Jagran 8/4/13 2012-13 Maninder Singh, Foundation For Developmental Research
6. Government Model High School, Sector -31, Chandigarh
1/4/13 2012-13 Maninder Singh Foundation For Developmental Research
7. Government Senior Secondary School, Mani Majra Town
25/3/13 2012-13 Kishan Singh Foundation For Developmental Research
8. Government Model High School, Sector -29, Chandigarh
2/4/13 2012-13 Kishan singh Foundation For Developmental Research
9. Government Model Senior Secondary School, Sector 56, Chandigarh
4/4/13 2012-13 Maninder Singh/ Kishan singh
Foundation For Developmental Research
10. Government Middle School, Indira Colony Mani Majra
3/4/13 2012-13 Kishan singh Foundation For Developmental Research
11. Ryan International School, Sector 49, Chandigarh 26/3/13 2012-13 Maninder Singh Foundation For Developmental Research
12. Tender Heart, Sector 33, Chandigarh 22/3/13 2012-13 Kishan Singh
Foundation For Developmental Research
13. Manav Mangal School, Sector 21, Chandigarh 20/3/13 2012-13 Maninder Singh Foundation For Developmental Research
14. Gurukul Global School, IT park Manimajra 21/3/13 2012-13 kishan Singh Foundation For Developmental Research
15. Chandigarh Bapist School, Sector 45, Chandigarh 3/4/13 2012-13 Maninder Singh Foundation For Developmental Research
16. Sri Guru Harkrishan School, Sector 38-D, Chandigarh 23/3/13 2012-13 Maninder Singh Foundation For Developmental Research
17. Chitkara International School, Sector 25, Chandigarh 21/3/13 2012-13 Maninder Singh Foundation For Developmental Research
18. DAV Senior Secondary School, Sector 8, Chandigarh 6/4/13 2012-13 Maninder Singh/ Kishan singh
Foundation For Developmental Research
19. Vedic Girls Senior Secondary School, Old Mani Majra, Chandigarh
23/3/13 2012-13 Kishan Singh Foundation For Developmental Research
20. Kendriya Vidyalya OCF, Sector 29, Chandigarh 26/3/13 2012-13 Kishan Singh Foundation For Developmental Research
46
Annexure-II.1 Location-wise Status of Surveyed Schools
S. No. Name of the School Village Name (Rural area)/
Ward No. (Urban area)
Rural-1 Urban-2 (Code)
Block/Municipal Name
Status of DISE School Code at the
time of visit of school
Status of U-DISE code received from
Office SSA
Deviation %
PES U-DISE Deviat
ion (%)
PES U-DISE
Deviation (%)
1. Government Model Senior Secondary School, Sector -10, Chandigarh
1 1 0
2 2 0
chandigarh 04010101201 04010101201 0
2. Government Senior Secondary School, Khuda Alisher
NA NA 0 1 1 0 chandigarh 04010100101 04010100101 0
3. Government Model High School – Dhanas
5 5 0 1 1 0 chandigarh 04010500402 04010500402 0
4. Government Model Middle School, Sector -45, Chandigarh
10 10 0 2 2 0 chandigarh 04011000401 04011000401 0
5. Government Senior Secondary School, Mauli Jagran
19 19 0 1 1 0 chandigarh 04011900301 04011900301 0
6. Government Model High School, Sector -31, Chandigarh
17 17 0 2 2 0 chandigarh 04011700101 04011700101 0
7. Government Senior Secondary School, Mani Majra Town
20 20 0 2 2 0 Chandigarh 04012000401 04012000401 0
8. Government Model High School, Sector -29, Chandigarh
15 15 0 2 2 0 chandigarh 04011500301 04011500301 0
9. Government Model Senior Secondary School, Sector 56, Chandigarh
7 7 0 2 2 0 chandigarh 04010700701 04010700701 0
10. Government Middle School, Indira Colony Mani Majra
20 20 0 2 2 0 chandigarh 04012000101 04012000101 0
11. Ryan International School, Sector 49, Chandigarh
13
13
0 2 2 0 Chandigarh 0401100401 0401100401 0
12. Tender Heart, Sector 33, Chandigarh
- - 0 2 2 0 chandigarh 04011103402 04011103402 0
13. Manav Mangal High School, Sector 21-C, Chandigarh
12 12 0 2 2 0 Chandigarh 04011200302 04011200302 0
47
14. Gurukul Global School, IT park Manimajra
20 20 0 2 2 0 Chandigarh 04012000404 04012000404 0
15. Chandigarh Bapist School, Sector 45, Chandigarh
10 10 0 2 2 0 chandigarh 04011333404 04011333404 0
16. Sri Guru Harkrishan School, Sector 38-D, Chandigarh
6 6 0 2 2 0 chandigarh 0600303 0600303 0
17. Chitkara International School, Sector 25, Chandigarh
5 5 0 2 2 0 Chandigarh 04010500114 04010500114 0
18. DAV Senior Secondary School, Sector 8, Chandigarh
1 1 0 2 2 0 chandigarh 04010101001 04010101001 0
19. Vedic Girls Senior Secondary School, Old Mani Majra, Chandigarh
20 20 0 2 2 0 Chandigarh 04012000702 04012000702 0
20. Kendriya Vidyalya OCF, Sector 29, Chandigarh
15 15 0 2 2 0 chandigarh 04011500304 04011500304 0
48
Annexure-III.1 Qualification of Principals/Head Teachers
1 2 Sr. No. Name of the School
Name of the Principal/Head
Teacher (Mr./Ms)
Educational Qualification of Principal
Number of year working as
Principal/Head Teacher in the present school
Total number of year of experience working as
Principal/Head Teacher in schools
1. Government Model Senior Secondary School, Sector -10, Chandigarh
Ms. Indra Beniwal MA, Bed, 9 11
2. Government Senior Secondary School, Khuda Alisher
Mr.Rajan Kamal M.Com, B.ed 1 4
3. Government Model High School – Dhanas
Ms. Harmeet kaur
Ms. Abhilasha (evening section)
M.A, M.ed
M.A, B.ed
1 1
4. Government Model Middle School, Sector -45, Chandigarh
Ms. Daljeet Kaur B.A, Giani 2 2
5. Government Senior Secondary School, Mauli Jagran
Ms. Manjeet Kaur
Ms. Naresh Kumari (evening section)
M.A, B.ed
JBT
1 3
1 9
6. Government Model High School, Sector -31, Chandigarh
Mr. Ramesh kumar M.Sc, B.ed 1 5
7. Government Senior Secondary School, Mani Majra Town
Ms. Manita M.sc, B.ed 1 1
8. Government Model High School, Sector -29, Chandigarh
Mr. Rajesh Kumar B.Sc, B.Ed 3 3
9. Government Model Senior Secondary School, Sector 56, Chandigarh
Ms. Neeta Sharma M.A, M.ed 2 months 2 months
10. Government Middle School, Indira Colony Mani Majra
Ms. Sunita Sethi M.A, B.ed 3.5 3.5
11. Ryan International School, Sector 49, Chandigarh
Ms. Rosy Choudhary (Officiating Principal)
B.Sc, B.ed 1 1
12. Tender Heart, Sector 33, Chandigarh Mr. Vikrant Suri M.Sc, M.com, M.Phil,Med
1 1
13. Manav Mangal High School, Sector 21-C, Chandigarh
Mr. Sanjay Sardana M.SC, M.Phil 16 16
14. Gurukul Global School, IT park Manimajra
Ms. Aruna Bhardwaj MBA, B.ed 6 6
15. Chandigarh Bapist School, Sector 45, Chandigarh
Ms. Sarojni Masih B.A, B.ed 27 27
16. Sri Guru Harkrishan School, Sector 38-D, Chandigarh
Ms. Harpreet kaur M.Sc, M.A, B.Ed 19 19
17. Chitkara International School, Sector 25, Chandigarh
Niyti chitkara B.ed, M.ed/MBA 8 8
18. DAV Senior Secondary School, Sector 8, Chandigarh
Dr. Vibha Ray M.A, M.Ed, M.Phil, LLB, Ph.d
6 6
19. Vedic Girls Senior Secondary School, Old Mani Majra, Chandigarh
Ms. Versha Malik M.A, B.ed 3 3
20. Kendriya Vidyalya OCF, Sector 29, Chandigarh
Mr. P.C Sharma,
Ms. Neelam verma
M.Sc, M.ed (principal)
MA,B.Ed (Head
mistress –primary wing)
8
8
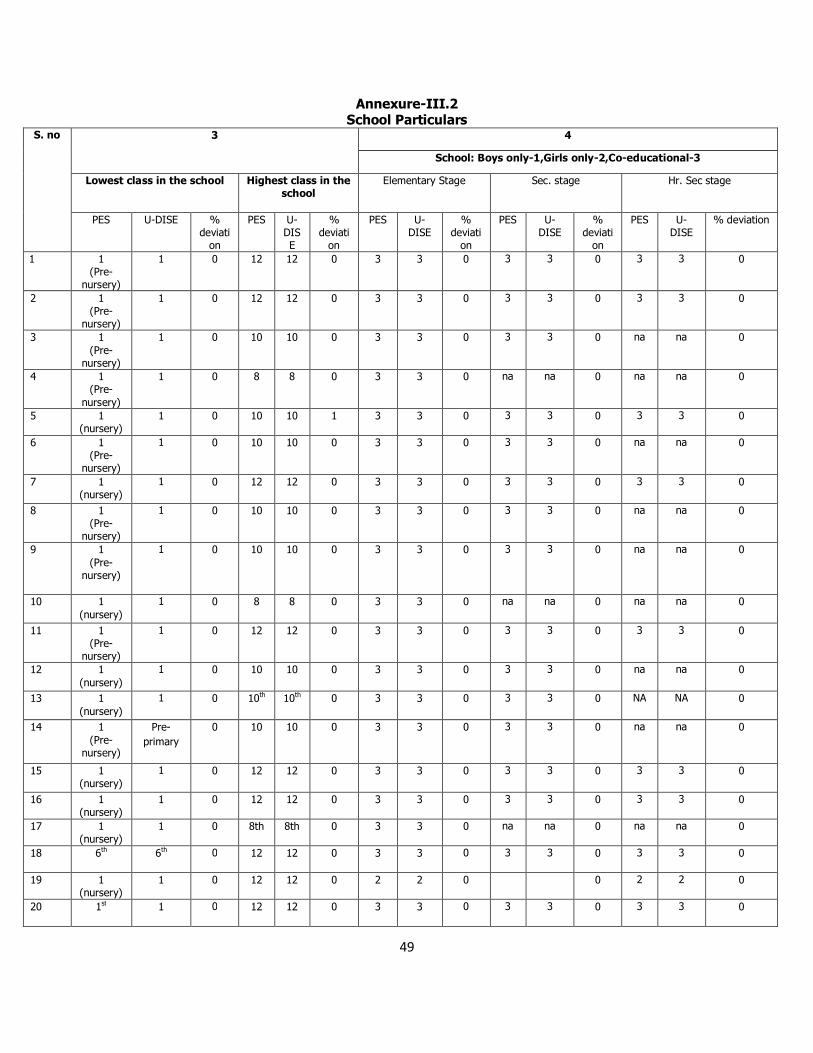
49
Annexure-III.2 School Particulars
S. no 3 4
School: Boys only-1,Girls only-2,Co-educational-3
Lowest class in the school
Highest class in the school
Elementary Stage
Sec. stage Hr. Sec stage
PES U-DISE % deviati
on
PES U-DISE
% deviati
on
PES U-DISE
% deviati
on
PES U-DISE
% deviati
on
PES U-DISE
% deviation
1 1 (Pre-
nursery)
1
0 12 12 0 3 3 0 3 3 0 3 3 0
2 1 (Pre-
nursery)
1
0 12 12 0 3 3 0 3 3 0 3 3 0
3 1 (Pre-
nursery)
1
0 10 10 0 3 3 0 3 3 0 na na 0
4 1 (Pre-
nursery)
1
0 8 8 0 3 3 0 na na 0 na na 0
5 1 (nursery)
1
0 10 10 1 3 3 0 3 3 0 3 3 0
6 1 (Pre-
nursery)
1 0 10 10 0 3 3 0 3 3 0 na na 0
7 1 (nursery)
1 0 12 12 0 3 3 0 3 3 0 3 3 0
8 1 (Pre-
nursery)
1 0 10 10 0 3 3 0 3 3 0 na na 0
9 1 (Pre-
nursery)
1 0 10 10 0 3 3 0 3 3 0 na na 0
10 1 (nursery)
1 0 8 8 0 3 3 0 na na 0 na na 0
11 1 (Pre-
nursery)
1 0 12 12 0 3 3 0 3 3 0 3 3 0
12 1 (nursery)
1 0 10 10 0 3 3 0 3 3 0 na na 0
13 1 (nursery)
1 0 10th 10th 0 3 3 0 3 3 0 NA NA 0
14 1 (Pre-
nursery)
Pre-primary
0 10 10 0 3 3 0 3 3 0 na na 0
15 1 (nursery)
1 0 12 12 0 3 3 0 3 3 0 3 3 0
16 1 (nursery)
1 0 12 12 0 3 3 0 3 3 0 3 3 0
17 1 (nursery)
1 0 8th 8th 0 3 3 0 na na 0 na na 0
18 6th 6th 0 12 12 0 3 3 0 3 3 0 3 3 0
19 1 (nursery)
1 0 12 12 0 2 2 0 0 2 2 0
20 1st 1 0 12 12 0 3 3 0 3 3 0 3 3 0
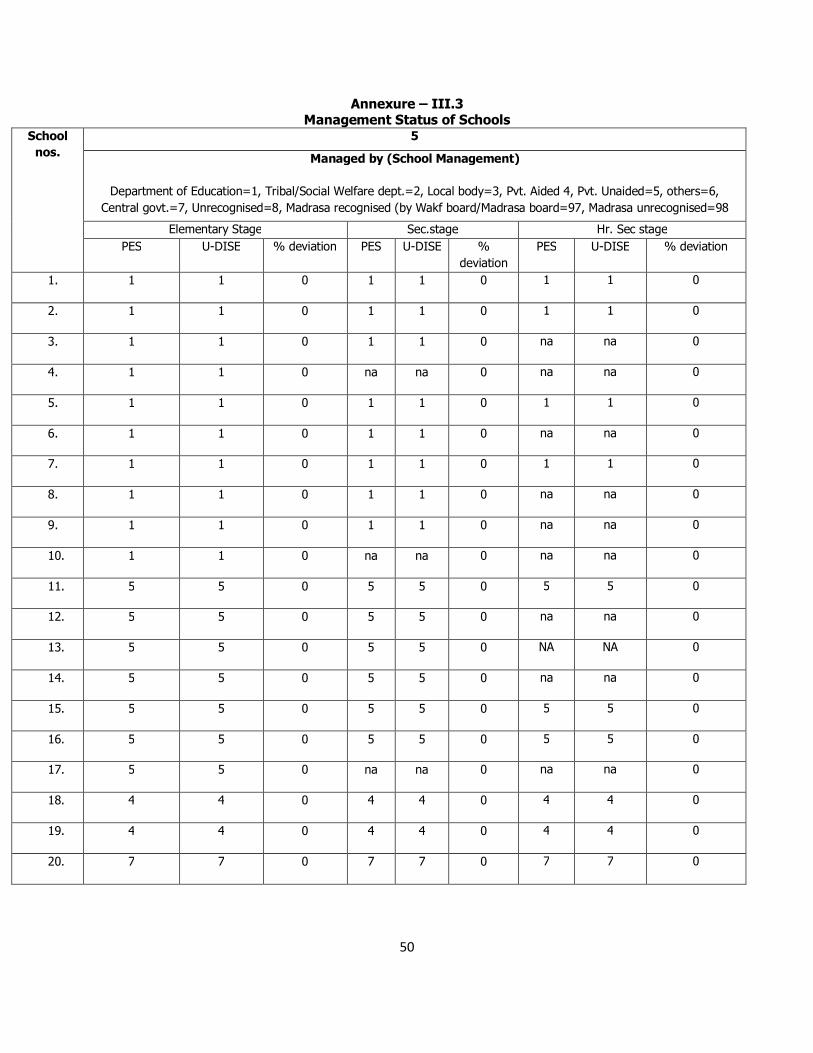
50
Annexure – III.3 Management Status of Schools
School nos.
5
Managed by (School Management)
Department of Education=1, Tribal/Social Welfare dept.=2, Local body=3, Pvt. Aided 4, Pvt. Unaided=5, others=6, Central govt.=7, Unrecognised=8, Madrasa recognised (by Wakf board/Madrasa board=97, Madrasa unrecognised=98
Elementary Stage Sec.stage Hr. Sec stage PES U-DISE % deviation PES U-DISE %
deviation PES U-DISE % deviation
1. 1 1 0 1 1 0 1 1 0
2. 1 1 0 1 1 0 1 1 0
3. 1 1 0 1 1 0 na na 0
4. 1 1 0 na na 0 na na 0
5. 1 1 0 1 1 0 1 1 0
6. 1 1 0 1 1 0 na na 0
7. 1 1 0 1 1 0 1 1 0
8. 1 1 0 1 1 0 na na 0
9. 1 1 0 1 1 0 na na 0
10. 1 1 0 na na 0 na na 0
11. 5 5 0 5 5 0 5 5 0
12. 5 5 0 5 5 0 na na 0
13. 5 5 0 5 5 0 NA NA 0
14. 5 5 0 5 5 0 na na 0
15. 5 5 0 5 5 0 5 5 0
16. 5 5 0 5 5 0 5 5 0
17. 5 5 0 na na 0 na na 0
18. 4 4 0 4 4 0 4 4 0
19. 4 4 0 4 4 0 4 4 0
20. 7 7 0 7 7 0 7 7 0
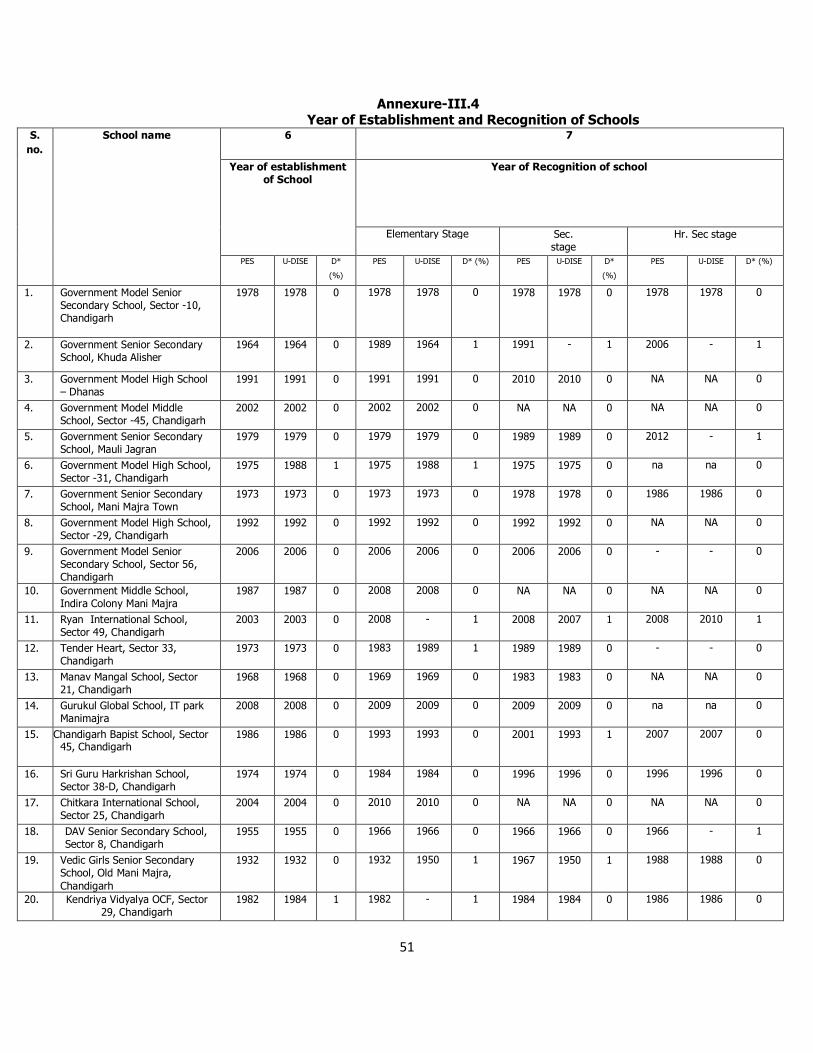
51
Annexure-III.4 Year of Establishment and Recognition of Schools
S. no.
School name 6 7
Year of establishment of School
Year of Recognition of school
Elementary Stage Sec. stage
Hr. Sec stage
PES U-DISE D*
(%)
PES U-DISE D* (%) PES U-DISE D*
(%)
PES U-DISE D* (%)
1. Government Model Senior Secondary School, Sector -10, Chandigarh
1978 1978 0 1978 1978 0 1978 1978 0 1978 1978 0
2. Government Senior Secondary School, Khuda Alisher
1964 1964 0 1989 1964 1 1991 - 1 2006 - 1
3. Government Model High School – Dhanas
1991 1991 0 1991 1991 0 2010 2010 0 NA NA 0
4. Government Model Middle School, Sector -45, Chandigarh
2002 2002 0 2002 2002 0 NA NA 0 NA NA 0
5. Government Senior Secondary School, Mauli Jagran
1979 1979 0 1979 1979 0 1989 1989 0 2012 - 1
6. Government Model High School, Sector -31, Chandigarh
1975 1988 1 1975 1988 1 1975 1975 0 na na 0
7. Government Senior Secondary School, Mani Majra Town
1973 1973 0 1973 1973 0 1978 1978 0 1986 1986 0
8. Government Model High School, Sector -29, Chandigarh
1992 1992 0 1992 1992 0 1992 1992 0 NA NA 0
9. Government Model Senior Secondary School, Sector 56, Chandigarh
2006 2006 0 2006 2006 0 2006 2006 0 - - 0
10. Government Middle School, Indira Colony Mani Majra
1987 1987 0 2008 2008 0 NA NA 0 NA NA 0
11. Ryan International School, Sector 49, Chandigarh
2003 2003 0 2008 - 1 2008 2007 1 2008 2010 1
12. Tender Heart, Sector 33, Chandigarh
1973 1973 0 1983 1989 1 1989 1989 0 - - 0
13. Manav Mangal School, Sector 21, Chandigarh
1968 1968 0 1969 1969 0 1983 1983 0 NA NA 0
14. Gurukul Global School, IT park Manimajra
2008 2008 0 2009 2009 0 2009 2009 0 na na 0
15. Chandigarh Bapist School, Sector 45, Chandigarh
1986 1986 0 1993 1993 0 2001 1993 1 2007 2007 0
16. Sri Guru Harkrishan School, Sector 38-D, Chandigarh
1974 1974 0 1984 1984 0 1996 1996 0 1996 1996 0
17. Chitkara International School, Sector 25, Chandigarh
2004 2004 0 2010 2010 0 NA NA 0 NA NA 0
18. DAV Senior Secondary School, Sector 8, Chandigarh
1955 1955 0 1966 1966 0 1966 1966 0 1966 - 1
19. Vedic Girls Senior Secondary School, Old Mani Majra, Chandigarh
1932 1932 0 1932 1950 1 1967 1950 1 1988 1988 0
20. Kendriya Vidyalya OCF, Sector 29, Chandigarh
1982 1984 1 1982 - 1 1984 1984 0 1986 1986 0
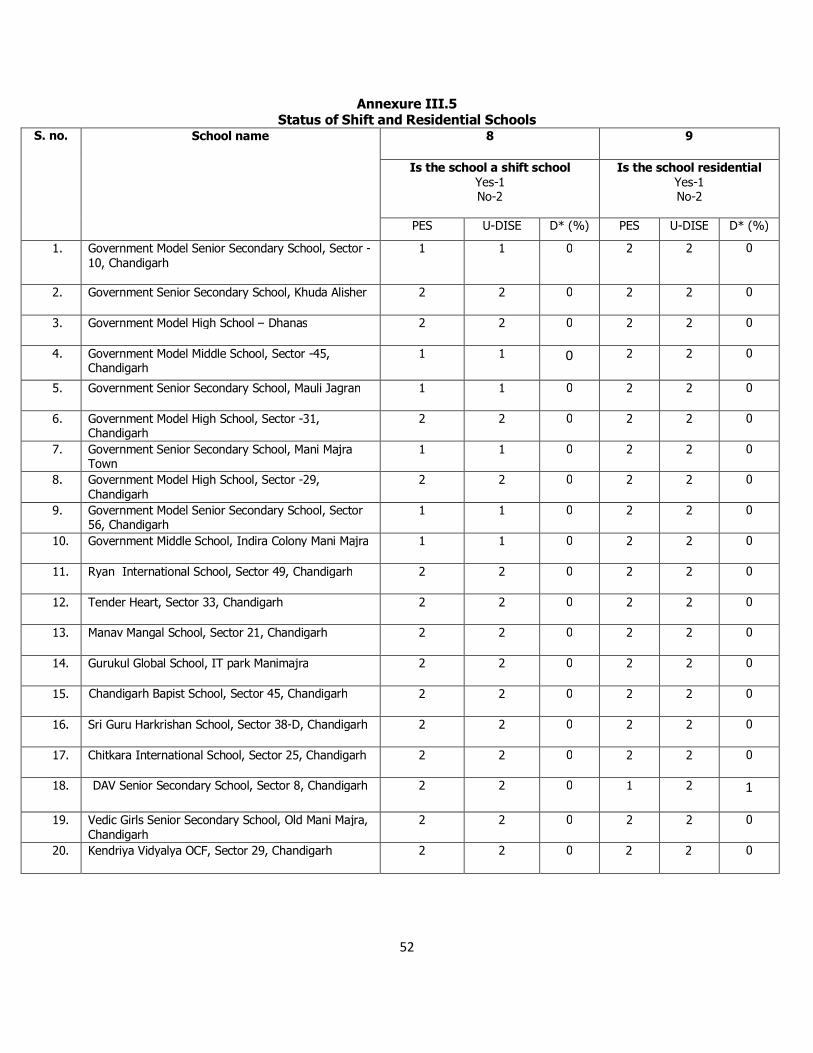
52
Annexure III.5 Status of Shift and Residential Schools
S. no. School name 8 9
Is the school a shift school Yes-1 No-2
Is the school residential Yes-1 No-2
PES U-DISE D* (%) PES U-DISE D* (%)
1. Government Model Senior Secondary School, Sector -10, Chandigarh
1 1 0 2 2 0
2. Government Senior Secondary School, Khuda Alisher 2 2 0 2 2 0
3. Government Model High School – Dhanas 2 2 0 2 2 0
4. Government Model Middle School, Sector -45, Chandigarh
1 1 0 2 2 0
5. Government Senior Secondary School, Mauli Jagran 1 1 0 2 2 0
6. Government Model High School, Sector -31, Chandigarh
2 2 0 2 2 0
7. Government Senior Secondary School, Mani Majra Town
1 1 0 2 2 0
8. Government Model High School, Sector -29, Chandigarh
2 2 0 2 2 0
9. Government Model Senior Secondary School, Sector 56, Chandigarh
1 1 0 2 2 0
10. Government Middle School, Indira Colony Mani Majra 1 1 0 2 2 0
11. Ryan International School, Sector 49, Chandigarh 2 2 0 2 2 0
12. Tender Heart, Sector 33, Chandigarh 2 2 0 2 2 0
13. Manav Mangal School, Sector 21, Chandigarh 2 2 0 2 2 0
14. Gurukul Global School, IT park Manimajra 2 2 0 2 2 0
15. Chandigarh Bapist School, Sector 45, Chandigarh 2 2 0 2 2 0
16. Sri Guru Harkrishan School, Sector 38-D, Chandigarh 2 2 0 2 2 0
17. Chitkara International School, Sector 25, Chandigarh 2 2 0 2 2 0
18. DAV Senior Secondary School, Sector 8, Chandigarh 2 2 0 1 2 1
19. Vedic Girls Senior Secondary School, Old Mani Majra, Chandigarh
2 2 0 2 2 0
20. Kendriya Vidyalya OCF, Sector 29, Chandigarh 2 2 0 2 2 0
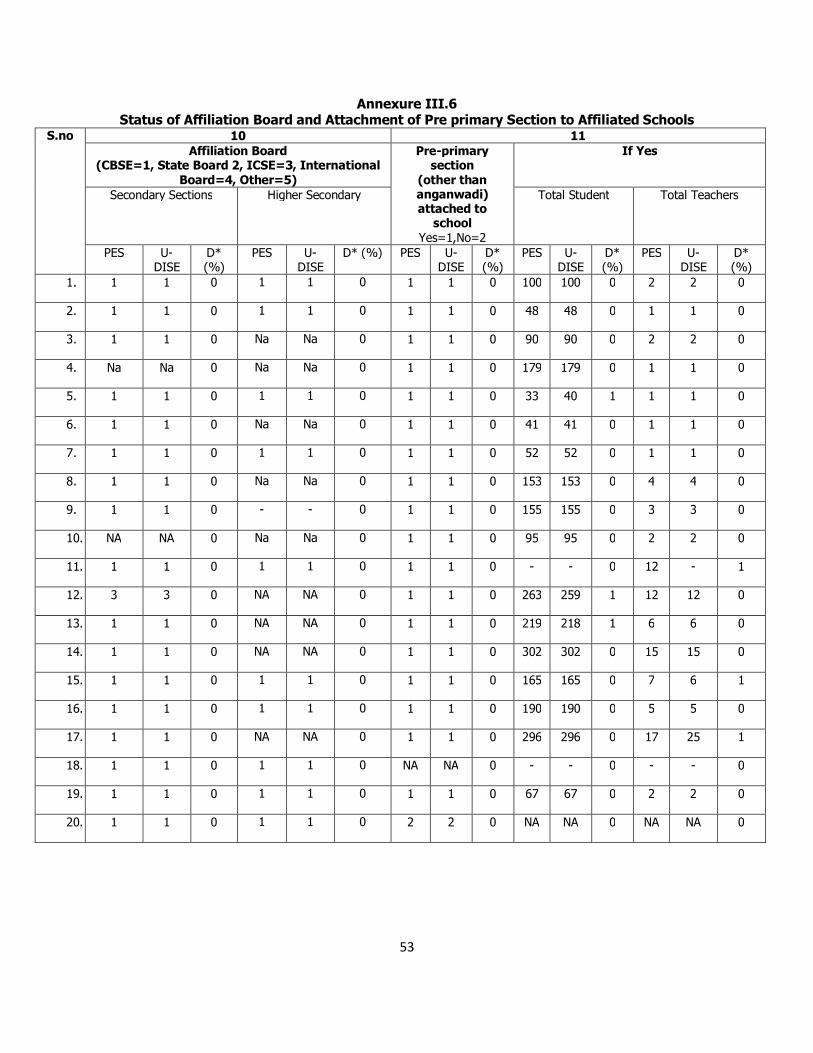
53
Annexure III.6 Status of Affiliation Board and Attachment of Pre primary Section to Affiliated Schools
S.no 10 11 Affiliation Board
(CBSE=1, State Board 2, ICSE=3, International Board=4, Other=5)
Pre-primary section
(other than anganwadi) attached to
school Yes=1,No=2
If Yes
Secondary Sections Higher Secondary Total Student Total Teachers
PES U-DISE
D* (%)
PES U-DISE
D* (%) PES U-DISE
D* (%)
PES U-DISE
D* (%)
PES U-DISE
D* (%)
1. 1 1 0 1 1 0 1 1 0 100 100 0 2 2 0
2. 1 1 0 1 1 0 1 1 0 48 48 0 1 1 0
3. 1 1 0 Na Na 0 1 1 0 90 90 0 2 2 0
4. Na Na 0 Na Na 0 1 1 0 179 179 0 1 1 0
5. 1 1 0 1 1 0 1 1 0 33 40 1 1 1 0
6. 1 1 0 Na Na 0 1 1 0 41 41 0 1 1 0
7. 1 1 0 1 1 0 1 1 0 52 52 0 1 1 0
8. 1 1 0 Na Na 0 1 1 0 153 153 0 4 4 0
9. 1 1 0 - - 0 1 1 0 155 155 0 3 3 0
10. NA NA 0 Na Na 0 1 1 0 95 95 0 2 2 0
11. 1 1 0 1 1 0 1 1 0 - - 0 12 - 1
12. 3 3 0 NA NA 0 1 1 0 263 259 1 12 12 0
13. 1 1 0 NA NA 0 1 1 0 219 218 1 6 6 0
14. 1 1 0 NA NA 0 1 1 0 302 302 0 15 15 0
15. 1 1 0 1 1 0 1 1 0 165 165 0 7 6 1
16. 1 1 0 1 1 0 1 1 0 190 190 0 5 5 0
17. 1 1 0 NA NA 0 1 1 0 296 296 0 17 25 1
18. 1 1 0 1 1 0 NA NA 0 - - 0 - - 0
19. 1 1 0 1 1 0 1 1 0 67 67 0 2 2 0
20. 1 1 0 1 1 0 2 2 0 NA NA 0 NA NA 0
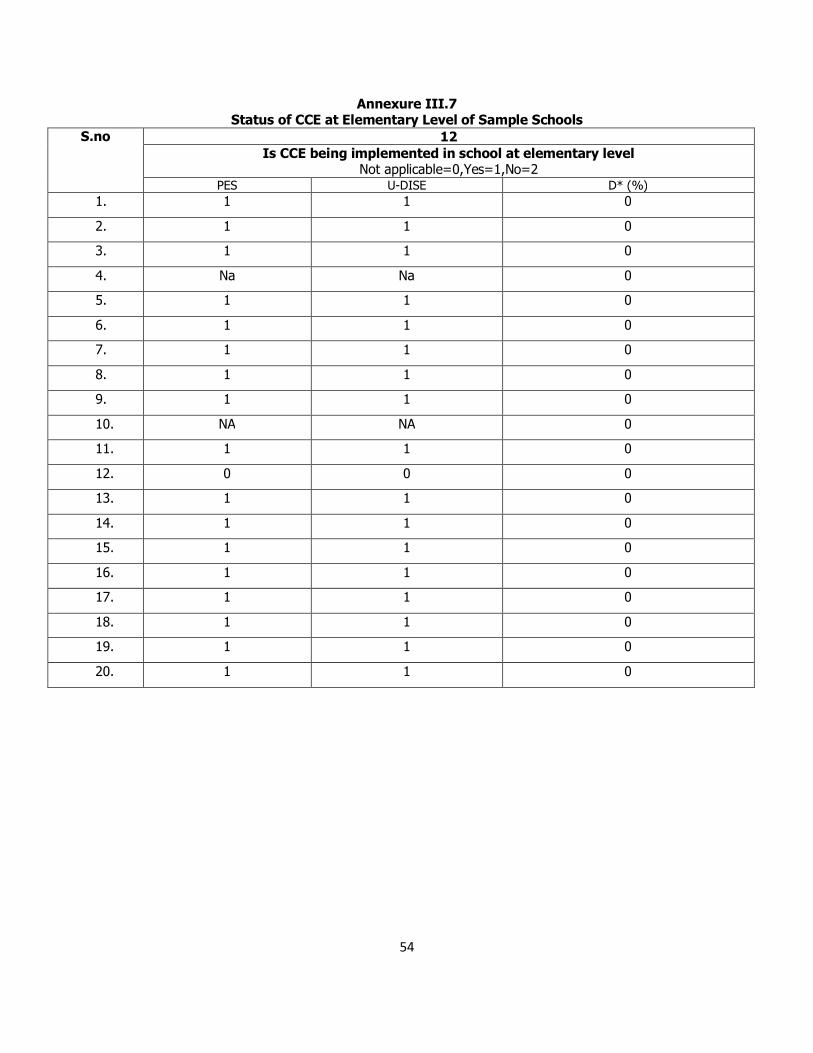
54
Annexure III.7 Status of CCE at Elementary Level of Sample Schools
S.no 12 Is CCE being implemented in school at elementary level
Not applicable=0,Yes=1,No=2 PES U-DISE D* (%)
1. 1 1 0
2. 1 1 0
3. 1 1 0
4. Na Na 0
5. 1 1 0
6. 1 1 0
7. 1 1 0
8. 1 1 0
9. 1 1 0
10. NA NA 0
11. 1 1 0
12. 0 0 0
13. 1 1 0
14. 1 1 0
15. 1 1 0
16. 1 1 0
17. 1 1 0
18. 1 1 0
19. 1 1 0
20. 1 1 0
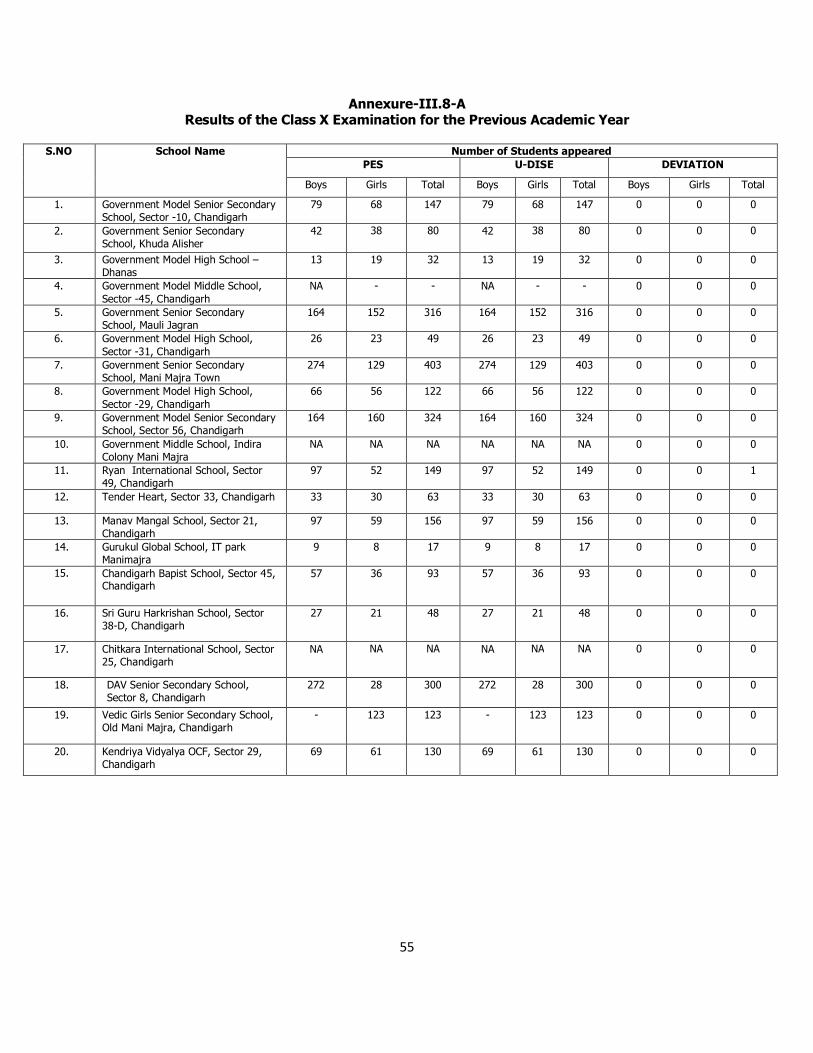
55
Annexure-III.8-A Results of the Class X Examination for the Previous Academic Year
S.NO School Name Number of Students appeared
PES U-DISE DEVIATION
Boys Girls Total Boys Girls Total Boys Girls Total
1. Government Model Senior Secondary School, Sector -10, Chandigarh
79 68 147 79 68 147 0 0 0
2. Government Senior Secondary School, Khuda Alisher
42 38 80 42 38 80 0 0 0
3. Government Model High School – Dhanas
13 19 32 13 19 32 0 0 0
4. Government Model Middle School, Sector -45, Chandigarh
NA - - NA - - 0 0 0
5. Government Senior Secondary School, Mauli Jagran
164 152 316 164 152 316 0 0 0
6. Government Model High School, Sector -31, Chandigarh
26 23 49 26 23 49 0 0 0
7. Government Senior Secondary School, Mani Majra Town
274 129 403 274 129 403 0 0 0
8. Government Model High School, Sector -29, Chandigarh
66 56 122 66 56 122 0 0 0
9. Government Model Senior Secondary School, Sector 56, Chandigarh
164 160 324 164 160 324 0 0 0
10. Government Middle School, Indira Colony Mani Majra
NA NA NA NA NA NA 0 0 0
11. Ryan International School, Sector 49, Chandigarh
97 52 149 97 52 149 0 0 1
12. Tender Heart, Sector 33, Chandigarh 33 30 63 33 30 63 0 0 0
13. Manav Mangal School, Sector 21, Chandigarh
97 59 156 97 59 156 0 0 0
14. Gurukul Global School, IT park Manimajra
9 8 17 9 8 17 0 0 0
15. Chandigarh Bapist School, Sector 45, Chandigarh
57 36 93 57 36 93 0 0 0
16. Sri Guru Harkrishan School, Sector 38-D, Chandigarh
27 21 48 27 21 48 0 0 0
17. Chitkara International School, Sector 25, Chandigarh
NA NA NA NA NA NA 0 0 0
18. DAV Senior Secondary School, Sector 8, Chandigarh
272 28 300 272 28 300 0 0 0
19. Vedic Girls Senior Secondary School, Old Mani Majra, Chandigarh
- 123 123 - 123 123 0 0 0
20. Kendriya Vidyalya OCF, Sector 29, Chandigarh
69 61 130 69 61 130 0 0 0
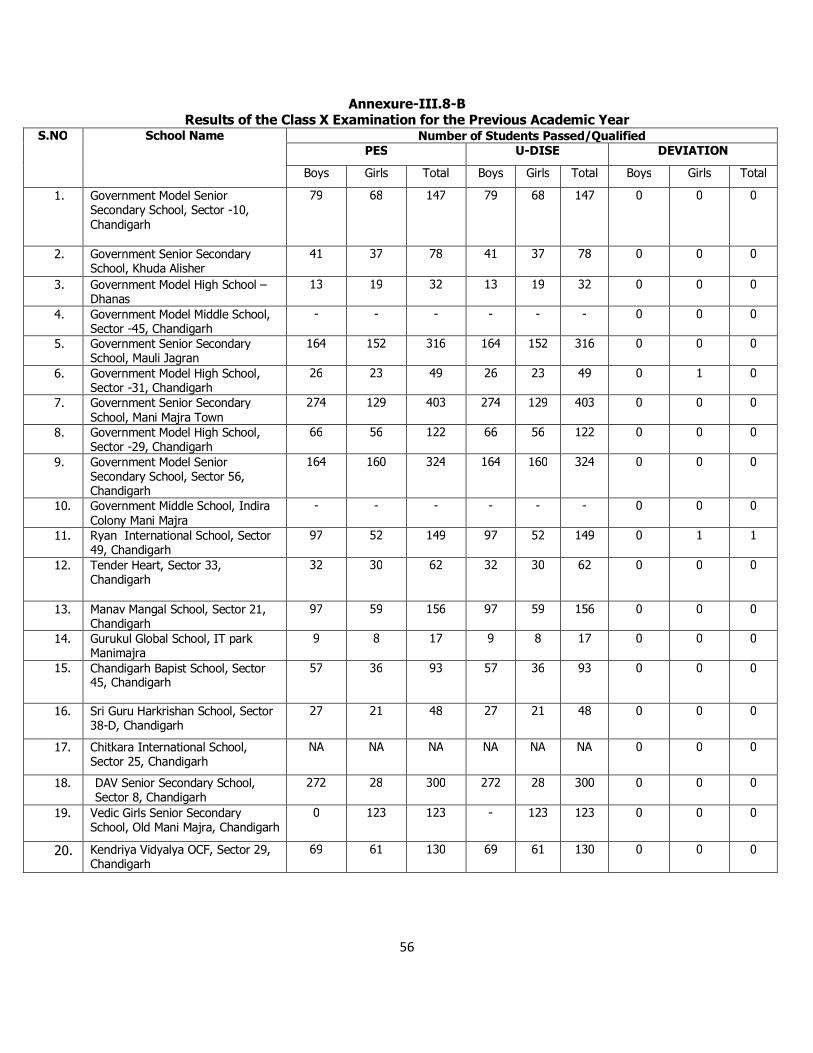
56
Annexure-III.8-B Results of the Class X Examination for the Previous Academic Year
S.NO School Name Number of Students Passed/Qualified PES U-DISE DEVIATION
Boys Girls Total Boys Girls Total Boys Girls Total
1. Government Model Senior Secondary School, Sector -10, Chandigarh
79 68 147 79 68 147 0 0 0
2. Government Senior Secondary School, Khuda Alisher
41 37 78 41 37 78 0 0 0
3. Government Model High School – Dhanas
13 19 32 13 19 32 0 0 0
4. Government Model Middle School, Sector -45, Chandigarh
- - - - - - 0 0 0
5. Government Senior Secondary School, Mauli Jagran
164 152 316 164 152 316 0 0 0
6. Government Model High School, Sector -31, Chandigarh
26 23 49 26 23 49 0 1 0
7. Government Senior Secondary School, Mani Majra Town
274 129 403 274 129 403 0 0 0
8. Government Model High School, Sector -29, Chandigarh
66 56 122 66 56 122 0 0 0
9. Government Model Senior Secondary School, Sector 56, Chandigarh
164 160 324 164 160 324 0 0 0
10. Government Middle School, Indira Colony Mani Majra
- - - - - - 0 0 0
11. Ryan International School, Sector 49, Chandigarh
97 52 149 97 52 149 0 1 1
12. Tender Heart, Sector 33, Chandigarh
32 30
62 32 30
62 0 0 0
13. Manav Mangal School, Sector 21, Chandigarh
97 59 156 97 59 156 0 0 0
14. Gurukul Global School, IT park Manimajra
9 8 17 9 8 17 0 0 0
15. Chandigarh Bapist School, Sector 45, Chandigarh
57 36 93 57 36 93 0 0 0
16. Sri Guru Harkrishan School, Sector 38-D, Chandigarh
27 21 48 27 21 48 0 0 0
17. Chitkara International School, Sector 25, Chandigarh
NA NA NA NA NA NA 0 0 0
18. DAV Senior Secondary School, Sector 8, Chandigarh
272 28 300 272 28 300 0 0 0
19. Vedic Girls Senior Secondary School, Old Mani Majra, Chandigarh
0 123 123 - 123 123 0 0 0
20. Kendriya Vidyalya OCF, Sector 29, Chandigarh
69 61 130 69 61 130 0 0 0
57
Annexure-III.9-A Results of the Class XII Examination for the Previous Academic Year
S.NO School Name Number of Students appeared PES U-DISE DEVIATION
Boys Girls Total Boys Girls Total Boys Girls Total
1. Government Model Senior Secondary School, Sector -10, Chandigarh
208 85 293 208 85 293 0 0 0
2. Government Senior Secondary School, Khuda Alisher
10 9 19 10 9 19 0 0 0
3. Government Model High School – Dhanas
NA NA NA NA NA NA 0 0 0
4. Government Model Middle School, Sector -45, Chandigarh
NA NA NA NA NA NA 0 0 0
5. Government Senior Secondary School, Mauli Jagran
NA NA NA NA NA NA 0 0 0
6. Government Model High School, Sector -31, Chandigarh
NA NA NA NA NA NA 0 0 0
7. Government Senior Secondary School, Mani Majra Town
206 61 267 206 61 267 0 0 0
8. Government Model High School, Sector -29, Chandigarh
NA NA NA NA NA NA 0 0 0
9. Government Model Senior Secondary School, Sector 56, Chandigarh
NA NA NA NA NA NA 0 0 0
10. Government Middle School, Indira Colony Mani Majra
NA NA NA NA NA NA 0 0 0
11. Ryan International School, Sector 49, Chandigarh
36 39 75 36 39 75 0 0 0
12. Tender Heart, Sector 33, Chandigarh
NA NA NA NA NA NA 0 0 0
13. Manav Mangal School, Sector 21, Chandigarh
NA NA NA NA NA NA 0 0 0
14. Gurukul Global School, IT park Manimajra
NA NA NA NA NA NA 0 0 0
15. Chandigarh Bapist School, Sector 45, Chandigarh
6 4 10 6 4 10 0 0 0
16. Sri Guru Harkrishan School, Sector 38-D, Chandigarh
71 45 116 71 45 116 0 0 0
17. Chitkara International School, Sector 25, Chandigarh
NA NA NA NA NA NA 0 0 0
18. DAV Senior Secondary School, Sector 8, Chandigarh
567 58 625 567 58 625 0 0 0
19. Vedic Girls Senior Secondary School, Old Mani Majra, Chandigarh
- 36 36 - 36 36 0 0 0
20. Kendriya Vidyalya OCF, Sector 29, Chandigarh
36 29 65 36 29 65 0 0 0
58
Annexure-III.9-B Results of the Class XII Examination for the Previous Academic Year
S.NO School Name Number of Students Passed/Qualified PES U-DISE DEVIATION
Boys Girls Total Boys Girls Total Boys Girls Total
1. Government Model Senior Secondary School, Sector -10, Chandigarh
177 78 255 177 78 255 0 0 0
2. Government Senior Secondary School, Khuda Alisher
3 5 8 3 5 8 0 0 0
3. Government Model High School – Dhanas
NA NA NA NA NA NA 0 0 0
4. Government Model Middle School, Sector -45, Chandigarh
NA NA NA NA NA NA 0 0 0
5. Government Senior Secondary School, Mauli Jagran
NA NA NA NA NA NA 0 0 0
6. Government Model High School, Sector -31, Chandigarh
NA NA NA NA NA NA 0 0 0
7. Government Senior Secondary School, Mani Majra Town
190 61 251 190 61 251 0 0 0
8. Government Model High School, Sector -29, Chandigarh
NA NA NA NA NA NA 0 0 0
9. Government Model Senior Secondary School, Sector 56, Chandigarh
NA NA NA NA NA NA 0 0 0
10. Government Middle School, Indira Colony Mani Majra
NA NA NA NA NA NA 0 0 0
11. Ryan International School, Sector 49, Chandigarh
36 39 75 36 39 75 0 0 0
12. Tender Heart, Sector 33, Chandigarh
NA NA NA NA NA NA 0 0 0
13. Manav Mangal School, Sector 21, Chandigarh
NA NA NA NA NA NA 0 0 0
14. Gurukul Global School, IT park Manimajra
NA NA NA NA NA NA 0 0 0
15. Chandigarh Bapist School, Sector 45, Chandigarh
2 2 4 2 2 4 0 0 0
16. Sri Guru Harkrishan School, Sector 38-D, Chandigarh
64 39 103 64 39 103 0 0 0
17. Chitkara International School, Sector 25, Chandigarh
NA NA NA NA NA NA 0 0 0
18. DAV Senior Secondary School, Sector 8, Chandigarh
463 48 511 463 48 511 0 0 0
19. Vedic Girls Senior Secondary School, Old Mani Majra, Chandigarh
- 26 26 - 26 26 0 0 0
20. Kendriya Vidyalya OCF, Sector 29, Chandigarh
36 28 64 36 28 64 0 0 0
59
Annexure-III.10-A Table-V A-Staff Detail
Teaching staff (Regular teachers) - No. of Sanctioned posts S.
No. Name of the
School PES U-DISE Deviation
For primary For upper primary
For sec.
For hr. sec.
Total Total
1. Government Model Senior Secondary School, Sector -10, Chandigarh
23 14 10 20 67 67 0
2. Government Senior Secondary School, Khuda Alisher
9 14 0 7 30 30 0
3. Government Model High School – Dhanas
3 13 nil na 16 16 0
4. Government Model Middle School, Sector -45, Chandigarh
7 7 - - 14 14 0
5. Go vernment Senior Secondary School, Mauli Jagran
23
21
(U-DISE 50)
- 7 51 50 1
6. Government Model High School, Sector -31, Chandigarh
2 7 3 na 12 12 0
7. Government Senior Secondary School, Mani Majra Town
27 35 - 11 73 73 0
8. Government Model High School, Sector -29, Chandigarh
11 13 17 NA 41 41 0
9. Government Model Senior Secondary School, Sector 56, Chandigarh
13
U-DISE (12)
19
U- DISE (18)
10
U- DISE (10)
NA 42 40 1
10. Government Middle School, Indira Colony Mani Majra
21 07 NA NA 28 28 0
11. Ryan International School, Sector 49, Chandigarh
29 35 34 11 109 109 0
12. Tender Heart, Sector 33, Chandigarh
30 12 8 na 50 50 0
13. Manav Mangal School, Sector 21, Chandigarh
23 12 10 NA 45 45 0
14. Gurukul Global School, IT park
- 30 - na 30 30 0
60
Manimajra
15. Chandigarh Bapist School, Sector 45, Chandigarh
22 14 9 8 53 53 0
16. Sri Guru Harkrishan School, Sector 38-D, Chandigarh
- - - - - - 0
17. Chitkara International School, Sector 25, Chandigarh
21 20 - - 41 41 0
18. DAV Senior Secondary School, Sector 8, Chandigarh
NA 18 37 22 77 77 0
19. Vedic Girls Senior Secondary School, Old Mani Majra, Chandigarh
10
(U-DISE) 10
1
(U-DISE) 1
11
(U-DISE)
11
7 (mgt)
(U-DISE) 0
29 22 1
20. Kendriya Vidyalya OCF, Sector 29, Chandigarh
18
(U-DISE) 19
15
(U-DISE) 0
-
(U-DISE) 16
9
(U-DISE) 9
42 44 1
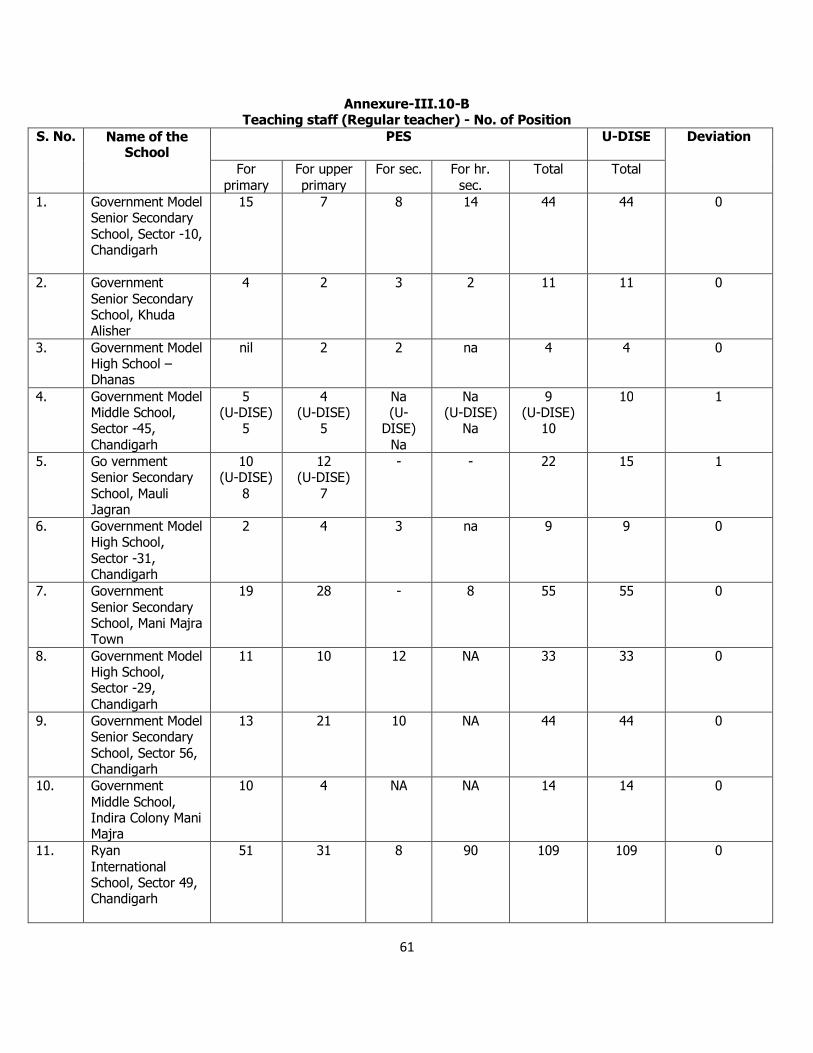
61
Annexure-III.10-B Teaching staff (Regular teacher) - No. of Position
S. No. Name of the School
PES U-DISE Deviation
For primary
For upper primary
For sec. For hr. sec.
Total Total
1. Government Model Senior Secondary School, Sector -10, Chandigarh
15 7 8 14 44 44 0
2. Government Senior Secondary School, Khuda Alisher
4 2 3 2 11 11 0
3. Government Model High School – Dhanas
nil 2 2 na 4 4 0
4. Government Model Middle School, Sector -45, Chandigarh
5 (U-DISE)
5
4 (U-DISE)
5
Na (U-
DISE) Na
Na (U-DISE)
Na
9 (U-DISE)
10
10 1
5. Go vernment Senior Secondary School, Mauli Jagran
10 (U-DISE)
8
12 (U-DISE)
7
- - 22 15 1
6. Government Model High School, Sector -31, Chandigarh
2 4 3 na 9 9 0
7. Government Senior Secondary School, Mani Majra Town
19 28 - 8 55 55 0
8. Government Model High School, Sector -29, Chandigarh
11 10 12 NA 33 33 0
9. Government Model Senior Secondary School, Sector 56, Chandigarh
13 21 10 NA 44 44 0
10. Government Middle School, Indira Colony Mani Majra
10 4 NA NA 14 14 0
11. Ryan International School, Sector 49, Chandigarh
51 31 8 90 109 109 0
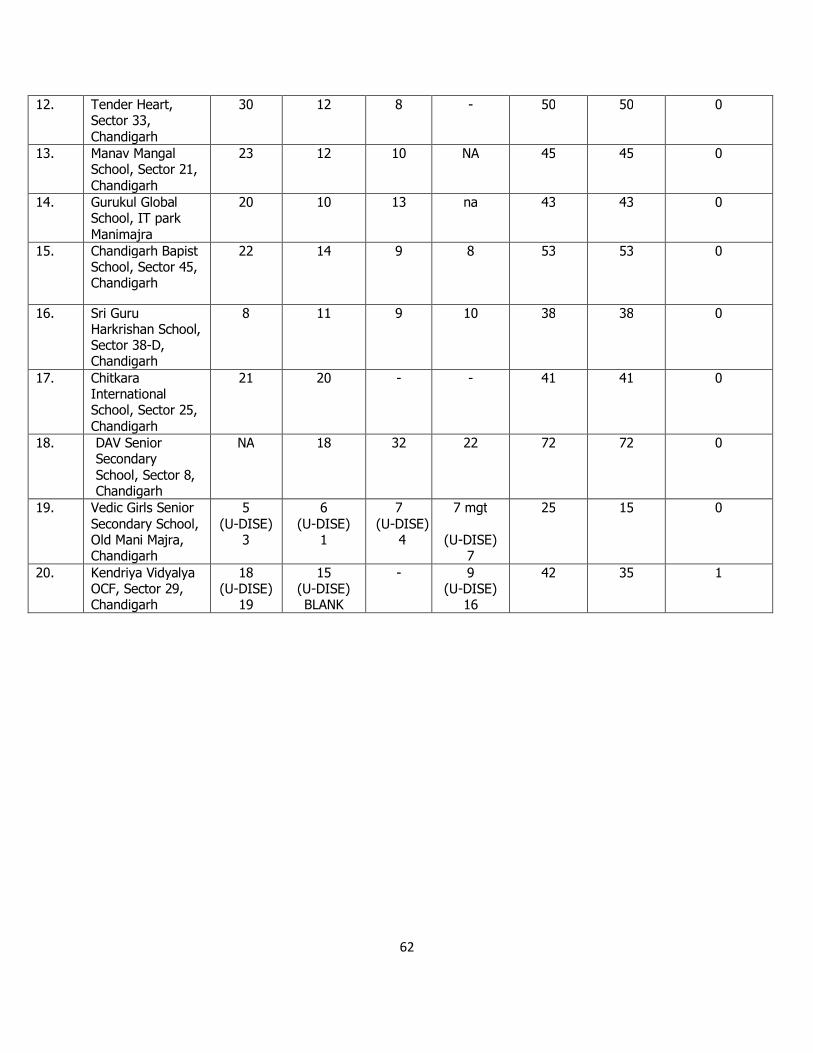
62
12. Tender Heart, Sector 33, Chandigarh
30 12 8 - 50 50 0
13. Manav Mangal School, Sector 21, Chandigarh
23 12 10 NA 45 45 0
14. Gurukul Global School, IT park Manimajra
20 10 13 na 43 43 0
15. Chandigarh Bapist School, Sector 45, Chandigarh
22 14 9 8 53 53 0
16. Sri Guru Harkrishan School, Sector 38-D, Chandigarh
8 11 9 10 38 38 0
17. Chitkara International School, Sector 25, Chandigarh
21 20 - - 41 41 0
18. DAV Senior Secondary School, Sector 8, Chandigarh
NA 18 32 22 72 72 0
19. Vedic Girls Senior Secondary School, Old Mani Majra, Chandigarh
5 (U-DISE)
3
6 (U-DISE)
1
7 (U-DISE)
4
7 mgt
(U-DISE) 7
25 15 0
20. Kendriya Vidyalya OCF, Sector 29, Chandigarh
18 (U-DISE)
19
15 (U-DISE) BLANK
- 9 (U-DISE)
16
42 35 1
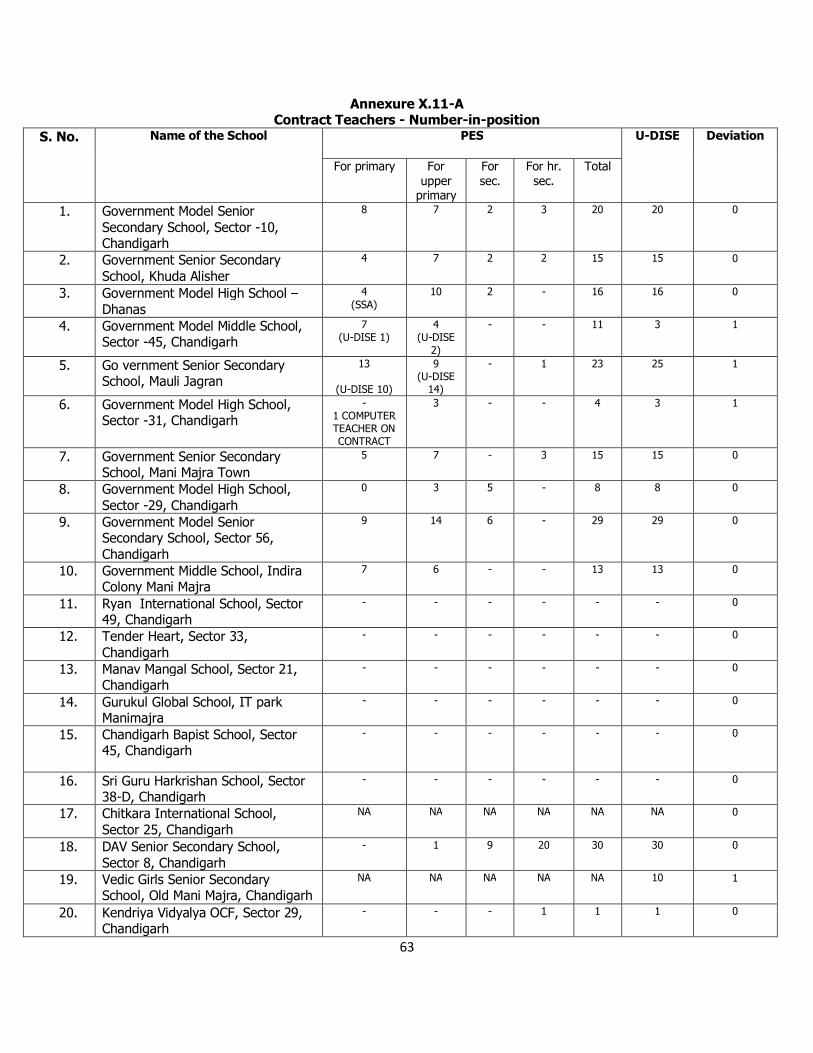
63
Annexure X.11-A Contract Teachers - Number-in-position
S. No. Name of the School PES U-DISE Deviation
For primary For upper
primary
For sec.
For hr. sec.
Total
1. Government Model Senior Secondary School, Sector -10, Chandigarh
8 7 2 3 20 20 0
2. Government Senior Secondary School, Khuda Alisher
4 7 2 2 15 15 0
3. Government Model High School – Dhanas
4 (SSA)
10 2 - 16 16 0
4. Government Model Middle School, Sector -45, Chandigarh
7 (U-DISE 1)
4 (U-DISE
2)
- - 11 3 1
5. Go vernment Senior Secondary School, Mauli Jagran
13
(U-DISE 10)
9 (U-DISE
14)
- 1 23 25 1
6. Government Model High School, Sector -31, Chandigarh
- 1 COMPUTER TEACHER ON CONTRACT
3 - - 4 3 1
7. Government Senior Secondary School, Mani Majra Town
5 7 - 3 15 15 0
8. Government Model High School, Sector -29, Chandigarh
0 3 5 - 8 8 0
9. Government Model Senior Secondary School, Sector 56, Chandigarh
9 14 6 - 29 29 0
10. Government Middle School, Indira Colony Mani Majra
7 6 - - 13 13 0
11. Ryan International School, Sector 49, Chandigarh
- - - - - - 0
12. Tender Heart, Sector 33, Chandigarh
- - - - - - 0
13. Manav Mangal School, Sector 21, Chandigarh
- - - - - - 0
14. Gurukul Global School, IT park Manimajra
- - - - - - 0
15. Chandigarh Bapist School, Sector 45, Chandigarh
- - - - - - 0
16. Sri Guru Harkrishan School, Sector 38-D, Chandigarh
- - - - - - 0
17. Chitkara International School, Sector 25, Chandigarh
NA NA NA NA NA NA 0
18. DAV Senior Secondary School, Sector 8, Chandigarh
-
1 9 20 30 30 0
19. Vedic Girls Senior Secondary School, Old Mani Majra, Chandigarh
NA NA NA NA NA 10 1
20. Kendriya Vidyalya OCF, Sector 29, Chandigarh
- - - 1 1 1 0
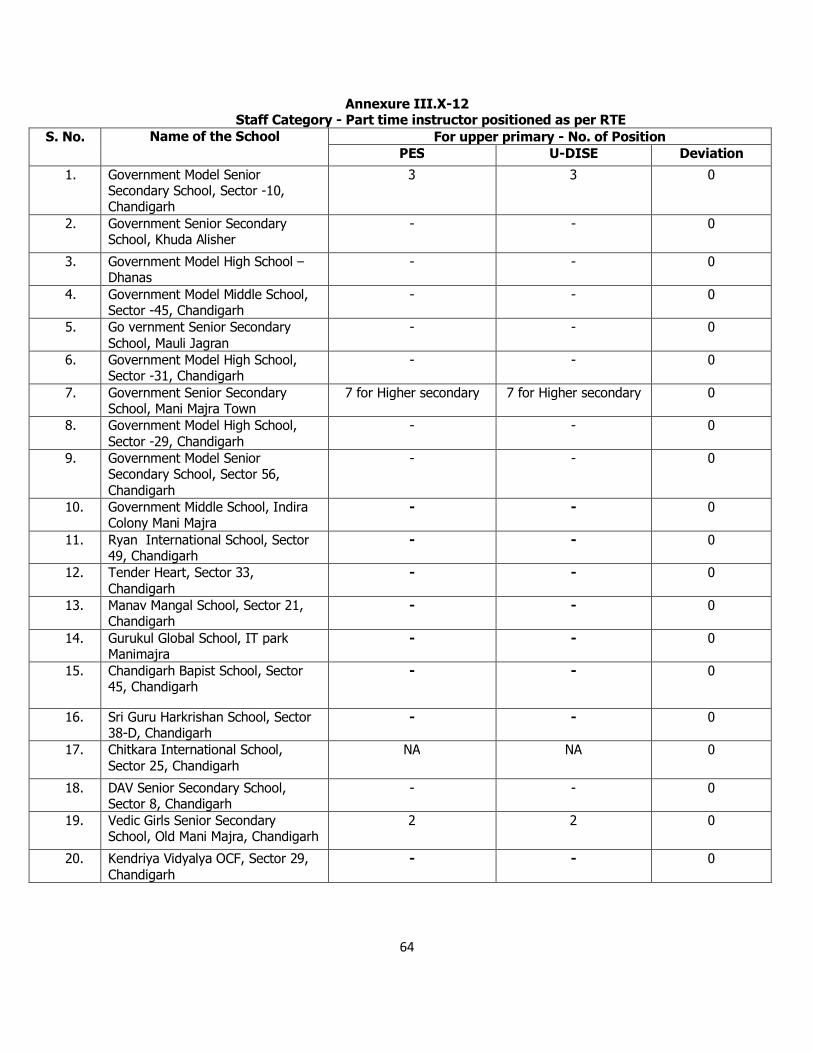
64
Annexure III.X-12 Staff Category - Part time instructor positioned as per RTE
S. No. Name of the School For upper primary - No. of Position PES U-DISE Deviation
1. Government Model Senior Secondary School, Sector -10, Chandigarh
3 3 0
2. Government Senior Secondary School, Khuda Alisher
- - 0
3. Government Model High School – Dhanas
- - 0
4. Government Model Middle School, Sector -45, Chandigarh
- - 0
5. Go vernment Senior Secondary School, Mauli Jagran
- - 0
6. Government Model High School, Sector -31, Chandigarh
- - 0
7. Government Senior Secondary School, Mani Majra Town
7 for Higher secondary 7 for Higher secondary 0
8. Government Model High School, Sector -29, Chandigarh
- - 0
9. Government Model Senior Secondary School, Sector 56, Chandigarh
- - 0
10. Government Middle School, Indira Colony Mani Majra
- - 0
11. Ryan International School, Sector 49, Chandigarh
- - 0
12. Tender Heart, Sector 33, Chandigarh
- - 0
13. Manav Mangal School, Sector 21, Chandigarh
- - 0
14. Gurukul Global School, IT park Manimajra
- - 0
15. Chandigarh Bapist School, Sector 45, Chandigarh
- - 0
16. Sri Guru Harkrishan School, Sector 38-D, Chandigarh
- - 0
17. Chitkara International School, Sector 25, Chandigarh
NA NA 0
18. DAV Senior Secondary School, Sector 8, Chandigarh
- - 0
19. Vedic Girls Senior Secondary School, Old Mani Majra, Chandigarh
2 2 0
20. Kendriya Vidyalya OCF, Sector 29, Chandigarh
- - 0
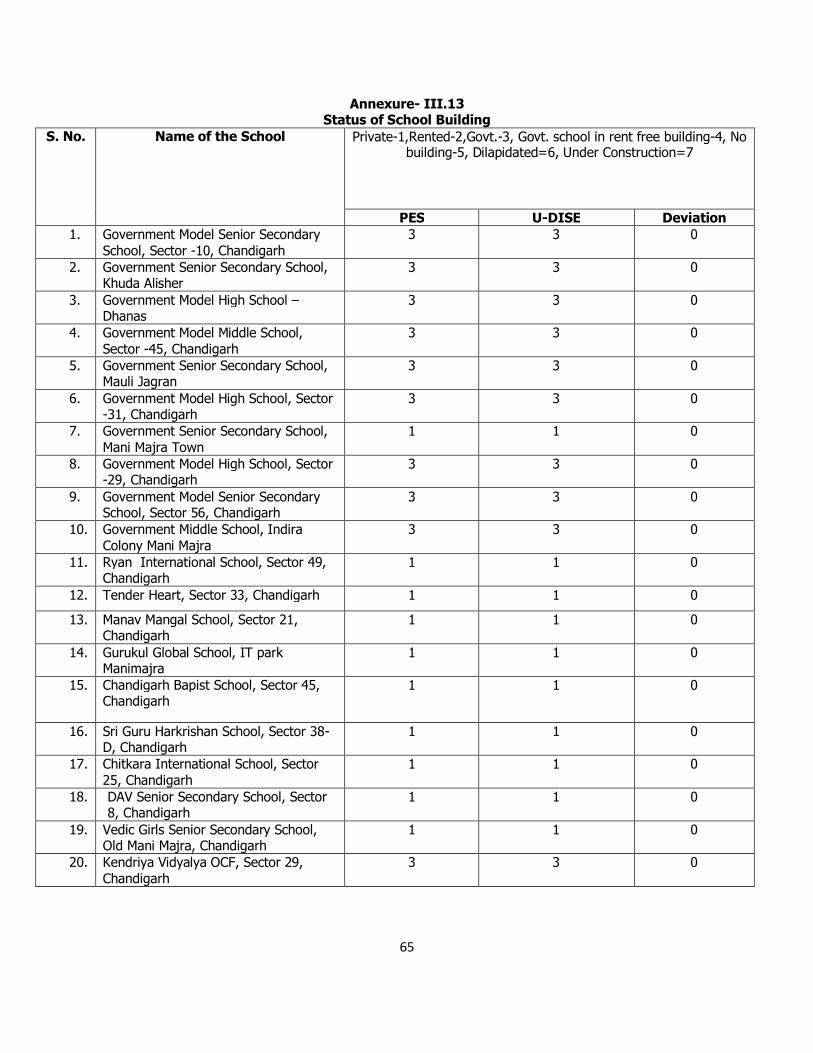
65
Annexure- III.13 Status of School Building
S. No. Name of the School Private-1,Rented-2,Govt.-3, Govt. school in rent free building-4, No building-5, Dilapidated=6, Under Construction=7
PES U-DISE Deviation 1. Government Model Senior Secondary
School, Sector -10, Chandigarh 3 3 0
2. Government Senior Secondary School, Khuda Alisher
3 3 0
3. Government Model High School – Dhanas
3 3 0
4. Government Model Middle School, Sector -45, Chandigarh
3 3 0
5. Government Senior Secondary School, Mauli Jagran
3 3 0
6. Government Model High School, Sector -31, Chandigarh
3 3 0
7. Government Senior Secondary School, Mani Majra Town
1 1 0
8. Government Model High School, Sector -29, Chandigarh
3 3 0
9. Government Model Senior Secondary School, Sector 56, Chandigarh
3 3 0
10. Government Middle School, Indira Colony Mani Majra
3 3 0
11. Ryan International School, Sector 49, Chandigarh
1 1 0
12. Tender Heart, Sector 33, Chandigarh 1 1 0
13. Manav Mangal School, Sector 21, Chandigarh
1 1 0
14. Gurukul Global School, IT park Manimajra
1 1 0
15. Chandigarh Bapist School, Sector 45, Chandigarh
1 1 0
16. Sri Guru Harkrishan School, Sector 38-D, Chandigarh
1 1 0
17. Chitkara International School, Sector 25, Chandigarh
1 1 0
18. DAV Senior Secondary School, Sector 8, Chandigarh
1 1 0
19. Vedic Girls Senior Secondary School, Old Mani Majra, Chandigarh
1 1 0
20. Kendriya Vidyalya OCF, Sector 29, Chandigarh
3 3 0
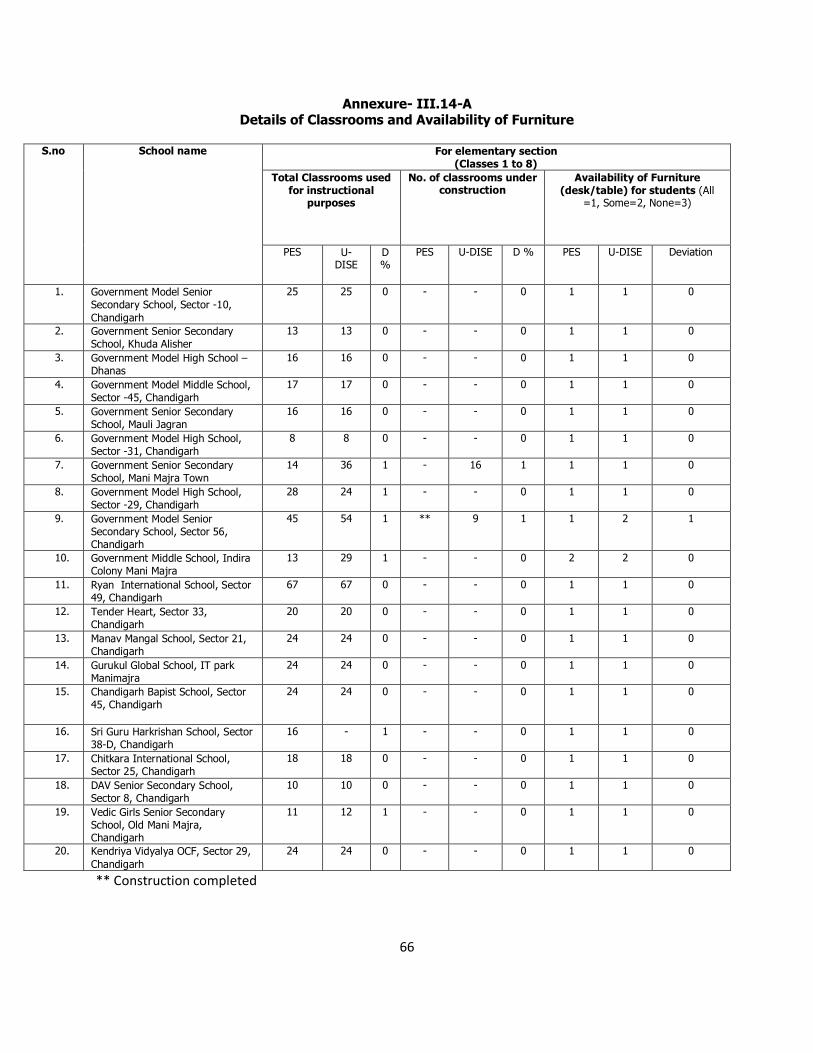
66
Annexure- III.14-A Details of Classrooms and Availability of Furniture
S.no School name For elementary section
(Classes 1 to 8) Total Classrooms used
for instructional purposes
No. of classrooms under construction
Availability of Furniture (desk/table) for students (All
=1, Some=2, None=3)
PES U-DISE
D %
PES U-DISE D % PES U-DISE Deviation
1. Government Model Senior Secondary School, Sector -10, Chandigarh
25 25 0 - - 0 1 1 0
2. Government Senior Secondary School, Khuda Alisher
13 13 0 - - 0 1 1 0
3. Government Model High School – Dhanas
16 16 0 - - 0 1 1 0
4. Government Model Middle School, Sector -45, Chandigarh
17 17 0 - - 0 1 1 0
5. Government Senior Secondary School, Mauli Jagran
16 16 0 - - 0 1 1 0
6. Government Model High School, Sector -31, Chandigarh
8 8 0 - - 0 1 1 0
7. Government Senior Secondary School, Mani Majra Town
14 36 1 - 16 1 1 1 0
8. Government Model High School, Sector -29, Chandigarh
28 24 1 - - 0 1 1 0
9. Government Model Senior Secondary School, Sector 56, Chandigarh
45 54 1 ** 9 1 1 2 1
10. Government Middle School, Indira Colony Mani Majra
13 29 1 - - 0 2 2 0
11. Ryan International School, Sector 49, Chandigarh
67 67 0 - - 0 1 1 0
12. Tender Heart, Sector 33, Chandigarh
20 20 0 - - 0 1 1 0
13. Manav Mangal School, Sector 21, Chandigarh
24 24 0 - - 0 1 1 0
14. Gurukul Global School, IT park Manimajra
24 24 0 - - 0 1 1 0
15. Chandigarh Bapist School, Sector 45, Chandigarh
24 24 0 - - 0 1 1 0
16. Sri Guru Harkrishan School, Sector 38-D, Chandigarh
16 - 1 - - 0 1 1 0
17. Chitkara International School, Sector 25, Chandigarh
18 18 0 - - 0 1 1 0
18. DAV Senior Secondary School, Sector 8, Chandigarh
10 10 0 - - 0 1 1 0
19. Vedic Girls Senior Secondary School, Old Mani Majra, Chandigarh
11 12 1 - - 0 1 1 0
20. Kendriya Vidyalya OCF, Sector 29, Chandigarh
24 24 0 - - 0 1 1 0
** Construction completed
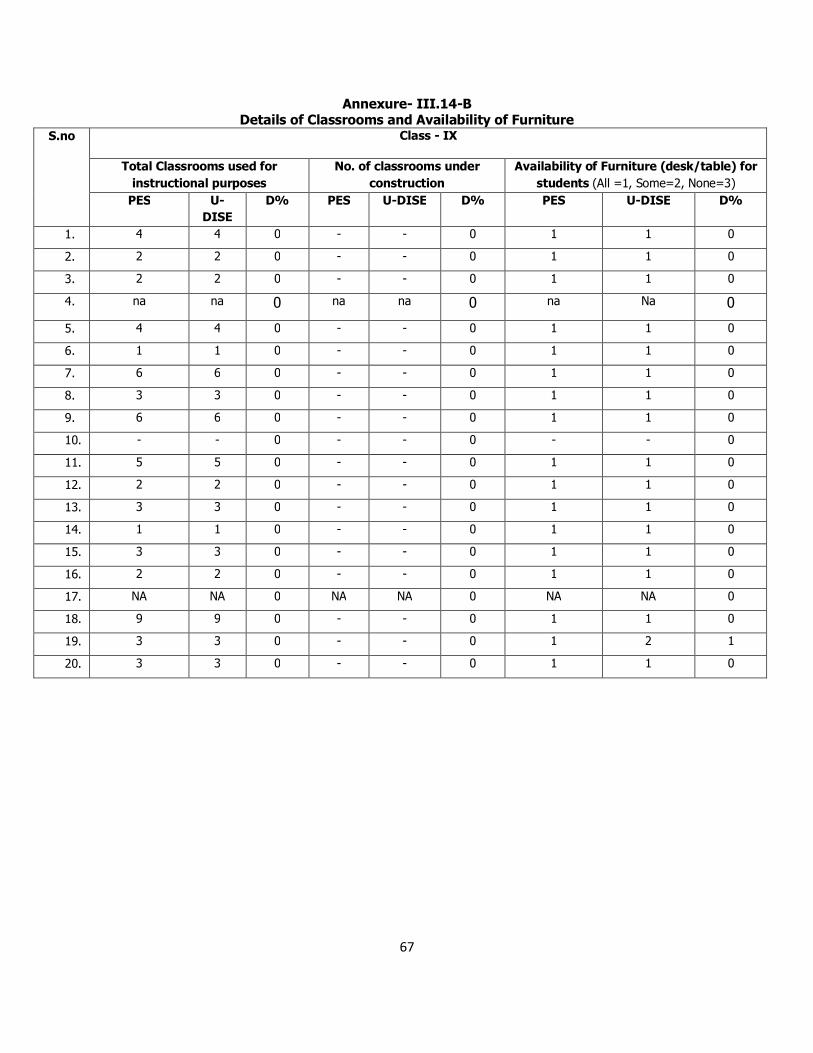
67
Annexure- III.14-B Details of Classrooms and Availability of Furniture
S.no Class - IX
Total Classrooms used for instructional purposes
No. of classrooms under construction
Availability of Furniture (desk/table) for students (All =1, Some=2, None=3)
PES U-DISE
D% PES U-DISE D% PES U-DISE D%
1. 4 4 0 - - 0 1 1 0
2. 2 2 0 - - 0 1 1 0
3. 2 2 0 - - 0 1 1 0
4. na na 0 na na 0 na Na 0
5. 4 4 0 - - 0 1 1 0
6. 1 1 0 - - 0 1 1 0
7. 6 6 0 - - 0 1 1 0
8. 3 3 0 - - 0 1 1 0
9. 6 6 0 - - 0 1 1 0
10. - - 0 - - 0 - - 0
11. 5 5 0 - - 0 1 1 0
12. 2 2 0 - - 0 1 1 0
13. 3 3 0 - - 0 1 1 0
14. 1 1 0 - - 0 1 1 0
15. 3 3 0 - - 0 1 1 0
16. 2 2 0 - - 0 1 1 0
17. NA NA 0 NA NA 0 NA NA 0
18. 9 9 0 - - 0 1 1 0
19. 3 3 0 - - 0 1 2 1
20. 3 3 0 - - 0 1 1 0
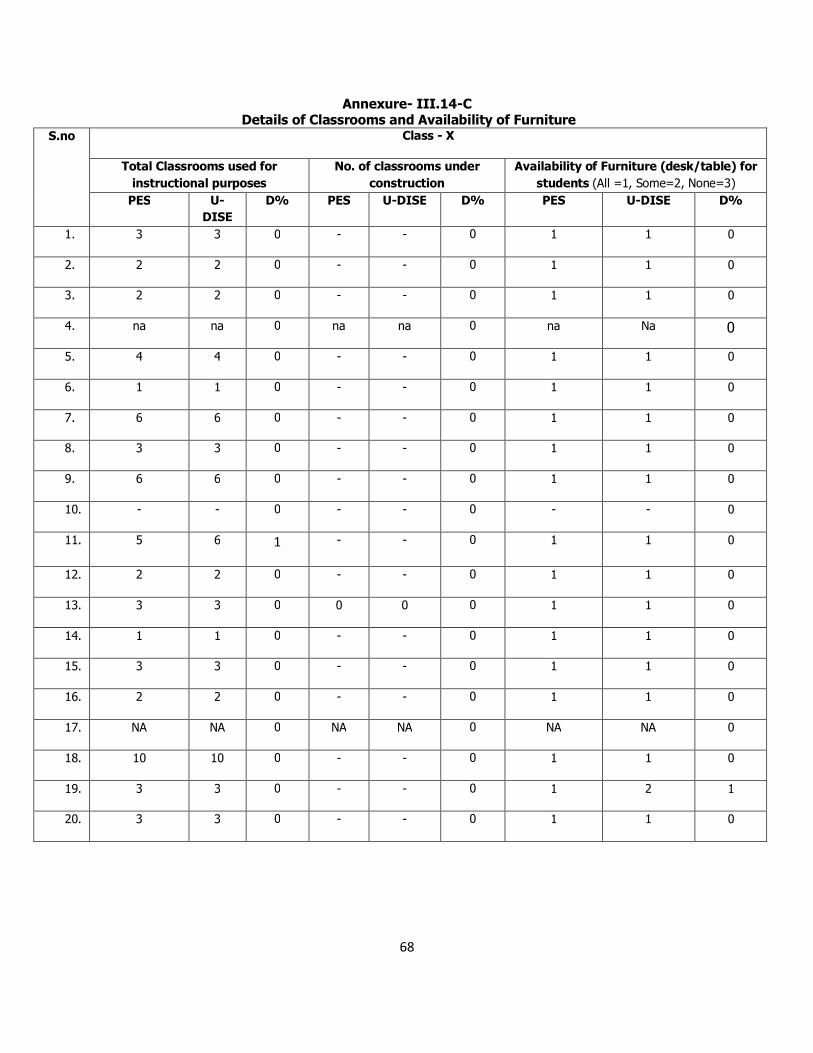
68
Annexure- III.14-C Details of Classrooms and Availability of Furniture
S.no Class - X
Total Classrooms used for instructional purposes
No. of classrooms under construction
Availability of Furniture (desk/table) for students (All =1, Some=2, None=3)
PES U-DISE
D% PES U-DISE D% PES U-DISE D%
1. 3 3 0 - - 0 1 1 0
2. 2 2 0 - - 0 1 1 0
3. 2 2 0 - - 0 1 1 0
4. na na 0 na na 0 na Na 0
5. 4 4 0 - - 0 1 1 0
6. 1 1 0 - - 0 1 1 0
7. 6 6 0 - - 0 1 1 0
8. 3 3 0 - - 0 1 1 0
9. 6 6 0 - - 0 1 1 0
10. - - 0 - - 0 - - 0
11. 5 6 1 - - 0 1 1 0
12. 2 2 0 - - 0 1 1 0
13. 3 3 0 0 0 0 1 1 0
14. 1 1 0 - - 0 1 1 0
15. 3 3 0 - - 0 1 1 0
16. 2 2 0 - - 0 1 1 0
17. NA NA 0 NA NA 0 NA NA 0
18. 10 10 0 - - 0 1 1 0
19. 3 3 0 - - 0 1 2 1
20. 3 3 0 - - 0 1 1 0
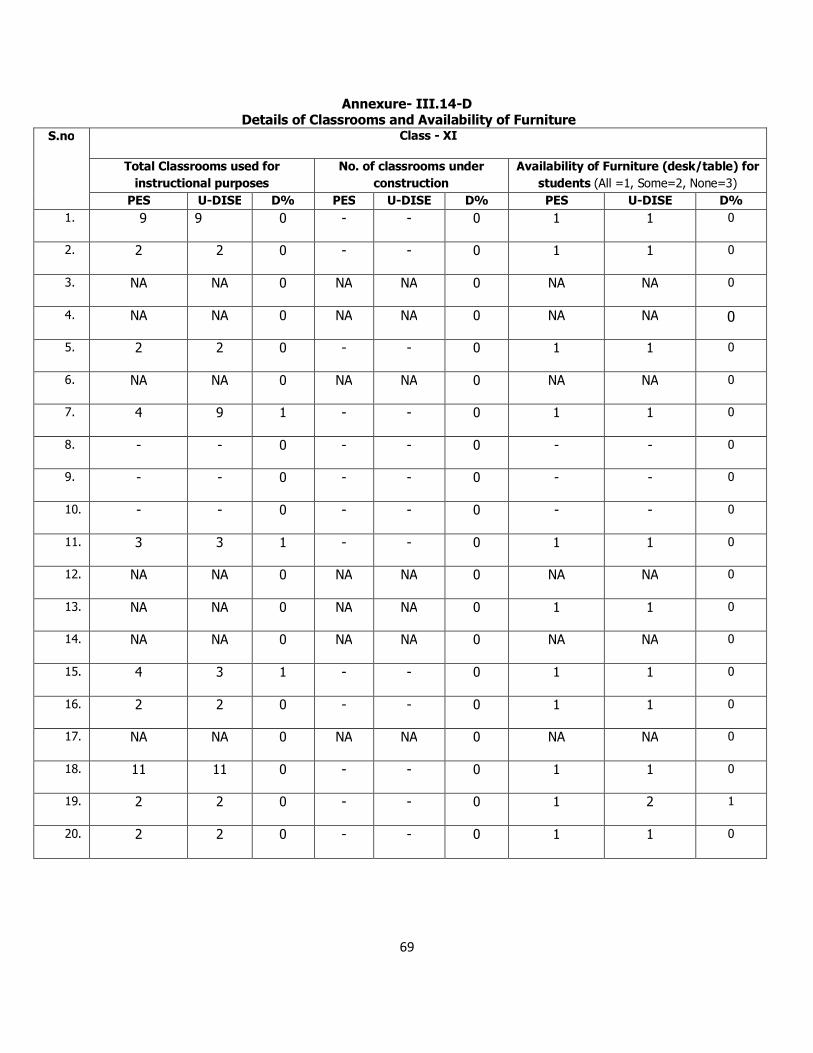
69
Annexure- III.14-D Details of Classrooms and Availability of Furniture
S.no Class - XI
Total Classrooms used for instructional purposes
No. of classrooms under construction
Availability of Furniture (desk/table) for students (All =1, Some=2, None=3)
PES U-DISE D% PES U-DISE D% PES U-DISE D% 1. 9 9 0 - - 0 1 1 0
2. 2 2 0 - - 0 1 1 0
3. NA NA 0 NA NA 0 NA NA 0
4. NA NA 0 NA NA 0 NA NA 0
5. 2 2 0 - - 0 1 1 0
6. NA NA 0 NA NA 0 NA NA 0
7. 4 9 1 - - 0 1 1 0
8. - - 0 - - 0 - - 0
9. - - 0 - - 0 - - 0
10. - - 0 - - 0 - - 0
11. 3 3 1 - - 0 1 1 0
12. NA NA 0 NA NA 0 NA NA 0
13. NA NA 0 NA NA 0 1 1 0
14. NA NA 0 NA NA 0 NA NA 0
15. 4 3 1 - - 0 1 1 0
16. 2 2 0 - - 0 1 1 0
17. NA NA 0 NA NA 0 NA NA 0
18. 11 11 0 - - 0 1 1 0
19. 2 2 0 - - 0 1 2 1
20. 2 2 0 - - 0 1 1 0
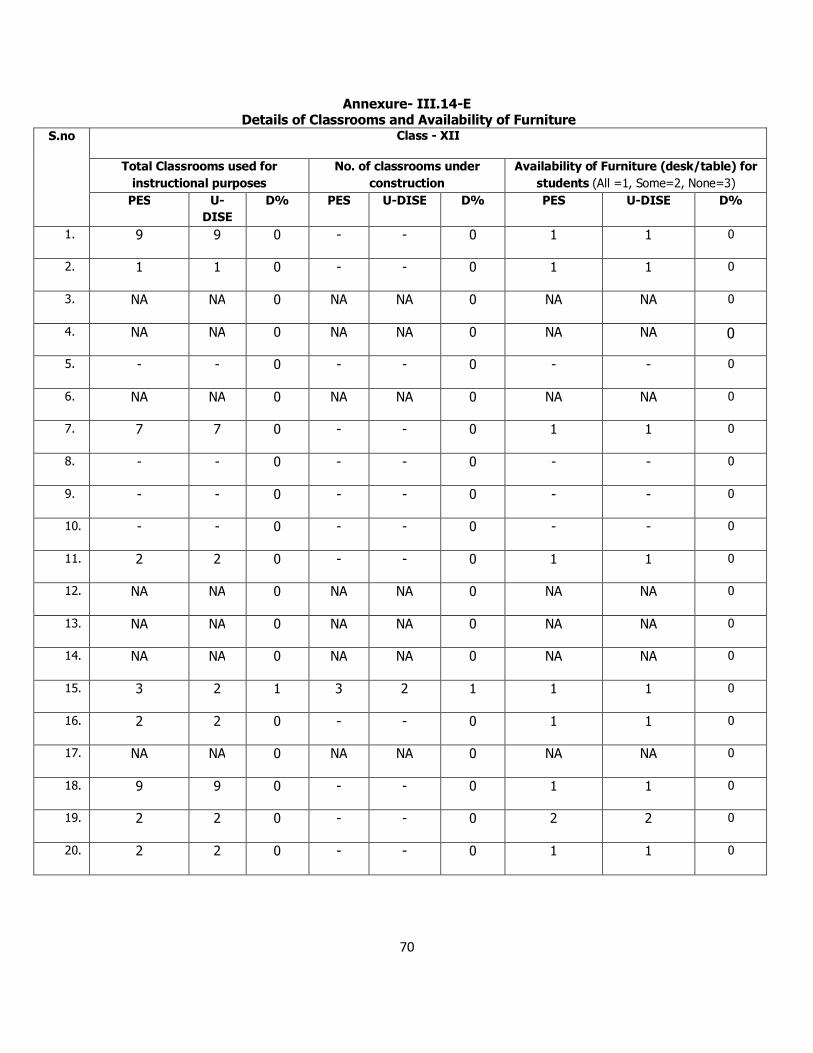
70
Annexure- III.14-E Details of Classrooms and Availability of Furniture
S.no Class - XII
Total Classrooms used for instructional purposes
No. of classrooms under construction
Availability of Furniture (desk/table) for students (All =1, Some=2, None=3)
PES U-DISE
D% PES U-DISE D% PES U-DISE D%
1. 9 9 0 - - 0 1 1 0
2. 1 1 0 - - 0 1 1 0
3. NA NA 0 NA NA 0 NA NA 0
4. NA NA 0 NA NA 0 NA NA 0
5. - - 0 - - 0 - - 0
6. NA NA 0 NA NA 0 NA NA 0
7. 7 7 0 - - 0 1 1 0
8. - - 0 - - 0 - - 0
9. - - 0 - - 0 - - 0
10. - - 0 - - 0 - - 0
11. 2 2 0 - - 0 1 1 0
12. NA NA 0 NA NA 0 NA NA 0
13. NA NA 0 NA NA 0 NA NA 0
14. NA NA 0 NA NA 0 NA NA 0
15. 3 2 1 3 2 1 1 1 0
16. 2 2 0 - - 0 1 1 0
17. NA NA 0 NA NA 0 NA NA 0
18. 9 9 0 - - 0 1 1 0
19. 2 2 0 - - 0 2 2 0
20. 2 2 0 - - 0 1 1 0
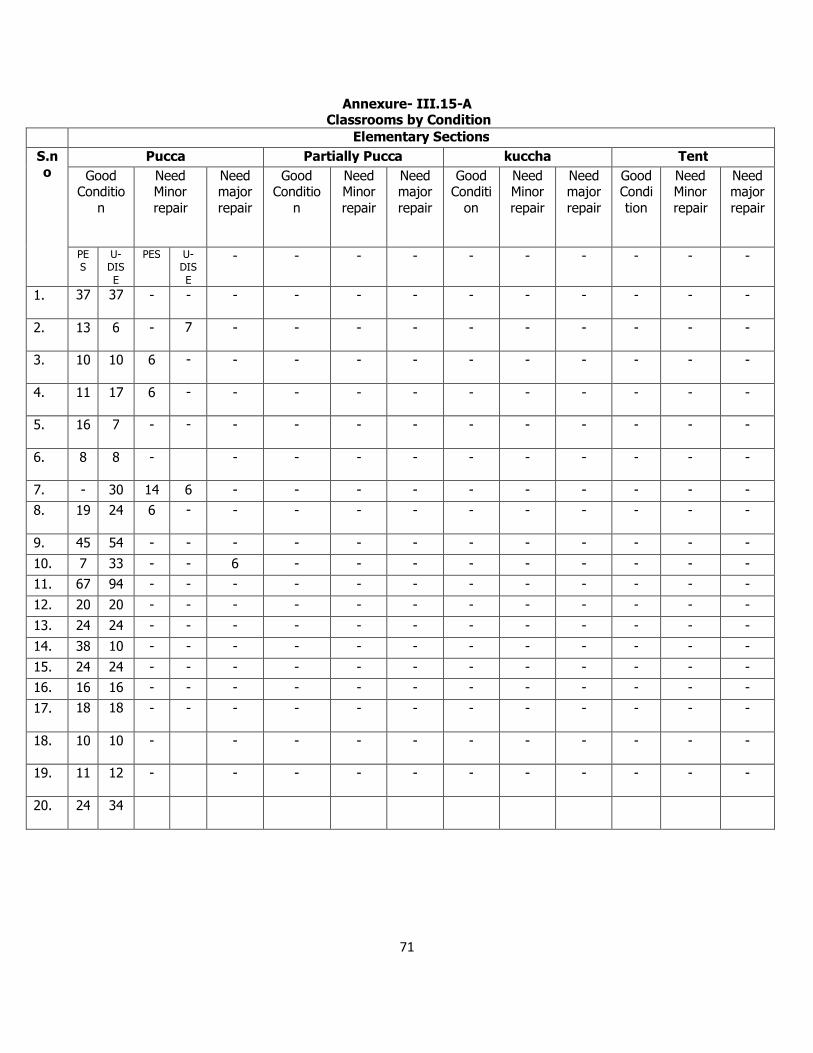
71
Annexure- III.15-A Classrooms by Condition
Elementary Sections S.no
Pucca Partially Pucca kuccha Tent Good
Condition
Need Minor repair
Need major repair
Good Conditio
n
Need Minor repair
Need major repair
Good Conditi
on
Need Minor repair
Need major repair
Good Condition
Need Minor repair
Need major repair
PES
U-DISE
PES U-DISE
- - - - - - - - - -
1. 37 37 - - - - - - - - - - - -
2. 13 6 - 7 - - - - - - - - - -
3. 10 10 6 - - - - - - - - - - -
4. 11 17 6 - - - - - - - - - - -
5. 16 7 - - - - - - - - - - - -
6. 8 8 - - - - - - - - - - -
7. - 30 14 6 - - - - - - - - - - 8. 19 24 6 - - - - - - - - - - -
9. 45 54 - - - - - - - - - - - - 10. 7 33 - - 6 - - - - - - - - - 11. 67 94 - - - - - - - - - - - - 12. 20 20 - - - - - - - - - - - - 13. 24 24 - - - - - - - - - - - - 14. 38 10 - - - - - - - - - - - - 15. 24 24 - - - - - - - - - - - - 16. 16 16 - - - - - - - - - - - - 17. 18 18 - - - - - - - - - - - -
18. 10 10 - - - - - - - - - - -
19. 11 12 - - - - - - - - - - -
20. 24 34
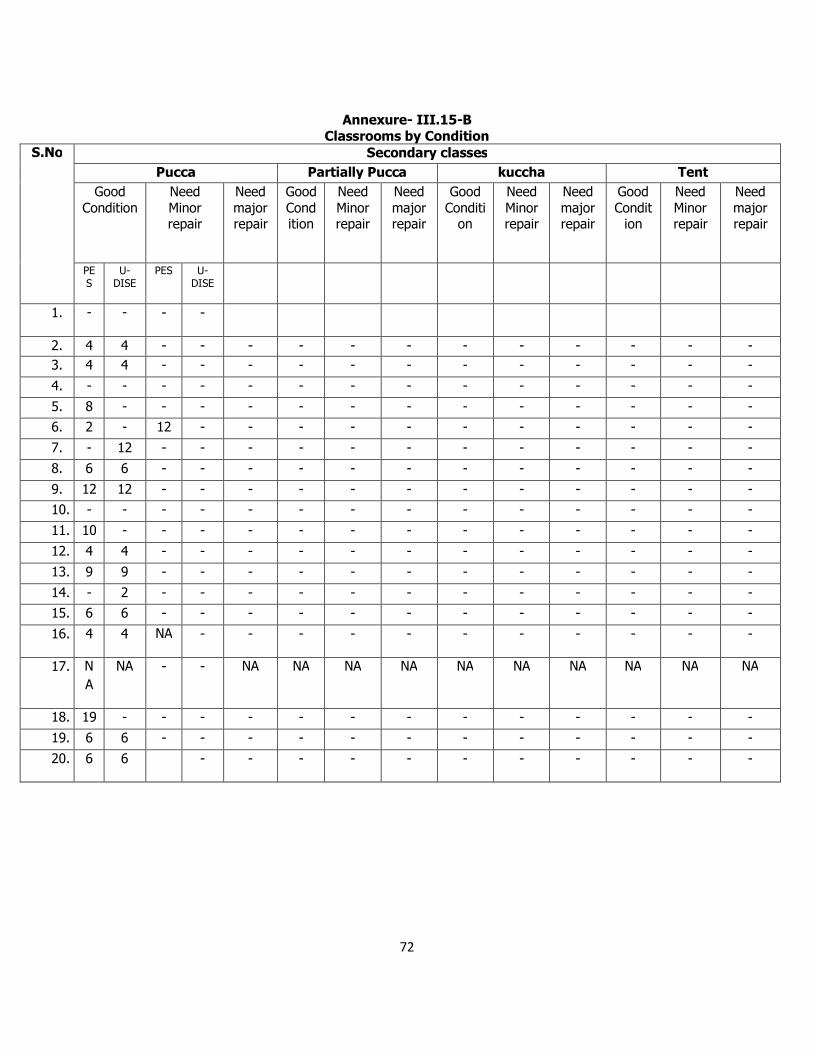
72
Annexure- III.15-B
Classrooms by Condition S.No Secondary classes
Pucca Partially Pucca kuccha Tent Good
Condition Need Minor repair
Need major repair
Good Condition
Need Minor repair
Need major repair
Good Conditi
on
Need Minor repair
Need major repair
Good Condit
ion
Need Minor repair
Need major repair
PES
U-DISE
PES U-DISE
1. - - - -
2. 4 4 - - - - - - - - - - - - 3. 4 4 - - - - - - - - - - - - 4. - - - - - - - - - - - - - - 5. 8 - - - - - - - - - - - - - 6. 2 - 12 - - - - - - - - - - - 7. - 12 - - - - - - - - - - - - 8. 6 6 - - - - - - - - - - - - 9. 12 12 - - - - - - - - - - - - 10. - - - - - - - - - - - - - - 11. 10 - - - - - - - - - - - - - 12. 4 4 - - - - - - - - - - - - 13. 9 9 - - - - - - - - - - - - 14. - 2 - - - - - - - - - - - - 15. 6 6 - - - - - - - - - - - - 16. 4 4 NA - - - - - - - - - - -
17. NA
NA - - NA NA NA NA NA NA NA NA NA NA
18. 19 - - - - - - - - - - - - - 19. 6 6 - - - - - - - - - - - - 20. 6 6 - - - - - - - - - - -
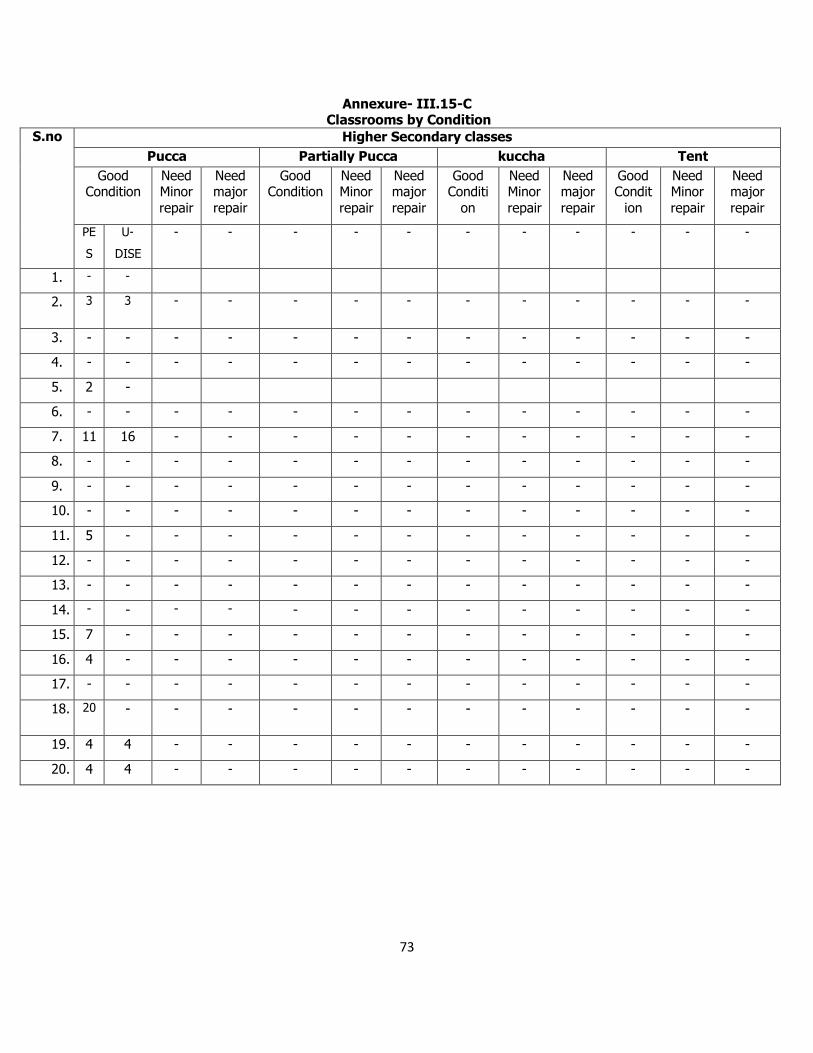
73
Annexure- III.15-C Classrooms by Condition
S.no Higher Secondary classes Pucca Partially Pucca kuccha Tent
Good Condition
Need Minor repair
Need major repair
Good Condition
Need Minor repair
Need major repair
Good Conditi
on
Need Minor repair
Need major repair
Good Condit
ion
Need Minor repair
Need major repair
PE
S
U-
DISE
- - - - - - - - - - -
1. - -
2. 3 3 - - - - - - - - - - -
3. - - - - - - - - - - - - -
4. - - - - - - - - - - - - -
5. 2 -
6. - - - - - - - - - - - - -
7. 11 16 - - - - - - - - - - -
8. - - - - - - - - - - - - -
9. - - - - - - - - - - - - -
10. - - - - - - - - - - - - -
11. 5 - - - - - - - - - - - -
12. - - - - - - - - - - - - -
13. - - - - - - - - - - - - -
14. - - - - - - - - - - - - -
15. 7 - - - - - - - - - - - -
16. 4 - - - - - - - - - - - -
17. - - - - - - - - - - - - -
18. 20 - - - - - - - - - - - -
19. 4 4 - - - - - - - - - - -
20. 4 4 - - - - - - - - - - -
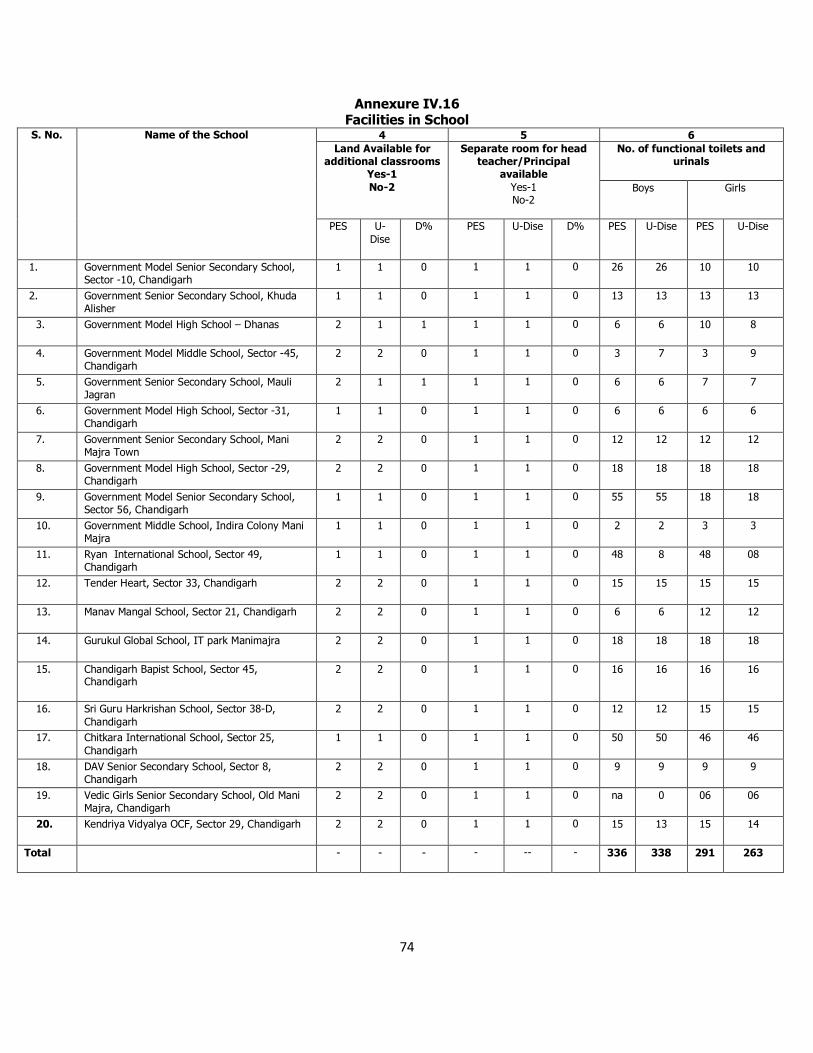
74
Annexure IV.16 Facilities in School
S. No. Name of the School 4 5 6 Land Available for
additional classrooms Yes-1 No-2
Separate room for head teacher/Principal
available Yes-1 No-2
No. of functional toilets and urinals
Boys Girls
PES U-Dise
D% PES U-Dise D% PES U-Dise PES U-Dise
1. Government Model Senior Secondary School, Sector -10, Chandigarh
1 1 0 1 1 0 26 26 10 10
2. Government Senior Secondary School, Khuda Alisher
1 1 0 1 1 0 13 13 13 13
3. Government Model High School – Dhanas 2 1 1 1 1 0 6 6 10 8
4. Government Model Middle School, Sector -45, Chandigarh
2 2 0 1 1 0 3 7 3 9
5. Government Senior Secondary School, Mauli Jagran
2 1 1 1 1 0 6 6 7 7
6. Government Model High School, Sector -31, Chandigarh
1 1 0 1 1 0 6 6 6 6
7. Government Senior Secondary School, Mani Majra Town
2 2 0 1 1 0 12 12 12 12
8. Government Model High School, Sector -29, Chandigarh
2 2 0 1 1 0 18 18 18 18
9. Government Model Senior Secondary School, Sector 56, Chandigarh
1 1 0 1 1 0 55 55 18 18
10. Government Middle School, Indira Colony Mani Majra
1 1 0 1 1 0 2 2 3 3
11. Ryan International School, Sector 49, Chandigarh
1 1 0 1 1 0 48 8 48 08
12. Tender Heart, Sector 33, Chandigarh 2 2 0 1 1 0 15 15 15 15
13. Manav Mangal School, Sector 21, Chandigarh 2 2 0 1 1 0 6 6 12 12
14. Gurukul Global School, IT park Manimajra 2 2 0 1 1 0 18 18 18 18
15. Chandigarh Bapist School, Sector 45, Chandigarh
2 2 0 1 1 0 16 16 16 16
16. Sri Guru Harkrishan School, Sector 38-D, Chandigarh
2 2 0 1 1 0 12 12 15 15
17. Chitkara International School, Sector 25, Chandigarh
1 1 0 1 1 0 50 50 46 46
18. DAV Senior Secondary School, Sector 8, Chandigarh
2 2 0 1 1 0 9 9 9 9
19. Vedic Girls Senior Secondary School, Old Mani Majra, Chandigarh
2 2 0 1 1 0 na 0 06
06
20. Kendriya Vidyalya OCF, Sector 29, Chandigarh 2 2 0 1 1 0 15 13 15 14
Total - - - - -- - 336 338 291 263
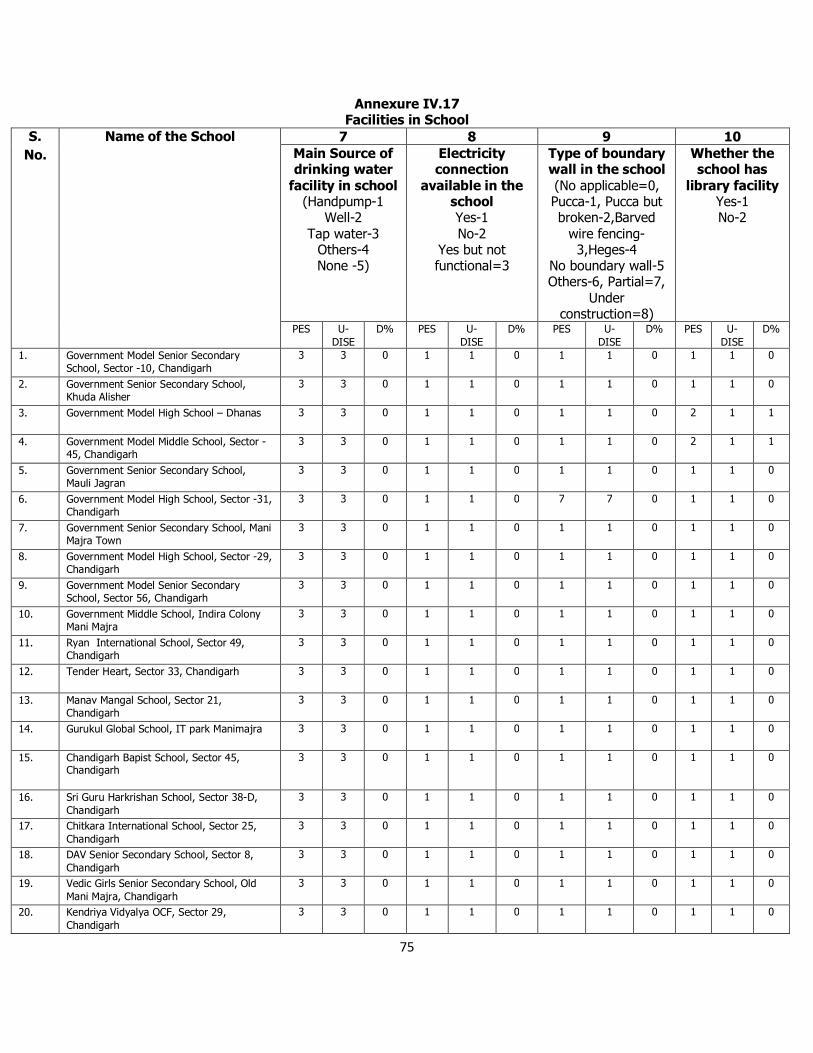
75
Annexure IV.17 Facilities in School
S. No.
Name of the School 7 8 9 10 Main Source of drinking water
facility in school (Handpump-1
Well-2 Tap water-3
Others-4 None -5)
Electricity connection
available in the school Yes-1 No-2
Yes but not functional=3
Type of boundary wall in the school (No applicable=0, Pucca-1, Pucca but broken-2,Barved
wire fencing-3,Heges-4
No boundary wall-5 Others-6, Partial=7,
Under construction=8)
Whether the school has
library facility Yes-1 No-2
PES U-DISE
D% PES U- DISE
D% PES U- DISE
D% PES U- DISE
D%
1. Government Model Senior Secondary School, Sector -10, Chandigarh
3 3 0 1 1 0 1 1 0 1 1 0
2. Government Senior Secondary School, Khuda Alisher
3 3 0 1 1 0 1 1 0 1 1 0
3. Government Model High School – Dhanas 3 3 0 1 1 0 1 1 0 2 1 1
4. Government Model Middle School, Sector -45, Chandigarh
3 3 0 1 1 0 1 1 0 2 1 1
5. Government Senior Secondary School, Mauli Jagran
3 3 0 1 1 0 1 1 0 1 1 0
6. Government Model High School, Sector -31, Chandigarh
3 3 0 1 1 0 7 7 0 1 1 0
7. Government Senior Secondary School, Mani Majra Town
3 3 0 1 1 0 1 1 0 1 1 0
8. Government Model High School, Sector -29, Chandigarh
3 3 0 1 1 0 1 1 0 1 1 0
9. Government Model Senior Secondary School, Sector 56, Chandigarh
3 3 0 1 1 0 1 1 0 1 1 0
10. Government Middle School, Indira Colony Mani Majra
3 3 0 1 1 0 1 1 0 1 1 0
11. Ryan International School, Sector 49, Chandigarh
3 3 0 1 1 0 1 1 0 1 1 0
12. Tender Heart, Sector 33, Chandigarh 3 3 0 1 1 0 1 1 0 1 1 0
13. Manav Mangal School, Sector 21, Chandigarh
3 3 0 1 1 0 1 1 0 1 1 0
14. Gurukul Global School, IT park Manimajra 3 3 0 1 1 0 1 1 0 1 1 0
15. Chandigarh Bapist School, Sector 45, Chandigarh
3 3 0 1 1 0 1 1 0 1 1 0
16. Sri Guru Harkrishan School, Sector 38-D, Chandigarh
3 3 0 1 1 0 1 1 0 1 1 0
17. Chitkara International School, Sector 25, Chandigarh
3 3 0 1 1 0 1 1 0 1 1 0
18. DAV Senior Secondary School, Sector 8, Chandigarh
3 3 0 1 1 0 1 1 0 1 1 0
19. Vedic Girls Senior Secondary School, Old Mani Majra, Chandigarh
3 3 0 1 1 0 1 1 0 1 1 0
20. Kendriya Vidyalya OCF, Sector 29, Chandigarh
3 3 0 1 1 0 1 1 0 1 1 0
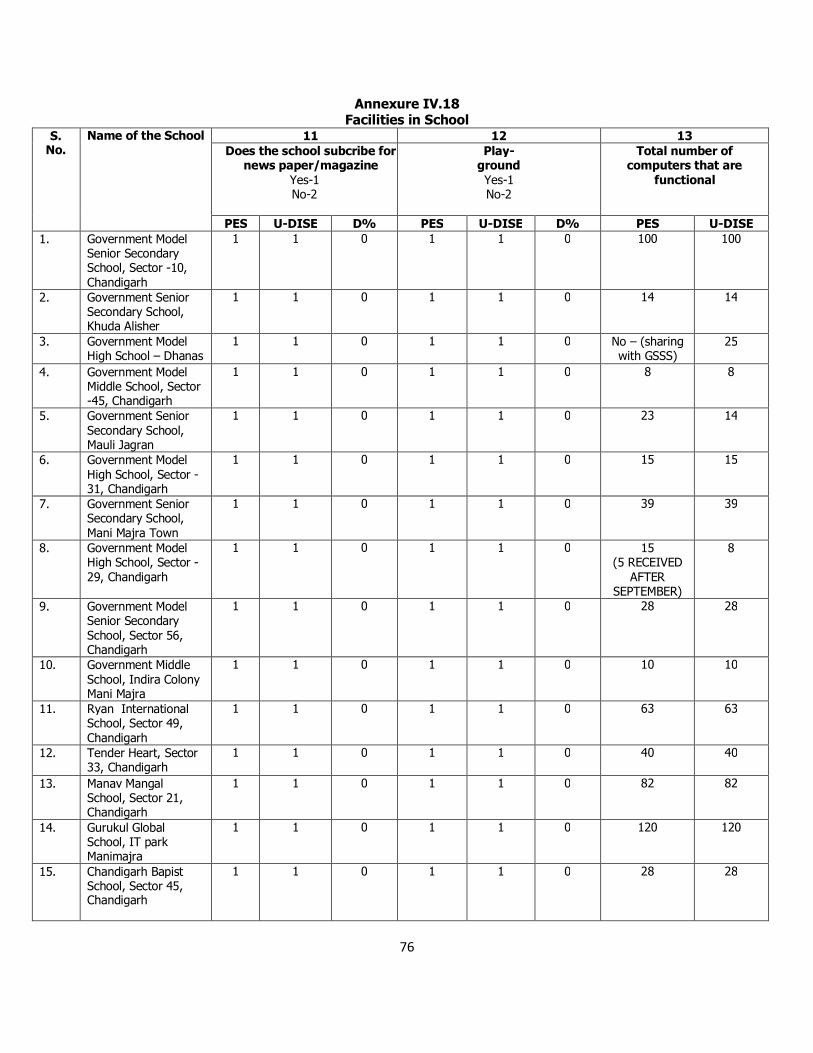
76
Annexure IV.18 Facilities in School
S. No.
Name of the School 11 12 13 Does the school subcribe for
news paper/magazine Yes-1 No-2
Play- ground Yes-1 No-2
Total number of computers that are
functional
PES U-DISE D% PES U-DISE D% PES U-DISE 1. Government Model
Senior Secondary School, Sector -10, Chandigarh
1 1 0 1 1 0 100 100
2. Government Senior Secondary School, Khuda Alisher
1 1 0 1 1 0 14 14
3. Government Model High School – Dhanas
1 1 0 1 1 0 No – (sharing with GSSS)
25
4. Government Model Middle School, Sector -45, Chandigarh
1 1 0 1 1 0 8 8
5. Government Senior Secondary School, Mauli Jagran
1 1 0 1 1 0 23 14
6. Government Model High School, Sector -31, Chandigarh
1 1 0 1 1 0 15 15
7. Government Senior Secondary School, Mani Majra Town
1 1 0 1 1 0 39 39
8. Government Model High School, Sector -29, Chandigarh
1 1 0 1 1 0 15 (5 RECEIVED
AFTER SEPTEMBER)
8
9. Government Model Senior Secondary School, Sector 56, Chandigarh
1 1 0 1 1 0 28 28
10. Government Middle School, Indira Colony Mani Majra
1 1 0 1 1 0 10 10
11. Ryan International School, Sector 49, Chandigarh
1 1 0 1 1 0 63 63
12. Tender Heart, Sector 33, Chandigarh
1 1 0 1 1 0 40 40
13. Manav Mangal School, Sector 21, Chandigarh
1 1 0 1 1 0 82 82
14. Gurukul Global School, IT park Manimajra
1 1 0 1 1 0 120 120
15. Chandigarh Bapist School, Sector 45, Chandigarh
1 1 0 1 1 0 28 28
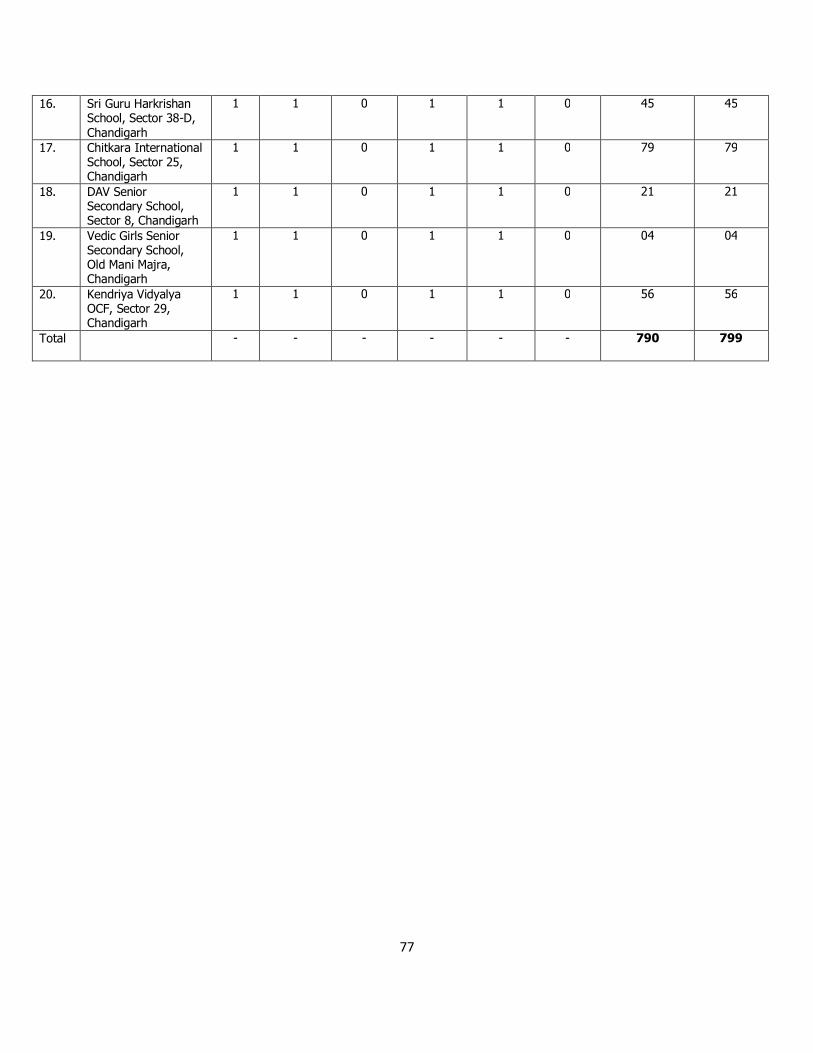
77
16. Sri Guru Harkrishan School, Sector 38-D, Chandigarh
1 1 0 1 1 0 45 45
17. Chitkara International School, Sector 25, Chandigarh
1 1 0 1 1 0 79 79
18. DAV Senior Secondary School, Sector 8, Chandigarh
1 1 0 1 1 0 21 21
19. Vedic Girls Senior Secondary School, Old Mani Majra, Chandigarh
1 1 0 1 1 0 04 04
20. Kendriya Vidyalya OCF, Sector 29, Chandigarh
1 1 0 1 1 0 56 56
Total - - - - - - 790 799
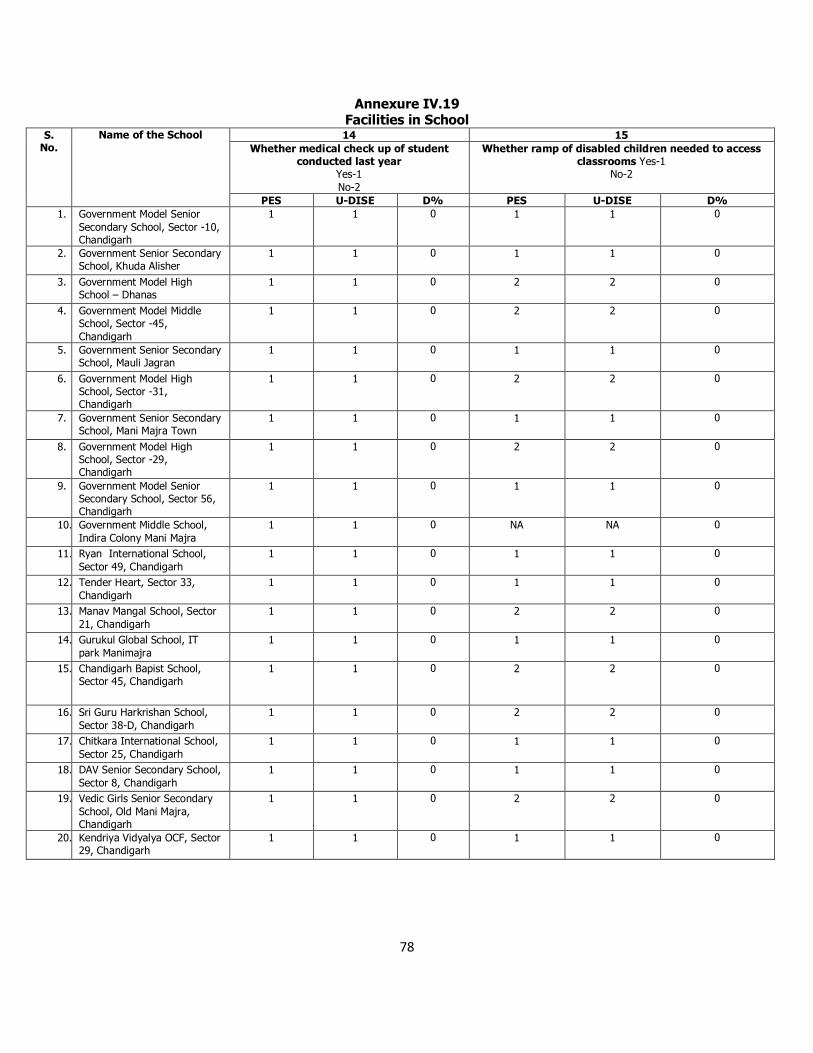
78
Annexure IV.19 Facilities in School
S. No.
Name of the School 14 15 Whether medical check up of student
conducted last year Yes-1 No-2
Whether ramp of disabled children needed to access classrooms Yes-1
No-2
PES U-DISE D% PES U-DISE D% 1. Government Model Senior
Secondary School, Sector -10, Chandigarh
1 1 0 1 1 0
2. Government Senior Secondary School, Khuda Alisher
1 1 0 1 1 0
3. Government Model High School – Dhanas
1 1 0 2 2 0
4. Government Model Middle School, Sector -45, Chandigarh
1 1 0 2 2 0
5. Government Senior Secondary School, Mauli Jagran
1 1 0 1 1 0
6. Government Model High School, Sector -31, Chandigarh
1 1 0 2 2 0
7. Government Senior Secondary School, Mani Majra Town
1 1 0 1 1 0
8. Government Model High School, Sector -29, Chandigarh
1 1 0 2 2 0
9. Government Model Senior Secondary School, Sector 56, Chandigarh
1 1 0 1 1 0
10. Government Middle School, Indira Colony Mani Majra
1 1 0 NA NA 0
11. Ryan International School, Sector 49, Chandigarh
1 1 0 1 1 0
12. Tender Heart, Sector 33, Chandigarh
1 1 0 1 1 0
13. Manav Mangal School, Sector 21, Chandigarh
1 1 0 2 2 0
14. Gurukul Global School, IT park Manimajra
1 1 0 1 1 0
15. Chandigarh Bapist School, Sector 45, Chandigarh
1 1 0 2 2 0
16. Sri Guru Harkrishan School, Sector 38-D, Chandigarh
1 1 0 2 2 0
17. Chitkara International School, Sector 25, Chandigarh
1 1 0 1 1 0
18. DAV Senior Secondary School, Sector 8, Chandigarh
1 1 0 1 1 0
19. Vedic Girls Senior Secondary School, Old Mani Majra, Chandigarh
1 1 0 2 2 0
20. Kendriya Vidyalya OCF, Sector 29, Chandigarh
1 1 0 1 1 0
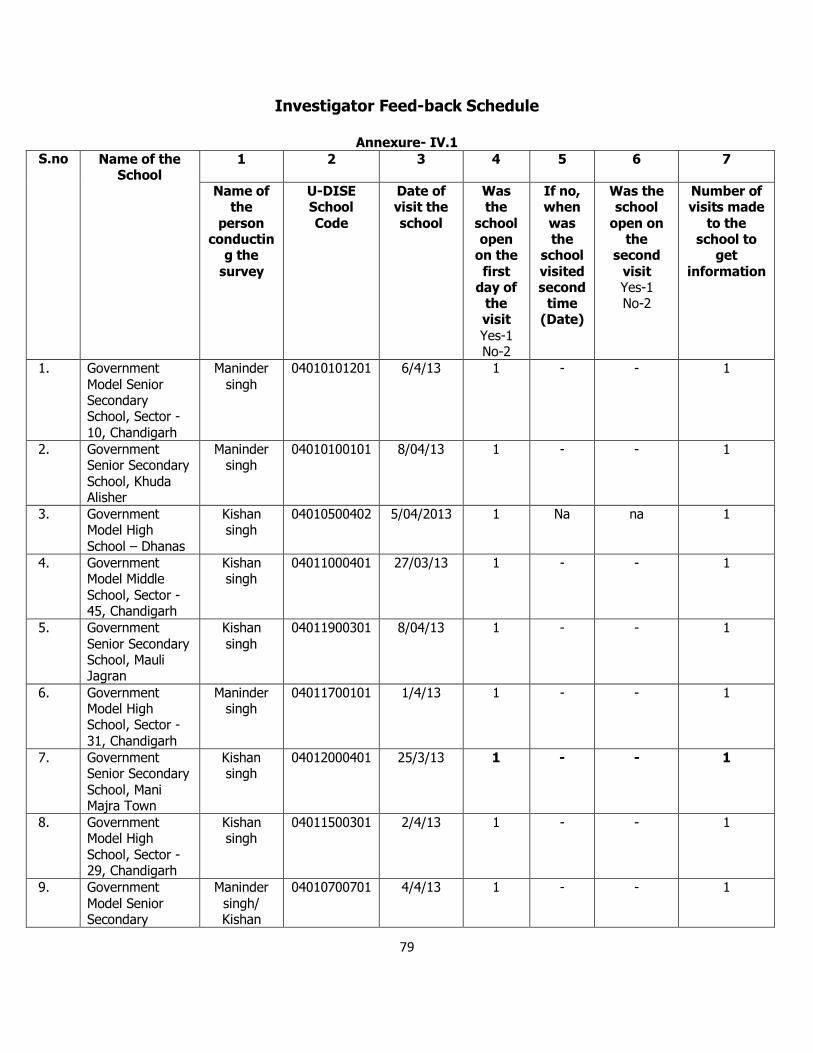
79
Investigator Feed-back Schedule
Annexure- IV.1 S.no Name of the
School
1 2 3 4 5 6 7
Name of the
person conductin
g the survey
U-DISE School Code
Date of visit the school
Was the
school open
on the first
day of the visit Yes-1 No-2
If no, when was the
school visited second
time (Date)
Was the school
open on the
second visit Yes-1 No-2
Number of visits made
to the school to
get information
1. Government Model Senior Secondary School, Sector -10, Chandigarh
Maninder singh
04010101201 6/4/13 1 - - 1
2. Government Senior Secondary School, Khuda Alisher
Maninder singh
04010100101 8/04/13 1 - - 1
3. Government Model High School – Dhanas
Kishan singh
04010500402 5/04/2013 1 Na na 1
4. Government Model Middle School, Sector -45, Chandigarh
Kishan singh
04011000401 27/03/13 1 - - 1
5. Government Senior Secondary School, Mauli Jagran
Kishan singh
04011900301 8/04/13 1 - - 1
6. Government Model High School, Sector -31, Chandigarh
Maninder singh
04011700101 1/4/13 1 - - 1
7. Government Senior Secondary School, Mani Majra Town
Kishan singh
04012000401 25/3/13 1 - - 1
8. Government Model High School, Sector -29, Chandigarh
Kishan singh
04011500301 2/4/13 1 - - 1
9. Government Model Senior Secondary
Maninder singh/ Kishan
04010700701 4/4/13 1 - - 1
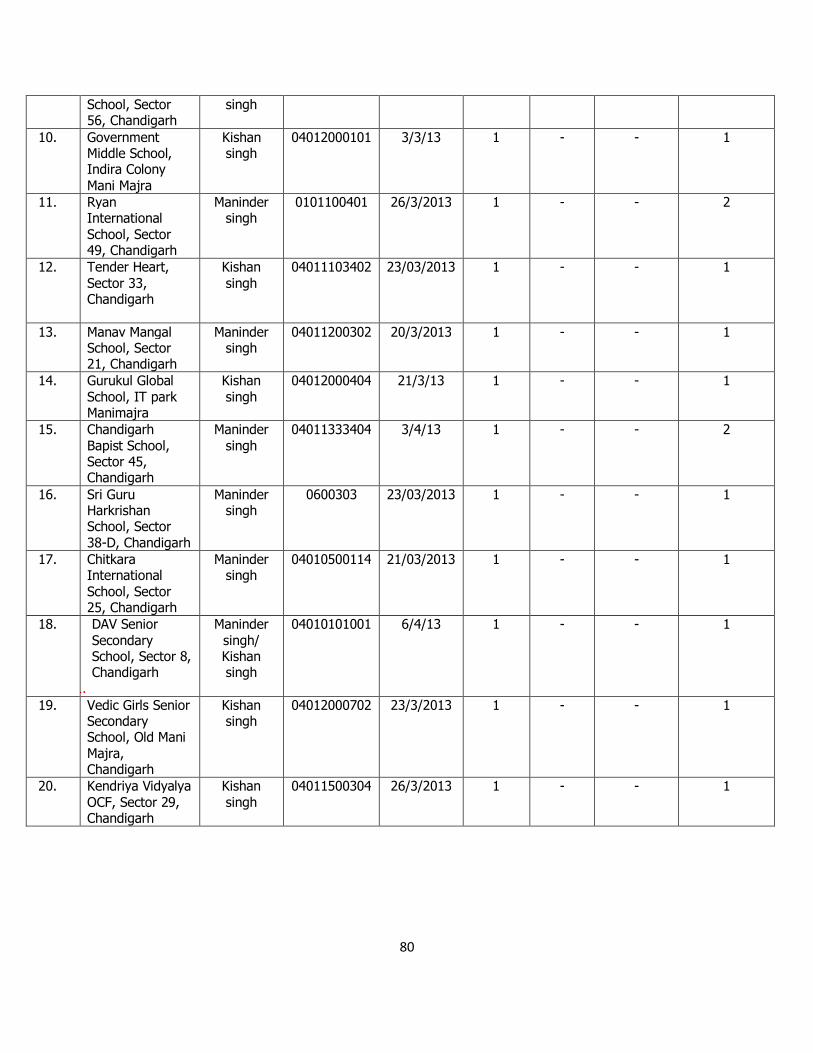
80
School, Sector 56, Chandigarh
singh
10. Government Middle School, Indira Colony Mani Majra
Kishan singh
04012000101 3/3/13 1 - - 1
11. Ryan International School, Sector 49, Chandigarh
Maninder singh
0101100401 26/3/2013 1 - - 2
12. Tender Heart, Sector 33, Chandigarh
Kishan singh
04011103402 23/03/2013 1 - - 1
13. Manav Mangal School, Sector 21, Chandigarh
Maninder singh
04011200302 20/3/2013 1 - - 1
14. Gurukul Global School, IT park Manimajra
Kishan singh
04012000404 21/3/13 1 - - 1
15. Chandigarh Bapist School, Sector 45, Chandigarh
Maninder singh
04011333404 3/4/13 1 - - 2
16. Sri Guru Harkrishan School, Sector 38-D, Chandigarh
Maninder singh
0600303 23/03/2013 1 - - 1
17. Chitkara International School, Sector 25, Chandigarh
Maninder singh
04010500114 21/03/2013 1 - - 1
18. DAV Senior Secondary School, Sector 8, Chandigarh
1.
Maninder singh/ Kishan singh
04010101001 6/4/13 1 - - 1
19. Vedic Girls Senior Secondary School, Old Mani Majra, Chandigarh
Kishan singh
04012000702 23/3/2013 1 - - 1
20. Kendriya Vidyalya OCF, Sector 29, Chandigarh
Kishan singh
04011500304 26/3/2013 1 - - 1
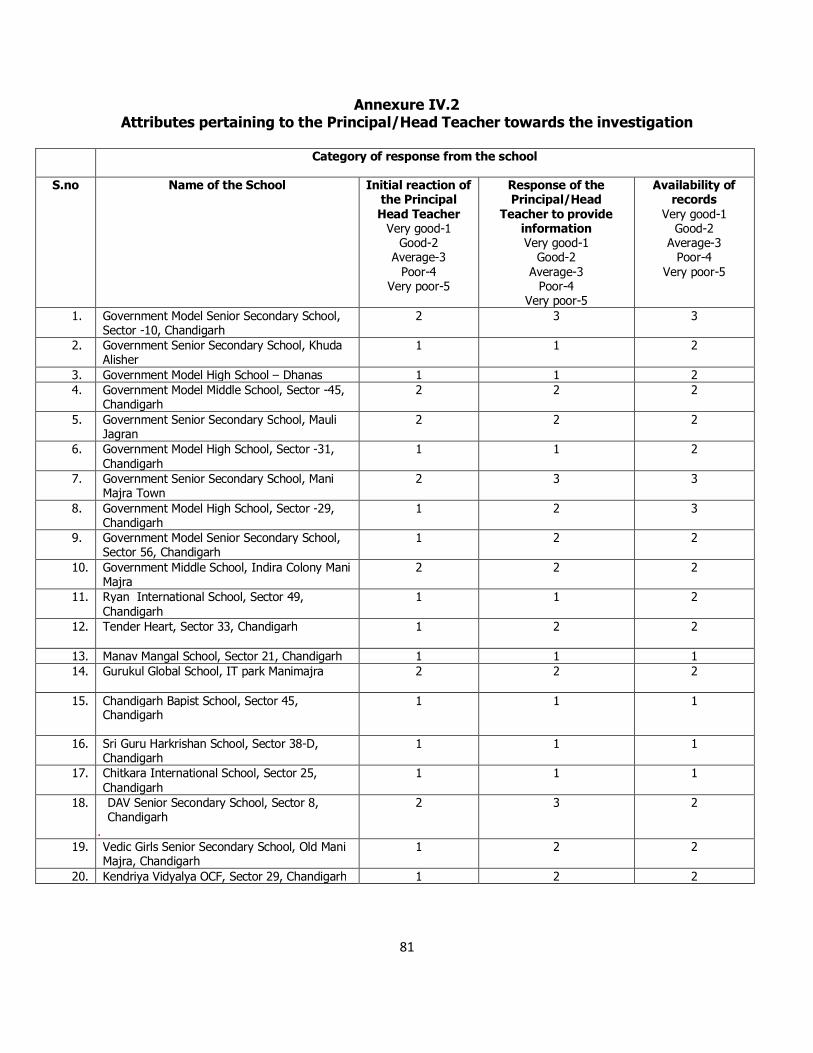
81
Annexure IV.2 Attributes pertaining to the Principal/Head Teacher towards the investigation
Category of response from the school
S.no
Name of the School
Initial reaction of the Principal Head Teacher
Very good-1 Good-2
Average-3 Poor-4
Very poor-5
Response of the Principal/Head
Teacher to provide information Very good-1
Good-2 Average-3
Poor-4 Very poor-5
Availability of records
Very good-1 Good-2
Average-3 Poor-4
Very poor-5
1. Government Model Senior Secondary School, Sector -10, Chandigarh
2 3 3
2. Government Senior Secondary School, Khuda Alisher
1 1 2
3. Government Model High School – Dhanas 1 1 2 4. Government Model Middle School, Sector -45,
Chandigarh 2 2 2
5. Government Senior Secondary School, Mauli Jagran
2 2 2
6. Government Model High School, Sector -31, Chandigarh
1 1 2
7. Government Senior Secondary School, Mani Majra Town
2 3 3
8. Government Model High School, Sector -29, Chandigarh
1 2 3
9. Government Model Senior Secondary School, Sector 56, Chandigarh
1 2 2
10. Government Middle School, Indira Colony Mani Majra
2 2 2
11. Ryan International School, Sector 49, Chandigarh
1 1 2
12. Tender Heart, Sector 33, Chandigarh 1
2 2
13. Manav Mangal School, Sector 21, Chandigarh 1 1 1 14. Gurukul Global School, IT park Manimajra 2
2 2
15. Chandigarh Bapist School, Sector 45, Chandigarh
1 1 1
16. Sri Guru Harkrishan School, Sector 38-D, Chandigarh
1 1 1
17. Chitkara International School, Sector 25, Chandigarh
1 1 1
18. DAV Senior Secondary School, Sector 8, Chandigarh
1.
2 3 2
19. Vedic Girls Senior Secondary School, Old Mani Majra, Chandigarh
1 2 2
20. Kendriya Vidyalya OCF, Sector 29, Chandigarh 1 2 2
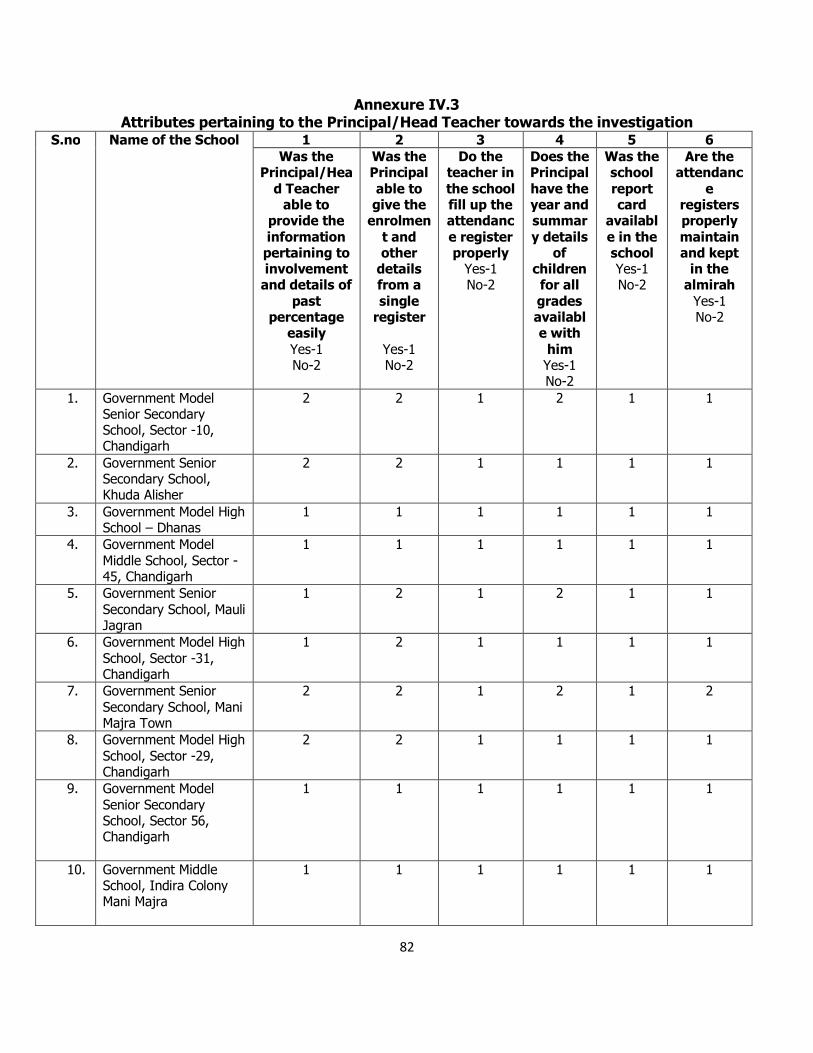
82
Annexure IV.3 Attributes pertaining to the Principal/Head Teacher towards the investigation
S.no Name of the School
1 2 3 4 5 6 Was the
Principal/Head Teacher
able to provide the information pertaining to involvement
and details of past
percentage easily Yes-1 No-2
Was the Principal able to give the
enrolment and other
details from a single
register
Yes-1 No-2
Do the teacher in the school fill up the attendance register properly
Yes-1 No-2
Does the Principal have the year and summary details
of children for all grades available with
him Yes-1 No-2
Was the school report card
available in the school Yes-1 No-2
Are the attendanc
e registers properly maintain and kept
in the almirah
Yes-1 No-2
1. Government Model Senior Secondary School, Sector -10, Chandigarh
2 2 1 2 1 1
2. Government Senior Secondary School, Khuda Alisher
2 2 1 1 1 1
3. Government Model High School – Dhanas
1 1 1 1 1 1
4. Government Model Middle School, Sector -45, Chandigarh
1 1 1 1 1 1
5. Government Senior Secondary School, Mauli Jagran
1 2 1 2 1 1
6. Government Model High School, Sector -31, Chandigarh
1 2 1 1 1 1
7. Government Senior Secondary School, Mani Majra Town
2 2 1 2 1 2
8. Government Model High School, Sector -29, Chandigarh
2 2 1 1 1 1
9. Government Model Senior Secondary School, Sector 56, Chandigarh
1 1 1 1 1 1
10. Government Middle School, Indira Colony Mani Majra
1 1 1 1 1 1
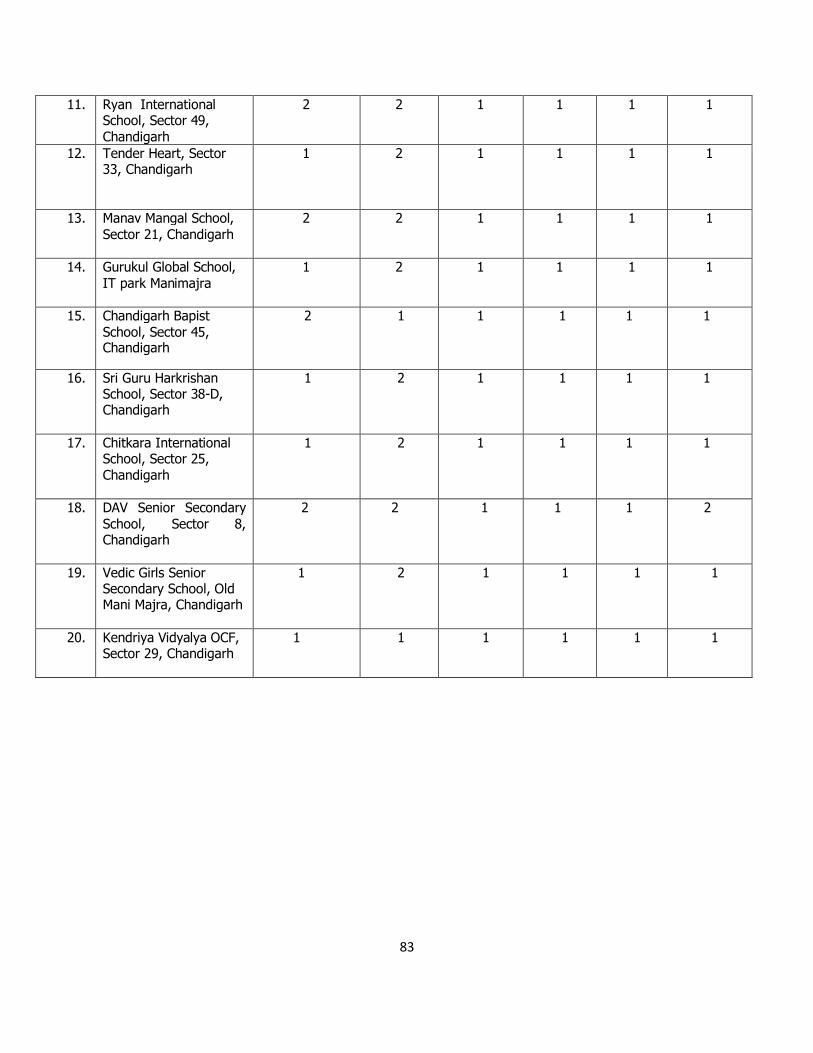
83
11. Ryan International School, Sector 49, Chandigarh
2 2 1 1 1 1
12. Tender Heart, Sector 33, Chandigarh
1
2 1 1 1 1
13. Manav Mangal School, Sector 21, Chandigarh
2 2 1 1 1 1
14. Gurukul Global School, IT park Manimajra
1 2 1 1 1 1
15. Chandigarh Bapist School, Sector 45, Chandigarh
2 1 1 1 1 1
16. Sri Guru Harkrishan School, Sector 38-D, Chandigarh
1 2 1 1 1 1
17. Chitkara International School, Sector 25, Chandigarh
1 2 1 1 1 1
18. DAV Senior Secondary School, Sector 8, Chandigarh
2 2 1 1 1 2
19. Vedic Girls Senior Secondary School, Old Mani Majra, Chandigarh
1 2 1 1 1 1
20. Kendriya Vidyalya OCF, Sector 29, Chandigarh
1 1 1 1 1 1
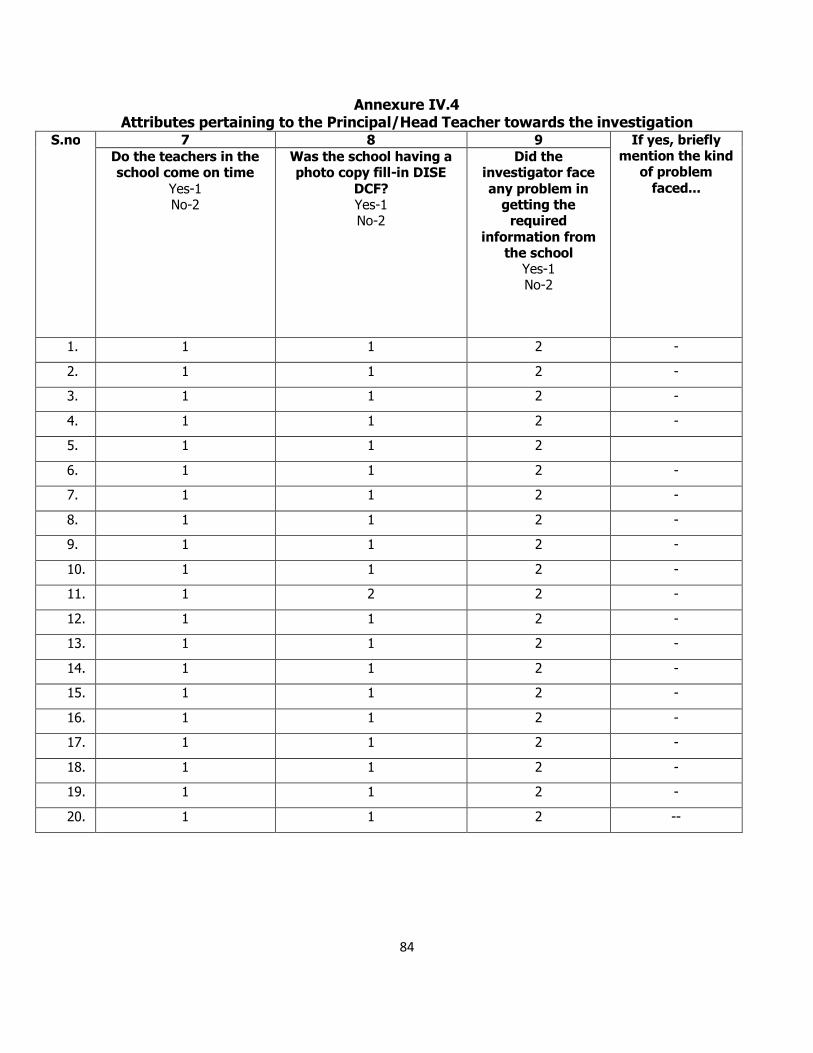
84
Annexure IV.4 Attributes pertaining to the Principal/Head Teacher towards the investigation
S.no
7 8 9 If yes, briefly mention the kind
of problem faced...
Do the teachers in the school come on time
Yes-1 No-2
Was the school having a photo copy fill-in DISE
DCF? Yes-1 No-2
Did the investigator face any problem in
getting the required
information from the school
Yes-1 No-2
1. 1 1 2 -
2. 1 1 2 -
3. 1 1 2 -
4. 1 1 2 -
5. 1 1 2
6. 1 1 2 -
7. 1 1 2 -
8. 1 1 2 -
9. 1 1 2 -
10. 1 1 2 -
11. 1 2 2 -
12. 1 1 2 -
13. 1 1 2 -
14. 1 1 2 -
15. 1 1 2 -
16. 1 1 2 -
17. 1 1 2 -
18. 1 1 2 -
19. 1 1 2 -
20. 1 1 2 --
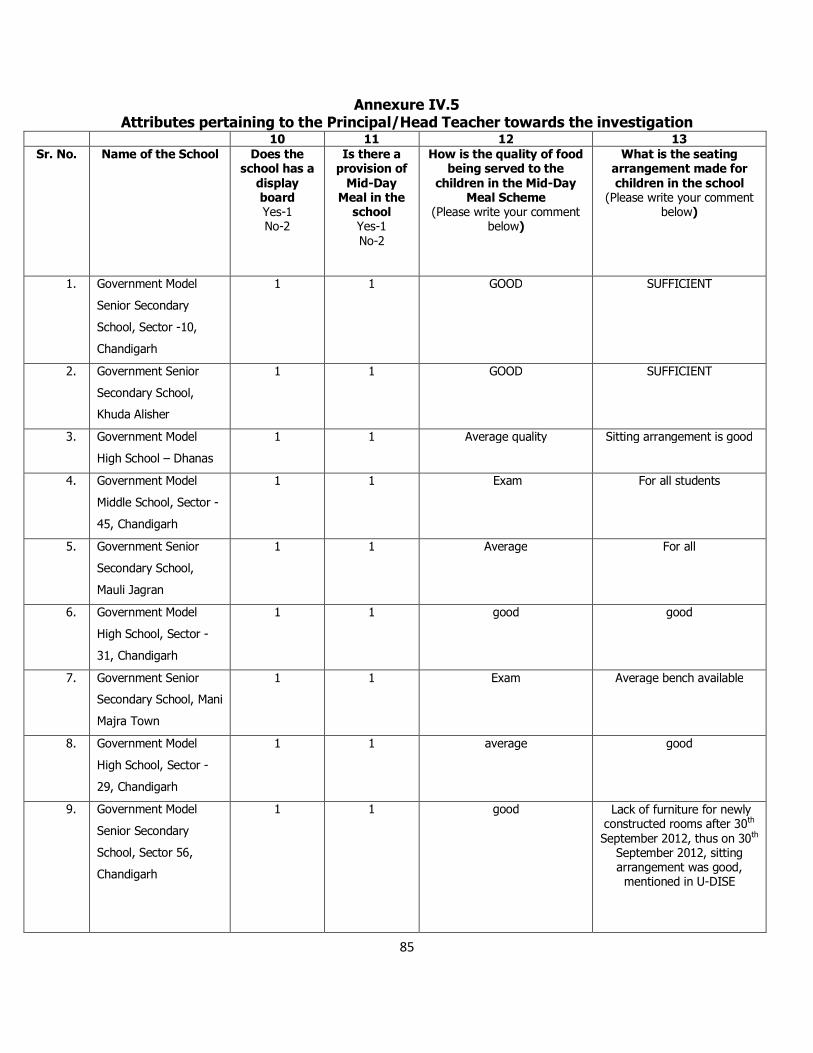
85
Annexure IV.5 Attributes pertaining to the Principal/Head Teacher towards the investigation
10 11 12 13 Sr. No. Name of the School
Does the school has a
display board Yes-1 No-2
Is there a provision of
Mid-Day Meal in the
school Yes-1 No-2
How is the quality of food being served to the
children in the Mid-Day Meal Scheme
(Please write your comment below)
What is the seating arrangement made for children in the school
(Please write your comment below)
1. Government Model
Senior Secondary
School, Sector -10,
Chandigarh
1 1 GOOD SUFFICIENT
2. Government Senior
Secondary School,
Khuda Alisher
1 1 GOOD SUFFICIENT
3. Government Model
High School – Dhanas
1 1 Average quality Sitting arrangement is good
4. Government Model
Middle School, Sector -
45, Chandigarh
1 1 Exam For all students
5. Government Senior
Secondary School,
Mauli Jagran
1 1 Average For all
6. Government Model
High School, Sector -
31, Chandigarh
1 1 good good
7. Government Senior
Secondary School, Mani
Majra Town
1 1 Exam Average bench available
8. Government Model
High School, Sector -
29, Chandigarh
1 1 average good
9. Government Model
Senior Secondary
School, Sector 56,
Chandigarh
1 1 good Lack of furniture for newly constructed rooms after 30th September 2012, thus on 30th
September 2012, sitting arrangement was good,
mentioned in U-DISE
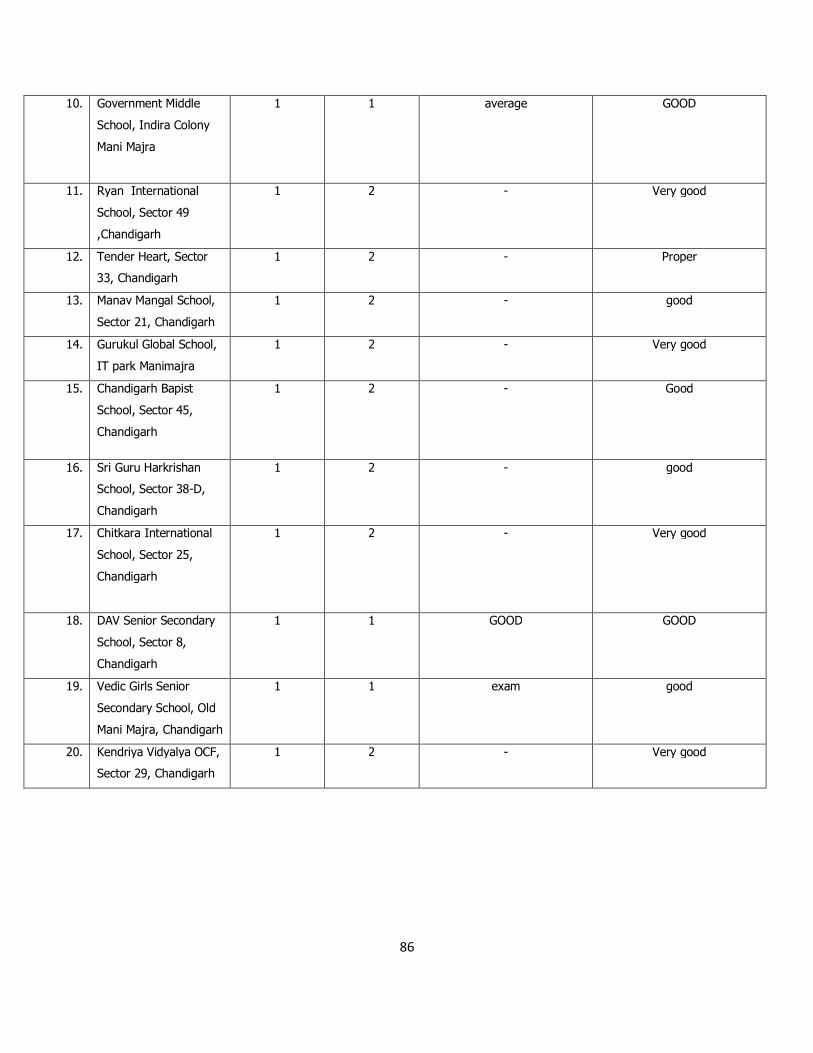
86
10. Government Middle
School, Indira Colony
Mani Majra
1 1 average GOOD
11. Ryan International
School, Sector 49
,Chandigarh
1 2 - Very good
12. Tender Heart, Sector
33, Chandigarh
1 2 - Proper
13. Manav Mangal School,
Sector 21, Chandigarh
1 2 - good
14. Gurukul Global School,
IT park Manimajra
1 2 - Very good
15. Chandigarh Bapist
School, Sector 45,
Chandigarh
1 2 - Good
16. Sri Guru Harkrishan
School, Sector 38-D,
Chandigarh
1 2 - good
17. Chitkara International
School, Sector 25,
Chandigarh
1 2 - Very good
18. DAV Senior Secondary
School, Sector 8,
Chandigarh
1 1 GOOD GOOD
19. Vedic Girls Senior
Secondary School, Old
Mani Majra, Chandigarh
1 1 exam good
20. Kendriya Vidyalya OCF,
Sector 29, Chandigarh
1 2 - Very good
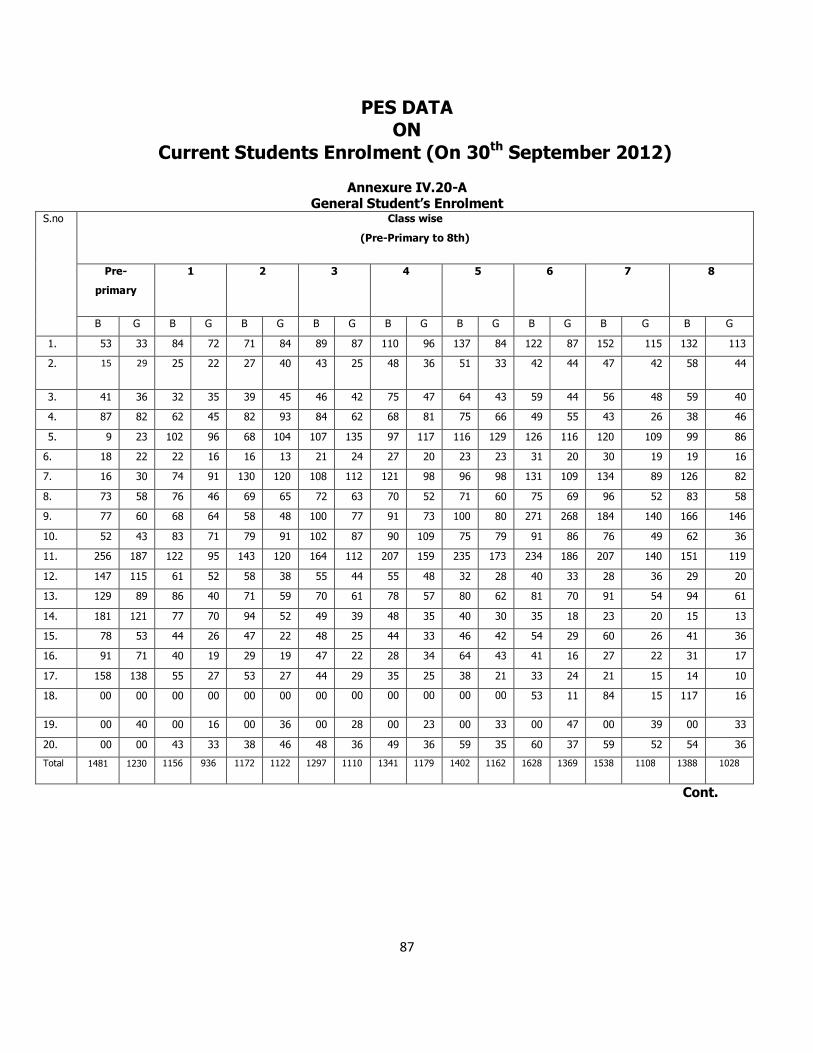
87
PES DATA ON
Current Students Enrolment (On 30th September 2012)
Annexure IV.20-A General Student’s Enrolment
S.no Class wise
(Pre-Primary to 8th)
Pre-
primary
1 2 3 4 5 6 7 8
B G B G B G B G B G B G B G B G B G
1. 53 33 84 72 71 84 89 87 110 96 137 84 122 87 152 115 132 113
2. 15 29 25 22 27 40 43 25 48 36 51 33 42 44 47 42 58 44
3. 41 36 32 35 39 45 46 42 75 47 64 43 59 44 56 48 59 40
4. 87 82 62 45 82 93 84 62 68 81 75 66 49 55 43 26 38 46
5. 9 23 102 96 68 104 107 135 97 117 116 129 126 116 120 109 99 86
6. 18 22 22 16 16 13 21 24 27 20 23 23 31 20 30 19 19 16
7. 16 30 74 91 130 120 108 112 121 98 96 98 131 109 134 89 126 82
8. 73 58 76 46 69 65 72 63 70 52 71 60 75 69 96 52 83 58
9. 77 60 68 64 58 48 100 77 91 73 100 80 271 268 184 140 166 146
10. 52 43 83 71 79 91 102 87 90 109 75 79 91 86 76 49 62 36
11. 256 187 122 95 143 120 164 112 207 159 235 173 234 186 207 140 151 119
12. 147 115 61 52 58 38 55 44 55 48 32 28 40 33 28 36 29 20
13. 129 89 86 40 71 59 70 61 78 57 80 62 81 70 91 54 94 61
14. 181 121 77 70 94 52 49 39 48 35 40 30 35 18 23 20 15 13
15. 78 53 44 26 47 22 48 25 44 33 46 42 54 29 60 26 41 36
16. 91 71 40 19 29 19 47 22 28 34 64 43 41 16 27 22 31 17
17. 158 138 55 27 53 27 44 29 35 25 38 21 33 24 21 15 14 10
18. 00 00 00 00 00 00 00 00 00 00 00 00 53 11 84 15 117 16
19. 00 40 00 16 00 36 00 28 00 23 00 33 00 47 00 39 00 33
20. 00 00 43 33 38 46 48 36 49 36 59 35 60 37 59 52 54 36
Total 1481 1230 1156 936 1172 1122 1297 1110 1341 1179 1402 1162 1628 1369 1538 1108 1388 1028
Cont.
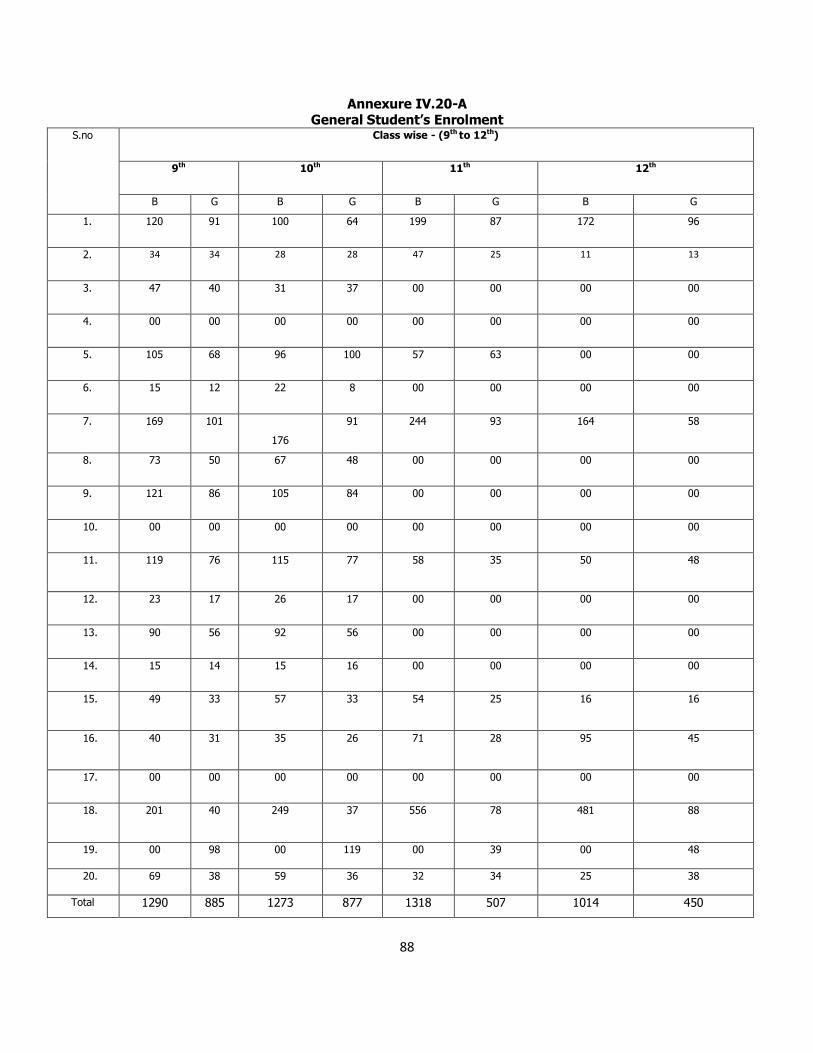
88
Annexure IV.20-A General Student’s Enrolment
S.no Class wise - (9th to 12th)
9th 10th 11th 12th
B G B G B G B G
1. 120 91 100 64 199 87 172 96
2. 34 34 28 28 47 25 11 13
3. 47 40 31 37 00 00 00 00
4. 00 00 00 00 00 00 00 00
5. 105 68 96 100 57 63 00 00
6. 15 12 22 8 00 00 00 00
7. 169 101
176
91 244 93 164 58
8. 73 50 67 48 00 00 00 00
9. 121 86 105 84 00 00 00 00
10. 00 00 00 00 00 00 00 00
11. 119 76 115
77 58 35 50 48
12. 23 17 26 17 00 00 00 00
13. 90 56 92 56 00 00 00 00
14. 15 14 15 16 00 00 00 00
15. 49 33 57
33 54 25 16 16
16. 40 31 35
26 71 28 95 45
17. 00 00 00 00 00 00 00 00
18. 201 40 249
37 556 78 481 88
19. 00 98 00
119 00 39 00 48
20. 69 38 59
36 32 34 25 38
Total 1290 885 1273 877 1318 507 1014 450
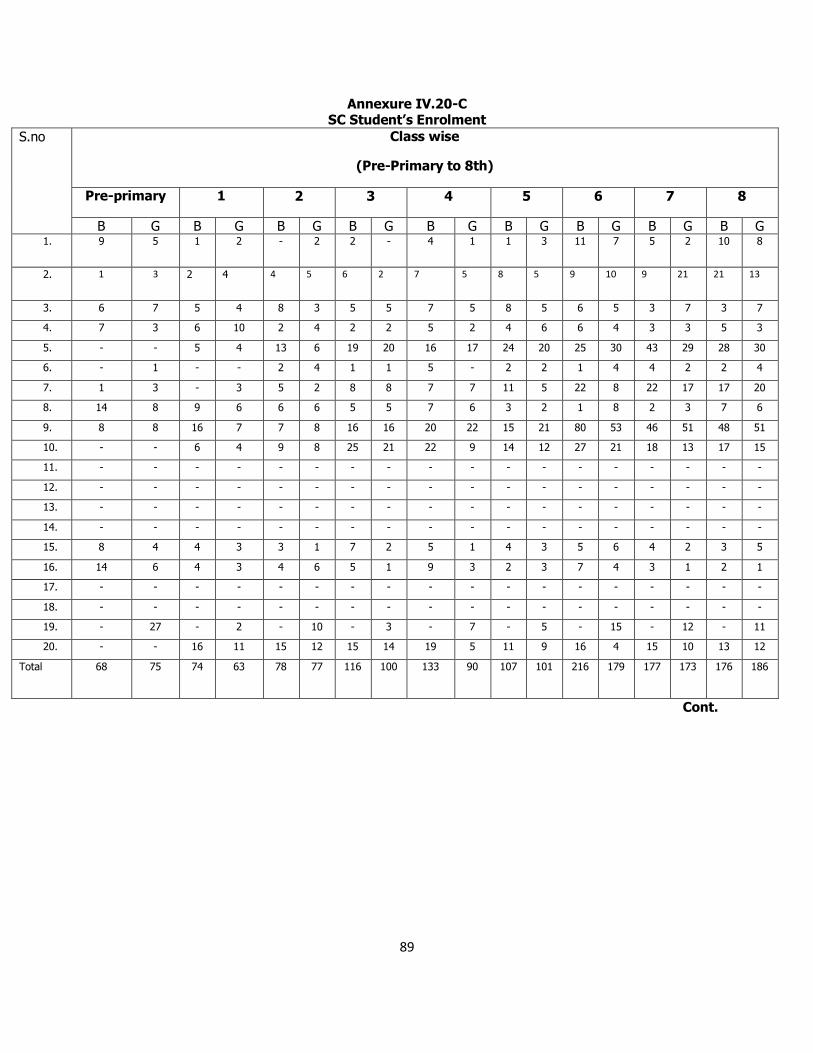
89
Annexure IV.20-C SC Student’s Enrolment
S.no Class wise
(Pre-Primary to 8th)
Pre-primary 1 2 3 4 5 6 7 8
B G B G B G B G B G B G B G B G B G 1. 9 5 1 2 - 2 2 - 4 1 1 3 11 7 5 2 10 8
2. 1 3 2 4 4 5 6 2 7 5 8 5 9 10 9 21 21 13
3. 6 7 5 4 8 3 5 5 7 5 8 5 6 5 3 7 3 7
4. 7 3 6 10 2 4 2 2 5 2 4 6 6 4 3 3 5 3
5. - - 5 4 13 6 19 20 16 17 24 20 25 30 43 29 28 30
6. - 1 - - 2 4 1 1 5 - 2 2 1 4 4 2 2 4
7. 1 3 - 3 5 2 8 8 7 7 11 5 22 8 22 17 17 20
8. 14 8 9 6 6 6 5 5 7 6 3 2 1 8 2 3 7 6
9. 8 8 16 7 7 8 16 16 20 22 15 21 80 53 46 51 48 51
10. - - 6 4 9 8 25 21 22 9 14 12 27 21 18 13 17 15
11. - - - - - - - - - - - - - - - - - -
12. - - - - - - - - - - - - - - - - - -
13. - - - - - - - - - - - - - - - - - -
14. - - - - - - - - - - - - - - - - - -
15. 8 4 4 3 3 1 7 2 5 1 4 3 5 6 4 2 3 5
16. 14 6 4 3 4 6 5 1 9 3 2 3 7 4 3 1 2 1
17. - - - - - - - - - - - - - - - - - -
18. - - - - - - - - - - - - - - - - - -
19. - 27 - 2 - 10 - 3 - 7 - 5 - 15 - 12 - 11
20. - - 16 11 15 12 15 14 19 5 11 9 16 4 15 10 13 12
Total 68 75 74 63 78 77 116 100 133 90 107 101 216 179 177 173 176 186
Cont.
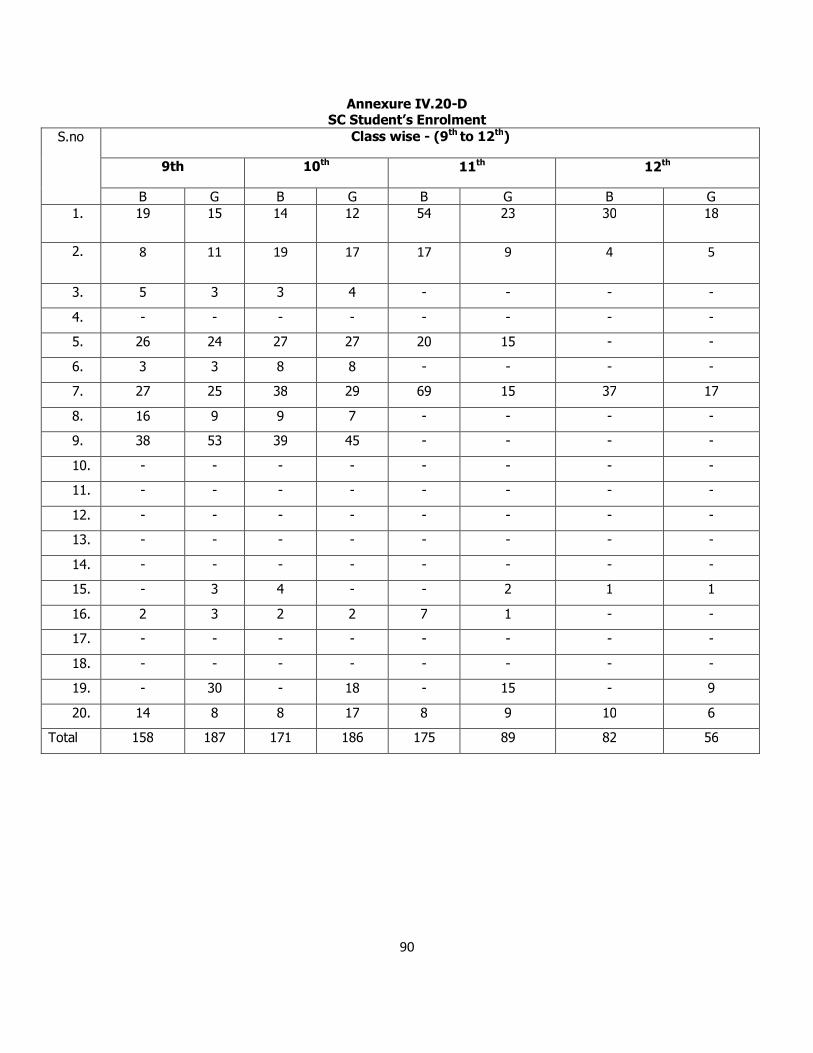
90
Annexure IV.20-D SC Student’s Enrolment
S.no Class wise - (9th to 12th)
9th 10th 11th 12th
B G B G B G B G 1. 19 15 14 12 54 23 30 18
2. 8 11 19 17 17 9 4 5
3. 5 3 3 4 - - - -
4. - - - - - - - -
5. 26 24 27 27 20 15 - -
6. 3 3 8 8 - - - -
7. 27 25 38 29 69 15 37 17
8. 16 9 9 7 - - - -
9. 38 53 39 45 - - - -
10. - - - - - - - -
11. - - - - - - - -
12. - - - - - - - -
13. - - - - - - - -
14. - - - - - - - -
15. - 3 4 - - 2 1 1
16. 2 3 2 2 7 1 - -
17. - - - - - - - -
18. - - - - - - - -
19. - 30 - 18 - 15 - 9
20. 14 8 8 17 8 9 10 6
Total 158 187 171 186 175 89 82 56
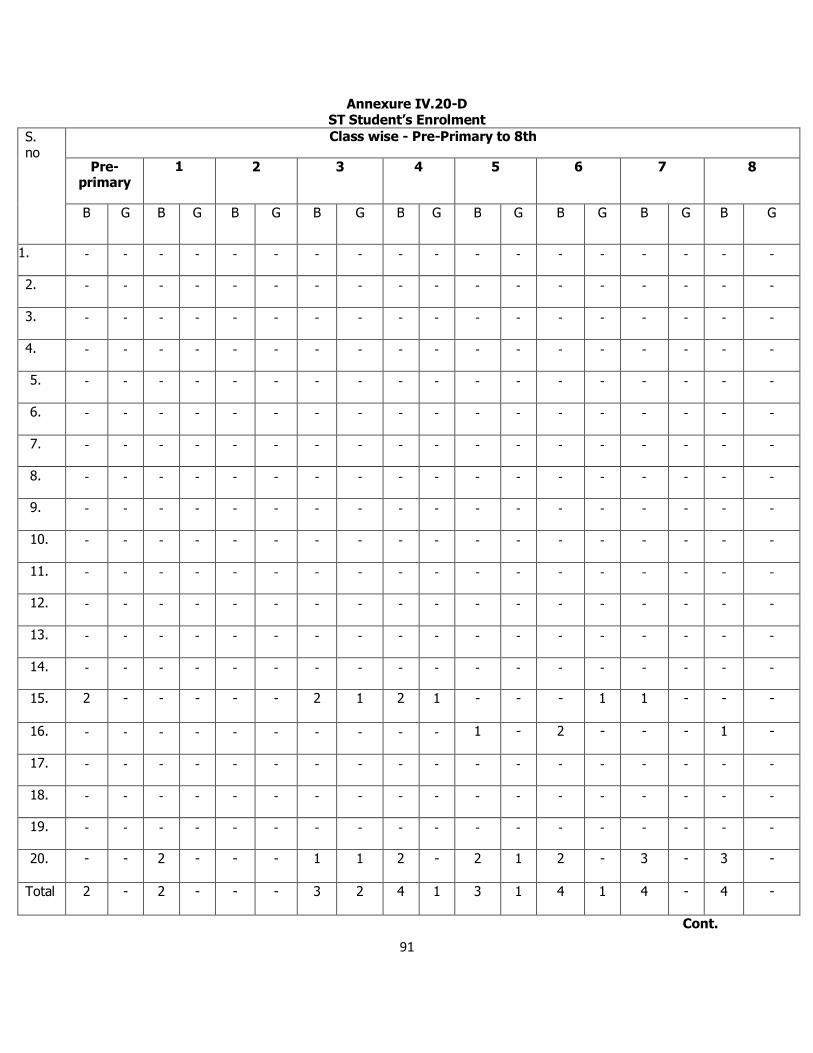
91
Annexure IV.20-D ST Student’s Enrolment
S. no
Class wise - Pre-Primary to 8th
Pre-primary
1 2 3 4 5 6 7 8
B G B G B G B G B G B G B G B G B G
1. - - - - - - - - - - - - - - - - - -
2. - - - - - - - - - - - - - - - - - -
3. - - - - - - - - - - - - - - - - - -
4. - - - - - - - - - - - - - - - - - -
5. - - - - - - - - - - - - - - - - - -
6. - - - - - - - - - - - - - - - - - -
7. - - - - - - - - - - - - - - - - - -
8. - - - - - - - - - - - - - - - - - -
9. - - - - - - - - - - - - - - - - - -
10. - - - - - - - - - - - - - - - - - -
11. - - - - - - - - - - - - - - - - - -
12. - - - - - - - - - - - - - - - - - -
13. - - - - - - - - - - - - - - - - - -
14. - - - - - - - - - - - - - - - - - -
15. 2 - - - - - 2 1
2 1 - - - 1 1 - - -
16. - - - - - - - - - - 1 - 2 - - - 1 -
17. - - - - - - - - - - - - - - - - - -
18. - - - - - - - - - - - - - - - - - -
19. - - - - - - - - - - - - - - - - - -
20. - - 2 - -
- 1 1 2 - 2 1 2 - 3 - 3 -
Total 2 - 2 - -
- 3 2 4 1 3 1 4 1 4 - 4 -
Cont.
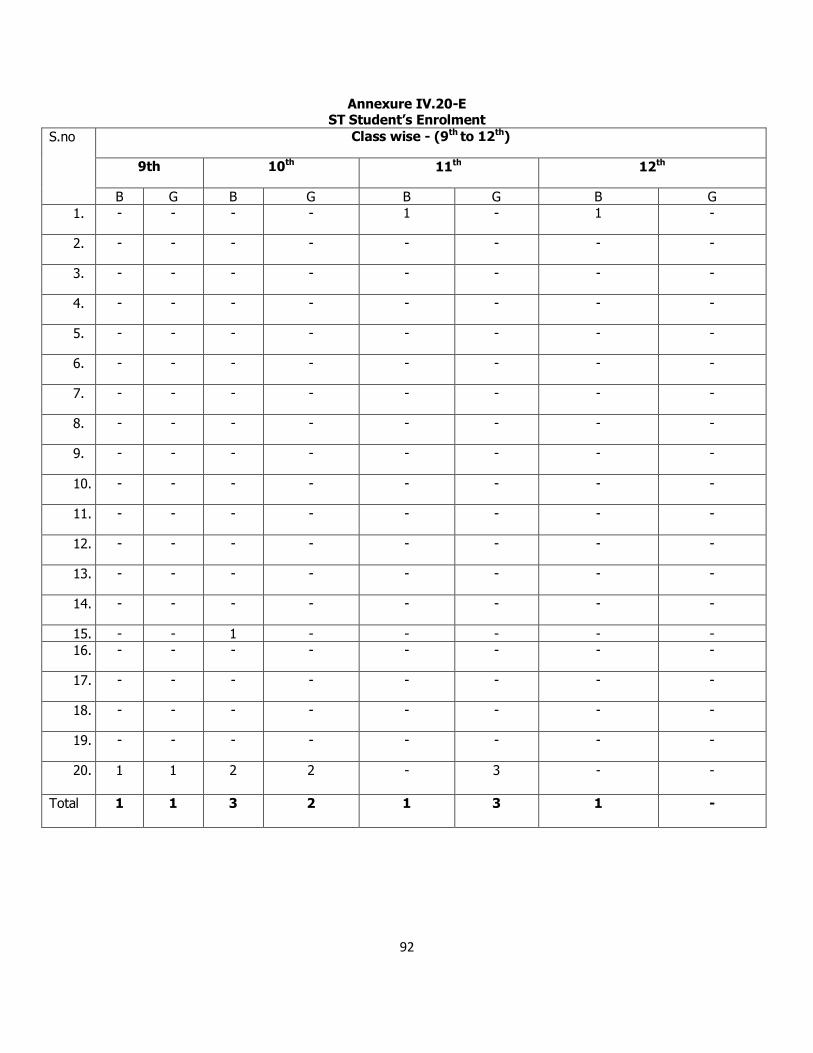
92
Annexure IV.20-E ST Student’s Enrolment
S.no Class wise - (9th to 12th)
9th 10th 11th 12th
B G B G B G B G 1. - - - - 1 - 1 -
2. - - - - - - - -
3. - - - - - - - -
4. - - - - - - - -
5. - - - - - - - -
6. - - - - - - - -
7. - - - - - - - -
8. - - - - - - - -
9. - - - - - - - -
10. - - - - - - - -
11. - - - - - - - -
12. - - - - - - - -
13. - - - - - - - -
14. - - - - - - - -
15. - - 1 - - - - - 16. - - - - - - - -
17. - - - - - - - -
18. - - - - - - - -
19. - - - - - - - -
20. 1 1 2
2 - 3 - -
Total 1 1 3 2 1
3 1 -
93
Annexure IV.20-F OBC Student’s Enrolment
S.no Class wise - Pre-Primary to 8th
Pre-primary
1 2 3 4 5 6 7 8
B G B G B G B G B G B G B G B G B G 1. - - - - - - - - - - - - - - 1 - 1 1
2. - - - - - - - - - - - - 1 1 2 - 1 1
3. - - - - 1 2 - - 1 2 1 - 1 - 3 2 1 3
4. - - - 1 - - - - - - 2 - 1 - 1 - 1 -
5. 1 - 1 - 4 - - - - - 2 1 7 10 9 4 7 19
6. - - - 1 - 1 - - - - - - - - 1 - 1 -
7. - 2 - - - - - - - - - - 1 6 3 2 5 11
8. - - - - - 4 - - - 2 1 1 - - - 4 - -
9. 1 1 3 6 1 - 4 2 4 3 3 - 9 13 17 21 10 24
10. - - - - - - - - - - - - - - -- - - 2
11. - - - - - - - - - - - - - - - - - -
12. - - - - - - - - - - - - - - - - - -
13. - - - - - - - - - - - - - - - - - -
14. - - - - - - - - - - - - - - - - - -
15. 7 - 3 - 5 1 3 3 7 2 7 5 4 2 7 2 2 2
16. 5 3 2 - 2 2 - - 4 3 3 4 5 1 4 7 - 1
17. - - - - - - - - - - - - - - - - - -
18. - - - - - - - - - - - - - - - - - -
19. - - - 2 - 4 - 8 - 7 - 2 - 7 - 10 - 28
20. - - 2 5 7 2 1 3 4 3 3 2 -- 1 1 1 3 -
Total 14 6 11 15 20 16 8 16 20 22 22 15 29 41 49 53 32 92
94
Annexure IV.20-G OBC Student’s Enrolment
S.no Class wise - (9th to 12th)
9th 10th 11th 12th
B G B G B G B G
1. - - 1 2 - - 2 -
2. - - - - - - - -
3. 1 1 - - - - - -
4. - - -
5. 12 5 7 5 - - - -
6. - - - - - - - -
7. 3 5 8 5 1 1 1 1
8. 2 1 1 1 - - - -
9. 15 26 10 18 - - - -
10. - - - - - - - -
11. - - - - - - - -
12. - - - - - - - -
13. - - - - - - - -
14. - - - - - - -
15. 2 - 7 1 - 2 - 2
16. 1 2 1 3 5 - 3 -
17. - - - - - - - -
18. - - - - - - - -
19. - 25 - 13 - 21 - 12
20. 3 2 6 3 2 3 3 4
Total 39 67 41 51 8 27 9 19
95
Annexure IV.20-H Total Enrolment of Students
S.No
Class wise (Pre-Primary to 8th)
Pre-
primary
1 2 3 4 5 6 7 8
B G B G B G B G B G B G B G B G B G
1. 62 38 85 74 71 86 91 87 114 97 138 87 134 94 158 117 143 122
2. 16 32 27 26 31 45 49 27 55 41 59 38 52 55 58 63 80 58
3. 47 43 37 39 48 50 51 47 83 54 73 49 66 49 62 57 63 50
4. 94 85 68 56 84 97 86 64 73 83 81 72 56 59 47 29 44 49
5. 10 23 108 100 85 110 126 155 113 134 142 150 158 156 172 142 134 135
6. 18 23 22 17 18 18 22 25 32 20 25 25 32 24 35 21 22 20
7. 17 35 74 94 135 122 116 120 128 105 107 103 154 123 159 108 148 113
8. 87 66 85 52 75 75 77 68 77 60 75 63 76 77 98 59 90 64
9. 86 69 87 77 66 56 120 95 115 98 118 101 360 334 247 212 224 221
10. 52 43 89 75 88 99 127 108 112 118 89 91 118 107 94 62 79 53
11. 256 187 122 95 143 120 164 112 207 159 235 173 216 197 207 140 151 119
12. 147 115 61 52 58 38 55 44 55 48 32 28 40 33 28 36 29 20
13. 129 89 86 40 71 59 70 61 78 57 80 62 81 70 91 54 94 61
14. 181 121 77 70 94 52 49 39 48 35 40 30 35 18 23 20 15 13
15. 95 57 51 29 55 24 60 31 58 37 57 50 63 38 72 30 46 43
16. 110 80 46 22 35 27 52 23 41 40 70 50 55 21 35 30 33 19
17. 158 138 55 27 53 27 44 29 35 25 38 21 33 24 21 15 14 10
18. 00 00 00 00 00 00 00 00 00 00 00 00 53 11 84 15 117 16
19. 00 67 00 20 00 50 00 39 00 37 00 40 00 69 00 61 00 72
20. 00 00 63 49 60 60 65 54 74 44 75 47 78 42 78 51 73 48
Total 1565 1311 1243 1014 1270 1215 1424 1228 1498 1292 1534 1280 1860 1601 1769 1322 1599 1306
Cont.
96
Annexure IV.20-I Total Enrolment
S.no Class wise - (9th to 12th)
9th 10th 11th 12th
B G B G B G B G
1. 139 106 115 78 254 110 205 114
2. 42 45 47 45 64 34 15 18
3. 53 44 34 41 00 00 00 00
4. 00 00 00 00 00 00 00 00
5. 143 97 130 132 77 78 00 00
6. 18 15 30 16 00 00 00 00
7. 199 131 222 125 314 109 202 76
8. 91 60 77 56 00 00 00 00
9. 174 165 154 147 00 00 00 00
10. 00 00 00 00 00 00 00 00
11. 119 76 115 77 58 35 50 48
12. 23 17 26 17 00 00 00 00
13. 90 56 92 56 00 00 00 00
14. 15 14 15 16 00 00 00 00
15. 51 36 69 34 54 29 17 19
16. 43 36 38 31 83 29 98 45
17. 00 00 00 00 00 00 00 00
18. 201 40 249 37 556 78 481 88
19. 00 153 00 150 00 75 00 69
20. 87 49 75 58 42 49 38 48
Total 1488 1140 1488 1116 1502 626 1106 525
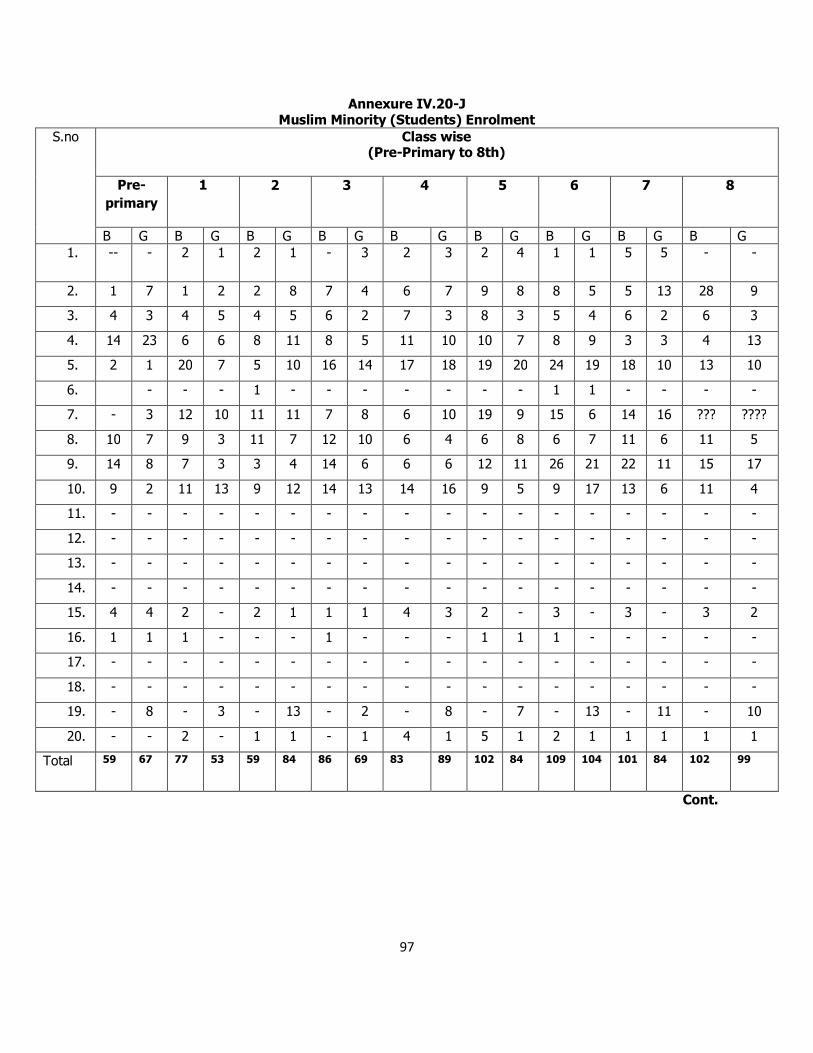
97
Annexure IV.20-J Muslim Minority (Students) Enrolment
S.no Class wise (Pre-Primary to 8th)
Pre-primary
1 2 3 4 5 6 7 8
B G B G B G B G B G B G B G B G B G 1. -- - 2 1 2 1 - 3 2 3 2 4 1 1 5 5 - -
2. 1 7 1 2 2 8 7 4 6 7 9 8 8 5 5 13 28 9
3. 4 3 4 5 4 5 6 2 7 3 8 3 5 4 6 2 6 3
4. 14 23 6 6 8 11 8 5 11 10 10 7 8 9 3 3 4 13
5. 2 1 20 7 5 10 16 14 17 18 19 20 24 19 18 10 13 10
6. - - - 1 - - - - - - - 1 1 - - - -
7. - 3 12 10 11 11 7 8 6 10 19 9 15 6 14 16 ??? ????
8. 10 7 9 3 11 7 12 10 6 4 6 8 6 7 11 6 11 5
9. 14 8 7 3 3 4 14 6 6 6 12 11 26 21 22 11 15 17
10. 9 2 11 13 9 12 14 13 14 16 9 5 9 17 13 6 11 4
11. - - - - - - - - - - - - - - - - - -
12. - - - - - - - - - - - - - - - - - -
13. - - - - - - - - - - - - - - - - - -
14. - - - - - - - - - - - - - - - - - -
15. 4 4 2 - 2 1 1 1 4 3 2 - 3 - 3 - 3 2
16. 1 1 1 - - - 1 - - - 1 1 1 - - - - -
17. - - - - - - - - - - - - - - - - - -
18. - - - - - - - - - - - - - - - - - -
19. - 8 - 3 - 13 - 2 - 8 - 7 - 13 - 11 - 10
20. - - 2 - 1 1 - 1 4 1 5 1 2 1 1 1 1 1
Total 59 67 77 53 59 84 86 69 83 89 102 84 109 104 101 84 102 99
Cont.
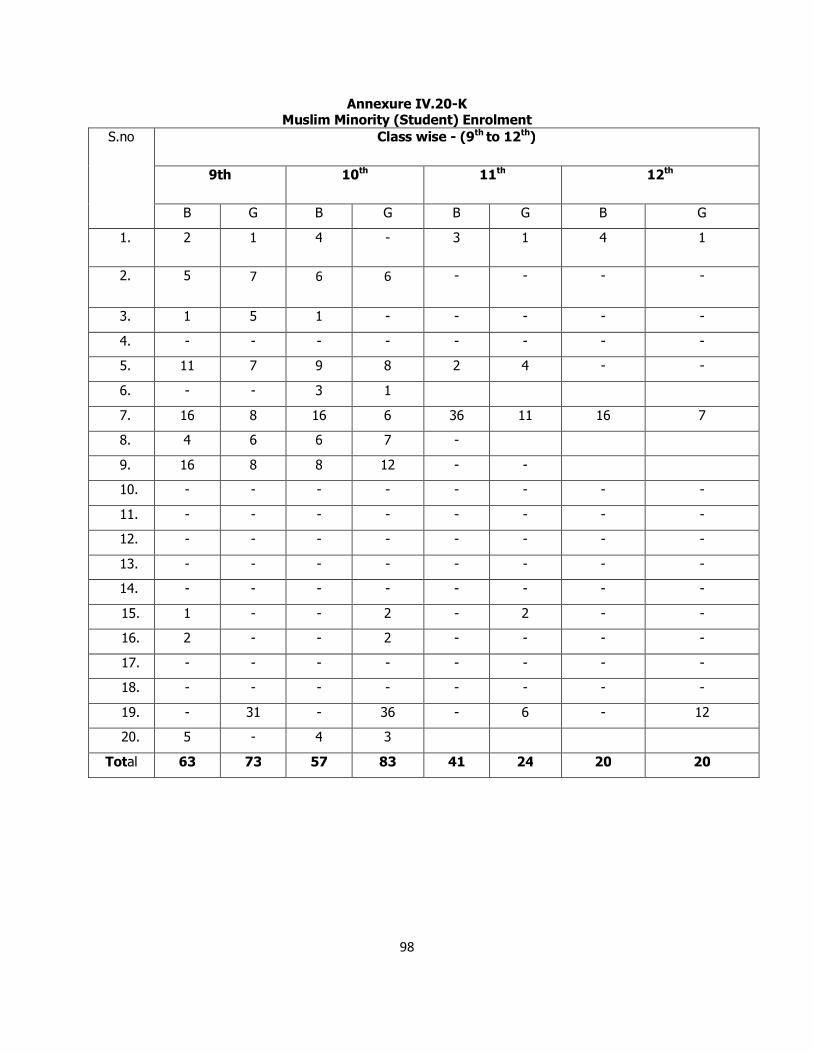
98
Annexure IV.20-K Muslim Minority (Student) Enrolment
S.no Class wise - (9th to 12th)
9th 10th 11th 12th
B G B G B G B G
1. 2 1 4 - 3 1 4 1
2. 5 7 6 6 - - - -
3. 1 5 1 - - - - -
4. - - - - - - - -
5. 11 7 9 8 2 4 - -
6. - - 3 1
7. 16 8 16 6 36 11 16 7
8. 4 6 6 7 -
9. 16 8 8 12 - -
10. - - - - - - - -
11. - - - - - - - -
12. - - - - - - - -
13. - - - - - - - -
14. - - - - - - - -
15. 1 - - 2 - 2 - -
16. 2 - - 2 - - - -
17. - - - - - - - -
18. - - - - - - - -
19. - 31 - 36 - 6 - 12
20. 5 - 4 3
Total 63 73 57 83 41 24 20 20
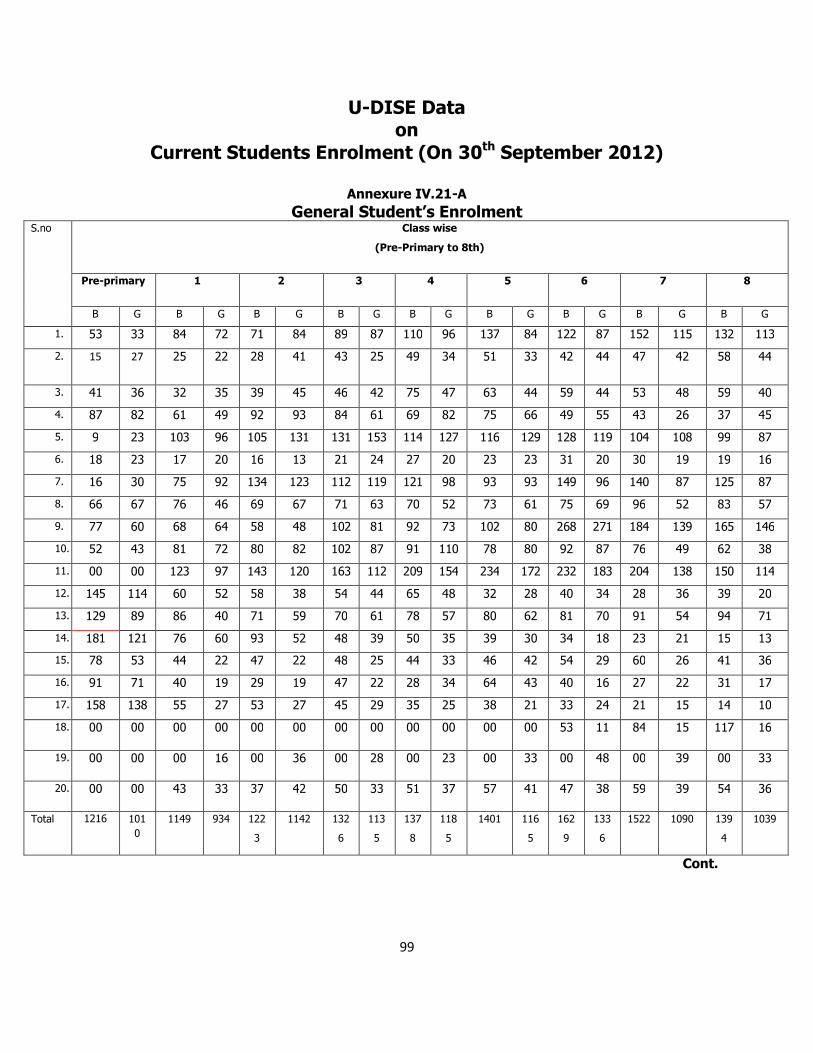
99
U-DISE Data on
Current Students Enrolment (On 30th September 2012)
Annexure IV.21-A General Student’s Enrolment
S.no Class wise
(Pre-Primary to 8th)
Pre-primary 1 2 3 4 5 6 7 8
B G B G B G B G B G B G B G B G B G
1. 53 33 84 72 71 84 89 87 110 96 137 84 122 87 152 115 132 113
2. 15 27 25 22 28 41 43 25 49 34 51 33 42 44 47 42 58 44
3. 41 36 32 35 39 45 46 42 75 47 63 44 59 44 53 48 59 40
4. 87 82 61 49 92 93 84 61 69 82 75 66 49 55 43 26 37 45
5. 9 23 103 96 105 131 131 153 114 127 116 129 128 119 104 108 99 87
6. 18 23 17 20 16 13 21 24 27 20 23 23 31 20 30 19 19 16
7. 16 30 75 92 134 123 112 119 121 98 93 93 149 96 140 87 125 87
8. 66 67 76 46 69 67 71 63 70 52 73 61 75 69 96 52 83 57
9. 77 60 68 64 58 48 102 81 92 73 102 80 268 271 184 139 165 146
10. 52 43 81 72 80 82 102 87 91 110 78 80 92 87 76 49 62 38
11. 00 00 123 97 143 120 163 112 209 154 234 172 232 183 204 138 150 114
12. 145 114 60 52 58 38 54 44 65 48 32 28 40 34 28 36 39 20
13. 129 89 86 40 71 59 70 61 78 57 80 62 81 70 91 54 94 71
14. 181 121 76 60 93 52 48 39 50 35 39 30 34 18 23 21 15 13
15. 78 53 44 22 47 22 48 25 44 33 46 42 54 29 60 26 41 36
16. 91 71 40 19 29 19 47 22 28 34 64 43 40 16 27 22 31 17
17. 158 138 55 27 53 27 45 29 35 25 38 21 33 24 21 15 14 10
18. 00 00 00 00 00 00 00 00 00 00 00 00 53 11 84 15 117 16
19. 00 00 00 16 00 36 00 28 00 23 00 33 00 48 00 39 00 33
20. 00 00 43 33 37 42 50 33 51 37 57 41 47 38 59 39 54 36
Total 1216 1010
1149 934 122
3
1142 132
6
113
5
137
8
118
5
1401 116
5
162
9
133
6
1522 1090 139
4
1039
Cont.
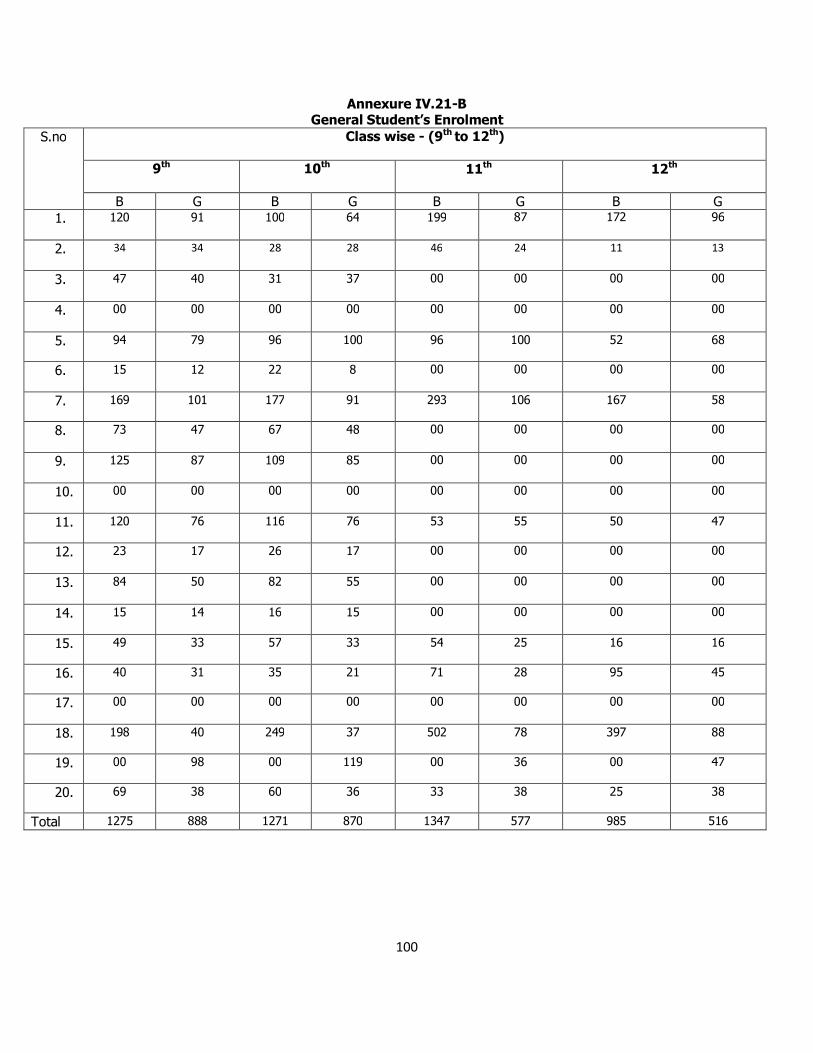
100
Annexure IV.21-B General Student’s Enrolment
S.no Class wise - (9th to 12th)
9th 10th 11th 12th
B G B G B G B G 1. 120 91 100 64 199 87 172 96
2. 34 34 28 28 46 24 11 13
3. 47 40 31 37 00 00 00 00
4. 00 00 00 00 00 00 00 00
5. 94 79
96 100 96 100 52 68
6. 15 12 22 8 00 00 00 00
7. 169 101
177 91 293 106 167 58
8. 73 47 67 48 00 00 00 00
9. 125 87 109 85 00 00 00 00
10. 00 00 00 00 00 00 00 00
11. 120 76
116 76 53 55 50 47
12. 23 17 26 17 00 00 00 00
13. 84 50 82 55 00 00 00 00
14. 15 14 16 15 00 00 00 00
15. 49 33
57 33 54 25 16 16
16. 40 31
35 21 71 28 95 45
17. 00 00 00 00 00 00 00 00
18. 198 40
249 37 502 78 397 88
19. 00 98
00 119 00 36 00 47
20. 69 38
60 36 33 38 25 38
Total 1275 888 1271 870 1347 577 985 516
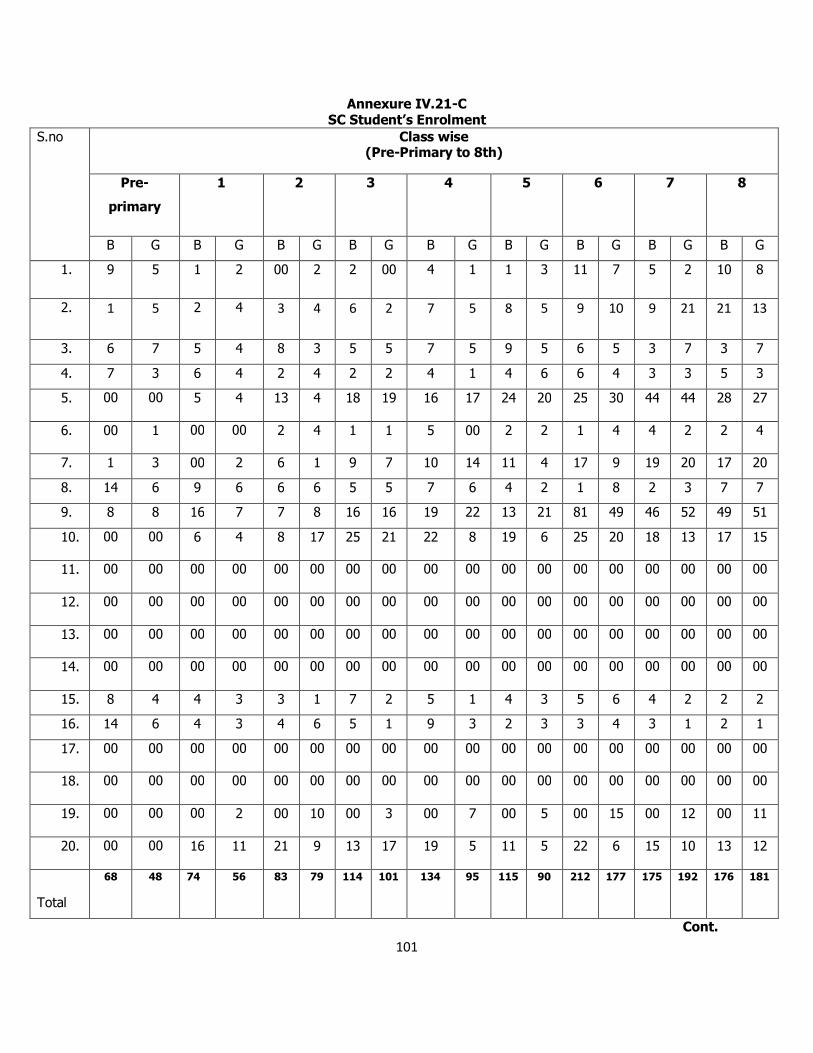
101
Annexure IV.21-C SC Student’s Enrolment
S.no Class wise (Pre-Primary to 8th)
Pre-
primary
1 2 3 4 5 6 7 8
B G B G B G B G B G B G B G B G B G
1. 9 5 1 2 00 2 2 00 4 1 1 3 11 7 5 2 10 8
2. 1 5 2 4 3 4 6 2 7 5 8 5 9 10 9 21 21 13
3. 6 7 5 4 8 3 5 5 7 5 9 5 6 5 3 7 3 7
4. 7 3 6 4 2 4 2 2 4 1 4 6 6 4 3 3 5 3
5. 00 00 5 4 13 4 18 19 16 17 24 20 25 30 44 44 28 27
6. 00 1 00 00 2 4 1 1 5 00 2 2 1 4 4 2 2 4
7. 1 3 00 2 6 1 9 7 10 14 11 4 17 9 19 20 17 20
8. 14 6 9 6 6 6 5 5 7 6 4 2 1 8 2 3 7 7
9. 8 8 16 7 7 8 16 16 19 22 13 21 81 49 46 52 49 51
10. 00 00 6 4 8 17 25 21 22 8 19 6 25 20 18 13 17 15
11. 00 00 00 00 00 00 00 00 00 00 00 00 00 00 00 00 00 00
12. 00 00 00 00 00 00 00 00 00 00 00 00 00 00 00 00 00 00
13. 00 00 00 00 00 00 00 00 00 00 00 00 00 00 00 00 00 00
14. 00 00 00 00 00 00 00 00 00 00 00 00 00 00 00 00 00 00
15. 8 4 4 3 3 1 7 2 5 1 4 3 5 6 4 2 2 2
16. 14 6 4 3 4 6 5 1 9 3 2 3 3 4 3 1 2 1
17. 00 00 00 00 00 00 00 00 00 00 00 00 00 00 00 00 00 00
18. 00 00 00 00 00 00 00 00 00 00 00 00 00 00 00 00 00 00
19. 00 00 00 2 00 10 00 3 00 7 00 5 00 15 00 12 00 11
20. 00 00 16 11 21 9 13 17 19 5 11 5 22 6 15 10 13 12
Total
68 48 74 56 83 79 114 101 134 95 115 90 212 177 175 192 176 181
Cont.
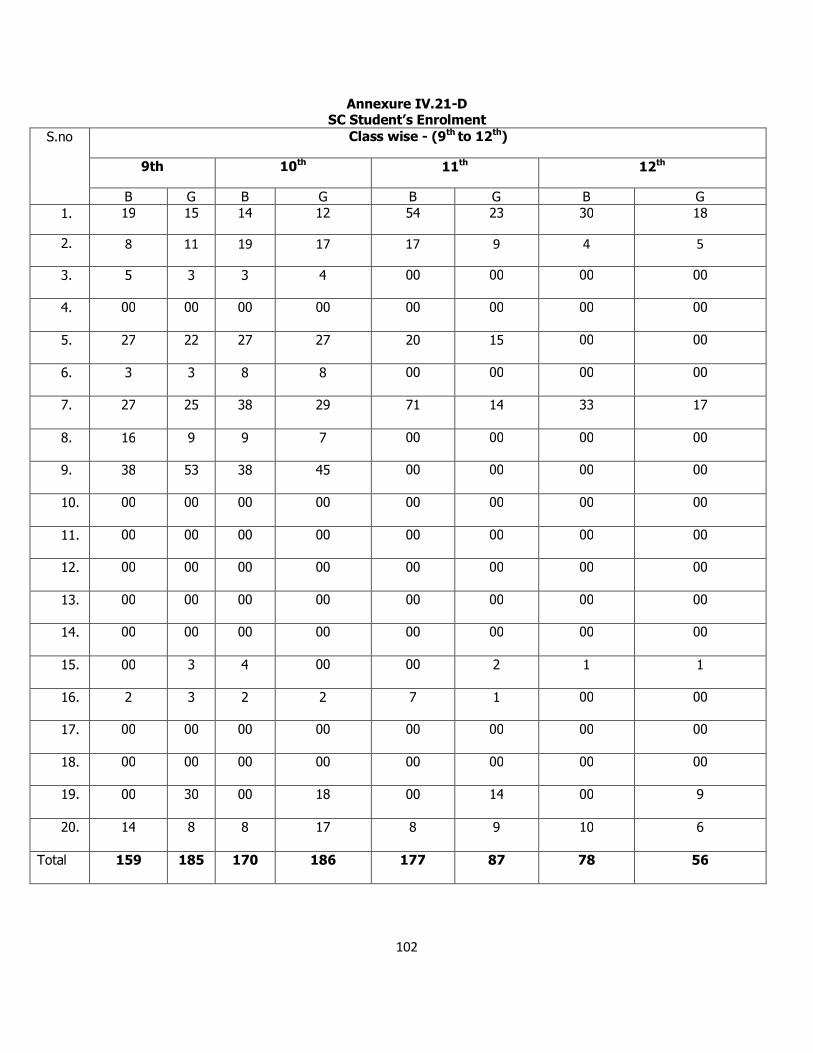
102
Annexure IV.21-D SC Student’s Enrolment
S.no Class wise - (9th to 12th)
9th 10th 11th 12th
B G B G B G B G 1. 19 15 14 12 54 23 30 18
2. 8 11 19 17 17 9 4 5
3. 5 3 3 4 00 00 00 00
4. 00 00 00 00 00 00 00 00
5. 27 22 27 27 20 15 00 00
6. 3 3 8 8 00 00 00 00
7. 27
25 38 29 71 14 33 17
8. 16 9 9 7 00 00 00 00
9. 38 53 38 45 00 00 00 00
10. 00 00 00 00 00 00 00 00
11. 00 00 00 00 00 00 00 00
12. 00 00 00 00 00 00 00 00
13. 00 00 00 00 00 00 00 00
14. 00 00 00 00 00 00 00 00
15. 00 3 4 00 00 2 1 1
16. 2 3 2 2 7 1 00 00
17. 00 00 00 00 00 00 00 00
18. 00 00 00 00 00 00 00 00
19. 00
30 00 18 00 14 00 9
20. 14
8 8 17 8 9 10 6
Total 159
185 170 186 177 87 78 56
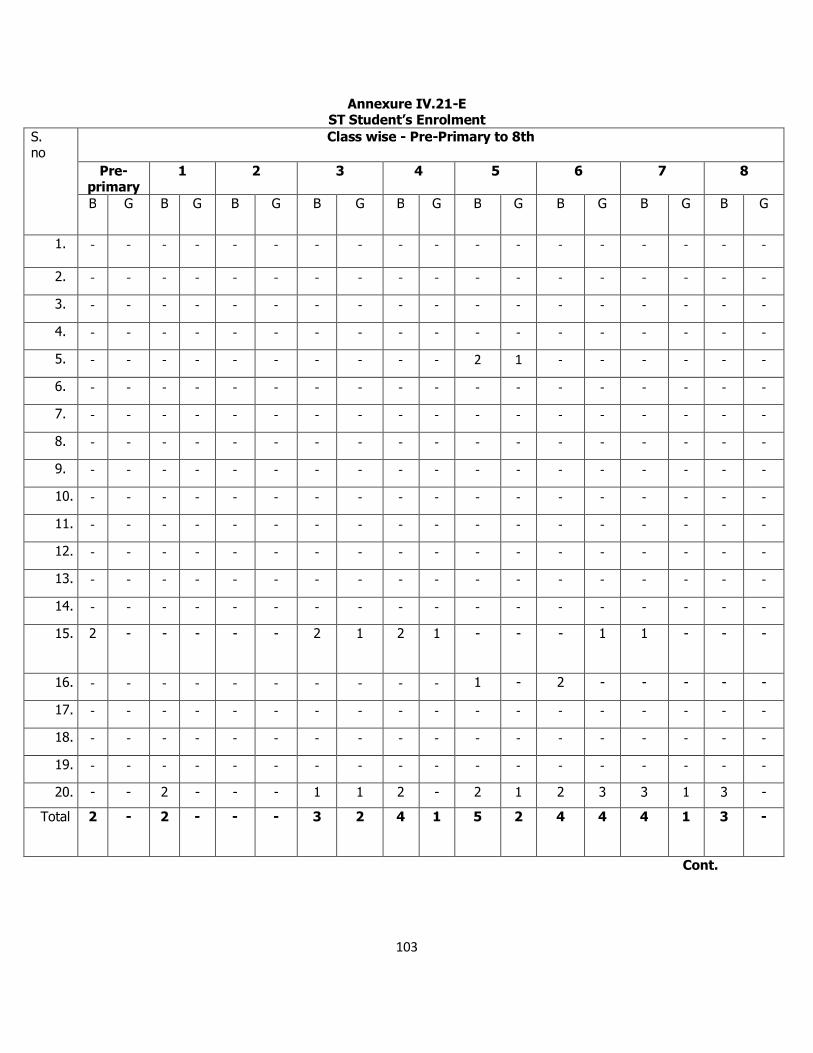
103
Annexure IV.21-E ST Student’s Enrolment
S. no
Class wise - Pre-Primary to 8th
Pre-primary
1 2 3 4 5 6 7 8
B G B G B G B G B G B G B G B G B G
1. - - - - - - - - - - - - - - - - - -
2. - - - - - - - - - - - - - - - - - -
3. - - - - - - - - - - - - - - - - - -
4. - - - - - - - - - - - - - - - - - -
5. - - - - - - - - - - 2 1 - - - - - -
6. - - - - - - - - - - - - - - - - - -
7. - - - - - - - - - - - - - - - - - -
8. - - - - - - - - - - - - - - - - - -
9. - - - - - - - - - - - - - - - - - -
10. - - - - - - - - - - - - - - - - - -
11. - - - - - - - - - - - - - - - - - -
12. - - - - - - - - - - - - - - - - - -
13. - - - - - - - - - - - - - - - - - -
14. - - - - - - - - - - - - - - - - - -
15. 2 - - - - - 2 1 2 1 - - - 1 1 - -
-
16. - - - - - - - - - - 1 - 2 - - - - -
17. - - - - - - - - - - - - - - - - - -
18. - - - - - - - - - - - - - - - - - -
19. - - - - - - - - - - - - - - - - - -
20. - - 2 - - - 1 1 2 - 2 1 2 3 3 1 3 -
Total 2 - 2 - - - 3 2 4 1 5 2 4 4 4 1 3 -
Cont.
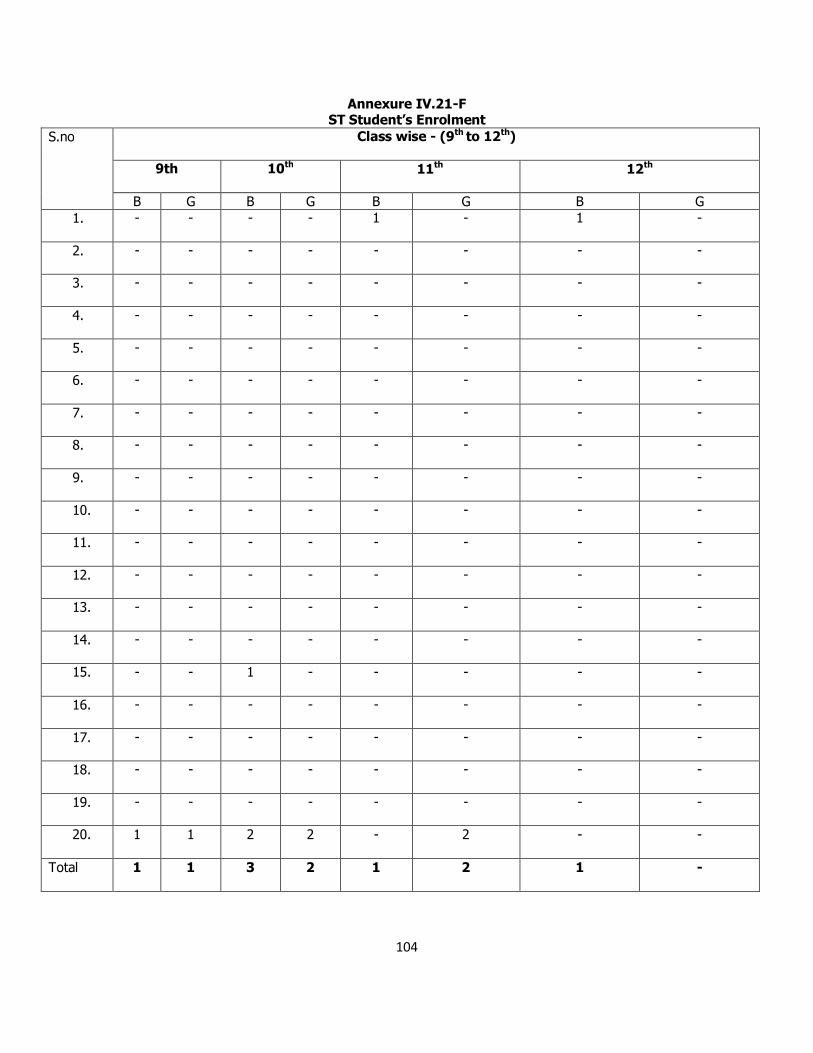
104
Annexure IV.21-F ST Student’s Enrolment
S.no Class wise - (9th to 12th)
9th 10th 11th 12th
B G B G B G B G 1. - - - - 1 - 1 -
2. - - - - - - - -
3. - - - - - - - -
4. - - - - - - - -
5. - - - - - - - -
6. - - - - - - - -
7. - - - - - - - -
8. - - - - - - - -
9. - - - - - - - -
10. - - - - - - - -
11. - - - - - - - -
12. - - - - - - - -
13. - - - - - - - -
14. - - - - - - - -
15. - - 1 -
- - - -
16. - - - - - - - -
17. - - - - - - - -
18. - - - - - - - -
19. - - - - - - - -
20. 1 1 2
2 - 2 - -
Total 1
1 3 2 1 2 1 -
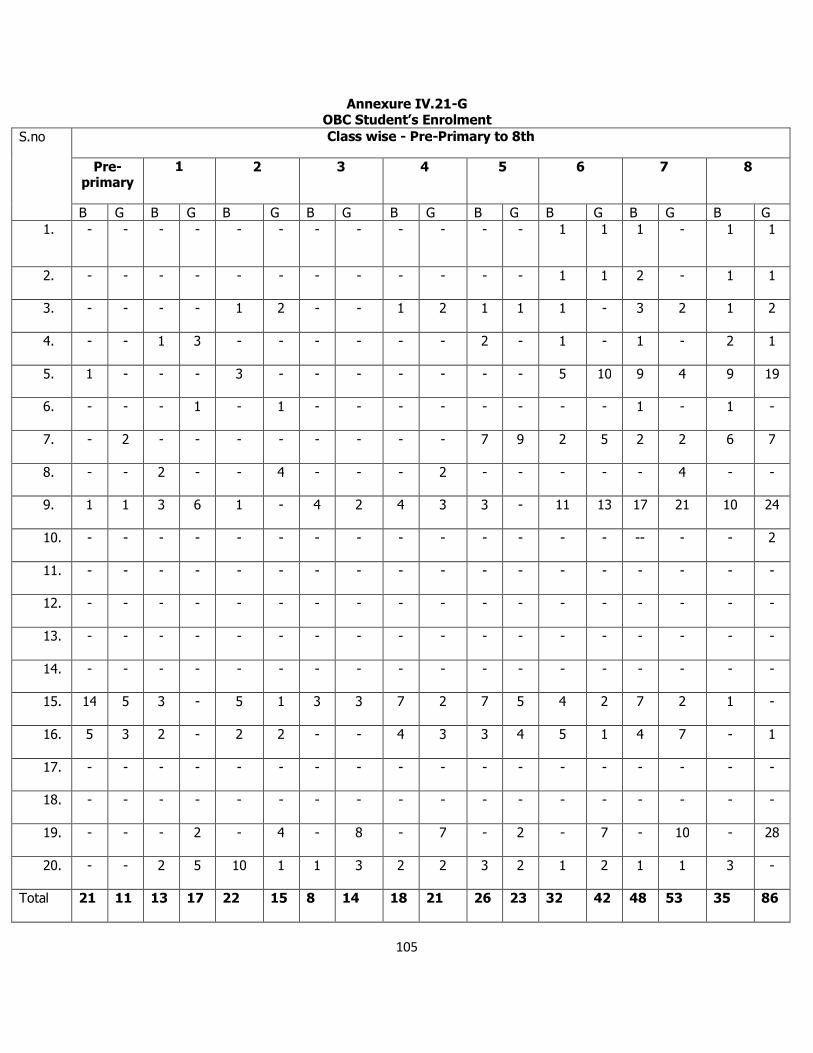
105
Annexure IV.21-G OBC Student’s Enrolment
S.no Class wise - Pre-Primary to 8th
Pre-primary
1 2 3 4 5 6 7 8
B G B G B G B G B G B G B G B G B G 1. - - - - - - - - - - - - 1 1 1 - 1 1
2. - - - - - - - - - - - - 1 1 2 - 1 1
3. - - - - 1 2 - - 1 2 1 1 1 - 3 2 1 2
4. - - 1 3 - - - - - - 2 - 1 - 1 - 2 1
5. 1 - - - 3 - - - - - - - 5 10 9 4 9 19
6. - - - 1 - 1 - - - - - - - - 1 - 1 -
7. - 2 - - - - - - - - 7 9 2 5 2 2 6 7
8. - - 2 - - 4 - - - 2 - - - - - 4 - -
9. 1 1 3 6 1 - 4 2 4 3 3 - 11 13 17 21 10 24
10. - - - - - - - - - - - - - - -- - - 2
11. - - - - - - - - - - - - - - - - - -
12. - - - - - - - - - - - - - - - - - -
13. - - - - - - - - - - - - - - - - - -
14. - - - - - - - - - - - - - - - - - -
15. 14 5 3 - 5 1 3 3 7 2 7 5 4 2 7 2 1 -
16. 5 3 2 - 2 2 - - 4 3 3 4 5 1 4 7 - 1
17. - - - - - - - - - - - - - - - - - -
18. - - - - - - - - - - - - - - - - - -
19. - - - 2 - 4 - 8 - 7 - 2 - 7 - 10 - 28
20. - - 2 5 10 1 1 3 2 2 3 2 1 2 1 1 3 -
Total 21 11 13 17 22 15 8 14 18 21 26 23 32 42 48 53 35 86
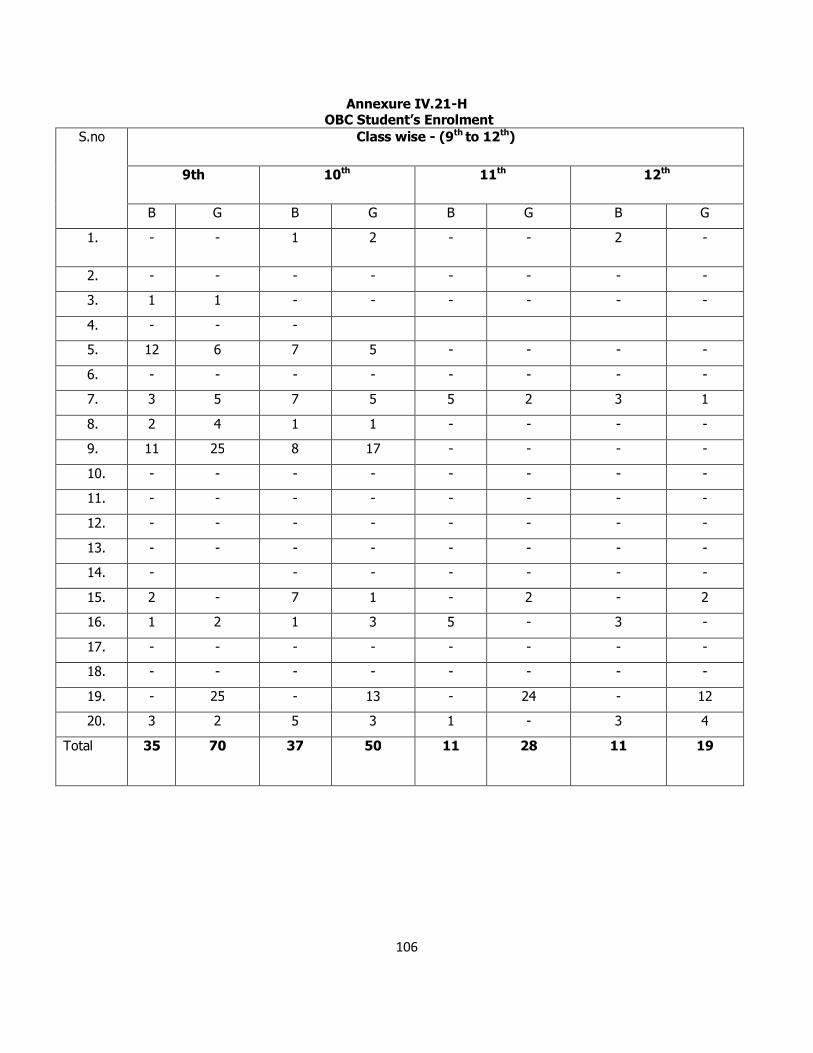
106
Annexure IV.21-H OBC Student’s Enrolment
S.no Class wise - (9th to 12th)
9th 10th 11th 12th
B G B G B G B G
1. - - 1 2 - - 2 -
2. - - - - - - - -
3. 1 1 - - - - - -
4. - - -
5. 12 6 7 5 - - - -
6. - - - - - - - -
7. 3 5 7 5 5 2 3 1
8. 2 4 1 1 - - - -
9. 11 25 8 17 - - - -
10. - - - - - - - -
11. - - - - - - - -
12. - - - - - - - -
13. - - - - - - - -
14. - - - - - - -
15. 2 - 7 1 - 2 - 2
16. 1 2 1 3 5 - 3 -
17. - - - - - - - -
18. - - - - - - - -
19. - 25 - 13 - 24 - 12
20. 3 2 5 3 1 - 3 4
Total 35
70 37 50 11 28 11 19
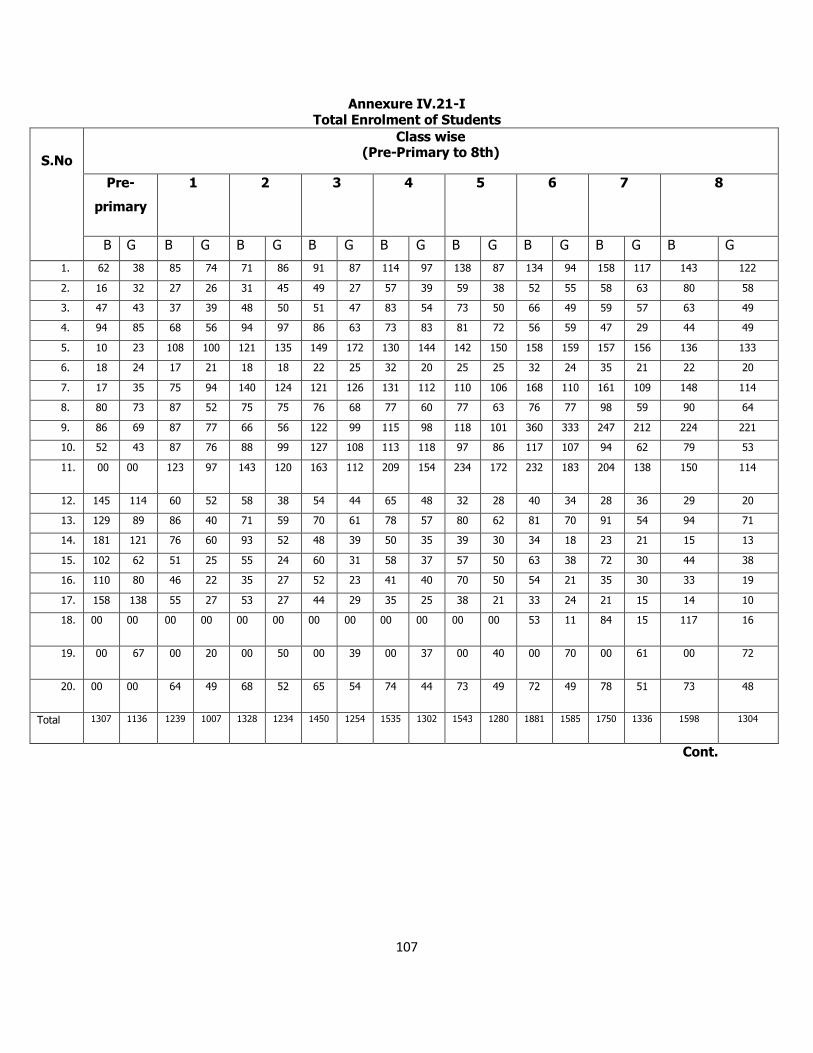
107
Annexure IV.21-I Total Enrolment of Students
S.No
Class wise (Pre-Primary to 8th)
Pre-
primary
1 2 3 4 5 6 7 8
B G B G B G B G B G B G B G B G B G
1. 62 38 85 74 71 86 91 87 114 97 138 87 134 94 158 117 143 122
2. 16 32 27 26 31 45 49 27 57 39 59 38 52 55 58 63 80 58
3. 47 43 37 39 48 50 51 47 83 54 73 50 66 49 59 57 63 49
4. 94 85 68 56 94 97 86 63 73 83 81 72 56 59 47 29 44 49
5. 10 23 108 100 121 135 149 172 130 144 142 150 158 159 157 156 136 133
6. 18 24 17 21 18 18 22 25 32 20 25 25 32 24 35 21 22 20
7. 17 35 75 94 140 124 121 126 131 112 110 106 168 110 161 109 148 114
8. 80 73 87 52 75 75 76 68 77 60 77 63 76 77 98 59 90 64
9. 86 69 87 77 66 56 122 99 115 98 118 101 360 333 247 212 224 221
10. 52 43 87 76 88 99 127 108 113 118 97 86 117 107 94 62 79 53
11. 00 00 123 97 143 120 163 112 209 154 234 172 232 183 204 138 150 114
12. 145 114 60 52 58 38 54 44 65 48 32 28 40 34 28 36 29 20
13. 129 89 86 40 71 59 70 61 78 57 80 62 81 70 91 54 94 71
14. 181 121 76 60 93 52 48 39 50 35 39 30 34 18 23 21 15 13
15. 102 62 51 25 55 24 60 31 58 37 57 50 63 38 72 30 44 38
16. 110 80 46 22 35 27 52 23 41 40 70 50 54 21 35 30 33 19
17. 158 138 55 27 53 27 44 29 35 25 38 21 33 24 21 15 14 10
18. 00 00 00 00 00 00 00 00 00 00 00 00 53 11 84 15 117 16
19. 00 67 00 20 00 50 00 39 00 37 00 40 00 70 00 61 00 72
20. 00 00 64 49 68 52 65 54 74 44 73 49 72 49 78 51 73 48
Total 1307 1136 1239 1007 1328 1234 1450 1254 1535 1302 1543 1280 1881 1585 1750 1336 1598 1304
Cont.
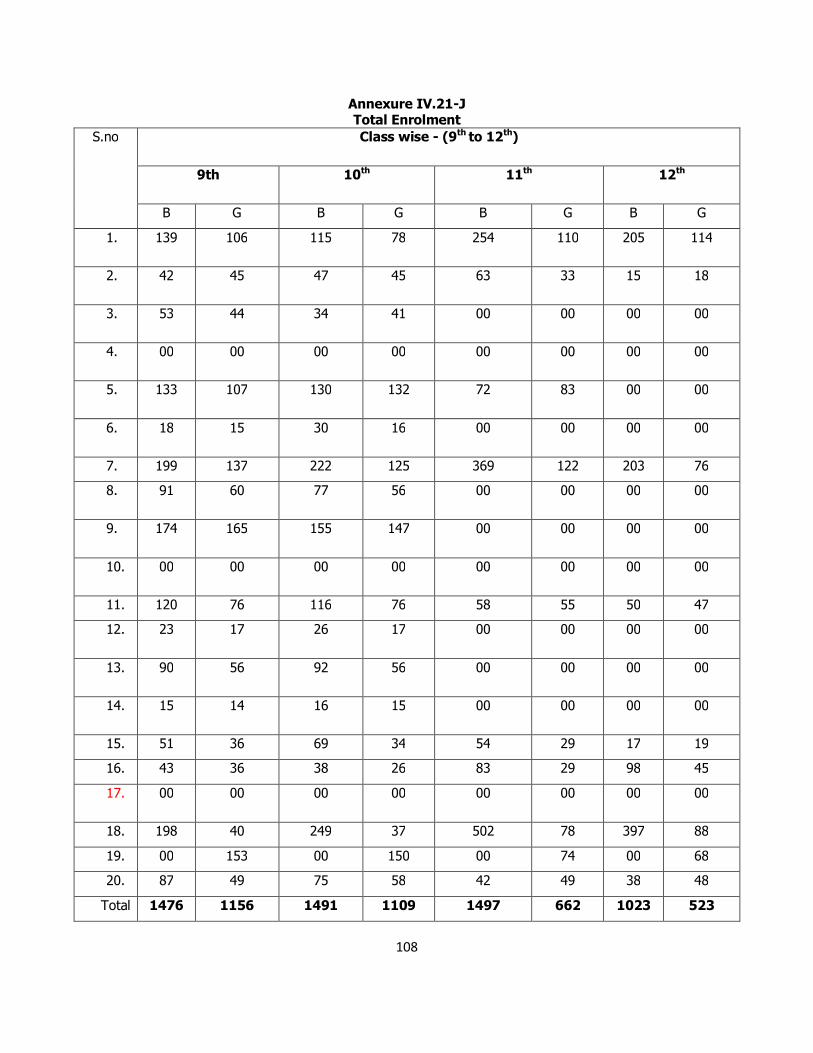
108
Annexure IV.21-J Total Enrolment
S.no Class wise - (9th to 12th)
9th 10th 11th 12th
B G B G B G B G
1. 139 106 115 78 254 110 205 114
2. 42 45 47 45 63 33 15 18
3. 53 44 34 41 00 00 00 00
4. 00 00 00 00 00 00 00 00
5. 133 107 130 132 72 83 00 00
6. 18 15 30 16 00 00 00 00
7. 199 137 222 125 369 122 203 76
8. 91 60 77 56 00 00 00 00
9. 174 165 155 147 00 00 00 00
10. 00 00 00 00 00 00 00 00
11. 120 76 116 76 58 55 50 47
12. 23 17 26 17 00 00 00 00
13. 90 56 92 56 00 00 00 00
14. 15 14 16 15 00 00 00 00
15. 51 36 69 34 54 29 17 19
16. 43 36 38 26 83 29 98 45
17. 00 00 00 00 00 00 00 00
18. 198 40 249 37 502 78 397 88
19. 00 153 00 150 00 74 00 68
20. 87 49 75 58 42 49 38 48
Total 1476 1156 1491 1109 1497 662 1023 523
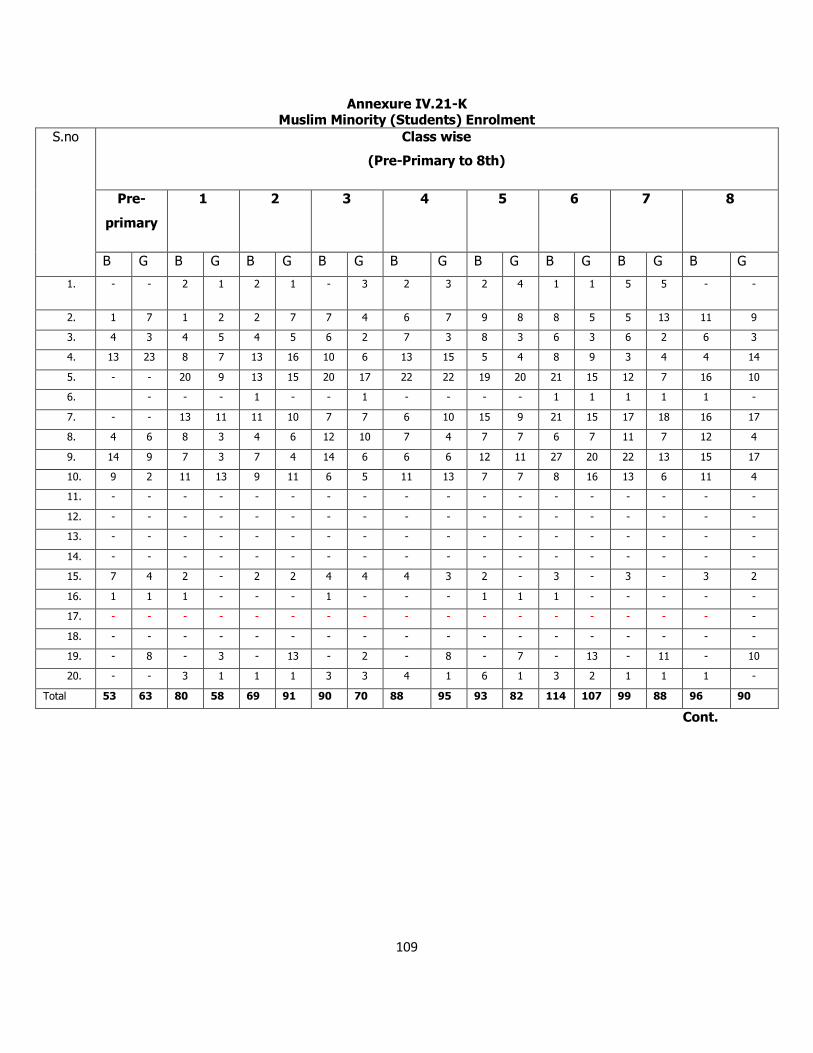
109
Annexure IV.21-K Muslim Minority (Students) Enrolment
S.no Class wise
(Pre-Primary to 8th)
Pre-
primary
1 2 3 4 5 6 7 8
B G B G B G B G B G B G B G B G B G
1. - - 2 1 2 1 - 3 2 3 2 4 1 1 5 5 - -
2. 1 7 1 2 2 7 7 4 6 7 9 8 8 5 5 13 11 9
3. 4 3 4 5 4 5 6 2 7 3 8 3 6 3 6 2 6 3
4. 13 23 8 7 13 16 10 6 13 15 5 4 8 9 3 4 4 14
5. - - 20 9 13 15 20 17 22 22 19 20 21 15 12 7 16 10
6. - - - 1 - - 1 - - - - 1 1 1 1 1 -
7. - - 13 11 11 10 7 7 6 10 15 9 21 15 17 18 16 17
8. 4 6 8 3 4 6 12 10 7 4 7 7 6 7 11 7 12 4
9. 14 9 7 3 7 4 14 6 6 6 12 11 27 20 22 13 15 17
10. 9 2 11 13 9 11 6 5 11 13 7 7 8 16 13 6 11 4
11. - - - - - - - - - - - - - - - - - -
12. - - - - - - - - - - - - - - - - - -
13. - - - - - - - - - - - - - - - - - -
14. - - - - - - - - - - - - - - - - - -
15. 7 4 2 - 2 2 4 4 4 3 2 - 3 - 3 - 3 2
16. 1 1 1 - - - 1 - - - 1 1 1 - - - - -
17. - - - - - - - - - - - - - - - - - -
18. - - - - - - - - - - - - - - - - - -
19. - 8 - 3 - 13 - 2 - 8 - 7 - 13 - 11 - 10
20. - - 3 1 1 1 3 3 4 1 6 1 3 2 1 1 1 -
Total 53 63 80 58 69 91 90 70 88 95 93 82 114 107 99 88 96 90
Cont.
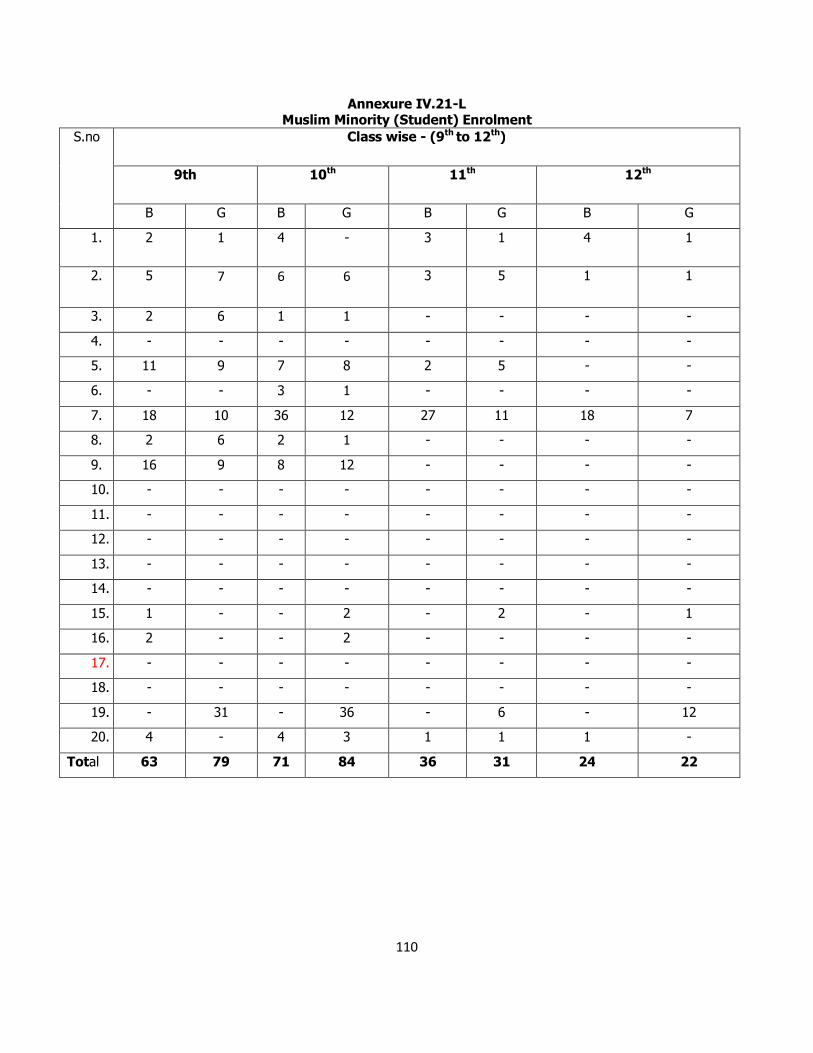
110
Annexure IV.21-L Muslim Minority (Student) Enrolment
S.no Class wise - (9th to 12th)
9th 10th 11th 12th
B G B G B G B G
1. 2 1 4 - 3 1 4 1
2. 5 7 6 6 3 5 1 1
3. 2 6 1 1 - - - -
4. - - - - - - - -
5. 11 9 7 8 2 5 - -
6. - - 3 1 - - - -
7. 18 10 36 12 27 11 18 7
8. 2 6 2 1 - - - -
9. 16 9 8 12 - - - -
10. - - - - - - - -
11. - - - - - - - -
12. - - - - - - - -
13. - - - - - - - -
14. - - - - - - - -
15. 1 - - 2 - 2 - 1
16. 2 - - 2 - - - -
17. - - - - - - - -
18. - - - - - - - -
19. - 31 - 36 - 6 - 12
20. 4 - 4 3 1 1 1 -
Total 63 79 71 84 36 31 24 22
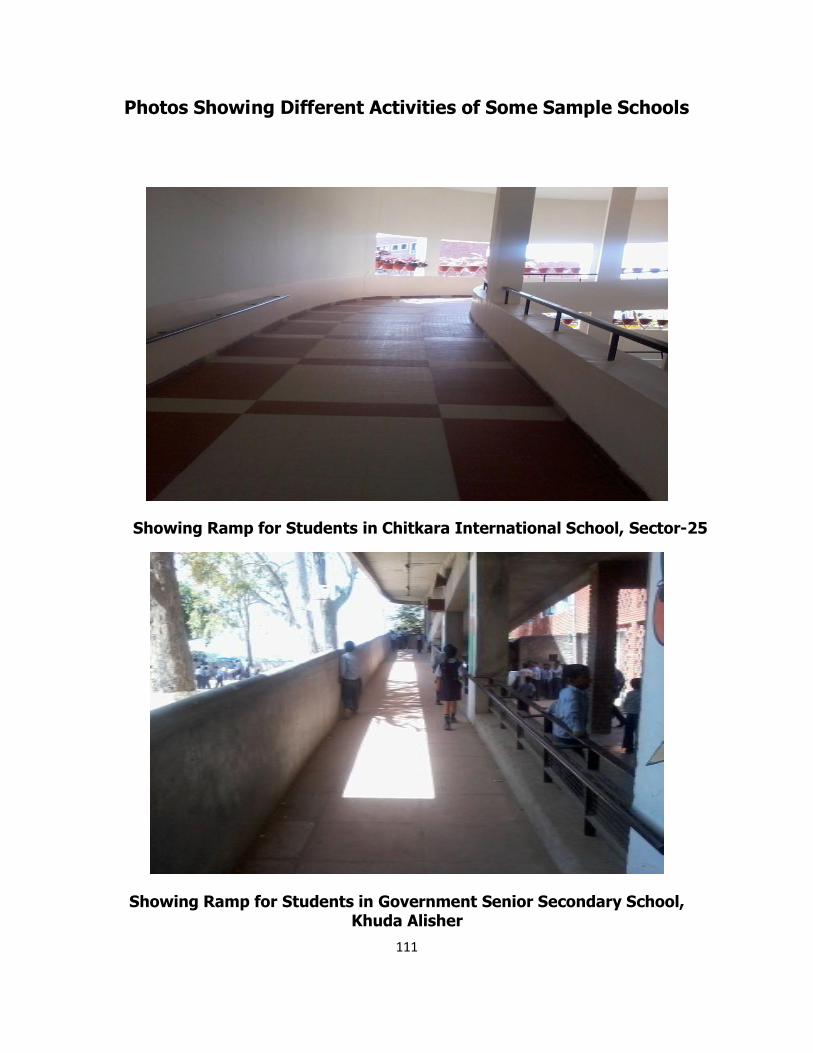
111
Photos Showing Different Activities of Some Sample Schools
Showing Ramp for Students in Chitkara International School, Sector-25
Showing Ramp for Students in Government Senior Secondary School, Khuda Alisher
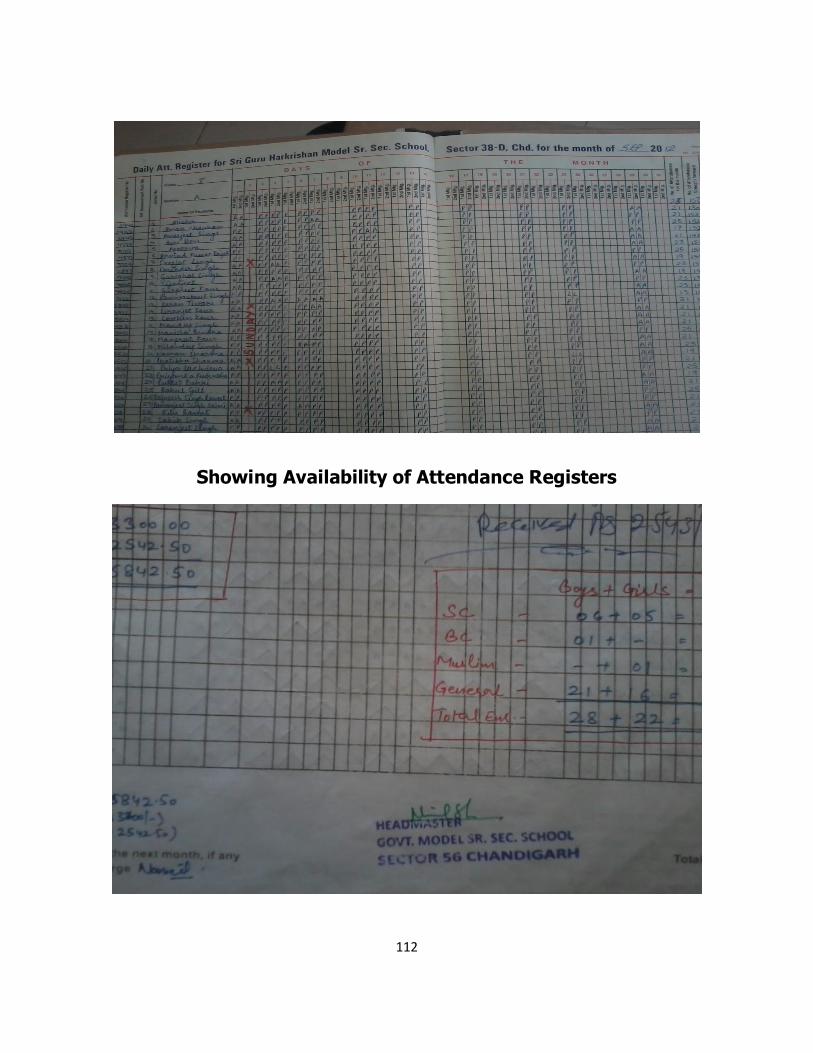
112
Showing Availability of Attendance Registers
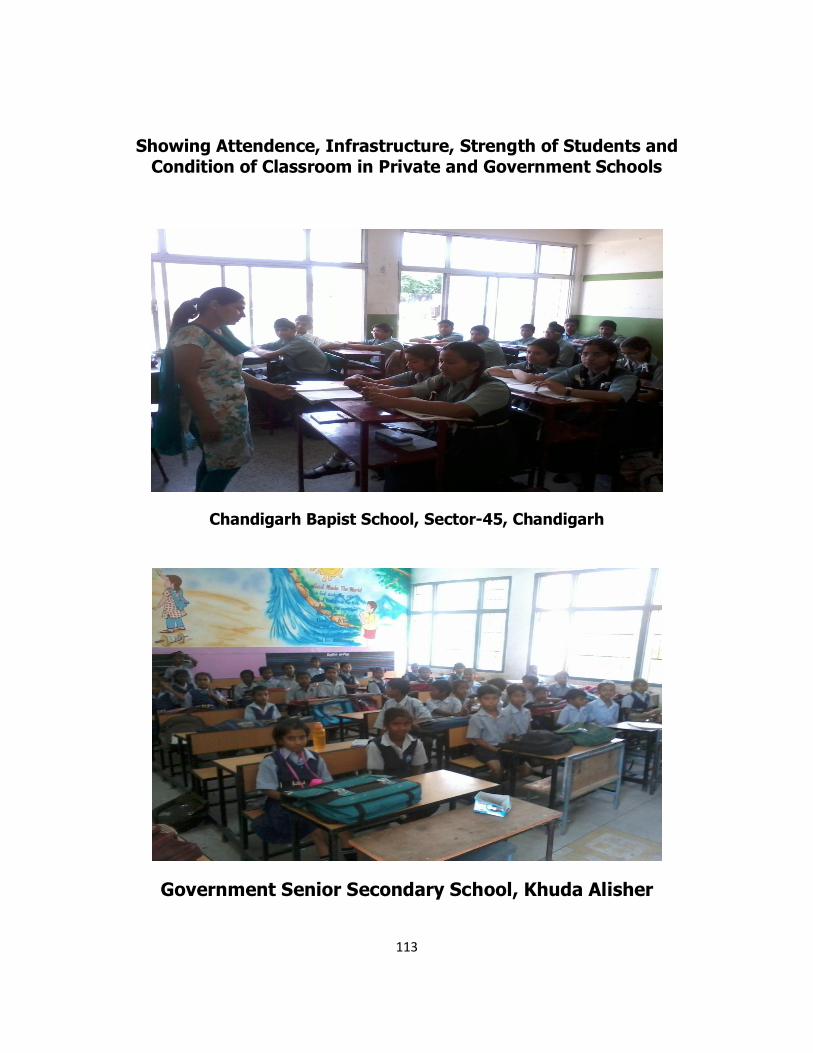
113
Showing Attendence, Infrastructure, Strength of Students and Condition of Classroom in Private and Government Schools
Chandigarh Bapist School, Sector-45, Chandigarh
Government Senior Secondary School, Khuda Alisher
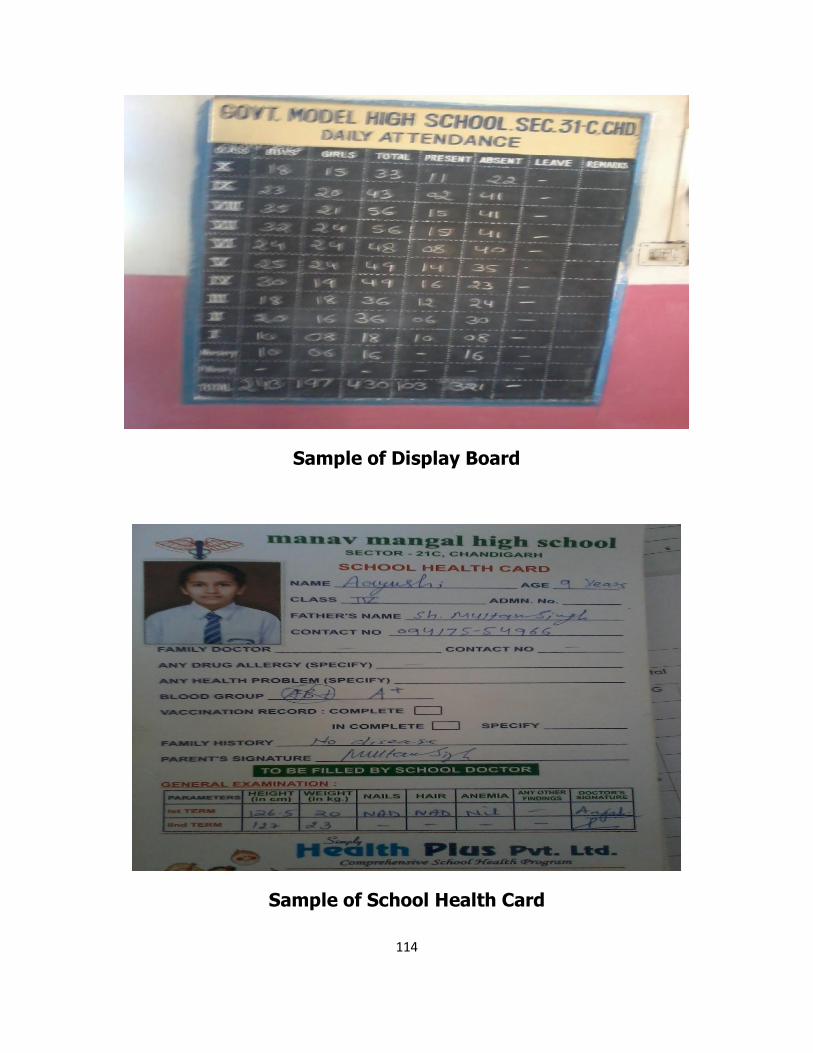
114
Sample of Display Board
Sample of School Health Card
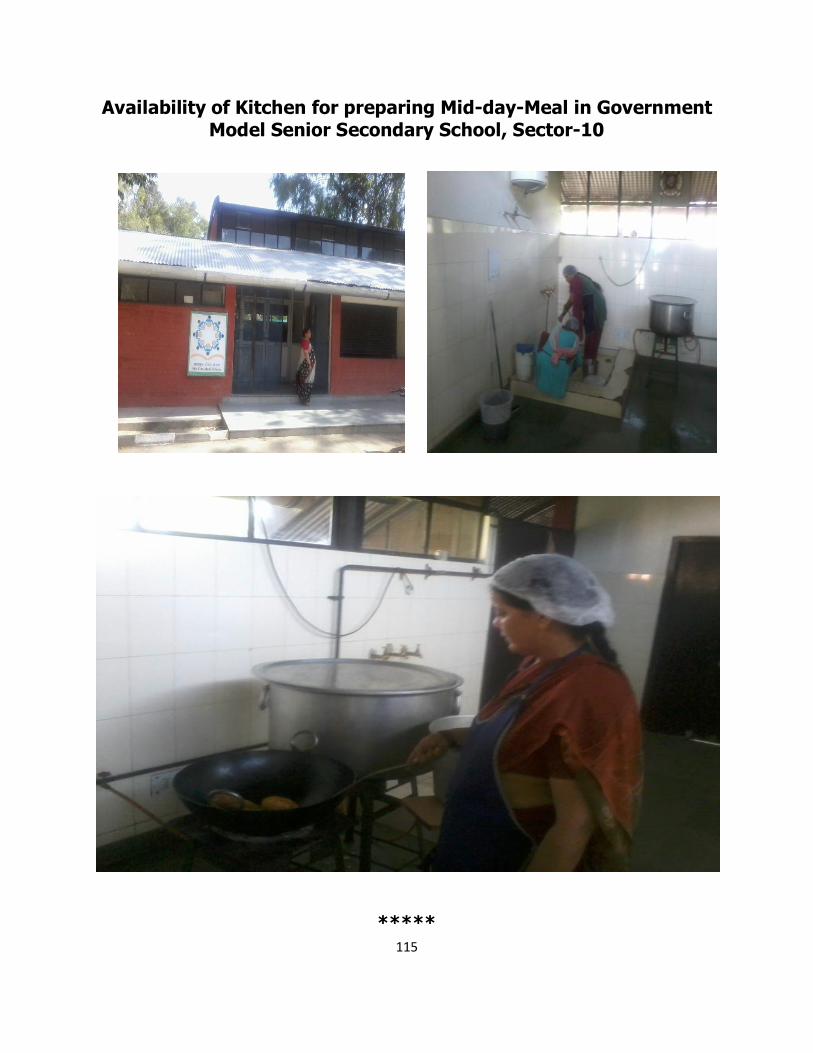
115
Availability of Kitchen for preparing Mid-day-Meal in Government Model Senior Secondary School, Sector-10
*****
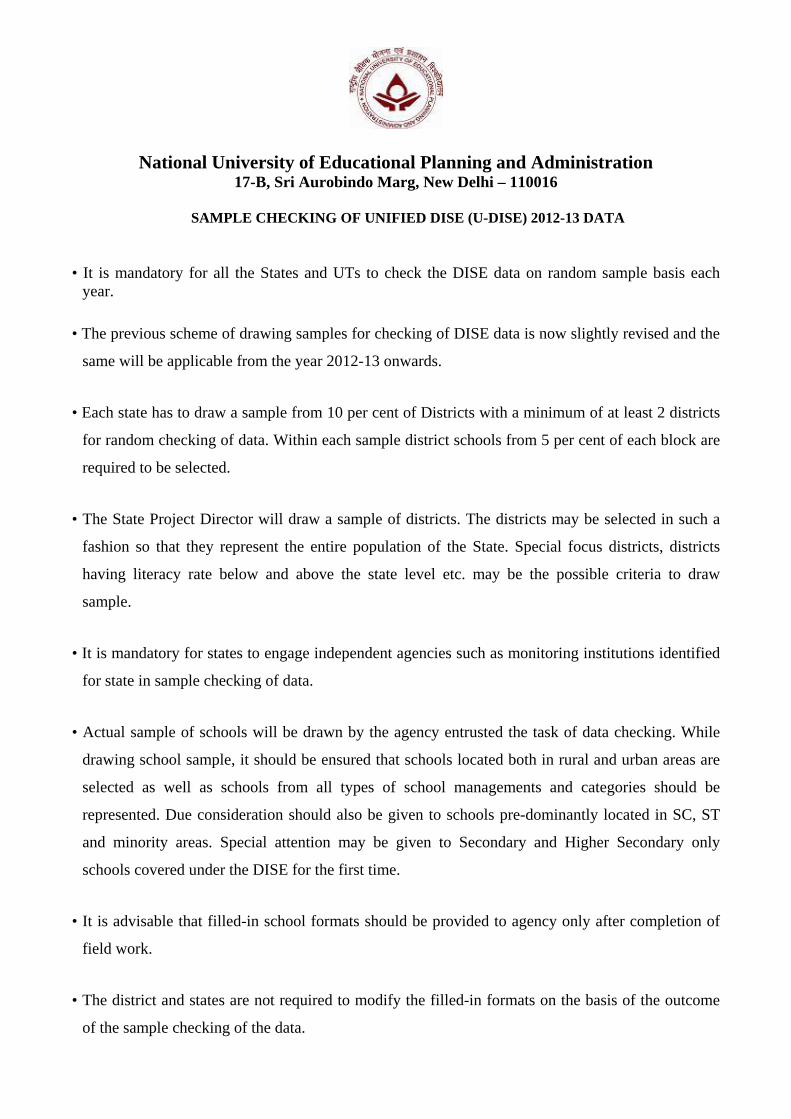
National University of Educational Planning and Administration 17-B, Sri Aurobindo Marg, New Delhi – 110016
SAMPLE CHECKING OF UNIFIED DISE (U-DISE) 2012-13 DATA
• It is mandatory for all the States and UTs to check the DISE data on random sample basis each
year.
• The previous scheme of drawing samples for checking of DISE data is now slightly revised and the
same will be applicable from the year 2012-13 onwards.
• Each state has to draw a sample from 10 per cent of Districts with a minimum of at least 2 districts
for random checking of data. Within each sample district schools from 5 per cent of each block are
required to be selected.
• The State Project Director will draw a sample of districts. The districts may be selected in such a
fashion so that they represent the entire population of the State. Special focus districts, districts
having literacy rate below and above the state level etc. may be the possible criteria to draw
sample.
• It is mandatory for states to engage independent agencies such as monitoring institutions identified
for state in sample checking of data.
• Actual sample of schools will be drawn by the agency entrusted the task of data checking. While
drawing school sample, it should be ensured that schools located both in rural and urban areas are
selected as well as schools from all types of school managements and categories should be
represented. Due consideration should also be given to schools pre-dominantly located in SC, ST
and minority areas. Special attention may be given to Secondary and Higher Secondary only
schools covered under the DISE for the first time.
• It is advisable that filled-in school formats should be provided to agency only after completion of
field work.
• The district and states are not required to modify the filled-in formats on the basis of the outcome
of the sample checking of the data.
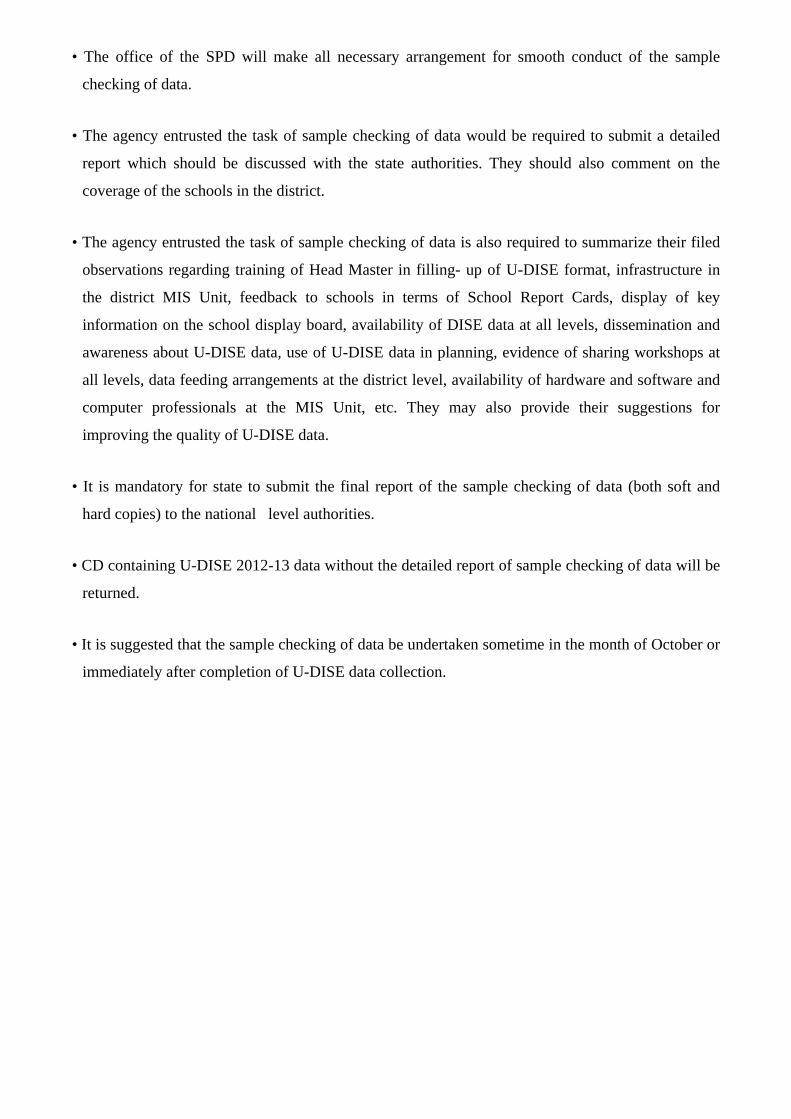
• The office of the SPD will make all necessary arrangement for smooth conduct of the sample
checking of data.
• The agency entrusted the task of sample checking of data would be required to submit a detailed
report which should be discussed with the state authorities. They should also comment on the
coverage of the schools in the district.
• The agency entrusted the task of sample checking of data is also required to summarize their filed
observations regarding training of Head Master in filling- up of U-DISE format, infrastructure in
the district MIS Unit, feedback to schools in terms of School Report Cards, display of key
information on the school display board, availability of DISE data at all levels, dissemination and
awareness about U-DISE data, use of U-DISE data in planning, evidence of sharing workshops at
all levels, data feeding arrangements at the district level, availability of hardware and software and
computer professionals at the MIS Unit, etc. They may also provide their suggestions for
improving the quality of U-DISE data.
• It is mandatory for state to submit the final report of the sample checking of data (both soft and
hard copies) to the national level authorities.
• CD containing U-DISE 2012-13 data without the detailed report of sample checking of data will be
returned.
• It is suggested that the sample checking of data be undertaken sometime in the month of October or
immediately after completion of U-DISE data collection.

National University of Educational Planning and Administration
17-B, Sri Aurobindo Marg, New Delhi – 110016
District Information System for Education (U-DISE) Five Percent Sample Check: Special DCF for Post Enumeration Survey
Date of visit to School: ..…../…../…….. Academic Year: ……./….…. Name of the Person conducting the survey: ………………………………………………………… Name of the organization conducting the survey:...………………………………………………… ………………………………………………………………..………………………… …………………………………………………………………..……………………………………… State: District: Pin Code:.
A. School location Particulars 1. Village name (Rural Area) /Ward No. (Urban Area)____________________________________ 2. School - Rural=1 or Urban =2 3. Block/Municipal name ________________________________________________________ 4. DISE Code:
B. School Particulars 1. Name of the School: ______________________________________________________________
2. Name of the Principal/Head Teacher, Educational Qualification and Experience as Principal/Head Teacher: (Please Note: Write the details of each one if Principal/Head Teacher is different for Elementary/secondary/Higher secondary) Ms. /Mr. ______________________________________________________________________ Ms. /Mr. ______________________________________________________________________ Ms. /Mr. ______________________________________________________________________ 3. Lowest class in the school 16. Highest Class in the school 4. Type of school [Boys = 1, Girls = 2, Co-educational = 3] Elementary Stage Secondary Stage Hr. Secondary Stage 5. Managed by (School Management) Elementary Stage Secondary Stage Hr. Secondary Stage [Department of Education = 1, Tribal/Social Welfare Department = 2, Local body = 3, Pvt. Aided = 4, Pvt. Unaided = 5, others = 6, Central Govt. = 7, Unrecognised = 8, Madarsa recognized (by Wakf board/Madarsa Board) =97, Madarsa unrecognized= 98] 6. Year of establishment of school:
7. Year of recognition of school: Elementary Stage Secondary Stage Hr. Secondary Stage 8. Is the school a shift school [Yes=1, No=2] 9. Is the school residential [Yes=1, No=2] 10. Affiliation Board: [CBSE=1, State Board=2, ICSE=3, International Board=4, Others=5]
For Secondary sections For Higher Secondary sections
11. Pre-primary section (other than Anganwadi) attached to school [Yes = 1, No = 2] If yes, a) Total students b) Total teachers 12. Is CCE being implemented in school at elementary level? [Not Applicable=0, Yes=1, No=2] 13. Results of the Class X Examination for the previous academic year Category Number of Students Appeared Number of Students
Passed/Qualified Boys Girls Total Boys Girls Total Total 14. Results of the Class XII Examination for the previous academic year Category Number of Students Appeared Number of Students
Passed/Qualified Boys Girls Total Boys Girls Total Total C. Staff details 1. Staff category
No. of sanctioned posts (if applicable) Number in-position
For Primary
For Upper Primary
For Secondary
For Hr. Secondary Total For
Primary
For Upper Primary
For Secondary
For Hr. Secondary Total
a. Teaching Staff (Regular Teachers)
b. Contract Teachers c. Part-time instructor positioned as per RTE
D. Facilities in school 1. Status of the school Building? [Private =1, Rented=2, Government=3, Government school in a rent free building=4, No Building=5, Dilapidated=6, Under Construction=7] 2. Details of classrooms and availability of furniture a) Class/Grade Total Classrooms used
for instructional purposes
No. of classrooms under construction
Availability of Furniture (desk/table) for Students [All=1, Some = 2, None=3]
i for Elementary section (classes 1 to 8)
ii IX iii X iv XI v XII 3. Classrooms by condition
No. of classrooms by condition Type of building block Good condition Need minor repair Need major repair a Pucca b Partially pucca c Kuchcha
Elem
enta
ry
Sect
ions
d Tent For secondary classes For Hr. Sec. classes 4. Land available for Additional Classrooms [Yes=1, No=2] 5. Separate room for Head Teacher/ Principal available [Yes = 1, No = 2] 6. No. of functional Toilets and urinals Boys only Girls only 7. Main source of drinking water facility [Hand pumps =1, Well =2, Tap water =3, others =4, none =5] 8. Electricity connection available in the school [Yes = 1, No = 2, Yes but not functional =3] 9. Type of Boundary wall [Not Applicable = 0, Pucca=1, Pucca but broken=2, barbed wire fencing=3, Hedges=4, No boundary wall=5, others=6, Partial=7, Under Construction= 8] 10. Whether school has Library facility? [Yes=1, No=2] 11. Does the school subscribe for news paper/magazine? [Yes=1, No=2] 12. Playground [Yes=1, No=2] 13. Total number of computers that are Functional 14. Whether Medical check-up of students conducted last year (Yes = 1 / No = 2) 15. Whether ramp for disabled children needed to access classrooms [Yes = 1, No = 2]
E. Enrolment in current academic session
Classes Pre-Primary I II III IV V VI VII VIII IX X XI XII S ections Boys Girls Boys Girls Boys Girls Boys Girls Boys Girls Boys Girls Boys Girls Boys Girls Boys Girls Boys Girls Boys Girls Boys Girls Boys Girls A - Gene ral B - SC C - ST D - O BC E- Total Enrolment (A+B+C+D)
Muslim Minority out of E
*
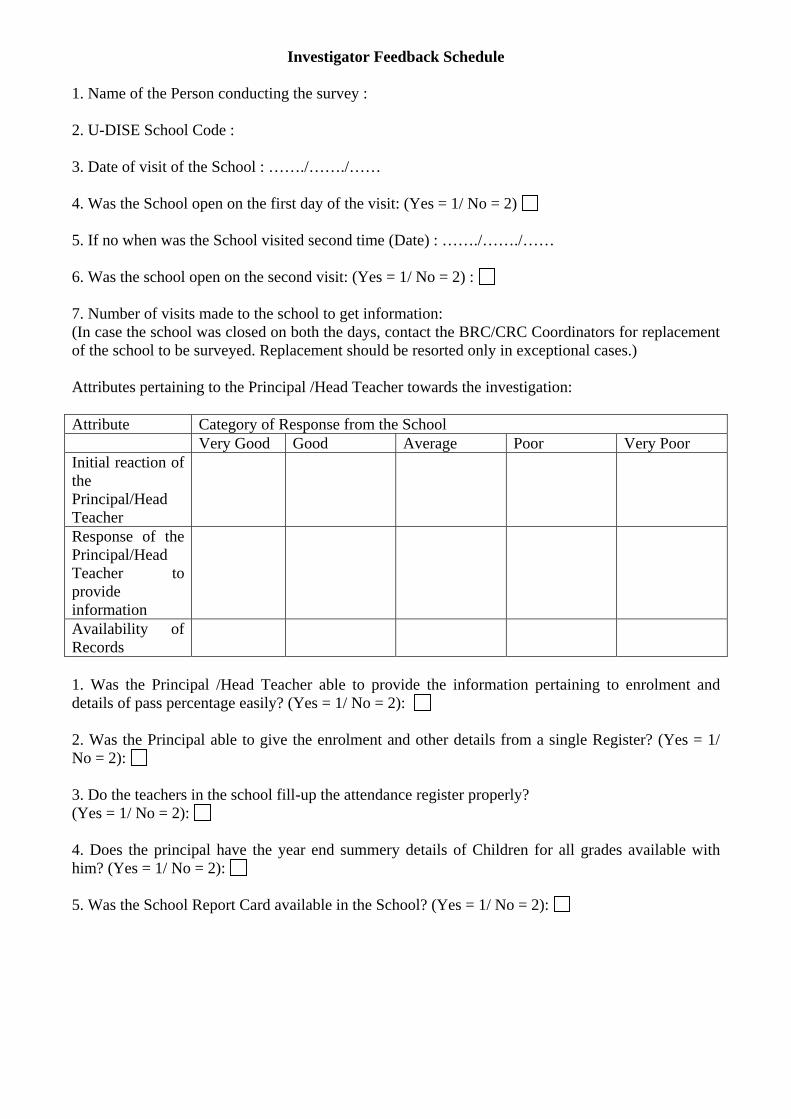
Investigator Feedback Schedule 1. Name of the Person conducting the survey : 2. U-DISE School Code : 3. Date of visit of the School : ……./……./…… 4. Was the School open on the first day of the visit: (Yes = 1/ No = 2) 5. If no when was the School visited second time (Date) : ……./……./…… 6. Was the school open on the second visit: (Yes = 1/ No = 2) : 7. Number of visits made to the school to get information: (In case the school was closed on both the days, contact the BRC/CRC Coordinators for replacement of the school to be surveyed. Replacement should be resorted only in exceptional cases.) Attributes pertaining to the Principal /Head Teacher towards the investigation: Attribute Category of Response from the School Very Good Good Average Poor Very Poor Initial reaction of the Principal/Head Teacher
Response of the Principal/Head Teacher to provide information
Availability of Records
1. Was the Principal /Head Teacher able to provide the information pertaining to enrolment and details of pass percentage easily? (Yes = 1/ No = 2): 2. Was the Principal able to give the enrolment and other details from a single Register? (Yes = 1/ No = 2): 3. Do the teachers in the school fill-up the attendance register properly? (Yes = 1/ No = 2): 4. Does the principal have the year end summery details of Children for all grades available with him? (Yes = 1/ No = 2): 5. Was the School Report Card available in the School? (Yes = 1/ No = 2):
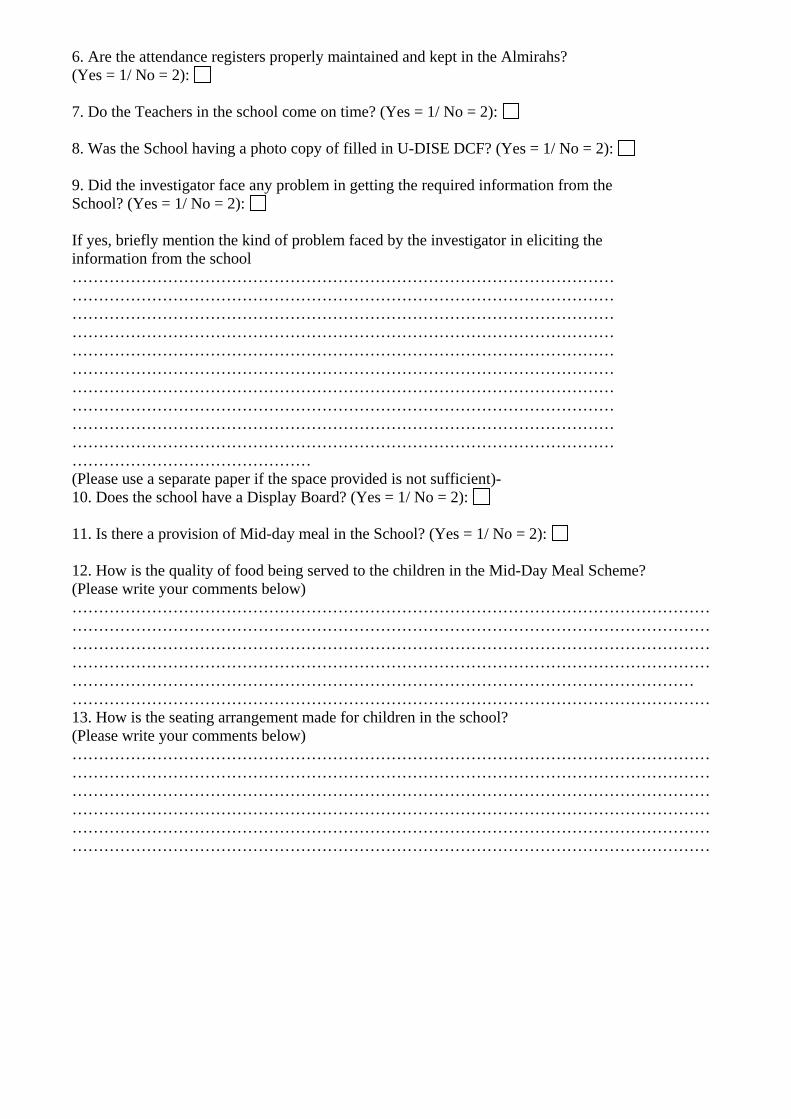
6. Are the attendance registers properly maintained and kept in the Almirahs? (Yes = 1/ No = 2): 7. Do the Teachers in the school come on time? (Yes = 1/ No = 2): 8. Was the School having a photo copy of filled in U-DISE DCF? (Yes = 1/ No = 2): 9. Did the investigator face any problem in getting the required information from the School? (Yes = 1/ No = 2): If yes, briefly mention the kind of problem faced by the investigator in eliciting the information from the school ………………………………………………………………………………………… ………………………………………………………………………………………… ………………………………………………………………………………………… ………………………………………………………………………………………… ………………………………………………………………………………………… ………………………………………………………………………………………… ………………………………………………………………………………………… ………………………………………………………………………………………… ………………………………………………………………………………………… ………………………………………………………………………………………… ……………………………………… (Please use a separate paper if the space provided is not sufficient)- 10. Does the school have a Display Board? (Yes = 1/ No = 2): 11. Is there a provision of Mid-day meal in the School? (Yes = 1/ No = 2): 12. How is the quality of food being served to the children in the Mid-Day Meal Scheme? (Please write your comments below) ………………………………………………………………………………………………………… ………………………………………………………………………………………………………… ………………………………………………………………………………………………………… ………………………………………………………………………………………………………… ……………………………………………………………………………………………………… ………………………………………………………………………………………………………… 13. How is the seating arrangement made for children in the school? (Please write your comments below) ………………………………………………………………………………………………………… ………………………………………………………………………………………………………… ………………………………………………………………………………………………………… ………………………………………………………………………………………………………… ………………………………………………………………………………………………………… …………………………………………………………………………………………………………