Embed Size (px)
Citation preview
1
REPORT ON SOWING PERIOD AND FLOODING
RISKS IN DOUALA, CAMEROON
BY
GERVAIS DIDIER YONTCHANG
Cameroon Meteorological Department
PROJECT WORK FOR PART FULFILMENT OF THE e-SIAC COURSE
(STATISTICS IN APPLIED CLIMATOLOGY APRIL – AUGUST 2010)
MAINTAINED BY THE MET. OFFICE COLLEGE AND THE SSC WITH SUPPORT
FROM THE UK MET. OFFICE AND WMO.
August 2010
2
TABLE OF CONTENTS
REPORT ON SOWING PERIOD AND FLOODING RISKS IN DOUALA,
CAMEROON.......................................................................................................................... 1
TABLE OF CONTENTS ........................................................................................................... 2
A. BACKGROUND: .......................................................................................................... 3
1). Extreme climate events increasingly important for Cameroon .................................... 3
2) Location and climate of Douala, Cameroon in Africa ................................................... 3
B. OBJECTIVES: .................................................................................................................. 4
i. Assessment of the annual distribution of sowing dates ............................................. 4
ii. Assessment of the flooding risks during the rainfall peak period .............................. 4
iii. To quantify the risk of having floods with crop failure ......................................... 4
iv. Towards development of a possible „cautious strategy‟ ........................................ 4
C. METHODOLOGY: ........................................................................................................... 5
1. Find the dates when sowing are possible using the suitable definitions ........................ 5
2. Assessment of the risk of flooding with crop failure ..................................................... 5
3. Boxplots for visual comparison, descriptive statistics as dates and Comment on the
summaries. ......................................................................................................................... 5
4. Some conclusions for the client (Ministry of agriculture) based on these summaries
and risks calculations. ........................................................................................................ 5
D. DATA AND DEFINITIONS USED: ............................................................................... 6
1. Daily rainfall data for the period of 1950 to 2006 collected at the Douala
international Airport........................................................................................................... 6
2. DATA reformatted using SSC-Stat tool before it could be imported from EXCEL to
INSTAT ............................................................................................................................. 6
E. RESULTS: ...........................................................................................................................
1) - Find the dates when sowing and flooding is possible using suitable definitions: ....... 7
2. Assessment of the risk of flooding with crop failure: .................................................... 8
3. RISK OF FLOODING WITH CROP FAILURE .......................................................... 9
4. Text boxes showing the chance (proportion) of experiencing floods and crop failure
during the month of August: ............................................................................................ 13
5. Boxplots for visual comparison, descriptive statistics as dates and Comment on the
summaries: ....................................................................................................................... 16
F. IMPLICATIONS: ............................................................................................................ 21
1. The “sowing strategy” definition that I would recommend to a farmer ...................... 21
2. The advantages............................................................................................................. 21
3. The disadvantages ........................................................................................................ 21
G.APPENDICES: ................................................................................................................ 22
Appendix A: References and sources documentation ..................................................... 22
Appendix: Daily data for Douala, Cameroon 1950-2006 ................................................ 27
Day numbers in the year ...................................................................................................... 29
3
BACKGROUND:
1). Extreme climate events increasingly important for Cameroon
Climate extremes such as droughts and floods have increased in frequency and severity in
Africa over the past 30 years (Nicholson, 1987). The probability of extreme climate events is
becoming increasingly important for Cameroon because of the inherent vulnerability of its
agricultural system and even the associated risk of the potential spread of plant, animal as
well as human diseases (malaria, typhoid, cholera, etc.) that are highly linked to climate
variability and climate change.
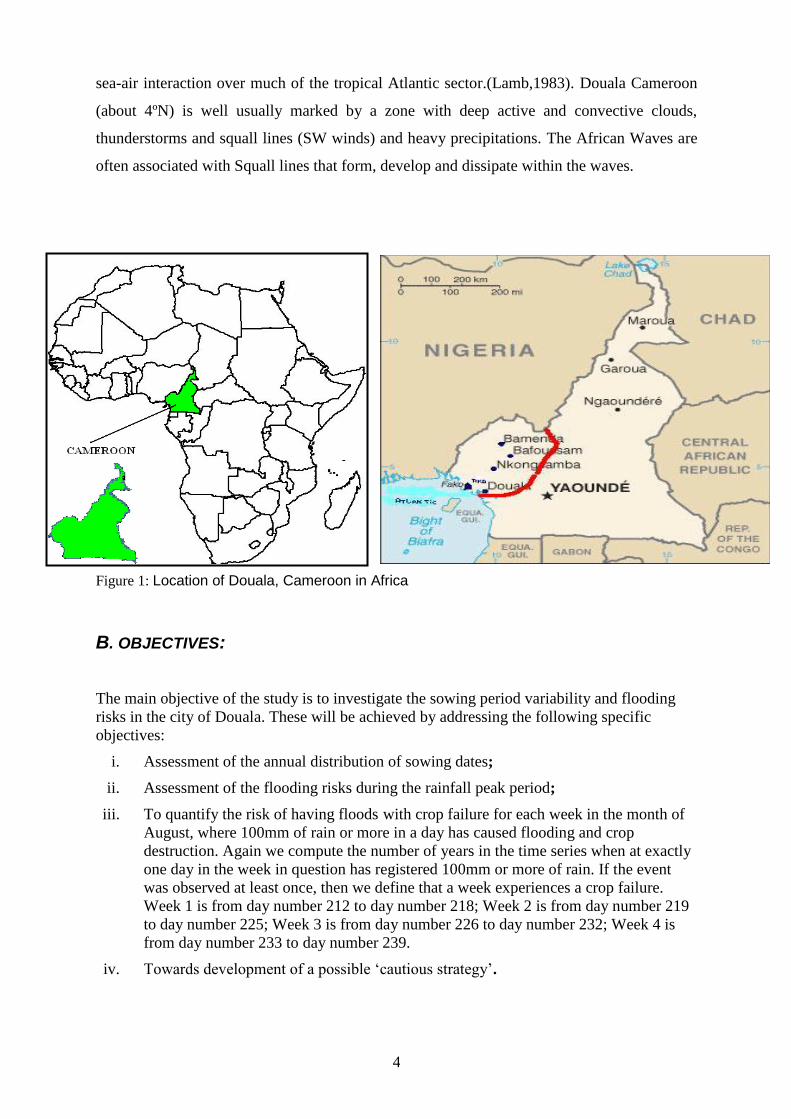
2) Location and climate of Douala, Cameroon in Africa
Cameroon lies within latitudes 1°45΄N to 13°΄N and Longitude 8°25΄E to 16°28΄E. It is
situated on the west coast of Africa, running north to south from Sahara desert to the Atlantic
Ocean. The country is bounded on the north by Lake Chad; on the east by Chad and the
Central African Republic; on the south by the Republic of the Congo, Gabon, and Equatorial
Guinea; and on the west by the Bight of Biafra (an arm of the Atlantic Ocean) and Nigeria
(Figure 1). The country is shaped like an elongated triangle, and forms a bridge between West
Africa and Central Africa. Cameroon has a total area of 475,442 km2. Yaoundé is the capital,
and Douala is the largest city. The major industries (petroleum refineries, fishing industries,
international air transports and others) are located in this region.
Douala city is situated at the junction of the southern coastal plain region with dense
equatorial rain forests and the west area of high forested mountains of volcanic origin, where
lies Mount Cameroon Mountain (4095m), the highest peak in western Africa and an active
volcano. One of the country‟s most fertile soils is found in this region. July and August are
seen to be the peak of the rainy season, with a lowest total of 207.4mm in July 2003 and one
year (August1966) with over 1240mm. The rains are usually from January to December,
though December, January and February are occasionally dry. The mean maximum relative
humidity occurs here due to its proximity to Atlantic Ocean (exposure to the warm Guinean
Gulf‟s currents).
Here, the type and intensity of the weather is determined by the meridional variations in the
depth of the monsoon layer (moisture). The southwest (SW) monsoon flow at lower levels,
source of humidity to a large extent determined by the large scale atmospheric circulation and
4
sea-air interaction over much of the tropical Atlantic sector.(Lamb,1983). Douala Cameroon
(about 4ºN) is well usually marked by a zone with deep active and convective clouds,
thunderstorms and squall lines (SW winds) and heavy precipitations. The African Waves are
often associated with Squall lines that form, develop and dissipate within the waves.
Figure 1: Location of Douala, Cameroon in Africa
B. OBJECTIVES:
The main objective of the study is to investigate the sowing period variability and flooding
risks in the city of Douala. These will be achieved by addressing the following specific
objectives:
i. Assessment of the annual distribution of sowing dates;
ii. Assessment of the flooding risks during the rainfall peak period;
iii. To quantify the risk of having floods with crop failure for each week in the month of
August, where 100mm of rain or more in a day has caused flooding and crop
destruction. Again we compute the number of years in the time series when at exactly
one day in the week in question has registered 100mm or more of rain. If the event
was observed at least once, then we define that a week experiences a crop failure.
Week 1 is from day number 212 to day number 218; Week 2 is from day number 219
to day number 225; Week 3 is from day number 226 to day number 232; Week 4 is
from day number 233 to day number 239.
iv. Towards development of a possible „cautious strategy‟.
5
C. METHODOLOGY:
The methods used to achieve the objectives mentioned above are the following:
All these results describe the rainfall data for Douala, Cameroon and were computed (plots,
graphs, tables, figures, risks or variability calculations) using Instat+ v3.36 and Excel
packages. To define the events of interest (start of the season, dry spell) the climatic>>Events
menu options from INSTAT were used. Then the sowing dates were extracted and analyzed
based on the below definitions.
1. Find the dates when sowing are possible using the suitable definitions:
a)- First date from 1st March getting more than 40mm in 1,2,3 or 4 days;
b)- First date from 1st April getting more than 40mm in 1,2 or 3 days;
c) – First date from 1st May getting more than 40mm in 1 or 2 days;
d) – First date from 1st June getting more than 40mm in 1 day
2. Assessment of the risk of flooding with crop failure
e) – Fist occasion after 1st August with more than 100mm totalled over 2 consecutive days
and no dry spell of 3 days or more in the next 30 days. If the event was observed at least once
we define that a year experiences a flood in low-land areas.
f) – First occasion after 1st August with more than 100mm totalled exactly over one day. If
the event was observed at least once we define that a year experiences a general flood with
crop failure.
g) – The average rainfall total for August will be compared with the average totals for the
other months to get a general idea as to how wet the month is.
Then the month will then be broken down in 4 weeks as specified above, where the average
total for each week will be looked at and the highest rainfall totals will be highlighted.
After this, a count of the number of days with at least 100mm in exactly 1 day will be looked
at for each week, then find the average number of times per week each of these occurred over
the past 57 years. This will give the probability of the event of flooding, and therefore the
level of risk for encountering crop failure in either week 1, 2, 3 or 4 will be estimated.
3. Boxplots for visual comparison, descriptive statistics as dates and Comment
on the summaries.
4. Some conclusions for the client (Ministry of agriculture) based on these
summaries and risks calculations.
6
D. DATA AND DEFINITIONS USED:
1. Daily rainfall data for the period of 1950 to 2006 collected at the Douala
international Airport
Daily rainfall data for the period of 1950 to 2006 collected at the Douala international
Airport which was provided by the Cameroon meteorological service. The accumulated
number of years of daily data is 57, because almost all the data was available. A rainy day in
this instance is considered to be a day with at least 0.85mm of rainfall. The data described are
the daily rainfall values from 1950 to 2006. The mean annual total rainfall over this period
was 3895mm with an average of about 220 rainy days. The highest annual total was
5327.6mm in 1956; the lowest total recorded was 2595.9mm in 1984.
The daily rainfall data was originally provided in EXCEL format by the Meteorological
office. It was then examined to ensure its quality. A thorough inspection was done in an effort
to clean the data from any erroneous values whenever necessary. There where very few
missing data and no negative values. The measurement units‟ millimeters were consistently
used throughout the dataset. The data had to be reformatted.
2. DATA reformatted using SSC-Stat tool before it could be imported from EXCEL to
INSTAT
DATA was reformatted using SSC-Stat tool before it could be imported from EXCEL to
INSTAT where supplementary checks were conducted to ensure adequate coding for non-
leap years and proper calendar year settings. The coding used fro non leap years was 9988
represented as ***.
7
E. RESULTS:
These results describe the rainfall data for Douala, Cameroon. This section gives all the
results (plots, graphs, tables, figures, risks or variability calculations, using Instat+ v3.36). It
is also the space for “analysis of the events”. To define the events of interest (start of the
season, dry spell) the climatic>>Events menu options from INSTAT were used. Then the
sowing dates were extracted and analyzed based on the given definitions.
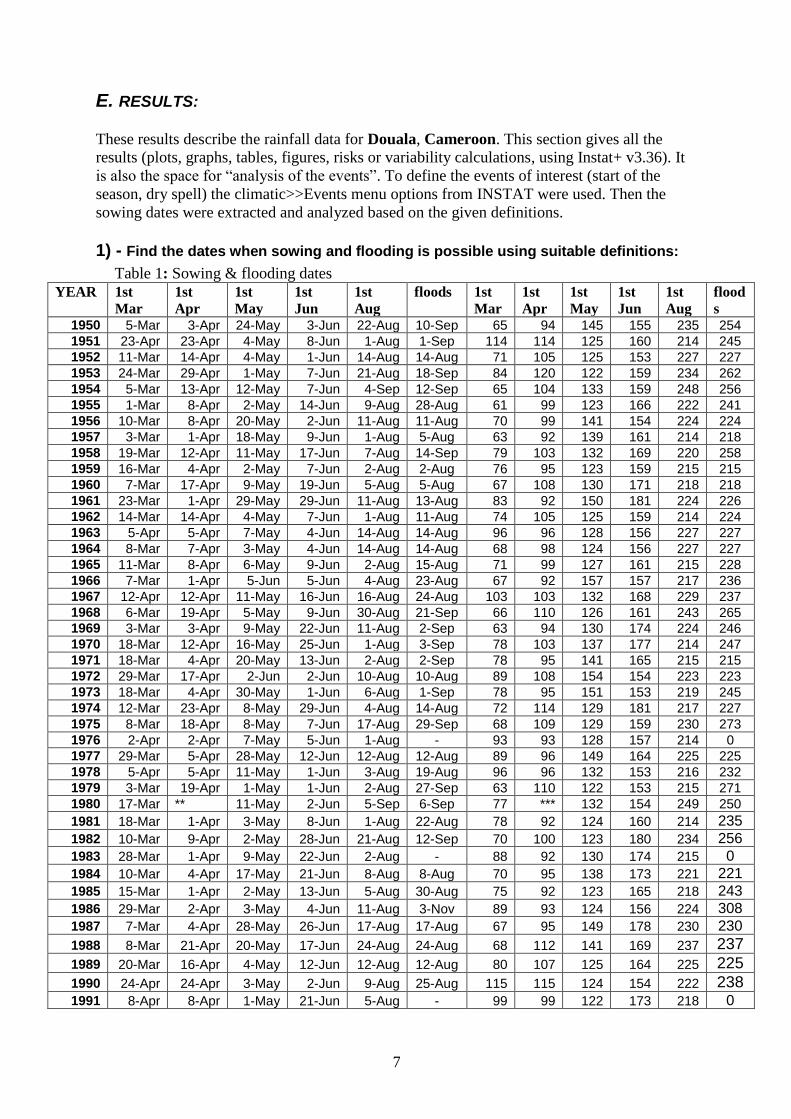
1) - Find the dates when sowing and flooding is possible using suitable definitions:
Table 1: Sowing & flooding dates YEAR 1st
Mar
1st
Apr
1st
May
1st
Jun
1st
Aug
floods 1st
Mar
1st
Apr
1st
May
1st
Jun
1st
Aug
flood
s 1950 5-Mar 3-Apr 24-May 3-Jun 22-Aug 10-Sep 65 94 145 155 235 254
1951 23-Apr 23-Apr 4-May 8-Jun 1-Aug 1-Sep 114 114 125 160 214 245
1952 11-Mar 14-Apr 4-May 1-Jun 14-Aug 14-Aug 71 105 125 153 227 227
1953 24-Mar 29-Apr 1-May 7-Jun 21-Aug 18-Sep 84 120 122 159 234 262
1954 5-Mar 13-Apr 12-May 7-Jun 4-Sep 12-Sep 65 104 133 159 248 256
1955 1-Mar 8-Apr 2-May 14-Jun 9-Aug 28-Aug 61 99 123 166 222 241
1956 10-Mar 8-Apr 20-May 2-Jun 11-Aug 11-Aug 70 99 141 154 224 224
1957 3-Mar 1-Apr 18-May 9-Jun 1-Aug 5-Aug 63 92 139 161 214 218
1958 19-Mar 12-Apr 11-May 17-Jun 7-Aug 14-Sep 79 103 132 169 220 258
1959 16-Mar 4-Apr 2-May 7-Jun 2-Aug 2-Aug 76 95 123 159 215 215
1960 7-Mar 17-Apr 9-May 19-Jun 5-Aug 5-Aug 67 108 130 171 218 218
1961 23-Mar 1-Apr 29-May 29-Jun 11-Aug 13-Aug 83 92 150 181 224 226
1962 14-Mar 14-Apr 4-May 7-Jun 1-Aug 11-Aug 74 105 125 159 214 224
1963 5-Apr 5-Apr 7-May 4-Jun 14-Aug 14-Aug 96 96 128 156 227 227
1964 8-Mar 7-Apr 3-May 4-Jun 14-Aug 14-Aug 68 98 124 156 227 227
1965 11-Mar 8-Apr 6-May 9-Jun 2-Aug 15-Aug 71 99 127 161 215 228
1966 7-Mar 1-Apr 5-Jun 5-Jun 4-Aug 23-Aug 67 92 157 157 217 236
1967 12-Apr 12-Apr 11-May 16-Jun 16-Aug 24-Aug 103 103 132 168 229 237
1968 6-Mar 19-Apr 5-May 9-Jun 30-Aug 21-Sep 66 110 126 161 243 265
1969 3-Mar 3-Apr 9-May 22-Jun 11-Aug 2-Sep 63 94 130 174 224 246
1970 18-Mar 12-Apr 16-May 25-Jun 1-Aug 3-Sep 78 103 137 177 214 247
1971 18-Mar 4-Apr 20-May 13-Jun 2-Aug 2-Sep 78 95 141 165 215 215
1972 29-Mar 17-Apr 2-Jun 2-Jun 10-Aug 10-Aug 89 108 154 154 223 223
1973 18-Mar 4-Apr 30-May 1-Jun 6-Aug 1-Sep 78 95 151 153 219 245
1974 12-Mar 23-Apr 8-May 29-Jun 4-Aug 14-Aug 72 114 129 181 217 227
1975 8-Mar 18-Apr 8-May 7-Jun 17-Aug 29-Sep 68 109 129 159 230 273
1976 2-Apr 2-Apr 7-May 5-Jun 1-Aug - 93 93 128 157 214 0
1977 29-Mar 5-Apr 28-May 12-Jun 12-Aug 12-Aug 89 96 149 164 225 225
1978 5-Apr 5-Apr 11-May 1-Jun 3-Aug 19-Aug 96 96 132 153 216 232
1979 3-Mar 19-Apr 1-May 1-Jun 2-Aug 27-Sep 63 110 122 153 215 271
1980 17-Mar ** 11-May 2-Jun 5-Sep 6-Sep 77 *** 132 154 249 250
1981 18-Mar 1-Apr 3-May 8-Jun 1-Aug 22-Aug 78 92 124 160 214 235
1982 10-Mar 9-Apr 2-May 28-Jun 21-Aug 12-Sep 70 100 123 180 234 256
1983 28-Mar 1-Apr 9-May 22-Jun 2-Aug - 88 92 130 174 215 0
1984 10-Mar 4-Apr 17-May 21-Jun 8-Aug 8-Aug 70 95 138 173 221 221
1985 15-Mar 1-Apr 2-May 13-Jun 5-Aug 30-Aug 75 92 123 165 218 243
1986 29-Mar 2-Apr 3-May 4-Jun 11-Aug 3-Nov 89 93 124 156 224 308
1987 7-Mar 4-Apr 28-May 26-Jun 17-Aug 17-Aug 67 95 149 178 230 230
1988 8-Mar 21-Apr 20-May 17-Jun 24-Aug 24-Aug 68 112 141 169 237 237
1989 20-Mar 16-Apr 4-May 12-Jun 12-Aug 12-Aug 80 107 125 164 225 225
1990 24-Apr 24-Apr 3-May 2-Jun 9-Aug 25-Aug 115 115 124 154 222 238 1991 8-Apr 8-Apr 1-May 21-Jun 5-Aug - 99 99 122 173 218 0
8
1992 8-Mar 14-Apr 6-May 13-Jun 5-Oct 5-Oct 68 105 127 165 279 279
1993 9-Mar 13-Apr 14-May 3-Jun 4-Aug 30-Aug 69 104 135 155 217 243
1994 23-Mar 3-Apr 2-May 22-Jun 9-Aug 9-Aug 83 94 123 174 222 222
1995 17-Mar 15-Apr 8-May 5-Jun 3-Aug 3-Aug 77 106 129 157 216 216
1996 1-Mar 11-Apr 27-May 1-Jun 18-Aug - 61 102 148 153 231 0
1997 25-Mar 6-Apr 1-May 16-Jun 1-Aug - 85 97 122 168 214 0
1998 6-Apr 6-Apr 2-May 15-Jun 13-Aug 13-Aug 97 97 123 167 226 226
1999 28-Mar 3-Apr 7-May 18-Jun 3-Aug 3-Sep 88 94 128 170 216 247
2000 22-Mar 3-Apr 5-Jun 5-Jun 3-Aug 16-Aug 82 94 157 157 216 229
2001 1-Mar 2-Apr ** 3-Jun 20-Sep 23-Sep 61 93 *** 155 264 267
2002 1-Mar 1-Apr 1-May 15-Jun 15-Aug 15-Aug 61 92 122 167 228 228
2003 29-Mar 9-Apr 24-May 7-Jun 5-Aug 5-Aug 89 100 145 159 218 218
2004 25-Mar 4-Apr 3-May 9-Jun 0-Jan - 85 95 124 161 0 0
2005 11-Mar 21-Apr 4-May 5-Jun 6-Aug 14-Sep 71 112 125 157 219 258
2006 15-Mar 1-Apr 4-May 14-Jun 1-Aug 17-Aug 75 92 125 166 214 230
Earliest 1-Mar 1-Apr 1-May 1-Jun 1-Aug 1st-Aug 61 92 122 153 214 214
Latest 24-Apr 29-Apr 5-Jun 29-Jun 5-Oct 3-Nov 115 120 157 181 279 308
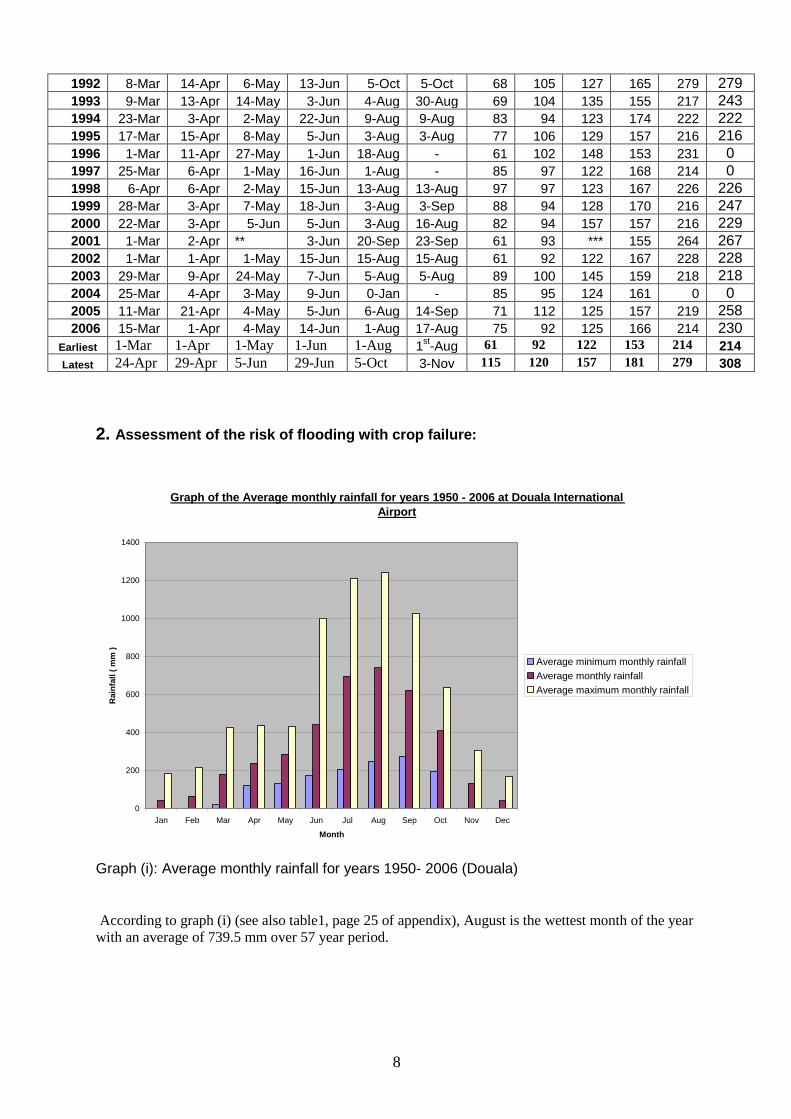
2. Assessment of the risk of flooding with crop failure:
Graph of the Average monthly rainfall for years 1950 - 2006 at Douala International
Airport
0
200
400
600
800
1000
1200
1400
Jan Feb Mar Apr May Jun Jul Aug Sep Oct Nov Dec
Month
Rain
fall (
mm
)
Average minimum monthly rainfall
Average monthly rainfall
Average maximum monthly rainfall
Graph (i): Average monthly rainfall for years 1950- 2006 (Douala)
According to graph (i) (see also table1, page 25 of appendix), August is the wettest month of the year
with an average of 739.5 mm over 57 year period.
9
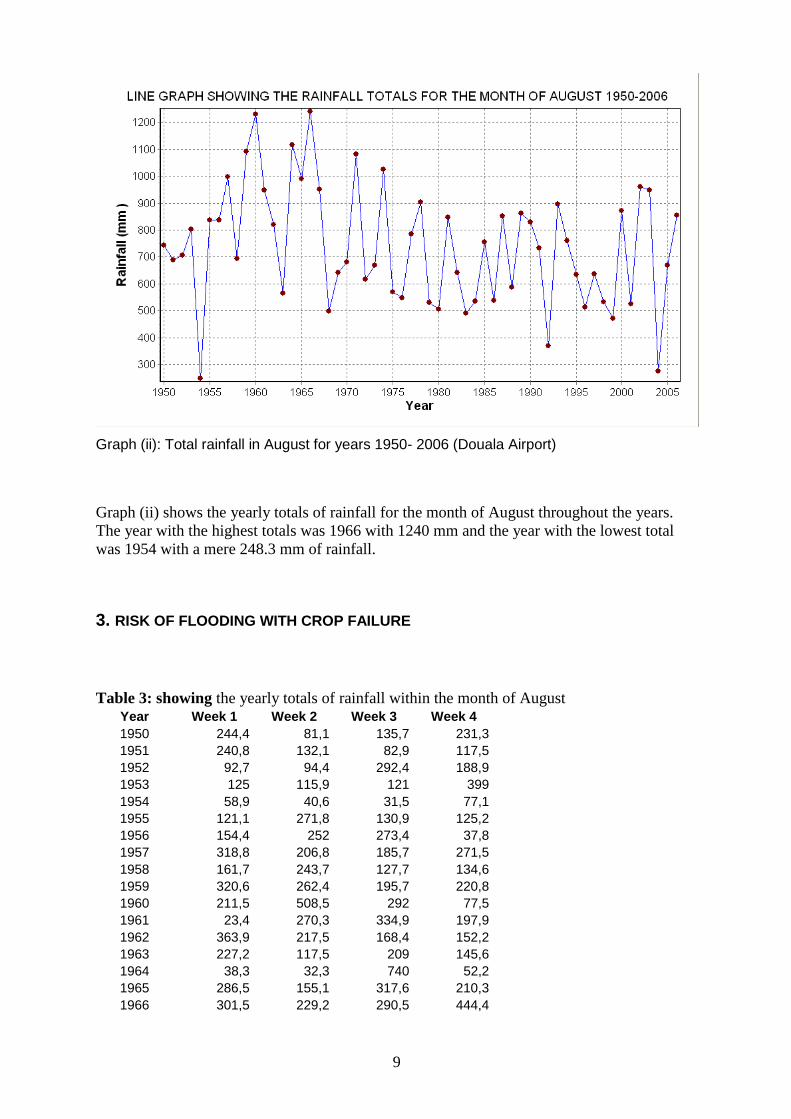
Graph (ii): Total rainfall in August for years 1950- 2006 (Douala Airport)
Graph (ii) shows the yearly totals of rainfall for the month of August throughout the years.
The year with the highest totals was 1966 with 1240 mm and the year with the lowest total
was 1954 with a mere 248.3 mm of rainfall.
3. RISK OF FLOODING WITH CROP FAILURE
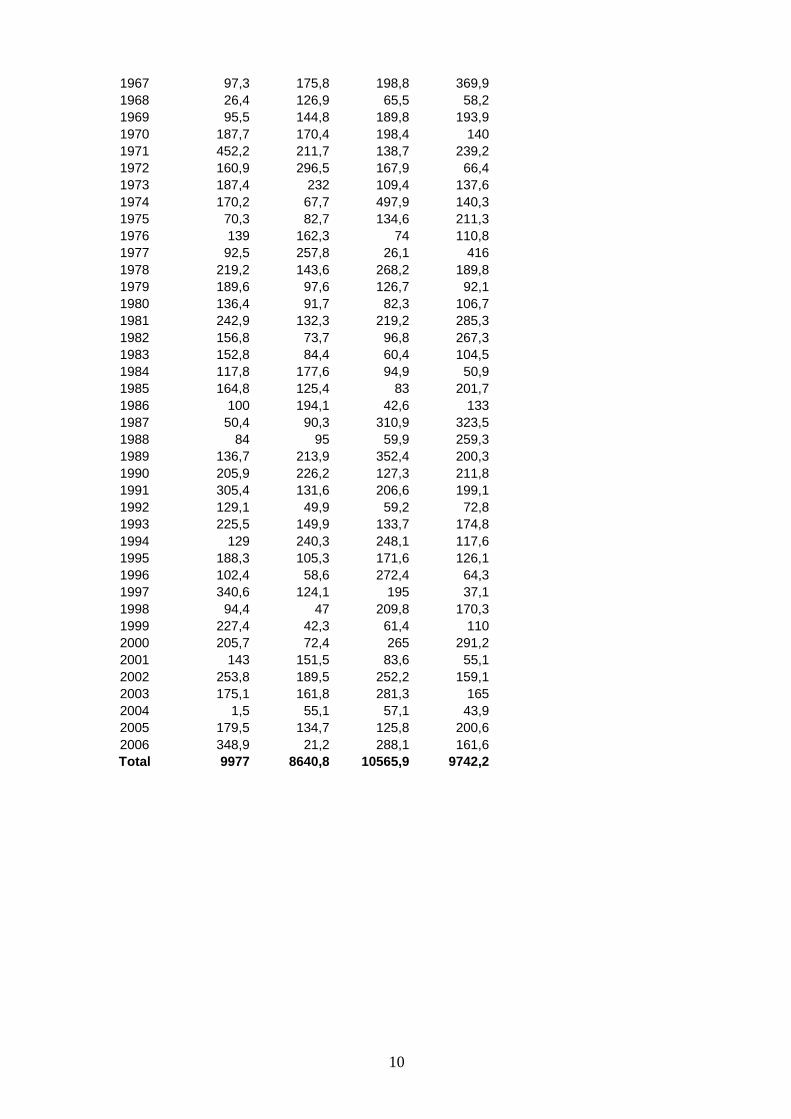
Table 3: showing the yearly totals of rainfall within the month of August
Year Week 1 Week 2 Week 3 Week 4
1950 244,4 81,1 135,7 231,3
1951 240,8 132,1 82,9 117,5
1952 92,7 94,4 292,4 188,9
1953 125 115,9 121 399
1954 58,9 40,6 31,5 77,1
1955 121,1 271,8 130,9 125,2
1956 154,4 252 273,4 37,8
1957 318,8 206,8 185,7 271,5
1958 161,7 243,7 127,7 134,6
1959 320,6 262,4 195,7 220,8
1960 211,5 508,5 292 77,5
1961 23,4 270,3 334,9 197,9
1962 363,9 217,5 168,4 152,2
1963 227,2 117,5 209 145,6
1964 38,3 32,3 740 52,2
1965 286,5 155,1 317,6 210,3
1966 301,5 229,2 290,5 444,4
10
1967 97,3 175,8 198,8 369,9
1968 26,4 126,9 65,5 58,2
1969 95,5 144,8 189,8 193,9
1970 187,7 170,4 198,4 140
1971 452,2 211,7 138,7 239,2
1972 160,9 296,5 167,9 66,4
1973 187,4 232 109,4 137,6
1974 170,2 67,7 497,9 140,3
1975 70,3 82,7 134,6 211,3
1976 139 162,3 74 110,8
1977 92,5 257,8 26,1 416
1978 219,2 143,6 268,2 189,8
1979 189,6 97,6 126,7 92,1
1980 136,4 91,7 82,3 106,7
1981 242,9 132,3 219,2 285,3
1982 156,8 73,7 96,8 267,3
1983 152,8 84,4 60,4 104,5
1984 117,8 177,6 94,9 50,9
1985 164,8 125,4 83 201,7
1986 100 194,1 42,6 133
1987 50,4 90,3 310,9 323,5
1988 84 95 59,9 259,3
1989 136,7 213,9 352,4 200,3
1990 205,9 226,2 127,3 211,8
1991 305,4 131,6 206,6 199,1
1992 129,1 49,9 59,2 72,8
1993 225,5 149,9 133,7 174,8
1994 129 240,3 248,1 117,6
1995 188,3 105,3 171,6 126,1
1996 102,4 58,6 272,4 64,3
1997 340,6 124,1 195 37,1
1998 94,4 47 209,8 170,3
1999 227,4 42,3 61,4 110
2000 205,7 72,4 265 291,2
2001 143 151,5 83,6 55,1
2002 253,8 189,5 252,2 159,1
2003 175,1 161,8 281,3 165
2004 1,5 55,1 57,1 43,9
2005 179,5 134,7 125,8 200,6
2006 348,9 21,2 288,1 161,6
Total 9977 8640,8 10565,9 9742,2
11
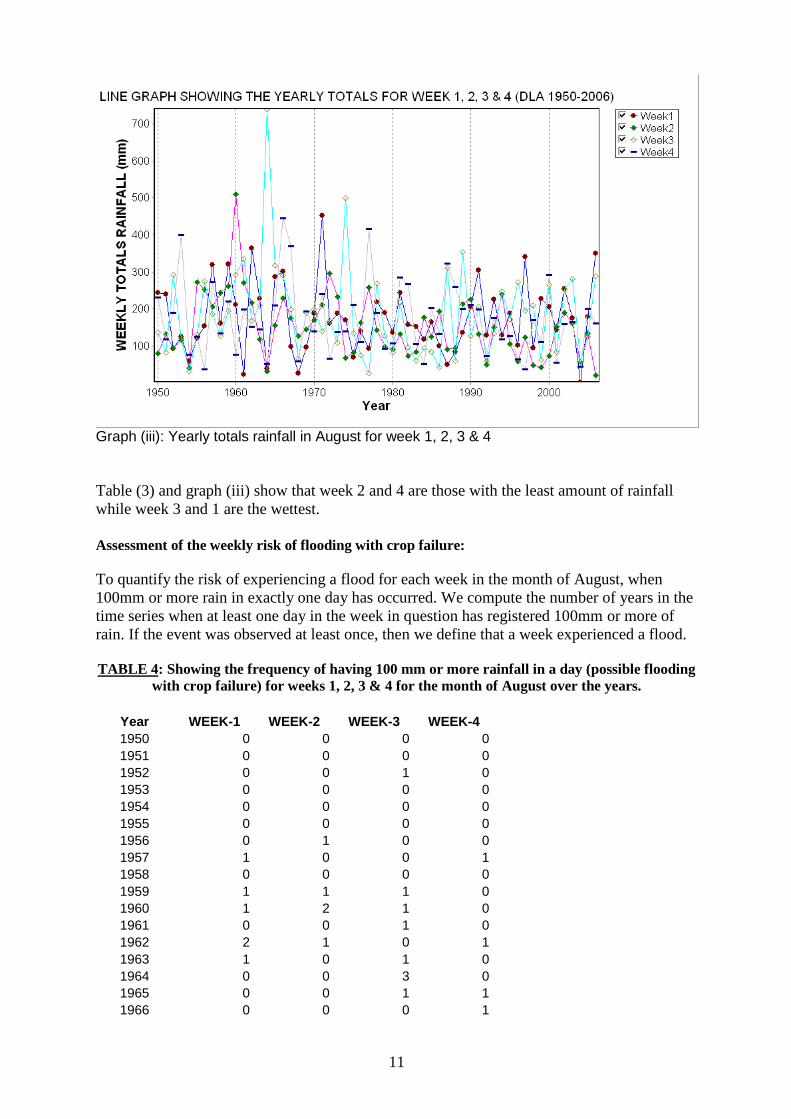
Graph (iii): Yearly totals rainfall in August for week 1, 2, 3 & 4
Table (3) and graph (iii) show that week 2 and 4 are those with the least amount of rainfall
while week 3 and 1 are the wettest.
Assessment of the weekly risk of flooding with crop failure:
To quantify the risk of experiencing a flood for each week in the month of August, when
100mm or more rain in exactly one day has occurred. We compute the number of years in the
time series when at least one day in the week in question has registered 100mm or more of
rain. If the event was observed at least once, then we define that a week experienced a flood.
TABLE 4: Showing the frequency of having 100 mm or more rainfall in a day (possible flooding
with crop failure) for weeks 1, 2, 3 & 4 for the month of August over the years.
Year WEEK-1 WEEK-2 WEEK-3 WEEK-4
1950 0 0 0 0
1951 0 0 0 0
1952 0 0 1 0
1953 0 0 0 0
1954 0 0 0 0
1955 0 0 0 0
1956 0 1 0 0
1957 1 0 0 1
1958 0 0 0 0
1959 1 1 1 0
1960 1 2 1 0
1961 0 0 1 0
1962 2 1 0 1
1963 1 0 1 0
1964 0 0 3 0
1965 0 0 1 1
1966 0 0 0 1
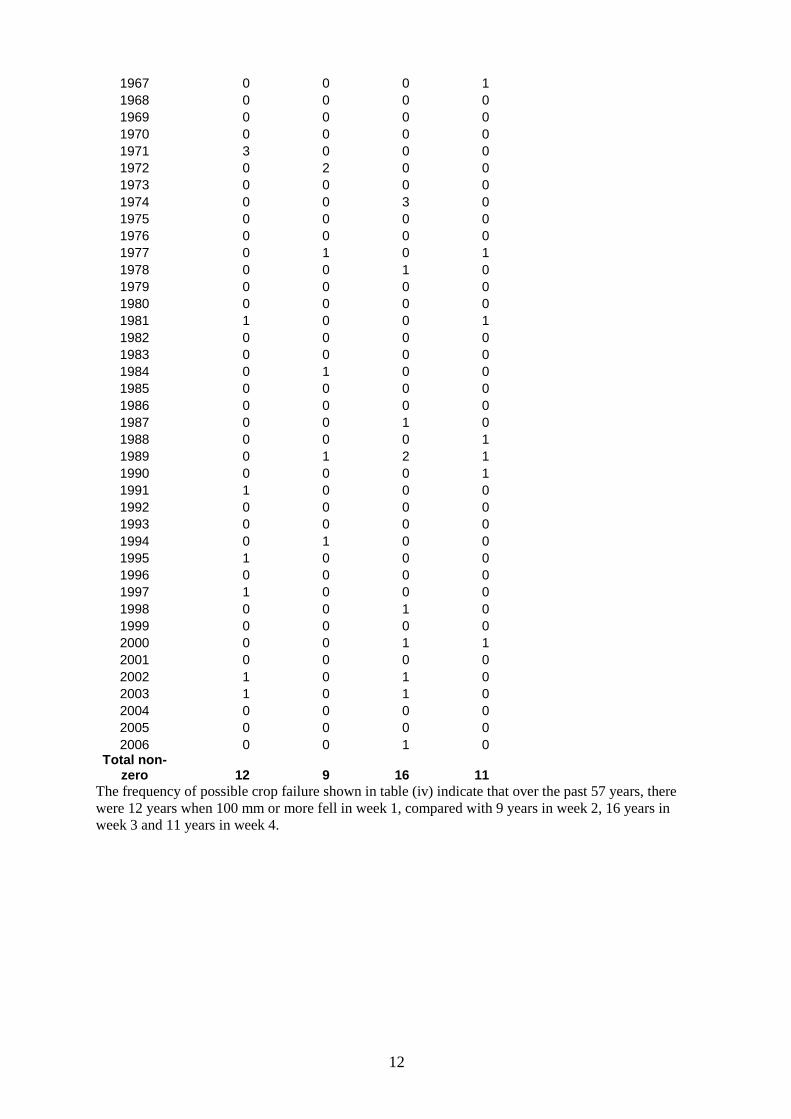
12
1967 0 0 0 1
1968 0 0 0 0
1969 0 0 0 0
1970 0 0 0 0
1971 3 0 0 0
1972 0 2 0 0
1973 0 0 0 0
1974 0 0 3 0
1975 0 0 0 0
1976 0 0 0 0
1977 0 1 0 1
1978 0 0 1 0
1979 0 0 0 0
1980 0 0 0 0
1981 1 0 0 1
1982 0 0 0 0
1983 0 0 0 0
1984 0 1 0 0
1985 0 0 0 0
1986 0 0 0 0
1987 0 0 1 0
1988 0 0 0 1
1989 0 1 2 1
1990 0 0 0 1
1991 1 0 0 0
1992 0 0 0 0
1993 0 0 0 0
1994 0 1 0 0
1995 1 0 0 0
1996 0 0 0 0
1997 1 0 0 0
1998 0 0 1 0
1999 0 0 0 0
2000 0 0 1 1
2001 0 0 0 0
2002 1 0 1 0
2003 1 0 1 0
2004 0 0 0 0
2005 0 0 0 0
2006 0 0 1 0 Total non-
zero 12 9 16 11
The frequency of possible crop failure shown in table (iv) indicate that over the past 57 years, there
were 12 years when 100 mm or more fell in week 1, compared with 9 years in week 2, 16 years in
week 3 and 11 years in week 4.
13
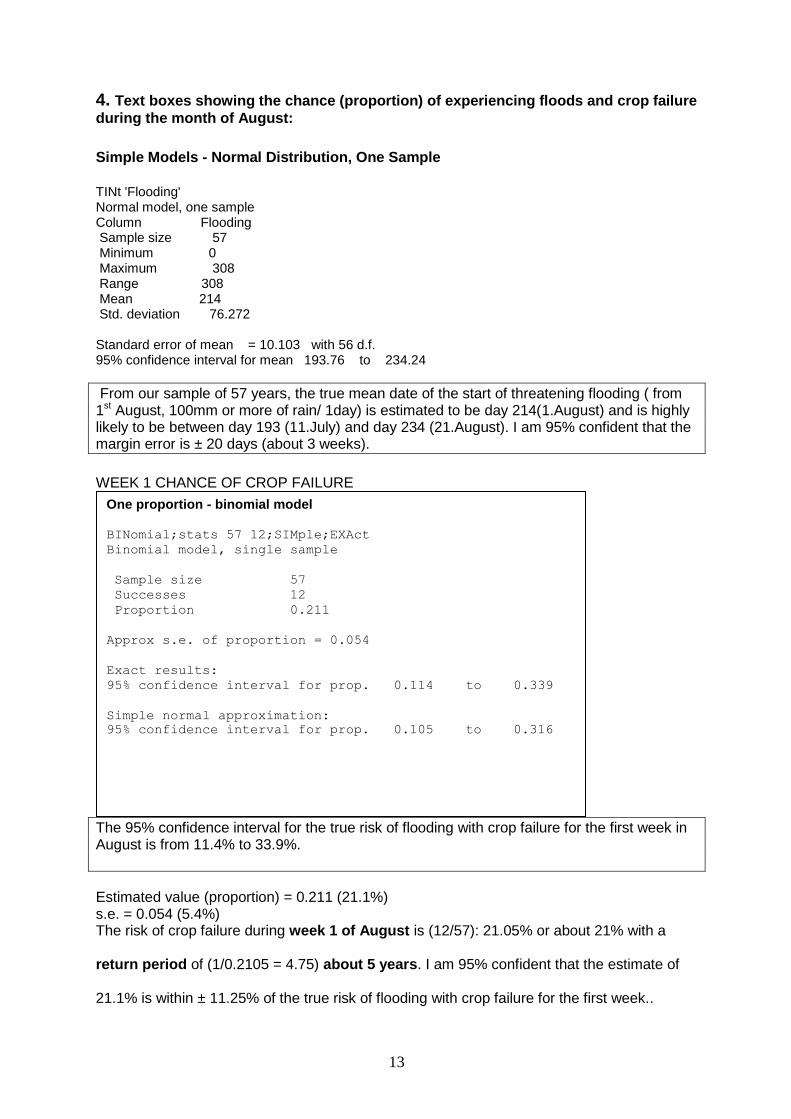
4. Text boxes showing the chance (proportion) of experiencing floods and crop failure
during the month of August:
Simple Models - Normal Distribution, One Sample
TINt 'Flooding' Normal model, one sample Column Flooding Sample size 57 Minimum 0 Maximum 308 Range 308 Mean 214 Std. deviation 76.272 Standard error of mean = 10.103 with 56 d.f. 95% confidence interval for mean 193.76 to 234.24
From our sample of 57 years, the true mean date of the start of threatening flooding ( from 1st August, 100mm or more of rain/ 1day) is estimated to be day 214(1.August) and is highly likely to be between day 193 (11.July) and day 234 (21.August). I am 95% confident that the margin error is ± 20 days (about 3 weeks).
WEEK 1 CHANCE OF CROP FAILURE
The 95% confidence interval for the true risk of flooding with crop failure for the first week in August is from 11.4% to 33.9%.
Estimated value (proportion) = 0.211 (21.1%) s.e. = 0.054 (5.4%) The risk of crop failure during week 1 of August is (12/57): 21.05% or about 21% with a
return period of (1/0.2105 = 4.75) about 5 years. I am 95% confident that the estimate of
21.1% is within ± 11.25% of the true risk of flooding with crop failure for the first week..
One proportion - binomial model
BINomial;stats 57 12;SIMple;EXAct
Binomial model, single sample
Sample size 57
Successes 12
Proportion 0.211
Approx s.e. of proportion = 0.054
Exact results:
95% confidence interval for prop. 0.114 to 0.339
Simple normal approximation:
95% confidence interval for prop. 0.105 to 0.316
14
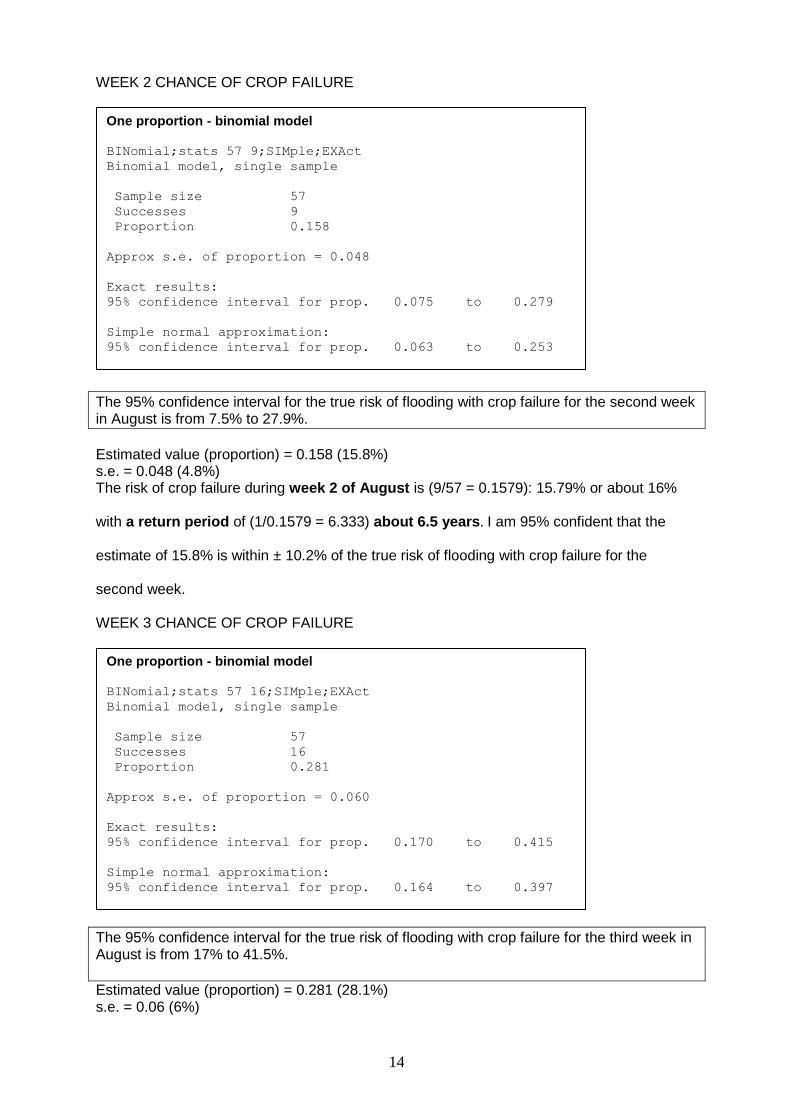
WEEK 2 CHANCE OF CROP FAILURE
The 95% confidence interval for the true risk of flooding with crop failure for the second week in August is from 7.5% to 27.9%.
Estimated value (proportion) = 0.158 (15.8%) s.e. = 0.048 (4.8%) The risk of crop failure during week 2 of August is (9/57 = 0.1579): 15.79% or about 16%
with a return period of (1/0.1579 = 6.333) about 6.5 years. I am 95% confident that the
estimate of 15.8% is within ± 10.2% of the true risk of flooding with crop failure for the
second week.
WEEK 3 CHANCE OF CROP FAILURE
The 95% confidence interval for the true risk of flooding with crop failure for the third week in August is from 17% to 41.5%.
Estimated value (proportion) = 0.281 (28.1%) s.e. = 0.06 (6%)
One proportion - binomial model
BINomial;stats 57 9;SIMple;EXAct
Binomial model, single sample
Sample size 57
Successes 9
Proportion 0.158
Approx s.e. of proportion = 0.048
Exact results:
95% confidence interval for prop. 0.075 to 0.279
Simple normal approximation:
95% confidence interval for prop. 0.063 to 0.253
One proportion - binomial model
BINomial;stats 57 16;SIMple;EXAct
Binomial model, single sample
Sample size 57
Successes 16
Proportion 0.281
Approx s.e. of proportion = 0.060
Exact results:
95% confidence interval for prop. 0.170 to 0.415
Simple normal approximation:
95% confidence interval for prop. 0.164 to 0.397
15
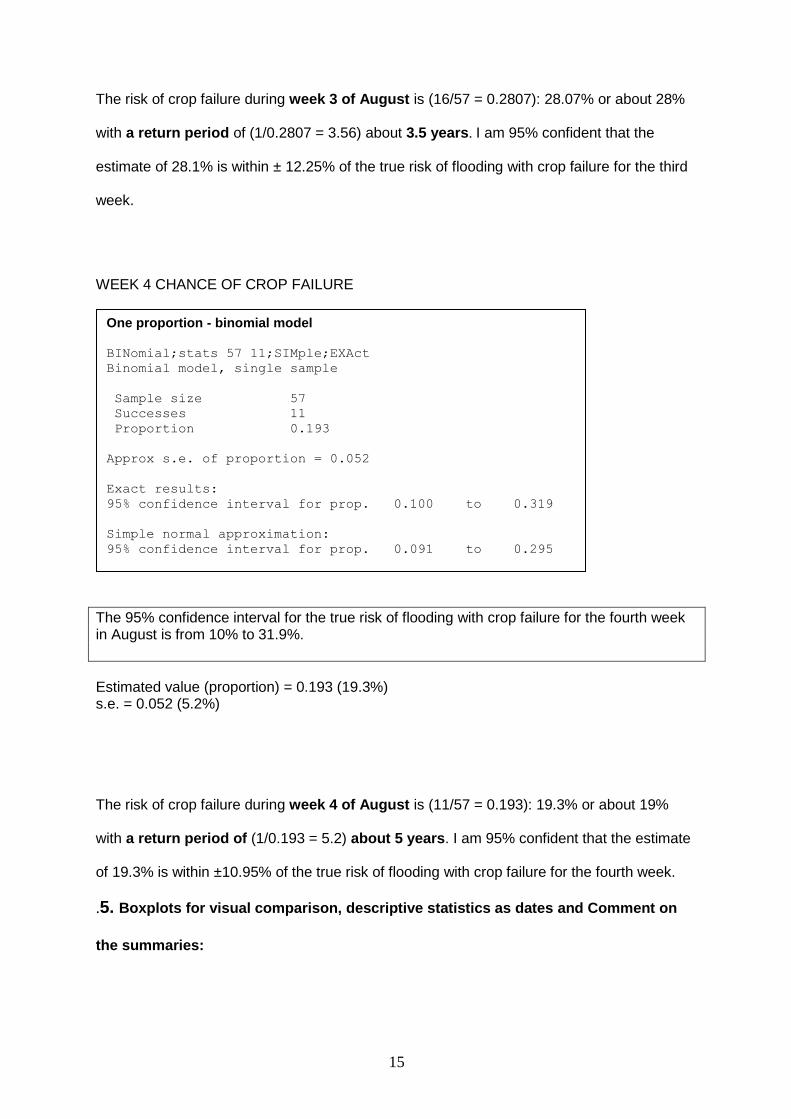
The risk of crop failure during week 3 of August is (16/57 = 0.2807): 28.07% or about 28%
with a return period of (1/0.2807 = 3.56) about 3.5 years. I am 95% confident that the
estimate of 28.1% is within ± 12.25% of the true risk of flooding with crop failure for the third
week.
WEEK 4 CHANCE OF CROP FAILURE
The 95% confidence interval for the true risk of flooding with crop failure for the fourth week in August is from 10% to 31.9%.
Estimated value (proportion) = 0.193 (19.3%) s.e. = 0.052 (5.2%)
The risk of crop failure during week 4 of August is (11/57 = 0.193): 19.3% or about 19%
with a return period of (1/0.193 = 5.2) about 5 years. I am 95% confident that the estimate
of 19.3% is within ±10.95% of the true risk of flooding with crop failure for the fourth week.
.5. Boxplots for visual comparison, descriptive statistics as dates and Comment on
the summaries:
One proportion - binomial model
BINomial;stats 57 11;SIMple;EXAct
Binomial model, single sample
Sample size 57
Successes 11
Proportion 0.193
Approx s.e. of proportion = 0.052
Exact results:
95% confidence interval for prop. 0.100 to 0.319
Simple normal approximation:
95% confidence interval for prop. 0.091 to 0.295
16
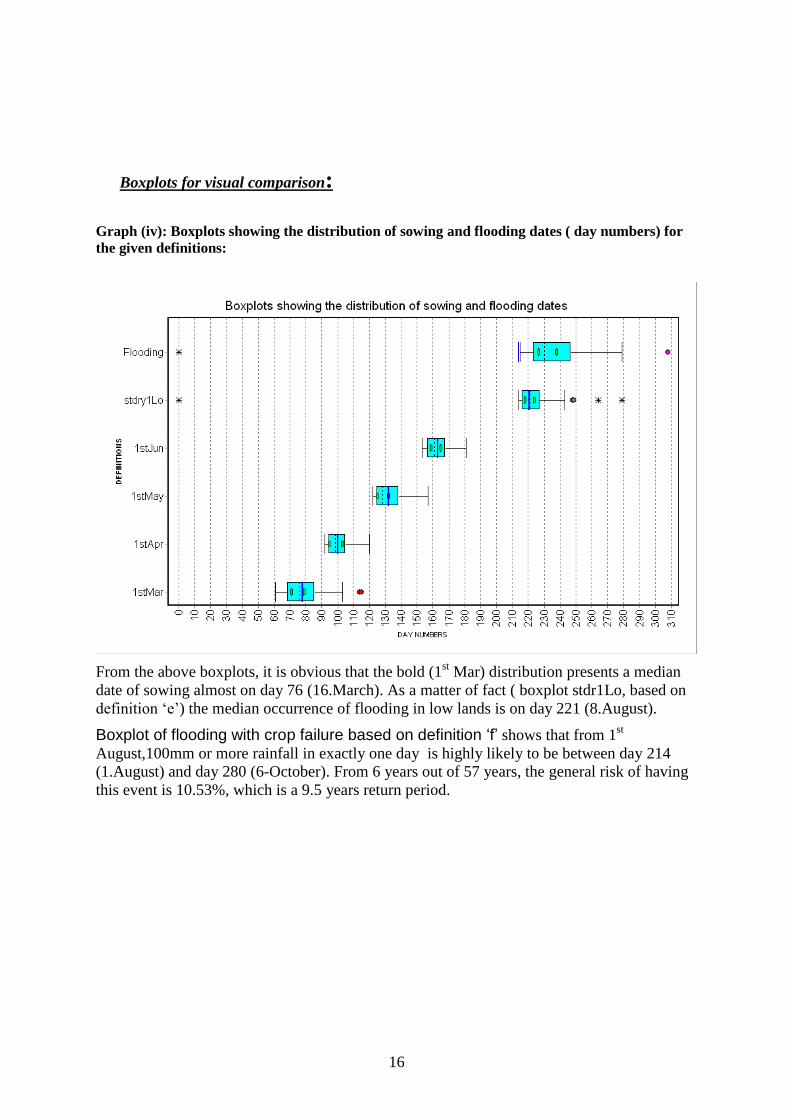
Boxplots for visual comparison:
Graph (iv): Boxplots showing the distribution of sowing and flooding dates ( day numbers) for
the given definitions:
From the above boxplots, it is obvious that the bold (1st Mar) distribution presents a median
date of sowing almost on day 76 (16.March). As a matter of fact ( boxplot stdr1Lo, based on
definition „e‟) the median occurrence of flooding in low lands is on day 221 (8.August).
Boxplot of flooding with crop failure based on definition ‘f’ shows that from 1st
August,100mm or more rainfall in exactly one day is highly likely to be between day 214
(1.August) and day 280 (6-October). From 6 years out of 57 years, the general risk of having
this event is 10.53%, which is a 9.5 years return period.
17
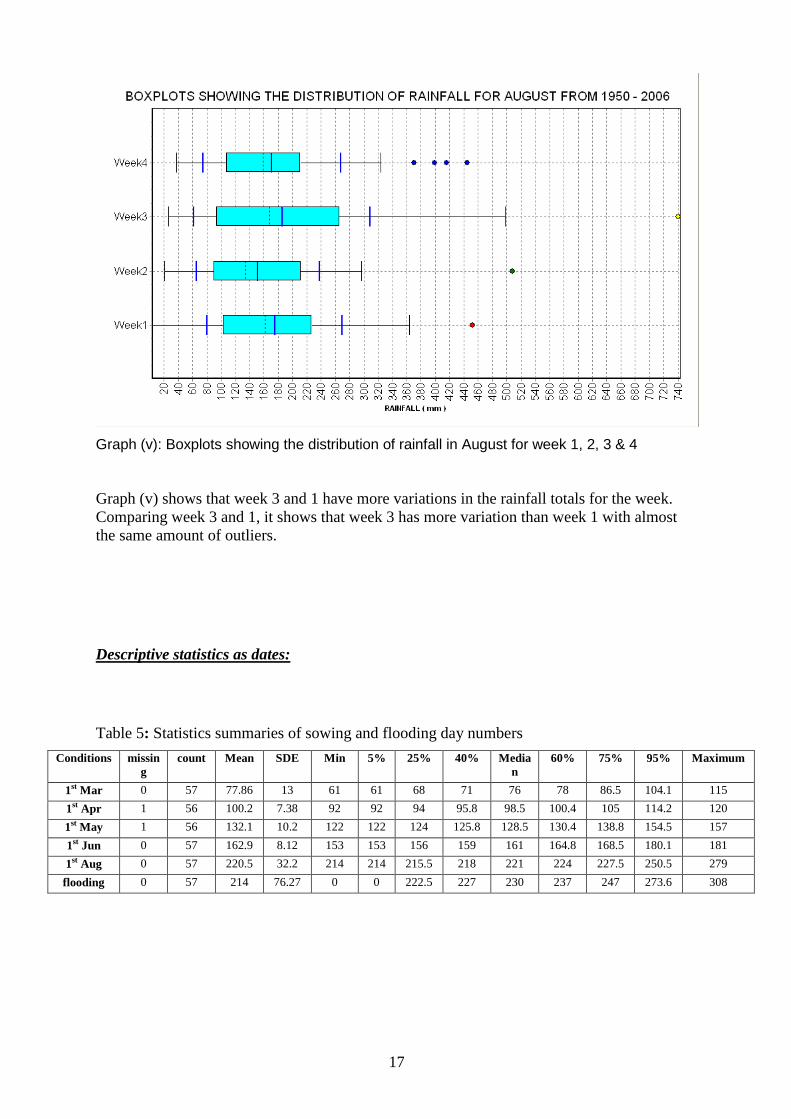
Graph (v): Boxplots showing the distribution of rainfall in August for week 1, 2, 3 & 4
Graph (v) shows that week 3 and 1 have more variations in the rainfall totals for the week.
Comparing week 3 and 1, it shows that week 3 has more variation than week 1 with almost
the same amount of outliers.
Descriptive statistics as dates:
Table 5: Statistics summaries of sowing and flooding day numbers
Conditions missin
g
count Mean SDE Min 5% 25% 40% Media
n
60% 75% 95% Maximum
1st Mar 0 57 77.86 13 61 61 68 71 76 78 86.5 104.1 115
1st Apr 1 56 100.2 7.38 92 92 94 95.8 98.5 100.4 105 114.2 120
1st May 1 56 132.1 10.2 122 122 124 125.8 128.5 130.4 138.8 154.5 157
1st Jun 0 57 162.9 8.12 153 153 156 159 161 164.8 168.5 180.1 181
1st Aug 0 57 220.5 32.2 214 214 215.5 218 221 224 227.5 250.5 279
flooding 0 57 214 76.27 0 0 222.5 227 230 237 247 273.6 308
18
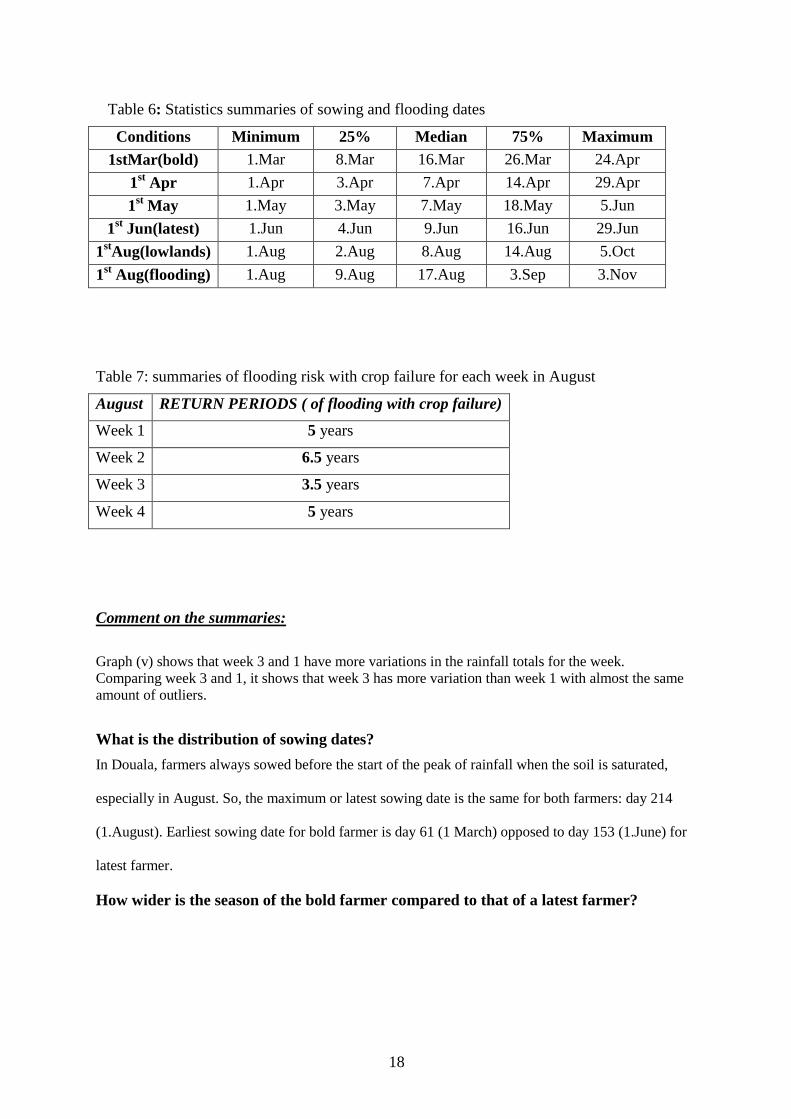
Table 6: Statistics summaries of sowing and flooding dates
Conditions Minimum 25% Median 75% Maximum
1stMar(bold) 1.Mar 8.Mar 16.Mar 26.Mar 24.Apr
1st Apr 1.Apr 3.Apr 7.Apr 14.Apr 29.Apr
1st May 1.May 3.May 7.May 18.May 5.Jun
1st Jun(latest) 1.Jun 4.Jun 9.Jun 16.Jun 29.Jun
1stAug(lowlands) 1.Aug 2.Aug 8.Aug 14.Aug 5.Oct
1st Aug(flooding) 1.Aug 9.Aug 17.Aug 3.Sep 3.Nov
Table 7: summaries of flooding risk with crop failure for each week in August
August RETURN PERIODS ( of flooding with crop failure)
Week 1 5 years
Week 2 6.5 years
Week 3 3.5 years
Week 4 5 years
Comment on the summaries:
Graph (v) shows that week 3 and 1 have more variations in the rainfall totals for the week.
Comparing week 3 and 1, it shows that week 3 has more variation than week 1 with almost the same
amount of outliers.
What is the distribution of sowing dates?
In Douala, farmers always sowed before the start of the peak of rainfall when the soil is saturated,
especially in August. So, the maximum or latest sowing date is the same for both farmers: day 214
(1.August). Earliest sowing date for bold farmer is day 61 (1 March) opposed to day 153 (1.June) for
latest farmer.
How wider is the season of the bold farmer compared to that of a latest farmer?

19
20
Difference in the length of growing season as experienced by bold and latest farmers
Bold farmers Latest farmers
Year Day_number Date Day_number Date Difference
1950 65 5-Mar 155 3-Jun 90
1951 114 23-Apr 160 8-Jun 46
1952 71 11-Mar 153 1-Jun 82
1953 84 24-Mar 159 7-Jun 75
1954 65 5-Mar 159 7-Jun 94
1955 61 1-Mar 166 14-Jun 105
1956 70 10-Mar 154 2-Jun 84
1957 63 3-Mar 161 9-Jun 98
1958 79 19-Mar 169 17-Jun 90
1959 76 16-Mar 159 7-Jun 83
1960 67 7-Mar 171 19-Jun 104
1961 83 23-Mar 181 29-Jun 98
1962 74 14-Mar 159 7-Jun 85
1963 96 5-Apr 156 4-Jun 60
1964 68 8-Mar 156 4-Jun 88
1965 71 11-Mar 161 9-Jun 90
1966 67 7-Mar 157 5-Jun 90
1967 103 12-Apr 168 16-Jun 65
1968 66 6-Mar 161 9-Jun 95
1969 63 3-Mar 174 22-Jun 111
1970 78 18-Mar 177 25-Jun 99
1971 78 18-Mar 165 13-Jun 87
1972 89 29-Mar 154 2-Jun 65
1973 78 18-Mar 153 1-Jun 75
1974 72 12-Mar 181 29-Jun 109
1975 68 8-Mar 159 7-Jun 91
1976 93 2-Apr 157 5-Jun 64
1977 89 29-Mar 164 12-Jun 75
1978 96 5-Apr 153 1-Jun 57
1979 63 3-Mar 153 1-Jun 90
1980 77 17-Mar 154 2-Jun 77
1981 78 18-Mar 160 8-Jun 82
1982 70 10-Mar 180 28-Jun 110
1983 88 28-Mar 174 22-Jun 86
1984 70 10-Mar 173 21-Jun 103
1985 75 15-Mar 165 13-Jun 90
1986 89 29-Mar 156 4-Jun 67
1987 67 7-Mar 178 26-Jun 111
1988 68 8-Mar 169 17-Jun 101
1989 80 20-Mar 164 12-Jun 84
1990 115 24-Apr 154 2-Jun 39
1991 99 8-Apr 173 21-Jun 74
1992 68 8-Mar 165 13-Jun 97
1993 69 9-Mar 155 3-Jun 86
1994 83 23-Mar 174 22-Jun 91
1995 77 17-Mar 157 5-Jun 80
1996 61 1-Mar 153 1-Jun 92
1997 85 25-Mar 168 16-Jun 83
1998 97 6-Apr 167 15-Jun 70
1999 88 28-Mar 170 18-Jun 82
2000 82 22-Mar 157 5-Jun 75
21
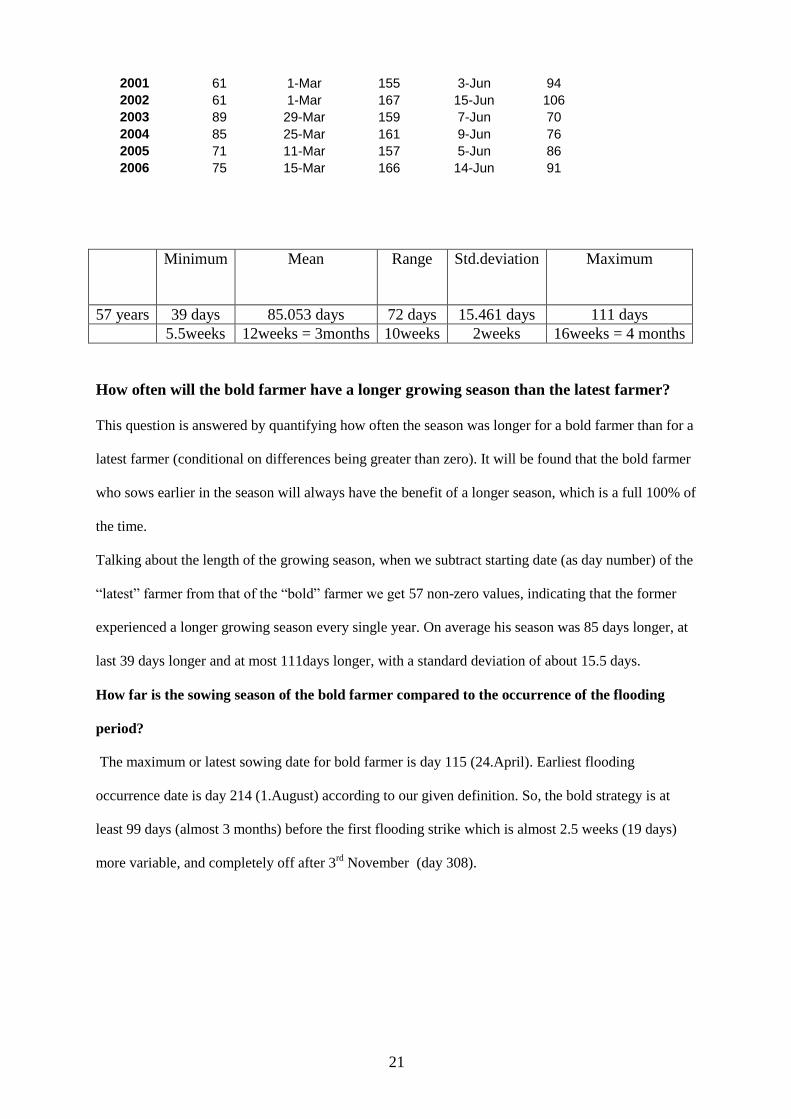
2001 61 1-Mar 155 3-Jun 94
2002 61 1-Mar 167 15-Jun 106
2003 89 29-Mar 159 7-Jun 70
2004 85 25-Mar 161 9-Jun 76
2005 71 11-Mar 157 5-Jun 86
2006 75 15-Mar 166 14-Jun 91
Minimum Mean Range Std.deviation Maximum
57 years 39 days 85.053 days 72 days 15.461 days 111 days
5.5weeks 12weeks = 3months 10weeks 2weeks 16weeks = 4 months
How often will the bold farmer have a longer growing season than the latest farmer?
This question is answered by quantifying how often the season was longer for a bold farmer than for a
latest farmer (conditional on differences being greater than zero). It will be found that the bold farmer
who sows earlier in the season will always have the benefit of a longer season, which is a full 100% of
the time.
Talking about the length of the growing season, when we subtract starting date (as day number) of the
“latest” farmer from that of the “bold” farmer we get 57 non-zero values, indicating that the former
experienced a longer growing season every single year. On average his season was 85 days longer, at
last 39 days longer and at most 111days longer, with a standard deviation of about 15.5 days.
How far is the sowing season of the bold farmer compared to the occurrence of the flooding
period?
The maximum or latest sowing date for bold farmer is day 115 (24.April). Earliest flooding
occurrence date is day 214 (1.August) according to our given definition. So, the bold strategy is at
least 99 days (almost 3 months) before the first flooding strike which is almost 2.5 weeks (19 days)
more variable, and completely off after 3rd
November (day 308).
22
F. IMPLICATIONS:
Some conclusions for the client (Ministry of agriculture) based on these
summaries and risks calculations.
At last, we could say the highest true risk of experiencing flood with crop failure is observed once
every 3.5 years during the third week of August. There is little difference between weeks 1 and 4 with
a chance of flooding with crop disruption every 5 years. The smallest risk is observed in week 2 with a
6.5 years return period.
1. The “sowing strategy” definition that I would recommend to a farmer
The “sowing strategy” definition that I would recommend to a farmer is the bold method.
2. The advantages
The advantages could be:
The greatest (range =54 days) and variable (s.d. =13 days) spread of sowing dates.
The possibility to harvest more than one type of crops within this long sowing period.
The possibility of choosing the accurate crop to match the expected season length, with
higher yield.
A crop growing during a shorter season (3 months) can be sow, with (57/57) 100 % risk
or zero risk not to meet a long dry spell.
As the threshold rainfall for sowing is high (40 mm), chance of crop failure is low even
if there is long dry spell later.
Hence, by sowing earlier, the risk of early crop failure due to flood could be greatly
reduced even in low lands because after three months, the growing stage enables more
plants‟ maturity to face flooding events and the farmer can gain in confidence in the
whole system of recommendations.
3. The disadvantages
The disadvantages could be:
Even with a better seasonal forecast, there still be at least once every three (3)
years a chance of crop destruction in Douala, during the peak period (July,
August, and September) of rainfall when the soil is saturated, especially in
August.
The flooding event in low land areas has a range of 65 days (about 2 months).
There is highest interannual variability i.e. spread in flooding dates with a
variability of 32 days (about 4.5 weeks mainly within the month of August). So
maximum awareness must be taken around day 221(8.August) and also the
farmer needs to keep himself in state of preparedness for this period so as to
take action of the 1st occasion to protect or to secure the crop). That is why I
strongly recommend to the farmers dwelling in Douala and surrounding:
“Please! Sow earlier!”.
23
G.APPENDICES:
Appendix A: References and sources documentation
Instat Climatic Guide Chapters 4-7 Roger Stern, Derk Rijks, Ian Dale, Joan Knock ed. January 2006
Confidence and significance: Key Concepts of Inferential Statistics, the University of Reading
Statistical Services Centre, February 2006
Climatic e-books (www.reading.ac.uk/ssc )
CAST for SADC ( www.ssc.rdg.ac.uk/sadc-training-pack/)
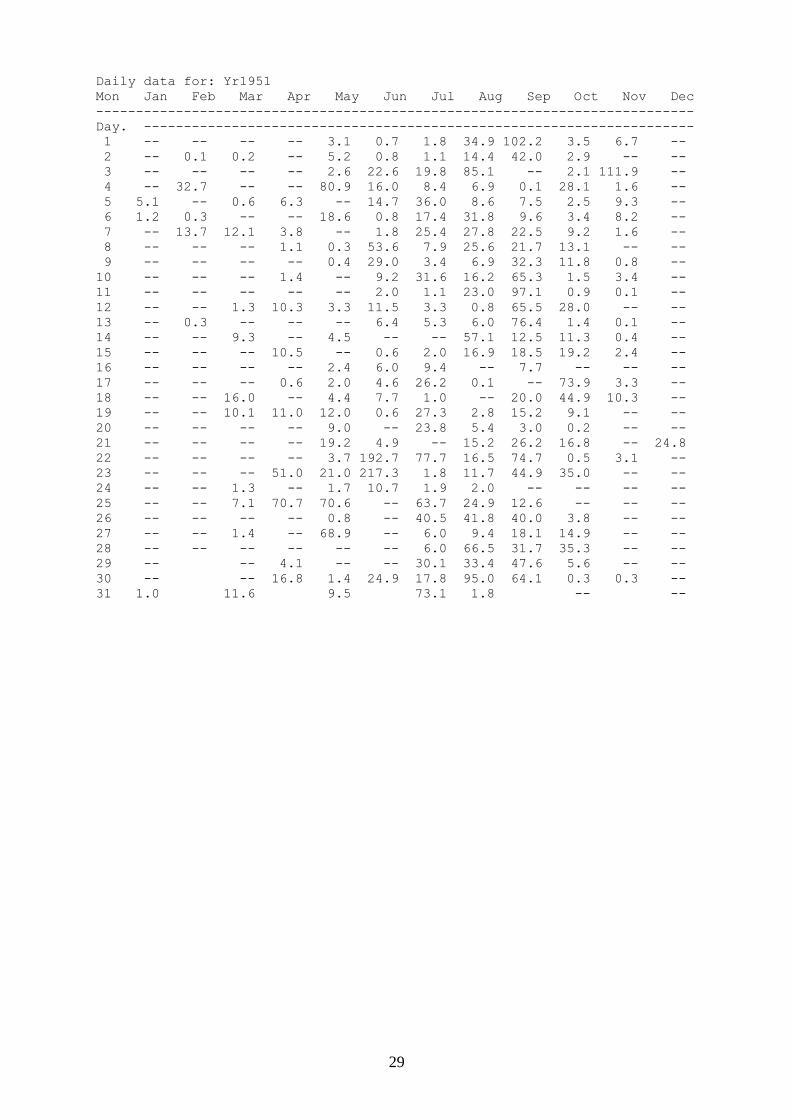
Appendix: Daily data for Douala, Cameroon 1950-2006
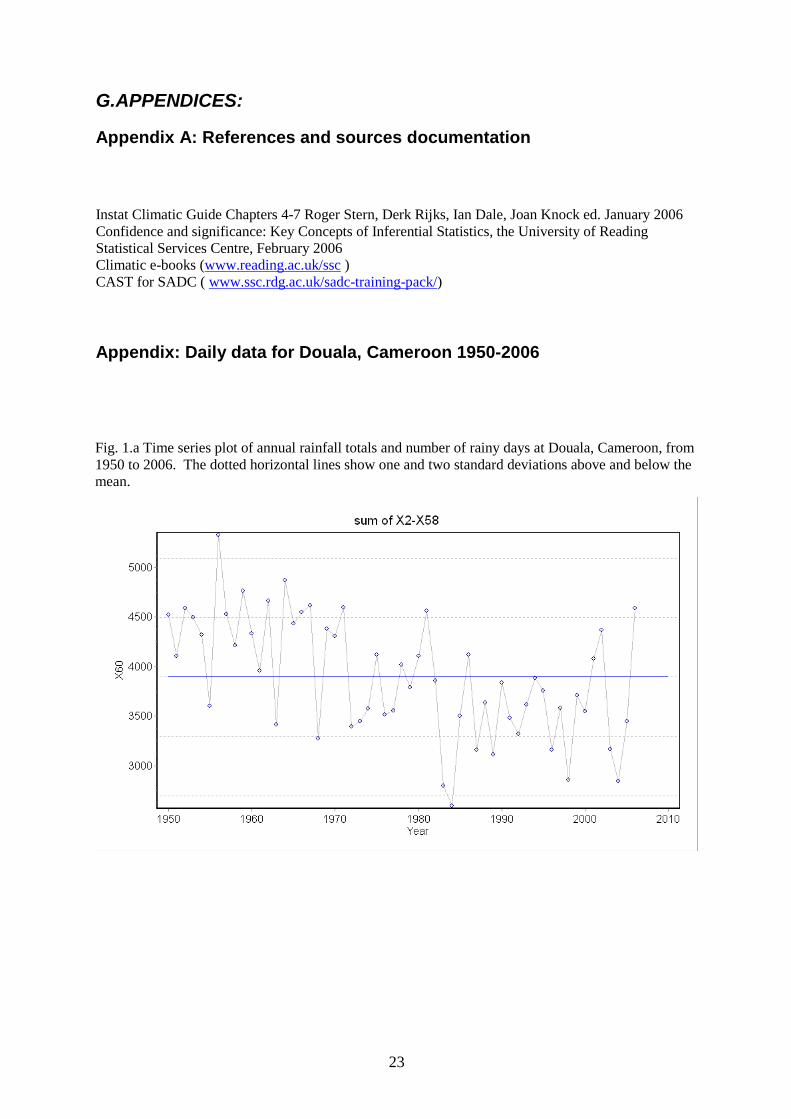
Fig. 1.a Time series plot of annual rainfall totals and number of rainy days at Douala, Cameroon, from
1950 to 2006. The dotted horizontal lines show one and two standard deviations above and below the
mean.
24
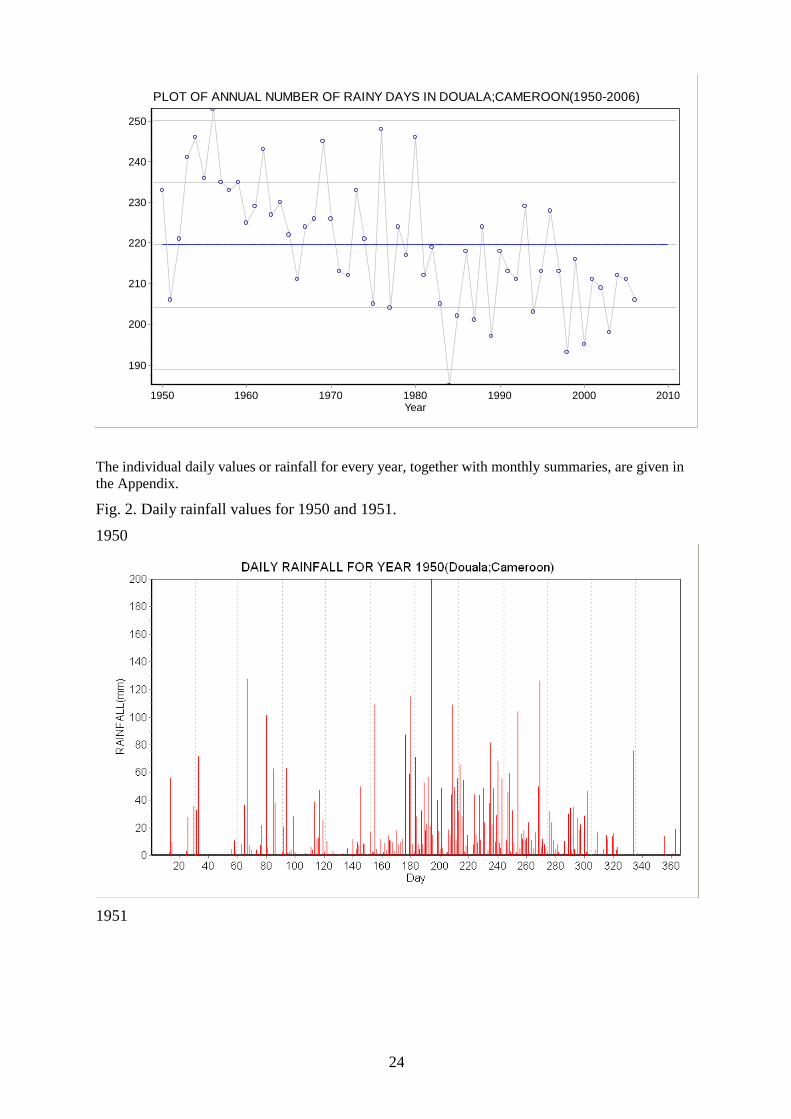
PLOT OF ANNUAL NUMBER OF RAINY DAYS IN DOUALA;CAMEROON(1950-2006)
Year2010200019901980197019601950
RA
INY
DA
YS
250
240
230
220
210
200
190
The individual daily values or rainfall for every year, together with monthly summaries, are given in
the Appendix.
Fig. 2. Daily rainfall values for 1950 and 1951.
1950
1951
25
Figure 2 shows the pattern of rainfall through the year for two years. Notice the „false start‟ to the
season in each year, where a few early days of rainfall are followed by a long spell of dry days.
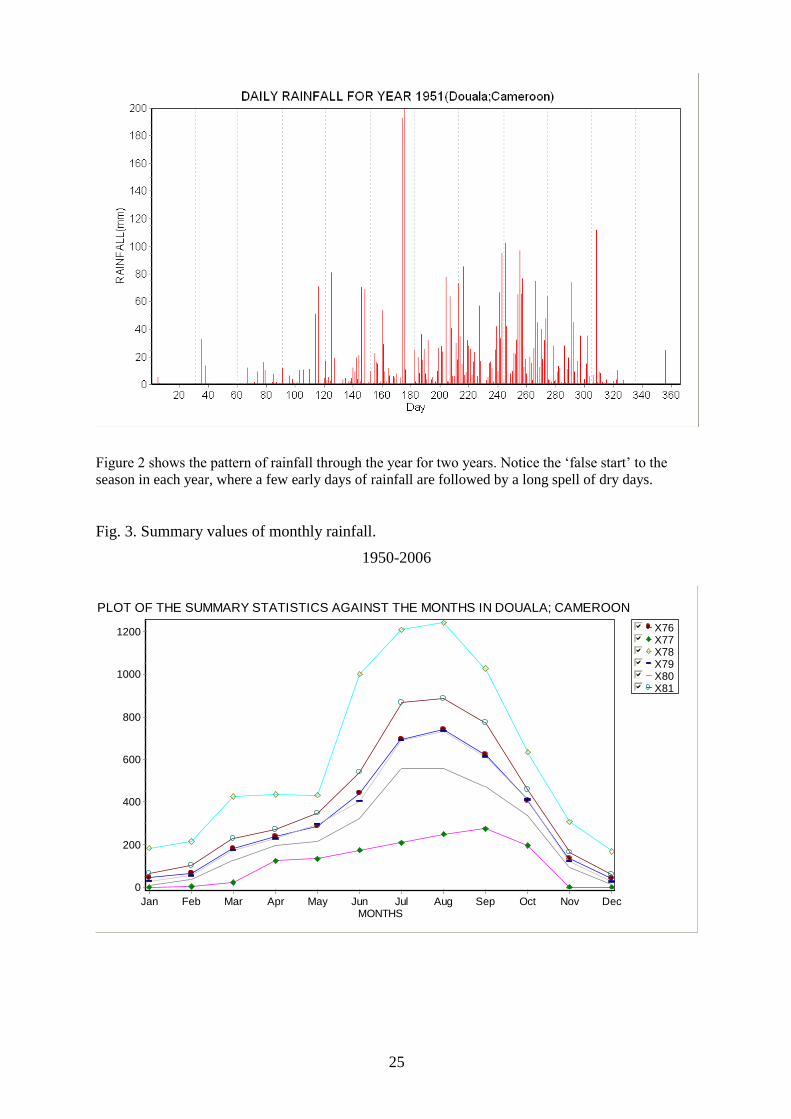
Fig. 3. Summary values of monthly rainfall.
1950-2006
X76gfedcb
X77gfedcb
X78gfedcb
X79gfedcb
X80gfedcb
X81gfedcb
PLOT OF THE SUMMARY STATISTICS AGAINST THE MONTHS IN DOUALA; CAMEROON
MONTHSJan Feb Mar Apr May Jun Jul Aug Sep Oct Nov Dec
1200
1000
800
600
400
200
0
26
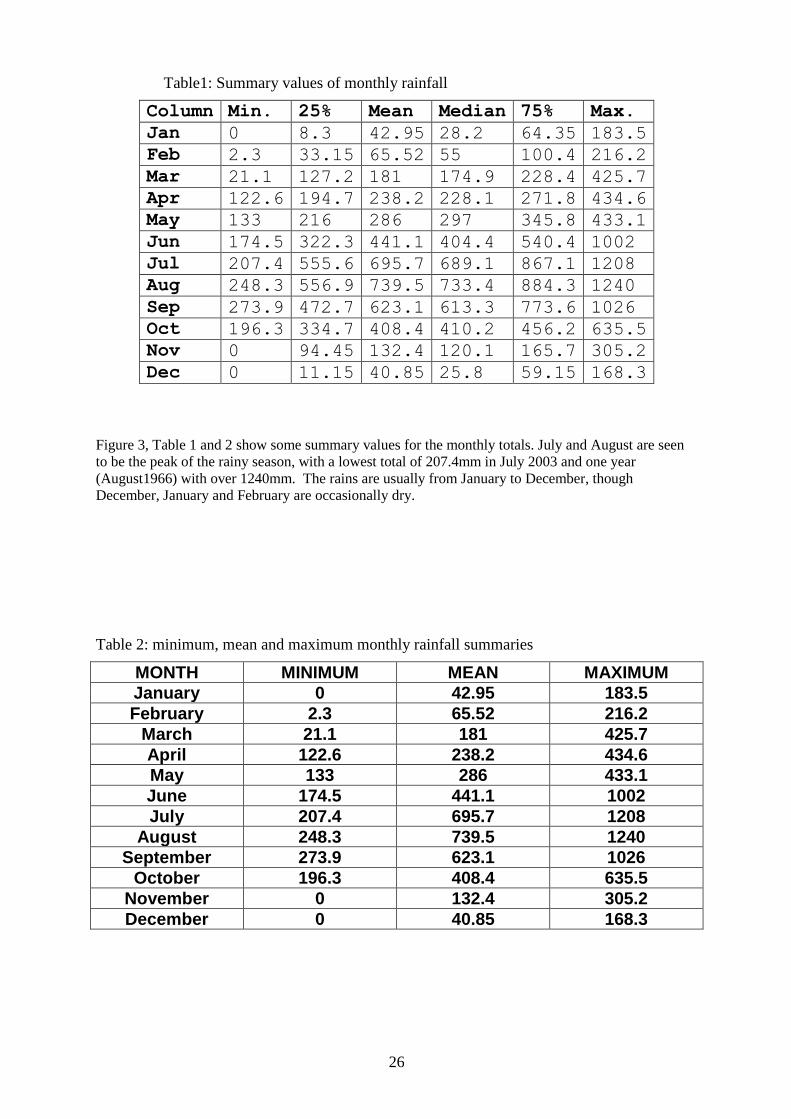
Table1: Summary values of monthly rainfall
Column Min. 25% Mean Median 75% Max.
Jan 0 8.3 42.95 28.2 64.35 183.5
Feb 2.3 33.15 65.52 55 100.4 216.2
Mar 21.1 127.2 181 174.9 228.4 425.7
Apr 122.6 194.7 238.2 228.1 271.8 434.6
May 133 216 286 297 345.8 433.1
Jun 174.5 322.3 441.1 404.4 540.4 1002
Jul 207.4 555.6 695.7 689.1 867.1 1208
Aug 248.3 556.9 739.5 733.4 884.3 1240
Sep 273.9 472.7 623.1 613.3 773.6 1026
Oct 196.3 334.7 408.4 410.2 456.2 635.5
Nov 0 94.45 132.4 120.1 165.7 305.2
Dec 0 11.15 40.85 25.8 59.15 168.3
Figure 3, Table 1 and 2 show some summary values for the monthly totals. July and August are seen
to be the peak of the rainy season, with a lowest total of 207.4mm in July 2003 and one year
(August1966) with over 1240mm. The rains are usually from January to December, though
December, January and February are occasionally dry.
Table 2: minimum, mean and maximum monthly rainfall summaries
MONTH MINIMUM MEAN MAXIMUM
January 0 42.95 183.5
February 2.3 65.52 216.2
March 21.1 181 425.7
April 122.6 238.2 434.6
May 133 286 433.1
June 174.5 441.1 1002
July 207.4 695.7 1208
August 248.3 739.5 1240
September 273.9 623.1 1026
October 196.3 408.4 635.5
November 0 132.4 305.2
December 0 40.85 168.3
27
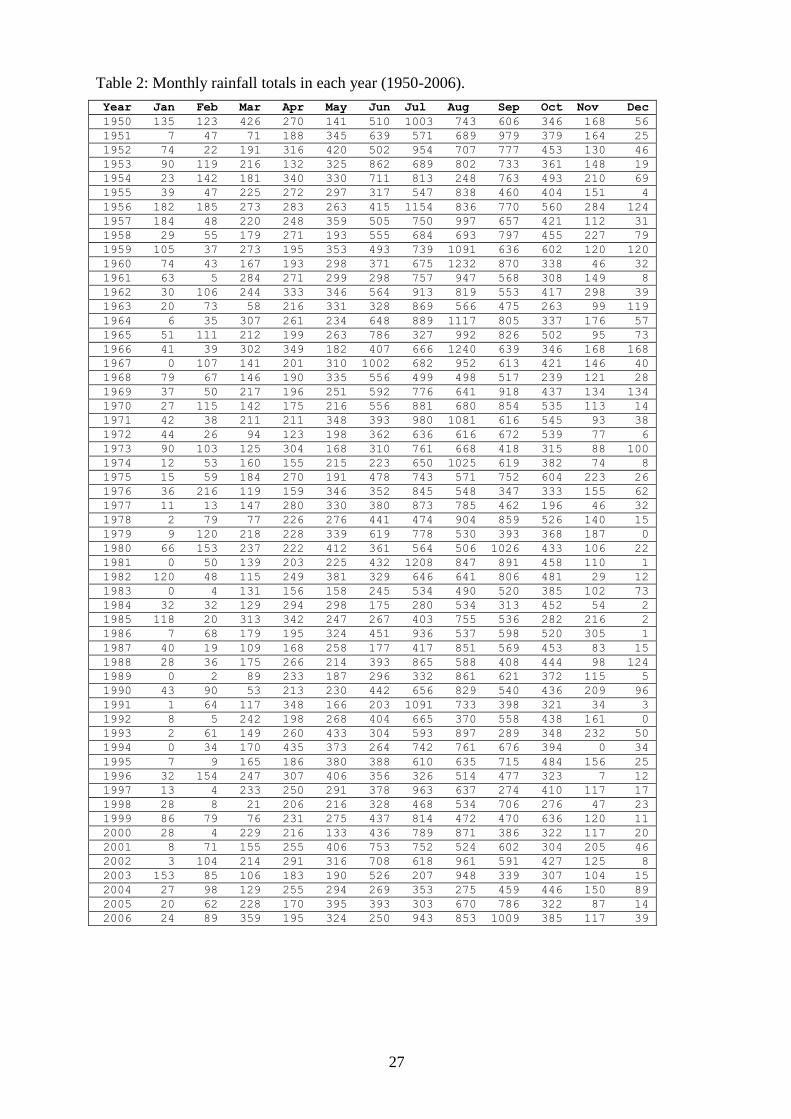
Table 2: Monthly rainfall totals in each year (1950-2006).
Year Jan Feb Mar Apr May Jun Jul Aug Sep Oct Nov Dec
1950 135 123 426 270 141 510 1003 743 606 346 168 56
1951 7 47 71 188 345 639 571 689 979 379 164 25
1952 74 22 191 316 420 502 954 707 777 453 130 46
1953 90 119 216 132 325 862 689 802 733 361 148 19
1954 23 142 181 340 330 711 813 248 763 493 210 69
1955 39 47 225 272 297 317 547 838 460 404 151 4
1956 182 185 273 283 263 415 1154 836 770 560 284 124
1957 184 48 220 248 359 505 750 997 657 421 112 31
1958 29 55 179 271 193 555 684 693 797 455 227 79
1959 105 37 273 195 353 493 739 1091 636 602 120 120
1960 74 43 167 193 298 371 675 1232 870 338 46 32
1961 63 5 284 271 299 298 757 947 568 308 149 8
1962 30 106 244 333 346 564 913 819 553 417 298 39
1963 20 73 58 216 331 328 869 566 475 263 99 119
1964 6 35 307 261 234 648 889 1117 805 337 176 57
1965 51 111 212 199 263 786 327 992 826 502 95 73
1966 41 39 302 349 182 407 666 1240 639 346 168 168
1967 0 107 141 201 310 1002 682 952 613 421 146 40
1968 79 67 146 190 335 556 499 498 517 239 121 28
1969 37 50 217 196 251 592 776 641 918 437 134 134
1970 27 115 142 175 216 556 881 680 854 535 113 14
1971 42 38 211 211 348 393 980 1081 616 545 93 38
1972 44 26 94 123 198 362 636 616 672 539 77 6
1973 90 103 125 304 168 310 761 668 418 315 88 100
1974 12 53 160 155 215 223 650 1025 619 382 74 8
1975 15 59 184 270 191 478 743 571 752 604 223 26
1976 36 216 119 159 346 352 845 548 347 333 155 62
1977 11 13 147 280 330 380 873 785 462 196 46 32
1978 2 79 77 226 276 441 474 904 859 526 140 15
1979 9 120 218 228 339 619 778 530 393 368 187 0
1980 66 153 237 222 412 361 564 506 1026 433 106 22
1981 0 50 139 203 225 432 1208 847 891 458 110 1
1982 120 48 115 249 381 329 646 641 806 481 29 12
1983 0 4 131 156 158 245 534 490 520 385 102 73
1984 32 32 129 294 298 175 280 534 313 452 54 2
1985 118 20 313 342 247 267 403 755 536 282 216 2
1986 7 68 179 195 324 451 936 537 598 520 305 1
1987 40 19 109 168 258 177 417 851 569 453 83 15
1988 28 36 175 266 214 393 865 588 408 444 98 124
1989 0 2 89 233 187 296 332 861 621 372 115 5
1990 43 90 53 213 230 442 656 829 540 436 209 96
1991 1 64 117 348 166 203 1091 733 398 321 34 3
1992 8 5 242 198 268 404 665 370 558 438 161 0
1993 2 61 149 260 433 304 593 897 289 348 232 50
1994 0 34 170 435 373 264 742 761 676 394 0 34
1995 7 9 165 186 380 388 610 635 715 484 156 25
1996 32 154 247 307 406 356 326 514 477 323 7 12
1997 13 4 233 250 291 378 963 637 274 410 117 17
1998 28 8 21 206 216 328 468 534 706 276 47 23
1999 86 79 76 231 275 437 814 472 470 636 120 11
2000 28 4 229 216 133 436 789 871 386 322 117 20
2001 8 71 155 255 406 753 752 524 602 304 205 46
2002 3 104 214 291 316 708 618 961 591 427 125 8
2003 153 85 106 183 190 526 207 948 339 307 104 15
2004 27 98 129 255 294 269 353 275 459 446 150 89
2005 20 62 228 170 395 393 303 670 786 322 87 14
2006 24 89 359 195 324 250 943 853 1009 385 117 39
28
Appendix: Daily data for Douala, Cameroon 1950-2006
Daily data for: Yr1950
Mon Jan Feb Mar Apr May Jun Jul Aug Sep Oct Nov Dec
---------------------------------------------------------------------------
Day. ---------------------------------------------------------------------
1 -- 32.6 -- 20.3 10.2 2.6 71.0 65.6 -- 0.1 0.1 1.6
2 -- 72.0 0.1 -- 0.9 1.7 28.0 28.0 11.0 32.0 3.8 --
3 -- -- 8.0 63.0 0.1 109.6 7.8 54.4 45.6 23.5 -- --
4 -- -- -- 1.5 -- 4.2 4.1 2.6 59.5 10.4 16.9 --
5 0.4 -- 36.2 1.7 3.0 -- 32.1 6.6 2.4 0.8 0.2 --
6 -- -- -- 4.0 -- 1.0 7.7 14.4 32.5 4.4 -- --
7 -- -- 127.8 -- 1.0 11.7 52.7 0.3 9.0 7.6 -- --
8 -- 0.7 7.2 27.9 0.1 -- 17.7 -- 1.2 1.8 4.1 --
9 -- -- -- 2.6 -- 1.7 22.8 -- 2.0 -- -- --
10 -- -- 3.3 -- 0.6 8.9 56.8 7.7 104.0 1.1 14.3 --
11 -- -- -- -- -- 3.7 21.3 44.0 4.6 1.5 11.5 --
12 -- -- 0.2 -- 1.3 14.3 215.0 14.7 15.6 10.1 -- --
13 2.3 -- 4.0 -- -- 10.5 14.4 9.1 11.6 -- -- --
14 56.0 -- -- -- 0.8 10.5 -- 43.3 17.7 0.2 13.5 --
15 9.7 -- -- 0.3 4.9 9.0 -- 11.2 10.7 29.9 16.1 --
16 -- -- 7.0 1.3 -- -- 39.8 0.2 12.5 34.0 0.3 --
17 -- -- 21.6 -- 0.7 2.8 17.5 48.5 23.7 3.9 3.9 --
18 -- -- -- -- 0.2 17.8 4.3 23.4 1.1 34.5 5.8 --
19 -- -- 0.7 -- 11.6 7.9 48.6 -- 10.7 4.3 0.5 1.2
20 -- -- 101.2 5.7 0.5 -- 4.8 3.8 0.2 1.1 -- 13.9
21 -- -- 5.5 3.7 4.1 9.4 0.3 37.8 4.6 26.8 -- 0.7
22 -- -- -- 38.4 9.1 11.5 1.7 81.4 16.5 18.2 0.7 --
23 -- -- 0.2 -- 7.3 -- 1.8 22.0 0.2 22.0 -- --
24 -- -- -- 11.5 49.6 87.1 18.3 48.1 49.8 0.4 -- --
25 2.9 4.1 62.5 12.3 0.9 0.1 14.4 9.5 126.2 -- -- --
26 27.7 -- 37.8 47.1 8.2 -- 43.9 28.7 6.3 28.4 -- 1.6
27 -- 10.8 -- -- 7.9 58.9 108.9 68.0 11.8 2.0 0.2 --
28 -- 2.5 -- 25.4 -- 115.0 49.1 8.5 7.5 46.2 -- 18.9
29 -- -- 2.6 0.5 8.2 10.5 5.2 5.5 0.6 75.8 --
30 35.5 0.7 0.6 0.2 2.3 55.2 55.3 1.7 -- 0.2 --
31 -- 1.7 17.0 32.0 1.1 -- 18.4
29
Daily data for: Yr1951
Mon Jan Feb Mar Apr May Jun Jul Aug Sep Oct Nov Dec
---------------------------------------------------------------------------
Day. ---------------------------------------------------------------------
1 -- -- -- -- 3.1 0.7 1.8 34.9 102.2 3.5 6.7 --
2 -- 0.1 0.2 -- 5.2 0.8 1.1 14.4 42.0 2.9 -- --
3 -- -- -- -- 2.6 22.6 19.8 85.1 -- 2.1 111.9 --
4 -- 32.7 -- -- 80.9 16.0 8.4 6.9 0.1 28.1 1.6 --
5 5.1 -- 0.6 6.3 -- 14.7 36.0 8.6 7.5 2.5 9.3 --
6 1.2 0.3 -- -- 18.6 0.8 17.4 31.8 9.6 3.4 8.2 --
7 -- 13.7 12.1 3.8 -- 1.8 25.4 27.8 22.5 9.2 1.6 --
8 -- -- -- 1.1 0.3 53.6 7.9 25.6 21.7 13.1 -- --
9 -- -- -- -- 0.4 29.0 3.4 6.9 32.3 11.8 0.8 --
10 -- -- -- 1.4 -- 9.2 31.6 16.2 65.3 1.5 3.4 --
11 -- -- -- -- -- 2.0 1.1 23.0 97.1 0.9 0.1 --
12 -- -- 1.3 10.3 3.3 11.5 3.3 0.8 65.5 28.0 -- --
13 -- 0.3 -- -- -- 6.4 5.3 6.0 76.4 1.4 0.1 --
14 -- -- 9.3 -- 4.5 -- -- 57.1 12.5 11.3 0.4 --
15 -- -- -- 10.5 -- 0.6 2.0 16.9 18.5 19.2 2.4 --
16 -- -- -- -- 2.4 6.0 9.4 -- 7.7 -- -- --
17 -- -- -- 0.6 2.0 4.6 26.2 0.1 -- 73.9 3.3 --
18 -- -- 16.0 -- 4.4 7.7 1.0 -- 20.0 44.9 10.3 --
19 -- -- 10.1 11.0 12.0 0.6 27.3 2.8 15.2 9.1 -- --
20 -- -- -- -- 9.0 -- 23.8 5.4 3.0 0.2 -- --
21 -- -- -- -- 19.2 4.9 -- 15.2 26.2 16.8 -- 24.8
22 -- -- -- -- 3.7 192.7 77.7 16.5 74.7 0.5 3.1 --
23 -- -- -- 51.0 21.0 217.3 1.8 11.7 44.9 35.0 -- --
24 -- -- 1.3 -- 1.7 10.7 1.9 2.0 -- -- -- --
25 -- -- 7.1 70.7 70.6 -- 63.7 24.9 12.6 -- -- --
26 -- -- -- -- 0.8 -- 40.5 41.8 40.0 3.8 -- --
27 -- -- 1.4 -- 68.9 -- 6.0 9.4 18.1 14.9 -- --
28 -- -- -- -- -- -- 6.0 66.5 31.7 35.3 -- --
29 -- -- 4.1 -- -- 30.1 33.4 47.6 5.6 -- --
30 -- -- 16.8 1.4 24.9 17.8 95.0 64.1 0.3 0.3 --
31 1.0 11.6 9.5 73.1 1.8 -- --
30
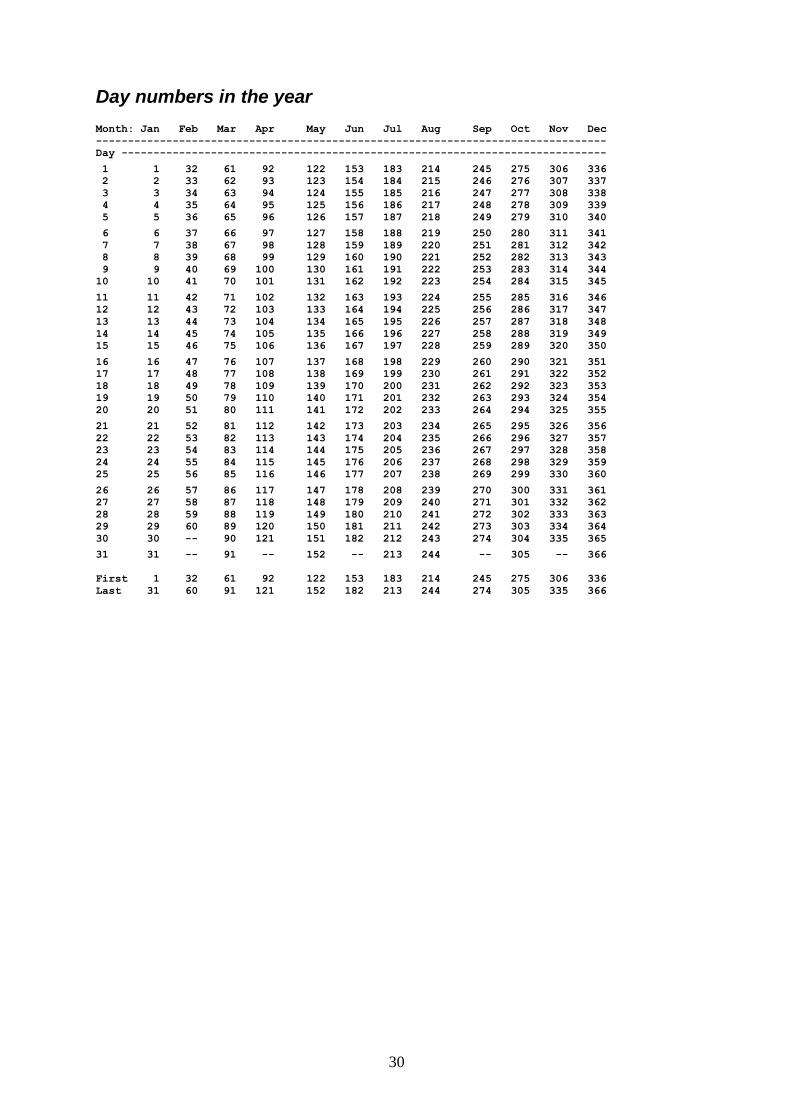
Day numbers in the year
Month: Jan Feb Mar Apr May Jun Jul Aug Sep Oct Nov Dec
--------------------------------------------------------------------------------
Day ---------------------------------------------------------------------------- 1 1 32 61 92 122 153 183 214 245 275 306 336
2 2 33 62 93 123 154 184 215 246 276 307 337
3 3 34 63 94 124 155 185 216 247 277 308 338
4 4 35 64 95 125 156 186 217 248 278 309 339
5 5 36 65 96 126 157 187 218 249 279 310 340 6 6 37 66 97 127 158 188 219 250 280 311 341
7 7 38 67 98 128 159 189 220 251 281 312 342
8 8 39 68 99 129 160 190 221 252 282 313 343
9 9 40 69 100 130 161 191 222 253 283 314 344
10 10 41 70 101 131 162 192 223 254 284 315 345 11 11 42 71 102 132 163 193 224 255 285 316 346
12 12 43 72 103 133 164 194 225 256 286 317 347
13 13 44 73 104 134 165 195 226 257 287 318 348
14 14 45 74 105 135 166 196 227 258 288 319 349
15 15 46 75 106 136 167 197 228 259 289 320 350 16 16 47 76 107 137 168 198 229 260 290 321 351
17 17 48 77 108 138 169 199 230 261 291 322 352
18 18 49 78 109 139 170 200 231 262 292 323 353
19 19 50 79 110 140 171 201 232 263 293 324 354
20 20 51 80 111 141 172 202 233 264 294 325 355 21 21 52 81 112 142 173 203 234 265 295 326 356
22 22 53 82 113 143 174 204 235 266 296 327 357
23 23 54 83 114 144 175 205 236 267 297 328 358
24 24 55 84 115 145 176 206 237 268 298 329 359
25 25 56 85 116 146 177 207 238 269 299 330 360 26 26 57 86 117 147 178 208 239 270 300 331 361
27 27 58 87 118 148 179 209 240 271 301 332 362
28 28 59 88 119 149 180 210 241 272 302 333 363
29 29 60 89 120 150 181 211 242 273 303 334 364
30 30 -- 90 121 151 182 212 243 274 304 335 365 31 31 -- 91 -- 152 -- 213 244 -- 305 -- 366
First 1 32 61 92 122 153 183 214 245 275 306 336
Last 31 60 91 121 152 182 213 244 274 305 335 366