Embed Size (px)
Citation preview

Report on
Structural Stability of Engineered Lumber in Fire Conditions
Project Number: 07CA42520 File Number: NC9140
Underwriters Laboratories Inc.
333 Pfingsten Road, Northbrook, IL 60062
September 30, 2008 Prepared by:
Mark S. Izydorek Patrick A. Zeeveld, P.E. Lead Engineering Associate Senior Project Engineer Fire Protection Division Fire Protection Division
Matthew D. Samuels James P. Smyser Associate Project Engineer Associate Project Engineer Fire Protection Division Fire Protection Division Reviewed by:
Robert M. Berhinig, P.E. Primary Designated Engineer Fire Resistive Construction Underwriters Laboratories Inc. (UL) its trustees, employees, sponsors, and contractors, make no warranties, express or implied, nor assume and expressly disclaim any legal liability or responsibility to any person for any loss or damage arising out of or in connection with the interpretation, application, or use of or inability to use, any information, data, apparatus, product, or process disclosed in this Report. This Report cannot be modified or reproduced, in part, without the prior written permission of Underwriters Laboratories Inc. Copyright © 2008 Underwriters Laboratories Inc.

File NC9140 Page 2 of 178 Issued: 2008-09-30 Revised: 2009-05-12
Acknowledgements Underwriters Laboratories Inc. is grateful to Department of Homeland Security for funding this research under the Fire Prevention and Safety Grants. Underwriters Laboratories Inc. also acknowledges the guidance and assistance provided by Chicago Fire Department, International Association of Fire Chiefs, and Michigan State University to develop the technical plan, design experiments, and analyze the results. In addition, these organizations also contributed significantly to the dissemination of the results to fire service and other safety organizations in the USA.

File NC9140 Page 3 of 178 Issued: 2008-09-30 Revised: 2009-05-12
Executive Summary This report describes the fire resistive performance of nine assemblies tested as part of a fire research and education grant sponsored by the Fire Prevention and Safety Grants under the direction of the Department of Home Security/Federal Emergency Management Agency/Assistance to Firefighters Grants.
Introduction For over 35 years repeated concern has been expressed within the fire service community regarding the structural performance of wood "I" beams and 2 by 4 wood trusses commonly known as lightweight wood construction during a fire as compared to the former traditional construction of 2 by 10s supporting floors and 2 by 6s supporting roofs. In October 1992, the National Fire Protection Research Foundation published a report by Mr. Kirk Grundahl titled, "National Engineered Lightweight Construction Fire Research Project – Technical Report: Literature Search & Technical Analysis". The report citied 60 articles related to the fire performance of lightweight wood construction between 1970 and 1990. Conclusions of the research project included recognition of the need for fire performance data and the need for training focusing upon the fire performance of lightweight wood construction. These identified needs remain today. The goals of this project include both the development of fire test data and the development of training methods. This report focuses only upon the development of the fire test data. The activities related to the educational material are reported separately. Test Plan Nine fire tests were conducted. Seven of the samples represented floor–ceiling constructions and two samples represented roof-ceiling constructions. A goal of the project was to develop comparable fire performance data among assemblies. All assemblies were intended to represent typical residential construction. Some assemblies included construction features such as 2 by 10 floor joists and 2 by 6 roof rafters that the fire service expressed satisfactory knowledge of their structural performance based upon their experience. Other assemblies included lighter weight wood structural members such as "I" joists and trusses. Two of the assemblies did not include a ceiling, six of the assemblies included a ceiling consisting of 1/2-inch thick regular gypsum board and one assembly included a 3/4-inch thick plaster ceiling. The nine fire tests complied with the requirements of ASTM E119 but the applied structural load was non-traditional. Typically, a uniform load is applied on the floor or roof to fully stress the supporting structural members. This load is generally higher than the minimum design load of 40 psf specified by the building code for residential construction. For the tests described in this report, the load placed on the samples was intended to represent typical conditions during a fire. A load of 40 psf was placed along two of the four edges of the floor – ceiling assemblies to represent loads around a perimeter of a room. On each sample, two 300 pound concentrated loads were placed
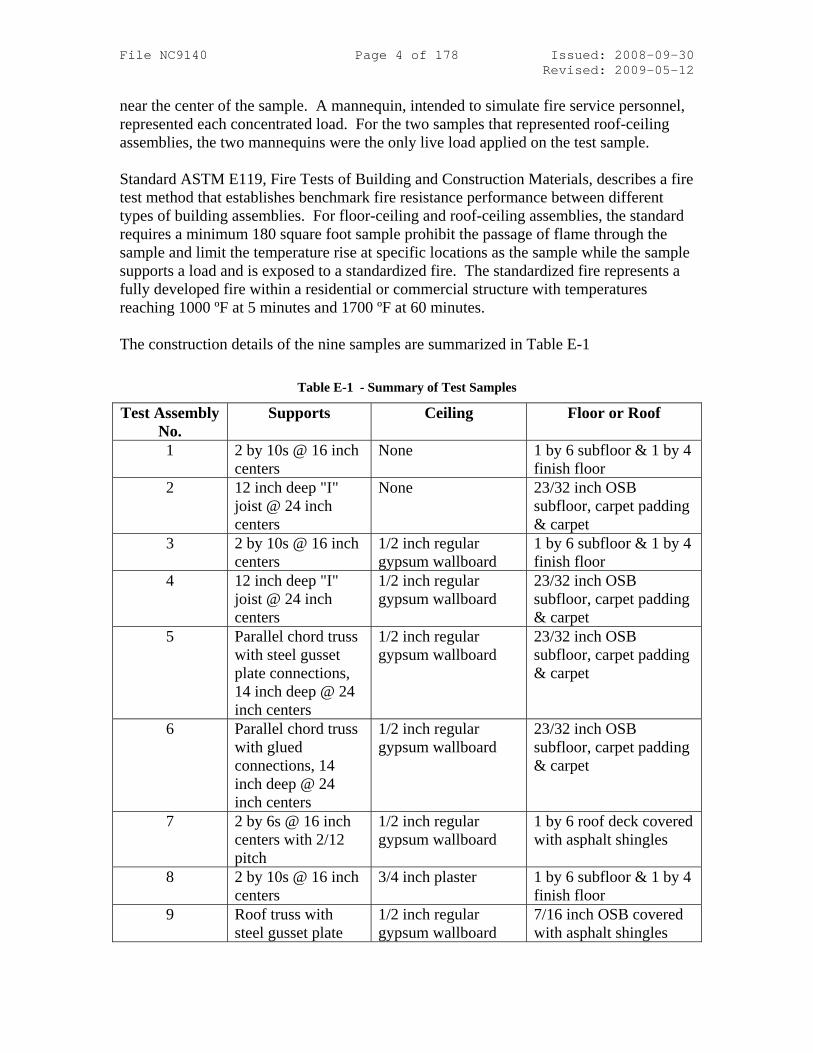
File NC9140 Page 4 of 178 Issued: 2008-09-30 Revised: 2009-05-12 near the center of the sample. A mannequin, intended to simulate fire service personnel, represented each concentrated load. For the two samples that represented roof-ceiling assemblies, the two mannequins were the only live load applied on the test sample. Standard ASTM E119, Fire Tests of Building and Construction Materials, describes a fire test method that establishes benchmark fire resistance performance between different types of building assemblies. For floor-ceiling and roof-ceiling assemblies, the standard requires a minimum 180 square foot sample prohibit the passage of flame through the sample and limit the temperature rise at specific locations as the sample while the sample supports a load and is exposed to a standardized fire. The standardized fire represents a fully developed fire within a residential or commercial structure with temperatures reaching 1000 ºF at 5 minutes and 1700 ºF at 60 minutes. The construction details of the nine samples are summarized in Table E-1
Table E-1 - Summary of Test Samples
Test Assembly No.
Supports Ceiling Floor or Roof
1 2 by 10s @ 16 inch centers
None 1 by 6 subfloor & 1 by 4 finish floor
2 12 inch deep "I" joist @ 24 inch centers
None 23/32 inch OSB subfloor, carpet padding & carpet
3 2 by 10s @ 16 inch centers
1/2 inch regular gypsum wallboard
1 by 6 subfloor & 1 by 4 finish floor
4 12 inch deep "I" joist @ 24 inch centers
1/2 inch regular gypsum wallboard
23/32 inch OSB subfloor, carpet padding & carpet
5 Parallel chord truss with steel gusset plate connections, 14 inch deep @ 24 inch centers
1/2 inch regular gypsum wallboard
23/32 inch OSB subfloor, carpet padding & carpet
6 Parallel chord truss with glued connections, 14 inch deep @ 24 inch centers
1/2 inch regular gypsum wallboard
23/32 inch OSB subfloor, carpet padding & carpet
7 2 by 6s @ 16 inch centers with 2/12 pitch
1/2 inch regular gypsum wallboard
1 by 6 roof deck covered with asphalt shingles
8 2 by 10s @ 16 inch centers
3/4 inch plaster 1 by 6 subfloor & 1 by 4 finish floor
9 Roof truss with steel gusset plate
1/2 inch regular gypsum wallboard
7/16 inch OSB covered with asphalt shingles
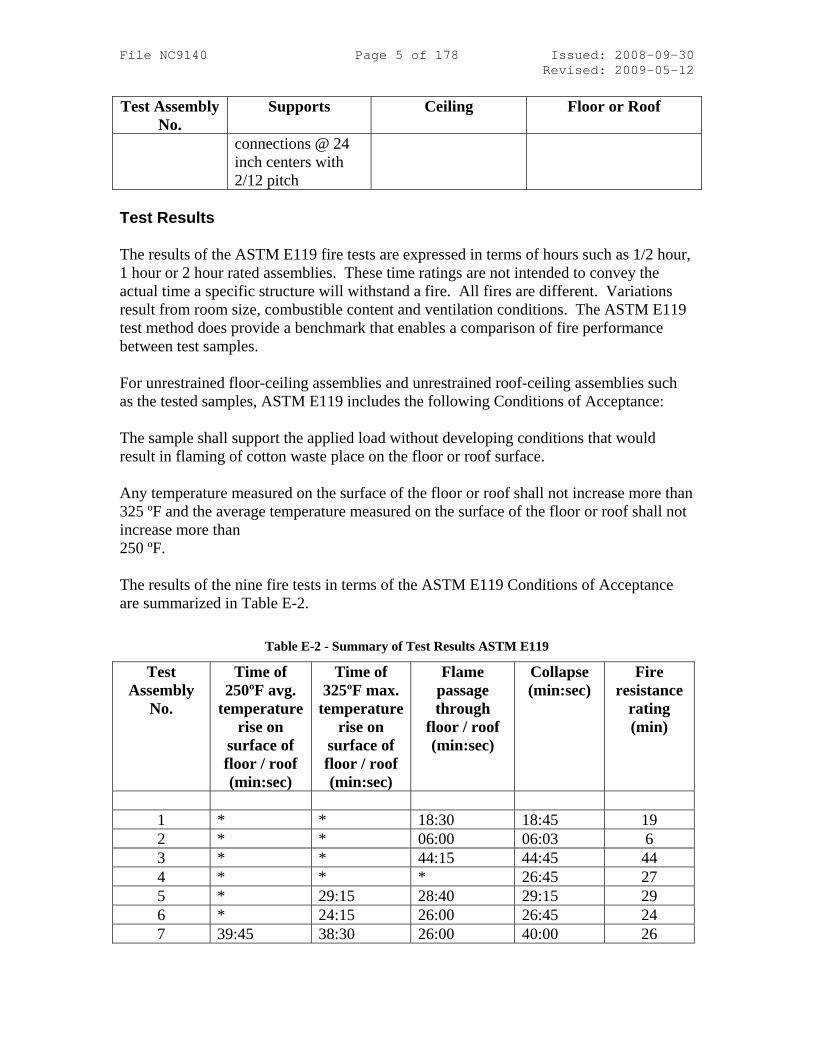
File NC9140 Page 5 of 178 Issued: 2008-09-30 Revised: 2009-05-12 Test Assembly
No. Supports Ceiling Floor or Roof
connections @ 24 inch centers with 2/12 pitch
Test Results The results of the ASTM E119 fire tests are expressed in terms of hours such as 1/2 hour, 1 hour or 2 hour rated assemblies. These time ratings are not intended to convey the actual time a specific structure will withstand a fire. All fires are different. Variations result from room size, combustible content and ventilation conditions. The ASTM E119 test method does provide a benchmark that enables a comparison of fire performance between test samples. For unrestrained floor-ceiling assemblies and unrestrained roof-ceiling assemblies such as the tested samples, ASTM E119 includes the following Conditions of Acceptance: The sample shall support the applied load without developing conditions that would result in flaming of cotton waste place on the floor or roof surface. Any temperature measured on the surface of the floor or roof shall not increase more than 325 ºF and the average temperature measured on the surface of the floor or roof shall not increase more than 250 ºF. The results of the nine fire tests in terms of the ASTM E119 Conditions of Acceptance are summarized in Table E-2.
Table E-2 - Summary of Test Results ASTM E119
Test Assembly
No.
Time of 250ºF avg.
temperature rise on
surface of floor / roof (min:sec)
Time of 325ºF max.
temperature rise on
surface of floor / roof (min:sec)
Flame passage through
floor / roof (min:sec)
Collapse (min:sec)
Fire resistance
rating (min)
1 * * 18:30 18:45 19 2 * * 06:00 06:03 6 3 * * 44:15 44:45 44 4 * * * 26:45 27 5 * 29:15 28:40 29:15 29 6 * 24:15 26:00 26:45 24 7 39:45 38:30 26:00 40:00 26

File NC9140 Page 6 of 178 Issued: 2008-09-30 Revised: 2009-05-12
Test Assembly
No.
Time of 250ºF avg.
temperature rise on
surface of floor / roof (min:sec)
Time of 325ºF max.
temperature rise on
surface of floor / roof (min:sec)
Flame passage through
floor / roof (min:sec)
Collapse (min:sec)
Fire resistance
rating (min)
8 * * * 79:45 51** 9 * * * 23:15 23
Notes: * - This condition was not achieved during the fire test. ** - Plaster ceiling in contact with furnace thermocouples at 51 minutes. The test method requires that the junction of the thermocouples in the furnace be placed 12 inches away from the ceiling surface at the beginning of the test and shall not touch the sample as a result of deflection. In addition to the fire resistance rating determined by the Conditions of Acceptance in ASTM E119, a finish rating is typically published for fire resistive assemblies with combustible supports such as the tested as samples. The finished rating is defined as the time when the first occurrence of either: (1) a temperature measured on the face of the combustible supports nearest to the fire increases more than 325 ºF or (2) the average temperature measured on the face of the combustible supports nearest the fire increases more than 250 ºF. Several fire test standards similar to ASTM E119 such as ISO 834:1 Fire-resistance tests – Elements of building construction – Part 1: General requirements define load bearing capacity as the elapsed time that a test sample is able to maintain its ability to support the applied load during the fire test. The ability to support the applied load is determined when both:
(1) Deflection exceeds: d
L400
2
; and
(2) When the deflection exceeds 30L , the Rate of Deflection exceeds:
dL
9000
2
where L is the clear span measured in millimeters and d is the distance from the extreme fiber of the design compression zone to the extreme fiber of the design tensile zone of the structural element as measured in millimeters. Other significant data obtained during the fire tests included observation of the conditions of the ceiling and floor or roof surfaces, temperatures in the concealed space above the ceiling membrane and deflections of the floor and roof surfaces.

File NC9140 Page 7 of 178 Issued: 2008-09-30 Revised: 2009-05-12 Other significant events that occurred during the nine fire tests are summarized in Table E-3
Table E-3 - Summary of Significant Events in Addition to ASTM E119 Conditions of Acceptance
Test
Assembly No.
Initial falling of
ceiling material
(More than 1 ft2)
(min:sec)
Average temperature
on unexposed surface of ceiling at
initial falling (ºF)
Finish rating
(min:sec)
Load bearing capacity
(min)
1 No ceiling No ceiling 00:45 18 2 No ceiling No ceiling 00:30 4 3 23:30 605 15:30 45 4 17:15 531 7:45 25 5 16:30 519 10:45 24 6 16:00 559 12:15 25 7 15:45 253 15:15 40 8 74:00** 1109 74:00** 80 9 13:45 730 14:45 24
Notes: ** - plaster ceiling in contact with furnace thermocouples at 51 minutes
Research Findings
• The following summarizes the key findings documented in this report:
• The fire containment performance of a combustible floor-ceiling assembly representing typical legacy construction without a ceiling was 18 minutes. The time duration was based upon the performance of the assembly when exposed to the time-temperature curve defined in Standard ASTM E119. This performance was defined as the bench mark performance for comparison purposes.
• The fire containment performance of a combustible floor-ceiling assembly
supported by engineered I joists was 14 minutes less than the bench mark performance.
• The fire containment performance of the combustible floor-ceiling assembly
supported by engineered I joists with a ½ inch thick regular gypsum board ceiling exceeded the benchmark performance by 7 minutes.
File NC9140 Page 8 of 178 Issued: 2008-09-30 Revised: 2009-05-12
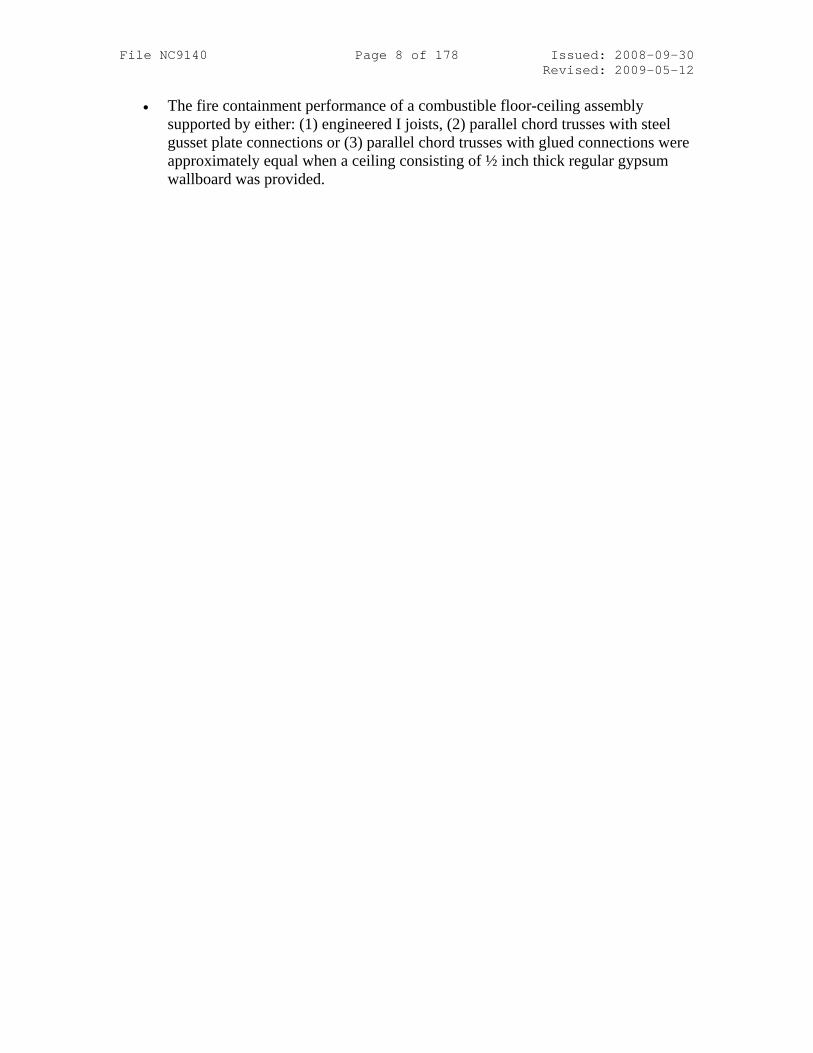
• The fire containment performance of a combustible floor-ceiling assembly supported by either: (1) engineered I joists, (2) parallel chord trusses with steel gusset plate connections or (3) parallel chord trusses with glued connections were approximately equal when a ceiling consisting of ½ inch thick regular gypsum wallboard was provided.

File NC9140 Page 9 of 178 Issued: 2008-09-30 Revised: 2009-05-12
TABLE OF CONTENTS
ACKNOWLEDGEMENTS ............................................................................................. 2
EXECUTIVE SUMMARY .............................................................................................. 3 INTRODUCTION ................................................................................................................ 3 TEST PLAN ....................................................................................................................... 3 TEST RESULTS ................................................................................................................. 5 RESEARCH FINDINGS ....................................................................................................... 7
LIST OF FIGURES ........................................................................................................ 11
LIST OF TABLES .......................................................................................................... 14
GENERAL ....................................................................................................................... 15 TEST ASSEMBLY MATERIALS......................................................................................... 15
Material..................................................................................................................... 15 Assembly Number...................................................................................................... 15
FIRE ENDURANCE TEST ................................................................................................. 16 Test Method ............................................................................................................... 16
TEST RECORD NO. 1 ...................................................................................................... 19 Materials ................................................................................................................... 19 Erection of Test Assembly No. 1 ............................................................................... 19 Test Sample ............................................................................................................... 19 Test Method ............................................................................................................... 20 Results ....................................................................................................................... 20 Surface ...................................................................................................................... 21 Observations ............................................................................................................. 21
TEST RECORD NO. 2 ...................................................................................................... 25 Materials ................................................................................................................... 25 Erection of Test Assembly ......................................................................................... 25 Test Sample ............................................................................................................... 25 Method ...................................................................................................................... 26 Results ....................................................................................................................... 26
TEST RECORD NO. 3 ...................................................................................................... 32 Materials ................................................................................................................... 32 Erection of Test Assembly ......................................................................................... 32 Sample ....................................................................................................................... 33 Method ...................................................................................................................... 33 Results ....................................................................................................................... 33
TEST RECORD NO. 4 ...................................................................................................... 41 Materials ................................................................................................................... 41 Erection of Test Assembly ......................................................................................... 41 Sample ....................................................................................................................... 42 Method ...................................................................................................................... 42 Results ....................................................................................................................... 43
TEST RECORD NO. 5 ...................................................................................................... 50 Materials ................................................................................................................... 50

File NC9140 Page 10 of 178 Issued: 2008-09-30 Revised: 2009-05-12
Erection of Test Assembly ......................................................................................... 50 Sample ....................................................................................................................... 51 Method ...................................................................................................................... 51 Results ....................................................................................................................... 52
TEST RECORD NO. 6 ...................................................................................................... 59 Materials ................................................................................................................... 59 Erection of Test Assembly ......................................................................................... 59 Sample ....................................................................................................................... 60 Method ...................................................................................................................... 60 Results ....................................................................................................................... 61
TEST RECORD NO. 7 ...................................................................................................... 68 Materials ................................................................................................................... 68 Erection of Test Assembly ......................................................................................... 68 Sample ....................................................................................................................... 69 Method ...................................................................................................................... 69 Results ....................................................................................................................... 70
TEST RECORD NO. 8 ...................................................................................................... 78 Materials ................................................................................................................... 78 Erection of Test Assembly ......................................................................................... 78 Sample ....................................................................................................................... 79 Method ...................................................................................................................... 79 Results ....................................................................................................................... 80
TEST RECORD NO. 9 ...................................................................................................... 87 Materials ................................................................................................................... 87 Erection of Test Assembly ......................................................................................... 87 Sample ....................................................................................................................... 88 Method ...................................................................................................................... 88 Results ....................................................................................................................... 89
DISCUSSION ................................................................................................................... 96 Furnace Conditions .................................................................................................. 96 Floor and Roof Surface Temperature Conditions .................................................... 98 Structural Serviceability ......................................................................................... 103
SUMMARY OF FINDINGS ............................................................................................... 104 Appendix A – Location of Instrumentation ............................................................. 106 General ................................................................................................................... 106

File NC9140 Page 11 of 178 Issued: 2008-09-30 Revised: 2009-05-12
List of Figures
Figure 1 - UL263 Standard Time Temperature Curve and Average Furnace Temperature vs. Time for Assembly No. 1 .................................................................................... 21
Figure 2 - Plot of Temperatures Below Subfloor vs. Time for Assembly No. 1 .............. 22 Figure 3 - Plot of the Subfloor Temperatures vs. Time for Assembly No. 1.................... 23 Figure 4 - Plot of the Unexposed Surface Temperatures vs. Time for Assembly No. 1 .. 24 Figure 5 - Plot of Deflections vs. Time for Assembly No. 1 ............................................ 24 Figure 6 – UL263 Standard Time Temperature Curve and Average Furnace Temperature
vs. Time for Assembly No. 2 .................................................................................... 27 Figure 7 - Furnace Pressure vs. Time for Assembly No. 2 ............................................... 27 Figure 8 - Oxygen Content vs. Time Oxygen Content vs. Time for Assembly No. 2 ...... 28 Figure 9 - Plot of Temperatures Below Subfloor vs. Time for Assembly No. 2 .............. 29 Figure 10 - Plot of the Subfloor Temperatures vs. Time for Assembly No. 2 .................. 30 Figure 11 - Plot of Temperature of the Carpet Padding vs. Time for Assembly No. 2 .... 30 Figure 12 - Plot of Unexposed Surface Temperatures vs. Time for Assembly No. 2 ...... 31 Figure 13 - Plot of Deflections vs. Time for Assembly No. 2 .......................................... 31 Figure 14 - UL263 Standard Time Temperature Curve and Average Furnace Temperature
vs. Time for Test Assembly No. 3 ............................................................................ 34 Figure 15 - Furnace Pressure vs. Time for Test Assembly No. 3 ..................................... 34 Figure 16 - Oxygen Content vs. Time for Test Assembly No. 3 ...................................... 35 Figure 17 - Plot of Temperature Below Subfloor vs. Time for Assembly No. 3 .............. 38 Figure 18 - Plot of Temperature of the Unexposed Surface of Gypsum Board vs. Time for
Assembly No. 3 ......................................................................................................... 39 Figure 19 - Plot of Temperature of the Subfloor Temperatures vs. Time for Assembly No.
3................................................................................................................................. 39 Figure 20 - Plot of Temperatures of the Unexposed Surface vs. Time for Assembly No. 3
................................................................................................................................... 40 Figure 21 - Plot of Deflections vs. Time for Assembly No. 3 .......................................... 40 Figure 22 - UL263 Standard Time Temperature Curve and Average Furnace Temperature
vs. Time for Assembly No. 4 .................................................................................... 43 Figure 23 – Furnace Pressure vs. Time for Assembly No. 4 ........................................... 44 Figure 24 - Oxygen Content vs. Time for Assembly No. 4 .............................................. 44 Figure 25 - Plot of Temperatures Below Subfloor vs. Time for Assembly No. 4 ............ 46 Figure 26 - Plot of Temperature of the Unexposed Surface of Gypsum Board vs. Time for
Assembly No. 4 ......................................................................................................... 47 Figure 27 - Plot of Temperature of the Subfloor Temperatures vs. Time ........................ 47 Figure 28 - Plot of Temperature of the Carpet Padding vs. Time for Assembly No. 4 .... 48 Figure 29 - Plot of Temperature of the Unexposed Surface vs. Time for Assembly No. 4
................................................................................................................................... 48 Figure 30 - Plot of Deflections vs. Time for Assembly No. 4 .......................................... 49 Figure 31 - UL263 Standard Time Temperature Curve and Average Furnace Temperature
vs. Time for Assembly No. 5 .................................................................................... 52 Figure 32 - Furnace Pressure vs. Time for Assembly No. 5 ............................................. 53 Figure 33 - Oxygen Content vs. Time for Assembly No. 5 .............................................. 53

File NC9140 Page 12 of 178 Issued: 2008-09-30 Revised: 2009-05-12 Figure 34 - Plot of Temperature of the Average Interstitial Space vs. Time for Assembly
No. 5 .......................................................................................................................... 55 Figure 35 - Plot of Temperature of the Top and Bottom Metal Gusset Plates vs. Time for
Assembly No. 5 ......................................................................................................... 56 Figure 36 - Plot of Temperature of the Unexposed Surface of Gypsum Board vs. Time for
Assembly No. 5 ......................................................................................................... 56 Figure 37 - Plot of Temperature of the Subfloor Temperatures vs. Time for Assembly No.
5................................................................................................................................. 57 Figure 38 - Plot of Temperature of the Carpet Padding vs. Time for Assembly No. 5 .... 57 Figure 39 - Plot of Temperatures of the Unexposed Surface vs. Time for Assembly No. 5
................................................................................................................................... 58 Figure 40 - Plot of Deflections vs. Time for Assembly No. 5 .......................................... 58 Figure 41 - UL263 Standard Time Temperature Curve and Average Furnace Temperature
vs. Time for Assembly No. 6 .................................................................................... 61 Figure 42 - Furnace Pressure vs. Time for Assembly No. 6 ............................................. 62 Figure 43 - Oxygen Content vs. Time for Assembly No. 6 .............................................. 62 Figure 44 - Plot of Temperatures of Below Subfloor vs. Time ........................................ 64 Figure 45 - Plot of Temperature of the Top and Bottom Glued Finger Joints vs. Time for
Assembly No. 6 ......................................................................................................... 65 Figure 46 - Plot of Temperature of the Unexposed Surface of Gypsum Board vs. Time for
Test Assembly No. 6 ................................................................................................. 65 Figure 47 - Plot of Temperature of the Subfloor Temperatures vs. Time for Test
Assembly No. 6 ......................................................................................................... 66 Figure 48 - Plot of Temperature of the Carpet Padding vs. Time for Test Assembly No. 6
................................................................................................................................... 66 Figure 49 - Plot of Temperatures of the Unexposed Surface vs. Time for Test Assembly
No. 6 .......................................................................................................................... 67 Figure 50 - Plot of Deflections vs. Time for Test Assembly No. 6 .................................. 67 Figure 51 – UL263 Standard Time Temperature Curve and Average Furnace
Temperature vs. Time for Assembly No. 7 ............................................................... 71 Figure 52 – Furnace Pressure vs. Time for Assembly No. 7 ............................................ 71 Figure 53 – Oxygen Content vs. Time for Test Assembly No. 7 ..................................... 72 Figure 54 – Plot of Temperatures Below Subfloor vs. Time for Test Assembly No. 7 ... 74 Figure 55 – Plot of Temperature of the Unexposed Surface of Gypsum Board vs. Time
for Test Assembly No. 7 ........................................................................................... 75 Figure 56 – Plot of the Roof Deck Temperatures vs. Time for Test Assembly No. 7 ..... 75 Figure 57 – Plot of Temperature of the Roofing Felt vs. Time for Test Assembly No. 7 76 Figure 58 – Plot of Temperatures of the Unexposed Surface vs. Time for Test Assembly
No. 7 .......................................................................................................................... 76 Figure 59 – Plot of Temperatures of the Unexposed Surface of the Mushroom Vent vs.
Time for Test Assembly No. 7 .................................................................................. 77 Figure 60 – Plot of Deflections vs. Time for Test Assembly No. 7 ................................. 77 Figure 61 – UL263 Standard Time Temperature Curve and Average Furnace
Temperature vs. Time for Test Assembly No. 8 ....................................................... 80 Figure 62 – Furnace Pressure vs. Time for Test Assembly No. 8 ................................... 81 Figure 63 – Oxygen Content vs. Time for Test Assembly No. 8 ..................................... 81

File NC9140 Page 13 of 178 Issued: 2008-09-30 Revised: 2009-05-12 Figure 64 – Plot of Temperatures Below Subfloor vs. Time for Test Assembly No. 8 ... 84 Figure 65 – Plot of Temperature of the Back of the Metal Lath vs. Time for Test
Assembly No. 8 ......................................................................................................... 84 Figure 66 – Plot of Temperature of the Subfloor Temperatures vs. Time for Test
Assembly No. 8 ......................................................................................................... 85 Figure 67 – Plot of Temperatures of the Unexposed Surface vs. Time for Test Assembly
No. 8 .......................................................................................................................... 85 Figure 68 – Plot of Deflections vs. Time for Test Assembly No. 8 ................................. 86 Figure 69 – UL263 Standard Time Temperature Curve and Average Furnace
Temperature vs. Time for Test Assembly No. 9 ....................................................... 90 Figure 70 – Furnace Pressure vs. Time for Test Assembly No. 9 .................................... 90 Figure 71 – Oxygen Content vs. Time for Test Assembly No. 9 ..................................... 91 Figure 72 – Plot of Temperature Below Subfloor vs. Time ............................................. 93 Figure 73 – Plot of Temperature of the Unexposed Surface of Gypsum Board vs. Time 93 Figure 74 – Plot of Temperature of the Roofing Felt vs. Time ........................................ 94 Figure 75 – Plot of Temperatures of the Unexposed Surface vs. Time ............................ 95 Figure 76 – Plot of Deflections vs. Time .......................................................................... 95 Figure 77 - Furnace Temperature ..................................................................................... 96 Figure 78 - Furnace Pressure ............................................................................................ 97 Figure 79 - Percent Oxygen in Furnace ............................................................................ 97 Figure 80 -Test Assembly No. 1 ...................................................................................... 98 Figure 81- Test Assembly No. 2 ....................................................................................... 99 Figure 82 - Test Assembly No. 3 ...................................................................................... 99 Figure 83 - Test Assembly No. 4 .................................................................................... 100 Figure 84 - Test Assembly No. 5 .................................................................................... 100 Figure 85 - Test Assembly No. 6 .................................................................................... 101 Figure 86 - Test Assembly No. 7 .................................................................................... 101 Figure 87 - Test Assembly No. 8 .................................................................................... 102 Figure 88 - Test Assembly No. 9 .................................................................................... 102

File NC9140 Page 14 of 178 Issued: 2008-09-30 Revised: 2009-05-12
List of Tables
Table 1 - Identification of Materials used in Multiple Assemblies .................................. 15 Table 2 - Set Depth of Steel Angles .................................................................................. 17 Table 3 - Deflection of Assembly After Application of Load .......................................... 18 Table 4 – Observations for Test Assembly No. 1 ............................................................. 21 Table 5 – Observations for Assembly No. 2 ..................................................................... 28 Table 6 - Observations for Test Assembly No. 3.............................................................. 35 Table 7 – Observations for Test Assembly No. 4 ............................................................. 45 Table 8 – Observations for Assembly No. 5 ..................................................................... 54 Table 9 – Observations for Assembly No. 6 ..................................................................... 63 Table 10 - Observations for Assembly No. 7 .................................................................. 72 Table 11 - Observations for Assembly No. 8 ................................................................... 82 Table 12 - Observations for Assembly No. 9 .................................................................. 91 Table 13 - Average temperature on exposed surface of sub-floor or roof deck and average
temperature on unexposed surface of floor or roofing shingles. ............................ 103

File NC9140 Page 15 of 178 Issued: 2008-09-30 Revised: 2009-05-12
General This section describes the construction of the test assemblies, and the test results. Test Assembly Materials Several materials were used to construct more than one test assembly. The assemblies in which these materials were used are identified in Table 1.
Table 1 - Identification of Materials used in Multiple Assemblies
Material Assembly Number 1 2 3 4 5 6 7 8 9
Joists - 2 by 10 Yes No Yes No No No No Yes No Engineered I Joist No Yes No Yes No No No No No Bearing Plates – 2 by 4 No Yes No Yes No No Yes No No Bearing Plates - 2 by 6 Yes No Yes No Yes Yes No Yes Yes Subflooring (OSB) No Yes No Yes Yes Yes No No No Subflooring Yes No Yes No No No No Yes No Finished Flooring Yes No Yes No No No No Yes No Red Rosin Paper Yes No Yes No No No No Yes No Carpet with Padding No Yes No Yes Yes Yes No No No Tack Strip No Yes No Yes Yes Yes No No No Felt Paper - 30 lbs. No No No No No No Yes No Yes Class A Asphalt Shingles No No No No No No Yes No Yes Faced Batt Insulation No No No No No No Yes No Yes Gypsum Board - 1/2 in. No No Yes Yes Yes Yes Yes No Yes The materials used in more than one assembly are described below. Joists – The nominal 2 in. by 10 in. dimensional lumber measured 9-1/8 in. by 1-1/2 in. cut to a length of 13 ft 10 in. and bore the marking “SPF No. 2 KD-HT.” The moisture content of the joists ranged from 11.7 to 15.4 percent and averaged 13.3 percent moisture. Engineered I Joists – The nominal 12 in. engineered I Joist measured 11-7/8 in tall and were cut to a length of 13 ft 7-3/4 in. The chords consisted of 2 in. wide by 1-3/16 deep laminated veneer lumber. The web consisted of 3/8 in. thick oriented strand board. The average weight of the I Joists was 34.94 lbs. Bearing Plate (2 by 4) – The nominal 2 in. by 4 in. dimensional lumber measured 1-1/2 in. by 3-1/2 in. and cut to lengths of 5 ft 8 in. and 12 ft 3/4 in. long. Bearing Plate (2 by 6) – The nominal 2 in. by 6 in. dimensional lumber measured 1-1/2 in. by 5-1/2 in. and cut to lengths of 9 ft 6 in. and 8 ft 3-1/2 in. long.
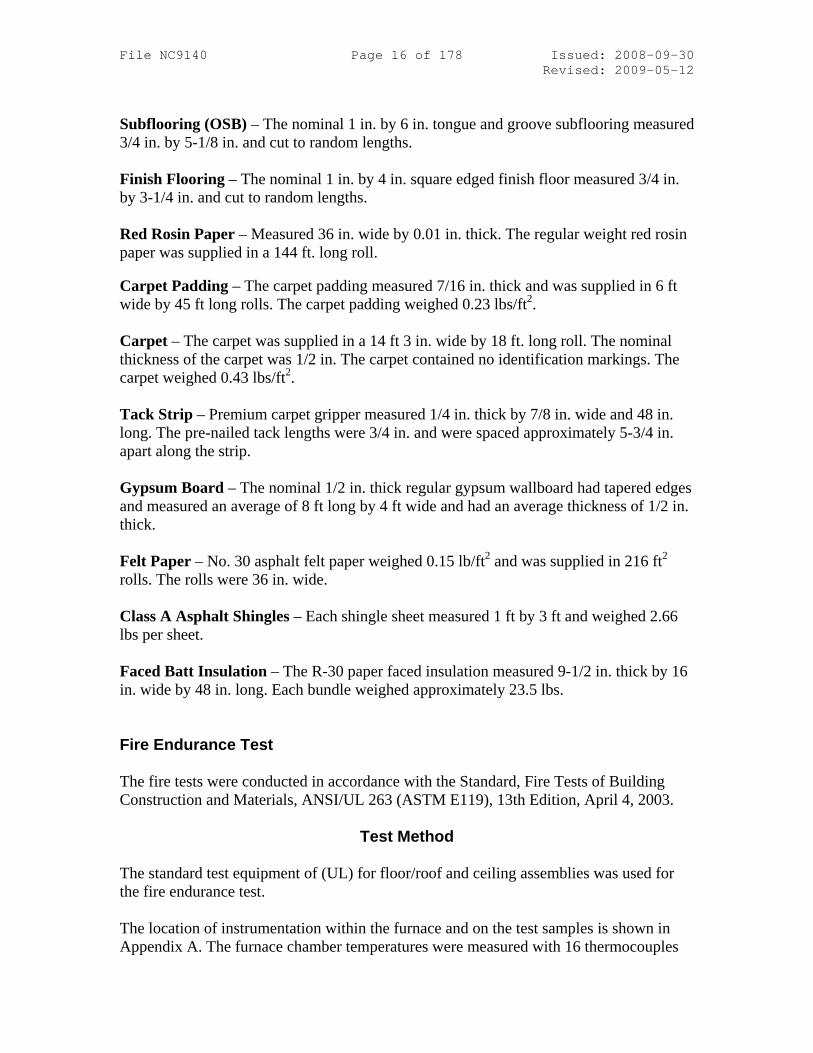
File NC9140 Page 16 of 178 Issued: 2008-09-30 Revised: 2009-05-12 Subflooring (OSB) – The nominal 1 in. by 6 in. tongue and groove subflooring measured 3/4 in. by 5-1/8 in. and cut to random lengths. Finish Flooring – The nominal 1 in. by 4 in. square edged finish floor measured 3/4 in. by 3-1/4 in. and cut to random lengths. Red Rosin Paper – Measured 36 in. wide by 0.01 in. thick. The regular weight red rosin paper was supplied in a 144 ft. long roll.
Carpet Padding – The carpet padding measured 7/16 in. thick and was supplied in 6 ft wide by 45 ft long rolls. The carpet padding weighed 0.23 lbs/ft2. Carpet – The carpet was supplied in a 14 ft 3 in. wide by 18 ft. long roll. The nominal thickness of the carpet was 1/2 in. The carpet contained no identification markings. The carpet weighed 0.43 lbs/ft2. Tack Strip – Premium carpet gripper measured 1/4 in. thick by 7/8 in. wide and 48 in. long. The pre-nailed tack lengths were 3/4 in. and were spaced approximately 5-3/4 in. apart along the strip. Gypsum Board – The nominal 1/2 in. thick regular gypsum wallboard had tapered edges and measured an average of 8 ft long by 4 ft wide and had an average thickness of 1/2 in. thick. Felt Paper – No. 30 asphalt felt paper weighed 0.15 lb/ft2 and was supplied in 216 ft2 rolls. The rolls were 36 in. wide. Class A Asphalt Shingles – Each shingle sheet measured 1 ft by 3 ft and weighed 2.66 lbs per sheet. Faced Batt Insulation – The R-30 paper faced insulation measured 9-1/2 in. thick by 16 in. wide by 48 in. long. Each bundle weighed approximately 23.5 lbs. Fire Endurance Test The fire tests were conducted in accordance with the Standard, Fire Tests of Building Construction and Materials, ANSI/UL 263 (ASTM E119), 13th Edition, April 4, 2003.
Test Method The standard test equipment of (UL) for floor/roof and ceiling assemblies was used for the fire endurance test. The location of instrumentation within the furnace and on the test samples is shown in Appendix A. The furnace chamber temperatures were measured with 16 thermocouples
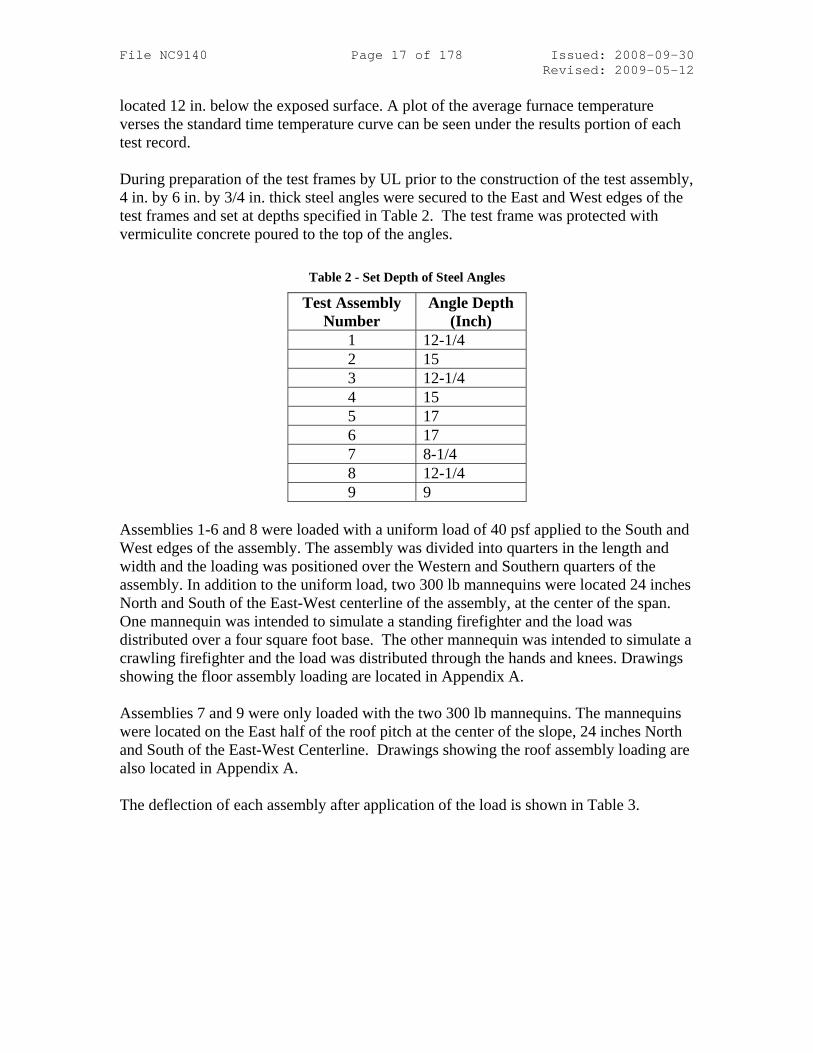
File NC9140 Page 17 of 178 Issued: 2008-09-30 Revised: 2009-05-12 located 12 in. below the exposed surface. A plot of the average furnace temperature verses the standard time temperature curve can be seen under the results portion of each test record. During preparation of the test frames by UL prior to the construction of the test assembly, 4 in. by 6 in. by 3/4 in. thick steel angles were secured to the East and West edges of the test frames and set at depths specified in Table 2. The test frame was protected with vermiculite concrete poured to the top of the angles.
Table 2 - Set Depth of Steel Angles
Test Assembly Number
Angle Depth (Inch)
1 12-1/4 2 15 3 12-1/4 4 15 5 17 6 17 7 8-1/4 8 12-1/4 9 9
Assemblies 1-6 and 8 were loaded with a uniform load of 40 psf applied to the South and West edges of the assembly. The assembly was divided into quarters in the length and width and the loading was positioned over the Western and Southern quarters of the assembly. In addition to the uniform load, two 300 lb mannequins were located 24 inches North and South of the East-West centerline of the assembly, at the center of the span. One mannequin was intended to simulate a standing firefighter and the load was distributed over a four square foot base. The other mannequin was intended to simulate a crawling firefighter and the load was distributed through the hands and knees. Drawings showing the floor assembly loading are located in Appendix A. Assemblies 7 and 9 were only loaded with the two 300 lb mannequins. The mannequins were located on the East half of the roof pitch at the center of the slope, 24 inches North and South of the East-West Centerline. Drawings showing the roof assembly loading are also located in Appendix A. The deflection of each assembly after application of the load is shown in Table 3.

File NC9140 Page 18 of 178 Issued: 2008-09-30 Revised: 2009-05-12
Table 3 - Deflection of Assembly After Application of Load
Test Assembly Number
Deflection (Inch)
1 0.13 2 0.25 3 0.10 4 0.09 5 0.07 6 0.08 7 Not Available 8 0.02 9 0.05
The floor ceiling and roof ceiling assemblies were installed in the test frame in accordance with standard practices and methods. The test assemblies were constructed by UL staff at UL’s fire test laboratory located in Northbrook, IL. All nine assemblies were tested in accordance with ASNI/UL263 and ASTM E119. The condition of acceptance for these standards state the transmission of heat thought the specimen during the classification period shall not have raised the average temperature on its unexposed surface to more than 250°F above its initial temperature. The specimen shall have sustained the applied load during the classification period without developing unexposed surface conditions that will ignite cotton waste.

File NC9140 Page 19 of 178 Issued: 2008-09-30 Revised: 2009-05-12 Test Record No. 1
Materials Materials described in section General and used in Assembly No. 1 include 2 in. by 10 in. joists, 2 in. by 6 in. bearing plates, subflooring, red rosin paper and finish flooring. Additional materials are described below. Cross Bridging – The nominal 1 in. by 3 in. dimensional lumber measured 11/16 in. by 2-7/16 in. and each end was cut at an angle and a length of 16-3/8 in.
Erection of Test Assembly No. 1 Nominal 2 in. by 6 in. structural grade wood bearing plates were placed on top of the steel angles. The 2 in. by 10 in. joists were placed on the wood bearing plates and spaced 16 in. OC starting 8 in. from the East-West centerline of the assembly. The joists were fire stopped with 14-1/2 in. long pieces of nominal 2 by 10 in. lumber. At the North and South ends of the assembly, additional joists, not in the field of the fire for the test, were placed 2-1/2 inches from the North and South edges of the assembly over the vermiculite concrete in order stabilize the nominal 1 by 4 in. tongue and groove subfloor. The average bearing at each end of the joist was 5-1/4 in. The joists were fastened to each bearing plate with two No. 16d coated sinker nails. The joists were stabilized by nominal 1 by 3 in. bridging cut to lengths of approximately 16-1/2 in. long with their ends cut to an angle of approximately 45 degrees. The pieces of bridging was secured diagonally opposed to each other between each pair of joists with two 8d coated sinker nails at each end of each piece. The nominal 1 by 6 in. random length tongue and groove subfloor boards were laid diagonally (45 degrees to the joists) and secured in place with No. 8d coated sinker nails four nails per butt joint and two nails in the field at each joist. The red rosin paper was laid over the subfloor in the East-West direction and secured in place with staples in a random order. There was a 4 in. overlap of each roll of paper. The nominal 1 by 4 in. tongue and groove finish floor was installed over the building paper and oriented perpendicular to the joists. The finish floor was secured to the joists by 2 in. FLN-200 hardwood flooring nails spaced nominally 8 in. OC nailed through the tongue and groove using an angled flooring nailer. A bead of fire resistive caulk was placed around the perimeter of the assembly to prevent any flame through between the frame and the test sample.
Test Sample

File NC9140 Page 20 of 178 Issued: 2008-09-30 Revised: 2009-05-12 The fire endurance test was conducted on the assembly described previously in this Report under "Erection Of Test Assembly". Test results relate only to items tested.
Test Method The location of instrumentation within the furnace and on the test sample is shown on Figures A1.1 - A1.8 in Appendix A. The temperatures of the nominal 2 by 10 in joists were measured with 20 thermocouples. Thermocouple numbers 16-25 were located on the bottom of joist and thermocouple numbers 26-35 were located on the side of the joist mid depth facing North. The thermocouples were stapled to the joists. The temperatures within the interstitial space were measured with 18 thermocouples. Thermocouple numbers 36-44 were located at the center of the interstitial space mid depth, and thermocouple numbers 45-53 located at the center of the interstitial space on the bottom of the subfloor. The temperatures between the subfloor and finish floor were measured with 15 thermocouples and numbered 1-15. The temperatures on the unexposed surface were measured with 15 thermocouples and numbered 54-68. Each of the unexposed surface thermocouples was covered with a 6 by 6 in. dry ceramic fiber pad. The deflection of the assembly was measured with five electronic transducers. There were a total of eight camera views taken during the fire exposure period. One camera was positioned in the furnace recording the exposed surface of the assembly. Five other cameras recorded separate angles of the unexposed surface of the assembly and one infrared camera recorded the unexposed surface temperatures.
Results Throughout the test, observations were made of the character of the fire, of the conditions of the exposed and unexposed surfaces, and of other events relative to the fire resistance performance of the assembly. Character and Distribution of the Furnace Fire - The furnace fire was luminous and well distributed throughout the test. A plot of the furnace temperature can be seen on Figure 1.

File NC9140 Page 21 of 178 Issued: 2008-09-30 Revised: 2009-05-12
Figure 1 - UL263 Standard Time Temperature Curve and Average Furnace Temperature vs. Time
for Assembly No. 1
Observations of the Exposed and Unexposed Surfaces - The observations were made during the fire test are presented in Table 4. All references to dimensions are approximate.
Table 4 – Observations for Test Assembly No. 1
Test Time, Min:Sec
Exposed (E) or Unexposed (U)
Surface
Observations 1:00 E Bottom of 2 by 10 in. joists began to char. 1:41 E The 2 by 10 in. joists ignited. 2:05 E The 1 by 6 in. subfloor ignited. 2:30 E Visible observations were obscured by smoke. 2:30 U Cracking from burning joists and subfloor could be
heard. 3:00 E Intense flaming and shaking of the assembly for about
10 seconds. 3:00 U Microphone on standing firefighter was vibrating. 5:00 E Still no visible observations could be seen due to
excessive flames and smoke. 8:00 E Only the furnace TCs and pylons could be seen. 9:50 E Thought the heavy smoke and flames, sparks can be
seen falling from the assembly. 13:45 U Smoke began to emit from the joints in the hardwood
floor. 18:30 U Flame through occurred near crawling mannequin. 18:45 E Mannequins fell through the floor assembly. Gas off.

File NC9140 Page 22 of 178 Issued: 2008-09-30 Revised: 2009-05-12 Temperatures of the Wood Joists - The finish rating is defined as the time necessary to raise the average temperature measured on the face of the bottom surface nearest the fire 250°F or the time required to raise the temperature on the bottom surface 325°F at any point. The average temperature measured on the bottom surface of the joists was 73°F before the test. Therefore, the average limiting temperature was 323°F and the individual limiting temperature was 398°F. The average limiting temperature for the finish rating was reach at 45 seconds as recorded by the average of thermocouple numbers 16-25. Temperatures of the Side of Mid Depth of Wood Joists – The average and maximum temperatures of the sides of the wood joists just before the moment of collapse (18 min 45 sec) were 1110°F and 1158°F respectively. The maximum individual temperature was recorded by thermocouple number 28. The average temperature was plotted on Figure 1.2. Temperatures of the Mid Depth Between Wood Joists – The average and maximum temperatures of the mid depth between the wood joists just before the moment of collapse (18 min 45 sec) were 1114°F and 1147°F respectively. The maximum individual temperature was recorded by thermocouple number 38. The average temperature was plotted on Figure 1.2. Temperatures of the Sub Floor Between Wood Joists – The average and maximum temperatures of the sub floor between the wood joists just before the moment of collapse (18 min 45 sec) were 1122°F and 1161°F respectively. The maximum individual temperature was recorded by thermocouple number 46. The average temperature was plotted on Figure 2.
Figure 2 - Plot of Temperatures Below Subfloor vs. Time for Assembly No. 1

File NC9140 Page 23 of 178 Issued: 2008-09-30 Revised: 2009-05-12 Temperatures of Between the Sub Floor and Finish Floor – The average and maximum temperatures between the sub floor and finish floor just before the moment of collapse (18 min 45 sec) were 383°F and 939°F respectively. The maximum individual temperature was recorded by thermocouple number 8. The average temperature was plotted on Figure 3.
Figure 3 - Plot of the Subfloor Temperatures vs. Time for Assembly No. 1
Temperatures of the Unexposed Surface – The average and maximum temperatures of the unexposed surface just before the moment of collapse (18 min 45 sec) were 122°F and 616°F respectively. The maximum individual temperature was recorded by thermocouple number 61. The average temperature and maximum temperatures were plotted on Figure 4.

File NC9140 Page 24 of 178 Issued: 2008-09-30 Revised: 2009-05-12
Figure 4 - Plot of the Unexposed Surface Temperatures vs. Time for Assembly No. 1
Deflection of the Assembly - The deflection of the floor-ceiling assembly during the fire test is shown on Figure 5. The location of each deflection transducer can be seen in Appendix A under Test Assembly 1.
Figure 5 - Plot of Deflections vs. Time for Assembly No. 1

File NC9140 Page 25 of 178 Issued: 2008-09-30 Revised: 2009-05-12
Test Record No. 2
Materials Materials described in section General and used in Assembly No. 2 include engineered I Joist, 2 by 4 bearing plate, subfloor (OSB), carpet and padding, and tack strips. Additional materials are described below. Rimboard – The nominal 1-1/8 in. by 12 in. OSB measured 1-1/8 in. thick by 11-15/16 in. wide and 144 in.
Erection of Test Assembly Nominal 2 in. by 4 in. structural grade wood bearing plates were placed on top of the steel angles. The wood I joists were placed on the wood bearing plates and spaced 24 in. OC starting at the East-West centerline of the assembly. The joists were fire stopped with 12 ft long pieces of rimboard. At the North and South ends of the assembly, two additional wood I joists, not in the field of the fire for the test, were placed on the North and South edges of the assembly over the vermiculite concrete, of the laboratory’s test frame, in order stabilize the wood tongue and groove subfloor. The average bearing at each end of the truss was 2-1/4 in. The trusses were fastened to each bearing plate with two No. 8d coated sinker nails spaced 12 in. OC. The nominal 8 ft by 4 ft tongue and groove subfloor boards were laid perpendicular to the wood I joists. A 1/4 in. bead of adhesive was placed on the top flange of each wood I joist and a 1/8 in. bead of adhesive was placed on the tip of the tongue and groove connection prior to sliding the subfloor panels together and set in place. The subfloor panels were secured in place with 1-7/8 in. long ringshank underlayment nails spaced 6 in. OC at the edges of the panels and 12 in. OC in the field of each panel. The pre-nailed tack strips were secured to the subfloor around the perimeter of the assembly approximately 2 in. from the inside edge of the test frame. The 6 ft wide carpet padding had joints spaced 6 ft, 12 ft and 17 ft 6 in starting at the South edge of the assembly. The carpet padding was secured to the subfloor with 1/4 in. long staples spaced 18 in. OC around the perimeter of each laid piece of padding. The 14 ft 3 in. wide by 18 ft long roll of carpet was laid on top of the carpet padding. The carpet was stretched tight and secured to the carpet gripper nailing strips located at the perimeter of the entire assembly.
Test Sample The fire endurance test was conducted on the assembly described previously in this Report under "Erection Of Test Assembly". Test results relate only to items tested.

File NC9140 Page 26 of 178 Issued: 2008-09-30 Revised: 2009-05-12
Method The location of instrumentation within the furnace and on the test sample is shown on Figures A1.1 - A1.8 in Appendix A. The temperatures of the wood I joists were measured with 20 thermocouples. Thermocouple numbers 31-40 were located on the bottom of I joist and thermocouple numbers 41-50 were located on the side of joist at mid depth facing North and stapled to the trusses. The temperatures within the interstitial space were measured with 20 thermocouples. Thermocouple numbers 51-60 were located at the center of the interstitial space mid depth and thermocouple numbers 61-70 were located at the center of the interstitial space on the bottom of the subfloor. The temperatures between the subfloor and carpet padding were measured with 15 thermocouples and numbered 1-15. The temperatures on top of the carpet padding (between the carpet padding and carpet) were measured with 15 thermocouples and numbered 16-30. The unexposed temperature were measured with 13 thermocouples and numbered 71-83. Each of the unexposed surface thermocouples was covered with a 6 by 6 in. dry ceramic fiber pad. The deflection of the assembly was measured with five electronic transducers. There were a total of eight camera views taken during the fire exposure period. One camera was positioned in the furnace recording the exposed surface of the assembly. Six other cameras recorded separate angles of the unexposed surface of the assembly and one infrared camera recorded the unexposed surface temperatures.
Results Throughout the test, observations were made of the character of the fire, of the conditions of the exposed and unexposed surfaces, and of other events relative to the fire resistance performance of the assembly. Character and Distribution of the Furnace Fire - The furnace fire was luminous and well distributed throughout the test. A plot of the furnace temperature can be seen on Figure 6.
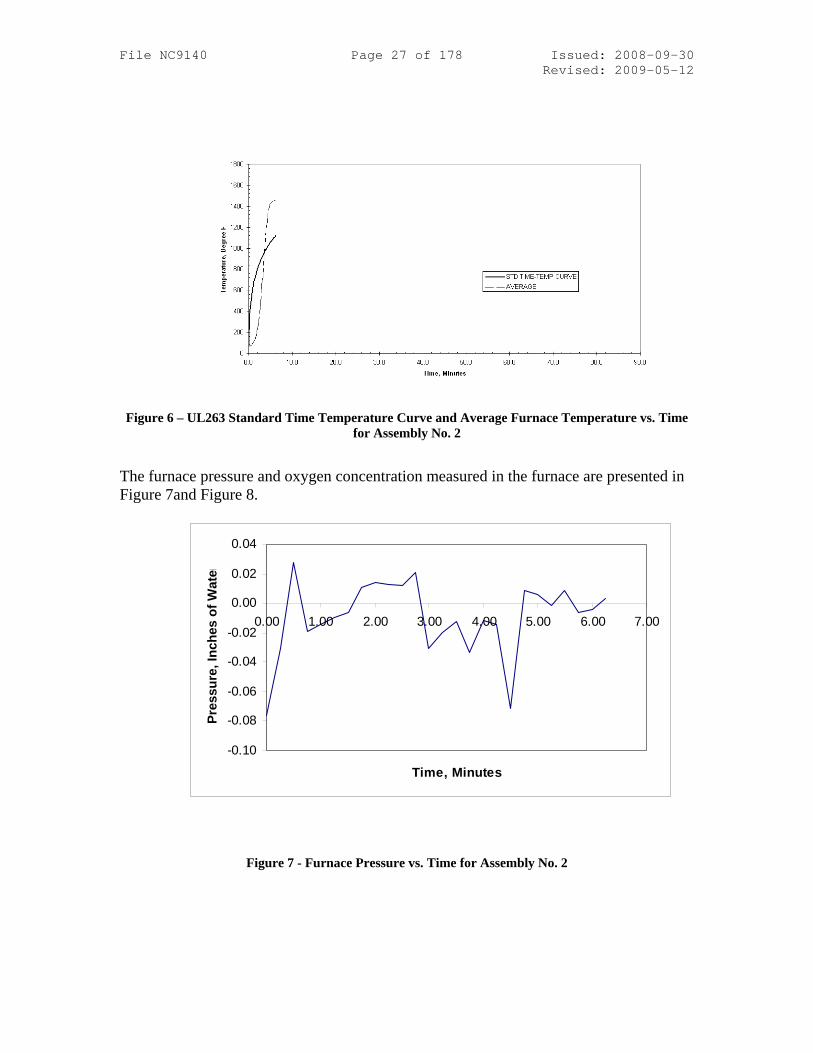
File NC9140 Page 27 of 178 Issued: 2008-09-30 Revised: 2009-05-12
Figure 6 – UL263 Standard Time Temperature Curve and Average Furnace Temperature vs. Time for Assembly No. 2
The furnace pressure and oxygen concentration measured in the furnace are presented in Figure 7and Figure 8.
-0.10
-0.08
-0.06
-0.04
-0.02
0.00
0.02
0.04
0.00 1.00 2.00 3.00 4.00 5.00 6.00 7.00
Time, Minutes
Pres
sure
, Inc
hes
of W
ater
Figure 7 - Furnace Pressure vs. Time for Assembly No. 2
File NC9140 Page 28 of 178 Issued: 2008-09-30 Revised: 2009-05-12
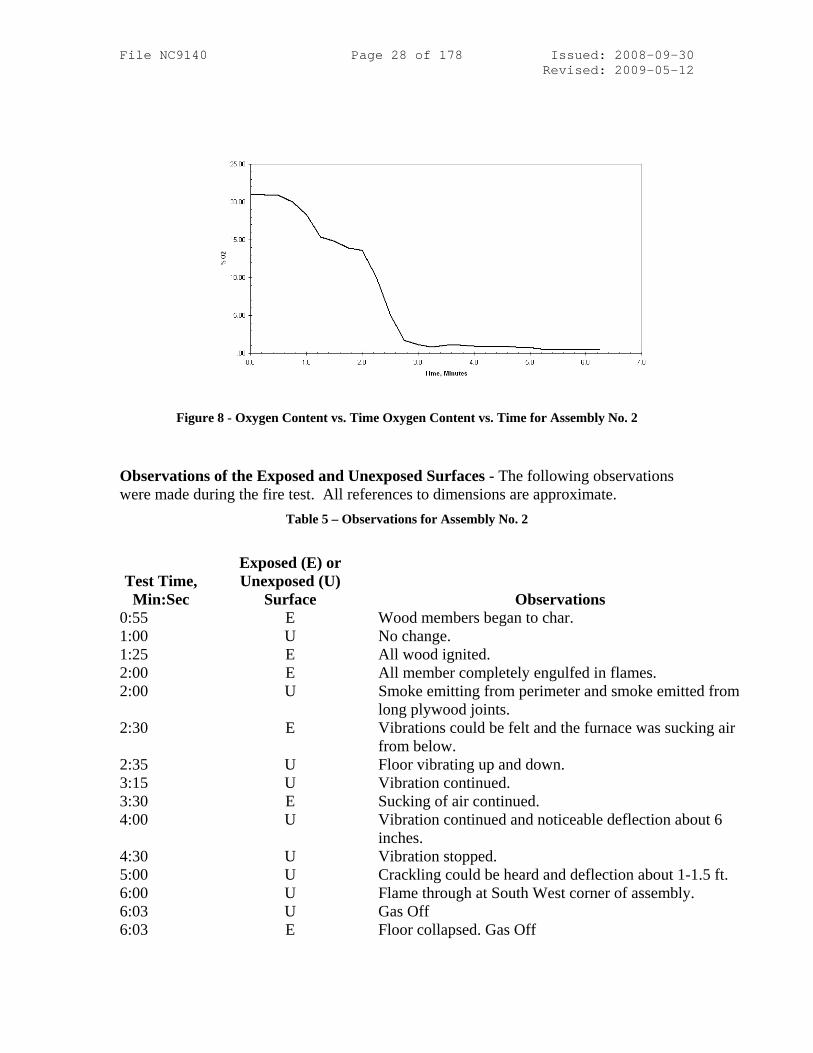
Figure 8 - Oxygen Content vs. Time Oxygen Content vs. Time for Assembly No. 2
Observations of the Exposed and Unexposed Surfaces - The following observations were made during the fire test. All references to dimensions are approximate.
Table 5 – Observations for Assembly No. 2
Test Time, Min:Sec
Exposed (E) or Unexposed (U)
Surface
Observations 0:55 E Wood members began to char. 1:00 U No change. 1:25 E All wood ignited. 2:00 E All member completely engulfed in flames. 2:00 U Smoke emitting from perimeter and smoke emitted from
long plywood joints. 2:30 E Vibrations could be felt and the furnace was sucking air
from below. 2:35 U Floor vibrating up and down. 3:15 U Vibration continued. 3:30 E Sucking of air continued. 4:00 U Vibration continued and noticeable deflection about 6
inches. 4:30 U Vibration stopped. 5:00 U Crackling could be heard and deflection about 1-1.5 ft. 6:00 U Flame through at South West corner of assembly. 6:03 U Gas Off 6:03 E Floor collapsed. Gas Off

File NC9140 Page 29 of 178 Issued: 2008-09-30 Revised: 2009-05-12 Temperatures of the Wood I Joists - The finish rating is defined as the time necessary to raise the average temperature measured on the face of the bottom chords nearest the fire 250°F or the time required to raise the temperature on the bottom chords 325°F at any point. The average temperature measured on the bottom chords of the trusses was 73°F before the test. Therefore, the average limiting temperature was 323°F and the individual limiting temperature was 398°F. The individual limiting temperature for the finish rating was reach at 30 seconds as recorded by thermocouple number 39. Temperatures on the Side of Mid Depth of the Wood I Joists – The average and maximum temperatures of the sides of the wood joists just before the moment of collapse (6 min 3 sec) were 1362°F and 1486°F respectively. The individual temperature was recorded by thermocouple number 45. A plot of these temperatures can be seen on Figure 9. Temperatures of the Mid Depth Between Wood Joists – The average and maximum temperatures of the mid depth between the wood joists just before the moment of collapse (6 min 3 sec) were 1377°F and 1430°F respectively. The individual temperature was recorded by thermocouple number 58. A plot of these temperatures can be seen on Figure 9. Temperatures of the Sub Floor Between Wood Joists – The average and maximum temperatures of the sub floor between the wood joists just before the moment of collapse (6 min 3 sec) were 1361°F and 1417°F respectively. The individual temperature was recorded by thermocouple number 70. A plot of these temperatures can be seen on Figure 9.
Figure 9 - Plot of Temperatures Below Subfloor vs. Time for Assembly No. 2
Temperatures of Between the Sub Floor and Carpet Padding – The average and maximum temperatures between the sub floor and finish floor just before the moment of collapse (6 min 3 sec) were 228°F and 1371°F respectively. The individual temperature

File NC9140 Page 30 of 178 Issued: 2008-09-30 Revised: 2009-05-12 was recorded by thermocouple number 3. A plot of these temperatures can be seen on Figure 10.
Figure 10 - Plot of the Subfloor Temperatures vs. Time for Assembly No. 2
Temperatures of Between the Carpet Padding and Carpet – The average and maximum temperatures between the carpet padding and carpet just before the moment of collapse (6 min 3 sec) were 109°F and 187°F respectively. The individual temperature was recorded by thermocouple number 29. A plot of these temperatures can be seen on Figure 11.
Figure 11 - Plot of Temperature of the Carpet Padding vs. Time for Assembly No. 2
Temperatures of the Unexposed Surface – The average and maximum temperatures of the unexposed surface just before the moment of collapse (6 min 3 sec) were 90°F and
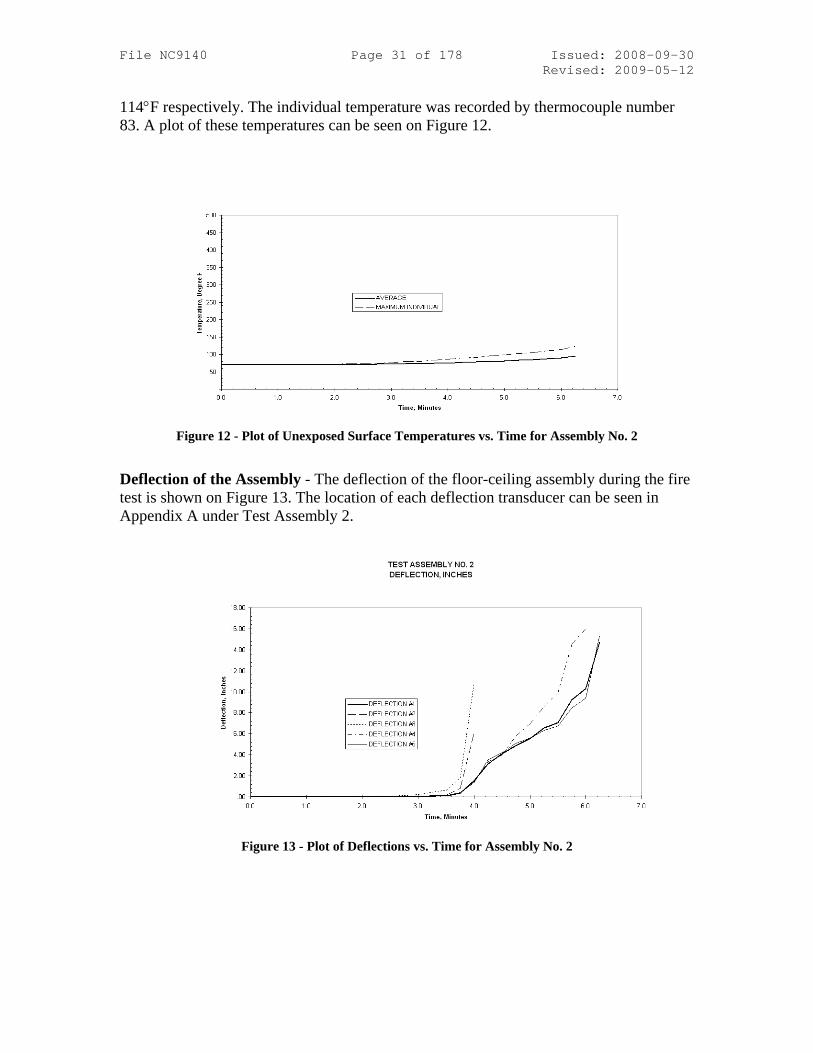
File NC9140 Page 31 of 178 Issued: 2008-09-30 Revised: 2009-05-12 114°F respectively. The individual temperature was recorded by thermocouple number 83. A plot of these temperatures can be seen on Figure 12.
Figure 12 - Plot of Unexposed Surface Temperatures vs. Time for Assembly No. 2
Deflection of the Assembly - The deflection of the floor-ceiling assembly during the fire test is shown on Figure 13. The location of each deflection transducer can be seen in Appendix A under Test Assembly 2.
Figure 13 - Plot of Deflections vs. Time for Assembly No. 2

File NC9140 Page 32 of 178 Issued: 2008-09-30 Revised: 2009-05-12 Test Record No. 3
Materials Materials described in Section General and used in Assembly No. 3 include 2 in. by 10 in. joists, 2 in. by 6 in. bearing plates, subflooring, red rosin paper, finish flooring, and 1/2 in. gypsum board. Additional materials are described below. Cross Bridging – The nominal 1 in. by 3 in. dimensional lumber measured 11/16 in. by 2-7/16 in. and each end was cut at an angle and a length of 16-3/8 in.
Erection of Test Assembly Nominal 2 in. by 6 in. structural grade wood bearing plates were placed on top of the steel angles. The 2 in. by 10 in. joists were placed on the wood bearing plates and spaced 16 in. OC starting 8 in. from the East-West centerline of the assembly. The joists were fire stopped with 14-1/2 in. long pieces of nominal 2 by 10 in. lumber. At the North and South ends of the assembly, additional joists, not in the field of the fire for the test, were placed 2-1/2 inches from the North and South edges of the assembly over the vermiculite concrete in order stabilize the nominal 1 by 4 in. tongue and groove subfloor. The average bearing at each end of the joist was 5-1/4 in. The joists were fastened to each bearing plate with two No. 16d coated sinker nails.
The joists were stabilized by nominal 1 by 3 in. bridging cut to lengths of approximately 16-1/2 in. long with their ends cut to an angle of approximately 45 degrees. The pieces of bridging was secured diagonally opposed to each other between each pair of joists with two 6d coated sinker nails at each end of each piece. The nominal 1 by 6 in. random length tongue and groove subfloor boards were laid diagonally (45 degrees to the joists) and secured in place with No. 8d coated sinker nails four nails per butt joint and two nails in the field at each joist. The red rosin paper was laid over the subfloor in the East-West direction and secured in place with staples in a random order. There was a 4 in. overlap of each roll of paper. The nominal 1 by 4 in. tongue and groove finish floor was installed over the building paper and oriented perpendicular to the joists. The finish floor was secured to the joists by 2 in. FLN-200 hardwood flooring nails spaced nominally 8 in. OC nailed through the tongue and groove using an angled flooring nailer. A bead of fire resistive caulk was placed around the perimeter of the assembly to prevent any flame through between the frame and the test sample. The gypsum board was secured to the exposed side of the assembly with 1-5/8 in. long phosphate coated drywall nails spaced 7 in. OC with nails spaced 1 in from the edge in the field and at the perimeter. The East-West gypsum board joints were staggered 4 ft as to not align any East-West joints. The North-South gypsum board joints were aligned and

File NC9140 Page 33 of 178 Issued: 2008-09-30 Revised: 2009-05-12 spaced 4 ft OC. The long edges of the boards were oriented perpendicular to the joists. Two layers of dry mix joint compound was used to cover all gypsum board joints and nails heads.
Sample The fire endurance test was conducted on the assembly described previously in this Report under "Erection Of Test Assembly". Test results relate only to items tested.
Method The location of instrumentation within the furnace and on the test sample is shown in Appendix A. The temperatures of the nominal 2 by 10 in joists were measured with 20 thermocouples. Thermocouple numbers 16-25 were located on the bottom of the joists and thermocouple numbers 26-35 were located on the side of joist mid depth facing North and stapled to the joists. The temperatures within the interstitial space were measured with 18 thermocouples. Thermocouple numbers 45-53 were located at the center of the interstitial space mid depth and thermocouple numbers 54-62 were located at the center of the interstitial space on the bottom of the sub floor. The temperatures between the subfloor and finish floor were measured with 15 thermocouples and numbered 1-15. The temperatures on the unexposed side of the gypsum board were measured with 9 thermocouples and numbered 36-44. The temperatures on the unexposed surface were measured with 15 thermocouples and numbered 63-77. Thermocouple number 72 malfunctioned and did not record any data. Each of the unexposed surface thermocouples was covered with a 6 by 6 in. dry ceramic fiber pad. The deflection of the assembly was measured with five electronic transducers. There were a total of eight camera views taken during the fire exposure period. Two cameras were positioned in the interstitial spaced in the cavities under both the kneeling and standing mannequins, both cameras were facing West. One camera was positioned in the furnace recording the exposed surface of the assembly, one infrared camera recording the unexposed surface temperatures. Four other cameras recorded separate angles of the unexposed surface of the assembly and one infrared camera recorded the unexposed surface temperatures.
Results

File NC9140 Page 34 of 178 Issued: 2008-09-30 Revised: 2009-05-12 Throughout the test, observations were made of the character of the fire, of the conditions of the exposed and unexposed surfaces, and of other events relative to the fire resistance performance of the assembly. Character and Distribution of the Furnace Fire - The furnace fire was luminous and well distributed throughout the test. A plot of the furnace temperature can be seen on Figure 14.
Figure 14 - UL263 Standard Time Temperature Curve and Average Furnace Temperature vs. Time for Test Assembly No. 3
The furnace pressure and oxygen concentration during the test are presented in Figure 15 and Figure 16.
-0.04
-0.03
-0.02
-0.01
0.00
0.01
0.02
0.03
0.04
0.0 10.0 20.0 30.0 40.0 50.0
Time, Minutes
Pres
sure
, Inc
hes
of W
ater
Figure 15 - Furnace Pressure vs. Time for Test Assembly No. 3

File NC9140 Page 35 of 178 Issued: 2008-09-30 Revised: 2009-05-12
Figure 16 - Oxygen Content vs. Time for Test Assembly No. 3
Observations of the Exposed and Unexposed Surfaces - The observations made during the fire test are presented in Table 6. All references to dimensions are approximate.
Table 6 - Observations for Test Assembly No. 3
Test Time (Min:Sec)
Exposed (E) or Unexposed (U)
Surface
Observations
4:00 E Entire surface black in color. 4:00 U No Change. 4:30 E A very small piece of joint
compound fell from a butt joint near the center of the assembly.
6:00 U No Change. 7:00 E Additional small areas of joint
compound fell from the butt joints. 8:00 U No Change. 10:00 E Joint tape and compound fell from
long joints. 10:00 U No Change. 12:00 U No Change. 12:45 E Tape and compound continued to
fall from joints and stated to fall from nail heads.
14:00 E Surface turned gray/white in color. 14:00 U No Change. 16:00 U No Change.

File NC9140 Page 36 of 178 Issued: 2008-09-30 Revised: 2009-05-12
Test Time (Min:Sec)
Exposed (E) or Unexposed (U)
Surface
Observations
16:30 U Smoke emitting from perimeter at SE corner.
18:00 E A long crack in the field of one board near the center of the assembly, 2 from South end occurred.
19:00 U No Change. 21:00 E Additional large crack in board
near center of the assembly 10 ft from North edge of assembly occurred.
21:00 U Smoke emitting form all saddle locations.
23:00 E Additional large cracks opening randomly in gypsum board.
23:00 U No Change. 23:30 E 2 ft by 4 ft piece of gypsum board
fell. 23:30 U Crackling could be heard.
24:45:00 E 1 ft by 1 ft piece of gypsum board fell.
26:00:00 E No Change. 26:15:00 E 1 ft by 2 ft piece of gypsum board
fell from south edge. 26:45:00 E Cracking noises heard. 27:30:00 E Additional pieces of gypsum board
fell randomly. 28:00:00 U Crackling could be heard and more
intense smoke could be seen. 28:15:00 E No visual observations could be
made. 28:45:00 U Smoke Coming through butt joints
of oak flooring North Center. 30:30:00 U Smoke coming through butt joints
of oak flooring East Center. 33:00:00 U Smoke emitting through butt joints
of entire assembly.

File NC9140 Page 37 of 178 Issued: 2008-09-30 Revised: 2009-05-12
Test Time (Min:Sec)
Exposed (E) or Unexposed (U)
Surface
Observations
34:00:00 U Crackling continued and smoke increased.
35:30:00 E No change, still no visual observations could be made.
37:00:00 U Smoke continued to increase 39:00:00 U Smoke almost non-existent. 41:00:00 U Smoke at perimeter and at floor
butt joints. 41:15:00 U Smoke emitting from pant leg of
kneeling mannequin. 42:30:00 U Pop heard. Buckling of finish
flooring between concrete weight and mannequins.
44:00:00 U Significant smoke at feet of standing mannequin.
44:15:00 U Flame through at base of standing mannequin.
44:45:00 U Standing mannequin fell through. Gas off.
44:45:00 E Mannequin fell through. Gas off. Temperatures of the Wood Joists - The finish rating is defined as the time necessary to raise the average temperature measured on the face of the bottom surface nearest the fire 250°F or the time required to raise the temperature on the bottom surface 325°F at any point. The average temperature measured on the bottom surface of the joists was 63°F before the test. Therefore, the average limiting temperature was 313°F and the individual limiting temperature was 388°F. The limiting temperature for the finish rating was reach at 15 minutes and 30 seconds as recorded by both the average of thermocouple numbers 16-25 and the individual thermocouple number 21. Temperatures of the Side of Mid Depth of Wood Joists – The average and maximum temperatures of the sides of the wood joists just before the moment of collapse (44 min 45 sec) were 1450°F and 1550°F respectively. The individual temperature was recorded by thermocouple number 33. A plot of these temperatures can be seen on Figure 17. Temperatures of the Mid Depth Between Wood Joists – The average and maximum temperatures of the mid depth between the wood joists just before the moment of collapse (44 min 45 sec) were 1482°F and 1566°F respectively. The individual temperature was recorded by thermocouple number 52. A plot of these temperatures can be seen on Figure 17.

File NC9140 Page 38 of 178 Issued: 2008-09-30 Revised: 2009-05-12 Temperatures of the Sub Floor Between Wood Joists – The average and maximum temperatures of the sub floor between the wood joists just before the moment of collapse (44 min 45 sec) were 1467°F and 1528°F respectively. The individual temperature was recorded by thermocouple number 62. A plot of these temperatures can be seen on Figure 17.
Figure 17 - Plot of Temperature Below Subfloor vs. Time for Assembly No. 3
Temperatures of the Unexposed Side of Gypsum Board - The average and maximum temperatures of the unexposed surface just before the moment of gypsum board fall off (23 min 30 sec) were 605°F and 617°F respectively. The individual temperature was recorded by thermocouple number 41. A plot of these temperatures can be seen on Figure 18.

File NC9140 Page 39 of 178 Issued: 2008-09-30 Revised: 2009-05-12
Figure 18 - Plot of Temperature of the Unexposed Surface of Gypsum Board vs. Time for Assembly No. 3
Temperatures of Between the Sub Floor and Finish Floor – The average and maximum temperatures between the sub floor and finish floor just before the moment of collapse (44 min 45 sec) were 993°F and 1479°F respectively. The individual temperature was recorded by thermocouple number 6. A plot of these temperatures can be seen on Figure 19.
Figure 19 - Plot of Temperature of the Subfloor Temperatures vs. Time for Assembly No. 3
Temperatures of the Unexposed Surface – The average and maximum temperatures of the unexposed surface just before the moment of collapse (44 min 45 sec) were 152°F and 183°F respectively. The individual temperature was recorded by thermocouple number 77. A plot of these temperatures can be seen on Figure 20.

File NC9140 Page 40 of 178 Issued: 2008-09-30 Revised: 2009-05-12
Figure 20 - Plot of Temperatures of the Unexposed Surface vs. Time for Assembly No. 3
Deflection of the Assembly - The deflection of the floor-ceiling assembly during the fire test is shown on Figure 21. The location of each deflection transducer can be seen in Appendix A under Test Assembly 3.
Figure 21 - Plot of Deflections vs. Time for Assembly No. 3

File NC9140 Page 41 of 178 Issued: 2008-09-30 Revised: 2009-05-12 Test Record No. 4
Materials Materials described in section General and used in Assembly No. 4 include engineered I Joist, 2 by 4 bearing plate, subfloor (OSB), carpet and padding, gypsum board, and tack strips. Additional materials are described below. Rimboard – The nominal 1-1/8 in. by 12 in. OSB measured 1-1/8 in. thick by 11-15/16 in. wide and 144 in.
Erection of Test Assembly Nominal 2 in. by 4 in. structural grade wood bearing plates were placed on top of the steel angles. The wood I joists were placed on the wood bearing plates and spaced 24 in. OC starting at the East-West centerline of the assembly. The joists were fire stopped with 144 in. long pieces of rimboard. At the North and South ends of the assembly, two additional wood I joists, not in the field of the fire for the test, were placed on the North and South edges of the assembly over the vermiculite concrete in order stabilize the wood tongue and groove subfloor. The average bearing at each end of the truss was 2-1/4 in. The trusses were fastened to each bearing plate with two No. 8d coated sinker nails spaced 12 in. OC. The nominal 8 ft by 4 ft tongue and groove subfloor boards were laid perpendicular to the wood I joists. A 1/4 in. bead of adhesive was placed on the top flange of each wood I joist and a 1/8 in. bead of adhesive was placed on the tip of the tongue and groove connection prior to sliding the subfloor panels together and set in place. The subfloor panels were secured in place with 1-7/8 in. long ringshank underlayment nails spaced 6 in. OC at the edges of the panels and 12 in. OC in the field of each panel. The pre-nailed tack strips were secured to the subfloor around the perimeter of the assembly approximately 2 in. from the inside edge of the test frame. The 6 ft wide carpet padding had joints spaced 6 ft, 12 ft and 17 ft 6 in. starting at the South edge of the assembly. The carpet padding was secured to the subfloor with 1/4 in. long staples spaced 18 in. OC around the perimeter of each laid piece of padding. The 14 ft 3 in wide by 18 ft long roll of carpet was laid on top of the carpet padding. The carpet was stretched tight and secured to the carpet gripper nailing strips located at the perimeter of the entire assembly. The gypsum board was secured to the exposed side of the assembly with 1-5/8 in. long phosphate coated drywall nails spaced 7 in. OC with nails spaced 1 in from the edge in the field and at the perimeter. The East-West gypsum board joints were staggered 48 in. as to not align any East-West joints. The North-South gypsum board joints were aligned

File NC9140 Page 42 of 178 Issued: 2008-09-30 Revised: 2009-05-12 and spaced 48 in. OC. The long edges of the boards were oriented perpendicular to the joists. Two layers of dry mix joint compound was used to cover all gypsum board joints and nails heads.
Sample The fire endurance test was conducted on the assembly described previously in this Report under "Erection Of Test Assembly". Test results relate only to items tested.
Method The location of instrumentation within the furnace and on the test sample is shown in Appendix A. The temperatures of the wood I joists were measured with 20 thermocouples. Thermocouple numbers 31-40 were located on bottom of the I joist and thermocouple numbers 41-50 were located on the side of joist mid depth facing North and were stapled to the trusses. The temperatures within the interstitial space were measured with 20 thermocouples. Thermocouple numbers 61-70 were located at the center of the interstitial space mid depth and thermocouple numbers 71-80 were located at the center of the interstitial space on the bottom of the subfloor. The temperatures between the subfloor and carpet padding were measured with 15 thermocouples and numbered 1-15. The temperatures on top of the carpet padding (between the carpet padding and carpet) were measured with 15 thermocouples and numbered 16-30. The unexposed temperatures were measured with 13 thermocouples and numbered 81-93. Each of the unexposed surface thermocouples was covered with a 6 by 6 in. dry ceramic fiber pad. The deflection of the assembly was measured with five electronic transducers. The temperatures on the unexposed side of the gypsum board (between the gypsum board and the subfloor) were measured with 10 thermocouples and numbered 51-60. There were a total of eight camera views taken during the fire exposure period. Two cameras were positioned in the interstitial spaced in the cavities under both the kneeling and standing mannequins, both cameras were facing West. One camera was positioned in the furnace recording the exposed surface of the assembly. Four other cameras recorded separate angles of the unexposed surface of the assembly and one infrared camera recorded the unexposed surface temperatures.

File NC9140 Page 43 of 178 Issued: 2008-09-30 Revised: 2009-05-12 Two accelerometers were placed near the East West centerline of the assembly. One was placed on the East West centerline and the other was placed 12 in. North of the East West centerline. They were both located 12 in. off the West edge of the assembly. These were uses to measure the vertical acceleration of the assembly throughout the fire exposure.
Results Throughout the test, observations were made of the character of the fire, of the conditions of the exposed and unexposed surfaces, and of other events relative to the fire resistance performance of the assembly. Character and Distribution of the Furnace Fire - The furnace fire was luminous and well distributed throughout the test. A plot of the furnace temperature can be seen on Figure 22.
Figure 22 - UL263 Standard Time Temperature Curve and Average Furnace Temperature vs. Time
for Assembly No. 4
The furnace pressure and oxygen concentration during the test are shown in Figure 23 and Figure 24.

File NC9140 Page 44 of 178 Issued: 2008-09-30 Revised: 2009-05-12
-0.07-0.06-0.05-0.04-0.03-0.02-0.010.000.010.020.03
0.0 5.0 10.0 15.0 20.0 25.0 30.0
Time, Minutes
Pres
sure
, Inc
hes
of W
ater
Figure 23 – Furnace Pressure vs. Time for Assembly No. 4
Figure 24 - Oxygen Content vs. Time for Assembly No. 4
Observations of the Exposed and Unexposed Surfaces - The observations were made during the fire test are presented in Table 7. All references to dimensions are approximate.

File NC9140 Page 45 of 178 Issued: 2008-09-30 Revised: 2009-05-12
Table 7 – Observations for Test Assembly No. 4
Test Time, Min:Sec
Exposed (E) or Unexposed (U)
Surface
Observations 1:15 E Paper began to char. 2:00 E Paper ignited. 2:00 U No Change. 2:30 E Per plenum camera, smoke was seen in plenum. 4:00 U No Change. 4:30 E Joint compound began to crack at butt joints. 5:30 E Paper flaked off. (TC # 65 Backwards) 6:00 U No Change. 7:45 E Joint tape began to peel from board in spots. 8:00 U No Change. 9:30 E Board was wavy in appearance from joist to joist. 10:00 E Joint compound began to fall off. 10:00 U No Change. 11:00 E Board turned gray in color 12:00 U No Change. 12:45 E 50% of joint compound had fallen off. 14:00 U No Change. 16:00 U No Change. 16:45 E 85% of joint compound had fallen off. 17:15 E Gypsum board beginning to fall on North end of
assembly. 18:00 E Gypsum board fell from Center and South ends of the
assembly. 18:00 U No Change. 18:15 U Smoke began to emit through carpet at East Center
subfloor joint. 19:00 U Smoke at West Center subfloor joint. 19:15 E 40% of board fell off. 20:00 U Smoke continued at all central joints. 20:40 U Holes developed through Carpet at West Center subfloor
joint at South end of assembly. 20:45 E Heavy flaming and board continued to fall. 21:15 E No visual observation could be made due to poor
visibility. 22:26 U Microphone on kneeling mannequin began to vibrate. 23:30 E Crackling noises could be heard. 23:45 U Vibrations Continued. 25:00 E Furnace TC #15 fell. 25:00 U Vibrations Continued. 26:45 U Assembly Collapse. 26:45 E Collapse

File NC9140 Page 46 of 178 Issued: 2008-09-30 Revised: 2009-05-12 Temperatures of the Wood I Joists - The finish rating is defined as the time necessary to raise the average temperature measured on the face of the bottom chords nearest the fire 250°F or the time required to raise the temperature on the bottom chords 325°F at any point. The average temperature measured on the bottom chords of the trusses was 67°F before the test. Therefore, the average limiting temperature was 317°F and the individual limiting temperature was 392°F. The maximum individual limiting temperature for the finish rating was reach at 7 minutes and 45 seconds as recorded by thermocouple number 31. Temperatures of the Side of Mid Depth of Wood Joists – The average and maximum temperatures of the sides of the wood joists just before the moment of collapse (26 min 45 sec) were 1467°F and 1597°F respectively. The individual temperature was recorded by thermocouple number 48. A plot of these temperatures can be seen on Figure 25. Temperatures of the Mid Depth Between Wood Joists – The average and maximum temperatures of the mid depth between the wood joists just before the moment of collapse (26 min 45 sec) were 1475°F and 1547°F respectively. The individual temperature was recorded by thermocouple number 70. A plot of these temperatures can be seen on Figure 25. Temperatures of the Bottom of the Sub Floor Between Wood Joists – The average and maximum temperatures of the sub floor between the wood joists just before the moment of collapse (26 min 45 sec) were 1467°F and 1549°F respectively. The individual temperature was recorded by thermocouple number 80. A plot of these temperatures can be seen on Figure 25.
Figure 25 - Plot of Temperatures Below Subfloor vs. Time for Assembly No. 4

File NC9140 Page 47 of 178 Issued: 2008-09-30 Revised: 2009-05-12 Temperatures of the Unexposed Side of Gypsum Board – The average and maximum temperatures of the unexposed surface just before the gypsum board fall off (17 min 15 sec) were 531°F and 634°F respectively. The individual temperature was recorded by thermocouple number 57. A plot of these temperatures can be seen on Figure 26.
Figure 26 - Plot of Temperature of the Unexposed Surface of Gypsum Board vs. Time for Assembly
No. 4
Temperatures Between the Sub Floor and Carpet Padding – The average and maximum temperatures between the sub floor and finish floor just before the moment of collapse (26 min 45 sec) were 191°F and 361°F respectively. The individual temperature was recorded by thermocouple number 7. A plot of these temperatures can be seen on Figure 27.
Figure 27 - Plot of Temperature of the Subfloor Temperatures vs. Time

File NC9140 Page 48 of 178 Issued: 2008-09-30 Revised: 2009-05-12 Temperatures Between the Carpet Padding and Carpet – The average and maximum temperatures between the sub floor and finish floor just before the moment of collapse (26 min 45 sec) were 135°F and 188°F respectively. The individual temperature was recorded by thermocouple number 29. A plot of these temperatures can be seen on Figure 28.
Figure 28 - Plot of Temperature of the Carpet Padding vs. Time for Assembly No. 4
Temperatures of the Unexposed Surface – The average and maximum temperatures of the unexposed surface just before the moment of collapse (26 min 45 sec) were 144°F and 355°F respectively. The individual temperature was recorded by thermocouple number 87. A plot of these temperatures can be seen on Figure 29.
Figure 29 - Plot of Temperature of the Unexposed Surface vs. Time for Assembly No. 4

File NC9140 Page 49 of 178 Issued: 2008-09-30 Revised: 2009-05-12 Deflection of the Assembly - The deflection of the floor-ceiling assembly during the fire test is shown on Figure 30. The location of each deflection transducer can be seen in Appendix A under Test Assembly 4.
Figure 30 - Plot of Deflections vs. Time for Assembly No. 4

File NC9140 Page 50 of 178 Issued: 2008-09-30 Revised: 2009-05-12 Test Record No. 5
Materials Materials described in section General and used in Assembly No. 5 include engineered 2 by 6 bearing plate, subfloor (OSB), carpet and padding, tack strips, and gypsum board. Additional materials are described below. Trusses - The parallel chord trusses were 14 in. deep, 13 ft 10 in. long fabricated from nominal 2 in. by 4 in. wood members and had an average weight of 54.08 lb. The nominal 4 in. side of the truss members was oriented in the horizontal direction. The truss members were secured together with galvanized steel plates measuring 0.036 in. thick for 1.5 in. by 4 in., 3 in. by 4 in., 3 in. by 7in., 3.5 in. by 8 in. and 3 in. by 10 in. sizes. The plates contained 5/16 in. long teeth projecting perpendicular to the plane of the plate. The moisture content of the truss members ranged from 3.4 to 12.1 percent and averaged 9.2 percent. End Closure – The nominal 2 in. by 4 in. dimensional lumber measured 1-1/2 in. by 3-1/2 in. and cut to lengths of 8 ft 8-5/8 in. long. Strongback – The nominal 2 in. by 6 in. dimensional lumber measured 1-1/2 in. by 5-1/2 in. and cut to lengths of 5 ft 7-3/4 in. and 12 ft 3/8 in. long.
Erection of Test Assembly Nominal 2 in. by 6 in. structural grade wood bearing plates were placed on top of the steel angles. The trusses were placed on the wood bearing plates and spaced 24 in. OC starting at the East West centerline of the assembly. At the North and South ends of the assembly, additional trusses, not in the field of the fire test, were placed over the vermiculite concrete in order stabilize the plywood subfloor. The average bearing at each end of the truss was 4-7/8 in. The trusses were fastened to each bearing plate with two No. 16d nails. Nominal 2 in. by 6 in. structural grade strongback was run perpendicular to the vertical member of the trusses located 5 ft 7-1/2 in. from the West side of the assembly. The strongback was secured to the vertical wood members of the trusses with two No. 16d nails at each strongback / truss interface. Along the east and west edges of the test assembly, nominal 2 in. by 4 in. wood headers (rim band) were spaced perpendicular to the trusses and fastened to the top chord of each truss with two No. 16d nails. A 1/4 in. wide bead of adhesive was placed on the top chord of the trusses and into the grooved edge of the plywood. The plywood sub-floor was placed on the trusses with the 8 ft long edges positioned perpendicular to the trusses and the ends butted and centered

File NC9140 Page 51 of 178 Issued: 2008-09-30 Revised: 2009-05-12 over trusses, with adjacent end joints staggered 4 ft. A 1/8 in. wide bead of adhesive was placed on the tip of the tongue and groove ends of the subfloor before sliding the panels together. The plywood was secured to the trusses with 1-7/8 in. ringshank underlayment nails spaced 6 in. OC at the perimeter and 12 in. OC in the field with nails 1 in. from the edge of each panel. The pre-nailed tack strips were secured to the subfloor around the perimeter of the assembly approximately 2 in. from the inside edge of the test frame. The 6 ft wide carpet padding had joints spaced 6 ft,12 ft and 17 ft 6 in. starting at the West edge of the assembly. The carpet padding was secured to the subfloor with 1/4 in. long staples spaced 18 in. OC around the perimeter of each laid piece of padding. The 14 ft 3 in. wide by 18 ft long roll of carpet was laid on top of the carpet padding. The carpet was stretched tight and secured to the carpet gripper nailing strips located at the perimeter of the entire assembly. The gypsum board was secured to the exposed side of the assembly with 1-5/8 in. long phosphate coated drywall nails spaced 7 in. OC with nails spaced 1 in from the edge in the field and at the perimeter. The East-West gypsum board joints were staggered 48 in. as to not align any East-West joints. The North-South gypsum board joints were aligned and spaced 48 in. OC. The long edges of the boards were oriented perpendicular to the joists. Two layers of dry mix joint compound was used to cover all gypsum board joints and nails heads.
Sample The fire endurance test was conducted on the assembly described previously in this Report under "Erection Of Test Assembly". Test results relate only to items tested.
Method The location of instrumentation within the furnace and on the test sample are shown in Appendix A. The temperatures of the wood trusses were measured with 20 thermocouples numbered 31-40 were located on the bottom of the trusses and thermocouple numbers 41-50 were located on the side of trusses mid depth facing North and stapled to the trusses. The temperatures within the interstitial space were measured with 26 thermocouples. These thermocouples were numbered 61-70 and located at the center of the interstitial space mid depth. Thermocouple numbers 71-80 were located at the center of the interstitial space on the bottom of the subfloor. Thermocouples numbered 81-83 were located on the bottom metal gusset plates nearest center of assembly facing North. Thermocouples numbered 84-86 were located on the top metal gusset plates nearest center of assembly facing North.

File NC9140 Page 52 of 178 Issued: 2008-09-30 Revised: 2009-05-12 The temperatures between the subfloor and carpet padding were measured with 15 thermocouples and numbered 1-15. The temperatures on top of the carpet padding (between the carpet padding and carpet) were measured with 15 thermocouples and numbered 16-30. The unexposed surface temperatures were measured with 13 thermocouples and numbered 87-99. Each thermocouple was covered with a 6 by 6 in. dry ceramic fiber pad. The temperatures on the unexposed side of the gypsum board (between the gypsum board and the subfloor) were measured with 10 thermocouples and numbered 51-60. The deflection of the assembly was measured with five electronic transducers. There were a total of eight camera views taken during the fire exposure period. One camera was positioned in the furnace recording the exposed surface of the assembly, two cameras positioned in the interstitial space between the gypsum board and sub floor. Four other cameras recorded separate angles of the unexposed surface of the assembly and one infrared camera recorded the unexposed surface temperatures.
Results Throughout the test, observations were made of the character of the fire, of the conditions of the exposed and unexposed surfaces, and of other events relative to the fire resistance performance of the assembly. Character and Distribution of the Furnace Fire - The furnace fire was luminous and well distributed throughout the test. A plot of the furnace temperature can be seen on Figure 31.
Figure 31 - UL263 Standard Time Temperature Curve and Average Furnace Temperature vs. Time
for Assembly No. 5

File NC9140 Page 53 of 178 Issued: 2008-09-30 Revised: 2009-05-12 The furnace pressure and oxygen concentration during the test are presented in Figure 32 and Figure 33.
-0.04
-0.03
-0.02
-0.01
0.00
0.01
0.02
0.0 5.0 10.0 15.0 20.0 25.0 30.0 35.0
Time, Minutes
Pres
sure
, Inc
hes
of W
ater
Figure 32 - Furnace Pressure vs. Time for Assembly No. 5
Figure 33 - Oxygen Content vs. Time for Assembly No. 5
Observations of the Exposed and Unexposed Surfaces - The observations made during the fire test are presented in Table 8. All references to dimensions are approximate.

File NC9140 Page 54 of 178 Issued: 2008-09-30 Revised: 2009-05-12
Table 8 – Observations for Assembly No. 5
Test Time, Min:Sec
Exposed (E) or Unexposed (U)
Surface
Observations 1:30 E Paper surface ignited. 2:00 U No change. 2:30 E Paper charred and black in color. 4:00 U No change. 6:00 U No change. 6:15 E Joint compound buckled and surface turned gray in
color. 8:00 U No change. 8:30 E Joint compound fell from joints. 10:00 U Smoke emitted fro perimeter of assembly at saddles and
penetrations. 10:30 E 20% of joint compound had fallen off. 12:00 U Smoke at perimeter continued. Slightly intensified. 12:30 E Joint compound continued to fall off. 75% had fallen
off. 14:00 U No change. 16:00 U No change. 16:30 E 2 ft by 4 ft piece of gypsum had fell off. The West
adjacent had large cracks. 17:45 E Board continued to fall off. 18:00 U No change at perimeter. Smoke began to emit from
assembly at subfloor joints. 18:15 E Large pieces of gypsum board continued to fall. About
50%-60% gone. 18:45 E 70%-75% of the gypsum board had fallen off. 19:00 E Crackling sounds from the trusses could be heard. 19:50 U Crackling form assembly could be heard. 20:00 E Could not see in furnace through windows of camera. 21:15 U Intense smoke over entire surface. Holes could be seen
through carpet at subfloor joints. 21:45 E Crackling noises continued. 24:30 U Flame through at TC hole. 25:30 E Still no visual observations could be made. 25:30 U Smoke was puffing at east side of assembly. 26:20 U Carpet buckled at subfloor joints. 27:45 U Flame through at west edge perimeter 28:00 E Mannequin dropped a few inches. 28:40 U Flame through along center truss. 28:49 E Mannequin dropped a few inches. 29:15 E Mannequin fell through. Gas off. 29:15 U Mannequin fell through. Gas off.
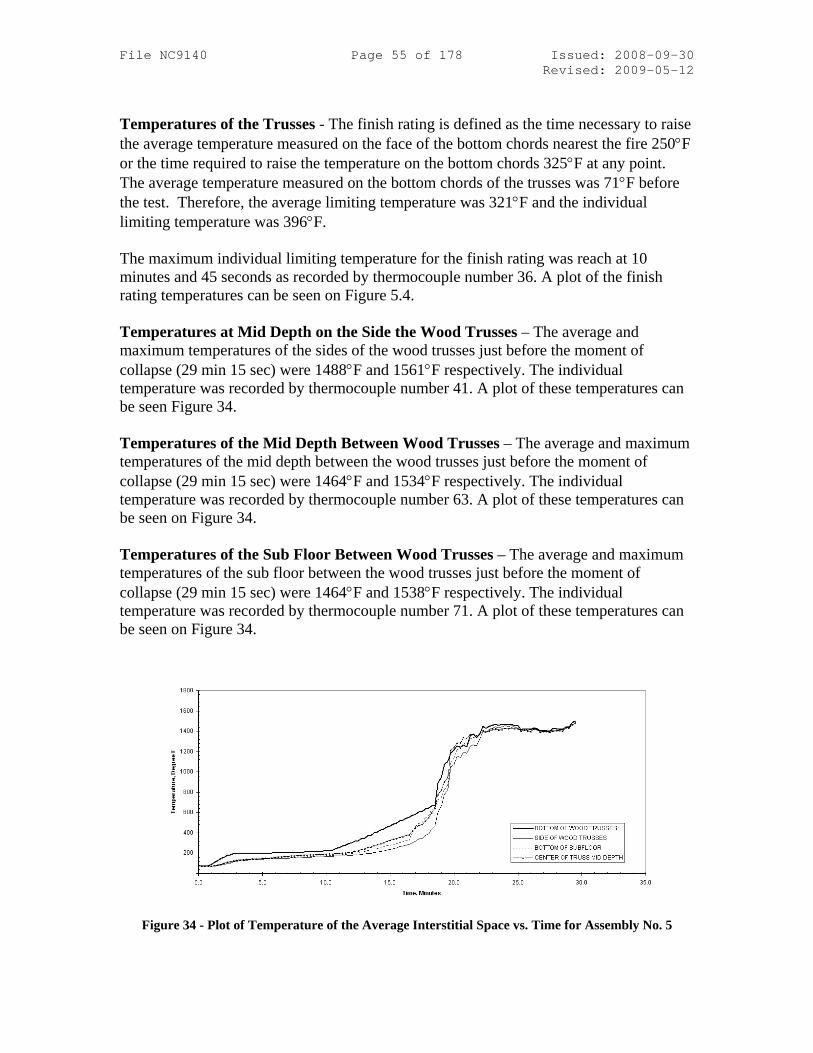
File NC9140 Page 55 of 178 Issued: 2008-09-30 Revised: 2009-05-12 Temperatures of the Trusses - The finish rating is defined as the time necessary to raise the average temperature measured on the face of the bottom chords nearest the fire 250°F or the time required to raise the temperature on the bottom chords 325°F at any point. The average temperature measured on the bottom chords of the trusses was 71°F before the test. Therefore, the average limiting temperature was 321°F and the individual limiting temperature was 396°F. The maximum individual limiting temperature for the finish rating was reach at 10 minutes and 45 seconds as recorded by thermocouple number 36. A plot of the finish rating temperatures can be seen on Figure 5.4. Temperatures at Mid Depth on the Side the Wood Trusses – The average and maximum temperatures of the sides of the wood trusses just before the moment of collapse (29 min 15 sec) were 1488°F and 1561°F respectively. The individual temperature was recorded by thermocouple number 41. A plot of these temperatures can be seen Figure 34. Temperatures of the Mid Depth Between Wood Trusses – The average and maximum temperatures of the mid depth between the wood trusses just before the moment of collapse (29 min 15 sec) were 1464°F and 1534°F respectively. The individual temperature was recorded by thermocouple number 63. A plot of these temperatures can be seen on Figure 34. Temperatures of the Sub Floor Between Wood Trusses – The average and maximum temperatures of the sub floor between the wood trusses just before the moment of collapse (29 min 15 sec) were 1464°F and 1538°F respectively. The individual temperature was recorded by thermocouple number 71. A plot of these temperatures can be seen on Figure 34.
Figure 34 - Plot of Temperature of the Average Interstitial Space vs. Time for Assembly No. 5

File NC9140 Page 56 of 178 Issued: 2008-09-30 Revised: 2009-05-12 Temperatures of the Metal Gusset Plates – The average and maximum temperatures of the top metal gusset plates just before the moment of collapse (29 min 15 sec) were 1487°F and 1537°F respectively. The individual temperature was recorded by thermocouple number 81. The average and maximum temperatures of the bottom metal gusset plate just before the moment of collapse (29 min 15 sec) were 1502°F and 1581°F respectively. The individual temperature was recorded by thermocouple number 86. A plot of the metal gusset temperatures can be seen on Figure 5.5.
Figure 35 - Plot of Temperature of the Top and Bottom Metal Gusset Plates vs. Time for Assembly
No. 5
Temperatures of the Unexposed Side of Gypsum Board – The average and maximum temperatures of the unexposed surface just before the gypsum board fall off (16 min 30 sec) were 519°F and 606°F respectively. The individual temperature was recorded by thermocouple number 54. A plot of these temperatures can be seen on Figure 36.
Figure 36 - Plot of Temperature of the Unexposed Surface of Gypsum Board vs. Time for Assembly
No. 5

File NC9140 Page 57 of 178 Issued: 2008-09-30 Revised: 2009-05-12 Temperatures Between the Sub Floor and Carpet Padding – The average and maximum temperatures between the sub floor and finish floor just before the moment of collapse (29 min 15 sec) were 459°F and 1416°F respectively. The individual temperature was recorded by thermocouple number 9. A plot of these temperatures can be seen on Figure 37.
Figure 37 - Plot of Temperature of the Subfloor Temperatures vs. Time for Assembly No. 5
Temperatures Between the Carpet Padding and Carpet – The average and maximum temperatures between the sub floor and finish floor just before the moment of collapse (29 min 15 sec) were 256°F and 636°F respectively. The individual temperature was recorded by thermocouple number 24. A plot of these temperatures can be seen on Figure 38.
Figure 38 - Plot of Temperature of the Carpet Padding vs. Time for Assembly No. 5
Temperatures of the Unexposed Surface – The average and maximum temperatures of the unexposed surface just before the moment of collapse (29 min 15 sec) were 194°F

File NC9140 Page 58 of 178 Issued: 2008-09-30 Revised: 2009-05-12 and 474°F respectively. The individual temperature was recorded by thermocouple number 96. A plot of these temperatures can be seen on Figure 5.9.
Figure 39 - Plot of Temperatures of the Unexposed Surface vs. Time for Assembly No. 5
Deflection of the Assembly - The deflection of the floor-ceiling assembly during the fire test is shown on Figure 40. The location of each deflection transducer can be seen in Appendix A under Test Assembly 5.
Figure 40 - Plot of Deflections vs. Time for Assembly No. 5

File NC9140 Page 59 of 178 Issued: 2008-09-30 Revised: 2009-05-12 Test Record No. 6
Materials Materials described in section General and used in Assembly No. 6 include engineered 2 by 6 bearing plate, subfloor (OSB), carpet and padding, tack strips, and gypsum board. Additional materials are described below. Trusses - The glued finger jointed trusses were nominally 14 in. deep, 14 ft long fabricated from nominal 2 in. by 2 in. wood members with nominal 2 in. 3 in. wide top and bottom chords and had an average weight of 34.36 lb. The top and bottom chords measured 2-1/2 in. wide by 1-1/2 in. high. The web members measured 1-1/2 in. wide by 1-1/2 in. high and the finger penetrated 3/4 in. into the top and bottom chords. Nominal 2 in. by 6 in. and 2 in. by 8 in. wood members were used as vertical and diagonal members inside each truss. The moisture content of the truss members ranged from 4.9 to 8.4 percent and averaged 7.55 percent. End Closure (Wood Headers) – The nominal 2 in. by 4 in. dimensional lumber measured 1-1/2 in. by 3-1/2 in. and cut to lengths of 104-5/8 in. long.
Erection of Test Assembly Nominal 2 in. by 6 in. structural grade wood bearing plates were placed on top of the steel angles. The trusses were placed on the wood bearing plates and spaced 24 in. OC starting at the East West centerline of the assembly. At the North and South ends of the assembly, additional trusses, not in the field of the fire test, were placed over the vermiculite concrete in order stabilize the plywood subfloor. The average bearing at each end of the truss was 4-7/8 in. The trusses were fastened to each bearing plate with two No. 16d nails. Along the east and west edges of the test assembly, nominal 2 in. by 4 in. wood headers (rim band) were placed perpendicular to the trusses and fastened to the top chord of each truss with two No. 16d nails. A 1/4 in. wide bead of adhesive was placed on the top chord of the trusses and into the grooved edge of the plywood. The plywood sub-floor was placed on the trusses with the 8 ft long edges positioned perpendicular to the trusses and the ends butted and centered over trusses, with adjacent end joints staggered 4 ft. A 1/8 in. wide bead of adhesive was placed on the tip of the tongue and groove ends of the subfloor before sliding the panels together. The plywood was secured to the trusses with 6d ringshank underlayment nails spaced 6 in. OC at the perimeter and 12 in. OC in the field with nails 1 in. from the edge of each panel. The pre-nailed tack strips were secured to the subfloor around the perimeter of the assembly approximately 2 in. from the inside edge of the test frame.

File NC9140 Page 60 of 178 Issued: 2008-09-30 Revised: 2009-05-12 The 6 ft wide carpet padding had joints spaced 6 ft 12 ft and 17-1/2 ft starting at the South edge of the assembly. The carpet padding was secured to the subfloor with 1/4 in. long staples spaced 18 in. OC around the perimeter of each laid piece of padding. The 14-1/4 ft wide by 18 ft long roll of carpet was laid on top of the carpet padding. The carpet was stretched tight and secured to the carpet gripper nailing strips located at the perimeter of the entire assembly. The gypsum board was secured to the exposed side of the assembly with 1-5/8 in. long phosphate coated drywall nails spaced 7 in. OC with nails spaced 1 in from the edge in the field and at the perimeter. The East-West gypsum board joints were staggered 48 in. as to not align any East-West joints. The North-South gypsum board joints were aligned and spaced 48 in. OC. The long edges of the boards were oriented perpendicular to the joists. Two layers of dry mix joint compound was used to cover all gypsum board joints and nails heads.
Sample The fire endurance test was conducted on the assembly described previously in this Report under "Erection Of Test Assembly". Test results relate only to items tested.
Method The location of instrumentation within the furnace and on the test sample are shown in Appendix A. The temperatures of the wood trusses were measured with 20 thermocouples. Thermocouple numbers 31-40 were located on the bottom of the trusses and thermocouple numbers 41-50 were located on the side of trusses mid depth facing North and stapled to the trusses. The temperatures within the interstitial space were measured with 26 thermocouples. Thermocouple numbers 61-70 were located at the center of the interstitial space mid depth. Thermocouple numbers 71-80 were located at the center of the interstitial space on the bottom of the subfloor. Thermocouple numbers 81-83 were located on the bottom glued finger joints nearest center of assembly facing North and thermocouple numbers 84-86 were located on the top glued finger joints nearest center of assembly facing North. The temperatures between the subfloor and carpet padding were measured with 15 thermocouples and numbered 1-15. The temperatures on top of the carpet padding (between the carpet padding and carpet) were measured with 15 thermocouples and numbered 16-30.

File NC9140 Page 61 of 178 Issued: 2008-09-30 Revised: 2009-05-12 The unexposed temperatures were measured with 13 thermocouples and numbered 87-99. Each of the unexposed surface thermocouples was covered with a 6 by 6 in. dry ceramic fiber pad. The temperatures on the unexposed side of the gypsum board (between the gypsum board and the subfloor) were measured with 10 thermocouples and numbered 51-60. The deflection of the assembly was measured with five electronic transducers. There were a total of eight camera views taken during the fire exposure period. One camera was positioned in the furnace recording the exposed surface of the assembly, two cameras positioned in the interstitial space between the gypsum board and sub floor. Four other cameras recorded separate angles of the unexposed surface of the assembly and one infrared camera recorded the unexposed surface temperatures.
Results Throughout the test, observations were made of the character of the fire, of the conditions of the exposed and unexposed surfaces, and of other events relative to the fire resistance performance of the assembly. Character and Distribution of the Furnace Fire - The furnace fire was luminous and well distributed throughout the test. A plot of the furnace temperature can be seen on Figure 41.
Figure 41 - UL263 Standard Time Temperature Curve and Average Furnace Temperature vs. Time
for Assembly No. 6

File NC9140 Page 62 of 178 Issued: 2008-09-30 Revised: 2009-05-12 The furnace pressure and oxygen concentration are presented in Figure 42 and Figure 43.
-0.07-0.06-0.05-0.04-0.03-0.02-0.010.000.010.020.03
0.0 5.0 10.0 15.0 20.0 25.0 30.0
Time, Minutes
Pres
sure
, Inc
hes
of W
ater
Figure 42 - Furnace Pressure vs. Time for Assembly No. 6
Figure 43 - Oxygen Content vs. Time for Assembly No. 6
Observations of the Exposed and Unexposed Surfaces - The observations made during the fire test are shown in Table 9. All references to dimensions are approximate.

File NC9140 Page 63 of 178 Issued: 2008-09-30 Revised: 2009-05-12
Table 9 – Observations for Assembly No. 6
Test Time, Min:Sec
Exposed (E) or Unexposed (U)
Surface
Observations 2:00 E Paper surface ignited. 2:00 U No change. 4:00 U No change. 4:30 E Surface charred and began to flake. 6:00 U Smoke emitting from perimeter at saddles. 7:00 E Joint compound began to crack along joints and started
to peal away. 7:30 E Surface gray in color. 8:00 U No change. 10:00 U No change. 10:30 E Joint compound began to fall off. 12:00 U Smoke increased at saddles. 13:30 E 80% of joint compound had fallen off. 14:00 U No change. 15:30 E North Center gypsum board joint opened to about 1/4
in. to 3/8 in. 16:00 E 2 ft by 3 ft piece of gypsum board fell off. 16:00 U No change. 16:20 U Smoke came from subfloor joints. 16:45 E Gypsum board fall off continued. 17:00 E Gypsum board fall off continued. 17:30 E Gypsum board fall off continued. 17:30 U Smoke increased. 18:10 U Holes were present through carpet at East subfloor joint.
Crackling could be heard. 18:45 E No visual observations could be made. 19:20 U Smoke continued to increase. 23:00 U Smoke stabilized and crackling continued. Very little
deflection had occurred. 23:15 U Standing mannequin vibrated. 23:40 U Buckling of subfloor was present near kneeling
mannequin. 23:51 U Both mannequins vibrated. 24:00 U Sudden drops in surface as truss joints popped. 24:23 U Both mannequins vibrated. 25:54 U Large amount of deflection was visible. 26:00 U Flame through at West edge. East and Center occurred
shortly after. 26:45 U/E Mannequin fell through. Gas off.

File NC9140 Page 64 of 178 Issued: 2008-09-30 Revised: 2009-05-12 Temperatures of the Trusses - The finish rating is defined as the time necessary to raise the average temperature measured on the face of the bottom chords nearest the fire 250°F or the time required to raise the temperature on the bottom chords 325°F at any point. The average temperature measured on the bottom chords of the trusses was 70°F before the test. Therefore, the average limiting temperature was 320°F and the individual limiting temperature was 395°F. The maximum individual limiting temperature for the finish rating was reach at 12 minutes and 15 seconds as recorded by thermocouple number 39. A plot of the finish rating temperatures can be seen on Figure 6.4. Temperatures at Mid Depth on the Side the Wood Trusses – The average and maximum temperatures of the sides of the wood trusses just before the moment of collapse (26 min 45 sec) were 1422°F and 1487°F respectively. The individual temperature was recorded by thermocouple number 45. A plot of these temperatures can be seen on Figure 6.4. Temperatures of the Mid Depth Between Wood Trusses – The average and maximum temperatures of the mid depth between the wood trusses just before the moment of collapse (29 min 45 sec) were 1403°F and 1474°F respectively. The individual temperature was recorded by thermocouple number 66. A plot of these temperatures can be seen on Figure 6.4. Temperatures of the Sub Floor Between Wood Trusses – The average and maximum temperatures of the sub floor between the wood joists just before the moment of collapse (29 min 45 sec) were 1411°F and 1476°F respectively. The individual temperature was recorded by thermocouple number 75. A plot of these temperatures can be seen on Figure 6.4.
Figure 44 - Plot of Temperatures of Below Subfloor vs. Time

File NC9140 Page 65 of 178 Issued: 2008-09-30 Revised: 2009-05-12 Temperatures of the Glued Finger Joints – The average and maximum temperatures of the top glued finger joints just before the moment of collapse (29 min 45 sec) were 1435°F and 1477°F respectively. The individual temperature was recorded by thermocouple number 84. The average and maximum temperatures of the bottom glued finger joints just before the moment of collapse (29 min 45 sec) were 1434°F and 1474°F respectively. The individual temperature was recorded by thermocouple number 81. A plot of the glued finger joint temperatures can be seen on Figure 6.5.
Figure 45 - Plot of Temperature of the Top and Bottom Glued Finger Joints vs. Time for Assembly
No. 6
Temperatures of the Unexposed Side of Gypsum Board – The average and maximum temperatures of the unexposed surface just before the gypsum board fall off (16 min) were 559°F and 650°F respectively. The individual temperature was recorded by thermocouple number 52. A plot of these temperatures can be seen on Figure 46.
Figure 46 - Plot of Temperature of the Unexposed Surface of Gypsum Board vs. Time for Test
Assembly No. 6

File NC9140 Page 66 of 178 Issued: 2008-09-30 Revised: 2009-05-12 Temperatures Between the Sub Floor and Carpet Padding – The average and maximum temperatures between the sub floor and finish floor just before the moment of collapse (29 min 45 sec) were 424°F and 1240°F respectively. The individual temperature was recorded by thermocouple number 9. A plot of these temperatures can be seen on Figure 47.
Figure 47 - Plot of Temperature of the Subfloor Temperatures vs. Time for Test Assembly No. 6
Temperatures Between the Carpet Padding and Carpet – The average and maximum temperatures between the sub floor and finish floor just before the moment of collapse (29 min 45 sec) were 241°F and 843°F respectively. The individual temperature was recorded by thermocouple number 24. A plot of these temperatures can be seen on Figure 48.
Figure 48 - Plot of Temperature of the Carpet Padding vs. Time for Test Assembly No. 6

File NC9140 Page 67 of 178 Issued: 2008-09-30 Revised: 2009-05-12 Temperatures of the Unexposed Surface – The average and maximum temperatures of the unexposed surface just before the moment of collapse (29 min 45 sec) were 182°F and 646°F respectively. The individual temperature was recorded by thermocouple number 92. A plot of these temperatures can be seen on Figure 49.
Figure 49 - Plot of Temperatures of the Unexposed Surface vs. Time for Test Assembly No. 6
Deflection of the Assembly - The deflection of the floor-ceiling assembly during the fire test is shown on Figure 50. The location of each deflection transducer can be seen in Appendix A under Test Assembly 6.
Figure 50 - Plot of Deflections vs. Time for Test Assembly No. 6

File NC9140 Page 68 of 178 Issued: 2008-09-30 Revised: 2009-05-12 Test Record No. 7
Materials Materials described in section General and used in Assembly No. 7 include engineered 2 by 4 bearing plate, No. 30 asphalt felt, faced batt insulation, gypsum board, and Class A asphalt shingles. Additional materials are described below. Joist – The nominal 2 in. by 6 in. dimensional lumber measured 1-1/2 in. by 5-1/2 in. and cut to a length of 14 ft 1/12 in. long. Blocking – The nominal 2 in. by 6 in dimensional lumber was cut to fit the area at the end of each joist. The installed pieces measured 1-1/2 in. by 4-7/8 in. and the top was cut to an angle of approximately 9.5°. Rafters - The nominal 2 in. by 6 in. dimensional lumber measured 1-1/2 in. by 5-1/2 in. and cut to a length of 6 ft 11-7/8 in. long. Ridge Beam – The nominal 2 in. by 8 in. dimensional lumber measured 1-1/2 in. by 7-1/2 in. and cut to a length of 13 ft 12-1/4 in. long. Roof Deck – The nominal 1 in. by 6 in. lumber measured 3/4 in. by 5-1/2 in. by 8 ft 1/4 in. long. Mushroom Vent – The mushroom shaped attic exhaust measure 15-3/8 in. by 17-5/16 in. at the base and 11 in. by 11-3/8 in. at the cap. The base contained four holes, one at each corner, for attachment. The aluminum thickness of the vent measured on average 0.0205 in. thick. The vents weight an average of 0.975 lbs.
Erection of Test Assembly Nominal 2 in. by 4 in. structural grade wood bearing plates were placed on top of the steel angles. The 2 in. by 6 in. wood joists were placed on the wood bearing plates and spaced 16 in. OC starting 8 in from each side of the East West centerline of the assembly. At the North and South ends of the assembly, additional joists, not in the field of the fire test, were placed over the vermiculite concrete in order stabilize the roof assembly. The average bearing at each end of the joists were 3-1/4 in. The joists were fastened to each bearing plate with two No. 8d nails. The joists were fire-stopped with nominal 2 in. by 6 in. lumber. Nominal 2 in. by 6 in. rafters were set to a 2/12 roof system angle and positioned parallel to the horizontal joist members. The rafters were secured to the horizontal joists with four No. 16d nails at each rafter / joist interface. The ridge beam ran perpendicular to the joists down the North South centerline and was secured to the top of each rafter with two 16d nails per side.

File NC9140 Page 69 of 178 Issued: 2008-09-30 Revised: 2009-05-12 The 1 in. by 6 in. roof deck was installed perpendicular to the rafters. Each piece of deck was secured to each rafter with two 8d cement coated nails. The 3 ft wide No. 30 asphalt felt was laid over the 1 in. by 6 in. roof deck with 1/4 in. long staples spaced approximately 16 in OC at the perimeter and in the field. The asphalt felt was overlapped 2 in. at each intersection. The Class A Asphalt Shingles were installed over the No. 30 asphalt felt with four 1-1/2 in. long electro galvanized roofing nails per sheet. The shingles were installed per the manufacture’s installation instructions and overlapped 4-1/2 in. The aluminum mushroom vents were installed per the manufacture’s installation instructions with four 1-1/2 long electro galvanized roofing nails per vent. There were three vents installed with the first located over the center rafter cavity and the other two located 40 in. to the North and South of the center cavity. All three vents were located 16 in. West of the ridge beam. The R-30 attic/flat ceiling glass fiber insulation was installed in the joist cavity with 1/2 in. crown by 1/4 in. long leg staples spread approximately 6 in. to 8 in. OC. The gypsum board was secured to the exposed side of the assembly with 1-5/8 in. long phosphate coated drywall nails spaced 7 in. OC with nails spaced 1 in from the edge in the field and at the perimeter. The East-West gypsum board joints were staggered 48 in. as to not align any East-West joints. The North-South gypsum board joints were aligned and spaced 48 in. OC. The long edges of the boards were oriented perpendicular to the joists. Two layers of dry mix joint compound was used to cover all gypsum board joints and nails heads.
Sample The fire endurance test was conducted on the assembly described previously in this Report under "Erection Of Test Assembly". Test results relate only to items tested.
Method The location of instrumentation within the furnace and on the test sample are shown in Appendix A. The temperatures of the wood joists were measured with 20 thermocouples. Thermocouple numbers 31-40 were located on the bottom of the joists and thermocouple numbers 41-50 were located on the side of joists mid depth facing North and stapled to the joists. The temperatures within the interstitial space were measured with 18 thermocouples. Thermocouple numbers 60-68 were located at the center of the interstitial space mid

File NC9140 Page 70 of 178 Issued: 2008-09-30 Revised: 2009-05-12 depth. Thermocouple numbers 69-77 were located at the center of the interstitial space on the bottom of the subfloor. The temperatures between the roof deck and roof felt were measured with 15 thermocouples and numbered 1-15. The temperatures on top of the roof felt (between the roof felt and asphalt shingles) were measured with 15 thermocouples and numbered 16-30. The unexposed temperatures were measured with 15 thermocouples and numbered 78-92. Each of the unexposed surface thermocouples was covered with a 6 by 6 in. dry ceramic fiber pad. The temperatures on top of the mushroom vents was measured with one thermocouple per vent. Thermocouple 93 was located on the North Vent, thermocouple 94 was located on the center vent and thermocouple 95 was located on the South vent. The temperatures on the unexposed side of the gypsum board (between the gypsum board and the subfloor) were measured with 9 thermocouples and numbered 51-59. The deflection of the assembly was measured with five electronic transducers. There were a total of eight camera views taken during the fire exposure period. One camera was positioned in the furnace recording the exposed surface of the assembly, two cameras positioned in the interstitial space between the gypsum board and sub floor. Four other cameras recorded separate angles of the unexposed surface of the assembly and one infrared camera recorded the unexposed surface temperatures.
Results Throughout the test, observations were made of the character of the fire, of the conditions of the exposed and unexposed surfaces, and of other events relative to the fire resistance performance of the assembly. Character and Distribution of the Furnace Fire - The furnace fire was luminous and well distributed throughout the test. A plot of the furnace temperature can be seen on Figure 51.

File NC9140 Page 71 of 178 Issued: 2008-09-30 Revised: 2009-05-12
Figure 51 – UL263 Standard Time Temperature Curve and Average Furnace Temperature vs. Time
for Assembly No. 7
The furnace pressure and oxygen concentration are presented in Figure 52 and Figure 53.
-0.08
-0.06
-0.04
-0.02
0.00
0.02
0.04
0.06
0.0 10.0 20.0 30.0 40.0 50.0
Time, Minutes
Pres
sure
, Inc
hes
of W
ater
Figure 52 – Furnace Pressure vs. Time for Assembly No. 7
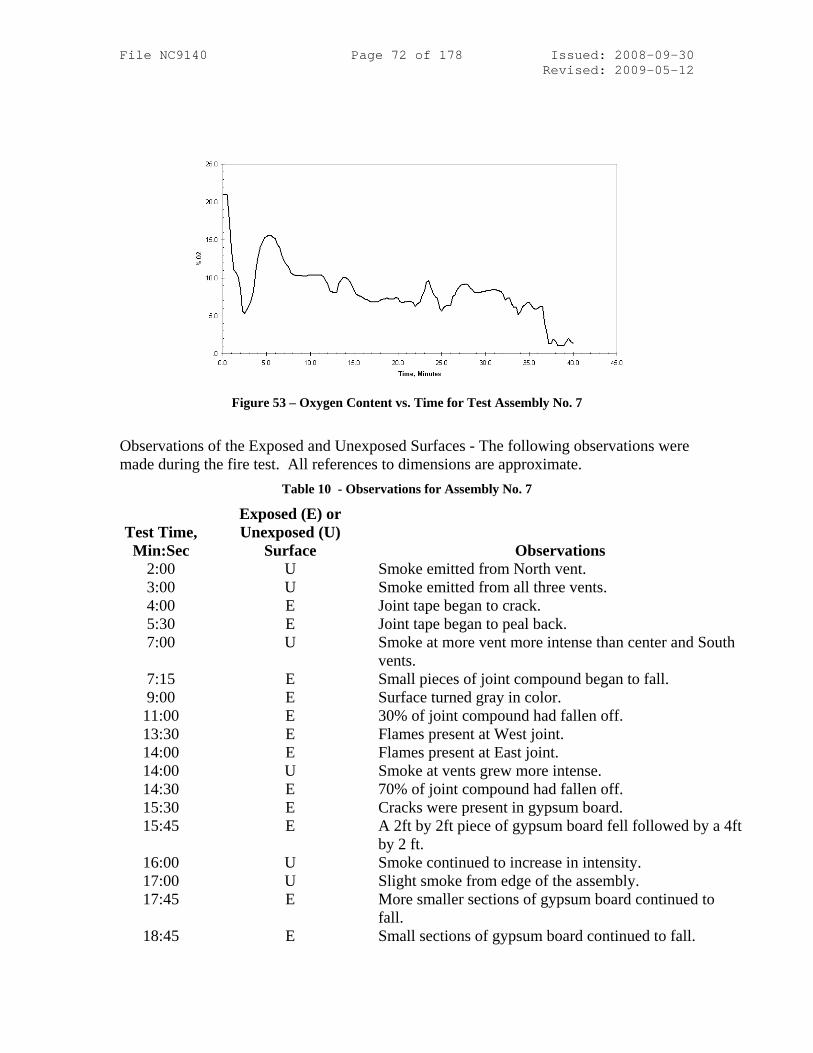
File NC9140 Page 72 of 178 Issued: 2008-09-30 Revised: 2009-05-12
Figure 53 – Oxygen Content vs. Time for Test Assembly No. 7
Observations of the Exposed and Unexposed Surfaces - The following observations were made during the fire test. All references to dimensions are approximate.
Table 10 - Observations for Assembly No. 7
Test Time, Min:Sec
Exposed (E) or Unexposed (U)
Surface
Observations 2:00 U Smoke emitted from North vent. 3:00 U Smoke emitted from all three vents. 4:00 E Joint tape began to crack. 5:30 E Joint tape began to peal back. 7:00 U Smoke at more vent more intense than center and South
vents. 7:15 E Small pieces of joint compound began to fall. 9:00 E Surface turned gray in color. 11:00 E 30% of joint compound had fallen off. 13:30 E Flames present at West joint. 14:00 E Flames present at East joint. 14:00 U Smoke at vents grew more intense. 14:30 E 70% of joint compound had fallen off. 15:30 E Cracks were present in gypsum board. 15:45 E A 2ft by 2ft piece of gypsum board fell followed by a 4ft
by 2 ft. 16:00 U Smoke continued to increase in intensity. 17:00 U Slight smoke from edge of the assembly. 17:45 E More smaller sections of gypsum board continued to
fall. 18:45 E Small sections of gypsum board continued to fall.

File NC9140 Page 73 of 178 Issued: 2008-09-30 Revised: 2009-05-12
Test Time, Min:Sec
Exposed (E) or Unexposed (U)
Surface
Observations 19:00 U Smoke could be seen from the shingles. 20:15 E Insulation began to fall 21:00 U Smoke increased in intensity and cracking could be
heard. 21:45 E Flames present where insulation fell. 22:00 U Moisture present around vents. 23:00 U Popping could be heard. 23:30 E More insulation and gypsum board fell. 25:00 U Continuous cracking could be heard. 26:00 U Flaming occurred at North vent and smoke decreased. 27:00 U Vents displayed puffing of smoke and flaming occurred
at center vent. 28:00 U Smoke became continuous again and flaming was also
continuous. 30:00 U Flaming around vent area. North vent has melted and is
open. 32:00 U Flaming grew in intensity at North vent. 32:15 E Large pieces of insulation fell. 33:00 E No visual observations could be made. 33:00 U Shingles and tar melted around vents. 35:00 U Kneeling mannequin’s arm began to sink. 38:00 U Hole grew larger at North vent. Kneeling mannequin fell
over. Flaming at kneeling mannequin. 40:00 U/E Mannequin fell through. Gas off
Temperatures of the Joist - The finish rating is defined as the time necessary to raise the average temperature measured on the face of the bottom of the joists nearest the fire 250°F or the time required to raise the temperature on the bottom of the joists 325°F at any point. The average temperature measured on the bottom of the joists was 70°F before the test. Therefore, the average limiting temperature was 320°F and the individual limiting temperature was 395°F. The maximum individual limiting temperature for the finish rating was reach at 15 minutes and 15 seconds as recorded by thermocouple number 36. A plot of the finish rating temperatures can be seen on Figure 7.4. Temperatures at Mid Depth on the Side the Wood Rafters – The average and maximum temperatures of the sides of the wood trusses just before the moment of collapse (40 min 00 sec) were 1375°F and 1476°F respectively. The individual temperature was recorded by thermocouple number 43. A plot of these temperatures can be seen on Figure 7.4.

File NC9140 Page 74 of 178 Issued: 2008-09-30 Revised: 2009-05-12 Temperatures of the Mid Depth Between Wood Joists and Rafters – The average and maximum temperatures of the mid depth between the wood trusses just before the moment of collapse (40 min 00 sec) were 1376°F and 1482°F respectively. The individual temperature was recorded by thermocouple number 63. A plot of these temperatures can be seen on Figure 54. Temperatures on the Bottom of the Roof Deck Between Wood Joists – The average and maximum temperatures of the sub floor between the wood joists just before the moment of collapse (40 min 00 sec) were 1383°F and 1487°F respectively. The individual temperature was recorded by thermocouple number 72. A plot of these temperatures can be seen on Figure 54
Figure 54 – Plot of Temperatures Below Subfloor vs. Time for Test Assembly No. 7
Temperatures of the Unexposed Side of Gypsum Board – The average and maximum temperatures of the unexposed surface just before the gypsum board fall off (15 min 45 sec) were 253°F and 606°F respectively. The individual temperature was recorded by thermocouple number 58. A plot of these temperatures can be seen on Figure 55

File NC9140 Page 75 of 178 Issued: 2008-09-30 Revised: 2009-05-12
Figure 55 – Plot of Temperature of the Unexposed Surface of Gypsum Board vs. Time for Test
Assembly No. 7
Temperatures on the top of the Roof Deck – The average and maximum temperatures between the roof deck and roof felt just before the moment of collapse (40 min 00 sec) were 352°F and 1585°F respectively. The individual temperature was recorded by thermocouple number 4. A plot of these temperatures can be seen on Figure 56.
Figure 56 – Plot of the Roof Deck Temperatures vs. Time for Test Assembly No. 7
Temperatures on the Roofing Felt – The average and maximum temperatures between the sub floor and finish floor just before the moment of collapse (40 min 00 sec) were 303°F and 1129°F respectively. The individual temperature was recorded by thermocouple number 19. A plot of these temperatures can be seen on Figure 57.

File NC9140 Page 76 of 178 Issued: 2008-09-30 Revised: 2009-05-12
Figure 57 – Plot of Temperature of the Roofing Felt vs. Time for Test Assembly No. 7
Temperatures of the Unexposed Surface – The average and maximum temperatures of the unexposed surface just before the moment of collapse (40 min 00 sec) were 385°F and 1487°F respectively. The individual temperature was recorded by thermocouple number 81. A plot of these temperatures can be seen on Figure 58.
Figure 58 – Plot of Temperatures of the Unexposed Surface vs. Time for Test Assembly No. 7
Temperatures of the Unexposed Surface of the Mushroom Vents – The average and maximum temperatures of the unexposed surface just before the moment of collapse (40 min 00 sec) were 1338°F and 1470°F respectively. The individual temperature was recorded by thermocouple number 94. A plot of these temperatures can be seen on Figure 59.
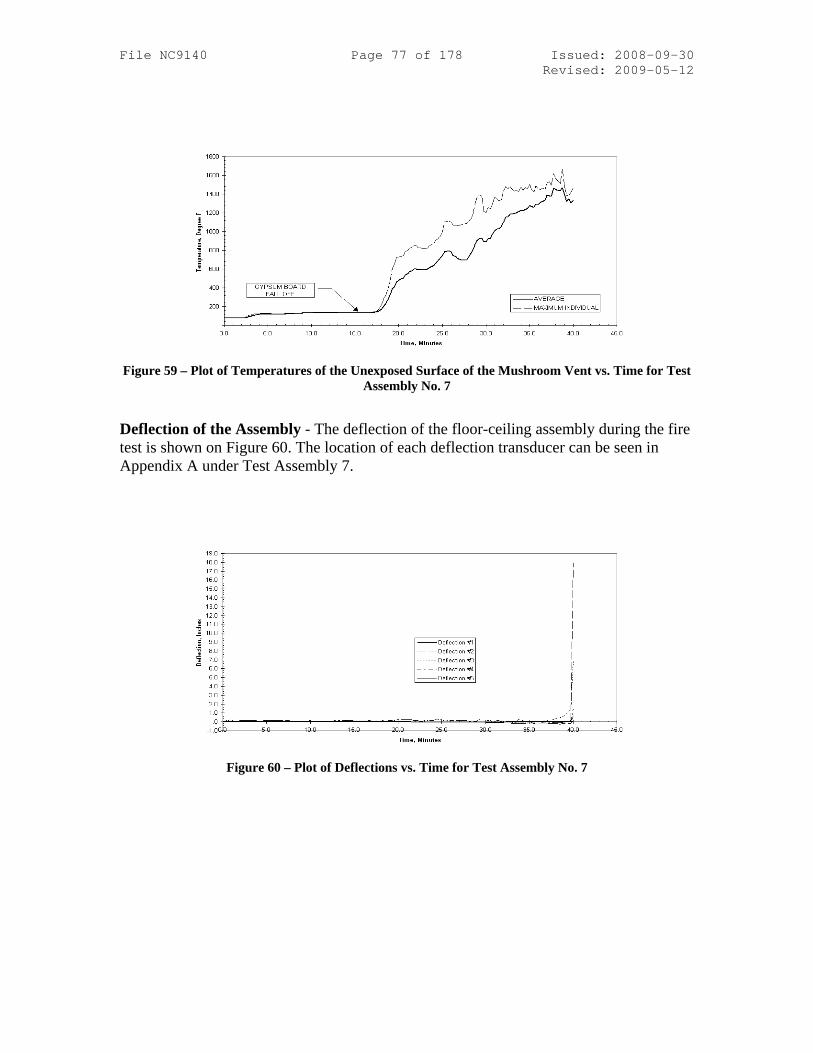
File NC9140 Page 77 of 178 Issued: 2008-09-30 Revised: 2009-05-12
Figure 59 – Plot of Temperatures of the Unexposed Surface of the Mushroom Vent vs. Time for Test
Assembly No. 7
Deflection of the Assembly - The deflection of the floor-ceiling assembly during the fire test is shown on Figure 60. The location of each deflection transducer can be seen in Appendix A under Test Assembly 7.
Figure 60 – Plot of Deflections vs. Time for Test Assembly No. 7

File NC9140 Page 78 of 178 Issued: 2008-09-30 Revised: 2009-05-12 Test Record No. 8
Materials Materials described in section General and used in Assembly No. 3 include 2 in. by 10 in. joists, 2 in. by 6 in. bearing plates, subflooring, red rosin paper and finish flooring. Additional materials are described below. Cross Bridging – The nominal 1 in. by 3 in. dimensional lumber measured 11/16 in. by 2-7/16 in. and each end was cut at an angle and a length of 16-3/8 in. Metal Lath – The 3.4 diamond mesh lath measured 8 ft long and 27-1/2 in wide. Each piece weighed approximately 6.25 lbs. Square Edge Casing Bead – The 10 ft 1 in. long square edge casing bead measured 3/4 in. deep and had a top flange of 1/4 in. wide and a bottom flange of 1 in. The casing measured 0.021 in. thick. Each section weight 1.7 lbs. Holes measuring 3/16 in. in diameter were spaced 1-15/16 in. apart for fastener application. Plaster – The plaster was applied in three separate coats the base or scratch coat, the middle or brown coat and the finish coat. The mix proportions of each are listed below. Scratch Coat - The base coat or scratch coat was composed of 100 lbs of gypsum plaster, approximately 1.3 ft3 of sand, 7 gallons of water and 0.008 ft3 of calcium sulfate accelerator (approximately 0.2 lbs). The scratch coat had an average wet density of 123 lbs/ft3. Brown Coat – The brown coat was composed of 100 lbs of gypsum plaster, 1.8 ft3 of sand, 7-1/2 gallons of water and 0.008 ft3 of calcium sulfate accelerator (approximately 0.2 lbs). The brown coat had an average wet density of 122 lbs/ft3. Finish Coat – The finish coat was composed of 30.6 lbs of ivory colored autoclaved finish lime, 42.2 lbs of water and 21.9 lbs of red top gauging plaster. The finish coat had an average wet density of 96 lbs/ft3.
Erection of Test Assembly Nominal 2 in. by 6 in. structural grade wood bearing plates were placed on top of the steel angles. The 2 in. by 10 in. joists were placed on the wood bearing plates and spaced 16 in. OC starting 8 in. from the East-West centerline of the assembly. The joists were fire stopped with 14-1/2 in. long pieces of nominal 2 by 10 in. lumber. At the North and South ends of the assembly, additional joists, not in the field of the fire for the test, were placed 2-1/2 inches from the North and South edges of the assembly over the vermiculite concrete in order stabilize the nominal 1 by 4 in. tongue and groove subfloor. The average bearing at each end of the joist was 5-1/4 in. The joists were fastened to each bearing plate with two No. 16d coated sinker nails.

File NC9140 Page 79 of 178 Issued: 2008-09-30 Revised: 2009-05-12
The joists were stabilized by nominal 1 by 3 in. bridging cut to lengths of approximately 16-1/2 in. long with their ends cut to an angle of approximately 45 degrees. The pieces of bridging was secured diagonally opposed to each other between each pair of joists with two 6d coated sinker nails at each end of each piece.
The nominal 1 by 6 in. random length tongue and groove subfloor boards were laid diagonally (45 degrees to the joists) and secured in place with No. 8d coated sinker nails four nails per butt joint and two nails in the field at each joist. The red rosin paper was laid over the subfloor in the East-West direction and secured in place with staples in a random order. There was a 4 in. overlap of each roll of paper. The nominal 1 by 4 in. tongue and groove finish floor was installed over the building paper and oriented perpendicular to the joists. The finish floor was secured to the joists by 2 in. FLN-200 hardwood flooring nails spaced nominally 8 in. OC nailed through the tongue and groove using an angled flooring nailer. A bead of fire resistive caulk was placed around the perimeter of the assembly to prevent any flame through between the frame and the test sample. The perimeter square edge casing bead was secured with 1-1/4 in. long galvanized nails at each joist intersection. The metal lath was installed to the exposed side of the assembly using 1-1/4 in. long galvanized nails. The metal lathe was overlapped 1 in. and secured to each joist with five nails and one nail at each North South overlapping intersection. The metal lath was overlapped 1-1/2 in. at each East West intersection and all overlapping occurred at a joist intersection. The metal lath was wire tied with a single strand of 18 gauge wire tie per intersection. The wire ties were spaced 16 in. OC at each joist cavity. The three coats of plaster were applied to the metal lath to a final average thickness of 0.79 in.
Sample The fire endurance test was conducted on the assembly described previously in this Report under "Erection Of Test Assembly". Test results relate only to items tested.
Method The temperatures of the nominal 2 by 10 in joists were measured with 20 thermocouples. Thermocouple numbers 16-25 were located on the bottom of the joists and thermocouple numbers 26-35 were located on the side of joist mid depth facing North and stapled to the joists. The temperatures within the interstitial space were measured with 18 thermocouples. Thermocouple numbers 45-53 were located at the center of the interstitial space mid
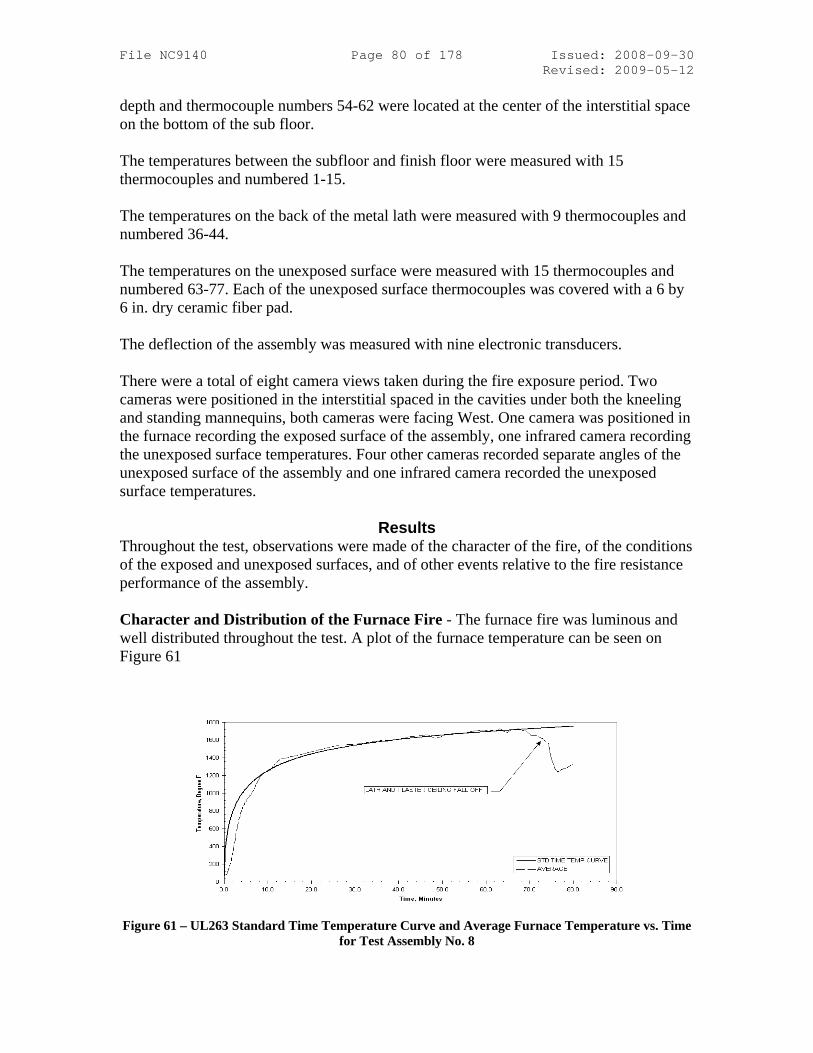
File NC9140 Page 80 of 178 Issued: 2008-09-30 Revised: 2009-05-12 depth and thermocouple numbers 54-62 were located at the center of the interstitial space on the bottom of the sub floor. The temperatures between the subfloor and finish floor were measured with 15 thermocouples and numbered 1-15. The temperatures on the back of the metal lath were measured with 9 thermocouples and numbered 36-44. The temperatures on the unexposed surface were measured with 15 thermocouples and numbered 63-77. Each of the unexposed surface thermocouples was covered with a 6 by 6 in. dry ceramic fiber pad.
The deflection of the assembly was measured with nine electronic transducers. There were a total of eight camera views taken during the fire exposure period. Two cameras were positioned in the interstitial spaced in the cavities under both the kneeling and standing mannequins, both cameras were facing West. One camera was positioned in the furnace recording the exposed surface of the assembly, one infrared camera recording the unexposed surface temperatures. Four other cameras recorded separate angles of the unexposed surface of the assembly and one infrared camera recorded the unexposed surface temperatures.
Results Throughout the test, observations were made of the character of the fire, of the conditions of the exposed and unexposed surfaces, and of other events relative to the fire resistance performance of the assembly. Character and Distribution of the Furnace Fire - The furnace fire was luminous and well distributed throughout the test. A plot of the furnace temperature can be seen on Figure 61
Figure 61 – UL263 Standard Time Temperature Curve and Average Furnace Temperature vs. Time
for Test Assembly No. 8

File NC9140 Page 81 of 178 Issued: 2008-09-30 Revised: 2009-05-12
The furnace pressure and oxygen concentration are presented Figure 62 and Figure 63.
-0.03
-0.02
-0.01
0.00
0.01
0.02
0.03
0.04
0.05
0.06
0.0 20.0 40.0 60.0 80.0 100.0
Time, Minutes
Pres
sure
, Inc
hes
of W
ater
Figure 62 – Furnace Pressure vs. Time for Test Assembly No. 8
Figure 63 – Oxygen Content vs. Time for Test Assembly No. 8
Observations of the Exposed and Unexposed Surfaces - The observations made during the fire test are presented in Table 11. All references to dimensions are approximate.

File NC9140 Page 82 of 178 Issued: 2008-09-30 Revised: 2009-05-12
Table 11 - Observations for Assembly No. 8
Test Time, Min:Sec
Exposed (E) or Unexposed (U)
Surface
Observations 2:00-14:00 U No change.
7:00 E Discoloration could be seen. 15:30 U Smoke emitting from North saddle on West edge. 18:00 U Smoke emitting from both saddles on West edge. 22:00 U No change. 26:00 U No change. 26:00 E No cracking in plaster but discoloration was present. 27:00 E Thermocouple #13 malfunctioned and was taken out of
the furnace average. 30:00 U No change. 32:00 E No change. 36:00 U Smoke increase at west edge. Crackling of joints could
be heard. 38:00 U Crackling continued. 42:00 U Crackling continued and no other changes. 44:20 U Some smoke could be seen at joints in flooring. 45:00 E Cracks appeared quickly. 46:00 E Ceiling surface deflected quickly almost touching center
thermocouple. 46:00 U No change. 47:30 E Cracks and deflection slowed. 50:00 U Crackling continued. Smoke continued from finish floor.51:10 E Thermocouples touching ceiling surface. 54:00 E Smoke issued from cracks. 54:00 U No change. Very little deflection was noted. 54:45 U Smoke increased at joints and perimeter of assembly. 58:00 U No change. 59:00 E Flames issued from cracks. 60:00 U Smoke and crackling increase with no visible deflection. 62:00 E Flame intensity increased and was more pronounced at
East West edges. 64:00 E Furnace windows were closed due to flames. 64:00 U Smoke increase and less crackling was heard. 65:00 E Ceiling rested on four furnace thermocouples. 67:30 U Smoke emitting from most hardwood joints. 68:00 E Furnace thermocouple #11 fell. 69:00 E Furnace thermocouple #10 fell. Ceiling rested on one
furnace thermocouple. 70:00 U Smoke continued to increase with no visible deflection. 73:00 E Furnace thermocouple #12 fell. 74:00 E Ceiling fell and destroyed all furnace thermocouples. 74:00 U Smoke decreased.

File NC9140 Page 83 of 178 Issued: 2008-09-30 Revised: 2009-05-12
Test Time, Min:Sec
Exposed (E) or Unexposed (U)
Surface
Observations 76:00 U Floor deflected about 1 in. 78:30 U Floor deflected about 2 in. 79:45 E Mannequin fall through. Gas off.
Temperatures of the Wood Joists - The finish rating is defined as the time necessary to raise the average temperature measured on the face of the bottom surface nearest the fire 250°F or the time required to raise the temperature on the bottom surface 325°F at any point. The average temperature measured on the bottom surface of the joists was 75°F before the test. Therefore, the average limiting temperature was 325°F and the individual limiting temperature was 400°F.
The average limiting temperature for the finish rating was reach at 17 minutes as recorded by the average of thermocouple numbers 16-25. Temperatures of the Side of Mid Depth of Wood Joists – The average and maximum temperatures of the sides of the wood joists just before the moment of collapse (79 min 45 sec) were 1395°F and 1483°F respectively. The individual temperature was recorded by thermocouple number 27. The average temperatures were plotted on Figure 64. Temperatures of the Mid Depth Between Wood Joists – The average and maximum temperatures of the mid depth between the wood joists just before the moment of collapse (79 min 45 sec) were 1403°F and 1466°F respectively. The individual temperature was recorded by thermocouple number 46. The average temperatures were plotted on Figure 64. Temperatures of the Sub Floor Between Wood Joists – The average and maximum temperatures of the sub floor between the wood joists just before the moment of collapse (79 min 45 sec) were 1402°F and 1464°F respectively. The individual temperature was recorded by thermocouple number 55. The average temperatures were plotted on Figure 64.
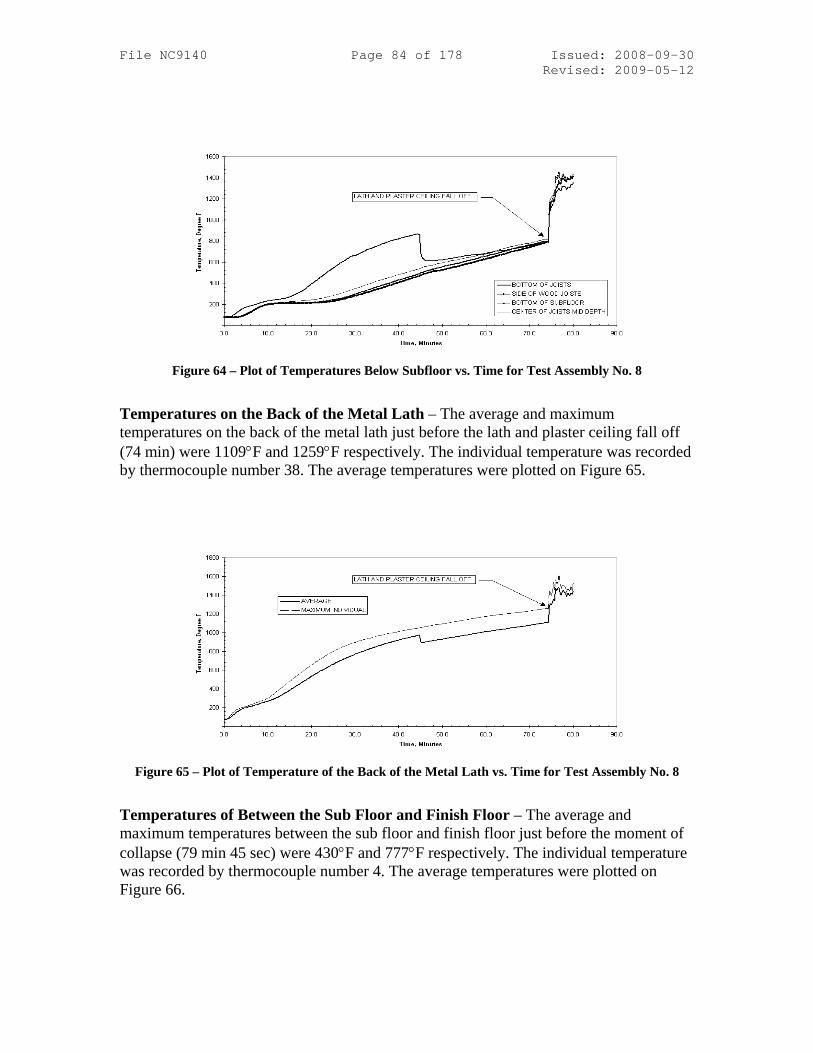
File NC9140 Page 84 of 178 Issued: 2008-09-30 Revised: 2009-05-12
Figure 64 – Plot of Temperatures Below Subfloor vs. Time for Test Assembly No. 8
Temperatures on the Back of the Metal Lath – The average and maximum temperatures on the back of the metal lath just before the lath and plaster ceiling fall off (74 min) were 1109°F and 1259°F respectively. The individual temperature was recorded by thermocouple number 38. The average temperatures were plotted on Figure 65.
Figure 65 – Plot of Temperature of the Back of the Metal Lath vs. Time for Test Assembly No. 8
Temperatures of Between the Sub Floor and Finish Floor – The average and maximum temperatures between the sub floor and finish floor just before the moment of collapse (79 min 45 sec) were 430°F and 777°F respectively. The individual temperature was recorded by thermocouple number 4. The average temperatures were plotted on Figure 66.

File NC9140 Page 85 of 178 Issued: 2008-09-30 Revised: 2009-05-12
Figure 66 – Plot of Temperature of the Subfloor Temperatures vs. Time for Test Assembly No. 8
Temperatures of the Unexposed Surface – The average and maximum temperatures of the unexposed surface just before the moment of collapse (79 min 45 sec) were 174°F and 197°F respectively. The individual temperature was recorded by thermocouple number 65. The average temperatures were plotted on Figure 67.
Figure 67 – Plot of Temperatures of the Unexposed Surface vs. Time for Test Assembly No. 8
Deflection of the Assembly - The deflection of the floor-ceiling assembly during the fire test is shown on Figure 68. The location of each deflection transducer can be seen in Appendix A under Test Assembly 8.

File NC9140 Page 86 of 178 Issued: 2008-09-30 Revised: 2009-05-12
Figure 68 – Plot of Deflections vs. Time for Test Assembly No. 8

File NC9140 Page 87 of 178 Issued: 2008-09-30 Revised: 2009-05-12 Test Record No. 9
Materials Materials described in section General and used in Assembly No. 7 include engineered 2 by 4 bearing plate, No. 30 asphalt felt, faced batt insulation, gypsum board and Class A asphalt shingles. Additional materials are described below. Metal Gusseted Trusses – The roof trusses were 20 in. deep at the peak, 13 ft 10 in. long and fabricated from nominal 2 in. by 4 in. wood members. The roof truss had an average weight of 36.78 lb. The nominal 4 in. side of the truss members was oriented in the vertical direction. The truss members were secured together with galvanized steel plates measuring 0.036 in. thick for 1.5 in. by 4 in., 4 in. by 4 in., 4 in. by 5 in. and 4 in. by 7 in. sizes. The plates contained 5/16 in. long teeth projecting perpendicular to the plane of the plate. The moisture content of the truss members ranged from 6.1 to 7.2 percent and averaged 6.6 percent.
Blocking – The nominal 2 in. by 8 in dimensional lumber was cut to fit the area at the end of each joist. The installed pieces measured 1-1/2 in. by 6-1/8 in.
Roof Deck – The nominal 7/16 in. thick oriented strand board roof deck measured an average of 0.45 in. thick and weighed an average of 41.54 lbs per sheet. The panels were supplied in 48 in. wide by 96 in. long panels.
Plywood Clips – The 7/16 in. high steel plywood clips measured 0.036 in. thick. The clip was arranged in a double C channel orientation. The C channels were back to back and one side measured 1-1/2 in. wide and the other measured 1/2 in. wide with the smaller side cut from the larger side.
Ridge Vent – The non-metallic ridge vents measured 13-7/8 in. wide by 4 ft long. The vents had an overall thickness of 1-1/2 in. at the center and 1 in. at the edges. Each edge of the vent contained a grid to allow the movement of air. The underside of the vent contained a filter screen. Nail holes spaced 12 in. OC with holes spaced 3-1/4 in. from the edge were present to accommodate the attachment of the vents to the roof deck.
Erection of Test Assembly
Nominal 2 in. by 6 in. structural grade wood bearing plates were placed on top of the steel angles. The metal gusseted wood trusses were placed on the wood bearing plates and spaced 24 in. OC starting at the East West centerline of the assembly. At the North and South ends of the assembly, additional trusses, not in the field of the fire test, were placed over the vermiculite concrete in order stabilize the roof assembly. The trusses were fastened to each bearing plate with two No. 16d nails. The trusses were fire-stopped with nominal 2 in. by 8 in. lumber which was cut to fit.

File NC9140 Page 88 of 178 Issued: 2008-09-30 Revised: 2009-05-12 The far most North and South trusses were reinforced with 7/16 in. thick OSB nailed to the outside of the trusses with 8d nails spaced 6 in. OC at the perimeter and on the web members.
The 7/16 in. thick OSB roof deck was laid on top of the roof trusses. The panels were staggered 48 in. in the East West direction. In the North South direction the plywood joints were aligned and located 48 in. off the East and West edges. Plywood clips were installed 24 in. OC starting 12 in. off the center truss. The clips were only placed on the joints running in the North South direction. A 3-1/4 in. gap was left at the crest of the roof system to allow for the application of the ridge vent. The deck was attached to the trusses using 1-7/8 in. long ringshank nails space 12 in. OC in the field and 6 in. at the perimeter. The 3 ft wide No. 30 asphalt felt was laid over the 7/16 in. OSB roof deck with 1/4 in. long staples spaced approximately 8 to 10 in. OC at the perimeter and in the field. The asphalt felt was overlapped 2 in. at each intersection. The Class A Asphalt Shingles were installed over the No. 30 asphalt felt with four 1-1/2 in. long electro galvanized roofing nails per sheet. The shingles were installed per the manufacture’s installation instructions and overlapped 4-1/2 in. The non-metallic ridge vent was installed at the crest of the assembly per the manufacture’s installation instructions with ten 16d nails per 48 in. long vent. There were four vents installed located the entire North South length of the assembly. The R-30 attic/flat ceiling glass fiber insulation was installed in the truss cavity with 1/2 in. crown by 1/4 in. long leg staples spread approximately 6 in. to 8 in. apart. The gypsum board was secured to the exposed side of the assembly with 1-5/8 in. long phosphate coated drywall nails spaced 7 in. OC with nails spaced 1 in from the edge in the field and at the perimeter. The East-West gypsum board joints were staggered 48 in. as to not align any East-West joints. The North-South gypsum board joints were aligned and spaced 48 in. OC. The long edges of the boards were oriented perpendicular to the joists. Two layers of dry mix joint compound was used to cover all gypsum board joints and nails heads.
Sample The fire endurance test was conducted on the assembly described previously in this Report under "Erection Of Test Assembly". Test results relate only to items tested.
Method The temperatures of the wood trusses were measured with 20 thermocouples. Thermocouple numbers 31-40 were located on the bottom of the trusses and

File NC9140 Page 89 of 178 Issued: 2008-09-30 Revised: 2009-05-12 thermocouple numbers 41-50 were located on the side of trusses mid depth facing North and stapled to the trusses. The temperatures on the unexposed side of the gypsum board (between the gypsum board and the subfloor) were measured with 10 thermocouples and numbered 51-60. The temperatures within the interstitial space were measured with 20 thermocouples. Thermocouple numbers 61-70 were located at the center of the interstitial space mid depth. Thermocouple numbers 71-80 were located at the center of the interstitial space on the bottom of the roof deck. The temperatures between the roof deck and roof felt were measured with 15 thermocouples and numbered 1-15. The temperatures on top of the roof felt (between the roof felt and asphalt shingles) were measured with 15 thermocouples and numbered 16-30.
The unexposed temperatures were measured with 13 thermocouples and numbered 81-93. Each of the unexposed surface thermocouples was covered with a 6 by 6 in. dry ceramic fiber pad. The deflection of the assembly was measured with five electronic transducers.
There were a total of eight camera views taken during the fire exposure period. One camera was positioned in the furnace recording the exposed surface of the assembly, two cameras positioned in the interstitial space between the gypsum board and sub floor. Four other cameras recorded separate angles of the unexposed surface of the assembly and one infrared camera recorded the unexposed surface temperatures.
Results
Throughout the test, observations were made of the character of the fire, of the conditions of the exposed and unexposed surfaces, and of other events relative to the fire resistance performance of the assembly. Character and Distribution of the Furnace Fire - The furnace fire was luminous and well distributed throughout the test. A plot of the furnace temperature can be seen on Figure 69.

File NC9140 Page 90 of 178 Issued: 2008-09-30 Revised: 2009-05-12
Figure 69 – UL263 Standard Time Temperature Curve and Average Furnace Temperature vs. Time
for Test Assembly No. 9
The furnace pressure and oxygen concentration are presented in Figure 70 and Figure 71.
-0.08
-0.06
-0.04
-0.02
0.00
0.02
0.04
0.06
0.0 5.0 10.0 15.0 20.0 25.0
Time, Minutes
Pres
sure
, Inc
hes
of W
ater
Figure 70 – Furnace Pressure vs. Time for Test Assembly No. 9

File NC9140 Page 91 of 178 Issued: 2008-09-30 Revised: 2009-05-12
Figure 71 – Oxygen Content vs. Time for Test Assembly No. 9
Observations of the Exposed and Unexposed Surfaces - The observations made during the fire test are presented in Table 12. All references to dimensions are approximate.
Table 12 - Observations for Assembly No. 9
Test Time, Min:Sec
Exposed (E) or Unexposed (U)
Surface
Observations
1:00 E Paper surface turned dark in color. 1:30 E Paper surface ignited. 2:00 U Smoke at perimeter. Mainly at gable ends. 3:00 U Smoke emitted from entire length of roof vent. 3:30 E Surface turned black and charred 3:45 E Joint compound began to crack. 4:15 U Smoke was only present at ridge vent. 6:00 E Surface turned gray in color. 6:30 U Smoke emitted at ridge vent and gable ends. 6:30 E Joint compound began to fall off. 7:30 E Joint tape and compound continued to fall 9:00 U No change. 9:00 E Large pieces of joint compound fell off. 11:30 U No change. 13:30 U Smoke increased especially at ridge vent. 13:30 E Flames could be seen from joints. 13:45 E Pieces of gypsum board began to fall off. 14:30 E Pieces of gypsum board continued to fall. 15:00 U Smoke continued to increase at ridge vent. 16:00 U Crackling of wood could be heard. Ridge vent deformed
near center of assembly. 17:00 U Really thick smoke could be seen at ridge vent. 17:15 E Insulation fell out allowing direct path to attic space.

File NC9140 Page 92 of 178 Issued: 2008-09-30 Revised: 2009-05-12
Test Time, Min:Sec
Exposed (E) or Unexposed (U)
Surface
Observations
18:30 U Crackling of wood could still be heard. Less smoke at center than North and South.
19:00 E No visual observations could be seen. 21:30 U Deformation in sheathing between trusses near
mannequin locations. 22:30 U Significant deformation at kneeling mannequin. 23:00 U Flame through. 23:10 Kneeling mannequin fell through. 23:15 U/E Mannequin fell through. Gas off.
Temperatures of the Trusses - The finish rating is defined as the time necessary to raise the average temperature measured on the face of the bottom of the trusses nearest the fire 250°F or the time required to raise the temperature on the bottom of the trusses 325°F at any point. The average temperature measured on the bottom of the trusses was 68°F before the test. Therefore, the average limiting temperature was 318°F and the individual limiting temperature was 393°F. The maximum individual limiting temperature for the finish rating was reach at 14 minutes and 45 seconds as recorded by thermocouple number 40. A plot of the finish rating temperatures can be seen on Figure 9.4. Temperatures at Mid Depth on the Side the Trusses – The average and maximum temperatures of the sides of the wood trusses just before the moment of collapse (23 min 15 sec) were 1061°F and 1432°F respectively. The individual temperature was recorded by thermocouple number 46. A plot of these temperatures can be seen on Figure 72. Temperatures of the Mid Depth Between Wood Trusses – The average and maximum temperatures of the mid depth between the wood trusses just before the moment of collapse (23 min 15 sec) were 1255°F and 1500°F respectively. The individual temperature was recorded by thermocouple number 64. A plot of these temperatures can be seen on Figure 72. Temperatures on the Bottom of the Roof Deck Between Wood Trusses – The average and maximum temperatures of the sub floor between the wood joists just before the moment of collapse (23 min 15 sec) were 1206°F and 1499°F respectively. The individual temperature was recorded by thermocouple number 74. A plot of these temperatures can be seen on Figure 72.

File NC9140 Page 93 of 178 Issued: 2008-09-30 Revised: 2009-05-12
Figure 72 – Plot of Temperature Below Subfloor vs. Time
Temperatures of the Unexposed Side of Gypsum Board – The average and maximum temperatures of the unexposed surface just before the gypsum board fall off (13 min 45 sec) were 731°F and 1033°F respectively. The individual temperature was recorded by thermocouple number 56. A plot of these temperatures can be seen on Figure 73
Figure 73 – Plot of Temperature of the Unexposed Surface of Gypsum Board vs. Time
Temperatures on the Top of the Roof Deck – The average and maximum temperatures between the roof deck and roof felt just before the moment of collapse (23 min 15 sec) were 249°F and 723°F respectively. The individual temperature was recorded by thermocouple number 9. A plot of these temperatures can be seen on Figure 9.6.

File NC9140 Page 94 of 178 Issued: 2008-09-30 Revised: 2009-05-12
Figure 9.6 – Plot of Temperature of the Roof Deck Temperatures vs. Time
Temperatures on the Roofing Felt – The average and maximum temperatures between the sub floor and finish floor just before the moment of collapse (23 min 15 sec) were 182°F and 245°F respectively. The individual temperature was recorded by thermocouple number 23. A plot of these temperatures can be seen on Figure 9.7.
Figure 74 – Plot of Temperature of the Roofing Felt vs. Time
Temperatures of the Unexposed Surface – The average and maximum temperatures of the unexposed surface just before the moment of collapse (23 min 15 sec) were 138°F and 263°F respectively. The individual temperature was recorded by thermocouple number 92. A plot of these temperatures can be seen on Figure 75.

File NC9140 Page 95 of 178 Issued: 2008-09-30 Revised: 2009-05-12
Figure 75 – Plot of Temperatures of the Unexposed Surface vs. Time
Deflection of the Assembly - The deflection of the floor-ceiling assembly during the fire test is shown on Figure 9.9. The location of each deflection transducer can be seen in Appendix A under Figure 76.
Figure 76 – Plot of Deflections vs. Time

File NC9140 Page 96 of 178 Issued: 2008-09-30 Revised: 2009-05-12 Discussion
Furnace Conditions The average temperature within the furnace, the pressure within the furnace and the percent oxygen content in the furnace exhaust duct were plotted in Figure 77, Figure 78 and Figure 79, respectively.
200400600800
100012001400160018002000
0 20 40 60 80 100
Time, Minutes
Tem
pera
ture
, F
Test No.1Test No. 2Test No. 3Test No. 4Test No. 5Test No. 6Test No. 7Test No. 8Test No. 9
Figure 77 - Furnace Temperature
The furnace temperature during the initial portion of Test Nos. 1 and 2 were significantly higher than recorded during Test Nos. 3 through 9 because the combustible supports and sub-floors for both of these assemblies were exposed to the furnace fire at the start of the test. The relatively low furnace temperatures recorded during the later stages of Test No. 8 reflect the collapse of the plaster ceiling upon the thermocouples in the furnace.

File NC9140 Page 97 of 178 Issued: 2008-09-30 Revised: 2009-05-12
-0.10
-0.08
-0.06
-0.04
-0.02
0.00
0.02
0.04
0.06
0.0 20.0 40.0 60.0 80.0 100.0
Time, Minutes
Pres
sure
, Inc
hes
of W
ater
Test No.2Test No. 3Test No. 4Test No. 5Test No. 6Test No. 7Test No. 8Test No. 9
Figure 78 - Furnace Pressure
The furnace pressure was measured at a level approximately 4 inches below the ceiling surface. After the initial few minutes, the furnace pressure ranged from 0.01 to 0.02 inches of water until the ceiling fell. Then the furnace pressure became negative and ranged for 0.01 to 0.03 inches of water.
.0
5.0
10.0
15.0
20.0
25.0
0.0 20.0 40.0 60.0 80.0 100.0
Time, Minutes
% O
xyge
n
Test No. 2Test No. 3Test No. 4Test No. 5Test No. 6Test No. 7Test No. 8Test No. 9
Figure 79 - Percent Oxygen in Furnace

File NC9140 Page 98 of 178 Issued: 2008-09-30 Revised: 2009-05-12 The percent oxygen content at the beginning of the tests was approximately 19 to 20 percent and was reduced to approximately 6 to 8 percent during the tests when the ceilings were in place. The percent oxygen content dropped to near zero after the ceilings fell and the combustible supports and sub-floor were exposed to the furnace flames. Overall, the conditions within the furnace during each of the nine fire tests were sufficiently similar to enable a comparison of the structural performance of the samples when considering the state of the test samples.
Floor and Roof Surface Temperature Conditions The use of thermal imaging cameras by firefighters continues to grow and has many current and potential life safety applications. The temperature on the surfaces of the floor and roof were measured at several locations during each fire test. The temperatures of these surfaces at 60 seconds and at 30 seconds before collapse are shown in Figure 80 to Figure 88.
60 seconds before collapse 30 seconds before collapse Collapse at 18 min.: 45 sec.
Figure 80 -Test Assembly No. 1
F in ished F loorSub F loor
124 °F
1291 °F
F in ished F loorSub F loor
127 °F
1330 °F
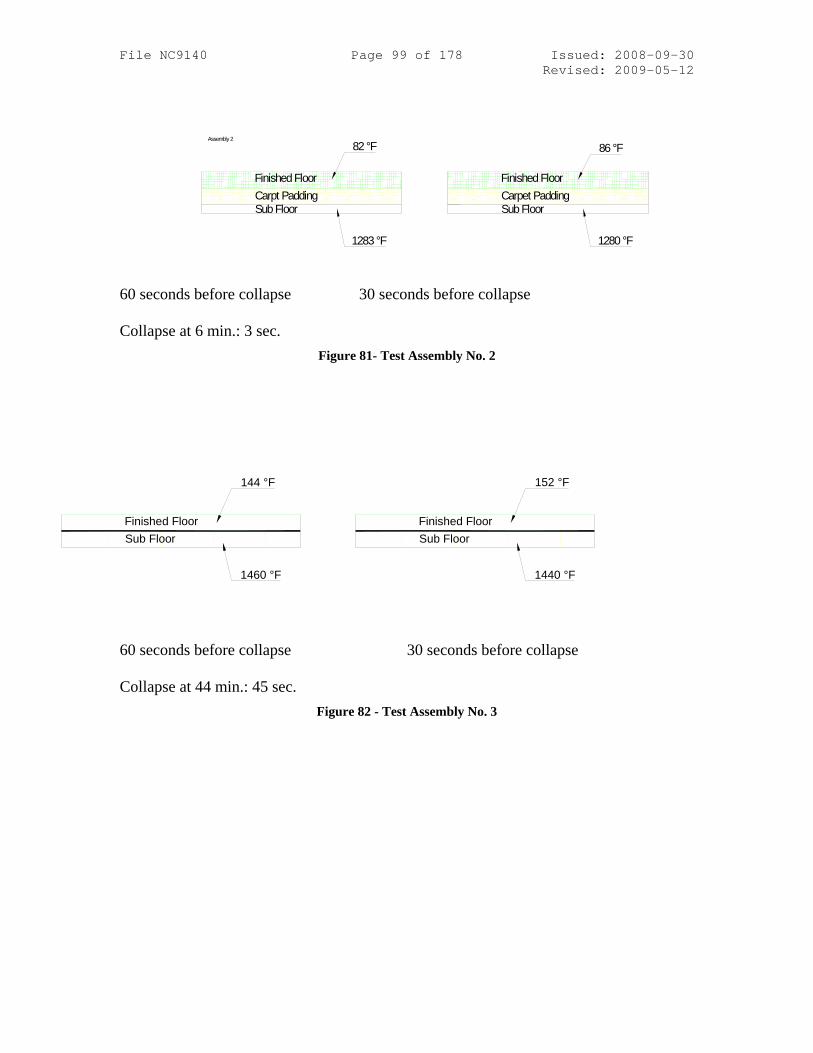
File NC9140 Page 99 of 178 Issued: 2008-09-30 Revised: 2009-05-12
60 seconds before collapse 30 seconds before collapse Collapse at 6 min.: 3 sec.
Figure 81- Test Assembly No. 2
60 seconds before collapse 30 seconds before collapse Collapse at 44 min.: 45 sec.
Figure 82 - Test Assembly No. 3
Finished Floor
Sub Floor
82 °F
1283 °F
Finished Floor
Sub Floor
86 °F
1280 °F
Carpt Padding Carpet Padding
Assembly 2
Finished FloorSub Floor
144 °F
1460 °F
Finished FloorSub Floor
152 °F
1440 °F

File NC9140 Page 100 of 178 Issued: 2008-09-30 Revised: 2009-05-12
60 seconds before collapse 30 seconds before collapse Collapse at 26 min.: 45 sec.
Figure 83 - Test Assembly No. 4
60 seconds before collapse 30 seconds before collapse
Collapse at 29 min.: 15 sec.
Figure 84 - Test Assembly No. 5
Finished Floor
Sub Floor
145 °F
1406 °F
Finished Floor
Sub Floor
152 °F
1435 °F
Carpt Padding Carpet Padding
Assembly 4
Finished Floor
Sub Floor
163 °F
1405 °F
Finished Floor
Sub Floor
164 °F
1436 °F
Carpt Padding Carpet Padding
Assembly 5

File NC9140 Page 101 of 178 Issued: 2008-09-30 Revised: 2009-05-12
60 seconds before collapse 30 seconds before collapse Collapse at 26 min.: 45 sec.
Figure 85 - Test Assembly No. 6
60 seconds before collapse 30 seconds before collapse
Collapse at 40 min.
Figure 86 - Test Assembly No. 7
Finished Floor
Sub Floor
171 °F
1383 °F
Finished Floor
Sub Floor
172 °F
1379 °F
Carpt Padding Carpet Padding
Assembly 6
Asphault Shingles
1 X 6 lumber
198 °F
1407 °F
Asphault Shingles
1 X 6 Lumber
172 °F
1375 °F
Roofing Felt Roofing Felt
Assembly 7

File NC9140 Page 102 of 178 Issued: 2008-09-30 Revised: 2009-05-12
60 seconds before collapse 30 seconds before collapse Collapse at 79 min.: 45 sec.
Figure 87 - Test Assembly No. 8
60 seconds before collapse 30 seconds before collapse
Collapse at 23 min.: 15 sec.
Figure 88 - Test Assembly No. 9
Finished Floor
Sub Floor
172 °F
1417 °F
Finished Floor
Sub Floor
173 °F
1394 °F
Carpt Padding Carpet Padding
Asphault Shingles
7/16 in. OSB
117 °F
1053°F
Asphault Shingles
7/16 in. OSB
121 °F
1089 °F
Roofing Felt Roofing Felt
Assembly 9

File NC9140 Page 103 of 178 Issued: 2008-09-30 Revised: 2009-05-12 Table 15 provides a summary of the temperature date in the previous Figure 80 through Figure 88.
Table 13 - Average temperature on exposed surface of sub-floor or roof deck and average temperature on unexposed surface of floor or roofing shingles.
Assembly No.
Average temperature of exposed (lower) surface of sub-floor or roof deck 30 seconds before collapse
(ºF)
Average temperature of unexposed (upper) surface of floor or asphalt shingles 30 second before collapse
(ºF) 1 1330 127 2 1280 86 3 1440 147 4 1435 152 5 1436 164 6 1379 172 7 1375 204 8 1394 173 9 1089 121
It should be noted the relatively low temperatures on the surface viewed by the thermal imaging camera shortly before collapse as compared to the surface temperature of the sub-floor exposed to the fire.
Structural Serviceability Firefighters have expressed concern about the rate of structure's deflection prior to collapse when reporting on experiences upon entering a fire scene and performing life safety and fire extinguishment activities. The firefighters' reports indicate the lightweight wood construction collapses at a quicker rate as compare to floors supported by 2 by 10s. Reviewing data from Test Nos. 1 and 2 support this observation. The elapse time between the start of a continuous deflection and collapse was 13 minutes for Sample No. 1 (2 by 10s without a ceiling) and 3 minutes for Sample No. 2 (wood I joist without a ceiling). The elapse time increased when a gypsum board ceiling was installed beneath the I joist supports. The elapse time increased to 6 minutes from 3 minutes for the I joist sample with the gypsum board ceiling. For the two samples with 2 by 4 wood trusses the elapse time was 10 minutes and 7 minutes for Sample Nos. 5 and 6, respectively.

File NC9140 Page 104 of 178 Issued: 2008-09-30 Revised: 2009-05-12 Summary of Findings
The project included the fire testing of nine combustible assemblies with the intent of documenting the significantg differences, if any, in the performance of these assemblies with respect to fire containment. Key findings included:
• The fire containment performance of a combustible floor-ceiling assembly representing typical legacy construction without a ceiling was 18 minutes. The time duration was based upon the performance of the assembly when exposed to the time-temperature curve defined in Standard ASTM E119. This performance was defined as the bench mark performance for comparison purposes.
• The fire containment performance of a combustible floor-ceiling assembly
supported by engineered I joists was 14 minutes less than the bench mark performance.
• The fire containment performance of the combustible floor-ceiling assembly
supported by engineered I joists with a ½ inch thick regular gypsum board ceiling exceeded the bench mark performance by 7 minutes.
• The fire containment performance of a combustible floor-ceiling assembly
supported by either: (1) engineered I joists, (2) parallel chord trusses with steel gusset plate connections or (3) parallel chord trusses with glued connections were approximately equal when a ceiling consisting of ½ inch thick regular gypsum wallboard was provided.
In addition, it was noted that the temperature difference between the surface of a floor or roof covering away from the fire and the temperature of the sub-floor or the roof deck below the roof covering ranged from 968 °F to 1221 °F 30 seconds before collapse.

File NC9140 Page 105 of 178 Issued: 2008-09-30 Revised: 2009-05-12

File NC9140 Page 106 of 178 Issued: 2008-09-30 Revised: 2009-05-12
Appendix A – Location of Instrumentation The location of instrumentation and materials such as thermocouples, deflection transducers, accelerometers, camera locations, joist and truss members, subflooring and finish flooring, and loading conditions are described in this Appendix.
General Furnace Thermocouples – There were a total of 16 furnace thermocouples space symmetrically throughout the furnace in rows of four.

File NC9140 Page 107 of 178 Issued: 2008-09-30 Revised: 2009-05-12 Assembly No. 1:
Figure A.1.1 – Construction Layout.

File NC9140 Page 108 of 178 Issued: 2008-09-30 Revised: 2009-05-12
Assembly No. 1
Figure A.1.2 – Construction Layout Section A1-A1.

File NC9140 Page 109 of 178 Issued: 2008-09-30 Revised: 2009-05-12
Assembly No. 1
Figure A.1.3 – Thermocouple Locations - Elevation.

File NC9140 Page 110 of 178 Issued: 2008-09-30 Revised: 2009-05-12
Assembly No. 1
Figure A.1.4 – Thermocouple Locations on Wood Members.

File NC9140 Page 111 of 178 Issued: 2008-09-30 Revised: 2009-05-12
Assembly No. 1
Figure A.1.5 – Thermocouple Locations on Subfloor.

File NC9140 Page 112 of 178 Issued: 2008-09-30 Revised: 2009-05-12
Assembly No. 1
Figure A.1.6 – Thermocouple Locations on Unexposed Surface.

File NC9140 Page 113 of 178 Issued: 2008-09-30 Revised: 2009-05-12
Assembly No. 1
Figure A.1.7 – Loading and Instrumentation Layout (See Figure A.1.8).
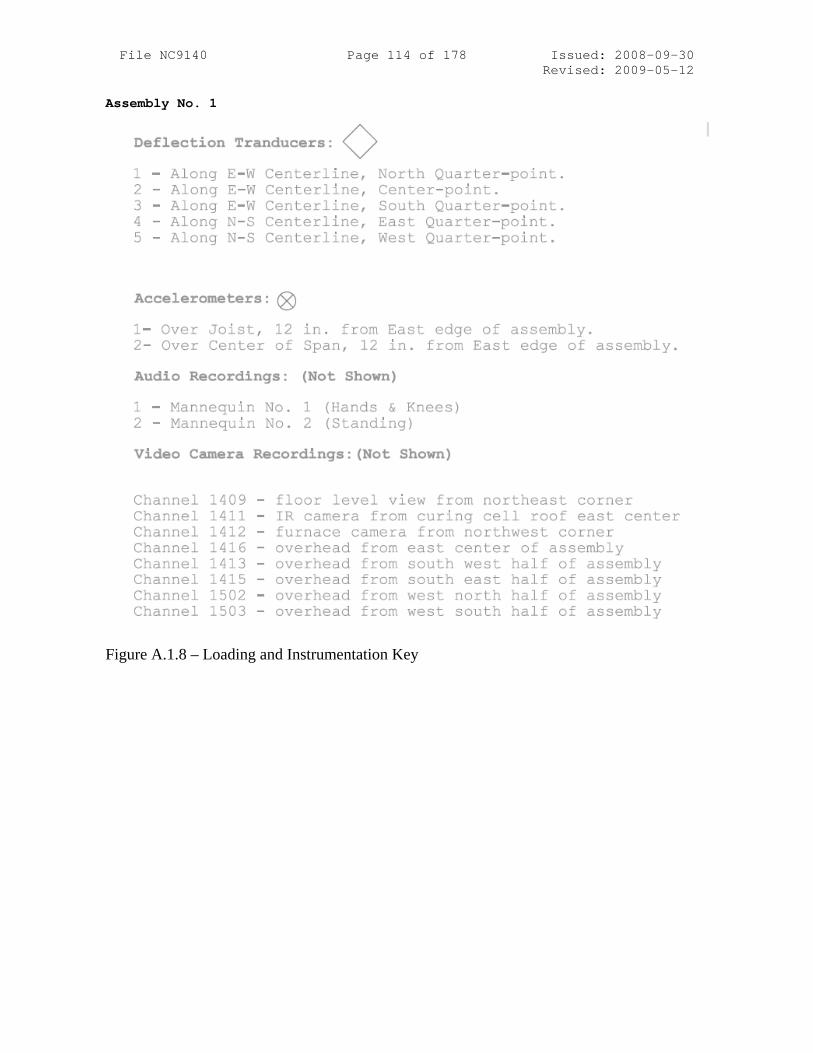
File NC9140 Page 114 of 178 Issued: 2008-09-30 Revised: 2009-05-12
Assembly No. 1
Figure A.1.8 – Loading and Instrumentation Key
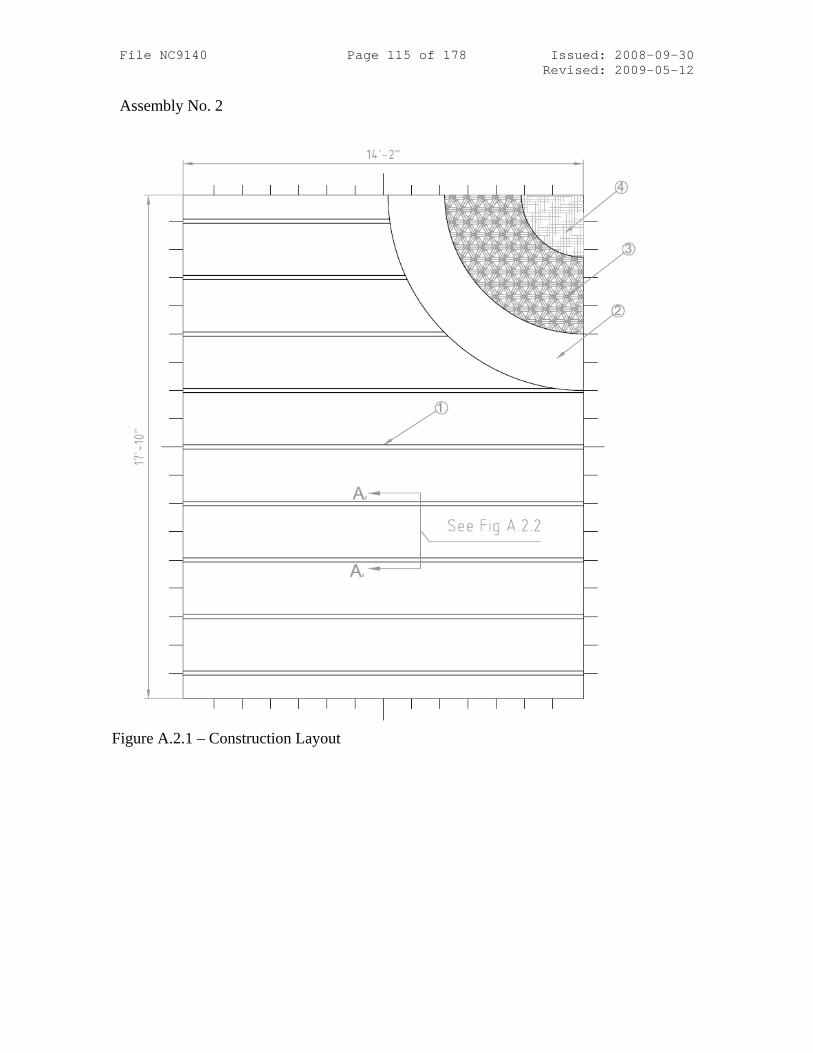
File NC9140 Page 115 of 178 Issued: 2008-09-30 Revised: 2009-05-12 Assembly No. 2
Figure A.2.1 – Construction Layout
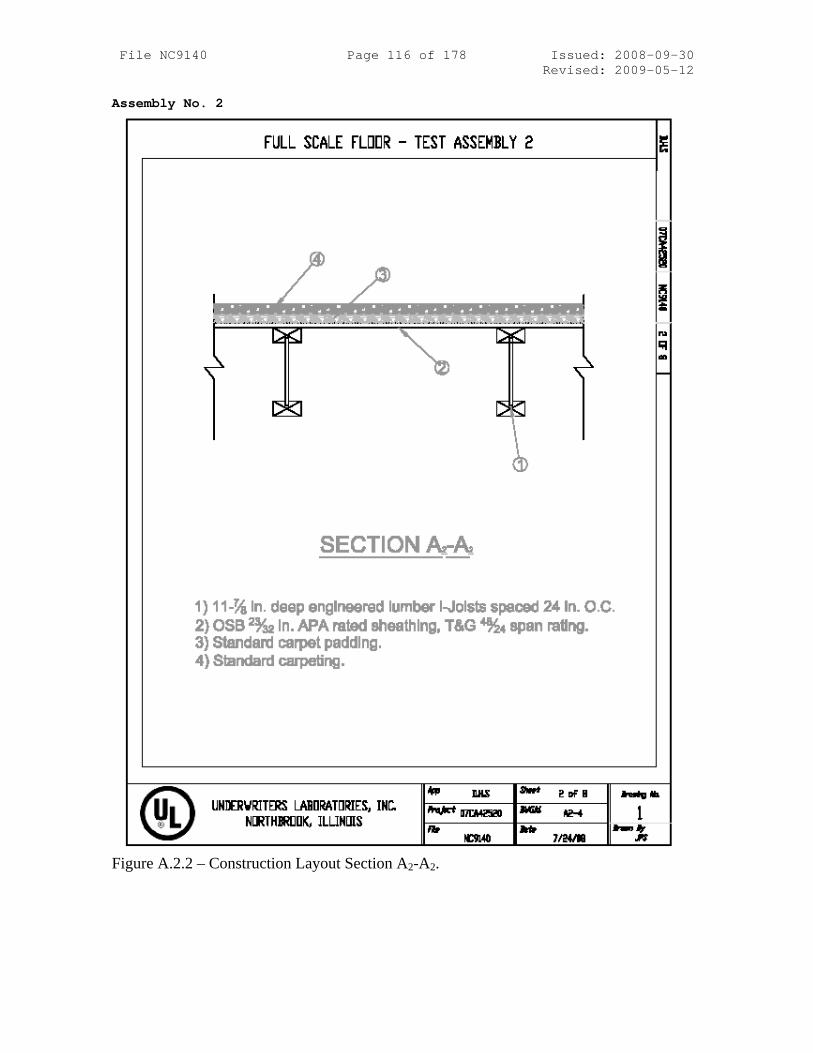
File NC9140 Page 116 of 178 Issued: 2008-09-30 Revised: 2009-05-12 Assembly No. 2
Figure A.2.2 – Construction Layout Section A2-A2.

File NC9140 Page 117 of 178 Issued: 2008-09-30 Revised: 2009-05-12 Assembly No. 2
Figure A.2.3 – Thermocouple Locations - Elevation.

File NC9140 Page 118 of 178 Issued: 2008-09-30 Revised: 2009-05-12 Assembly No. 2
Figure A.2.4 – Thermocouple Locations on Wood Members.

File NC9140 Page 119 of 178 Issued: 2008-09-30 Revised: 2009-05-12 Assembly No. 2
Figure A.2.5 – Thermocouple Locations on Subfloor and Carpet Padding.

File NC9140 Page 120 of 178 Issued: 2008-09-30 Revised: 2009-05-12 Assembly No. 2
Figure A.2.6 – Thermocouple Locations on Unexposed Surface.

File NC9140 Page 121 of 178 Issued: 2008-09-30 Revised: 2009-05-12 Assembly No. 2
Figure A.2.7 – Loading and Instrumentation Layout (See Figure A.2.8).

File NC9140 Page 122 of 178 Issued: 2008-09-30 Revised: 2009-05-12 Assembly No. 2
Figure A.2.8 – Loading and Instrumentation Key

File NC9140 Page 123 of 178 Issued: 2008-09-30 Revised: 2009-05-12 Assembly No. 3
Figure A.3.1 – Construction Layout.

File NC9140 Page 124 of 178 Issued: 2008-09-30 Revised: 2009-05-12
Assembly No. 3
Figure A.3.2 – Construction Layout Section A3-A3.

File NC9140 Page 125 of 178 Issued: 2008-09-30 Revised: 2009-05-12
Assembly No. 3
Figure A.3.3 – Thermocouple Locations - Elevation.

File NC9140 Page 126 of 178 Issued: 2008-09-30 Revised: 2009-05-12
Assembly No. 3
Figure A.3.4 – Thermocouple Locations on Wood Member.

File NC9140 Page 127 of 178 Issued: 2008-09-30 Revised: 2009-05-12
Assembly No. 3
Figure A.3.5 – Thermocouple Locations on Subfloor.
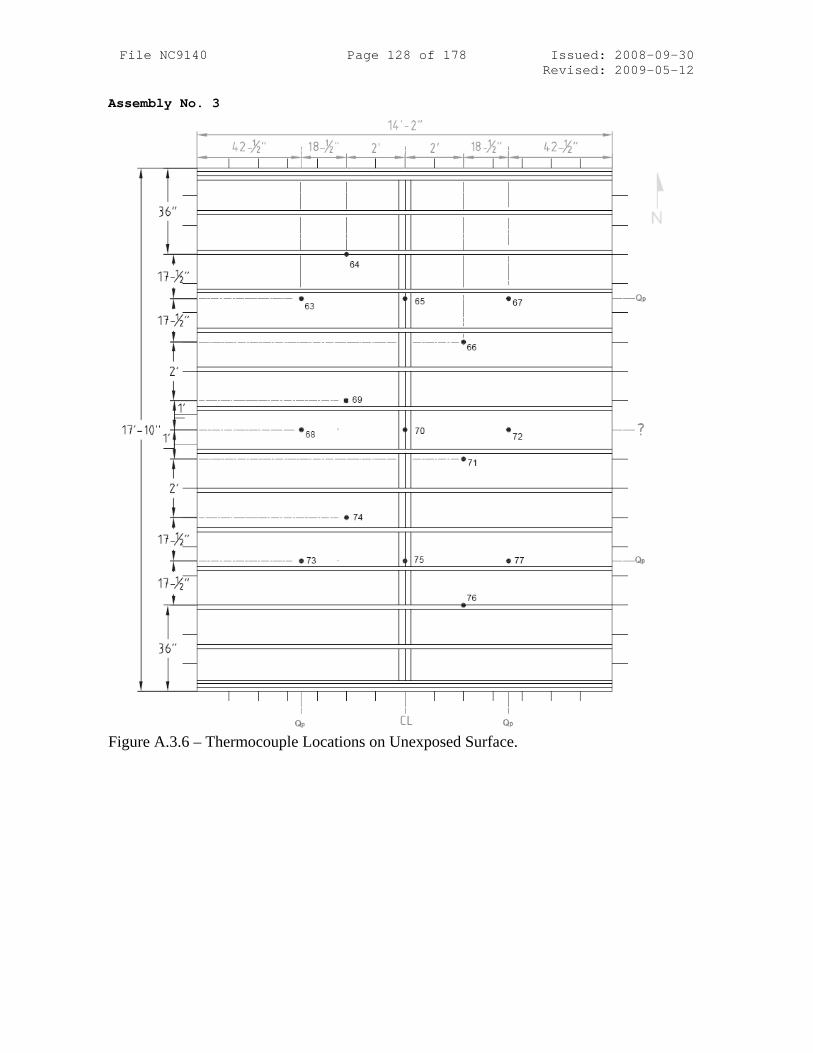
File NC9140 Page 128 of 178 Issued: 2008-09-30 Revised: 2009-05-12
Assembly No. 3
Figure A.3.6 – Thermocouple Locations on Unexposed Surface.

File NC9140 Page 129 of 178 Issued: 2008-09-30 Revised: 2009-05-12
Assembly No. 3
Figure A.3.7 – Loading and Instrumentation Layout (See Figure A.3.8).

File NC9140 Page 130 of 178 Issued: 2008-09-30 Revised: 2009-05-12
Assembly No. 3
Figure A.3.8 – Loading and Instrumentation Key

File NC9140 Page 131 of 178 Issued: 2008-09-30 Revised: 2009-05-12 Assembly No. 4
Figure A.4.1 – Construction Layout

File NC9140 Page 132 of 178 Issued: 2008-09-30 Revised: 2009-05-12 Assembly No. 4
Figure A.4.2 – Construction Layout Section A4-A4.

File NC9140 Page 133 of 178 Issued: 2008-09-30 Revised: 2009-05-12 Assembly No. 4
Figure A.4.3 – Thermocouple Locations - Elevation.
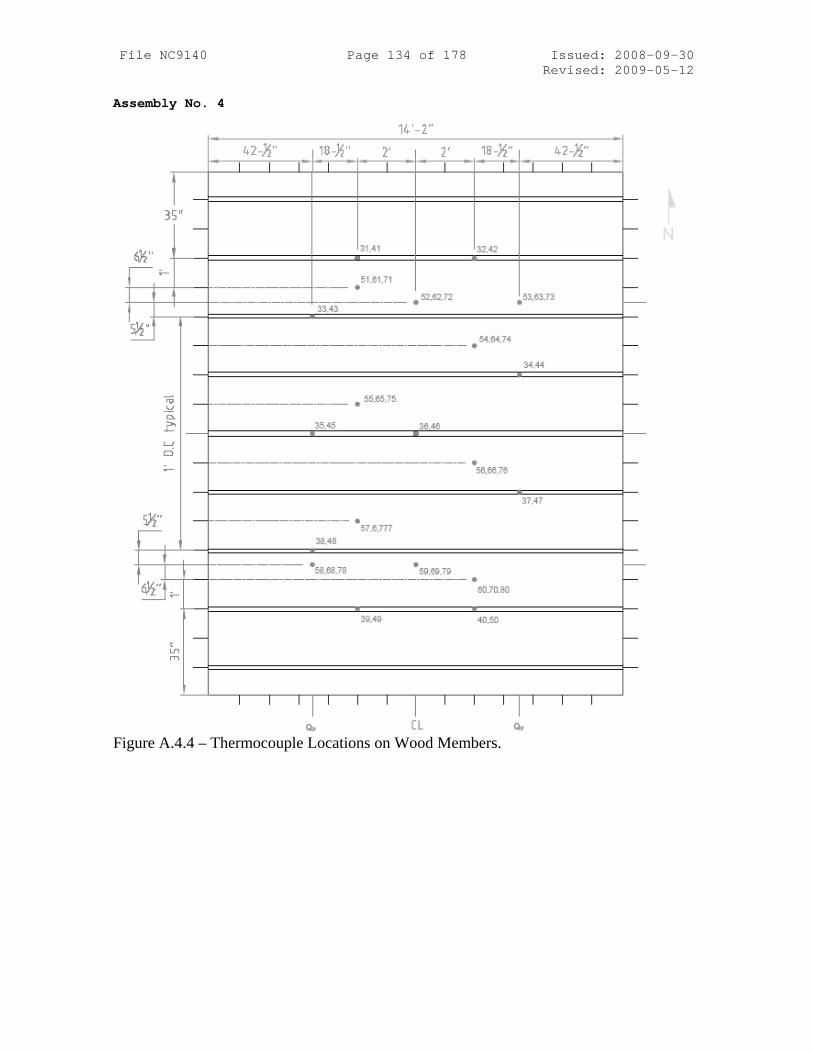
File NC9140 Page 134 of 178 Issued: 2008-09-30 Revised: 2009-05-12 Assembly No. 4
Figure A.4.4 – Thermocouple Locations on Wood Members.

File NC9140 Page 135 of 178 Issued: 2008-09-30 Revised: 2009-05-12 Assembly No. 4
Figure A.4.5 – Thermocouple Locations on Subfloor and Carpet Padding.
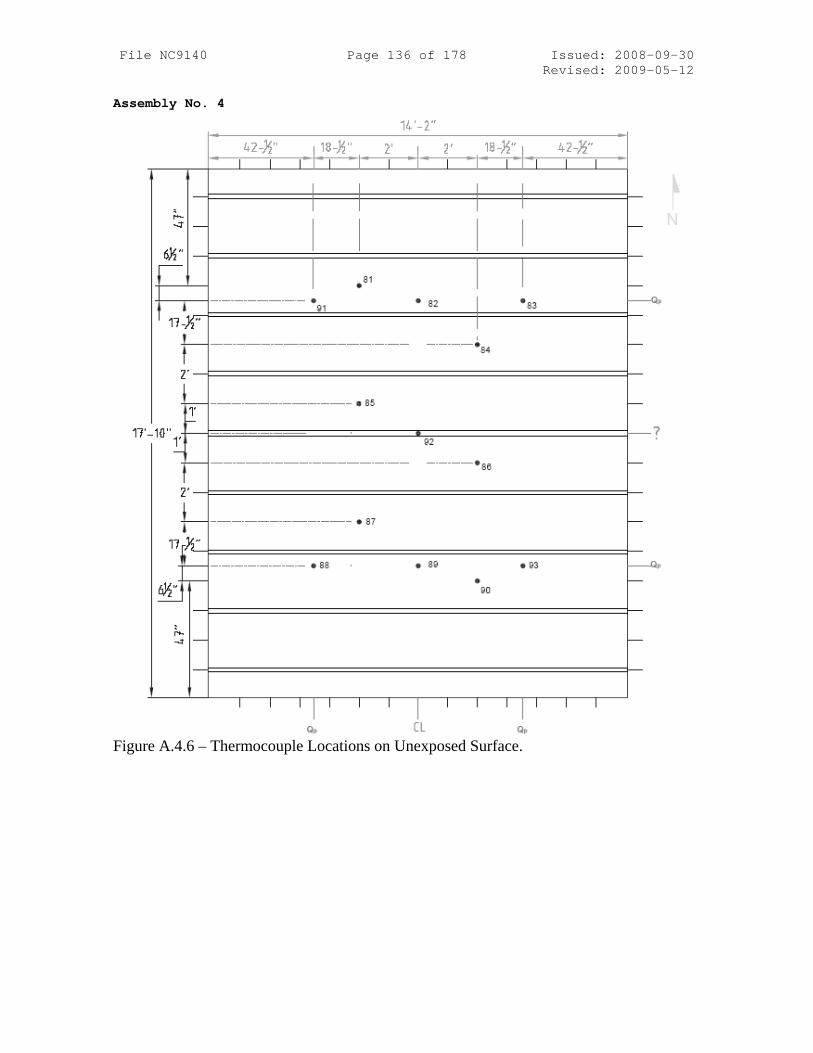
File NC9140 Page 136 of 178 Issued: 2008-09-30 Revised: 2009-05-12 Assembly No. 4
Figure A.4.6 – Thermocouple Locations on Unexposed Surface.

File NC9140 Page 137 of 178 Issued: 2008-09-30 Revised: 2009-05-12 Assembly No. 4
Figure A.4.7 – Loading and Instrumentation Layout (See Figure A.4.8).

File NC9140 Page 138 of 178 Issued: 2008-09-30 Revised: 2009-05-12 Assembly No. 4
Figure A.4.8 – Loading and Instrumentation Key

File NC9140 Page 139 of 178 Issued: 2008-09-30 Revised: 2009-05-12 Assembly No. 5
Figure A.5.1 – Construction Layout

File NC9140 Page 140 of 178 Issued: 2008-09-30 Revised: 2009-05-12 Assembly No. 5
Figure A.5.2 – Construction Layout Section A5-A5.
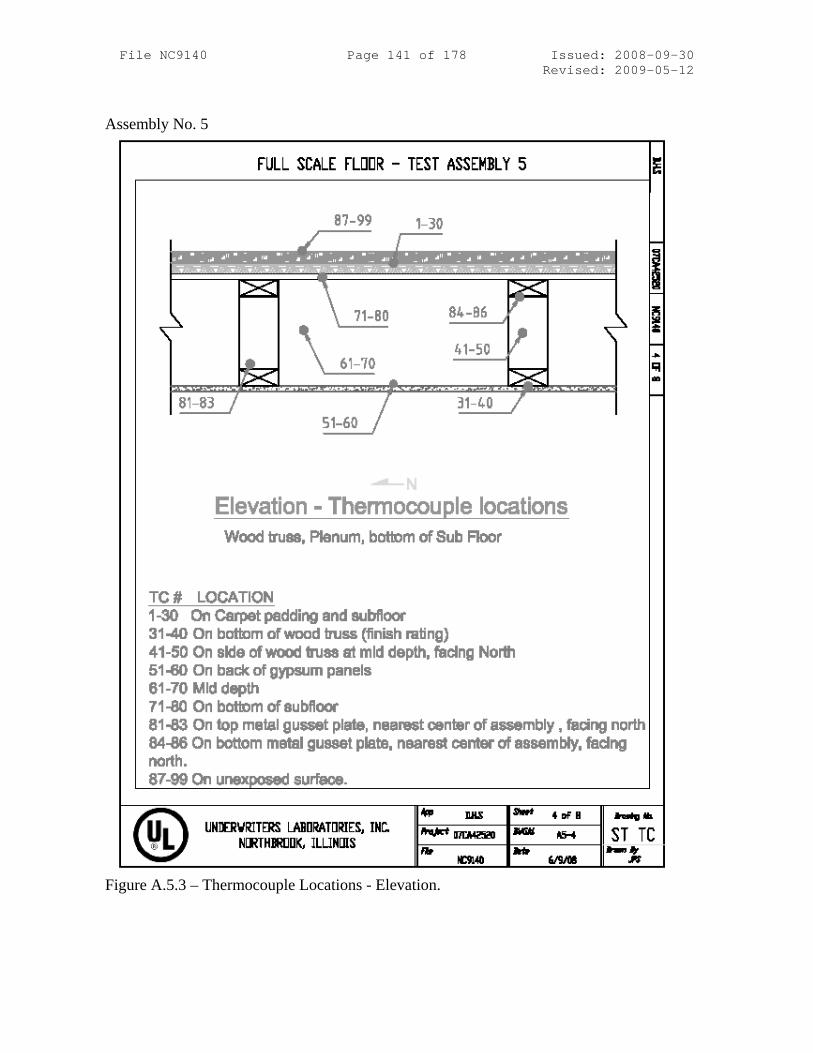
File NC9140 Page 141 of 178 Issued: 2008-09-30 Revised: 2009-05-12
Assembly No. 5
Figure A.5.3 – Thermocouple Locations - Elevation.
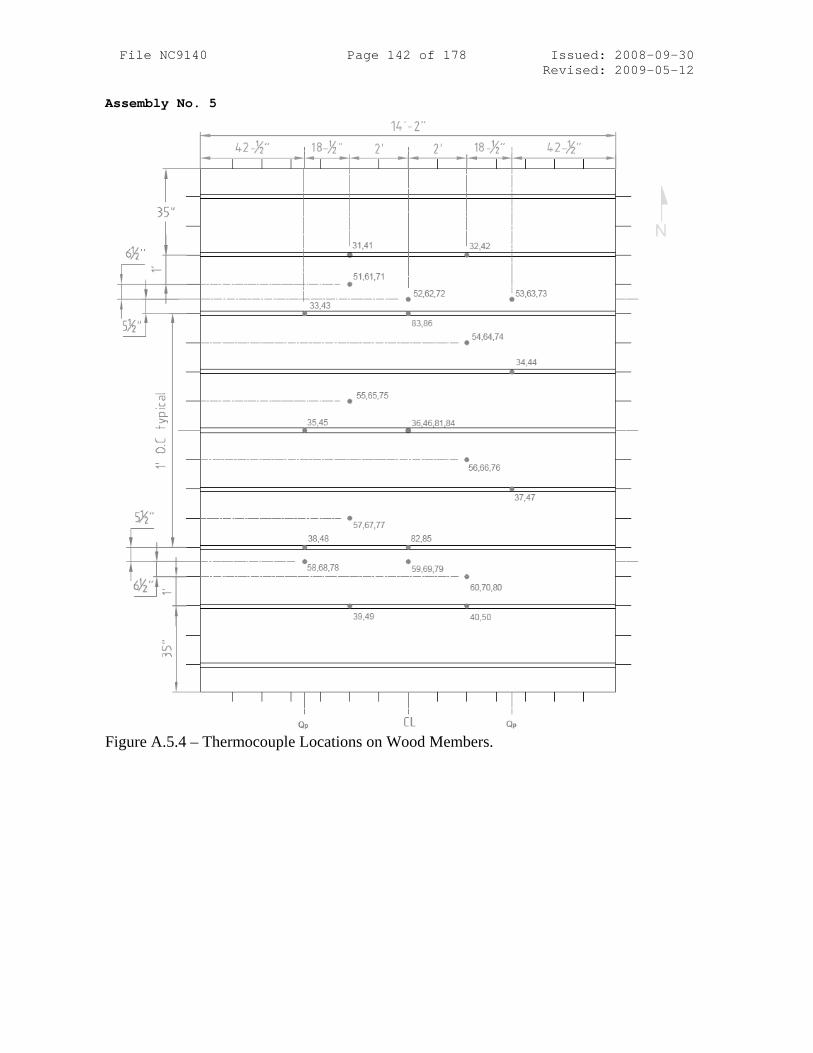
File NC9140 Page 142 of 178 Issued: 2008-09-30 Revised: 2009-05-12
Assembly No. 5
Figure A.5.4 – Thermocouple Locations on Wood Members.

File NC9140 Page 143 of 178 Issued: 2008-09-30 Revised: 2009-05-12
Assembly No. 5
Figure A.5.5 – Thermocouple Locations on Subfloor and Carpet Padding.
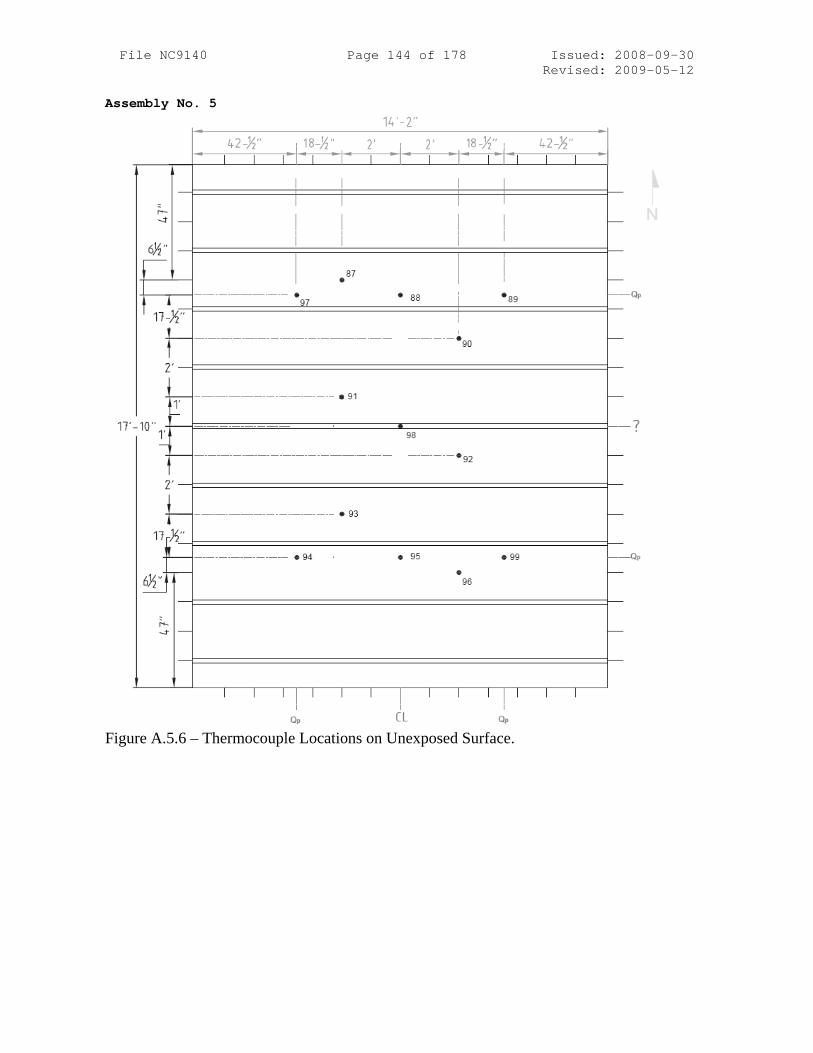
File NC9140 Page 144 of 178 Issued: 2008-09-30 Revised: 2009-05-12
Assembly No. 5
Figure A.5.6 – Thermocouple Locations on Unexposed Surface.

File NC9140 Page 145 of 178 Issued: 2008-09-30 Revised: 2009-05-12
Assembly No. 5
Figure A.5.7 – Loading and Instrumentation Layout (See Figure A.5.8).

File NC9140 Page 146 of 178 Issued: 2008-09-30 Revised: 2009-05-12
Assembly No. 5
Figure A.5.8 – Loading and Instrumentation Key

File NC9140 Page 147 of 178 Issued: 2008-09-30 Revised: 2009-05-12 Assembly No. 6
Figure A.6.1 – Construction Layout

File NC9140 Page 148 of 178 Issued: 2008-09-30 Revised: 2009-05-12
Assembly No. 6
Figure A.6.2 – Construction Layout Section A6-A6.

File NC9140 Page 149 of 178 Issued: 2008-09-30 Revised: 2009-05-12
Assembly No. 6
Figure A.6.3 – Thermocouple Locations - Elevation.
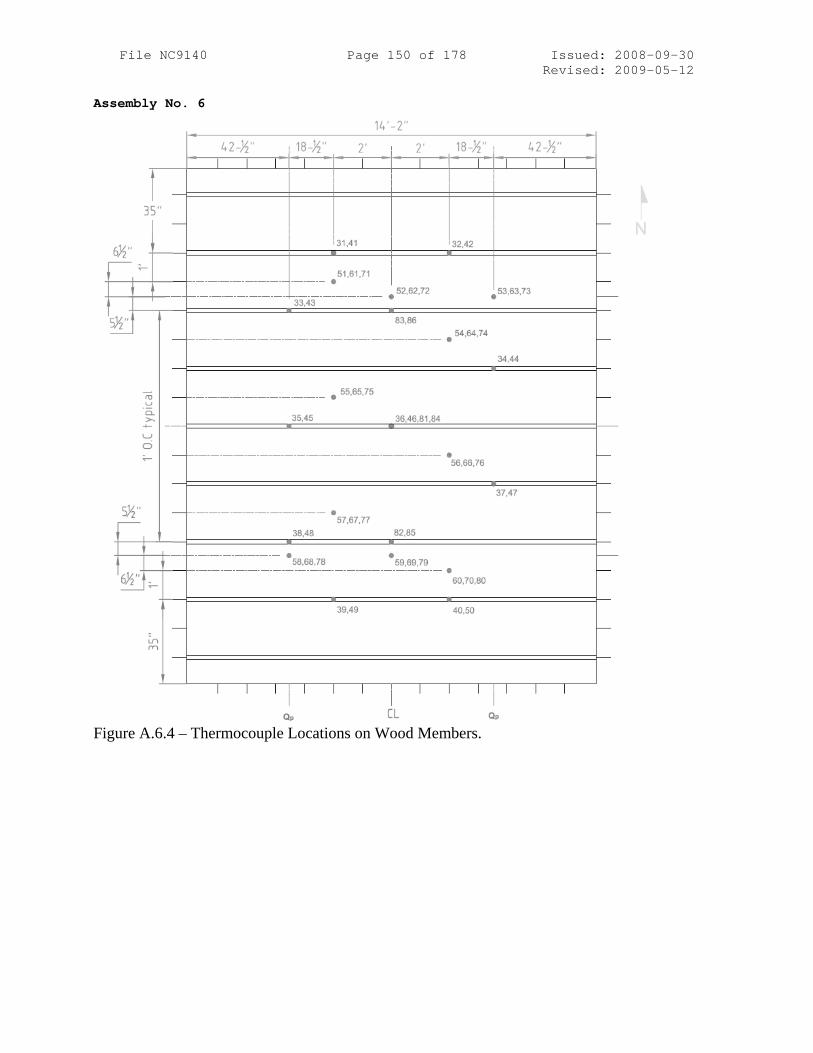
File NC9140 Page 150 of 178 Issued: 2008-09-30 Revised: 2009-05-12
Assembly No. 6
Figure A.6.4 – Thermocouple Locations on Wood Members.

File NC9140 Page 151 of 178 Issued: 2008-09-30 Revised: 2009-05-12
Assembly No. 6
Figure A.6.5 – Thermocouple Locations on Subfloor and Carpet Padding.
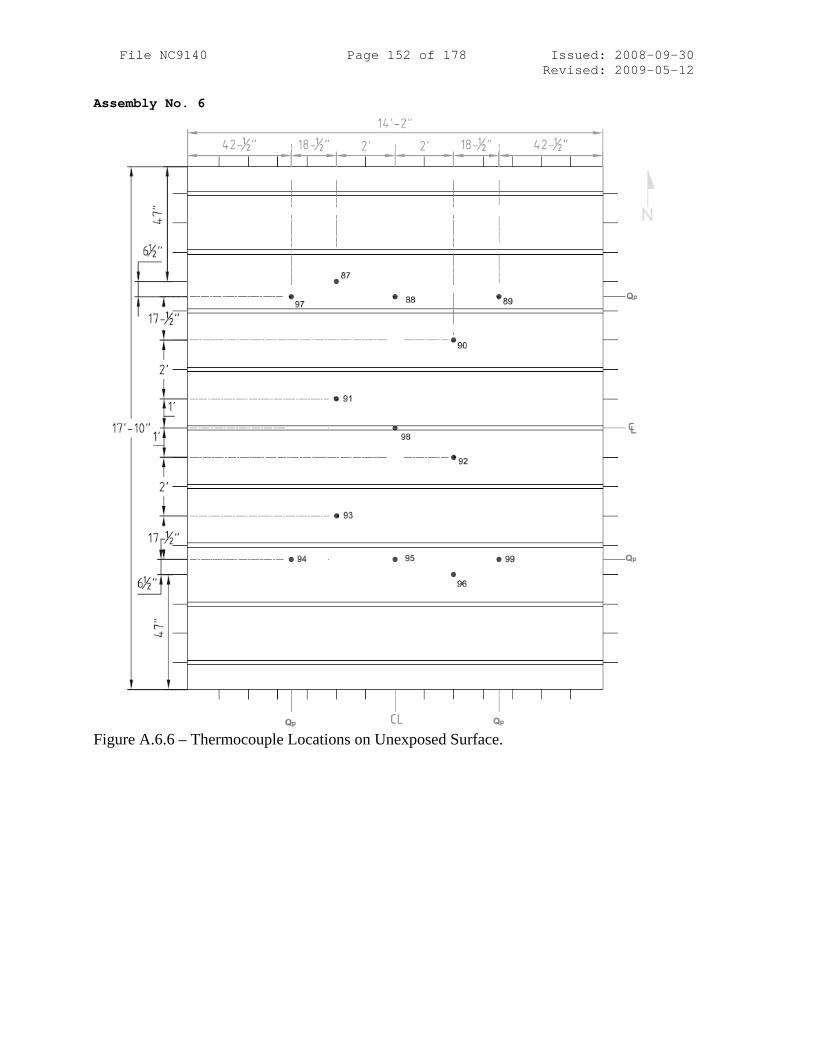
File NC9140 Page 152 of 178 Issued: 2008-09-30 Revised: 2009-05-12
Assembly No. 6
Figure A.6.6 – Thermocouple Locations on Unexposed Surface.

File NC9140 Page 153 of 178 Issued: 2008-09-30 Revised: 2009-05-12
Assembly No. 6
Figure A.6.7 – Loading and Instrumentation Layout (See Figure A.6.8)
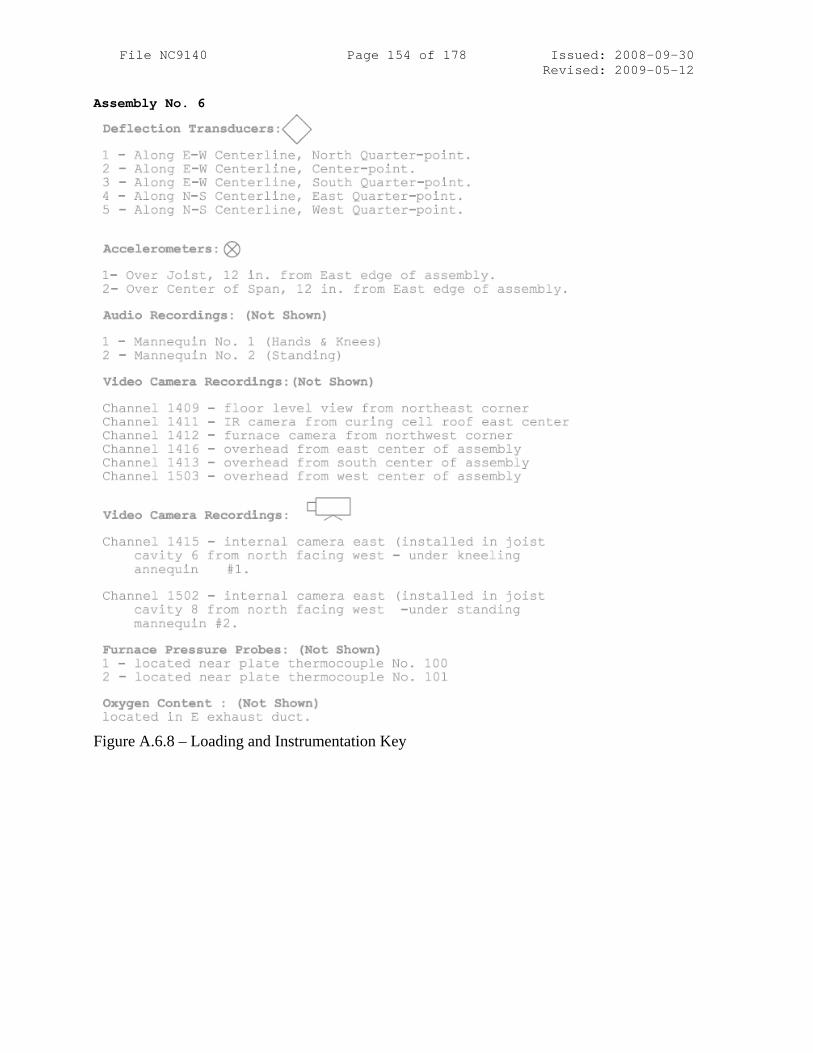
File NC9140 Page 154 of 178 Issued: 2008-09-30 Revised: 2009-05-12
Assembly No. 6
Figure A.6.8 – Loading and Instrumentation Key

File NC9140 Page 155 of 178 Issued: 2008-09-30 Revised: 2009-05-12 Assembly No. 7
Figure A.7.1 – Construction Layout
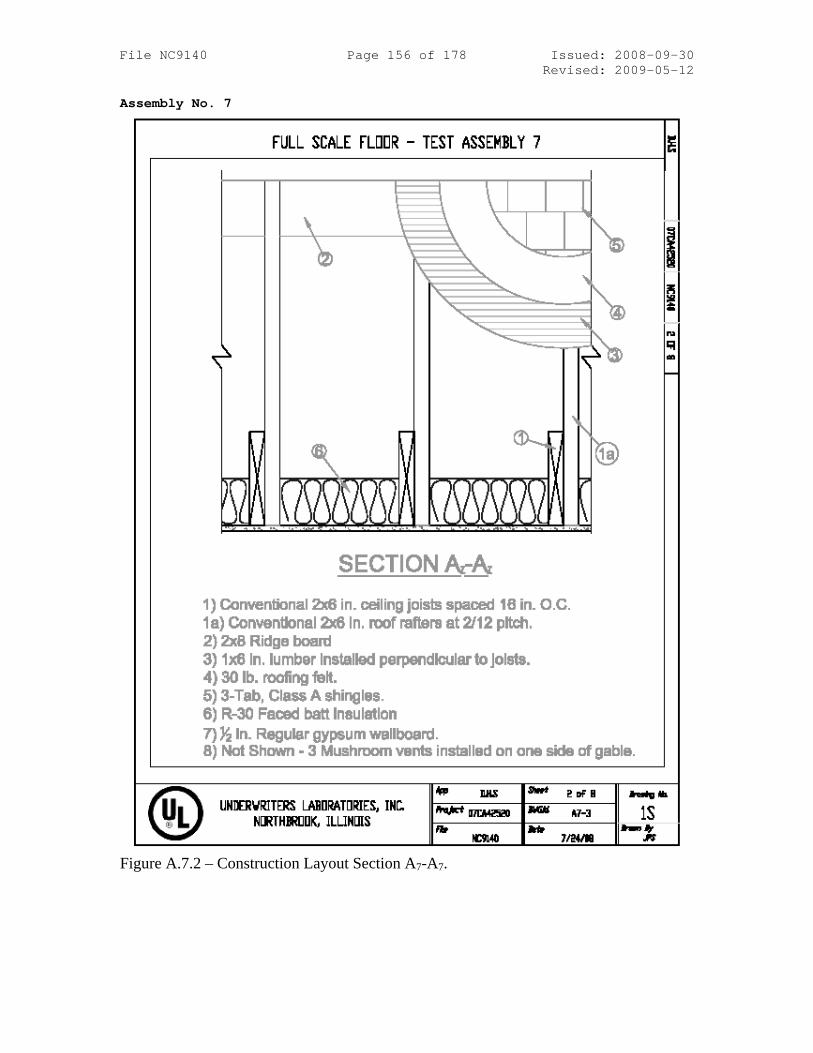
File NC9140 Page 156 of 178 Issued: 2008-09-30 Revised: 2009-05-12 Assembly No. 7
Figure A.7.2 – Construction Layout Section A7-A7.

File NC9140 Page 157 of 178 Issued: 2008-09-30 Revised: 2009-05-12 Assembly No. 7
Figure A.7.3 – Thermocouple Locations - Elevation.

File NC9140 Page 158 of 178 Issued: 2008-09-30 Revised: 2009-05-12 Assembly No. 7
Figure A.7.4 – Thermocouple Locations on Wood Members.

File NC9140 Page 159 of 178 Issued: 2008-09-30 Revised: 2009-05-12 Assembly No. 7
Figure A.7.5 – Thermocouple Locations on Roof Deck and Roof Felt.

File NC9140 Page 160 of 178 Issued: 2008-09-30 Revised: 2009-05-12 Assembly No. 7
Figure A.7.6 – Thermocouple Locations on Unexposed Surface.

File NC9140 Page 161 of 178 Issued: 2008-09-30 Revised: 2009-05-12 Assembly No. 7
Figure A.7.7 – Loading and Instrumentation Layout (See Figure A.7.8).

File NC9140 Page 162 of 178 Issued: 2008-09-30 Revised: 2009-05-12 Assembly No. 7
Figure A.7.8 – Loading and Instrumentation Key

File NC9140 Page 163 of 178 Issued: 2008-09-30 Revised: 2009-05-12 Assembly No. 8
Figure A.8.1 – Construction Layout

File NC9140 Page 164 of 178 Issued: 2008-09-30 Revised: 2009-05-12 Assembly No. 8
Figure A.8.2 – Construction Layout Section A8-A8.

File NC9140 Page 165 of 178 Issued: 2008-09-30 Revised: 2009-05-12 Assembly No. 8
Figure A.8.3 – Thermocouple Locations - Elevation.

File NC9140 Page 166 of 178 Issued: 2008-09-30 Revised: 2009-05-12 Assembly No. 8
Figure A.8.4 – Thermocouple Locations on Wood Members.

File NC9140 Page 167 of 178 Issued: 2008-09-30 Revised: 2009-05-12 Assembly No. 8
Figure A.8.5 – Thermocouple Locations on Subfloor.

File NC9140 Page 168 of 178 Issued: 2008-09-30 Revised: 2009-05-12 Assembly No. 8
Figure A.8.6 – Thermocouple Locations on Unexposed Surface.

File NC9140 Page 169 of 178 Issued: 2008-09-30 Revised: 2009-05-12 Assembly No. 8
Figure A.8.7 – Loading and Instrumentation Layout (See Figure A.8.8).

File NC9140 Page 170 of 178 Issued: 2008-09-30 Revised: 2009-05-12 Assembly No. 8
Figure A.8.8 – Loading and Instrumentation Key

File NC9140 Page 171 of 178 Issued: 2008-09-30 Revised: 2009-05-12 Assembly No. 9
Figure A.9.1 – Construction Layout

File NC9140 Page 172 of 178 Issued: 2008-09-30 Revised: 2009-05-12
Assembly No. 9
Figure A.9.2 – Construction Layout Section A9-A9.
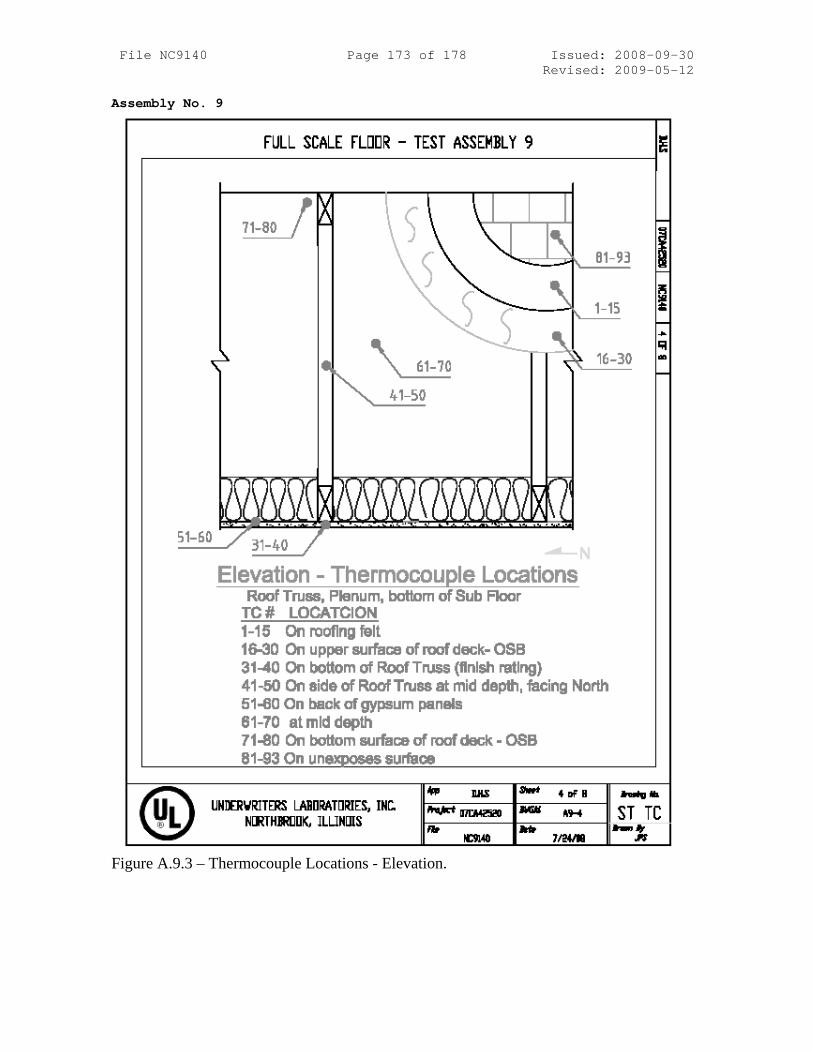
File NC9140 Page 173 of 178 Issued: 2008-09-30 Revised: 2009-05-12
Assembly No. 9
Figure A.9.3 – Thermocouple Locations - Elevation.

File NC9140 Page 174 of 178 Issued: 2008-09-30 Revised: 2009-05-12
Assembly No. 9
Figure A.9.4 – Thermocouple Locations on Wood Members.

File NC9140 Page 175 of 178 Issued: 2008-09-30 Revised: 2009-05-12
Assembly No. 9
Figure A.9.5 – Thermocouple Locations on Roof Subfloor and Roof Felt.

File NC9140 Page 176 of 178 Issued: 2008-09-30 Revised: 2009-05-12
Assembly No. 9
Figure A.9.6 – Thermocouple Locations on Unexposed Surface.

File NC9140 Page 177 of 178 Issued: 2008-09-30 Revised: 2009-05-12
Assembly No. 9
Figure A.9.7 – Loading and Instrumentation Layout (See Figure A.9.8).

File NC9140 Page 178 of 178 Issued: 2008-09-30 Revised: 2009-05-12
Assembly No. 9
Figure A.9.8 – Loading and Instrumentation Key