Embed Size (px)
Citation preview

1 | P a g e
Report on the Biological Monitoring of Selected Chemicals of Concern Results of the New Zealand biological monitoring programme, 2014-2016
March 2018
2 | P a g e
Andrea ’t Mannetje Jonathan Coakley Jeroen Douwes Centre for Public Health Research Massey University Wellington New Zealand Technical report number 2017-1 Prepared as part of a Ministry of Health contract for scientific services. March 2018

3 | P a g e
Contents 1. Summary .......................................................................................................................... 8
2. Background .................................................................................................................... 10
2.1. Introduction .............................................................................................................. 10
2.2. Aims .......................................................................................................................... 11
2.3. Selected chemicals of concern ............................................................................. 12
3. Methods .......................................................................................................................... 13
3.1. Sample frame .......................................................................................................... 13
3.2. Ethical considerations ............................................................................................ 13
3.3. Fieldwork .................................................................................................................. 14
3.3.1 Invitation................................................................................................................ 14
3.3.2 Questionnaire ....................................................................................................... 15
3.3.3 Blood collection ................................................................................................... 15
3.3.4 Urine collection .................................................................................................... 16
3.4. Laboratory analyses ............................................................................................... 17
3.4.1. Blood lead ......................................................................................................... 17
3.4.2. Blood mercury .................................................................................................. 17
3.4.3. Urinary arsenic ................................................................................................. 17
3.4.4. Urinary cadmium ............................................................................................. 18
3.4.5. Urinary chromium ............................................................................................ 18
3.4.6. Urinary thallium ................................................................................................ 18
3.4.7. Urinary antimony ............................................................................................. 19
3.4.8. Urinary cotinine ................................................................................................ 19
3.4.9. Urinary fluoride ................................................................................................ 19
3.4.10. Urinary phenols ............................................................................................ 20
3.4.11. Urinary phthalate metabolites .................................................................... 20
3.4.12. Urinary creatinine ........................................................................................ 20
3.4.13. Urinary specific gravity ................................................................................ 20
3.5. Statistical analyses ................................................................................................. 21
4. Results ............................................................................................................................ 22
4.1. Study population ..................................................................................................... 22
4.2. Results by chemical ............................................................................................... 25
4.2.1. Blood lead ......................................................................................................... 26
4.2.2. Blood mercury .................................................................................................. 28
4.2.3. Urinary arsenic ................................................................................................. 30
4.2.4. Urinary cadmium ............................................................................................. 36
4.2.5. Urinary chromium ............................................................................................ 38

4 | P a g e
4.2.6. Urinary thallium ................................................................................................ 40
4.2.7. Urinary antimony ............................................................................................. 42
4.2.8. Urinary cotinine ................................................................................................ 44
4.2.9. Urinary fluoride ................................................................................................ 46
4.2.10. Urinary phenols ............................................................................................ 48
4.2.11. Urinary phthalate metabolites .................................................................... 61
5. Comparison with other countries ................................................................................ 75
5.1 International comparison blood lead ....................................................................... 77
5.2 International comparison blood mercury ................................................................. 78
5.3 International comparison urinary arsenic ................................................................ 79
5.4 International comparison urinary cadmium ............................................................ 81
5.5 International comparison urinary chromium ........................................................... 82
5.6 International comparison urinary thallium ............................................................... 83
5.7 International comparison urinary antimony ............................................................ 84
5.8 International comparison urinary cotinine ............................................................... 85
5.9 International comparison urinary fluoride ............................................................... 85
5.10 International comparison urinary phenols ............................................................ 86
5.11 International comparison urinary phthalate metabolites .................................... 94
6. Reference values and upper reference limits ......................................................... 103
7. Recommendations for future biological monitoring of selected chemicals of concern ................................................................................................................................. 109
8. Discussion .................................................................................................................... 112
9. Conclusions .................................................................................................................. 114
10. References ................................................................................................................ 123
Appendix 1. Study materials .............................................................................................. 132
Appendix 2. Conversion factors ........................................................................................ 155
Appendix 3. Results for creatinine and specific gravity ................................................. 156
5 | P a g e
LIST OF TABLES
TABLE 1. CHEMICALS INCLUDED IN THE BIOMONITORING PROGRAMME .............................................................. 12 TABLE 2. NUMBER OF ADULT BLOOD SAMPLES AVAILABLE IN THE BIOMONITORING PROGRAMME 2014-2016 22 TABLE 3. NUMBER OF ADULT URINE SAMPLES AVAILABLE IN THE BIOMONITORING PROGRAMME 2014-2016 .. 23 TABLE 4. NUMBER OF CHILD BLOOD SAMPLES AVAILABLE IN THE BIOMONITORING PROGRAMME 2014-2016 . 24 TABLE 5. NUMBER OF CHILD URINE SAMPLES AVAILABLE IN THE BIOMONITORING PROGRAMME 2014-2016 ... 24 TABLE 6A. GEOMETRIC MEANS FOR BLOOD LEAD, ADULTS. ................................................................................ 27 TABLE 6B. GEOMETRIC MEANS FOR BLOOD LEAD, CHILDREN. ............................................................................ 27 TABLE 7A. GEOMETRIC MEANS FOR BLOOD MERCURY, ADULTS. ........................................................................ 29 TABLE 7B. GEOMETRIC MEANS FOR BLOOD MERCURY, CHILDREN. .................................................................... 29 TABLE 8A. GEOMETRIC MEANS FOR TOTAL INORGANIC ARSENIC (DMA+MMA+ASIII+ASV), ADULTS. ............ 31 TABLE 8B. GEOMETRIC MEANS FOR TOTAL INORGANIC ARSENIC (DMA+MMA+ASIII+ASV), CHILDREN. ........ 31 TABLE 9A. GEOMETRIC MEANS FOR URINARY DIMETHYLARSINIC ACID (DMA), ADULTS. ................................... 32 TABLE 9B. GEOMETRIC MEANS FOR URINARY DIMETHYLARSINIC ACID (DMA), CHILDREN................................. 32 TABLE 10A. GEOMETRIC MEANS FOR URINARY MONOMETHYLARSONIC ACID (MMA), ADULTS. GMS BASED ON
DETECTED VALUES ONLY. ........................................................................................................................... 33 TABLE 10B. GEOMETRIC MEANS FOR URINARY MONOMETHYLARSONIC ACID (MMA), CHILDREN. GMS BASED
ON DETECTED VALUES ONLY. ...................................................................................................................... 33 TABLE 11A. GEOMETRIC MEANS FOR URINARY ORGANIC ARSENIC ARSENOBETAINE (AB), ADULTS. ................ 35 TABLE 11B. GEOMETRIC MEANS FOR URINARY ORGANIC ARSENIC ARSENOBETAINE (AB), CHILDREN. ............. 35 TABLE 12A. GEOMETRIC MEANS FOR URINARY CADMIUM, ADULTS. .................................................................... 37 TABLE 12B. GEOMETRIC MEANS FOR URINARY CADMIUM, CHILDREN. ................................................................ 37 TABLE 13A. GEOMETRIC MEANS FOR URINARY CHROMIUM, ADULTS. ................................................................. 39 TABLE 13B. GEOMETRIC MEANS FOR URINARY CHROMIUM, CHILDREN. ............................................................. 39 TABLE 14A. GEOMETRIC MEANS FOR URINARY THALLIUM, ADULTS. ................................................................... 41 TABLE 14B. GEOMETRIC MEANS FOR URINARY THALLIUM, CHILDREN. ............................................................... 41 TABLE 15A. GEOMETRIC MEANS FOR URINARY ANTIMONY, ADULTS. .................................................................. 43 TABLE 15B. GEOMETRIC MEANS FOR URINARY ANTIMONY, CHILDREN. .............................................................. 43 TABLE 16A. GEOMETRIC MEANS FOR URINARY COTININE, ADULTS. THE GMS ARE BASED ON >LOD VALUES
ONLY. ........................................................................................................................................................... 45 TABLE 16B. GEOMETRIC MEANS FOR URINARY COTININE, CHILDREN. THE GMS ARE BASED ON >LOD VALUES
ONLY. ........................................................................................................................................................... 45 TABLE 17A. GEOMETRIC MEANS FOR URINARY FLUORIDE, ADULTS. ................................................................... 47 TABLE 17B. GEOMETRIC MEANS FOR URINARY FLUORIDE, CHILDREN. ............................................................... 47 TABLE 18A. GEOMETRIC MEANS FOR URINARY BISPHENOL A, ADULTS. ............................................................. 49 TABLE 18B. GEOMETRIC MEANS FOR URINARY BISPHENOL A, CHILDREN. ......................................................... 49 TABLE 19A. GEOMETRIC MEANS FOR URINARY TRICLOSAN, ADULTS. ................................................................. 51 TABLE 19B. GEOMETRIC MEANS FOR URINARY TRICLOSAN, CHILDREN. ............................................................. 51 TABLE 20A. GEOMETRIC MEANS FOR URINARY BENZOPHENONE-3, ADULTS. ..................................................... 53 TABLE 20B. GEOMETRIC MEANS FOR URINARY BENZOPHENONE-3, CHILDREN. ................................................. 53 TABLE 21A. GEOMETRIC MEANS FOR URINARY METHYLPARABEN, ADULTS. ....................................................... 56 TABLE 21B. GEOMETRIC MEANS FOR URINARY METHYLPARABEN, CHILDREN. ................................................... 56 TABLE 22A. GEOMETRIC MEANS FOR URINARY N-PROPYLPARABEN, ADULTS. ................................................... 57 TABLE 22B. GEOMETRIC MEANS FOR URINARY N-PROPYLPARABEN, CHILDREN. ............................................... 57 TABLE 23A. GEOMETRIC MEANS FOR URINARY ETHYLPARABEN, ADULTS. ......................................................... 58 TABLE 23B. GEOMETRIC MEANS FOR URINARY ETHYLPARABEN, CHILDREN. ...................................................... 58 TABLE 24A. GEOMETRIC MEANS FOR URINARY BUTYLPARABEN, ADULTS. ......................................................... 59 TABLE 24B. GEOMETRIC MEANS FOR URINARY BUTYLPARABEN, CHILDREN. ...................................................... 59 TABLE 25A. GEOMETRIC MEANS FOR URINARY TOTAL PARABEN (METHYL+PROPYL+ETHYL+BUTYL), ADULTS. 60 TABLE 25B. GEOMETRIC MEANS FOR TOTAL PARABEN (METHYL+PROPYL+ETHYL+BUTYL), CHILDREN. ........... 60 TABLE 26. DETECTION FREQUENCY FOR URINARY MONOMETHYL PHTHALATE (MMP), CHILDREN. ................... 62 TABLE 27A. GEOMETRIC MEANS FOR URINARY MONOETHYL PHTHALATE (MEP), ADULTS. ................................ 63 TABLE 27B. GEOMETRIC MEANS FOR URINARY MONOETHYL PHTHALATE (MEP), CHILDREN. ............................ 63 TABLE 28A. GEOMETRIC MEANS FOR URINARY MONOBUTYL PHTHALATE (MBP, N+ISO), ADULTS. .................... 64 TABLE 28B. GEOMETRIC MEANS FOR URINARY MONOBUTYL PHTHALATE (MBP, N+ISO), CHILDREN. ................ 64 TABLE 29A. GEOMETRIC MEANS FOR URINARY MONOBENZYL PHTHALATE (MBZP), ADULTS............................. 65
6 | P a g e
TABLE 29B. GEOMETRIC MEANS FOR URINARY MONOBENZYL PHTHALATE (MBZP), CHILDREN. ........................ 66 TABLE 30A. GEOMETRIC MEANS FOR URINARY MONO-2-ETHYLHEXYL PHTHALATE (MEHP), ADULTS............... 67 TABLE 30B. GEOMETRIC MEANS FOR URINARY MONO-2-ETHYLHEXYL PHTHALATE (MEHP), CHILDREN. .......... 68 TABLE 31A. GEOMETRIC MEANS FOR URINARY MONO-(2-ETHYL-5-OXOHEXYL) PHTHALATE (MEOHP), ADULTS.
.................................................................................................................................................................... 68 TABLE 31B. GEOMETRIC MEANS FOR URINARY MONO-(2-ETHYL-5-OXOHEXYL) PHTHALATE (MEOHP),
CHILDREN. ................................................................................................................................................... 69 TABLE 32A. GEOMETRIC MEANS FOR URINARY MONO-(2-ETHYL-5-HYDROXYHEXYL) PHTHALATE (MEHHP),
ADULTS. ....................................................................................................................................................... 69 TABLE 32B. GEOMETRIC MEANS FOR URINARY MONO-(2-ETHYL-5-HYDROXYHEXYL) PHTHALATE (MEHHP),
CHILDREN. ................................................................................................................................................... 70 TABLE 33A. GEOMETRIC MEANS FOR THE SUM OF URINARY MEHP, MEOHP AND MEHHP, ADULTS (SUM-
DEHP). ....................................................................................................................................................... 70 TABLE 33B. GEOMETRIC MEANS FOR THE SUM OF URINARY MEHP, MEOHP AND MEHHP, CHILDREN. .......... 71 TABLE 34A. GEOMETRIC MEANS FOR URINARY MONO-(3-CARBOXYPROPYL) PHTHALATE (MCPP), ADULTS. ... 72 TABLE 34B. GEOMETRIC MEANS FOR URINARY MONO-(3-CARBOXYPROPYL) PHTHALATE (MCPP), CHILDREN. 72 TABLE 35. GEOMETRIC MEANS (ΜG/L) OF PHTHALATE METABOLITES BY AGE GROUP. ...................................... 73 FIGURE 1. GEOMETRIC MEANS (ΜG/L) OF PHTHALATE METABOLITES BY AGE GROUP. ...................................... 74 TABLE 36. COMPARISON OF POPULATION GEOMETRIC MEANS OF BLOOD LEAD CONCENTRATIONS (µG/L),
REPORTED FOR DIFFERENT COUNTRIES ..................................................................................................... 77 TABLE 37. COMPARISON OF POPULATION GEOMETRIC MEANS OF BLOOD MERCURY CONCENTRATIONS (µG/L),
REPORTED FOR DIFFERENT COUNTRIES ..................................................................................................... 78 TABLE 38. COMPARISON OF POPULATION GEOMETRIC MEANS OF URINARY ARSENOBETAINE (AB)
CONCENTRATIONS (µG/L), REPORTED FOR DIFFERENT COUNTRIES .......................................................... 79 TABLE 39. COMPARISON OF POPULATION GEOMETRIC MEANS OF URINARY DIMETHYLARSINIC ACID (DMA)
CONCENTRATIONS (µG/L), REPORTED FOR DIFFERENT COUNTRIES .......................................................... 80 TABLE 40. COMPARISON OF POPULATION GEOMETRIC MEANS OF URINARY MONOMETHYL ARSONIC ACID
(MMA) CONCENTRATIONS (µG/L), REPORTED FOR DIFFERENT COUNTRIES ............................................. 80 TABLE 41. COMPARISON OF POPULATION GEOMETRIC MEANS OF URINARY CADMIUM CONCENTRATIONS (µG/L),
REPORTED FOR DIFFERENT COUNTRIES ..................................................................................................... 81 TABLE 42. COMPARISON OF POPULATION GEOMETRIC MEANS OF URINARY CHROMIUM CONCENTRATIONS
(µG/L), REPORTED FOR DIFFERENT COUNTRIES ......................................................................................... 82 TABLE 43. COMPARISON OF POPULATION GEOMETRIC MEANS OF URINARY THALLIUM CONCENTRATIONS (µG/L),
REPORTED FOR DIFFERENT COUNTRIES ..................................................................................................... 83 TABLE 44. COMPARISON OF POPULATION GEOMETRIC MEANS OF URINARY ANTIMONY CONCENTRATIONS
(µG/L), REPORTED FOR DIFFERENT COUNTRIES ......................................................................................... 84 TABLE 45. COMPARISON OF POPULATION GEOMETRIC MEANS OF URINARY FLUORIDE CONCENTRATIONS
(µG/L), REPORTED FOR DIFFERENT COUNTRIES ......................................................................................... 85 THE GMS FOR URINARY BPA CONCENTRATIONS FOR NEW ZEALAND ADULTS AND CHILDREN, AND THOSE
REPORTED FOR OTHER COUNTRIES, ARE LISTED IN TABLE 46. THIS TABLE INDICATES THAT NEW
ZEALAND LEVELS ARE COMPARABLE TO THOSE THAT HAVE BEEN REPORTED FOR THE US AND CANADA, BUT THAT THE MOST RECENT GMS REPORTED FOR US AND CANADA ARE BELOW THOSE OF NEW
ZEALAND. .................................................................................................................................................... 86 TABLE 46. COMPARISON OF POPULATION GEOMETRIC MEANS OF URINARY BISPHENOL A CONCENTRATIONS
(µG/L), REPORTED FOR DIFFERENT COUNTRIES ......................................................................................... 86 TABLE 47. COMPARISON OF POPULATION GEOMETRIC MEANS OF URINARY TRICLOSAN CONCENTRATIONS
(µG/L), REPORTED FOR DIFFERENT COUNTRIES ......................................................................................... 87 TABLE 48. COMPARISON OF POPULATION GEOMETRIC MEANS OF URINARY BENZOPHENONE-3
CONCENTRATIONS (µG/L), REPORTED FOR DIFFERENT COUNTRIES .......................................................... 88 TABLE 49. COMPARISON OF POPULATION GEOMETRIC MEANS OF URINARY 4-TERT-OCTYLPHENOL
CONCENTRATIONS (µG/L), REPORTED FOR DIFFERENT COUNTRIES .......................................................... 89 TABLE 52. COMPARISON OF POPULATION GEOMETRIC MEANS OF URINARY METHYLPARABEN CONCENTRATIONS
(µG/L), REPORTED FOR DIFFERENT COUNTRIES ......................................................................................... 90 TABLE 53. COMPARISON OF POPULATION GEOMETRIC MEANS OF URINARY N-PROPYLPARABEN
CONCENTRATIONS (µG/L), REPORTED FOR DIFFERENT COUNTRIES .......................................................... 91 TABLE 54. COMPARISON OF POPULATION GEOMETRIC MEANS OF URINARY ETHYLPARABEN CONCENTRATIONS
(µG/L), REPORTED FOR DIFFERENT COUNTRIES ......................................................................................... 92
7 | P a g e
TABLE 55. COMPARISON OF POPULATION GEOMETRIC MEANS OF URINARY BUTYLPARABEN CONCENTRATIONS
(µG/L), REPORTED FOR DIFFERENT COUNTRIES ......................................................................................... 93 TABLE 54. COMPARISON OF POPULATION GEOMETRIC MEANS OF URINARY MONOMETHYL PHTHALATE (MMP)
CONCENTRATIONS (µG/L), REPORTED FOR DIFFERENT COUNTRIES .......................................................... 94 TABLE 55. COMPARISON OF POPULATION GEOMETRIC MEANS OF URINARY MONOETHYL PHTHALATE (MEP)
CONCENTRATIONS (µG/L), REPORTED FOR DIFFERENT COUNTRIES .......................................................... 95 TABLE 56. COMPARISON OF POPULATION GEOMETRIC MEANS OF URINARY MONOBUTYL PHTHALATE (MBP)
(MONO-N-BUTYL PHTHALATE (MNBP)+ MONO-ISO-BUTYL PHTHALATE (MIBP)) CONCENTRATIONS (µG/L),
REPORTED FOR DIFFERENT COUNTRIES ..................................................................................................... 96 TABLE 57. COMPARISON OF POPULATION GEOMETRIC MEANS OF URINARY MONOBENZYL PHTHALATE (MBZP)
CONCENTRATIONS (µG/L), REPORTED FOR DIFFERENT COUNTRIES .......................................................... 97 TABLE 58. COMPARISON OF POPULATION GEOMETRIC MEANS OF URINARY MONO-2-ETHYLHEXYL PHTHALATE
(MEHP) CONCENTRATIONS (µG/L), REPORTED FOR DIFFERENT COUNTRIES ............................................ 98 TABLE 59. COMPARISON OF POPULATION GEOMETRIC MEANS OF URINARY MONO-(2-ETHYL-5-OXOHEXYL)
PHTHALATE (MEOHP) CONCENTRATIONS (µG/L), REPORTED FOR DIFFERENT COUNTRIES ..................... 99 TABLE 60. COMPARISON OF POPULATION GEOMETRIC MEANS OF URINARY MONO-(2-ETHYL-5-HYDROXYHEXYL)
PHTHALATE (MEHHP) CONCENTRATIONS (µG/L), REPORTED FOR DIFFERENT COUNTRIES ................... 100 TABLE 61. COMPARISON OF POPULATION GEOMETRIC MEANS OF URINARY MONO-CYCLOHEXYL PHTHALATE
(MCHP) CONCENTRATIONS (µG/L), REPORTED FOR DIFFERENT COUNTRIES ......................................... 101 TABLE 62. COMPARISON OF POPULATION GEOMETRIC MEANS OF URINARY MONO-(3-CARBOXYPROPYL)
PHTHALATE (MCPP) CONCENTRATIONS (µG/L), REPORTED FOR DIFFERENT COUNTRIES ...................... 101 TABLE 63. COMPARISON OF POPULATION GEOMETRIC MEANS OF URINARY MONO-ISO-NONYL PHTHALATE
(MINP) CONCENTRATIONS (µG/L), REPORTED FOR DIFFERENT COUNTRIES ........................................... 102 TABLE 63A. REFERENCE VALUES AND UPPER REFERENCE LIMITS (URL) FOR METALS, METALLOIDS AND
FLUORIDE FOR ADULT NEW ZEALANDERS (AGE 19-65) ........................................................................... 103 TABLE 63B. REFERENCE VALUES AND UPPER REFERENCE LIMITS (URL) FOR METALS, METALLOIDS AND
FLUORIDE FOR NEW ZEALAND CHILDREN (AGE 5-18) .............................................................................. 104 TABLE 64A. REFERENCE VALUES AND UPPER REFERENCE LIMITS (URL) FOR PHENOLS FOR ADULT NEW
ZEALANDERS (AGE 19-65)........................................................................................................................ 107 TABLE 64B. REFERENCE VALUES AND UPPER REFERENCE LIMITS (URL) FOR PHENOLS FOR NEW ZEALAND
CHILDREN (AGE 5-18) ............................................................................................................................... 107 TABLE 65A. REFERENCE VALUES AND UPPER REFERENCE LIMITS (URL) FOR PHTHALATE METABOLITES FOR
ADULT NEW ZEALANDERS (AGE 19-65) ................................................................................................... 108 TABLE 65B. REFERENCE VALUES AND UPPER REFERENCE LIMITS (URL) FOR PHTHALATE METABOLITES FOR
NEW ZEALAND CHILDREN (AGE 5-18) ...................................................................................................... 108
8 | P a g e
1. Summary This report presents the results of the first comprehensive national biological monitoring programme for selected chemicals of concern in New Zealand. The programme aimed to provide New Zealand-specific data for the development of reference values for these chemicals in the general population. Biological samples were collected in 2014-2016 from 319 adults aged 19-64 who provided 304 urine samples and 304 blood samples, and 303 children aged 5-18 who provided 300 urine samples and 193 blood samples. In order to achieve a sample representative for the New Zealand population, participants were selected from all geographic regions, all age groups, both genders, and included both Māori and non-Māori. Blood samples were analysed for lead and mercury and urine samples were analysed for arsenic, cadmium, chromium, thallium, antimony, phenols, phthalate metabolites, cotinine and fluoride. The central tendency of the blood and urine concentrations of the selected chemicals in the study population are represented by the geometric mean. Individual concentrations are not reported. Geometric means and 95% confidence intervals of the blood and urinary concentrations are presented by gender, age group, ethnicity (Māori/non-Māori) and geographic region (Northland/Auckland, Waikato/Bay of Plenty, Lower North Island, South Island), and compared with the results from similar biological monitoring programmes recently conducted in other countries. For metals and metal compounds, the geometric means (GM) for adults and children respectively were: 13 µg/L and 8 µg/L for blood lead; 1.6 µg/L and 0.9 µg/L for blood mercury; 4.2 µg/L and 3.0 µg/L urine for the inorganic arsenic metabolite dimethylarsinic acid (DMA); 3.5 µg/L and 1.5 µg/L for the organic arsenic compound arsenobetaine (AB); 0.19 µg/L and 0.07 µg/L for cadmium; 0.05 µg/L and 0.03 µg/L for chromium; 0.20 µg/L and 0.05 µg/L for thallium; and 0.06 µg/L and 0.09 µg/L for antimony. With the exception of antimony, the geometric mean levels of all tested chemicals were highest for adults. For lead, mercury and cadmium positive associations with age were observed among adults. Inorganic arsenic and thallium showed geographic variation for both children and adults, with lowest levels observed for the South Island and highest for the North of the North Island. Urinary cotinine was detected in 11% of adults and 2% of children. Detection frequencies were significantly higher among Māori children (8% detected) compared to non-Māori children (0% detected) and among Māori adults (19% detected) compared to non-Māori adults (6% detected). The GM for urinary fluorine was 760 µg/L for adults and 630 µg/L for children. For both children and adults, the lowest mean urinary fluoride level was observed for the South Island. Bisphenol A (BPA), a phenolic chemical used as a monomer in polycarbonate plastics and epoxy resins, was detected in the urine samples of 93% of adults and 89% of children. The geometric mean urinary BPA concentration was 1.8 µg/L for adults and 2.2 µg/L for children. BPA concentrations differed by age group, with the highest GM observed for the 19-24 year age group (2.9 µg/L) and the lowest for the 50-64 age group (1.4 µg/L).

9 | P a g e
Triclosan, an antibacterial agent used in consumer products such as hand wash, was detected in the urine samples of 85% of adults and 92% of children, at a geometric mean concentration of 4.8 µg/L for adults and 3.9 µg/L for children. The GM of urinary triclosan was more than two times higher for non-Māori children compared to Māori children. Benzophenone-3 (BP-3), used in personal care products such as sunscreens to absorb and dissipate ultraviolet (UV) radiation, was detected in the urine samples of 100% of adults and children, with a geometric mean of 18.4 µg/L for adults and 20.8 µg/L for children. For adults who had used sunscreen in the 48 hours before urine sampling, the GM for urinary BP-3 was 160 µg/L. BP-3 urinary concentrations were higher among females compared to males. For both adults and children, Māori had lower urinary BP-3 concentrations compared to non-Māori. Parabens, which are widely used as antimicrobial preservatives in cosmetics, pharmaceuticals, and food and beverage processing, were detected in all urine samples. The geometric mean concentration of the sum of the four parabens (methyl, propyl, ethyl, butyl) was 27.1 µg/L for adults and 17.7 µg/L for children. Methylparaben contributed most to the sum (GM 17.5 µg/L for adults and 11.9 µg/L for children), followed by n-propylparaben (GM 3.4 µg/L for adults and 2.1 µg/L for children), ethylparaben (GM 1.4 µg/L for adults and 0.7 µg/L for children). Paraben urinary concentrations were higher in women compared to men. Metabolites of phthalates, with their wide range of uses as plasticisers, solvents and additives in many consumer products including plastics, adhesives, pharmaceuticals and personal care products, were detected in all urine samples. The highest urinary concentrations were measured for monobutyl phthalate (mBP, n+iso), a metabolite of dibutyl phthalate (DBP, n+iso), with geometric means of 37 µg/L for adults and 61 µg/L for children. For the DEHP metabolites mEHP, mEOHP and mEHHP, also commonly used as plasticisers, the geometric means for adults and children were 2 and 3, 7 and 14, 9 and 18 µg/L, respectively. Urinary phthalate metabolite concentrations were typically highest for the youngest age groups. For mEP, a metabolite of DEP which is commonly used in personal care products, concentrations were positively associated with age, and higher for women compared to men. Comparing these New Zealand population based geometric means with the results from biological monitoring programmes recently conducted in other countries, indicated that New Zealand levels are in the same range as those observed for other countries. Upper reference limits (URLs) were calculated based on the 97.5th percentile of the distribution for adults and children, which can be used as the basis for developing New Zealand-specific notifiable levels and reference values, and help determine whether individuals have been exposed to levels higher than the general population. This biomonitoring programme also provides baseline levels of selected chemicals of concern in the New Zealand population allowing future temporal trends to be assessed.

10 | P a g e
2. Background
2.1. Introduction This report presents the results of the first comprehensive national biological monitoring programme for selected chemicals of concern in New Zealand. The programme was commissioned by the New Zealand Ministry of Health (on 10 September 2012) and conducted by Massey University’s Centre for Public Health Research (CPHR). Two analytical laboratories were subcontracted to complete the laboratory analyses of blood and urine samples. Biological monitoring is a proven approach to estimate population exposure for a range of environmental contaminants. In New Zealand, biological monitoring has proven effective in measuring concentrations of persistent organic pollutants (POPs) in serum and breast milk (Bates et al., 1994; Bates et al., 2001; Buckland et al., 2001; Mannetje et al., 2013). The programme described in this report is an expansion of these earlier studies with a specific focus on selected chemicals of concern in blood and urine of adults and children. The chemicals covered include metals and metalloids (lead, mercury, chromium, arsenic, cadmium, thallium, antimony), cotinine, fluoride, environmental phenols (e.g. bisphenol A, parabens), and phthalate metabolites. Biological samples (i.e. blood and urine) were collected in 2014-2016 The programme was designed to provide reference values for levels of chemicals of concern in the general New Zealand population of children aged 5-18 and adults aged 19-65. The programme also provides a benchmark for future biological monitoring to establish temporal trends and aimed to assess the relationship between blood/urine levels and age, geographic region, ethnicity and gender. This report describes the survey design, field work, analytical methods and results of the programme. Data tables are provided for each chemical, containing descriptive statistics on blood or urine concentrations in the sample population. Differences between age groups, gender, ethnicity (Māori and non-Māori) and geographic regions were assessed and comparisons were made with international biological monitoring programmes.

11 | P a g e
2.2. Aims The biological monitoring programme had the following specific aims: 1. To undertake a biological monitoring programme of selected substances of
concern (SoCs) in a cross-sectional survey of the New Zealand population including adults and children;
2. To establish baseline levels of SoCs in the New Zealand population to allow for future determination of temporal trends;
3. To compare the New Zealand SoCs levels with international levels; 4. To monitor the influence of gender, age, geographic region and ethnicity in
relation to the levels of SoCs in the New Zealand population; 5. To develop a robust methodology for adding or removing SoCs on a national
list; 6. To support the Protection Regulation and Assurance Business Unit deliver its
environmental and border health protection work programme in relation to hazardous substances.

12 | P a g e
2.3. Selected chemicals of concern The list of chemicals of concern included in the programme was primarily based on the chemicals that had been identified by the Ministry of Health in their Request for Proposals (RFP). Other considerations in the choice of chemicals included the available analytical methods, cost of specific tests or test suits, additional cost for specific analytes added to the analytical suite, and being able to directly compare results with other national and international surveys. Table 1 lists all the chemicals included in the biomonitoring programme.
Table 1. Chemicals included in the biomonitoring programme
matrix chemical group chemical specific analyte acronym
blood metals lead total lead Pb
mercury total mercury Hg
urine
arsenic organic arsenic (‘fish arsenic’):
arsenobetaine AB
arsenicals of inorganic arsenic origin:
dimethylarsinic acid (methylated metabolite of inorganic arsenic) DMA
monomethylarsonic acid (methylated metabolite of inorganic arsenic) MMA
arsenite AsIII
arsenate AsV
cadmium cadmium Cd
chromium chromium Cr
thallium thallium Tl
antimony antimony Sb
phenols phenols bisphenol A (2,2-bis[4-hydroxyphenyl] propane) BPA
triclosan (2,4,4’-trichloro-2’-hydroxyphenyl ether) TCS
benzophenone-3 BP-3
4-tert-octylphenol tOP
butyl parabens
ethyl parabens
methyl parabens
propyl parabens phthalates phthalate ester monomethyl phthalate mMP
metabolites monoethyl phthalate mEP
monobutyl phthalate (n+iso) mBP
monobenzyl phthalate mBzP
mono-2-ethylhexyl phthalate mEHP
mono-(2-ethyl-5-oxohexyl) phthalate mEOHP
mono-(2-ethyl-5-hydroxyhexyl) phthalate mEHHP
mono-cyclohexyl phthalate mCHP
mono-(3-carboxypropyl) phthalate mCPP
mono-iso-nonyl phthalate miNP
tobacco cotinine cotinine
fluoride fluoride fluoride F
-
other creatinine (for urinary volume adjustment)
specific gravity (for urinary volume adjustment)

13 | P a g e
3. Methods
3.1. Sample frame The biological monitoring programme included a cross-section of adult and school-age New Zealanders between the ages of 5 and 64 years. We used separate sampling frames for adults (aged 19-64) and children (aged 5-18) as detailed below. Selection of adults For the recruitment of adult participants the most recent (2014) New Zealand Electoral Roll was used. The 2014 Electoral Roll included an estimated 93% of the eligible New Zealand voting public (all New Zealand citizens or permanent residents age 18 years or older who lived in New Zealand for one year or more continuously at any stage) (Electoral Commission, 2015). In order to ensure representation from all demographic groups, the sample frame included randomly selected men and women in four age groups (i.e. 19-24, 25-34, 35-49, 50-64 year), from four geographic regions (Northland/Auckland, Waikato/Bay of Plenty, Lower North Island, South Island), and of Māori and non-Māori descent. The study aimed for a total of 300 participants with approximately equal numbers in each of the gender/age/geographical/ethnic sub-groups. Selection of children For the recruitment of children we contacted primary, intermediary and high schools located in the four selected geographic regions (Northland/Auckland, Waikato/Bay of Plenty, Lower North Island, South Island). Schools were selected to include children of ethnic diversity (e.g. mixed student body including European and Māori descent). While schools represented the main recruitment avenue, additional recruitment opportunities were also used including: (1) recruitment through already enrolled parents; (2) recruitment through an another study in children of the same age which was already collecting urine samples; (3) public events such as science fairs; and (4) sports clubs.
3.2. Ethical considerations The study protocol was evaluated by the Central Health and Disability Ethics Committee (14/CEN/44 Biological monitoring of selected chemicals of concern). On 05 May 2014 the application was approved by the Central Health and Disability Ethics Committee, through the HDEC-Expedited Review pathway.

14 | P a g e
3.3. Fieldwork
3.3.1 Invitation Contacting adult participants Individuals selected from the 2014 Electoral Roll were invited by mail to participate in the programme and were sent an invitation letter (Appendix 1 – Adult letter of invitation), information sheet (Appendix 1 – 3.3-Adult information sheet) and a reply form (Appendix 1 – 2.1-Adult Reply form). A short screening interview was conducted by phone before final study enrolment to determine eligibility, using the following exclusion criteria:
Medical conditions which would prevent providing a blood or urine sample
Non residency in New Zealand
If the subject was considered eligible they were sent the required instructions and materials for self-collecting a urine sample and attending a nearby pathology laboratory for the collection of a whole blood sample (Appendix 1 – 4.1-Adult Letter with instructions for sample collection; 5.1-Adult Instructions for urine collection; 6.1-Adult consent form; 7.1-Adult consent form for storage future use). Pre-paid postal packages, designed to keep the urine samples cold, were provided to the participants to send the sample to the Centre for Public Health Research (CPHR) in Wellington. Each participant was asked to complete a short questionnaire on potential sources of exposure to the chemicals in the study (Appendix 1 – 8.1-Adult questionnaire). Contacting the child participants Children in the 5-18 age range were contacted in different ways (see above), but the majority were contacted through the participating schools, initially by sending a letter to the school principal (Appendix 1 – 1.3-Children School invitation letter). If the school was interested in participating, this was followed by the inclusion of a news item about the study in their regular newsletters, and posted on the school’s notice board where possible. Depending on the specific requirements of each school, interested students and their parents were asked to talk to the school administrator to obtain information about the programme and the collection process (Appendix 1 – 1.2-Children invitation letter; 3.1-Children information sheet; 3.2-Children Parent information sheet; 2.2-Children Reply form). A short screening interview was conducted by phone before final study enrolment to determine eligibility, using the following exclusion criteria:
Medical conditions which would prevent giving a blood or urine sample
Non residency in New Zealand
If the child was considered eligible the parents were sent the required instructions and materials for self-collection of a urine sample and attending a nearby pathology laboratory for collection of a whole blood sample (Appendix 1 – 4.2-Child Letter with instructions for sample collection; 5.2-Children Instructions for urine collection; 6.2-Children consent form; 7.2-Children consent form for storage future use). Pre-paid postal packages, designed to keep urine samples cold, were provided to send the

15 | P a g e
sample to CPHR. Parents were also asked to complete a short questionnaire on potential sources of exposure of their children to the chemicals in the study (Appendix 1 – 8.2-Children questionnaire). Adult participants and parents of children were provided with a freepost envelope to return the completed consent forms and questionnaire to CPHR.
3.3.2 Questionnaire A questionnaire was used to collect information on a range of factors that have previously been shown to affect blood and urinary concentrations of the selected chemicals. This included information on lifestyle factors, living circumstances, diet and occupation. Participants were asked to complete the questionnaire within two weeks before or after sample collection. Adult questionnaire A copy of the adult questionnaire is included in Appendix 1 (8.1-Adult questionnaire). It includes questions on demographics (e.g. ethnicity, education, height and weight), lifestyle factors (e.g. smoking, alcohol, sunscreen use), dwelling (e.g. age, location, type of water supply), diet, some health related issues that may affect exposure (e.g. metallic dental fillings, menopause), and occupation. The questionnaire was designed to take no more than 15 minutes. Parent questionnaire A copy of the parent questionnaire (about the child) is included in Appendix 1 (8.2-Children questionnaire). It includes questions on demographics (e.g. ethnicity, place of birth), some lifestyle factors (e.g. smokers in the household, use of sunscreen lotions), primary dwelling (e.g. age, location, type of water supply), diet, and health related issues (e.g. metallic dental fillings). The questionnaire was completed by a parent or primary caregiver and was designed to take no more than 15 minutes.
3.3.3 Blood collection Blood samples were collected between September 2014 and December 2016. Samples were taken by a trained phlebotomist at a private pathology laboratory, medical clinic, or at the school (in the case of some children). Blood was collected in 10 mL K2EDTA-containing plastic vacutainer blood collection tubes (royal blue tops) using standard venipuncture methods. Collected blood samples were held frozen (-20OC) by the pathology laboratory until they were sent to CPHR in frozen containers. The following sections provide specific blood collection procedures for the adult and child participants.
16 | P a g e
Sample collection adults Blood samples from adults (a maximum of 3 x 10 mL vacutainers) were collected at a local pathology laboratory. Adult participants were offered a $20 MTA gift voucher to assist with transport costs. The pathology laboratory personnel and the adult participant completed a form (Appendix 1 – 9.1-Adult clinical form) during the participant’s visit which included questions relevant to short-term exposure. The adult participants completed two separate consent forms (Appendix 1 - 6.1-Adult consent form; 7.1-Adult consent form storage future use). Sample collection children Blood samples from children (a maximum of 2 x 10 mL vacutainers) were collected at a local pathology laboratory (i.e. a local venue that was convenient for the children and their parents to attend), at a local medical clinic, or in some cases during a collection day at the participating schools. The phlebotomist and the child’s parent completed a form (Appendix 1 – 9.2-Children clinical form) during the child’s visit which included questions relevant to short-term exposure. The parents completed two separate consent forms (Appendix 1 – 6.2-Children consent form; 7.2-Children consent form storage future use).
3.3.4 Urine collection For both children and adults first-void morning urine samples were self-collected at the home into 60 mL sterile, pre-labelled polypropylene urine collection containers following the instructions as outlined in the instructions (appendix 1- 5.1 and 5.2). Urine samples were sent to CPHR on the day of collection, or were stored in the participant’s home freezer (-20OC) until they were sent to CPHR using a pre-paid postal package, designed to keep samples cold during transit.
17 | P a g e
3.4. Laboratory analyses All blood and urine samples from each individual participant were shipped on dry ice to Canterbury Health Laboratories (CHL) in Christchurch (www.chl.co.nz/) which was subcontracted to conduct the analyses for metals and metalloids, cotinine, fluoride, creatinine and specific gravity. These analyses were completed between May 2016 and June 2017. Sample aliquoting was conducted at CHL after which urine aliquots were shipped on dry ice to Axys Analytical Services in Sidney, Canada (www.axysanalytical.com/), which was subcontracted to conduct the analyses for phenols and phthalates, as this capacity was not available in New Zealand based laboratories. The analyses for phenols and phthalates were completed between March 2017 and September 2017.
3.4.1. Blood lead Lead concentrations in whole blood were determined using Inductively Coupled Mass spectroscopy (ICP-MS). Blood samples were diluted in an ammonia EDTA solution, aspirated into an argon plasma torch at 2700°C for ion formation. The ions were focused into an octopole reaction system and collided with helium gas. The ions then passed into the quadrupole for detection by the electron multiplier. Equipment: Agilent ICP. LLOD (lower limit of detection): 0.041 µg/L. External QC (quality control): RCPA Quality Assurance Programs. Internal QC: Lyphochek metal control.
3.4.2. Blood mercury Mercury concentrations in whole blood were determined using ICP-MS. Blood samples were diluted in an ammonia EDTA solution, aspirated into an argon plasma torch at 2700°C for ion formation. The ions were focused into an octopole reaction system and collided with Helium gas. The ions then passed into the quadrupole for detection by the electron multiplier. Equipment: Agilent ICP. LLOD: 1.003 µg/L. Concentrations between 0.2 µg/L and 1.003 µg/L were detectable and used in calculating the geometric means for the study population, but were marked as ‘not detected’ by the analytical laboratory in the analytical results print-out sent to the participants. In the calculations of the geometric mean, a blood mercury concentration of ½*0.2 µg/L was assumed if not detectable. External QC (quality control): RCPA Quality Assurance Programs. Internal QC: Lyphochek metal control.
3.4.3. Urinary arsenic Concentrations of arsenic forms in urine were determined using HPLC-ICP-MS. Urine samples were diluted in an ammonia EDTA solution, aspirated into an argon plasma torch at 2700°C for ion formation. The ions were focused into an octopole reaction system and collided with Helium gas. The ions then passed into the quadrupole for detection by the electron multiplier. Equipment: Agilent ICP. LLOD:

18 | P a g e
0.1 µg/L (for Arsenate, arsenobetaine, arsenocholine, DMA, MMA). A urinary concentration of ½*0.1 µg/L was assumed if not detectable. External QC (quality control): RCPA Quality Assurance Programs. Internal QC: Lyphochek metal control.
3.4.4. Urinary cadmium Cadmium concentrations in urine were determined using ICP-MS. Urine samples were diluted in an ammonia EDTA solution, aspirated into an argon plasma torch at 2700°C for ion formation. The ions were focused into an octopole reaction system and collided with Helium gas. The ions then passed into the quadrupole for detection by the electron multiplier. Equipment: Agilent ICP. LLOD: 0.079 µg/L. A blood urinary concentration of ½*0.079 µg/L was assumed if not detectable. External QC (quality control): RCPA Quality Assurance Programs. Internal QC: Lyphochek metal control.
3.4.5. Urinary chromium Chromium concentrations in urine were determined using ICP-MS. Urine samples were diluted in an ammonia EDTA solution, aspirated into an argon plasma torch at 2700°C for ion formation. The ions were focused into an octopole reaction system and collided with Helium gas. The ions then passed into the quadrupole for detection by the electron multiplier. Equipment: Agilent ICP. LLOD: 0.104 µg/L. Concentrations between 0.02 µg/L and 0.104 µg/L were detectable and used in calculating the geometric means for the study population, but were marked as ‘not detected’ by the analytical laboratory in the analytical results print-out sent to the participants. In the calculations of the geometric mean, a urinary chromium concentration of ½*0.02 µg/L was assumed if not detectable. External QC (quality control): RCPA Quality Assurance Programs. Internal QC: Lyphochek metal control.
3.4.6. Urinary thallium Thallium concentrations in urine were determined using ICP-MS. Urine samples were diluted in an ammonia EDTA solution, aspirated into an argon plasma torch at 2700°C for ion formation. The ions were focused into an octopole reaction system and collided with Helium gas. The ions then passed into the quadrupole for detection by the electron multiplier. Equipment: Agilent ICP. LLOD: 0.1 µg/L. Concentrations between 0.02 µg/L and 0.1 µg/L were detectable and used in calculating the geometric means for the study population, but were marked as ‘not detected’ by the analytical laboratory in the analytical results print-out sent to the participants. In the calculations of the geometric mean, a urinary thallium concentration of ½*0.02 µg/L was assumed if not detectable. External QC (quality control): RCPA Quality Assurance Programs. Internal QC: Lyphochek metal control
19 | P a g e
3.4.7. Urinary antimony Antimony concentrations in urine were determined using ICP-MS. Urine samples were diluted in an ammonia EDTA solution, aspirated into an argon plasma torch at 2700°C for ion formation. The ions were focused into an octopole reaction system and collided with Helium gas. The ions then passed into the quadrupole for detection by the electron multiplier. Equipment: Agilent ICP. LLOD: 0.1 µg/L. Concentrations between 0.02 µg/L and 0.1 µg/L were detectable and used in calculating the geometric means for the study population, but were marked as ‘not detected’ by the analytical laboratory in the analytical results print-out sent to the participants. In the calculations of the geometric mean, a urine antimony concentration of ½*0.02 µg/L was assumed if not detectable. External QC (quality control): RCPA Quality Assurance Programs. Internal QC: Lyphochek metal control.
3.4.8. Urinary cotinine Cotinine concentrations in urine were determined using LC-MS: Liquid chromatography–mass spectrometry. Urine samples were diluted with a deuterated cotinine internal standard. Equipment: SCIX 3200. LLOD: 0.5 µg/L. External QC (quality control): not applicable. Internal QC: in-house.
3.4.9. Urinary fluoride Fluoride concentrations in urine were determined using ISE: Ion Selective electrode. The urine samples were mixed with a buffer and the free fluoride concentration was measured by a single crystal lanthanum-fluoride membrane electrode. LLOD: 19 µg/L. External QC (quality control): water Chek. Internal QC: Lyphochek metal control.
20 | P a g e
3.4.10. Urinary phenols Phenolics concentrations in urine were determined using LC-MS/MS: Liquid chromatography tandem-mass spectrometry. Limit of detection (LOD): BPA 0.4 µg/L triclosan 0.4 µg/L benzophenone-3 0.2 µg/L 4-tert-octylphenol 0.2 µg/L methylparabens 0.08 µg/L ethylparabens 0.08 µg/L propylparabens 0.08 µg/L butylparabens 0.08 µg/L
3.4.11. Urinary phthalate metabolites Phthalate metabolite concentrations in urine were determined using LC-MS/MS: Liquid chromatography tandem-mass spectrometry. Axys method: MLA-059. MDL (Method Detection Limit) protocol: Federal Register 40 CFR Part 136, Appendix B, no iteration. Limit of detection (LOD): monomethyl phthalate (mMP) 1 µg/L monoethyl phthalate (mEP) 2 µg/L monobutyl phthalate (mBP) 1 µg/L monobenzyl phthalate (mBzP) 1 µg/L mono-2-ethylhexyl phthalate (mEHP) 1 µg/L mono-(2-ethyl-5-oxohexyl) phthalate (mEOHP) 1 µg/L mono-(2-ethyl-5-hydroxyhexyl) phthalate (mEHHP) 1 µg/L mono-cyclohexyl phthalate (mCHP) 1 µg/L mono-(3-carboxypropyl) phthalate (mCPP) 2 µg/L mono-iso-nonyl phthalate (miNP) 1 µg/L
3.4.12. Urinary creatinine Creatinine in urine was determined using ABBOTT 8200. Creatinine was measured using the colorimetric end-point Jaffe method. LLOD: not applicable. External QC (quality control): RCPA Quality Assurance Programs. Internal QC: Biorad.
3.4.13. Urinary specific gravity The specific gravity of the urine samples was determined with a refractometer. LLOD (lower limit of detection): not applicable. External QC (quality control): not applicable. Internal QC: not applicable.

21 | P a g e
3.5. Statistical analyses Data were imported from MS Access and MS Excel into SAS analytical software. Blood concentrations were expressed as µg/L blood. Urine concentrations were expressed as µg/L urine, as well as µg/g creatinine and µg/L urine adjusted for specific gravity. Appendix 2 includes the molar weight to allow levels to be converted to µmol/L. Geometric means (GM) of the blood and urine concentrations, the GM’s 95% confidence interval, and the 95th percentile, were calculated for adults and children. GMs were also calculated separately by age group, gender, ethnicity (Māori/non-Māori) and geographic region. Levels below the limit of detection were set to half the limit of detected as specified in paragraph 3.4., and used in the calculation of the GM. If the detection frequency was less than 33%, summary statistics including the samples below the limit of detection are not presented. Adjustment of urinary concentrations The survey used spot urine samples rather that 24-hour urine voids for practical reasons. Spot urine samples are subject to the variability in the volume of urine and the differential dilution of endogenous and exogenous chemicals from void to void. The best method to adjust the urinary concentrations of environmental chemicals for urinary dilution remains a subject of debate (Barr et al., 2005; Hoet et al., 2016). Urinary creatinine is a chemical by-product generated from muscle metabolism. Its production and excretion are considered to be relatively constant over 24 hours, and many biomonitoring studies have therefore used systematic creatinine adjustment of urinary concentrations of biomarkers. However, more recently is has been proposed that creatinine adjustment carries the risk of over-adjustment (Hoet et al., 2016) and an alternative method of specific gravity adjustment has been proposed (Hoet et al., 2016). A urine specific gravity test compares the specific gravity of urine to the density of water. Urinary concentrations were adjusted to the specific gravity of 1.018 (study mean) using the below formula (Sorahan et al., 2008): Urine concentration (individual’s urine concentrations adjusted for specific gravity)= (individual’s measured concentration) * (1.018-1) / (individual’s measured specific gravity-1). In this report urinary concentrations are presented unadjusted (µg/L) in first instance. In addition, two ways to adjust for the effect of urinary dilution are used and presented in the results: (1) urinary concentrations adjusted for urinary creatinine and expressed as µg/g creatinine; (2) urinary concentrations adjusted for specific gravity expressed as µg/L. Urine samples were not excluded based on the creatinine or specific gravity measurements. The results for the study population’s urinary creatinine concentrations and specific gravity are provided in appendix 3. Comparison of concentrations between demographic groups Geometric means of the blood and urine concentrations are presented by age, ethnicity, gender and geographic region. To evaluate whether differences in geometric means between groups are statistically significant, general linear regression was used involving the 4 categorical variables for demographic factors (age-group, sex, ethnicity, geographic region) as independent variables with the log-transformed blood or urine concentration as the dependent variable. The R2 was used as an indication of the variance in the log-transformed blood or urine concentrations explained by the 4 independent variables. A low p-value (<0.05) was used as an indicator of the variable’s association with the dependent variable.

22 | P a g e
4. Results
4.1. Study population Adults A total of 5908 invitations were posted to addresses on the Electoral Roll. For 4058 we had no response after additional attempts to contact people by phone. Contact by phone was only possible for 1428 individuals, for whom phone numbers could be identified. Of the 1859 invited individuals for whom a response was received, 228 were returned to sender, 672 refused participation, 441 were not eligible (did not have a phone, no longer living in New Zealand, illness or impairment or deceased). A total of 518 adults were interested in the study, of which 319 participated in the study. Of the 319 adult participants, 304 provided a blood sample and 304 provided a urine sample (Table 2 and 3).
Table 2. Number of adult blood samples available in the biomonitoring programme 2014-2016
Age Group
Gender Ethnicity
Group Northland/ Auckland
Waikato/Bay of Plenty
Lower North Island
South Island
total
19-24
male Māori 1 2 2 1 6
Non-Māori 4 6 5 1 16
female Māori 3 4 1 2 10
Non-Māori 7 6 2 5 20
25-34
male Māori 3 2 4 3 12
Non-Māori 5 7 4 3 19
female Māori 0 2 5 4 11
Non-Māori 7 8 3 4 22
35-49
male Māori 4 4 3 4 15
Non-Māori 4 6 7 9 26
female Māori 3 7 4 6 20
Non-Māori 4 6 7 7 24
50-64
male Māori 6 2 4 5 17
Non-Māori 5 6 8 10 29
female Māori 5 5 6 5 21
Non-Māori 4 12 14 6 36
total 65 85 79 75 304

23 | P a g e
Table 3. Number of adult urine samples available in the biomonitoring programme 2014-2016
Age Group
Gender Ethnicity
group Northland/ Auckland
Waikato/Bay of Plenty
Lower North Island
South Island
total
19-24
male Māori 1 2 1 1 5
Non-Māori 4 6 6 2 18
female Māori 3 4 1 2 10
Non-Māori 7 6 3 4 20
25-34
male Māori 3 2 5 4 14
Non-Māori 5 7 3 3 18
female Māori 1 2 5 4 12
Non-Māori 7 7 3 4 21
35-49
male Māori 4 3 3 4 14
Non-Māori 3 6 5 9 23
female Māori 4 7 5 6 22
Non-Māori 4 6 8 6 24
50-64
male Māori 6 3 4 5 18
Non-Māori 6 6 8 10 30
female Māori 5 5 5 5 20
Non-Māori 4 12 13 6 35
total 67 84 78 75 304
Children A total of 150 schools were invited to participate in the study of which 40 replied positively and placed information of the study in their newsletter. A total of 113 children were recruited through schools. In addition, 47 children were recruited through enrolled parents and 145 through other ways, mainly through another study in school children for which urine samples were also being collected (for the purpose of measuring pesticide metabolites). In total, 303 children participated in the study, of which 193 provided a blood sample and 300 provided a urine sample (Table 4 and 5).

24 | P a g e
Table 4. Number of child blood samples available in the biomonitoring programme 2014-2016
Age Group
Gender Ethnicity
group Northland/ Auckland
Waikato/Bay of Plenty
Lower North Island
South Island
total
5-7
male Māori 3 1 1 0 5
Non-Māori 2 5 3 5 15
female Māori 1 1 7 0 9
Non-Māori 1 2 5 1 9
8-10
male Māori 3 3 0 0 6
Non-Māori 4 4 15 7 30
female Māori 1 1 7 0 9
Non-Māori 1 1 17 6 25
11-17
male Māori 3 3 4 0 10
Non-Māori 8 5 13 3 29
female Māori 5 2 3 0 10
Non-Māori 10 8 15 3 36
total 42 36 90 25 193
Table 5. Number of child urine samples available in the biomonitoring programme 2014-2016
Age Group
Gender Ethnicity
group Northland/ Auckland
Waikato/Bay of Plenty
Lower North Island
South Island total
5-7
male Māori 3 3 3 0 9
Non-Māori 4 5 8 5 22
female Māori 2 1 12 0 15
Non-Māori 1 2 13 2 18
8-10
male Māori 3 5 7 0 15
Non-Māori 4 5 33 8 50
female Māori 1 3 13 0 17
Non-Māori 2 1 27 8 38
11-17
male Māori 3 4 5 0 12
Non-Māori 8 7 17 4 36
female Māori 7 3 9 0 19
Non-Māori 12 9 25 3 49
total 50 48 172 30 300
25 | P a g e
4.2. Results by chemical The sections below provide a short background section for each chemical. This is followed by tables with geometric means (GM) and 95% confidence interval (95%CI) of the levels measured in blood and urine of the adult and child study populations, stratified by age, sex, ethnicity and study region. The R2 indicates how much of the variance in the log transformed blood or urine concentration is explained by age-group, gender, ethnicity and geographic region. A p-value below 0.05 indicates that the variable is a statistically significant determinant of the blood/urine concentration in the study population.
26 | P a g e
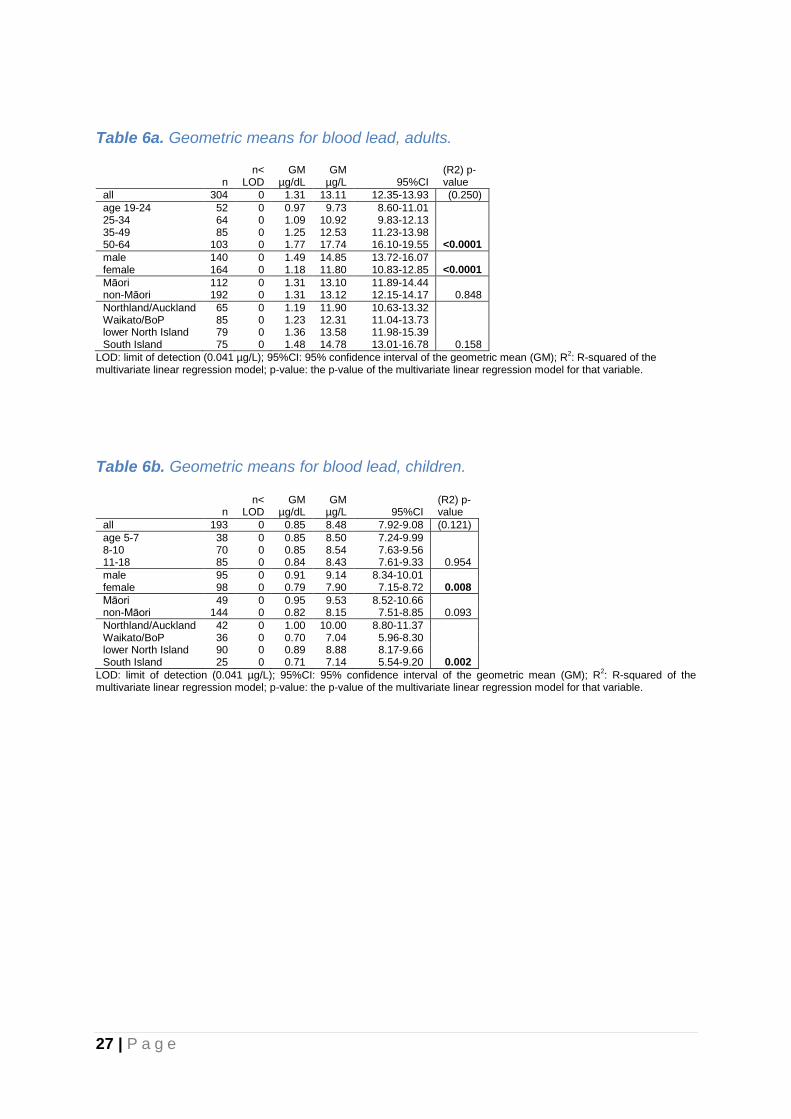
4.2.1. Blood lead Elemental lead occurs naturally in rocks and soils and is mined from ores or recycled from scrap metal and batteries. Lead is used in a number of applications ranging from solders, glass, ammunition, and radiation shielding. Lead was previously used in plumbing materials and there may be remaining lead in existing household plumbing. Humans are exposed to lead via inhalation or ingestion of lead from historical contamination (e.g. roadside dust, deteriorated lead-based paint). Before the phasing out leaded petrol, motor vehicle exhaust also contributed to lead exposure for the general public. Effects of lead exposure in adults include neurocognitive effects, decreased renal function, increased blood pressure, and reduced fertility. Lead exposure is a particular concern for children because of reported adverse neurodevelopmental effects at low exposure levels. Lead is generally measured in whole blood to enable assessment of recent lead intake and equilibration with stored lead in other body compartments, including bone. Blood levels of lead have reduced considerably over the past 30 years (Hinton et al., 1986; Jones et al., 2009). The notification of ‘lead poisoning’ under the Health Act 1956 was amended in 2007 to a blood lead of 100 µg/L (10 µg/dL; 0.48 µmol/L) or greater for all ages.
The results for blood lead are included in Table 6a for adults and Table 6b for children. Lead was detected in all blood samples. The geometric mean blood lead level was 13 µg/L (1.3 µg/dL) for adults and 8 µg/L (0.8 µg/dL) for children. The arithmetic mean was 15 µg/L (1.5 µg/dL) for adults and 9 µg/L (0.9 µg/dL) for children. The 95th percentile was 29 µg/L (2.9 µg/dL) for adults and 16 µg/L (1.6 µg/dL) for children. None of the study participants had blood lead levels above the notifiable blood lead level of 100 µg/L (10 µg/dL). Children had lower blood lead levels compared to adults and for the adults, a higher age was associated with higher blood lead levels. For both children and adults, males had higher blood lead levels compared to females. Some differences between regions were observed for children (highest mean levels for Northland/Auckland), but these were not observed for adults. For adults who indicated they were currently a smoker (n=26), the GM was 15.41 µg/L (95%CI 12.95-18.33). For adults who indicated they were currently not a smoker (n=278), the GM was 12.92 µg/L (95%CI 12.12-13.77).
27 | P a g e
Table 6a. Geometric means for blood lead, adults.
n
n< LOD
GM µg/dL
GM µg/L 95%CI
(R2) p-value
all 304 0 1.31 13.11 12.35-13.93 (0.250)
age 19-24 52 0 0.97 9.73 8.60-11.01 25-34 64 0 1.09 10.92 9.83-12.13 35-49 85 0 1.25 12.53 11.23-13.98 50-64 103 0 1.77 17.74 16.10-19.55 <0.0001
male 140 0 1.49 14.85 13.72-16.07 female 164 0 1.18 11.80 10.83-12.85 <0.0001
Māori 112 0 1.31 13.10 11.89-14.44 non-Māori 192 0 1.31 13.12 12.15-14.17 0.848
Northland/Auckland 65 0 1.19 11.90 10.63-13.32 Waikato/BoP 85 0 1.23 12.31 11.04-13.73 lower North Island 79 0 1.36 13.58 11.98-15.39 South Island 75 0 1.48 14.78 13.01-16.78 0.158
LOD: limit of detection (0.041 µg/L); 95%CI: 95% confidence interval of the geometric mean (GM); R2: R-squared of the
multivariate linear regression model; p-value: the p-value of the multivariate linear regression model for that variable.
Table 6b. Geometric means for blood lead, children.
n
n< LOD
GM µg/dL
GM µg/L 95%CI
(R2) p-value
all 193 0 0.85 8.48 7.92-9.08 (0.121)
age 5-7 38 0 0.85 8.50 7.24-9.99 8-10 70 0 0.85 8.54 7.63-9.56 11-18 85 0 0.84 8.43 7.61-9.33 0.954
male 95 0 0.91 9.14 8.34-10.01 female 98 0 0.79 7.90 7.15-8.72 0.008
Māori 49 0 0.95 9.53 8.52-10.66 non-Māori 144 0 0.82 8.15 7.51-8.85 0.093
Northland/Auckland 42 0 1.00 10.00 8.80-11.37 Waikato/BoP 36 0 0.70 7.04 5.96-8.30 lower North Island 90 0 0.89 8.88 8.17-9.66 South Island 25 0 0.71 7.14 5.54-9.20 0.002
LOD: limit of detection (0.041 µg/L); 95%CI: 95% confidence interval of the geometric mean (GM); R2: R-squared of the
multivariate linear regression model; p-value: the p-value of the multivariate linear regression model for that variable.

28 | P a g e
4.2.2. Blood mercury Mercury occurs naturally in elemental, organic and inorganic forms. Elemental mercury is used in a number of applications including production of electrical equipment, and in dental amalgams. Methyl mercury, an organic form of mercury, is generated by metabolism of mercury by microorganisms in aquatic sediments and can bio-accumulate in fish species and in humans via diet. Inorganic mercury is used in the production of batteries, cosmetics and alternative medicines. International and New Zealand studies (Crump 1998) have shown adverse neurodevelopmental effects from mercury exposure, particularly in young children. Currently, there is no notifiable blood mercury level in New Zealand. Assessment of blood levels of mercury is an appropriate method to estimate dietary intake of organic forms of mercury (e.g. methyl mercury). Elevated mercury in blood usually indicates exposure to organic mercury such as from eating fish containing methylmercury, or recent occupational exposure to a high level of elemental mercury vapour.
The results for blood mercury are included in Table 7a for adults and Table 7b for children. Mercury was detected in 99% of the adult blood samples and 93% of the child blood samples. The geometric mean blood mercury level was 1.6 µg/L for adults and 0.9 µg/L for children. The arithmetic mean blood mercury level was 2.4 µg/L for adults and 1.4 µg/L for children. The 95th percentile was 6 µg/L for adults and 4 µg/L for children. Children had lower blood mercury levels compared to adults, and for adults, a higher age was associated with higher blood mercury levels. Boys had higher blood mercury levels compared to girls, but the same pattern was not observed for adults. For adults there appeared to be a South to North gradient in the region-specific blood mercury levels although this did not reach statistical significance, and this pattern was not observed for children. Of the 304 adults who provided a blood sample, 83 indicated they had eaten fish in the 48 hours prior to sampling, with a GM of 2.24 µg/L (95%CI 1.87-2.69). The GM of the 221 adults who did not have fish 48 hours before sampling was 1.47 µg/L (95%CI 1.30-1.65). For the 35 children that had eaten fish 48 hours before sampling the GM was 1.92 µg/L (95%CI 1.40-2.63), compared to 0.71 µg/L (95%CI 0.61-0.83) for children who did not have fish.
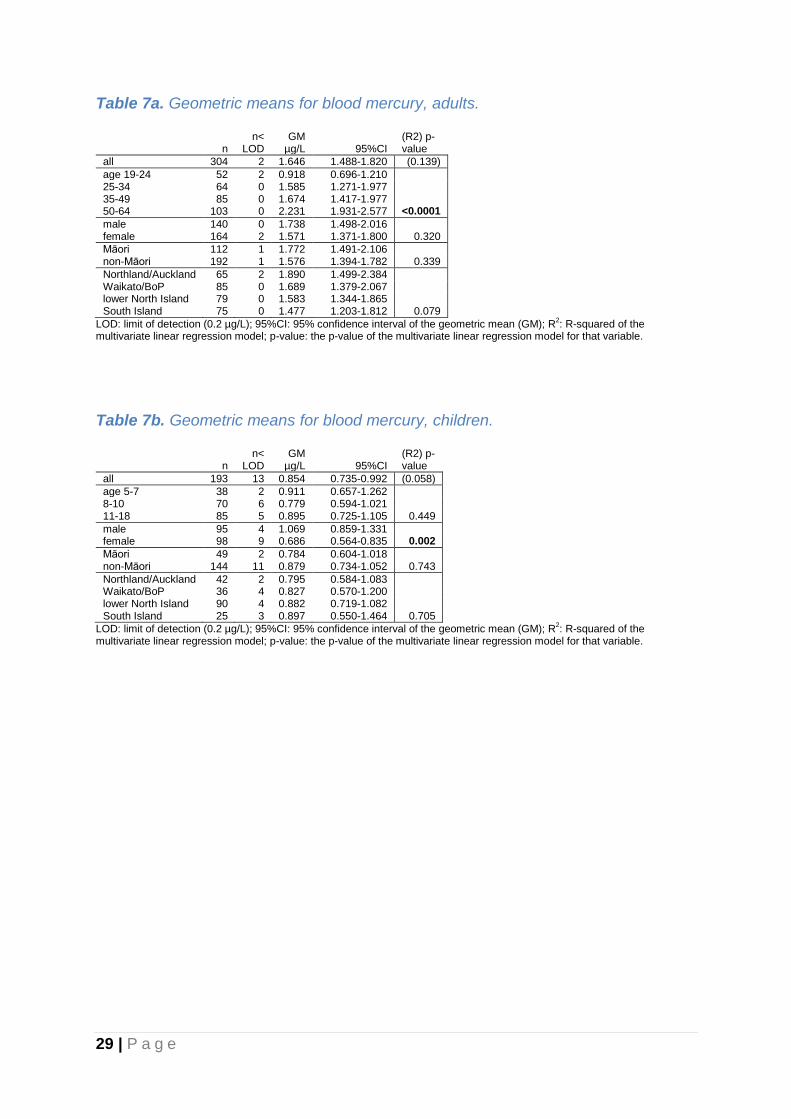
29 | P a g e
Table 7a. Geometric means for blood mercury, adults.
n n<
LOD GM
µg/L 95%CI (R2) p-value
all 304 2 1.646 1.488-1.820 (0.139)
age 19-24 52 2 0.918 0.696-1.210 25-34 64 0 1.585 1.271-1.977 35-49 85 0 1.674 1.417-1.977 50-64 103 0 2.231 1.931-2.577 <0.0001
male 140 0 1.738 1.498-2.016 female 164 2 1.571 1.371-1.800 0.320
Māori 112 1 1.772 1.491-2.106 non-Māori 192 1 1.576 1.394-1.782 0.339
Northland/Auckland 65 2 1.890 1.499-2.384 Waikato/BoP 85 0 1.689 1.379-2.067 lower North Island 79 0 1.583 1.344-1.865 South Island 75 0 1.477 1.203-1.812 0.079
LOD: limit of detection (0.2 µg/L); 95%CI: 95% confidence interval of the geometric mean (GM); R2: R-squared of the
multivariate linear regression model; p-value: the p-value of the multivariate linear regression model for that variable.
Table 7b. Geometric means for blood mercury, children.
n n<
LOD GM
µg/L 95%CI (R2) p-value
all 193 13 0.854 0.735-0.992 (0.058)
age 5-7 38 2 0.911 0.657-1.262 8-10 70 6 0.779 0.594-1.021 11-18 85 5 0.895 0.725-1.105 0.449
male 95 4 1.069 0.859-1.331 female 98 9 0.686 0.564-0.835 0.002
Māori 49 2 0.784 0.604-1.018 non-Māori 144 11 0.879 0.734-1.052 0.743
Northland/Auckland 42 2 0.795 0.584-1.083 Waikato/BoP 36 4 0.827 0.570-1.200 lower North Island 90 4 0.882 0.719-1.082 South Island 25 3 0.897 0.550-1.464 0.705
LOD: limit of detection (0.2 µg/L); 95%CI: 95% confidence interval of the geometric mean (GM); R2: R-squared of the
multivariate linear regression model; p-value: the p-value of the multivariate linear regression model for that variable.

30 | P a g e
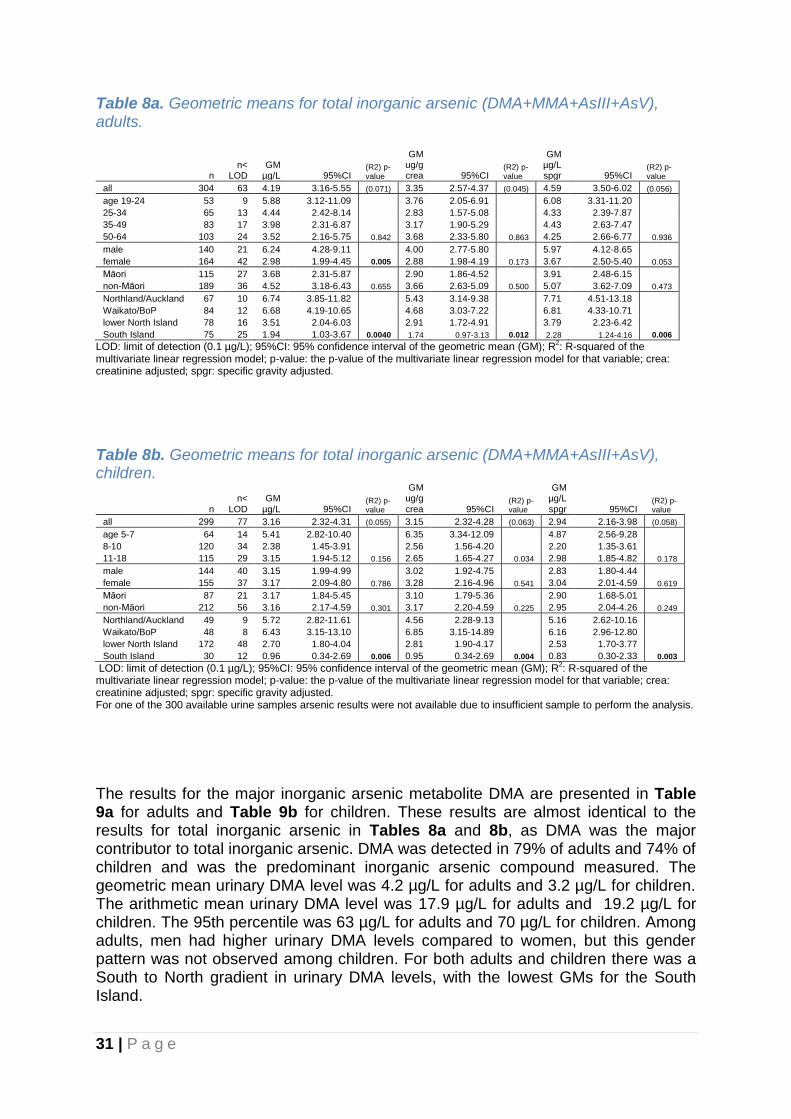
4.2.3. Urinary arsenic Arsenic is a non-essential metalloid and a widely distributed element found in several forms resulting from geothermal activity, mining operations, coal burning, and smelting operations. In several countries arsenic is naturally present at high levels in groundwater. Arsenic compounds have been used for medical purposes, pigments, pesticides, and timber treatment (i.e. CCA). Arsenic is highly toxic in its inorganic form. Inorganic arsenic has also been associated with long-term health effects including developmental effects, neurotoxicity, diabetes, pulmonary disease, cardiovascular disease and cancer (WHO, 2016). General population exposure to inorganic arsenic can occur through consumption of contaminated drinking water and to a lesser extent rice, grains, seaweed and fish. Fish and seafood consumption is the main route of exposure for organic arsenic, which is rapidly excreted and has not been associated with toxic effects in humans. After recent seafood ingestion, organic arsenic in the form of arsenobetaine (AB) and arsenocholine will greatly increase the level of total urinary arsenic. When seafood intake is avoided, inorganic arsenic related compounds in the form of dimethylarsenic acid (DMA), the major metabolite of inorganic arsenic, and monomethylarsonic acid (MMA) compose most of the total of arsenic species measured in the urine. Inorganic arsenic The inorganic arsenic related compounds determined in urine included dimethylersinic acid (DMA), the major metabolite of inorganic arsenic, monomethylarsonic acid (MMA), arsenite (AsIII) and arsenate (AsV). The detection frequency of these compounds for adults and children were 79% and 72% for DMA, and 3% and 14% for MMA. AsIII and AsV were not detected in any of the samples from adults and in one and two of the samples from children, respectively. The results for total inorganic arsenic (DMA+MMA+AsIII+AsV) are presented in Table 8a for adults and Table 8b for children. Inorganic arsenic was detected in 79% of adults and 74% of children. The geometric mean urinary inorganic arsenic level was 4.2 µg/L for adults and 3.2 µg/L for children. The arithmetic mean urinary inorganic arsenic level was 17.9 µg/L for adults and 19.2 µg/L for children. The 95th percentile was 63 µg/L for adults and 70 µg/L for children. For both adults and children there was a strong South to North gradient in urinary inorganic arsenic levels, with the lowest GMs for the South Island. Of the 304 adults who provided a urine sample, 79 indicated they had eaten fish in the 48 hours prior to sampling, for which the GM was 8.97 µg/L (95%CI 5.59-14.41). The GM of the 225 adults who did not have fish 48 hours before sampling was 3.20 µg/L (95%CI 2.29-4.49). For the 37 children that had eaten fish 48 hours before sampling the GM was 14.38 µg/L (95%CI 7.28-28.41), compared to 2.40 µg/L (95%CI 1.59-3.63) for children who did not have fish.
31 | P a g e
Table 8a. Geometric means for total inorganic arsenic (DMA+MMA+AsIII+AsV), adults.
n n<
LOD GM
µg/L 95%CI (R2) p-value
GM ug/g crea 95%CI
(R2) p-value
GM µg/L spgr 95%CI
(R2) p-value
all 304 63 4.19 3.16-5.55 (0.071) 3.35 2.57-4.37 (0.045) 4.59 3.50-6.02 (0.056)
age 19-24 53 9 5.88 3.12-11.09 3.76 2.05-6.91 6.08 3.31-11.20
25-34 65 13 4.44 2.42-8.14 2.83 1.57-5.08 4.33 2.39-7.87
35-49 83 17 3.98 2.31-6.87 3.17 1.90-5.29 4.43 2.63-7.47
50-64 103 24 3.52 2.16-5.75 0.842 3.68 2.33-5.80 0.863 4.25 2.66-6.77 0.936
male 140 21 6.24 4.28-9.11 4.00 2.77-5.80 5.97 4.12-8.65
female 164 42 2.98 1.99-4.45 0.005 2.88 1.98-4.19 0.173 3.67 2.50-5.40 0.053
Māori 115 27 3.68 2.31-5.87 2.90 1.86-4.52 3.91 2.48-6.15
non-Māori 189 36 4.52 3.18-6.43 0.655 3.66 2.63-5.09 0.500 5.07 3.62-7.09 0.473
Northland/Auckland 67 10 6.74 3.85-11.82 5.43 3.14-9.38 7.71 4.51-13.18
Waikato/BoP 84 12 6.68 4.19-10.65 4.68 3.03-7.22 6.81 4.33-10.71
lower North Island 78 16 3.51 2.04-6.03 2.91 1.72-4.91 3.79 2.23-6.42
South Island 75 25 1.94 1.03-3.67 0.0040 1.74 0.97-3.13 0.012 2.28 1.24-4.16 0.006
LOD: limit of detection (0.1 µg/L); 95%CI: 95% confidence interval of the geometric mean (GM); R2: R-squared of the
multivariate linear regression model; p-value: the p-value of the multivariate linear regression model for that variable; crea: creatinine adjusted; spgr: specific gravity adjusted.
Table 8b. Geometric means for total inorganic arsenic (DMA+MMA+AsIII+AsV), children.
n n<
LOD GM
µg/L 95%CI (R2) p-value
GM ug/g crea 95%CI
(R2) p-value
GM µg/L spgr 95%CI
(R2) p-value
all 299 77 3.16 2.32-4.31 (0.055) 3.15 2.32-4.28 (0.063) 2.94 2.16-3.98 (0.058)
age 5-7 64 14 5.41 2.82-10.40 6.35 3.34-12.09 4.87 2.56-9.28
8-10 120 34 2.38 1.45-3.91 2.56 1.56-4.20 2.20 1.35-3.61
11-18 115 29 3.15 1.94-5.12 0.156 2.65 1.65-4.27 0.034 2.98 1.85-4.82 0.178
male 144 40 3.15 1.99-4.99 3.02 1.92-4.75 2.83 1.80-4.44
female 155 37 3.17 2.09-4.80 0.786 3.28 2.16-4.96 0.541 3.04 2.01-4.59 0.619
Māori 87 21 3.17 1.84-5.45 3.10 1.79-5.36 2.90 1.68-5.01
non-Māori 212 56 3.16 2.17-4.59 0.301 3.17 2.20-4.59 0.225 2.95 2.04-4.26 0.249
Northland/Auckland 49 9 5.72 2.82-11.61 4.56 2.28-9.13 5.16 2.62-10.16
Waikato/BoP 48 8 6.43 3.15-13.10 6.85 3.15-14.89 6.16 2.96-12.80
lower North Island 172 48 2.70 1.80-4.04 2.81 1.90-4.17 2.53 1.70-3.77
South Island 30 12 0.96 0.34-2.69 0.006 0.95 0.34-2.69 0.004 0.83 0.30-2.33 0.003
LOD: limit of detection (0.1 µg/L); 95%CI: 95% confidence interval of the geometric mean (GM); R2: R-squared of the
multivariate linear regression model; p-value: the p-value of the multivariate linear regression model for that variable; crea: creatinine adjusted; spgr: specific gravity adjusted. For one of the 300 available urine samples arsenic results were not available due to insufficient sample to perform the analysis. The results for the major inorganic arsenic metabolite DMA are presented in Table 9a for adults and Table 9b for children. These results are almost identical to the results for total inorganic arsenic in Tables 8a and 8b, as DMA was the major contributor to total inorganic arsenic. DMA was detected in 79% of adults and 74% of children and was the predominant inorganic arsenic compound measured. The geometric mean urinary DMA level was 4.2 µg/L for adults and 3.2 µg/L for children. The arithmetic mean urinary DMA level was 17.9 µg/L for adults and 19.2 µg/L for children. The 95th percentile was 63 µg/L for adults and 70 µg/L for children. Among adults, men had higher urinary DMA levels compared to women, but this gender pattern was not observed among children. For both adults and children there was a South to North gradient in urinary DMA levels, with the lowest GMs for the South Island.

32 | P a g e
The results for the inorganic arsenic metabolite MMA are presented in Table 10a for adults and Table 10b for children. MMA was detected in 3% of adults and 14% of children. Because of these low detection frequencies the p-values in Tables 10a and 10b refer to differences in detection frequency between groups and not differences in GM between groups. Detection frequencies were significantly higher in the younger age groups. There were no statistically significant differences in detection frequency of MMA between the different gender and ethnic groups. Among children the lowest MMA detection frequency was observed for the lower North Island.
Table 9a. Geometric means for urinary dimethylarsinic acid (DMA), adults.
n n<
LOD GM
µg/L 95%CI (R2) p-value
GM ug/g crea 95%CI
(R2) p-value
GM µg/L spgr 95%CI
(R2) p-value
all 304 63 4.18 3.16-5.54 (0.071) 3.35 2.57-4.37 (0.045) 4.59 3.50-6.02 (0.056)
age 19-24 53 9 5.88 3.12-11.09 3.76 2.05-6.90 6.08 3.31-11.19
25-34 65 13 4.42 2.41-8.11 2.82 1.57-5.06 4.32 2.38-7.85
35-49 83 17 3.98 2.31-6.87 3.17 1.90-5.29 4.43 2.62-7.46
50-64 103 24 3.52 2.16-5.75 0.843 3.68 2.33-5.80 0.860 4.25 2.66-6.77 0.935
male 140 21 6.23 4.27-9.09 4.00 2.76-5.79 5.96 4.12-8.64
female 164 42 2.98 1.99-4.45 0.005 2.88 1.98-4.19 0.173 3.67 2.50-5.40 0.053
Māori 115 27 3.68 2.31-5.87 2.90 1.86-4.52 3.91 2.48-6.15
non-Māori 189 36 4.52 3.18-6.43 0.656 3.66 2.63-5.09 0.501 5.06 3.62-7.08 0.474
Northland/Auckland 67 10 6.74 3.85-11.81 5.43 3.14-9.37 7.70 4.50-13.17
Waikato/BoP 84 12 6.68 4.19-10.64 4.67 3.03-7.21 6.80 4.32-10.70
lower North Island 78 16 3.51 2.04-6.02 2.90 1.72-4.91 3.78 2.23-6.42
South Island 75 25 1.94 1.03-3.67 0.004 1.74 0.97-3.13 0.012 2.27 1.24-4.16 0.006
LOD: limit of detection (0.1 µg/L); 95%CI: 95% confidence interval of the geometric mean (GM); R2: R-squared of the
multivariate linear regression model; p-value: the p-value of the multivariate linear regression model for that variable; crea: creatinine adjusted; spgr: specific gravity adjusted.
Table 9b. Geometric means for urinary dimethylarsinic acid (DMA), children.
n n<
LOD GM
µg/L 95%CI (R2) p-value
GM ug/g crea 95%CI
(R2) p-value
GM µg/L spgr 95%CI
(R2) p-value
all 299 85 3.01 2.20-4.12 (0.061) 3.00 2.19-4.11 (0.068) 2.80 2.05-3.82 (0.064)
age 5-7 64 14 5.40 2.81-10.36 6.33 3.33-12.04 4.85 2.55-9.24
8-10 120 40 2.18 1.31-3.65 2.35 1.41-3.93 2.02 1.22-3.37
11-18 115 31 3.04 1.86-4.98 0.121 2.56 1.58-4.15 0.028 2.88 1.77-4.68 0.138
male 144 42 3.08 1.94-4.89 2.95 1.86-4.65 2.76 1.75-4.35
female 155 43 2.95 1.92-4.53 0.941 3.05 1.99-4.69 0.686 2.83 1.85-4.34 0.770
Māori 87 23 3.05 1.75-5.29 2.98 1.70-5.22 2.79 1.59-4.86
non-Māori 212 62 3.00 2.04-4.39 0.295 3.01 2.07-4.39 0.222 2.80 1.92-4.07 0.245
Northland/Auckland 49 10 5.53 2.70-11.36 4.41 2.17-8.95 4.99 2.50-9.96
Waikato/BoP 48 9 6.09 2.93-12.64 6.48 2.92-14.39 5.83 2.76-12.33
lower North Island 172 50 2.64 1.76-3.98 2.76 1.85-4.10 2.48 1.66-3.71
South Island 30 16 0.76 0.26-2.25 0.003 0.76 0.25-2.28 0.003 0.66 0.22-1.96 0.002
LOD: limit of detection (0.1 µg/L); 95%CI: 95% confidence interval of the geometric mean (GM); R2: R-squared of the
multivariate linear regression model; p-value: the p-value of the multivariate linear regression model for that variable; crea: creatinine adjusted; spgr: specific gravity adjusted. For one of the 300 available urine samples arsenic results were not available due to insufficient sample to perform the analysis.
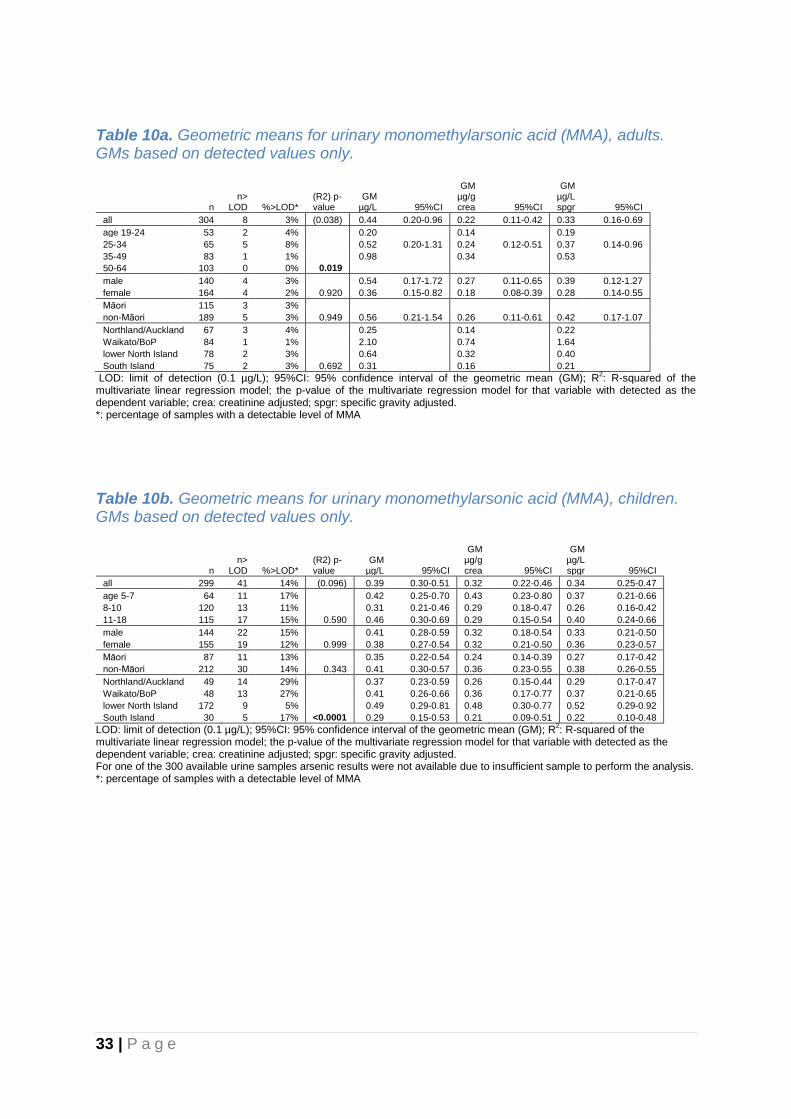
33 | P a g e
Table 10a. Geometric means for urinary monomethylarsonic acid (MMA), adults. GMs based on detected values only.
n n>
LOD %>LOD* (R2) p-value
GM µg/L 95%CI
GM µg/g crea 95%CI
GM µg/L spgr 95%CI
all 304 8 3% (0.038) 0.44 0.20-0.96 0.22 0.11-0.42 0.33 0.16-0.69
age 19-24 53 2 4% 0.20
0.14
0.19
25-34 65 5 8% 0.52 0.20-1.31 0.24 0.12-0.51 0.37 0.14-0.96
35-49 83 1 1% 0.98
0.34
0.53
50-64 103 0 0% 0.019
male 140 4 3% 0.54 0.17-1.72 0.27 0.11-0.65 0.39 0.12-1.27
female 164 4 2% 0.920 0.36 0.15-0.82 0.18 0.08-0.39 0.28 0.14-0.55
Māori 115 3 3%
non-Māori 189 5 3% 0.949 0.56 0.21-1.54 0.26 0.11-0.61 0.42 0.17-1.07
Northland/Auckland 67 3 4% 0.25
0.14
0.22
Waikato/BoP 84 1 1% 2.10
0.74
1.64
lower North Island 78 2 3% 0.64
0.32
0.40
South Island 75 2 3% 0.692 0.31 0.16 0.21
LOD: limit of detection (0.1 µg/L); 95%CI: 95% confidence interval of the geometric mean (GM); R2: R-squared of the
multivariate linear regression model; the p-value of the multivariate regression model for that variable with detected as the dependent variable; crea: creatinine adjusted; spgr: specific gravity adjusted. *: percentage of samples with a detectable level of MMA
Table 10b. Geometric means for urinary monomethylarsonic acid (MMA), children. GMs based on detected values only.
n n>
LOD %>LOD* (R2) p-value
GM µg/L 95%CI
GM µg/g crea 95%CI
GM µg/L spgr 95%CI
all 299 41 14% (0.096) 0.39 0.30-0.51 0.32 0.22-0.46 0.34 0.25-0.47
age 5-7 64 11 17% 0.42 0.25-0.70 0.43 0.23-0.80 0.37 0.21-0.66
8-10 120 13 11% 0.31 0.21-0.46 0.29 0.18-0.47 0.26 0.16-0.42
11-18 115 17 15% 0.590 0.46 0.30-0.69 0.29 0.15-0.54 0.40 0.24-0.66
male 144 22 15% 0.41 0.28-0.59 0.32 0.18-0.54 0.33 0.21-0.50
female 155 19 12% 0.999 0.38 0.27-0.54 0.32 0.21-0.50 0.36 0.23-0.57
Māori 87 11 13% 0.35 0.22-0.54 0.24 0.14-0.39 0.27 0.17-0.42
non-Māori 212 30 14% 0.343 0.41 0.30-0.57 0.36 0.23-0.55 0.38 0.26-0.55
Northland/Auckland 49 14 29% 0.37 0.23-0.59 0.26 0.15-0.44 0.29 0.17-0.47
Waikato/BoP 48 13 27% 0.41 0.26-0.66 0.36 0.17-0.77 0.37 0.21-0.65
lower North Island 172 9 5% 0.49 0.29-0.81 0.48 0.30-0.77 0.52 0.29-0.92
South Island 30 5 17% <0.0001 0.29 0.15-0.53 0.21 0.09-0.51 0.22 0.10-0.48
LOD: limit of detection (0.1 µg/L); 95%CI: 95% confidence interval of the geometric mean (GM); R2: R-squared of the
multivariate linear regression model; the p-value of the multivariate regression model for that variable with detected as the dependent variable; crea: creatinine adjusted; spgr: specific gravity adjusted. For one of the 300 available urine samples arsenic results were not available due to insufficient sample to perform the analysis. *: percentage of samples with a detectable level of MMA

34 | P a g e
Organic arsenic The results for arsenobetaine are presented in Table 11a for adults and Table 11b for children. Organic arsenic in the form of arsenobetaine (AB), the predominant arsenic species in most marine fish, was detected in 68% of adults and 53% of children. The geometric mean urinary AB level was 3.5 µg/L for adults and 1.5 µg/L for children. The arithmetic mean urinary AB level was 69.6 µg/L for adults and 117.1 µg/L for children. The 95th percentile was 231 µg/L for adults and 247 µg/L for children. Among adults, men had higher urinary AB levels compared to women, but this gender pattern was no longer statistically significant after creatinine and specific gravity adjustment, and a gender pattern was not observed among children. Among children, AB levels were higher for non-Māori compared to Māori, but this ethnicity pattern was not observed among adults. Of the 304 adults who provided a urine sample, 79 indicated they had eaten fish in the 48 hours prior to sampling, and this group had a GM of 24.60 µg/L (95%CI 13.98-43.27). The GM of the 225 adults who did not have fish 48 hours before sampling was 1.77 µg/L (95%CI 1.17-2.68). For the 37 children that had eaten fish 48 hours before sampling the GM was 41.21 µg/L (95%CI 15.32-110.85), compared to 0.91 µg/L (95%CI 0.56-1.48) for children who did not have fish.

35 | P a g e
Table 11a. Geometric means for urinary organic arsenic arsenobetaine (AB), adults.
n n<
LOD GM
µg/L 95%CI (R2) p-value
GM µg/g crea 95%CI
(R2) p-value
GM µg/L spgr 95%CI
(R2) p-value
all 304 98 3.51 2.44-5.04 (0.042) 2.81 1.98-3.99 (0.025) 3.85 2.71-5.48 (0.030)
age 19-24 53 21 2.40 0.96-6.01 1.54 0.62-3.79 2.49 1.01-6.15
25-34 65 16 4.65 2.26-9.58 2.96 1.44-6.11 4.54 2.21-9.34
35-49 83 22 5.67 2.88-11.17 4.52 2.37-8.60 6.30 3.29-12.09
50-64 103 39 2.43 1.29-4.57 0.253 2.53 1.38-4.63 0.300 2.92 1.59-5.39 0.292
male 140 35 5.65 3.42-9.34 3.62 2.19-6.01 5.40 3.28-8.91
female 164 63 2.34 1.41-3.89 0.014 2.26 1.39-3.67 0.178 2.88 1.76-4.72 0.074
Māori 115 34 4.54 2.56-8.07 3.58 2.05-6.26 4.82 2.74-8.48
non-Māori 189 64 3.00 1.88-4.78 0.294 2.43 1.55-3.80 0.357 3.36 2.14-5.28 0.380
Northland/Auckland 67 24 3.22 1.46-7.11 2.60 1.20-5.63 3.68 1.71-7.96
Waikato/BoP 84 21 4.83 2.51-9.28 3.38 1.78-6.40 4.92 2.57-9.41
lower North Island 78 28 2.68 1.33-5.42 2.22 1.13-4.35 2.89 1.46-5.74
South Island 75 25 3.51 1.64-7.51 0.615 3.14 1.51-6.52 0.800 4.10 1.98-8.53 0.708
LOD: limit of detection (0.1 µg/L); 95%CI: 95% confidence interval of the geometric mean (GM); R2: R-squared of the
multivariate linear regression model; p-value: the p-value of the multivariate linear regression model for that variable; crea: creatinine adjusted; spgr: specific gravity adjusted.
Table 11b. Geometric means for urinary organic arsenic arsenobetaine (AB), children.
n n<
LOD GM
µg/L 95%CI (R2) p-value
GM µg/g crea
95% CI
(R2) p-value
GM µg/L spgr
95% CI
(R2) p-value
all 299 142 1.50 1.01-2.24 (0.078) 1.50 1.01-2.23 (0.074) 1.39 0.94-2.07 (0.080)
age 5-7 64 32 1.25 0.54-2.89 1.46 0.64-3.36 1.12 0.49-2.58
8-10 120 67 0.88 0.47-1.64 0.95 0.51-1.77 0.81 0.44-1.51
11-18 115 43 2.91 1.54-5.49 0.011 2.45 1.29-4.66 0.044 2.76 1.46-5.21 0.010
male 144 67 1.85 1.02-3.37 1.77 0.98-3.22 1.66 0.92-3.00
female 155 75 1.24 0.73-2.10 0.310 1.28 0.75-2.17 0.451 1.19 0.70-2.01 0.396
Māori 87 54 0.49 0.25-0.95 0.47 0.24-0.92 0.44 0.23-0.87
non-Māori 212 88 2.39 1.48-3.84 0.002 2.40 1.49-3.86 0.001 2.23 1.39-3.57 0.001
Northland/Auckland 49 25 0.89 0.37-2.12 0.71 0.30-1.67 0.80 0.34-1.90
Waikato/BoP 48 24 1.94 0.61-6.16 2.07 0.64-6.67 1.86 0.60-5.81
lower North Island 172 81 1.42 0.86-2.35 1.48 0.90-2.44 1.33 0.81-2.21
South Island 30 12 3.24 0.86-12.21 0.436 3.23 0.82-12.66 0.272 2.82 0.75-11 0.415
LOD: limit of detection (0.1 µg/L); 95%CI: 95% confidence interval of the geometric mean (GM); R2: R-squared of the
multivariate linear regression model; p-value: the p-value of the multivariate linear regression model for that variable; crea: creatinine adjusted; spgr: specific gravity adjusted. For one of the 300 available urine samples arsenic results were not available due to insufficient sample to perform the analysis.

36 | P a g e
4.2.4. Urinary cadmium Cadmium is a non-essential heavy metal. Cadmium is primarily sourced as a by-product of processing zinc-containing ores and sulphide ores and is used in battery manufacture. Emissions of air-borne cadmium come from burning fossil fuels and incineration of solid waste. Cadmium is a natural impurity in phosphate rock used to produce phosphate fertilisers. With continuous fertiliser application cadmium may accumulate in soil and there is evidence that cadmium is accumulating in New Zealand agricultural soils (Kim, 2005). Soil cadmium may be absorbed by common food plants including cereals and potatoes. Cadmium is toxic at very low exposure levels and has been associated with acute and chronic health effects, including kidney damage and resulting renal dysfunction. Exposure to cadmium is primarily from contaminated water and food, including potatoes, cereals and oysters. Cigarette smoke is a significant cadmium source and the body burden of cadmium in smokers is typically twice that of non-smokers. Urinary levels of cadmium are an accepted indicator of cumulative exposure and the concentration of cadmium in the kidney. Cadmium has a long retention time in the human body, with a half-life of approximately 15 years in the kidney (WHO, 2011) and urinary cadmium reflects long-term body burden of cadmium. The results for cadmium are presented in Table 12a for adults and Table 12b for children. Cadmium was detected in 89% of the adult urine samples and 53% of the child urine samples. The geometric mean urinary cadmium was 0.19 µg/L for adults and 0.07 µg/L for children. The arithmetic mean urinary cadmium was 0.28 µg/L for adults and 0.09 µg/L for children. The 95th percentile was 0.64 µg/L for adults and 0.17 µg/L for children. Age was strongly and positively associated with cadmium levels. There were no consistently observed differences in urinary cadmium levels between men and women or boys and girls. Among adults, Māori had higher cadmium levels, although this was no longer statistically significant after specific gravity adjustment. Among children a difference between Māori and non-Māori for cadmium was not observed. For adults, cadmium levels differed among geographic regions, but this was not observed for children. For adults who indicated they were currently a smoker (n=26), the GM was 0.30 µg/L (95%CI 0.22-0.41). For adults who indicated they were currently not a smoker (n=278), the GM was 0.19 µg/L (95%CI 0.17-0.21).
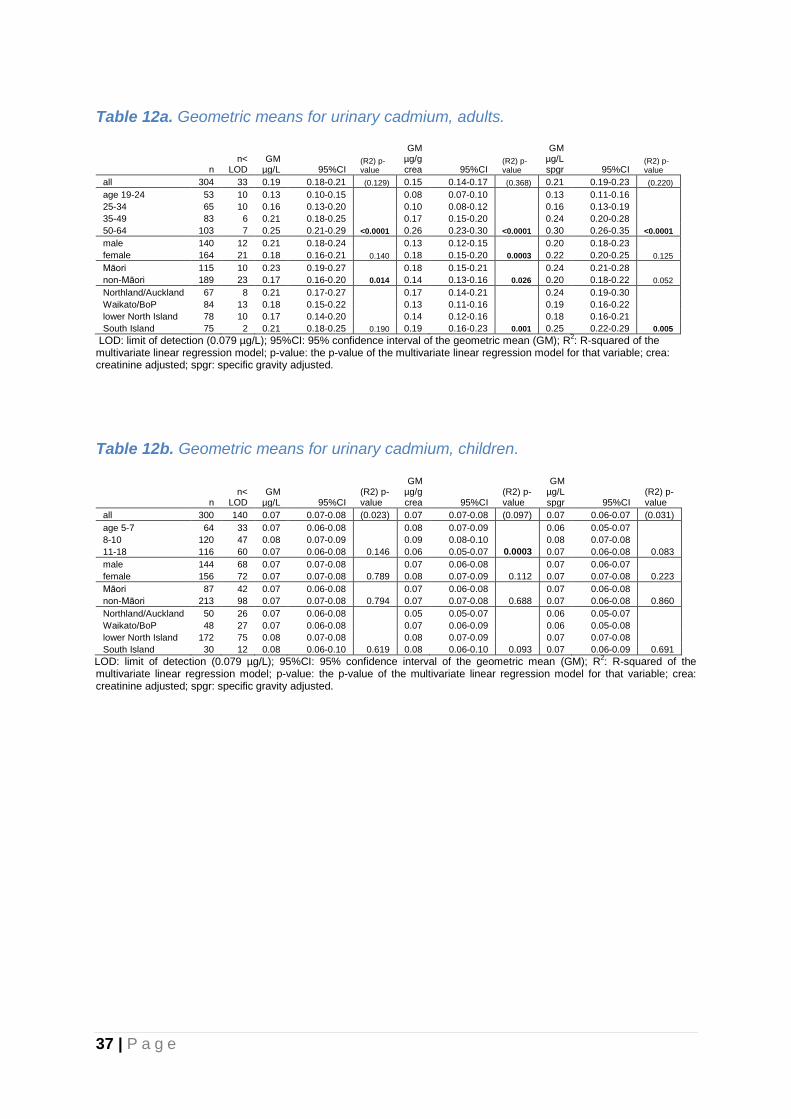
37 | P a g e
Table 12a. Geometric means for urinary cadmium, adults.
n n<
LOD GM
µg/L 95%CI (R2) p-value
GM µg/g crea 95%CI
(R2) p-value
GM µg/L spgr 95%CI
(R2) p-value
all 304 33 0.19 0.18-0.21 (0.129) 0.15 0.14-0.17 (0.368) 0.21 0.19-0.23 (0.220)
age 19-24 53 10 0.13 0.10-0.15 0.08 0.07-0.10 0.13 0.11-0.16
25-34 65 10 0.16 0.13-0.20 0.10 0.08-0.12 0.16 0.13-0.19
35-49 83 6 0.21 0.18-0.25 0.17 0.15-0.20 0.24 0.20-0.28
50-64 103 7 0.25 0.21-0.29 <0.0001 0.26 0.23-0.30 <0.0001 0.30 0.26-0.35 <0.0001
male 140 12 0.21 0.18-0.24 0.13 0.12-0.15 0.20 0.18-0.23
female 164 21 0.18 0.16-0.21 0.140 0.18 0.15-0.20 0.0003 0.22 0.20-0.25 0.125
Māori 115 10 0.23 0.19-0.27 0.18 0.15-0.21 0.24 0.21-0.28
non-Māori 189 23 0.17 0.16-0.20 0.014 0.14 0.13-0.16 0.026 0.20 0.18-0.22 0.052
Northland/Auckland 67 8 0.21 0.17-0.27 0.17 0.14-0.21 0.24 0.19-0.30
Waikato/BoP 84 13 0.18 0.15-0.22 0.13 0.11-0.16 0.19 0.16-0.22
lower North Island 78 10 0.17 0.14-0.20 0.14 0.12-0.16 0.18 0.16-0.21
South Island 75 2 0.21 0.18-0.25 0.190 0.19 0.16-0.23 0.001 0.25 0.22-0.29 0.005
LOD: limit of detection (0.079 µg/L); 95%CI: 95% confidence interval of the geometric mean (GM); R2: R-squared of the
multivariate linear regression model; p-value: the p-value of the multivariate linear regression model for that variable; crea: creatinine adjusted; spgr: specific gravity adjusted.
Table 12b. Geometric means for urinary cadmium, children.
n n<
LOD GM
µg/L 95%CI (R2) p-value
GM µg/g crea 95%CI
(R2) p-value
GM µg/L spgr 95%CI
(R2) p-value
all 300 140 0.07 0.07-0.08 (0.023) 0.07 0.07-0.08 (0.097) 0.07 0.06-0.07 (0.031)
age 5-7 64 33 0.07 0.06-0.08 0.08 0.07-0.09 0.06 0.05-0.07
8-10 120 47 0.08 0.07-0.09 0.09 0.08-0.10 0.08 0.07-0.08
11-18 116 60 0.07 0.06-0.08 0.146 0.06 0.05-0.07 0.0003 0.07 0.06-0.08 0.083
male 144 68 0.07 0.07-0.08 0.07 0.06-0.08 0.07 0.06-0.07
female 156 72 0.07 0.07-0.08 0.789 0.08 0.07-0.09 0.112 0.07 0.07-0.08 0.223
Māori 87 42 0.07 0.06-0.08 0.07 0.06-0.08 0.07 0.06-0.08
non-Māori 213 98 0.07 0.07-0.08 0.794 0.07 0.07-0.08 0.688 0.07 0.06-0.08 0.860
Northland/Auckland 50 26 0.07 0.06-0.08 0.05 0.05-0.07 0.06 0.05-0.07
Waikato/BoP 48 27 0.07 0.06-0.08 0.07 0.06-0.09 0.06 0.05-0.08
lower North Island 172 75 0.08 0.07-0.08 0.08 0.07-0.09 0.07 0.07-0.08
South Island 30 12 0.08 0.06-0.10 0.619 0.08 0.06-0.10 0.093 0.07 0.06-0.09 0.691
LOD: limit of detection (0.079 µg/L); 95%CI: 95% confidence interval of the geometric mean (GM); R2: R-squared of the
multivariate linear regression model; p-value: the p-value of the multivariate linear regression model for that variable; crea: creatinine adjusted; spgr: specific gravity adjusted.

38 | P a g e
4.2.5. Urinary chromium Chromium is an essential nutrient required for sugar and fat metabolism. Chromium occurs as either trivalent (III) or hexavalent (VI) states, with chromium (III) being the most common and stable in the environment. Chromium (III) is an essential nutrient while chromium (VI) is toxic and associated with carcinogenicity, respiratory effects, and renal effects in humans (NHMRC, 2006). Diet is the main exposure route for chromium however there is no information on dietary intake in New Zealand (Ministry for the Environment, 2011). The majority of absorbed chromium is excreted in faeces and urine so urinary chromium will provide useful information on absorbed chromium from dietary sources, reflecting recent exposure. The results for chromium are presented in Table 13a for adults and Table 13b for children. Chromium was detected in 59% of the adult urine samples and 44% of the child urine samples. The geometric mean urinary chromium was 0.05 µg/L for adults and 0.03 µg/L for children. The arithmetic mean urinary chromium was 0.18 µg/L for adults and 0.14 µg/L for children. The 95th percentile was 0.75 µg/L for adults and 0.48 µg/L for children. There were no consistent differences in urinary chromium levels between age groups, men and women, ethnicity groups, or geographic regions. However, children in the lower North Island had higher urinary chromium levels compared to children from the other regions, albeit based on small numbers above the limit of detection for some regions. Overall, the relatively low detection frequency for chromium limits the statistical interpretation of these data.
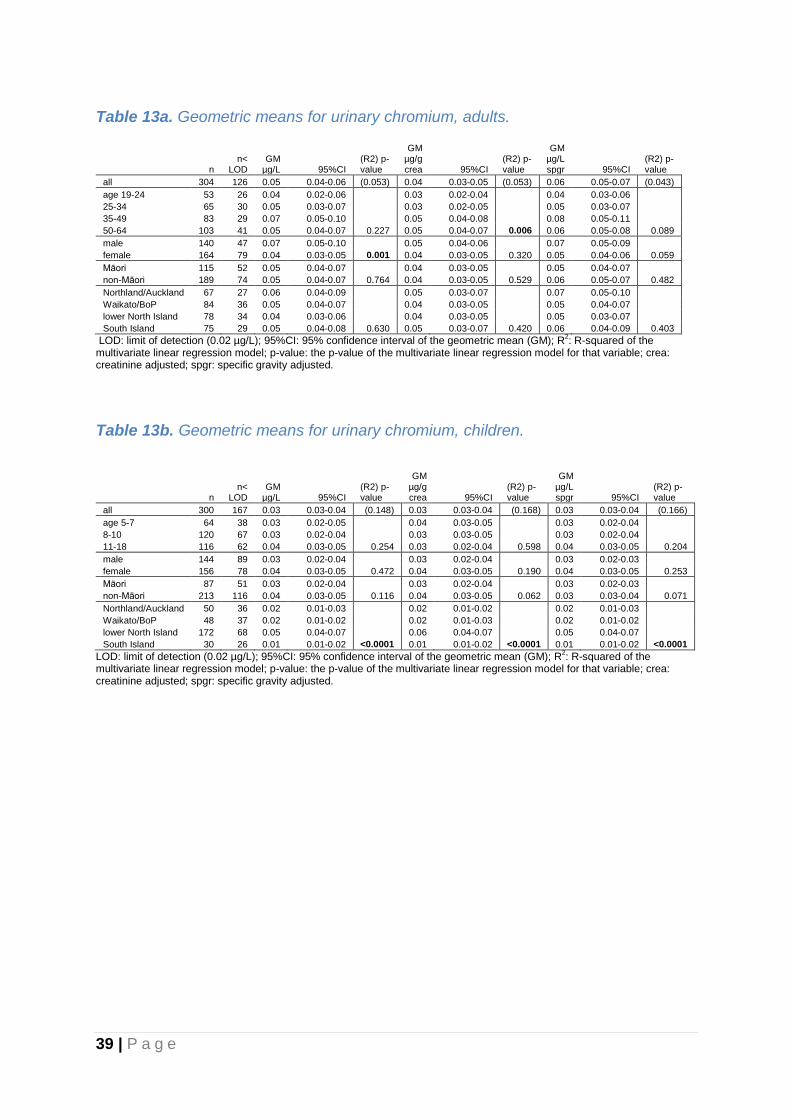
39 | P a g e
Table 13a. Geometric means for urinary chromium, adults.
n n<
LOD GM
µg/L 95%CI (R2) p-value
GM µg/g crea 95%CI
(R2) p-value
GM µg/L spgr 95%CI
(R2) p-value
all 304 126 0.05 0.04-0.06 (0.053) 0.04 0.03-0.05 (0.053) 0.06 0.05-0.07 (0.043)
age 19-24 53 26 0.04 0.02-0.06 0.03 0.02-0.04 0.04 0.03-0.06
25-34 65 30 0.05 0.03-0.07 0.03 0.02-0.05 0.05 0.03-0.07
35-49 83 29 0.07 0.05-0.10 0.05 0.04-0.08 0.08 0.05-0.11
50-64 103 41 0.05 0.04-0.07 0.227 0.05 0.04-0.07 0.006 0.06 0.05-0.08 0.089
male 140 47 0.07 0.05-0.10 0.05 0.04-0.06 0.07 0.05-0.09
female 164 79 0.04 0.03-0.05 0.001 0.04 0.03-0.05 0.320 0.05 0.04-0.06 0.059
Māori 115 52 0.05 0.04-0.07 0.04 0.03-0.05 0.05 0.04-0.07
non-Māori 189 74 0.05 0.04-0.07 0.764 0.04 0.03-0.05 0.529 0.06 0.05-0.07 0.482
Northland/Auckland 67 27 0.06 0.04-0.09 0.05 0.03-0.07 0.07 0.05-0.10
Waikato/BoP 84 36 0.05 0.04-0.07 0.04 0.03-0.05 0.05 0.04-0.07
lower North Island 78 34 0.04 0.03-0.06 0.04 0.03-0.05 0.05 0.03-0.07
South Island 75 29 0.05 0.04-0.08 0.630 0.05 0.03-0.07 0.420 0.06 0.04-0.09 0.403
LOD: limit of detection (0.02 µg/L); 95%CI: 95% confidence interval of the geometric mean (GM); R2: R-squared of the
multivariate linear regression model; p-value: the p-value of the multivariate linear regression model for that variable; crea: creatinine adjusted; spgr: specific gravity adjusted.
Table 13b. Geometric means for urinary chromium, children.
n n<
LOD GM
µg/L 95%CI (R2) p-value
GM µg/g crea 95%CI
(R2) p-value
GM µg/L spgr 95%CI
(R2) p-value
all 300 167 0.03 0.03-0.04 (0.148) 0.03 0.03-0.04 (0.168) 0.03 0.03-0.04 (0.166)
age 5-7 64 38 0.03 0.02-0.05 0.04 0.03-0.05 0.03 0.02-0.04
8-10 120 67 0.03 0.02-0.04 0.03 0.03-0.05 0.03 0.02-0.04
11-18 116 62 0.04 0.03-0.05 0.254 0.03 0.02-0.04 0.598 0.04 0.03-0.05 0.204
male 144 89 0.03 0.02-0.04 0.03 0.02-0.04 0.03 0.02-0.03
female 156 78 0.04 0.03-0.05 0.472 0.04 0.03-0.05 0.190 0.04 0.03-0.05 0.253
Māori 87 51 0.03 0.02-0.04 0.03 0.02-0.04 0.03 0.02-0.03
non-Māori 213 116 0.04 0.03-0.05 0.116 0.04 0.03-0.05 0.062 0.03 0.03-0.04 0.071
Northland/Auckland 50 36 0.02 0.01-0.03 0.02 0.01-0.02 0.02 0.01-0.03
Waikato/BoP 48 37 0.02 0.01-0.02 0.02 0.01-0.03 0.02 0.01-0.02
lower North Island 172 68 0.05 0.04-0.07 0.06 0.04-0.07 0.05 0.04-0.07
South Island 30 26 0.01 0.01-0.02 <0.0001 0.01 0.01-0.02 <0.0001 0.01 0.01-0.02 <0.0001
LOD: limit of detection (0.02 µg/L); 95%CI: 95% confidence interval of the geometric mean (GM); R2: R-squared of the
multivariate linear regression model; p-value: the p-value of the multivariate linear regression model for that variable; crea: creatinine adjusted; spgr: specific gravity adjusted.

40 | P a g e
4.2.6. Urinary thallium Thallium is a non-essential heavy metal that is found in trace amounts in the earth’s crust. Major releases of thallium to the environment are from processes such as coal-burning, metal smelting and metal mining in which thallium is a trace contaminant of the raw materials, rather than from facilities producing or using thallium compounds. Thallium and thallium compounds are soluble and highly toxic. Thallium toxicity can occur at the workplace after respiratory or dermal exposure. Population exposure occurs mainly through eating fruits and green vegetables grown in thallium rich soils, or grown in the vicinity of sources releasing thallium into the air, including coal-burning power plants, cement factories, and smelting operations. Urinary thallium levels reflect recent exposure. The results for thallium are presented in Table 14a for adults and Table 14b for children. Thallium was detected in urine of 97% of the adults and 79% of the children. The geometric mean urinary thallium concentration was 0.20 µg/L for adults and 0.05 µg/L for children. The arithmetic mean urinary thallium concentration was µg/L for 0.28 adults and 0.10 µg/L for children. The 95th percentile was 0.64 µg/L for adults and 0.34 µg/L for children. There were no consistent differences in urinary thallium levels between age groups, men and women, or ethnicity groups. Differences in urinary thallium levels between geographic regions were observed for both adults and children, with the lowest GM observed for the South Island.

41 | P a g e
Table 14a. Geometric means for urinary thallium, adults.
n n<
LOD GM
µg/L 95%CI (R2) p-value
GM µg/g crea 95%CI
(R2) p-value
GM µg/L spgr 95%CI
(R2) p-value
all 304 8 0.20 0.18-0.22 (0.163) 0.16 0.14-0.18 (0.112) 0.22 0.20-0.24 (0.116)
age 19-24 53 0 0.20 0.16-0.25 0.13 0.10-0.16 0.21 0.17-0.26
25-34 65 2 0.21 0.17-0.27 0.14 0.11-0.17 0.21 0.17-0.26
35-49 83 3 0.22 0.18-0.27 0.18 0.15-0.22 0.25 0.21-0.30
50-64 103 3 0.17 0.14-0.20 0.116 0.18 0.15-0.21 0.007 0.21 0.18-0.24 0.174
male 140 2 0.23 0.20-0.26 0.14 0.13-0.16 0.22 0.19-0.24
female 164 6 0.18 0.15-0.21 0.004 0.17 0.15-0.20 0.141 0.22 0.19-0.25 0.831
Māori 115 2 0.20 0.17-0.24 0.16 0.14-0.19 0.21 0.18-0.25
non-Māori 189 6 0.20 0.17-0.22 0.561 0.16 0.14-0.18 0.994 0.22 0.19-0.25 0.884
Northland/Auckland 67 0 0.21 0.17-0.25 0.17 0.14-0.20 0.24 0.20-0.28
Waikato/BoP 84 0 0.29 0.25-0.35 0.21 0.18-0.24 0.30 0.26-0.34
lower North Island 78 1 0.20 0.17-0.24 0.17 0.14-0.20 0.22 0.18-0.26
South Island 75 7 0.12 0.10-0.16 <0.0001 0.11 0.09-0.14 <0.0001 0.14 0.12-0.18 <0.0001
LOD: limit of detection (0.02 µg/L); 95%CI: 95% confidence interval of the geometric mean (GM); R2: R-squared of the
multivariate linear regression model; p-value: the p-value of the multivariate linear regression model for that variable; crea: creatinine adjusted; spgr: specific gravity adjusted.
Table 14b. Geometric means for urinary thallium, children.
n n<
LOD GM
µg/L 95%CI (R2) p-value
GM µg/g crea 95%CI
(R2) p-value
GM µg/L spgr 95%CI
(R2) p-value
all 300 64 0.05 0.05-0.06 (0.037) 0.05 0.05-0.06 (0.037) 0.05 0.04-0.06 (0.046)
age 5-7 64 18 0.05 0.04-0.07 0.06 0.04-0.08 0.05 0.03-0.06
8-10 120 22 0.05 0.04-0.06 0.06 0.05-0.07 0.05 0.04-0.06
11-18 116 24 0.06 0.05-0.07 0.843 0.05 0.04-0.06 0.402 0.06 0.05-0.07 0.720
male 144 33 0.05 0.04-0.07 0.05 0.04-0.06 0.05 0.04-0.06
female 156 31 0.06 0.05-0.07 0.849 0.06 0.05-0.07 0.500 0.05 0.04-0.06 0.659
Māori 87 26 0.05 0.04-0.07 0.05 0.04-0.07 0.05 0.04-0.06
non-Māori 213 38 0.05 0.05-0.06 0.531 0.05 0.05-0.06 0.326 0.05 0.04-0.06 0.379
Northland/Auckland 50 6 0.07 0.05-0.09 0.06 0.04-0.07 0.06 0.05-0.08
Waikato/BoP 48 14 0.05 0.03-0.06 0.05 0.03-0.07 0.04 0.03-0.06
lower North Island 172 32 0.06 0.05-0.07 0.06 0.05-0.07 0.05 0.05-0.07
South Island 30 12 0.03 0.02-0.05 0.018 0.03 0.02-0.05 0.030 0.03 0.02-0.04 0.009
LOD: limit of detection (0.02 µg/L); 95%CI: 95% confidence interval of the geometric mean (GM); R2: R-squared of the
multivariate linear regression model; p-value: the p-value of the multivariate linear regression model for that variable; crea: creatinine adjusted; spgr: specific gravity adjusted.

42 | P a g e
4.2.7. Urinary antimony Antimony (Sb) is a silvery-white metal that is found in the earth’s crust. Certain mineral deposits, hot springs and mining can result in locally elevated soil levels. Antimony is used in lead storage batteries, solder, sheet and pipe metal, bearings, castings, and pewter. Antimony oxide is added to textiles and plastics as a flame retardant. It is also used in paints, ceramics, and fireworks, and as enamels for plastics, metal, and glass. Antimony toxicity can occur due to occupational exposure. The general population is exposed to antimony primarily through food, tobacco smoking and, to a lesser extent, from air and drinking water. Levels of urinary antimony reflect recent exposure. The results for antimony are presented in Table 15a for adults and Table 15b for children. Antimony was detected in 90% of the adult urine samples and 99% of the child urine samples. The geometric mean urinary antimony was 0.06 µg/L for adults and 0.09 µg/L for children. The arithmetic mean urinary antimony was 0.10 µg/L for adults and 0.11 µg/L for children. The 95th percentile was 0.22 µg/L for adults and 0.25 µg/L for children. Among adults, there were no consistent differences in urinary antimony levels between age groups, men and women, ethnicity groups, or geographic regions. Among children, the GM for urinary antimony was higher for girls compared to boys and lowest in the Northland/Auckland region. For adults who indicated they were currently a smoker (n=26), the GM was 0.12 µg/L (95%CI 0.09-0.16). For adults who indicated they were currently not a smoker (n=278), the GM was 0.06 µg/L (95%CI 0.05-0.07).

43 | P a g e
Table 15a. Geometric means for urinary antimony, adults.
n n<
LOD GM
µg/L 95%CI (R2) p-value
GM µg/g crea 95%CI
(R2) p-value
GM µg/L spgr 95%CI
(R2) p-value
all 304 29 0.062 0.055-0.069 (0.060) 0.049 0.044-0.055 (0.024) 0.068 0.061-0.075 (0.019)
age 19-24 53 3 0.071 0.058-0.089 0.046 0.036-0.058 0.074 0.060-0.092
25-34 65 2 0.072 0.060-0.087 0.046 0.038-0.055 0.070 0.060-0.083
35-49 83 8 0.064 0.052-0.080 0.051 0.041-0.064 0.071 0.058-0.088
50-64 103 16 0.050 0.041-0.061 0.037 0.052 0.043-0.063 0.840 0.060 0.050-0.073 0.438
male 140 13 0.071 0.060-0.083 0.045 0.039-0.053 0.068 0.058-0.079
female 164 16 0.055 0.048-0.063 0.014 0.053 0.046-0.061 0.139 0.068 0.059-0.077 0.980
Māori 115 9 0.066 0.056-0.077 0.052 0.044-0.061 0.070 0.060-0.081
non-Māori 189 20 0.059 0.051-0.068 0.256 0.048 0.042-0.055 0.535 0.066 0.058-0.076 0.611
Northland/Auckland 67 7 0.054 0.043-0.067 0.043 0.034-0.054 0.061 0.050-0.076
Waikato/BoP 84 10 0.069 0.056-0.085 0.048 0.040-0.058 0.070 0.058-0.085
lower North Island 78 6 0.058 0.048-0.071 0.048 0.040-0.059 0.063 0.053-0.075
South Island 75 6 0.065 0.051-0.082 0.310 0.058 0.046-0.072 0.324 0.076 0.061-0.094 0.443
LOD: limit of detection (0.02 µg/L); 95%CI: 95% confidence interval of the geometric mean (GM); R2: R-squared of the
multivariate linear regression model; p-value: the p-value of the multivariate linear regression model for that variable; crea: creatinine adjusted; spgr: specific gravity adjusted.
Table 15b. Geometric means for urinary antimony, children.
n n<
LOD GM
µg/L 95%CI (R2) p-value
GM µg/g crea 95%CI
(R2) p-value
GM µg/L spgr 95%CI
(R2) p-value
all 300 3 0.091 0.085-0.098 (0.054) 0.091 0.084-0.098 (0.195) 0.085 0.079-0.091 (0.086)
5-7 64 0 0.095 0.081-0.111 0.111 0.095-0.131 0.085 0.075-0.097
8-10 120 0 0.097 0.088-0.107 0.105 0.095-0.116 0.090 0.083-0.099
11-18 116 3 0.084 0.073-0.096 0.308 0.070 0.061-0.080 <0.0001 0.079 0.070-0.089 0.276
male 144 0 0.087 0.079-0.096 0.084 0.075-0.093 0.078 0.072-0.085
female 156 3 0.095 0.085-0.107 0.169 0.098 0.088-0.109 0.004 0.091 0.083-0.101 0.008
Māori 87 1 0.100 0.086-0.117 0.098 0.084-0.114 0.092 0.081-0.104
non-Māori 213 2 0.088 0.081-0.096 0.105 0.088 0.081-0.096 0.308 0.082 0.076-0.089 0.159
Northland/Auckland 50 3 0.073 0.056-0.094 0.058 0.046-0.072 0.065 0.053-0.081
Waikato/BoP 48 0 0.106 0.088-0.126 0.112 0.094-0.135 0.101 0.087-0.117
lower North Island 172 0 0.092 0.084-0.100 0.096 0.088-0.105 0.087 0.080-0.093
South Island 30 0 0.102 0.084-0.123 0.029 0.101 0.083-0.123 <0.0001 0.088 0.075-0.104 0.002
LOD: limit of detection (0.02 µg/L); 95%CI: 95% confidence interval of the geometric mean (GM); R2: R-squared of the
multivariate linear regression model; p-value: the p-value of the multivariate linear regression model for that variable; crea: creatinine adjusted; spgr: specific gravity adjusted.
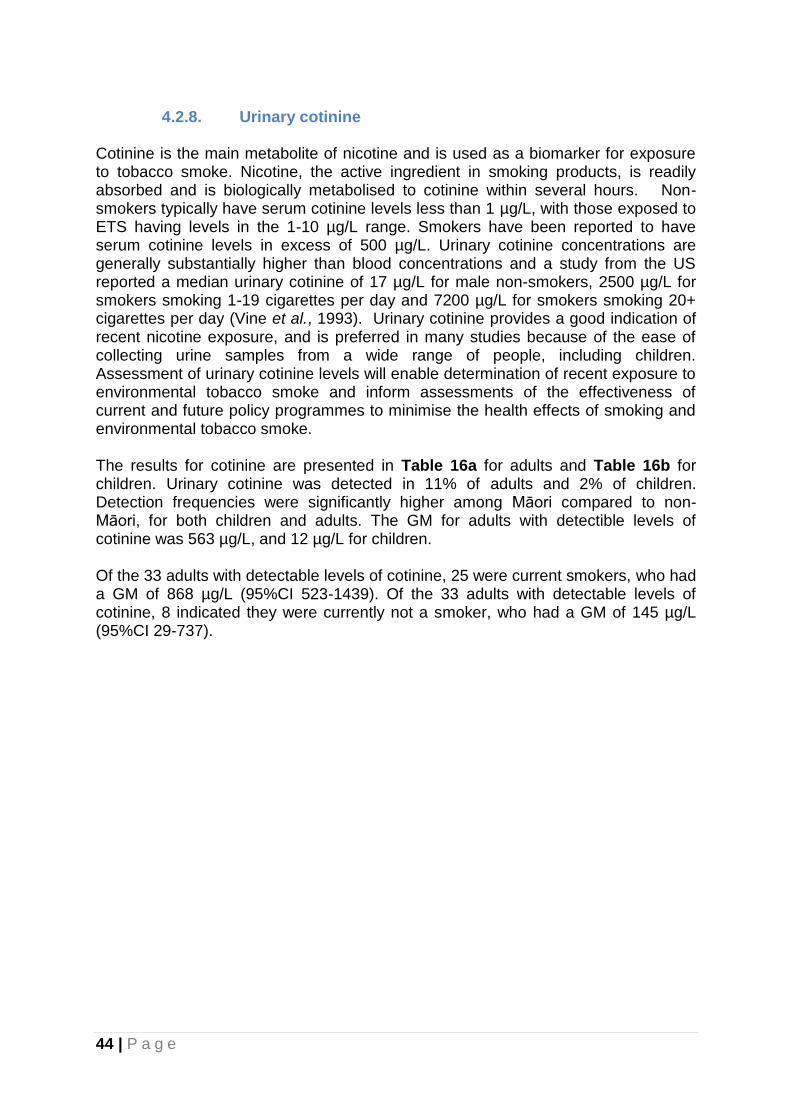
44 | P a g e
4.2.8. Urinary cotinine Cotinine is the main metabolite of nicotine and is used as a biomarker for exposure to tobacco smoke. Nicotine, the active ingredient in smoking products, is readily absorbed and is biologically metabolised to cotinine within several hours. Non-smokers typically have serum cotinine levels less than 1 µg/L, with those exposed to ETS having levels in the 1-10 µg/L range. Smokers have been reported to have serum cotinine levels in excess of 500 µg/L. Urinary cotinine concentrations are generally substantially higher than blood concentrations and a study from the US reported a median urinary cotinine of 17 µg/L for male non-smokers, 2500 µg/L for smokers smoking 1-19 cigarettes per day and 7200 µg/L for smokers smoking 20+ cigarettes per day (Vine et al., 1993). Urinary cotinine provides a good indication of recent nicotine exposure, and is preferred in many studies because of the ease of collecting urine samples from a wide range of people, including children. Assessment of urinary cotinine levels will enable determination of recent exposure to environmental tobacco smoke and inform assessments of the effectiveness of current and future policy programmes to minimise the health effects of smoking and environmental tobacco smoke. The results for cotinine are presented in Table 16a for adults and Table 16b for children. Urinary cotinine was detected in 11% of adults and 2% of children. Detection frequencies were significantly higher among Māori compared to non-Māori, for both children and adults. The GM for adults with detectible levels of cotinine was 563 µg/L, and 12 µg/L for children. Of the 33 adults with detectable levels of cotinine, 25 were current smokers, who had a GM of 868 µg/L (95%CI 523-1439). Of the 33 adults with detectable levels of cotinine, 8 indicated they were currently not a smoker, who had a GM of 145 µg/L (95%CI 29-737).
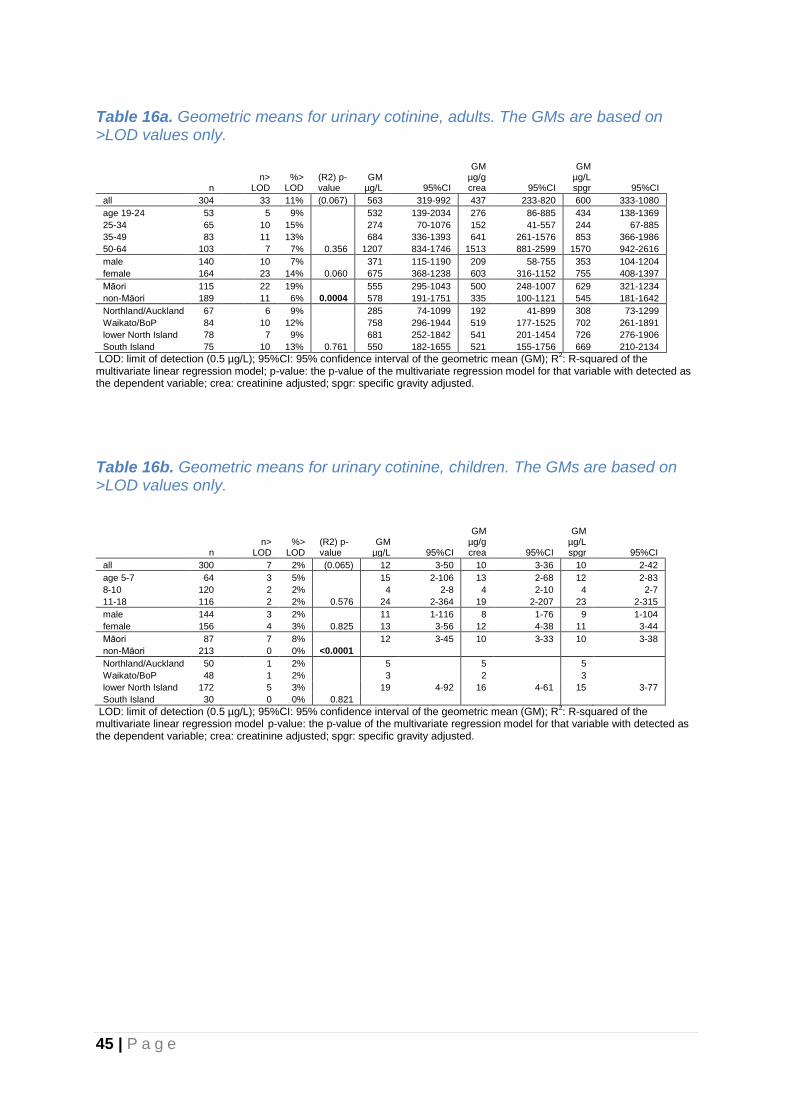
45 | P a g e
Table 16a. Geometric means for urinary cotinine, adults. The GMs are based on >LOD values only.
n n>
LOD %>
LOD (R2) p-value
GM µg/L 95%CI
GM µg/g crea 95%CI
GM µg/L spgr 95%CI
all 304 33 11% (0.067) 563 319-992 437 233-820 600 333-1080
age 19-24 53
5 9% 532 139-2034 276 86-885 434 138-1369
25-34 65
10 15% 274 70-1076 152 41-557 244 67-885
35-49 83
11 13% 684 336-1393 641 261-1576 853 366-1986
50-64 103 7 7% 0.356 1207 834-1746 1513 881-2599 1570 942-2616
male 140
10 7% 371 115-1190 209 58-755 353 104-1204
female 164 23 14% 0.060 675 368-1238 603 316-1152 755 408-1397
Māori 115
22 19% 555 295-1043 500 248-1007 629 321-1234
non-Māori 189 11 6% 0.0004 578 191-1751 335 100-1121 545 181-1642
Northland/Auckland 67
6 9% 285 74-1099 192 41-899 308 73-1299
Waikato/BoP 84
10 12% 758 296-1944 519 177-1525 702 261-1891
lower North Island 78
7 9% 681 252-1842 541 201-1454 726 276-1906
South Island 75 10 13% 0.761 550 182-1655 521 155-1756 669 210-2134
LOD: limit of detection (0.5 µg/L); 95%CI: 95% confidence interval of the geometric mean (GM); R2: R-squared of the
multivariate linear regression model; p-value: the p-value of the multivariate regression model for that variable with detected as the dependent variable; crea: creatinine adjusted; spgr: specific gravity adjusted.
Table 16b. Geometric means for urinary cotinine, children. The GMs are based on >LOD values only.
n n>
LOD %>
LOD (R2) p-value
GM µg/L 95%CI
GM µg/g crea 95%CI
GM µg/L spgr 95%CI
all 300 7 2% (0.065) 12 3-50 10 3-36 10 2-42
age 5-7 64
3 5% 15 2-106 13 2-68 12 2-83
8-10 120
2 2% 4 2-8 4 2-10 4 2-7
11-18 116 2 2% 0.576 24 2-364 19 2-207 23 2-315
male 144
3 2% 11 1-116 8 1-76 9 1-104
female 156 4 3% 0.825 13 3-56 12 4-38 11 3-44
Māori 87
7 8%
12 3-45 10 3-33 10 3-38
non-Māori 213 0 0% <0.0001
Northland/Auckland 50
1 2% 5
5
5
Waikato/BoP 48
1 2% 3
2
3
lower North Island 172
5 3% 19 4-92 16 4-61 15 3-77
South Island 30 0 0% 0.821
LOD: limit of detection (0.5 µg/L); 95%CI: 95% confidence interval of the geometric mean (GM); R2: R-squared of the
multivariate linear regression model p-value: the p-value of the multivariate regression model for that variable with detected as the dependent variable; crea: creatinine adjusted; spgr: specific gravity adjusted.

46 | P a g e
4.2.9. Urinary fluoride Fluoride is an ion of fluorine and is ubiquitous in the environment in air, soil, water, plants, animals and food. Fluoride is known to have a protective effect against tooth decay by preventing demineralization of tooth enamel during attack by acid-producing plaque bacteria. In infants and young children ingested fluoride is incorporated into the developing enamel, making the teeth more resistant to decay. Fluoride is added to most tooth pastes and fluoride is also added to approximately half of New Zealand’s public water supplies as an equitable way to prevent dental caries. Fluoridation of the public drinking water supplies involves the deliberate adjustment of fluoride concentrations in drinking water from their natural low levels (0.1-0.2 mg/L in most parts of New Zealand) upward up to between 0.7 and 1.0 mg/L (Royal Society of New Zealand, 2014). There is some controversy regarding fluoridation of water supplies in New Zealand because of perceived health concerns related to exposure to excess fluoride (e.g. dental fluorosis in children, unsubstantiated links with cancer, allergic conditions, and other diseases). However, the only observed side effect of fluoridation at levels used in New Zealand is minimal fluorosis, which is not considered of major cosmetic significance (Royal Society of New Zealand, 2014). There is compelling evidence that fluoridation of water at the established and recommended levels produces broad benefits for the dental health of New Zealanders (Royal Society of New Zealand, 2014). Urinary fluoride reflects recent exposure. The results for fluoride are presented in Table 17a for adults and Table 17b for children. Fluoride was detected in all urine samples. The geometric mean urinary fluorine was 760 µg/L for adults and 630 µg/L for children. The arithmetic mean urinary fluorine concentration was 893 µg/L for adults and 752 µg/L for children. The 95th percentile was 1760 µg/L for adults and 1600 µg/L for children. Among children, older age was associated with lower urinary fluoride levels. Among adults, a higher urinary fluoride level was observed for females compared to males after creatinine or specific gravity adjustment. This gender pattern was not observed among children. For both children and adults, the lowest geometric mean urinary fluoride level was observed for the South Island.

47 | P a g e
Table 17a. Geometric means for urinary fluoride, adults.
n n<
LOD GM
µg/L 95%CI (R2) p-value
GM µg/g crea 95%CI
(R2) p-value
GM µg/L spgr 95%CI
(R2) p-value
all 304 0 759 710-812 (0.132) 608 563-657 (0.237) 833 778-892 (0.156)
age 19-24 53 0 804 700-924 515 442-599 832 729-950
25-34 65 0 740 645-850 472 414-538 723 631-829
35-49 83 0 749 651-863 597 511-697 833 721-962
50-64 103 0 757 675-849 0.932 789 690-904 <0.0001 912 809-1029 0.055
male 140 0 778 708-854 499 455-548 744 681-814
female 164 0 744 677-818 0.332 720 644-805 <0.0001 918 831-1013 0.002
Māori 115 0 758 681-845 598 525-681 805 717-903
non-Māori 189 0 760 698-827 0.859 615 559-676 0.525 851 782-926 0.370
Northland/Auckland 67 0 964 842-1103 776 669-900 1101 968-1253
Waikato/BoP 84 0 797 706-901 558 490-636 812 730-904
lower North Island 78 0 821 727-928 680 573-808 886 762-1031
South Island 75 0 535 474-604 <0.0001 479 417-551 <0.0001 627 551-713 <0.0001
LOD: limit of detection (19 µg/L); 95%CI: 95% confidence interval of the geometric mean (GM); R2: R-squared of the
multivariate linear regression model; p-value: the p-value of the multivariate linear regression model for that variable; crea: creatinine adjusted; spgr: specific gravity adjusted.
Table 17b. Geometric means for urinary fluoride, children.
n n<
LOD GM
µg/L 95%CI (R2) p-value
GM µg/g crea 95%CI
(R2) p-value
GM µg/L spgr 95%CI
(R2) p-value
all 299 0 628 586-674 (0.190) 626 577-678 (0.307) 584 546-624 (0.210)
age 5-7 64 0 743 642-859 871 754-1006 668 584-764
8-10 120 0 679 616-750 731 653-817 629 567-698
11-18 115 0 528 469-593 0.001 443 389-503 <0.0001 500 448-559 0.003
male 144 0 651 588-720 624 555-701 584 529-644
female 155 0 608 553-669 0.138 627 562-701 0.933 584 532-640 0.654
Māori 87 0 597 528-675 583 509-669 546 489-609
non-Māori 212 0 642 590-698 0.152 644 584-710 0.040 600 552-652 0.044
Northland/Auckland 50 0 492 410-590 390 317-480 444 379-520
Waikato/BoP 48 0 502 422-597 535 426-671 481 408-566
lower North Island 171 0 762 704-826 796 735-862 716 664-773
South Island 30 0 450 370-546 <0.0001 448 344-583 <0.0001 391 314-487 <0.0001
LOD: limit of detection (19 µg/L); 95%CI: 95% confidence interval of the geometric mean (GM); R2: R-squared of the
multivariate linear regression model; p-value: the p-value of the multivariate linear regression model for that variable; crea: creatinine adjusted; spgr: specific gravity adjusted. For one of the 300 available urine samples fluoride results were not available due to insufficient sample to perform the analysis.
48 | P a g e
4.2.10. Urinary phenols Urinary bisphenol A Bisphenol A (BPA) is a phenolic chemical used primarily as a monomer in polycarbonate plastics and epoxy resins. Polycarbonate plastics are rigid plastics used to make products such as compact discs, automobile parts, eyeglass lenses, toys, as well as products that can get into direct contact with food such as baby bottles and plastic dinnerware. Epoxy resins are used for lining canned food containers, wine vat linings, epoxy resin-based paints, floorings and some dental composites. Population exposure to BPA may occur through ingestion of food, which has been in contact with BPA containing materials. BPA is more likely to migrate into oily or fatty foods such as meat, fish and coconut cream. BPA is classified by the New Zealand Environmental Protection Authority as a “suspected human reproductive or developmental toxicant” (6.8B) and as “acutely toxic (oral and dermal)” (6.1E). BPA has weak estrogenic properties i.e. it has the capacity to mimic the female sex hormone, but the human health effects from BPA from low environmental exposures are unknown. The average dietary exposure to BPA by New Zealanders from consumption of canned foods has been estimated as 0.0008 µg/kg body weight/day, based on measurements of BPA in canned foods and New Zealand dietary recall data (Thompson and Grounds, 2005). The European Food Safety Authority (EFSA) published a re-evaluation of BPA exposure and toxicity in 2015 when it reduced the tolerable daily intake (TDI) for BPA from 50 to 4 µg/kg body weight/day (EFSA, 2016). There is no evidence that BPA accumulates in the body. Urinary levels of BPA include both conjugated and unconjugated forms and reflect recent exposure. The results for urinary BPA are presented in Table 18a for adults and 18b for children. The detection frequency was 93% for adults and 89% for children. The geometric mean urinary BPA was 1.8 μg/L for adults and 2.2 μg/L for children. The arithmetic mean urinary triclosan concentration was 3.1 μg/L for adults and 3.2 μg/L for children, and the 95th percentile was 11.7 μg/L for adults and 9.6 μg/L for children. Of all age groups, the geometric mean of the 19-24 year age group was the highest (2.9 μg/L). The oldest age group (50-64) had the lowest GM for BPA (1.4 μg/L). There were no consistent differences in urinary BPA concentrations between males and females or between Māori and non-Māori. For children, differences among geographic regions were observed, with the highest GM for the Northland/Auckland region (3.2 μg/L).

49 | P a g e
Table 18a. Geometric means for urinary bisphenol A, adults.
n n<
LOD GM μg/L 95% CI
(R2) p-value
GM μg/g crea
95% CI
(R2) p-value
GM μg/L spgr 95% CI
(R2) p-value
all 302 20 1.80 1.60-2.03 (0.095) 1.45 1.30-1.61 (0.026) 1.98 1.78-2.21 (0.057)
age 19-24 53 1 2.88 2.22-3.74 1.84 1.46-2.33 2.98 2.36-3.78
25-34 65 5 2.03 1.54-2.66 1.29 0.99-1.69 1.98 1.53-2.56
35-49 82 10 1.73 1.36-2.20 1.39 1.14-1.71 1.93 1.57-2.38
50-64 102 4 1.36 1.15-1.61 0.0003 1.41 1.19-1.67 0.241 1.63 1.38-1.93 0.005
male 140 8 2.12 1.77-2.55 1.36 1.15-1.61 2.03 1.71-2.41
female 162 12 1.57 1.34-1.82 0.006 1.52 1.33-1.75 0.328 1.93 1.69-2.22 0.596
Maori 114 9 1.82 1.49-2.22 1.45 1.21-1.74 1.94 1.61-2.34
non-Maori 188 11 1.79 1.55-2.07 0.604 1.44 1.26-1.65 0.897 2.00 1.75-2.28 0.977
Northland/Auckland 67 2 2.10 1.63-2.69 1.69 1.35-2.11 2.40 1.92-2.99
Waikato/BoP 83 6 1.95 1.57-2.42 1.38 1.13-1.69 2.00 1.64-2.45
lower North Island 77 8 1.65 1.30-2.08 1.36 1.08-1.70 1.77 1.42-2.20
South Island 75 4 1.58 1.24-2.01 0.486 1.42 1.15-1.74 0.540 1.85 1.48-2.31 0.397
LOD: limit of detection (0.4 µg/L); 95%CI: 95% confidence interval of the geometric mean (GM); R2: R-squared of the
multivariate linear regression model; p-value: the p-value of the multivariate linear regression model for that variable; crea: creatinine adjusted; spgr: specific gravity adjusted.
Table 18b. Geometric means for urinary bisphenol A, children.
n n<
LOD GM
μg/L 95%CI (R2) p-value
GM μg/g crea 95%CI
(R2) p-value
GM μg/L spgr 95%CI
(R2) p-value
all 299 34 2.18 1.96-2.41 (0.080) 2.17 1.96-2.39 (0.086) 2.02 1.83-2.23 (0.081)
age 5-7 64 9 2.17 1.71-2.74 2.54 2.06-3.14 1.95 1.57-2.43
8-10 120 13 2.21 1.88-2.60 2.38 2.04-2.78 2.05 1.74-2.41
11-18 115 12 2.14 1.82-2.53 0.568 1.80 1.53-2.11 0.002 2.03 1.74-2.38 0.557
male 144 13 2.38 2.05-2.76 2.28 1.97-2.64 2.13 1.85-2.46
female 155 21 2.00 1.73-2.31 0.099 2.07 1.80-2.36 0.489 1.92 1.67-2.21 0.304
Maori 87 9 2.60 2.21-3.06 2.54 2.20-2.94 2.38 2.06-2.75
non-Maori 212 25 2.02 1.78-2.30 0.136 2.03 1.79-2.30 0.292 1.89 1.67-2.15 0.219
Northland/Auckland 50 4 3.24 2.57-4.09 2.57 2.04-3.24 2.92 2.31-3.70
Waikato/BoP 48 4 2.35 1.85-2.98 2.50 1.91-3.27 2.25 1.84-2.75
lower North Island 171 21 2.05 1.79-2.35 2.14 1.88-2.44 1.93 1.69-2.20
South Island 30 5 1.39 1.01-1.91 0.001 1.38 1.05-1.82 0.004 1.21 0.89-1.63 0.0003
LOD: limit of detection (0.4 µg/L); 95%CI: 95% confidence interval of the geometric mean (GM); R2: R-squared of the multivariate
linear regression model; p-value: the p-value of the multivariate linear regression model for that variable; crea: creatinine adjusted; spgr: specific gravity adjusted.

50 | P a g e
Urinary triclosan Triclosan has been used internationally as a preservative and antiseptic agent in consumer products (e.g. soaps, deodorants) for over 30 years. General population exposure results from the use and ingestion of triclosan-containing products via oral ingestion and dermal absorption. Triclosan is not currently known to be hazardous to humans and classified by the New Zealand Environmental Protection Authority as “acutely toxic (oral)” (6.1E) based on animal data. The human health effects of low-level exposure to triclosan are unknown, but some animal studies suggest it may be an endocrine disrupting chemical, and there is some evidence that triclosan exposure is associated with increased allergies in young people (Bertelsen et al., 2012). In humans, triclosan is excreted in urine and faeces, and urine is the preferred biological matrix for exposure assessment, reflecting recent exposure. The results for urinary triclosan are presented in Table 19a for adults and 19b for children. The detection frequency was 85% for adults and 92% for children. The geometric mean urinary triclosan was 5.8 μg/L for adults and 3.9 μg/L for children. The arithmetic mean urinary triclosan concentration was 133 μg/L for adults and 88 μg/L for children, and the 95th percentile was 963 μg/L for adults and 607 μg/L for children. Of all age groups, the geometric mean of the 19-24 year age group was the highest (14.2 μg/L). There were no consistent differences in urinary triclosan concentrations between males and females or among the different geographic regions. There were marked differences in urinary triclosan concentrations between Māori and non-Māori children, with the GM for non-Māori children more than double the GM for Māori children. For adults this difference between ethnic groups was much less pronounced and did not reach statistical significance. Of the 303 adults who provided a urine sample, 157 indicated they had used anti-bacterial soaps or hand sanitizers in the 48 hours before urine sampling, with a GM of 8.59 µg/L (95%CI 5.42-13.61). The GM of the 146 adults who did not recall using these products 48 hours before sampling was 3.76 µg/L (95%CI 2.57-5.52). Children indicating having used anti-bacterial soaps or hand sanitizers in the 48 hours before urine sampling (n=73), had a GM urinary triclosan concentration of 4.69 μg/L, marginally higher compared to the GM of 125 children that did not recall using these products (3.36 μg/L).

51 | P a g e
Table 19a. Geometric means for urinary triclosan, adults.
n n<
LOD GM
µg/L 95%CI (R2) p-value
GM µg/g crea 95%CI
(R2) p-value
GM µg/L spgr 95%CI
(R2) p-value
all 303 44 5.77 4.26-7.82 (0.038) 4.63 3.43-6.25 (0.037) 6.34 4.69-8.56 (0.039)
age 19-24 53 2 14.15 6.97-28.75 9.06 4.34-18.92 14.65 7.10-30.20
25-34 65 8 5.74 3.14-10.50 3.66 2.01-6.68 5.61 3.07-10.25
35-49 82 11 5.01 2.79-9.00 4.04 2.28-7.16 5.61 3.17-9.91
50-64 103 23 4.08 2.40-6.94 0.040 4.24 2.50-7.17 0.215 4.90 2.90-8.30 0.077
male 141 20 5.88 3.84-9.00 3.78 2.48-5.77 5.64 3.68-8.62
female 162 24 5.68 3.69-8.73 0.939 5.52 3.62-8.43 0.184 7.02 4.60-10.71 0.433
Māori 114 16 4.70 2.90-7.63 3.74 2.29-6.10 5.01 3.09-8.11
non-Māori 189 28 6.53 4.43-9.63 0.389 5.27 3.60-7.70 0.309 7.30 4.98-10.71 0.281
Northland/Auckland 67 15 4.71 2.50-8.88 3.79 2.01-7.14 5.38 2.89-10.01
Waikato/BoP 83 9 5.30 3.05-9.20 3.75 2.19-6.43 5.43 3.16-9.34
lower North Island 77 14 5.24 2.82-9.72 4.31 2.34-7.94 5.62 3.02-10.47
South Island 76 6 8.35 4.48-15.57 0.396 7.47 4.04-13.84 0.197 9.79 5.29-18.10 0.271
LOD: limit of detection (0.4 µg/L); 95%CI: 95% confidence interval of the geometric mean (GM); R2: R-squared of the
multivariate linear regression model; p-value: the p-value of the multivariate linear regression model for that variable; crea: creatinine adjusted; spgr: specific gravity adjusted.
Table 19b. Geometric means for urinary triclosan, children.
n n<
LOD GM
µg/L 95%CI (R2) p-value
GM µg/g crea 95%CI
(R2) p-value
GM µg/L spgr 95%CI
(R2) p-value
all 299 24 3.85 2.96-5.03 (0.074) 3.84 2.95-4.99 (0.076) 3.58 2.75-4.66 (0.084)
age 5-7 64 5 2.29 1.38-3.81 2.69 1.65-4.38 2.06 1.27-3.33
8-10 120 13 3.60 2.33-5.57 3.87 2.52-5.95 3.34 2.17-5.14
11-18 115 6 5.52 3.61-8.47 0.119 4.63 2.99-7.17 0.521 5.24 3.42-8.03 0.086
male 144 11 3.30 2.28-4.77 3.16 2.17-4.62 2.96 2.05-4.27
female 155 13 4.45 3.05-6.51 0.141 4.59 3.19-6.61 0.061 4.27 2.94-6.21 0.079
Māori 87 9 1.78 1.25-2.55 1.74 1.22-2.50 1.63 1.14-2.33
non-Māori 212 15 5.29 3.78-7.40 0.0003 5.30 3.81-7.38 0.0001 4.94 3.55-6.88 0.0002
Northland/Auckland 50 2 3.16 1.80-5.54 2.50 1.41-4.44 2.85 1.62-5.01
Waikato/BoP 48 4 5.38 2.76-10.48 5.73 3.01-10.90 5.15 2.69-9.86
lower North Island 171 16 3.54 2.46-5.08 3.69 2.57-5.30 3.32 2.31-4.77
South Island 30 2 5.16 2.25-11.85 0.459 5.14 2.38-11.09 0.222 4.49 2.08-9.70 0.379
LOD: limit of detection (0.4 µg/L); 95%CI: 95% confidence interval of the geometric mean (GM); R2: R-squared of the
multivariate linear regression model; p-value: the p-value of the multivariate linear regression model for that variable; crea: creatinine adjusted; spgr: specific gravity adjusted.
52 | P a g e
Urinary benzophenone-3 (BP-3) Benzophenone-3 (2-hydroxy-4-methoxybenzophenone) is used as a sunscreen or sun-block in lotions, conditioners, and cosmetics and as a UV stabilizer in plastic surface coatings and polymers. Human exposure to BP-3 may occur through dermal application of sunscreens and cosmetic products. Small amounts of BP-3 can be absorbed through human skin and excreted in the urine (Gonzalez et al., 2006). A study in the US population, based on NHANES data, indicated an increasing trend of urinary BP-3 concentration since 2005-2006, with consistently higher levels in females than in males (Han et al., 2016). Human health effects of BP-3 are unclear but recent in vivo and in vitro studies have indicated potential endocrine-disrupting effects of BP-3 such as disturbance of estrogenic signalling, androgenic activity, and the hypothalamic pituitary axis (Krause et al., 2012). Urinary BP-3 levels include both conjugated and unconjugated forms and reflect recent exposure. The results for urinary BP-3 are presented in Table 20a for adults and 20b for children. BP-3 was detected in all but one of the urinary samples from children and adults. The geometric mean urinary BP-3 was 18.4 μg/L for adults and 20.8 μg/L for children. The specific gravity adjusted urinary concentrations were very similar for adults and children (GMs of 20.2 and 19.4 μg/L respectively). The arithmetic mean urinary BP-3 was 125 μg/L for adults and 101 μg/L for children. The 95th percentile was 585 μg/L for adults and 279 μg/L for children. Age was an important determinant of urinary BP-3 concentrations for adults, with the highest concentrations observed for the younger age groups. Among children, urinary concentrations of BP-3 were comparable across the three age groups. BP-3 urinary concentrations were higher among females compared to males, particularly for adults. For both adults and children, Māori had lower urinary BP-3 concentrations compared to non-Māori. Among children, the GM for urinary BP-3 was 3 to 5 times lower in the South Island compared to the three North Island regions. Of the 303 adults, 29 reported to have used sunscreen in the 48 hours prior to urine sampling, with a geometric mean urinary BP-3 concentration of 159.8 μg/L. The 274 adults who had not used sunscreen in the past 48 hours had a geometric mean urinary BP-3 concentration of 14.6 μg/L. Children who reported to have used sunscreen in the 48 hours prior to urine sampling (n=8), had a geometric mean urinary BP-3 concentration of 22.9 μg/L. Children who reported to not have used sunscreen in the past 48 hours (n=189), had a geometric mean urinary BP-3 concentration of 17.9 μg/L.

53 | P a g e
Table 20a. Geometric means for urinary benzophenone-3, adults.
n n<
LOD GM
µg/L 95%CI (R2) p-value
GM µg/g crea 95%CI
(R2) p-value
GM µg/L spgr 95%CI
(R2) p-value
all 303 1 18.4 14.9-22.7 (0.141) 14.8 12.0-18.2 (0.144) 20.2 16.4-25.0 (0.149)
age 19-24 53 0 33.9 21.2-54.4 21.7 13.4-35.1 35.1 21.6-57.1
25-34 65 0 34.9 22.2-54.9 22.3 13.9-35.7 34.1 21.4-54.4
35-49 82 0 17.9 12.2-26.3 14.5 10.0-21.1 20.1 13.7-29.4
50-64 103 1 9.1 6.5-12.9 <0.0001 9.5 6.7-13.4 0.007 11.0 7.8-15.5 <0.0001
male 141 1 12.7 9.6-16.7 8.1 6.3-10.6 12.2 9.3-15.9
female 162 0 25.5 18.7-34.6 0.0008 24.8 18.5-33.2 0.0001 31.5 23.2-42.7 <0.0001
Māori 114 0 14.1 9.9-20.2 11.2 7.9-15.9 15.1 10.6-21.4
non-Māori 189 1 21.6 16.7-27.9 0.050 17.4 13.5-22.5 0.026 24.1 18.6-31.3 0.022
Northland/Auckland 67 0 18.6 12.6-27.6 15.0 9.8-22.9 21.3 14.0-32.3
Waikato/BoP 83 0 24.1 16.0-36.3 17.1 11.8-24.7 24.7 16.7-36.5
lower North Island 77 1 16.6 10.5-26.3 13.7 8.6-21.7 17.8 11.3-28.2
South Island 76 0 15.0 10.0-22.6 0.752 13.5 9.0-20.1 0.984 17.6 11.6-26.7 0.912
LOD: limit of detection (0.2 µg/L); 95%CI: 95% confidence interval of the geometric mean (GM); R2: R-squared of the
multivariate linear regression model; p-value: the p-value of the multivariate linear regression model for that variable; crea: creatinine adjusted; spgr: specific gravity adjusted.
Table 20b. Geometric means for urinary benzophenone-3, children.
n n<
LOD GM
µg/L 95%CI (R2) p-value
GM µg/g crea 95%CI
(R2) p-value
GM µg/L spgr 95%CI
(R2) p-value
all 298 1 20.8 17.6-24.7 (0.111) 20.8 17.5-24.8 (0.124) 19.4 16.3-23.0 (0.122)
age 5-7 64 0 21.0 14.9-29.5 24.6 17.5-34.5 18.8 13.5-26.3
8-10 119 1 21.6 16.2-28.9 23.5 17.6-31.2 20.1 15.2-26.7
11-18 115 0 20.0 15.3-26.1 0.507 16.7 12.7-22.2 0.027 18.9 14.4-24.9 0.557
male 143 1 18.7 14.8-23.6 18.0 14.2-22.9 16.8 13.3-21.2
female 155 0 23.1 18.0-29.5 0.311 23.8 18.5-30.5 0.116 22.1 17.3-28.3 0.157
Māori 87 0 18.3 13.7-24.5 17.9 13.4-24.0 16.7 12.6-22.3
non-Māori 211 1 22.0 17.8-27.1 0.039 22.1 17.9-27.4 0.018 20.6 16.7-25.4 0.022
Northland/Auckland 50 0 30.3 20.0-46.0 24.0 15.3-37.7 27.4 17.9-41.9
Waikato/BoP 48 0 13.9 9.5-20.5 14.8 10.0-22.0 13.3 9.3-19.0
lower North Island 170 1 25.7 20.4-32.3 27.0 21.5-33.9 24.2 19.3-30.4
South Island 30 0 6.5 4.7-8.9 <0.0001 6.5 4.8-8.7 <0.0001 5.6 4.1-7.7 <0.0001
LOD: limit of detection (0.2 µg/L); 95%CI: 95% confidence interval of the geometric mean (GM); R2: R-squared of the
multivariate linear regression model; p-value: the p-value of the multivariate linear regression model for that variable; crea: creatinine adjusted; spgr: specific gravity adjusted.

54 | P a g e
Urinary 4-tert-octylphenol (tOP) 4-tertiary-octylphenol [tOP; 4-(1,1,3,3-tetramethylbutyl)propane], is both a degradation product of and an intermediate in the manufacture of octylphenol ethoxylates, which are nonionic surfactants used in detergents, pesticide formulations, and other applications. Exposure to tOP may occur from contact with personal care products, detergents, water, and food containing tOP.(Calafat et al., 2008). Human health effects of tOP are unknown, but tOP has been associated with developmental and reproductive alterations in aquatic species and in laboratory animals (Calafat et al., 2008). Urinary levels of 4-tert-octyphenol reflect recent exposure. TOP was detected in 3% of urine samples from adults and children and results are
therefore not presented.

55 | P a g e
Urinary parabens Parabens are esters of p-hydroxybenzoic acid and widely used as antimicrobial preservatives in cosmetics, pharmaceuticals, and food and beverage processing. The group includes methylparaben, ethylparaben, propylparaben, isopropylparaben, butylparaben, isobutylparaben, and benzylparaben, with methylparaben (MP) and propylparaben (PP) being two of the most used parabens (Andersen, 2008). General population exposure occurs with use of paraben-containing personal care products or consumption of foods or pharmaceuticals containing parabens. Concentrations can be considerably higher in females compared to males, likely reflecting the use of personal care products containing these compounds (Calafat et al., 2010). Parabens are popular preservatives because of their low toxicity and cost, their broad inertness, and their worldwide regulatory acceptance, but their potential estrogenic activity has raised some concerns (Andersen, 2008). Ethylparaben is classified by the New Zealand Environmental Protection Authority as “acutely toxic (oral)” (6.1E, based on studies in mice). In 2006, the Cosmetic Ingredient Review (CIR) expert panel concluded that methyl, ethyl, propyl, isopropyl, butyl, isobutyl, and benzyl parabens are safe as cosmetic ingredients in the practices of use and use concentrations (up to 0.4% if used alone, up to 0.8% in mixtures) (Andersen, 2008). Levels of urinary paraben metabolites reflect recent exposure.
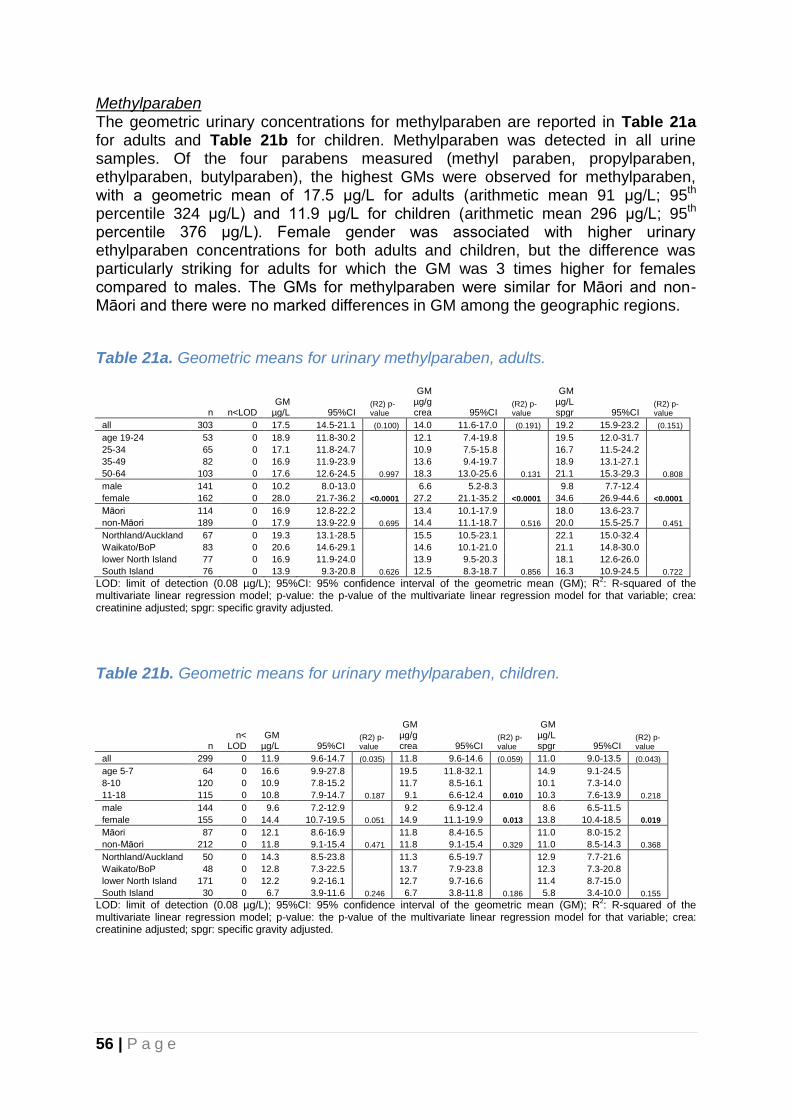
56 | P a g e
Methylparaben The geometric urinary concentrations for methylparaben are reported in Table 21a for adults and Table 21b for children. Methylparaben was detected in all urine samples. Of the four parabens measured (methyl paraben, propylparaben, ethylparaben, butylparaben), the highest GMs were observed for methylparaben, with a geometric mean of 17.5 μg/L for adults (arithmetic mean 91 μg/L; 95th percentile 324 μg/L) and 11.9 μg/L for children (arithmetic mean 296 μg/L; 95th percentile 376 μg/L). Female gender was associated with higher urinary ethylparaben concentrations for both adults and children, but the difference was particularly striking for adults for which the GM was 3 times higher for females compared to males. The GMs for methylparaben were similar for Māori and non-Māori and there were no marked differences in GM among the geographic regions.
Table 21a. Geometric means for urinary methylparaben, adults.
n n<LOD GM
µg/L 95%CI (R2) p-value
GM µg/g crea 95%CI
(R2) p-value
GM µg/L spgr 95%CI
(R2) p-value
all 303 0 17.5 14.5-21.1 (0.100) 14.0 11.6-17.0 (0.191) 19.2 15.9-23.2 (0.151)
age 19-24 53 0 18.9 11.8-30.2 12.1 7.4-19.8 19.5 12.0-31.7
25-34 65 0 17.1 11.8-24.7 10.9 7.5-15.8 16.7 11.5-24.2
35-49 82 0 16.9 11.9-23.9 13.6 9.4-19.7 18.9 13.1-27.1
50-64 103 0 17.6 12.6-24.5 0.997 18.3 13.0-25.6 0.131 21.1 15.3-29.3 0.808
male 141 0 10.2 8.0-13.0 6.6 5.2-8.3 9.8 7.7-12.4
female 162 0 28.0 21.7-36.2 <0.0001 27.2 21.1-35.2 <0.0001 34.6 26.9-44.6 <0.0001
Māori 114 0 16.9 12.8-22.2 13.4 10.1-17.9 18.0 13.6-23.7
non-Māori 189 0 17.9 13.9-22.9 0.695 14.4 11.1-18.7 0.516 20.0 15.5-25.7 0.451
Northland/Auckland 67 0 19.3 13.1-28.5 15.5 10.5-23.1 22.1 15.0-32.4
Waikato/BoP 83 0 20.6 14.6-29.1 14.6 10.1-21.0 21.1 14.8-30.0
lower North Island 77 0 16.9 11.9-24.0 13.9 9.5-20.3 18.1 12.6-26.0
South Island 76 0 13.9 9.3-20.8 0.626 12.5 8.3-18.7 0.856 16.3 10.9-24.5 0.722
LOD: limit of detection (0.08 µg/L); 95%CI: 95% confidence interval of the geometric mean (GM); R2: R-squared of the
multivariate linear regression model; p-value: the p-value of the multivariate linear regression model for that variable; crea: creatinine adjusted; spgr: specific gravity adjusted.
Table 21b. Geometric means for urinary methylparaben, children.
n n<
LOD GM
µg/L 95%CI (R2) p-value
GM µg/g crea 95%CI
(R2) p-value
GM µg/L spgr 95%CI
(R2) p-value
all 299 0 11.9 9.6-14.7 (0.035) 11.8 9.6-14.6 (0.059) 11.0 9.0-13.5 (0.043)
age 5-7 64 0 16.6 9.9-27.8 19.5 11.8-32.1 14.9 9.1-24.5
8-10 120 0 10.9 7.8-15.2 11.7 8.5-16.1 10.1 7.3-14.0
11-18 115 0 10.8 7.9-14.7 0.187 9.1 6.6-12.4 0.010 10.3 7.6-13.9 0.218
male 144 0 9.6 7.2-12.9 9.2 6.9-12.4 8.6 6.5-11.5
female 155 0 14.4 10.7-19.5 0.051 14.9 11.1-19.9 0.013 13.8 10.4-18.5 0.019
Māori 87 0 12.1 8.6-16.9 11.8 8.4-16.5 11.0 8.0-15.2
non-Māori 212 0 11.8 9.1-15.4 0.471 11.8 9.1-15.4 0.329 11.0 8.5-14.3 0.368
Northland/Auckland 50 0 14.3 8.5-23.8 11.3 6.5-19.7 12.9 7.7-21.6
Waikato/BoP 48 0 12.8 7.3-22.5 13.7 7.9-23.8 12.3 7.3-20.8
lower North Island 171 0 12.2 9.2-16.1 12.7 9.7-16.6 11.4 8.7-15.0
South Island 30 0 6.7 3.9-11.6 0.246 6.7 3.8-11.8 0.186 5.8 3.4-10.0 0.155
LOD: limit of detection (0.08 µg/L); 95%CI: 95% confidence interval of the geometric mean (GM); R2: R-squared of the
multivariate linear regression model; p-value: the p-value of the multivariate linear regression model for that variable; crea: creatinine adjusted; spgr: specific gravity adjusted.

57 | P a g e
n-Propylparaben The geometric urinary concentrations for propylparaben are reported in Table 22a for adults and Table 22b for children. Propylparaben was detected in most samples (detection frequency 100% for adults and 99% for children). The urinary propylparaben geometric mean was 3.38 μg/L for adults (arithmetic mean 22 μg/L; 95th percentile 76 μg/L) and 2.11 μg/L for children (arithmetic mean 16 μg/L; 95th percentile 41 μg/L). Female gender was associated with higher urinary propylparaben concentrations for adults, with the GM being 3 times higher for females compared to males. The GMs for propylparaben were similar for Māori and non-Māori and there were no marked differences in GM among the geographic regions.
Table 22a. Geometric means for urinary n-propylparaben, adults.
n n<
LOD GM
µg/L 95%CI (R2) p-value
GM µg/g crea 95%CI
(R2) p-value
GM µg/L spgr 95%CI
(R2) p-value
all 303 1 3.38 2.73-4.18 (0.063) 2.71 2.18-3.37 (0.130) 3.71 3.00-4.60 (0.099)
age 19-24 53 0 3.86 2.29-6.50 2.47 1.45-4.21 3.99 2.34-6.80
25-34 65 0 2.65 1.80-3.91 1.69 1.15-2.48 2.59 1.76-3.82
35-49 82 0 3.76 2.48-5.70 3.03 1.96-4.70 4.21 2.74-6.45
50-64 103 1 3.38 2.31-4.95 0.712 3.51 2.40-5.13 0.076 4.06 2.79-5.90 0.393
male 141 1 2.16 1.63-2.85 1.39 1.05-1.84 2.07 1.57-2.73
female 162 0 4.99 3.69-6.75 0.0002 4.86 3.61-6.53 <0.0001 6.17 4.59-8.30 <0.0001
Māori 114 0 3.52 2.52-4.90 2.80 1.98-3.95 3.75 2.68-5.25
non-Māori 189 1 3.30 2.50-4.34 0.777 2.66 2.01-3.52 0.944 3.69 2.80-4.86 0.985
Northland/Auckland 67 0 3.59 2.27-5.68 2.89 1.82-4.57 4.10 2.62-6.41
Waikato/BoP 83 0 4.43 2.98-6.59 3.13 2.07-4.76 4.54 3.03-6.81
lower North Island 77 1 2.83 1.84-4.35 2.32 1.51-3.58 3.03 1.97-4.65
South Island 76 0 2.86 1.90-4.30 0.446 2.56 1.66-3.93 0.720 3.35 2.19-5.12 0.536
LOD: limit of detection (0.08 µg/L); 95%CI: 95% confidence interval of the geometric mean (GM); R2: R-squared of the
multivariate linear regression model; p-value: the p-value of the multivariate linear regression model for that variable; crea: creatinine adjusted; spgr: specific gravity adjusted.
Table 22b. Geometric means for urinary n-propylparaben, children.
n n<
LOD GM
µg/L 95%CI (R2) p-value
GM µg/g crea 95%CI
(R2) p-value
GM µg/L spgr 95%CI
(R2) p-value
all 299 2 2.11 1.75-2.56 (0.021) 2.10 1.75-2.54 (0.039) 1.96 1.63-2.36 (0.022)
age 5-7 64 1 2.93 1.89-4.56 3.44 2.24-5.28 2.64 1.73-4.03
8-10 120 0 1.95 1.46-2.61 2.10 1.59-2.77 1.81 1.37-2.40
11-18 115 1 1.91 1.42-2.58 0.177 1.60 1.19-2.16 0.007 1.81 1.36-2.42 0.212
male 144 2 2.00 1.50-2.68 1.92 1.44-2.56 1.80 1.36-2.37
female 155 0 2.22 1.73-2.85 0.565 2.29 1.80-2.92 0.259 2.13 1.68-2.71 0.336
Māori 87 0 2.29 1.66-3.15 2.23 1.62-3.08 2.09 1.54-2.84
non-Māori 212 2 2.05 1.62-2.58 0.981 2.05 1.63-2.58 0.811 1.91 1.53-2.40 0.883
Northland/Auckland 50 0 2.90 1.78-4.70 2.30 1.41-3.74 2.62 1.64-4.17
Waikato/BoP 48 2 2.01 1.20-3.37 2.14 1.26-3.62 1.92 1.16-3.19
lower North Island 171 0 2.04 1.60-2.59 2.13 1.69-2.69 1.92 1.52-2.41
South Island 30 0 1.67 0.93-3.00 0.432 1.67 0.95-2.92 0.672 1.45 0.84-2.51 0.399
LOD: limit of detection (0.08 µg/L); 95%CI: 95% confidence interval of the geometric mean (GM); R2: R-squared of the
multivariate linear regression model; p-value: the p-value of the multivariate linear regression model for that variable; crea: creatinine adjusted; spgr: specific gravity adjusted.
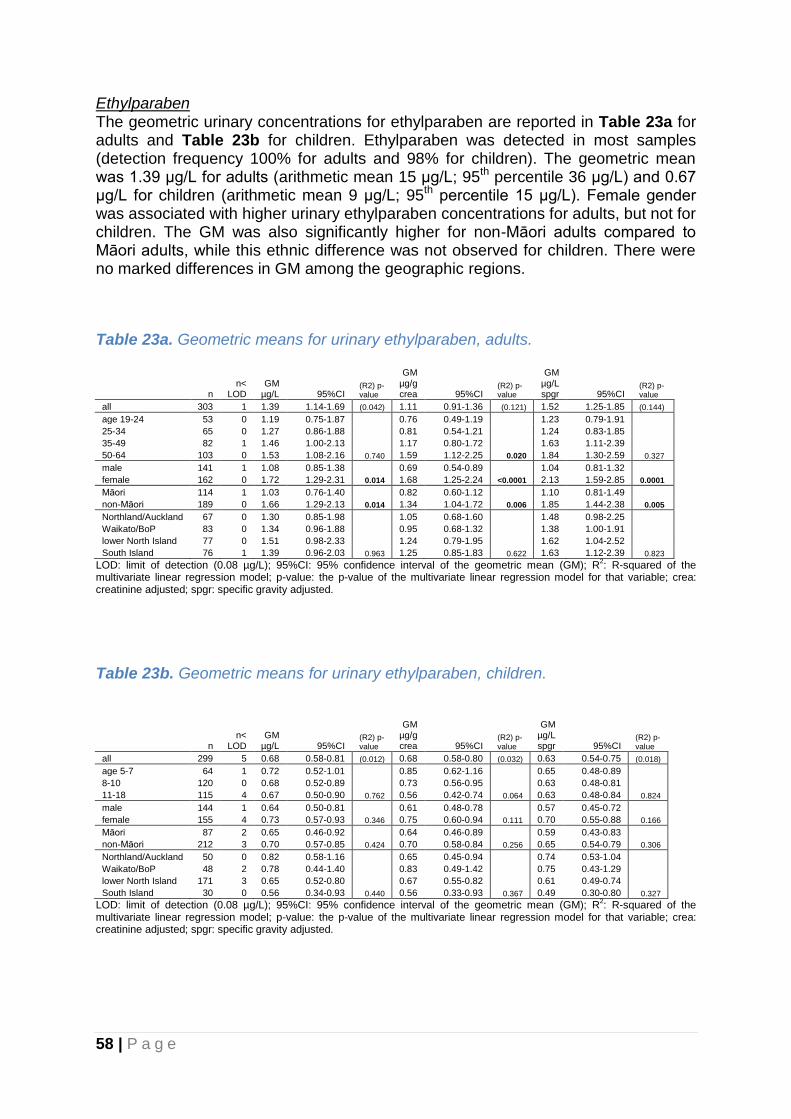
58 | P a g e
Ethylparaben The geometric urinary concentrations for ethylparaben are reported in Table 23a for adults and Table 23b for children. Ethylparaben was detected in most samples (detection frequency 100% for adults and 98% for children). The geometric mean was 1.39 μg/L for adults (arithmetic mean 15 μg/L; 95th percentile 36 μg/L) and 0.67 μg/L for children (arithmetic mean 9 μg/L; 95th percentile 15 μg/L). Female gender was associated with higher urinary ethylparaben concentrations for adults, but not for children. The GM was also significantly higher for non-Māori adults compared to Māori adults, while this ethnic difference was not observed for children. There were no marked differences in GM among the geographic regions.
Table 23a. Geometric means for urinary ethylparaben, adults.
n n<
LOD GM
µg/L 95%CI (R2) p-value
GM µg/g crea 95%CI
(R2) p-value
GM µg/L spgr 95%CI
(R2) p-value
all 303 1 1.39 1.14-1.69 (0.042) 1.11 0.91-1.36 (0.121) 1.52 1.25-1.85 (0.144)
age 19-24 53 0 1.19 0.75-1.87 0.76 0.49-1.19 1.23 0.79-1.91
25-34 65 0 1.27 0.86-1.88 0.81 0.54-1.21 1.24 0.83-1.85
35-49 82 1 1.46 1.00-2.13 1.17 0.80-1.72 1.63 1.11-2.39
50-64 103 0 1.53 1.08-2.16 0.740 1.59 1.12-2.25 0.020 1.84 1.30-2.59 0.327
male 141 1 1.08 0.85-1.38 0.69 0.54-0.89 1.04 0.81-1.32
female 162 0 1.72 1.29-2.31 0.014 1.68 1.25-2.24 <0.0001 2.13 1.59-2.85 0.0001
Māori 114 1 1.03 0.76-1.40 0.82 0.60-1.12 1.10 0.81-1.49
non-Māori 189 0 1.66 1.29-2.13 0.014 1.34 1.04-1.72 0.006 1.85 1.44-2.38 0.005
Northland/Auckland 67 0 1.30 0.85-1.98 1.05 0.68-1.60 1.48 0.98-2.25
Waikato/BoP 83 0 1.34 0.96-1.88 0.95 0.68-1.32 1.38 1.00-1.91
lower North Island 77 0 1.51 0.98-2.33 1.24 0.79-1.95 1.62 1.04-2.52
South Island 76 1 1.39 0.96-2.03 0.963 1.25 0.85-1.83 0.622 1.63 1.12-2.39 0.823
LOD: limit of detection (0.08 µg/L); 95%CI: 95% confidence interval of the geometric mean (GM); R2: R-squared of the
multivariate linear regression model; p-value: the p-value of the multivariate linear regression model for that variable; crea: creatinine adjusted; spgr: specific gravity adjusted.
Table 23b. Geometric means for urinary ethylparaben, children.
n n<
LOD GM
µg/L 95%CI (R2) p-value
GM µg/g crea 95%CI
(R2) p-value
GM µg/L spgr 95%CI
(R2) p-value
all 299 5 0.68 0.58-0.81 (0.012) 0.68 0.58-0.80 (0.032) 0.63 0.54-0.75 (0.018)
age 5-7 64 1 0.72 0.52-1.01 0.85 0.62-1.16 0.65 0.48-0.89
8-10 120 0 0.68 0.52-0.89 0.73 0.56-0.95 0.63 0.48-0.81
11-18 115 4 0.67 0.50-0.90 0.762 0.56 0.42-0.74 0.064 0.63 0.48-0.84 0.824
male 144 1 0.64 0.50-0.81 0.61 0.48-0.78 0.57 0.45-0.72
female 155 4 0.73 0.57-0.93 0.346 0.75 0.60-0.94 0.111 0.70 0.55-0.88 0.166
Māori 87 2 0.65 0.46-0.92 0.64 0.46-0.89 0.59 0.43-0.83
non-Māori 212 3 0.70 0.57-0.85 0.424 0.70 0.58-0.84 0.256 0.65 0.54-0.79 0.306
Northland/Auckland 50 0 0.82 0.58-1.16 0.65 0.45-0.94 0.74 0.53-1.04
Waikato/BoP 48 2 0.78 0.44-1.40 0.83 0.49-1.42 0.75 0.43-1.29
lower North Island 171 3 0.65 0.52-0.80 0.67 0.55-0.82 0.61 0.49-0.74
South Island 30 0 0.56 0.34-0.93 0.440 0.56 0.33-0.93 0.367 0.49 0.30-0.80 0.327
LOD: limit of detection (0.08 µg/L); 95%CI: 95% confidence interval of the geometric mean (GM); R2: R-squared of the
multivariate linear regression model; p-value: the p-value of the multivariate linear regression model for that variable; crea: creatinine adjusted; spgr: specific gravity adjusted.

59 | P a g e
Butylparaben The results for butyl parabens are reported in Table 24a for adults and Table 24b for children. Butylparaben was detected in 32% of urine samples from adults and in 33% of samples from children. Because the detection frequency was relatively low, and the ½ limit of detection (LOD) was used for those samples below LOD, the GMs are close to the limit of detection for both adults and children.
Table 24a. Geometric means for urinary butylparaben, adults.
n n<
LOD GM
µg/L 95%CI (R2) p-value
GM µg/g crea 95%CI
(R2) p-value
GM µg/L spgr 95%CI
(R2) p-value
all 303 206 0.08 0.07-0.10 (0.093) 0.07 0.06-0.08 (0.183) 0.09 0.08-0.11 (0.144)
age 19-24 53 29 0.10 0.07-0.14 0.06 0.04-0.09 0.11 0.07-0.15
25-34 65 44 0.09 0.06-0.14 0.06 0.04-0.09 0.09 0.06-0.14
35-49 82 60 0.07 0.05-0.08 0.05 0.04-0.07 0.07 0.06-0.09
50-64 103 73 0.08 0.06-0.11 0.274 0.09 0.06-0.12 0.098 0.10 0.07-0.14 0.425
male 141 113 0.06 0.05-0.07 0.04 0.03-0.04 0.06 0.05-0.06
female 162 93 0.11 0.09-0.15 <0.0001 0.11 0.09-0.14 <0.0001 0.14 0.11-0.18 <0.0001
Māori 114 82 0.07 0.05-0.08 0.05 0.04-0.07 0.07 0.06-0.09
non-Māori 189 124 0.09 0.08-0.12 0.030 0.08 0.06-0.10 0.015 0.11 0.08-0.13 0.011
Northland/Auckland 67 42 0.09 0.06-0.13 0.07 0.05-0.11 0.10 0.07-0.15
Waikato/BoP 83 57 0.08 0.06-0.10 0.06 0.04-0.07 0.08 0.06-0.11
lower North Island 77 59 0.08 0.05-0.11 0.06 0.04-0.09 0.08 0.06-0.12
South Island 76 48 0.09 0.07-0.12 0.564 0.08 0.06-0.11 0.121 0.10 0.08-0.14 0.191
LOD: limit of detection (0.08 µg/L); 95%CI: 95% confidence interval of the geometric mean (GM); R2: R-squared of the
multivariate linear regression model; p-value: the p-value of the multivariate linear regression model for that variable; crea: creatinine adjusted; spgr: specific gravity adjusted.
Table 24b. Geometric means for urinary butylparaben, children.
n n<
LOD GM
µg/L 95%CI (R2) p-value
GM µg/g crea 95%CI
(R2) p-value
GM µg/L spgr 95%CI
(R2) p-value
all 299 201 0.08 0.07-0.09 (0.015) 0.08 0.07-0.09 (0.024) 0.07 0.06-0.09 (0.022)
age 5-7 64 45 0.07 0.05-0.10 0.09 0.06-0.12 0.07 0.05-0.09
8-10 120 76 0.08 0.06-0.10 0.09 0.07-0.11 0.07 0.06-0.09
11-18 115 80 0.08 0.06-0.11 0.873 0.07 0.05-0.10 0.321 0.08 0.06-0.11 0.790
male 144 103 0.07 0.06-0.10 0.07 0.06-0.09 0.07 0.05-0.08
female 155 98 0.09 0.07-0.11 0.382 0.09 0.07-0.11 0.141 0.08 0.07-0.10 0.192
Māori 87 58 0.08 0.06-0.11 0.08 0.06-0.11 0.07 0.06-0.10
non-Māori 212 143 0.08 0.07-0.10 0.723 0.08 0.07-0.10 0.516 0.08 0.06-0.09 0.577
Northland/Auckland 50 32 0.10 0.06-0.15 0.08 0.05-0.12 0.09 0.06-0.13
Waikato/BoP 48 35 0.08 0.05-0.13 0.09 0.06-0.14 0.08 0.05-0.13
lower North Island 171 110 0.08 0.07-0.10 0.09 0.07-0.10 0.08 0.06-0.09
South Island 30 24 0.05 0.04-0.07 0.364 0.05 0.04-0.07 0.315 0.05 0.03-0.06 0.254
LOD: limit of detection (0.08 µg/L); 95%CI: 95% confidence interval of the geometric mean (GM); R2: R-squared of the
multivariate linear regression model; p-value: the p-value of the multivariate linear regression model for that variable; crea: creatinine adjusted; spgr: specific gravity adjusted.
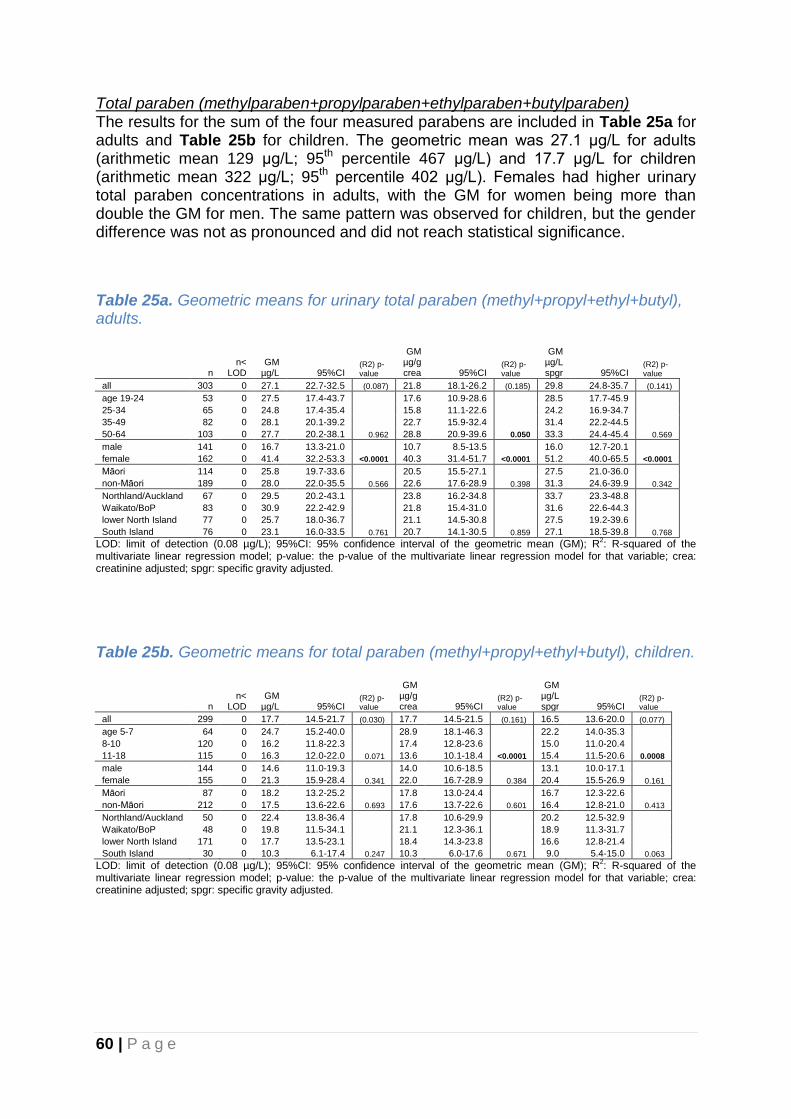
60 | P a g e
Total paraben (methylparaben+propylparaben+ethylparaben+butylparaben) The results for the sum of the four measured parabens are included in Table 25a for adults and Table 25b for children. The geometric mean was 27.1 μg/L for adults (arithmetic mean 129 μg/L; 95th percentile 467 μg/L) and 17.7 μg/L for children (arithmetic mean 322 μg/L; 95th percentile 402 μg/L). Females had higher urinary total paraben concentrations in adults, with the GM for women being more than double the GM for men. The same pattern was observed for children, but the gender difference was not as pronounced and did not reach statistical significance.
Table 25a. Geometric means for urinary total paraben (methyl+propyl+ethyl+butyl), adults.
n n<
LOD GM
µg/L 95%CI (R2) p-value
GM µg/g crea 95%CI
(R2) p-value
GM µg/L spgr 95%CI
(R2) p-value
all 303 0 27.1 22.7-32.5 (0.087) 21.8 18.1-26.2 (0.185) 29.8 24.8-35.7 (0.141)
age 19-24 53 0 27.5 17.4-43.7 17.6 10.9-28.6 28.5 17.7-45.9
25-34 65 0 24.8 17.4-35.4 15.8 11.1-22.6 24.2 16.9-34.7
35-49 82 0 28.1 20.1-39.2 22.7 15.9-32.4 31.4 22.2-44.5
50-64 103 0 27.7 20.2-38.1 0.962 28.8 20.9-39.6 0.050 33.3 24.4-45.4 0.569
male 141 0 16.7 13.3-21.0 10.7 8.5-13.5 16.0 12.7-20.1
female 162 0 41.4 32.2-53.3 <0.0001 40.3 31.4-51.7 <0.0001 51.2 40.0-65.5 <0.0001
Māori 114 0 25.8 19.7-33.6 20.5 15.5-27.1 27.5 21.0-36.0
non-Māori 189 0 28.0 22.0-35.5 0.566 22.6 17.6-28.9 0.398 31.3 24.6-39.9 0.342
Northland/Auckland 67 0 29.5 20.2-43.1 23.8 16.2-34.8 33.7 23.3-48.8
Waikato/BoP 83 0 30.9 22.2-42.9 21.8 15.4-31.0 31.6 22.6-44.3
lower North Island 77 0 25.7 18.0-36.7 21.1 14.5-30.8 27.5 19.2-39.6
South Island 76 0 23.1 16.0-33.5 0.761 20.7 14.1-30.5 0.859 27.1 18.5-39.8 0.768
LOD: limit of detection (0.08 µg/L); 95%CI: 95% confidence interval of the geometric mean (GM); R2: R-squared of the
multivariate linear regression model; p-value: the p-value of the multivariate linear regression model for that variable; crea: creatinine adjusted; spgr: specific gravity adjusted.
Table 25b. Geometric means for total paraben (methyl+propyl+ethyl+butyl), children.
n n<
LOD GM
µg/L 95%CI (R2) p-value
GM µg/g crea 95%CI
(R2) p-value
GM µg/L spgr 95%CI
(R2) p-value
all 299 0 17.7 14.5-21.7 (0.030) 17.7 14.5-21.5 (0.161) 16.5 13.6-20.0 (0.077)
age 5-7 64 0 24.7 15.2-40.0 28.9 18.1-46.3 22.2 14.0-35.3
8-10 120 0 16.2 11.8-22.3 17.4 12.8-23.6 15.0 11.0-20.4
11-18 115 0 16.3 12.0-22.0 0.071 13.6 10.1-18.4 <0.0001 15.4 11.5-20.6 0.0008
male 144 0 14.6 11.0-19.3 14.0 10.6-18.5 13.1 10.0-17.1
female 155 0 21.3 15.9-28.4 0.341 22.0 16.7-28.9 0.384 20.4 15.5-26.9 0.161
Māori 87 0 18.2 13.2-25.2 17.8 13.0-24.4 16.7 12.3-22.6
non-Māori 212 0 17.5 13.6-22.6 0.693 17.6 13.7-22.6 0.601 16.4 12.8-21.0 0.413
Northland/Auckland 50 0 22.4 13.8-36.4 17.8 10.6-29.9 20.2 12.5-32.9
Waikato/BoP 48 0 19.8 11.5-34.1 21.1 12.3-36.1 18.9 11.3-31.7
lower North Island 171 0 17.7 13.5-23.1 18.4 14.3-23.8 16.6 12.8-21.4
South Island 30 0 10.3 6.1-17.4 0.247 10.3 6.0-17.6 0.671 9.0 5.4-15.0 0.063
LOD: limit of detection (0.08 µg/L); 95%CI: 95% confidence interval of the geometric mean (GM); R2: R-squared of the
multivariate linear regression model; p-value: the p-value of the multivariate linear regression model for that variable; crea: creatinine adjusted; spgr: specific gravity adjusted.

61 | P a g e
4.2.11. Urinary phthalate metabolites Phthalates are synthetic compounds first introduced and used in commercial products in the 1920s. Since the early 1930s they have been widely used as plasticisers, solvents and additives in many consumer products including plastics, adhesives, pharmaceuticals and personal care products. Phthalates are added to plastics to enhance flexibility and durability, but are not chemically bound to it and can therefore be released during use or disposal of plastic products. Exposure can occur through diet, inhalation, dermal absorption, and ingestion of house dust. Animal studies suggest the potential for developmental and reproductive effects following exposure, but the health effects in humans are currently unclear. Phthalates do not accumulate in the body and are rapidly metabolised and excreted through urine. Urinary levels of phthalate metabolites therefore reflect recent exposure. The urinary phthalate metabolites determined in this study and their parent chemical are listed below. Phthalate (parent chemical) Metabolite determined in urine dimethyl phthalate (DMP) monomethyl phthalate (mMP) diethyl phthalate (DEP) monoethyl phthalate (mEP) dibutyl phthalate (DBP) (di-n&di-iso) monobutyl phthalate (mBP) (n+iso) butylbenzyl phthalate (BBzP) monobenzyl phthalate (mBzP) di(2-ethylhexyl) phthalate (DEHP) mono-2-ethylhexyl phthalate (mEHP) di(2-ethylhexyl) phthalate (DEHP) mono-(2-ethyl-5-oxohexyl) phthalate (mEOHP) di(2-ethylhexyl) phthalate (DEHP) mono-(2-ethyl-5-hydroxyhexyl) phthalate (mEHHP) dicyclohexyl phthalate (DCHP) mono-cyclohexyl phthalate (mCHP) di-n-octyl phthalate (DOP) mono-(3-carboxypropyl) phthalate (mCPP) di-iso-nonyl phthalate (DiNP) mono-iso-nonyl Phthalate (miNP)
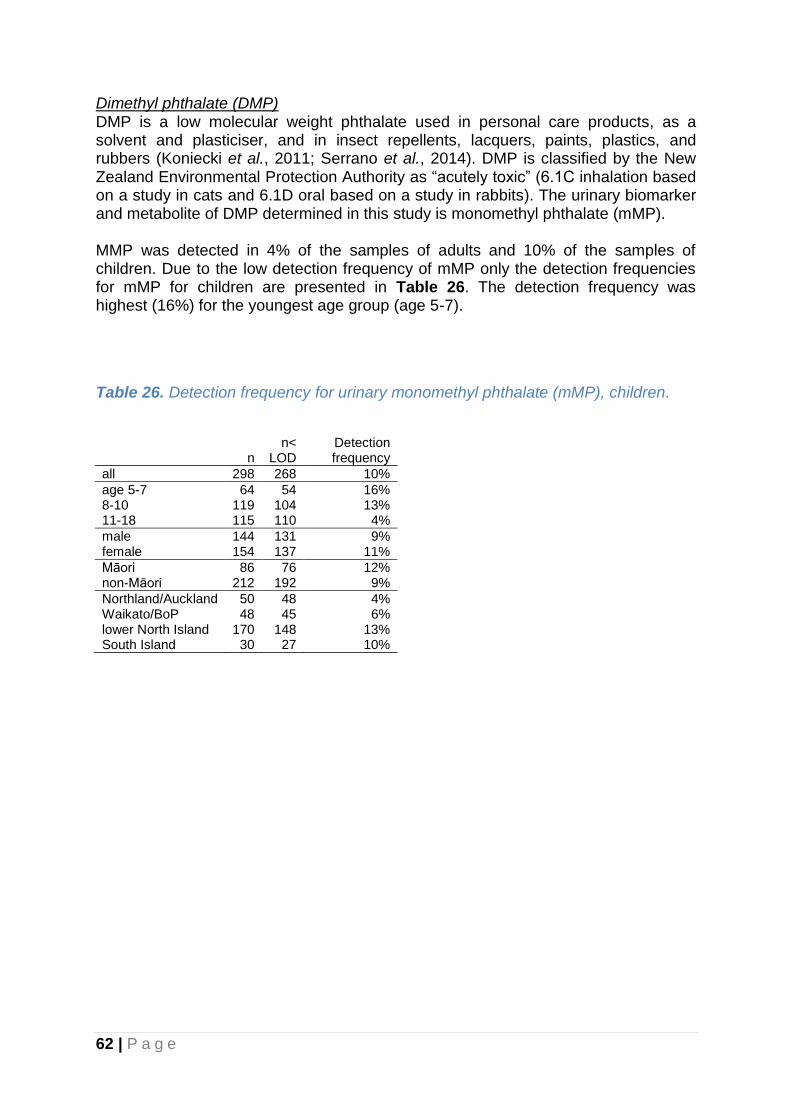
62 | P a g e
Dimethyl phthalate (DMP) DMP is a low molecular weight phthalate used in personal care products, as a solvent and plasticiser, and in insect repellents, lacquers, paints, plastics, and rubbers (Koniecki et al., 2011; Serrano et al., 2014). DMP is classified by the New Zealand Environmental Protection Authority as “acutely toxic” (6.1C inhalation based on a study in cats and 6.1D oral based on a study in rabbits). The urinary biomarker and metabolite of DMP determined in this study is monomethyl phthalate (mMP). MMP was detected in 4% of the samples of adults and 10% of the samples of children. Due to the low detection frequency of mMP only the detection frequencies for mMP for children are presented in Table 26. The detection frequency was highest (16%) for the youngest age group (age 5-7).
Table 26. Detection frequency for urinary monomethyl phthalate (mMP), children.
n n<
LOD Detection frequency
all 298 268 10%
age 5-7 64 54 16% 8-10 119 104 13% 11-18 115 110 4%
male 144 131 9% female 154 137 11%
Māori 86 76 12% non-Māori 212 192 9%
Northland/Auckland 50 48 4% Waikato/BoP 48 45 6% lower North Island 170 148 13% South Island 30 27 10%
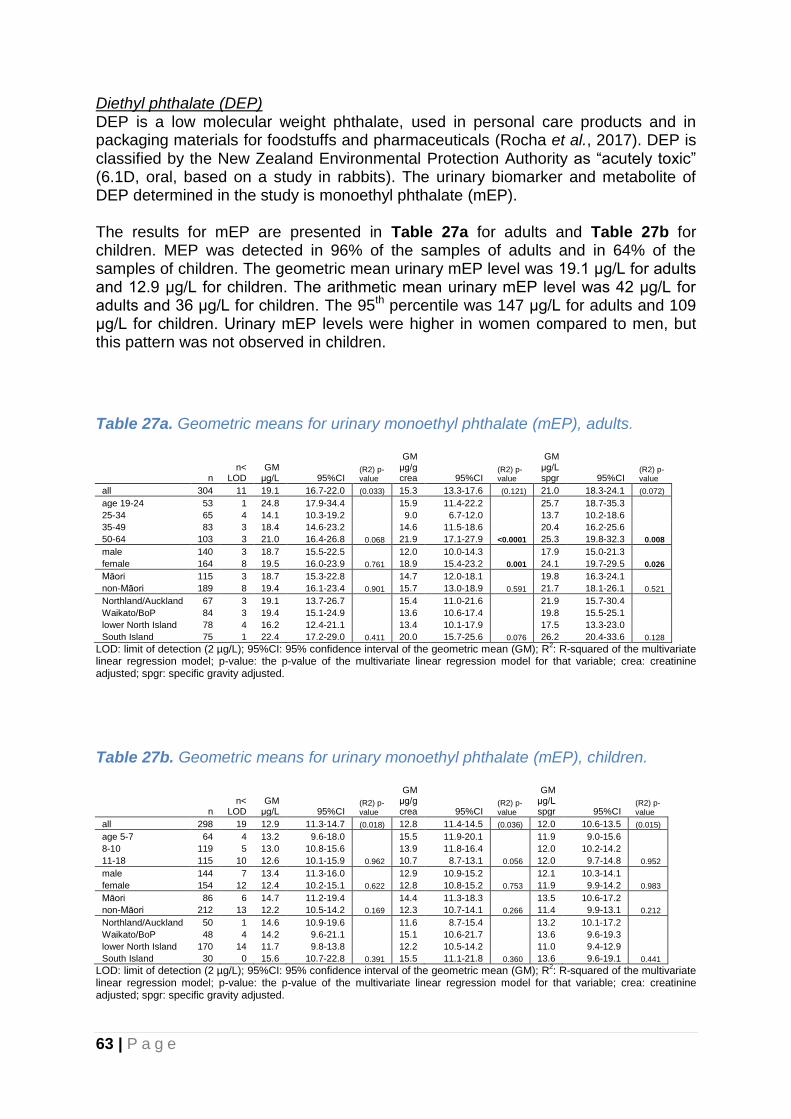
63 | P a g e
Diethyl phthalate (DEP) DEP is a low molecular weight phthalate, used in personal care products and in packaging materials for foodstuffs and pharmaceuticals (Rocha et al., 2017). DEP is classified by the New Zealand Environmental Protection Authority as “acutely toxic” (6.1D, oral, based on a study in rabbits). The urinary biomarker and metabolite of DEP determined in the study is monoethyl phthalate (mEP). The results for mEP are presented in Table 27a for adults and Table 27b for children. MEP was detected in 96% of the samples of adults and in 64% of the samples of children. The geometric mean urinary mEP level was 19.1 μg/L for adults and 12.9 μg/L for children. The arithmetic mean urinary mEP level was 42 μg/L for adults and 36 μg/L for children. The 95th percentile was 147 μg/L for adults and 109 μg/L for children. Urinary mEP levels were higher in women compared to men, but this pattern was not observed in children.
Table 27a. Geometric means for urinary monoethyl phthalate (mEP), adults.
n n<
LOD GM
μg/L 95%CI (R2) p-value
GM μg/g crea 95%CI
(R2) p-value
GM μg/L spgr 95%CI
(R2) p-value
all 304 11 19.1 16.7-22.0 (0.033) 15.3 13.3-17.6 (0.121) 21.0 18.3-24.1 (0.072)
age 19-24 53 1 24.8 17.9-34.4 15.9 11.4-22.2 25.7 18.7-35.3
25-34 65 4 14.1 10.3-19.2 9.0 6.7-12.0 13.7 10.2-18.6
35-49 83 3 18.4 14.6-23.2 14.6 11.5-18.6 20.4 16.2-25.6
50-64 103 3 21.0 16.4-26.8 0.068 21.9 17.1-27.9 <0.0001 25.3 19.8-32.3 0.008
male 140 3 18.7 15.5-22.5 12.0 10.0-14.3 17.9 15.0-21.3
female 164 8 19.5 16.0-23.9 0.761 18.9 15.4-23.2 0.001 24.1 19.7-29.5 0.026
Māori 115 3 18.7 15.3-22.8 14.7 12.0-18.1 19.8 16.3-24.1
non-Māori 189 8 19.4 16.1-23.4 0.901 15.7 13.0-18.9 0.591 21.7 18.1-26.1 0.521
Northland/Auckland 67 3 19.1 13.7-26.7 15.4 11.0-21.6 21.9 15.7-30.4
Waikato/BoP 84 3 19.4 15.1-24.9 13.6 10.6-17.4 19.8 15.5-25.1
lower North Island 78 4 16.2 12.4-21.1 13.4 10.1-17.9 17.5 13.3-23.0
South Island 75 1 22.4 17.2-29.0 0.411 20.0 15.7-25.6 0.076 26.2 20.4-33.6 0.128
LOD: limit of detection (2 µg/L); 95%CI: 95% confidence interval of the geometric mean (GM); R2: R-squared of the multivariate
linear regression model; p-value: the p-value of the multivariate linear regression model for that variable; crea: creatinine adjusted; spgr: specific gravity adjusted.
Table 27b. Geometric means for urinary monoethyl phthalate (mEP), children.
n n<
LOD GM
μg/L 95%CI (R2) p-value
GM μg/g crea 95%CI
(R2) p-value
GM μg/L spgr 95%CI
(R2) p-value
all 298 19 12.9 11.3-14.7 (0.018) 12.8 11.4-14.5 (0.036) 12.0 10.6-13.5 (0.015)
age 5-7 64 4 13.2 9.6-18.0 15.5 11.9-20.1 11.9 9.0-15.6
8-10 119 5 13.0 10.8-15.6 13.9 11.8-16.4 12.0 10.2-14.2
11-18 115 10 12.6 10.1-15.9 0.962 10.7 8.7-13.1 0.056 12.0 9.7-14.8 0.952
male 144 7 13.4 11.3-16.0 12.9 10.9-15.2 12.1 10.3-14.1
female 154 12 12.4 10.2-15.1 0.622 12.8 10.8-15.2 0.753 11.9 9.9-14.2 0.983
Māori 86 6 14.7 11.2-19.4 14.4 11.3-18.3 13.5 10.6-17.2
non-Māori 212 13 12.2 10.5-14.2 0.169 12.3 10.7-14.1 0.266 11.4 9.9-13.1 0.212
Northland/Auckland 50 1 14.6 10.9-19.6 11.6 8.7-15.4 13.2 10.1-17.2
Waikato/BoP 48 4 14.2 9.6-21.1 15.1 10.6-21.7 13.6 9.6-19.3
lower North Island 170 14 11.7 9.8-13.8 12.2 10.5-14.2 11.0 9.4-12.9
South Island 30 0 15.6 10.7-22.8 0.391 15.5 11.1-21.8 0.360 13.6 9.6-19.1 0.441
LOD: limit of detection (2 µg/L); 95%CI: 95% confidence interval of the geometric mean (GM); R2: R-squared of the multivariate
linear regression model; p-value: the p-value of the multivariate linear regression model for that variable; crea: creatinine adjusted; spgr: specific gravity adjusted.

64 | P a g e
Dibutyl phthalate (DBP) DBP is a plasticiser which includes di-n-butyl phthalate (DnBP) and diisobutyl phthalate (DiBP) and is commonly used in consumer products. DnBP is classified by the New Zealand Environmental Protection Authority as a “known or presumed human reproductive or developmental toxicant” (6.8A based on a study in rats) and as “acutely toxic (oral)” (6.1E, based on a study in mice) and DiBP as a “suspected human reproductive or developmental toxicant” (6.8B based on a study in rats). The urinary biomarker and metabolite of DBP determined in the study is monobutyl phthalate (mBP), including both the “n” and “iso” forms. The results for mBP are presented in Table 28a for adults and Table 28b for children. mBP was detected in all samples of adults and children. The geometric mean (GM) urinary mBP levels was 37.0 μg/L for adults and 60.6 μg/L for children. The 95th percentile was 146 μg/L for adults and 198 μg/L for children. The highest GM was observed for the youngest age group (71.6 μg/L for the 5-7 year olds) with gradually lower urinary mBP levels in the older age groups.
Table 28a. Geometric means for urinary monobutyl phthalate (mBP, n+iso), adults.
n n<
LOD GM
μg/L 95%CI (R2) p-value
GM μg/g crea 95%CI
(R2) p-value
GM μg/L spgr 95%CI
(R2) p-value
all 304 0 37.0 33.4-40.9 (0.071) 29.6 27.2-32.2 (0.058) 40.6 37.2-44.3 (0.058)
19-24 53 0 48.0 38.0-60.6 30.7 25.2-37.4 49.7 40.8-60.4
25-34 65 0 46.5 38.3-56.6 29.7 25.0-35.2 45.4 37.8-54.7
35-49 83 0 36.6 30.6-43.9 29.2 25.3-33.7 40.7 35.1-47.2
50-64 103 0 28.2 23.5-33.8 0.001 29.4 25.0-34.7 0.992 34.0 28.9-40.0 0.023
male 140 0 38.5 33.5-44.2 24.7 22.1-27.6 36.8 32.7-41.4
female 164 0 35.8 30.9-41.4 0.425 34.6 30.7-39.0 <0.0001 44.1 38.9-50.0 0.039
Māori 115 0 35.3 30.2-41.3 27.8 24.4-31.7 37.4 32.8-42.8
non-Māori 189 0 38.1 33.4-43.4 0.606 30.8 27.6-34.4 0.205 42.6 38.0-47.8 0.166
Northland/Auckland 67 0 36.5 29.9-44.5 29.4 24.9-34.6 41.7 35.1-49.5
Waikato/BoP 84 0 43.1 35.7-51.9 30.1 25.8-35.2 43.9 37.2-51.8
lower North Island 78 0 34.5 28.5-41.6 28.6 24.8-32.9 37.2 31.9-43.3
South Island 75 0 34.0 27.0-42.7 0.427 30.4 24.7-37.5 0.903 39.8 32.4-48.8 0.758
LOD: limit of detection (1 µg/L); 95%CI: 95% confidence interval of the geometric mean (GM); R2: R-squared of the multivariate
linear regression model; p-value: the p-value of the multivariate linear regression model for that variable; crea: creatinine adjusted; spgr: specific gravity adjusted.
Table 28b. Geometric means for urinary monobutyl phthalate (mBP, n+iso), children.
n n<
LOD GM
μg/L 95%CI (R2) p-value
GM μg/g crea 95%CI
(R2) p-value
GM μg/L spgr 95%CI
(R2) p-value
all 299 0 60.6 55.8-65.7 (0.069) 60.3 55.8-65.1 (0.174) 56.3 52.4-60.4 (0.056)
5-7 64 0 71.6 59.5-86.2 84.0 72.3-97.6 64.4 55.2-75.3
8-10 119 0 64.9 57.0-73.9 69.8 61.8-78.7 60.1 53.1-68.0
11-18 116 0 51.4 45.6-58.0 0.008 43.2 38.8-48.1 <0.0001 48.8 44.2-53.7 0.007
male 144 0 68.5 61.1-76.8 65.6 58.5-73.6 61.4 55.3-68.2
female 155 0 54.0 48.2-60.6 0.014 55.7 50.2-61.8 0.171 51.9 47.1-57.1 0.064
Māori 86 0 62.7 54.4-72.2 61.2 53.8-69.5 57.3 51.1-64.3
non-Māori 213 0 59.7 54.1-66.0 0.554 59.9 54.4-65.9 0.984 55.8 51.1-61.0 0.811
Northland/Auckland 50 0 65.8 57.1-75.9 52.2 45.5-59.9 59.4 52.6-67.1
Waikato/BoP 48 0 60.6 49.7-74.0 64.5 51.1-81.5 58.0 48.9-68.9
lower North Island 171 0 57.6 51.5-64.4 60.1 54.1-66.7 54.1 48.9-59.8
South Island 30 0 70.3 52.0-95.1 0.368 70.0 56.4-86.8 0.588 61.1 47.7-78.3 0.527
LOD: limit of detection (1 µg/L); 95%CI: 95% confidence interval of the geometric mean (GM); R2: R-squared of the multivariate
linear regression model; p-value: the p-value of the multivariate linear regression model for that variable; crea: creatinine adjusted; spgr: specific gravity adjusted.
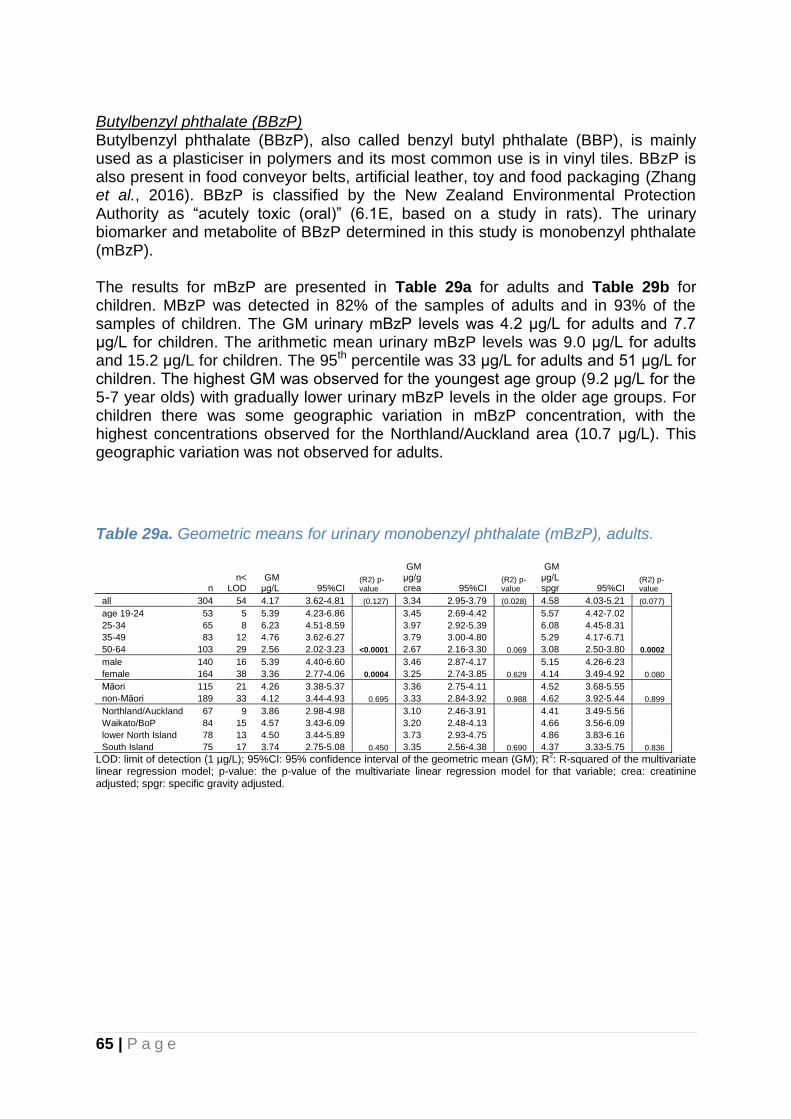
65 | P a g e
Butylbenzyl phthalate (BBzP) Butylbenzyl phthalate (BBzP), also called benzyl butyl phthalate (BBP), is mainly used as a plasticiser in polymers and its most common use is in vinyl tiles. BBzP is also present in food conveyor belts, artificial leather, toy and food packaging (Zhang et al., 2016). BBzP is classified by the New Zealand Environmental Protection Authority as “acutely toxic (oral)” (6.1E, based on a study in rats). The urinary biomarker and metabolite of BBzP determined in this study is monobenzyl phthalate (mBzP). The results for mBzP are presented in Table 29a for adults and Table 29b for children. MBzP was detected in 82% of the samples of adults and in 93% of the samples of children. The GM urinary mBzP levels was 4.2 μg/L for adults and 7.7 μg/L for children. The arithmetic mean urinary mBzP levels was 9.0 μg/L for adults and 15.2 μg/L for children. The 95th percentile was 33 μg/L for adults and 51 μg/L for children. The highest GM was observed for the youngest age group (9.2 μg/L for the 5-7 year olds) with gradually lower urinary mBzP levels in the older age groups. For children there was some geographic variation in mBzP concentration, with the highest concentrations observed for the Northland/Auckland area (10.7 μg/L). This geographic variation was not observed for adults.
Table 29a. Geometric means for urinary monobenzyl phthalate (mBzP), adults.
n n<
LOD GM
μg/L 95%CI (R2) p-value
GM μg/g crea 95%CI
(R2) p-value
GM μg/L spgr 95%CI
(R2) p-value
all 304 54 4.17 3.62-4.81 (0.127) 3.34 2.95-3.79 (0.028) 4.58 4.03-5.21 (0.077)
age 19-24 53 5 5.39 4.23-6.86 3.45 2.69-4.42 5.57 4.42-7.02
25-34 65 8 6.23 4.51-8.59 3.97 2.92-5.39 6.08 4.45-8.31
35-49 83 12 4.76 3.62-6.27 3.79 3.00-4.80 5.29 4.17-6.71
50-64 103 29 2.56 2.02-3.23 <0.0001 2.67 2.16-3.30 0.069 3.08 2.50-3.80 0.0002
male 140 16 5.39 4.40-6.60 3.46 2.87-4.17 5.15 4.26-6.23
female 164 38 3.36 2.77-4.06 0.0004 3.25 2.74-3.85 0.629 4.14 3.49-4.92 0.080
Māori 115 21 4.26 3.38-5.37 3.36 2.75-4.11 4.52 3.68-5.55
non-Māori 189 33 4.12 3.44-4.93 0.695 3.33 2.84-3.92 0.988 4.62 3.92-5.44 0.899
Northland/Auckland 67 9 3.86 2.98-4.98 3.10 2.46-3.91 4.41 3.49-5.56
Waikato/BoP 84 15 4.57 3.43-6.09 3.20 2.48-4.13 4.66 3.56-6.09
lower North Island 78 13 4.50 3.44-5.89 3.73 2.93-4.75 4.86 3.83-6.16
South Island 75 17 3.74 2.75-5.08 0.450 3.35 2.56-4.38 0.690 4.37 3.33-5.75 0.836
LOD: limit of detection (1 µg/L); 95%CI: 95% confidence interval of the geometric mean (GM); R2: R-squared of the multivariate
linear regression model; p-value: the p-value of the multivariate linear regression model for that variable; crea: creatinine adjusted; spgr: specific gravity adjusted.
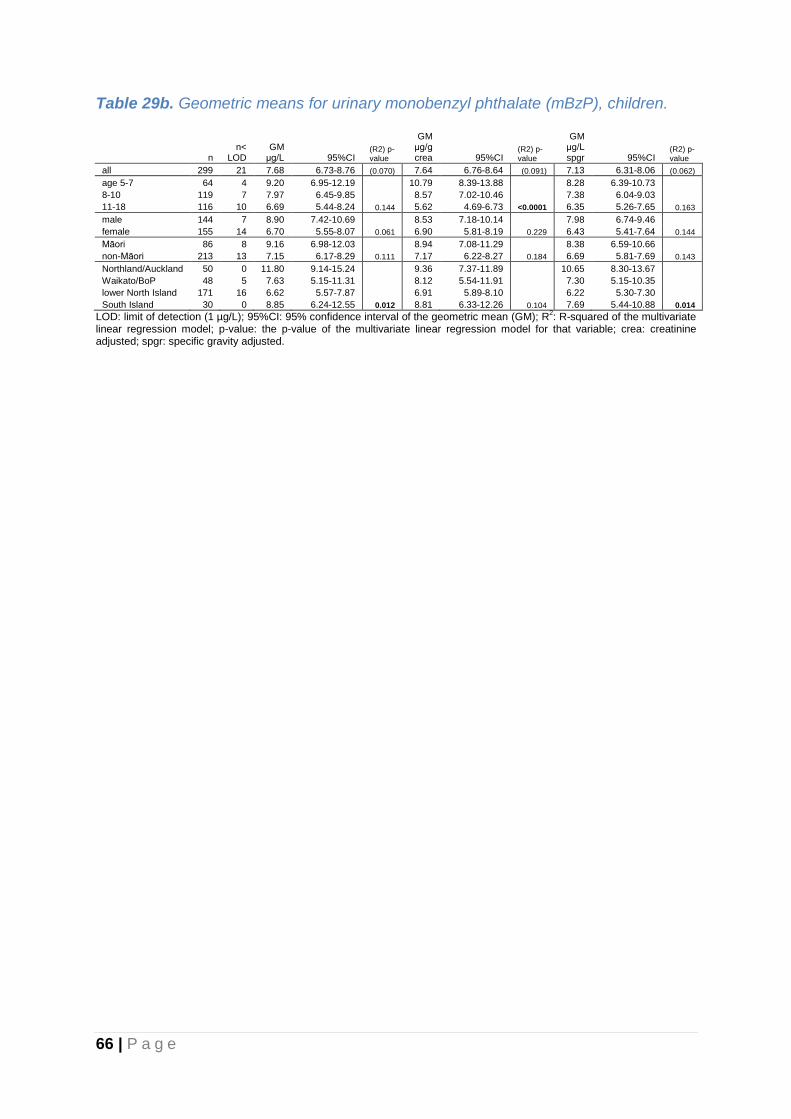
66 | P a g e
Table 29b. Geometric means for urinary monobenzyl phthalate (mBzP), children.
n n<
LOD GM
μg/L 95%CI (R2) p-value
GM μg/g crea 95%CI
(R2) p-value
GM μg/L spgr 95%CI
(R2) p-value
all 299 21 7.68 6.73-8.76 (0.070) 7.64 6.76-8.64 (0.091) 7.13 6.31-8.06 (0.062)
age 5-7 64 4 9.20 6.95-12.19 10.79 8.39-13.88 8.28 6.39-10.73
8-10 119 7 7.97 6.45-9.85 8.57 7.02-10.46 7.38 6.04-9.03
11-18 116 10 6.69 5.44-8.24 0.144 5.62 4.69-6.73 <0.0001 6.35 5.26-7.65 0.163
male 144 7 8.90 7.42-10.69 8.53 7.18-10.14 7.98 6.74-9.46
female 155 14 6.70 5.55-8.07 0.061 6.90 5.81-8.19 0.229 6.43 5.41-7.64 0.144
Māori 86 8 9.16 6.98-12.03 8.94 7.08-11.29 8.38 6.59-10.66
non-Māori 213 13 7.15 6.17-8.29 0.111 7.17 6.22-8.27 0.184 6.69 5.81-7.69 0.143
Northland/Auckland 50 0 11.80 9.14-15.24 9.36 7.37-11.89 10.65 8.30-13.67
Waikato/BoP 48 5 7.63 5.15-11.31 8.12 5.54-11.91 7.30 5.15-10.35
lower North Island 171 16 6.62 5.57-7.87 6.91 5.89-8.10 6.22 5.30-7.30
South Island 30 0 8.85 6.24-12.55 0.012 8.81 6.33-12.26 0.104 7.69 5.44-10.88 0.014
LOD: limit of detection (1 µg/L); 95%CI: 95% confidence interval of the geometric mean (GM); R2: R-squared of the multivariate
linear regression model; p-value: the p-value of the multivariate linear regression model for that variable; crea: creatinine adjusted; spgr: specific gravity adjusted.

67 | P a g e
Di(2-ethylhexyl) phthalate (DEHP) DEHP, also called di-s-octyl phthalate, is a high molecular weight phthalate, primarily used as a plasticiser in the manufacture of flexible vinyl plastic which is commonly used in consumer products, flooring and wall coverings, food contact applications, and medical devices. More recently DEHP has been replaced by higher molecular weight phthalates such as DiNP in many applications due to concerns regarding possible adverse effects of DEHP-exposures in humans (Dekant & Bridges, 2016). DEHP is classified by the New Zealand Environmental Protection Authority as a “known or presumed human reproductive or developmental toxicant” (6.8A, based on a study in mice) and as “harmful to human target organs or systems” (6.9B, oral, based on a study in rats). In this study urinary concentrations of three DEHP metabolites were measured: mono(2-ethylhexyl) phthalate (mEHP) and two oxidative metabolites, mono-(2-ethyl-5-oxohexyl) phthalate (mEOHP) and mono-(2-ethyl-5-hydroxylhexyl) phthalate (MEHHP). mEHP is considered the most toxic and active one among these phthalate metabolites (Gobas et al., 2017). Geometric means of urinary concentrations are presented for each of these metabolites individually, as well as for their sum. The results for mEHP are presented in Table 30a for adults and Table 30b for children. mEHP was detected in 82% of the samples of adults and in 90% of the samples of children. The GM urinary mEHP concentration was 2.0 μg/L for adults and 2.7 μg/L for children. The arithmetic mean urinary mEHP concentration was 3.4 μg/L for adults and 3.8 μg/L for children. The 95th percentile was 10 μg/L for adults and 11 μg/L for children. The highest GM was observed for the youngest age group (3.2 μg/L for the 5-7 year age group) and the lowest for the oldest age group (1.2 μg/L for the 50-64 year age group). For adults the GM urinary mEHP levels were higher for Māori compared to non-Māori, but this pattern was not observed for children.
Table 30a. Geometric means for urinary mono-2-ethylhexyl phthalate (mEHP), adults.
n n<
LOD GM
μg/L 95%CI (R2) p-value
GM μg/g crea
95% CI
(R2) p-value
GM μg/L spgr 95%CI
(R2) p-value
all 304 76 1.99 1.77-2.23 (0.164) 1.59 1.44-1.76 (0.051) 2.18 1.97-2.41 (0.114)
age 19-24 53 7 2.66 2.08-3.39 1.70 1.37-2.11 2.75 2.22-3.41
25-34 65 6 2.80 2.27-3.46 1.79 1.43-2.24 2.74 2.21-3.40
35-49 83 21 2.25 1.78-2.85 1.79 1.49-2.16 2.50 2.06-3.03
50-64 103 42 1.24 1.04-1.49 <0.0001 1.30 1.09-1.54 0.050 1.50 1.28-1.76 <0.0001
male 140 28 2.33 1.97-2.76 1.50 1.29-1.73 2.23 1.93-2.59
female 164 48 1.73 1.49-2.02 0.004 1.68 1.46-1.92 0.283 2.14 1.86-2.46 0.588
Māori 115 22 2.34 1.93-2.82 1.84 1.58-2.15 2.48 2.11-2.91
non-Māori 189 54 1.80 1.56-2.08 0.013 1.46 1.28-1.66 0.034 2.02 1.77-2.30 0.043
Northland/Auckland 67 15 2.18 1.70-2.81 1.76 1.40-2.21 2.49 2.01-3.10
Waikato/BoP 84 21 2.28 1.80-2.89 1.60 1.29-1.98 2.32 1.86-2.91
lower North Island 78 22 1.75 1.41-2.17 1.45 1.22-1.72 1.89 1.57-2.26
South Island 75 18 1.79 1.46-2.19 0.294 1.60 1.35-1.91 0.713 2.10 1.77-2.48 0.393
LOD: limit of detection (1 µg/L); 95%CI: 95% confidence interval of the geometric mean (GM); R2: R-squared of the multivariate
linear regression model; p-value: the p-value of the multivariate linear regression model for that variable; crea: creatinine adjusted; spgr: specific gravity adjusted.
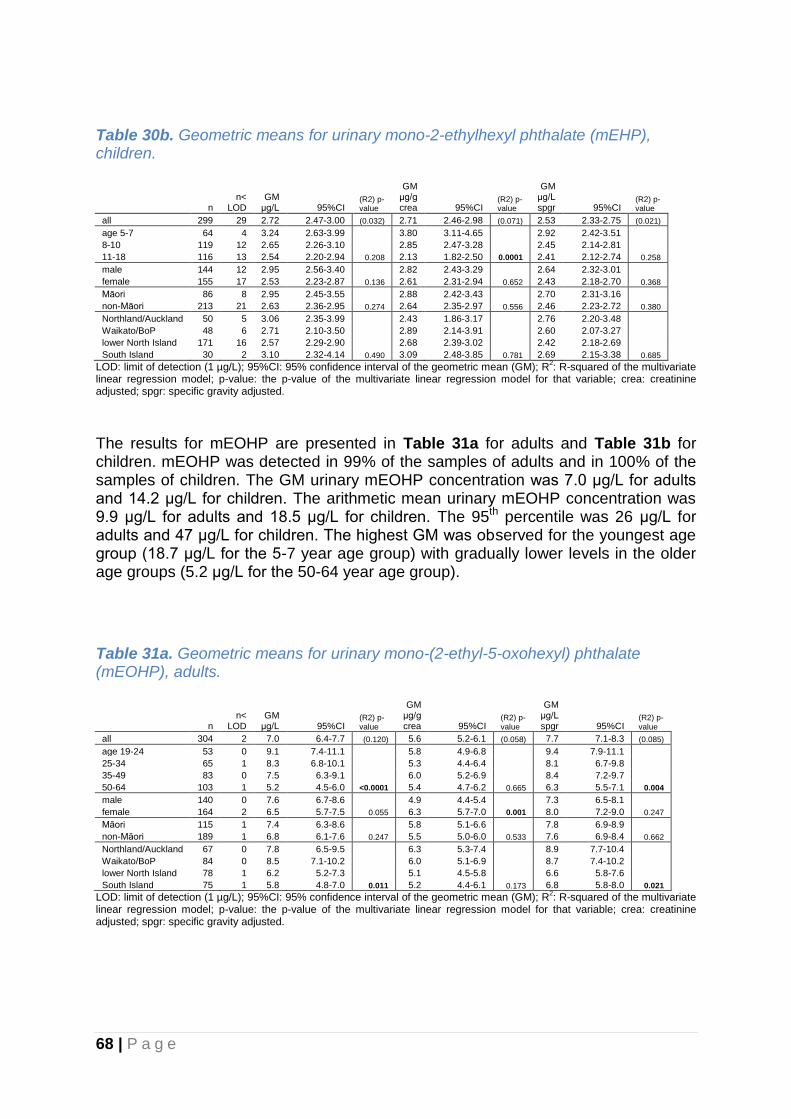
68 | P a g e
Table 30b. Geometric means for urinary mono-2-ethylhexyl phthalate (mEHP), children.
n n<
LOD GM
μg/L 95%CI (R2) p-value
GM μg/g crea 95%CI
(R2) p-value
GM μg/L spgr 95%CI
(R2) p-value
all 299 29 2.72 2.47-3.00 (0.032) 2.71 2.46-2.98 (0.071) 2.53 2.33-2.75 (0.021)
age 5-7 64 4 3.24 2.63-3.99 3.80 3.11-4.65 2.92 2.42-3.51
8-10 119 12 2.65 2.26-3.10 2.85 2.47-3.28 2.45 2.14-2.81
11-18 116 13 2.54 2.20-2.94 0.208 2.13 1.82-2.50 0.0001 2.41 2.12-2.74 0.258
male 144 12 2.95 2.56-3.40 2.82 2.43-3.29 2.64 2.32-3.01
female 155 17 2.53 2.23-2.87 0.136 2.61 2.31-2.94 0.652 2.43 2.18-2.70 0.368
Māori 86 8 2.95 2.45-3.55 2.88 2.42-3.43 2.70 2.31-3.16
non-Māori 213 21 2.63 2.36-2.95 0.274 2.64 2.35-2.97 0.556 2.46 2.23-2.72 0.380
Northland/Auckland 50 5 3.06 2.35-3.99 2.43 1.86-3.17 2.76 2.20-3.48
Waikato/BoP 48 6 2.71 2.10-3.50 2.89 2.14-3.91 2.60 2.07-3.27
lower North Island 171 16 2.57 2.29-2.90 2.68 2.39-3.02 2.42 2.18-2.69
South Island 30 2 3.10 2.32-4.14 0.490 3.09 2.48-3.85 0.781 2.69 2.15-3.38 0.685
LOD: limit of detection (1 µg/L); 95%CI: 95% confidence interval of the geometric mean (GM); R2: R-squared of the multivariate
linear regression model; p-value: the p-value of the multivariate linear regression model for that variable; crea: creatinine adjusted; spgr: specific gravity adjusted.
The results for mEOHP are presented in Table 31a for adults and Table 31b for children. mEOHP was detected in 99% of the samples of adults and in 100% of the samples of children. The GM urinary mEOHP concentration was 7.0 μg/L for adults and 14.2 μg/L for children. The arithmetic mean urinary mEOHP concentration was 9.9 μg/L for adults and 18.5 μg/L for children. The 95th percentile was 26 μg/L for adults and 47 μg/L for children. The highest GM was observed for the youngest age group (18.7 μg/L for the 5-7 year age group) with gradually lower levels in the older age groups (5.2 μg/L for the 50-64 year age group).
Table 31a. Geometric means for urinary mono-(2-ethyl-5-oxohexyl) phthalate (mEOHP), adults.
n n<
LOD GM
μg/L 95%CI (R2) p-value
GM μg/g crea 95%CI
(R2) p-value
GM μg/L spgr 95%CI
(R2) p-value
all 304 2 7.0 6.4-7.7 (0.120) 5.6 5.2-6.1 (0.058) 7.7 7.1-8.3 (0.085)
age 19-24 53 0 9.1 7.4-11.1 5.8 4.9-6.8 9.4 7.9-11.1
25-34 65 1 8.3 6.8-10.1 5.3 4.4-6.4 8.1 6.7-9.8
35-49 83 0 7.5 6.3-9.1 6.0 5.2-6.9 8.4 7.2-9.7
50-64 103 1 5.2 4.5-6.0 <0.0001 5.4 4.7-6.2 0.665 6.3 5.5-7.1 0.004
male 140 0 7.6 6.7-8.6 4.9 4.4-5.4 7.3 6.5-8.1
female 164 2 6.5 5.7-7.5 0.055 6.3 5.7-7.0 0.001 8.0 7.2-9.0 0.247
Māori 115 1 7.4 6.3-8.6 5.8 5.1-6.6 7.8 6.9-8.9
non-Māori 189 1 6.8 6.1-7.6 0.247 5.5 5.0-6.0 0.533 7.6 6.9-8.4 0.662
Northland/Auckland 67 0 7.8 6.5-9.5 6.3 5.3-7.4 8.9 7.7-10.4
Waikato/BoP 84 0 8.5 7.1-10.2 6.0 5.1-6.9 8.7 7.4-10.2
lower North Island 78 1 6.2 5.2-7.3 5.1 4.5-5.8 6.6 5.8-7.6
South Island 75 1 5.8 4.8-7.0 0.011 5.2 4.4-6.1 0.173 6.8 5.8-8.0 0.021
LOD: limit of detection (1 µg/L); 95%CI: 95% confidence interval of the geometric mean (GM); R2: R-squared of the multivariate
linear regression model; p-value: the p-value of the multivariate linear regression model for that variable; crea: creatinine adjusted; spgr: specific gravity adjusted.

69 | P a g e
Table 31b. Geometric means for urinary mono-(2-ethyl-5-oxohexyl) phthalate (mEOHP), children.
n n<
LOD GM
μg/L 95%CI (R2) p-value
GM μg/g crea 95%CI
(R2) p-value
GM μg/L spgr 95%CI
(R2) p-value
all 299 0 14.2 13.1-15.4 (0.107) 14.1 13.0-15.3 (0.205) 13.2 12.3-14.2 (0.106)
age 5-7 64 0 18.7 15.5-22.5 21.9 18.5-25.9 16.8 14.2-19.9
8-10 119 0 15.1 13.2-17.2 16.2 14.6-18.0 14.0 12.6-15.6
11-18 116 0 11.5 10.2-12.9 <0.0001 9.6 8.5-10.9 <0.0001 10.9 9.8-12.1 <0.0001
male 144 0 15.7 13.9-17.7 15.1 13.2-17.1 14.1 12.6-15.7
female 155 0 12.9 11.5-14.5 0.054 13.3 12.0-14.8 0.466 12.4 11.3-13.6 0.200
Māori 86 0 15.2 12.8-17.9 14.8 12.6-17.3 13.9 12.0-16.0
non-Māori 213 0 13.8 12.6-15.2 0.448 13.9 12.6-15.3 0.873 12.9 11.9-14.0 0.659
Northland/Auckland 50 0 17.3 14.2-21.1 13.7 11.3-16.6 15.6 13.2-18.4
Waikato/BoP 48 0 13.3 10.4-16.9 14.1 10.6-18.9 12.7 10.3-15.8
lower North Island 171 0 13.4 12.1-14.9 14.0 12.6-15.5 12.6 11.5-13.8
South Island 30 0 15.8 12.1-20.6 0.040 15.7 12.9-19.1 0.685 13.7 11.1-16.9 0.042
LOD: limit of detection (1 µg/L); 95%CI: 95% confidence interval of the geometric mean (GM); R2: R-squared of the multivariate
linear regression model; p-value: the p-value of the multivariate linear regression model for that variable; crea: creatinine adjusted; spgr: specific gravity adjusted. The results for mEHHP are presented in Table 32a for adults and Table 32b for children. mEHHP was detected in 96% of the samples of adults and in 98% of the samples of children. The GM urinary mEHHP concentration was 9.0 μg/L for adults and 17.6 μg/L for children. The arithmetic mean urinary mEHHP concentration was 14.1 μg/L for adults and 24.7 μg/L for children. The 95th percentile was 39 μg/L for adults and 68 μg/L for children. The highest GM was observed for the youngest age group (20.3 μg/L for the 5-7 year age group) and the lowest for the oldest age group (7.5 μg/L for the 50-64 year age group).
Table 32a. Geometric means for urinary mono-(2-ethyl-5-hydroxyhexyl) phthalate (mEHHP), adults.
n n<
LOD GM
μg/L 95%CI (R2) p-value
GM μg/g crea 95%CI
(R2) p-value
GM μg/L spgr 95%CI
(R2) p-value
all 304 12 9.0 8.0-10.1 (0.050) 7.2 6.5-8.0 (0.025) 9.9 8.9-10.9 (0.017)
age 19-24 53 4 9.4 7.0-12.8 6.0 4.6-7.9 9.8 7.4-12.9
25-34 65 1 11.3 9.0-14.2 7.2 5.8-8.9 11.0 8.9-13.7
35-49 83 4 9.1 7.2-11.6 7.2 5.9-8.9 10.1 8.2-12.5
50-64 103 3 7.5 6.3-8.9 0.108 7.8 6.7-9.2 0.392 9.0 7.8-10.5 0.629
male 140 6 10.2 8.7-12.0 6.6 5.7-7.6 9.8 8.5-11.3
female 164 6 8.0 6.8-9.4 0.030 7.8 6.8-8.9 0.102 9.9 8.6-11.4 0.921
Māori 115 7 9.7 7.9-11.9 7.6 6.5-9.0 10.3 8.6-12.3
non-Māori 189 5 8.6 7.5-9.8 0.265 6.9 6.1-7.9 0.483 9.6 8.5-10.9 0.575
Northland/Auckland 67 5 9.5 7.2-12.4 7.6 6.0-9.6 10.8 8.6-13.6
Waikato/BoP 84 3 10.3 8.2-12.9 7.2 5.8-8.9 10.5 8.4-13.0
lower North Island 78 2 7.9 6.5-9.7 6.6 5.5-7.9 8.6 7.2-10.2
South Island 75 2 8.4 6.7-10.4 0.370 7.5 6.2-9.0 0.693 9.8 8.1-11.9 0.448
LOD: limit of detection (1 µg/L); 95%CI: 95% confidence interval of the geometric mean (GM); R2: R-squared of the multivariate
linear regression model; p-value: the p-value of the multivariate linear regression model for that variable; crea: creatinine adjusted; spgr: specific gravity adjusted.

70 | P a g e
Table 32b. Geometric means for urinary mono-(2-ethyl-5-hydroxyhexyl) phthalate (mEHHP), children.
n n<
LOD GM
μg/L 95%CI (R2) p-value
GM μg/g crea 95%CI
(R2) p-value
GM μg/L spgr 95%CI
(R2) p-value
all 299 6 17.6 15.9-19.4 (0.069) 17.5 15.9-19.3 (0.122) 16.3 15.0-17.9 (0.063)
age 5-7 64 4 20.3 15.9-25.9 23.8 18.8-30.1 18.3 14.5-23.1
8-10 119 0 19.3 16.6-22.4 20.7 18.3-23.5 17.8 15.7-20.3
11-18 116 2 14.8 12.8-17.1 0.014 12.4 10.7-14.4 <0.0001 14.0 12.3-16.0 0.012
male 144 1 20.0 17.4-22.9 19.1 16.6-22.0 17.9 15.8-20.2
female 155 5 15.7 13.6-18.0 0.032 16.1 14.1-18.4 0.243 15.0 13.2-17.0 0.107
Māori 86 2 19.9 16.4-24.0 19.4 16.2-23.2 18.2 15.4-21.5
non-Māori 213 4 16.8 14.9-18.8 0.205 16.8 15.0-18.8 0.423 15.7 14.1-17.4 0.291
Northland/Auckland 50 1 22.1 17.4-28.0 17.5 14.1-21.7 19.9 16.3-24.3
Waikato/BoP 48 0 17.5 13.6-22.6 18.6 13.8-25.1 16.8 13.3-21.1
lower North Island 171 4 16.7 14.8-18.8 17.4 15.4-19.6 15.7 14.0-17.5
South Island 30 1 16.5 11.2-24.3 0.115 16.4 11.7-23.1 0.530 14.3 10.1-20.4 0.087
LOD: limit of detection (1 µg/L); 95%CI: 95% confidence interval of the geometric mean (GM); R2: R-squared of the multivariate
linear regression model; p-value: the p-value of the multivariate linear regression model for that variable; crea: creatinine adjusted; spgr: specific gravity adjusted. The results for the summed DEHP metabolites (mEHP+ mEOHP+ mEHHP) expressed as sum-DEHP, are presented in Table 33a for adults and Table 33b for children. The GM urinary sum-DEHP concentration was 18.9 μg/L for adults and 35.5 μg/L for children. As for each of the 3 metabolites included in sum-DEHP, the highest GM was observed for the youngest age group (44.0 μg/L for the 5-7 year age group) and the lowest for the oldest age group (14.5 μg/L for the 50-64 year age group).
Table 33a. Geometric means for the sum of urinary mEHP, mEOHP and mEHHP, adults (sum-DEHP).
n n<
LOD GM
μg/L 95%CI (R2) p-value
GM μg/g crea 95%CI
(R2) p-value
GM μg/L spgr 95%CI
(R2) p-value
all 304 0 18.9 17.2-20.9 (0.107) 15.2 14.0-16.4 (0.031) 20.8 19.2-22.5 (0.056)
age 19-24 53 0 22.7 18.3-28.1 14.5 12.3-17.2 23.5 19.7-28.1
25-34 65 0 23.1 18.8-28.2 14.7 12.1-17.8 22.5 18.5-27.4
35-49 83 0 20.2 16.6-24.6 16.1 13.9-18.6 22.4 19.2-26.2
50-64 103 0 14.5 12.4-16.8 0.001 15.1 13.1-17.3 0.815 17.4 15.3-19.8 0.039
male 140 0 21.7 19.1-24.5 13.9 12.5-15.5 20.7 18.7-23.0
female 164 0 16.9 14.7-19.4 0.005 16.3 14.6-18.4 0.053 20.8 18.4-23.5 0.961
Māori 115 0 20.6 17.4-24.4 16.3 14.3-18.5 21.9 19.1-25.1
non-Māori 189 0 18.0 16.0-20.2 0.106 14.5 13.1-16.1 0.234 20.1 18.2-22.3 0.313
Northland/Auckland 67 0 20.8 16.8-25.7 16.7 14.0-20.0 23.7 20.1-28.0
Waikato/BoP 84 0 22.4 18.6-27.1 15.7 13.4-18.4 22.8 19.2-27.2
lower North Island 78 0 16.6 14.0-19.7 13.8 12.0-15.8 17.9 15.7-20.5
South Island 75 0 16.5 13.6-20.1 0.053 14.8 12.6-17.4 0.353 19.4 16.4-22.8 0.081
LOD: limit of detection; 95%CI: 95% confidence interval of the geometric mean (GM); R2: R-squared of the multivariate linear
regression model; p-value: the p-value of the multivariate linear regression model for that variable; crea: creatinine adjusted; spgr: specific gravity adjusted.
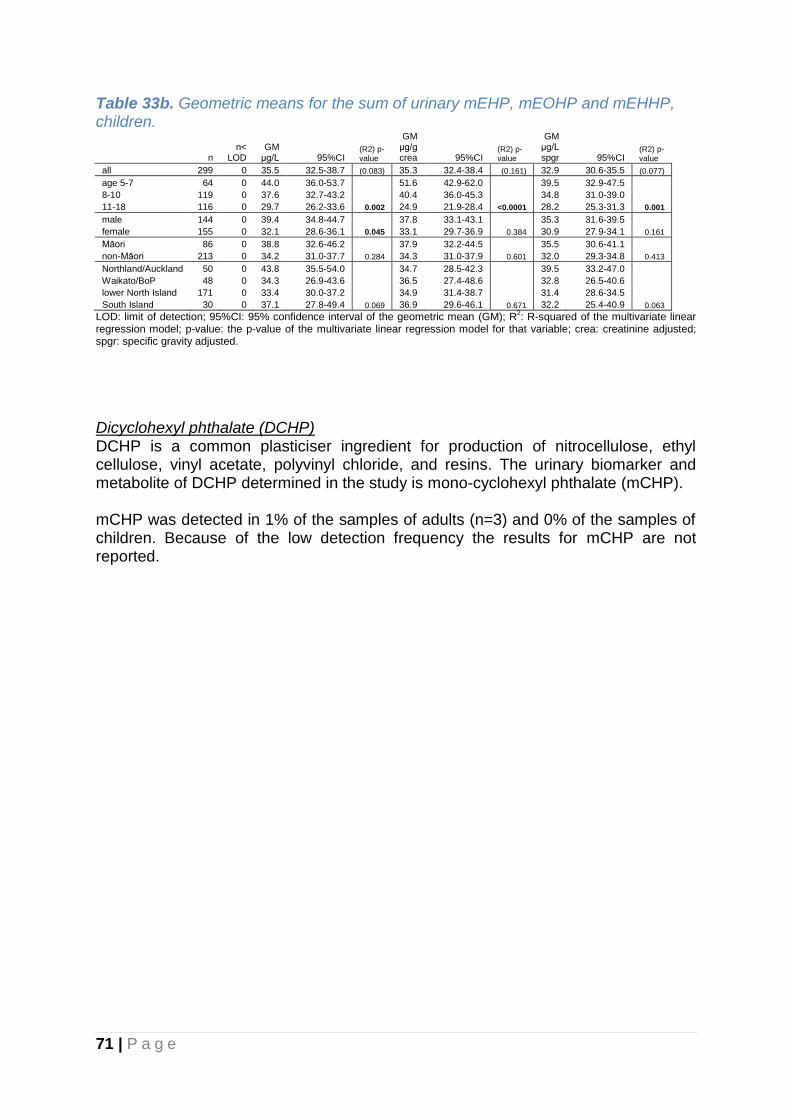
71 | P a g e
Table 33b. Geometric means for the sum of urinary mEHP, mEOHP and mEHHP, children.
n n<
LOD GM
μg/L 95%CI (R2) p-value
GM μg/g crea 95%CI
(R2) p-value
GM μg/L spgr 95%CI
(R2) p-value
all 299 0 35.5 32.5-38.7 (0.083) 35.3 32.4-38.4 (0.161) 32.9 30.6-35.5 (0.077)
age 5-7 64 0 44.0 36.0-53.7 51.6 42.9-62.0 39.5 32.9-47.5
8-10 119 0 37.6 32.7-43.2 40.4 36.0-45.3 34.8 31.0-39.0
11-18 116 0 29.7 26.2-33.6 0.002 24.9 21.9-28.4 <0.0001 28.2 25.3-31.3 0.001
male 144 0 39.4 34.8-44.7 37.8 33.1-43.1 35.3 31.6-39.5
female 155 0 32.1 28.6-36.1 0.045 33.1 29.7-36.9 0.384 30.9 27.9-34.1 0.161
Māori 86 0 38.8 32.6-46.2 37.9 32.2-44.5 35.5 30.6-41.1
non-Māori 213 0 34.2 31.0-37.7 0.284 34.3 31.0-37.9 0.601 32.0 29.3-34.8 0.413
Northland/Auckland 50 0 43.8 35.5-54.0 34.7 28.5-42.3 39.5 33.2-47.0
Waikato/BoP 48 0 34.3 26.9-43.6 36.5 27.4-48.6 32.8 26.5-40.6
lower North Island 171 0 33.4 30.0-37.2 34.9 31.4-38.7 31.4 28.6-34.5
South Island 30 0 37.1 27.8-49.4 0.069 36.9 29.6-46.1 0.671 32.2 25.4-40.9 0.063
LOD: limit of detection; 95%CI: 95% confidence interval of the geometric mean (GM); R2: R-squared of the multivariate linear
regression model; p-value: the p-value of the multivariate linear regression model for that variable; crea: creatinine adjusted; spgr: specific gravity adjusted.
Dicyclohexyl phthalate (DCHP) DCHP is a common plasticiser ingredient for production of nitrocellulose, ethyl cellulose, vinyl acetate, polyvinyl chloride, and resins. The urinary biomarker and metabolite of DCHP determined in the study is mono-cyclohexyl phthalate (mCHP). mCHP was detected in 1% of the samples of adults (n=3) and 0% of the samples of children. Because of the low detection frequency the results for mCHP are not reported.

72 | P a g e
di-n-octyl phthalate (DOP) DOP is a high molecular weight phthalate and a commonly used plasticiser found in a variety of consumer products. The urinary biomarker and metabolite of DOP determined in the study is mono-(3-carboxypropyl) phthalate (mCPP). The results for mCPP are presented in Table 34a for adults and Table 34b for children. mCPP was detected in 63% of the samples of adults and in 76% of the samples of children. The GM urinary mCPP levels was 2.4 μg/L for adults and 3.3 μg/L for children. The arithmetic mean urinary mCPP levels was 5.5 μg/L for adults and 5.2 μg/L for children. The 95th percentile was 18 μg/L for adults and 12 μg/L for children. The highest GM was observed for the youngest age group (4.4 μg/L for the 5-7 year age group) and the lowest for the oldest age group (2.0 μg/L for the 50-64 year age group).
Table 34a. Geometric means for urinary mono-(3-carboxypropyl) phthalate (mCPP), adults.
n n<
LOD GM
μg/L 95%CI (R2) p-value
GM μg/g crea 95%CI
(R2) p-value
GM μg/L spgr 95%CI
(R2) p-value
all 304 112 2.36 2.10-2.66 (0.044) 1.89 1.68-2.13 (0.029) 2.59 2.32-2.90 (0.020)
age 19-24 53 17 2.69 2.09-3.46 1.72 1.34-2.21 2.78 2.20-3.52
25-34 65 31 2.44 1.88-3.16 1.56 1.23-1.97 2.38 1.88-3.02
35-49 83 27 2.68 2.06-3.48 2.13 1.64-2.77 2.98 2.31-3.84
50-64 103 37 1.96 1.64-2.34 0.123 2.04 1.69-2.47 0.242 2.36 1.98-2.82 0.333
male 140 43 2.73 2.31-3.23 1.75 1.48-2.08 2.61 2.22-3.07
female 164 69 2.09 1.77-2.46 0.020 2.02 1.72-2.38 0.230 2.58 2.20-3.02 0.883
Māori 115 45 2.20 1.82-2.67 1.74 1.44-2.09 2.34 1.95-2.80
non-Māori 189 67 2.46 2.12-2.86 0.426 1.99 1.71-2.32 0.211 2.76 2.39-3.19 0.155
Northland/Auckland 67 26 2.26 1.76-2.91 1.82 1.40-2.38 2.58 2.02-3.31
Waikato/BoP 84 30 2.49 2.02-3.09 1.75 1.42-2.14 2.54 2.07-3.12
lower North Island 78 26 2.58 2.03-3.28 2.14 1.71-2.68 2.79 2.24-3.47
South Island 75 30 2.11 1.66-2.68 0.524 1.89 1.47-2.43 0.687 2.47 1.94-3.13 0.864
LOD: limit of detection (2 µg/L); 95%CI: 95% confidence interval of the geometric mean (GM); R2: R-squared of the multivariate
linear regression model; p-value: the p-value of the multivariate linear regression model for that variable; crea: creatinine adjusted; spgr: specific gravity adjusted.
Table 34b. Geometric means for urinary mono-(3-carboxypropyl) phthalate (mCPP), children.
n n<
LOD GM
μg/L 95%CI (R2) p-value
GM μg/g crea 95%CI
(R2) p-value
GM μg/L spgr 95%CI
(R2) p-value
all 299 71 3.33 3.04-3.66 (0.114) 3.32 3.01-3.65 (0.210) 3.10 2.84-3.37 (0.111)
age 5-7 64 8 4.36 3.63-5.24 5.12 4.31-6.07 3.92 3.31-4.65
8-10 119 18 3.85 3.30-4.50 4.14 3.58-4.80 3.57 3.10-4.12
11-18 116 45 2.48 2.18-2.82 <0.0001 2.08 1.83-2.37 <0.0001 2.35 2.09-2.64 <0.0001
male 144 26 3.67 3.23-4.17 3.52 3.05-4.06 3.29 2.92-3.71
female 155 45 3.05 2.67-3.48 0.099 3.14 2.76-3.57 0.593 2.93 2.60-3.30 0.330
Māori 86 19 3.51 3.02-4.09 3.43 2.90-4.05 3.21 2.81-3.67
non-Māori 213 52 3.26 2.91-3.66 0.696 3.27 2.92-3.67 0.869 3.05 2.74-3.39 0.961
Northland/Auckland 50 11 3.77 3.02-4.72 2.99 2.39-3.74 3.41 2.77-4.18
Waikato/BoP 48 17 2.84 2.32-3.47 3.02 2.28-4.01 2.72 2.22-3.33
lower North Island 171 37 3.38 2.97-3.84 3.52 3.11-3.99 3.17 2.83-3.56
South Island 30 6 3.25 2.52-4.21 0.121 3.24 2.51-4.17 0.687 2.83 2.24-3.57 0.120
LOD: limit of detection (2 µg/L); 95%CI: 95% confidence interval of the geometric mean (GM); R2: R-squared of the multivariate
linear regression model; p-value: the p-value of the multivariate linear regression model for that variable; crea: creatinine adjusted; spgr: specific gravity adjusted.
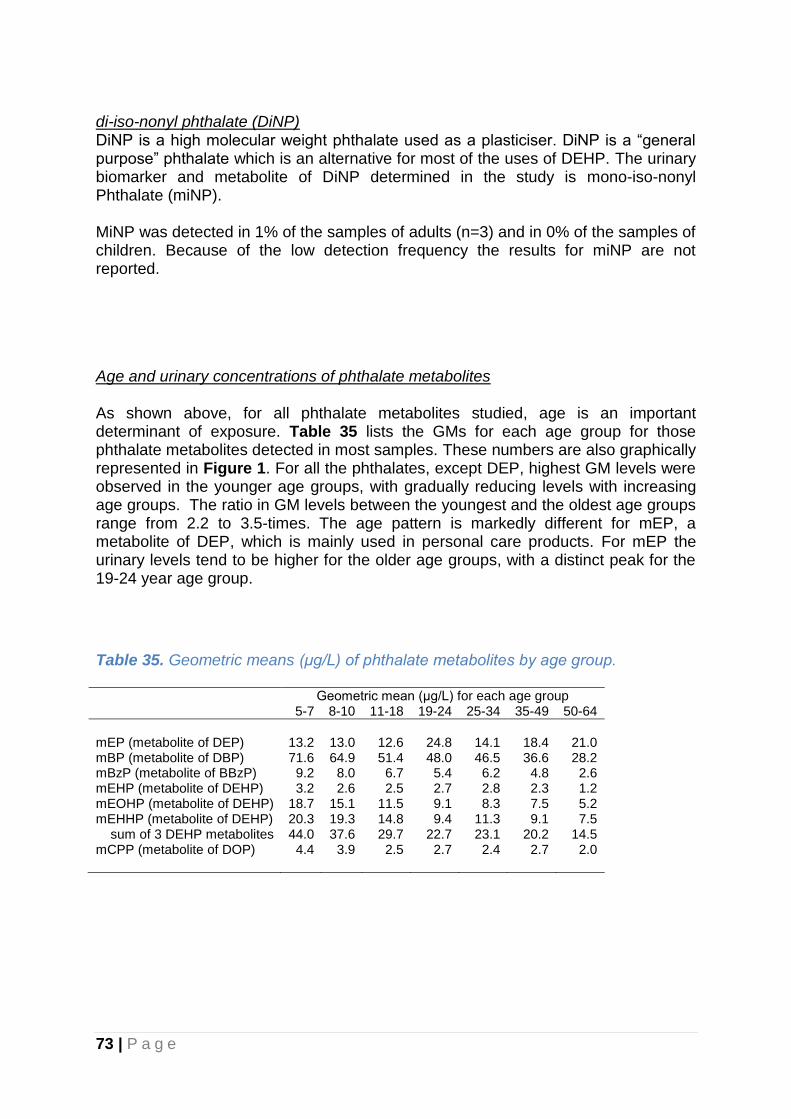
73 | P a g e
di-iso-nonyl phthalate (DiNP) DiNP is a high molecular weight phthalate used as a plasticiser. DiNP is a “general purpose” phthalate which is an alternative for most of the uses of DEHP. The urinary biomarker and metabolite of DiNP determined in the study is mono-iso-nonyl Phthalate (miNP). MiNP was detected in 1% of the samples of adults (n=3) and in 0% of the samples of children. Because of the low detection frequency the results for miNP are not reported.
Age and urinary concentrations of phthalate metabolites As shown above, for all phthalate metabolites studied, age is an important determinant of exposure. Table 35 lists the GMs for each age group for those phthalate metabolites detected in most samples. These numbers are also graphically represented in Figure 1. For all the phthalates, except DEP, highest GM levels were observed in the younger age groups, with gradually reducing levels with increasing age groups. The ratio in GM levels between the youngest and the oldest age groups range from 2.2 to 3.5-times. The age pattern is markedly different for mEP, a metabolite of DEP, which is mainly used in personal care products. For mEP the urinary levels tend to be higher for the older age groups, with a distinct peak for the 19-24 year age group.
Table 35. Geometric means (μg/L) of phthalate metabolites by age group. Geometric mean (μg/L) for each age group 5-7 8-10 11-18 19-24 25-34 35-49 50-64
mEP (metabolite of DEP) 13.2 13.0 12.6 24.8 14.1 18.4 21.0 mBP (metabolite of DBP) 71.6 64.9 51.4 48.0 46.5 36.6 28.2 mBzP (metabolite of BBzP) 9.2 8.0 6.7 5.4 6.2 4.8 2.6 mEHP (metabolite of DEHP) 3.2 2.6 2.5 2.7 2.8 2.3 1.2 mEOHP (metabolite of DEHP) 18.7 15.1 11.5 9.1 8.3 7.5 5.2 mEHHP (metabolite of DEHP) 20.3 19.3 14.8 9.4 11.3 9.1 7.5 sum of 3 DEHP metabolites 44.0 37.6 29.7 22.7 23.1 20.2 14.5 mCPP (metabolite of DOP) 4.4 3.9 2.5 2.7 2.4 2.7 2.0
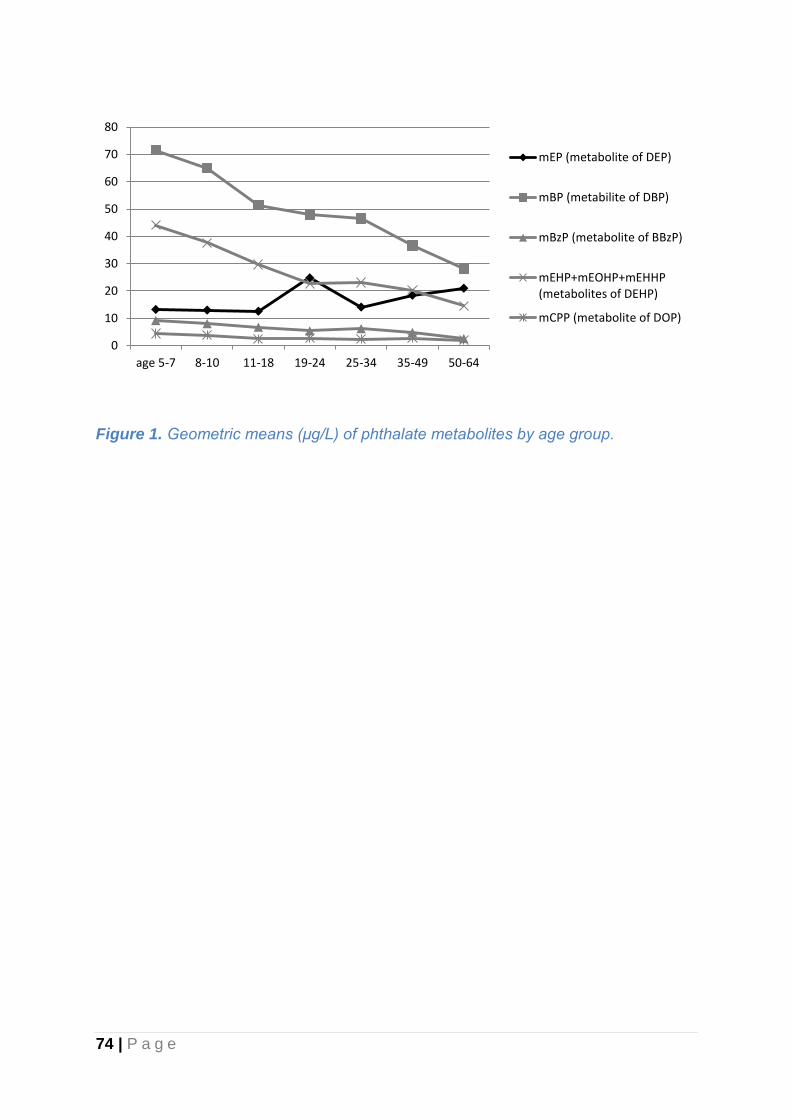
74 | P a g e
Figure 1. Geometric means (μg/L) of phthalate metabolites by age group.
0
10
20
30
40
50
60
70
80
age 5-7 8-10 11-18 19-24 25-34 35-49 50-64
mEP (metabolite of DEP)
mBP (metabilite of DBP)
mBzP (metabolite of BBzP)
mEHP+mEOHP+mEHHP(metabolites of DEHP)
mCPP (metabolite of DOP)
75 | P a g e
5. Comparison with other countries Several countries have conducted similar general population biomonitoring studies or programmes in recent years, including Austria (Hohenblum et al., 2012), Belgium (Schoeters et al., 2012; Hoet et al., 2013), Canada (Haines et al., 2011; Haines & Murray, 2012; Haines et al., 2016; Saravanabhavan et al., 2016), the Czech Republic (Cerna et al., 2007; Cerna et al., 2012), European countries (DEMOCOPHES) (Casteleyn & Aerts, 2015; Casteleyn et al., 2015; Den Hond et al., 2015), France (Frery et al., 2012; Nisse et al., 2016; Tagne-Fotso et al., 2016), Germany (Schulz et al., 2007a; Schulz et al., 2007b; Kolossa-Gehring et al., 2012), Korea (Lee et al., 2012; Sul et al., 2012; Lee et al., 2014; Choi et al., 2016; Kim et al., 2016), Spain (Perez-Gomez et al., 2013; Canas et al., 2014; Lopez-Herranz et al., 2016), UK (Morton et al., 2014; Saravanabhavan et al., 2016) and the US (CDC, 2017). These biomonitoring studies or programmes vary widely in the list of tested substances and the number of participants. Both the programmes conducted in the US and Canada included an extensive list of tested substances, large numbers of participants, and repeated surveys at regular intervals, thus providing insight in trends over time. Both also report results for children. The paragraphs below include more information on the monitoring programmes from the US and Canada. US (NHANES) The National Health and Nutrition Examination Survey (NHANES) is a program of studies designed to assess the health and nutritional status of adults and children in the United States. NHANES is a major program of the National Center for Health Statistics (NCHS), which is part of the Centers for Disease Control and Prevention (CDC) and has the responsibility for producing vital and health statistics for the US. The sample for the survey is selected to represent the US population of all ages. To produce reliable statistics, NHANES over-samples persons 60 and older, African Americans, Asians, and Hispanics. Blood and urine samples have been collected since 1999, and the survey was repeated every 2 years (1999-2000, 2001-2002, 2003-2004, 2005-2006, 2007-2008, 2009-2010, 2011-2012, 2013-2014). The Fourth National Report on Human Exposure to Environmental Chemicals published in 2017 includes the most recent biomonitoring results (2013-2014), as well as the results for all the previous survey cycles since 1999 (CDC, 2017). Canada (The Canadian Health Measures Survey) The Canadian Health Measures Survey (CHMS) was launched in 2007 to collect key information relevant to the health of Canadians. The target population for CHMS consists of persons 3 to 79 years of age living in Canada. The survey includes the collection of blood and urine and has thus far reported on 4 survey cycles: 2007-2009, 2009-2011, 2012-2013 and 2014-2015. The fourth report on human biomonitoring of environmental chemicals in Canada published in 2017, reports the most recent results of Survey Cycle 4 (2014-2015) (Health Canada, 2017). Comparisons with earlier cycles has also been reported in 2016 (Saravanabhavan et al., 2016).
76 | P a g e
The tables in the following sections include the geometric means reported for the most recent US (NHANES) and Canadian (The Canadian Health Measures Survey) survey cycles (if available), as well as geometric means from population based surveys from other countries if identified through a medline search. Geometric means reported from studies using a sample that was not representative for the general population (e.g. only pregnant women; only occupationally exposed) are not included. Studies that used pooled biological samples rather than individual samples are not included in the following tables, because concentrations based on pooled samples are not directly comparable to geometric means of collections of individual samples. Results from pooled samples can however be compared with the arithmetic mean of collections of individual samples, as the impact of outliers on the summary statistic is similar in these situations. Therefore, to enable comparison with recent Australian studies that were based on pooled samples, the Australian summary statistics are included in the text and compared to the arithmetic mean of the levels in the individual New Zealand samples.

77 | P a g e
5.1 International comparison blood lead The GMs for blood lead concentrations for New Zealand adults and children, and those reported for other countries, are listed in Table 36. The blood lead concentrations for adults and children in New Zealand were comparable to the geometric means reported for US and Canada. However, for these countries a downward trend over time has been observed with the most recent results indicating concentrations below those observed for New Zealand, which could reflect the earlier phase out by over a decade of lead in petrol in North America compared to New Zealand. The New Zealand blood lead concentrations in adults are lower than those reported for Korea, France, Spain, and Germany, although it should be noted that these surveys were conducted several years before the New Zealand survey.
Table 36. Comparison of population geometric means of blood lead concentrations (µg/L), reported for different countries country year age Sample size GM 95%CI reference
New Zealand 2014-2016 19-64 304 13.1 12.4-13.9 This study
US 2007-2008 20+ 5364 13.8 13.1-14.6 (CDC, 2017)
US 2009-2010 20+ 5765 12.3 11.9-12.8 (CDC, 2017)
US 2011-2012 20+ 5030 10.9 10.3-11.6 (CDC, 2017)
US 2013-2014 20+ 2695 9.67 9.21-10.2 (CDC, 2017)
Canada 2007-2009 6-79 5319 13 12-14 (Haines et al., 2016)
Canada 2009-2011 3-79 6070 12 11-12 (Haines et al., 2016)
Canada 2012-2013 3-79 5538 11 10-11 (Haines et al., 2016)
Canada 2014-2015 3-79 5498 9.5 9.0-10.0 (Health Canada, 2017)
Korea 2012-2014 19-70+ 6455 19.4 18.9-19.9 (Choi et al., 2016)
France (North) 2008-2010 20-59 1992 18.8 18.3-19.3 (Nisse et al., 2016)
Spain 2009-2010 18-65 1880 24.03 22.98-25.12 (Canas et al., 2014)
Germany 1998 25-69 3974 31.6 nr (Schulz et al., 2007b)
New Zealand 2014-2016 5-18 193 8.5 7.9-9.1 This study
US 2007-2008 6-11 1011 9.88 9.14-10.7 (CDC, 2017)
US 2009-2010 6-11 1009 8.38 7.92-8.87 (CDC, 2017)
US 2011-2012 6-11 1048 6.81 6.23-7.44 (CDC, 2017)
US 2013-2014 6-11 1075 5.67 5.29-6.07 (CDC, 2017)
Canada 2007-2009 6-11 910 9.0 8.1-9.9 (Health Canada, 2015)
Canada 2009-2011 6-11 961 7.9 7.4-8.4 (Health Canada, 2017)
Canada 2012-2013 6-11 944 7.1 6.7-7.6 (Health Canada, 2017)
Canada 2014-2015 6-11 925 5.9 5.5-6.2 (Health Canada, 2017)
Germany 2003-2006 6-14 1245 15.7 nr (Schulz et al., 2007b)
Italy 2008-2010 13-15 252 9.5 nr (Pino et al., 2012)
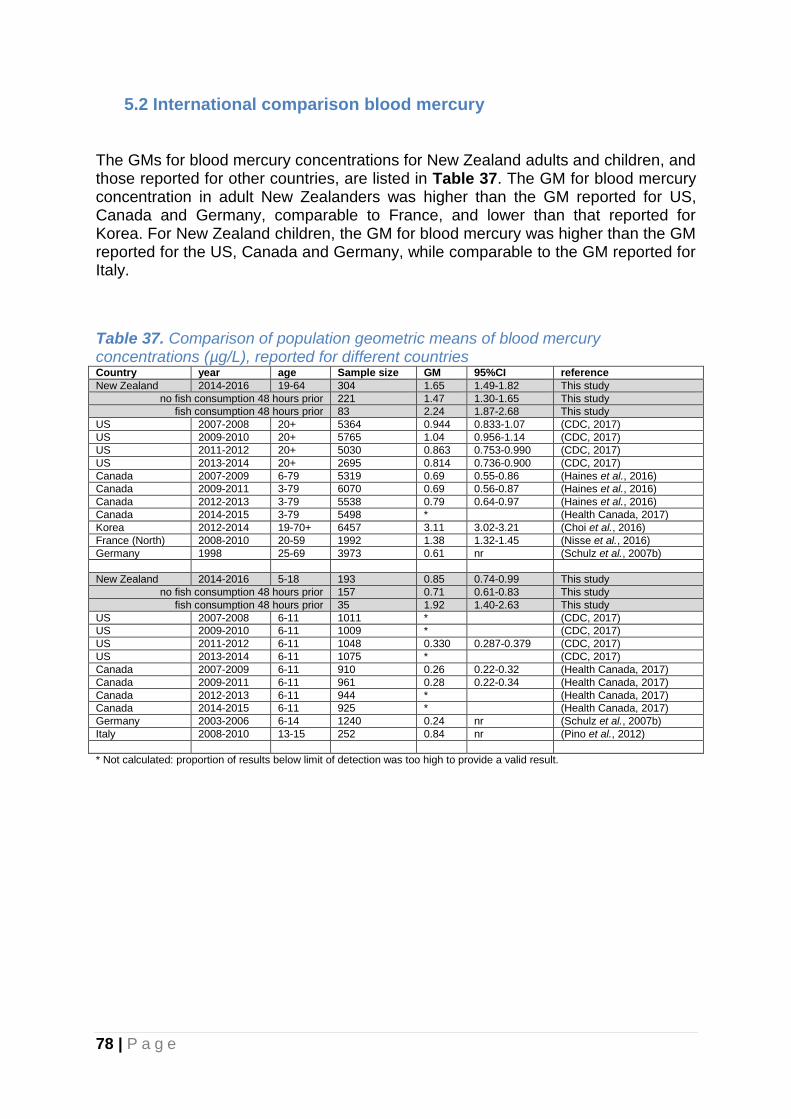
78 | P a g e
5.2 International comparison blood mercury The GMs for blood mercury concentrations for New Zealand adults and children, and those reported for other countries, are listed in Table 37. The GM for blood mercury concentration in adult New Zealanders was higher than the GM reported for US, Canada and Germany, comparable to France, and lower than that reported for Korea. For New Zealand children, the GM for blood mercury was higher than the GM reported for the US, Canada and Germany, while comparable to the GM reported for Italy.
Table 37. Comparison of population geometric means of blood mercury concentrations (µg/L), reported for different countries Country year age Sample size GM 95%CI reference
New Zealand 2014-2016 19-64 304 1.65 1.49-1.82 This study
no fish consumption 48 hours prior 221 1.47 1.30-1.65 This study
fish consumption 48 hours prior 83 2.24 1.87-2.68 This study
US 2007-2008 20+ 5364 0.944 0.833-1.07 (CDC, 2017)
US 2009-2010 20+ 5765 1.04 0.956-1.14 (CDC, 2017)
US 2011-2012 20+ 5030 0.863 0.753-0.990 (CDC, 2017)
US 2013-2014 20+ 2695 0.814 0.736-0.900 (CDC, 2017)
Canada 2007-2009 6-79 5319 0.69 0.55-0.86 (Haines et al., 2016)
Canada 2009-2011 3-79 6070 0.69 0.56-0.87 (Haines et al., 2016)
Canada 2012-2013 3-79 5538 0.79 0.64-0.97 (Haines et al., 2016)
Canada 2014-2015 3-79 5498 * (Health Canada, 2017)
Korea 2012-2014 19-70+ 6457 3.11 3.02-3.21 (Choi et al., 2016)
France (North) 2008-2010 20-59 1992 1.38 1.32-1.45 (Nisse et al., 2016)
Germany 1998 25-69 3973 0.61 nr (Schulz et al., 2007b)
New Zealand 2014-2016 5-18 193 0.85 0.74-0.99 This study
no fish consumption 48 hours prior 157 0.71 0.61-0.83 This study
fish consumption 48 hours prior 35 1.92 1.40-2.63 This study
US 2007-2008 6-11 1011 * (CDC, 2017)
US 2009-2010 6-11 1009 * (CDC, 2017)
US 2011-2012 6-11 1048 0.330 0.287-0.379 (CDC, 2017)
US 2013-2014 6-11 1075 * (CDC, 2017)
Canada 2007-2009 6-11 910 0.26 0.22-0.32 (Health Canada, 2017)
Canada 2009-2011 6-11 961 0.28 0.22-0.34 (Health Canada, 2017)
Canada 2012-2013 6-11 944 * (Health Canada, 2017)
Canada 2014-2015 6-11 925 * (Health Canada, 2017)
Germany 2003-2006 6-14 1240 0.24 nr (Schulz et al., 2007b)
Italy 2008-2010 13-15 252 0.84 nr (Pino et al., 2012)
* Not calculated: proportion of results below limit of detection was too high to provide a valid result.

79 | P a g e
5.3 International comparison urinary arsenic Arsenobetaine (AB) is the main organic form of arsenic detectable in urine, indicative of recent fish consumption. The GMs for urinary AB concentrations for New Zealand adults and children, and those reported for other countries, are listed in Table 38. Urinary levels of AB in adult New Zealanders are approximately two times higher compared to data reported for the US, but lower than those reported for high fish consuming nations such as Spain(Navarro Serrano et al., 2016) (see table) and Japan (Hata et al., 2007) (not included in the table as the GM was not reported). For children a direct comparison with other countries could not be made, as results for the US were not presented due to a high proportion of samples being below the limit of detection.
Table 38. Comparison of population geometric means of urinary arsenobetaine (AB) concentrations (µg/L), reported for different countries country year age Sample size GM 95%CI reference
New Zealand 2014-2016 19-64 304 3.51 2.44-5.04 This study
no fish consumption 48 hours prior 225 1.77 1.17-2.68 This study
fish consumption 48 hours prior 79 24.59 13.98-43.27 This study
US 2007-2008 20+ 1820 1.46 1.28-1.67 (CDC, 2017)
US 2009-2010 20+ 2035 1.92 1.63-2.26 (CDC, 2017)
US 2011-2012 20+ 1724 * (CDC, 2017)
US 2013-2014 20+ 1807 * (CDC, 2017)
Spain nr 20-67 124 29.1 nr (Navarro Serrano et al., 2016)
New Zealand 2014-2016 5-18 299 1.50 1.01-2.23 This study
no fish consumption 48 hours prior 116 0.91 0.56-1.48 This study
fish consumption 48 hours prior 37 41.21 15.32-110.9 This study
US 2007-2008 6-11 390 * (CDC, 2017)
US 2009-2010 6-11 380 * (CDC, 2017)
US 2011-2012 6-11 401 * (CDC, 2017)
US 2013-2014 6-11 397 * (CDC, 2017)
* Not calculated: proportion of results below limit of detection was too high to provide a valid result.
Dimethylarsinic acid (DMA) is a main inorganic arsenic related compound found in urine. The GMs for urinary DMA concentrations for New Zealand adults and children, and those reported for other countries, are listed in Table 39. Urinary levels of DMA in adult New Zealanders are comparable to data reported for the US and Canada while below that reported for Spain. For urinary DMA concentrations in children few comparison studies were available, but studies from the US indicate that New Zealand levels of urinary DMA in children are below those reported for the US
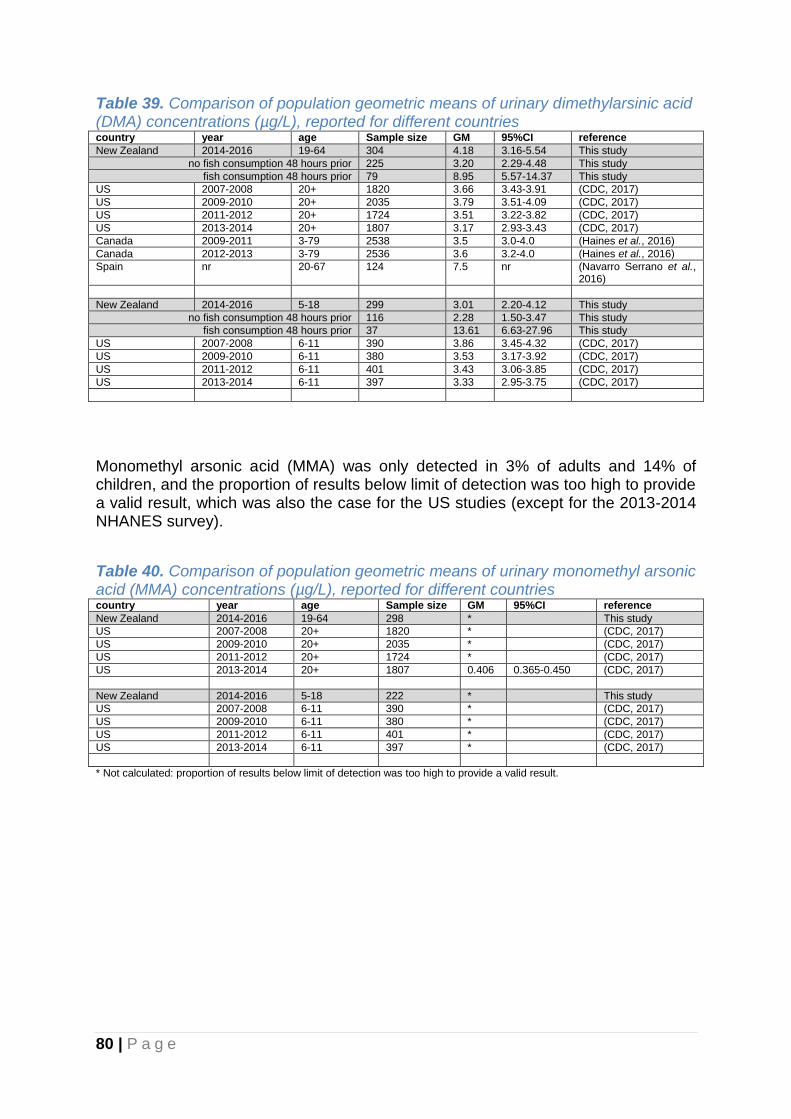
80 | P a g e
Table 39. Comparison of population geometric means of urinary dimethylarsinic acid (DMA) concentrations (µg/L), reported for different countries country year age Sample size GM 95%CI reference
New Zealand 2014-2016 19-64 304 4.18 3.16-5.54 This study
no fish consumption 48 hours prior 225 3.20 2.29-4.48 This study
fish consumption 48 hours prior 79 8.95 5.57-14.37 This study
US 2007-2008 20+ 1820 3.66 3.43-3.91 (CDC, 2017)
US 2009-2010 20+ 2035 3.79 3.51-4.09 (CDC, 2017)
US 2011-2012 20+ 1724 3.51 3.22-3.82 (CDC, 2017)
US 2013-2014 20+ 1807 3.17 2.93-3.43 (CDC, 2017)
Canada 2009-2011 3-79 2538 3.5 3.0-4.0 (Haines et al., 2016)
Canada 2012-2013 3-79 2536 3.6 3.2-4.0 (Haines et al., 2016)
Spain nr 20-67 124 7.5 nr (Navarro Serrano et al., 2016)
New Zealand 2014-2016 5-18 299 3.01 2.20-4.12 This study
no fish consumption 48 hours prior 116 2.28 1.50-3.47 This study
fish consumption 48 hours prior 37 13.61 6.63-27.96 This study
US 2007-2008 6-11 390 3.86 3.45-4.32 (CDC, 2017)
US 2009-2010 6-11 380 3.53 3.17-3.92 (CDC, 2017)
US 2011-2012 6-11 401 3.43 3.06-3.85 (CDC, 2017)
US 2013-2014 6-11 397 3.33 2.95-3.75 (CDC, 2017)
Monomethyl arsonic acid (MMA) was only detected in 3% of adults and 14% of children, and the proportion of results below limit of detection was too high to provide a valid result, which was also the case for the US studies (except for the 2013-2014 NHANES survey).
Table 40. Comparison of population geometric means of urinary monomethyl arsonic acid (MMA) concentrations (µg/L), reported for different countries country year age Sample size GM 95%CI reference
New Zealand 2014-2016 19-64 298 * This study
US 2007-2008 20+ 1820 * (CDC, 2017)
US 2009-2010 20+ 2035 * (CDC, 2017)
US 2011-2012 20+ 1724 * (CDC, 2017)
US 2013-2014 20+ 1807 0.406 0.365-0.450 (CDC, 2017)
New Zealand 2014-2016 5-18 222 * This study
US 2007-2008 6-11 390 * (CDC, 2017)
US 2009-2010 6-11 380 * (CDC, 2017)
US 2011-2012 6-11 401 * (CDC, 2017)
US 2013-2014 6-11 397 * (CDC, 2017)
* Not calculated: proportion of results below limit of detection was too high to provide a valid result.

81 | P a g e
5.4 International comparison urinary cadmium The GMs for urinary cadmium concentrations for New Zealand adults and children, and those reported for other countries, are listed in Table 41.The geometric mean of urinary cadmium concentrations of adult New Zealanders is comparable to that reported for US and the Europe DEMOCOPHES study, and lower than that reported for Canada, Korea and Spain. For children, the New Zealand GM is also comparable to the GM reported for Europe DEMOCOPHES, while below that reported for Canada.
Table 41. Comparison of population geometric means of urinary cadmium concentrations (µg/L), reported for different countries country year age Sample
size GM 95%CI reference
New Zealand 2014-2016 19-64 304 0.19 0.18-0.21 This study
US 2007-2008 20+ 1857 0.232 0.215-0.251 (CDC, 2017)
US 2009-2010 20+ 2019 0.229 0.213-0.245 (CDC, 2017)
US 2011-2012 20+ 1715 0.194 0.178-0.211 (CDC, 2017)
US 2013-2014 20+ 1811 0.156 0.146-0.167 (CDC, 2017)
Canada 2007-2009 6-79 5491 0.34 0.31-0.38 (Haines et al., 2016)
Canada 2009-2011 3-79 6311 0.38 0.34-0.43 (Haines et al., 2016)
Korea 2012-2014 19-70+ 6469 0.38 0.36-0.39 (Choi et al., 2016)
France (North) 2008-2010 20-59 1910 0.37 0.35-0.39 (Nisse et al., 2016)
Spain 2009-2010 18-65 1770 0.28 0.27-0.32 (Lopez-Herranz et al., 2016)
Belgium 2010-2011 18-80 1001 0.228 0.211-0.245 (Hoet et al., 2013)
Germany (non smokers) 1998 25-69 2758 0.209 nr (Schulz et al., 2007b)
Germany (smokers) 1998 25-69 1293 0.334 nr (Schulz et al., 2007b)
Europe (DEMOCOPHES) urban 2011 31-52 844 0.216 0.203-0.229 (Morck et al., 2015)
Europe (DEMOCOPHES) rural 2011 31-50 841 0.220 0.207-0.233 (Morck et al., 2015)
New Zealand 2014-2016 5-18 300 0.074 0.069-0.079 This study
US 2007-2008 6-11 394 0.064 0.058-0.071 (CDC, 2017)
US 2009-2010 6-11 378 0.057 0.053-0.061 (CDC, 2017)
US 2011-2012 6-11 399 * (CDC, 2017)
US 2013-2014 6-11 402 * (CDC, 2017)
Canada 2007-2009 6-11 1033 0.22 0.19-0.26 (Health Canada, 2015)
Germany 2003-2006 6-14 1354 0.071 nr (Schulz et al., 2007b)
Europe (DEMOCOPHES) 2011 6-11 848 0.066 0.062-0.070 (Morck et al., 2015)
Europe (DEMOCOPHES) 2011 6-11 850 0.069 0.065-0.074 (Morck et al., 2015)
* Not calculated: proportion of results below limit of detection was too high to provide a valid result.

82 | P a g e
5.5 International comparison urinary chromium The GMs for urinary chromium concentrations for New Zealand adults and children, and those reported for other countries, are listed in Table 42. Very few studies have reported geometric means of urinary concentrations for chromium in adults and comparisons with the US and Canada cannot be made. The New Zealand mean urinary chromium concentration is considerably lower than the most recent results reported for France and Belgium.
Table 42. Comparison of population geometric means of urinary chromium concentrations (µg/L), reported for different countries country Year age Sample size GM 95%CI reference
New Zealand 2014-2016 19-64 304 0.052 0.043-0.063 This study
France (North) 2008-2010 20-59 1910 0.38 0.36-0.40 (Nisse et al., 2016)
Belgium 2010-2011 18-80 1001 0.103 0.10-0.11 (Hoet et al., 2013)
New Zealand 2014-2016 5-18 300 0.034 0.028-0.040 This study
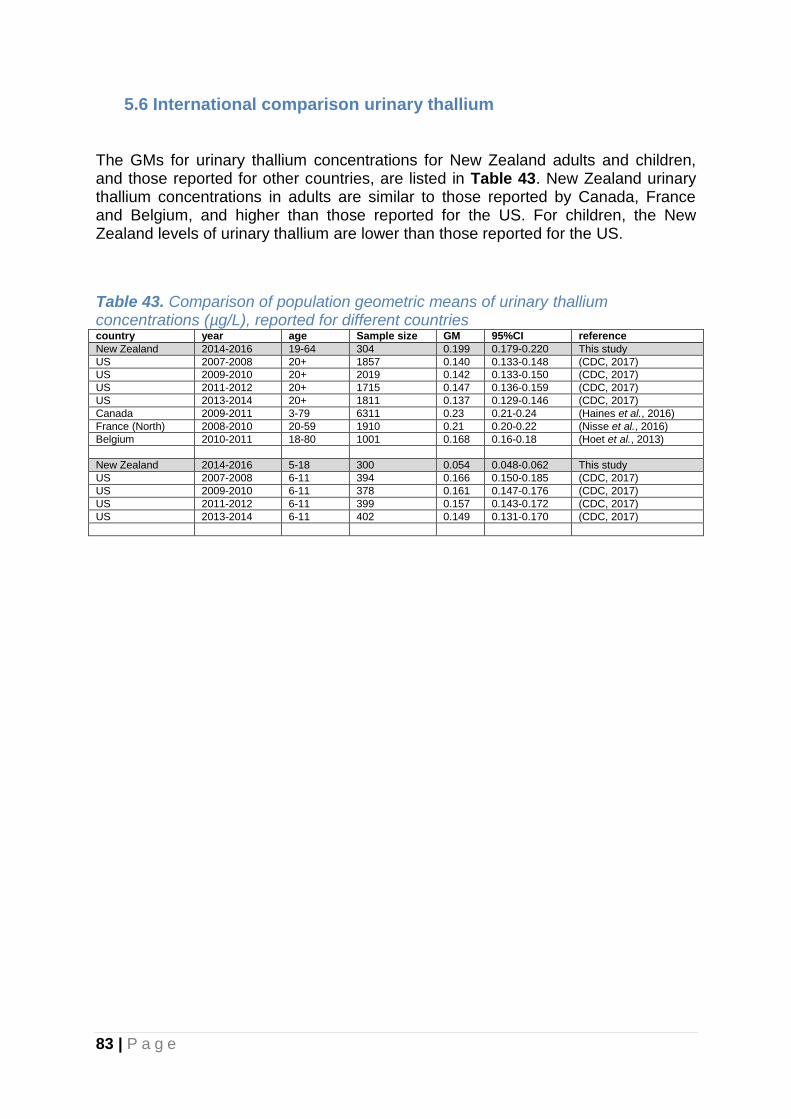
83 | P a g e
5.6 International comparison urinary thallium The GMs for urinary thallium concentrations for New Zealand adults and children, and those reported for other countries, are listed in Table 43. New Zealand urinary thallium concentrations in adults are similar to those reported by Canada, France and Belgium, and higher than those reported for the US. For children, the New Zealand levels of urinary thallium are lower than those reported for the US.
Table 43. Comparison of population geometric means of urinary thallium concentrations (µg/L), reported for different countries country year age Sample size GM 95%CI reference
New Zealand 2014-2016 19-64 304 0.199 0.179-0.220 This study
US 2007-2008 20+ 1857 0.140 0.133-0.148 (CDC, 2017)
US 2009-2010 20+ 2019 0.142 0.133-0.150 (CDC, 2017)
US 2011-2012 20+ 1715 0.147 0.136-0.159 (CDC, 2017)
US 2013-2014 20+ 1811 0.137 0.129-0.146 (CDC, 2017)
Canada 2009-2011 3-79 6311 0.23 0.21-0.24 (Haines et al., 2016)
France (North) 2008-2010 20-59 1910 0.21 0.20-0.22 (Nisse et al., 2016)
Belgium 2010-2011 18-80 1001 0.168 0.16-0.18 (Hoet et al., 2013)
New Zealand 2014-2016 5-18 300 0.054 0.048-0.062 This study
US 2007-2008 6-11 394 0.166 0.150-0.185 (CDC, 2017)
US 2009-2010 6-11 378 0.161 0.147-0.176 (CDC, 2017)
US 2011-2012 6-11 399 0.157 0.143-0.172 (CDC, 2017)
US 2013-2014 6-11 402 0.149 0.131-0.170 (CDC, 2017)

84 | P a g e
5.7 International comparison urinary antimony The GMs for urinary antimony concentrations for New Zealand adults and children, and those reported for other countries, are listed in Table 44. New Zealand urinary antimony concentrations in adults are similar to those reported for France and marginally higher than levels most recently reported for Belgium, US and Canada. New Zealand urinary antimony concentrations in children are also above those most recently reported for the US and Canada. The pattern of somewhat higher levels among children compared to adults observed in this study, was also observed in studies from the US and Canada.
Table 44. Comparison of population geometric means of urinary antimony concentrations (µg/L), reported for different countries country year age Sample size GM 95%CI reference
New Zealand 2014-2016 19-64 304 0.062 0.055-0.069 This study
US 2007-2008 20+ 1857 0.058 0.054-0.062 (CDC, 2017)
US 2009-2010 20+ 2018 0.045 0.051-0.057 (CDC, 2017)
US 2011-2012 20+ 1715 * (CDC, 2017)
US 2013-2014 20+ 1811 0.042 0.038-0.045 (CDC, 2017)
Canada 2007-2009 6-79 5492 0.042 0.040-0.045 (Haines et al., 2016)
Canada 2009-2011 3-79 6311 0.046 0.044-0.048 (Haines et al., 2016)
France (North) 2008-2010 20-59 1910 0.06 0.05-0.07 (Nisse et al., 2016)
Belgium 2010-2011 18-80 1001 0.029 0.03-0.03 (Hoet et al., 2013)
New Zealand 2014-2016 5-18 300 0.091 0.085-0.098 This study
US 2007-2008 6-11 394 0.068 0.061-0.077 (CDC, 2017)
US 2009-2010 6-11 378 0.069 0.061-0.079 (CDC, 2017)
US 2011-2012 6-11 399 0.064 0.059-0.069 (CDC, 2017)
US 2013-2014 6-11 402 0.052 0.045-0.060 (CDC, 2017)
Canada 2007-2009 6-11 1034 0.05 0.05-0.05 (Health Canada, 2015)
* Not calculated: proportion of results below limit of detection was too high to provide a valid result.

85 | P a g e
5.8 International comparison urinary cotinine
Due to the low detection frequency of cotinine in the New Zealand samples, valid
comparisons with Geometric Means reported for other countries could not be made.
5.9 International comparison urinary fluoride The GMs for urinary fluoride concentrations for New Zealand adults and children, and those reported for other countries, are listed in Table 45. Only very few studies have reported population levels of urinary fluoride. Concentrations of fluoride in New Zealand adults are higher than those reported for Canada, but comparable to those reported for Brazil (Bauru) and Japan. Data from the US or Canada were not available for urinary fluoride concentrations in children. Some studies conducted in areas with high concentrations of naturally occurring fluoride reported very high urinary fluoride concentrations for children (i.e. 12000 µg/L for children living in Ethiopia (Rango et al., 2014) and 2000 µg/L for children living in India (Singh et al., 2007)).
Table 45. Comparison of population geometric means of urinary fluoride concentrations (µg/L), reported for different countries country year age Sample
size GM 95%CI reference
New Zealand 2014-2016 19-64 304 759 710-812 This study
Canada 2009-2011 3-79 2530 500 460-550 (Haines et al., 2016)
Canada 2012-2013 3-79 2671 430 390-480 (Haines et al., 2016)
Canada 2014-2015 3-79 2574 470 380-590 (Health Canada, 2017)
Brazil (Bauru, water fluoridated) 1995-1996 5-50 167 750* Nr (Heintze et al., 1998)
Brazil (Garca, water fluoridated) 1995-1996 5-50 206 1190* Nr (Heintze et al., 1998)
Brazil (Itapolis, water not fluoridated) 1995-1996 5-50 172 360* Nr (Heintze et al., 1998)
Japan nr 19-59 167 614 241-1633 (Usuda et al., 2007)
New Zealand 2014-2016 5-18 299 628 586-674 This study
Canada 2009-2011 6-11 514 500 440-570 (Health Canada, 2017)
Canada 2012-2013 6-11 549 400 360-450 (Health Canada, 2017)
Canada 2014-2015 6-11 533 470 370-600 (Health Canada, 2017)
*median (not GM)
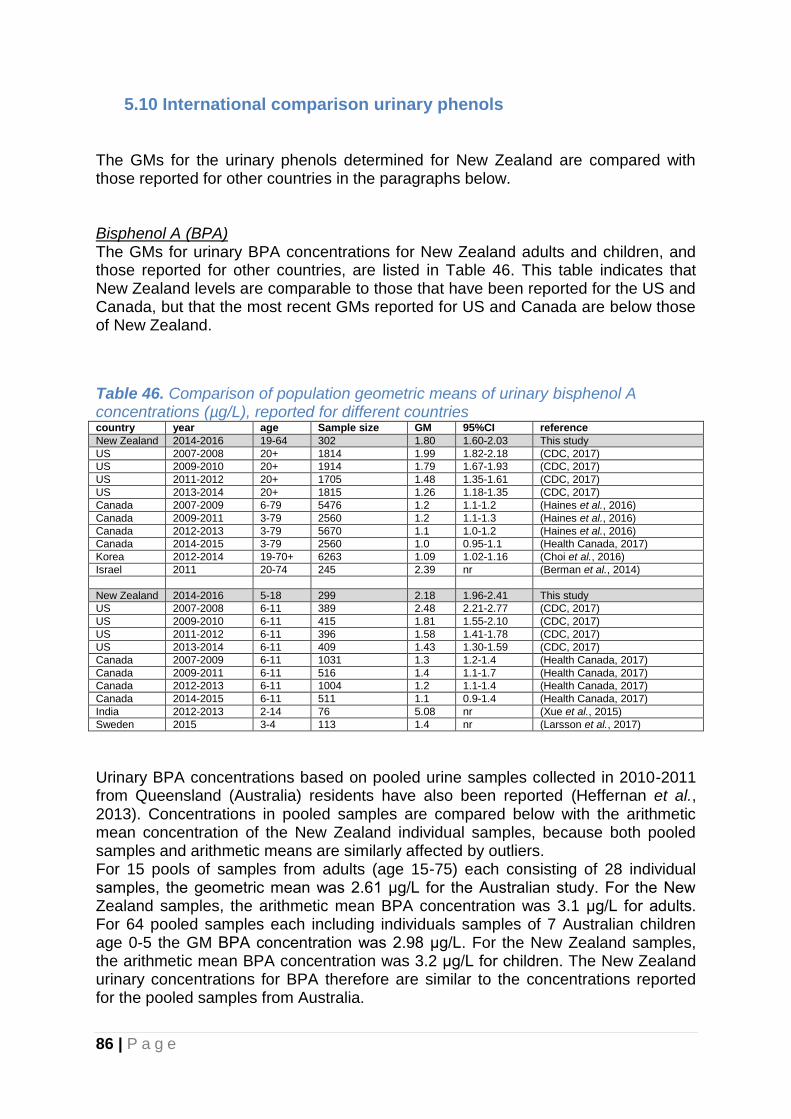
86 | P a g e
5.10 International comparison urinary phenols The GMs for the urinary phenols determined for New Zealand are compared with those reported for other countries in the paragraphs below. Bisphenol A (BPA) The GMs for urinary BPA concentrations for New Zealand adults and children, and those reported for other countries, are listed in Table 46. This table indicates that New Zealand levels are comparable to those that have been reported for the US and Canada, but that the most recent GMs reported for US and Canada are below those of New Zealand.
Table 46. Comparison of population geometric means of urinary bisphenol A concentrations (µg/L), reported for different countries country year age Sample size GM 95%CI reference
New Zealand 2014-2016 19-64 302 1.80 1.60-2.03 This study
US 2007-2008 20+ 1814 1.99 1.82-2.18 (CDC, 2017)
US 2009-2010 20+ 1914 1.79 1.67-1.93 (CDC, 2017)
US 2011-2012 20+ 1705 1.48 1.35-1.61 (CDC, 2017)
US 2013-2014 20+ 1815 1.26 1.18-1.35 (CDC, 2017)
Canada 2007-2009 6-79 5476 1.2 1.1-1.2 (Haines et al., 2016)
Canada 2009-2011 3-79 2560 1.2 1.1-1.3 (Haines et al., 2016)
Canada 2012-2013 3-79 5670 1.1 1.0-1.2 (Haines et al., 2016)
Canada 2014-2015 3-79 2560 1.0 0.95-1.1 (Health Canada, 2017)
Korea 2012-2014 19-70+ 6263 1.09 1.02-1.16 (Choi et al., 2016)
Israel 2011 20-74 245 2.39 nr (Berman et al., 2014)
New Zealand 2014-2016 5-18 299 2.18 1.96-2.41 This study
US 2007-2008 6-11 389 2.48 2.21-2.77 (CDC, 2017)
US 2009-2010 6-11 415 1.81 1.55-2.10 (CDC, 2017)
US 2011-2012 6-11 396 1.58 1.41-1.78 (CDC, 2017)
US 2013-2014 6-11 409 1.43 1.30-1.59 (CDC, 2017)
Canada 2007-2009 6-11 1031 1.3 1.2-1.4 (Health Canada, 2017)
Canada 2009-2011 6-11 516 1.4 1.1-1.7 (Health Canada, 2017)
Canada 2012-2013 6-11 1004 1.2 1.1-1.4 (Health Canada, 2017)
Canada 2014-2015 6-11 511 1.1 0.9-1.4 (Health Canada, 2017)
India 2012-2013 2-14 76 5.08 nr (Xue et al., 2015)
Sweden 2015 3-4 113 1.4 nr (Larsson et al., 2017)
Urinary BPA concentrations based on pooled urine samples collected in 2010-2011 from Queensland (Australia) residents have also been reported (Heffernan et al., 2013). Concentrations in pooled samples are compared below with the arithmetic mean concentration of the New Zealand individual samples, because both pooled samples and arithmetic means are similarly affected by outliers. For 15 pools of samples from adults (age 15-75) each consisting of 28 individual samples, the geometric mean was 2.61 μg/L for the Australian study. For the New Zealand samples, the arithmetic mean BPA concentration was 3.1 μg/L for adults. For 64 pooled samples each including individuals samples of 7 Australian children age 0-5 the GM BPA concentration was 2.98 μg/L. For the New Zealand samples, the arithmetic mean BPA concentration was 3.2 μg/L for children. The New Zealand urinary concentrations for BPA therefore are similar to the concentrations reported for the pooled samples from Australia.

87 | P a g e
Triclosan The GMs for urinary concentrations of the preservative and antiseptic agent triclosan in New Zealand adults and children, and those reported for other countries, are listed in Table 47. Only a few countries have reported on urinary triclosan concentrations in the general population. For these countries, the GMs were two to three times higher than those observed for New Zealand, for both adults and children.
Table 47. Comparison of population geometric means of urinary triclosan concentrations (µg/L), reported for different countries country year age Sample size GM 95%CI reference
New Zealand 2014-2016 19-64 303 5.8 4.3-7.8 This study
US 2007-2008 20+ 1814 15.4 13.7-17.3 (CDC, 2017)
US 2009-2010 20+ 1914 15.5 12.9-18.5 (CDC, 2017)
US 2011-2012 20+ 1705 12.7 11.2-14.4 (CDC, 2017)
US 2013-2014 20+ 1815 10.3 9.32-11.3 (CDC, 2017)
Canada 2009-2011 3-79 2550 16 13-20 (Haines et al., 2016)
Canada 2012-2013 3-79 5645 17 15-19 (Haines et al., 2016)
Canada 2014-2015 3-79 2558 * (Health Canada, 2017)
New Zealand 2014-2016 5-18 299 3.9 3.0-5.0 This study
US 2007-2008 6-11 389 11.8 7.57-18.2 (CDC, 2017)
US 2009-2010 6-11 415 10.9 9.35-12.8 (CDC, 2017)
US 2011-2012 6-11 396 7.18 5.73-9.01 (CDC, 2017)
US 2013-2014 6-11 409 8.24 6.70-10.1 (CDC, 2017)
Canada 2009-2011 6-11 515 8.5 6.7-11 (Health Canada, 2017)
Canada 2012-2013 6-11 1001 11 8.4-16 (Health Canada, 2017)
Canada 2014-2015 6-11 510 * (Health Canada, 2017)
* Not calculated: proportion of results below limit of detection was too high to provide a valid result.
Urinary triclosan concentrations based on pooled urine samples collected in 2012-2013 from Queensland (Australia) residents have also been reported (Heffernan et al., 2015). Concentrations in pooled samples are compared below with the arithmetic mean concentration of the New Zealand individual samples, because both pooled samples and arithmetic means are similarly affected by outliers. For 24 pools of all age groups (0->60 year) each consisting of 100 individual samples, the geometric mean was 88 μg/L for the Australian study. For the New Zealand samples, the arithmetic mean triclosan concentration was 133 μg/L for adults. For a pooled sample of 100 Australian children age 5-14 the triclosan concentration was 106 μg/L. For the New Zealand samples, the arithmetic mean triclosan concentration was 88 μg/L for children. The New Zealand urinary concentrations for triclosan therefore appear comparable to the concentrations reported for the pooled samples from Australia.
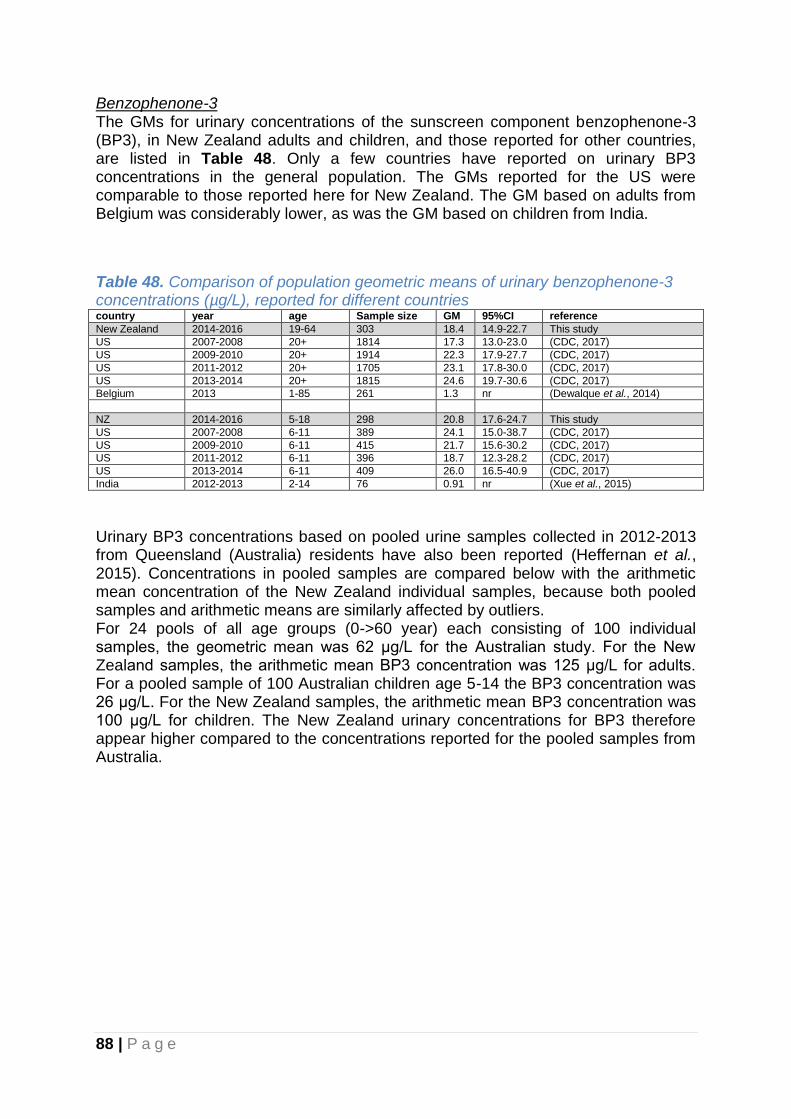
88 | P a g e
Benzophenone-3 The GMs for urinary concentrations of the sunscreen component benzophenone-3 (BP3), in New Zealand adults and children, and those reported for other countries, are listed in Table 48. Only a few countries have reported on urinary BP3 concentrations in the general population. The GMs reported for the US were comparable to those reported here for New Zealand. The GM based on adults from Belgium was considerably lower, as was the GM based on children from India.
Table 48. Comparison of population geometric means of urinary benzophenone-3 concentrations (µg/L), reported for different countries country year age Sample size GM 95%CI reference
New Zealand 2014-2016 19-64 303 18.4 14.9-22.7 This study
US 2007-2008 20+ 1814 17.3 13.0-23.0 (CDC, 2017)
US 2009-2010 20+ 1914 22.3 17.9-27.7 (CDC, 2017)
US 2011-2012 20+ 1705 23.1 17.8-30.0 (CDC, 2017)
US 2013-2014 20+ 1815 24.6 19.7-30.6 (CDC, 2017)
Belgium 2013 1-85 261 1.3 nr (Dewalque et al., 2014)
NZ 2014-2016 5-18 298 20.8 17.6-24.7 This study
US 2007-2008 6-11 389 24.1 15.0-38.7 (CDC, 2017)
US 2009-2010 6-11 415 21.7 15.6-30.2 (CDC, 2017)
US 2011-2012 6-11 396 18.7 12.3-28.2 (CDC, 2017)
US 2013-2014 6-11 409 26.0 16.5-40.9 (CDC, 2017)
India 2012-2013 2-14 76 0.91 nr (Xue et al., 2015)
Urinary BP3 concentrations based on pooled urine samples collected in 2012-2013 from Queensland (Australia) residents have also been reported (Heffernan et al., 2015). Concentrations in pooled samples are compared below with the arithmetic mean concentration of the New Zealand individual samples, because both pooled samples and arithmetic means are similarly affected by outliers. For 24 pools of all age groups (0->60 year) each consisting of 100 individual samples, the geometric mean was 62 μg/L for the Australian study. For the New Zealand samples, the arithmetic mean BP3 concentration was 125 μg/L for adults. For a pooled sample of 100 Australian children age 5-14 the BP3 concentration was 26 μg/L. For the New Zealand samples, the arithmetic mean BP3 concentration was 100 μg/L for children. The New Zealand urinary concentrations for BP3 therefore appear higher compared to the concentrations reported for the pooled samples from Australia.

89 | P a g e
4-tert-octylphenol Urinary concentrations of 4-tert-octylphenol reported for different countries are listed in Table 49. Only the US has reported on 4-tert-octylephenol but levels were below the limit of detection for the majority of samples, as was the case for the New Zealand samples.
Table 49. Comparison of population geometric means of urinary 4-tert-octylphenol concentrations (µg/L), reported for different countries country year age Sample
size GM 95%CI reference
New Zealand 2014-2016 19-64 303 * This study
US 2007-2008 20+ 1814 * (CDC, 2017)
US 2009-2010 20+ 1914 * (CDC, 2017)
New Zealand 2014-2016 5-18 299 * This study
US 2007-2008 6-11 389 * (CDC, 2017)
US 2009-2010 6-11 415 * (CDC, 2017)
*Not calculated: proportion of results below limit of detection was too high to provide a valid result.

90 | P a g e
Parabens The GMs for urinary parabens (methylparaben, propylparaben, ethylparaben, butylparaben), in New Zealand adults and children, and those reported for other countries, are listed in Table 52-55. Methylparaben For methylparaben, the GMs reported for the US are generally two times higher than the GMs reported here for New Zealand, for both adults and children (Table 52). The GM for New Zealand adults is comparable to the GM reported for Canada, Belgium and Greece, while the GM for New Zealand children is higher than those reported for China and India.
Table 52. Comparison of population geometric means of urinary methylparaben concentrations (µg/L), reported for different countries country year age Sample size GM 95%CI reference
New Zealand 2014-2016 19-64 303 17.5 14.5-21.1 This study
US 2007-2008 20+ 1814 63.0 51.8-76.7 (CDC, 2017)
US 2009-2010 20+ 1914 61.0 53.5-69.6 (CDC, 2017)
US 2011-2012 20+ 1705 46.8 41.3-53.1 (CDC, 2017)
US 2013-2014 20+ 1815 52.2 46.0-59.3 (CDC, 2017)
Canada 2014-2015 3-79 2564 17 13-22 (Health Canada, 2017)
China, Shanghai 2010 22-58 26 30.5 nr (Wang et al., 2013)
Belgium 2013 1-85 261 19.0 nr (Dewalque et al., 2014)
Greece 2012 2-87 100 15.2 nr (Asimakopoulos et al., 2014)
New Zealand 2014-2016 5-18 299 11.9 9.6-14.7 This study
US 2007-2008 6-11 389 35.2 25.0-49.6 (CDC, 2017)
US 2009-2010 6-11 415 33.9 27.4-41.9 (CDC, 2017)
US 2011-2012 6-11 396 18.5 15.7-21.9 (CDC, 2017)
US 2013-2014 6-11 409 28.6 21.4-38.1 (CDC, 2017)
Canada 2014-2015 6-11 514 7.6 6.4-9.1 (Health Canada, 2017)
China, Tianjin 2012 9-10 70 5.28 nr (Wang et al., 2013)
India 2012-2013 2-14 76 6.77 nr (Xue et al., 2015)
Urinary methylparaben concentrations based on pooled urine samples collected in 2012-2013 from Queensland (Australia) residents have also been reported (Heffernan et al., 2015). Concentrations in pooled samples are compared below with the arithmetic mean concentration of the New Zealand individual samples, because both pooled samples and arithmetic means are similarly affected by outliers. For 24 pools of all age groups (0->60 year) each consisting of 100 individual samples, the geometric mean was 232 μg/L for the Australian study. For the New Zealand samples, the arithmetic mean methylparaben concentration was 91 μg/L for adults. For four pooled samples of 100 Australian children age 5-14 each, the methylparaben concentrations were 306, 378, 882 and 496 μg/L. For the New Zealand samples, the arithmetic mean methylparaben concentration was 296 μg/L for children. The New Zealand urinary concentrations for methylparaben therefore appear comparable to the concentrations reported for the pooled samples from Australia for children. For adults the Australian levels appear to be higher compared to the New Zealand methylparaben levels.
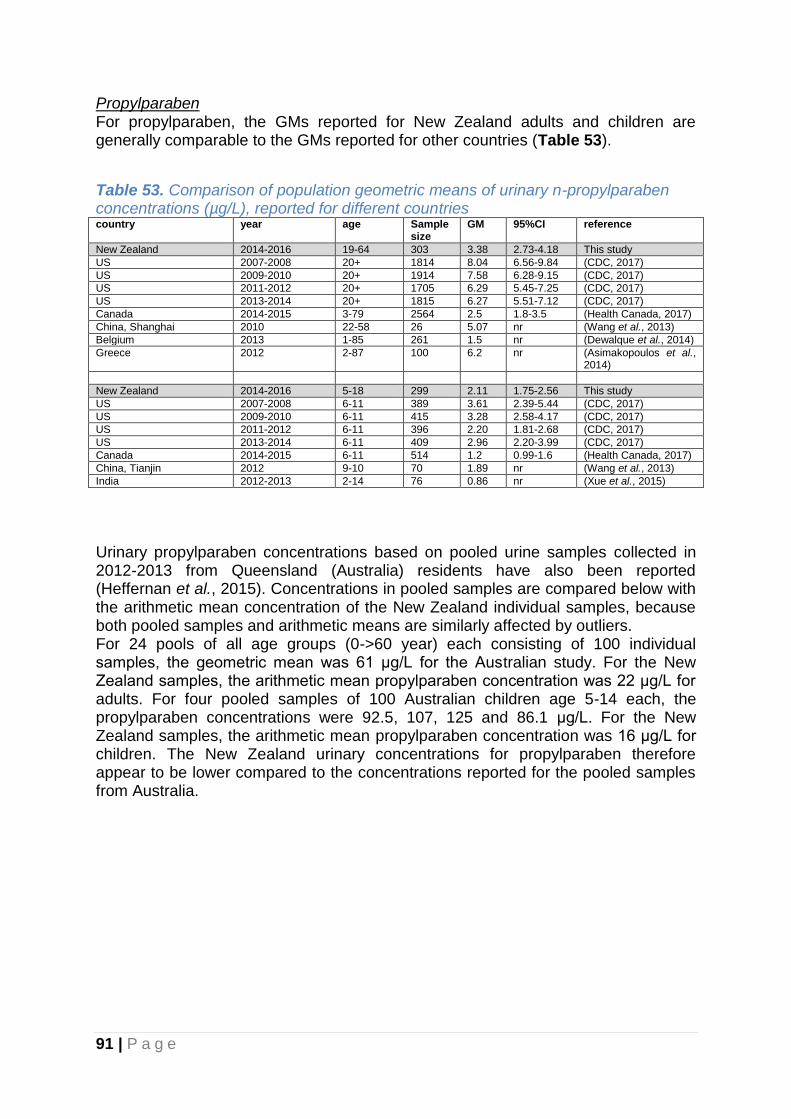
91 | P a g e
Propylparaben For propylparaben, the GMs reported for New Zealand adults and children are generally comparable to the GMs reported for other countries (Table 53).
Table 53. Comparison of population geometric means of urinary n-propylparaben concentrations (µg/L), reported for different countries country year age Sample
size GM 95%CI reference
New Zealand 2014-2016 19-64 303 3.38 2.73-4.18 This study
US 2007-2008 20+ 1814 8.04 6.56-9.84 (CDC, 2017)
US 2009-2010 20+ 1914 7.58 6.28-9.15 (CDC, 2017)
US 2011-2012 20+ 1705 6.29 5.45-7.25 (CDC, 2017)
US 2013-2014 20+ 1815 6.27 5.51-7.12 (CDC, 2017)
Canada 2014-2015 3-79 2564 2.5 1.8-3.5 (Health Canada, 2017)
China, Shanghai 2010 22-58 26 5.07 nr (Wang et al., 2013)
Belgium 2013 1-85 261 1.5 nr (Dewalque et al., 2014)
Greece 2012 2-87 100 6.2 nr (Asimakopoulos et al., 2014)
New Zealand 2014-2016 5-18 299 2.11 1.75-2.56 This study
US 2007-2008 6-11 389 3.61 2.39-5.44 (CDC, 2017)
US 2009-2010 6-11 415 3.28 2.58-4.17 (CDC, 2017)
US 2011-2012 6-11 396 2.20 1.81-2.68 (CDC, 2017)
US 2013-2014 6-11 409 2.96 2.20-3.99 (CDC, 2017)
Canada 2014-2015 6-11 514 1.2 0.99-1.6 (Health Canada, 2017)
China, Tianjin 2012 9-10 70 1.89 nr (Wang et al., 2013)
India 2012-2013 2-14 76 0.86 nr (Xue et al., 2015)
Urinary propylparaben concentrations based on pooled urine samples collected in 2012-2013 from Queensland (Australia) residents have also been reported (Heffernan et al., 2015). Concentrations in pooled samples are compared below with the arithmetic mean concentration of the New Zealand individual samples, because both pooled samples and arithmetic means are similarly affected by outliers. For 24 pools of all age groups (0->60 year) each consisting of 100 individual samples, the geometric mean was 61 μg/L for the Australian study. For the New Zealand samples, the arithmetic mean propylparaben concentration was 22 μg/L for adults. For four pooled samples of 100 Australian children age 5-14 each, the propylparaben concentrations were 92.5, 107, 125 and 86.1 μg/L. For the New Zealand samples, the arithmetic mean propylparaben concentration was 16 μg/L for children. The New Zealand urinary concentrations for propylparaben therefore appear to be lower compared to the concentrations reported for the pooled samples from Australia.

92 | P a g e
Ethylparaben For ethylparaben, the GMs reported for New Zealand adults and children are generally comparable to the GMs reported for other countries that reported detectable levels in a majority of samples (Table 54). For the US study more than half of the samples were below the detection limit of 1 μg/L and a GM was not reported. However, a 95th percentile was reported (85 μg/L adults and 11 μg/L for the year 20013-14). For New Zealand the respective 95th percentiles were 36 μg/L for adults and 15 μg/L for children, comparable to the 95th percentiles reported for the US.
Table 54. Comparison of population geometric means of urinary ethylparaben concentrations (µg/L), reported for different countries country year age Sample size GM 95%CI reference
New Zealand 2014-2016 19-64 303 1.39 1.14-1.69 This study
US 2007-2008 20+ 1814 * (CDC, 2017)
US 2009-2010 20+ 1914 * (CDC, 2017)
US 2011-2012 20+ 1705 * (CDC, 2017)
US 2013-2014 20+ 1815 * (CDC, 2017)
Canada 2014-2015 3-79 2564 * (Health Canada, 2017)
China, Shanghai 2010 22-58 26 0.34 nr (Wang et al., 2013)
Belgium 2013 1-85 261 2.1 nr (Dewalque et al., 2014)
Greece 2012 2-87 100 2.0 nr (Asimakopoulos et al., 2014)
New Zealand 2014-2016 5-18 299 0.68 0.58-0.81 This study
US 2007-2008 6-11 389 * (CDC, 2017)
US 2009-2010 6-11 415 * (CDC, 2017)
US 2011-2012 6-11 396 * (CDC, 2017)
US 2013-2014 6-11 409 * (CDC, 2017)
Canada 2014-2015 6-11 514 * (Health Canada, 2017)
China, Tianjin 2012 9-10 70 0.97 nr (Wang et al., 2013)
India 2012-2013 2-14 76 0.22 nr (Xue et al., 2015)
* Not calculated: proportion of results below limit of detection was too high to provide a valid result.
Urinary ethylparaben concentrations based on pooled urine samples collected in 2012-2013 from Queensland (Australia) residents have also been reported (Heffernan et al., 2015). Concentrations in pooled samples are compared below with the arithmetic mean concentration of the New Zealand individual samples, because both pooled samples and arithmetic means are similarly affected by outliers. For 24 pools of all age groups (0->60 year) each consisting of 100 individual samples, the geometric mean was 33.5 μg/L for the Australian study. For the New Zealand samples, the arithmetic mean ethylparaben concentration was 11 μg/L for adults. For four pooled samples of 100 Australian children age 5-14 each, the ethylparaben concentrations were 24.1, 54.8, 18.9 and 42.3 μg/L. For the New Zealand samples, the arithmetic mean ethylparaben concentration was 9 μg/L for children. The New Zealand urinary concentrations for ethylparaben therefore appear lower compared to the concentrations reported for the pooled samples from Australia.

93 | P a g e
Butylparaben Butylparaben was detected in a third of the New Zealand samples, and geometric means assuming levels of half of the limit of detection in the samples with levels below the limit of detection are therefore not reliable and placed in parentheses in Table 55. For the US samples the proportion of results below the limit of detection was also too high to provide a valid result. The GM reported for Greece however appears to be considerably higher than the GM for adult New Zealanders.
Table 55. Comparison of population geometric means of urinary butylparaben concentrations (µg/L), reported for different countries country year age Sample size GM 95%CI reference
New Zealand 2014-2016 19-64 303 *(0.08) (0.07-0.10) This study
US 2007-2008 20+ 1814 * (CDC, 2017)
US 2009-2010 20+ 1914 * (CDC, 2017)
US 2011-2012 20+ 1705 * (CDC, 2017)
US 2013-2014 20+ 1815 * (CDC, 2017)
Canada 2014-2015 3-79 2564 * (Health Canada, 2017)
China, Shanghai 2010 22-58 26 * (Wang et al., 2013)
Belgium 2013 1-85 261 * (Dewalque et al., 2014)
Greece 2012 2-87 100 1.2 nr (Asimakopoulos et al., 2014)
New Zealand 2014-2016 5-18 299 * (0.08) (0.07-0.09) This study
US 2007-2008 6-11 389 * (CDC, 2017)
US 2009-2010 6-11 415 * (CDC, 2017)
US 2011-2012 6-11 396 * (CDC, 2017)
US 2013-2014 6-11 409 * (CDC, 2017)
Canada 2014-2015 6-11 514 * (Health Canada, 2017)
China, Tianjin 2012 9-10 70 0.04 nr (Wang et al., 2013)
* Not calculated: proportion of results below limit of detection was too high to provide a valid result.
Urinary butylparaben concentrations based on pooled urine samples collected in 2012-2013 from Queensland (Australia) residents have also been reported (Heffernan et al., 2015). Concentrations in pooled samples are compared below with the arithmetic mean concentration of the New Zealand individual samples, because both pooled samples and arithmetic means are similarly affected by outliers. For 24 pools of all age groups (0->60 year) each consisting of 100 individual samples, the geometric mean was 4.3 μg/L for the Australian study. For the New Zealand samples, the arithmetic mean butylparaben concentration was 0.9 μg/L for adults. For four pooled samples of 100 Australian children age 5-14 each, the butylparaben concentrations were 1.9, 3.4, 8.7 and 3 μg/L. For the New Zealand samples, the arithmetic mean butylparaben concentration was 0.8 μg/L for children. The New Zealand urinary concentrations for butylparaben therefore appear to be lower compared to the concentrations reported for the pooled samples from Australia.

94 | P a g e
5.11 International comparison urinary phthalate metabolites The GMs for urinary phthalate metabolite concentrations for New Zealand adults and children, and those reported for other countries, are listed in Tables 54-63. Monomethyl phthalate (mMP) Monomethyl phthalate (mMP) (Table 54) was not detected in the vast majority of the New Zealand samples, similar to what has been reported for the US and Canada. Relatively high urinary mMP concentrations have been reported for Taiwan.
Table 54. Comparison of population geometric means of urinary monomethyl phthalate (mMP) concentrations (µg/L), reported for different countries country year age Sample size GM 95%CI reference
New Zealand 2014-2016 19-64 304 * This study
US 2007-2008 20+ 1814 * (CDC, 2017)
US 2009-2010 20+ 1914 * (CDC, 2017)
US 2011-2012 20+ 1705 * (CDC, 2017)
Canada 2007-2009 6-49 3237 * (Haines et al., 2016)
Canada 2009-2011 3-79 2559 * (Haines et al., 2016)
Taiwan 2013 18-65 290 31.3 nr (Huang et al., 2015)
New Zealand 2014-2016 5-18 299 * This study
US 2007-2008 6-11 389 * (CDC, 2017)
US 2009-2010 6-11 415 2.13 1.83-2.47 (CDC, 2017)
US 2011-2012 6-11 396 2.33 1.78-3.04 (CDC, 2017)
Brazil 2012-2013 6-14 300 7.61 nr (Rocha et al., 2017)
Taiwan 2013 7-18 97 37.5 nr (Huang et al., 2015)
Germany 2007-2009 6-8 104 4.9 3.8-6.3 (Kasper-Sonnenberg et al., 2012)
* Not calculated: proportion of results below limit of detection was too high to provide a valid result.
In pooled urine samples from Queensland Australia, collected in 2012-2013 (Gomez Ramos et al., 2016), the concentrations of mMP (GM for 24 pooled urine samples) of 0->60 year old Australians was 1.7 µg/L and for infants aged 0-5 years the GM urinary concentrations for 4 pools was 2.2 µg/L.
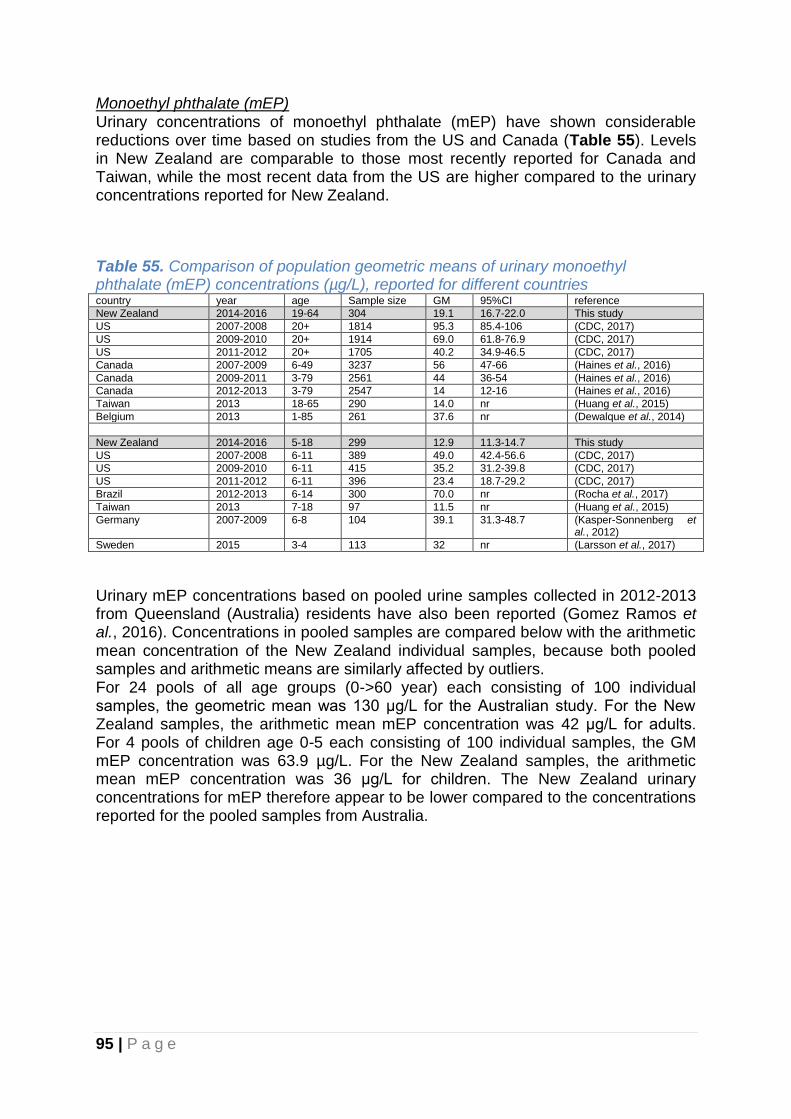
95 | P a g e
Monoethyl phthalate (mEP) Urinary concentrations of monoethyl phthalate (mEP) have shown considerable reductions over time based on studies from the US and Canada (Table 55). Levels in New Zealand are comparable to those most recently reported for Canada and Taiwan, while the most recent data from the US are higher compared to the urinary concentrations reported for New Zealand.
Table 55. Comparison of population geometric means of urinary monoethyl phthalate (mEP) concentrations (µg/L), reported for different countries country year age Sample size GM 95%CI reference
New Zealand 2014-2016 19-64 304 19.1 16.7-22.0 This study
US 2007-2008 20+ 1814 95.3 85.4-106 (CDC, 2017)
US 2009-2010 20+ 1914 69.0 61.8-76.9 (CDC, 2017)
US 2011-2012 20+ 1705 40.2 34.9-46.5 (CDC, 2017)
Canada 2007-2009 6-49 3237 56 47-66 (Haines et al., 2016)
Canada 2009-2011 3-79 2561 44 36-54 (Haines et al., 2016)
Canada 2012-2013 3-79 2547 14 12-16 (Haines et al., 2016)
Taiwan 2013 18-65 290 14.0 nr (Huang et al., 2015)
Belgium 2013 1-85 261 37.6 nr (Dewalque et al., 2014)
New Zealand 2014-2016 5-18 299 12.9 11.3-14.7 This study
US 2007-2008 6-11 389 49.0 42.4-56.6 (CDC, 2017)
US 2009-2010 6-11 415 35.2 31.2-39.8 (CDC, 2017)
US 2011-2012 6-11 396 23.4 18.7-29.2 (CDC, 2017)
Brazil 2012-2013 6-14 300 70.0 nr (Rocha et al., 2017)
Taiwan 2013 7-18 97 11.5 nr (Huang et al., 2015)
Germany 2007-2009 6-8 104 39.1 31.3-48.7 (Kasper-Sonnenberg et al., 2012)
Sweden 2015 3-4 113 32 nr (Larsson et al., 2017)
Urinary mEP concentrations based on pooled urine samples collected in 2012-2013 from Queensland (Australia) residents have also been reported (Gomez Ramos et al., 2016). Concentrations in pooled samples are compared below with the arithmetic mean concentration of the New Zealand individual samples, because both pooled samples and arithmetic means are similarly affected by outliers. For 24 pools of all age groups (0->60 year) each consisting of 100 individual samples, the geometric mean was 130 μg/L for the Australian study. For the New Zealand samples, the arithmetic mean mEP concentration was 42 μg/L for adults. For 4 pools of children age 0-5 each consisting of 100 individual samples, the GM mEP concentration was 63.9 µg/L. For the New Zealand samples, the arithmetic mean mEP concentration was 36 μg/L for children. The New Zealand urinary concentrations for mEP therefore appear to be lower compared to the concentrations reported for the pooled samples from Australia.

96 | P a g e
Monobutyl phthalate (mBP) In this study, concentrations of mono-n-butyl phthalate (mnBP) and mono-iso-butyl phthalate (miBP) were measured together and expressed as the combined value for monobutyl phthalate (mBP). Other countries have reported GMs for mnBP and miBP separately (Table 56), and values reported for these metabolites therefore need to be added to be comparable with mBP. Urinary concentrations of mnBP+miBP have shown considerable reductions over time based on studies from the US. The urinary mBP concentration of the New Zealand samples are higher than those reported for the US, Canada, Brazil and Taiwan.
Table 56. Comparison of population geometric means of urinary monobutyl phthalate (mBP) (mono-n-butyl phthalate (mnBP)+ mono-iso-butyl phthalate (miBP)) concentrations (µg/L), reported for different countries Country year age Sample
size GM 95%CI reference
New Zealand (mBP) 2014-2016 19-64 304 37.0 33.4-40.9 This study
US (mnBP) 2007-2008 20+ 1814 17.2 15.6-19.1 (CDC, 2017) (miBP) 6.47 5.91-7.09
US (mnBP) 2009-2010 20+ 1914 13.5 12.0-15.1 (CDC, 2017) (miBP) 7.03 6.26-7.90
US (mnBP) 2011-2012 20+ 1705 7.04 6.04-8.21 (CDC, 2017) (miBP) 5.57 4.92-6.31
Canada (mnBP) 2007-2009 6-79 3237 23 21-25 (Haines et al., 2016)
Canada (mnBP) 2009-2011 3-79 2555 20 18-22 (Haines et al., 2016)
Taiwan (mnBP) 2013 18-65 290 12.8 nr (Huang et al., 2015) (miBP) 4.4
Belgium (mnBP) 2013 1-85 261 31.3 nr (Dewalque et al., 2014) (miBP) 26.2
New Zealand (mBP) 2014-2016 5-18 299 60.6 55.8-65.7 This study
US (mnBP) 2007-2008 6-11 389 26.9 22.5-32.1 (CDC, 2017) (miBP) 10.7 8.94-12.8
US (mnBP) 2009-2010 6-11 415 21.7 19.0-24.8 (CDC, 2017) (miBP) 10.2 9.10-11.4
US (mnBP) 2011-2012 6-11 396 11.1 8.73-14.2 (CDC, 2017) (miBP) 8.28 6.93-9.91
Brazil (mBP) 2012-2013 6-14 300 31.4 nr (Rocha et al., 2017)
Taiwan (mnBP) 2013 7-18 97 17.6 nr (Huang et al., 2015) (miBP) 7.2
Korea (mBP) 2012 6-19 342 31.19 29.37-33.45 (Ha et al., 2014)
Germany (mnBP) 2007-2009 6-8 104 48.1 40.5-57.1 (Kasper-Sonnenberg et al., 2012) (miBP) 66.2 55.0-80.0
Sweden (mnBP) 2015 3-4 113 55 nr (Larsson et al., 2017)
Urinary mnBP and miBP concentrations based on pooled urine samples collected in 2012-2013 from Queensland (Australia) residents have also been reported (Gomez Ramos et al., 2016). Concentrations in pooled samples are compared below with the arithmetic mean concentration of the New Zealand individual samples, because both pooled samples and arithmetic means are similarly affected by outliers. For 24 pools of all age groups (0->60 year) each consisting of 100 individual samples, the geometric mean was 24.7 μg/L for MnBP and 21.0 μg/L for MiBP for the Australian study. For the New Zealand samples, the arithmetic mean mBP concentration was 60.5 μg/L for adults. For 4 pools of children age 0-5 each consisting of 100 individual samples, the GM was 29.7 μg/L for MnBP and 26.4 μg/L for MiBP. For the New Zealand samples, the arithmetic mean mBP concentration was 78.3 μg/L for children. The New Zealand urinary concentrations for mBP therefore appear to be comparable to the concentrations reported for the pooled samples from Australia.
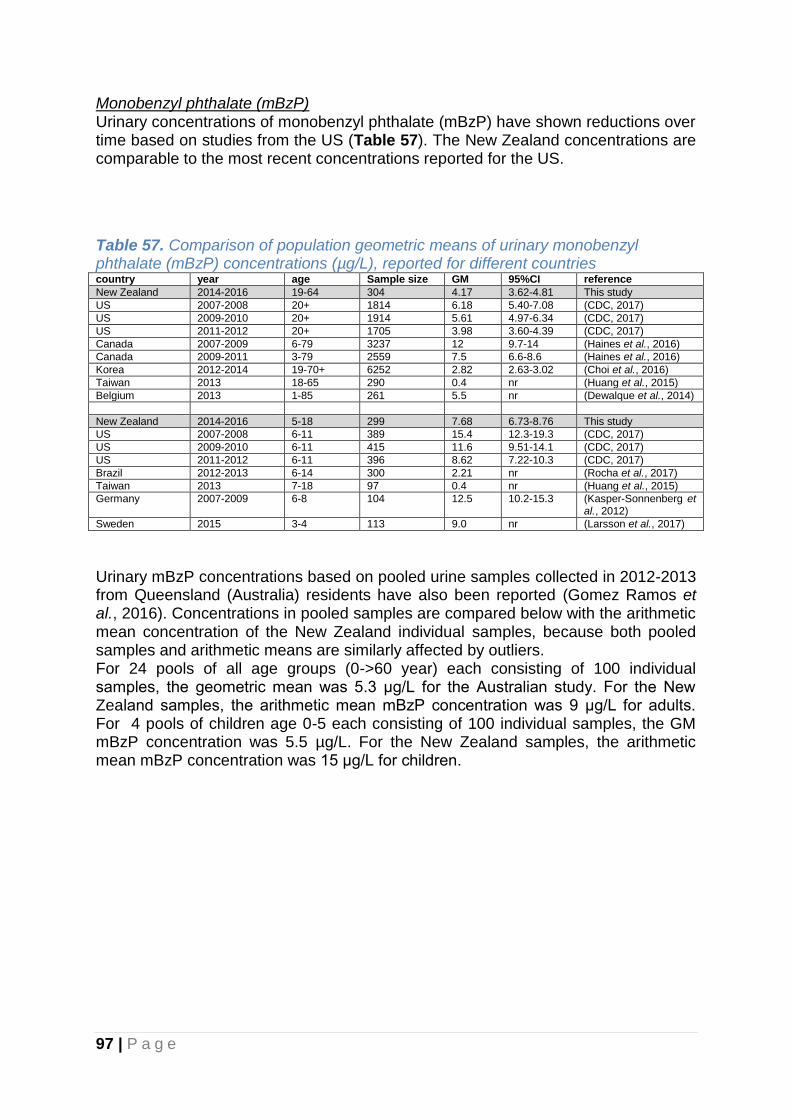
97 | P a g e
Monobenzyl phthalate (mBzP) Urinary concentrations of monobenzyl phthalate (mBzP) have shown reductions over time based on studies from the US (Table 57). The New Zealand concentrations are comparable to the most recent concentrations reported for the US.
Table 57. Comparison of population geometric means of urinary monobenzyl phthalate (mBzP) concentrations (µg/L), reported for different countries country year age Sample size GM 95%CI reference
New Zealand 2014-2016 19-64 304 4.17 3.62-4.81 This study
US 2007-2008 20+ 1814 6.18 5.40-7.08 (CDC, 2017)
US 2009-2010 20+ 1914 5.61 4.97-6.34 (CDC, 2017)
US 2011-2012 20+ 1705 3.98 3.60-4.39 (CDC, 2017)
Canada 2007-2009 6-79 3237 12 9.7-14 (Haines et al., 2016)
Canada 2009-2011 3-79 2559 7.5 6.6-8.6 (Haines et al., 2016)
Korea 2012-2014 19-70+ 6252 2.82 2.63-3.02 (Choi et al., 2016)
Taiwan 2013 18-65 290 0.4 nr (Huang et al., 2015)
Belgium 2013 1-85 261 5.5 nr (Dewalque et al., 2014)
New Zealand 2014-2016 5-18 299 7.68 6.73-8.76 This study
US 2007-2008 6-11 389 15.4 12.3-19.3 (CDC, 2017)
US 2009-2010 6-11 415 11.6 9.51-14.1 (CDC, 2017)
US 2011-2012 6-11 396 8.62 7.22-10.3 (CDC, 2017)
Brazil 2012-2013 6-14 300 2.21 nr (Rocha et al., 2017)
Taiwan 2013 7-18 97 0.4 nr (Huang et al., 2015)
Germany 2007-2009 6-8 104 12.5 10.2-15.3 (Kasper-Sonnenberg et al., 2012)
Sweden 2015 3-4 113 9.0 nr (Larsson et al., 2017)
Urinary mBzP concentrations based on pooled urine samples collected in 2012-2013 from Queensland (Australia) residents have also been reported (Gomez Ramos et al., 2016). Concentrations in pooled samples are compared below with the arithmetic mean concentration of the New Zealand individual samples, because both pooled samples and arithmetic means are similarly affected by outliers. For 24 pools of all age groups (0->60 year) each consisting of 100 individual samples, the geometric mean was 5.3 μg/L for the Australian study. For the New Zealand samples, the arithmetic mean mBzP concentration was 9 μg/L for adults. For 4 pools of children age 0-5 each consisting of 100 individual samples, the GM mBzP concentration was 5.5 µg/L. For the New Zealand samples, the arithmetic mean mBzP concentration was 15 μg/L for children.

98 | P a g e
Mono-2-ethylhexyl phthalate (mEHP) Urinary concentrations of mono-2-ethylhexyl phthalate (mEHP) have shown reductions over time based on studies from the US and Canada (Table 58). The New Zealand concentrations in adults are comparable to the most recent concentrations reported for the US and Canada, while for New Zealand children the concentrations are higher than those reported for the US since 2007.
Table 58. Comparison of population geometric means of urinary mono-2-ethylhexyl phthalate (mEHP) concentrations (µg/L), reported for different countries country year age Sample size GM 95%CI reference
New Zealand 2014-2016 19-64 304 1.99 1.77-2.23 This study
US 2007-2008 20+ 401 2.99 2.39-3.75 (CDC, 2017)
US 2009-2010 20+ 420 1.82 1.52-2.16 (CDC, 2017)
US 2011-2012 20+ 1705 1.33 1.19-1.48 (CDC, 2017)
Canada 2007-2009 6-49 3237 3.6 3.2-4.0 (Haines et al., 2016)
Canada 2009-2011 3-79 2498 1.9 1.7-2.1 (Haines et al., 2016)
Taiwan 2013 18-65 290 4.4 nr (Huang et al., 2015)
Belgium 2013 1-85 261 2.7 nr (Dewalque et al., 2014)
New Zealand 2014-2016 5-18 299 2.72 2.47-3.00 This study
US 2007-2008 6-11 389 2.39 2.05-2.80 (CDC, 2017)
US 2009-2010 6-11 415 1.64 1.45-1.85 (CDC, 2017)
US 2011-2012 6-11 396 1.41 1.23-1.61 (CDC, 2017)
Brazil 2012-2013 6-14 300 17.2 nr (Rocha et al., 2017)
Taiwan 2013 7-18 97 4.0 nr (Huang et al., 2015)
Germany 2007-2009 6-8 104 3.9 3.3-4.7 (Kasper-Sonnenberg et al., 2012)
Sweden 2015 3-4 113 1.5 nr (Larsson et al., 2017)
Urinary mEHP concentrations based on pooled urine samples collected in 2012-2013 from Queensland (Australia) residents have also been reported (Gomez Ramos et al., 2016). Concentrations in pooled samples are compared below with the arithmetic mean concentration of the New Zealand individual samples, because both pooled samples and arithmetic means are similarly affected by outliers. For 24 pools of all age groups (0->60 year) each consisting of 100 individual samples, the geometric mean was 6.0 μg/L for the Australian study. For the New Zealand samples, the arithmetic mean mEHP concentration was 3.4 μg/L for adults. For 4 pools of children age 0-5 each consisting of 100 individual samples, the GM mEHP concentration was 4.2 µg/L. For the New Zealand samples, the arithmetic mean mEHP concentration was 3.8 μg/L for children. The New Zealand urinary concentrations for mEHP therefore appear to be comparable to the concentrations reported for the pooled samples from Australia.

99 | P a g e
Mono-(2-ethyl-5-oxohexyl) phthalate (mEOHP) Urinary concentrations of mono-(2-ethyl-5-oxohexyl) phthalate (mEOHP) have shown reductions over time based on studies from the US and Canada (Table 59). The New Zealand concentrations in adults are comparable to the most recent concentrations reported for the US and Canada, while for New Zealand children the concentrations are higher than those reported for the US since 2009.
Table 59. Comparison of population geometric means of urinary mono-(2-ethyl-5-oxohexyl) phthalate (mEOHP) concentrations (µg/L), reported for different countries country year age Sample size GM 95%CI reference
New Zealand 2014-2016 19-64 304 7.0 6.4-7.7 This study
US 2007-2008 20+ 1814 11.1 9.48-13.1 (CDC, 2017)
US 2009-2010 20+ 1914 7.59 6.64-8.68 (CDC, 2017)
US 2011-2012 20+ 1705 4.83 4.45-5.23 (CDC, 2017)
Canada 2007-2009 6-49 3237 14 13-16 (Haines et al., 2016)
Canada 2009-2011 3-79 2561 7.4 6.9-8.0 (Haines et al., 2016)
Korea 2012-2014 19-70+ 6392 12.1 11.6-12.6 (Choi et al., 2016)
Taiwan 2013 18-65 290 10.7 nr (Huang et al., 2015)
Belgium 2013 1-85 261 8.6 nr (Dewalque et al., 2014)
New Zealand 2014-2016 5-18 299 14.2 13.1-15.4 This study
US 2007-2008 6-11 389 16.9 13.9-20.6 (CDC, 2017)
US 2009-2010 6-11 415 9.78 8.72-11.0 (CDC, 2017)
US 2011-2012 6-11 396 6.96 5.86-8.28 (CDC, 2017)
Brazil 2012-2013 6-14 300 12.7 nr (Rocha et al., 2017)
Taiwan 2013 7-18 97 16.9 nr (Huang et al., 2015)
Korea 2012 6-19 342 13.46 12.55-14.44 (Ha et al., 2014)
Germany 2007-2009 6-8 104 26.2 22.7-30.3 (Kasper-Sonnenberg et al., 2012)
Sweden 2015 3-4 113 11 nr (Larsson et al., 2017)
Urinary mEOHP concentrations based on pooled urine samples collected in 2012-2013 from Queensland (Australia) residents have also been reported (Gomez Ramos et al., 2016). Concentrations in pooled samples are compared below with the arithmetic mean concentration of the New Zealand individual samples, because both pooled samples and arithmetic means are similarly affected by outliers. For 24 pools of all age groups (0->60 year) each consisting of 100 individual samples, the geometric mean was 16.1 μg/L for the Australian study. For the New Zealand samples, the arithmetic mean mEOHP concentration was 9.9 μg/L for adults. For 4 pools of children age 0-5 each consisting of 100 individual samples, the GM mEOHP concentration was 17.2 µg/L. For the New Zealand samples, the arithmetic mean mEOHP concentration was 18.5 μg/L for children. The New Zealand urinary concentrations for mEOHP therefore appear to be comparable to the concentrations reported for the pooled samples from Australia.

100 | P a g e
Mono-(2-ethyl-5-hydroxyhexyl) phthalate (mEHHP) Urinary concentrations of mono-(2-ethyl-5-hydroxyhexyl) phthalate (mEHHP) have shown reductions over time based on studies from the US and Canada (Table 60). The New Zealand concentrations in adults are comparable to the concentrations reported for the US and Canada.
Table 60. Comparison of population geometric means of urinary mono-(2-ethyl-5-hydroxyhexyl) phthalate (mEHHP) concentrations (µg/L), reported for different countries country year age Sample size GM 95%CI reference
New Zealand 2014-2016 19-64 304 9.0 8.0-10.1 This study
US 2007-2008 20+ 1814 20.5 17.4-24.1 (CDC, 2017)
US 2009-2010 20+ 1914 12.4 10.7-14.3 (CDC, 2017)
US 2011-2012 20+ 1705 7.58 7.03-8.16 (CDC, 2017)
Canada 2007-2009 6-49 3237 23 21-26 (Haines et al., 2016)
Canada 2009-2011 3-79 2561 13 12-14 (Haines et al., 2016)
Korea 2012-2014 19-70+ 6406 17.5 16.7-18.2 (Choi et al., 2016)
Taiwan 2013 18-65 290 20.2 nr (Huang et al., 2015)
New Zealand 2014-2016 5-18 299 17.6 15.9-19.4 This study
US 2007-2008 6-11 389 28.6 23.4-34.8 (CDC, 2017)
US 2009-2010 6-11 415 15.0 13.2-17.1 (CDC, 2017)
US 2011-2012 6-11 396 10.5 8.82-12.4 (CDC, 2017)
Brazil 2012-2013 6-14 300 18.5 nr (Rocha et al., 2017)
Taiwan 2013 7-18 97 21.9 nr (Huang et al., 2015)
Korea 2012 6-19 342 17.12 15.96-18.17 (Ha et al., 2014)
Germany 2007-2009 6-8 104 29.3 25.2-34.0 (Kasper-Sonnenberg et al., 2012)
Sweden 2015 3-4 113 17 nr (Larsson et al., 2017)
Urinary mEHHP concentrations based on pooled urine samples collected in 2012-2013 from Queensland (Australia) residents have also been reported (Gomez Ramos et al., 2016). Concentrations in pooled samples are compared below with the arithmetic mean concentration of the New Zealand individual samples, because both pooled samples and arithmetic means are similarly affected by outliers. For 24 pools of all age groups (0->60 year) each consisting of 100 individual samples, the geometric mean was 26.4 μg/L for the Australian study. For the New Zealand samples, the arithmetic mean mEHHP concentration was 14.1 μg/L for adults. For 4 pools of children age 0-5 each consisting of 100 individual samples, the GM mEHHP concentration was 24.3 µg/L. For the New Zealand samples, the arithmetic mean mEHHP concentration was 24.7 μg/L for children. The New Zealand urinary concentrations for mEHHP therefore appear to be comparable to the concentrations reported for the pooled samples from Australia.
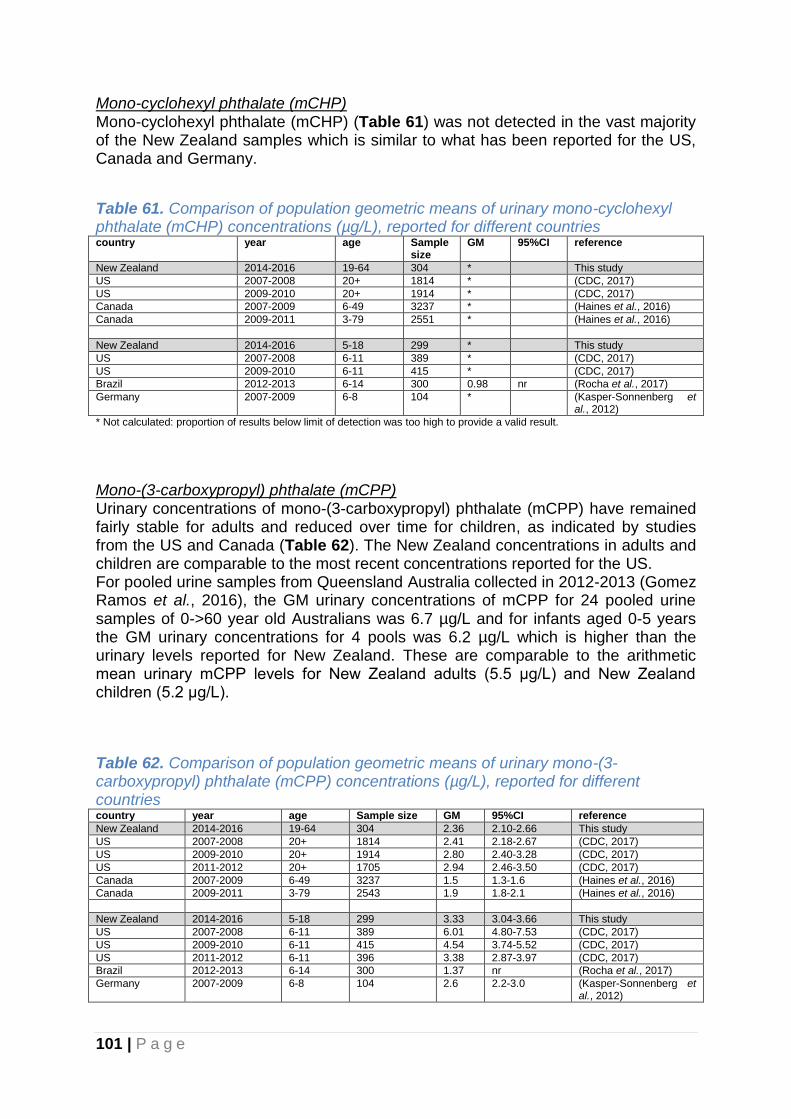
101 | P a g e
Mono-cyclohexyl phthalate (mCHP) Mono-cyclohexyl phthalate (mCHP) (Table 61) was not detected in the vast majority of the New Zealand samples which is similar to what has been reported for the US, Canada and Germany.
Table 61. Comparison of population geometric means of urinary mono-cyclohexyl phthalate (mCHP) concentrations (µg/L), reported for different countries country year age Sample
size GM 95%CI reference
New Zealand 2014-2016 19-64 304 * This study
US 2007-2008 20+ 1814 * (CDC, 2017)
US 2009-2010 20+ 1914 * (CDC, 2017)
Canada 2007-2009 6-49 3237 * (Haines et al., 2016)
Canada 2009-2011 3-79 2551 * (Haines et al., 2016)
New Zealand 2014-2016 5-18 299 * This study
US 2007-2008 6-11 389 * (CDC, 2017)
US 2009-2010 6-11 415 * (CDC, 2017)
Brazil 2012-2013 6-14 300 0.98 nr (Rocha et al., 2017)
Germany 2007-2009 6-8 104 * (Kasper-Sonnenberg et al., 2012)
* Not calculated: proportion of results below limit of detection was too high to provide a valid result.
Mono-(3-carboxypropyl) phthalate (mCPP) Urinary concentrations of mono-(3-carboxypropyl) phthalate (mCPP) have remained fairly stable for adults and reduced over time for children, as indicated by studies from the US and Canada (Table 62). The New Zealand concentrations in adults and children are comparable to the most recent concentrations reported for the US. For pooled urine samples from Queensland Australia collected in 2012-2013 (Gomez Ramos et al., 2016), the GM urinary concentrations of mCPP for 24 pooled urine samples of 0->60 year old Australians was 6.7 µg/L and for infants aged 0-5 years the GM urinary concentrations for 4 pools was 6.2 µg/L which is higher than the urinary levels reported for New Zealand. These are comparable to the arithmetic mean urinary mCPP levels for New Zealand adults (5.5 μg/L) and New Zealand children (5.2 μg/L).
Table 62. Comparison of population geometric means of urinary mono-(3-carboxypropyl) phthalate (mCPP) concentrations (µg/L), reported for different countries country year age Sample size GM 95%CI reference
New Zealand 2014-2016 19-64 304 2.36 2.10-2.66 This study
US 2007-2008 20+ 1814 2.41 2.18-2.67 (CDC, 2017)
US 2009-2010 20+ 1914 2.80 2.40-3.28 (CDC, 2017)
US 2011-2012 20+ 1705 2.94 2.46-3.50 (CDC, 2017)
Canada 2007-2009 6-49 3237 1.5 1.3-1.6 (Haines et al., 2016)
Canada 2009-2011 3-79 2543 1.9 1.8-2.1 (Haines et al., 2016)
New Zealand 2014-2016 5-18 299 3.33 3.04-3.66 This study
US 2007-2008 6-11 389 6.01 4.80-7.53 (CDC, 2017)
US 2009-2010 6-11 415 4.54 3.74-5.52 (CDC, 2017)
US 2011-2012 6-11 396 3.38 2.87-3.97 (CDC, 2017)
Brazil 2012-2013 6-14 300 1.37 nr (Rocha et al., 2017)
Germany 2007-2009 6-8 104 2.6 2.2-3.0 (Kasper-Sonnenberg et al., 2012)

102 | P a g e
Mono-iso-nonyl Phthalate (miNP) Mono-iso-nonyl Phthalate (miNP) (Table 63) was not detected in the majority of the New Zealand samples, which is similar to what has been reported for other countries.
Table 63. Comparison of population geometric means of urinary mono-iso-nonyl Phthalate (miNP) concentrations (µg/L), reported for different countries country year age Sample size GM 95%CI reference
New Zealand 2014-2016 19-64 304 * This study
US 2007-2008 20+ 1814 * (CDC, 2017)
US 2009-2010 20+ 1914 * (CDC, 2017)
US 2011-2012 20+ 1705 * (CDC, 2017)
Canada 2007-2009 6-49 3236 * (Haines et al., 2016)
Canada 2009-2011 3-79 2556 * (Haines et al., 2016)
Taiwan 2013 18-65 290 * (Huang et al., 2015)
New Zealand 2014-2016 5-18 299 * This study
US 2007-2008 6-11 389 * (CDC, 2017)
US 2009-2010 6-11 415 * (CDC, 2017)
US 2011-2012 6-11 396 * (CDC, 2017)
Brazil 2012-2013 6-14 300 * (Rocha et al., 2017)
Taiwan 2013 7-18 97 * (Huang et al., 2015)
* Not calculated: proportion of results below limit of detection was too high to provide a valid result.
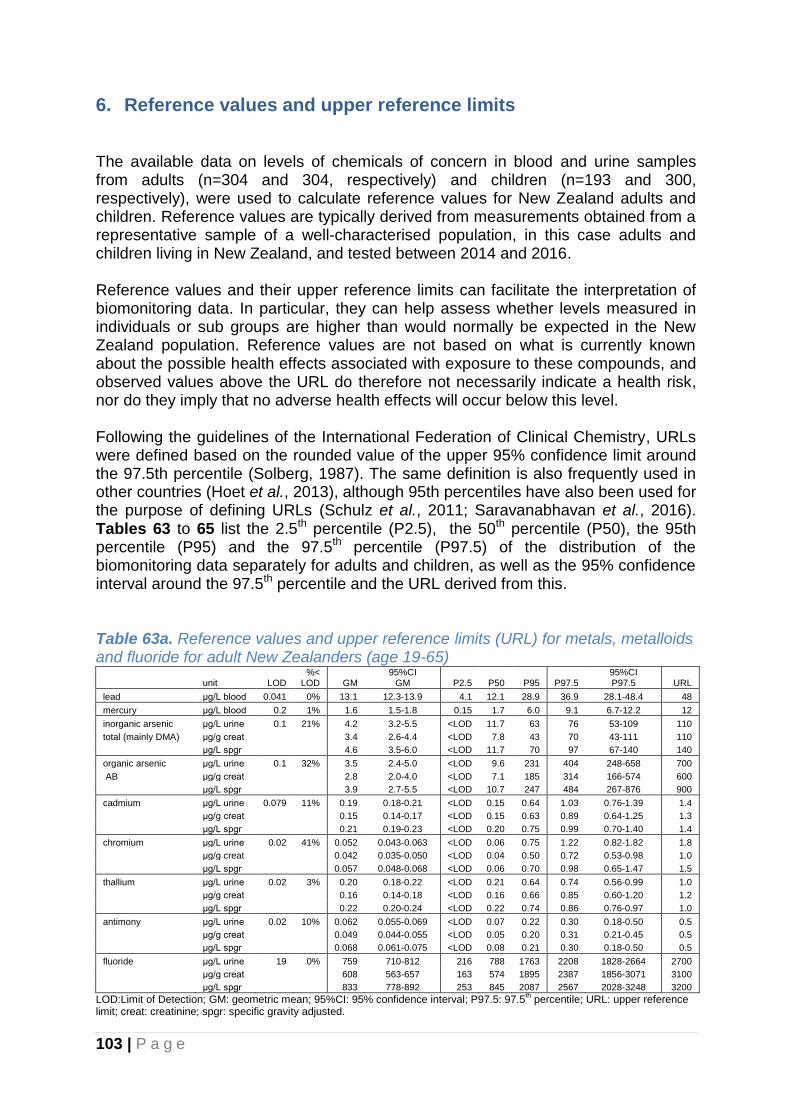
103 | P a g e
6. Reference values and upper reference limits The available data on levels of chemicals of concern in blood and urine samples from adults (n=304 and 304, respectively) and children (n=193 and 300, respectively), were used to calculate reference values for New Zealand adults and children. Reference values are typically derived from measurements obtained from a representative sample of a well-characterised population, in this case adults and children living in New Zealand, and tested between 2014 and 2016. Reference values and their upper reference limits can facilitate the interpretation of biomonitoring data. In particular, they can help assess whether levels measured in individuals or sub groups are higher than would normally be expected in the New Zealand population. Reference values are not based on what is currently known about the possible health effects associated with exposure to these compounds, and observed values above the URL do therefore not necessarily indicate a health risk, nor do they imply that no adverse health effects will occur below this level. Following the guidelines of the International Federation of Clinical Chemistry, URLs were defined based on the rounded value of the upper 95% confidence limit around the 97.5th percentile (Solberg, 1987). The same definition is also frequently used in other countries (Hoet et al., 2013), although 95th percentiles have also been used for the purpose of defining URLs (Schulz et al., 2011; Saravanabhavan et al., 2016). Tables 63 to 65 list the 2.5th percentile (P2.5), the 50th percentile (P50), the 95th percentile (P95) and the 97.5th percentile (P97.5) of the distribution of the biomonitoring data separately for adults and children, as well as the 95% confidence interval around the 97.5th percentile and the URL derived from this. Table 63a. Reference values and upper reference limits (URL) for metals, metalloids and fluoride for adult New Zealanders (age 19-65)
unit LOD %<
LOD GM 95%CI
GM P2.5 P50 P95 P97.5 95%CI P97.5 URL
lead μg/L blood 0.041 0% 13.1 12.3-13.9 4.1 12.1 28.9 36.9 28.1-48.4 48
mercury μg/L blood 0.2 1% 1.6 1.5-1.8 0.15 1.7 6.0 9.1 6.7-12.2 12
inorganic arsenic μg/L urine 0.1 21% 4.2 3.2-5.5 <LOD 11.7 63 76 53-109 110
total (mainly DMA) μg/g creat
3.4 2.6-4.4 <LOD 7.8 43 70 43-111 110
μg/L spgr
4.6 3.5-6.0 <LOD 11.7 70 97 67-140 140
organic arsenic μg/L urine 0.1 32% 3.5 2.4-5.0 <LOD 9.6 231 404 248-658 700
AB μg/g creat
2.8 2.0-4.0 <LOD 7.1 185 314 166-574 600
μg/L spgr
3.9 2.7-5.5 <LOD 10.7 247 484 267-876 900
cadmium μg/L urine 0.079 11% 0.19 0.18-0.21 <LOD 0.15 0.64 1.03 0.76-1.39 1.4
μg/g creat
0.15 0.14-0.17 <LOD 0.15 0.63 0.89 0.64-1.25 1.3
μg/L spgr
0.21 0.19-0.23 <LOD 0.20 0.75 0.99 0.70-1.40 1.4
chromium μg/L urine 0.02 41% 0.052 0.043-0.063 <LOD 0.06 0.75 1.22 0.82-1.82 1.8
μg/g creat
0.042 0.035-0.050 <LOD 0.04 0.50 0.72 0.53-0.98 1.0
μg/L spgr
0.057 0.048-0.068 <LOD 0.06 0.70 0.98 0.65-1.47 1.5
thallium μg/L urine 0.02 3% 0.20 0.18-0.22 <LOD 0.21 0.64 0.74 0.56-0.99 1.0
μg/g creat
0.16 0.14-0.18 <LOD 0.16 0.66 0.85 0.60-1.20 1.2
μg/L spgr
0.22 0.20-0.24 <LOD 0.22 0.74 0.86 0.76-0.97 1.0
antimony μg/L urine 0.02 10% 0.062 0.055-0.069 <LOD 0.07 0.22 0.30 0.18-0.50 0.5
μg/g creat
0.049 0.044-0.055 <LOD 0.05 0.20 0.31 0.21-0.45 0.5
μg/L spgr
0.068 0.061-0.075 <LOD 0.08 0.21 0.30 0.18-0.50 0.5
fluoride μg/L urine 19 0% 759 710-812 216 788 1763 2208 1828-2664 2700
μg/g creat
608 563-657 163 574 1895 2387 1856-3071 3100
μg/L spgr 833 778-892 253 845 2087 2567 2028-3248 3200
LOD:Limit of Detection; GM: geometric mean; 95%CI: 95% confidence interval; P97.5: 97.5th percentile; URL: upper reference
limit; creat: creatinine; spgr: specific gravity adjusted.

104 | P a g e
Table 63b. Reference values and upper reference limits (URL) for metals, metalloids and fluoride for New Zealand children (age 5-18)
unit LOD %<
LOD GM 95%CI
GM P2.5 P50 P95 P97.5 95%CI P97.5 URL
lead μg/L blood 0.04 0% 8.5 7.9-9.1 2.1 7.6 16.1 19.9 15.9-24.8 25
mercury μg/L blood 0.2 7% 0.9 0.7-1.0 <LOD 0.8 4.1 5.1 3.7-7.1 7
inorganic arsenic μg/L urine 0.1 26% 3.2 2.3-4.3 <LOD 10.1 70 88 53-147 150
total (mainly DMA) μg/g creat
3.2 2.3-4.3 <LOD 9.4 74 98 74-131 130
μg/L spgr
2.9 2.2-4.0 <LOD 9.4 65 98 67-142 140
organic arsenic - AB μg/L urine 0.1 47% 1.5 1.0-2.2 <LOD 1.6 247 619 239-1582 1600
μg/g creat
1.5 1.0-2.2 <LOD 1.4 419 687 310-1515 1500
μg/L spgr
1.4 0.9-2.1 <LOD 1.5 245 547 217-1381 1400
cadmium μg/L urine 0.079 47% 0.074 0.069-0.079 <LOD 0.04 0.17 0.21 0.17-0.24 0.2
μg/g creat
0.074 0.068-0.079 <LOD 0.08 0.21 0.23 0.20-0.28 0.3
μg/L spgr
0.069 0.064-0.074 <LOD 0.08 0.18 0.20 0.16-0.24 0.2
chromium μg/L urine 0.02 56% 0.034 0.028-0.040 <LOD <LOD 0.48 0.90 0.46-1.77 1.8
μg/g creat
0.034 0.028-0.040 <LOD <LOD 0.50 0.78 0.48-1.26 1.3
μg/L spgr
0.031 0.026-0.037 <LOD <LOD 0.44 0.68 0.40-1.14 1.1
thallium μg/L urine 0.02 21% 0.054 0.048-0.062 <LOD 0.05 0.34 0.40 0.34-0.47 0.5
μg/g creat
0.054 0.047-0.062 <LOD 0.06 0.37 0.58 0.39-0.87 0.9
μg/L spgr
0.051 0.044-0.058 <LOD 0.06 0.32 0.44 0.35-0.56 0.6
antimony μg/L urine 0.02 1% 0.091 0.085-0.098 0.01 0.09 0.25 0.31 0.26-0.37 0.4
μg/g creat
0.091 0.084-0.098 0.02 0.09 0.23 0.32 0.22-0.46 0.5
μg/L spgr
0.085 0.079-0.091 0.02 0.08 0.22 0.23 0.18-0.29 0.3
fluoride μg/L urine 19 0% 628 586-674 176 644 1595 1855 1507-2282 2300
μg/g creat
626 577-678 135 634 1932 2096 1875-2344 2300
μg/L spgr 584 546-624 189 593 1512 1781 1514-2094 2100
LOD:Limit of Detection; GM: geometric mean; 95%CI: 95% confidence interval; P97.5: 97.5th percentile; URL: upper reference
limit; creat: creatinine; spgr: specific gravity adjusted.
Tables 63a and 63b provide the suggested upper reference limits for metals, metalloids and fluoride for New Zealand adults and children, respectively. For blood lead the URL is 48 μg/L for adults and 25 μg/L for children, both below New Zealand’s current blood lead notification level of 100 μg/L (10 μg/dL; 0.48 μmol/L). Health Agencies for Europe and the USA have set blood lead levels of concern since the 1960s (Taylor et al., 2014). The United States’ Centers for Disease Control and Prevention (CDC) have used a “blood lead level of concern” of 100 μg/L (10 μg/dL) since 1991 until 2012. In 2012 this term of “blood lead level of concern” was removed as CDC declared there is no safe level of lead in children’s blood (Taylor et al., 2014). Instead, an intervention (reference) level of 50 μg/L (5 μg/dL) for individual children was established (CDC, 2012). In Australia the current recommended public health goal for blood lead is 100 μg/L (10 μg/dL) (Taylor et al., 2014) (since 1993), but recently changes have been recommended including a new blood lead intervention level of no more than 50 μg/L (5 ug/dL), with a national goal for all children under 5 year of age to have a blood lead level of below 10 μg/L (1 ug/dL) by 2020(Taylor et al., 2014). In 2009, The German Human Biomonitoring Commission (HBC) concluded that establishing an effect threshold for blood lead levels would be arbitrary and therefore not justified, as several findings consistently had shown no threshold levels (Schulz et al., 2011). In 2011, the HBC reported a reference value (based on the 95th population percentile) for blood lead of 35 μg/L (3.5 ug/dL) for children (aged 3-14 years), 70 μg/L for adult women and 90 μg/L for adult men (Schulz et al., 2011).

105 | P a g e
For blood mercury the suggested upper reference limit was 12 μg/L for adults and 7 μg/L for children. While currently there is no blood mercury notification level in New Zealand, levels above 10 μg/L are considered by the analytical laboratory used to analyse the samples in this study as requiring repeat testing after exclusion of fish from the diet. For levels >20 μg/L it is recommend that possible environmental exposure should be reviewed. The U.S. EPA reference blood mercury level is 5.8 μg/L (Schober et al., 2003). In some states of the US ‘reportable levels’ and ‘investigation levels’ are used. For example, for blood mercury New York State uses a ‘reportable level’ of 5 μg/L and an ‘investigation level’ of ≥15 μg/L (McKelvey et al., 2007). The current Health Canada blood mercury guidance value is 20 μg/L for the general adult population and a provisional guidance value of 8 μg/L for children (Lye et al., 2013). In 2011, The German Human Biomonitoring Commission (HBC) reported a reference value (based on the 95th population percentile) for blood mercury of 0.8 μg/L for children (aged 3-14 years) who ate fish 3 times per month or less, and 2.0 μg/L for adults who ate fish 3 times per month or less (Schulz et al., 2011). The German Human Biomonitoring Commission’s health-related human biomonitoring (HBM) values are 5 μg/L (HBM I) and 15 μg/L (HBM II) (Schulz et al., 2011). The HBM I value represents the concentration of a substance in human biological material below which – according to the knowledge and judgement of the commission and with regard to the substance under consideration – there is no risk for adverse health effects and, consequently, no need for action. The HBM II value represents the concentration of a substance in human biological material above which – according to the knowledge and judgement of the commission and with regard to the substance under consideration – there is an increased risk for adverse health effects and, consequently, an urgent need to reduce exposure and to provide individual biomedical care (advice). While for urinary organic and inorganic arsenic the GMs were lower for children compared to adults, the suggested upper reference limit was higher for children due to outliers as expressed by the higher 97.5th percentile and wider confidence interval for children, particularly for organic arsenic. For inorganic arsenic (predominantly DMA), the URL for adults was 110 μg/L and 150 μg/L for children. There is no urinary arsenic notification level for inorganic arsenic in New Zealand, but the analytical laboratory uses an unexposed reference range of 0-20 μg/g creatinine for DMA. For organic arsenic (AB), the URL for adults was 700 μg/L and 1600 μg/L for children. For urinary cadmium the suggested upper reference limit was higher for adults (1.4 μg/L) compared to children (0.2 μg/L). There is no urinary cadmium notification level for New Zealand, but the analytical laboratory considers urinary cadmium concentrations below 2 μg/L as normal. For urinary chromium the suggested upper reference limit was similar for adults (1.8 μg/L) and children (1.8 μg/L). There is no urinary chromium notification level for New Zealand, but the analytical laboratory considers urinary chromium concentrations below 1 μg/L as normal. For urinary thallium the suggested upper reference limit was higher for adults (1.0 μg/L) compared to children (0.5 μg/L). There is no urinary thallium notification level
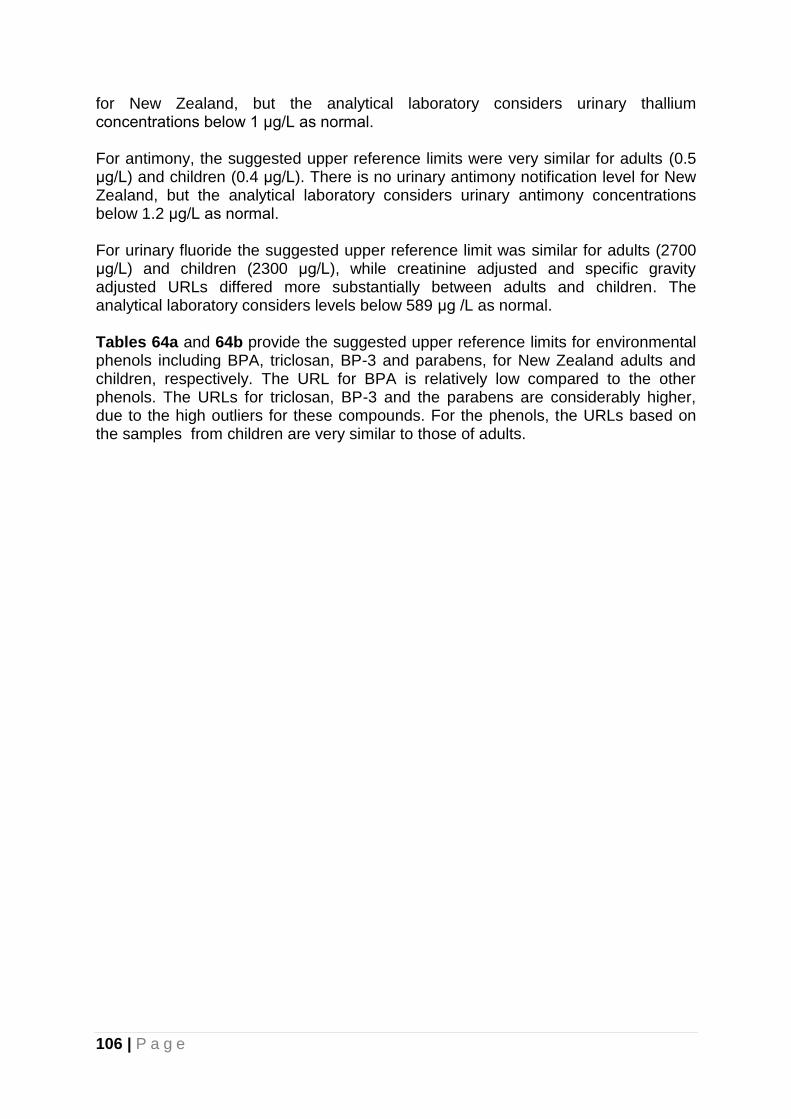
106 | P a g e
for New Zealand, but the analytical laboratory considers urinary thallium concentrations below 1 μg/L as normal. For antimony, the suggested upper reference limits were very similar for adults (0.5 μg/L) and children (0.4 μg/L). There is no urinary antimony notification level for New Zealand, but the analytical laboratory considers urinary antimony concentrations below 1.2 μg/L as normal. For urinary fluoride the suggested upper reference limit was similar for adults (2700 μg/L) and children (2300 μg/L), while creatinine adjusted and specific gravity adjusted URLs differed more substantially between adults and children. The analytical laboratory considers levels below 589 μg /L as normal. Tables 64a and 64b provide the suggested upper reference limits for environmental phenols including BPA, triclosan, BP-3 and parabens, for New Zealand adults and children, respectively. The URL for BPA is relatively low compared to the other phenols. The URLs for triclosan, BP-3 and the parabens are considerably higher, due to the high outliers for these compounds. For the phenols, the URLs based on the samples from children are very similar to those of adults.

107 | P a g e
Table 64a. Reference values and upper reference limits (URL) for phenols for adult New Zealanders (age 19-65)
LOD
%< LOD GM
95%CI GM P2.5 P50 P95 P97.5
95%CI P97.5 URL
Bisphenol A μg/L urine 0.4 93% 1.80 1.60-2.03 <LOD 1.87 12 17 13-22 25
μg/g creat
1.45 1.30-1.61 <LOD 1.51 7 8 3-12 15
μg/L spgr 1.98 1.78-2.21 <LOD 1.94 9 13 6-21 25
triclosan μg/L urine 0.4 15% 5.77 4.26-7.82 <LOD 2.6 963 1161 998-1351 1360
μg/g creat
4.63 3.43-6.25 <LOD 1.8 654 901 675-1202 1210
μg/L spgr 6.34 4.69-8.56 <LOD 2.6 951 1270 975-1653 1660
BP-3 μg/L urine 0.2 0% 18.40 14.90-22.74 0.85 14.31 585 899 503-1600 1600
μg/g creat
14.77 12.00-18.18 0.82 10.59 429 974 509-1859 1860
μg/L spgr 20.21 16.36-24.97 1.01 14.32 690 1752 1027-2988 3000
methylparaben μg/L urine 0.08 0% 17.49 14.52-21.08 1.73 14.33 324 737 369-1381 1400
μg/g creat
14.04 11.56-17.04 1.15 11.14 258 632 244-1537 1540
μg/L spgr 19.21 15.91-23.21 1.92 15.41 348 894 403-1981 2000
n-propylparaben μg/L urine 0.08 0% 3.38 2.73-4.18 0.15 2.83 76 145 63-327 330
μg/g creat
2.71 2.18-3.37 0.10 2.19 89 124 76-200 200
μg/L spgr 3.71 3.00-4.60 0.16 2.85 108 162 87-301 310
ethylparaben μg/L urine 0.08 0% 1.39 1.14-1.69 0.14 0.92 36 108 38-309 310
μg/g creat
1.11 0.91-1.36 0.12 0.74 31 103 37-266 270
μg/L spgr 1.52 1.25-1.85 0.18 0.98 42 140 53-369 370
LOD:Limit of Detection; GM: geometric mean; 95%CI: 95% confidence interval; P97.5: 97.5th percentile; URL: upper reference
limit; creat: creatinine; spgr: specific gravity adjusted.
Table 64b. Reference values and upper reference limits (URL) for phenols for New Zealand children (age 5-18)
LOD
%< LOD GM
95%CI GM P2.5 P50 P95 P97.5
95%CI P97.5 URL
Bisphenol A μg/L urine 0.4 89% 2.18 1.96-2.41 <LOD 2.17 10 12 9-15 15
μg/g creat
2.17 1.96-2.39 <LOD 2.12 9 12 8-17 20
μg/L spgr 2.02 1.83-2.23 <LOD 1.92 8 15 10-21 25
triclosan μg/L urine 0.4 8% 3.85 2.96-5.03 <LOD 1.8 607 918 674-1248 1250
μg/g creat
3.84 2.95-4.99 <LOD 1.9 497 835 572-1218 1220
μg/L spgr 3.58 2.75-4.66 <LOD 1.6 479 781 503-1214 1220
BP-3 μg/L urine 0.2 0% 20.8 17.6-24.7 1.8 17.3 279 640 283-1448 1450
μg/g creat
20.8 17.5-24.8 1.8 18.4 357 573 321-1017 1020
μg/L spgr 19.4 16.3-23.0 1.8 15.7 300 555 300-1027 1030
methylparaben μg/L urine 0.08 0% 11.87 9.60-14.68 1.26 7.18 376 3810 972-14265 14300
μg/g creat
11.82 9.59-14.57 1.07 6.88 343 3777 968-14330 14400
μg/L spgr 11.03 8.98-13.54 1.31 6.12 333 3463 875-13594 13600
n-propylparaben μg/L urine 0.08 1% 2.11 1.75-2.56 0.13 1.82 41 84 31-227 230
μg/g creat
2.10 1.75-2.54 0.12 1.91 34 69 22-213 220
μg/L spgr 1.96 1.63-2.36 0.12 1.65 37 90 32-258 260
ethylparaben μg/L urine 0.08 2% 0.68 0.58-0.81 0.10 0.49 15 44 11-180 180
μg/g creat
0.68 0.58-0.80 0.11 0.50 13 46 13-150 150
μg/L spgr 0.63 0.54-0.75 0.11 0.44 13 53 15-194 200
LOD:Limit of Detection; GM: geometric mean; 95%CI: 95% confidence interval; P97.5: 97.5th percentile; URL: upper reference
limit; creat: creatinine; spgr: specific gravity adjusted.
Tables 65a and 65b provide the suggested upper reference limits for phthalate metabolites, for New Zealand adults and children, respectively. Overall, also for the phthalates the URLs based on the samples from children are similar to those of adults.
108 | P a g e
Table 65a. Reference values and upper reference limits (URL) for phthalate metabolites for adult New Zealanders (age 19-65)
unit LOD %<
LOD GM 95%CI
GM P2.5 P50 P95 P97.5 95%CI P97.5 URL
mEP μg/L urine 1 4% 19.1 16.7-22.0 <LOD 19.1 147.4 228 155-334 340
μg/g creat
15.3 13.3-17.6 <LOD 13.7 155.0 230 143-368 370
μg/L spgr 21.0 18.3-24.1 <LOD 19.0 161.9 255 154-422 430
mBP μg/L urine 1 0% 37.0 33.4-40.9 7.7 36.1 146.4 221 114-423 430
μg/g creat
29.6 27.2-32.2 7.9 26.2 95.8 121 64-229 230
μg/L spgr 40.6 37.2-44.3 9.9 37.0 146.3 196 94-408 410
mBzP μg/L urine 1 18% 4.2 3.6-4.8 <LOD 4.6 32.7 48 28-82 90
μg/g creat
3.3 2.9-3.8 <LOD 3.2 20.5 31 20-46 50
μg/L spgr 4.6 4.0-5.2 <LOD 5.0 27.9 40 26-62 70
mEHP μg/L urine 1 18% 2.0 1.8-2.2 <LOD 2.1 10.1 12 8-18 20
μg/g creat
1.6 1.4-1.8 <LOD 1.6 6.5 8 5-11 20
μg/L spgr 2.2 2.0-2.4 <LOD 2.2 9.2 11 8-15 20
mEOHP μg/L urine 1 1% 7.0 6.4-7.7 1.4 7.0 25.8 32 24-43 50
μg/g creat
5.6 5.2-6.1 1.3 5.6 16.9 21 16-27 30
μg/L spgr 7.7 7.1-8.3 2.0 7.7 22.5 31 21-45 50
mEHHP μg/L urine 1 4% 9.0 8.0-10.1 <LOD 9.6 38.8 45 33-61 70
μg/g creat
7.2 6.5-8.0 <LOD 8.0 25.7 35 24-51 60
μg/L spgr 9.9 8.9-10.9 <LOD 10.3 36.4 43 29-64 70
mCPP μg/L urine 1 37% 2.4 2.1-2.7 <LOD 1.9 18.2 35 16-76 80
μg/g creat
1.9 1.7-2.1 <LOD 1.5 11.7 29 13-65 70
μg/L spgr 2.6 2.3-2.9 <LOD 2.2 17.6 45 21-98 100
LOD:Limit of Detection; GM: geometric mean; 95%CI: 95% confidence interval; P97.5: 97.5th percentile; URL: upper reference
limit; creat: creatinine; spgr: specific gravity adjusted.
Table 65b. Reference values and upper reference limits (URL) for phthalate metabolites for New Zealand children (age 5-18)
unit LOD %<
LOD GM 95%CI
GM P2.5 P50 P95 P97.5 95%CI P97.5 URL
mEP μg/L urine 1 36% 12.9 11.3-14.7 <LOD 12.0 109.3 167 72-385 390
μg/g creat
12.8 11.4-14.5 <LOD 11.8 66.5 211 93-481 490
μg/L spgr 12.0 10.6-13.5 <LOD 10.7 78.4 189 84-411 420
mBP μg/L urine 1 0% 60.6 55.8-65.7 12.7 60.6 198.2 257 205-322 330
μg/g creat
60.3 55.8-65.1 16.9 60.2 213.9 264 187-373 380
μg/L spgr 56.3 52.4-60.4 17.4 53.5 159.4 215 167-276 280
mBzP μg/L urine 1 7% 7.7 6.7-8.8 <LOD 7.4 50.5 87 60-126 130
μg/g creat
7.6 6.8-8.6 <LOD 7.1 44.9 69 38-124 130
μg/L spgr 7.1 6.3-8.1 <LOD 6.8 42.8 59 32-110 110
mEHP μg/L urine 1 10% 2.7 2.5-3.0 <LOD 2.8 11.2 14 12-17 20
μg/g creat
2.7 2.5-3.0 <LOD 2.6 11.1 13 10-16 20
μg/L spgr 2.5 2.3-2.8 <LOD 2.6 8.5 11 9-14 20
mEOHP μg/L urine 1 0% 14.2 13.1-15.4 3.1 14.3 47.0 62 48-81 90
μg/g creat
14.1 13.0-15.3 3.1 13.7 46.8 68 55-84 90
μg/L spgr 13.2 12.3-14.2 3.7 12.9 36.6 48 37-62 70
mEHHP μg/L urine 1 2% 17.6 15.9-19.4 2.7 18.7 68.1 78 60-101 110
μg/g creat
17.5 15.9-19.3 3.2 18.1 67.2 90 71-114 120
μg/L spgr 16.3 15.0-17.9 2.9 17.1 54.0 60 47-78 80
mCPP μg/L urine 1 24% 3.3 3.0-3.7 <LOD 3.0 11.8 20 11-34 40
μg/g creat
3.3 3.0-3.6 <LOD 3.2 12.0 17 10-28 30
μg/L spgr 3.1 2.8-3.4 <LOD 2.9 10.1 14 8-23 30
LOD:Limit of Detection; GM: geometric mean; 95%CI: 95% confidence interval; P97.5: 97.5th percentile; URL: upper reference
limit; creat: creatinine; spgr: specific gravity adjusted.

109 | P a g e
7. Recommendations for future biological monitoring of selected chemicals of concern
This is the first national biomonitoring study representative for adults and children living in New Zealand on human environmental exposure of selected chemicals of concern measured in whole blood and urine, including metals and metalloids, cotinine, fluoride, phenols and phthalates. It did not include persistent organic pollutants, as these compounds were evaluated for adult New Zealanders in two previous surveys (Bates et al., 2004; 't Mannetje et al., 2013) and are typically measured in pooled serum samples. Repetition of a similar biomonitoring programme in the future will enable the monitoring of trends over time. The US and Canada both have biomonitoring programmes that have been repeated every 2 to 3 years. These studies have shown that changes in population levels of certain chemicals of concern can occur fast (i.e. phthalate urinary concentrations have more than halved in a 5 year time period). This suggests that the reference values and upper reference limits as reported here (Table 63-65) may need updating in 5 years. Because urinary concentrations for most of the chemicals of concern represent recent exposure, repetition of the biological monitoring programme will also provide a timely evaluation of the effectiveness of regulatory changes in relation to these chemicals. For future biological monitoring of selected chemicals of concern, we recommend the following:
To conduct it as part of a larger nationwide survey (e.g. the New Zealand nutrition survey), if possible. This would reduce the cost for recruitment and has the advantage that details on diet are already collected. In addition, it would optimise the use of biological samples collected as part of the larger nationwide survey, which, in the case of urine, is generally available in sufficient volume to allow for testing of both nutritional indicators and selected chemicals of concern.
To include questions that enable the evaluation of the determinants of exposure, as was done for this survey.
To use similar inclusion criteria, age range and geographic representation, to optimise comparability over time.
To recruit a similar number of study participants (i.e. 300 children and 300 adults). This number of participants will provide sufficient study power to detect age, gender, ethnicity and geographic patterns, as demonstrated in this study.
To ensure sufficiently low detection limits are achieved by the analytical laboratories, for the survey to provide useful results, taking into account possible reductions in population levels since the last survey.
To consider inclusion of additional chemicals of concern. Biological monitoring has developed rapidly over the past two decades and advancements in analytical techniques have provided additional options for the number of chemicals and compounds that can be monitored in the general population. Recommendations to aid decision making are included below.
Listed below are issues to be taken into consideration when including or excluding compounds in future New Zealand biomonitoring programmes.

110 | P a g e
Is the compound a biomarker of an environmental exposure (as opposed to biomarkers of effect, disease or susceptibility)? A valid biomarker of exposure is one that links the biomarker in the subject to a specific environmental exposure. Ideally, a biomarker will be unique to the substance under investigation, although this is often not the case (Zelenka et al., 2011).
Is the environmental exposure or its metabolites biologically relevant and relevant for public health? Answering this question requires up to date reviews of the scientific literature.
Does the concentration of the biomarker increase with exposure?
Are reference values available for the compound? The availability of reference values increases the value of repeating biomonitoring of this compound over time. Blood lead is an excellent example of this, for which repeated biomonitoring programmes have indicated substantial decreases in population levels of blood lead over time, reflecting environmental exposure.
Can the compound be determined in human body fluids and have standard operating procedures (SOPs) been evaluated and published?
What volume of human body fluids is required to conduct the analyses? Particularly when including children in the biomonitoring programme, sample volume is an important criterion.
Are the detection limits sufficiently low and the expected detection frequency of the compound sufficiently high in the population? For example, for compounds detected in less than half of the samples, geometric means are generally not calculated. A review article from 2007 indicates which substances are found in blood or urine samples of less or more than 50% of the population (Angerer et al., 2007).
Does a New Zealand based laboratory provide routine analyses for the compound? This will facilitate the analyses of single samples that can be compared with the reference values resulting from the biomonitoring programme. For example, New Zealand laboratories currently do not provide analyses of phthalates and phenols, and if individual urine sample results (e.g. from individuals in a highly exposed job) are to be compared with the reference values, the urine sample will have to be sent overseas.
Can pre-analytic and analytic contamination be sufficiently controlled? This is particularly relevant for compounds that can be found in medical and analytical equipment or omnipresent in an indoor environment.
Is the biomarker stable in the sample matrix? If the biomarker is not stable, this may complicate the sample collection and storage procedures.
Does the compound provide the possibility of comparing with other countries? Countries that have conducted repeated surveys at regular intervals include the US (NHANES survey repeated every 2 years since 1999) and Canada (The Canadian Health Measures Survey repeated every 3 years since 2007).
Are there sources of exposure of the compound present in New Zealand? Are these sources particularly relevant for New Zealand? For example, with New Zealand’s strong agricultural sector, population exposure to pesticides is particularly relevant.
What are the analytical costs of adding the compound to the list? In some cases adding compounds to a suite of analytes may not substantially alter the total analytical cost.
111 | P a g e
A weight of evidence approach for selecting exposure biomarkers for biomarkers has been developed (Zelenka et al., 2011) in the US, which recommends a framework following six steps:
1. Specify the intended use of the biomarker. 2. Rigorously define the exposure question against which the biomarkers will be
evaluated. 3. Develop the list of competing biomarkers and matrices. 4. Rate each criterion as to its relevance in answering the exposure question. 5. Rate the suitability of each biomarker for each criterion. 6. Complete the required calculations and interpretation.
112 | P a g e
8. Discussion This national biological monitoring programme provides descriptive statistics on blood and urine concentrations of metals, metalloids, cotinine, fluoride, phenols and phthalates, for a sample of the New Zealand population. The programme aimed to include 300 children and 300 adults with an age range from 5 to 64 years, men and women, Māori and non-Māori and all geographic regions in New Zealand. The limitations of the biological monitoring programme are discussed below. For practical reasons different recruitment methods were used for children and adults, which may have impacted on the representativeness of the sample. For example, children were mainly recruited through schools, while adults were selected from the electoral roll and invited by mail to participate in the study. As considerable effort and commitment was required from individuals and their families to participate in the study (i.e. go to a local pathology lab to have a blood sample taken and self-collect a urine sample), participation rates were low, particularly for children. To partially mitigate this, we had an opportunity to use urine samples which were being collected as part of another study in children conducted at the same time. However, this resulted in a relative over-representation of children from the lower North Island. As a consequence, population geometric means in the presence of substantial geographic variation in urinary concentrations need to be interpreted with caution. This is relevant for the urinary fluoride levels for children, which were highest for the lower North Island. The over-representation of children from the lower North Island will therefore have inflated the overall geometric mean of urinary fluoride concentrations for New Zealand children and region-specific GMs need to be considered. The results based on blood samples (lead and mercury) are not affected by an over-representation of children from the lower North Island, but for children the number of blood samples included in the study was smaller than the number of urine samples. For adults the representativeness of the study population for the general population in terms of age, sex, ethnicity and geographic region was evaluated by comparing the unweighted geometric means (as reported here) with GMs weighted by the age, sex, ethnicity and geographic distribution of the New Zealand population (not reported). This showed very similar GMs for the unweighted and weighted sample, providing support that the sample was sufficiently representative for the New Zealand population in terms of age, ethnicity, geographic region and gender. Although our ability to measure environmental chemicals at very low concentrations has advanced, the proportion of samples in which the compound could not be detected remained high for some analytes, and assumptions on the actual level had to be made. As a rule, we used half the detection limit for those samples below the limit of detection. Geometric means including those below the limit of detection were, however, not presented, if the detection frequency was below 33%. In these cases the detection frequency was presented. All urine concentrations are presented unadjusted, as well as creatinine adjusted, and specific gravity adjusted. Each method to adjust for urinary volume has their own limitations, and creatinine adjustment has been shown to potentially result in over adjustment (Hoet et al., 2016). Particularly when comparing urinary concentrations

113 | P a g e
between age groups and genders, the type of urinary volume adjustment needs to be taken into account, as creatinine concentrations and specific gravity of the urine both depend strongly but differentially on age and gender (see appendix 3). Consistency in age and sex differences independently of the adjustment method used was therefore interpreted as the strongest evidence of such age and sex differences in urinary concentrations. If gender or age differences were only apparent for creatinine adjusted urine concentrations, these differences were generally disregarded. Another limitation of using urinary samples in biomonitoring studies is that for most included compounds the urinary concentrations generally reflect recent exposure, as opposed to chronic exposure which would be most relevant for any health effects. Elevated levels can therefore not be interpreted as indicative of health risk. Additionally, for some compounds the metabolites are measured, rather than the parent compound, which makes an individual’s result dependent on that person’s individual metabolic rate which can vary widely within populations. However, on a population level these individual variations will be balanced out and do not impact on the population geometric mean as reported here. This is the first biomonitoring study in New Zealand reporting on blood and urinary concentrations of selected chemicals of concern. The results provide baseline levels representative for New Zealanders during the period 2014 to 2016. Health risk assessments were outside the scope of this study. From this data it is therefore not possible to draw conclusions about potential health risks, and the reported levels can only be interpreted as an indicator of exposure.
114 | P a g e
9. Conclusions The conclusions of the biomonitoring programme are presented by chemical, followed by more general conclusions regarding these chemicals and associations with age, sex, ethnicity and geographic region. Population levels of the selected chemicals are represented by the geometric mean, reflecting the central tendency of the blood and urine concentrations in the study population. The geometric means, representative for the New Zealand general population, are also compared with those reported for other countries. Blood lead
Total lead was determined in whole blood samples collected during 2014-2016 from 304 adults and 193 children living in New Zealand.
Lead was detected in all samples.
The geometric mean (GM) blood lead level was 13 µg/L (1.3 µg/dL) for adults and 8 µg/L (0.8 µg/dL) for children.
None of the study participants had blood lead levels above the notifiable blood lead level of 100 µg/L (10 µg/dL).
Lead levels were positively associated with age and male gender.
Among children lead levels were highest for the Northland/Auckland region, but this pattern was not observed for adults.
The blood lead concentrations for adults and children in New Zealand were comparable to the geometric means reported for the US and Canada, although for these countries a downward trend over time has been observed with the most recent results indicating concentrations below those observed for New Zealand.
Blood mercury
Total mercury was determined in whole blood samples collected during 2014-2016 from 304 adults and 193 children living in New Zealand.
Mercury was detected in 99% of the adult blood samples and 93% of the child blood samples.
The geometric mean (GM) blood mercury level was 1.6 µg/L for adults and 0.9 µg/L for children.
There currently is no New Zealand blood mercury notification level. None of the participants had blood mercury concentrations above Health Canada’s blood mercury guidance value of 20 µg/L.
Mercury levels were higher for those who reported fish consumption in the 48 hours before blood taking.
Mercury levels were positively associated with age and male gender although this gender pattern was only observed for children, not for adults.
The GM for blood mercury in New Zealanders was approximately double the GM reported for US, Canada and Germany. The New Zealand GMs were comparable to those reported for France, and lower than that reported for Korea.
115 | P a g e
Urinary inorganic arsenic
Inorganic arsenic related compounds, including dimethylersinic acid (DMA), monomethylarsonic acid (MMA), arsenite (AsIII) and arsenate (AsV), were determined in morning void urine samples collected during 2014-2016 from 304 adults and 299 children living in New Zealand.
DMA was the dominant inorganic arsenic related compound, accounting for practically all inorganic arsenic measured.
DMA was detected in 79% of adults and 72% of children. MMA was detected in 3% of adults and 14% of children. AsIII and AsV were not detected in any of the adult samples and in one and two samples respectively of the children samples.
The geometric mean (GM) urinary DMA level was 4.2 µg/L for adults and 3.0 µg/L for children.
For both adults and children there was a strong South to North gradient in urinary DMA levels, with the lowest GMs observed for the South Island.
Fish consumption in the 48 hours prior to sampling was associated with higher urinary levels of DMA, for both adults and children.
Urinary levels of DMA in adult New Zealanders were comparable to those reported for the US and Canada while below those reported for Spain. New Zealand levels of urinary DMA in children were below those reported for the US.
Urinary organic arsenic
The organic arsenic compound arsenobetaine (AB) was determined in morning void urine samples collected during 2014-2016 from 304 adults and 299 children living in New Zealand.
AB was detected in samples from 68% of the adults and 53% of the children.
The geometric mean urinary AB level was 3.5 µg/L for adults and 1.5 µg/L for children.
Among children, AB levels were higher for non-Māori compared to Māori, but this ethnicity pattern was not observed among adults.
Fish consumption in the 48 hours prior to sampling was associated with substantially higher urinary levels of AB, for both adults (24.6 µg/L) and children (41.2 µg/L).
Urinary levels of AB in adult New Zealanders were higher than data reported for the US, but lower than those reported for high fish consuming nations such as Spain and Japan.

116 | P a g e
Urinary cadmium
Cadmium was determined in morning void urine samples collected during 2014-2016 from 304 adults and 300 children living in New Zealand.
Cadmium was detected in 89% of the adult urine samples and 53% of the child urine samples.
The geometric mean (GM) urinary cadmium was 0.19 µg/L for adults and 0.07 µg/L for children.
Age was strongly and positively associated with cadmium levels. For adults cadmium levels differed among geographic regions but this was not observed for children.
The GM of urinary cadmium concentrations of New Zealanders was comparable to those reported for US and Europe, and lower than that reported for Canada, for both adults and children.
Urinary chromium
Chromium was determined in morning void urine samples collected during 2014-2016 from 304 adults and 300 children living in New Zealand.
Chromium was detected in 59% of the adult urine samples and 44% of the child urine samples. The relatively low detection frequency for chromium limits the statistical interpretation of these data.
The geometric mean urinary chromium was 0.05 µg/L for adults and 0.03 µg/L for children.
Apart from the higher GMs observed for adults compared to children, there were no consistent differences in urinary chromium levels between age groups, men and women, ethnicity groups, or geographic regions. Among children the geometric mean for the lower North Island was more than double that of the other three regions, but this pattern was not observed for adults.
The New Zealand GMs for urinary chromium were below those reported for France and Belgium. Comparisons with the US and Canada could not be made.

117 | P a g e
Urinary thallium
Thallium was determined in morning void urine samples collected during 2014-2016 from 304 adults and 300 children living in New Zealand.
Thallium was detected in 97% of the adult urine samples and 79% of the child urine samples.
The geometric mean (GM) urinary thallium was 0.20 µg/L for adults and 0.05 µg/L for children.
Apart from the higher GM observed for adults compared to children, there were no consistent differences in urinary chromium levels between age groups, men and women, or ethnicity groups.
Differences in urinary thallium levels between geographic regions were observed for both adults and children, with the lowest GM observed for the South Island.
New Zealand urinary thallium concentrations in adults were similar to those reported for Canada, France and Belgium, and higher than those reported for the US. For children the New Zealand levels were lower than those reported for the US.
Urinary antimony
Antimony was determined in morning void urine samples collected during 2014-2016 from 304 adults and 300 children living in New Zealand.
Antimony was detected in 90% of the adult urine samples and 99% of the child urine samples.
The geometric mean urinary antimony was 0.06 µg/L for adults and 0.09 µg/L for children.
Among children, the GM for antimony was higher for girls compared to boys and lowest in the Northland/Auckland region. These gender and regional patterns were not observed for adults.
New Zealand urinary antimony concentrations in adults were similar to those reported for France and marginally higher than levels most recently reported for Belgium, US and Canada. New Zealand urinary antimony concentrations in children were also above those most recently reported for the US and Canada. The pattern of higher levels among children compared to adults observed in this study, was also observed in the studies from the US and Canada.
Urinary cotinine
Cotinine was determined in morning void urine samples collected during 2014-2016 from 304 adults and 300 children living in New Zealand.
Urinary cotinine was detected in 11% of adults and 2% of children.
Detection frequencies were significantly higher among Māori children (8% detected) compared to non-Māori children (0% detected). Also among adults detection frequencies were significantly higher among Māori (19% detected) compared to non-Māori (6% detected).

118 | P a g e
Urinary fluoride
Fluoride was determined in morning void urine samples collected during 2014-2016 from 304 adults and 299 children living in New Zealand.
Fluoride was detected in all urine samples.
The geometric mean urinary fluorine was 760 µg/L for adults and 630 µg/L for children.
Among children, older age was associated with lower urinary fluoride levels. Among adults, a higher urinary fluoride level was observed for females compared to males, while this pattern was not observed among children.
For both children and adults, the lowest urinary fluoride GM was observed for the South Island.
Concentrations of fluoride in New Zealand adults are marginally higher than those reported for Canada, but comparable to those reported for Brazil and Japan.
Urinary phenols: BPA
BPA was determined in morning void urine samples collected during 2014-2016 from 303 adults and 299 children living in New Zealand.
BPA was detected in the urine samples of 93% of adults and 89% of children.
The geometric mean urinary BPA concentration was 1.8 µg/L for adults and 2.2 µg/L for children.
BPA concentrations differed by age group, with the highest GM observed for the 19-24 year age group (2.9 µg/L) and the lowest for the 50-64 age group (1.4 µg/L).
There were no consistent differences in urinary BPA concentrations between men and women or between Māori and non-Māori.
For children geographic variation in urinary BPA concentrations were observed, with the highest GM for the Northland/Auckland region.
The urinary BPA concentrations for New Zealand were comparable to those reported for Australia, US and Canada, although the most recent GMs reported for the US and Canada were below those of New Zealand, for both adults and children.

119 | P a g e
Urinary phenols: triclosan
Triclosan was determined in morning void urine samples collected during 2014-2016 from 303 adults and 299 children living in New Zealand.
Triclosan was detected in the urine samples of 85% of adults and 92% of children.
The geometric mean urinary triclosan concentration was 4.8 µg/L for adults and 3.9 µg/L for children.
Among children, triclosan levels were positively associated with age, while in adults they were negatively associated with age, with the highest GM for triclosan observed for the 19-24 year age group.
There were no consistent differences in urinary triclosan concentrations between males and females or among the different geographic regions.
Adults who recalled using anti-bacterial soaps or hand sanitizers in the 48 hours before urine sampling, had a GM for urinary triclosan two times (8.6 µg/L) the GM of those who had not recently used these products (3.8 µg/L).
There were marked differences in urinary triclosan concentrations between Māori and non-Māori children, with the GM for non-Māori children more than double the GM for Māori children. For adults this difference between ethnic groups was much less pronounced and did not reach statistical significance.
The urinary triclosan concentrations for New Zealand were generally below those reported for the US and Canada, and comparable to those reported for Australia.
Urinary phenols: Benzophenone-3 (BP-3)
BP-3 was determined in morning void urine samples collected during 2014-2016 from 303 adults and 298 children living in New Zealand.
BP-3 was detected in the urine samples of 100% of adults and children.
The geometric mean urinary BP-3 concentration was 18.4 µg/L for adults and 20.8 µg/L for children.
Age was negatively associated with urinary BP-3 concentrations for adults, while among children urinary concentrations of BP-3 were comparable across the three age groups.
BP-3 urinary concentrations were higher among females compared to males, particularly for adults.
Adults who had used sunscreen in the 48 hours before urine sampling, had a GM for urinary BP-3 10 times (160 µg/L) the GM of those who had not recently used sunscreen (15 µg/L).
For both adults and children, Māori had lower urinary BP-3 concentrations compared to non-Māori.
New Zealand BP-3 levels were comparable to those reported for the US, and higher than those reported for Belgium, India and Australia.
120 | P a g e
Urinary phenols: 4-tert-octylphenol
4-tert-octylphenol was determined in morning void urine samples collected during 2014-2016 from 303 adults and 299 children living in New Zealand.
4-tert-octylphenol was detected in the urine samples of 3% of adults and 3% of children.
This low detection frequency is comparable to what has been reported for the US.
Urinary phenols: parabens
Four urinary parabens were determined in morning void urine samples collected during 2014-2016 from 303 adults and 299 children living in New Zealand: methylparaben, n-propylparaben, ethylparaben, butylparaben.
The detection frequency of methylparaben, propylparaben, and ethylparaben was high (>98%), while the detection frequency of butylparaben was 32% for adults and 33% for children.
The geometric mean concentration of the sum of the four parabens was 27.1 µg/L for adults and 17.7 µg/L for children.
Methylparaben contributed most to the sum (methylparaben GM 17.5 µg/L for adults and 11.9 µg/L for children), followed by propylparaben (GM 3.4 µg/L for adults and 2.1 µg/L for children) and ethylparaben (GM 1.4 µg/L for adults and 0.7 µg/L for children).
While GMs were generally higher for adults than for children, age was not associated with paraben concentrations for either adults or children.
For all four parabens the GM urinary concentrations were higher in women compared to men. This gender difference was not observed for children.
GMs for Māori and non-Māori were similar for methylparaben and propylparaben, while for ethylparaben and butylparaben GMs were higher for non-Māori compared to Māori (only for adults, not for children).
Geographic differences in urinary paraben levels were not observed.
New Zealand methylparaben levels were lower than those reported for the US, and comparable to the levels reported for China, Belgium, Greece and Australia.

121 | P a g e
Urinary phthalates
Ten phthalate metabolites were determined in morning void urine samples collected during 2014-2016 from 304 adults and 299 children living in New Zealand.
The following phthalate metabolites were detected in the majority of samples: mEP, mBP, mBzP, mEHP, mEOHP, mEHHP, mCPP.
The following phthalate metabolites had very low detection frequencies: mMP, mCHP, miNP.
The highest urinary concentrations were measured for monobutyl phthalate (mBP, n+iso), a metabolite of dibutyl phthalate (DBP, n+iso), commonly used as a plasticiser and other applications. The geometric mean was 37 µg/L for adults and 61 µg/L for children.
For the DEHP metabolites mEHP, mEOHP and mEHHP, also commonly used as plasticisers, the geometric means for adults and children were 2 and 3, 7 and 14, 9 and 18 µg/L, respectively.
For mBzP and mCPP, metabolites of the plasticisers BBzP and DOP, the geometric means of urinary concentrations for adults and children were 4 and 8, 2 and 3 µg/L, respectively.
For mEP, a metabolite of DEP which is commonly used in personal care products, food packaging and pharmaceuticals, the geometric mean was 19 µg/L for adults and 13 µg/L for children.
For the metabolites of phthalates commonly used as plasticisers, the highest concentrations were observed for the youngest age groups. Associations with sex, ethnicity or region were not observed.
For mEP, a metabolite of DEP which is commonly used in personal care products, concentrations were positively associated with age, and higher for women compared to men.
Urinary concentrations of phthalate metabolites in New Zealanders were largely comparable with those reported for other countries, with one possible exception i.e. for both adults and children the urinary concentrations of mBP, a metabolite of dibutyl phthalate (DBP), appeared to be higher than those reported for several other countries, but were comparable to the levels reported for Australia.
Associations with age With the notable exception of antimony, for all metals the geometric means were higher for adults compared to children (1.5x higher for lead, 1.9x for mercury, 1.3x for inorganic arsenic, 2.3x for organic arsenic, 2.6x for cadmium, 1.5x for chromium, 3.6x for thallium). For lead, mercury and cadmium, positive associations with age were also observed among the adult age groups, with the oldest age group (50-64 years) having approximately 2x higher GMs compared to the youngest age groups (19-24). For antimony, the GM was higher for children compared to adults, a pattern also observed in other countries. For fluoride, the GM was similar in adults and children (particularly when comparing creatinine adjusted levels), while among children the highest GM was observed for the youngest age group of 5-7. For the phenols and parabens, urinary concentrations in adults were generally higher than those in children. For BPA, triclosan and BP-3 the highest concentrations were

122 | P a g e
found for the 19-24 year age group. For the phthalate metabolites, urinary concentrations were typically negatively associated with age, showing the highest geometric means for the youngest age group of 5-7 years. This was not the case for mEP, a metabolite of DEP which is commonly used in personal care products, which showed a positive association with age and a peak for the 19-24 year age group. Association with gender For the metals lead, mercury and arsenic, higher GMs were observed for males compared to females, and for lead and mercury the same gender pattern was also observed for children. For fluoride, female adults had a higher GM compared to men, but this difference was only present for creatinine and specific gravity adjusted values. Urinary concentrations for BP-3 (a sunscreen component) and the parabens (used as antimicrobial preservatives in cosmetics), were significantly higher in females compared to males. For most phthalate metabolites, GMs were similar for males and females with the exception of mEP, a metabolite of DEP, which is commonly used in personal care products, for which the GM was higher in women compared to men. Association with ethnicity For organic arsenic the GMs were substantially higher for non-Māori children compared to Māori children, while no ethnic difference was observed among adults. Cotinine was detected with substantially higher frequency in Māori children compared to non-Māori children and this pattern was also observed for adults. For triclosan, non-Māori had higher urinary concentrations compared to Māori, particularly among children. For BP-3 (a sunscreen component) non-Māori had higher urinary concentrations compared to Māori, for both children and adults. For ethyl- and butylparaben (but not methyl- and propylparaben) urinary concentrations were higher in non-Māori compared to Māori (for adults only). Association with geographic region Both inorganic arsenic (in the form of DMA) and thallium, showed geographic variation for both children and adults, with lowest levels observed for the South Island and highest for the North of the North Island. Also for fluoride, the lowest GMs were observed for the South Island, for both adults and children. For BPA the lowest GMs were observed for the South Island, but this pattern was only observed for children, not for adults. For most other chemicals, a clear and consistent association was geographic region was not observed.

123 | P a g e
10. References Andersen, F.A. (2008) Final Amended Report on the Safety Assessment of
Methylparaben, Ethylparaben, Propylparaben, Isopropylparaben, Butylparaben, Isobutylparaben, and Benzylparaben as used in Cosmetic Products. Int J Toxicol, 27, 1-82.
Angerer, J., Ewers, U. & Wilhelm, M. (2007) Human biomonitoring: state of the art.
Int J Hyg Environ Health, 210, 201-228. Asimakopoulos, A.G., Thomaidis, N.S. & Kannan, K. (2014) Widespread occurrence
of bisphenol A diglycidyl ethers, p-hydroxybenzoic acid esters (parabens), benzophenone type-UV filters, triclosan, and triclocarban in human urine from Athens, Greece. Sci Total Environ, 470-471, 1243-1249.
Barr, D.B., Wilder, L.C., Caudill, S.P., Gonzalez, A.J., Needham, L.L. & Pirkle, J.L.
(2005) Urinary creatinine concentrations in the US population: Implications for urinary biologic monitoring measurements. Environmental Health Perspectives, 113, 192-200.
Bates, M., Thomson, B. & Garrett, N. (2001) Investigation of Organochlorine
Contaminants in the Milk of New Zealand Women. In Health, M.o. (ed), Wellington.
Bates, M.N., Buckland, S.J., Garrett, N., Ellis, H., Needham, L.L., Patterson, D.G.,
Jr., Turner, W.E. & Russell, D.G. (2004) Persistent organochlorines in the serum of the non-occupationally exposed New Zealand population. Chemosphere, 54, 1431-1443.
Bates, M.N., Hannah, D.J., Simon, J.B., Taucher, J.A. & Maanen, T.v. (1994)
Chlorinated Organic Contaminants in Breast Milk of New Zealand Women. Environmental Health Perspectives, 102, 211-217.
Berman, T., Goldsmith, R., Goen, T., Spungen, J., Novack, L., Levine, H., Amitai, Y.,
Shohat, T. & Grotto, I. (2014) Demographic and dietary predictors of urinary bisphenol A concentrations in adults in Israel. Int J Hyg Environ Health, 217, 638-644.
Buckland, S., Bates, M., Garrett, N., Ellis, H. & van Maanen, T. (2001)
Concentrations of selected organochlorines in the serum of the non-occupationally exposed New Zealand population. In Ministry for the Environment (ed), Wellington.
Calafat, A.M., Ye, X., Wong, L.Y., Reidy, J.A. & Needham, L.L. (2008) Exposure of
the U.S. population to bisphenol A and 4-tertiary-octylphenol: 2003-2004. Environ Health Perspect, 116, 39-44.
Canas, A.I., Cervantes-Amat, M., Esteban, M., Ruiz-Moraga, M., Perez-Gomez, B.,
Mayor, J. & Castano, A. (2014) Blood lead levels in a representative sample
124 | P a g e
of the Spanish adult population: the BIOAMBIENT.ES project. Int J Hyg Environ Health, 217, 452-459.
Casteleyn, L. & Aerts, D. (2015) Guest Editorial. Harmonized human biomonitoring
on a European scale: experiences in seventeen countries. Environ Res, 141, 1-2.
Casteleyn, L., Dumez, B., Becker, K., Kolossa-Gehring, M., Den Hond, E.,
Schoeters, G., Castano, A., Koch, H.M., Angerer, J., Esteban, M., Exley, K., Sepai, O., Bloemen, L., Horvat, M., Knudsen, L.E., Joas, A., Joas, R., Biot, P., Koppen, G., Dewolf, M.C., Katsonouri, A., Hadjipanayis, A., Cerna, M., Krskova, A., Schwedler, G., Fiddicke, U., Nielsen, J.K., Jensen, J.F., Rudnai, P., Kozepesy, S., Mulcahy, M., Mannion, R., Gutleb, A.C., Fischer, M.E., Ligocka, D., Jakubowski, M., Reis, M.F., Namorado, S., Lupsa, I.R., Gurzau, A.E., Halzlova, K., Jajcaj, M., Mazej, D., Tratnik Snoj, J., Posada, M., Lopez, E., Berglund, M., Larsson, K., Lehmann, A., Crettaz, P. & Aerts, D. (2015) A pilot study on the feasibility of European harmonized human biomonitoring: Strategies towards a common approach, challenges and opportunities. Environ Res, 141, 3-14.
CDC (2012) CDC Response to Advisory Committee on Childhood Lead Poisoning
Prevention Recommendations in “Low Level Lead Exposure Harms Children: A Renewed Call of Primary Prevention”. https://www.cdc.gov/nceh/lead/acclpp/cdc_response_lead_exposure_recs.pdf
CDC (2017) Fourth National Report on Human Exposure to Environmental
Chemicals, Updated Tables, January 2017, Volume One. https://www.cdc.gov/exposurereport/. In CDC: Centers for Disease Control and Prevention, U.S.D.o.H.a.H.S. (ed).
Cerna, M., Krskova, A., Cejchanova, M. & Spevackova, V. (2012) Human
biomonitoring in the Czech Republic: an overview. Int J Hyg Environ Health, 215, 109-119.
Cerna, M., Spevackova, V., Batariova, A., Smid, J., Cejchanova, M., Ocadlikova, D.,
Bavorova, H., Benes, B. & Kubinova, R. (2007) Human biomonitoring system in the Czech Republic. Int J Hyg Environ Health, 210, 495-499.
Choi, W., Kim, S., Baek, Y.W., Choi, K., Lee, K. & Yu, S.D. (2016) Exposure to
environmental chemicals among Korean adults-updates from the second Korean National Environmental Health Survey (2012-2014). Int J Hyg Environ Health.
Dekant, W. & Bridges, J. (2016) Assessment of reproductive and developmental
effects of DINP, DnHP and DCHP using quantitative weight of evidence. Regul Toxicol Pharmacol, 81, 397-406.
Den Hond, E., Govarts, E., Willems, H., Smolders, R., Casteleyn, L., Kolossa-
Gehring, M., Schwedler, G., Seiwert, M., Fiddicke, U., Castano, A., Esteban, M., Angerer, J., Koch, H.M., Schindler, B.K., Sepai, O., Exley, K., Bloemen,
125 | P a g e
L., Horvat, M., Knudsen, L.E., Joas, A., Joas, R., Biot, P., Aerts, D., Koppen, G., Katsonouri, A., Hadjipanayis, A., Krskova, A., Maly, M., Morck, T.A., Rudnai, P., Kozepesy, S., Mulcahy, M., Mannion, R., Gutleb, A.C., Fischer, M.E., Ligocka, D., Jakubowski, M., Reis, M.F., Namorado, S., Gurzau, A.E., Lupsa, I.R., Halzlova, K., Jajcaj, M., Mazej, D., Tratnik, J.S., Lopez, A., Lopez, E., Berglund, M., Larsson, K., Lehmann, A., Crettaz, P. & Schoeters, G. (2015) First steps toward harmonized human biomonitoring in Europe: demonstration project to perform human biomonitoring on a European scale. Environ Health Perspect, 123, 255-263.
Dewalque, L., Pirard, C. & Charlier, C. (2014) Measurement of urinary biomarkers of
parabens, benzophenone-3, and phthalates in a Belgian population. Biomed Res Int, 2014, 649314.
Electoral Commission (2015), Report of the Electoral Commission on the 2014
General Election. http://www.elections.org.nz/sites/default/files/bulk-upload/documents/report_of_the_ec_on_the_2014_general_election.pdf.
EFSA (2016) http://www.efsa.europa.eu/en/topics/topic/bisphenol. Bisphenol A.
European Food Safety Authority. Frery, N., Vandentorren, S., Etchevers, A. & Fillol, C. (2012) Highlights of recent
studies and future plans for the French human biomonitoring (HBM) programme. Int J Hyg Environ Health, 215, 127-132.
Gobas, F., Otton, S.V., Tupper-Ring, L.F., Crawford, M.A., Clark, K.E. & Ikonomou,
M.G. (2017) Chemical activity-based environmental risk analysis of the plasticizer di-ethylhexyl phthalate and its main metabolite mono-ethylhexyl phthalate. Environ Toxicol Chem, 36, 1483-1492.
Gomez Ramos, M.J., Heffernan, A.L., Toms, L.M., Calafat, A.M., Ye, X., Hobson, P.,
Broomhall, S. & Mueller, J.F. (2016) Concentrations of phthalates and DINCH metabolites in pooled urine from Queensland, Australia. Environ Int, 88, 179-186.
Gonzalez, H., Farbrot, A., Larko, O. & Wennberg, A.M. (2006) Percutaneous
absorption of the sunscreen benzophenone-3 after repeated whole-body applications, with and without ultraviolet irradiation. Br J Dermatol, 154, 337-340.
Ha, M., Kwon, H.J., Leem, J.H., Kim, H.C., Lee, K.J., Park, I., Lim, Y.W., Lee, J.H.,
Kim, Y., Seo, J.H., Hong, S.J., Choi, Y.H., Yu, J., Kim, J., Yu, S.D. & Lee, B.E. (2014) Korean Environmental Health Survey in Children and Adolescents (KorEHS-C): survey design and pilot study results on selected exposure biomarkers. Int J Hyg Environ Health, 217, 260-270.
Haines, D.A., Arbuckle, T.E., Lye, E., Legrand, M., Fisher, M., Langlois, R. & Fraser,
W. (2011) Reporting results of human biomonitoring of environmental chemicals to study participants: a comparison of approaches followed in two Canadian studies. J Epidemiol Community Health, 65, 191-198.
126 | P a g e
Haines, D.A. & Murray, J. (2012) Human biomonitoring of environmental chemicals--
early results of the 2007-2009 Canadian Health Measures Survey for males and females. Int J Hyg Environ Health, 215, 133-137.
Haines, D.A., Saravanabhavan, G., Werry, K. & Khoury, C. (2016) An overview of
human biomonitoring of environmental chemicals in the Canadian Health Measures Survey: 2007-2019. Int J Hyg Environ Health.
Han, C., Lim, Y.H. & Hong, Y.C. (2016) Ten-year trends in urinary concentrations of
triclosan and benzophenone-3 in the general U.S. population from 2003 to 2012. Environ Pollut, 208, 803-810.
Hata, A., Endo, Y., Nakajima, Y., Ikebe, M., Ogawa, M., Fujitani, N. & Endo, G.
(2007) HPLC-ICP-MS speciation analysis of arsenic in urine of Japanese subjects without occupational exposure. J Occup Health, 49, 217-223.
Health Canada (2015). Third report on human biomonitoring of environmental
chemicals in Canada. Results of the Canadian Health Measures Survey Cycle 3 (2012-2013). Ottawa.
Health Canada (2017). Fourth Report on Human Biomonitoring of Environmental
Chemicals in Canada. Results of the Canadian Health Measures Survey Cycle 4 (2014-2015). Available on: canada.ca/biomonitoring.
Heffernan, A.L., Aylward, L.L., Toms, L.M., Eaglesham, G., Hobson, P., Sly, P.D. &
Mueller, J.F. (2013) Age-related trends in urinary excretion of bisphenol A in Australian children and adults: evidence from a pooled sample study using samples of convenience. J Toxicol Environ Health A, 76, 1039-1055.
Heffernan, A.L., Baduel, C., Toms, L.M., Calafat, A.M., Ye, X., Hobson, P.,
Broomhall, S. & Mueller, J.F. (2015) Use of pooled samples to assess human exposure to parabens, benzophenone-3 and triclosan in Queensland, Australia. Environ Int, 85, 77-83.
Heintze, S.D., Bastos, J.R. & Bastos, R. (1998) Urinary fluoride levels and
prevalence of dental fluorosis in three Brazilian cities with different fluoride concentrations in the drinking water. Community Dent Oral Epidemiol, 26, 316-323.
Hinton, D., Coope, P.A., Malpress, W.A. & Janus, E.D. (1986) Trends in blood lead
levels in Christchurch (NZ) and environs 1978-85. J Epidemiol Community Health, 40, 244-248.
Hoet, P., Deumer, G., Bernard, A., Lison, D. & Haufroid, V. (2016) Urinary trace
element concentrations in environmental settings: is there a value for systematic creatinine adjustment or do we introduce a bias? J Expo Sci Env Epid, 26, 296-302.

127 | P a g e
Hoet, P., Jacquerye, C., Deumer, G., Lison, D. & Haufroid, V. (2013) Reference values and upper reference limits for 26 trace elements in the urine of adults living in Belgium. Clin Chem Lab Med, 51, 839-849.
Hohenblum, P., Steinbichl, P., Raffesberg, W., Weiss, S., Moche, W., Vallant, B.,
Scharf, S., Haluza, D., Moshammer, H., Kundi, M., Piegler, B., Wallner, P. & Hutter, H.P. (2012) Pollution gets personal! A first population-based human biomonitoring study in Austria. Int J Hyg Environ Health, 215, 176-179.
Huang, P.C., Tsai, C.H., Liang, W.Y., Li, S.S., Pan, W.H. & Chiang, H.C. (2015) Age
and Gender Differences in Urinary Levels of Eleven Phthalate Metabolites in General Taiwanese Population after a DEHP Episode. PLoS One, 10, e0133782.
Jones, R.L., Homa, D.M., Meyer, P.A., Brody, D.J., Caldwell, K.L., Pirkle, J.L. &
Brown, M.J. (2009) Trends in blood lead levels and blood lead testing among US children aged 1 to 5 years, 1988-2004. Pediatrics, 123, e376-385.
Kasper-Sonnenberg, M., Koch, H.M., Wittsiepe, J. & Wilhelm, M. (2012) Levels of
phthalate metabolites in urine among mother-child-pairs - results from the Duisburg birth cohort study, Germany. Int J Hyg Environ Health, 215, 373-382.
Kim, N.D. (2005) Cadmium accumulation in Waikato soils. Environment Waikato
Technical Report 2005/51. Kim, S.A., Kwon, Y., Kim, S. & Joung, H. (2016) Assessment of Dietary Mercury
Intake and Blood Mercury Levels in the Korean Population: Results from the Korean National Environmental Health Survey 2012-2014. Int J Environ Res Public Health, 13.
Kolossa-Gehring, M., Becker, K., Conrad, A., Schroter-Kermani, C., Schulz, C. &
Seiwert, M. (2012) Environmental surveys, specimen bank and health related environmental monitoring in Germany. Int J Hyg Environ Health, 215, 120-126.
Koniecki, D., Wang, R., Moody, R.P. & Zhu, J. (2011) Phthalates in cosmetic and
personal care products: concentrations and possible dermal exposure. Environ Res, 111, 329-336.
Krause, M., Klit, A., Jensen, M.B., Soeborg, T., Frederiksen, H., Schlumpf, M.,
Lichtensteiger, W., Skakkebaek, N.E. & Drzewiecki, K.T. (2012) Sunscreens: are they beneficial for health? An overview of endocrine disrupting properties of UV-filters. Int J Androl, 35, 424-436.
Larsson, K., Lindh, C.H., Jonsson, B.A., Giovanoulis, G., Bibi, M., Bottai, M.,
Bergstrom, A. & Berglund, M. (2017) Phthalates, non-phthalate plasticizers and bisphenols in Swedish preschool dust in relation to children's exposure. Environ Int, 102, 114-124.

128 | P a g e
Lee, J.W., Lee, C.K., Moon, C.S., Choi, I.J., Lee, K.J., Yi, S.M., Jang, B.K., Yoon, B.J., Kim, D.S., Peak, D., Sul, D., Oh, E., Im, H., Kang, H.S., Kim, J., Lee, J.T., Kim, K., Park, K.L., Ahn, R., Park, S.H., Kim, S.C., Park, C.H. & Lee, J.H. (2012) Korea National Survey for Environmental Pollutants in the Human Body 2008: heavy metals in the blood or urine of the Korean population. Int J Hyg Environ Health, 215, 449-457.
Lee, S.R., Lee, C.K., Im, H., Yang, W., Urm, S.H., Yu, S.D., Lee, J.H., Suh, C.H.,
Kim, K.H., Son, B.C., Kim, J.H., Kim, S.Y., Lee, S.W. & Lee, J.T. (2014) Secondhand smoke exposure and urine cotinine concentrations by occupation among Korean workers: results from the 2008 Korea National Survey for Environmental Pollutants in the Human Body. J Occup Environ Hyg, 11, 314-325.
Lopez-Herranz, A., Cutanda, F., Esteban, M., Pollan, M., Calvo, E., Perez-Gomez,
B., Victoria Cortes, M. & Castano, A. (2016) Cadmium levels in a representative sample of the Spanish adult population: The BIOAMBIENT.ES project. J Expo Sci Environ Epidemiol, 26, 471-480.
Lye, E., Legrand, M., Clarke, J. & Probert, A. (2013) Blood total mercury
concentrations in the Canadian population: Canadian Health Measures Survey cycle 1, 2007-2009. Can J Public Health, 104, e246-251.
Mannetje, A., Coakley, J., Bridgen, P., Brooks, C., Harrad, S., Smith, A.H., Pearce,
N. & Douwes, J. (2013) Current concentrations, temporal trends and determinants of persistent organic pollutants in breast milk of New Zealand women. Science of The Total Environment, 458-460, 399-407.
McKelvey, W., Gwynn, R.C., Jeffery, N., Kass, D., Thorpe, L.E., Garg, R.K., Palmer,
C.D. & Parsons, P.J. (2007) A biomonitoring study of lead, cadmium, and mercury in the blood of New York city adults. Environ Health Perspect, 115, 1435-1441.
Ministry for the Environment (2011). Toxicological Intake Values for Priority
Contaminants in Soil. Wellington: Ministry for the Environment, Wellington. Morck, T.A., Nielsen, F., Nielsen, J.K., Jensen, J.F., Hansen, P.W., Hansen, A.K.,
Christoffersen, L.N., Siersma, V.D., Larsen, I.H., Hohlmann, L.K., Skaanild, M.T., Frederiksen, H., Biot, P., Casteleyn, L., Kolossa-Gehring, M., Schwedler, G., Castano, A., Angerer, J., Koch, H.M., Esteban, M., Schoeters, G., Den Hond, E., Exley, K., Sepai, O., Bloemen, L., Joas, R., Joas, A., Fiddicke, U., Lopez, A., Canas, A., Aerts, D. & Knudsen, L.E. (2015) The Danish contribution to the European DEMOCOPHES project: A description of cadmium, cotinine and mercury levels in Danish mother-child pairs and the perspectives of supplementary sampling and measurements. Environ Res, 141, 96-105.
Morton, J., Tan, E., Leese, E. & Cocker, J. (2014) Determination of 61 elements in
urine samples collected from a non-occupationally exposed UK adult population. Toxicol Lett, 231, 179-193.

129 | P a g e
Navarro Serrano, I., Llorente Ballesteros, M.T., Sanchez Fernandez Pacheco, S.,
Izquierdo Alvarez, S. & Lopez Colon, J.L. (2016) Total and speciated urinary arsenic levels in the Spanish population. Sci Total Environ, 571, 164-171.
Nisse, C., Tagne-Fotso, R., Howsam, M., Richeval, C., Labat, L. & Leroyer, A.
(2016) Blood and urinary levels of metals and metalloids in the general adult population of Northern France: The IMEPOGE study, 2008-2010. Int J Hyg Environ Health.
Perez-Gomez, B., Pastor-Barriuso, R., Cervantes-Amat, M., Esteban, M., Ruiz-
Moraga, M., Aragones, N., Pollan, M., Navarro, C., Calvo, E., Roman, J., Lopez-Abente, G. & Castano, A. (2013) BIOAMBIENT.ES study protocol: rationale and design of a cross-sectional human biomonitoring survey in Spain. Environ Sci Pollut Res Int, 20, 1193-1202.
Pino, A., Amato, A., Alimonti, A., Mattei, D. & Bocca, B. (2012) Human biomonitoring
for metals in Italian urban adolescents: data from Latium Region. Int J Hyg Environ Health, 215, 185-190.
Rango, T., Vengosh, A., Jeuland, M., Tekle-Haimanot, R., Weinthal, E., Kravchenko,
J., Paul, C. & McCornick, P. (2014) Fluoride exposure from groundwater as reflected by urinary fluoride and children's dental fluorosis in the Main Ethiopian Rift Valley. Sci Total Environ, 496, 188-197.
Rocha, B.A., Asimakopoulos, A.G., Barbosa, F., Jr. & Kannan, K. (2017) Urinary
concentrations of 25 phthalate metabolites in Brazilian children and their association with oxidative DNA damage. Sci Total Environ, 586, 152-162.
Royal Society of New Zealand (2014). Health effects of water fluoridation: A review
of the scientific evidence. A report on behalf of the Royal Society of New Zealand and the Office of the Prime Minister’s Chief Science Advisor.
Saravanabhavan, G., Werry, K., Walker, M., Haines, D., Malowany, M. & Khoury, C.
(2016) Human biomonitoring reference values for metals and trace elements in blood and urine derived from the Canadian Health Measures Survey 2007-2013. Int J Hyg Environ Health.
Schober, S.E., Sinks, T.H., Jones, R.L., Bolger, P.M., McDowell, M., Osterloh, J.,
Garrett, E.S., Canady, R.A., Dillon, C.F., Sun, Y., Joseph, C.B. & Mahaffey, K.R. (2003) Blood mercury levels in US children and women of childbearing age, 1999-2000. JAMA, 289, 1667-1674.
Schoeters, G., Den Hond, E., Colles, A., Loots, I., Morrens, B., Keune, H., Bruckers,
L., Nawrot, T., Sioen, I., De Coster, S., Van Larebeke, N., Nelen, V., Van de Mieroop, E., Vrijens, J., Croes, K., Goeyens, K. & Baeyens, W. (2012) Concept of the Flemish human biomonitoring programme. Int J Hyg Environ Health, 215, 102-108.
130 | P a g e
Schulz, C., Angerer, J., Ewers, U. & Kolossa-Gehring, M. (2007a) The German Human Biomonitoring Commission. Int J Hyg Environ Health, 210, 373-382.
Schulz, C., Conrad, A., Becker, K., Kolossa-Gehring, M., Seiwert, M. & Seifert, B.
(2007b) Twenty years of the German Environmental Survey (GerES): human biomonitoring--temporal and spatial (West Germany/East Germany) differences in population exposure. Int J Hyg Environ Health, 210, 271-297.
Schulz, C., Wilhelm, M., Heudorf, U. & Kolossa-Gehring, M. (2011) Update of the
reference and HBM values derived by the German Human Biomonitoring Commission. Int J Hyg Environ Health, 215, 26-35.
Serrano, S.E., Braun, J., Trasande, L., Dills, R. & Sathyanarayana, S. (2014)
Phthalates and diet: a review of the food monitoring and epidemiology data. Environ Health, 13, 43.
Singh, B., Gaur, S. & Garg, V.K. (2007) Fluoride in drinking water and human urine
in Southern Haryana, India. J Hazard Mater, 144, 147-151. Solberg, H.E. (1987) Approved Recommendation (1987) on the Theory of Reference
Values .5. Statistical Treatment of Collected Reference Values - Determination of Reference Limits. Clin Chim Acta, 170, S13-S32.
Sorahan, T., Pang, D., Esmen, N. & Sadhra, S. (2008) Urinary concentrations of
toxic substances: an assessment of alternative approaches to adjusting for specific gravity. J Occup Environ Hyg, 5, 721-723.
Sul, D., Ahn, R., Im, H., Oh, E., Kim, J.H., Kim, J.G., Kim, P., Kim, H.A., Park, W.Y.,
Son, B.S., Shin, D., Shim, A.S., Yang, W., Yu, S.D., Lee, K.H., Lee, K.J., Lee, S.D., Lee, J.W., Lee, C.K., Jang, B.K., Choi, K., Han, D.H., Hwang, M.Y. & Lee, J.H. (2012) Korea National Survey for Environmental Pollutants in the human body 2008: 1-hydroxypyrene, 2-naphthol, and cotinine in urine of the Korean population. Environ Res, 118, 25-30.
't Mannetje, A., Coakley, J., Bates, M., Borman, B. & Douwes, J. (2013)
Concentrations of Selected Persistent Organic Pollutants (POPs) in the Serum of New Zealanders. Technical Report No. 34. A report for the Ministry of Health, Wellington. Prepared by the Centre for Public Health Research (CPHR), Massey University, Wellington.
Tagne-Fotso, R., Leroyer, A., Howsam, M., Dehon, B., Richeval, C. & Nisse, C.
(2016) Current sources of lead exposure and their relative contributions to the blood lead levels in the general adult population of Northern France: The IMEPOGE Study, 2008-2010. J Toxicol Environ Health A, 79, 245-265.
Taylor, M.P., Winder, C. & Lanphear, B.P. (2014) Australia's leading public health
body delays action on the revision of the public health goal for blood lead exposures. Environ Int, 70, 113-117.

131 | P a g e
Usuda, K., Kono, K., Shimbo, Y., Fujihara, M., Fujimoto, K., Kawano, A., Kono, R., Tsuji, H., Tanida, E., Imanishi, M., Fukuda, C., Suzuki, S. & Tanaka, H. (2007) Urinary fluoride reference values determined by a fluoride ion selective electrode. Biol Trace Elem Res, 119, 27-34.
Vine, M.F., Hulka, B.S., Margolin, B.H., Truong, Y.K., Hu, P.C., Schramm, M.M.,
Griffith, J.D., McCann, M. & Everson, R.B. (1993) Cotinine concentrations in semen, urine, and blood of smokers and nonsmokers. Am J Public Health, 83, 1335-1338.
Wang, L., Wu, Y., Zhang, W. & Kannan, K. (2013) Characteristic profiles of urinary p-
hydroxybenzoic acid and its esters (parabens) in children and adults from the United States and China. Environ Sci Technol, 47, 2069-2076.
WHO (2011) Cadmium. Safety evaluation of certain food additives and contaminants
(prepared by the 73rd meeting of the Joint FAO/WHO Expert Committee on Food Additives (JECFA)). WHO Food Addtive Series: 64. Geneva: World Health Organization.
WHO (2016) Arsenic: Fact Sheet.
http://www.who.int/mediacentre/factsheets/fs372/en/. Xue, J., Wu, Q., Sakthivel, S., Pavithran, P.V., Vasukutty, J.R. & Kannan, K. (2015)
Urinary levels of endocrine-disrupting chemicals, including bisphenols, bisphenol A diglycidyl ethers, benzophenones, parabens, and triclosan in obese and non-obese Indian children. Environ Res, 137, 120-128.
Zelenka, M.P., Barr, D.B., Nicolich, M.J., Lewis, R.J., Bird, M.G., Letinski, D.J.,
Metcalf, S.W. & O'Lone, R.B. (2011) A weight of evidence approach for selecting exposure biomarkers for biomonitoring. Biomarkers, 16, 65-73.
Zhang, L., Jiang, D.G., Sui, H.X., Wu, P.G., Liu, A.D., Yang da, J., Liu, Z.P., Song, Y.
& Li, N. (2016) Dietary Exposure to Benzyl Butyl Phthalate in China. Biomed Environ Sci, 29, 365-373.

132 | P a g e
Appendix 1. Study materials 1.1- Adult invitation letter 1.2- Children invitation letter 1.3- Children School invitation letter 2.1- Adult Reply form 2.2- Children Reply form 3.1- Children Information Sheet 3.2- Children Parent information sheet 3.3- Adult information sheet 4.1- Adult Letter with instructions for sample collection 4.2- Children Letter with instructions for sample collection 5.1- Adult Instructions for urine collection 5.2- Children Instructions for urine collection 6.1- Adult consent form 6.2- Children consent form 7.1- Adult consent form storage future use 7.2- Children consent form storage future use 8.1- Adult Questionnaire 8.2- Children questionnaire 9.1- Adult clinical form 9.2- Children clinical form

133 | P a g e
1.1- Adult invitation letter

134 | P a g e
1.2- Children invitation letter

135 | P a g e
1.3- Children School invitation letter

136 | P a g e
2.1- Adult Reply form

137 | P a g e
2.2- Children Reply form
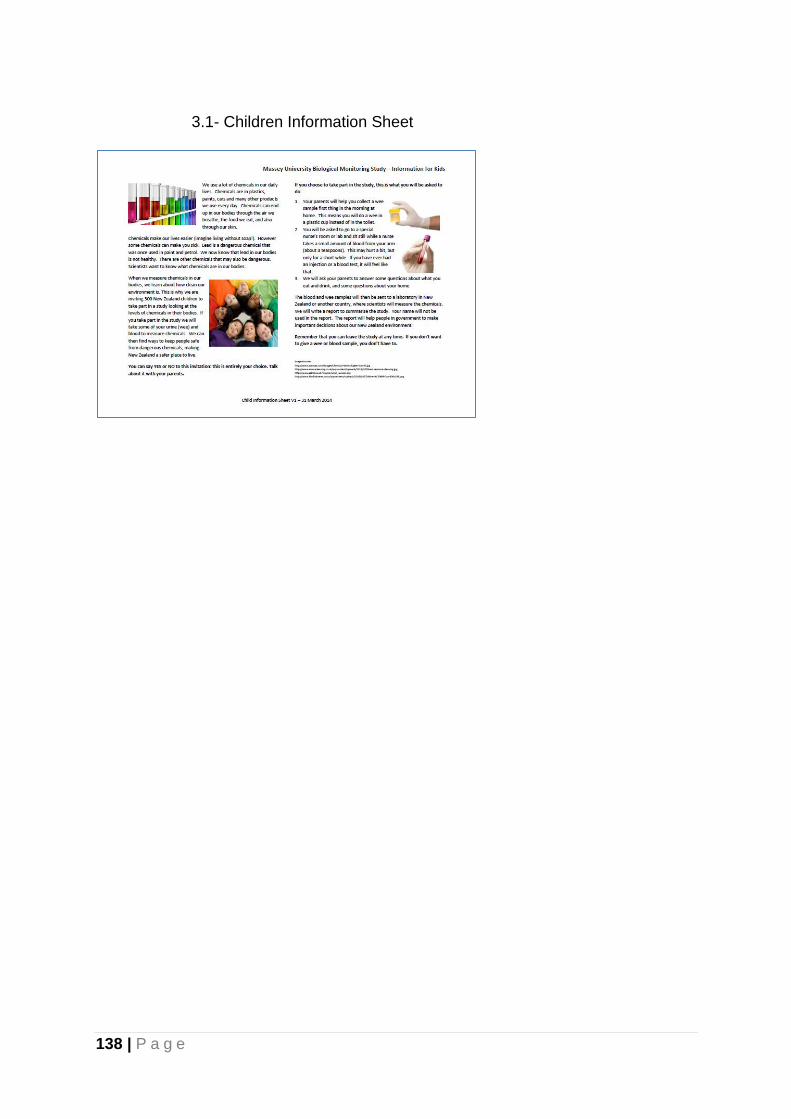
138 | P a g e
3.1- Children Information Sheet

139 | P a g e
3.2- Children Parent information sheet
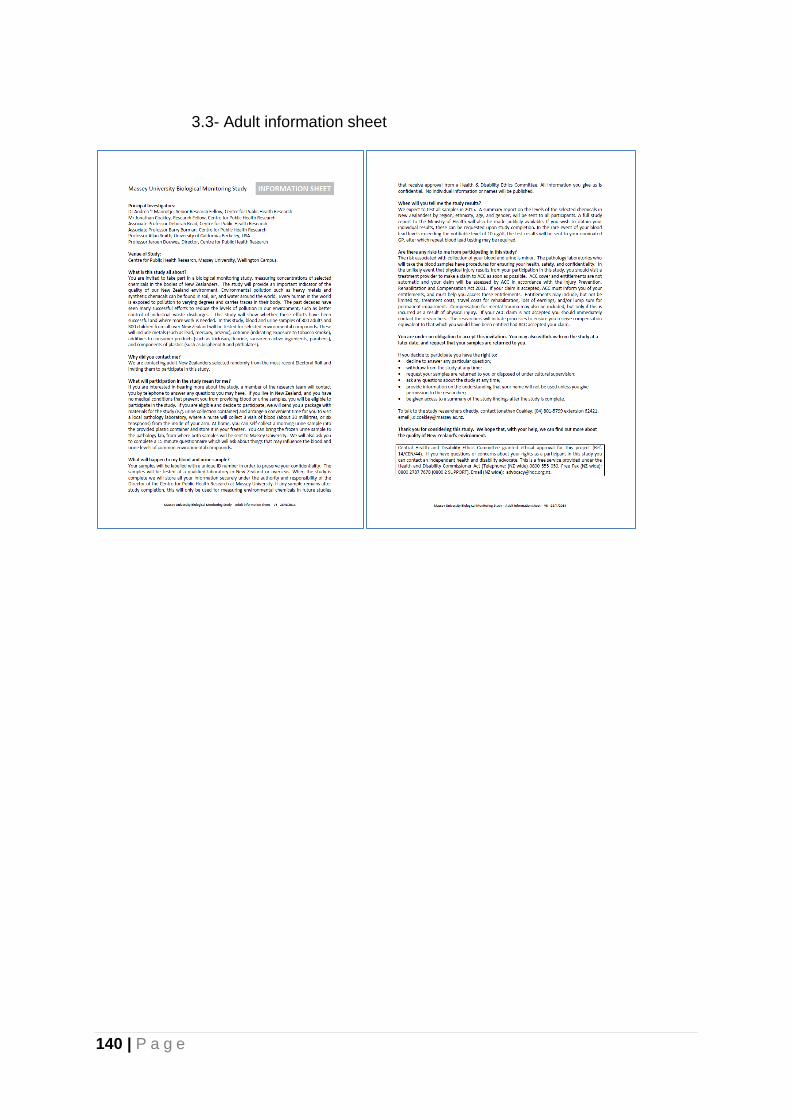
140 | P a g e
3.3- Adult information sheet
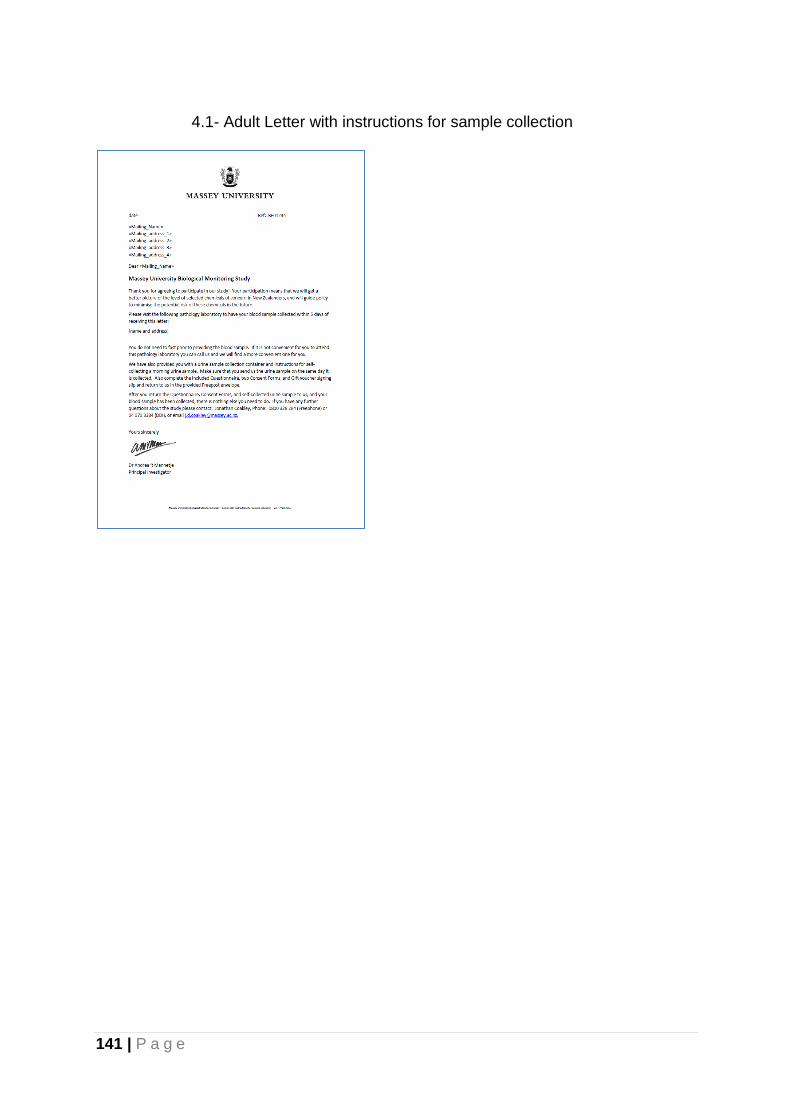
141 | P a g e
4.1- Adult Letter with instructions for sample collection

142 | P a g e
4.2- Children Letter with instructions for sample collection

143 | P a g e
5.1- Adult Instructions for urine collection
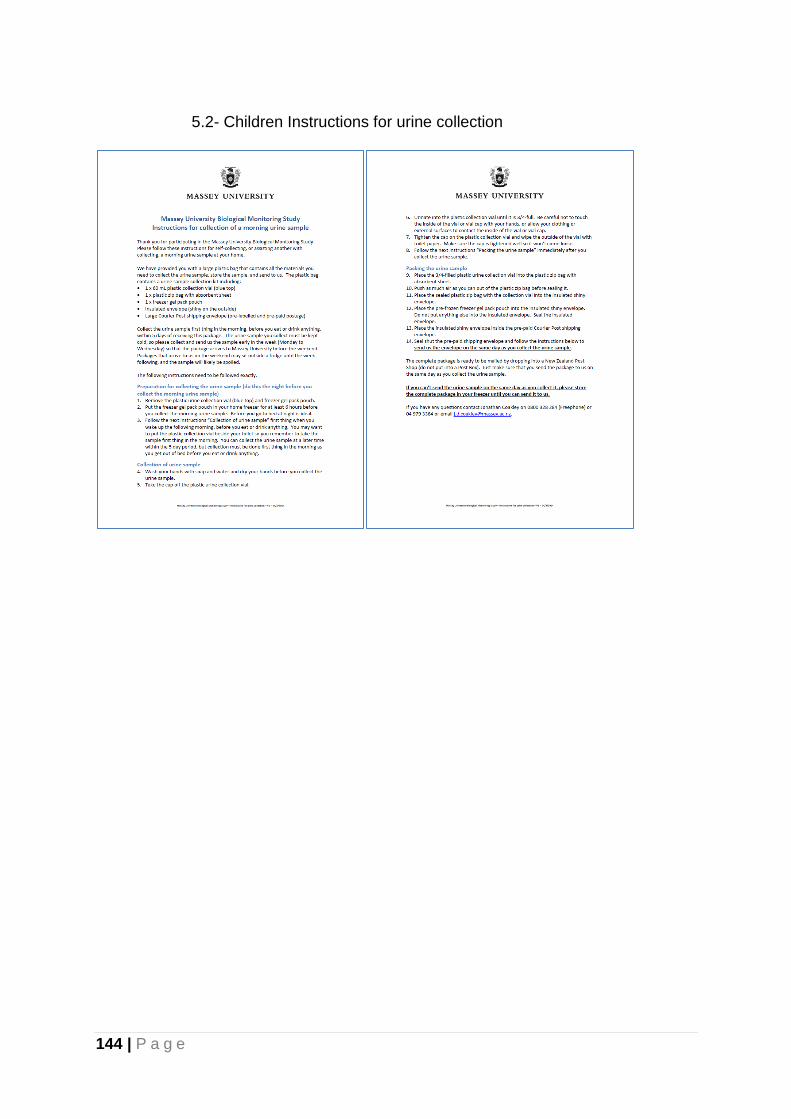
144 | P a g e
5.2- Children Instructions for urine collection

145 | P a g e
6.1- Adult consent form

146 | P a g e
6.2- Children consent form
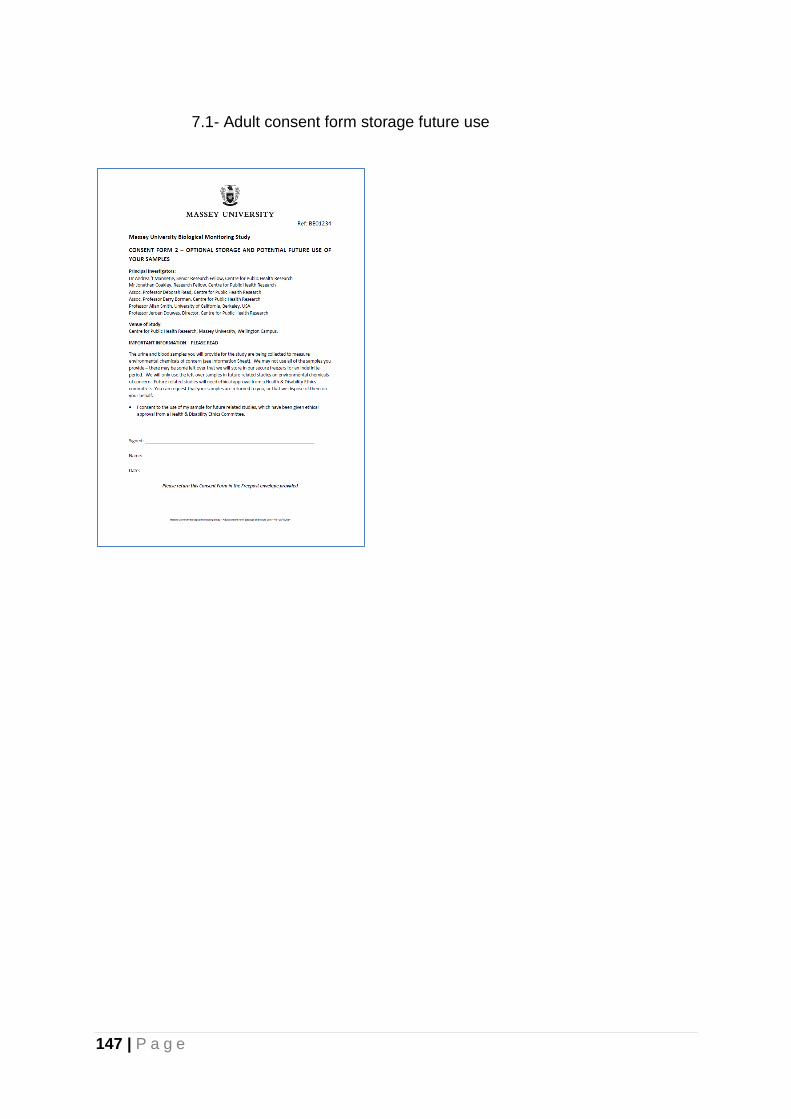
147 | P a g e
7.1- Adult consent form storage future use

148 | P a g e
7.2- Children consent form storage future use

149 | P a g e
8.1- Adult Questionnaire

150 | P a g e

151 | P a g e
8.2- Children questionnaire
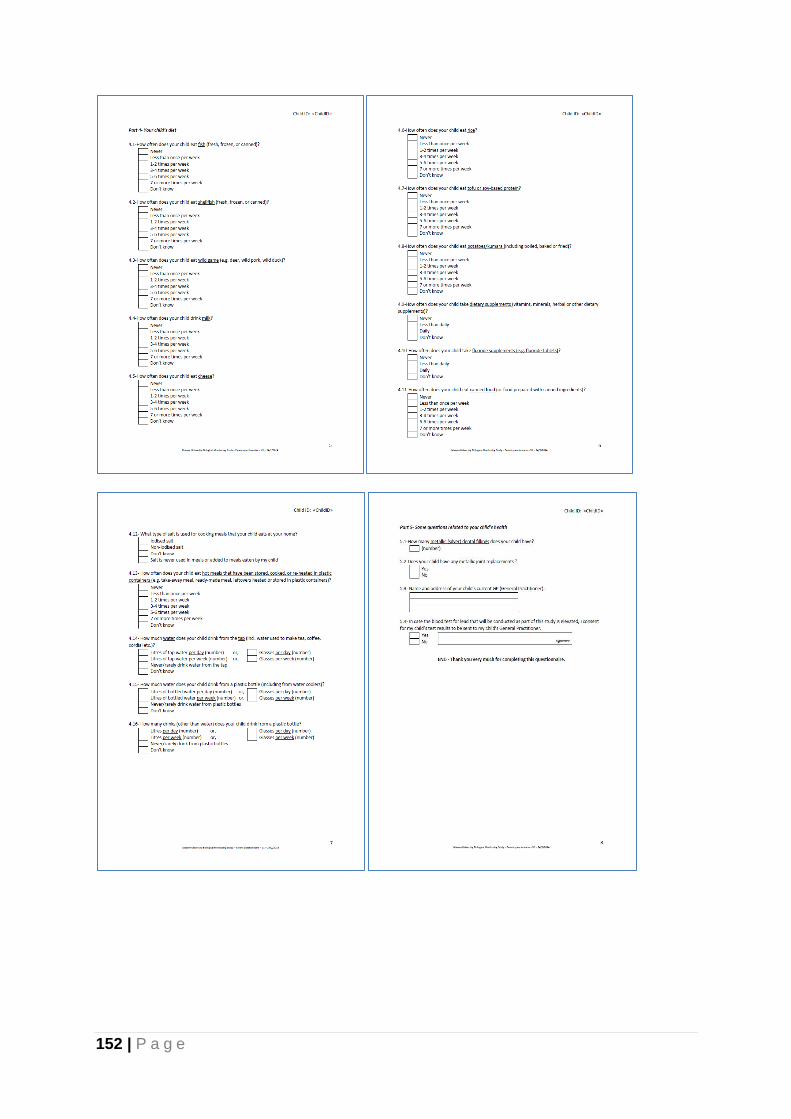
152 | P a g e
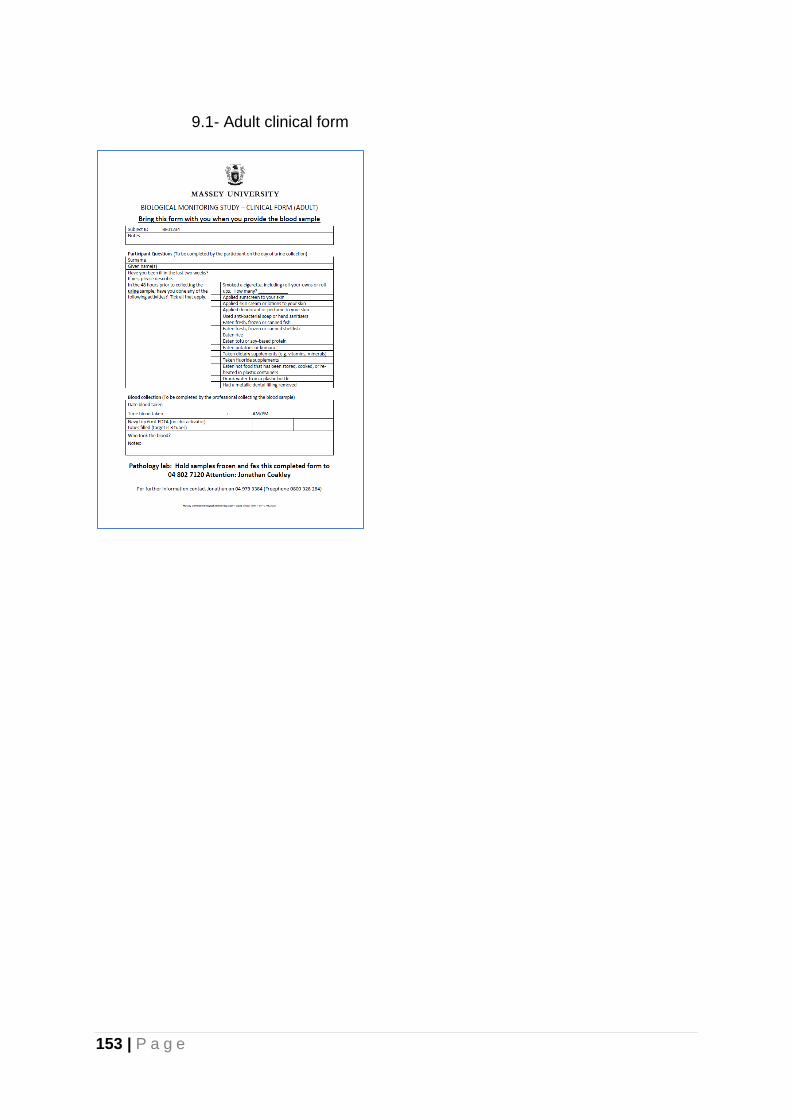
153 | P a g e
9.1- Adult clinical form
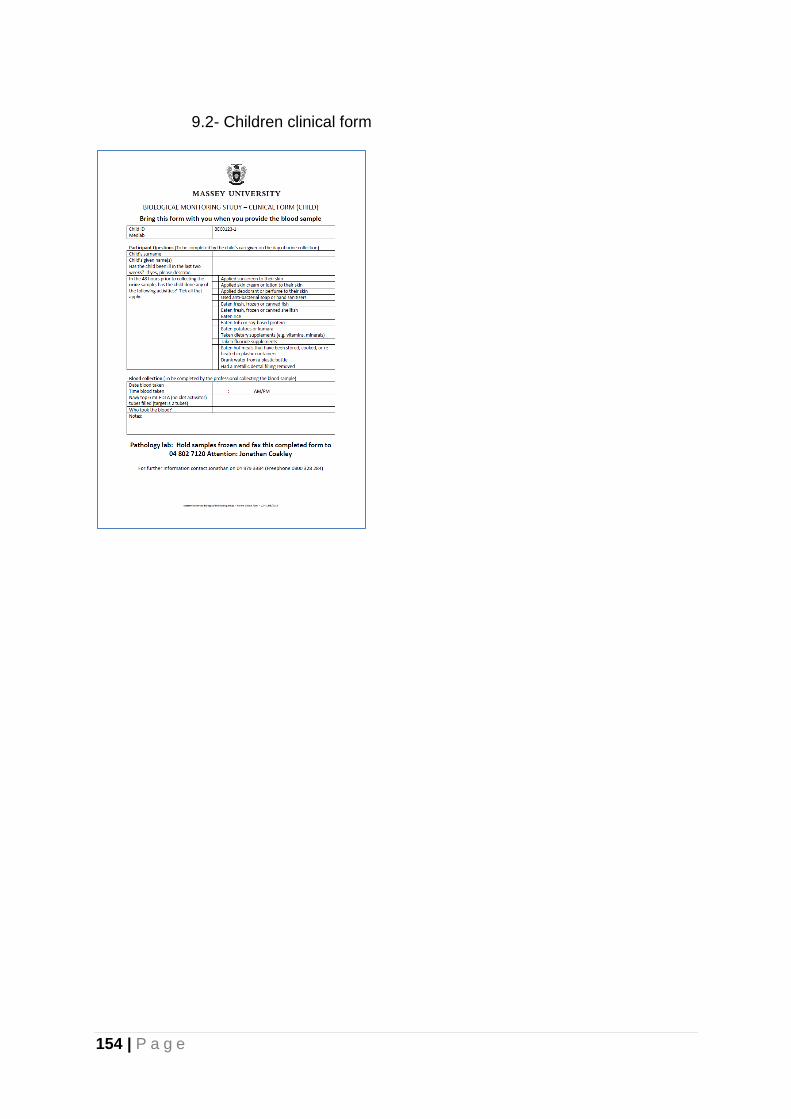
154 | P a g e
9.2- Children clinical form
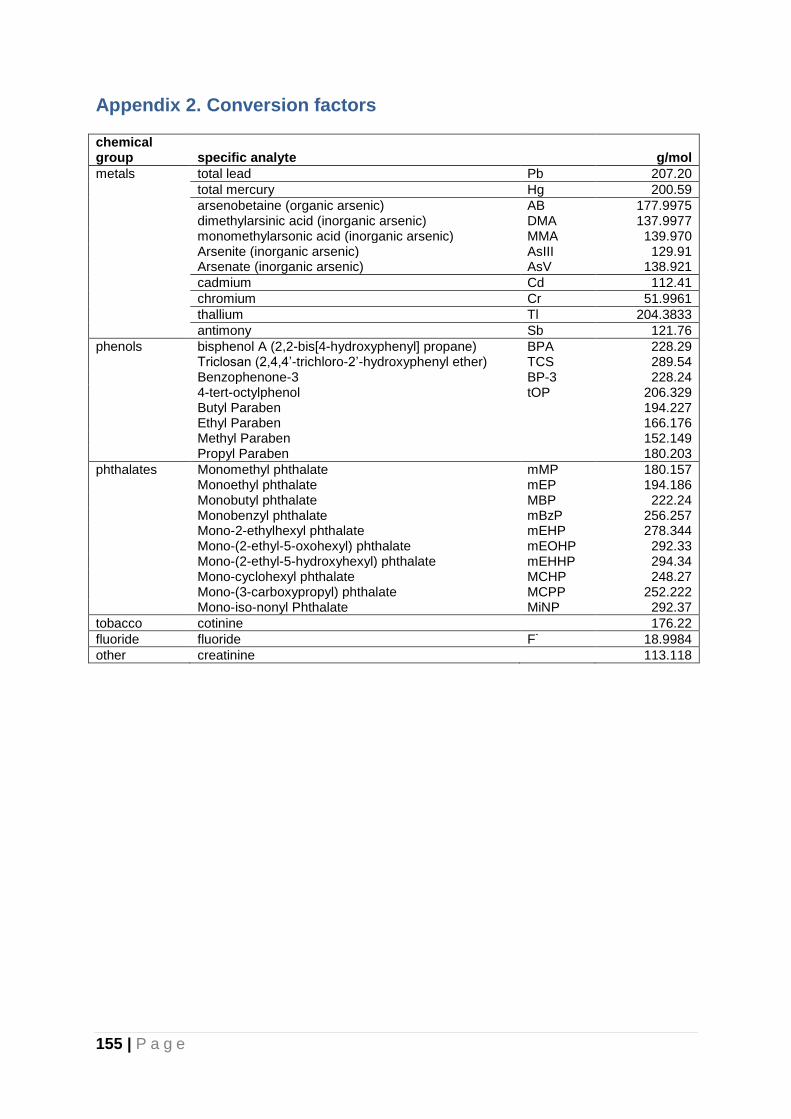
155 | P a g e
Appendix 2. Conversion factors chemical group specific analyte
g/mol
metals total lead Pb 207.20
total mercury Hg 200.59
arsenobetaine (organic arsenic) AB 177.9975
dimethylarsinic acid (inorganic arsenic) DMA 137.9977
monomethylarsonic acid (inorganic arsenic) MMA 139.970
Arsenite (inorganic arsenic) AsIII 129.91
Arsenate (inorganic arsenic) AsV 138.921
cadmium Cd 112.41
chromium Cr 51.9961
thallium Tl 204.3833
antimony Sb 121.76
phenols bisphenol A (2,2-bis[4-hydroxyphenyl] propane) BPA 228.29
Triclosan (2,4,4’-trichloro-2’-hydroxyphenyl ether) TCS 289.54
Benzophenone-3 BP-3 228.24
4-tert-octylphenol tOP 206.329
Butyl Paraben
194.227
Ethyl Paraben
166.176
Methyl Paraben
152.149
Propyl Paraben
180.203
phthalates Monomethyl phthalate mMP 180.157
Monoethyl phthalate mEP 194.186
Monobutyl phthalate MBP 222.24
Monobenzyl phthalate mBzP 256.257
Mono-2-ethylhexyl phthalate mEHP 278.344
Mono-(2-ethyl-5-oxohexyl) phthalate mEOHP 292.33
Mono-(2-ethyl-5-hydroxyhexyl) phthalate mEHHP 294.34
Mono-cyclohexyl phthalate MCHP 248.27
Mono-(3-carboxypropyl) phthalate MCPP 252.222
Mono-iso-nonyl Phthalate MiNP 292.37
tobacco cotinine 176.22
fluoride fluoride F- 18.9984
other creatinine 113.118

156 | P a g e
Appendix 3. Results for creatinine and specific gravity Table A3.1. Urinary creatinine in g/L (adults).
n
n< LOD
GM g/L 95% CI
(R2) p-value
all all 304 0 1.25 1.17 1.34 (0.244)
age 19-24 53 0 1.56 1.33 1.83
25-34 65 0 1.57 1.40 1.76
35-49 83 0 1.26 1.10 1.44
50-64 103 0 0.96 0.86 1.07 <0.0001
gender male 140 0 1.56 1.43 1.69
female 164 0 1.03 0.94 1.14 <0.0001
ethnicity Māori 115 0 1.27 1.13 1.42
non-Māori 189 0 1.24 1.13 1.35 0.205
region Northland/Auckland 67 0 1.24 1.06 1.45
Waikato/BoP 84 0 1.43 1.25 1.64
lower North Island 78 0 1.21 1.06 1.37
South Island 75 0 1.12 0.99 1.26 0.109
95%CI: 95% confidence interval of the geometric mean; R2: R-squared of the multivariate linear regression model; *:p<0.05
Table A3.2. Urinary creatinine in g/L (children)
n
n< LOD
GM g/L 95% CI
(R2) p-value
all all 300 0 1.16 1.09 1.23 (0.124)
age 5-7 64 0 0.97 0.86 1.07
8-10 120 0 1.03 0.95 1.11
11-18 116 0 1.40 1.25 1.55 <0.0001
gender male 144 0 1.21 1.09 1.32
female 156 0 1.12 1.02 1.21 0.089
ethnicity Māori 87 0 1.23 1.07 1.38
non-Māori 213 0 1.13 1.05 1.21 0.133
region Northland/Auckland 50 0 1.42 1.23 1.60
Waikato/BoP 48 0 1.23 0.95 1.50
lower North Island 172 0 1.07 1.00 1.15
South Island 30 0 1.13 0.95 1.32 0.140
95%CI: 95% confidence interval of the geometric mean; R2: R-squared of the multivariate linear regression model; *:p<0.05
Figure A3.1. Geometric means and 95% Confidence Intervals of urinary creatinine in g/L (y axis), by age group (x axis).
0.0
0.2
0.4
0.6
0.8
1.0
1.2
1.4
1.6
1.8
2.0
5-7 8-10 11-18 19-24 25-34 35-49 50-64

157 | P a g e
Table A3.3. Urinary specific gravity (adults)
n
n< LOD AM 95% CI
(R2) p-value
all all 304 0 1.018 1.017 1.018 (0.136)
age 19-24 53 0 1.019 1.017 1.021
25-34 65 0 1.019 1.018 1.021
35-49 83 0 1.018 1.016 1.019
50-64 103 0 1.016 1.015 1.017 0.027
gender male 140 0 1.020 1.019 1.021
female 164 0 1.016 1.015 1.017 <0.0001
ethnicity Māori 115 0 1.018 1.017 1.019
non-Māori 189 0 1.017 1.016 1.018 0.159
region Northland/Auckland 67 0 1.017 1.016 1.019
Waikato/BoP 84 0 1.019 1.018 1.020
lower North Island 78 0 1.018 1.016 1.019
South Island 75 0 1.016 1.015 1.018 0.744
95%CI: 95% confidence interval of the arithmetic mean; R2: R-squared of the multivariate linear regression model; *:p<0.05
Table A3.3. Urinary specific gravity (children)
n
n< LOD AM 95% CI
(R2) p-value
all all 300 0 1.020 1.020 1.021 (0.024)
age 5-7 64 0 1.021 1.020 1.022
8-10 120 0 1.020 1.019 1.021
11-18 116 0 1.020 1.019 1.021 0.810
gender male 144 0 1.021 1.020 1.022
female 156 0 1.020 1.019 1.021 0.106
ethnicity Māori 87 0 1.021 1.020 1.022
non-Māori 213 0 1.020 1.019 1.021 0.144
region Northland/Auckland 50 0 1.021 1.019 1.022
Waikato/BoP 48 0 1.020 1.018 1.022
lower North Island 172 0 1.020 1.019 1.021
South Island 30 0 1.022 1.020 1.024 0.481
95%CI: 95% confidence interval of the arithmetic mean; R2: R-squared of the multivariate linear regression model; *:p<0.05
Figure A3.2. Arithmetic means and 95% Confidence Intervals of urinary specific gravity (y axis), by age group (x axis).
1.010
1.012
1.014
1.016
1.018
1.020
1.022
1.024
5-7 8-10 11-18 19-24 25-34 35-49 50-64