Embed Size (px)
Citation preview

PEBS Internal Deliverable DB-1
Technical Note:
Report on the Detailed Design of China-Mock-Up Experiment
BRIUG: Ju Wang, Yuemiao Liu, Xingguang Zhao November 18th 2010
Beijing Research Institute of Uranium Geology, CNNC
PEBS Project. Technical Note. PEBS Internal Deliverable DB-1
PEBS Project. Technical Note. PEBS Internal Deliverable DB-1
1
CONTENTS
1. Background .......................................................................................... 1
2. Description of China-Mock-Up design ................................................. 1
2.1 Preparation of compacted bentonite blocks and pellets ............... 2
2.2 Thermal properties of compacted bentonite blocks ...................... 4
2.3 Sensor types ................................................................................ 7
3. Future actions .................................................................................... 14
PEBS Project. Technical Note. PEBS Internal Deliverable DB-1
1
1. Background
A bentonite-based material is often proposed or considered as a possible
buffer/backfill material for the isolation of high-level radioactive waste (HLW). In
order to study the behavior of the GMZ-bentonite under simulative repository
conditions, a Mock-Up called China-Mock-Up has been proposed according to the
preliminary concept of HLW repository in China since 2009. The China-Mock-Up is
used to evaluate the key thermo-hydro-mechanical-chemical (THMC) processes of
bentonite, it will be performed in the laboratory of Beijing Research Institute of
Uranium Geology (BRIUG). The test is intended to evaluate key THMC processes
taking place in the compacted GMZ-bentonite blocks during the early phase of HLW
disposal system, and to provide a reliable database for numerical modeling and
further investigations.
2. Description of China-Mock-Up design
The China-Mock-Up has been constructed with compacted bentonite blocks in a
large steel tank with 900 mm internal diameter and 2200 mm height. An electric
heater of 300 mm diameter and 1600 mm length, which is made by the same
stainless carbon steel as the substitute of a real HLW container is placed inside the
bentonite-buffer. The bentonite blocks will be heated by the heater from ambient
temperature to 90°C and then cooled down. The groundwater flow will be simulated
by injecting the formation water (taken from the host granite rock in the Beishan site,
NW China) around the outer surface of the barrier. It is expected that complex THM-
C processes will occur in the bentonite-buffer, which will be monitored by a number
of sensors to be installed at various locations in the buffer. The main parameters to
be measured in the EBS include temperature, water inflow, relative humidity
(suction), swelling and total pressure, as well as displacement of the heater inside
the buffer.
The China-Mock-Up with a vertical configuration is composed of eight
components, namely compacted bentonite blocks, steel tank, heater and
corresponding temperature control system, hydration system, sensors, gas
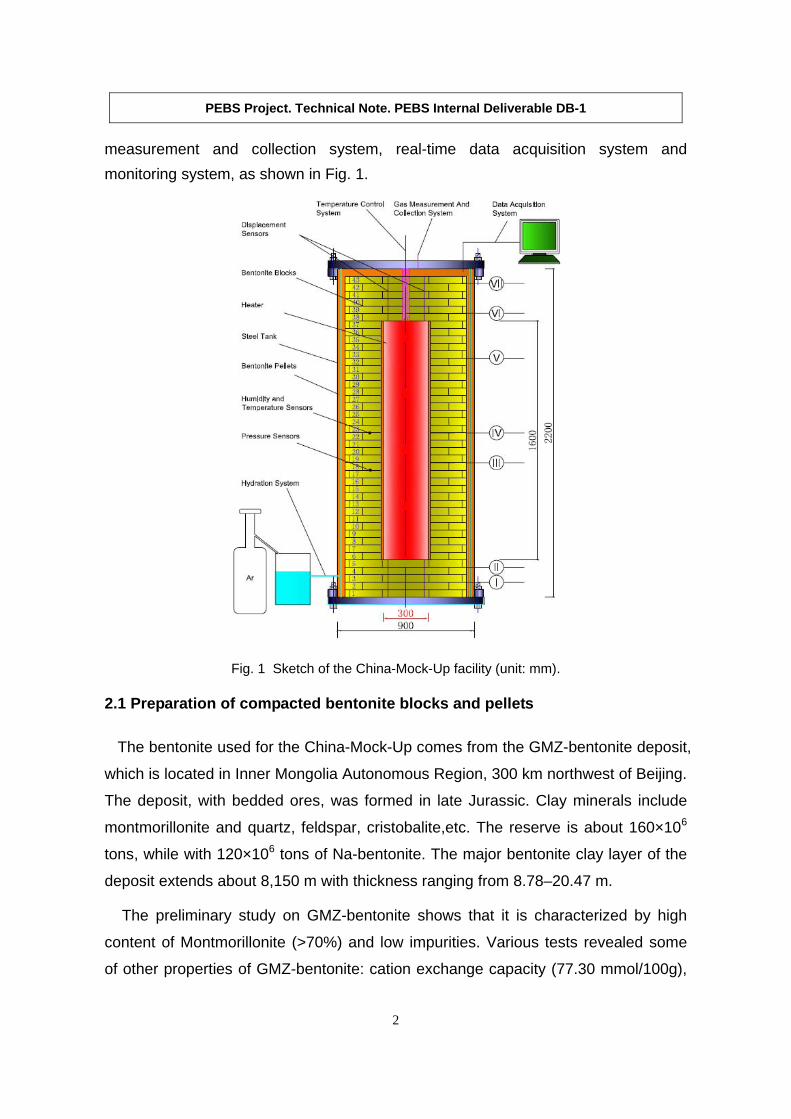
PEBS Project. Technical Note. PEBS Internal Deliverable DB-1
2
measurement and collection system, real-time data acquisition system and
monitoring system, as shown in Fig. 1.
Fig. 1 Sketch of the China-Mock-Up facility (unit: mm).
2.1 Preparation of compacted bentonite blocks and pellets
The bentonite used for the China-Mock-Up comes from the GMZ-bentonite deposit,
which is located in Inner Mongolia Autonomous Region, 300 km northwest of Beijing.
The deposit, with bedded ores, was formed in late Jurassic. Clay minerals include
montmorillonite and quartz, feldspar, cristobalite,etc. The reserve is about 160×106
tons, while with 120×106 tons of Na-bentonite. The major bentonite clay layer of the
deposit extends about 8,150 m with thickness ranging from 8.78–20.47 m.
The preliminary study on GMZ-bentonite shows that it is characterized by high
content of Montmorillonite (>70%) and low impurities. Various tests revealed some
of other properties of GMZ-bentonite: cation exchange capacity (77.30 mmol/100g),
PEBS Project. Technical Note. PEBS Internal Deliverable DB-1
3
Methylene blue exchange capacity 102 (mmol/100g) and alkali index (1.14). The
properties of the compacted bentonite at dry density 1.8g/cm3 are: thermal
conductivity (around 1.0 W/(m·K) at a water content of 8.6%), hydraulic conductivity
(1×10-13 m/s), and swelling pressure (10 MPa, at full saturation). Those figures have
shown that GMZ-bentonite is a suitable buffer/backfill material.
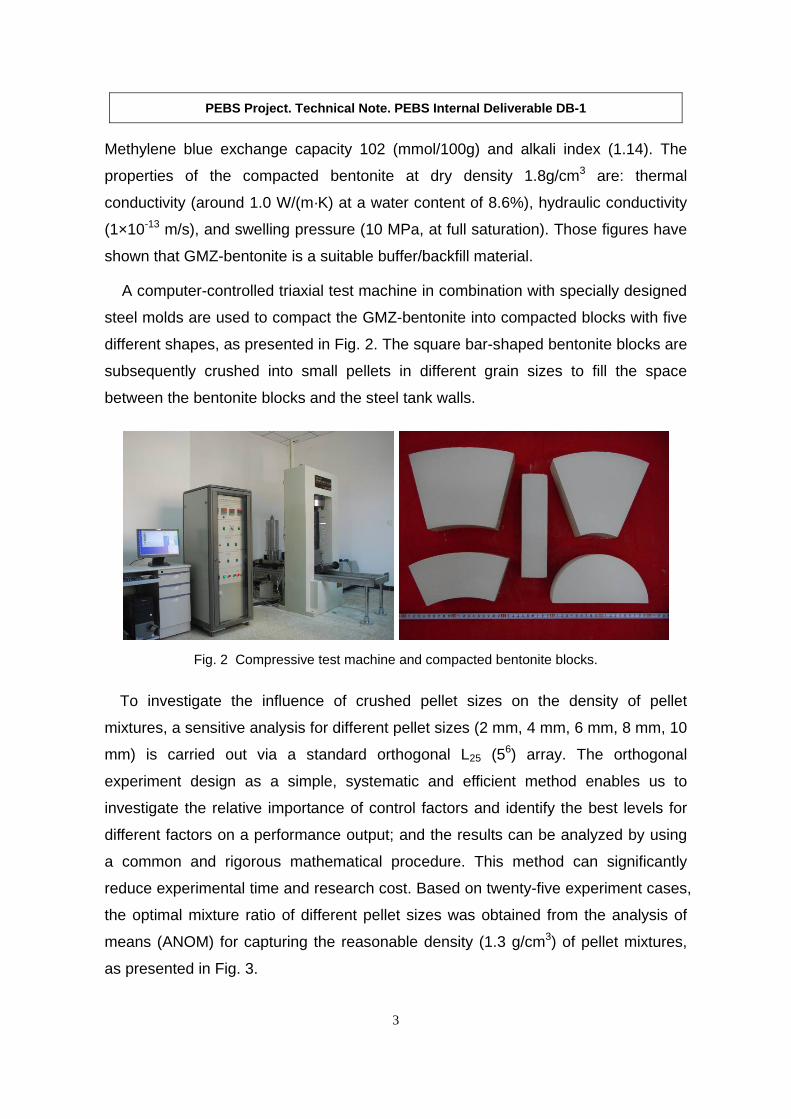
A computer-controlled triaxial test machine in combination with specially designed
steel molds are used to compact the GMZ-bentonite into compacted blocks with five
different shapes, as presented in Fig. 2. The square bar-shaped bentonite blocks are
subsequently crushed into small pellets in different grain sizes to fill the space
between the bentonite blocks and the steel tank walls.
Fig. 2 Compressive test machine and compacted bentonite blocks.
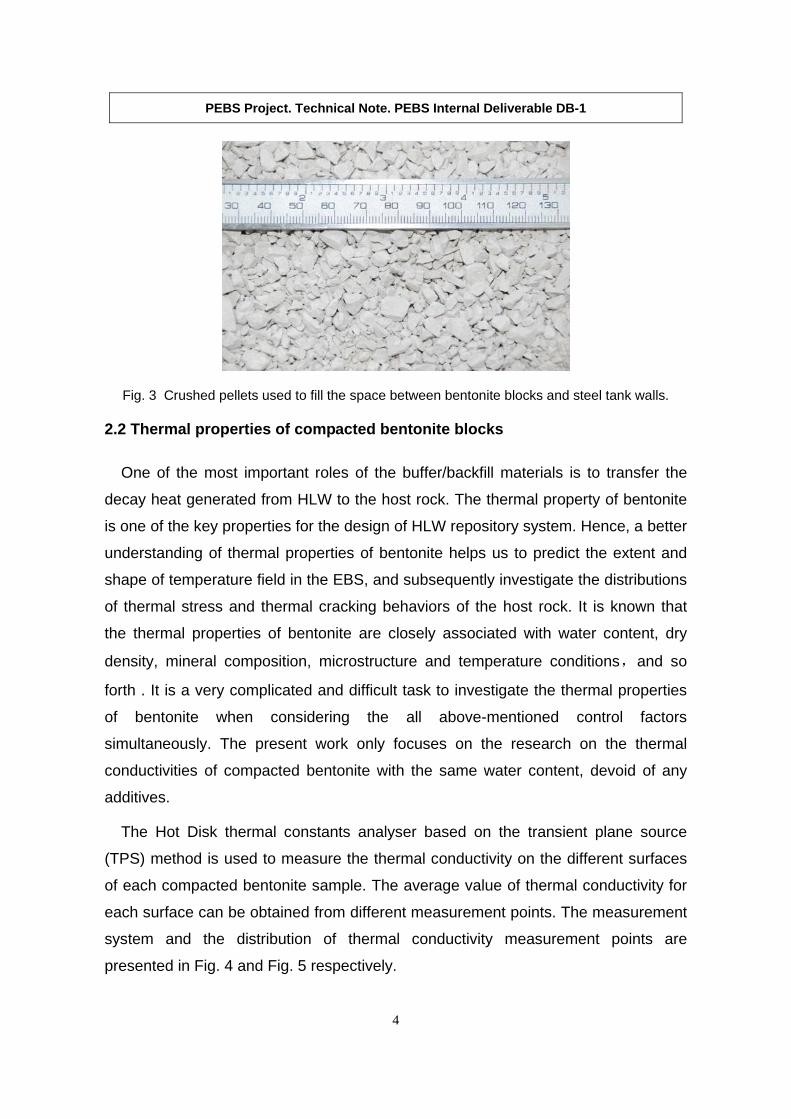
To investigate the influence of crushed pellet sizes on the density of pellet
mixtures, a sensitive analysis for different pellet sizes (2 mm, 4 mm, 6 mm, 8 mm, 10
mm) is carried out via a standard orthogonal L25 (56) array. The orthogonal
experiment design as a simple, systematic and efficient method enables us to
investigate the relative importance of control factors and identify the best levels for
different factors on a performance output; and the results can be analyzed by using
a common and rigorous mathematical procedure. This method can significantly
reduce experimental time and research cost. Based on twenty-five experiment cases,
the optimal mixture ratio of different pellet sizes was obtained from the analysis of
means (ANOM) for capturing the reasonable density (1.3 g/cm3) of pellet mixtures,
as presented in Fig. 3.
PEBS Project. Technical Note. PEBS Internal Deliverable DB-1
4
Fig. 3 Crushed pellets used to fill the space between bentonite blocks and steel tank walls.
2.2 Thermal properties of compacted bentonite blocks
One of the most important roles of the buffer/backfill materials is to transfer the
decay heat generated from HLW to the host rock. The thermal property of bentonite
is one of the key properties for the design of HLW repository system. Hence, a better
understanding of thermal properties of bentonite helps us to predict the extent and
shape of temperature field in the EBS, and subsequently investigate the distributions
of thermal stress and thermal cracking behaviors of the host rock. It is known that
the thermal properties of bentonite are closely associated with water content, dry
density, mineral composition, microstructure and temperature conditions,and so
forth . It is a very complicated and difficult task to investigate the thermal properties
of bentonite when considering the all above-mentioned control factors
simultaneously. The present work only focuses on the research on the thermal
conductivities of compacted bentonite with the same water content, devoid of any
additives.
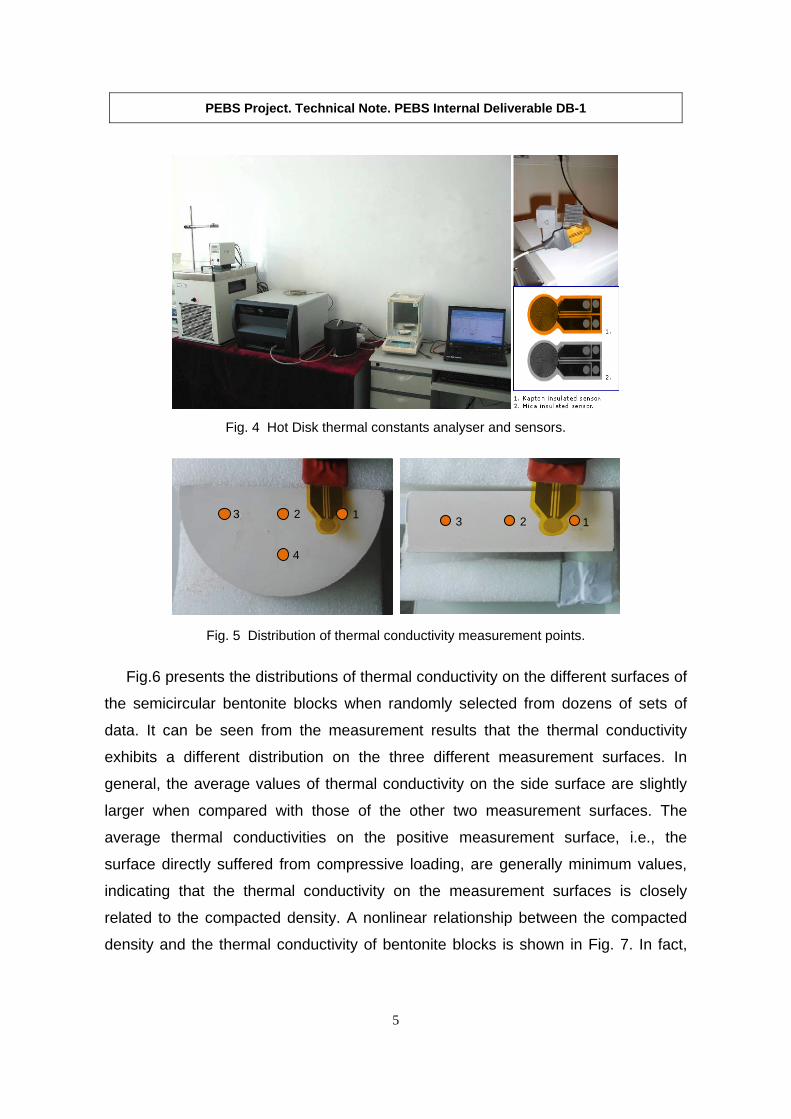
The Hot Disk thermal constants analyser based on the transient plane source
(TPS) method is used to measure the thermal conductivity on the different surfaces
of each compacted bentonite sample. The average value of thermal conductivity for
each surface can be obtained from different measurement points. The measurement
system and the distribution of thermal conductivity measurement points are
presented in Fig. 4 and Fig. 5 respectively.
PEBS Project. Technical Note. PEBS Internal Deliverable DB-1
5
Fig. 4 Hot Disk thermal constants analyser and sensors.
Fig. 5 Distribution of thermal conductivity measurement points.
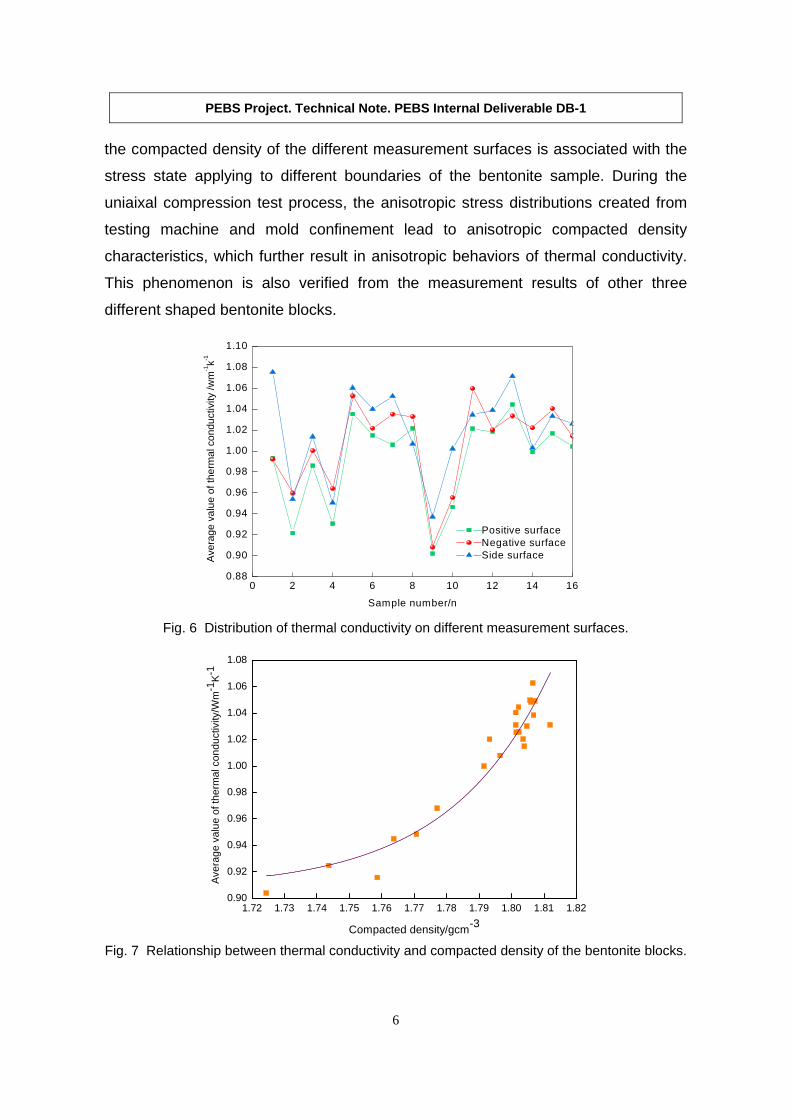
Fig.6 presents the distributions of thermal conductivity on the different surfaces of
the semicircular bentonite blocks when randomly selected from dozens of sets of
data. It can be seen from the measurement results that the thermal conductivity
exhibits a different distribution on the three different measurement surfaces. In
general, the average values of thermal conductivity on the side surface are slightly
larger when compared with those of the other two measurement surfaces. The
average thermal conductivities on the positive measurement surface, i.e., the
surface directly suffered from compressive loading, are generally minimum values,
indicating that the thermal conductivity on the measurement surfaces is closely
related to the compacted density. A nonlinear relationship between the compacted
density and the thermal conductivity of bentonite blocks is shown in Fig. 7. In fact,
3 1 22 3 1
4
PEBS Project. Technical Note. PEBS Internal Deliverable DB-1
6
the compacted density of the different measurement surfaces is associated with the
stress state applying to different boundaries of the bentonite sample. During the
uniaixal compression test process, the anisotropic stress distributions created from
testing machine and mold confinement lead to anisotropic compacted density
characteristics, which further result in anisotropic behaviors of thermal conductivity.
This phenomenon is also verified from the measurement results of other three
different shaped bentonite blocks.
Fig. 6 Distribution of thermal conductivity on different measurement surfaces.
1.72 1.73 1.74 1.75 1.76 1.77 1.78 1.79 1.80 1.81 1.820.90
0.92
0.94
0.96
0.98
1.00
1.02
1.04
1.06
1.08
Ave
rag
e v
alu
e o
f the
rma
l co
nd
uct
ivity
/Wm
-1K
-1
Compacted density/gcm-3
Fig. 7 Relationship between thermal conductivity and compacted density of the bentonite blocks.
0 2 4 6 8 10 12 14 160.88
0.90
0.92
0.94
0.96
0.98
1.00
1.02
1.04
1.06
1.08
1.10
Positive surfaceNegative surfaceSide surfaceA
vera
ge v
alu
e of
the
rmal
co
ndu
ctiv
ity /w
m-1k-1
Sample number/n

PEBS Project. Technical Note. PEBS Internal Deliverable DB-1
7
2.3 Sensor types
The China-Mock-Up is equipped with 9 different types of sensors to monitor the
comprehensive performances of GMZ Na-bentonite under coupled THMC conditions.
The 5 sensor types inside the China-Mock-Up include stress sensor, hydraulic
pressure sensor, LVDT displacement sensor, temperature sensor and RH sensor. In
addition, a series of metal corrosion samples are placed inside the bentonite blocks
and crushed pellets to investigate the influence of internal environment of the Mock-
up on metal corrosion behaviors. Another 4 sensor types consisting of Coriolis mass
flowmeter, fiber Bragg grating (FBG) strain/temperature sensor, resistance strain
gauge and dial gauge are located outside the Mock-up. Measurements based on the
9 types of sensors are mainly carried out at seven measurement profiles located
from the top to the bottom of the Mock-up vertical model (see Fig.1). The overall
sensing system involved in the Mock-up is expected to provide reliable data for
numerical modeling and future design of EBS.
2.3.1 Stress sensor
Measurements of swelling stress are carried out by using electric signal stress
sensors installed in two or three different directions, i.e., x-, y- and z-directions, in
each measurement profile. Moreover, there are another three stress sensors directly
contacting with the inner top, bottom and side walls of the steel tank, respectively.
The stress sensor is capable of withstanding temperatures up to +100 °C with a
stress measurement range from 0 to 20 MPa, as shown in Fig. 8.
Fig. 8 Stress sensor.
PEBS Project. Technical Note. PEBS Internal Deliverable DB-1
8
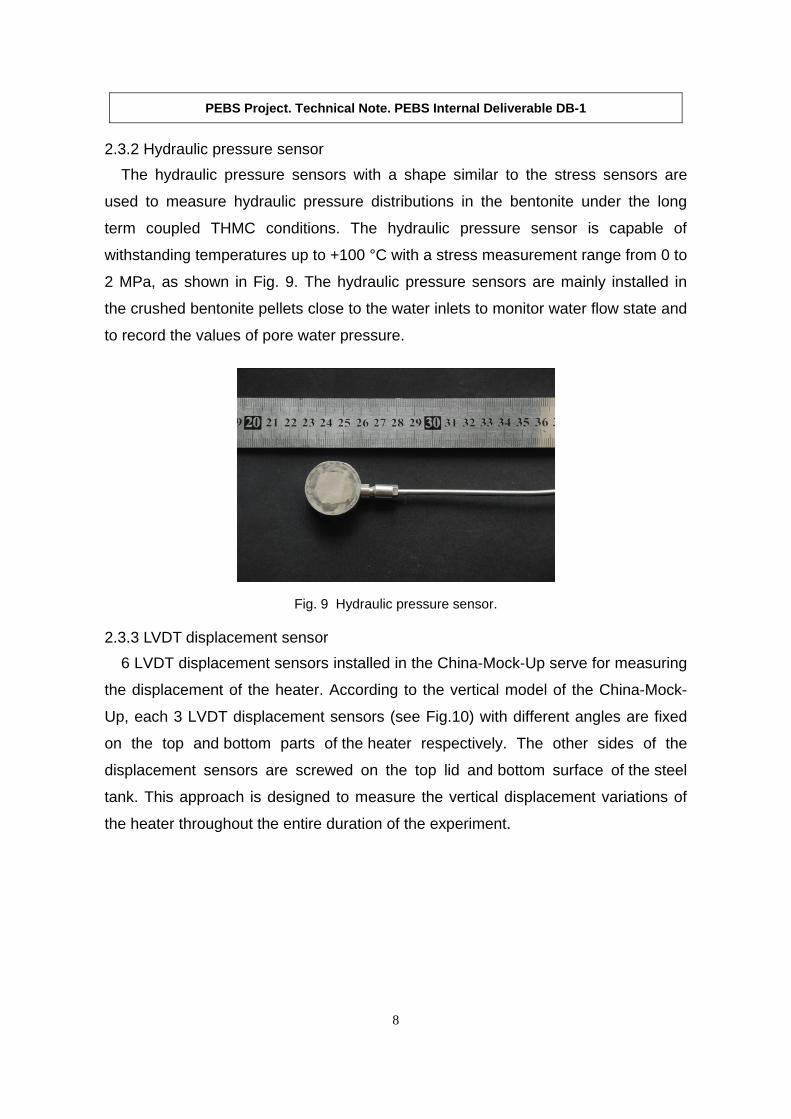
2.3.2 Hydraulic pressure sensor
The hydraulic pressure sensors with a shape similar to the stress sensors are
used to measure hydraulic pressure distributions in the bentonite under the long
term coupled THMC conditions. The hydraulic pressure sensor is capable of
withstanding temperatures up to +100 °C with a stress measurement range from 0 to
2 MPa, as shown in Fig. 9. The hydraulic pressure sensors are mainly installed in
the crushed bentonite pellets close to the water inlets to monitor water flow state and
to record the values of pore water pressure.
Fig. 9 Hydraulic pressure sensor.
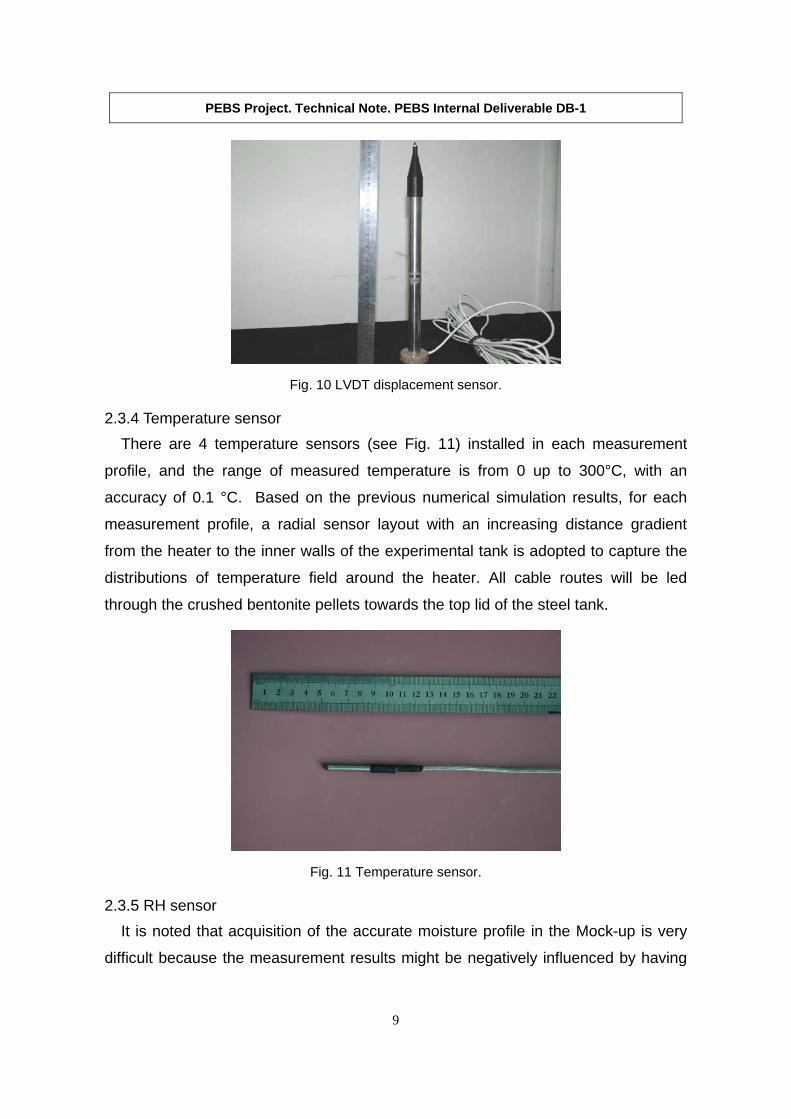
2.3.3 LVDT displacement sensor
6 LVDT displacement sensors installed in the China-Mock-Up serve for measuring
the displacement of the heater. According to the vertical model of the China-Mock-
Up, each 3 LVDT displacement sensors (see Fig.10) with different angles are fixed
on the top and bottom parts of the heater respectively. The other sides of the
displacement sensors are screwed on the top lid and bottom surface of the steel
tank. This approach is designed to measure the vertical displacement variations of
the heater throughout the entire duration of the experiment.
PEBS Project. Technical Note. PEBS Internal Deliverable DB-1
9
Fig. 10 LVDT displacement sensor.
2.3.4 Temperature sensor
There are 4 temperature sensors (see Fig. 11) installed in each measurement
profile, and the range of measured temperature is from 0 up to 300°C, with an
accuracy of 0.1 °C. Based on the previous numerical simulation results, for each
measurement profile, a radial sensor layout with an increasing distance gradient
from the heater to the inner walls of the experimental tank is adopted to capture the
distributions of temperature field around the heater. All cable routes will be led
through the crushed bentonite pellets towards the top lid of the steel tank.
Fig. 11 Temperature sensor.
2.3.5 RH sensor
It is noted that acquisition of the accurate moisture profile in the Mock-up is very
difficult because the measurement results might be negatively influenced by having

PEBS Project. Technical Note. PEBS Internal Deliverable DB-1
10
installed the sensors and cables in recessed hollows thus creating preferential paths
for water penetration. Hence, the use of RH sensors (see Fig.12) only provides with
an initial judgment on the moisture content changes in the compacted bentonite
blocks. The layout of the RH sensors complies with the similar distribution principle
of the temperature sensors in each measurement profile, monitoring the variations of
relative humidity and temperature under varied environmental conditions.
Fig. 12 RH sensor.
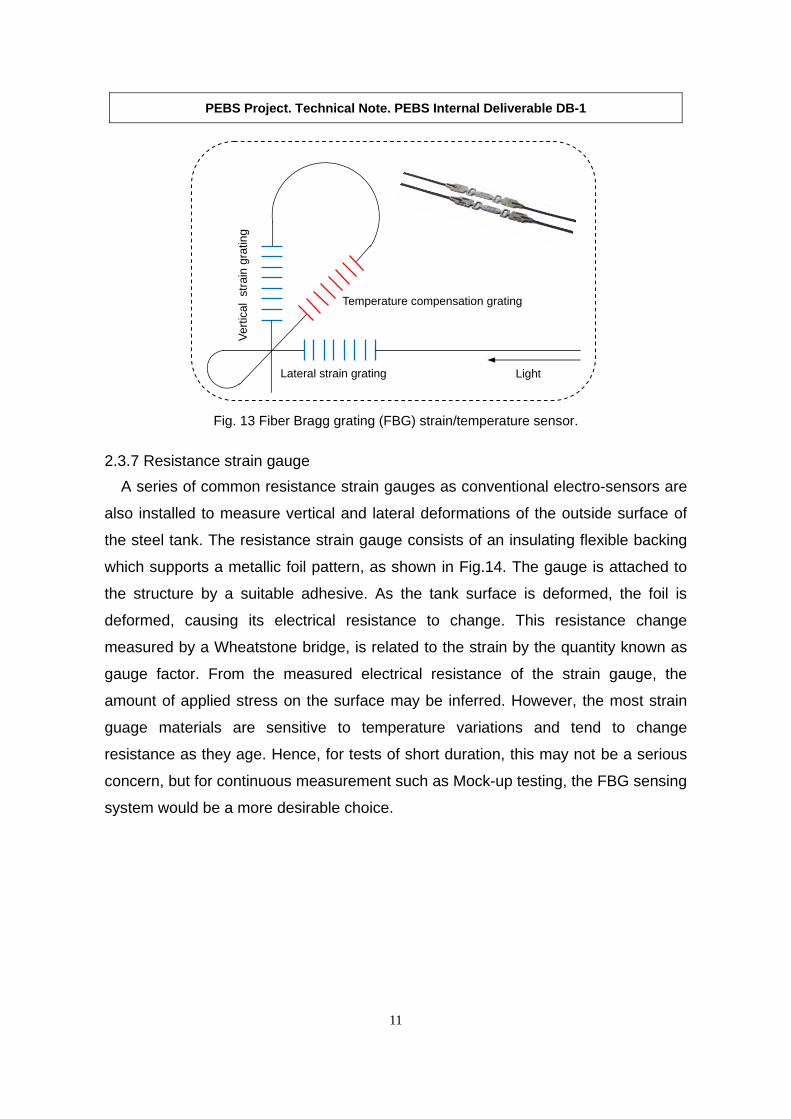
2.3.6 Fiber Bragg grating (FBG) strain/temperature sensor
As a newly developed stain/temperature measurement technique, the FBG
sensing system has been installed to monitor the long term variations of deformation
and temperature occuring on the outside surface of the steel tank due to the
generation of swelling stress and diffusing heat from the inner environment of the
facility. The FBG monitoring system is desinged to cover the overall regions of the
tank surface using a series of FBG sensor groups with a quasi-distributed
measuremnt mode. Every FBG sensor group is made up of three gratings, namely
two strain measurement gratings and one temperature compensation grating, as
presented in Fig. 13. The two strain measurement gratings welded on the tank
surface are used to monitor the changes of strain along the vertical and lateral
directions of the tank respectively, but the inclining temperature compensation
grating bonded on the tank surface is only influenced by the temperature variations
rather than mechanical effects of the steel structure. The moritoring system provides
us with an effective means to understand the characteristics of deformation of the
experimental tank, and subsequently to take necessary measures if the strain or
stress exceeds stipulated limits.
PEBS Project. Technical Note. PEBS Internal Deliverable DB-1
11
Fig. 13 Fiber Bragg grating (FBG) strain/temperature sensor.
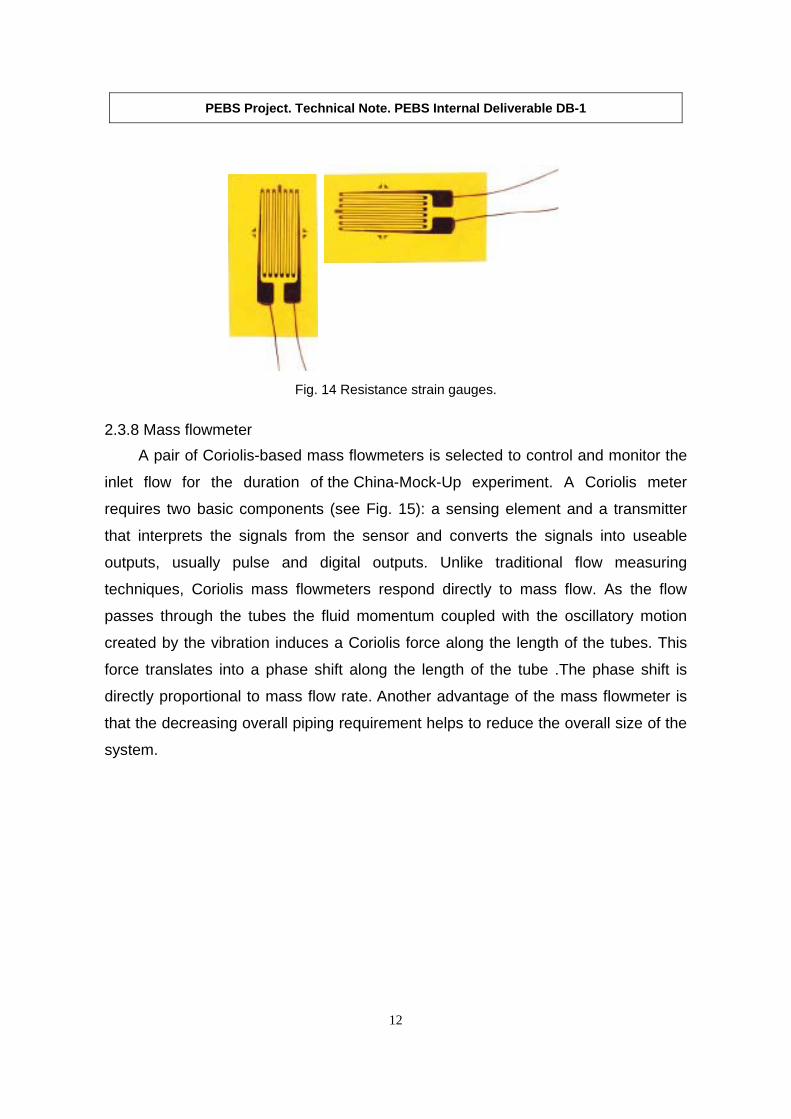
2.3.7 Resistance strain gauge
A series of common resistance strain gauges as conventional electro-sensors are
also installed to measure vertical and lateral deformations of the outside surface of
the steel tank. The resistance strain gauge consists of an insulating flexible backing
which supports a metallic foil pattern, as shown in Fig.14. The gauge is attached to
the structure by a suitable adhesive. As the tank surface is deformed, the foil is
deformed, causing its electrical resistance to change. This resistance change
measured by a Wheatstone bridge, is related to the strain by the quantity known as
gauge factor. From the measured electrical resistance of the strain gauge, the
amount of applied stress on the surface may be inferred. However, the most strain
guage materials are sensitive to temperature variations and tend to change
resistance as they age. Hence, for tests of short duration, this may not be a serious
concern, but for continuous measurement such as Mock-up testing, the FBG sensing
system would be a more desirable choice.
Lateral strain grating Light
Temperature compensation grating
Ver
tical
str
ain
grat
ing
PEBS Project. Technical Note. PEBS Internal Deliverable DB-1
12
Fig. 14 Resistance strain gauges.
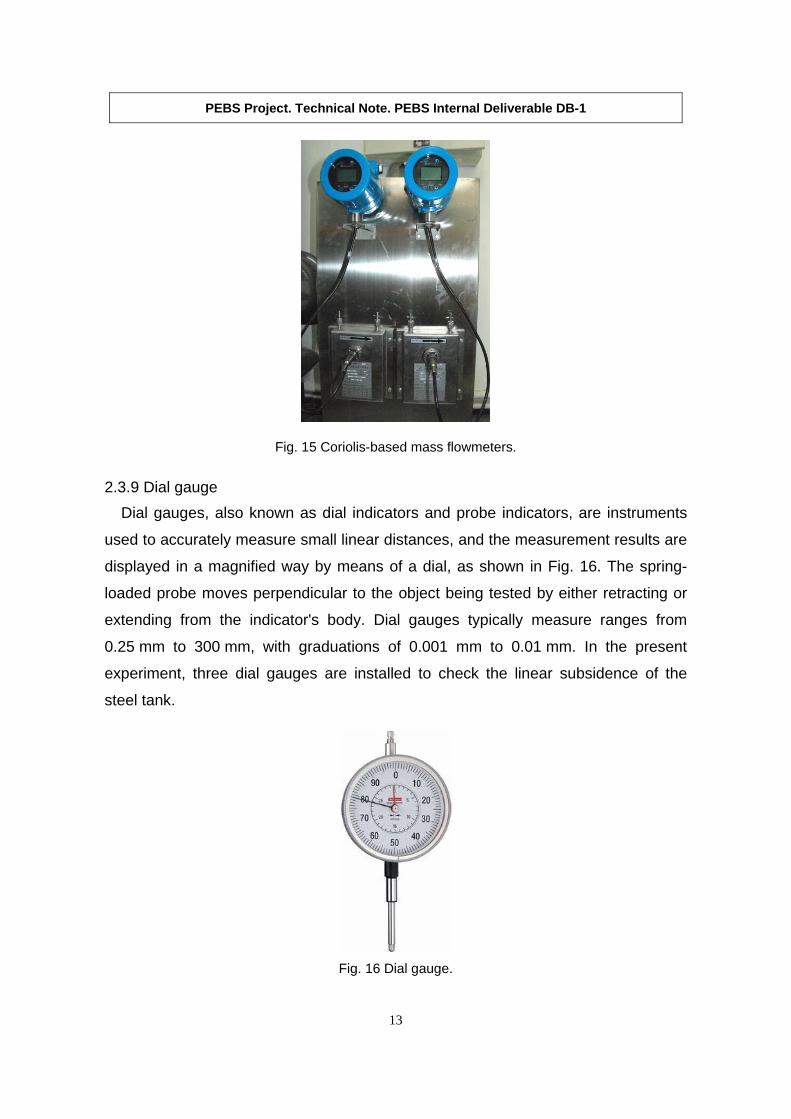
2.3.8 Mass flowmeter
A pair of Coriolis-based mass flowmeters is selected to control and monitor the
inlet flow for the duration of the China-Mock-Up experiment. A Coriolis meter
requires two basic components (see Fig. 15): a sensing element and a transmitter
that interprets the signals from the sensor and converts the signals into useable
outputs, usually pulse and digital outputs. Unlike traditional flow measuring
techniques, Coriolis mass flowmeters respond directly to mass flow. As the flow
passes through the tubes the fluid momentum coupled with the oscillatory motion
created by the vibration induces a Coriolis force along the length of the tubes. This
force translates into a phase shift along the length of the tube .The phase shift is
directly proportional to mass flow rate. Another advantage of the mass flowmeter is
that the decreasing overall piping requirement helps to reduce the overall size of the
system.
PEBS Project. Technical Note. PEBS Internal Deliverable DB-1
13
Fig. 15 Coriolis-based mass flowmeters.
2.3.9 Dial gauge
Dial gauges, also known as dial indicators and probe indicators, are instruments
used to accurately measure small linear distances, and the measurement results are
displayed in a magnified way by means of a dial, as shown in Fig. 16. The spring-
loaded probe moves perpendicular to the object being tested by either retracting or
extending from the indicator's body. Dial gauges typically measure ranges from
0.25 mm to 300 mm, with graduations of 0.001 mm to 0.01 mm. In the present
experiment, three dial gauges are installed to check the linear subsidence of the
steel tank.
Fig. 16 Dial gauge.

PEBS Project. Technical Note. PEBS Internal Deliverable DB-1
14
3. Future actions
In the next phase of this project, the experimental data based on the China-Mock-
Up experiment will be initialy analyzed. The constitutive models to describe the
bentonite behaviors under coupled THMC conditions will be developed from
theoretical analysis in combination with experimental results, and subsequently, the
China-Mock-Up will be numerically modeled to verify the constitutive models and the
computer codes to be used, such as FLAC3D, LAGAMINE and CODE-BRIGHT, for
THM processes modelling; and EQ3/6 and Crunchflow for modelling THC processes.