Embed Size (px)
Citation preview

Report to the Twenty-Fifth Legislature
Regular Session of 2010
REPORT ON THE FINDINGS AND RECOMMENDATIONS OF
EFFECTIVENESS OF THE WEST HAWAI'I REGIONAL FISHERY
MANAGEMENT AREA
Prepared by
Department of Land and Natural Resources
State of Hawai'i
In response to
Section 188F-5, Hawai`i Revised Statutes
January 2010

Page 1
REPORT ON THE FINDINGS AND RECOMMENDATIONS OF
EFFECTIVENESS OF THE WEST HAWAI'I REGIONAL FISHERY
MANAGEMENT AREA
The West Hawai′i Regional Fisheries Management Area (WHRFMA) was created by Act
306, Session Laws of Hawaii (SLH) 1998, largely in response to longstanding and
widespread conflict surrounding commercial aquarium collecting. The Act, now Chapter
188F, Hawaii Revised Statutes (HRS), required of the Department of Land and Natural
Resources (DLNR), 1) A review of the effectiveness of the WHRFMA every five years,
in cooperation with the University of Hawaii (UH), and 2) A report of its findings and
recommendations prepared by DLNR to the Legislature following the review.
The overall goals of the Act are to effectively manage fishery activities, enhance
nearshore resources and reduce conflict. Four management objectives were mandated: 1)
Prohibit aquarium collecting in a minimum of 30% of West Hawai′i coastal waters, 2)
Establish a day-use mooring buoy system, 3) Establish no-take reef fish reserves, and 4)
Designate areas which prohibit gill nets.
SUMMARY OF FINDINGS
In order to accomplish the mandates of Act 306, SLH 1998, with required substantive
community input, a community advisory group, the West Hawai′i Fisheries Council
(WHFC) was convened by DLNR's Division of Aquatic Resources (DAR) in 1998. The
first accomplishment of the WHFC was the designation of a network of nine Fish
Replenishment Areas (FRAs), comprising 35.2% of the coastline. Aquarium collecting is
prohibited within the FRAs. The FRAs became effective 31 December 1999.
Ten years after closure of the FRAs, the top 20 aquarium species showed a small overall
increase in abundance relative to the period before the FRAs were operational. Most of
the increase was attributed to the top two species Yellow Tang and Goldring Surgeonfish
(kole) which comprise 91% of the West Hawai′i aquarium catch. These species increased
in the FRAs by 57% and 13% respectively. Seven of the top 10 most collected species
(representing <6% of all collected fish) decreased in overall density. Three of these
decreases were significant (Achilles Tang, Multiband Butterflyfish and Black
Surgeonfish).
The FRAs were „effective‟ (increases in FRAs relative to long term MPAs) for eight of
the top 10 collected species with three being statistically significant. With only a single
exception, the FRAs were highly effective in increasing the abundance of Yellow Tang
within their areas spread along the West Hawai′i coastline. While habitat characteristics,
FRA size, and density of adult fishes are important factors influencing the effectiveness
of FRAs, successful recruitment of young fish is a fundamental requirement. Poor
recruitment appears to be a key factor in the population declines within the FRAs of some
aquarium species.

Page 2
The effect of the FRAs on the aquarium fishery itself has been positive overall. The
number of commercial aquarium collectors in West Hawai′i increased 19% over the past
10 years, catch increased 25%, and its value 71%. In terms of conflict reduction between
stakeholder groups, survey data indicated that for both aquarium fishers and SCUBA dive
operators, more individuals felt the FRAs were effective than not.
As a management adjunct to the FRAs, the WHFC has recommended a „white list‟ of 25
species which can be harvested by aquarium collectors. All other species would be off
limits. 12+ other species of special concern, with particular ecological and cultural
importance, were also proposed for protected (i.e. no-take) status. To prevent the
continued unbridled growth of the aquarium fishery, the WHFC has proposed the
implementation of a limited entry program for West Hawai′i, which would be the first of
its kind in state waters.
The day-use mooring buoy system is well established with limited expansion anticipated
in the near future. As part of a 10-Year Strategic Management Plan for the day-use
mooring system, the Malama Kai Foundation is working with DLNR to write and refine
objectives for the system and develop bio-physical criteria for site selection.
Somewhat delayed progress on the establishment of no-take reef fish reserves is being
realized. Educational and outreach efforts have been reinvigorated recently and survey
results indicate increasing acceptance of the utility and benefit of such marine protected
areas. Several local communities are actively engaged in developing management
recommendations which include some form of a highly protected nearshore area.
Eight no lay gill netting areas were established in West Hawai′i in 2005, comprising 25%
of the coastline (including already protected areas). Preliminary nearshore monitoring
results do not find major differences in food fish abundance in/out of the no netting areas.
The lack of a marked effect of protection may be due to several factors including the
relatively low number of lay gill nets that are presently being used (i.e. registered) in
West Hawai′i.
Although not formally established by statute, the West Hawai′i community‟s formation of
the WHFC has been, and continues to be, invaluable and instrumental in achieving the
objectives of Act 306, SLH 2008. Recent WHRFMA initiatives which are in the process
of administrative rule making include a ban on SCUBA spearfishing, species of special
concern listing and resolution of aquarium related conflict at Pebble Beach, South Kona.
Based on over a decade of experience, the WHFC has been a model system for the
resolution of issues surrounding reef fisheries resources. Based on this review, a number
of specific recommendations are proposed.
AUTHORS & CONTRIBUTORS
William Walsh, Stephen Cotton, Brent Carman, Laura Livnat, Kara Osada, Camille
Barnett, DAR, Brian Tissot, Todd Stevenson Washington State University Vancouver,
Chad Wiggins The Nature Conservancy, David Tarnas, Kater Bourdon Malama Kai
Foundation, Sara Peck UH Sea Grant College Program.

Page 3
BACKGROUND
The WHRFMA was conceived and established primarily in response to the activities of
aquarium collectors along the West Hawai'i coastline. Overall, the marine aquarium
fishery in the State of Hawai'i is one of the most economically valuable commercial
inshore fisheries with Fiscal Year (FY) 2009 reported landings of 557,673 specimens and
a total value of $1.08 million. The reported values may be underestimated by a factor of
approximately 2 to 5X (Cesar et al. 2002, Walsh et al. 2003). Walsh et al. 2003 provides
an historical overview of the commercial aquarium fishery in Hawai'i.
The aquarium collecting industry in Hawai'i and especially in West Hawai'i has long
been a subject of controversy. In contrast to other areas in the State, in West Hawai'i the
aquarium fishery has undergone substantial and sustained expansion over the past 30
years (Figure 1). Presently 75% of fish caught in the State and 67% of the total aquarium
catch value comes from the Big Island and almost exclusively from West Hawai'i (Table
1). As the number of collectors in West Hawai'i began to rise and the numbers of
animals collected increased markedly, conflict escalated along the coast, most
particularly between dive tour operators and collectors. A short-lived informal
“Gentleperson‟s Agreement” was reached in 1987 whereby aquarium collectors agreed to
refrain from collecting in certain areas. In return, charter operators agreed not to initiate
legislation opposing collecting and to cease harassment. In 1991 four of the areas from
Figure 1. Number of aquarium animals collected and number of commercial
aquarium permits in West Hawai'i for Fiscal years 1976-2009.
0
10
20
30
40
50
60
70
80
0
100,000
200,000
300,000
400,000
500,000
600,000
No
. o
f P
erm
its
No
. C
augh
t
Fiscal Year
AQ Catch
AQ Permits
FRAs established

Page 4
the Gentleperson‟s Agreement were established as the Kona Coast Fisheries Management
Area (FMA) within which aquarium collecting is prohibited (§13-58, Hawaii
Administrative Rules (HAR)).
In spite of these management efforts, controversy and conflict over aquarium collecting
continued unabated. Various meetings were held and legislative resolutions and bills
were drafted to address the issue. A 1996 House Concurrent Resolution (HCR 184)
requested DLNR, in conjunction with a citizens‟ task force, to develop a comprehensive
management plan to regulate the collection of aquarium fish. A West Hawai'i Reef Fish
Working Group (WHRFWG) involving over 70 members of the West Hawai'i community including aquarium collectors and charter operators and other stakeholders
held nine meetings over a 15 month period. The WHRFWG opened a dialog between
user groups and community members and provided a forum for the education of its
members on social and biological issues involved in resource management
Table 1. Changes in West Hawai'i aquarium fishery since implementation of the
FRAs. Dollar value is adjusted for inflation.
FY 2000 FY 2009 ∆
No. Permits 48 57 19% ↑
Total Catch 279,606 349,250 25% ↑
Total Value $745,129 $1,271,329 71% ↑
% of State Fish Catch 70% 75% 5% ↑
% of State Fish Value 67% 69% 2% ↑
% of State Total Catch 55% 63% 8% ↑
% of State Total Value 59% 67% 8% ↑
The WHRFWG identified “hot spots” along the coast where conflict over ocean
resources was especially intense and also proposed a wide range of management
recommendations, some of which were included in the 1997 DLNR legislative package.
Working directly with the people of Ho'okena and Miloli'i, DAR developed
comprehensive FMA rule proposals for each of these communities. To finally begin
investigating the biological impact of collecting, DAR also commenced a joint research
project with the University of Hawai'i-Hilo. Due in part to opposition by O'ahu aquarium
collectors, only one legislative recommendation of the WHRFWG passed; establishing
licenses for aquarium exporters. Similarly, recommendations involving the DAR FMA
rule proposals languished.
Act 306, SLH 1998
In response to the perceived lack of success in adequately dealing with aquarium
collecting, a number of citizens, including several members of the WHRFWG formed a
grassroots organization, the Lost Fish Coalition (LFC), to push for a total ban on
aquarium collecting in West Hawai'i. They collected almost 4,000 signatures on a
petition to ban such collecting. In January 1997, Representative (Rep.) Paul Whalen (R-
Kona, Ka'u) introduced legislation (House Bill (HB) 3349) which proposed an outright

Page 5
ban on all collecting between Kawaihae and Miloli'i. Shortly thereafter, Rep. David
Tarnas (D-N. Kona, S. Kohala) introduced HB 3457. This bill proposed establishing a
West Hawai'i Regional Fishery Management Area (WHRFMA) along the entire 147 mile
West Hawai'i coast (Upolu Pt. to Ka Lae) to provide for effective management of marine
resources. Among several provisions of this bill was a requirement to set aside 50% of
the WHRFMA as Fish Replenishment Areas (FRAs) where aquarium collecting was
prohibited. In February 1998, HB 3348 was put on hold. During committee hearings on
HB 3457, the 50% provision for FRAs was reduced to “a minimum of 30%.” Aquarium
collectors and other user groups endorsed the bill and it was passed by the Legislature as
Act 306, SLH 1998; effective 13 July 1998.
Given the longstanding and contentious nature of the aquarium issue in West Hawai′i, the
importance of government action in finally addressing the issue cannot be
underestimated. It was only when organized and concerted community effort was
applied directly via the legislative process that the means for resolution was made
possible. It seems highly likely that without the direct legislative mandates of Act 306,
SLH 1998, which provided DLNR with the administrative authority to manage the
fishery and region, little progress would have been made in successfully managing this
controversial fishery. However, as this report later notes, additional legislative action is
needed to provide authority to adopt a limited entry management tool.
Act 306, SLH 1998, established a West Hawai'i Regional Fishery Management Area
along the entire west coast of the Island of Hawai'i (§188F-4, HRS). Overall, the
purposes of Act 306 are to:
(1) Effectively manage fishery activities to ensure sustainability;
(2) Enhance nearshore resources;
(3) Minimize conflicts of use in this coastal area.
There were also four specific management objectives to be accomplished by DLNR:
(1) Designate a minimum of 30% of coastal waters as Fish Replenishment Areas
(FRAs) where aquarium collecting is prohibited.
(2) Establish a day-use mooring buoy system and designate some high-use areas
where no anchoring is allowed.
(3) Establish a portion of the FRAs as fish reserves where no fishing of reef-dwelling
fish is allowed.
(4) Designate areas where the use of gill nets is prohibited.
A review of the WHRFMA management plan was to be conducted every five years in
cooperation with the UH.
Additionally, Act 306, SLH 1998, also directed DLNR/DAR to identify the specific areas
and restrictions “after close consultation and facilitated dialogue with working groups of
community members and resource users” mandating “substantive involvement of the
community in resource management decisions” was a unique and key aspect of the
legislation rather than a purely “top-down” (i.e. government-driven) approach which

Page 6
specified all the details of required management actions, Act 306, SLH 1998, instead
directed the community to actively participate in the development of such actions. This
approach was at once both innovative and far-reaching.
The West Hawai'i Fisheries Council (WHFC)
In order to accomplish the mandates of Act 306, SLH 1998, with substantive community
input, The West Hawai′i Fisheries Council (WHFC) was convened June 16, 1998 under
the aegis of DLNR and the University of Hawai'i Sea Grant. Consisting of 24 voting
members and 6 ex-officio agency representatives from DLNR, Sea Grant, and the
Governor‟s Office, the WHFC‟s members represented diverse geographic areas and
various stakeholder, community and user groups in West Hawai'i. Four aquarium
representatives (three collectors and one aquarium shop owner) were members of the
WHFC, 40% of the WHFC were kanaka maoli and most of the members were previously
on the WHRFWG.
The WHFC provided the vehicle for stakeholders to participate directly in the
development of management recommendations. Such participation has important
benefits for increasing legitimacy of decisions in the eyes of stakeholders, as well as
increasing compliance with decisions and rules subsequently established (Kessler 2004).
The first mandate of Act 306 was the establishment the FRAs. FRAs were mandated to
address concerns over user conflict and localized resource depletion caused by aquarium
fish collectors in West Hawai'i. Working under a punishing deadline, the WHFC, by
determination, consensus and vote, developed an FRA plan consisting of nine separate
areas along the coast (Figure 2) encompassing a total of 35.2% of the West Hawai`i
coastline (including already protected areas). Perhaps somewhat surprisingly the areas
specifically recommended as FRAs by the aquarium collecting representatives on the
Council showed remarkable congruence with those selected by the WHFC as a whole.
The WHFC‟s FRA plan was subsequently incorporated by DLNR into administrative
rules. The 28 April 1999 public hearing on the FRA Rule (§13-60.3, HAR) was the
largest ever conducted by DAR with at least 860 attendees. The Plan received
overwhelming support (93.5% of 876 testimonies) from a wide range of community
sectors. The FRA administrative rule was signed into approval by Governor Benjamin
Cayetano on 17 December 1999 becoming effective 31 December 1999.
The FRAs prohibit all collecting of aquarium animals within their boundaries as well as
non-fishing related fish feeding. The seaward boundaries of the FRAs extend to a depth
of 100 fathoms and distinctive signs mark the boundaries on shore.
The WHFC and the FRA development process have been the focus of a number of in-
depth reports and scientific case studies (Walsh 1999, Capitini et al. 2004, Tissot 2005,
Maurin and Peck 2008, Tissot et al. 2009, Gregory 2009) making it one of the most
intensively studied community driven management efforts in the State of Hawai'i.

Page 7
In addition to the development of the FRA network the WHFC, in conjunction with DAR
and UH Sea Grant, has been successful in achieving a number of other accomplishments
(after Maurin and Peck, 2008):
Sea Urchin Limited Harvest: The WHFC developed a management plan
permitting the sustainable harvest of wana (long-spine/black sea urchin) at
Makae'o, the Old Kona Airport Marine Life Conservation District (MLCD). This
recommendation was adopted by DLNR as an administrative rule.
The West Hawai'i Youth Fisheries Council: An outreach component of the
WHFC, the Youth Fisheries Council worked with the Hawai'i County Council to
ban smoking at Kahalu'u Beach Park.
Gill Net Rules: The WHFC developed a set of gill net rule recommendations
focused on limiting impacts of large-scale commercial netting while providing for
subsistence netting (see Gill Net Section). This recommendation was adopted as
an administrative rule).
Day-Use Mooring Buoys: In collaboration with the Malama Kai Foundation, the
WHFC is a working partner in the site selection process and educates
communities on the value of day use moorings to preserve our coral reefs (See
Mooring Buoy Section).
SCUBA Spear Fishing Recommendations: The WHFC set forth a set of
recommendations to ban SCUBA spear fishing in West Hawai'i. This
recommendation was adopted by DAR and is currently in the administrative rule
making process.
Pebble Beach User Conflict: The WHFC drafted recommendations addressing a
conflict between aquarium collectors and this South Kona community. It
recommended creating a new FRA in the Pebble Beach area and opening up to
collecting a similarly sized section of another FRA (by a non-residential area).
This recommendation was adopted by DAR and is currently in the administrative
rule making process.
Species of Special Concern: Based on scientific input from DAR, the WHFC
developed a list of 25 species which can be harvested by aquarium collectors.
Several other species of special concern are to be protected from all harvesting.
This recommendation was adopted by DAR and is currently in the administrative
rule making process.
Limited Entry Aquarium Program: The WHFC recommended to DAR that
Limited Entry Rules be adopted for further management of the Aquarium
Industry. Capping the number of permitted aquarium collectors on the reef will
curtail unregulated expansion of the aquarium fishery and ensure that
participation in fishery requires a high level of skill, experience and regulatory
compliance. The rules will enhance the economic value of the reefs and their
marine life and will serve as an economic incentive to fishers to promote good
stewardship of the reefs. This recommendation, which would be the first of its
kind in state waters, has been passed on to DAR.
Informal Council Involvement: The WHFC has helped mediate between a
community group and a live aboard dive operator, to ensure minimal disruption to
the endangered Hawksbill sea turtle nesting and hatching.

Page 8
The creation and functioning of the WHFC is entirely attributable to the volunteer
commitment of time, energy and resources of its members. The 62 members of the
community who have been members at one time or another of the WHFC have
contributed nearly 5,000 hours of their own time at no cost to the State. While not
directly authorized by state law, this community-based advisory body represents a
valuable tool to state government in terms of its approach to and recommendations on
marine resource management. These efforts have been assisted by the support of
community organizations such as the Hawai′i Community Foundation, The Nature
Conservancy, Community Conservation Network and the Harold Castle Foundation, all
of whom recognize the significance and value of the WHFC and its role in assisting in
effective management of our marine resources.
West Hawai`i Aquarium Project (WHAP)
Although Act 306, SLH 1998, mandated review and evaluation (thus monitoring) of the
FRAs in conjunction with the UH, no funding was provided to accomplish this. In order
to investigate the effectiveness of the FRAs to replenish depleted fish stocks, a
consortium of researchers established the West Hawai'i Aquarium Project (WHAP) in
early 1999. Funding was secured for the early years of the project through the Hawai'i Coral Reef Initiative Research Program (HCRI-RP), a federal initiative under the aegis of
the National Oceanic and Atmospheric Administration (NOAA). Subsequent funding has
been provided by Coral Reef Monitoring Grants under NOAA‟s Coral Reef Conservation
Program. The initial project researchers were Dr. Brian Tissot, Washington State
University, Dr. William Walsh, DAR/DLNR and Dr. Leon Hallacher, University of
Hawai'i-Hilo. They have been joined in recent years by Dr. Ivor Williams, National
Marine Fisheries Service, Dr. Mark Hixon, Oregon State University and Dr. Helen Fox,
World Wildlife Fund.
WHAP established 23 study sites (Figure 2) along the West Hawai'i coastline in early
1999 at 9 FRA sites, 8 open sites (aquarium fish collection areas) and 6 previously
established Marine Protected Areas (MPAs) to collect baseline data both prior to and
after the closure of the FRAs. The MPAs are MLCDs and Fishery Management Areas
(FMAs), which have been closed to aquarium collecting for at least 9 years and were
presumed to have close to “natural” levels of aquarium fish abundances. They serve as a
reference or „control‟ to compare with the FRAs and open areas.
The overall goals of WHAP were two-fold: 1) To evaluate the effectiveness of the FRA
network by comparing targeted aquarium fishes in FRAs and open areas relative to
adjacent control sites and, 2) To evaluate the impact of the FRA network on the
aquarium fishery.
Detailed explanations of the study sites and survey methodology are contained in Tissot
et al. 2004 and Division of Aquatic Resources 2004. To briefly summarize: Densities of
all fish and selected invertebrate species are visually estimated along four 25X4m strip
transects at each of 23 permanent sites in the three types of management areas. All survey
divers either have extensive experience in conducting underwater fish surveys in Hawai'i

Page 9
or received training through the UH‟s Quantitative Underwater Ecological Survey
Techniques (QUEST) training course prior to collecting data (Hallacher and Tissot,
1999). In addition to the transect surveys, a 10 minute „free-swim‟ survey is also
Figure 2. Locations of Fish Replenishment Areas (FRAs) in West Hawai'i and DAR
monitoring sites (6 MPAs, 9 FRAs and 8 open sites).
conducted by two divers in the areas surrounding the actual transects. The purpose of
this survey is to better census uncommon or rare species and species of particular
ecological interest such as taape, roi, terminal phase parrotfish, cleaner wrasses and
crown-of-thorns starfish. All sites are surveyed at least four times a year. As of
December 2009, a total of 55 survey rounds of all study sites have been completed
(>5,000 transects). Six rounds were conducted prior to FRA closure in 1999.

Page 10
The general rationale for WHAP‟s goals was based on the premise that changes in FRAs
and open areas can best be estimated by comparing them to other areas which have been
protected for relatively long periods of time. These areas (MPAs) serve as control areas
against which the FRAs are measured both before and after the closure of the FRAs.
This rationale is derived from a well-known statistical procedure known as the BACI
(Before-After-Control-Impact) procedure (Tissot et al, 2004) which is an appropriate and
statistically powerful method for examining FRA effectiveness.
The BACI procedure attempts to take into account changes that may be affecting the
ecosystem but are unrelated to the workings of the FRAs. For example, there could be
several years of widespread and plentiful recruitment of aquarium fish to the reefs of
West Hawai′i. The numbers of fish would thus increase in the FRAs (as well as other
areas) over time, but the increase in a particular FRA may not have anything to do with it
being protected from aquarium collecting. Instead, the increase in fish could just be the
result of favorable ocean currents or more food available during the fish‟s offshore larval
stage which results in more young fish recruiting to the reefs. The BACI procedure
separates out these factors by comparing the FRAs (or open areas) to control areas which
serve as reference points to gauge change.
For this study FRA effectiveness (R) is measured statistically as the change in the
difference between each FRA and the mean of all MPA sites during each survey (control
vs. impact) from before (1991-2000) vs. after (2007-2009) FRA establishment. Details
on this procedure are covered in (Tissot et al, 2004, Division of Aquatic Resources 2004).
R measures the changes within the FRA as a percent of the baseline abundance relative to
control sites. In the case of this study, R is a measure of the effectiveness or „protective
value‟ of the FRAs. That is, what effect is increased protection having on targeted fish?
Scientific studies on reef fishes are notoriously difficult due to the very high variability of
fish abundance in both time and space. Even with a rigorous statistical design (such as
BACI) and 11 years of study, it is difficult to statistically detect changes in abundances
except for the most common species that exhibit relatively large changes.
FINDINGS AND EVALUATION
Fish Replenishment Areas (FRAs)
The overall changes in fish abundance and effectiveness of the FRAs are shown in Table
2. Young-of-Year (YOY) fishes (i.e. newly settled/recruited) are not included in analyses
since their initial abundance is not directly related to aquarium collecting. The top 20
aquarium fishes in general have shown only a minor, nonsignificant increase and most of
the increase is attributable to the two most heavily collected species, the Yellow Tang
and Goldring Surgeonfish (Table 3). These two species account for 91% of total fish
catch over the last five years (Appendix A) and thus are key indicators of the protective
value of the FRAs and the sustainability of the aquarium fishery.

Page 11
Table 2. Overall FRA effectiveness for fishes. ‘Before’ = Mean of 1999-2000;
‘After’= Mean of 2007-2009. YOY not included.
GROUP MEAN DENSITY
(NO/100M2)
OVERALL%
CHANGE IN
DENSITY R
Before After
Top 20 aquarium species 64.75 66.38 +3% 0.80 +6% 0.57
Aquarium fishes w/o Yellow Tang 52.01 46.43 -11% 0.27 -17% 0.02
Non-aquarium fishes 70.10 113.95 +63% <0.01 +95% 0.03 Bold = statistically significant at ≤ 0.05
Changes for the ten most collected aquarium fishes across all FRAs are shown in Table 3.
Yellow Tang density increased markedly (and significantly) in the FRAs while seven of
10 decreased (Achilles Tang, Multiband Butterflyfish and Brown Surgeonfish decreased
significantly). These seven species represent <6% of the total West Hawai′i aquarium
catch (Appendix A).
The FRAs were „effective‟ (increases in FRAs relative to long term MPAs) for eight of
the top 10 collected species with three being statistically significant. As with density
there were significant decreases in effectiveness for the Multiband Butterflyfish and
Brown Surgeonfish. Both of these species are not very heavily collected averaging
<2000 individuals per year over the last 5 years (Appendix A) and are fairly abundant on
the reef. It‟s thus not clear why their numbers are declining in the FRAs. These two
species exhibited overall declines in all three types of areas with the greatest decrease in
the protected areas (FRAs and MPAs). For the Brown Surgeonfish this may be the result
of a competitive interaction with Yellow Tang and/or Goldring Surgeonfish. As their
numbers have increased the Brown Surgeonfish‟s has decreased. Both Yellow Tang and
Brown Surgeonfish are herbivore browsers with quite similar diets (Jones 1968). In a
possibly similar relationship Barlow (1974) found the numbers of Brown Surgeonfish
and manini (Acanthurus triostegus) to be negatively correlated and this was attributed to
the aggressive dominance of the Brown Surgeonfish.
Table 3. Overall FRA effectiveness for the top ten most aquarium collected fishes.
‘Before’ = Mean of 1999-2000; ‘After’ = Mean of 2007-2009. YOY not included.
COMMON NAME SCIENTIFIC NAME MEAN DENSITY
(NO/100M2)
OVERALL%
CHANGE IN
DENSITY R
Before After
Yellow Tang Zebrasoma flavescens 12.73 19.95 +57% 0.01 +77% <0.01
Goldring Surgeonfish Ctenochaetus strigosus 28.38 32.01 +13% 0.23 +83% 0.39

Page 12
Achilles Tang Acanthurus achilles 0.26 0.05 -81% 0.01 +2% 0.09
Clown Tang Naso lituratus 0.81 0.59 -27% 0.10 +2% 0.37
Black Surgeonfish Ctenochaetus hawaiiensis 0.18 0.16 -12% 0.77 +3% 0.41
Longnose and Forcepsfish Forcipiger spp. 0.64 0.84 +32% 0.13 +4% 0.03
Multiband Butterflyfish Chaetodon multicinctus 5.20 3.49 -33% 0.02 -5% <0.01
Brown Surgeonfish Acanthurus nigrofuscus 8.58 4.06 -53% 0.03 -26% 0.01
Orangeband Surgeonfish Acanthurus olivaceus 0.13 0.10 -20% 0.63 +3% 0.45
Ornate Wrasse Halichoeres ornatissimus 0.94 0.65 -31% 0.08 +2% 0.14 Bold = statistically significant at ≤ 0.05
With only a single exception all of the FRAs have proven to be effective (positive R
value) in enhancing Yellow Tang stocks (Figure 3). Seven of the eight increases were
statistically significant. The single FRA which was ineffective was Waiakailio Bay in
North Kohala (Appendix B). This FRA had very low Yellow Tang recruitment
throughout the study period and additionally the area may have been impacted by a
sedimentation event in October 2006 on nearby reefs.
An examination of multiple factors associated with effective FRAs (Tissot et al., 2003)
found that habitat quality, FRA size (especially reef width) and density of adult fishes are
associated with significant recovery of fish stocks. Of particular importance are areas of
high finger coral (Porites compressa) cover which is critical habitat for juvenile Yellow
Tang and other fishes (Walsh, 1987). Live coral cover at Waiakailio declined 17%
between 1999 and 2007 (DAR unpublished data).
The overall average changes in Yellow Tang abundance in the three management areas
are shown in Figure 4. Yellow Tang exhibited a delayed increase in abundance in all
areas following a strong recruitment year in 2002. Relatively low recruitment in 5 of the
7 following years resulted in subsequent downward trends in all areas. Even with low
recruitment in 6 of the past 11 years the number of adult Yellow Tang has increased by
57% in the FRAs since they were established (Table 3).

Page 13
Figure 3. Effectiveness of individual FRAs to replenish Yellow Tangs, 1999-2009.
*= Statistically significant at ≤0.05
Recent work (Claisse 2009) has shown that when Yellow Tang reach sexual maturity
they leave the deeper coral rich reef areas where they settled (and where WHAP transects
are located) for shallower reef habitat. For females this occurs at approximately 4-5
years of age and for males at age 5-7. Thus in the absence of substantial input of Young-
of-the-Year fish, (i.e. low recruitment) Yellow Tang populations will invariably decline
over time due to the emigration of mature fish in addition to natural mortality. This
apparently is what has occurred over the last six years in the protected areas. The
-100% -50% 0% 50% 100% 150% 200% 250%
Miloli′i
Ho′okena
Nāpo′opo′o-Hōnaunau
North Keauhou
Kailua-Keauhou
Kaloko-Honokōhau
Ka′upulehu
Puakō-′Anaeho′omalu
Waiakailio Bay
R (% Change in Density)

Page 14
Figure 4. Overall changes in Yellow Tang abundance in FRAs, MPAs and Open
areas, 1999-2009. Yellow bars indicate mean density (June-Nov) Yellow
Tang Young-of-Year (YOY). YOY are not included in trend line data.
decrease of Yellow Tangs in open areas to below baseline levels is attributable to the
above factors as well as an increase in the number of aquarium collectors and collected
animals relative to the period when the FRAs were established (Figure 1). The
continuing decline of Yellow Tang in areas open to collecting has prompted several
additional proposed management actions including restricting which species can be
collected (See Species of Special Concern section) and the establishment of a limited
entry program for the fishery. Recruitment in 2009 is the highest in the past 11 years
which is likely to ameliorate current downward trends at least over the short term.
The fishing/reserve (i.e. FRA/MPA) impacts described above are striking, but of greater
significance to the role such reserves have in enhancing and sustaining West Hawai'i populations and the fishery which depends on those, are effects of the reserve network on
Yellow Tang breeding stocks. To supplement long-term monitoring of juvenile habitats,
DAR initiated a series of surveys in 2006 of the shallow reef habitats utilized by adult
Yellow Tang (Williams et al. 2009).
Adult densities were highest within protected areas and in ‟boundary‟ areas (open areas
adjacent to protected areas). Densities were lowest in open areas far from protected areas
(Figure 5). The high densities in boundary areas are evidence of „spillover‟ (outward
movement from reserves into surrounding open areas) and indicate that protected areas
supplement adult stocks not only within their own boundaries, but also in open areas up
to a kilometer or more away. Thus, the 35% of the coastline in reserves sustains yellow
tang breeding stocks in about 50% of the coastline.
0
5
10
15
20
25
30
1999 2000 2001 2002 2003 2004 2005 2006 2007 2008 2009
Den
sity
(#
/10
0m
2)
YOY
MPA
FRA
Open
FRAs Established

Page 15
Although reserves are already important source areas for adult Yellow Tang (2006
densities were 48% higher in FRAs, and 41% higher in boundary areas than in open areas
far from boundaries), the reduced supply of new adults from open areas following recent
increases in effort and catch mean they are likely to become even more important in
coming years.
Figure 5. Abundance of adult Yellow Tang in and out of MPAs. Trend line was
generated using a LOESS smoothing function.
Goldring Surgeonfish (Figure 6) exhibited trends quite similar to Yellow Tang but since
they are more abundant and much less collected than the Tangs, open areas have been
relatively stable. Overall, Goldring Surgeonfish have increased by 13% since FRA
establishment (Table 3). As with Yellow Tang, recruitment levels have been relatively
high thus enabling densities to increase in the protected areas. It is unknown at present if
Goldring Surgeonfish makes a habitat change as they reach sexual maturity. Recruitment
patterns are markedly similar between the two species, likely due to similarities in
spawning seasonality, location and daily timing (Walsh 1984, 1987).
Distance to Boundary (m)
-6000 -4000 -2000 0 2000 4000 6000
Nu
mb
er A
du
lt Y
T/1
00
m2
0
10
20
30
40
FRA
Open
MPA
Within MPA Outside MPA

Page 16
Figure 6. Overall changes in Goldring Surgeonfish abundance in FRAs, MPAs and
Open areas, 1999-2009. Bars indicate mean density (June-Nov) of
Goldring Surgeonfish Young-of-Year (YOY). YOY are not included in
trend line data.
Achilles Tang (Figure 7) has generally shown a highly variable pattern in all management
areas in the early years of the study with an overall decline in the last four years.
Average densities of this species is very low (x̄ = 0.26/100m2) on all transects. The
deeper reef areas where the WHAP transects are located is not the prime habitat for
adults of this species. They prefer the high energy shallower surge zones more typical of
the shoreline drop-offs areas in West Hawai'i. Presumably algal food resources are more
abundant in these areas. These shallower reef areas are being surveyed by a different
type of monitoring program (Shallow Water Resource Surveys) presently being
conducted by DAR. Initial results from this program and other ancillary longer terms
studies suggest there should be concern for the sustained abundance of this species.
Achilles Tangs are a very popular food fish as well as an aquarium fish and thus are
being harvested both as juveniles and adults. Low levels of recruitment over the past 11
years (x̄ (Jun-Nov) = 0.09/100m2) appear insufficient to compensate for the existing
levels of harvest. DAR is currently in the process of developing a comprehensive
package of size and bag limits for a number of popularly targeted species. There is a
recommended bag limit of 10 Achilles Tangs/person/day which would apply to all
harvesters including commercial fishers and aquarium collectors.
10
15
20
25
30
35
40
1999 2000 2001 2002 2003 2004 2005 2006 2007 2008 2009
Den
sity
(#
/10
0m
2)
YOY
MPA
FRA
Open

Page 17
Figure 7. Overall changes in Achilles Tang abundance in FRAs, MPAs and Open
areas, 1999-2009. Bars indicate mean density (June-Nov) of Achilles Tang
Young-of-Year (YOY). YOY are not included in trend line data.
The abundance/recruitment trends of the Clown Tang and Black Surgeonfish, the fourth
and fifth most collected species (Table 3, Appendix A), are quite similar to Achilles Tang
(Figures 8 & 9). Here again the primary adult habitat is not the deeper, coral rich areas,
where the WHAP transects are located. Additionally the Clown Tang is also widely
taken as a food fish as well as being an important aquarium fish. The abundance of both
these species on the transects closely tracks recruitment with an upturn during 2004/2005
when there was somewhat higher recruitment followed by declining trends in subsequent
years that had low recruitment. Overall, recruitment has been minimal over the last
decade for both Clown Tang (x̄ = 0.05/100m2) and Black Surgeonfish (x̄ = 0.05/100m
2).
As observed in previous work (Walsh 1987) and emphasized again in this study, for some
species, recruitment can be highly variable between years and repeated low levels of
recruitment is a regular occurrence. Without substantial input of the YOY, overall
abundances on the deeper reef transects decrease over time due to ontogenetic movement
out of settlement habitat and natural mortality. This decrease can occur even in areas
which are not subject to aquarium collecting pressure (i.e. FRAs and MPAs).
0.0
0.1
0.2
0.3
0.4
0.5
0.6
1999 2000 2001 2002 2003 2004 2005 2006 2007 2008 2009
Den
sity
(#
/10
0m
2YOY
MPA
FRA
Open

Page 18
Figure 8. Overall changes in Clown Tang abundance in FRAs, MPAs and Open
areas, 1999-2009. Bars indicate mean density (June-Nov) of Clown Tang
Young-of-Year (YOY). YOY are not included in trend line data.
Figure 9. Overall changes in Black Surgeonfish abundance in FRAs, MPAs and
Open areas, 1999-2009. Bars indicate mean density (June-Nov) of Black
Surgeonfish Young-of-Year (YOY).
0.0
0.5
1.0
1.5
2.0
2.5
1999 2000 2001 2002 2003 2004 2005 2006 2007 2008 2009
Den
sity
(#
/10
0m
2)
YOY
MPA
FRA
Open
0.0
0.1
0.2
0.3
0.4
0.5
0.6
0.7
0.8
0.9
1999 2000 2001 2002 2003 2004 2005 2006 2007 2008 2009
Den
sity
(#
/10
0m
2)
YOY
MPA
FRA
Open

Page 19
Although only a few species comprise the bulk of the West Hawai'i aquarium fishery,
over 200 different species of fishes and invertebrates have been collected from the reefs
over the last five years (Appendix A). Some of these species are uncommon or even rare
and presumably have a low resilience to harvesting pressure. Even in protected areas a
considerable amount of time may be required for populations of these species to increase.
A good example seems to be the Flame Angel, Centropyge loricula. This very attractive
but uncommon species is highly desired in the aquarium trade. Demand far exceeds the
supply Hawai'i can provide so substantial numbers of this species are imported to Hawai'i (for subsequent reshipping) from other locales (e.g. Christmas Island). Flame Angels
were rarely sighted on transect or free swim surveys during the first seven years of the
study (Figure 10). Beginning in 2006 however they have become noticeably more
abundant presumably due to one or more years of good recruitment. The recruits are
apparently cryptic so not readily surveyed.
Figure 10. Sightings of Flame Angels in FRAs, MPAs and Open areas, 1999-2009.
FRAs and Conflict Reduction
One of the primary objectives associated with Act 306 was to reduce conflict between
opposing reef users by spatially separating the groups via the FRAs where conflict was
reportedly high. In 2007 and 2008, Washington State University researchers surveyed
recreational scuba diving operators (referred to as divers) and aquarium fishers (referred
to as fishers) to examine their perceptions regarding the effectiveness of Act 306 for
alleviating conflict between reef user groups and enhancing reef fish populations. They
surveyed 23 fishers, comprising ~62% of the active fisher population in West Hawai'i,
0%
10%
20%
30%
40%
50%
1999 2000 2001 2002 2003 2004 2005 2006 2007 2008 2009
Sig
hti
ngs
(%
of
Sit
es)
FRA
MPA
Open
Page 20
and 11 divers, who ranged in expertise from boat captains, master divers, to shop
managers using a post test survey design.
Fishers were slightly more inclined to feel the FRAs were effective (34.8%) for
alleviating conflict than ineffective (30.4%); however, a similar number of fishers
reported having neutral perceptions (34.8%). Likewise, more divers felt the FRAs were
effective (36.4%) than ineffective (18.2%), but the majority held neutral perceptions
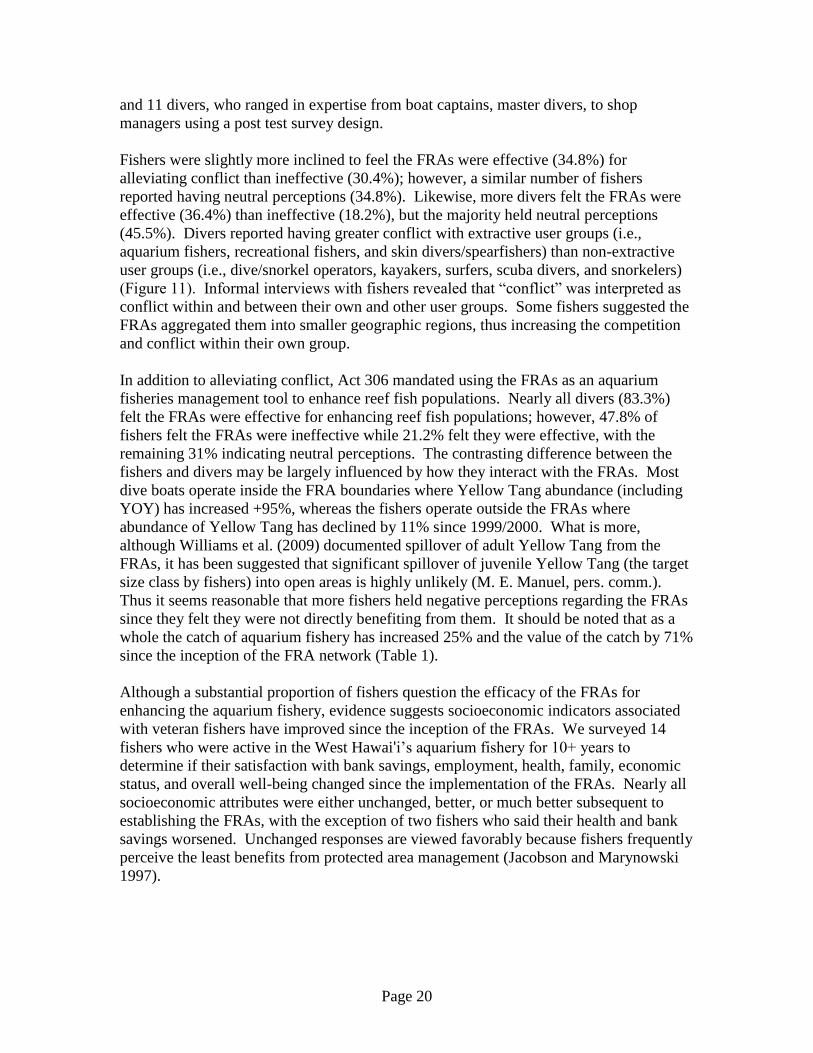
(45.5%). Divers reported having greater conflict with extractive user groups (i.e.,
aquarium fishers, recreational fishers, and skin divers/spearfishers) than non-extractive
user groups (i.e., dive/snorkel operators, kayakers, surfers, scuba divers, and snorkelers)
(Figure 11). Informal interviews with fishers revealed that “conflict” was interpreted as
conflict within and between their own and other user groups. Some fishers suggested the
FRAs aggregated them into smaller geographic regions, thus increasing the competition
and conflict within their own group.
In addition to alleviating conflict, Act 306 mandated using the FRAs as an aquarium
fisheries management tool to enhance reef fish populations. Nearly all divers (83.3%)
felt the FRAs were effective for enhancing reef fish populations; however, 47.8% of
fishers felt the FRAs were ineffective while 21.2% felt they were effective, with the
remaining 31% indicating neutral perceptions. The contrasting difference between the
fishers and divers may be largely influenced by how they interact with the FRAs. Most
dive boats operate inside the FRA boundaries where Yellow Tang abundance (including
YOY) has increased +95%, whereas the fishers operate outside the FRAs where
abundance of Yellow Tang has declined by 11% since 1999/2000. What is more,
although Williams et al. (2009) documented spillover of adult Yellow Tang from the
FRAs, it has been suggested that significant spillover of juvenile Yellow Tang (the target
size class by fishers) into open areas is highly unlikely (M. E. Manuel, pers. comm.).
Thus it seems reasonable that more fishers held negative perceptions regarding the FRAs
since they felt they were not directly benefiting from them. It should be noted that as a
whole the catch of aquarium fishery has increased 25% and the value of the catch by 71%
since the inception of the FRA network (Table 1).
Although a substantial proportion of fishers question the efficacy of the FRAs for
enhancing the aquarium fishery, evidence suggests socioeconomic indicators associated
with veteran fishers have improved since the inception of the FRAs. We surveyed 14
fishers who were active in the West Hawai'i‟s aquarium fishery for 10+ years to
determine if their satisfaction with bank savings, employment, health, family, economic
status, and overall well-being changed since the implementation of the FRAs. Nearly all
socioeconomic attributes were either unchanged, better, or much better subsequent to
establishing the FRAs, with the exception of two fishers who said their health and bank
savings worsened. Unchanged responses are viewed favorably because fishers frequently
perceive the least benefits from protected area management (Jacobson and Marynowski
1997).

Page 21
Figure 11: Level of conflict divers reported having with non-extractive vs.
extractive reef user groups.
Species of Special Concern
Coral reef animals have multiple values and they serve fundamental biodiversity and
ecosystem functions. They‟re important not only to aquarium collectors and other fishers
but also to the commercial ocean recreation industry, their visitors and Hawai'i ocean
users in general. Management of this resource needs to balance these values and uses. A
number of reef fish species are particularly vulnerable to depletion because they may be
naturally uncommon or rare but command high prices in the aquarium trade and are thus
highly sought after by collectors. Examples include the Dragon Moray, Zebra Moray,
Tinker‟s Butterflyfish, Banded Angelfish and Hawaiian Turkeyfish. All of these species
(and others) are worth more (sometimes considerably more) than $20 each when
collected (Appendix A).
For uncommon or rare species or those that occur in deeper reef habitats, it is difficult
and/or unfeasibly expensive to gather solid information on their status and trends.
Nevertheless for some of these species such as the Hawaiian Turkeyfish there is
considerable anecdotal evidence that they have declined in recent decades. It‟s also clear
from a number of long term studies presently being conducted in West Hawai'i (Puakō,
Ke'ei and Hōnaunau) that a number of fairly conspicuous species have likewise declined
in abundance over time – most obviously several species of butterflyfish and, in
particular, the Bandit Angelfish.
In a recent study of the Florida marine aquarium fishery (Rhyne et al. 2009), researchers
noted the once small ornamental fish fishery has grown dramatically in recent years to
0%
20%
40%
60%
80%
100%
Frequent Occasional None
Per
cen
t Res
po
nse
Level Of Conflict
Non-extractive Users
Extractive Users

Page 22
become a large scale invertebrate-dominated industry. Similar to the West Hawai′i fishery, a relatively small number of species (15) represent the bulk of the fishery (92%
in 2007). What was noteworthy was the change in species composition attributable to a
shift from the collection of purely ornamental species to ones providing biological
services in home aquaria. Invertebrate grazers (e.g. snails, urchins, crabs) are now the
most heavily collected animals because they can control algal growth. Noting the
important role such organisms play in the wild the authors concluded the intensive
collecting of such species was ecologically unsound and the fishery was “crawling to
collapse.”
FRAs are a key component of the sustainable management of the West Hawai′i aquarium
fishery. They encompass many of the areas most utilized by residents and dive/snorkel
business, and help maintain the biodiversity of our reefs people expect and visitors are
willing to pay for. The FRAs do not of course provide protection for species in the open
areas. While they do provide a population reservoir, intensive fishing pressure on species
with low natural abundances across most of West Hawai′i‟s reefs is problematic.
Concerns over continued expansion of the fishery (up 25% in the last decade) and
harvesting effects in the open areas (65% of the coast), necessitate additional
management measures.
To address such issues, DAR in conjunction with the WHFC developed a „white list‟ of
species which could be taken by aquarium fishers (Table 4). The approach taken by the
Council was based on the fact that the West Hawai'i aquarium fishery is very heavily
focused on a relatively small number of species. Six species (Yellow Tang, Goldring
Surgeonfish, Achilles Tang, Clown Tang, Black Surgeonfish and Tinker‟s Butterfly)
make up 96% of the total catch value averaged over the last 5 years. The 25 species on
the white list make up 99% of the total catch value so the great majority of species taken
(over 180 species - Appendix A) have very little individual or collective value;
nonetheless they are important components of the reef ecosystem. It should be noted no
invertebrates are included on the white list.
Table 4. List of species which may be collected for Aquarium purposes within the
West Hawai′i Regional Fisheries Management Area.
Common Name Scientific Name Hawaiian (local) Name
Yellow Tang Zebrasoma flavescens lau′īpala
Goldring Surgeonfish Ctenochaetus strigosus kole
Achilles Tang Acanthurus achilles pāku′iku′i
Clown Tang Naso lituratus umaumalei
Black Surgeonfish Ctenochaetus hawaiiensis black kole
Forcepsfish Forcipiger flavissimus lauwiliwilinukunuku′oi′oi
Multiband Butterflyfish Chaetodon multicinctus kikākapu
Brown Surgeonfish Acanthurus nigrofuscus māi′i′i′
Orangeband Surgeonfish Acanthurus olivaceus na′ena′e
Ornate Wrasse Halichoeres ornatissimus ōhua

Page 23
Fourspot Butterflyfish Chaetodon quadrimaculatus lauhau
Moorish Idol Zanclus cornutus kihikihi
Potter‟s Angelfish Centropyge potteri
Goldrim Surgeonfish Acanthurus nigricans
Saddle Wrasse Thalassoma duperrey hinālea lauwili
Yellowtail Coris Coris gaimard hinālea ′akilolo
Bird Wrasse Gomphosus varius hinālea ′i′iwi
Eyestripe Surgeonfish Acanthurus dussumieri palani
Tinker‟s Butterflyfish Chaetodon tinkeri
Unicorn spp. Other Naso spp. kala
Thompson‟s Surgeonfish Acanthurus thompsoni
Flame Wrasse Cirrhilabrus jordani
Peacock Grouper Cephalopholis argus roi
Bluestripe Snapper Lutjanus kasmira taape
Blacktail Snapper Lutjanus fulvus toau
In addition to the aquarium list of (permitted) species the WHFC also recommended that
a number of ecologically and culturally important species be prohibited from being taken
by anyone (Table 5). Note that Manta Rays have recently been afforded complete
protection within the State by Act 92, SLH 2009.
Table 5. List of species for which all take is prohibited
Common Name Scientific Name Hawaiian (local) Name
Manta Rays Manta & Mobula spp. hahalua
Spotted Eagleray Aetobatis narinari hīhīmanu
Broad Stingray Dasyatis latus
Pelagic Stingray Dasyatis violacea
Hawaiian Stingray Dasyatis brevis
Tiger Shark Galeocerdo cuvier Manō/niuhi
Whale Shark Rhincodon typus lele wa'a
Whitetip Reef Shark Triaenodon obesus manō lālākea
Blacktip Reef Shark Carcharhinus melanopterus manō pā'ele
Gray Reef Shark Carcharhinus amblyrhynchos manō
Triton‟s Trumpet* Charonia tritonis 'olē
Horned Helmet* Cassis cornuta pū puhi
*Cultural harvesting by permit
The last focus of the species of special concern related to protecting the breeding stock of
Yellow Tang. The WHFC recommendation, motivated largely by several aquarium
fishers, is that for all fishers there is a bag limit of 5 fish/person/day of Yellow Tang 5”
(Total Length). All of the species of special concern recommendations are presently
undergoing rulemaking.

Page 24
Day-Use Mooring Buoys
Act 306, SLH 1998, mandated the establishment of a day-use mooring buoy system in
high-use coral reef areas to prevent anchor damage. Day-use mooring buoys have proven
to be an effective tool around the world in reducing damage to coral reefs by providing
boaters with a convenient means of securing their boats without dropping anchor. Such a
day use mooring buoy system has been in place in West Hawai′i for almost 15 years.
The first day-use mooring buoys in West Hawai′i were approved by the Hawai′i Board of
Land and Natural Resources in early 1990. Permission to rig the buoys for use was given
by DLNR's Division of Boating and Ocean Recreation (DOBOR) in June 1990 and an
Environmental Assessment was completed by DOBOR in March 1994. In June 1995, the
United States (U.S.) Army Corps of Engineers (COE) issued a general permit to DOBOR
for the statewide installation and maintenance of 277 day-use moorings. The most recent
U.S. Army COE permit for the program was issued in 2005 for the installation of 15
moorings statewide which were previously permitted but not installed, five of which are
in West Hawai′i.
At present, 80 moorings have been either permitted, installed or in use in West Hawai′i (Appendix C). Seven additional moorings are currently in the permit application process
with DOBOR and the U.S. Army COE. DOBOR, in consultation with DAR, the WHFC
and other community members and supported by the Malama Kai Foundation, is
responsible for the process of selecting additional sites for mooring buoys, as well as
maintaining the statewide system of buoys.
The mooring buoys are located in popular dive and snorkel spots along the West Hawai′i coastline (Figure 12). A no-anchoring zone exists within a 100 yd. radius of any day-use
mooring. Costs for the buoy hardware and equipment have been paid primarily by
private contributions, with some state funds, while buoy installation and maintenance
have been supported by in-kind contributions from ocean recreation businesses (charter
boat time, divers, air, fuel, food), and assisted by technical support services provided by
the UH Sea Grant Extension Service, the Hawai′i Institute of Geophysics and the Malama
Kai Foundation.
The mooring buoy system would probably not exist without the help of the Malama Kai
Foundation and its many dedicated volunteer individuals and businesses. The Malama
Kai Foundation raises funds through contributions and the Adopt-A-Buoy Program.
Numerous sport divers as well as dive charter businesses from around the state
collaborate with Malama Kai Foundation to install, monitor and maintain the buoys.
As part of the DLNR Day-Use Mooring 10-Year Strategic Management Plan Malama
Kai Foundation is working with DLNR Staff to write and refine objectives for the
statewide day-use mooring system and develop bio-physical criteria for site selection.

Page 25
Figure 12. Locations of Day-use mooring buoys in West Hawai′i.
Gill Nets
As mandated by Act 306, SLH 1998, a laynet (i.e. gill net) management plan was
developed over four years by the WHFC and DAR. The recommended plan became
administrative rule in 2005. The rule provides for continued small-scale subsistence-
level netting while effectively controlling large-scale commercial netting. Eight areas
have been designated where the use of gill nets is prohibited. Along with existing no gill-
netting areas, approximately 25% of the coastline now prohibits the use of such nets
(Figure 13).

Page 26
Figure 13. Locations of laynet prohibited areas in West Hawai'i and shallow water
resource fish survey sites.
Additional provisions of the rule were designed to encourage responsible net use and
enhance enforcement. These include such requirements as net registration and numbered
identification (floats and tags), maximum soak time of four hours and maximum net
length of 125‟. One area (Kaloko-Honokōhau FRA) was designated a Hawaiian cultural
netting area where only locally constructed handmade nets of natural fibers may be used.
The West Hawai′i laynet rules served as a model for the rest of the state and have
generally been adopted elsewhere except for Maui which completely banned their use. It
is noteworthy that only in West Hawai′i are nets measured, inspected, registered and
tagged personally by DAR staff. Such interaction with the net fishers provides a good
opportunity to educate people about the rules and use of lay gill nets. Additionally it

Page 27
ensures the nets physically conform to the requirements of the rule and are correctly
marked by identification tags and buoys.
Transects conducted in shallow water habitats most likely to be impacted by lay gill
netters (Figure 13) indicate there is presently little difference in the biomass of targeted
food fishes between areas open to netting and those prohibiting netting either beginning
in 2005 or MPAs which have had longer (>10 years) prohibitions on laynetting (Figure
14).
Figure 14. Biomass of ‘Resource’ (i.e. food) fish on shallow water transects. Only
fish > 15 cm TL are censused. ‘Open’ denotes surveys (n=99) in areas
where lay gill netting is permitted. ‘New Gill Net’ are survey areas (=32)
which were closed to gill netting in 2005 and ‘Long Term Gill Net’ are
survey sites (n=11) within MPAs which have prohibited netting for >10
years.
The reasons for the lack of differences between open and laynet protected areas may
relate to one or more of several factors: (i) the newly protected areas haven't had
sufficient time to work; (ii) the protected areas are not effectively enforced; (iii) the sites
of many of the shallow water resource transects may be areas where netting is impractical
(i.e. rocky shorelines, sharp reef drop-offs, etc.) and (iv) the overall level of laynet fishing
is relatively low. This last factor is supported by the low number of lay gill nets
registered in West Hawai′i as compared to the other islands (Figure 15).
0
2
4
6
8
10
12
14
Open New Gill Net Long Term Gill Net
Bio
mass
(g
m/m
2)
Management Status
Parrotfish
Surgeonfish
Goatfish
Jacks

Page 28
Figure 15. Number of registered lay gill nets in Hawai′i. Note that lay gill nets are
prohibited on Maui and on Kaua′i all types of nets are registered.
Fish Reserves
Unlike the other mandates of Act 306, SLH 1998, and resulting statute (Chapter 188f,
HRS) and administrative rule (§13-60.3, HAR), the establishment of fish reserves where
no fishing is allowed is an ongoing effort and has not yet been realized. This is due in
part to a generalized resistance from some segments of the fishing community and overall
government reluctance.
There are exceptions however. Beginning in 2001 an initiative developed within the
South Kona community of Miloli′i to develop rules which would allow management of
their nearshore marine resources in a more traditional manner. In 2006, legislation was
enacted which designated Miloli′i a Subsistence Fishing Area (SFA). Rules for the SFA
were to be subsequently developed by the community in conjunction with DAR. The
following year a SFA rule package was proposed which limited fishing in the nearshore
waters of Miloli′i to subsistence purposes only. There were also a number of gear
restrictions (e.g. nets and spears) and the establishment of a limited take refuge subzone
928
847796
252
84 52 00
200
400
600
800
1000
Kaua′i Moloka′i O′ahu East Hawai′i Lāna′i West Hawai′i Maui
Nu
mb
er
of
Reg
iste
red
Nets

Page 29
(Pu′uhonua). Unfortunately the proposed rule was scuttled at a public hearing in
November 2007 when large numbers of offshore fishers objected to the subsistence only
designation, fearing they would be prohibited from trolling through the area. A
somewhat similar initiative is presently underway at Ho′okena also in south Kona. In this
area a one mile no-take zone (for 10 years) is proposed.
There are indications that public perceptions of marine protected areas are changing. In a
2009 DAR survey of West Hawai′i fishers and other ocean users (n=89) in 78%
responded affirmatively to the question; should additional No-Take Marine Protected
Areas be established in West Hawai′i? When queried about what type of management
actions should be employed MPAs were most often indicated (Figure 16).
Figure 16. Top 10 methods for managing West Hawai′i Fisheries Resources as
indicated in DAR size and bag limit questionnaire.
In response to this unfulfilled mandate, the WHFC convened a subcommittee in January
2009 to develop a strategy for working with communities to designate marine reserves
within areas currently closed to aquarium collecting. Active members of the
subcommittee include representatives from the commercial aquarium and SCUBA diving
industries, educators, cultural advisors, and scientists.
The strategy outlined by this subcommittee has three phases:
Phase I: Compile relevant science from Hawai'i and elsewhere in the Pacific that
demonstrates the benefits of properly designed and enforced marine reserves and marine
reserve networks.
0
5
10
15
20
25
Nu
mb
er
of
ind
ivid
uals

Page 30
Phase II: Provide outreach to schools, community members, and the general public
summarizing the benefits of marine reserves.
Phase III: Identify and support communities in designing and designating marine
reserves in biologically viable areas by providing scientific and technical guidance and
facilitating community education and outreach.
As a first step, the subcommittee has compiled scientific papers documenting marine
reserve benefits to coral reef habitat, fish biomass, biodiversity, and fisheries yield in
adjacent areas. Additionally, the subcommittee obtained studies that emphasize the
importance of a network of marine reserves in combating the detrimental effects of
natural disasters and climate change. This information will be used to develop a fact sheet
highlighting reserve benefits to be made available to educators and concerned community
members. Commercial aquarium collectors in West Hawai'i have pledged tentative
support for the initiative provided it does not increase the percentage of coastline
currently prohibiting aquarium collecting.
Kona school teachers at Kealakehe High School and Hualalai Academy have been
approached to encourage their students to develop appropriate video and print media that
explains the necessity of marine reserves. Verbal commitments have been made that
such projects will be incorporated into their curriculums. The subcommittee is exploring
re-activation of the West Hawai′i Youth Fisheries Council, which organized students to
successfully lobby for a smoking prohibition at Kahalu′u Beach Park.
A subcommittee member has identified a West Hawai′i community interested in the
possibility of designating a marine reserve within their area of interest. This community
has an existing advisory comprised of Hawaiian lineal descendents from the relevant
geographic area, land owners and lessees, cultural advisors, educators, community
coordinators and representatives from the Office of Hawaiian Affairs. Thus far,
representatives from the WHFC have attended six advisory group meetings to provide
information relevant to discussing designation of a Marine Reserve in an existing FRA.
Advisory group meetings have been attended by officers from DLNR‟s Division of
Conservation and Resources Enforcement (DOCARE) who have provided useful
information related to enhancing compliance and enforcement, designating penalties, and
building support for regulations. This community group is also dedicated to supporting
education and outreach regarding this initiative and related coral reef topics at the
Kalaemanō Interpretive Center at Ka′upulehu.
The subcommittee has also responded to interest by the Puakō community related to
amending existing FMA regulations to protect this coral reef from destructive and
wasteful fishing practices and over-exploitation of existing stocks.

Page 31
RECOMMENDATIONS
Based on the results of this review and evaluation the following recommendations are
proposed:
1. Biological and fishery results to date indicate the FRAs are clearly working and
are expected to increase in importance as time progresses. With one possible
exception (Pebble Beach), there are no compelling reasons at present to alter the
existing network of protected areas.
2. As monitoring and evaluation of the FRAs is required by law and necessary to
further understand the dynamics of our coral reef ecosystem, a dedicated
monitoring program similar to WHAP needs to be continued and supported.
3. Community input and co-management responsibility has proven to be critical in
the establishment and legitimacy of the FRA network. Community advisory
groups such as the WHFC should be encouraged and supported by DLNR.
4. Experienced facilitators preferably with training in environmental dispute
resolution need to work with community advisory groups when addressing
complex and contentious marine resource issues. This would also be desirable for
DAR when holding particularly contentious community meetings and public
hearings.
5. Strong community education/outreach efforts should be initiated and coordinated
with “neutral” organizations already working in this capacity, for example: UH
Sea Grant College Program, some branches of NOAA and the U.S. Fish and
Wildlife Service.
6. While FRAs are an excellent strategy to manage the most abundant and heavily
collected aquarium species, uncommon, rare or ecologically important species
require species-specific harvesting limitations in open areas. An alternative, less
data dependent, approach is to delimit what species can be collected (e.g. species
of special concern initiative).
7. FRA boundary coordinates in the HARs do not all correspond to the shapefiles
from which the maps are created for the published regulations. Some of these
discrepancies are minimal while some are rather significant. A review and
updating of the official MMA shapefiles and/or the HAR coordinates could
prevent confusion and potential enforcement issues in the future.
8. A limited entry aquarium fishery should be established in West Hawai′i at the
earliest possible date.
9. In order to protect and enhance aquarium stocks on other islands, especially Maui
and O′ahu, consideration should be given to establishing a system of FRAs on
each island.

Page 32
10. The existing aquarium catch report system needs to be revised to improve
accuracy, remove ambiguities in fishing effort and provide for verification of
catch.
11. A comprehensive verification of aquarium dealer and collector catch reports
should be undertaken to determine reporting accuracy.
12. Collectors who continually fail to abide by the terms of their aquarium fish permit
should be removed by DLNR from the fishery.
13. An effective DOCARE enforcement "presence" on the water and along coastal
areas is essential for long term sustainability of our marine resources. Poaching
can undermine monitoring results and make analyses of the effectiveness of
protected areas problematic.
14. The effectiveness of the FRAs for aquarium fish suggests it would be prudent to
establish MPAs for other resource species throughout Hawai′i as a precautionary
measure against overfishing and for restoration of marine resources. Currently,
less than 1% of the Main Hawaiian Islands is fully protected by MPAs (Clark and
Gulko 1999).
15. MPAs should be large enough for self-recruitment of short distance dispersing
propagules and spaced far enough apart that long distance dispersing propagules
released from one reserve can settle in adjacent reserves.
16. An MPA network should encompass the proportion of the biomass necessary to
sustain optimal yields of populations of concern.
17. Representative proportions of all habitat types should be included in MPAs,
although rare and vulnerable habitats should be represented more fully. An initial
step in this process would be to quantify/identify such habitats in West Hawai′i waters.
18. MPA efforts must recognize known ecological connections among habitat types,
typically from shallow to deeper sites.
19. Diel movement patterns, such as from daytime foraging habitat to nocturnal
resting areas must be considered in MPA establishment.
20. As recruitment is a key mechanism influencing the replenishment of nearshore
populations, increased monitoring of recruitment and nearshore oceanography is
necessary to better understand the dynamics of recruitment processes.
21. MPAs should have unambiguous and geographical distinct boundaries, as they are
easier to recognize and enforce.

Page 33
22. DAR staff should register lay gill nets at DAR offices on islands where such
netting is allowed as this provides an excellent educational and net verification
opportunity.
23. Support and implement co-management efforts at Miloli′i, Ho′okena and other
interested communities.
24. A sustainable funding source for the day-use mooring buoy system needs to be
established. Funds from coral damage related administrative fines and mitigation
requirements could prove useful to this end.
25. Prohibit, by HAR, utilizing an illegally installed day-use mooring.
26. For continued safe and dependable operations, the DAR West Hawai′i vessel
should be replaced. The 26‟ Glacier Bay catamaran used for all research and
monitoring activities in West Hawai′i over the past 11 years has logged over
40,000 sea miles. Structural cracks have occurred on the deck and hull.
ACKNOWLEDGEMENTS
The West Hawai′i Aquarium Project (WHAP) would not have been possible without
initial support and funding by the Hawai′i Coral Reef Initiative Research Program
(HCRI-RP). HCRI-RP was established in 1998 to support scientific research and
monitoring to enhance the state's capacity to manage its coral reef resources. The
Program is jointly managed by Hawai`i's Department of Land and Natural Resources/
Division of Aquatic Resources (DLNR/DAR) and the University of Hawai`i (UH). This
partnership between resource managers and researchers is the foundation of HCRI-RP as
it strives to become an innovative, results-driven, and science-based program.
Since FY 2002 the West Hawai′i coral reef monitoring program has been funded by the
National Oceanic and Atmospheric Administration's (NOAA) Coral Reef Conservation
Program under the National Centers for Coastal Ocean Science (NOAA/NCCOS).
Many people have played important roles in laying the groundwork for successful and
adaptive marine resource co-management in West Hawai′i. David Tarnas is to be
especially commended for his innovative and forward looking legislation. Sara Peck of
UH Sea Grant College Program has been involved from the beginning and is instrumental
in ensuring community participation and education. Many other people have played and
continue to play important roles in West Hawai′i resource co-management. Some of them
are listed below:

Page 34
West Hawai'i Fisheries Council – 1998-2009:
Members:
Edward Ahuna Jr., Pete Basabe, Scott Brien, Jody Bright, Ben Casuga Jr., Lisa
Choquette, David Dart, Neil Dart, Fred Duerr, Michael Forcum Sr., Rick Gaffney, Doug
Genovia, Glennon Gingo, Donna Goodale, Robert Hajek, Luanakanawai Hauanio, Mike
Henshaw, Doug Herkes, David Hoopaugh, Kahana Itozaki, Josephine Kamoku, Ernest
Kanehailua Jr., Junior Kanuha, Willie Kaupiko, Damien Kenison, Karen Klein, Guy
Kitaoka, Matthias Kusch, Gerald Lange, Stan Lavine, Kawika Leicher, Gordon Leslie,
Jeffery Lorance, Len Losalio, Paul Masterjohn, Ruby McDonald, Jim Medeiros Sr.,
Steven Meyer, Tony Nahacky, Mike Nakachi, Teresa Nakama, Cynthia Nazara, Frank
Ota Jr., Bob Owens, Tina Owens, George Paleudis, Richard Prohoroff, William Rickards,
Doug Robbins, JR Rosario, Dale Sarver, Robert Shallenberger, Hannah Springer, Joseph
Stewart, Bill Stockley, William Talley III, Leonard Torricer, Paul Warren, Andrew West,
Chad Wiggins, Vern Yamanaka, Charles Young
Alternates:
Scott Atkinson, Kater Bourdon, Zac Caldwell, Duane Erway, Ted Hardie, Jeffery Jarvis,
Gilbert Kahele, Helen Lorance, Mark McGuffie, Gena Mendez, Dan Mersburgh, Pedro
Padillo, Jim Passion, Dianne Yamaguchi, Caleb Yamanaka, Vern Yamanaka
Ex-officio/Agency:
Jeff Bearman, Sallie Beavers, Alex Cadang, Brent Carman, Lt. Mike Heisler, Pete
Hendricks, Marnie Herkes, John Kahiapo, Reggie Lee, Laura Livnat, Wayne Leslie, Jan
Marsh (KNA Jan Koo), Lt. Brian McCaul, Mark McGuffie, Nancy Murphy, Dickie
Nelson, Robert Nishimoto, Robert Pacheco, Sara Peck, Scott Shero-Amba, David Tarnas,
Justin Viezbicke, Ann Irene Wilcox, Bill Walsh
WHAP Divers & Data Management:
Brent Carman, Steve Cotton, Pete Hendricks, Darrell Kuamo′o, Laura Livnat, Bob
Nishimoto, Ivor Williams DAR, Kathy Greenwood, Jonathan Hultquist, Delisse Ortiz
Washington State University Vancouver, Mark Albins, Paula Ayotte, Josh Ballauer,
Camille Barnett, Matt Barton, Zachary Caldwell, Laura Campbell, Paul Clark, Anne
Creason, Brian Doo, Jeff Eble, Marc Hughes, Katie Gaab, Karen Geisler, Jonatha
Giddens, Jeffrey Gomas, Brian Greene, Jim Gunderson, Leon Hallacher, Ranya Henson,
Jackie Holbrook, Caitlin Kryss, Joe Laughlin, Ross Martin, Sara McCutcheon, Scarlet
Mraz, Jeff Muir, Elizabeth Murphy, Shaun Norris, Michelle Oldenburg, Daniel Okumura,
Kara Osada, Richard Osada, Kim Page, Erica Perez, Greg Polloi, Linda Preskitt, Noelani
Puniwai, Noelle Ruscinski, Chelsie Settlemier, Kosta Stamoulis, Allison Suhr, Jill
Sommers, Jen Vander Veur, Dan VanRavensway, Cecile Walsh, Todd Wass, Lisa
Wedding, Darla White, Charles Wiggins, Amy Young, Rachael Younger, Brian
Zyglicynski, University of Hawai′i Hilo, Jan Dierking University of Hawai′i Mānoa
Funding, logistical & other support:
Mike Hamnett, Christine Davidson, Risa Minato HCRI-RP, Jenny Waddell NOAA,
Athline Clark, Petra MacGowen, Tony Montgomery, Ray Uchimura DAR, John Coney,

Page 35
Michael Childers University of Hawai′i Hilo, Dave Pence University of Hawai′i Mānoa, Scott Atkinson Community Conservation Network, Larry Basch National
Park Service, Linda Paul, Kim Moffie Audubon Society, Marnie Herkes WHFC,
Virginia Isbell, Collins Tomei, Paul Whalen and Chris Walsh.
REFERENCES
Barlow, G.W. 1974. Extraspecific imposition of social grouping among surgeonfishes
(Pisces: Acanthuridae). J. Zool. Lond. 174:333-340.
Bingham, G. 1985. Resolving environmental disputes: A decade of experience.
Washington, DC: The Conservation Foundation.
Capitini, C.A., Tissot, B.N., Carroll, M., Walsh W.J. and S. Peck. 2004. Competing
Perspectives in Resource Protection: the Case of Marine Protected Areas in West
Hawai„i. Society and Natural Resources 17: 763-778.
Cesar, H., Beukering, P.V., Pintz, S., and Dierking, J. 2002. Economic valuation of the
coral reefs of Hawaii. Final Report. Hawaii Coral Reef Initiative Research
Program. 117 pp.
Clark, A.M. and D. Gulko. 1999. Hawai`i‟s State of the Reefs Report, 1998. Department
of Land and Natural Resources, Honolulu, HI. 41pp.
Division of Aquatic Resources, State of Hawaii. 2004. A report on the findings and
recommendations of effectiveness of the West Hawai'i Regional Fishery
Management Area. Report to the State Legislature. 38pp. Available online:
http://hawaii.gov/dlnr/dar/pubs/ar_hrs188F5.pdf
Dollar, S.J. 1982. Wave stress and coral community structure in Hawaii. Coral Reefs
1:71-81.
Gregory, R. 2009. USA-Hawaii (Big Island) – The West Hawai'i Fisheries Council: A
forum for coral reef stakeholders. The EcoTipping Points Project. 28 pp.
Available online: http://www.ecotippingpoints.org/our-stories/indepth/usa-hawaii-
fisheries-council-community-participation.html
Grigg, R. W. and J. E. Maragos. 1974. Recolonization of hermatypic corals on
submerged lava flows in Hawaii. Ecology 55: 387-395.
Hallacher, L.E. and B.N. Tissot. 1999. QUEST: Quantitative Underwater Ecological
Survey Techniques: A coral reef monitoring workshop. Proceedings of the
Hawai‟i Coral Reef Monitoring Workshop, Dept. of Land and Natural Resources,
Honolulu, HI.
Jacobson, S. K. and S. B. Marynowski. 1997. Public Attitudes and Knowledge about
Ecosystem Management on Department of Defense Land in Florida. Conservation
Biology, 11(3): 770 –781.
Jones, R.S. 1968. Ecological relationships in Hawaiian and Johnston Island
Acanthuridae (Surgeonfishes). Micronesica 4:309-361.

Page 36
Kessler, B.L. 2004. Stakeholder participation: A synthesis of current literature. National
Marine Protected Areas Center, National Oceanic and Atmospheric
Administration. 24pp.
Maurin, P. and S. Peck. 2008. The West Hawaii Fisheries Council Case Study Report.
University of Hawaii Sea Grant College Program. 32pp. Available online:
http://www.soest.hawaii.edu/SEAGRANT/communication/pdf/West%20Hawaii
%20Fisheries%20Council.pdf
Rhyne, A, Rotjan, R, Bruckner, A. and M. Tlusty. 2009. Crawling to collapse:
Ecologically unsound ornamental invertebrate fisheries. PLoS ONE
4(12):e8413:1-8. Available online:
http://74.125.155.132/search?q=cache:http://www.plosone.org/article/info:doi/10.
1371/journal.pone.0008413
Tissot, B.N. 2005. Integral marine ecology: community-base fishery management in
Hawai'i. World Futures 61:79-95
Tissot, B.N., Walsh, W. and L.E. Hallacher. 2004. Evaluating the effectiveness of a
marine reserve network in Hawaii to increase the productivity of an aquarium
fishery. Pacific Science 58(2): 175-188.
Tissot, B. N., Walsh, W. and L. E. Hallacher. 2003. Evaluating the effectiveness of a
marine reserve network in Hawaii to improve management of the aquarium
fishery. NOAA Technical Report. 20pp.
Tissot, B.N., Walsh, W.J. and M.A. Hixon. 2009. Hawaiian islands marine ecosystem
case study: Ecosystem- and community-based management in Hawaii. Coastal
Management 37:255-273.
Walsh, W.J. 1984. Aspects of nocturnal shelter, habitat space, and juvenile recruitment
in Hawaiian coral reef fishes. Ph.D. Dissertation, University of Hawaii. 475 pp.
Walsh, W. J. 1987. Patterns of recruitment and spawning in Hawaiian reef fishes.
Environmental Biology of Fishes 18(4): 257-276.
Walsh, W.J. 1999. Community-Based management of a Hawai'i aquarium fishery.
Marine Ornamentals ‟99, Waikoloa, Hawaii, November 16-19, 1999.
Walsh, W.J., Cotton S.P., Dierking, J and I.D. Williams. 2003. The Commercial Marine
Aquarium Fishery in Hawai'i 1976-2003. In: Friedlander A.M. (ed) Status of
Hawai`i‟s Coastal Fisheries in the New Millennium. Proceedings of a
Symposium sponsored by the American Fisheries Society, Hawai`i Chapter. pp.
132-159.
Williams, I.D., Walsh, W.J., Claisse, J.T., Tissot, B.N. and K.A. Stamoulis. 2009.
Impacts of a Hawaiian marine protected area network on the abundance and
fishery sustainability of the yellow tang, Zebrasoma flavescens. Biol. Cons. 142:
1066-1073.

Page 37
APPENDIX A.
List of Aquarium collected species in West Hawai'i. Due to catch report
confidentiality requirements 57 fish and 16 invertebrate species are not listed. They
are included in total catch and value.
FY05-FY09 FY05-FY09
Common Name Scientific Name Total Caught Total Value
Fishes
Yellow Tang Zebrasoma flavescens 1,621,053 $5,035,883
Goldring Surgeonfish Ctenochaetus strigosus 181,121 $376,253
Achilles Tang Acanthurus achilles 42,383 $274,111
Clown Tang Naso lituratus 29,859 $122,090
Black Surgeonfish Ctenochaetus hawaiiensis 19,631 $309,808
Forcepsfish Forcipiger flavissimus 13,216 $27,393
Multiband Butterflyfish Chaetodon multicinctus 9,385 $7,127
Brown Surgeonfish Acanthurus nigrofuscus 7,754 $6,833
Ornate Wrasse Halichoeres ornatissimus 5,198 $11,415
Orangeband Surgeonfish Acanthurus olivaceus 5,195 $9,654
Fourspot Butterflyfish Chaetodon quadrimaculatus 4,909 $12,793
Moorish Idol Zanclus cornutus 4,296 $9,492
Potter's Angelfish Centropyge potteri 3,979 $23,343
Goldrim Surgeonfish Acanthurus nigricans 3,969 $18,813
Saddle Wrasse Thalassoma duperrey 3,831 $4,794
Yellowtail Coris Coris gaimard 3,391 $13,049
Bird Wrasse Gomphosus varius 2,559 $8,407
Hawaiian Cleaner Wrasse Labroides phthirophagus 2,544 $9,550
Eye Stripe Surgeonfish Acanthurus dussumieri 2,363 $3,753
Tinker's Butterflyfish Chaetodon tinkeri 1,977 $156,240
Unicornfish Naso sp 1,678 $6,348
Christmas Wrasse Thalassoma trilobatum 1,190 $2,441
Arc-Eye Hawkfish Paracirrhites arcatus 1,152 $1,426
Psychedelic Wrasse Anampses chrysocephalus 1,146 $4,488
Thompson's Surgeonfish Acanthurus thompsoni 1,143 $2,247
Teardrop Butterflyfish Chaetodon unimaculatus 1,138 $2,930
Lei Triggerfish Sufflamen bursa 1,106 $1,820
Bluelined Surgeonfish Acanthurus nigroris 1,099 $1,453
Hawaiian Whitespotted Toby Canthigaster jactator 932 $1,302
Smalltail Wrasse Pseudojuloides cerasinus 876 $1,793
Shortnose Wrasse Macropharyngodon geoffroy 849 $1,655
Hawaiian Dascyllus Dascyllus albisella 821 $1,103
Fourline Wrasse Pseudocheilinus tetrataenia 596 $3,419

Page 38
Common Name Scientific Name Total Caught Total Value
Eightline Wrasse Pseudocheilinus octotaenia 588 $1,168
Spotted Boxfish Ostracion meleagris 559 $2,076
Blacklip Butterflyfish Chaetodon kleinii 491 $664
Flame Angelfish Centropyge loricula 480 $5,969
Fisher's Angelfish Centropyge fisheri 444 $1,810
Belted Wrasse Stethojulis balteata 427 $713
Raccoon Butterflyfish Chaetodon lunula 348 $1,732
Gilded Triggerfish Xanthichthys auromarginatus 337 $2,414
Blackside Hawkfish Paracirrhites forsteri 302 $712
Lantern Toby Canthigaster epilampra 295 $1,300
Flame Wrasse Cirrhilabrus jordani 270 $6,381
Milletseed Butterflyfish Chaetodon miliaris 269 $414
Black Durgon Melichthys niger 267 $1,189
Zebra Blenny Istiblennius zebra 235 $248
Wrasse Family Labridae 223 $470
Bandit Angelfish Desmoholacanthus arcuatus 216 $16,784
Special Anthias Pseudoanthias hawaiiensis 197 $3,210
Damselfish Family Pomacentridae 195 $313
Pyramid Butterflyfish Hemitaurichthys polylepis 193 $1,460
Reticulated Butterflyfish Chaetodon reticulatus 159 $360
Disappearing Wrasse Pseudocheilinus evanidus 158 $314
Rockmover Wrasse Novaculichthys taeniourus 153 $858
Surgeonfish Family Acanthuridae 143 $1,598
Ringtail Surgeonfish Acanthurus blochii 134 $182
Oval Butterflyfish Chaetodon lunulatus 133 $1,370
Bluestripe Snapper Lutjanus kasmira 128 $149
Yellowfin Surgeonfish Acanthurus xanthopterus 124 $321
Trumpetfish Aulostomus chinensis 113 $471
Squirrelfish/Soldierfish Family Holocentridae 95 $214
Ringtail Wrasse Oxycheilinus unifasciatus 91 $84
Frogfish Antennarius sp. 80 $1,463
Crown Toby Canthigaster coronata 73 $194
Ornate Butterflyfish Chaetodon ornatissimus 72 $118
Threadfin Butterflyfish Chaetodon auriga 68 $372
Brick Soldierfish Myripristis amaena 67 $149
Bluestripe Butterflyfish Chaetodon fremblii 65 $82
Whitley's Boxfish Ostracion whitleyi 62 $1,147
Blue-eye Damselfish Plectroglyphidodon johnstonianus 62 $53
Longnose Hawkfish Oxycirrhites typus 59 $1,100
Dragon Moray Enchelycore pardalis 57 $14,550

Page 39
Common Name Scientific Name Total Caught Total Value
Fantail Filefish Pervagor spilosoma 57 $205
Snowflake Moray Echidna nebulosa 55 $629
Pearl Wrasse Anampses cuvier 55 $267
Redbar Hawkfish Cirrhitops fasciatus 54 $198
Yellowfin Goatfish Mulloidichthys vanicolensis 51 $85
Stout Moray Gymnothorax eurostus 49 $216
Hawaiian Squirrelfish Sargocentron xantherythrum 49 $54
Pinktail Durgon Melichthys vidua 48 $239
Bigscale Soldierfish Myripristis berndti 48 $106
Whitebar Surgeonfish Acanthurus leucopareius 47 $135
Bicolor Anthias Pseudanthias bicolor 46 $380
Blenny Family Blenniidae 44 $227
Parrotfish Family Scaridae 42 $194
Manybar Goatfish Parupeneus multifasciatus 42 $63
Whitemouth Moray Gymnothorax meleagris 39 $246
Porcupine Fish Diodon hystrix 34 $34
Reef Triggerfish Rhinecanthus rectangulus 33 $210
Leaf Scorpionfish Taenianotus triacanthus 32 $205
Blackfin Chromis Chromis vanderbilti 27 $9
Shortbodied Blenny Exallias brevis 24 $126
Bluespine Unicornfish Naso unicornis 24 $68
Longnose Butterflyfish Forcipiger longirostris 22 $55
Brighteye Damselfish Plectroglyphidodon imparipennis 22 $2
Orangefin Filefish Cantherhines dumerilii 19 $48
Hawaiian Hogfish Bodianus albotaeniatus 19 $28
Speckled Butterflyfish Chaetodon citrinellus 19 $18
Cardinalfish Apogon sp. 18 $2
Surge Wrasse Thalassoma purpureum 16 $96
Elegant Coris Coris venusta 16 $76
Hawaiian Sergeant Major Abudefduf abdominalis 16 $0
Hawaiian Turkeyfish Pterois sphex 15 $570
Thompson's Anthias Pseudanthias thompsoni 14 $66
Goatfish Family Mullidae 13 $24
Threespot Damselfish Chromis verater 13 $17
Ruby Cardinalfish Apogon erythrinus 13 $0
Bay Cardinalfish Foa brachygrammus 11 $0
Zebra Moray Gymnomuraena zebra 10 $222
Twospot Hawkfish Amblycirrhitus bimacula 10 $21
Thompson's Butterflyfish Hemitaurichthys thompsoni 10 $15

Page 40
Common Name Scientific Name Total Caught Total Value
Invertebrates
Opae ula Halocaridina rubra 116,100 $6,670
Shrimp 56,384 $41,567
Hermit Crab Family Diogenidae 12,074 $2,086
Sea Star Class Asteroidea 616 $1,364
Common Linckia Linckia multifora 455 $910
Urchin 243 $215
Sponge 274 $1,759
Coral-Banded Shrimp Stenopus hispidus 153 $1,026
Spiny Lobster Family Palinuridae 95 $475
Echinoderm 64 $43
Cowry Family Cypraeidae 73 $92
Mann's Anemone Cladactella manni 47 $610
Anemone Crab Dardanus gemmatus 36 $35
Brittlestars Family Ophiocomidae 21 $24
Yellow Hairy Crab Aniculus maximus 22 $310
Cleaner Shrimp Lysmata amboinensis 40 $199
Green Shrimp Family Hippolytidae 25 $130
Ghost Shrimp Stenopus pyrsonotus 24 $177
Miscellaneous Crab 19 $33
Sea Cucumber Family Holothuroidea 16 $137
Bubble Shell Order Cephalaspidea 14 $140
Harlequin Shrimp Hymenocera picta 11 $174
Grand Total 2,179,361 $6,613,443

Page 41
APPENDIX B.
Summarized below are the changes (Δ) observed in each individual FRA over time.
„Before‟ density is the mean of 1999-2000 and „After‟ is the mean of 2007-2009.
„Aquarium Fish‟ consist of the top 20 collected species (without yellow tangs since they
account for the majority of the catch). The Figure shows Yellow Tang densities in each
FRA relative to the closest MPA and Open area.
North Kohala FRA
Table A. Changes in fish groups in the North Kohala (Waiakailio Bay) FRA.
Density (#/100m2)
Group Before After Δ R
Yellow Tang 16.34 11.77 -28% 0.01 -57% 0.01
Aquarium Fish w/o Yellow Tang 34.78 30.54 -12% 0.27 -26% 0.17
Non-aquarium fishes 46.37 34.52 -26% 0.14 +39% 0.07
Bold = statistically significant at ≤0.05
Figure 15. Changes in Yellow Tang abundance over time in FRA, MPA (Puakō)
and Open (Kamilo Gulch) areas. Bars denote mean density (June-Nov)
of Young- of-the-Year (YOY).
0
5
10
15
20
25
30
35
1999 2000 2001 2002 2003 2004 2005 2006 2007 2008 2009
Den
sity
(#
/10
0m
2) YOY
FRA
MPA
OPEN
FRAs Established

Page 42
Puakō-′Anaeho′omalu FRA
Table B. Changes in fish groups in the Puakō-′Anaeho′omalu FRA.
Density (#/100m2)
Group Before After Δ R
Yellow Tangs 11.59 14.62 +26% 0.04 +33% 0.01
Aquarium spp. w/o Yellow
Tangs
45.70 42.35 -7% 0.52 -45% 0.24
Non-aquarium fishes 25.82 20.65 -20% 0.03 +38% 0.03
Bold = statistically significant at ≤ 0.05
Figure 16. Changes in Yellow Tang abundance over time in FRA, MPA (Puakō)
and Open (Keawaiki) areas. Bars denote mean density (June-Nov)
of Young- of-the-Year (YOY).
0
5
10
15
20
25
30
35
1999 2000 2001 2002 2003 2004 2005 2006 2007 2008 2009
Den
sity
(#
/10
0m
2)
YOY
FRA
MPA
OPEN
FRAs Established

Page 43
Ka′upulehu FRA
Table C. Changes in fish groups in the Ka′upulehu FRA.
Density (#/100m2)
Group Before After Δ R
Yellow Tang 17.45 27.05 +55% 0.01 +184% 0.01
Aquarium spp. w/o Yellow Tang 55.69 59.98 +8% 0.32 +761% 0.26
Non-aquarium fishes 31.60 25.40 -20% 0.24 +39 0.05
Bold = statistically significant at ≤ 0.05
Figure 17. Changes in Yellow Tang abundance over time in FRA, MPA (Puakō)
and Open (Makalawena) areas. Bars denote mean density (June-Nov)
of Young- of-the-Year (YOY).
0
5
10
15
20
25
30
35
40
1999 2000 2001 2002 2003 2004 2005 2006 2007 2008 2009
Den
sity
(#
/10
0m
2)
YOY
FRA
MPA
OPEN
FRAs Established

Page 44
Kaloko-Honokōhau FRA
Table D. Changes in fish groups in the Kaloko-Honokohau FRA.
Density (#/100m2)
Group Before After Δ R
Yellow Tang 17.42 19.77 +14% 0.28 +55% 0.10
Aquarium spp. w/o Yellow Tang 59.45 44.15 -26% 0.11 -493% 0.02
Non-aquarium fishes 82.03 94.19 +15% 0.42 +123% 0.03
Bold = statistically significant at ≤0.05
Figure 18. Changes in Yellow Tang abundance over time in FRA, MPA (Wawaloli)
and Open (Wawaloli Beach) areas. Bars denote mean density (June-
Nov) of Young- of-the-Year (YOY).
0
5
10
15
20
25
30
35
40
45
50
55
1999 2000 2001 2002 2003 2004 2005 2006 2007 2008 2009
Den
sity
(#
/10
0m
2)
YOY
FRA
MPA
OPEN
FRAs Established

Page 45
Kailua-Keauhou (South Oneo Bay) FRA
Table E. Changes in fish groups in the Kailua-Keauhou FRA.
Density (#/100m2)
Group Before After Δ R
Yellow Tang 11.77 13.04 +11% 0.53 +18% 0.33
Aquarium spp. w/o Yellow Tang 39.54 30.54 -23% 0.04 -63% <0.01
Non-aquarium fishes 44.50 29.90 -33% 0.08 +35% <0.01
Bold = statistically significant at ≤ 0.05
Figure 19. Changes in Yellow Tang abundance over time in FRA, MPA (Papawai)
and Open (Kualanui Point) areas. Bars denote mean density (June-Nov)
of Young- of-the-Year (YOY).
0
5
10
15
20
25
1999 2000 2001 2002 2003 2004 2005 2006 2007 2008 2009
Den
sity
(#
/10
0m
2)
YOY
FRA
MPA
OPEN
FRAs Established

Page 46
North Keauhou (Kailua-Keauhou) FRA
Table F. Changes in fish groups in the North Keauhou FRA.
Density (#/100m2)
Group Before After Δ R
Yellow Tang 6.50 17.17 +164% 0.01 +69% 0.01
Aquarium spp. w/o Yellow Tang 48.25 34.25 -29% 0.02 -196% 0.04
Non-aquarium fishes 32.47 19.54 -40% 0.05 +32% 0.05
Bold = statistically significant at ≤ 0.05
Figure 20. Changes in Yellow Tang abundance over time in FRA, MPA (Red Hill)
and Open (Kualanui Point) areas. Bars denote mean density (June-Nov)
of Young- of-the-Year (YOY).
0
5
10
15
20
25
30
35
40
45
1999 2000 2001 2002 2003 2004 2005 2006 2007 2008 2009
Den
sity
(#
/10
0m
2)
YOY
FRA
MPA
OPEN
FRAs Established

Page 47
Nāpo′opo′o-Hōnaunau (Ke′ei) FRA
Table G. Changes in fish groups in the Nāpo′opo′o-Hōnaunau FRA.
Density
(#/100m2)
Group Before After Δ R
Yellow Tang 12.81 35.54 +178% 0.01 +229% 0.01
Aquarium spp. w/o Yellow Tang 48.34 49.10 +2% 0.88 -8% 0.71
Non-aquarium fishes 59.13 44.46 -25% 0.07 +42% 0.08
Bold = statistically significant at ≤0.05
Figure 21. Changes in Yellow Tang abundance over time in FRA, MPA
(Kealakekua Bay) and Open (Keopuka) areas. Bars denote mean density
(June-Nov) of Young- of-the-Year (YOY).
0
5
10
15
20
25
30
35
40
45
1999 2000 2001 2002 2003 2004 2005 2006 2007 2008 2009
Den
sity
(#
/10
0m
2)
YOY
FRA
MPA
OPEN
FRAs Established

Page 48
Ho′okena (Kalahiki Beach) FRA
Table H. Changes in fish groups in the Ho′okena FRA.
Density
(#/100m2)
Group Before After Δ R
Yellow Tang 11.91 26.46 +122% 0.01 +137% 0.01
Aquarium spp. w/o Yellow Tang 73.00 63.96 -12% 0.40 -61% 0.21
Non-aquarium fishes 49.61 42.29 -15% 0.14 +47% 0.03
Bold = statistically significant at ≤0.05
Figure 22. Changes in Yellow Tang abundance over time in FRA, MPA
(Kealakekua Bay) and Open (Au′au Crater) areas. Bars denote mean
density (June-Nov) of Young- of-the-Year (YOY).
0
5
10
15
20
25
30
35
40
45
1999 2000 2001 2002 2003 2004 2005 2006 2007 2008 2009
Den
sity
(#
/10
0m
2)
YOY
FRA
MPA
OPEN
FRAs Established

Page 49
Miloli′i FRA
Table I. Changes in fish groups in the Miloli′i (Omaka′a) FRA.
Density (#/100m2)
Group Before After Δ R
Yellow Tang 8.82 14.11 60% 0.01 +42% 0.01
Aquarium spp. w/o Yellow Tang 63.35 63.02 -1% 0.96 -23% 0.66
Non-aquarium fishes 103.16 78.38 -24% 0.14 +77% 0.38
Bold = statistically significant at ≤0.05
Figure 23. Changes in Yellow Tang abundance over time in FRA, MPA
(Kealakekua Bay) and Open (Manuka) areas. Bars denote mean
density (June-Nov) of Young- of-the-Year (YOY).
0
5
10
15
20
25
30
35
40
45
1999 2000 2001 2002 2003 2004 2005 2006 2007 2008 2009
Den
sity
(#
/10
0m
2)
YOY
FRA
MPA
OPEN
FRAs Established

Page 50
APPENDIX C
List of West Hawai′i day-use mooring buoys. Moorings in blue are installed but
have not yet been written into Hawaii Administrative Rule. NR=not rigged
(missing).
Name Local Area Name DM # ft N Latitude W Longitude
Black Point (N) Keawanui Bay 1 48 20° 6.775' 155° 53.177'
Black Point Mala'e Pt (N) 2 55 20° 6.349' 155° 53.086'
Black Point (S) Mala'e Pt (S) 3 53 20° 6.203' 155° 52.988'
Kei Kei Caverns (N) (Horseshoe) Pōhakuloa Gulch (N) 4 51 20° 4.824' 155° 52.058'
Kei Kei Caverns (S) Pōhakuloa Gulch (S) 5 42 20° 4.803' 155° 52.038'
Ulua Caverns Waiakailio Bay 6 30 20° 4.462' 155° 51.861'
Frog Rock Kapae Gulch 7 54 20° 3.895' 155° 51.266'
Lava Dome Rock Kaiōpae 8 40 20° 3.654' 155° 51.058'
Crystal Cove Honokoa 9 43 20° 3.220' 155° 50.749'
Puakō Puakō 9A 40 19° 58.217' 155° 50.837'
Secrets Waimā Pt (Puakō) 9B 35 19° 58.203' 155° 50.924'
Pine Tree Kapuniau Pt 9C 18 19° 58.052' 155° 51.309'
Paniau N Paniau N 9D 20 19° 56.590' 155° 51.595'
Paniau S Paniau S 9E 40 19° 57.566' 155° 51.619'
Makaiwa Bay (Turtles) Keanapukalua Pt 10 28 19° 56.957' 155° 52.259'
Haunted Cavern Makaiwa Bay 11 34 19° 56.809' 155° 52.339'
Pentagon ′Anaeho′omalu Bay 12 18 19° 54.940' 155° 53.940'
Kua Bay Kua Bay 12.04 23 19° 48.776' 156° 0.487'
Hoover's Tower (Keahole) (3) Unualoha 12A 35 19° 44.422' 156° 3.333'
Garden Eels (N) Makako Bay 12A1 26 19° 44.230' 156° 3.240'
Garden Eels West Makako Bay 12A2 27 19° 44.202' 156° 3.235'
Garden Eels East Makako Bay 12A3 19 19° 44.198' 156° 3.215'
Garden Eels (S) Makako Bay 12A4 23 19° 44.161' 156° 3.235'
Tako City (Keahole) Ho′ona Bay 13 35 19° 43.955' 156° 3.467'
Keahole Wash Rock Ho′ona Bay 14 32 19° 43.934' 156° 3.578'
Pipe Dreams Keahole Pt. 14A 39 19° 43.747' 156° 3.735'
Black Hole Wawaloli Beach 14B 55 19° 42.932' 156° 3.238'
Dotti's Reef Pūhili Pt. 14C 28 19° 42.406' 156° 3.001'
Rabbi's Reef (Lionfish Arch) Pūhili Pt. 14D 47 19° 42.359' 156° 3.056'
Phantom Ridge (High Rock) Pūhili Pt. 15 38 19° 42.295' 156° 3.016'
Carpenter's House Pūhili Pt. 16 34 19° 42.283' 156° 3.009'
Golden Arches (N) Pūhili Pt. 17 40 19° 42.203' 156° 3.007'
Golden Arches (S) Pūhili Pt. 17A 26 19° 42.176' 156° 2.991'
Pyramid Pinnacle 1 Wawahiwa′a Pt. 18 65 19° 41.552' 156° 2.742'
Pyramid Pinnacle 2 Wawahiwa′a Pt. 19 38 19° 41.551' 156° 2.775'
Skunk Hollow 1 (Inside) Wawahiwa′a Pt. 20 32 19° 41.483' 156° 2.582'

Page 51
Skink Hollow 2 (Outside) Wawahiwa′a Pt. 21 40 19° 41.466' 156° 2.588'
Suck 'Em Up Cave Wawahiwa′a Pt. 22 35 19° 41.480' 156° 2.538'
Lone Tree Wawahiwa′a Pt. 23 40 19° 41.468' 156° 2.445'
Freeze-Face Cave Wawahiwa′a Pt. 23A 23 19° 41.425' 156° 2.365'
Windows Kaloko Fishpond 23B 33 19° 41.154' 156° 2.099'
Kaloko Ledges (Kaloko Arches1) Kaloko Pt 24 43 19° 40.991' 156° 2.192'
Kaloko Arches (Kaloko Arches2) Kaloko Pt 24A 35 19° 41.019' 156° 2.152'
Terrapin Station Honokōhau Bay 24A1 35 19° 40.330' 156° 1.875'
Turtle Pinnacle Honokōhau Bay 24B 32 19° 40.305' 156° 1.830'
Turtle Pai Honokōhau Bay 24C 21 19° 40.302' 156° 1.791'
Turtle Heaven Maliu Pt. 24D 22 19° 40.223' 156° 1.750'
Honokohau Inside Honokōhau Bay (S) 24E 18 19° 40.076' 156° 1.739'
Honokohau Middle Honokōhau Bay (S) 24F 16 19° 40.072' 156° 1.747'
Honokohau Outside Honokōhau Bay (S) 24G 20 19° 40.064' 156° 1.768'
Eel Cove (N) Kaiwi Pt 25 33 19° 39.302' 156° 1.910'
Eel Cove (S) Kaiwi Pt 26 15 19° 39.249' 156° 1.893'
Outhouse ?? 26A 47 19° 39.002' 156° 1.806'
Kaiwi Wash Rock 1 (Pawai Bay) Pawai Bay 27 40 19° 38.816' 156° 1.410'
Kaiwi Wash Rock 2 (Pawai Bay) Pawai Bay 28 40 19° 38.830' 156° 1.403'
Kaiwi Arch Cave (Pawai Bay) Pawai Bay 29 40 19° 38.840' 156° 1.375'
Kaiwi Sand Channel (Pawai Bay) Pawai Bay 30 40 19° 38.849' 156° 1.348'
Kaiwi Kamanu (Pawai Bay) Pawai Bay 31 45 19° 38.857' 156° 1.308'
Disneyland ?? 32 33 19° 38.830' 156° 1.186'
Airtanks ?? 32A 28 19° 38.802' 156° 1.108'
Old Airport Pohakuloa Rock 33 40 19° 38.648' 156° 0.990'
Sharkfin Rock (Old Airport S) Pohakuloa Rock 34 36 19° 38.620' 156° 0.940'
Casa Cave Puapua′a Pt. 34A 38 19° 36.963' 155° 59.209'
Mano Point (Fantasy Reef) Kualanui Pt. 35 42 19° 32.757' 155° 57.700'
Chimney Kuamo′o Pt. 36 41 19° 32.475' 155° 57.600'
Leinokano Point Leinokano Pt. 37 NR 19° 32.180' 155° 57.520'
Pa′aoa Bay Pa′aoa Bay 38 NR 19° 31.860' 155° 57.440'
Coral Domes Keikiwaha Pt. (N) 39 33 19° 31.307' 155° 57.562'
Keikiwaha Point Keikiwaha Pt. (S) 40 NR 19° 31.180' 155° 57.690'
Henry's Cave Pu′u Ohau (N) 40A 43 19° 30.496' 155° 57.292'
Sharkey's (Bay of Pig) Pu′u Ohau (S) 41 49 19° 30.371' 155° 57.305'
Nenue Point Nenue Point 42 NR 19° 30.760' 155° 57.630'
Amphitheater (Long Lava Tube) Nawawa Bay (N) 43 52 19° 30.239' 155° 57.183'
Amphitheater (Octocoral) Nawawa Bay (S) 44 40 19° 30.185' 155° 57.145'
Driftwood ?? 45 42 19° 29.929' 155° 57.088'
The Dome Keawekaheka Bay (N) 45A 36 19° 29.823' 155° 57.002'
Ridges Keawekaheka Bay (S) 46 32 19° 29.665' 155° 57.010'
A-Bay Arches Kapalaoa 12.01 20 19° 54.919' 155° 54.001'
Black Coral Arch ?? 12.02 40 19° 50.154' 155° 59.789'
Touch of Grey ?? 12.03 58 19° 46.962' 156° 3.159'

Page 52
Proposed Additional Moorings
Puako Condos Puakō Pt. 37 19° 58.405' 155° 50.615'
Puako Puffer Canyon Puakō reef 37 19° 58.260' 155° 50.729'
Garden Eel Cove 1 Makako Bay 50 19° 44.186' 156° 3.260'
Garden Eel Cove 2 Makako Bay 85 19° 44.186' 156° 3.260'
Keauhou Manta 1 Kaukalaelae Pt. 25 19° 33.558' 155° 58.023'
Keauhou Manta 2 Kaukalaelae Pt. 35 19° 33.558' 155° 58.023'
Keauhou Manta 3 Kaukalaelae Pt. 40 19° 33.558' 155° 58.023'
Kealakekua Bay Ka′awaloa TBD TBD