Embed Size (px)
Citation preview
Report
OPG Proprietary Document Number: Usage Classification:
NK30-REP-03611-00021 N/A Sheet Number: Revision Number: Page:
N/A R001 2 of 121 Title:
PICKERING NUCLEAR GENERATING STATION B PROBABILISTIC SAFETY ASSESSMENT SUMMARY REPORT
N-TMP-10010-R010 (Microsoft® 2007)
Table of Contents Page
List of Tables and Figures ........................................................................................................... 5 Revision Summary ...................................................................................................................... 6 Executive Summary .................................................................................................................... 7
1.0 INTRODUCTION .......................................................................................................... 9
1.1 Objectives ................................................................................................................... 10 1.2 Scope ......................................................................................................................... 10 1.3 Organization of Summary Report ............................................................................... 11
2.0 PLANT DESCRIPTION .............................................................................................. 12
2.1 Site Arrangement ........................................................................................................ 12 2.2 Buildings and Structures ............................................................................................. 12 2.3 Reactor ....................................................................................................................... 13 2.4 Heat Transport System ............................................................................................... 14 2.5 Moderator System ...................................................................................................... 14 2.6 Steam and Feedwater System .................................................................................... 14 2.7 Boiler Emergency Cooling System.............................................................................. 14 2.8 Steam Relief System .................................................................................................. 14 2.9 Shutdown Cooling System .......................................................................................... 15 2.10 Reactor Regulating System ........................................................................................ 15 2.11 Powerhouse Emergency Venting System ................................................................... 15 2.12 Special Safety Systems .............................................................................................. 15 2.12.1 Shutdown Systems ..................................................................................................... 15 2.12.2 Emergency Coolant Injection System ......................................................................... 15 2.12.3 Negative Pressure Containment (NPC) System .......................................................... 16 2.12.4 Support Systems ........................................................................................................ 16 2.12.4.1 Electrical Power Systems ........................................................................................... 16 2.12.4.2 Service Water Systems .............................................................................................. 16 2.12.4.3 Instrument Air Systems ............................................................................................... 17 2.12.4.4 Powerhouse Ventilation System ................................................................................. 17 2.12.4.5 Emergency Mitigating Equipment ............................................................................... 17 2.13 Two-Group Separation ............................................................................................... 18
3.0 OVERVIEW OF PSA METHODS ............................................................................... 18
4.0 HAZARD SCREENING METHODS ............................................................................ 22
4.1 External Hazard Screening ......................................................................................... 22 4.1.1 Overview of External Hazards Screening Method ....................................................... 22 4.1.2 Human-Induced External Hazards .............................................................................. 24 4.1.3 Natural External Hazards ............................................................................................ 24 4.1.4 Combined External Hazards ....................................................................................... 24
Report
OPG Proprietary Document Number: Usage Classification:
NK30-REP-03611-00021 N/A Sheet Number: Revision Number: Page:
N/A R001 3 of 121 Title:
PICKERING NUCLEAR GENERATING STATION B PROBABILISTIC SAFETY ASSESSMENT SUMMARY REPORT
N-TMP-10010-R010 (Microsoft® 2007)
4.2 Internal Hazards Screening ........................................................................................ 25 4.2.1 Overview of Internal Hazards Screening Method ........................................................ 25 4.2.2 Internal Hazards Screening Results ............................................................................ 25
5.0 LEVEL 1 PSA METHODS .......................................................................................... 26
5.1 Level 1 At-Power Internal Events ................................................................................ 26 5.1.1 Initiating Events Identification and Quantification ........................................................ 27 5.1.2 Fuel Damage Categorization Scheme ........................................................................ 28 5.1.3 Event Tree Analysis .................................................................................................... 29 5.1.4 Fault Tree Analysis ..................................................................................................... 30 5.1.5 Human Reliability Analysis ......................................................................................... 32 5.1.6 Fault Tree Integration and Evaluation ......................................................................... 34 5.2 Outage Internal Events ............................................................................................... 35 5.2.1 Plant Operational State Identification and Analysis ..................................................... 35 5.2.2 Initiating Event Identification and Quantification .......................................................... 36 5.2.3 Outage Event Tree Analysis and Fuel Damage Category Analysis ............................. 36 5.2.4 Outage System Fault Tree Analysis ............................................................................ 37 5.2.5 Reliability Data Analysis ............................................................................................. 37 5.2.6 Human Reliability Analysis ......................................................................................... 37 5.2.7 Model Integration, Quantification, and Additional Analyses ......................................... 38 5.3 At-Power Internal Fire ................................................................................................. 38 5.3.1 Phased Approach to Fire PSA .................................................................................... 39 5.3.2 Plant Boundary Definition and Partitioning (Task 1) .................................................... 40 5.3.3 Fire PSA Component (Task 2) and Cable Selection (Task 3) ..................................... 40 5.3.4 Qualitative Screening (Task 4) .................................................................................... 41 5.3.5 Fire-Induced Risk Model (Task 5) ............................................................................... 41 5.3.6 Fire Ignition Frequencies (Task 6) .............................................................................. 41 5.3.7 Quantitative Screening (Task 7) ................................................................................. 42 5.3.8 Scoping Fire Modeling (Task 8) .................................................................................. 42 5.3.9 Detailed Circuit Failure (Task 9) and Failure Mode Likelihood Analysis (Task 10) ...... 42 5.3.10 Detailed Fire Modeling (Task 11) ................................................................................ 43 5.3.11 Post-Fire Human Reliability Analysis (Task 12) .......................................................... 43 5.3.12 Fire Level 1 PSA Quantification (Task 14) .................................................................. 44 5.3.13 Uncertainty and Sensitivity Analysis (Task 15) ........................................................... 44 5.3.14 Level 2 Analysis (Task 17) .......................................................................................... 45 5.3.15 Alternate Unit Analysis (Task 18) ................................................................................ 45 5.4 At-Power Internal Flood .............................................................................................. 46 5.4.1 Identification of Flood Areas, and affected SSCs (Task 1) .......................................... 47 5.4.2 Identification of Flood Sources (Task 2) ...................................................................... 47 5.4.3 Plant Walkdowns (Task 3) .......................................................................................... 47 5.4.4 Internal Flood Qualitative Screening (Task 4) ............................................................. 47 5.4.5 Potential Flood Scenario Characterization (Task 5) .................................................... 48 5.4.6 Internal Flooding Initiating Event Frequency Estimation (Task 6) ................................ 48 5.4.7 Flood Consequence Analysis (Task 7) ....................................................................... 49 5.4.8 Flood Mitigation Strategies (Task 8) ........................................................................... 49 5.4.9 PSA Modelling of Flood Scenarios (Task 9) ................................................................ 49 5.4.10 Level 1 PSA Quantification (Task 10) ......................................................................... 49 5.5 At-Power Seismic ....................................................................................................... 50
Report
OPG Proprietary Document Number: Usage Classification:
NK30-REP-03611-00021 N/A Sheet Number: Revision Number: Page:
N/A R001 4 of 121 Title:
PICKERING NUCLEAR GENERATING STATION B PROBABILISTIC SAFETY ASSESSMENT SUMMARY REPORT
N-TMP-10010-R010 (Microsoft® 2007)
5.5.1 Seismic Hazard Characterization (Task 1) .................................................................. 51 5.5.2 Plant Logic Model Development (Task 2) ................................................................... 51 5.5.3 Seismic Response Characterization (Task 3) ............................................................. 51 5.5.4 Plant Walkdown and Screening Reviews (Task 4) ...................................................... 52 5.5.5 Seismic Fragility Development (Task 5) ...................................................................... 52 5.5.6 Seismic Risk Quantification (Task 6) .......................................................................... 52 5.6 High Wind Safety Assessment .................................................................................... 53 5.6.1 Task 1 - High Wind Hazard Analysis ........................................................................... 54 5.6.2 Task 2 - Analysis of Windborne Missile Risk ............................................................... 54 5.6.3 Task 3 - High Wind Fragility and Combined Fragility Analysis .................................... 54 5.6.4 Task 4 - Plant Logic Model Development.................................................................... 55 5.6.5 Task 5 - Plant Response Model Quantification ........................................................... 55
6.0 LEVEL 2 PSA METHODS .......................................................................................... 55
6.1 Interface with Level 1 PSA .......................................................................................... 56 6.2 Containment Event Tree Analysis ............................................................................... 57 6.3 Containment Fault Trees ............................................................................................ 57 6.4 Release Categorization .............................................................................................. 58 6.5 MAAP-CANDU Analysis ............................................................................................. 58 6.6 Integration of the Level 1 and 2 PSA .......................................................................... 59 6.7 Level 2 Outage Assessment ....................................................................................... 59 6.8 Level 2 Fire Assessment ............................................................................................ 60 6.9 Level 2 Seismic Assessment ...................................................................................... 60 6.10 Level 2 High Wind Assessment .................................................................................. 60
7.0 SUMMARY OF RESULTS ......................................................................................... 61
7.1 Conclusions ................................................................................................................ 61
8.0 REFERENCES ........................................................................................................... 62
Appendix A: Acronyms ............................................................................................................ 119
Report
OPG Proprietary Document Number: Usage Classification:
NK30-REP-03611-00021 N/A Sheet Number: Revision Number: Page:
N/A R001 5 of 121 Title:
PICKERING NUCLEAR GENERATING STATION B PROBABILISTIC SAFETY ASSESSMENT SUMMARY REPORT
N-TMP-10010-R010 (Microsoft® 2007)
List of Tables and Figures
Page
Figure 1: Pickering Site Layout ................................................................................................65 Figure 2: Typical Pickering B Reactor .......................................................................................66 Figure 3: Hazards Screening Steps ...........................................................................................67 Figure 4: Example LOCA Event Tree ........................................................................................68 Figure 5: Fault Tree and Event Tree Integration ........................................................................69 Figure 6: Example Fault Tree ....................................................................................................70 Figure 7: Fault Tree Integration .................................................................................................71 Figure 8: Fire PSA Tasks ..........................................................................................................72 Figure 9: Internal Flood Phase 1 Tasks .....................................................................................73 Figure 10: PSA-based SMA Tasks ............................................................................................74 Figure 11: Example Seismic Hazard Curve ...............................................................................75 Figure 12: Example Fragility Curve ...........................................................................................75 Figure 13: High Wind Hazard Assessment Overview ................................................................76 Figure 14: PNGS-B Bridging Event Tree ...................................................................................77 Figure 15: Generic Containment Event Tree .............................................................................78
Table 1: OPG Risk Based Safety Goals [R4] ..........................................................................80 Table 2: Quantitative Hazard Screening Criteria ......................................................................81 Table 3: Summary of Criteria Applied for Screening for External Human-Induced Hazards.....82 Table 4: Summary of Criteria Applied for Screening of Natural Hazards .................................83 Table 5: Pickering B At-Power Internal Events PSA Initiating Events ......................................84 Table 6: PBRA Fuel Damage Categories ................................................................................89 Table 7: List of Systems Modelled by Fault Trees ...................................................................90 Table 8: PBRA-L1O Plant Operational State Definition ...........................................................92 Table 9: Initiating Events for Pickering B Level 1 Outage PSA ................................................93 Table 10: Summary of Fuel Damage Categories for PBRA-L1O ........................................... 111 Table 11: Summary of Selected Accident Sequences ........................................................... 112 Table 12: Pickering NGS B Release Categorization Scheme ................................................ 113 Table 13: Summary of PBRA Severe Core Damage and Large Release Frequency Results for Internal Events ........................................................................................................................ 114 Table 14: Summary of PBRA Severe Core Damage and Large Release Frequency Results for Fire, Seismic, Flooding and High Wind Events ........................................................................ 115 Table 15: PBRA Level 1 At-Power Internal Events Fuel Damage Results .............................. 116 Table 16: Plant Damage State Frequency .............................................................................. 117 Table 17: Release Category Frequency ................................................................................. 118
Report
OPG Proprietary Document Number: Usage Classification:
NK30-REP-03611-00021 N/A Sheet Number: Revision Number: Page:
N/A R001 6 of 121 Title:
PICKERING NUCLEAR GENERATING STATION B PROBABILISTIC SAFETY ASSESSMENT SUMMARY REPORT
N-TMP-10010-R010 (Microsoft® 2007)
Revision Summary
Revision Number Date Comments R000 February 2013 Initial issue. R001 January 2018 Revised for 2017 update.
Report
OPG Proprietary Document Number: Usage Classification:
NK30-REP-03611-00021 N/A Sheet Number: Revision Number: Page:
N/A R001 7 of 121 Title:
PICKERING NUCLEAR GENERATING STATION B PROBABILISTIC SAFETY ASSESSMENT SUMMARY REPORT
N-TMP-10010-R010 (Microsoft® 2007)
Executive Summary
The objective of Probabilistic Safety Assessment (PSA) at OPG Nuclear is to provide an integrated review of the adequacy of the safety of the current station design and operation for each nuclear power station. The station PSAs are required to meet the intent of the Canadian Nuclear Safety Commission (CNSC) Standard S-294 [R1].
A nuclear PSA identifies the various sequences that lead to radioactive releases, assigns them to different categories of consequences, and calculates their frequencies of occurrence. Additionally, the PSA is used to identify the sources of risk and assess the magnitude of radiological risks to the public from potential accidents due to operation of nuclear reactors while at power as well as during outages. The PSA is a comprehensive model of the plant that incorporates knowledge about plant design, operation, maintenance, testing and response to abnormal events. To the extent possible, the PSA is intended to be a realistic model of the plant.
The Pickering Nuclear Generating Station B (PNGS-B) PSA followed a quality assurance plan consistent with Canadian Standards Association standard CSA N286-05, Management System Requirements for Nuclear Power Plants [R2]. The PSA used computer programs consistent with Canadian Standards Association standard CSA N286.7-99, Quality Assurance of Analytical, Scientific and Design Computer Programs for Nuclear Power Plants [R3].
The PSA was prepared following methodologies consistent with best industry practice. The OPG PSA Methodologies have been accepted by the CNSC under Regulatory Standard S-294.
The baseline PNGS-B safety assessments are documented in several reports:
• A hazard screening assessment identifies the hazards that require assessment in a PSA model.
• The Level-1 and Level-2 internal events at-power PSA assesses the risk of severe core damage and radioactive releases from internal events occurring while the reactor is at power; i.e., it considers the challenges to reactor core cooling from accident sequences covering Design Basis Accidents and Beyond Design Basis Accidents including Severe Accidents while the reactor is at full power.
• The Level-1 internal events outage PSA assesses the risk of severe core damage from internal events occurring while the reactor is in the guaranteed shutdown state; i.e., it considers the challenges to reactor core cooling from accident sequences during unit outages, including loss of shutdown heat sinks.
• The PSA-based seismic margin assessment estimates the risk of severe core damage and large release from seismic events occurring while the reactor is at full power, and provides an estimate of the containment failure frequency as a result of seismic events.
• The internal fire PSA assesses the risk of severe core damage and large release from internal fires occurring while the reactor is at full power.
Report
OPG Proprietary Document Number: Usage Classification:
NK30-REP-03611-00021 N/A Sheet Number: Revision Number: Page:
N/A R001 8 of 121 Title:
PICKERING NUCLEAR GENERATING STATION B PROBABILISTIC SAFETY ASSESSMENT SUMMARY REPORT
N-TMP-10010-R010 (Microsoft® 2007)
• The internal flooding PSA assesses the risk of severe core damage from internal floods occurring while the reactor is at full power.
• The high wind PSA assesses the risk of severe core damage from high winds occurring while the reactor is at full power.
The PNGS-B PSA has demonstrated that for each hazard the safety goals are met for severe core damage frequency and large release frequency.
Report
OPG Proprietary Document Number: Usage Classification:
NK30-REP-03611-00021 N/A Sheet Number: Revision Number: Page:
N/A R001 9 of 121 Title:
PICKERING NUCLEAR GENERATING STATION B PROBABILISTIC SAFETY ASSESSMENT SUMMARY REPORT
N-TMP-10010-R010 (Microsoft® 2007)
1.0 INTRODUCTION
The objective of Probabilistic Safety Assessment (PSA) at OPG Nuclear is to provide an integrated review of the adequacy of the safety of the current station design and operation for each nuclear power station. The station PSAs are required to meet the intent of the Canadian Nuclear Safety Commission (CNSC) Standard S-294 [R1].
A nuclear PSA identifies the various sequences that lead to radioactive releases, assigns them to different categories of consequences, and calculates their frequencies of occurrence. Additionally, the PSA is used to identify the sources of risk and assess the magnitude of radiological risks to the public from potential accidents due to operation of nuclear reactors while at power as well as during outages. The PSA is a comprehensive model of the plant that incorporates knowledge about plant design, operation, maintenance, testing and response to abnormal events. To the extent possible, the PSA is intended to be a realistic model of the plant.
The PSA for the identified hazards for Pickering Nuclear Generating Station B (PNGS-B), commonly referred to as PBRA, provides an estimate of the station risk in its current configuration and is required for compliance with S-294. The PSA reflects the current station design and operation, is consistent with the OPG PSA methodology, and is consistent with best industry practice. The OPG PSA Methodologies have been accepted by the CNSC under S-294. A separate hazard screening assessment for internal and external events has been completed to confirm that no other identified hazards require assessment in a PSA.
The PNGS-B PSA followed a quality assurance plan consistent with Canadian Standards Association standard CSA N286-05, Management System Requirements for Nuclear Power Plants [R2]. The PSA used computer programs consistent with Canadian Standards Association standard CSA N286.7-99, Quality Assurance of Analytical, Scientific and Design Computer Programs for Nuclear Power Plants [R3].
Ontario Power Generation has safety goals for severe core damage frequency (SCDF) and large release frequency (LRF) [R4], as shown in Table 1. The intent of these goals is to ensure the radiological risks arising from nuclear accidents associated with the operation of Ontario Power Generation’s nuclear power reactors is low in comparison to risks to which the public is normally exposed. The baseline PBRA studies show that the overall risk from the operation of PNGS-B is acceptable.
The first PBRA studies for S-294 compliance were completed in 2012. All PBRA studies were revised in 2017 as part of the regular update cycle. The updates included:
• Station design, operation and analysis information up to the study freeze date of December 31, 2015;
• A number of model and documentation enhancements; and
• Event tree and fault tree modelling updates to reflect recent safety analysis, as well as PNGS-B design and operation.
Report
OPG Proprietary Document Number: Usage Classification:
NK30-REP-03611-00021 N/A Sheet Number: Revision Number: Page:
N/A R001 10 of 121 Title:
PICKERING NUCLEAR GENERATING STATION B PROBABILISTIC SAFETY ASSESSMENT SUMMARY REPORT
N-TMP-10010-R010 (Microsoft® 2007)
This report summarizes the safety assessments of PNGS-B and compares the results with Ontario Power Generation’s Safety Goals, documented in Reference [R4].
1.1 Objectives
The principal objectives of the PNGS-B PSA Studies are:
1. To provide an integrated review of the adequacy of the safety of the current station design and operation; and
2. To prepare a risk model in a form that it can be used, in conjunction with ancillary application tools, to assist the safety-related decision making process.
1.2 Scope
The baseline PNGS-B PSAs are documented in eight separate reports – one hazard screening and seven PSA models, as follows:
1. A hazard screening assessment for internal and external events, which identifies the hazards that require further analysis in a PSA.
2. A Level-1 internal events at-power PSA, which studies the risk of fuel damage from events occurring within the station (i.e., loss of coolant accidents, steam line breaks) while the reactor is at full power; it considers the challenges to reactor core cooling from accident sequences covering Design Basis Accidents and Beyond Design Basis Accidents including Severe Accidents while the reactor is at full power. This report is commonly referred to as PBRA-L1P.
3. A Level-1 internal events outage PSA (PBRA-L1O), which studies the risk of severe core damage from internal events occurring at the station while the reactor is in a guaranteed shutdown state (GSS) and Rod-Based GSS (RBGSS). The outage PSA studies severe core damage due to failure to remove decay heat produced while the unit is in GSS.
4. A Level-2 internal events at-power PSA (PBRA-L2P), which studies the frequency and composition of releases to the environment from severe core damage occurring due to events occurring within the station (e.g., loss of coolant accidents, steam line breaks) while the reactor is at full power. This PSA is the extension of the Level-1 PSA (i.e., PBRA-L1P).
5. A PSA-Based Seismic Margin Assessment (PBRA-SEISMIC), which studies the risk of severe core damage and large release from seismic events (i.e., earthquakes).
6. An internal fire PSA (PBRA-FIRE), which studies the risk of severe core damage and large releases from fires originating in the station (e.g., fires caused by failures in station electrical equipment) while the reactor is at full power.
Report
OPG Proprietary Document Number: Usage Classification:
NK30-REP-03611-00021 N/A Sheet Number: Revision Number: Page:
N/A R001 11 of 121 Title:
PICKERING NUCLEAR GENERATING STATION B PROBABILISTIC SAFETY ASSESSMENT SUMMARY REPORT
N-TMP-10010-R010 (Microsoft® 2007)
7. An internal flooding PSA (PBRA-FLOOD), which studies the risk of severe core damage from floods originating inside the station (i.e., pipe breaks of plant systems) occurring while the reactor is at full power.
8. A high winds PSA (PBRA-HIGHWINDS), which studies the risk of severe core damage from high winds occurring while the reactor is at full power.
The PBRA reports do not cover the following potential sources of risk:
• Hazards from chemical materials used and stored at the plant;
• Handling of radioactive material outside containment, i.e., the irradiated fuel storage bay;
• Other external initiating events such as external floods, airplane crashes, train derailment, etc.; and,
• Other internal initiating events such as turbine missiles.
These types of hazards are instead addressed through other screening or deterministic hazard studies.
The response of all PNGS-B units to various initiating events is essentially identical, and it is generally only necessary to model a single unit, with this unit considered representative of all other units. Unit 5 was selected as the reference unit. Design differences between units were not incorporated in the reference model, as they are not expected to be significant in terms of risk.
1.3 Organization of Summary Report
In addition to the general information presented in this introductory section, the Summary Report provides:
A short description of the PNGS-B station and units (Section 2.0); (a)
An overview of PSA methods (Section 3.0); (b)
An overview of the hazard screening method and the internal/external (c)hazard screening assessment (Section 4.0);
An overview of the methods used for Level 1 Analysis (Section 5.0) and (d)Level 2 Analysis (Section 6.0); and
A discussion of the main results of the PBRA studies(Section 7.0). (e)
Appendix A contains a list of the abbreviations and acronyms used in this summary report.
Report
OPG Proprietary Document Number: Usage Classification:
NK30-REP-03611-00021 N/A Sheet Number: Revision Number: Page:
N/A R001 12 of 121 Title:
PICKERING NUCLEAR GENERATING STATION B PROBABILISTIC SAFETY ASSESSMENT SUMMARY REPORT
N-TMP-10010-R010 (Microsoft® 2007)
2.0 PLANT DESCRIPTION
The following sections provide a short description of the Pickering site and plant.
2.1 Site Arrangement
The Pickering Nuclear Generating Station B comprises four CANDU nuclear reactors, four turbine generators and their associated equipment, services and facilities. The arrangement of the eight-unit Pickering site (PNGS-A and PNGS-B) is shown in Figure 1.
The design net electrical output of each unit is 516 MWe at an 85 percent power factor which yields a total station net output of 2064 MWe. Power is produced at 24 kV and delivered at 230 kV and 60 Hz to the Southern Ontario grid. The station is designed for base-load operation.
Each unit comprises a power source capable of operating independently of the other units with reliance on certain common services. The power generating equipment of each unit is a conventional steam-driven turbine generator. The associated heat source is a heavy water moderated, pressurized heavy water cooled, natural uranium dioxide fuelled, horizontal pressure tube reactor. This type of nuclear steam supply is used in all nuclear power stations built in the province of Ontario.
2.2 Buildings and Structures
The principle structures at the PNGS-B site are as follows:
(a) Four reactor buildings;
(b) A reactor auxiliary bay;
(c) A powerhouse, which includes the turbine hall and turbine auxiliary bay, running the full length of the station;
(d) An Annex building and the Used Duel Dry Storage Facility located east and the south of the Unit 8, respectively;
(e) An addition to the Units 1 to 4 service wing;
(f) An administrative building;
(g) A tempering water pumphouse;
(h) A heavy water upgrading building;
(i) A screenhouse;
(j) Six standby generator enclosures;
(k) A pressure relief duct;
Report
OPG Proprietary Document Number: Usage Classification:
NK30-REP-03611-00021 N/A Sheet Number: Revision Number: Page:
N/A R001 13 of 121 Title:
PICKERING NUCLEAR GENERATING STATION B PROBABILISTIC SAFETY ASSESSMENT SUMMARY REPORT
N-TMP-10010-R010 (Microsoft® 2007)
(l) A high pressure emergency coolant injection (HPECI) pumphouse;
(m) An HPECI water storage tank; and
(n) An emergency supply water/power supply building.
The EME building, vacuum building and the HPECI structures serve the entire eight-unit station.
The containment boundary is formed by the reactor buildings, the pressure relief duct, the vacuum ducts and the vacuum building. Each reactor building is a reinforced concrete structure with cylindrical walls and an elliptical dome. The vacuum building is also a reinforced-concrete structure with a cylindrical wall and a flat roof. A tank in the top of the vacuum building contains water for the dousing system. A reinforced concrete ring around the vacuum building, outside the perimeter wall near the base, provides additional pressure retaining capability. The pressure relief duct, also a reinforced concrete structure, is rectangular in section and is linked to the vacuum building by steel vacuum ducts 1.8 m in diameter.
Unit emergency control centres (UECC), one for each unit, are located under the pressure relief duct.
The reactor auxiliary bay runs the full length of the station and is a conventional four-story steel frame building fitted around the northern halves of the four reactor buildings. In addition to the control room and irradiated fuel bay, the reactor auxiliary bay houses some reactor auxiliary systems.
The service wing extension is located at the eastern end of the Pickering A station, i.e., in the center of the eight units, and provides additional space for waste management, laboratories, stores, locker and change facilities, maintenance shops, fuelling machine dismantling facilities and offices.
2.3 Reactor
The reactor consists of an array of tubes in a cylindrical, heavy water filled structure, referred to as the calandria assembly. Inside the calandria are the fuel channel assemblies, which contain the fuel, as well as reactivity monitoring control units. The whole assembly is enclosed the calandria vault, a concrete vault filled with light water.
The ends of the calandria assembly are called the end shields and are located in openings in the calandria vault wall. The end shields form part of the vault enclosure. The end shields, in conjunction with the shield plugs in the fuel channels, provide sufficient shielding against radiation from the reactor and its fuel, to permit personnel access to the fuelling machine areas when the reactor is shutdown. An arrangement of embedded pipes carries light water to provide cooling for the concrete of the vault. A typical PNGS-B reactor assembly is illustrated in Figure 2.
Report
OPG Proprietary Document Number: Usage Classification:
NK30-REP-03611-00021 N/A Sheet Number: Revision Number: Page:
N/A R001 14 of 121 Title:
PICKERING NUCLEAR GENERATING STATION B PROBABILISTIC SAFETY ASSESSMENT SUMMARY REPORT
N-TMP-10010-R010 (Microsoft® 2007)
2.4 Heat Transport System
The heat transport system consists of two identical loops, one for the north half of the reactor and one for the south half. Each loop consists of fuel channels filled with natural uranium fuel bundles surrounded by pressurized heavy water, boilers, circulation pumps and associated piping and valves. The coolant in the fuel channels removes the heat generated by the fuel. During normal operation the heat from the fuel is generated via the nuclear fission, following shutdown heat is generated from the fuel via fission product decay. The circulating coolant then transports this heat to the boilers. This is the primary heat sink for the reactor, thus the system is often referred to as the primary heat transport system.
The heat transport system interfaces with a number of systems: the shutdown cooling system, which removes decay heat when the reactor is shutdown; the feed and bleed system, which provides pressure and inventory control for the coolant; the D2O recovery system, which recovery lost heavy water from leaks; and the Emergency Coolant Injection System, which adds light water after the occurrence of a loss of coolant accident beyond the capacity of the heavy water recovery system.
2.5 Moderator System
During normal plant operation the moderator system is used to slow the neutrons produced by the reactor in order to maintain a critical fission reaction. During normal operation a small fraction of the heat produced by the fuel is transferred to the moderator. The moderator system includes heat exchangers to remove this heat. After an accident, the moderator can be used as an additional heat sink to remove decay heat from the reactor. This additional heat sink is an important, unique feature of the CANDU reactor design.
2.6 Steam and Feedwater System
As described above, the main role of the primary heat transport system is to transport the heat generated in the fuel channels to the boilers. The role of the boilers, then, is to transfer this heat and boil the light water on the secondary side of the boilers. The steam generated in the boilers is then used to spin the turbine generators to convert the thermal energy to electrical power. During this process, the boiling water condenses. The condensate is returned to the feedwater system and eventually returned to the boilers to continue the process.
2.7 Boiler Emergency Cooling System
The boiler emergency cooling system is designed to provide a short term, high pressure supply of cooling water to the boilers in the event of a total loss of feedwater. This system is designed to be used until an alternative heat sink can be placed in service.
2.8 Steam Relief System
The steam relief system protects the boilers from overpressure. The system is also used for rapid cooling of the primary heat transport system when needed.
Report
OPG Proprietary Document Number: Usage Classification:
NK30-REP-03611-00021 N/A Sheet Number: Revision Number: Page:
N/A R001 15 of 121 Title:
PICKERING NUCLEAR GENERATING STATION B PROBABILISTIC SAFETY ASSESSMENT SUMMARY REPORT
N-TMP-10010-R010 (Microsoft® 2007)
2.9 Shutdown Cooling System
The shutdown cooling system provides an alternative method to remove decay heat from the primary heat transport coolant when the reactor is shutdown. The system consists of a set of pumps and heat exchangers that are normally isolated from the primary heat transport circuit, but can be connected when needed. The shutdown cooling system has a much smaller capacity to remove heat than the main boilers, as the reactor produces significantly less heat in the shutdown state.
2.10 Reactor Regulating System
The reactor regulating system is designed to control the power of the reactor during normal operation. The reactor regulating system uses several control mechanisms including the liquid zone control, and the insertion of neutron absorbing rods, to regulate reactor power.
2.11 Powerhouse Emergency Venting System
The powerhouse emergency venting system is used to mitigate harsh environments caused by high temperature or high humidity in the powerhouse, which contains the turbines and other equipment, due to steam line breaks.
2.12 Special Safety Systems
Four special safety systems are incorporated into the plant design to limit radioactive releases to the public following any abnormal event:
(a) Shutdown System No. 1 (SDS1)
(b) Shutdown System No. 2 (SDS2)
(c) Emergency Coolant Injection (ECI) System
(d) Negative Pressure Containment (NPC) System.
2.12.1 Shutdown Systems
The reactor is equipped with two separate and isolated shutdown systems. Shutdown System No. 1 is a rod based system that drops neutron absorbing rods into the reactor core. Shutdown System No. 2 is a liquid injection system that adds a neutron absorbing fluid into the moderator. The two shutdown systems are part of the four special safety systems.
2.12.2 Emergency Coolant Injection System
The emergency coolant injection system provides cooling water to the heat transport system following a loss of coolant accident. The PNGS-B ECI system includes an initial high pressure injection from the HPECI system which is shared with Pickering NGS A and a low pressure recovery injection which is common to paired units (5/6 or 7/8) in Pickering B. This system is one of the four special safety systems.
Report
OPG Proprietary Document Number: Usage Classification:
NK30-REP-03611-00021 N/A Sheet Number: Revision Number: Page:
N/A R001 16 of 121 Title:
PICKERING NUCLEAR GENERATING STATION B PROBABILISTIC SAFETY ASSESSMENT SUMMARY REPORT
N-TMP-10010-R010 (Microsoft® 2007)
2.12.3 Negative Pressure Containment (NPC) System
The negative pressure containment system provides a physical barrier designed to limit the release of radioactivity to the environment which might result from a process or system failure. The containment system is a reinforced concrete envelope around the nuclear components of the reactor cooling system, with provisions for controlling and maintaining a negative pressure within the envelope before and after accidents.
The NPCS includes a number of sub-systems required for providing normal and post-accident functions such as reactor building cooling, pressure suppression, control of hydrogen, and air discharge filtration.
2.12.4 Support Systems
Support systems are considered in the safety assessment as they provide common services to the systems described above. Failure of the support systems can result in failure of the mitigating systems credited to remove heat after an initiating event. The following systems are modelled as support systems in the PSA.
2.12.4.1 Electrical Power Systems
(a) Normal Power Supply
The electrical systems at Pickering B are organized into four classes: Class IV power is the main site electrical power supplied from a combination of the provincial electrical grid and the station generating unit transformers; Class III power is the back-up supply to Class IV and includes three standby generators for each paired unit (5/6 or 7/8); Class II is primarily used to supply control and monitoring systems; Class I is primary used to supply motive power to electrical breakers. Class II and Class I both have battery backup supplies.
(b) Emergency Power Supply
The emergency power supply (EPS) is a system qualified to withstand seismic events and is completely independent from the station normal Class IV and Class III power sources. The purpose of the EPS is to provide power supply to essential station safety functions (reactor shutdown, removal of decay heat, monitoring of post-accident events) in the event of a total loss of normal station power supplies.
2.12.4.2 Service Water Systems
The service water systems provide cooling water for various loads. The service water systems for PNGS-B consist of:
(a) Service Water System:
The service water system provides cooling water from Lake Ontario for various loads. Service water is drawn from Lake Ontario through an open canal bounded by two rock filled groynes extending into the lake. The water is drawn from the canal to an open forebay, then through a common screen house into an enclosed concrete duct or
Report
OPG Proprietary Document Number: Usage Classification:
NK30-REP-03611-00021 N/A Sheet Number: Revision Number: Page:
N/A R001 17 of 121 Title:
PICKERING NUCLEAR GENERATING STATION B PROBABILISTIC SAFETY ASSESSMENT SUMMARY REPORT
N-TMP-10010-R010 (Microsoft® 2007)
intake channel. The service water system is divided into two sub-systems referred to as low and high pressure service water. The high pressure service water systems draws its water from the low pressure service water pumps discharge and provides a pressure boost via a second set of pumps to deliver service water at higher elevations in the plant. Service water is used once and returned to the lake.
(b) Recirculated Cooling Water System:
The recirculated cooling water system provides clean, demineralized cooling water to equipment that might become contaminated or plugged if supplied by lake water via the service water system. The RCW system recirculates water via a set of pumps and cools the water via a set of heat exchangers. The normal service water system is used on the secondary side of the RCW heat exchangers for cooling purposes.
(c) Emergency Water System:
The emergency water system is a redundant water supply, designed to provide cooling water in the event that other sources of water fail. The emergency water system has a separate screen house and pump house to obtain water from the common Pickering forebay.
2.12.4.3 Instrument Air Systems
The instrument air supply is a support system providing compressed air. This compressed air is used for various plant activities including operating valves, starting motors, and inflating airlock seals.
2.12.4.4 Powerhouse Ventilation System
The cooling and ventilation system provides heating and cooling to the station buildings. Failures of this system are studied for Class I and II Electrical Equipment Rooms, in the Reactor Building Moderator Room, in the Emergency Power Supply Electrical Room and in the Standby Generator Rooms. Failure of the cooling and ventilation in these rooms may result in equipment failures in the support or mitigating systems.
2.12.4.5 Emergency Mitigating Equipment
The emergency mitigating equipment is a set of equipment designed to mitigate a beyond design basis event (BDBE) which results in a total loss of power to the station and subsequent loss of heat sink. The PNGS-B EME consists of portable equipment (pumps and generators) that can be deployed in an event to restore power to critical loads and provide emergency water make-up. The equipment is normally located in the EME storage facility at the east end of the Pickering site. In addition, there are also uninterruptable 120 V power supplies (UPS) that are stored in the UECC and used to provide power to instrumentation until the power is restored by the diesel generators. Emergency water make-up is provided by portable diesel pumps to the Boilers, HTS, and Moderator.
Report
OPG Proprietary Document Number: Usage Classification:
NK30-REP-03611-00021 N/A Sheet Number: Revision Number: Page:
N/A R001 18 of 121 Title:
PICKERING NUCLEAR GENERATING STATION B PROBABILISTIC SAFETY ASSESSMENT SUMMARY REPORT
N-TMP-10010-R010 (Microsoft® 2007)
2.13 Two-Group Separation
The PNGS-B design uses group separation to minimize the possible consequences of events that could cause widespread damage, and to provide defence in depth. Each group contains equipment to shut down the reactor, remove decay heat, and monitor the reactor status. The Group 1 and Group 2 systems are physically separated.
The following systems are Group 1:
• SDS1: Shutdown System No. 1
• SDC: Shutdown Cooling
• FW: Feedwater
• Class IV, III, II, I Electrical Power
• Instrument air (normal distribution)
The Group 1 control functions are performed from the main control room (MCR).
The following systems are Group 2:
• SDS2: Shutdown System No. 2
• SRVs: Steam Reject Valves
• EPS: Emergency Power System
• BECS: Boiler Emergency Cooling System
• EWS: Emergency Water Supply System
• ECI Recovery: Emergency Coolant Injection Recovery System
• Containment
• EFADS: Emergency Filtered Air Discharge System
The Group 2 systems are seismically qualified to withstand a design basis earthquake (DBE). The DBE used for the design of PNGS-B is described in Reference [R6]. The Group 2 control functions are performed from UECC.
3.0 OVERVIEW OF PSA METHODS
Probabilisitic safety assessment is based on the idea that the product of the frequency of occurrence of an event and the consequence of the event represents a useful and meaningful quantity. This product is defined to be the risk from the event and is expressed in units of consequence per unit of time. For example, consider a
Report
OPG Proprietary Document Number: Usage Classification:
NK30-REP-03611-00021 N/A Sheet Number: Revision Number: Page:
N/A R001 19 of 121 Title:
PICKERING NUCLEAR GENERATING STATION B PROBABILISTIC SAFETY ASSESSMENT SUMMARY REPORT
N-TMP-10010-R010 (Microsoft® 2007)
residential sump pump that fails on average once every four years. If the consequence of the pump failing is $1000 in property damage, then the average risk from failure of the pump is $250 per year.
Risk provides a means of quantifying the degree of safety inherent in a potentially hazardous activity as well as a common basis for comparing the relative safety of dissimilar types of activities and industrial processes. One of the principles of the probabilisitc safety assessment process is that the larger the numerical value of risk for a particular event or combination of events, the more important the event is to safety. Thus, measures to reduce calculated risk improve the level of safety. Probabilistic Safety Assessment represents the process by which risk is quantified, leading to the identification of the dominant contributors to risk. If necessary, the dominant contributors can be used to create strategies to reduce risk and improve safety.
For a nuclear generating plant, the events studied are those leading to damage to fuel in the core or releases of radioisotopes into the environment. Consistent with the requirements of the CNSC S-294 standard, Ontario Power Generation has completed hazard screening, Level 1 and Level 2 PSA to assess the risk from PNGS-B:
• A hazard screening assessment was performed to confirm which hazards can be screened out from probabilistic safety assessment, and identify which hazards need to be assessed by a PSA.
• Level 1 of the PSA assesses the frequency of varying degrees of fuel failures, which lead to release of radioactivity into containment.
• Level 2 of the PSA assesses the frequency and magnitude of the release of this radioactivity from containment to the outside environment.
OPG’s safety goals in Table 1 for PSA correspond to the Level 1 and Level 2 PSA results.
Level 1 PSAs have been prepared for full reactor power operation for the following types of initiating events:
• Internal initiating events (e.g., steam line break, loss of coolant accidents);
• Seismic events;
• Internal Fire (fires initiated by in plant sources, e.g., electrical equipment);
• Internal flooding (floods originate from water sources internal to the plant); and,
• High winds.
An assessment of risk while a single unit is in GSS was prepared for internal initiating events. Outage PSAs have not been prepared for seismic events, fire, and internal flooding for the reasons described below:
Report
OPG Proprietary Document Number: Usage Classification:
NK30-REP-03611-00021 N/A Sheet Number: Revision Number: Page:
N/A R001 20 of 121 Title:
PICKERING NUCLEAR GENERATING STATION B PROBABILISTIC SAFETY ASSESSMENT SUMMARY REPORT
N-TMP-10010-R010 (Microsoft® 2007)
• An outage seismic PSA was not performed as the risk from a seismic event is either acceptably low or is bounded by the risk from seismic events for a high power unit; in that the seismic event will have similar effect on the heat sinks for the shutdown and high power units: the in-service heat sink will fail and the Group 1 emergency heat sinks will fail, but operation of the Group 2 emergency heat sinks will be largely unaffected. Initial reactor power is at least two orders of magnitude less for a shutdown unit than for a high power unit. Therefore, fuel temperatures will be lower, accident progression will be slower thereby giving more time for operator action, and the amount of energy deposited into containment will be lower. On average, a unit is shutdown for a planned outage for approximately 10% of the operating cycle. Therefore, the exposure to low frequency events such as seismic events is much lower for a shutdown unit than for a high power unit. Risk management programs are adequate to control the risk from high winds while a single unit is shutdown.
• An internal fire outage PSA was not performed as the overall risk of severe core damage due to fire while the unit is in outage is either acceptably low or is bounded by the risk from fire events for a high power unit. The factors that contribute to the low SCDF for internal fires at high power (low initiating event frequency; reliable fire detection and suppression systems; and physical separation between Group1 and Group2 systems) also apply when a single unit is shutdown. Initial reactor power is at least two orders of magnitude less for a shutdown unit than for a high power unit. Therefore, fuel temperatures will be lower, accident progression will be slower thereby, giving more time for operator action, the inventory of radioactive material available for release to the environment is less due to decay of short lived isotopes and the amount of energy deposited into containment will be lower. On average, a unit is shutdown for a planned outage for approximately 10% of the operating cycle. Therefore, the exposure to low frequency events such as fire events is much lower for a shutdown unit than for a high power unit. Risk management programs are adequate to control risk from internal fires while a single unit is shutdown.
• An outage internal flood PSA was not done as the overall risk of severe core damage (SCD) due to flooding while the unit is in outage is either acceptably low or is bounded by the risk from flood events for a high power unit. The low risk of SCD due to flooding is due to the low initiating event frequency and the physical separation of the Group 1 and Group 2 systems. The factors that contribute to the low SCDF for high power unit also apply when a unit is shutdown. Initial reactor power is at least two orders of magnitude less for a shutdown unit than for a high power unit. Therefore, fuel temperatures will be lower, accident progression will be slower thereby, giving more time for operator action, and the amount of energy deposited into containment will be lower. On average, a unit is shutdown for a planned outage for approximately 10% of the operating cycle. Therefore, the exposure to low frequency events such as flood events is much lower for a shutdown unit than for a high power unit. Risk
Report
OPG Proprietary Document Number: Usage Classification:
NK30-REP-03611-00021 N/A Sheet Number: Revision Number: Page:
N/A R001 21 of 121 Title:
PICKERING NUCLEAR GENERATING STATION B PROBABILISTIC SAFETY ASSESSMENT SUMMARY REPORT
N-TMP-10010-R010 (Microsoft® 2007)
management programs are adequate to control risk from internal floods while a single unit is shutdown.
• An outage high wind PSA was not performed as the risk of severe core damage for a single shutdown unit is low and it is bounded by the risk from high winds for a high power unit. High winds, like seismic events, are assumed to affect all four units simultaneously. The highest risk comes from straight line winds conservatively assumed to be perfectly correlated i.e. they affect all four units simultaneously. The risk from high winds is dominated by sequences involving the failure of all heat sinks. Therefore, a high wind will have similar effect upon the in-service heat sinks and emergency heat sinks for both shutdown and high power units. Containment challenges during a high wind event (energy released from reactors; wind induced failures; missile strikes; and random containment failures) are either unaffected if a single unit is shutdown or bounded by the challenges from the three high power units. On average, a unit is shutdown for a planned outage for approximately 10% of the operating cycle. Therefore, the exposure to low frequency events such as high wind events is much lower for a shutdown unit than for a high power unit. Risk management programs are adequate to control the risk from high winds while a single unit is shutdown.
The full scope Level 2 PSAs has been prepared for at-power internal events. Limited scope Level 2 assessments have been prepared for seismic events, outage internal events and fire events as follows:
• The Level 2 assessment for seismic events considers the likelihood of consequential failure of containment due to an earthquake, and then provides a bounding assessment of large release frequency due to seismic failure modes of containment following severe core damage caused by a seismic event.
• The Level 2 assessment of outage internal events reviews the potential for unique containment challenges or bypass pathways in the outage state, and provides a bounding assessment of large release frequency caused by severe core damage from an internal initiating event occurring while the reactor is in the guaranteed shutdown state.
• For the Level 2 assessment of fire events, an estimate of large release frequency has been performed.
• Level 2 assessment for internal flooding was not performed due to the very low frequency of severe core damage caused by these events.
• Level 2 assessment for high winds was not performed because high winds are conservatively assumed to affect all four PNGS-B units in the same manner at the same time. The progression of an accident to severe core damage in all four Pickering B units will result in the consequential failure of containment. Hence, the Severe Core Damage Frequency bounds the
Report
OPG Proprietary Document Number: Usage Classification:
NK30-REP-03611-00021 N/A Sheet Number: Revision Number: Page:
N/A R001 22 of 121 Title:
PICKERING NUCLEAR GENERATING STATION B PROBABILISTIC SAFETY ASSESSMENT SUMMARY REPORT
N-TMP-10010-R010 (Microsoft® 2007)
Large Release Frequency. The typical timing and release magnitudes for a total loss of heat sinks on all four units are documented in the Level 2 PSA for internal events. Therefore, Level 2 high wind PSA for high power units will not provide significant additional insights.
In the following sections, the methods used for Level 1 and Level 2 PSAs are described.
4.0 HAZARD SCREENING METHODS
A hazard is an event or natural phenomenon that has the potential to pose some risk to the facility. Hazards can be divided into two groups: external and internal. External hazards include events such as flooding and fires external to the plant, tornadoes, earthquakes, and aircraft crashes. Internal hazards include events such as equipment failures, operator induced events, flooding and fires internal to the plant. The purpose of hazard screening analysis is to determine which hazards can be screened out from probabilistic safety assessment, and identify which hazards need to be assessed by a PSA.
4.1 External Hazard Screening
External hazards are defined as hazards that are initiated outside the OPG exclusion zone or are hazards that are outside the plant’s direct control. These hazards could be in the form of natural hazards (ice-storms, flood, etc.) or man-made hazards (chlorine leak from a rail-car derailment, aircraft crash, etc.).
4.1.1 Overview of External Hazards Screening Method
The external hazards screening method involves three main steps:
1. Identify all the external hazards applicable to the site.
2. Determine consequences of hazards and accident scenarios. Screen-out events qualitatively, based on the consequence of events.
3. Determine likelihood of event occurring. Screen-out events quantitatively, based on the likelihood of event occurring, severe core damage frequency or conditional core damage probability.
The hazard screening flow diagram of steps is shown in Figure 3. A generic list of the hazards is developed based on a literature review and is reviewed and rationalized by a group of risk assessment experts to come up with a refined master list. Once the hazards are identified, the screening process begins with qualitative assessment of hazards impact and consequences of events, followed by quantitative assessments.
The qualitative screening steps QL1 to QL7 discussed below are the criteria for qualitative screening.
Report
OPG Proprietary Document Number: Usage Classification:
NK30-REP-03611-00021 N/A Sheet Number: Revision Number: Page:
N/A R001 23 of 121 Title:
PICKERING NUCLEAR GENERATING STATION B PROBABILISTIC SAFETY ASSESSMENT SUMMARY REPORT
N-TMP-10010-R010 (Microsoft® 2007)
[QL1] The first qualitative criterion is if the event is of equal or lesser damage potential than similar events for which the plant has been designed.
After the hazards are identified and determined their impact could be beyond the design basis of the plant, the scenarios need to be defined for each hazard, and it needs to be determined how far from the station they take place and how they can potentially impact the plant’s operation.
[QL2] For each scenario, it has to be determined if there are other bounding events. If the hazard imposes lower risk (frequency and consequence) than another hazard, it can be screened out.
[QL3] Once the hazard distance is determined, it can be assessed whether it can be screened based on the distance from the plant. For screening purpose a screening distance value (SDV) is defined by the OPG Hazard Screening Guide [R7], which is the distance from a facility beyond which, potential sources of a particular type of external event can be ignored. The SDV is different for different hazards. Generally, the safe distance is a distance beyond which a hazard source is too weak to impact nuclear safety.
[QL4] If the event is included in the definition of another event or bounded by other event, it can be screened out from any further assessment.
[QL5] Events that progress slowly and it can be demonstrated that there is sufficient time to eliminate the source of the threat or provide an adequate response, can be screened out.
[QL6] If the event does not cause an initiating event (or the need to shutdown), and does not result in loss of a safety system, it can be screened out.
[QL7] If the hazard does not result in actuation of a front-line system (i.e., a system that directly performs accident mitigating functions), then it is not necessary to evaluate the consequences of the hazard, and it can be screened out.
The quantitative screening steps QN1 to QN5 discussed below, and shown in Table 2 are the criteria for quantitative screening.
[QN1] The SCDF is less than 1.0E-06/yr. with no direct containment bypass/failure.
[QN2] Design basis hazard frequency is less than 1.0E-05/yr. and the conditional core damage probability (CCDP) is less than1.0E-01, with no direct containment bypass/failure.
[QN3] The SCDF is less than 1.0E-07/yr., with a conditional large release probability equal to or very close to 1.0, as a result of the hazard’s impact on the plant (i.e., containment bypass/failure).
[QN4] Design basis hazard frequency is less than 1.0E-06/yr. and the conditional core damage probability is less than1.0E-01, with a conditional large release probability
Report
OPG Proprietary Document Number: Usage Classification:
NK30-REP-03611-00021 N/A Sheet Number: Revision Number: Page:
N/A R001 24 of 121 Title:
PICKERING NUCLEAR GENERATING STATION B PROBABILISTIC SAFETY ASSESSMENT SUMMARY REPORT
N-TMP-10010-R010 (Microsoft® 2007)
equal to or very close to 1.0, as a result of the hazard’s impact on the plant (i.e., containment bypass/failure).
[QN5] The initiating event or hazard may be screened out if it can be shown that their frequency is less than 1.0E-07/yr.
Those hazards subjected to all qualitative and quantitative criteria, but cannot be screened out will require a more detailed assessment using a PSA.
4.1.2 Human-Induced External Hazards
All human-induced (man-made) external hazards identified for PNGS-B are reviewed and examined against the methodology described in Section 4.1.1. All human-induced external hazards are screened out, and do not require a PSA. A list of the human-induced hazards assessed is presented in Table 3.
4.1.3 Natural External Hazards
A Review Level Condition (RLC) needs to be defined for each natural hazard during screening assessment and is used to assess the impact on the nuclear safety. The RLC is normally defined as a beyond-design-basis event, as the natural hazards within the design basis should not have any significant impact on the plant’s operation and safety. The concept of RLC implies a particular level of hazard which challenges the systems, structures and components (SSCs) on the site. Selection of RLC is based on:
• Canadian and International regulations and standards,
• Information on credible hazards at the plant site,
• Or alternatively, the RLC can be established for the corresponding screening frequency.
PSA screening analysis for natural external hazards was conducted in accordance with the methodology described in Section 4.1.1. A set of RLCs were defined and used in the screening analysis. All natural external hazards have been screened out, with the exception of hazards that are already addressed in the PSA for PNGS-B. Such hazards for which a PSA has already been initiated are seismic events, high winds/tornadoes. A list of the natural external hazards considered is presented in Table 4.
4.1.4 Combined External Hazards
Combinations of external hazards may have a significant impact on diverse safety systems at the same time. Therefore, evaluation of the combination of events is an essential part of the external hazards screening for PSA to ensure the consequences of combinations are not disproportionate. Combined external hazards include combinations of man-made hazards with natural hazards, human induced hazards with other human induced hazards, as well as, combinations of natural hazards. In particular, some combinations of natural hazards can be correlated (e.g., high winds and flooding can both occur in summer storms) and could potentially produce the most
Report
OPG Proprietary Document Number: Usage Classification:
NK30-REP-03611-00021 N/A Sheet Number: Revision Number: Page:
N/A R001 25 of 121 Title:
PICKERING NUCLEAR GENERATING STATION B PROBABILISTIC SAFETY ASSESSMENT SUMMARY REPORT
N-TMP-10010-R010 (Microsoft® 2007)
severe impacts challenging the safe operations of the nuclear plants. Review of the international practices shows that combinations of external hazards are considered only if the hazards are correlated and dependent. Independent combinations of beyond design basis hazards usually have an extremely low likelihood of occurrence. The objective of the assessment was to ensure the combinations would not have significant impacts on diverse safety systems at the same time, and do not impose disproportional risks to the station’s safe operation. Several hundred combinations of external hazards were assessed. The combined hazard assessment did not identify any hazard combination that requires additional PSA assessments.
4.2 Internal Hazards Screening
4.2.1 Overview of Internal Hazards Screening Method
The internal hazards screening method is similar to the external hazards screening method and involves three main steps:
1. Identify all the internal hazards applicable to the site.
2. Determine consequences of hazards and accident scenarios. Screen-out events qualitatively, based on the consequence of events.
3. If the event could not be screened out based on qualitative screening criteria, then use quantitative screening criteria for the event screening.
The screening flow diagram of steps is the same as for the external events as shown in Figure 3. A preliminary list of the hazards is developed based on a literature review, as well as a walk down to review vulnerable areas within the powerhouse to identify any additional hazards. As many internal hazards have already been assessed in detail by the different PNGS-B PSA studies (e.g. internal fires, internal floods), the hazard screening only considered internal hazards not already assessed in PBRA.
For each of the hazards identified, one or more parameters are selected that define the internal hazard and/or its potential impact, and for which discrete and quantifiable criteria can be developed. The qualitative criteria are the same as those for the external events as described in Section 4.1.1. If all qualitative criteria have been examined and the hazard has not been screened out by the seven deterministic criteria, the quantitative screening is required. The five quantitative screening criteria are presented in Table 2.
4.2.2 Internal Hazards Screening Results
The internal hazards identification included mechanical, chemical, electrical hazards, etc., initiated from the inside of the plant; an updated operating experience (OPEX) review was also conducted. The internal hazards identified are listed below:
• Mechanical Missile Impacts
• Explosions within the Generating Station Main Buildings
Report
OPG Proprietary Document Number: Usage Classification:
NK30-REP-03611-00021 N/A Sheet Number: Revision Number: Page:
N/A R001 26 of 121 Title:
PICKERING NUCLEAR GENERATING STATION B PROBABILISTIC SAFETY ASSESSMENT SUMMARY REPORT
N-TMP-10010-R010 (Microsoft® 2007)
• Release of Oxidizing, Toxic, Radioactive or Corrosive Gases and Liquids from On-site Storage
• Release of Stored Energy
• Dropped or Impacting Loads
• Transportation
• Electromagnetic Interference
• Static Electricity
The above internal hazards were assessed and all of them were screened out. Internal hazards for which a PSA already exists (e.g. internal fires, internal floods) were not considered. As a result of the screening assessment, no new internal hazard was identified to be included in the PNGS-B PSA.
5.0 LEVEL 1 PSA METHODS
The goal of a Level 1 PSA is to identify occurrences at the plant that can cause a transient that would challenge fuel cooling, identify what systems can be credited to mitigate the event, what the impact of the transient may be on the mitigating systems, and to determine and quantify the degree of fuel damage that would occur if the mitigating systems fail.
Typically, the first PSA study for a station will be a Level 1 At-Power internal events PSA. Much of the effort of this study is in constructing models of what mitigating systems can be credited for a given transient, and how the mitigating systems can fail. In PSAs for other types of initiating events, e.g., internal fire, internal flood and seismic, much of the effort is associated with determining the impact these events have on the mitigating systems. The descriptions of the methodology for the various Level 1 studies in the following subsections reflect different requirements for the different studies.
The Level 1 At-Power PSA model was used to aid in the development and quantification of the outage, seismic, fire, and internal flood PSA.
5.1 Level 1 At-Power Internal Events
The At-Power Internal Events PSA for PNGS-B has been developed following the methodology for preparation of a Level-1 At-Power PSA as described in the Internal Events At-Power PSA Guide [R5].
The major activities of a Level 1 Internal Events PSA are listed below:
(a) Identification of initiating events based on a review of station-specific operating experience, generic industry operating experience and knowledge gained from
Report
OPG Proprietary Document Number: Usage Classification:
NK30-REP-03611-00021 N/A Sheet Number: Revision Number: Page:
N/A R001 27 of 121 Title:
PICKERING NUCLEAR GENERATING STATION B PROBABILISTIC SAFETY ASSESSMENT SUMMARY REPORT
N-TMP-10010-R010 (Microsoft® 2007)
previous risk assessment studies. The identification of initiating events is discussed in Section 5.1.1.
(b) Development of a scheme to group sequences into a manageable number of consequence categories based on degree of fuel damage. A discussion of fuel damage categories in PBRA is presented in Section 5.1.2.
(c) Development of event trees. Event trees are a tool that establishes what consequences can occur following a particular initiating event, given success or failure of the systems credited with mitigating the initiating event. Development of the PBRA event trees is discussed in Section 5.1.3.
(d) Development of system-level fault trees needed to quantify the probability of failure of the mitigating systems credited in the event trees. This includes the support systems that interface with mitigating systems. The development of the fault trees is discussed in Section 5.1.4.
(e) Development of a component reliability database with, to the extent possible, information specific to PNGS-B. The reliability database is needed to support the fault tree analysis mentioned above. The sources of the data in the component reliability database are also discussed in Section 5.1.4.
(f) Assessment of the effect of human error on accident progression and system performance using Human Reliability Analysis (HRA). The potential for human errors must be incorporated along with hardware failures in the event trees and system-level fault trees. Human error probabilities are systematically estimated and assigned. Human errors are referred to as “human interactions” in PBRA. The HRA is discussed in Section 5.1.5.
(g) Integration of event trees with the system-level fault trees, and risk quantification. This step combines the accident sequences developed in the event trees with the system logic contained in the fault trees to produce integrated fault trees representing each of the fuel damage categories. The frequency of each fuel damage category is then determined by quantifing the corresponding integrated fault tree. The integration process is described in Section 5.1.6.
Although the above listed tasks are carried out in the indicated order, the process is iterative in nature and entails re-assessing the results of a previous task based on insights gained from a subsequent one. The major activities of the Level-1 At-Power methodology are summarized in the subsections below.
5.1.1 Initiating Events Identification and Quantification
An initiating event (IE) is a disturbance at the plant that challenges reactor operation or fuel integrity either by itself or in conjunction with other failures. Identifying and quantifying the initiating events is the first step in the Level 1 PSA process.
In the Level 1 At-Power PBRA, consistent with the above definition, the initiating events under consideration are primarily those plant failures that could lead directly, or in combination with other failures, to damage of fuel in the reactor. The list of PBRA
Report
OPG Proprietary Document Number: Usage Classification:
NK30-REP-03611-00021 N/A Sheet Number: Revision Number: Page:
N/A R001 28 of 121 Title:
PICKERING NUCLEAR GENERATING STATION B PROBABILISTIC SAFETY ASSESSMENT SUMMARY REPORT
N-TMP-10010-R010 (Microsoft® 2007)
initiating events includes events leading to a hostile environment in the powerhouse, i.e., steam line breaks and feedwater line breaks. Although the Level 1 At-Power PBRA is an internal events PSA, it does include events associated with loss of off-site power (loss of the bulk electrical system) and events leading to failures in the service water intake (adverse conditions in the forebay).
The objective of the initiating event selection task was to obtain as complete coverage as possible of credible initiating events. To create the initiating event list, past Ontario Power Generation risk assessments were reviewed, as were the plant operating experience and station condition records, and other published PSAs. In addition, insights gained from the system-level fault tree modelling, discussed in Section 5.1.4, identified other initiating events. The complete list of initiating events considered in Level 1 At-Power PBRA is provided in Table 5.
The initiating events are quantified primarily using Bayes’ Theorem. In a Bayesian approach, an assessment is made of generic experience (prior) that is then updated by station-specific experience (posterior). This technique allows general experience and knowledge about a given event to be combined with actual operating experience gained with the station under study. It is especially useful for quantifying the frequency of events unlikely to be experienced within the lifetime of a single station. This is the industry standard method.
5.1.2 Fuel Damage Categorization Scheme
Each accident sequence, consisting of an initiating event and failures of mitigating systems, may potentially result in a different end state at the plant. The plant end states will vary in terms of the severity and timing of fuel damage. Fuel damage categorisation is carried out to simplify the subsequent evaluation of consequence and risk. Each Fuel Damage Category (FDC) represents a collection of event sequences judged to result in a similar degree of potential fuel damage. The FDCs are used as end-states in the Level 1 event trees, discussed in Section 5.1.3. In addition, groupings of the fuel damage categories are used to transition from the Level 1 PSA to the Level 2 PSA, discussed in Section 6.1.
The range of events or event sequences covered by the FDCs is defined by the scope of the PBRA. From the event tree analysis, described in Section 5.1.3, general types of accident sequences can be identified. They are presented below, in general order of decreasing severity of fuel damage:
(a) Severe Core Damage:
• Sequences with the potential for loss of core structural integrity.
(b) Limited Fuel Damage:
• Loss of fuel cooling requiring the moderator as a heat sink.
(c) Prolonged loss of heat sink.
Report
OPG Proprietary Document Number: Usage Classification:
NK30-REP-03611-00021 N/A Sheet Number: Revision Number: Page:
N/A R001 29 of 121 Title:
PICKERING NUCLEAR GENERATING STATION B PROBABILISTIC SAFETY ASSESSMENT SUMMARY REPORT
N-TMP-10010-R010 (Microsoft® 2007)
(d) Inadequate cooling to fuel in one or more core passes following a large loss of coolant accident (LOCA) with unsuccessful ECIS initiation.
(e) Sequences leading to fuel damage in one channel with and without an accompanying automatic containment isolation (button-up).
(f) Negligible Fuel Damage:
• Inadequate cooling to fuel in one or more core passes following a large loss of coolant accident (LOCA) with successful ECIS initiation.
The lower consequence threshold for significance is deemed to be the occurrence of a loss of heat transport system integrity resulting in ECI initiation. Although fuel damage is not likely, the event is considered to have the potential for significant economic consequence due to the downgrading of heavy water, and the loss of revenue due to prolonged shutdown of the accident unit. At the other extreme are the unlikely events that have the potential for severe consequences involving the loss of core structural integrity. Within this general framework, the objective has been to generate a categorisation scheme with as few categories as possible, while continuing to distinguish between the most important event characteristics that affect consequence.
The FDCs used in PBRA are presented in Table 6. These FDCs are also used to calculate the frequency of severe core damage, for comparison to the relevant Ontario Power Generation safety goal. Severe core damage is defined to be the sum of the FDC1 and FDC2 frequencies.
5.1.3 Event Tree Analysis
The potential for accidental release of fission products contained in nuclear fuel constitutes the main risk from a nuclear power plant. In the Level 1 analysis, event trees are used to systematically review the possible ways that radioisotopes can be released from the fuel and to distinguish between varying levels of fuel damage and isotope release resulting from different accidents.
Since a nuclear plant is a complex system, the search for accident sequences must be conducted in a systematic and structured manner. This analysis requires both a thorough understanding of the plant design, operation, maintenance and testing, and the ability to translate that understanding into a model of the plant that captures the logic of the sequences leading to fuel damage.
These sequences are constructed using inductive logic. The graphical representation of this inductive logic is called an event tree (ET). The start of this inductive method is the initiating event, usually a plant malfunction. Following the identification of the initiating events, the next step is to consider what systems are required to mitigate the event and show how the accident could progress if failures of the mitigating systems were also to occur, until a previously defined end state is reached.
Event tree analysis requires the following to be predefined:
(a) A list of initiating events to be considered.
Report
OPG Proprietary Document Number: Usage Classification:
NK30-REP-03611-00021 N/A Sheet Number: Revision Number: Page:
N/A R001 30 of 121 Title:
PICKERING NUCLEAR GENERATING STATION B PROBABILISTIC SAFETY ASSESSMENT SUMMARY REPORT
N-TMP-10010-R010 (Microsoft® 2007)
(b) Definition of sequence end states.
(c) Definition of mitigating systems.
A generic event tree for a large loss-of-coolant accident (LOCA) at a CANDU plant is presented in Figure 4 as an example. A LOCA is typically a pipe break in the heat transport system. Following a large LOCA, three systems are postulated to mitigate releases of radioisotopes: the shutdown systems, ECI and the heat sink function of the moderator system. The potential plant state must be assessed if one or more of these systems fail. These three systems form the branch points in the event tree. The event tree is read from the left, starting at the initiating event “IE-LOCA”. The first systems credited with preventing fuel damage are the shutdown systems. Failure of both SDS1 and SDS2 is represented by the event tree branch point “SD”. The shutdown systems, SDS1 and SDS2 are fast acting, diverse and independent systems. The convention used to interpret an event tree is that success of the system is the top branch of the event tree and failure is the lower. If the shutdown systems fail, rapid loss of core structural integrity is expected. This sequences is assigned to the FDC1 end state. If reactor shutdown is successful, the decay heat from the fuel must still be removed to prevent fuel damage. Two systems are credited for this function: automatic ECI injection and the moderator as a heat sink. If ECI fails, represented by the event tree branch point “ECI”, then the moderator is credited to prevent severe core damage. However, if the moderator system fails, a slow loss of structural integrity is expected. This end state is FDC2, one of the fuel damage categories included in the definition of severe core damage. If the moderator system is successful, the less severe FDC3 category is assigned. If both shutdown and ECI are successful, the end state FDC9 is reached. This category represents no significant fuel damage, and no releases to the public, but has significant economic consequences.
Once the Level 1 event trees have been created, the mitigating systems that have been identified in the event tree analysis require fault tree modelling to calculate the probability of failure of the mitigating function. Fault tree analysis is described in the next section.
5.1.4 Fault Tree Analysis
A fault tree (FT) is a logic diagram that models the possible causes of a particular fault, usually a system failure, and is used to calculate the probability that the fault occurs. In PBRA, fault trees are used to quantify the probability of the failure of the mitigating systems that appear in the event trees discussed in Section 5.1.3, and for their support systems. Table 7 lists the systems modelled by fault trees in the Level 1 At-Power PBRA. Figure 5 depicts the relationship between the event trees and fault trees. System fault tree analysis is used to calculate the probability of an event tree branch point given a specific set of events that fail the system.
Each fault tree is a logic diagram developed for a failure mode of interest, and is based on the understanding of system design and operation. At the top of the diagram the event itself is noted and termed the “top event”. The process of fault tree analysis is a deductive, systematic way of failure analysis whereby an undesired state of a system is specified (i.e., top event), and the system is analyzed in context of its environment
Report
OPG Proprietary Document Number: Usage Classification:
NK30-REP-03611-00021 N/A Sheet Number: Revision Number: Page:
N/A R001 31 of 121 Title:
PICKERING NUCLEAR GENERATING STATION B PROBABILISTIC SAFETY ASSESSMENT SUMMARY REPORT
N-TMP-10010-R010 (Microsoft® 2007)
and operation to find all credible ways in which the undesired state can occur. Thus, through this process, the contributors to the top event are identified.
For example, consider Shutdown System 1. For this system, the failure mode of interest might be “fails to shutdown the reactor when required”. Figure 6 shows a partially completed fault tree with this event at the top. Starting from this top event, the fault tree analyst poses the question “How can this event occur?”. The answer to this question becomes the inputs to this top event. For example, Figure 6 shows that Shutdown System 1 can fail if the rods fail, the shutoff logic fails, or if a combination of shutoff logic and rod failures occur. For each of these contributors, the process of examining how they can occur is repeated, until no further insights can be obtained about the behaviour of the system. Typically, the fault tree is developed either to predefined system boundaries, or to the individual system components.
In constructing a fault tree model, a number of design and operational features are assessed.
(a) System capability: For example, how many rods need to operate to shutdown the reactor?
(b) Fault detection: For example, if a component has failed, when and how can its failure be detected?
(c) Common cause failures (CCF): For example, if a component failed due to any number of causes, application of CCF will force the analyst to ask the question, would any other similar component fail for the same reason?
(d) Failure criteria: For example, what fundamental failure modes lead to failure of the Shutdown System 1?
(e) Fault tolerance: For example, if the electrical systems have failed what is the impact on the shutoff rods?
The basis for system capability and the failure criteria is based on analysis from a variety of sources, including the safety analysis contained in the PNGS-B Safety Report [R8], Operational Safety Requirements (OSR), Abnormal Incidents Manuals (AIMs), and assessments and regulatory submissions.
In principle, the fault tree analysis technique is straightforward. An undesired event is postulated and then, deductively, its contributors are identified. However, this process requires a detailed understanding of the system design and function, and how it behaves under fault conditions.
Once the fault tree is constructed, it is linked with the system reliability database, a database containing the information to calculate the probability of each event in the fault tree. In PBRA, failure rate, test and maintenance data are assigned to the fault tree primary events from a central type code table that is linked to the system reliability databases. This type code table defines failure rates for the various components at the PNGS-B. The use of the CAFTA compatible reliability database and a central type
Report
OPG Proprietary Document Number: Usage Classification:
NK30-REP-03611-00021 N/A Sheet Number: Revision Number: Page:
N/A R001 32 of 121 Title:
PICKERING NUCLEAR GENERATING STATION B PROBABILISTIC SAFETY ASSESSMENT SUMMARY REPORT
N-TMP-10010-R010 (Microsoft® 2007)
code table ensures that the same type of component is assigned the same failure rate for the same failure mode in all system fault trees.
The nuclear industry has adopted a Bayesian approach for obtaining component failure rates. The Bayesian approach is based on the use of both the generic “prior knowledge” and the plant-specific data in deriving the failure rates. Three industry sources, U.S. Nuclear Regulatory Commission (NRC) [R10], T-book [R11], and Westinghouse Savannah River Company [R12], were used for obtaining generic data. PBRA plant-specific data documented in the 2010 Annual Reliability Report [R13] were used for the Bayesian update.
The reliability database also contains information on human errors modelled in the fault tree and event trees. The analysis of human errors and their quantification are discussed in the next section.
5.1.5 Human Reliability Analysis
Human errors can affect the performance of systems, and in some cases be significant contributors to risk. Thus, HRA is an important part of PBRA. The potential for human errors must be incorporated along with hardware failures in the system level fault trees, and human error probabilities systematically identified and assigned.
The overall objective is to include all human interactions that can potentially lead to a significant increase in the probability of component or system failure and that are not already reflected in the plant failure rate database.
In principle, every piece of equipment or system in the plant is susceptible to failure because of human error; however, human errors that contribute directly to the failure of individual components are included in the equipment reliability database (i.e., reflected in the component failure rate) and need not be identified in fault trees. The human errors of interest to the fault tree analyst arise under five sets of circumstances:
(a) Where an otherwise operable component, subsystem or system can be disabled (i.e., prevented from performing its design function) prior to an initiating event;
(b) Where an annunciated equipment or system failure occurs but this failure is not responded to by the operator prior to an initiating event;
(c) Where an operator action or a closely related series of actions can cause more than one piece of equipment in parallel or redundant pathways to fail or become disabled simultaneously prior to an initiating event;
(d) Where an operator can fail to respond appropriately to bring the plant to a stable state following an initiating event (by not taking any action at all or taking the required action but in an inappropriate way); and,
(e) Where an operator can plausibly interfere with correct responses by inhibiting or activating a system.
Report
OPG Proprietary Document Number: Usage Classification:
NK30-REP-03611-00021 N/A Sheet Number: Revision Number: Page:
N/A R001 33 of 121 Title:
PICKERING NUCLEAR GENERATING STATION B PROBABILISTIC SAFETY ASSESSMENT SUMMARY REPORT
N-TMP-10010-R010 (Microsoft® 2007)
A human interaction in a fault tree identifies an opportunity for a human to make an error. Only those opportunities that arise in carrying out established plant operating practice are included; specifically, errors made during maintenance, testing, normal plant control, and post-initiating event control and recovery activities. In most cases, these errors would be made while carrying out formal procedures. Random, spurious, wilful, or vengeful actions are not included.
In order to systematically quantify the human interactions in the PBRA, Ontario Power Generation uses a human interaction taxonomy. This taxonomy classifies the human interactions in Level 1 At-Power PBRA into three parts: Part 1 contains the simple interactions that, by definition, occur prior to an initiating event; Part 2 contains complex human interactions that occur prior to initiating events; and Part 3 contains the complex interactions that occur after an initiating event.
Simple human interactions have the following characteristics:
(a) They are based on written or learned procedures (as opposed to cognitive or creative tasks).
(b) They involve directly manipulated components (e.g., a valve handwheel or a handswitch) or directly viewed main control room display devices.
(c) They occur prior to an initiating event.
The task of assigning preliminary (screening) human error probabilities for the simple human interactions is made easier and faster using a simple method requiring only selection of an unmodified basic human error probability and predefined modifying factors. This method quantifies the human interaction based on the type of task, the location where the task is performed, whether the error can be detected in the main control room, and if any annunciations or inspections can detect the error.
For the complex human interactions that occur prior to initiating events, the same process may be followed to obtain a preliminary (screening) quantification. These human interactions are complex because they include system-level functions that involve more than just direct physical manipulation of a component, such as the setting of computer control program parameters or modes.
Post-initiating event complex human interactions usually occur during abnormal conditions and are, therefore, more difficult to identify, analyze, and quantify. Additionally, interactions involved in handling unit upsets are also unlike other interactions as they may take place in dynamic and uncertain situations. Such actions depend upon the cognitive functions of diagnosis and decision-making. These actions are knowledge-based; they are based on fundamental principles of process and safety system operation and on understanding of the interactions amongst these systems. For the post-initiating event complex human interactions, the preliminary (screening) human error probabilities are assigned based on three criteria: whether the task is straightforward, of average complexity, or very complex; the time available; and the quality of indication available in the main control room to indicate that action is required.

Report
OPG Proprietary Document Number: Usage Classification:
NK30-REP-03611-00021 N/A Sheet Number: Revision Number: Page:
N/A R001 34 of 121 Title:
PICKERING NUCLEAR GENERATING STATION B PROBABILISTIC SAFETY ASSESSMENT SUMMARY REPORT
N-TMP-10010-R010 (Microsoft® 2007)
Human interactions that are identified as risk significant [R5] can be further refined using a methodolgy such as Technique for Human Error Rate Prediction (THERP).
5.1.6 Fault Tree Integration and Evaluation
The fault tree and associated failure rate data contain the information necessary to calculate the top event probability and identify the dominant contributors to failure for the individual system. Integration is the process of merging the system fault trees with the event trees to create logic for the fuel damage (i.e., Level 1) and release categories (i.e., Level 2). The end goal of the integration step is to develop a model that can be used to calculate the frequency of occurrence for each of the end states, i.e., the fuel damage categories and release categories. Combining this information in one model allows dependencies between systems to be identified and quantified correctly.
The information required to quantify the fuel damage categories is stored in the fault trees and event trees. In order to combine the two, the event tree logic is converted into fault tree logic with a top event for each fuel damage category. These fault trees are referred to as the high level logic. The events in the high level logic are the initiating events and the branch points from the event trees. The high level logic is then integrated with the mitigating system fault trees; the top events in the mitigating system fault trees are inserted where the mitigating system branch point labels exist in the high level logic model. Finally the support systems are added to the integrated high level logic fault tree. Figure 7 illustrates this process.
The CAFTA software is used to evaluate the integrated fault trees. The CAFTA program was developed by EPRI [R9]. The FTREX program is used as the solution engine to quantify the results [R15].
The solution of a fault tree is expressed as a listing of the combination of an initiating event, equipment failures, and human errors that leads to the occurrence of the integrated fault tree top event, with each combination containing the minimum number of failures that have to occur to cause the top event. Such combinations are called minimal cutsets.
The solution of the fault tree calculated using CAFTA is truncated. That is to say, contributors below a certain frequency are not included in the solution. Truncation is necessary because of computational limits. The truncation limit selected should be low enough that all significant contributors are captured. The Level 1 At-Power PSA Guide recommends that the solution of the integrated fault tree for each FDC be truncated at either 4 orders of magnitude below the most likely minimal cutset in that FDC or at 1E-12 occ/yr, whichever is the highest. For FDC2, the top cutset frequency is in the 1E-06 occ/yr range, and a truncation of 1E-11 occ/yr is used.
Following the development of the baseline PSA results, an additional understanding of the station risk is obtained by supplementing the baseline solution with the following:
• Accident sequence quantification to provide sequence by sequence cutset ranking;
Report
OPG Proprietary Document Number: Usage Classification:
NK30-REP-03611-00021 N/A Sheet Number: Revision Number: Page:
N/A R001 35 of 121 Title:
PICKERING NUCLEAR GENERATING STATION B PROBABILISTIC SAFETY ASSESSMENT SUMMARY REPORT
N-TMP-10010-R010 (Microsoft® 2007)
• Importance analysis to identify systems and components that are important to the FDC results;
• Parametric uncertainty analysis to determine the lower and upper limits of the two-sided 90% confidence interval for the frequency of each FDC; and
• Sensitivity analysis used to evaluate the impact on the results of a number of assumptions made in the event tree analysis and fault tree analysis, as well as assumptions impacting the quantification of initiating events, undeveloped events, and human error events.
Recall from Section 3.0 that risk has two components: the frequency of occurrence and the consequences. Section 5.1.1 to Section 5.1.6 described the methods used to quantify the frequency of occurrence of the fuel damage categories. The Level 1 analysis is used an input to the Level 2 analysis described in Section 6.0. The remaining subsections in Section 5.0 describe the differences in methodology for Level 1 assessment for the outage state, and for fire, internal flood, and seismic initiators.
5.2 Outage Internal Events
The Level 1 At-Power PBRA considers internal events occurring at 100% full power operation. However, the PNGS-B has periods of planned outage to perform routine maintenance and testing that cannot be done during full power operation. Typically, a unit has a planned outage for less than 10% of the operating cycle. The reactor power continues to decrease exponentially after reactor shutdown.
The 2017 Level 1 Outage PBRA (PBRA-L1O) has been developed as a bounding update of the 2012 PBRA-L1O, developed following the methodology for preparation of a Level-1 Outage PSA as described in the OPG Outage PSA Guide [R14]. The Outage PSA uses many of the same techniques as used in the At-Power PSA. The PSA process for outage uses initiating events, event tree analysis and fault tree analysis, much like the At-Power PSA. However, different initiating events can occur in the outage state, and the event tree and fault tree must reflect the plant configurations during the outage (e.g. HT system pressurized or depressurized). The plant configurations modelled as part of the outage PSA are typically described as plant operational states (POS).
Determining the possible plant configurations is a major part of the outage PSA and is described in the next section.
5.2.1 Plant Operational State Identification and Analysis
The purpose of Plant Operational State analysis is to define the various outage plant scenarios and group them into fewer, representative and bounding states for which the plant status, configurations and system failure criteria are considered sufficiently stable. POS analysis is unique to Outage PSA. During unit shutdown, plant system configurations and parameters are dynamic, changing with respect to time. The dynamic nature of shutdown, specifically system configurations, process parameters and varying system failure mechanisms, result in an excessively large number of
Report
OPG Proprietary Document Number: Usage Classification:
NK30-REP-03611-00021 N/A Sheet Number: Revision Number: Page:
N/A R001 36 of 121 Title:
PICKERING NUCLEAR GENERATING STATION B PROBABILISTIC SAFETY ASSESSMENT SUMMARY REPORT
N-TMP-10010-R010 (Microsoft® 2007)
unique plant scenarios to be analyzed. In the definition of the POSs, only normally planned plant configurations are considered.
Firstly, Pre-Plant Operational States (Pre-POSs) are identified; Pre-POSs are defined as unique outage plant configurations wherein all parameters of interest (system configuration and parameters, e.g., heat transport system pressure, primary heat sink, HTS level) are considered stable for the duration of the state. Pre-POS are the highest resolution of the outage states. The Pre-POSs are grouped into POSs. For the Level 1 Outage PBRA, eight pre-POSs were identified and have been grouped into five representative POSs. The five POSs are used in other aspects of the Outage PSA, including accident sequence analysis using event trees. Table 8 provides a summary of the final POSs used in the Level 1 Outage PBRA model. The parameters used to define the POSs are listed in the leftmost column.
5.2.2 Initiating Event Identification and Quantification
The development of a Level-1 Outage PSA requires the identification, grouping and quantification of a set of outage initiating events that could occur during the identified outage POSs. An outage initiating event is defined as a malfunction that can, either independently or in conjunction with other plant conditions or configurations, lead to fuel damage when the unit is in the guaranteed shutdown state. The process described below was used to identify, group and quantify outage state initiating events:
• The outage IE identification process uses a number of different steps and different sources of information, so that the basis for the Outage PSA is as comprehensive as possible.
• The identified IEs are grouped on the basis of similar mitigation requirements, in order to simplify the accident sequence analysis.
• The frequency of occurrence of each initiating event (or IE group) is estimated, so that the overall risk of core damage can be calculated.
Table 9 presents the list of outage initiating events for the Level 1 Outage PBRA, and which POS each initiating event can occur in. Some initiating events can occur only in specific plant configurations. For example, ice-plugs are used during some maintenance activities on the HT system, but can only be used while the HT system is depressurized.
5.2.3 Outage Event Tree Analysis and Fuel Damage Category Analysis
The event tree process for the internal outage events trees is similar to that used for the at-power event trees described in Section 5.1.3. The overall process followed to develop the ETs for PBRA-L1O is as follows:
1. For each unique IE/POS combination, identify the mitigating systems credited for the IE based on a review of the accident analysis and plant operating procedures.
Report
OPG Proprietary Document Number: Usage Classification:
NK30-REP-03611-00021 N/A Sheet Number: Revision Number: Page:
N/A R001 37 of 121 Title:
PICKERING NUCLEAR GENERATING STATION B PROBABILISTIC SAFETY ASSESSMENT SUMMARY REPORT
N-TMP-10010-R010 (Microsoft® 2007)
2. Determine the end states of interest in the ET analysis. For the Level 1 Outage PBRA, the outage fuel damage categories as shown in Table 10.
3. Develop the accident sequence logic depending on the success and failure of the mitigating functions credited for the IE.
4. Add the branch point label for each mitigating system failure as the logic is being developed on the failure branch of the ET.
5. Assign a FDC to each ET sequence end state.
5.2.4 Outage System Fault Tree Analysis
The fault tree analysis process for the internal outage PSA is the same as for the at-power PSA. However, the fault tree models are significantly different to reflect the outage configurations of the system.
The system FT models are specific to the outage PSA. Each fault tree includes a brief overview of the system analyzed, top event definitions, assumptions, failure criteria, FT diagram, data table, results expressed as minimal cutsets, system failure probability and importance indices. Table 7 lists the systems modelled by fault trees in PBRA-L1O.
5.2.5 Reliability Data Analysis
The objective of reliability data analysis is to derive the reliability data assigned to the primary events modelled in the PBRA-L1O system fault trees. Primary events include basic events (e.g., component hardware failures), conditioning events (i.e., events used to specify a condition or restriction that applies to the fault tree logic), developed events (i.e., specific fault events related to external interfaces which are typically developed in separate fault tree models), and undeveloped events (i.e., specific fault events not amenable to further development and so quantified using specialized methods).
Like in the at-power PSA, a Bayesian approach is used for obtaining component failure rates. Conditioning events, developed events, and undeveloped events, for which component failure rates are not applicable, are also quantified using one of the following methods:
• Operational events are quantified from observation of operating experience; or
• Analytical events have a probability of occurrence that is determined from the results of analytical models outside of the fault tree, engineering judgement, or both.
5.2.6 Human Reliability Analysis
The possibility of component or system failure due to human error is recognized by the inclusion of human interactions in the FTs and ETs. The scope of the HRA includes inadvertent errors by plant operators or maintainers that may contribute to the failure
Report
OPG Proprietary Document Number: Usage Classification:
NK30-REP-03611-00021 N/A Sheet Number: Revision Number: Page:
N/A R001 38 of 121 Title:
PICKERING NUCLEAR GENERATING STATION B PROBABILISTIC SAFETY ASSESSMENT SUMMARY REPORT
N-TMP-10010-R010 (Microsoft® 2007)
of systems or components but excludes consideration of arbitrary or wilful actions. Ultimately, the human error probabilities are combined with equipment failures in the system FT to provide the overall probability of the top event. In the ETs, the human error probabilities are addressed along with system and/or equipment failures to provide accident sequence frequencies.
While the methodology for quantifying human interactions in the Outage PSA is generally the same as in the At-Power model (see Section 5.1.5), the effort required to identify, quantify and model human interactions in Outage PSA is not trivial. The human interactions during outage states require the consideration of the many testing and maintenance activities, procedures, and manual initiation of certain mitigating systems. The outage POSs and system configurations are considered to better understand required operator actions, recall actions, and possible testing and maintenance activities during a given POS.
5.2.7 Model Integration, Quantification, and Additional Analyses
Once the event trees and fault trees are developed, they are linked to determine the frequencies with which various fuel damage consequence categories can occur. Categories, here, are groupings of sequences with similar consequences. As the linked models can be of large size, computer aided methods are used to carry out the computations. The results are expressed in terms of the expected number of occurrences of the consequence category per unit time (i.e., frequency). Only those failure combinations that have frequencies greater than a certain cut-off value are listed. The frequency of the consequence category is obtained by summing the frequency of each sequence belonging to that category.
For outage severe core damage consequence categories (e.g., FDC2-SD), the magnitude of the associated consequence was assessed. The product of frequency and consequence is calculated for each FDC2-SD sequence and summed to obtain an overall estimate of risk. These are used in absolute terms to assess the overall safety design adequacy, and in relative terms to identify the dominant risk contributors. The acceptability of the PNGS-B risk estimates is judged based on comparison with the risk-based safety goals established by OPG [R4].
5.3 At-Power Internal Fire
The PBRA-FIRE assessment has been developed following the methodology for preparation of an internal fire PSA as described in the OPG Fire PSA Guide [R16]. The OPG Fire PSA Guide has been developed based on NUREG/CR-6850 [R17]. The major activities of the fire PSA methodology and its application in the development of the PBRA-FIRE assessment are summarized in the subsections below.
An internal fire PSA is built from the internal events PSA. The scope of the PBRA-FIRE model is limited to internal fires occurring while the unit is at power with the potential to cause severe core damage. The purpose of a fire PSA is to estabilish whether the design and operation the plant poses an acceptable level of risk to the public and to identify the major sources of risk due to interal fires.
Report
OPG Proprietary Document Number: Usage Classification:
NK30-REP-03611-00021 N/A Sheet Number: Revision Number: Page:
N/A R001 39 of 121 Title:
PICKERING NUCLEAR GENERATING STATION B PROBABILISTIC SAFETY ASSESSMENT SUMMARY REPORT
N-TMP-10010-R010 (Microsoft® 2007)
The PBRA-FIRE model considers sequences that result in severe core damage. Severe core damage states includes the FDC1 and FDC2 sequences. However, severe core damage in PNGS-B is dominated by the FDC2. In the PNGS-B fire PSA, therefore, FDC1 sequences (failure to shutdown the reactor) are not assessed due to the low frequency in the internal events model, the fail safe design of the two shutdown systems (SDS1 and SDS2), and the physical separation of SDS1 and SDS2 which makes it unlikely that a fire could impact both shutdown systems.
5.3.1 Phased Approach to Fire PSA
The fire PSA Guide describes a phased evaluation of internal fire risks. This phased approach develops the overal fire PSA in a manner that focuses on the most risk signficant areas and use more conservative or screening approaches for non-risk signficant contributors. In each phase, appropriate technical bases and methods are applied; the difference is in the degree to which simplifying assumptions are made as the significant contributors to risk are addressed.
Phase 1 focuses on areas of the plant that contain equipment / cables from both Group 1 and Group 2. These areas, called pinch points, represent the highest potential for risk-significant fires. Areas of the plant containting cables and equipment from only one Group, or one division of one Group, are of limited interest in Phase 1 as signficant mitigating capability is known to be available.
Phase 2 involves more detailed analysis of the potentially risk-contributing plant fire areas identified in Phase 1. Both phases address the effect of fires upon the reference Unit 5 and upon common systems and areas that can impact Unit 5 operation (e.g., Emergency Power Generators and Main Control Room). In PNGS-B fire PSA, both phases have been performed to meet S-294 objectives [R1].
The objectives of the Fire PSA were:
• To identify areas of the plant with particular vulnerability to fires while the reactor is at high power;
• Identify fire scenarios that potentially have the greatest contribution to risk while the reactor is at high power;
• Characterize differences between the units that may affect risk;
• Analyze multi-unit fire scenarios; and,
• Provide an estimate of SCDF and LRF for both single-unit and multi-unit scenarios.
The fire PSA logic is based on the internal events PSA logic for the forced shutdown event tree. The major tasks in the fire PSA are associated with identifying possible fire scenarios, the zones the fires can impact, affected equipment and cables, and quantifying the consequences of the fire scenarios.
Report
OPG Proprietary Document Number: Usage Classification:
NK30-REP-03611-00021 N/A Sheet Number: Revision Number: Page:
N/A R001 40 of 121 Title:
PICKERING NUCLEAR GENERATING STATION B PROBABILISTIC SAFETY ASSESSMENT SUMMARY REPORT
N-TMP-10010-R010 (Microsoft® 2007)
The OPG fire PSA methodology is broken down into 18 tasks:
Task 1 – Plant Boundary Definition and Partitioning Task 2 – Fire PSA Component Selection Task 3 – Fire PSA Cable Selection Task 4 – Qualitative Screening Task 5 – Fire-Induced Risk Model Task 6 – Fire Ignition Frequencies Task 7 – Quantitative Screening Task 8 – Scoping Fire Modeling Task 9 – Detailed Circuit Failure Analysis Task 10 – Circuit Failure Mode Likelihood Analysis Task 11 – Detailed Fire Modeling Task 12 – Post-Fire Human Reliability Analysis Task 13 – Seismic-Fire Interactions Assessment (outside the scope of the
PNGS-B Fire PSA, addressed through alternate methodology) Task 14 – Fire PSA Level 1 Quantification Task 15 – Uncertainty and Sensitivity Analysis Task 16 – Fire PSA Documentation Task 17 – Fire PSA Level 2 Quantification Task 18 – Alternate Unit Assessment
The integration of these tasks is shown in Figure 8. The methods described in the fire PSA Guide are iterative. Several of the tasks listed above involve calculation of severe core damage frequency due to fires in various plant locations. With each subsequent calculation, the methods used to assess the risk for the various scenarios are refined. This iterative approach is used to identify high risk areas and to focus the detailed fire analysis on these areas. A brief summary of the methodology used for PBRA-FIRE is provided in the following sections.
5.3.2 Plant Boundary Definition and Partitioning (Task 1)
This first task in the fire PSA involves the division of the plant into discrete areas called physical analysis units (PAUs). This requires defining the global boundary analysis to ensure that those plant areas where a postulated fire could impact the PSA are included in the analysis. Once the global analysis boundary is defined, the buildings that are within the boundary are examined for potential sub-division into PAUs. The PAUs used in the PBRA-FIRE assessment are based on those identified in the PNGS-B Fire Protection Program documented in the Fire Hazard Assessment (FHA) and Fire Safe Shutdown Analysis (FSSA) [R21]. This approach allows the fire PSA to rely on the existing programmatic controls and design requirements for maintaining the integrity of the associated compartment boundaries.
5.3.3 Fire PSA Component (Task 2) and Cable Selection (Task 3)
The development of a fire PSA requires identifying components and their associated cables necessary for safe shutdown and long-term decay heat removal following a fire. A fire can affect the equipment / cables credited for safe shutdown by either being in the same area as the credited equipment or by being in the same area as the cables related to the credited equipment.
Report
OPG Proprietary Document Number: Usage Classification:
NK30-REP-03611-00021 N/A Sheet Number: Revision Number: Page:
N/A R001 41 of 121 Title:
PICKERING NUCLEAR GENERATING STATION B PROBABILISTIC SAFETY ASSESSMENT SUMMARY REPORT
N-TMP-10010-R010 (Microsoft® 2007)
The purpose of these tasks is to identify the equipment / associated cables to be included in the fire PSA, determine where in the plant, and in which PAU they are located.
The selection of PSA-credited equipment / cables required for safe shutdown following a fire is based on the systems credited in the PNGS-B FSSA.
5.3.4 Qualitative Screening (Task 4)
This task involves the identification of the physical analysis units that can be shown to have little or no risk signficance without quantitative analysis. The PAUs can be screened if they do not contain PSA-credited coponents or cables, and cannot propagate fires into PAUs containing such components and cables, and if they cannot lead to a plant trip due to either plant procedures, an automatic trip signal, or OP&P requirements. This task was not done as a separate task but included as part of Task 1 in PBRA-FIRE.
5.3.5 Fire-Induced Risk Model (Task 5)
This task involves the development of a logic model that reflects plant response following a postulated fire. This requires modification and / or manipulation of the at-power internal events PSA model to produce a fire-induced risk model, including fire-induced impact on operators’ response following a fire, as discussed in Task 12. That model is used to calculate conditional core damage probabilities for postulated fires (e.g., scenarios from Tasks 7, 8 and 14).
5.3.6 Fire Ignition Frequencies (Task 6)
To calculate the risk due to an internal fire, fire ignition frequencies (FIFs) for each PAU identified in Task 1 should be assessed. The FIFs were calculated based on generic data in NUREG/CR-6850 and Supplement 1 [R18] and the plant populations of equipment that can be an ignition source (e.g. pumps, electrical equipment), identified by plant walkdowns and other appropriate means (e.g., PNGS-B design inputs such as equipment layout drawings).
Unit 5 is used as the reference unit for PNGS-B with consideration of applicable shared sysems and areas that could impact Unit 5 operation. The calculation of FIFs for Unit 5 and common areas, however, required calculation of FIFs for all of the PAUs that are within analysis boundary. This was accomplished by:
1. Conducting fixed ignition sources (FISs) walkdowns of Unit 5 PAUs; and,
2. Assuming that Unit 5 is spatially representative of the other three operating units, replicating the Unit 5 FISs walkdown data for PAUs in Units 6, 7 and 8.
Canadian CANDU fire experience data was reviewed to determine the applicability of using the NUREG/CR-6850 generic data [R18]. The qualitative review of CANDU operating experience with fire events found Canadian experience sufficiently similar to U. S. experience documented in NUREG/CR-6850 [R18]. It was concluded that it is
Report
OPG Proprietary Document Number: Usage Classification:
NK30-REP-03611-00021 N/A Sheet Number: Revision Number: Page:
N/A R001 42 of 121 Title:
PICKERING NUCLEAR GENERATING STATION B PROBABILISTIC SAFETY ASSESSMENT SUMMARY REPORT
N-TMP-10010-R010 (Microsoft® 2007)
reasonable to use that industry-wide generic data for fire bin frequencies for PBRA-FIRE.
The fixed ignition sources fire frequency, the transient ignition sources fire frequency and the total fire ignition frequency were calculated for each PAU identified in Task 1.
5.3.7 Quantitative Screening (Task 7)
The development of a fire PSA allows a quantitative screening of PAUs based on their contribution to fire risk. This task considers the cumulative risk associated with the screened PAUs (i.e., thoses that are not retained for detailed analysis) to ensure that a true estimate of fire risk profile is obtained. With the information from the fire risk model and fire ignition frequencies (described in Sections 5.3.5 and 5.3.6), the contribution to severe core damage for each PAU can be calculated. Based on the severe core damage contribution of each PAU, the areas of the plant are further screened, using quantitative screening criteria from Reference [R18].
Areas of the plant that are screened out of the analysis during this step are still retained and included in the final fire-induced risk estimates (e.g., SCDF and LRF). They are excluded from further refinement of fire scenarios in risk-significant areas.
5.3.8 Scoping Fire Modeling (Task 8)
This task is intended to provide a conservative and simplied means to develop a initial refinement to the bounding treatment in Task 7. It involves the use of generic fire models [R19] for various fire ignition sources such that simple rules can be used to define and screen fire ignition sources (and therefore fire scenarios) in an unscreened PAU. The generic fire models can be also used to develop simplified treatments for specific fire ignition sources and their impact on nearby targets (cables) and thereby eliminate the need for numerous explicit detailed fire modeling analyses. The information from these models was combined with walkdown information using raceway identifiers to characterize the extent of fire impact to plant systems.
This task has two main objectives:
• To screen out those fixed ignition sources that do not pose a threat to the targets within a specific fire compartment; and,
• To assign severity factors to unscreened fixed ignition sources.
To meet these objectives, Task 8 developed fire scenarios for the unscreened PAUs from Task 7, and assigned conditional core damage probability cases to each scenario.
5.3.9 Detailed Circuit Failure (Task 9) and Failure Mode Likelihood Analysis (Task 10)
The development of a full-scope fire PSA requires detailed circuit failure analysis and circuit failure mode and likelihood analysis. The purpose of these analyses is to identify additional components and cables to include in the scope of this analysis. Tasks 9 and 10 only need be applied to cables that have not previously analyzed in
Report
OPG Proprietary Document Number: Usage Classification:
NK30-REP-03611-00021 N/A Sheet Number: Revision Number: Page:
N/A R001 43 of 121 Title:
PICKERING NUCLEAR GENERATING STATION B PROBABILISTIC SAFETY ASSESSMENT SUMMARY REPORT
N-TMP-10010-R010 (Microsoft® 2007)
the FSSA. Since no components and cables were added, these analyses were not been required and therefore have not been performed.
5.3.10 Detailed Fire Modeling (Task 11)
Detailed fire modeling can be used to address risk-signficant scenarios in cases where the Task 8 results in Section 5.3.8 are producing overly conservative treatments. The applciation of fire ignition source (scenario) specific fire modeling can be assessed and detailed modeling can be performed only in those instances where such analyses produce substantially improved results. This task was not performed for individual risk-signficant scenarios, but was performed for:
• Main Control Room Abandonment scenarios; and
• Hot Gas Layer (HGL) and Multi-Compartment scenarios.
The abandonment times for operators in the PNGS-B Main Control Room (MCR) envelope were assessed for electrical equipment fires and for transient combustible fires within the MCR envelope, in accordance with the methodologies in Reference [R17].
The purpose of multi-compartment analysis is to calculate the probability of compartment interaction caused by a hot gas layer due to smoke propagation. The calculation is the product of multiplying the probability of a hot gas layer in the PAU (i.e., the probability that the fire creates a hot smoke layer) by the PAU barrier failure probability (i.e., failure of fire doors, dampers and penetrations). The multi-compartment analysis used the hot gas layer development timing defined in Reference [R19].
5.3.11 Post-Fire Human Reliability Analysis (Task 12)
A review of PBRA-L1P was performed to identify the post-initiator operator actions modeled as human failure events along with their associated human error probability (HEP); pre-initiator operator actions and operator actions associated with non-fire induced events were excluded from consideration.
For each human failure event that represents a post-fire operator action, HEP multipliers were developed for fire HEP adjustments. The method for fire HEP adjustment considered the following factors:
• Location (either inside the MCR actions or outside the MCR actions);
• Time available (based on PBRA-L1P HRA documentation);
• Complexity of the action (based on PBRA-L1P HRA documentation);
• Availability of instrumentation; and
• Availability of path to equipment for field actions.
Report
OPG Proprietary Document Number: Usage Classification:
NK30-REP-03611-00021 N/A Sheet Number: Revision Number: Page:
N/A R001 44 of 121 Title:
PICKERING NUCLEAR GENERATING STATION B PROBABILISTIC SAFETY ASSESSMENT SUMMARY REPORT
N-TMP-10010-R010 (Microsoft® 2007)
Based on the factors above, all the post-initiator operator actions from the PBRA-L1P were reviewed and their HEP values were adjusted by multiplying a factor of 1 to 30. No additional post-initiator operator actions were credited for potential post-fire shutdown actions that were not already modeled in the PBRA-L1P model. All the adjusted post-fire HEP values were applied for all the CCDPcases in final fire-induced risk quantification.
5.3.12 Fire Level 1 PSA Quantification (Task 14)
The development of a fire PSA requires the integration of the fire risk model with the damage consequences calculated for each scenario. The development of the fire risk quantification is typically an iterative process. As various analysis refinement strategies are developed, they are incorporated into the fire risk model.
The scope of work for fire quantification involves the use of the fire PSA model, described in Section 5.3.5, to quantify the CCDP for each of the fire PSA scenarios.
The scoping fire modeling (Task 8) provided a conservative and simplified means to develop an initial refinement to the bounding treatment in the quantitative screening (Task 7). The scope of work for this task involves the use of the fire PSA model with the adjusted post-fire HEPs (Task 12) and the performance of quantifications of a new set of CCDP cases refined specifically for this task for purposes of obtaining SCDF estimates. In the quantitative screening (Task 7), the SCDF estimates were done conservatively at the PAU level. In the final quantification, information gathered during walkdowns conducted for scoping modelling and additional analysis of other PNGS-B design inputs (e.g., equipment and cable tray layout drawings) was used to refine treatment of PAUs that had high estimated SCDFs in initial bounding assessment (Task 7). This refinement typically divided risk significant PAUs into multiple fire initiating events (scenarios) to represent individual fire ignition sources. In some cases, multiple fire ignition sources in a PAU were grouped and treated as a single fire initiating event so long as such grouping did not result in overly conservative risk estimates.
The SCDF contribution from the PAUs that were screened out as part of quantitative screening analysis was included in the final fire-induced SCDF estimate.
5.3.13 Uncertainty and Sensitivity Analysis (Task 15)
The development of a risk assessment inherently results in the introduction of uncertainty in the anlaysis results. In general, the sources of uncertainty for each of the fire PSA development tasks are dicussed in the industry reference document [R17]. Much of the potential burden associated with this task can be mitigated to a large degree through careful selection of input parameters. The treatment of uncertainty and sensitivity is primarily limited to those fire scenarios where the refinements described in Tasks 8 through 12 were applied, because these scenarios would have been significant risk contributors. Other fire scenarios that were subjective to less agressive refinements are expected to maintain a degree of conservatism so that their treatment would more closely resemble that of an ‘upper bound’ analysis.
Report
OPG Proprietary Document Number: Usage Classification:
NK30-REP-03611-00021 N/A Sheet Number: Revision Number: Page:
N/A R001 45 of 121 Title:
PICKERING NUCLEAR GENERATING STATION B PROBABILISTIC SAFETY ASSESSMENT SUMMARY REPORT
N-TMP-10010-R010 (Microsoft® 2007)
5.3.14 Level 2 Analysis (Task 17)
This task is built on the results of the Level 1 quantification to consider the Level 2 impacts of fire scenarios. If scenarios were identified in Level 1 that would affect multiple units such as fires impacting the MCR or fire impacting common systems and / or common cable trays, then the multi-unit impact on Level 2 functions was quantified.
The approach for the treatment of Level 2 consisted of three steps. The first two steps involved a screening process. The objective of these screening steps was to identify and exclude those fire initiating events that represent a negligible contribution to the overall plant risk. The overall fire PSA development is based on having divided the plant into multiple PAUs. Within each PAU, the fire ignition sources are identified and addressed resulting in a number of individual fire initiating events (scenarios).
Those fire scenarios that remained after the screening process were subjected to the third step, an assessment of the impact of the fire scenario on containment and the application of modification factors to generate an estimate of the LRF. Containment failure can be prevented given severe core damage in a single unit if the accident progression is terminated in the calandria with injection of EME makeup to the calandria; this is referred to as late In-Vessel Retention (IVR). The impact of each of the remaining scenarios on EME is assessed for the potential to support IVR with each scenario assigned a status of None or Complete.
As well, each remaining scenario was assigned one of three levels of containment impact: None, Degraded, or Complete. For single-unit scenarios assessed to have no impact on containment due to successful IVR, an additional factor representing Conditional Containment Failure Probability was applied to the scenario frequencies to determine their contribution to the LRF. For single-unit scenarios assessed to create a degraded containment condition, or a complete failure of containment, the scenario SCDF is reported without adjustment as the LRF. For scenarios causing the shutdown of two or more units, the SCDF is also reported without adjustment as the LRF irrespective of the impact of the fire itself on the containment systems.
5.3.15 Alternate Unit Analysis (Task 18)
The scope of work resulted in specific numerical results for the Unit 5 PAUs and other site PAUs that are common to all four units. Quantification of separate SCDFs and release frequencies for Units 6, 7, and 8 are not specifically included. Because fire risk characterization is needed for the entire plant site, the anticipated symmetry / consistency in the design and construction of the entire four unit site is being relied upon to support a qualitative approach.
A side-by-side comparison of the Unit 6, 7 and 8 PAUs to the analyzed Unit 5 PAUs was created using fire zone information from the FSSA, the FHA, and Tasks 1and 6. Equipment layout drawings and general arrangement drawings were also consulted. A walkdown was performed to assess the differences between the units. The walkdown confirmed the physical differences between the units are relatively minor.
Report
OPG Proprietary Document Number: Usage Classification:
NK30-REP-03611-00021 N/A Sheet Number: Revision Number: Page:
N/A R001 46 of 121 Title:
PICKERING NUCLEAR GENERATING STATION B PROBABILISTIC SAFETY ASSESSMENT SUMMARY REPORT
N-TMP-10010-R010 (Microsoft® 2007)
5.4 At-Power Internal Flood
The OPG Internal Flooding PSA Guide [R20] describes the methodology used to quantify the risk due to internal flooding. Similar to the Fire PSA, the guide prescribes using a two phased approach. If the results of the first phase are satisfactory, then only the first phase is implemented. For PNGS-B, a Phase 2 Flood PSA was not required.
Like the fire PSA described in Section 5.3, the impacts of internal flooding events are related to the physical location of equipment in the plant. The station must be divided into areas, and the potential initiators in each area assessed, and the impacts of the initiators determined.
The flooding analysis is focused on two primary objectives: areas of the plant that contain equipment from both Group 1 and Group 2 systems (referred to as “pinch-points”), or areas which might completely disable all of Group 1 or Group 2, as these areas represent the highest potential for degradation of the plant mitigation capability; and conservative estimation of risks associated with the other areas of the plant. A major input into the Internal Flooding PSA is the At-Power Internal Events PSA (PBRA-L1P). The At-Power Internal Events PSA is used to determine which components need to be evaluated for flooding impacts, and is also used as the basis for the quantification of the internal flooding severe core damage frequency.
The construction of the Internal Flood PSA requires the following tasks:
Task 1 - Identification of Flood Areas and affected Systems Structures and Components.
Task 2 - Identification of Flood Sources.
Task 3 - Plant Walkdowns.
Task 4 - Internal Flood Qualitative Screening.
Task 5 - Potential Flood Scenario Characterization.
Task 6 - Internal Flooding Initiating Event Frequency Estimation.
Task 7 - Flood Consequence Analysis.
Task 8 - Evaluate Flood Mitigation Strategies.
Task 9 - PSA Modelling of Flood Scenarios.
Task 10 - Level 1 PSA Quantification.
Figure 9 shows the tasks for the flooding PSA.
The flooding PSA focuses on sequences that lead to severe core damage (FDC1 and FDC2) caused by an internal flood. Failure to shutdown sequences (FDC1) are not
Report
OPG Proprietary Document Number: Usage Classification:
NK30-REP-03611-00021 N/A Sheet Number: Revision Number: Page:
N/A R001 47 of 121 Title:
PICKERING NUCLEAR GENERATING STATION B PROBABILISTIC SAFETY ASSESSMENT SUMMARY REPORT
N-TMP-10010-R010 (Microsoft® 2007)
quantified as the frequency of FDC1 is several orders of magnitude lower than FDC2 in the PBRA-L1P model (see Table 15) and the potential for flooding events to adversely affect the shutdown systems, which fail safe on loss of power or loss of actuation inputs, is minimal.
5.4.1 Identification of Flood Areas, and affected SSCs (Task 1)
Like the fire PSA, the first step of the flooding PSA is to partition the plant into the flood areas that will form the basis of the analysis. As part of this task the flood areas are defined based on physical barriers, mitigation features, and propagation pathways. The flood areas were defined based on the partitions in the FSSA [R21].
Once the flood areas are defined, the SSCs in each flood area modelled by the internal event PSA are identified.
For the PBRA-FLOOD model, once the flood areas were identified, they were screened using qualitative arguments as described in the following section. After the initial screening, those unscreened areas were reviewed for the impact on equipment credited in the PSA, and the possible flood sources in the area.
5.4.2 Identification of Flood Sources (Task 2)
This task identifies the potential flood sources in the plant and includes the following sub-tasks:
• Identify or confirm flood sources in each flood area.
• Determine or confirm flooding mechanisms associated with each flood sources.
• Determine or confirm the characteristics of each flooding mechanism.
• Identify or confirm drains and sumps.
• Identify flood propagation paths.
5.4.3 Plant Walkdowns (Task 3)
This task supports the other flooding PSA tasks by identifying or confirming plant data by observing it at the plant during walkdowns.
5.4.4 Internal Flood Qualitative Screening (Task 4)
This step performs a qualitative screening considering the sources of flooding, the flood propagation pathways and the consequences of the flood. The objective is to qualitatively screen out many low risk internal flood scenarios.
The following rules were used when screening:
• Screening criteria for flood areas:

Report
OPG Proprietary Document Number: Usage Classification:
NK30-REP-03611-00021 N/A Sheet Number: Revision Number: Page:
N/A R001 48 of 121 Title:
PICKERING NUCLEAR GENERATING STATION B PROBABILISTIC SAFETY ASSESSMENT SUMMARY REPORT
N-TMP-10010-R010 (Microsoft® 2007)
o The area contains no credible flood source, or no sources that could propagate from one unit to another, or
o Flooding of the area does not cause an initiating event or a need for immediate plant shutdown, and the flood area does not have either mitigating equipment modelled in the PSA or flood sources sufficient to cause failure of equipment.
• Screening criteria for flood sources:
o The flood source is insufficient to cause failure of the equipment, or
o The area flooding mitigation systems are capable of preventing unacceptable flood levels and the nature of the flood does not cause equipment failure through other failure mechanisms, or
o The flood only affects the system that is the flood source and the internal events PSA already addresses this type of failure, or
o Mitigating human actions are shown to be effective.
• The area contains no credible flood source, or credible propagation path.
5.4.5 Potential Flood Scenario Characterization (Task 5)
This step identifies and characterizes the potential flood scenarios to be included in the analysis. This task characterizes the consequences for each flood-induced initiating event by considering the following factors:
• The specific flood area, flood source, flood source failure mode and associated magnitude;
• The type of flood failure mechanism;
• The consequences of the flood;
• Operator and mitigation system responses to terminate the flood;
• The means to be used to define the interface with the internal events PSA model for calculating the probability that the flood leads to severe core damage.
5.4.6 Internal Flooding Initiating Event Frequency Estimation (Task 6)
This step identifies flooding induced initiating events and estimates their frequency of occurrence. The flooding failure rates are based on generic EPRI data from Reference [R22].
Report
OPG Proprietary Document Number: Usage Classification:
NK30-REP-03611-00021 N/A Sheet Number: Revision Number: Page:
N/A R001 49 of 121 Title:
PICKERING NUCLEAR GENERATING STATION B PROBABILISTIC SAFETY ASSESSMENT SUMMARY REPORT
N-TMP-10010-R010 (Microsoft® 2007)
5.4.7 Flood Consequence Analysis (Task 7)
The characterization of the consequences for each flood-induced initiating event includs consideration of the type of flood sources, flood propagation paths, plant mitigating features, and equipment susceptibility to flood.
5.4.8 Flood Mitigation Strategies (Task 8)
This step is to identify and evaluate the strategies that can be employed by plant operators to mitigate the consequences of the flood. These actions can include terminating the source of the flood by isolating the break, or stopping the pumps that supply the flood source, or opening doors to divert water away from sensitive equipment.
The evaluation of human failure events in the internal flood scenarios differs from the internal events PSA. Specifically, the appropriate scenario-specific impacts on Performance Shaping Factors (PSFs) were considered for both control room and ex-control room actions based on the following items:
• Additional workload and stress (above that for similar sequences not caused by internal floods);
• Availability of indications;
• Effect of flood on mitigation, required response, timing, and recovery activities (e.g., accessibility restrictions, possibility of physical harm); and
• Flooding-specific job aids and training (e.g., procedures, training exercises).
5.4.9 PSA Modelling of Flood Scenarios (Task 9)
This step includes the finalization of flood scenario development and completing internal flood accident sequence models based on modifying the internal events PSA model. The PBRA-FLOOD model is based on small event trees for each flooding scenario. These event trees model the possible mitigating actions described in Section 5.4.8. Based on success or failure of the mitigating actions equipment availability is determined.
5.4.10 Level 1 PSA Quantification (Task 10)
Following the completion of the event tree analysis, the next step is to construct an integrated PSA model to evaluate the risk from internal flooding. To quantify the internal at-power flood model, new flooding events are added to the existing integrated loop cut internal events model and this is integrated with the high level logic developed from the flood specific event trees.
Qualitative sensitivity and uncertainly analysis were included as part of the quantification of the PBRA-FLOOD model.
Report
OPG Proprietary Document Number: Usage Classification:
NK30-REP-03611-00021 N/A Sheet Number: Revision Number: Page:
N/A R001 50 of 121 Title:
PICKERING NUCLEAR GENERATING STATION B PROBABILISTIC SAFETY ASSESSMENT SUMMARY REPORT
N-TMP-10010-R010 (Microsoft® 2007)
5.5 At-Power Seismic
The PBRA-SEISMIC assessment has been developed following the methodology for preparation of a PSA-based Seismic Margin Assessment (SMA) as described in the OPG Seismic PSA Guide [R23]. The major activities of the PSA-based SMA methodology and its application in the development of the PBRA-SEISMIC assessment are summarized in the subsections below.
The primary steps in developing the PSA-based SMA are identifying the seismic hazard at the site, constructing an event tree and fault tree model of the plant to represent the credited heat sinks following a seismic event, and creating new equipment failure modes based on the likelihood of equipment failure due to the seismic event. The PSA-based SMA was created based on the internal events At-Power PSA, PBRA-L1P.
The PBRA-SEISMIC model considers sequences that result in severe core damage (FDC1 and FDC2). Like the fire PSA, FDC1 sequences (failure to shutdown the reactor) are not assessed following a seismic event. Failure to shutdown following a seismic event is highly unlikely as SDS2 is seismically qualified, and selective components of the SDS1 system (mainly the shutoff rods) are seismically qualified. The two shutdown systems are highly reliable, and both have a fail safe design.
Similar to the Fire and Flood studies, the Seismic PSA Guide also outlines a Phased approach with two phases defined:
• Phase 1 - PSA-Based Seismic Margin Assessment - In Phase 1, a Probabilistic Safety Assessment-based Seismic Margin Assessment (PSA based SMA) is performed based on the methodology described in Reference [R24]. This focused approach uses a plant model based on PBRA-L1P with the addition of new seismic failure modes; the new seismic failure events are developed from a seismic margin approach with generic variabilities and the time average seismic risk is calculated in terms of a point estimate of SCDF that does not include a full uncertainty analysis.
• Phase 2 - Limited Seismic PSA (SPSA) – In Phase 2, the Phase 1 results are used to identify the most effective approach to convert the Phase 1 risk-based seismic margin study into a limited SPSA. Uncertainty in the seismic hazard and seismic fragilities are included, propagated, and displayed in the final quantification of risk estimates of the plant for significant risk contributors.
For PNGS-B, a Phase 1 PSA-based SMA study was performed and the results showed that there was no need to transition into Phase 2.
Major elements of the PNGS-B PSA-based SMA consist of the following tasks:
Task 1 - Seismic Hazard Characterization
Task 2 - Plant Logic Model Development
Task 3 - Seismic Response Characterization
Report
OPG Proprietary Document Number: Usage Classification:
NK30-REP-03611-00021 N/A Sheet Number: Revision Number: Page:
N/A R001 51 of 121 Title:
PICKERING NUCLEAR GENERATING STATION B PROBABILISTIC SAFETY ASSESSMENT SUMMARY REPORT
N-TMP-10010-R010 (Microsoft® 2007)
Task 4 - Plant Walkdown and Screening Reviews
Task 5 - Seismic Fragility Development
Task 6 - Seismic Risk Quantification
The integration of these tasks is shown in Figure 10.
In addition to the above tasks, the impact of seismically-induced internal fires and seismically-induced internal floods on seismic risk at PNGS-B has been evaluated qualitatively, considering potential significant sources at the station.
5.5.1 Seismic Hazard Characterization (Task 1)
The first step in the PSA-based SMA is to model the site-specific seismic hazard. The seismic hazard is a representation of the possible earthquakes and seismic activity that can be experienced at the site. The seismic hazard is a plot of the peak ground acceleration versus the annual frequency that the ground acceleration will be exceeded (typically described as the frequency of exceedance). Figure 11 shows a typical seismic hazard curve. The curve shows that very small ground accelerations are more likely than very large ground accelerations.
The site-specific seismic hazard curve is used to define the earthquake characteristics used in the PSA-based SMA analysis. The earthquake ground motion under analysis is greater than the seismic design of the plant in order to understand the plant capacity to survive a beyond design basis earthquake. The beyond design basis earthquake under consideration is referred to as the Review Level Earthquake (RLE).
5.5.2 Plant Logic Model Development (Task 2)
This task involves two related but separate sub-tasks: development of the event tree logic for the risk quantification model, and development of the seismic equipment list (SEL), which lists the components credited in the PSA-based SMA. This task relies upon the internal events PSA and other safe shutdown analyses to define the functions, structures, systems, and components required to mitigate seismic initiating event.
In this study, the seismic event tree has been developed only for the Level 1 aspect of PSA), whereas the development of the seismic equipment list is applicable to both Level 1 and Level 2 PSA aspects. An event tree is not needed for the Level 2 portion of this study as the robustness of containment is assessed using a simplified approach.
5.5.3 Seismic Response Characterization (Task 3)
The next step in the seismic PSA is to characterize how the site structures respond to a seismic event. The response of the building will not be the same on each elevation. For example, the small earthquakes occasionally experienced in southern Ontario are typically undetectable to people in the basement or lower floors of buildings, but can be easily detected by people in the higher floors of tall buildings.
Report
OPG Proprietary Document Number: Usage Classification:
NK30-REP-03611-00021 N/A Sheet Number: Revision Number: Page:
N/A R001 52 of 121 Title:
PICKERING NUCLEAR GENERATING STATION B PROBABILISTIC SAFETY ASSESSMENT SUMMARY REPORT
N-TMP-10010-R010 (Microsoft® 2007)
The ground oscillation of any seismic event can be described by a combination of ground motion frequencies. This is called the spectrum of the seismic event. Each potential seismic event may have a different spectrum. The different frequencies in an earthquake’s spectrum will be transferred to the site structures in different ways. The response of site buildings determines how the earthquake will affect the credited equipment in the PSA-based SMA and is used to calculate the probability of equipment failure due to a seismic event.
In Phase 1, a generalized scaling approach is used to calculate the response of the site structures. This method is based on the existing design basis earthquake seismic response analyses for the site structures, prepared as part of the Pickering A Seismic Assessment performed between 1995 and 1998, with updates to reflect the shapes of the new seismic hazard curves. In addition to characterizing the overall building response, this task defines the local accelerations for the credited equipment.
5.5.4 Plant Walkdown and Screening Reviews (Task 4)
Plant walkdowns were required to assess the relative vulnerability of equipment to seismic challenges. The walkdowns were performed by fragility experts in order to document the basis for screening equipment in (based on susceptibility) or out (based on ruggedness) of the PSA-based SMA. The plant walkdowns included reviews of the SEL items in one lead unit (Unit 5) and the items in the systems common to all four units. The screening level chosen needs to be high enough such that the contribution from screened-out SSCs is not significant to overall seismic risk. In addition, equipment required for credititng EME was assessed during the 2017 walkdown.
5.5.5 Seismic Fragility Development (Task 5)
The likelihood that a given piece of equipment will fail for a given seismic hazard is based on the fragility of the equipment. The fragility of the equipment is a conditional failure probability that the equipment will fail when subjected to a specific acceleration caused by a seismic event. The likelihood the equipment will fail increases as it is subject to greater acceleration. Figure 12 shows an example fragility curve. Figure 12 shows that if the example equipment is subject to an acceleration of 1g, the failure probability is 80%.
The fragility analysis conducted for a PSA-based SMA is limited to that of the Conservative Deterministic Failure Margin (CDFM) whereby the seismic capacity is calculated in terms of a High Confidence of Low Probability of Failiure (HCLPF) value using a generic representation of the variabiltiy [R25].
5.5.6 Seismic Risk Quantification (Task 6)
The seismic risk is evaluated using a PSA-based SMA model. To build the PSA-based SMA model, the information on the seismic response of the buildings and the seismic fragility of the equipment is used to calculate the probability of equipment failures. The development of the model involves the following key steps:
1. Make high level logic using the seismic event tree developed in the task Plant Logic Development.
Report
OPG Proprietary Document Number: Usage Classification:
NK30-REP-03611-00021 N/A Sheet Number: Revision Number: Page:
N/A R001 53 of 121 Title:
PICKERING NUCLEAR GENERATING STATION B PROBABILISTIC SAFETY ASSESSMENT SUMMARY REPORT
N-TMP-10010-R010 (Microsoft® 2007)
2. Prepare the fault tree where the high level fault tree logic prepared in Step 1 is populated with mitigating and support system fault tree logic by merging it with the at-power, internal events PBRA fault tree model.
3. Prepare the database, which is comprised of data from the PBRA at-power internal events database and augmented with seismically-induced failure modes.
4. Evaluate and post-process the model.
The model solution generated cutsets. Seismic cutsets were reviewed using MIN-MAX method to obtain the plant-level HCLPF. The plant-level HCLPF forms the basis of the fragility curve for the station. The plant-level fragility is convolved with the hazard curve for the station to obtain a mean point estimate of the seismic contribution to severe core damage frequency. Non-seismic cutsets, representing random failures of credited system, are also considered in the determination of SCDF following a seismic event, in the same manner as they are for internal events PSAs.
5.6 High Wind Safety Assessment
The PBRA-HIGHWINDS assessment has been developed following the methodology for preparation of a high wind PSA as described in the OPG HIGH Wind Hazard PSA Guide [R26].
High winds and, in particular, wind gusts can cause property damage or cause loose items to become airborne missiles. In addition, thunderstorms may spawn tornadoes where both high wind and missile generation hazards are a certainty. Each of these wind hazard types needs to be accounted for in the wind hazard initiating events.
The methodology involves five main tasks as listed below:
Task 1 - High Wind Hazard Analysis.
Task 2 - Analysis of Windborne Missile Risk.
Task 3 - High Wind Fragility and Combined Fragility Analysis.
Task 4 - Plant Logic Model Development.
Task 5 - Plant Response Model Quantification.
In addition, an important support task is the plant walkdown. A walkdown provides information on the spacial layout of the site, structural vulnerability and to determine the potential for missile generation. The walkdown is used as an input to the determination of high wind fragilities and missile impact areas.
Figure 13 shows the relationship between all tasks of the high wind PSA. A brief overview of each task is provided in subsections below.
Report
OPG Proprietary Document Number: Usage Classification:
NK30-REP-03611-00021 N/A Sheet Number: Revision Number: Page:
N/A R001 54 of 121 Title:
PICKERING NUCLEAR GENERATING STATION B PROBABILISTIC SAFETY ASSESSMENT SUMMARY REPORT
N-TMP-10010-R010 (Microsoft® 2007)
The methodology applied in this high wind hazard assessment uses a high level approach in determining fragilities based on median wind capacity. The approach used is realistic with conservative assumptions where needed to simplify the analysis.
5.6.1 Task 1 - High Wind Hazard Analysis
The purpose of this task is the evaluation of the frequency and intensity of occurrence of various straight wind and tornado wind hazards based on site-specific and region-specific data. The spatial extent of these hazards are analyzed or estimated based on available data sets from sources such as Environment Canada (EC), Ontario Climate Centre, US National Weather Service (NWS) Storm Prediction Centre, US National Oceanic and Atmospheric Administration (NOAA) Storm Prediction Center. Tornado and mean median wind speed hazard curves are generated based on the available data sets and applicable uncertainties. The tornado point hazard curves are combined with the point hazard curves for other high winds to produce the combined high wind hazard curves. These wind hazards are considered to be independent stochastic events.
A combined wind hazard is developed and from that mean wind speeds corresponding to each of the Fujita scales (F1 through F5) are used as the basis for defining high wind initiating events in the PSA model (Task 4).
5.6.2 Task 2 - Analysis of Windborne Missile Risk
The purpose of this task is to develop wind-borne missile fragilities for the plant targets. Windborne missile fragility is defined as the probability of target damage (failure) from windborne missiles for a given value of peak gust wind speed. A list of high wind targets is generated under Task 4: Plant Logic Model Development. The missile risk is derived based on missile sources, plant layout, and plant design information taking into account applicable uncertainties.
The EPRI-developed TORMIS methodology is utilised to estimate the probability of tornado missile impact and damage to plant structures and components [R27], [R28].
5.6.3 Task 3 - High Wind Fragility and Combined Fragility Analysis
The purpose of this task is to evaluate the fragility of high wind targets identified in Task 4 due to high wind loading effects. This task includes the combination of the various wind failure modes, however, it does not complete the integration of wind and windborne missile fragilities derived in Task 2: Windborne Missile Risk and Task 3: High Wind Fragility Evaluation as these two wind failure modes are combined within the PSA model.
The list of high wind targets is screened based on system dependencies to obtain a sub-list of targets bounding mitigating safety systems fragility. Wind capacity calculations are completed to obtain the median wind capacity and associated uncertainties of these targets based on available design information, National Building codes and walkdown observations. The generated wind capacity and uncertainty values are used to derive the wind fragility curves.
Report
OPG Proprietary Document Number: Usage Classification:
NK30-REP-03611-00021 N/A Sheet Number: Revision Number: Page:
N/A R001 55 of 121 Title:
PICKERING NUCLEAR GENERATING STATION B PROBABILISTIC SAFETY ASSESSMENT SUMMARY REPORT
N-TMP-10010-R010 (Microsoft® 2007)
5.6.4 Task 4 - Plant Logic Model Development
This task addresses the identification of high wind targets and development of the high-level plant logic for high wind PSA model based on the internal events PSA model. This high level logic, in turn, forms the basis for the SSCs to be credited for the various high wind scenarios. The high wind plant logic model examines the response of plant SSCs to the defined high wind hazard, and then combines this response with the response of the plant to the initiating event, given the degraded condition of plant SSCs and challenges faced by the operator due to the wind hazard. The focus of the high wind analysis is estimation of SCDF for a single reference unit, with common unit and adjacent unit impacts on the reference unit considered.
5.6.5 Task 5 - Plant Response Model Quantification
This task is performed to finalize and quantify the high wind scenarios developed by modifying the integrated severe core damage (FDC2) model of PBRA-L1P. This task involved integration of the high wind hazard and fragility information with the overall plant PSA logic model by linking the fragility information to appropriate sequences and basic events in the plant logic model. The high wind hazard curve used in the high wind hazard characterization is then integrated with the plant logic model containing the fragility information to determine high wind risk in terms of Severe Core Damage. In addition to providing the overall frequencies for each sequence, this quantification identified dominant accident sequences, component failures, and human actions with respect to high wind risk. The cutsets obtained from the PSA quantification step contains a single Wind Initiating Event combined with mitigating system failures due to random failures, high wind failures and operator actions.
6.0 LEVEL 2 PSA METHODS
Section 5.0 described the methods used for the Level 1 PSA assessments of PNGS-B. In the Level 1 PSA, the goal was to quantify the frequency of fuel damage. Once the fuel has been damaged, there is the potential for radioactive material to be released from the fuel into containment. The Pickering B NGS design includes a containment system (described in Section 2.12.3) to prevent the release of any radioactive material in the station from being discharged into the environment.
The Level 2 PSA studies the system failures and accident phenomena that might result in a release to the environment, and the timing and magnitude of the release. This information is combined with the PBRA-L1P model to quantify the frequency of possible releases.
The PBRA-L2P model has been developed following the methodology for preparation of a Level-2 PSA as described in the Level 2 PSA Guide [R29]. The consequence assessment was performed by simulating the accident sequences using the MAAP-CANDU 4.0.7D code. The major activities of the Level-2 PSA methodology and its application in the development of the PBRA-L2P are summarized in the subsections below.
Report
OPG Proprietary Document Number: Usage Classification:
NK30-REP-03611-00021 N/A Sheet Number: Revision Number: Page:
N/A R001 56 of 121 Title:
PICKERING NUCLEAR GENERATING STATION B PROBABILISTIC SAFETY ASSESSMENT SUMMARY REPORT
N-TMP-10010-R010 (Microsoft® 2007)
6.1 Interface with Level 1 PSA
The PNGS-B At-Power Level 1 PSA (PBRA-L1P) generates results in the form of frequencies of nine Fuel Damage Categories, described in Section 5.1.2, representing a wide range of possible outcomes. The possible outcomes include the most severe involving failure to shutdown (FDC1) to relatively benign where there are no fuel failures and release is limited to the equilibrium fission product inventory of the Heat Transport System (HTS) (FDC9). A subset of the FDCs (1-7), those that involve release of significant quantities of fission products from the core, is used to develop the interface between Level 1 and Level 2, the Plant Damage States (PDSs). The plant damage states serve to reduce number of the sequences assessed in the Level 2 analysis to a manageable number while still reflecting the full range of possible accident sequences and their impacts on the plant.
Only two FDCs are used to represent the range of sequences that result in severe core damage, FDC1 for rapid accident progression resulting from failures to shut down the reactor when required and FDC2 for all other sequences. FDC1 is conservatively assumed to cause early consequential containment failure and is assigned to a unique PDS, PDS1.
FDC2 is not assumed to result in immediate containment failure and was subdivided into three PDSs (2-4) to examine the potential for random and consequential failures of containment systems that could eventually lead to enhanced release to the environment:
• PDS2 represents sequences affecting a single unit with release into containment;
• PDS3 represents sequences affecting more than one unit; and
• PDS4 represents single unit sequences with a release pathway that bypasses containment.
Random containment system failures are associated only with PDS2 and were identified by means of a Bridging Event Tree (Figure 14) that led to the creation of eleven subcategories, labelled PDS2A-K.
As described in Section 1.0, Unit 5 is the reference unit for the PSA Study. In order to develop the logic for PDS3, conservative assumptions were made to partition the FDC2 logic in to sequences that impact a single unit, and sequences that could impact more than one unit.
FDCs 3-7 represent the range of accidents that fall under the general heading of “design basis events”. These were allocated to PDS5 and 6 respectively, depending on whether the initiating event involves containment bypass (PDS6) or not (PDS5).
FDCs 8-9 are excluded from Level 2 analysis on the basis that the radionuclide releases from these in-plant sequences would be negligible.
For Level 2 analysis, the characteristics of each plant damage state are represented by a single representative accident sequence. By design, the plant damage states
Report
OPG Proprietary Document Number: Usage Classification:
NK30-REP-03611-00021 N/A Sheet Number: Revision Number: Page:
N/A R001 57 of 121 Title:
PICKERING NUCLEAR GENERATING STATION B PROBABILISTIC SAFETY ASSESSMENT SUMMARY REPORT
N-TMP-10010-R010 (Microsoft® 2007)
group sequences expected to generate similar magnitude and timing of fission product release to containment and containment response. However, the frequency and releases for each sequence will vary to some extent.
The Level 1 PSA is used to identify initiating events that are the largest contributors to the frequency of the plant damage state. These sequences are then reviewed to select a representative sequence that bounds the consequence. The approach follows the OPG Level 2 PSA Guide [R29]. The representative sequences chosen for each PDS are summarized in Table 11.
6.2 Containment Event Tree Analysis
In Level 2 PSAs, Containment Event Trees (CETs) are used to delineate the sequence of events and severe accident phenomena after the onset of core damage that challenge successive barriers to radioactive release to the environment. They provide a structured approach for the evaluation of the capability of a plant, specifically its containment boundary, to cope with severe core damage accidents. The entry points into the CETs are the plant damage states that involve severe core damage.
A CET is a logic model that addresses uncertainties in the ability to predict the potential impacts of accident progression and associated physical phenomena on containment response. Figure 15 shows a generic containment event tree. CET branch points are not built from system based “success criteria” but from questions that are intended to ascertain the magnitude of phenomenological challenges to the containment boundary and its continued integrity at a given stage of accident progression (e.g., “Is containment integrity maintained?” or “Does core concrete interaction occur?”). The CET branch points represent major events in accident progression and the potential for fission product release to the environment. The CET also represents the evolution of the progression with time so the same nodal question may appear more than once in the tree as conditions inside containment change. The focus of the CET is to estimate the probabilities of the various ways that containment failure may occur leading to a release to the environment.
Most of the CET branch points represent alternative possible outcomes of a given physical interaction. Depending on the availability of suitable models and data for a given physical interaction or phenomenon, the methods of branch point quantification can vary. The acceptability of these probability estimates is supported via an expert review process.
6.3 Containment Fault Trees
Containment system fault trees are required for quantification of the frequencies of the end-states PDS2A – PDS2K in the Level 1/Level 2 PDS2 bridging event tree, which is shown in Figure 14, and includes the following branch headers:
LCEI: Large Containment Envelope Integrity (> 0.1 m**2) Avoided
SCEI: Small Containment Envelope Integrity (< 0.1 m**2) Avoided
PRV: Pressure Relief Valves (PRV) Open to Limit Containment Pressure for LOCA Events
Report
OPG Proprietary Document Number: Usage Classification:
NK30-REP-03611-00021 N/A Sheet Number: Revision Number: Page:
N/A R001 58 of 121 Title:
PICKERING NUCLEAR GENERATING STATION B PROBABILISTIC SAFETY ASSESSMENT SUMMARY REPORT
N-TMP-10010-R010 (Microsoft® 2007)
ACU: Boiler Room Air Conditioning Units (ACUs) Condense Steam
IGN: FMV Ignitors Operate and FMV ACUs Mix Atmosphere
FADS: FAD Systems Vent and Filtering Functions Available
The fault tree models used in the quantification of the Level 2 PSA are listed in Table 7. Fault tree representations for failure of these containment functions have been developed, reflecting the likelihood that random equipment failure or human error will prevent the operation of the system on demand or during the mission. Containment failures arising as a consequence of severe accident progression are addressed in the CET.
6.4 Release Categorization
The CET analysis generates a multitude of end states associated with each specific severe accident sequence. The CET end states are binned into Release Categories (RCs), for use in subsequent applications such as Level 3 PSA and to facilitate comparison with safety goals (Table 1). The RCs are defined based on two criteria:
• The magnitude of release in Becquerel (Bq) of specific radionuclides considered important to offsite impacts (e.g., isotopes of cesium or iodine), and
• The timing of the release, either early in the accident sequence (where “early” is less than 24 hours) or late (after 24 hours).
Seven RCs cover the full range of possible releases and provide enough discrimination to evaluate safety goal frequencies. An eighth category is used to represent basemat melt-through, when the core debris is postulated to penetrate the floor of the reactor vault. Table 12 presents the release categories used in the PBRA-L2P analysis. LRF is defined to be the sum of RC1 through RC3.
6.5 MAAP-CANDU Analysis
MAAP-CANDU (Modular Accident Analysis Program – CANDU) is a severe accident simulation code for CANDU nuclear stations [R30]. It is used to calculate the consequences of severe accidents and is designated as a CANDU Owners Group (COG) Industry Standard Toolset (IST) code. MAAP-CANDU originated from MAAP developed for Pressurized Water Reactor (PWR) and Boiling Water Reactor (BWR) systems by Fauske and Associates (FAI) and is part of the EPRI suite of risk assessment tools.
MAAP-CANDU can simulate the response of a CANDU power plant during severe accident sequences. The code quantitatively simulates the evolution of a severe accident starting from full power conditions given a set of system faults and initiating events through events such as primary heat transport system failure, core melt, calandria vessel failure, shield tank failure, and containment failure.
Severe accident analysis carried out using MAAP-CANDU is the cornerstone of the Level 2 PSA. There are at least five distinct roles for the code, as outlined below:
Report
OPG Proprietary Document Number: Usage Classification:
NK30-REP-03611-00021 N/A Sheet Number: Revision Number: Page:
N/A R001 59 of 121 Title:
PICKERING NUCLEAR GENERATING STATION B PROBABILISTIC SAFETY ASSESSMENT SUMMARY REPORT
N-TMP-10010-R010 (Microsoft® 2007)
• To establish the baseline accident progression for each plant damage state and the potential impact of associated physical phenomena on CET top events;
• To determine the sensitivity of phenomena to reasonable variations in key parameter values to support CET branch point quantification;
• To calculate releases to the environment for those sequences for which a non-zero probability of a containment failure mode has been estimated to support categorization of releases;
• To generate results to support systematic sensitivity and uncertainty analysis; and
• To provide information related to plant environmental conditions.
6.6 Integration of the Level 1 and 2 PSA
The purpose of integration is to link the Level 1 event trees with the PDSs via the Level 1/Level 2 bridging event tree and containment fault trees and then with the RCs via the CET end-states using the results of the branch point quantification. The product is a complete set of sequences that contribute to each RC, from which the frequency of each RC can be determined.
Importance analysis is performed to identify the dominant contributors to each release category.
Sensitivity and uncertainty analysis is performed on both the frequency quantification and on the MAAP-CANDU consequence assessment.
6.7 Level 2 Outage Assessment
Given the low risk of fuel damage from internal events occurring while the unit is in GSS, a full Level 2 study of the outage risks was not performed. Instead, a reduced scope consequence assessment for a number of representative outage accident sequences at PNGS-B during each POS is performed.
The goals of the assessment are:
1. Determine if severe accidents while in a shutdown POS progress more slowly than severe accidents in high power units. If this is the case, then the risk from a multi-unit event occurring while a single unit is operating in a shutdown POS is driven by the transients in the high power units.
2. Determine if severe accidents while in a shutdown POS pose unique challenges to the containment boundary. If no unique challenges are identified, then it is reasonable to assume that the large release frequency for a shutdown POS will be much lower than the already extremely low shutdown state SCDF.
The consequence assessment was performed by simulating the accident sequences using the MAAP-CANDU 4.0.7D code.
Report
OPG Proprietary Document Number: Usage Classification:
NK30-REP-03611-00021 N/A Sheet Number: Revision Number: Page:
N/A R001 60 of 121 Title:
PICKERING NUCLEAR GENERATING STATION B PROBABILISTIC SAFETY ASSESSMENT SUMMARY REPORT
N-TMP-10010-R010 (Microsoft® 2007)
6.8 Level 2 Fire Assessment
As described in Section 5.3.14, the Level 2 assessment of internal fire risk was built on the Level 1 internal fire model. The approach for the treatment of Level 2 consisted of three steps. The first two steps involved a screening process. Those fire scenarios that remained after the screening process were subjected to the third step, an assessment of the impact of the fire scenarios on containment and the application of modification factors to generate an estimate of the LRF.
6.9 Level 2 Seismic Assessment
The Level 2 seismic assessment was limited to two main tasks:
• Estimate the seismic fragility of containment components; and
• To estimate the potential contribution of non-consequential containment failures to LRF (i.e., those containment failures not related to phenomenological effects following severe core damage). The purpose of this estimate is to confirm that the seismic LRF is driven by the correlated failures of the heat sink components.
Additional walkdowns and fragility calculations, using the same techniques as those described in Section 5.5.5, were used to assess the possible failure of containment due to seismic events.
HCLPF values for containment structures, systems and components were evaluated to determine the limiting HCLPF for containment integrity. A convolution of the plant-level limiting containment fragility with the hazard curve for the station produced the PNGS-B seismically-induced containment failure frequency. The multi-unit nature of the seismic initiating event combined with correlated response of units and common mitigating systems is postulated to lead to severe core damage at all Pickering NGS ‘B’ units concurrently. Since the Pickering NGS ‘B’ containment cannot survive the overpressure transient created by such a scenario, it is conservatively considered that the LRF estimate is equal to the SCDF estimate of 1.3E-7 per year.
6.10 Level 2 High Wind Assessment
A Level 2 assessment was performed to estimate LRF following a high wind event at PNGS-B. The LRF estimate was based on the Level 1 High Winds SCDF cutset solution and insights from PBRA-L2P. Specifically, it was found that accident sequences involving severe core damage at multiple units led directly to large releases but only a fraction of sequences involving severe core damage at a single unit led to large releases. The Level 1 High Winds SCDF cutset solution was interrogated to identify four-unit, two-unit and single unit cutsets. Taking into account correlated failures due to the high wind initiating event, additional random failures occuring simultaneously on a sister unit, and potential containment system failures, large releases following a high wind event was estimate to be 9.8E-07/yr.
Report
OPG Proprietary Document Number: Usage Classification:
NK30-REP-03611-00021 N/A Sheet Number: Revision Number: Page:
N/A R001 61 of 121 Title:
PICKERING NUCLEAR GENERATING STATION B PROBABILISTIC SAFETY ASSESSMENT SUMMARY REPORT
N-TMP-10010-R010 (Microsoft® 2007)
7.0 SUMMARY OF RESULTS
The PBRA study uses two measures to assess the acceptability of risk. These two measures correspond to the OPG risk-based safety goals:
• Frequency of severe core damage; and
• Frequency of large release
Table 13 compares the results of the internal events PSA studies described in Sections 5.0, and 6.0, with the OPG safety goals. OPG has an admistrative safety goal and a safety goal. The safety goal represents the tolerability of risk exposure above which action shall be taken to reduce risk. The administrative safety goal represents the desired objective towards which the facility should strive. The summary of the Level 1 severe core damage and Level 2 large release frequencies results for internal events is provided in Table 13.
The internal event PSAs assess the full range of fuel damage and release categories defined in Table 6, Table 10 and Table 12. The frequency of fuel damage for the at-power internal events PSA (PBRA-L1P) is presented in Table 15. The results in Table 15 show that failure to shutdown is a negligible contributor to severe core damage frequency.
As described in Section 6.1, the fuel damage categories used as end states in the Level 1 PSA are partitioned into PDSs to use as inputs into the Level 2 PSA. Table 16 presents the frequencies of the plant damage states, and Table 17 presents the results of PBRA Level 2 At Power (PBRA-L2P).
The fire, seismic, flooding, and high wind risk results are presented in Table 14. The fire, seismic, flood, and high-wind results are all below the administrative safety goals for severe core damage.
While the large release frequency due to a seismic event is bounded by the severe core damage frequency, the assessment of the containment fragility concluded that containment is robust to seismically induced failure modes.
7.1 Conclusions
The PBRA models meet the intent of the Canadian Nuclear Safety Commission Standard S-294 [R1]. This comprehensive model assesses risk from internal events, internal floods, internal fires, high winds and seismic events.
As described in Section 6.0 the results of models prepared to meet the requirements of S-294 are below the OPG Safety Goals, demonstrating that the overall risk to the public is low. OPG continues to meet industry best practices through periodic updates to account for operating experience and changes at the station.
Report
OPG Proprietary Document Number: Usage Classification:
NK30-REP-03611-00021 N/A Sheet Number: Revision Number: Page:
N/A R001 62 of 121 Title:
PICKERING NUCLEAR GENERATING STATION B PROBABILISTIC SAFETY ASSESSMENT SUMMARY REPORT
N-TMP-10010-R010 (Microsoft® 2007)
8.0 REFERENCES
[R1] Canadian Nuclear Safety Commission, Probabilistic Safety Assessments (PSA) for Nuclear Power Plants, Regulatory Standard S-294, April 2005.
[R2] Canadian Standards Association, Management System Requirements for Nuclear Power Plants, CSA N286-05.
[R3] Canadian Standards Association, Quality Assurance of Analytical, Scientific and Design Computer Programs for Nuclear Power Plants, CSA N286.7-99.
[R4] Ontario Power Generation, Risk and Reliability Program, N-PROG-RA-0016, R008.
[R5] Ontario Power Generation, OPG Probabilistic Risk Assessment (PRA) Guide – Level 1 (At-Power), N-GUID-03611-10001 Volume 1 R004.
[R6] Ontario Power Generation, Pickering NGS B Safety Report, Part 1, Site and Plant Description, NK30-SR-01320-00001, R004.
[R7] Ontario Power Generation, OPG Probabilistic Safety Assessment (PSA) Guide - External Hazards Screening N-GUID-03611-10001 Volume 8 R004.
[R8] Ontario Power Generation, Pickering NGS B Safety Report, Part 2, NK30-SR-01320-00002, R004.
[R9] EPRI, CAFTA Software Manual Version 5.4, Palo Alto, CA, Software Product ID #1018460, 2009.
[R10] U.S. Nuclear Regulatory Commission, Industry-Average Performance for Components and Initiating Events at U.S. Commercial Nuclear Power Plants, NUREG/CR-6928, January 2007.
[R11] The TUD Office, T-Book - Reliability Data of Components in Nordic Nuclear Power Plants, 8th Edition, ISBN 978-91-637-8817-8, 2015.
[R12] Westinghouse Savannah River Company, Savannah River Site Generic Data Base Development, File # WSRC-TR-93-262, R001, May 1998.
[R13] Ontario Power Generation, PND-B Reliability Report 2010, NK30-REP-09051.1-00010-R000.
[R14] Ontario Power Generation, OPG Outage Probabilistic Risk Assessment Guide – Level 1, N-GUID-03611-10001 Volume 4 R001.
[R15] EPRI, FTREX User Manual Version 1.7, Palo Alto, CA and KAERI, Daejeon, South Korea, Software Product ID #1016858, 2013.
[R16] Ontario Power Generation, Probabilistic Risk Assessment (PRA) Guide - Fire, N-GUID-03611-10001 Volume 5 R001.
Report
OPG Proprietary Document Number: Usage Classification:
NK30-REP-03611-00021 N/A Sheet Number: Revision Number: Page:
N/A R001 63 of 121 Title:
PICKERING NUCLEAR GENERATING STATION B PROBABILISTIC SAFETY ASSESSMENT SUMMARY REPORT
N-TMP-10010-R010 (Microsoft® 2007)
[R17] EPRI/NRC-RES Fire PRA Methodology for Nuclear Power Facilities: Volume 2: Detailed Methodology, Electric Power Research Institute (EPRI), Palo Alto, California USA, and United States Nuclear Regulatory Commission, Office of Nuclear Regulatory Research (RES), Rockville, Maryland USA: 2005, EPRI TR-1011989 and NUREG/CR-6850.
[R18] Fire Probabilistic Risk Assessment Methods Enhancements, Electric Power Research Institute (EPRI), Palo Alto, California USA and United States Nuclear Regulatory Commission Office of Nuclear Regulatory Research (RES), Rockville, Maryland USA, EPRI TR-1019259 and NUREG/CR-6850 Supplement 1, September 2010.
[R19] Generic Fire Modeling Treatments, Hughes Associates Project Number 1SPH02902.030, Revision 0, January 15, 2008.
[R20] Ontario Power Generation, Probabilistic Risk Assessment (PRA) Guide - Internal Flood, N-GUID-03611-10001 Volume 6 R001.
[R21] Ontario Power Generation, Fire Safe Shutdown Analysis- Pickering B Nuclear Generating Station, NK30-REP-71400-00001 R004.
[R22] Electric Power Research Institute, "Pipe Rupture Frequencies for Internal Flooding Probabilistic Risk Assessments," Palo Alto, CA, EPRI 3002000079 Revision 3, 2013.
[R23] Ontario Power Generation, Probabilistic Risk Assessment (PRA) Guide - Seismic, N-GUID-03611-10001 Volume 7 R001.
[R24] United States Nuclear Regulatory Commission, Recommendations to the Nuclear Regulatory Commission on Trial Guidelines for Seismic Margin Reviews of Nuclear Power Plants, NUREG/CR-4482, Lawrence Livermore National Laboratory, Livermore, CA, 1986.
[R25] Electric Power Research Institute, A Methodology for Assessment of Nuclear Power Plant Seismic Margin, Revision 1, EPRI NP-6041 SL, Palo Alto, CA, August 1991.
[R26] Ontario Power Generation, OPG Probabilistic Risk Assessment Guide - High Wind Hazard, N-GUID-03611-10001 Volume 10 R000.
[R27] Electric Power Research Institute, Tornado Missile Risk Analysis and Appendices, NP-768 and NP-769, May 1978.
[R28] Twisdale at al, Tornado Missile Risk Evaluation Methodology, EPRI, NP-2005 Volumes I and II, August 1981.
[R29] Ontario Power Generation, "Probabilistic Safety Assessment (PSA) Guide – Level 2 (At-Power)", N-GUID-03611-10001 Volume 2 R003.
[R30] MAAP4-CANDU - Modular Accident Analysis Program for Candu Power Plant Volume 1: User Guidance, Fauske & Associates, Inc, Burr Ridge, Illinois, 1998.
Report
OPG Proprietary Document Number: Usage Classification:
NK30-REP-03611-00021 N/A Sheet Number: Revision Number: Page:
N/A R001 64 of 121 Title:
PICKERING NUCLEAR GENERATING STATION B PROBABILISTIC SAFETY ASSESSMENT SUMMARY REPORT
N-TMP-10010-R010 (Microsoft® 2007)
[R31] EPRI, 3002005287, Identification of External Hazards for Analysis in Probabilistic Risk Assessment (Update of EPRI Report 1022997), October 2015.
[R32] IAEA, Safety Series No. 50-P-7. Treatment of External Hazards in Probabilistic Safety Assessment for Nuclear Power Plants, A Safety Practice, 1995.
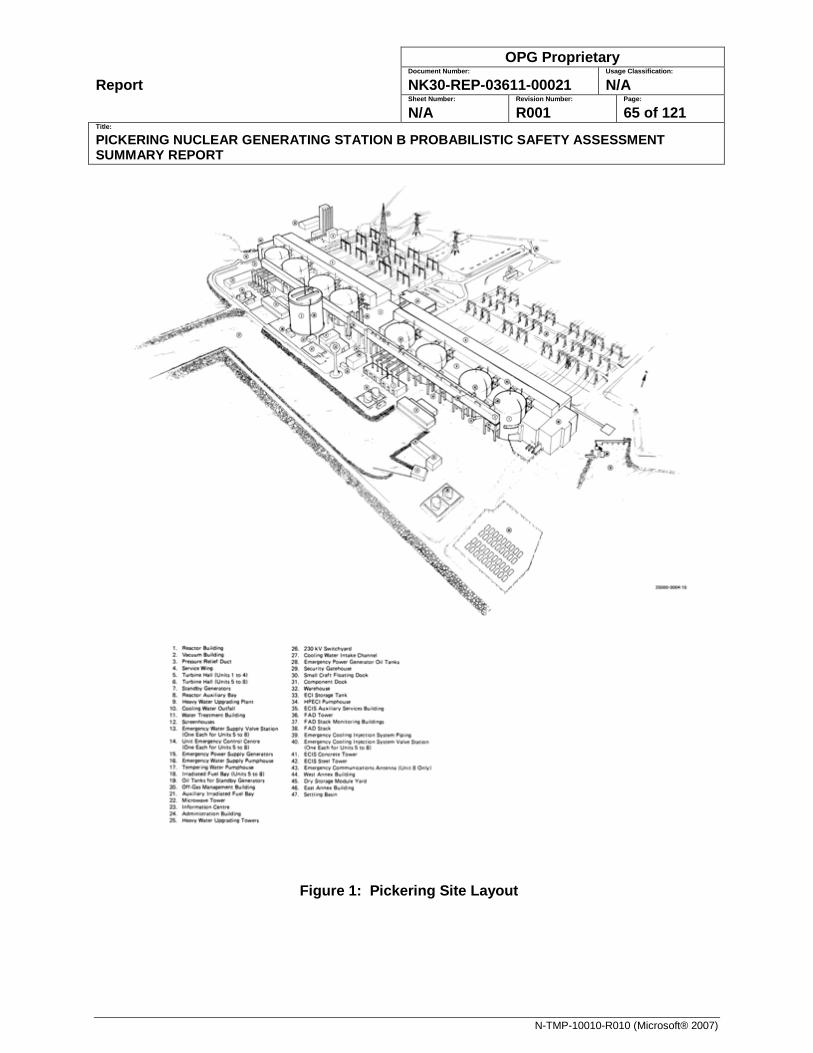
Report
OPG Proprietary Document Number: Usage Classification:
NK30-REP-03611-00021 N/A Sheet Number: Revision Number: Page:
N/A R001 65 of 121 Title:
PICKERING NUCLEAR GENERATING STATION B PROBABILISTIC SAFETY ASSESSMENT SUMMARY REPORT
N-TMP-10010-R010 (Microsoft® 2007)
Figure 1: Pickering Site Layout
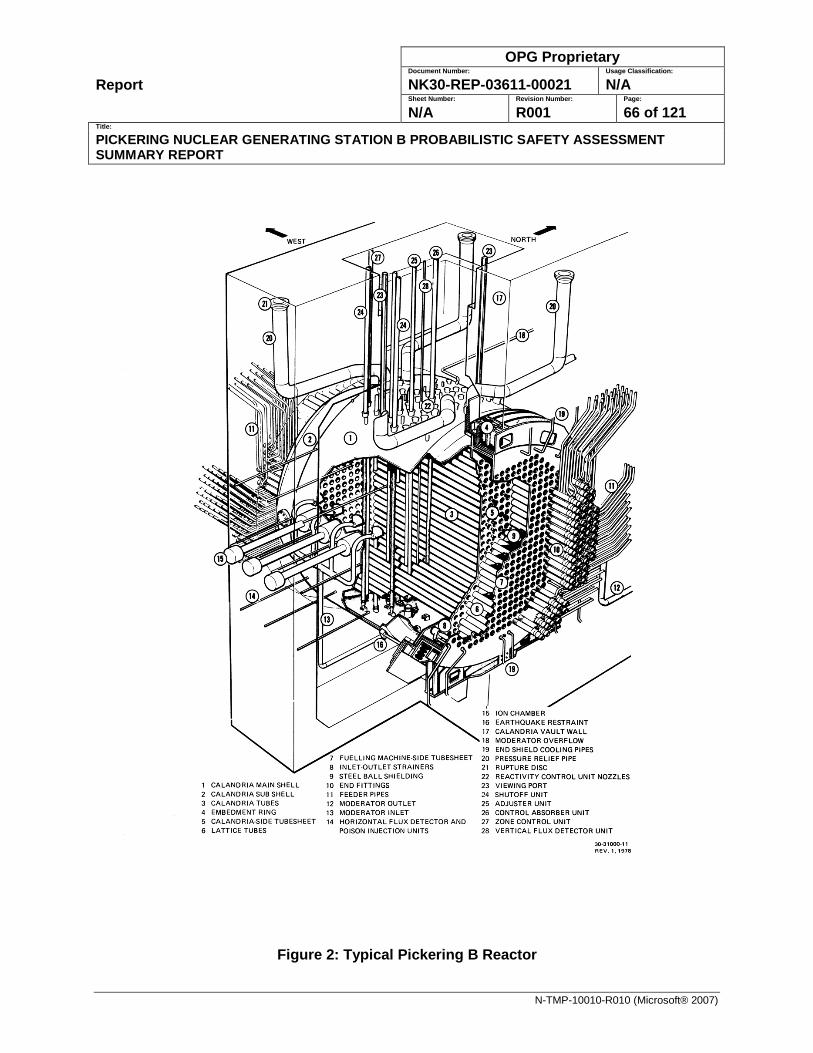
Report
OPG Proprietary Document Number: Usage Classification:
NK30-REP-03611-00021 N/A Sheet Number: Revision Number: Page:
N/A R001 66 of 121 Title:
PICKERING NUCLEAR GENERATING STATION B PROBABILISTIC SAFETY ASSESSMENT SUMMARY REPORT
N-TMP-10010-R010 (Microsoft® 2007)
Figure 2: Typical Pickering B Reactor
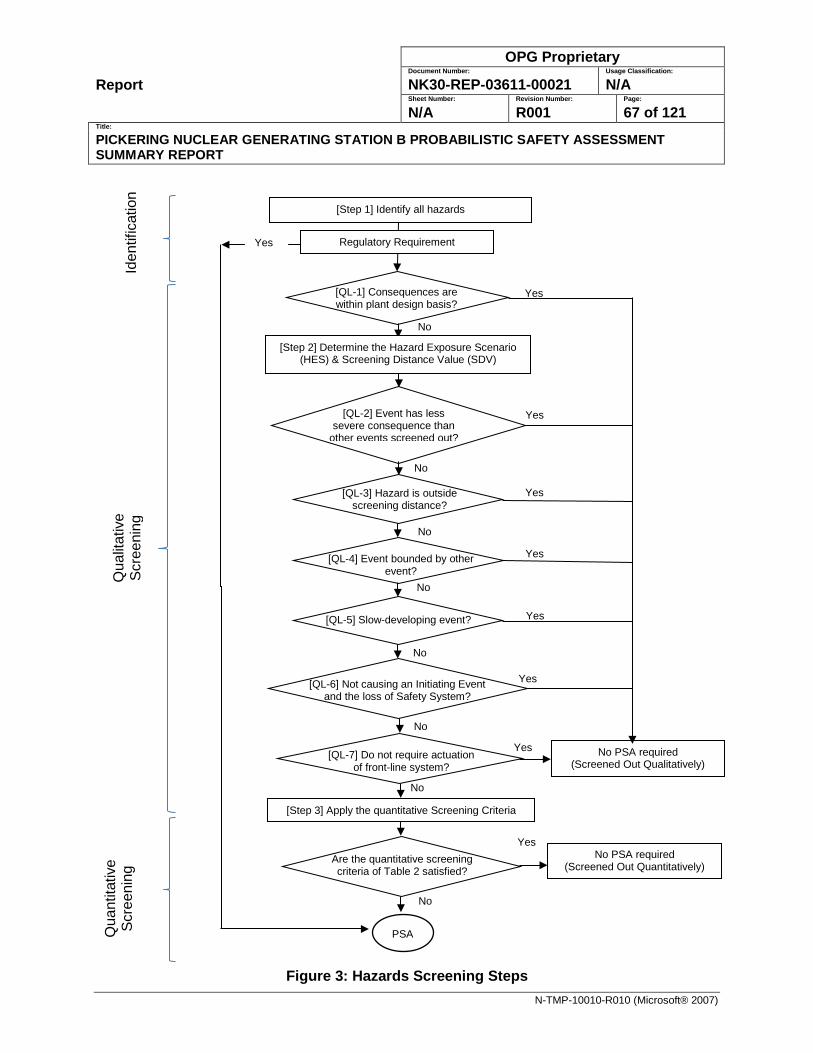
Report
OPG Proprietary Document Number: Usage Classification:
NK30-REP-03611-00021 N/A Sheet Number: Revision Number: Page:
N/A R001 67 of 121 Title:
PICKERING NUCLEAR GENERATING STATION B PROBABILISTIC SAFETY ASSESSMENT SUMMARY REPORT
N-TMP-10010-R010 (Microsoft® 2007)
Figure 3: Hazards Screening Steps
Yes
[Step 1] Identify all hazards
[Step 2] Determine the Hazard Exposure Scenario (HES) & Screening Distance Value (SDV)
[Step 3] Apply the quantitative Screening Criteria
[QL-1] Consequences are within plant design basis?
No
[QL-2] Event has less severe consequence than
other events screened out?
Yes
[QL-3] Hazard is outside screening distance?
Yes
Yes
No PSA required (Screened Out Quantitatively)
Yes
PP
[QL-4] Event bounded by other event?
Yes
[QL-5] Slow-developing event?
[QL-6] Not causing an Initiating Event and the loss of Safety System?
Yes
[QL-7] Do not require actuation of front-line system?
No PSA required (Screened Out Qualitatively)
Yes
Are the quantitative screening criteria of Table 2 satisfied?
Iden
tific
atio
n Q
uant
itativ
e Sc
reen
ing
Qua
litat
ive
Scre
enin
g
Yes Regulatory Requirement
No
No
No
No
No
No
No
PSA

Report
OPG Proprietary Document Number: Usage Classification:
NK30-REP-03611-00021 N/A Sheet Number: Revision Number: Page:
N/A R001 68 of 121 Title:
PICKERING NUCLEAR GENERATING STATION B PROBABILISTIC SAFETY ASSESSMENT SUMMARY REPORT
N-TMP-10010-R010 (Microsoft® 2007)
Figure 4: Example LOCA Event Tree
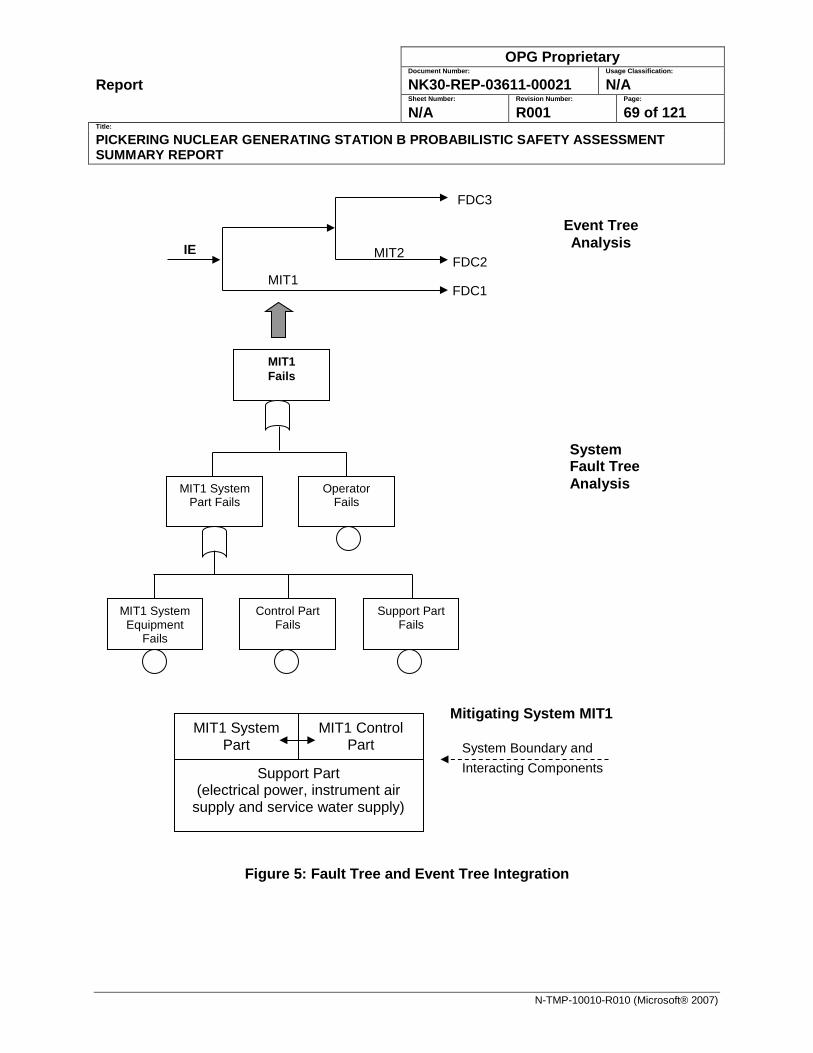
Report
OPG Proprietary Document Number: Usage Classification:
NK30-REP-03611-00021 N/A Sheet Number: Revision Number: Page:
N/A R001 69 of 121 Title:
PICKERING NUCLEAR GENERATING STATION B PROBABILISTIC SAFETY ASSESSMENT SUMMARY REPORT
N-TMP-10010-R010 (Microsoft® 2007)
Figure 5: Fault Tree and Event Tree Integration
Event Tree Analysis
MIT2 IE
MIT1
FDC3
FDC2
FDC1
System Fault Tree Analysis
System Boundary and
Interacting Components
Mitigating System MIT1
MIT1 Fails
MIT1 System Equipment
Fails
Support Part Fails
Control Part Fails
Operator Fails
MIT1 System Part Fails
MIT1 System Part
Support Part (electrical power, instrument air
supply and service water supply)
MIT1 Control Part
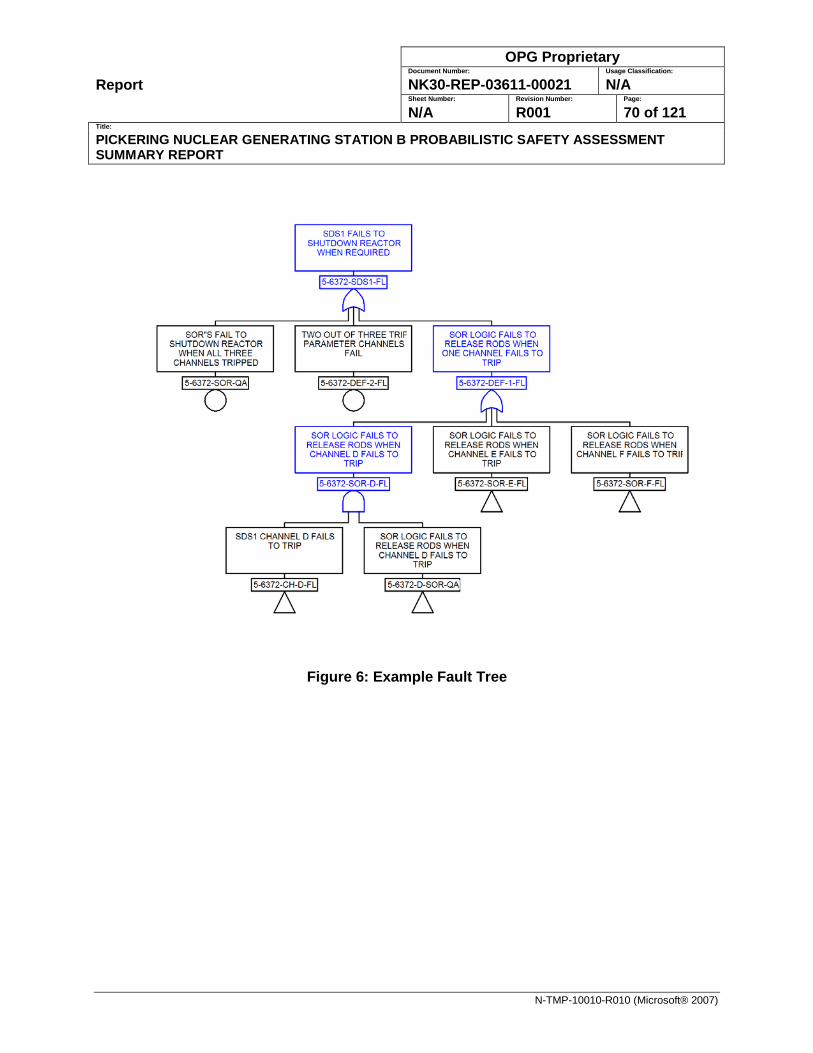
Report
OPG Proprietary Document Number: Usage Classification:
NK30-REP-03611-00021 N/A Sheet Number: Revision Number: Page:
N/A R001 70 of 121 Title:
PICKERING NUCLEAR GENERATING STATION B PROBABILISTIC SAFETY ASSESSMENT SUMMARY REPORT
N-TMP-10010-R010 (Microsoft® 2007)
Figure 6: Example Fault Tree
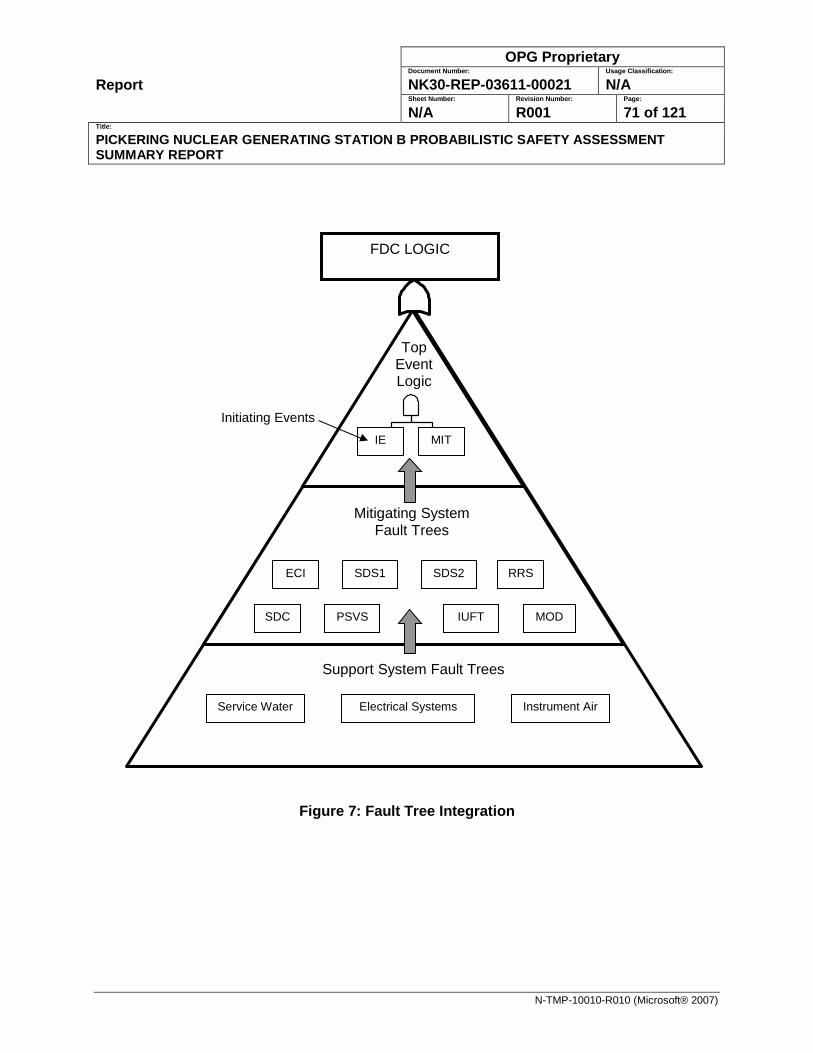
Report
OPG Proprietary Document Number: Usage Classification:
NK30-REP-03611-00021 N/A Sheet Number: Revision Number: Page:
N/A R001 71 of 121 Title:
PICKERING NUCLEAR GENERATING STATION B PROBABILISTIC SAFETY ASSESSMENT SUMMARY REPORT
N-TMP-10010-R010 (Microsoft® 2007)
Figure 7: Fault Tree Integration
FDC LOGIC
Top Event Logic
Mitigating System Fault Trees
Support System Fault Trees
IE MIT
ECI SDS1 SDS2 RRS
IUFT PSVS SDC MOD
Electrical Systems Service Water Instrument Air
Initiating Events
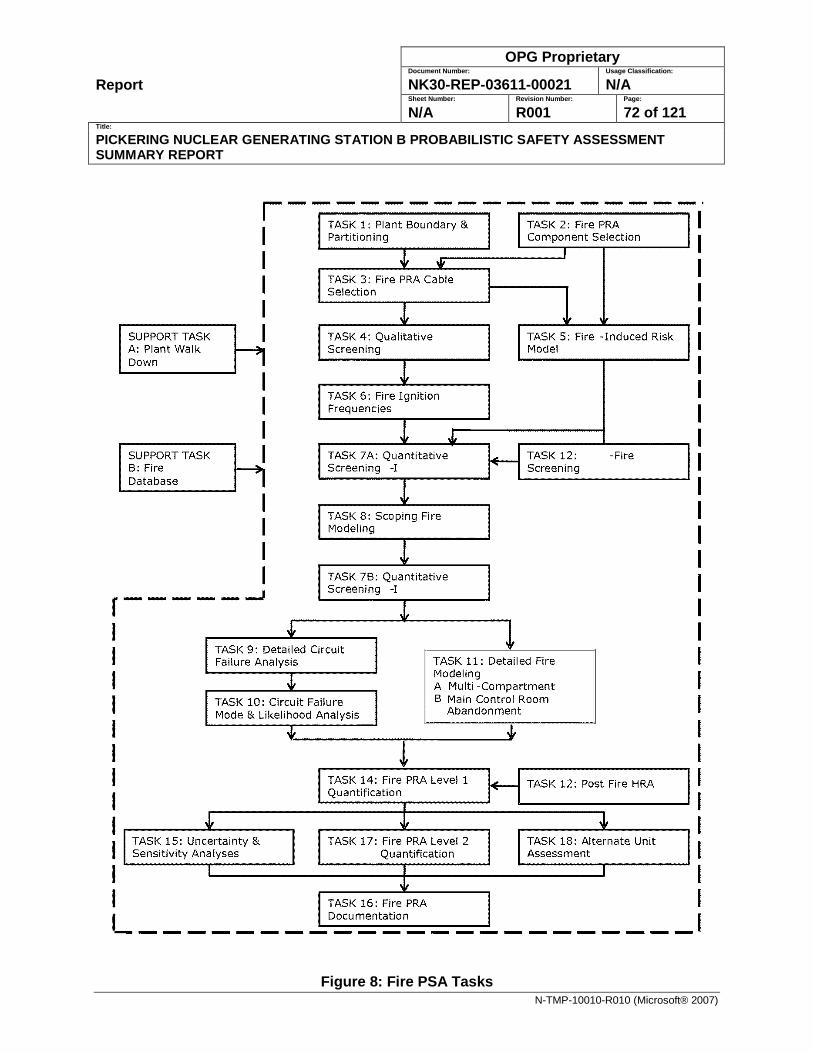
Report
OPG Proprietary Document Number: Usage Classification:
NK30-REP-03611-00021 N/A Sheet Number: Revision Number: Page:
N/A R001 72 of 121 Title:
PICKERING NUCLEAR GENERATING STATION B PROBABILISTIC SAFETY ASSESSMENT SUMMARY REPORT
N-TMP-10010-R010 (Microsoft® 2007)
Figure 8: Fire PSA Tasks
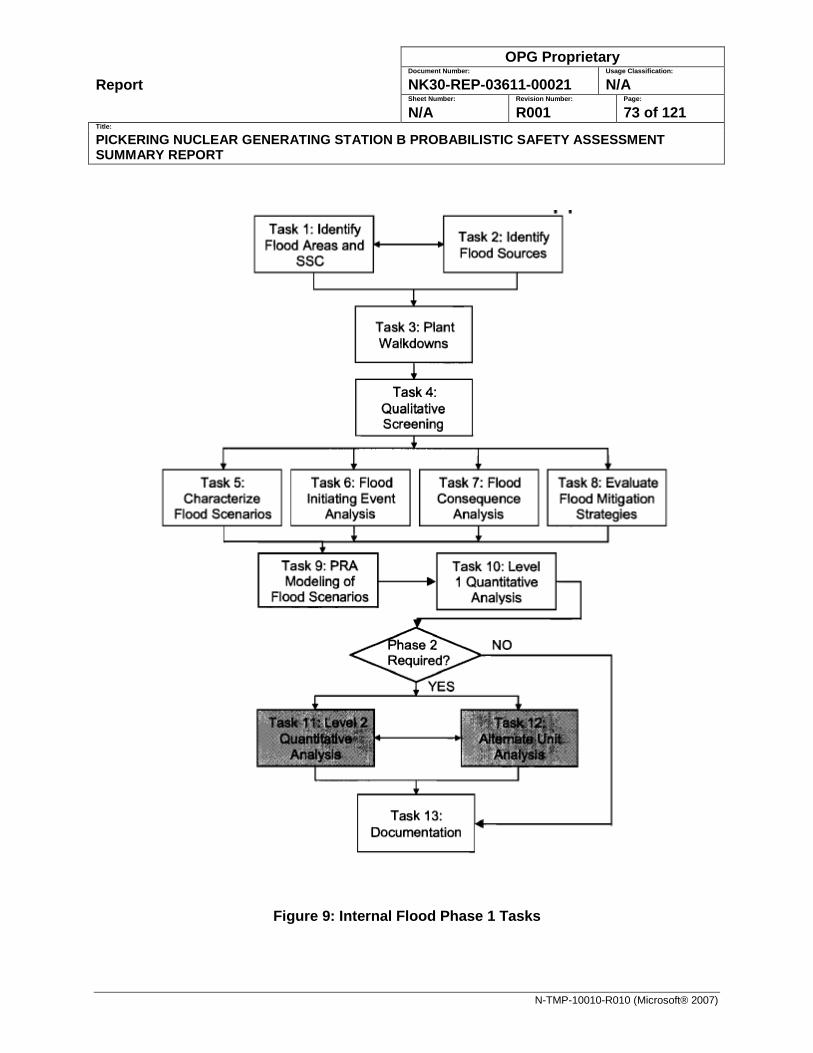
Report
OPG Proprietary Document Number: Usage Classification:
NK30-REP-03611-00021 N/A Sheet Number: Revision Number: Page:
N/A R001 73 of 121 Title:
PICKERING NUCLEAR GENERATING STATION B PROBABILISTIC SAFETY ASSESSMENT SUMMARY REPORT
N-TMP-10010-R010 (Microsoft® 2007)
Figure 9: Internal Flood Phase 1 Tasks
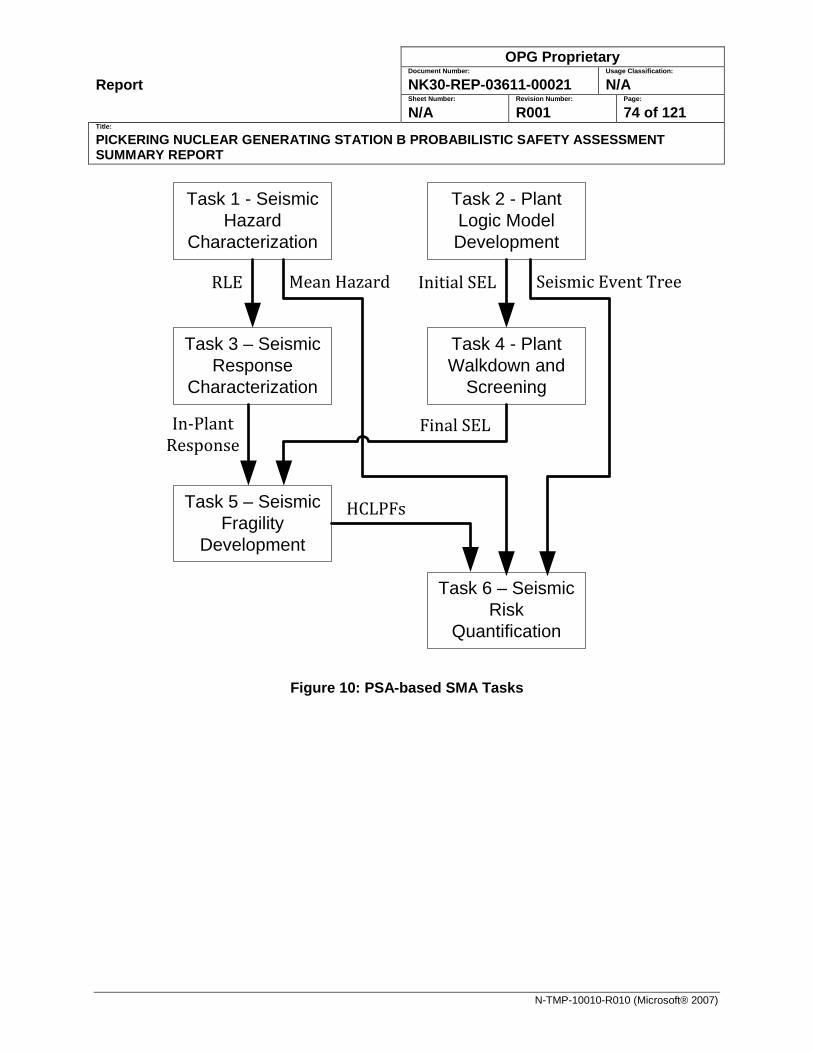
Report
OPG Proprietary Document Number: Usage Classification:
NK30-REP-03611-00021 N/A Sheet Number: Revision Number: Page:
N/A R001 74 of 121 Title:
PICKERING NUCLEAR GENERATING STATION B PROBABILISTIC SAFETY ASSESSMENT SUMMARY REPORT
N-TMP-10010-R010 (Microsoft® 2007)
Figure 10: PSA-based SMA Tasks
Task 2 - Plant Logic Model Development
Task 1 - Seismic Hazard
Characterization
Task 5 – Seismic Fragility
Development
Task 6 – Seismic Risk
Quantification
RLE Initial SEL
HCLPFs
Task 4 - Plant Walkdown and
Screening
Final SEL
Mean Hazard
Task 3 – Seismic Response
Characterization
Seismic Event Tree
In-Plant Response
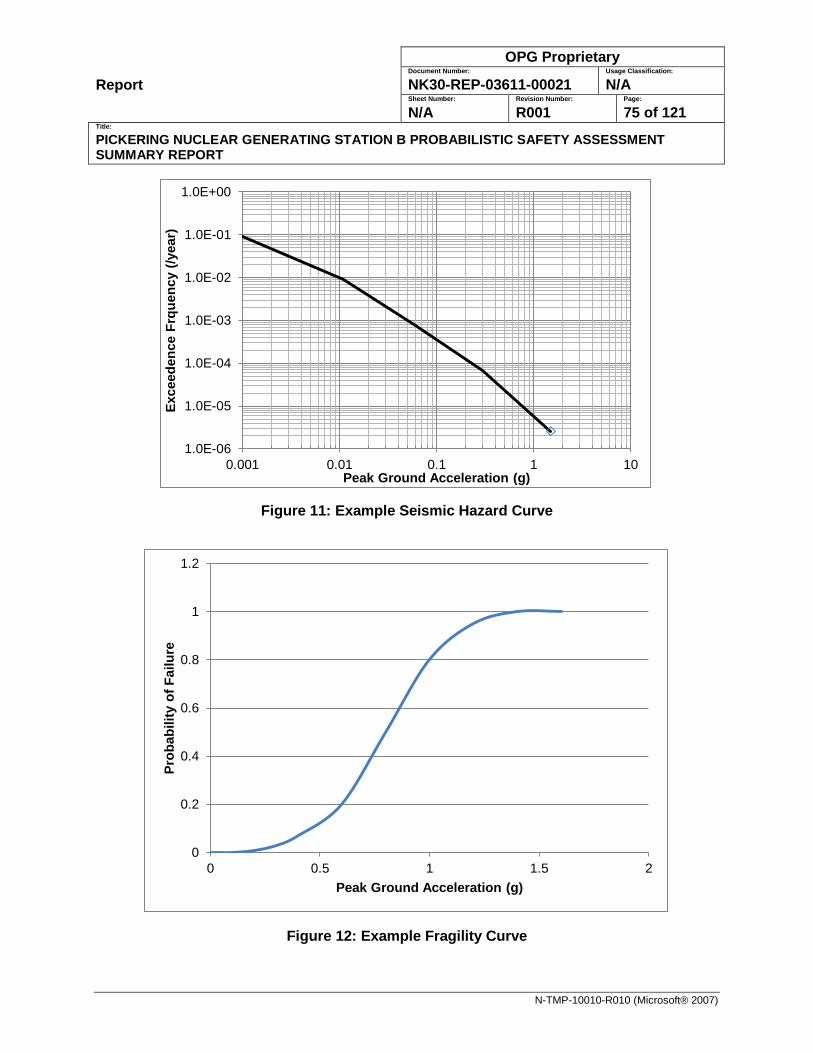
Report
OPG Proprietary Document Number: Usage Classification:
NK30-REP-03611-00021 N/A Sheet Number: Revision Number: Page:
N/A R001 75 of 121 Title:
PICKERING NUCLEAR GENERATING STATION B PROBABILISTIC SAFETY ASSESSMENT SUMMARY REPORT
N-TMP-10010-R010 (Microsoft® 2007)
Figure 11: Example Seismic Hazard Curve
Figure 12: Example Fragility Curve
1.0E-06
1.0E-05
1.0E-04
1.0E-03
1.0E-02
1.0E-01
1.0E+00
0.001 0.01 0.1 1 10
Exce
eden
ce F
rque
ncy
(/yea
r)
Peak Ground Acceleration (g)
0
0.2
0.4
0.6
0.8
1
1.2
0 0.5 1 1.5 2
Prob
abili
ty o
f Fai
lure
Peak Ground Acceleration (g)
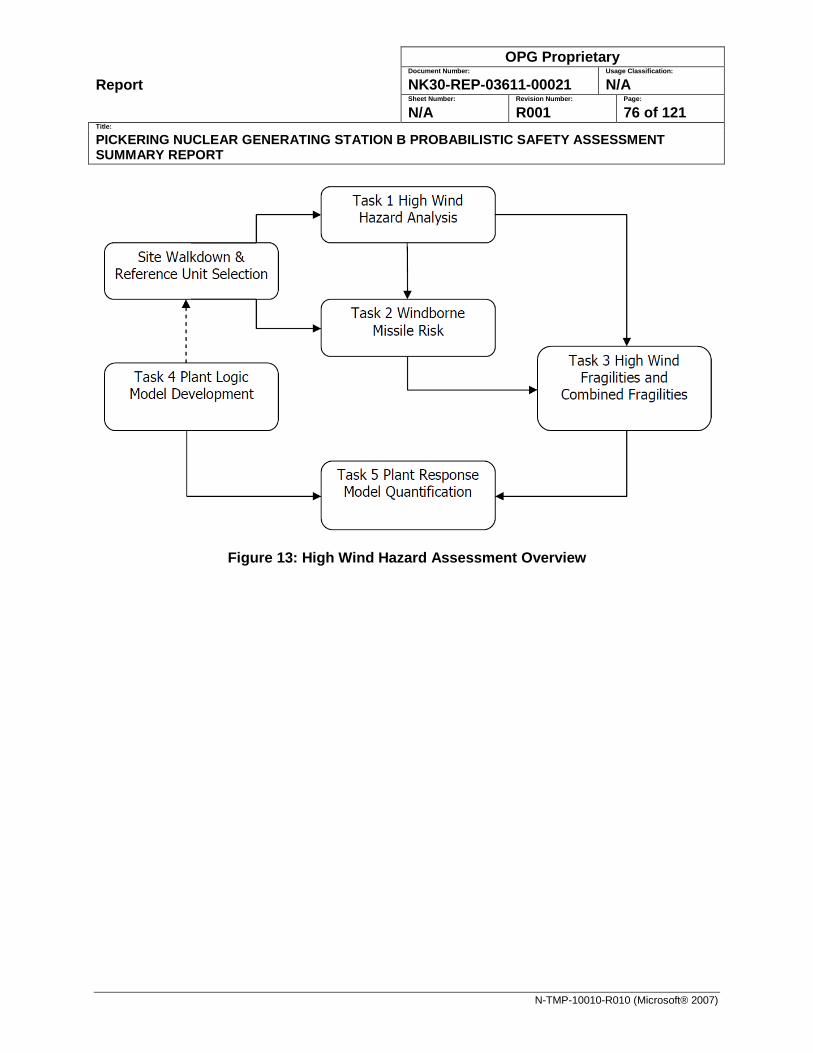
Report
OPG Proprietary Document Number: Usage Classification:
NK30-REP-03611-00021 N/A Sheet Number: Revision Number: Page:
N/A R001 76 of 121 Title:
PICKERING NUCLEAR GENERATING STATION B PROBABILISTIC SAFETY ASSESSMENT SUMMARY REPORT
N-TMP-10010-R010 (Microsoft® 2007)
Figure 13: High Wind Hazard Assessment Overview
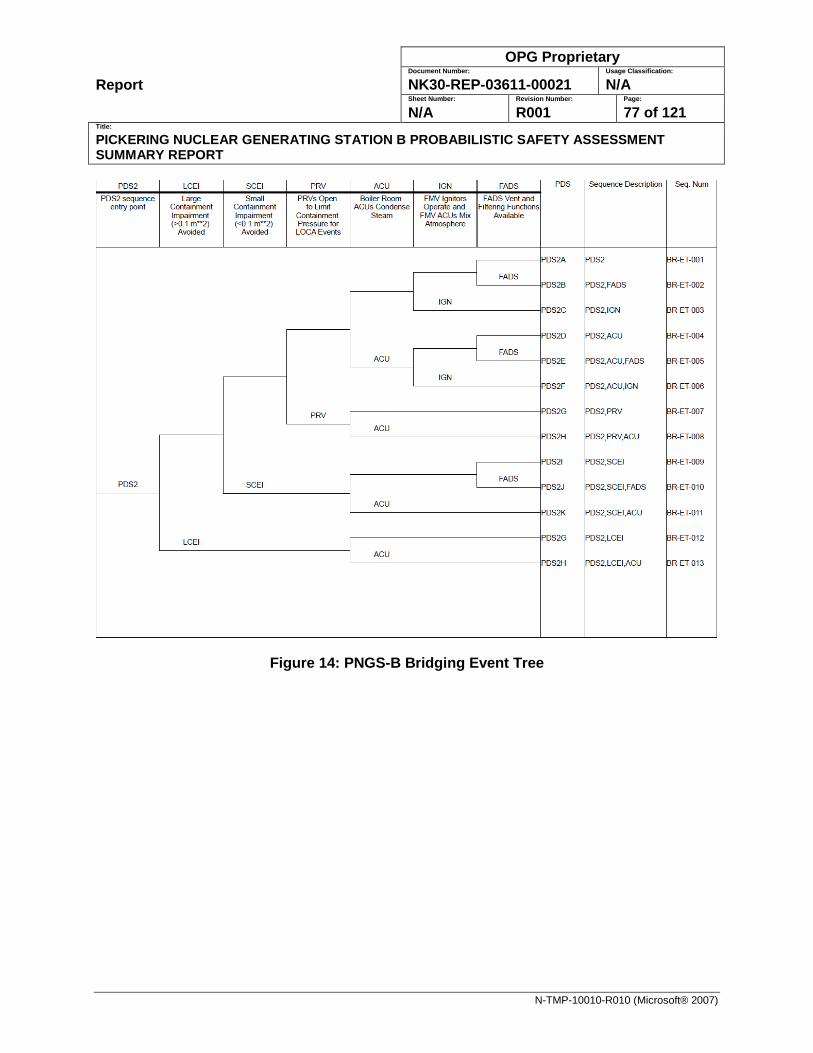
Report
OPG Proprietary Document Number: Usage Classification:
NK30-REP-03611-00021 N/A Sheet Number: Revision Number: Page:
N/A R001 77 of 121 Title:
PICKERING NUCLEAR GENERATING STATION B PROBABILISTIC SAFETY ASSESSMENT SUMMARY REPORT
N-TMP-10010-R010 (Microsoft® 2007)
Figure 14: PNGS-B Bridging Event Tree
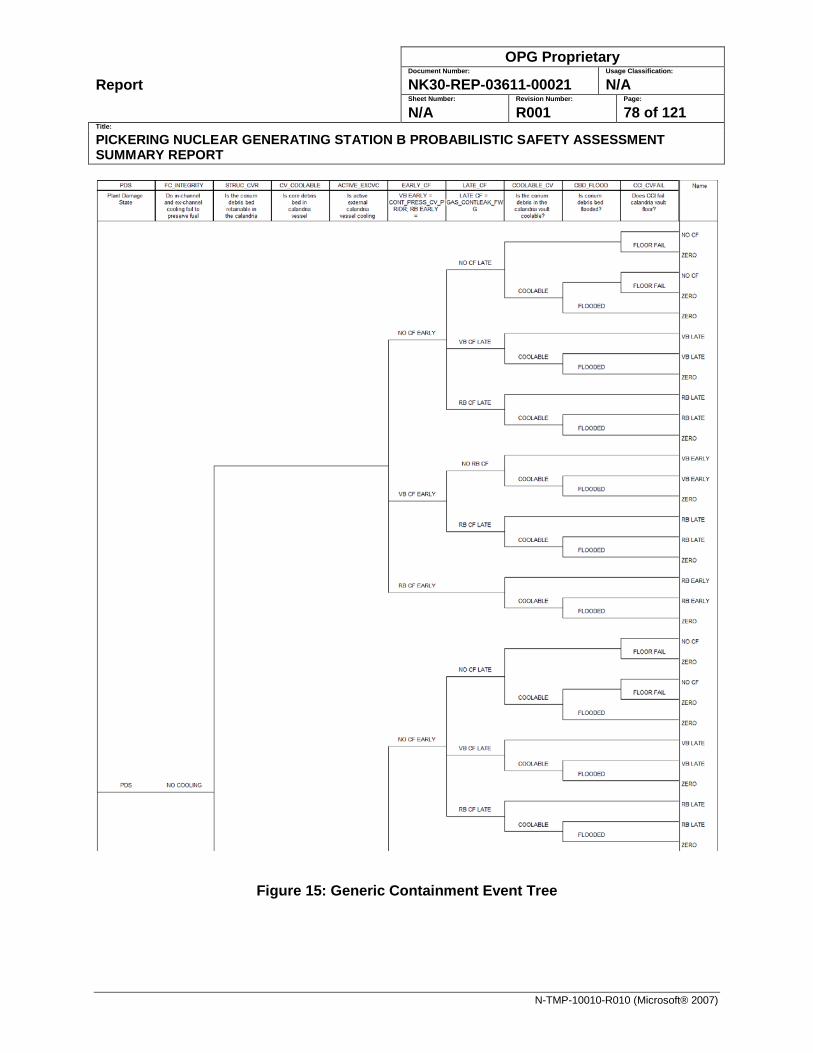
Report
OPG Proprietary Document Number: Usage Classification:
NK30-REP-03611-00021 N/A Sheet Number: Revision Number: Page:
N/A R001 78 of 121 Title:
PICKERING NUCLEAR GENERATING STATION B PROBABILISTIC SAFETY ASSESSMENT SUMMARY REPORT
N-TMP-10010-R010 (Microsoft® 2007)
Figure 15: Generic Containment Event Tree
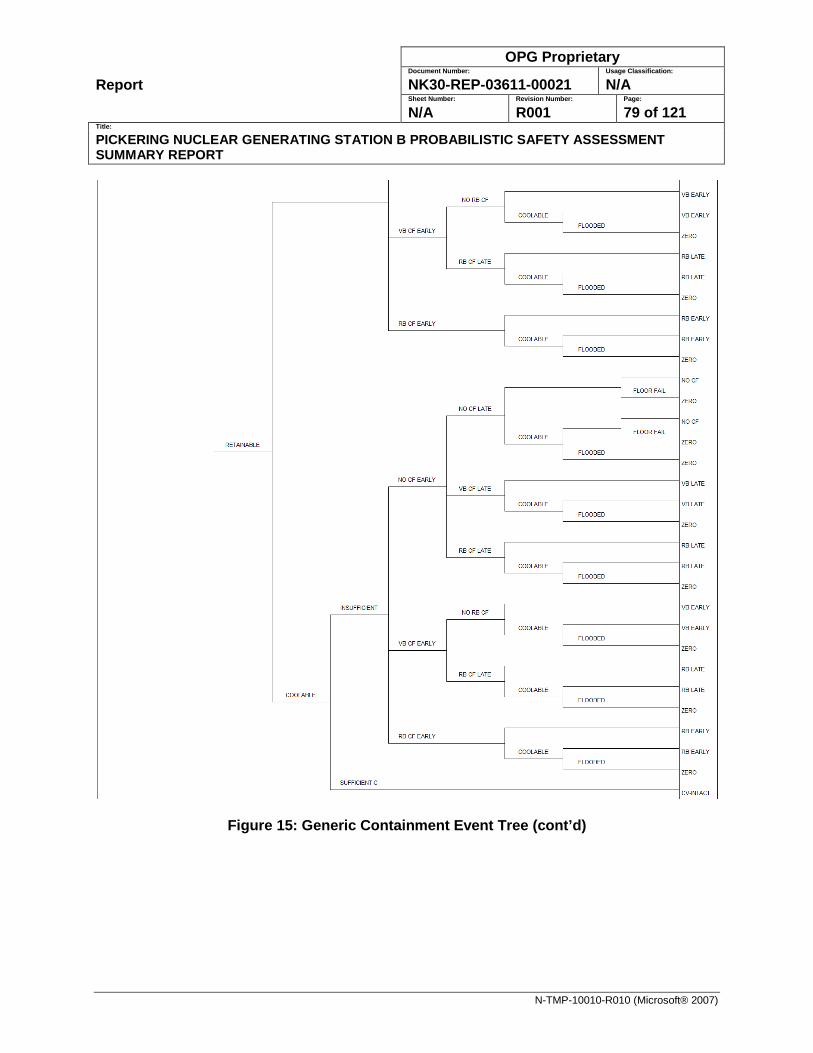
Report
OPG Proprietary Document Number: Usage Classification:
NK30-REP-03611-00021 N/A Sheet Number: Revision Number: Page:
N/A R001 79 of 121 Title:
PICKERING NUCLEAR GENERATING STATION B PROBABILISTIC SAFETY ASSESSMENT SUMMARY REPORT
N-TMP-10010-R010 (Microsoft® 2007)
Figure 15: Generic Containment Event Tree (cont’d)
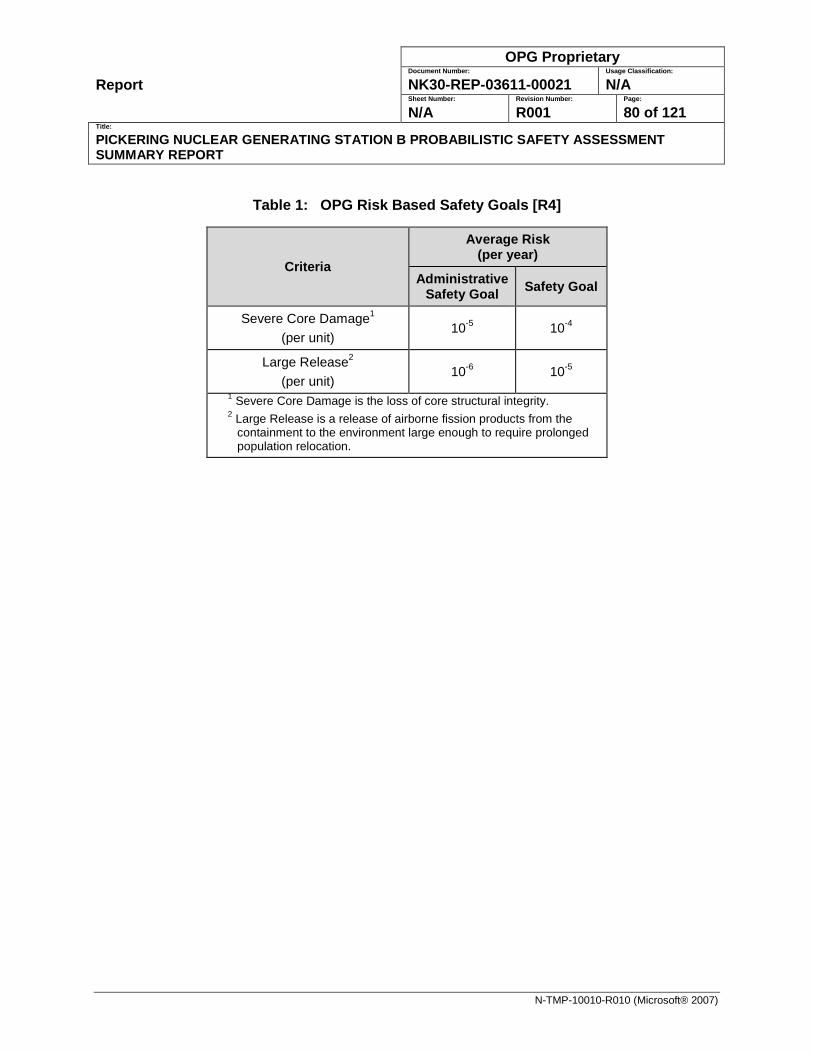
Report
OPG Proprietary Document Number: Usage Classification:
NK30-REP-03611-00021 N/A Sheet Number: Revision Number: Page:
N/A R001 80 of 121 Title:
PICKERING NUCLEAR GENERATING STATION B PROBABILISTIC SAFETY ASSESSMENT SUMMARY REPORT
N-TMP-10010-R010 (Microsoft® 2007)
Table 1: OPG Risk Based Safety Goals [R4]
Criteria
Average Risk (per year)
Administrative Safety Goal Safety Goal
Severe Core Damage1 (per unit) 10-5 10-4
Large Release2 (per unit) 10-6 10-5
1 Severe Core Damage is the loss of core structural integrity. 2 Large Release is a release of airborne fission products from the
containment to the environment large enough to require prolonged population relocation.
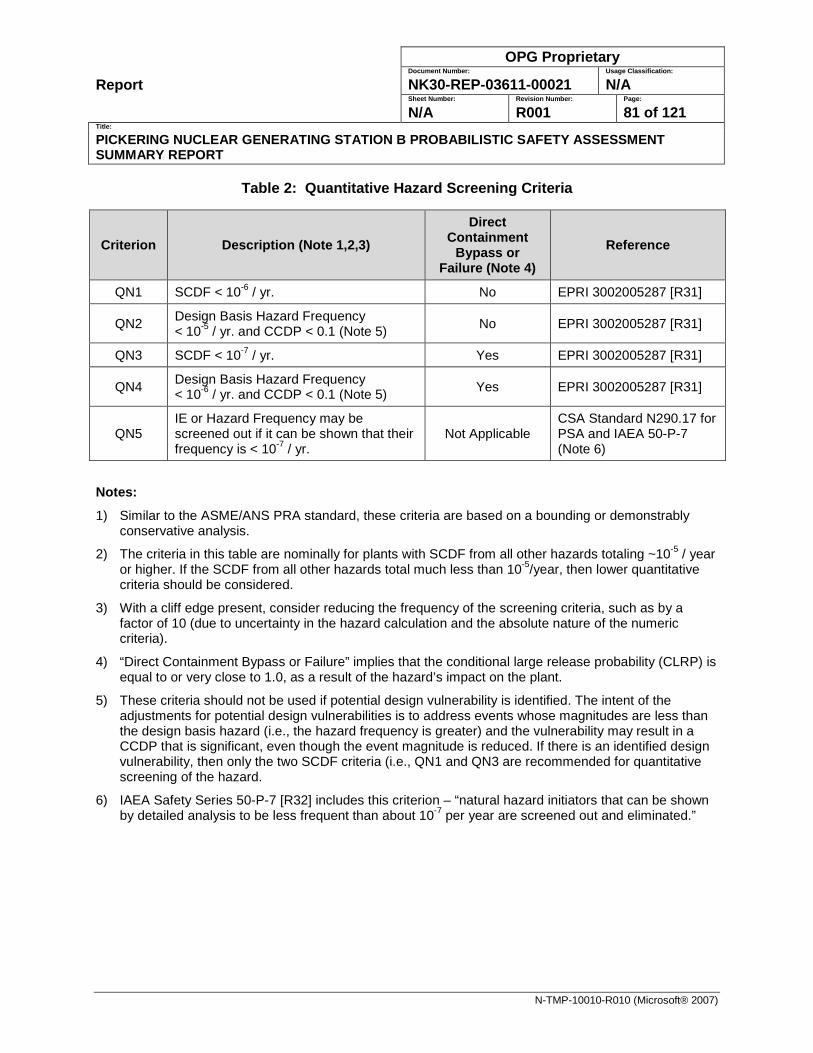
Report
OPG Proprietary Document Number: Usage Classification:
NK30-REP-03611-00021 N/A Sheet Number: Revision Number: Page:
N/A R001 81 of 121 Title:
PICKERING NUCLEAR GENERATING STATION B PROBABILISTIC SAFETY ASSESSMENT SUMMARY REPORT
N-TMP-10010-R010 (Microsoft® 2007)
Table 2: Quantitative Hazard Screening Criteria
Criterion Description (Note 1,2,3) Direct
Containment Bypass or
Failure (Note 4) Reference
QN1 SCDF < 10-6 / yr. No EPRI 3002005287 [R31]
QN2 Design Basis Hazard Frequency < 10-5 / yr. and CCDP < 0.1 (Note 5) No EPRI 3002005287 [R31]
QN3 SCDF < 10-7 / yr. Yes EPRI 3002005287 [R31]
QN4 Design Basis Hazard Frequency < 10-6 / yr. and CCDP < 0.1 (Note 5) Yes EPRI 3002005287 [R31]
QN5 IE or Hazard Frequency may be screened out if it can be shown that their frequency is < 10-7 / yr.
Not Applicable CSA Standard N290.17 for PSA and IAEA 50-P-7 (Note 6)
Notes:
1) Similar to the ASME/ANS PRA standard, these criteria are based on a bounding or demonstrably conservative analysis.
2) The criteria in this table are nominally for plants with SCDF from all other hazards totaling ~10-5 / year or higher. If the SCDF from all other hazards total much less than 10-5/year, then lower quantitative criteria should be considered.
3) With a cliff edge present, consider reducing the frequency of the screening criteria, such as by a factor of 10 (due to uncertainty in the hazard calculation and the absolute nature of the numeric criteria).
4) “Direct Containment Bypass or Failure” implies that the conditional large release probability (CLRP) is equal to or very close to 1.0, as a result of the hazard’s impact on the plant.
5) These criteria should not be used if potential design vulnerability is identified. The intent of the adjustments for potential design vulnerabilities is to address events whose magnitudes are less than the design basis hazard (i.e., the hazard frequency is greater) and the vulnerability may result in a CCDP that is significant, even though the event magnitude is reduced. If there is an identified design vulnerability, then only the two SCDF criteria (i.e., QN1 and QN3 are recommended for quantitative screening of the hazard.
6) IAEA Safety Series 50-P-7 [R32] includes this criterion – “natural hazard initiators that can be shown by detailed analysis to be less frequent than about 10-7 per year are screened out and eliminated.”
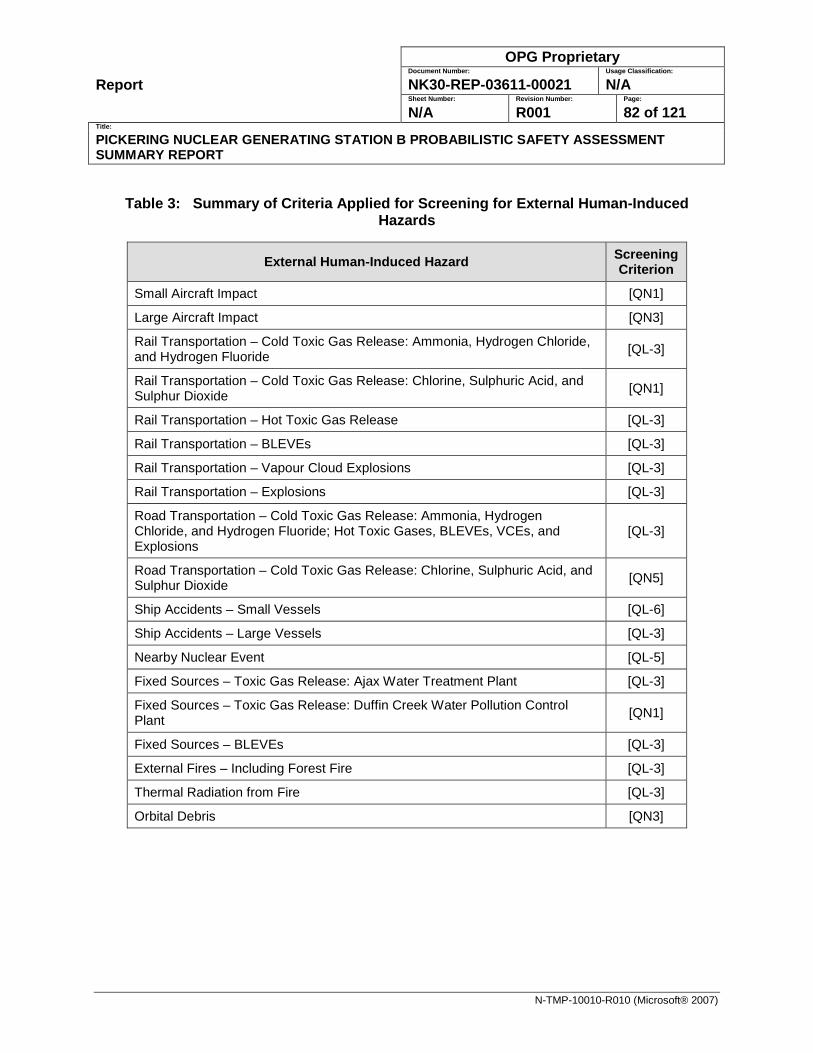
Report
OPG Proprietary Document Number: Usage Classification:
NK30-REP-03611-00021 N/A Sheet Number: Revision Number: Page:
N/A R001 82 of 121 Title:
PICKERING NUCLEAR GENERATING STATION B PROBABILISTIC SAFETY ASSESSMENT SUMMARY REPORT
N-TMP-10010-R010 (Microsoft® 2007)
Table 3: Summary of Criteria Applied for Screening for External Human-Induced
Hazards
External Human-Induced Hazard Screening Criterion
Small Aircraft Impact [QN1]
Large Aircraft Impact [QN3]
Rail Transportation – Cold Toxic Gas Release: Ammonia, Hydrogen Chloride, and Hydrogen Fluoride [QL-3]
Rail Transportation – Cold Toxic Gas Release: Chlorine, Sulphuric Acid, and Sulphur Dioxide [QN1]
Rail Transportation – Hot Toxic Gas Release [QL-3]
Rail Transportation – BLEVEs [QL-3]
Rail Transportation – Vapour Cloud Explosions [QL-3]
Rail Transportation – Explosions [QL-3]
Road Transportation – Cold Toxic Gas Release: Ammonia, Hydrogen Chloride, and Hydrogen Fluoride; Hot Toxic Gases, BLEVEs, VCEs, and Explosions
[QL-3]
Road Transportation – Cold Toxic Gas Release: Chlorine, Sulphuric Acid, and Sulphur Dioxide [QN5]
Ship Accidents – Small Vessels [QL-6]
Ship Accidents – Large Vessels [QL-3]
Nearby Nuclear Event [QL-5]
Fixed Sources – Toxic Gas Release: Ajax Water Treatment Plant [QL-3]
Fixed Sources – Toxic Gas Release: Duffin Creek Water Pollution Control Plant [QN1]
Fixed Sources – BLEVEs [QL-3]
External Fires – Including Forest Fire [QL-3]
Thermal Radiation from Fire [QL-3]
Orbital Debris [QN3]
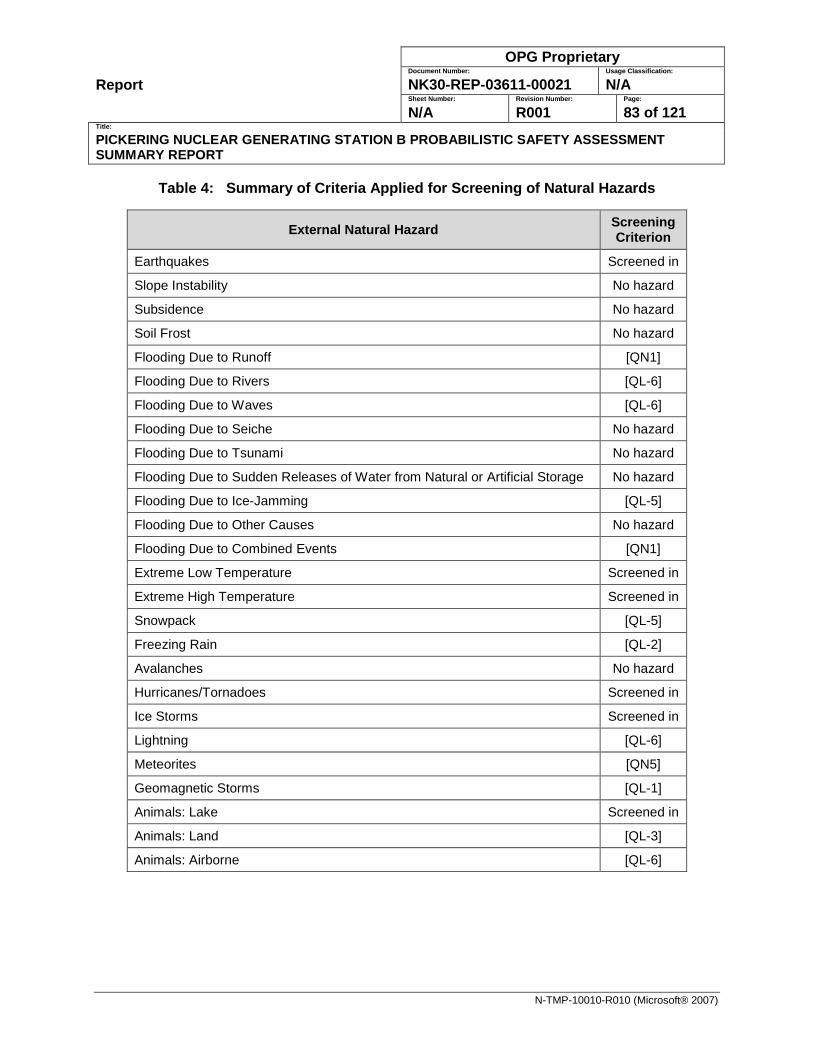
Report
OPG Proprietary Document Number: Usage Classification:
NK30-REP-03611-00021 N/A Sheet Number: Revision Number: Page:
N/A R001 83 of 121 Title:
PICKERING NUCLEAR GENERATING STATION B PROBABILISTIC SAFETY ASSESSMENT SUMMARY REPORT
N-TMP-10010-R010 (Microsoft® 2007)
Table 4: Summary of Criteria Applied for Screening of Natural Hazards
External Natural Hazard Screening Criterion
Earthquakes Screened in
Slope Instability No hazard
Subsidence No hazard
Soil Frost No hazard
Flooding Due to Runoff [QN1]
Flooding Due to Rivers [QL-6]
Flooding Due to Waves [QL-6]
Flooding Due to Seiche No hazard
Flooding Due to Tsunami No hazard
Flooding Due to Sudden Releases of Water from Natural or Artificial Storage No hazard
Flooding Due to Ice-Jamming [QL-5]
Flooding Due to Other Causes No hazard
Flooding Due to Combined Events [QN1]
Extreme Low Temperature Screened in
Extreme High Temperature Screened in
Snowpack [QL-5]
Freezing Rain [QL-2]
Avalanches No hazard
Hurricanes/Tornadoes Screened in
Ice Storms Screened in
Lightning [QL-6]
Meteorites [QN5]
Geomagnetic Storms [QL-1]
Animals: Lake Screened in
Animals: Land [QL-3]
Animals: Airborne [QL-6]
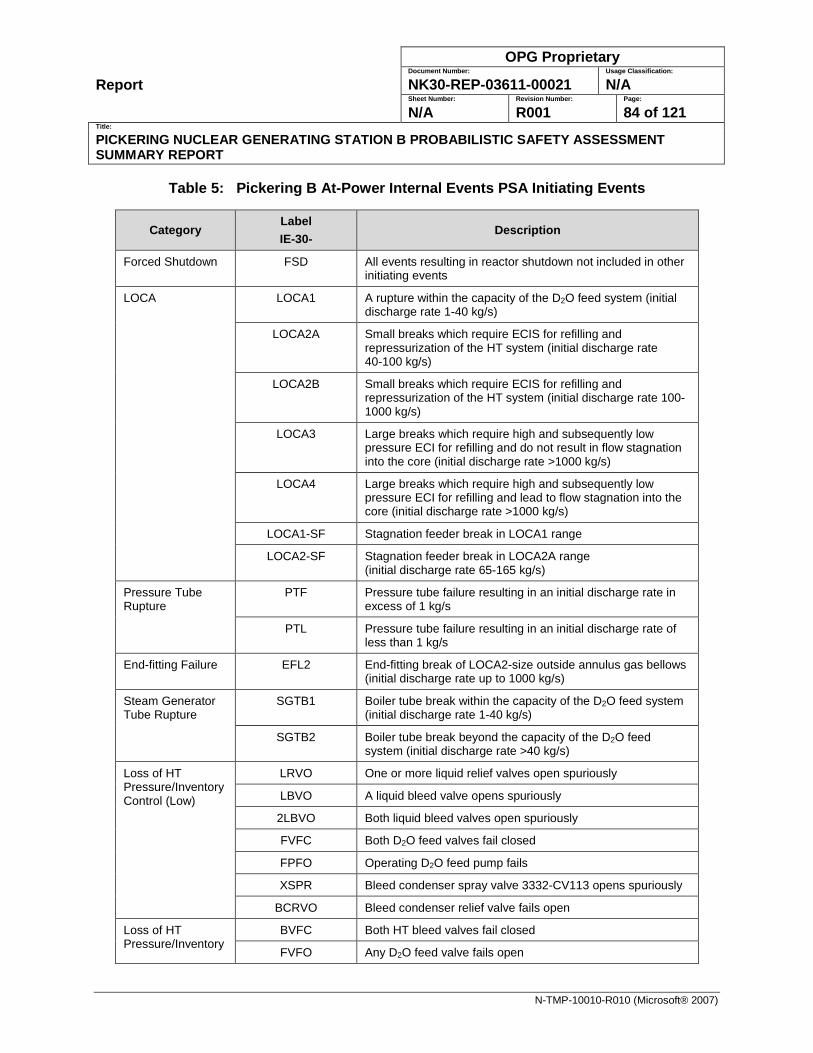
Report
OPG Proprietary Document Number: Usage Classification:
NK30-REP-03611-00021 N/A Sheet Number: Revision Number: Page:
N/A R001 84 of 121 Title:
PICKERING NUCLEAR GENERATING STATION B PROBABILISTIC SAFETY ASSESSMENT SUMMARY REPORT
N-TMP-10010-R010 (Microsoft® 2007)
Table 5: Pickering B At-Power Internal Events PSA Initiating Events
Category Label IE-30-
Description
Forced Shutdown FSD All events resulting in reactor shutdown not included in other initiating events
LOCA LOCA1 A rupture within the capacity of the D2O feed system (initial discharge rate 1-40 kg/s)
LOCA2A Small breaks which require ECIS for refilling and repressurization of the HT system (initial discharge rate 40-100 kg/s)
LOCA2B Small breaks which require ECIS for refilling and repressurization of the HT system (initial discharge rate 100-1000 kg/s)
LOCA3 Large breaks which require high and subsequently low pressure ECI for refilling and do not result in flow stagnation into the core (initial discharge rate >1000 kg/s)
LOCA4 Large breaks which require high and subsequently low pressure ECI for refilling and lead to flow stagnation into the core (initial discharge rate >1000 kg/s)
LOCA1-SF Stagnation feeder break in LOCA1 range
LOCA2-SF Stagnation feeder break in LOCA2A range (initial discharge rate 65-165 kg/s)
Pressure Tube Rupture
PTF Pressure tube failure resulting in an initial discharge rate in excess of 1 kg/s
PTL Pressure tube failure resulting in an initial discharge rate of less than 1 kg/s
End-fitting Failure EFL2 End-fitting break of LOCA2-size outside annulus gas bellows (initial discharge rate up to 1000 kg/s)
Steam Generator Tube Rupture
SGTB1 Boiler tube break within the capacity of the D2O feed system (initial discharge rate 1-40 kg/s)
SGTB2 Boiler tube break beyond the capacity of the D2O feed system (initial discharge rate >40 kg/s)
Loss of HT Pressure/Inventory Control (Low)
LRVO One or more liquid relief valves open spuriously
LBVO A liquid bleed valve opens spuriously
2LBVO Both liquid bleed valves open spuriously
FVFC Both D2O feed valves fail closed
FPFO Operating D2O feed pump fails
XSPR Bleed condenser spray valve 3332-CV113 opens spuriously
BCRVO Bleed condenser relief valve fails open
Loss of HT Pressure/Inventory
BVFC Both HT bleed valves fail closed
FVFO Any D2O feed valve fails open
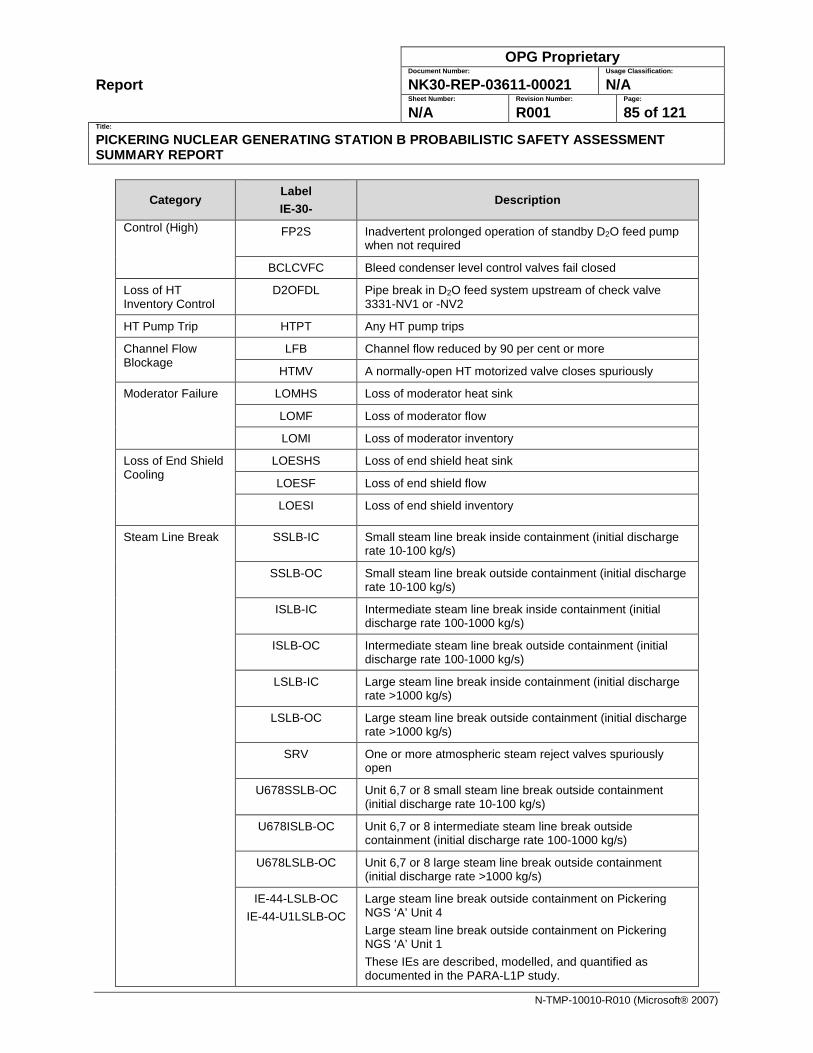
Report
OPG Proprietary Document Number: Usage Classification:
NK30-REP-03611-00021 N/A Sheet Number: Revision Number: Page:
N/A R001 85 of 121 Title:
PICKERING NUCLEAR GENERATING STATION B PROBABILISTIC SAFETY ASSESSMENT SUMMARY REPORT
N-TMP-10010-R010 (Microsoft® 2007)
Category Label IE-30-
Description
Control (High) FP2S Inadvertent prolonged operation of standby D2O feed pump when not required
BCLCVFC Bleed condenser level control valves fail closed
Loss of HT Inventory Control
D2OFDL Pipe break in D2O feed system upstream of check valve 3331-NV1 or -NV2
HT Pump Trip HTPT Any HT pump trips
Channel Flow Blockage
LFB Channel flow reduced by 90 per cent or more
HTMV A normally-open HT motorized valve closes spuriously
Moderator Failure LOMHS Loss of moderator heat sink
LOMF Loss of moderator flow
LOMI Loss of moderator inventory
Loss of End Shield Cooling
LOESHS Loss of end shield heat sink
LOESF Loss of end shield flow
LOESI Loss of end shield inventory
Steam Line Break SSLB-IC Small steam line break inside containment (initial discharge rate 10-100 kg/s)
SSLB-OC Small steam line break outside containment (initial discharge rate 10-100 kg/s)
ISLB-IC Intermediate steam line break inside containment (initial discharge rate 100-1000 kg/s)
ISLB-OC Intermediate steam line break outside containment (initial discharge rate 100-1000 kg/s)
LSLB-IC Large steam line break inside containment (initial discharge rate >1000 kg/s)
LSLB-OC Large steam line break outside containment (initial discharge rate >1000 kg/s)
SRV One or more atmospheric steam reject valves spuriously open
U678SSLB-OC Unit 6,7 or 8 small steam line break outside containment (initial discharge rate 10-100 kg/s)
U678ISLB-OC Unit 6,7 or 8 intermediate steam line break outside containment (initial discharge rate 100-1000 kg/s)
U678LSLB-OC Unit 6,7 or 8 large steam line break outside containment (initial discharge rate >1000 kg/s)
IE-44-LSLB-OC IE-44-U1LSLB-OC
Large steam line break outside containment on Pickering NGS ‘A’ Unit 4 Large steam line break outside containment on Pickering NGS ‘A’ Unit 1 These IEs are described, modelled, and quantified as documented in the PARA-L1P study.
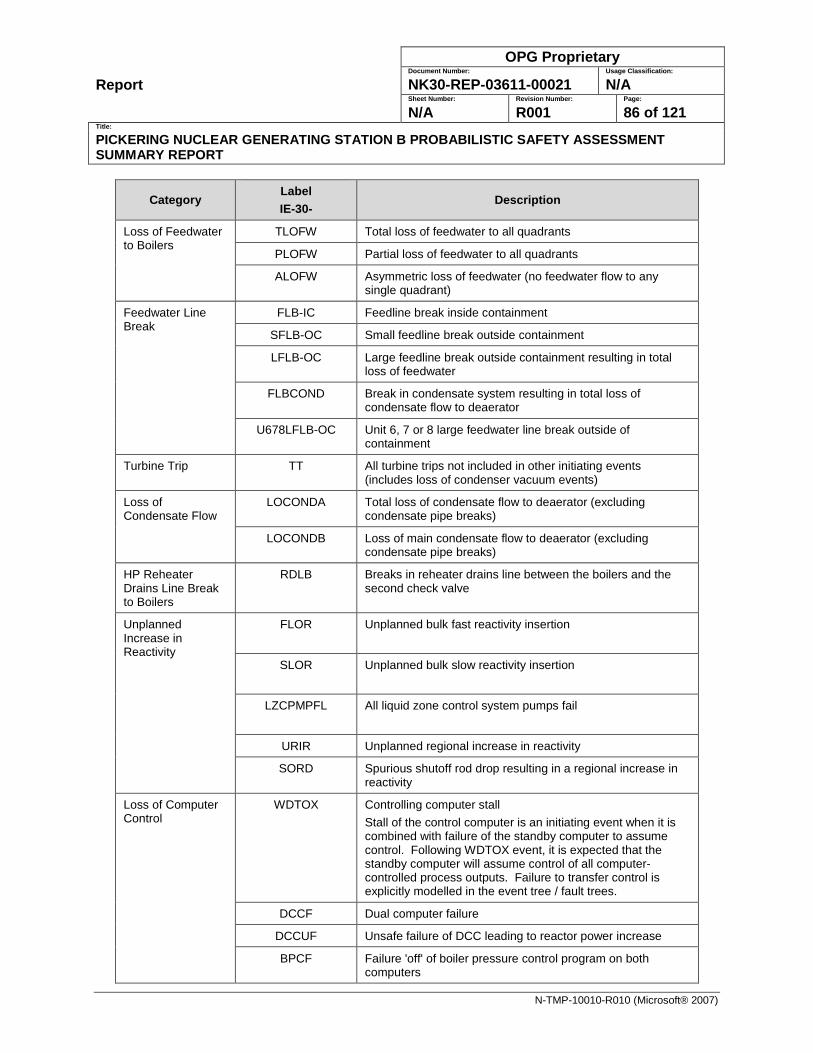
Report
OPG Proprietary Document Number: Usage Classification:
NK30-REP-03611-00021 N/A Sheet Number: Revision Number: Page:
N/A R001 86 of 121 Title:
PICKERING NUCLEAR GENERATING STATION B PROBABILISTIC SAFETY ASSESSMENT SUMMARY REPORT
N-TMP-10010-R010 (Microsoft® 2007)
Category Label IE-30-
Description
Loss of Feedwater to Boilers
TLOFW Total loss of feedwater to all quadrants
PLOFW Partial loss of feedwater to all quadrants
ALOFW Asymmetric loss of feedwater (no feedwater flow to any single quadrant)
Feedwater Line Break
FLB-IC Feedline break inside containment
SFLB-OC Small feedline break outside containment
LFLB-OC Large feedline break outside containment resulting in total loss of feedwater
FLBCOND Break in condensate system resulting in total loss of condensate flow to deaerator
U678LFLB-OC Unit 6, 7 or 8 large feedwater line break outside of containment
Turbine Trip TT All turbine trips not included in other initiating events (includes loss of condenser vacuum events)
Loss of Condensate Flow
LOCONDA Total loss of condensate flow to deaerator (excluding condensate pipe breaks)
LOCONDB Loss of main condensate flow to deaerator (excluding condensate pipe breaks)
HP Reheater Drains Line Break to Boilers
RDLB Breaks in reheater drains line between the boilers and the second check valve
Unplanned Increase in Reactivity
FLOR Unplanned bulk fast reactivity insertion
SLOR Unplanned bulk slow reactivity insertion
LZCPMPFL All liquid zone control system pumps fail
URIR Unplanned regional increase in reactivity
SORD Spurious shutoff rod drop resulting in a regional increase in reactivity
Loss of Computer Control
WDTOX Controlling computer stall Stall of the control computer is an initiating event when it is combined with failure of the standby computer to assume control. Following WDTOX event, it is expected that the standby computer will assume control of all computer-controlled process outputs. Failure to transfer control is explicitly modelled in the event tree / fault trees.
DCCF Dual computer failure
DCCUF Unsafe failure of DCC leading to reactor power increase
BPCF Failure 'off' of boiler pressure control program on both computers
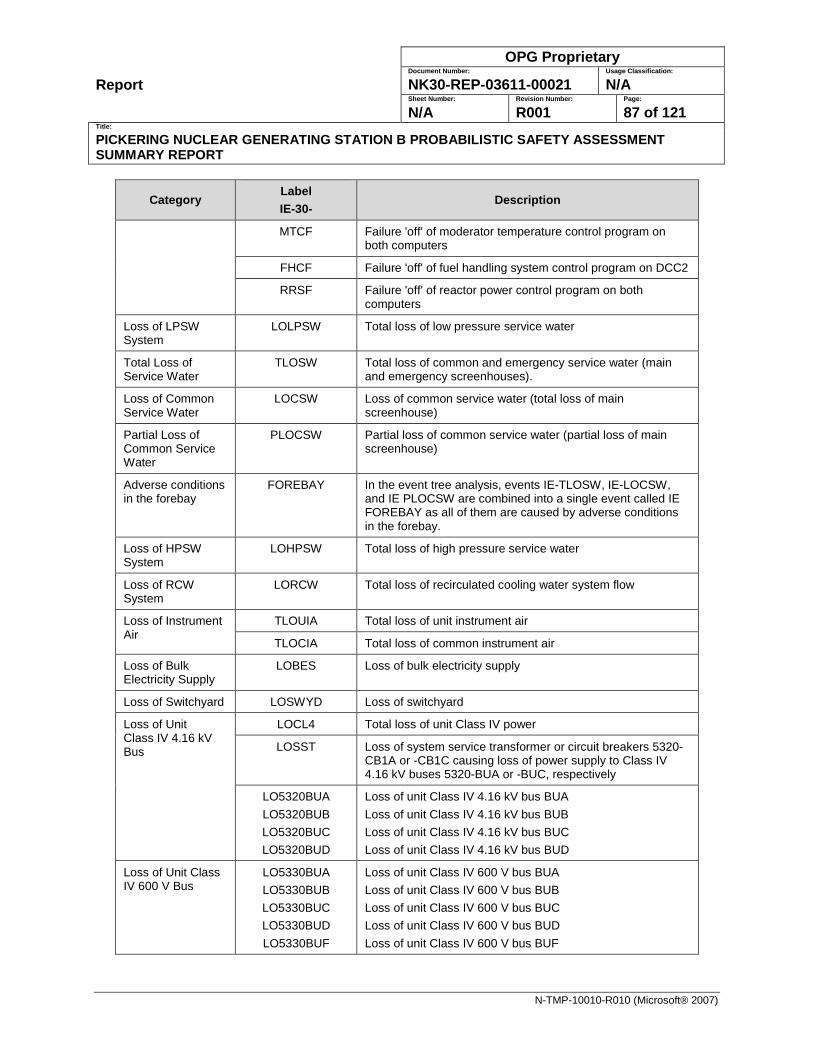
Report
OPG Proprietary Document Number: Usage Classification:
NK30-REP-03611-00021 N/A Sheet Number: Revision Number: Page:
N/A R001 87 of 121 Title:
PICKERING NUCLEAR GENERATING STATION B PROBABILISTIC SAFETY ASSESSMENT SUMMARY REPORT
N-TMP-10010-R010 (Microsoft® 2007)
Category Label IE-30-
Description
MTCF Failure 'off' of moderator temperature control program on both computers
FHCF Failure 'off' of fuel handling system control program on DCC2
RRSF Failure 'off' of reactor power control program on both computers
Loss of LPSW System
LOLPSW Total loss of low pressure service water
Total Loss of Service Water
TLOSW Total loss of common and emergency service water (main and emergency screenhouses).
Loss of Common Service Water
LOCSW Loss of common service water (total loss of main screenhouse)
Partial Loss of Common Service Water
PLOCSW Partial loss of common service water (partial loss of main screenhouse)
Adverse conditions in the forebay
FOREBAY In the event tree analysis, events IE-TLOSW, IE-LOCSW, and IE PLOCSW are combined into a single event called IE FOREBAY as all of them are caused by adverse conditions in the forebay.
Loss of HPSW System
LOHPSW Total loss of high pressure service water
Loss of RCW System
LORCW Total loss of recirculated cooling water system flow
Loss of Instrument Air
TLOUIA Total loss of unit instrument air
TLOCIA Total loss of common instrument air
Loss of Bulk Electricity Supply
LOBES Loss of bulk electricity supply
Loss of Switchyard LOSWYD Loss of switchyard
Loss of Unit Class IV 4.16 kV Bus
LOCL4 Total loss of unit Class IV power
LOSST Loss of system service transformer or circuit breakers 5320-CB1A or -CB1C causing loss of power supply to Class IV 4.16 kV buses 5320-BUA or -BUC, respectively
LO5320BUA LO5320BUB LO5320BUC LO5320BUD
Loss of unit Class IV 4.16 kV bus BUA Loss of unit Class IV 4.16 kV bus BUB Loss of unit Class IV 4.16 kV bus BUC Loss of unit Class IV 4.16 kV bus BUD
Loss of Unit Class IV 600 V Bus
LO5330BUA LO5330BUB LO5330BUC LO5330BUD LO5330BUF
Loss of unit Class IV 600 V bus BUA Loss of unit Class IV 600 V bus BUB Loss of unit Class IV 600 V bus BUC Loss of unit Class IV 600 V bus BUD Loss of unit Class IV 600 V bus BUF
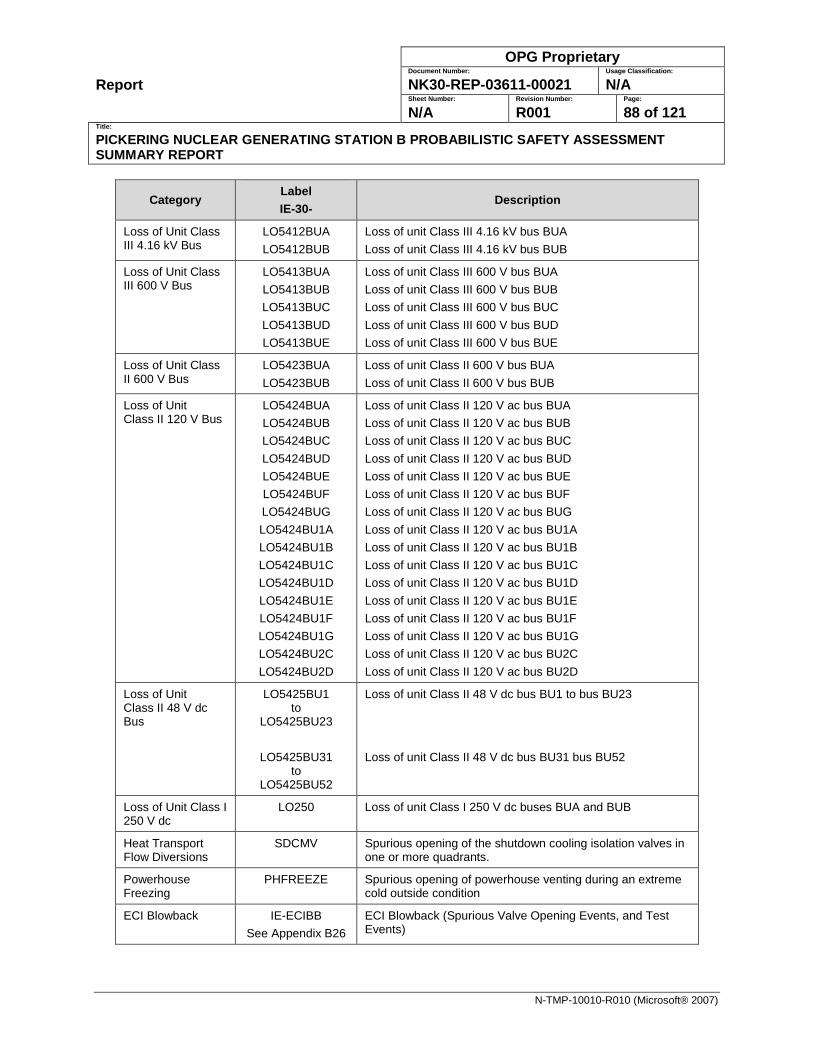
Report
OPG Proprietary Document Number: Usage Classification:
NK30-REP-03611-00021 N/A Sheet Number: Revision Number: Page:
N/A R001 88 of 121 Title:
PICKERING NUCLEAR GENERATING STATION B PROBABILISTIC SAFETY ASSESSMENT SUMMARY REPORT
N-TMP-10010-R010 (Microsoft® 2007)
Category Label IE-30-
Description
Loss of Unit Class III 4.16 kV Bus
LO5412BUA LO5412BUB
Loss of unit Class III 4.16 kV bus BUA Loss of unit Class III 4.16 kV bus BUB
Loss of Unit Class III 600 V Bus
LO5413BUA LO5413BUB LO5413BUC LO5413BUD LO5413BUE
Loss of unit Class III 600 V bus BUA Loss of unit Class III 600 V bus BUB Loss of unit Class III 600 V bus BUC Loss of unit Class III 600 V bus BUD Loss of unit Class III 600 V bus BUE
Loss of Unit Class II 600 V Bus
LO5423BUA LO5423BUB
Loss of unit Class II 600 V bus BUA Loss of unit Class II 600 V bus BUB
Loss of Unit Class II 120 V Bus
LO5424BUA LO5424BUB LO5424BUC LO5424BUD LO5424BUE LO5424BUF LO5424BUG LO5424BU1A LO5424BU1B LO5424BU1C LO5424BU1D LO5424BU1E LO5424BU1F LO5424BU1G LO5424BU2C LO5424BU2D
Loss of unit Class II 120 V ac bus BUA Loss of unit Class II 120 V ac bus BUB Loss of unit Class II 120 V ac bus BUC Loss of unit Class II 120 V ac bus BUD Loss of unit Class II 120 V ac bus BUE Loss of unit Class II 120 V ac bus BUF Loss of unit Class II 120 V ac bus BUG Loss of unit Class II 120 V ac bus BU1A Loss of unit Class II 120 V ac bus BU1B Loss of unit Class II 120 V ac bus BU1C Loss of unit Class II 120 V ac bus BU1D Loss of unit Class II 120 V ac bus BU1E Loss of unit Class II 120 V ac bus BU1F Loss of unit Class II 120 V ac bus BU1G Loss of unit Class II 120 V ac bus BU2C Loss of unit Class II 120 V ac bus BU2D
Loss of Unit Class II 48 V dc Bus
LO5425BU1 to
LO5425BU23
LO5425BU31 to
LO5425BU52
Loss of unit Class II 48 V dc bus BU1 to bus BU23 Loss of unit Class II 48 V dc bus BU31 bus BU52
Loss of Unit Class I 250 V dc
LO250 Loss of unit Class I 250 V dc buses BUA and BUB
Heat Transport Flow Diversions
SDCMV Spurious opening of the shutdown cooling isolation valves in one or more quadrants.
Powerhouse Freezing
PHFREEZE Spurious opening of powerhouse venting during an extreme cold outside condition
ECI Blowback IE-ECIBB See Appendix B26
ECI Blowback (Spurious Valve Opening Events, and Test Events)
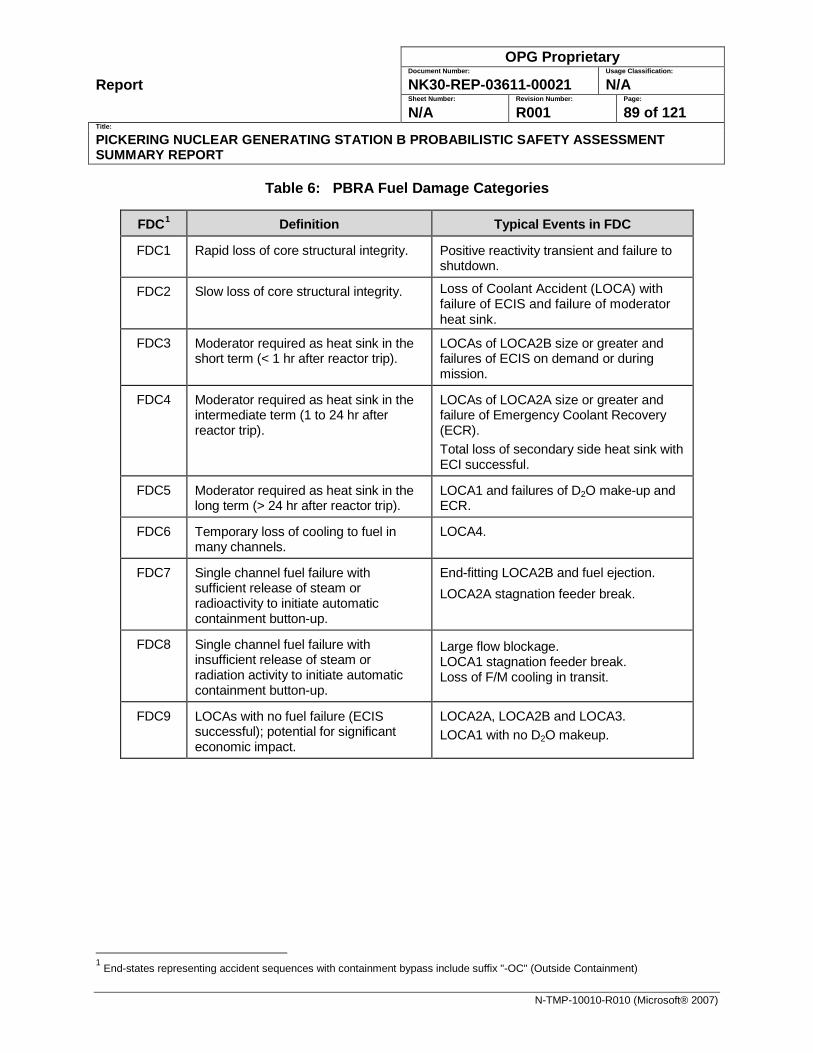
Report
OPG Proprietary Document Number: Usage Classification:
NK30-REP-03611-00021 N/A Sheet Number: Revision Number: Page:
N/A R001 89 of 121 Title:
PICKERING NUCLEAR GENERATING STATION B PROBABILISTIC SAFETY ASSESSMENT SUMMARY REPORT
N-TMP-10010-R010 (Microsoft® 2007)
Table 6: PBRA Fuel Damage Categories
FDC1 Definition Typical Events in FDC
FDC1 Rapid loss of core structural integrity. Positive reactivity transient and failure to shutdown.
FDC2 Slow loss of core structural integrity. Loss of Coolant Accident (LOCA) with failure of ECIS and failure of moderator heat sink.
FDC3 Moderator required as heat sink in the short term (< 1 hr after reactor trip).
LOCAs of LOCA2B size or greater and failures of ECIS on demand or during mission.
FDC4 Moderator required as heat sink in the intermediate term (1 to 24 hr after reactor trip).
LOCAs of LOCA2A size or greater and failure of Emergency Coolant Recovery (ECR). Total loss of secondary side heat sink with ECI successful.
FDC5 Moderator required as heat sink in the long term (> 24 hr after reactor trip).
LOCA1 and failures of D2O make-up and ECR.
FDC6 Temporary loss of cooling to fuel in many channels.
LOCA4.
FDC7 Single channel fuel failure with sufficient release of steam or radioactivity to initiate automatic containment button-up.
End-fitting LOCA2B and fuel ejection. LOCA2A stagnation feeder break.
FDC8 Single channel fuel failure with insufficient release of steam or radiation activity to initiate automatic containment button-up.
Large flow blockage. LOCA1 stagnation feeder break. Loss of F/M cooling in transit.
FDC9 LOCAs with no fuel failure (ECIS successful); potential for significant economic impact.
LOCA2A, LOCA2B and LOCA3. LOCA1 with no D2O makeup.
1 End-states representing accident sequences with containment bypass include suffix "-OC" (Outside Containment)
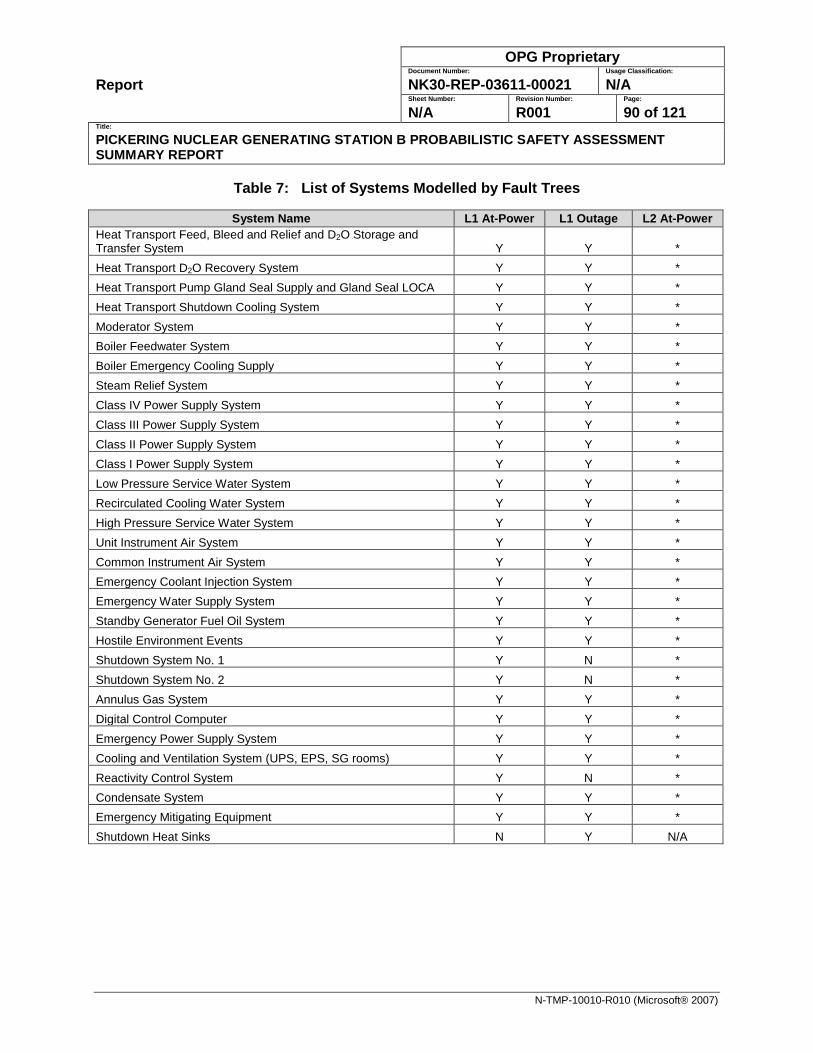
Report
OPG Proprietary Document Number: Usage Classification:
NK30-REP-03611-00021 N/A Sheet Number: Revision Number: Page:
N/A R001 90 of 121 Title:
PICKERING NUCLEAR GENERATING STATION B PROBABILISTIC SAFETY ASSESSMENT SUMMARY REPORT
N-TMP-10010-R010 (Microsoft® 2007)
Table 7: List of Systems Modelled by Fault Trees
System Name L1 At-Power L1 Outage L2 At-Power Heat Transport Feed, Bleed and Relief and D2O Storage and Transfer System Y Y * Heat Transport D2O Recovery System Y Y * Heat Transport Pump Gland Seal Supply and Gland Seal LOCA Y Y * Heat Transport Shutdown Cooling System Y Y * Moderator System Y Y * Boiler Feedwater System Y Y * Boiler Emergency Cooling Supply Y Y * Steam Relief System Y Y * Class IV Power Supply System Y Y * Class III Power Supply System Y Y * Class II Power Supply System Y Y * Class I Power Supply System Y Y * Low Pressure Service Water System Y Y * Recirculated Cooling Water System Y Y * High Pressure Service Water System Y Y * Unit Instrument Air System Y Y * Common Instrument Air System Y Y * Emergency Coolant Injection System Y Y * Emergency Water Supply System Y Y * Standby Generator Fuel Oil System Y Y * Hostile Environment Events Y Y * Shutdown System No. 1 Y N * Shutdown System No. 2 Y N * Annulus Gas System Y Y * Digital Control Computer Y Y * Emergency Power Supply System Y Y * Cooling and Ventilation System (UPS, EPS, SG rooms) Y Y * Reactivity Control System Y N * Condensate System Y Y * Emergency Mitigating Equipment Y Y * Shutdown Heat Sinks N Y N/A
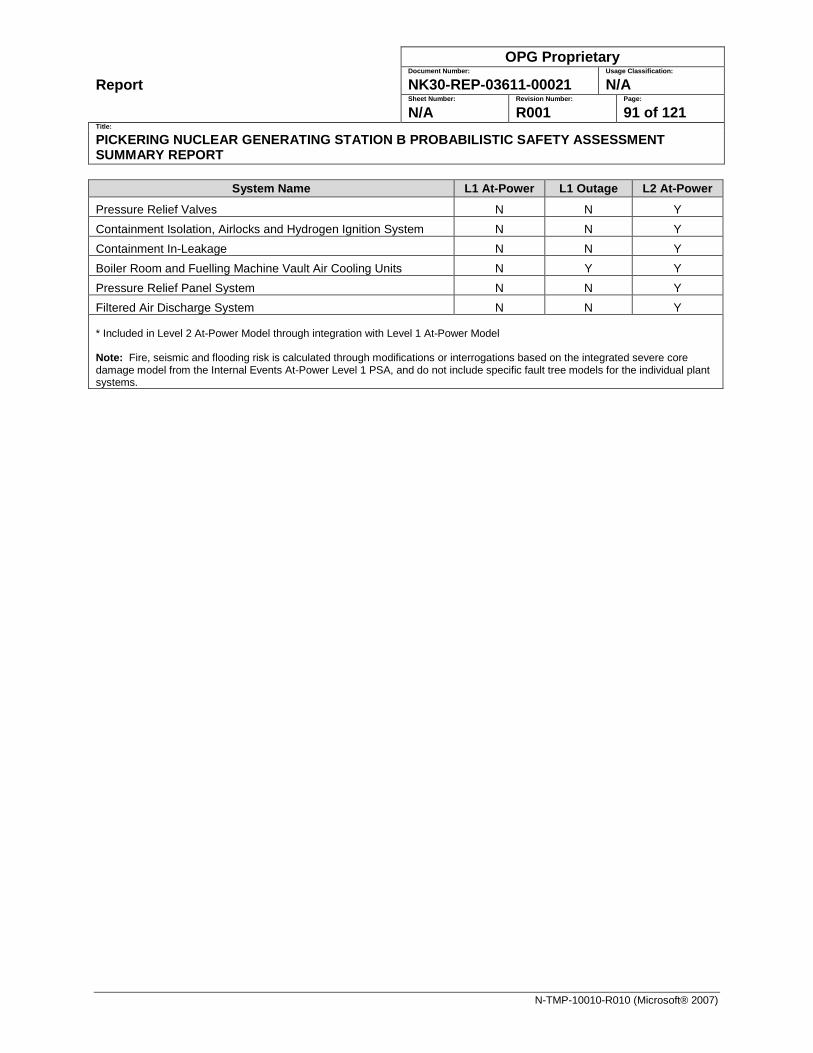
Report
OPG Proprietary Document Number: Usage Classification:
NK30-REP-03611-00021 N/A Sheet Number: Revision Number: Page:
N/A R001 91 of 121 Title:
PICKERING NUCLEAR GENERATING STATION B PROBABILISTIC SAFETY ASSESSMENT SUMMARY REPORT
N-TMP-10010-R010 (Microsoft® 2007)
System Name L1 At-Power L1 Outage L2 At-Power
Pressure Relief Valves N N Y Containment Isolation, Airlocks and Hydrogen Ignition System N N Y Containment In-Leakage N N Y Boiler Room and Fuelling Machine Vault Air Cooling Units N Y Y Pressure Relief Panel System N N Y Filtered Air Discharge System N N Y * Included in Level 2 At-Power Model through integration with Level 1 At-Power Model Note: Fire, seismic and flooding risk is calculated through modifications or interrogations based on the integrated severe core damage model from the Internal Events At-Power Level 1 PSA, and do not include specific fault tree models for the individual plant systems.
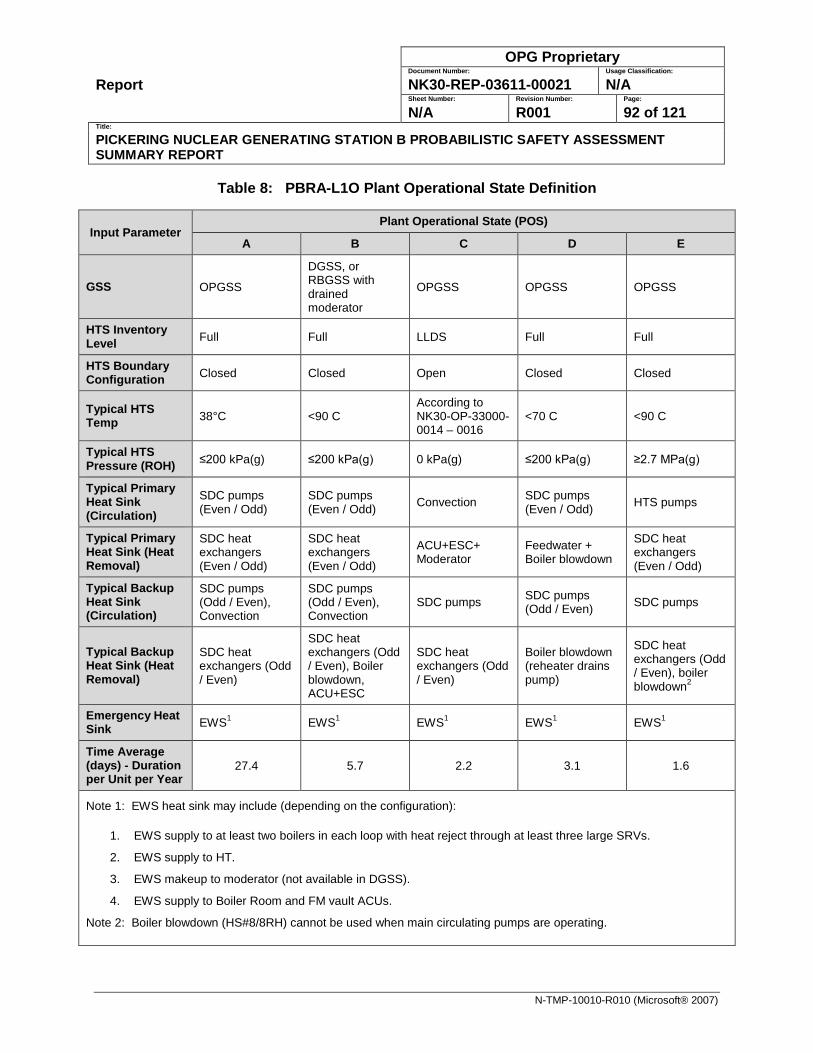
Report
OPG Proprietary Document Number: Usage Classification:
NK30-REP-03611-00021 N/A Sheet Number: Revision Number: Page:
N/A R001 92 of 121 Title:
PICKERING NUCLEAR GENERATING STATION B PROBABILISTIC SAFETY ASSESSMENT SUMMARY REPORT
N-TMP-10010-R010 (Microsoft® 2007)
Table 8: PBRA-L1O Plant Operational State Definition
Input Parameter Plant Operational State (POS)
A B C D E
GSS OPGSS DGSS, or RBGSS with drained moderator
OPGSS OPGSS OPGSS
HTS Inventory Level Full Full LLDS Full Full
HTS Boundary Configuration Closed Closed Open Closed Closed
Typical HTS Temp 38°C <90 C
According to NK30-OP-33000-0014 – 0016
<70 C <90 C
Typical HTS Pressure (ROH) ≤200 kPa(g) ≤200 kPa(g) 0 kPa(g) ≤200 kPa(g) ≥2.7 MPa(g)
Typical Primary Heat Sink (Circulation)
SDC pumps (Even / Odd)
SDC pumps (Even / Odd) Convection SDC pumps
(Even / Odd) HTS pumps
Typical Primary Heat Sink (Heat Removal)
SDC heat exchangers (Even / Odd)
SDC heat exchangers (Even / Odd)
ACU+ESC+ Moderator
Feedwater + Boiler blowdown
SDC heat exchangers (Even / Odd)
Typical Backup Heat Sink (Circulation)
SDC pumps (Odd / Even), Convection
SDC pumps (Odd / Even), Convection
SDC pumps SDC pumps (Odd / Even) SDC pumps
Typical Backup Heat Sink (Heat Removal)
SDC heat exchangers (Odd / Even)
SDC heat exchangers (Odd / Even), Boiler blowdown, ACU+ESC
SDC heat exchangers (Odd / Even)
Boiler blowdown (reheater drains pump)
SDC heat exchangers (Odd / Even), boiler blowdown2
Emergency Heat Sink EWS1 EWS1 EWS1 EWS1 EWS1
Time Average (days) - Duration per Unit per Year
27.4 5.7 2.2 3.1 1.6
Note 1: EWS heat sink may include (depending on the configuration):
1. EWS supply to at least two boilers in each loop with heat reject through at least three large SRVs.
2. EWS supply to HT.
3. EWS makeup to moderator (not available in DGSS).
4. EWS supply to Boiler Room and FM vault ACUs.
Note 2: Boiler blowdown (HS#8/8RH) cannot be used when main circulating pumps are operating.
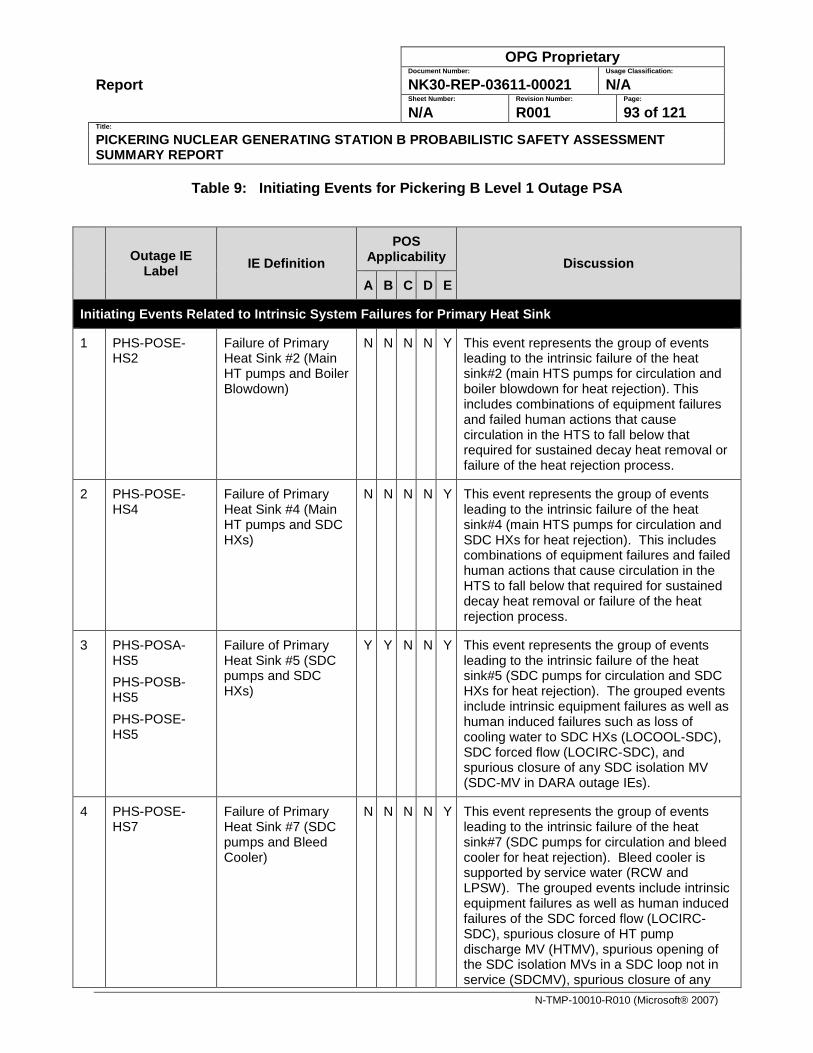
Report
OPG Proprietary Document Number: Usage Classification:
NK30-REP-03611-00021 N/A Sheet Number: Revision Number: Page:
N/A R001 93 of 121 Title:
PICKERING NUCLEAR GENERATING STATION B PROBABILISTIC SAFETY ASSESSMENT SUMMARY REPORT
N-TMP-10010-R010 (Microsoft® 2007)
Table 9: Initiating Events for Pickering B Level 1 Outage PSA
Outage IE Label IE Definition
POS Applicability Discussion A B C D E
Initiating Events Related to Intrinsic System Failures for Primary Heat Sink
1 PHS-POSE-HS2
Failure of Primary Heat Sink #2 (Main HT pumps and Boiler Blowdown)
N N N N Y This event represents the group of events leading to the intrinsic failure of the heat sink#2 (main HTS pumps for circulation and boiler blowdown for heat rejection). This includes combinations of equipment failures and failed human actions that cause circulation in the HTS to fall below that required for sustained decay heat removal or failure of the heat rejection process.
2 PHS-POSE-HS4
Failure of Primary Heat Sink #4 (Main HT pumps and SDC HXs)
N N N N Y This event represents the group of events leading to the intrinsic failure of the heat sink#4 (main HTS pumps for circulation and SDC HXs for heat rejection). This includes combinations of equipment failures and failed human actions that cause circulation in the HTS to fall below that required for sustained decay heat removal or failure of the heat rejection process.
3 PHS-POSA-HS5 PHS-POSB-HS5 PHS-POSE-HS5
Failure of Primary Heat Sink #5 (SDC pumps and SDC HXs)
Y Y N N Y This event represents the group of events leading to the intrinsic failure of the heat sink#5 (SDC pumps for circulation and SDC HXs for heat rejection). The grouped events include intrinsic equipment failures as well as human induced failures such as loss of cooling water to SDC HXs (LOCOOL-SDC), SDC forced flow (LOCIRC-SDC), and spurious closure of any SDC isolation MV (SDC-MV in DARA outage IEs).
4 PHS-POSE-HS7
Failure of Primary Heat Sink #7 (SDC pumps and Bleed Cooler)
N N N N Y This event represents the group of events leading to the intrinsic failure of the heat sink#7 (SDC pumps for circulation and bleed cooler for heat rejection). Bleed cooler is supported by service water (RCW and LPSW). The grouped events include intrinsic equipment failures as well as human induced failures of the SDC forced flow (LOCIRC-SDC), spurious closure of HT pump discharge MV (HTMV), spurious opening of the SDC isolation MVs in a SDC loop not in service (SDCMV), spurious closure of any
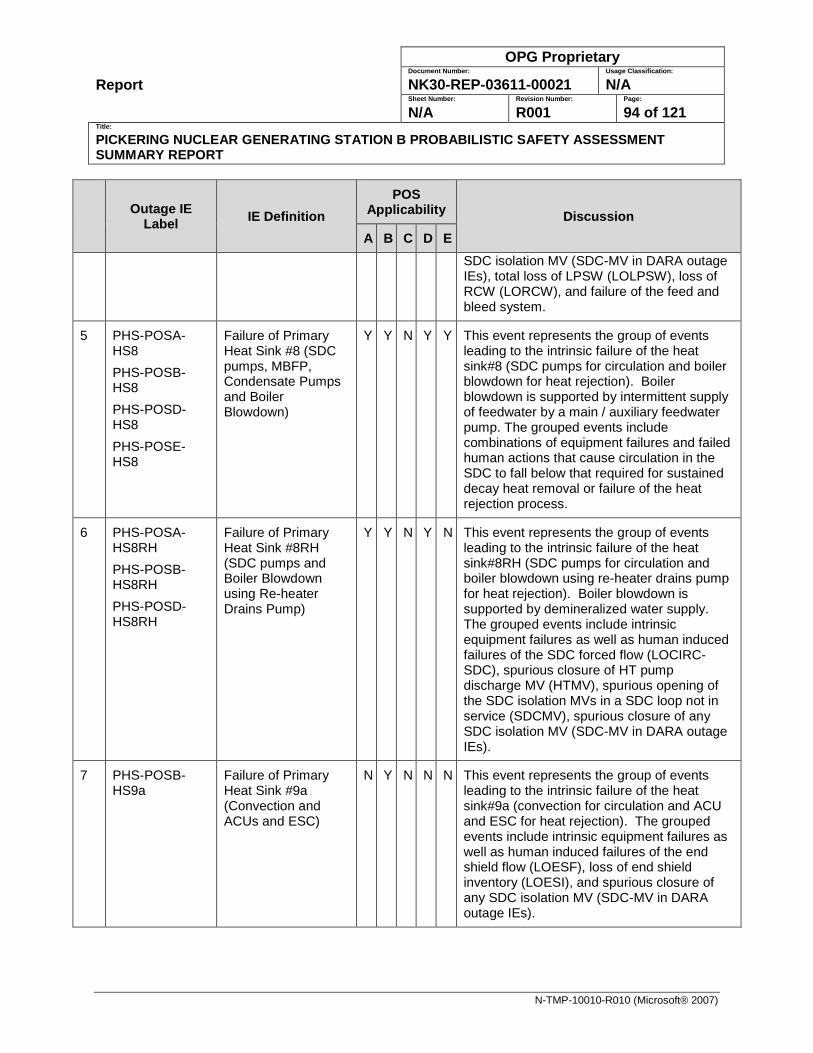
Report
OPG Proprietary Document Number: Usage Classification:
NK30-REP-03611-00021 N/A Sheet Number: Revision Number: Page:
N/A R001 94 of 121 Title:
PICKERING NUCLEAR GENERATING STATION B PROBABILISTIC SAFETY ASSESSMENT SUMMARY REPORT
N-TMP-10010-R010 (Microsoft® 2007)
Outage IE
Label IE Definition POS
Applicability Discussion A B C D E
SDC isolation MV (SDC-MV in DARA outage IEs), total loss of LPSW (LOLPSW), loss of RCW (LORCW), and failure of the feed and bleed system.
5 PHS-POSA-HS8 PHS-POSB-HS8 PHS-POSD-HS8 PHS-POSE-HS8
Failure of Primary Heat Sink #8 (SDC pumps, MBFP, Condensate Pumps and Boiler Blowdown)
Y Y N Y Y This event represents the group of events leading to the intrinsic failure of the heat sink#8 (SDC pumps for circulation and boiler blowdown for heat rejection). Boiler blowdown is supported by intermittent supply of feedwater by a main / auxiliary feedwater pump. The grouped events include combinations of equipment failures and failed human actions that cause circulation in the SDC to fall below that required for sustained decay heat removal or failure of the heat rejection process.
6 PHS-POSA-HS8RH PHS-POSB-HS8RH PHS-POSD-HS8RH
Failure of Primary Heat Sink #8RH (SDC pumps and Boiler Blowdown using Re-heater Drains Pump)
Y Y N Y N This event represents the group of events leading to the intrinsic failure of the heat sink#8RH (SDC pumps for circulation and boiler blowdown using re-heater drains pump for heat rejection). Boiler blowdown is supported by demineralized water supply. The grouped events include intrinsic equipment failures as well as human induced failures of the SDC forced flow (LOCIRC-SDC), spurious closure of HT pump discharge MV (HTMV), spurious opening of the SDC isolation MVs in a SDC loop not in service (SDCMV), spurious closure of any SDC isolation MV (SDC-MV in DARA outage IEs).
7 PHS-POSB-HS9a
Failure of Primary Heat Sink #9a (Convection and ACUs and ESC)
N Y N N N This event represents the group of events leading to the intrinsic failure of the heat sink#9a (convection for circulation and ACU and ESC for heat rejection). The grouped events include intrinsic equipment failures as well as human induced failures of the end shield flow (LOESF), loss of end shield inventory (LOESI), and spurious closure of any SDC isolation MV (SDC-MV in DARA outage IEs).
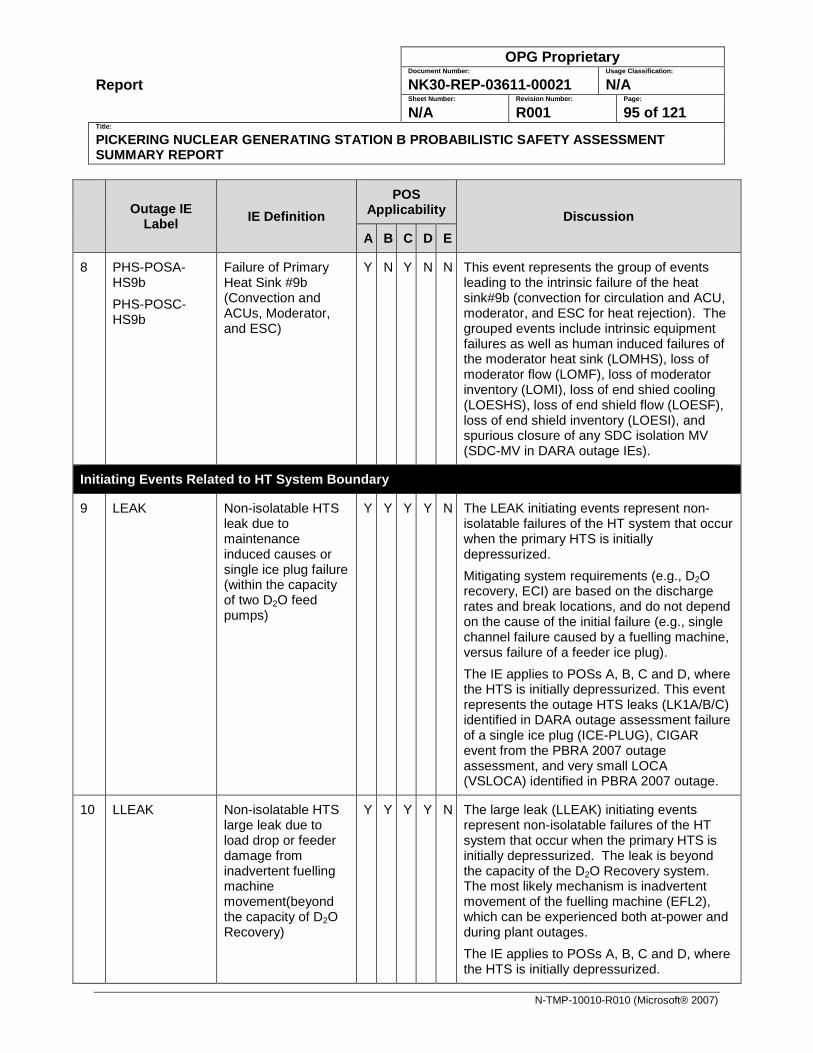
Report
OPG Proprietary Document Number: Usage Classification:
NK30-REP-03611-00021 N/A Sheet Number: Revision Number: Page:
N/A R001 95 of 121 Title:
PICKERING NUCLEAR GENERATING STATION B PROBABILISTIC SAFETY ASSESSMENT SUMMARY REPORT
N-TMP-10010-R010 (Microsoft® 2007)
Outage IE
Label IE Definition POS
Applicability Discussion A B C D E
8 PHS-POSA-HS9b PHS-POSC-HS9b
Failure of Primary Heat Sink #9b (Convection and ACUs, Moderator, and ESC)
Y N Y N N This event represents the group of events leading to the intrinsic failure of the heat sink#9b (convection for circulation and ACU, moderator, and ESC for heat rejection). The grouped events include intrinsic equipment failures as well as human induced failures of the moderator heat sink (LOMHS), loss of moderator flow (LOMF), loss of moderator inventory (LOMI), loss of end shied cooling (LOESHS), loss of end shield flow (LOESF), loss of end shield inventory (LOESI), and spurious closure of any SDC isolation MV (SDC-MV in DARA outage IEs).
Initiating Events Related to HT System Boundary
9 LEAK Non-isolatable HTS leak due to maintenance induced causes or single ice plug failure (within the capacity of two D2O feed pumps)
Y Y Y Y N The LEAK initiating events represent non-isolatable failures of the HT system that occur when the primary HTS is initially depressurized. Mitigating system requirements (e.g., D2O recovery, ECI) are based on the discharge rates and break locations, and do not depend on the cause of the initial failure (e.g., single channel failure caused by a fuelling machine, versus failure of a feeder ice plug). The IE applies to POSs A, B, C and D, where the HTS is initially depressurized. This event represents the outage HTS leaks (LK1A/B/C) identified in DARA outage assessment failure of a single ice plug (ICE-PLUG), CIGAR event from the PBRA 2007 outage assessment, and very small LOCA (VSLOCA) identified in PBRA 2007 outage.
10 LLEAK Non-isolatable HTS large leak due to load drop or feeder damage from inadvertent fuelling machine movement(beyond the capacity of D2O Recovery)
Y Y Y Y N The large leak (LLEAK) initiating events represent non-isolatable failures of the HT system that occur when the primary HTS is initially depressurized. The leak is beyond the capacity of the D2O Recovery system. The most likely mechanism is inadvertent movement of the fuelling machine (EFL2), which can be experienced both at-power and during plant outages. The IE applies to POSs A, B, C and D, where the HTS is initially depressurized.
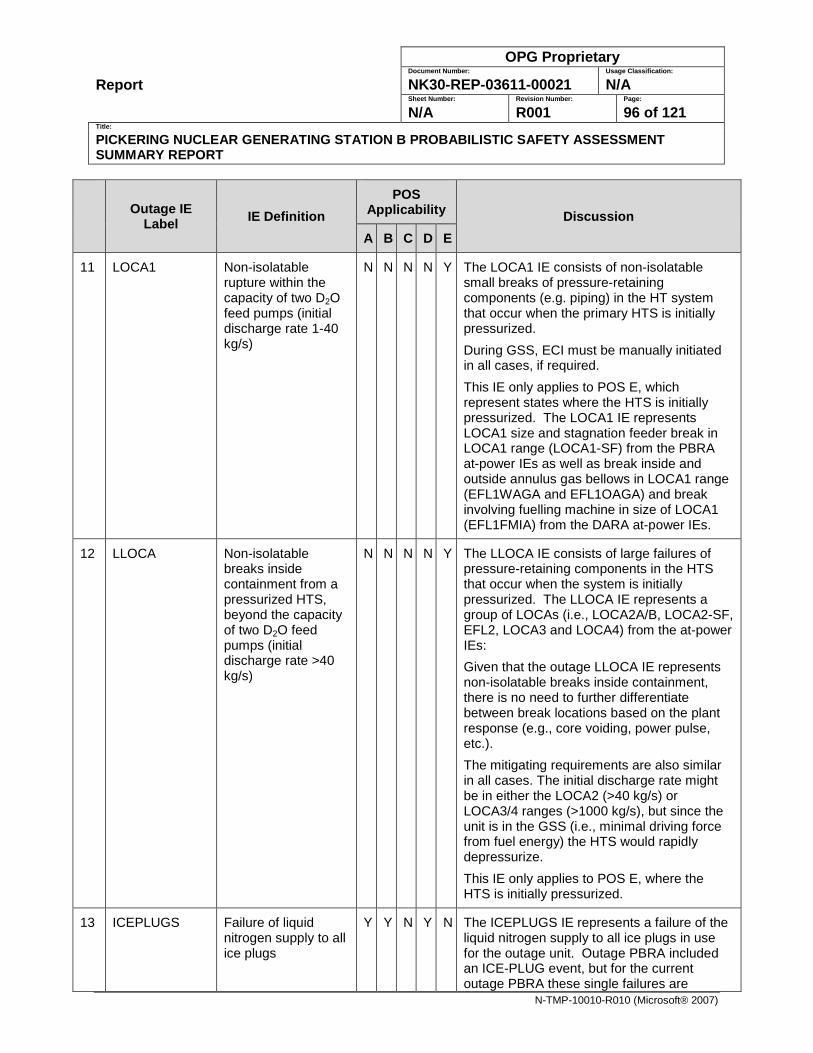
Report
OPG Proprietary Document Number: Usage Classification:
NK30-REP-03611-00021 N/A Sheet Number: Revision Number: Page:
N/A R001 96 of 121 Title:
PICKERING NUCLEAR GENERATING STATION B PROBABILISTIC SAFETY ASSESSMENT SUMMARY REPORT
N-TMP-10010-R010 (Microsoft® 2007)
Outage IE
Label IE Definition POS
Applicability Discussion A B C D E
11 LOCA1 Non-isolatable rupture within the capacity of two D2O feed pumps (initial discharge rate 1-40 kg/s)
N N N N Y The LOCA1 IE consists of non-isolatable small breaks of pressure-retaining components (e.g. piping) in the HT system that occur when the primary HTS is initially pressurized. During GSS, ECI must be manually initiated in all cases, if required. This IE only applies to POS E, which represent states where the HTS is initially pressurized. The LOCA1 IE represents LOCA1 size and stagnation feeder break in LOCA1 range (LOCA1-SF) from the PBRA at-power IEs as well as break inside and outside annulus gas bellows in LOCA1 range (EFL1WAGA and EFL1OAGA) and break involving fuelling machine in size of LOCA1 (EFL1FMIA) from the DARA at-power IEs.
12 LLOCA Non-isolatable breaks inside containment from a pressurized HTS, beyond the capacity of two D2O feed pumps (initial discharge rate >40 kg/s)
N N N N Y The LLOCA IE consists of large failures of pressure-retaining components in the HTS that occur when the system is initially pressurized. The LLOCA IE represents a group of LOCAs (i.e., LOCA2A/B, LOCA2-SF, EFL2, LOCA3 and LOCA4) from the at-power IEs: Given that the outage LLOCA IE represents non-isolatable breaks inside containment, there is no need to further differentiate between break locations based on the plant response (e.g., core voiding, power pulse, etc.). The mitigating requirements are also similar in all cases. The initial discharge rate might be in either the LOCA2 (>40 kg/s) or LOCA3/4 ranges (>1000 kg/s), but since the unit is in the GSS (i.e., minimal driving force from fuel energy) the HTS would rapidly depressurize. This IE only applies to POS E, where the HTS is initially pressurized.
13 ICEPLUGS Failure of liquid nitrogen supply to all ice plugs
Y Y N Y N The ICEPLUGS IE represents a failure of the liquid nitrogen supply to all ice plugs in use for the outage unit. Outage PBRA included an ICE-PLUG event, but for the current outage PBRA these single failures are
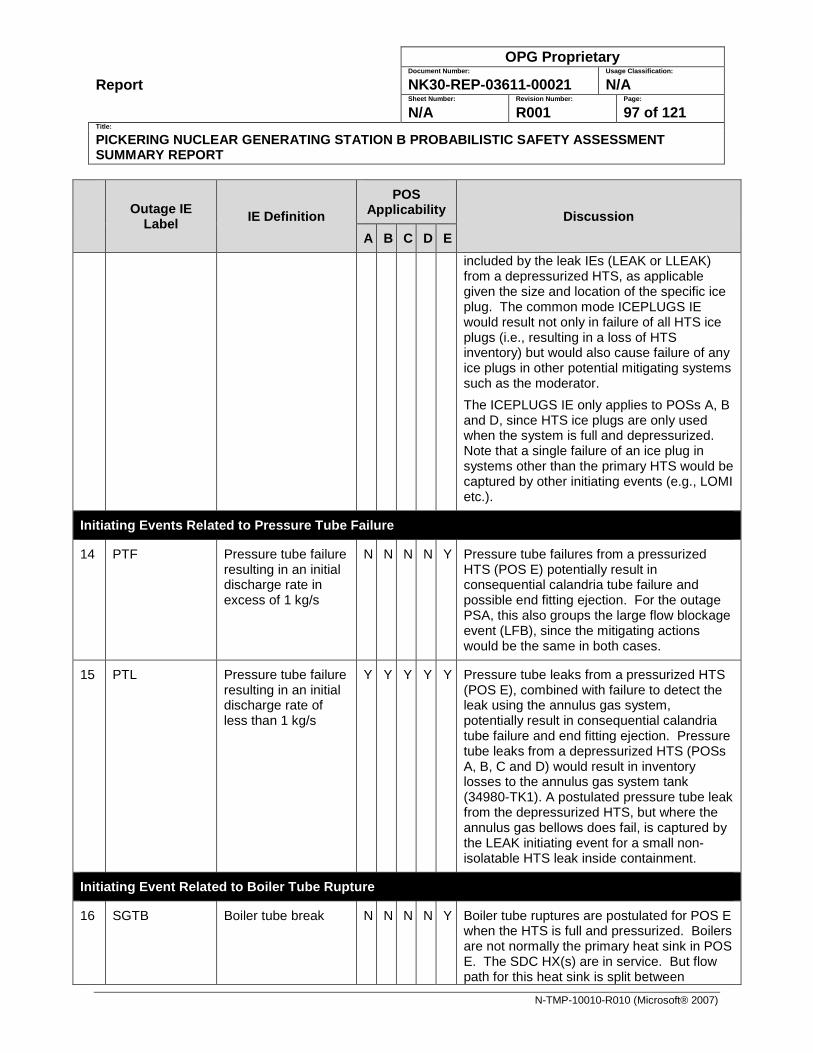
Report
OPG Proprietary Document Number: Usage Classification:
NK30-REP-03611-00021 N/A Sheet Number: Revision Number: Page:
N/A R001 97 of 121 Title:
PICKERING NUCLEAR GENERATING STATION B PROBABILISTIC SAFETY ASSESSMENT SUMMARY REPORT
N-TMP-10010-R010 (Microsoft® 2007)
Outage IE
Label IE Definition POS
Applicability Discussion A B C D E
included by the leak IEs (LEAK or LLEAK) from a depressurized HTS, as applicable given the size and location of the specific ice plug. The common mode ICEPLUGS IE would result not only in failure of all HTS ice plugs (i.e., resulting in a loss of HTS inventory) but would also cause failure of any ice plugs in other potential mitigating systems such as the moderator. The ICEPLUGS IE only applies to POSs A, B and D, since HTS ice plugs are only used when the system is full and depressurized. Note that a single failure of an ice plug in systems other than the primary HTS would be captured by other initiating events (e.g., LOMI etc.).
Initiating Events Related to Pressure Tube Failure
14 PTF Pressure tube failure resulting in an initial discharge rate in excess of 1 kg/s
N N N N Y Pressure tube failures from a pressurized HTS (POS E) potentially result in consequential calandria tube failure and possible end fitting ejection. For the outage PSA, this also groups the large flow blockage event (LFB), since the mitigating actions would be the same in both cases.
15 PTL Pressure tube failure resulting in an initial discharge rate of less than 1 kg/s
Y Y Y Y Y Pressure tube leaks from a pressurized HTS (POS E), combined with failure to detect the leak using the annulus gas system, potentially result in consequential calandria tube failure and end fitting ejection. Pressure tube leaks from a depressurized HTS (POSs A, B, C and D) would result in inventory losses to the annulus gas system tank (34980-TK1). A postulated pressure tube leak from the depressurized HTS, but where the annulus gas bellows does fail, is captured by the LEAK initiating event for a small non-isolatable HTS leak inside containment.
Initiating Event Related to Boiler Tube Rupture
16 SGTB Boiler tube break N N N N Y Boiler tube ruptures are postulated for POS E when the HTS is full and pressurized. Boilers are not normally the primary heat sink in POS E. The SDC HX(s) are in service. But flow path for this heat sink is split between
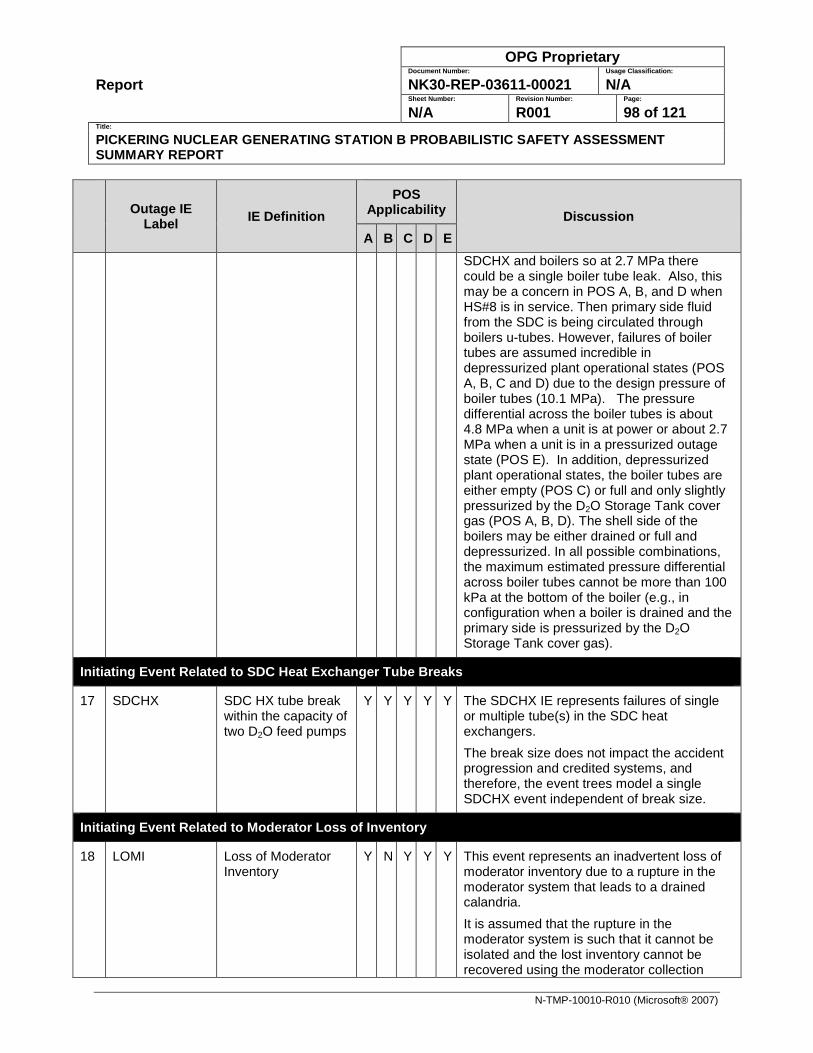
Report
OPG Proprietary Document Number: Usage Classification:
NK30-REP-03611-00021 N/A Sheet Number: Revision Number: Page:
N/A R001 98 of 121 Title:
PICKERING NUCLEAR GENERATING STATION B PROBABILISTIC SAFETY ASSESSMENT SUMMARY REPORT
N-TMP-10010-R010 (Microsoft® 2007)
Outage IE
Label IE Definition POS
Applicability Discussion A B C D E
SDCHX and boilers so at 2.7 MPa there could be a single boiler tube leak. Also, this may be a concern in POS A, B, and D when HS#8 is in service. Then primary side fluid from the SDC is being circulated through boilers u-tubes. However, failures of boiler tubes are assumed incredible in depressurized plant operational states (POS A, B, C and D) due to the design pressure of boiler tubes (10.1 MPa). The pressure differential across the boiler tubes is about 4.8 MPa when a unit is at power or about 2.7 MPa when a unit is in a pressurized outage state (POS E). In addition, depressurized plant operational states, the boiler tubes are either empty (POS C) or full and only slightly pressurized by the D2O Storage Tank cover gas (POS A, B, D). The shell side of the boilers may be either drained or full and depressurized. In all possible combinations, the maximum estimated pressure differential across boiler tubes cannot be more than 100 kPa at the bottom of the boiler (e.g., in configuration when a boiler is drained and the primary side is pressurized by the D2O Storage Tank cover gas).
Initiating Event Related to SDC Heat Exchanger Tube Breaks
17 SDCHX SDC HX tube break within the capacity of two D2O feed pumps
Y Y Y Y Y The SDCHX IE represents failures of single or multiple tube(s) in the SDC heat exchangers. The break size does not impact the accident progression and credited systems, and therefore, the event trees model a single SDCHX event independent of break size.
Initiating Event Related to Moderator Loss of Inventory
18 LOMI Loss of Moderator Inventory
Y N Y Y Y This event represents an inadvertent loss of moderator inventory due to a rupture in the moderator system that leads to a drained calandria. It is assumed that the rupture in the moderator system is such that it cannot be isolated and the lost inventory cannot be recovered using the moderator collection
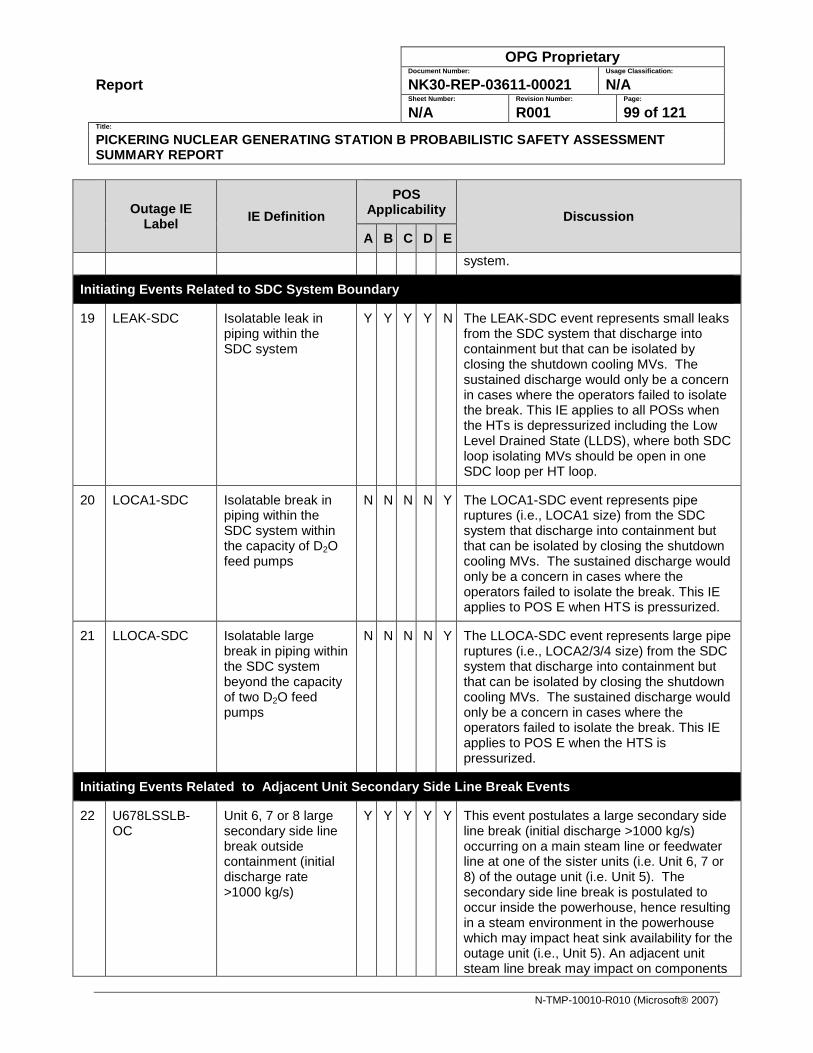
Report
OPG Proprietary Document Number: Usage Classification:
NK30-REP-03611-00021 N/A Sheet Number: Revision Number: Page:
N/A R001 99 of 121 Title:
PICKERING NUCLEAR GENERATING STATION B PROBABILISTIC SAFETY ASSESSMENT SUMMARY REPORT
N-TMP-10010-R010 (Microsoft® 2007)
Outage IE
Label IE Definition POS
Applicability Discussion A B C D E
system.
Initiating Events Related to SDC System Boundary
19 LEAK-SDC Isolatable leak in piping within the SDC system
Y Y Y Y N The LEAK-SDC event represents small leaks from the SDC system that discharge into containment but that can be isolated by closing the shutdown cooling MVs. The sustained discharge would only be a concern in cases where the operators failed to isolate the break. This IE applies to all POSs when the HTs is depressurized including the Low Level Drained State (LLDS), where both SDC loop isolating MVs should be open in one SDC loop per HT loop.
20 LOCA1-SDC Isolatable break in piping within the SDC system within the capacity of D2O feed pumps
N N N N Y The LOCA1-SDC event represents pipe ruptures (i.e., LOCA1 size) from the SDC system that discharge into containment but that can be isolated by closing the shutdown cooling MVs. The sustained discharge would only be a concern in cases where the operators failed to isolate the break. This IE applies to POS E when HTS is pressurized.
21 LLOCA-SDC Isolatable large break in piping within the SDC system beyond the capacity of two D2O feed pumps
N N N N Y The LLOCA-SDC event represents large pipe ruptures (i.e., LOCA2/3/4 size) from the SDC system that discharge into containment but that can be isolated by closing the shutdown cooling MVs. The sustained discharge would only be a concern in cases where the operators failed to isolate the break. This IE applies to POS E when the HTS is pressurized.
Initiating Events Related to Adjacent Unit Secondary Side Line Break Events
22 U678LSSLB-OC
Unit 6, 7 or 8 large secondary side line break outside containment (initial discharge rate >1000 kg/s)
Y Y Y Y Y This event postulates a large secondary side line break (initial discharge >1000 kg/s) occurring on a main steam line or feedwater line at one of the sister units (i.e. Unit 6, 7 or 8) of the outage unit (i.e. Unit 5). The secondary side line break is postulated to occur inside the powerhouse, hence resulting in a steam environment in the powerhouse which may impact heat sink availability for the outage unit (i.e., Unit 5). An adjacent unit steam line break may impact on components
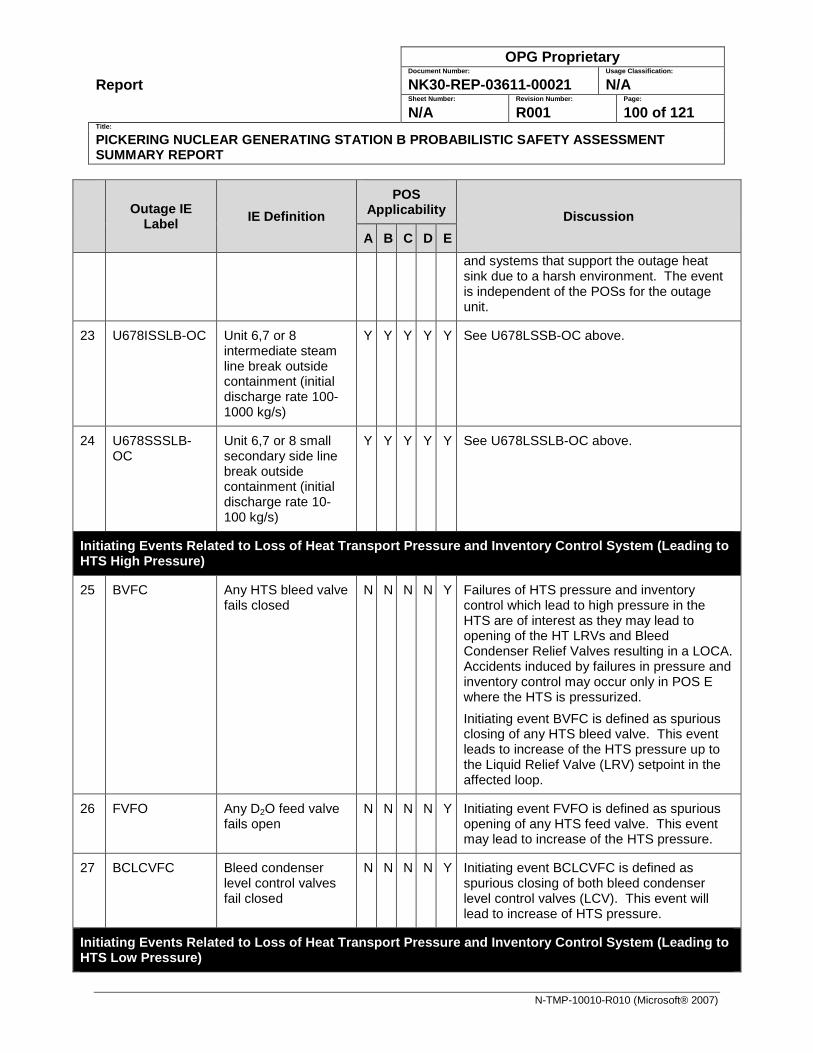
Report
OPG Proprietary Document Number: Usage Classification:
NK30-REP-03611-00021 N/A Sheet Number: Revision Number: Page:
N/A R001 100 of 121 Title:
PICKERING NUCLEAR GENERATING STATION B PROBABILISTIC SAFETY ASSESSMENT SUMMARY REPORT
N-TMP-10010-R010 (Microsoft® 2007)
Outage IE
Label IE Definition POS
Applicability Discussion A B C D E
and systems that support the outage heat sink due to a harsh environment. The event is independent of the POSs for the outage unit.
23 U678ISSLB-OC Unit 6,7 or 8 intermediate steam line break outside containment (initial discharge rate 100-1000 kg/s)
Y Y Y Y Y See U678LSSB-OC above.
24 U678SSSLB-OC
Unit 6,7 or 8 small secondary side line break outside containment (initial discharge rate 10-100 kg/s)
Y Y Y Y Y See U678LSSLB-OC above.
Initiating Events Related to Loss of Heat Transport Pressure and Inventory Control System (Leading to HTS High Pressure)
25 BVFC Any HTS bleed valve fails closed
N N N N Y Failures of HTS pressure and inventory control which lead to high pressure in the HTS are of interest as they may lead to opening of the HT LRVs and Bleed Condenser Relief Valves resulting in a LOCA. Accidents induced by failures in pressure and inventory control may occur only in POS E where the HTS is pressurized. Initiating event BVFC is defined as spurious closing of any HTS bleed valve. This event leads to increase of the HTS pressure up to the Liquid Relief Valve (LRV) setpoint in the affected loop.
26 FVFO Any D2O feed valve fails open
N N N N Y Initiating event FVFO is defined as spurious opening of any HTS feed valve. This event may lead to increase of the HTS pressure.
27 BCLCVFC Bleed condenser level control valves fail closed
N N N N Y Initiating event BCLCVFC is defined as spurious closing of both bleed condenser level control valves (LCV). This event will lead to increase of HTS pressure.
Initiating Events Related to Loss of Heat Transport Pressure and Inventory Control System (Leading to HTS Low Pressure)
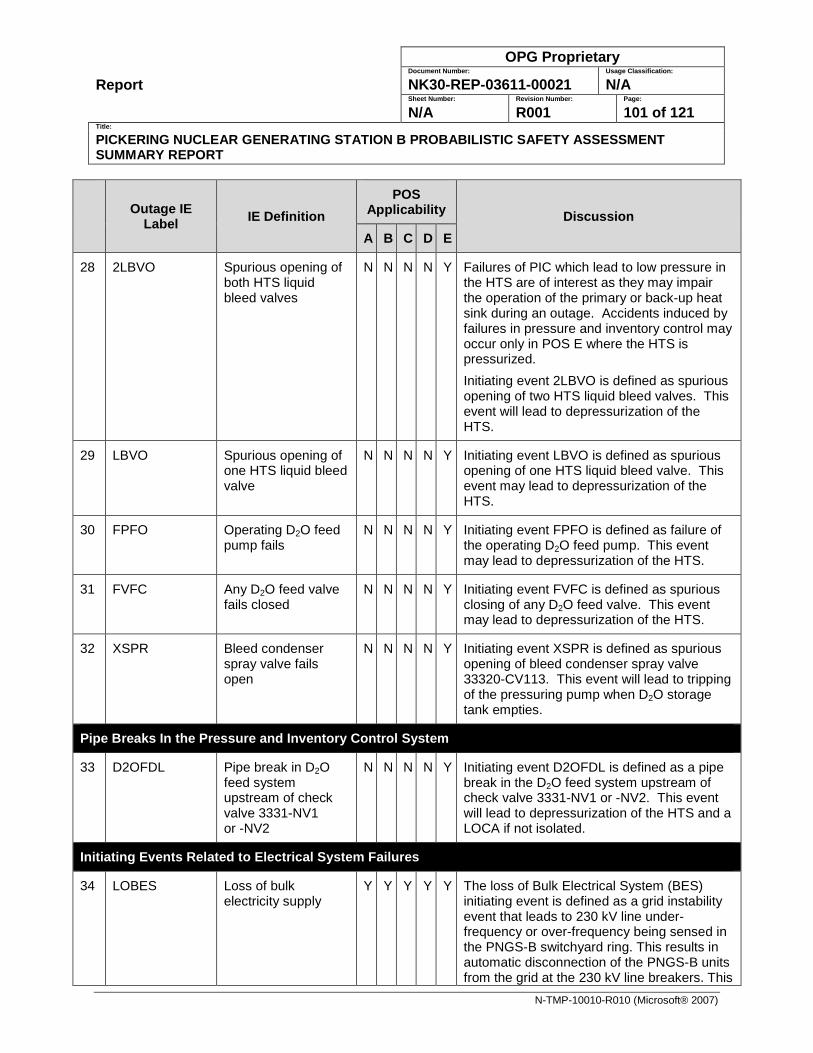
Report
OPG Proprietary Document Number: Usage Classification:
NK30-REP-03611-00021 N/A Sheet Number: Revision Number: Page:
N/A R001 101 of 121 Title:
PICKERING NUCLEAR GENERATING STATION B PROBABILISTIC SAFETY ASSESSMENT SUMMARY REPORT
N-TMP-10010-R010 (Microsoft® 2007)
Outage IE
Label IE Definition POS
Applicability Discussion A B C D E
28 2LBVO Spurious opening of both HTS liquid bleed valves
N N N N Y Failures of PIC which lead to low pressure in the HTS are of interest as they may impair the operation of the primary or back-up heat sink during an outage. Accidents induced by failures in pressure and inventory control may occur only in POS E where the HTS is pressurized. Initiating event 2LBVO is defined as spurious opening of two HTS liquid bleed valves. This event will lead to depressurization of the HTS.
29 LBVO Spurious opening of one HTS liquid bleed valve
N N N N Y Initiating event LBVO is defined as spurious opening of one HTS liquid bleed valve. This event may lead to depressurization of the HTS.
30 FPFO Operating D2O feed pump fails
N N N N Y Initiating event FPFO is defined as failure of the operating D2O feed pump. This event may lead to depressurization of the HTS.
31 FVFC Any D2O feed valve fails closed
N N N N Y Initiating event FVFC is defined as spurious closing of any D2O feed valve. This event may lead to depressurization of the HTS.
32 XSPR Bleed condenser spray valve fails open
N N N N Y Initiating event XSPR is defined as spurious opening of bleed condenser spray valve 33320-CV113. This event will lead to tripping of the pressuring pump when D2O storage tank empties.
Pipe Breaks In the Pressure and Inventory Control System
33 D2OFDL Pipe break in D2O feed system upstream of check valve 3331-NV1 or -NV2
N N N N Y Initiating event D2OFDL is defined as a pipe break in the D2O feed system upstream of check valve 3331-NV1 or -NV2. This event will lead to depressurization of the HTS and a LOCA if not isolated.
Initiating Events Related to Electrical System Failures
34 LOBES Loss of bulk electricity supply
Y Y Y Y Y The loss of Bulk Electrical System (BES) initiating event is defined as a grid instability event that leads to 230 kV line under-frequency or over-frequency being sensed in the PNGS-B switchyard ring. This results in automatic disconnection of the PNGS-B units from the grid at the 230 kV line breakers. This
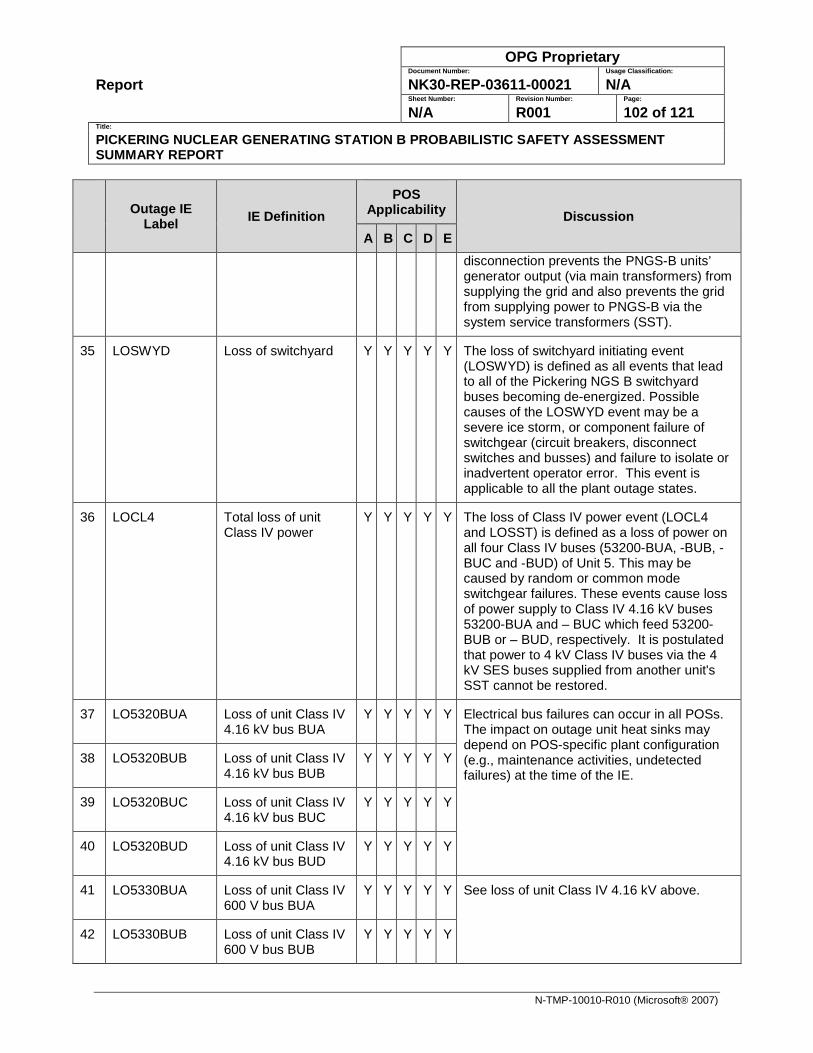
Report
OPG Proprietary Document Number: Usage Classification:
NK30-REP-03611-00021 N/A Sheet Number: Revision Number: Page:
N/A R001 102 of 121 Title:
PICKERING NUCLEAR GENERATING STATION B PROBABILISTIC SAFETY ASSESSMENT SUMMARY REPORT
N-TMP-10010-R010 (Microsoft® 2007)
Outage IE
Label IE Definition POS
Applicability Discussion A B C D E
disconnection prevents the PNGS-B units’ generator output (via main transformers) from supplying the grid and also prevents the grid from supplying power to PNGS-B via the system service transformers (SST).
35 LOSWYD Loss of switchyard Y Y Y Y Y The loss of switchyard initiating event (LOSWYD) is defined as all events that lead to all of the Pickering NGS B switchyard buses becoming de-energized. Possible causes of the LOSWYD event may be a severe ice storm, or component failure of switchgear (circuit breakers, disconnect switches and busses) and failure to isolate or inadvertent operator error. This event is applicable to all the plant outage states.
36 LOCL4 Total loss of unit Class IV power
Y Y Y Y Y The loss of Class IV power event (LOCL4 and LOSST) is defined as a loss of power on all four Class IV buses (53200-BUA, -BUB, -BUC and -BUD) of Unit 5. This may be caused by random or common mode switchgear failures. These events cause loss of power supply to Class IV 4.16 kV buses 53200-BUA and – BUC which feed 53200-BUB or – BUD, respectively. It is postulated that power to 4 kV Class IV buses via the 4 kV SES buses supplied from another unit's SST cannot be restored.
37 LO5320BUA Loss of unit Class IV 4.16 kV bus BUA
Y Y Y Y Y Electrical bus failures can occur in all POSs. The impact on outage unit heat sinks may depend on POS-specific plant configuration (e.g., maintenance activities, undetected failures) at the time of the IE.
38 LO5320BUB Loss of unit Class IV 4.16 kV bus BUB
Y Y Y Y Y
39 LO5320BUC Loss of unit Class IV 4.16 kV bus BUC
Y Y Y Y Y
40 LO5320BUD Loss of unit Class IV 4.16 kV bus BUD
Y Y Y Y Y
41 LO5330BUA Loss of unit Class IV 600 V bus BUA
Y Y Y Y Y See loss of unit Class IV 4.16 kV above.
42 LO5330BUB Loss of unit Class IV 600 V bus BUB
Y Y Y Y Y
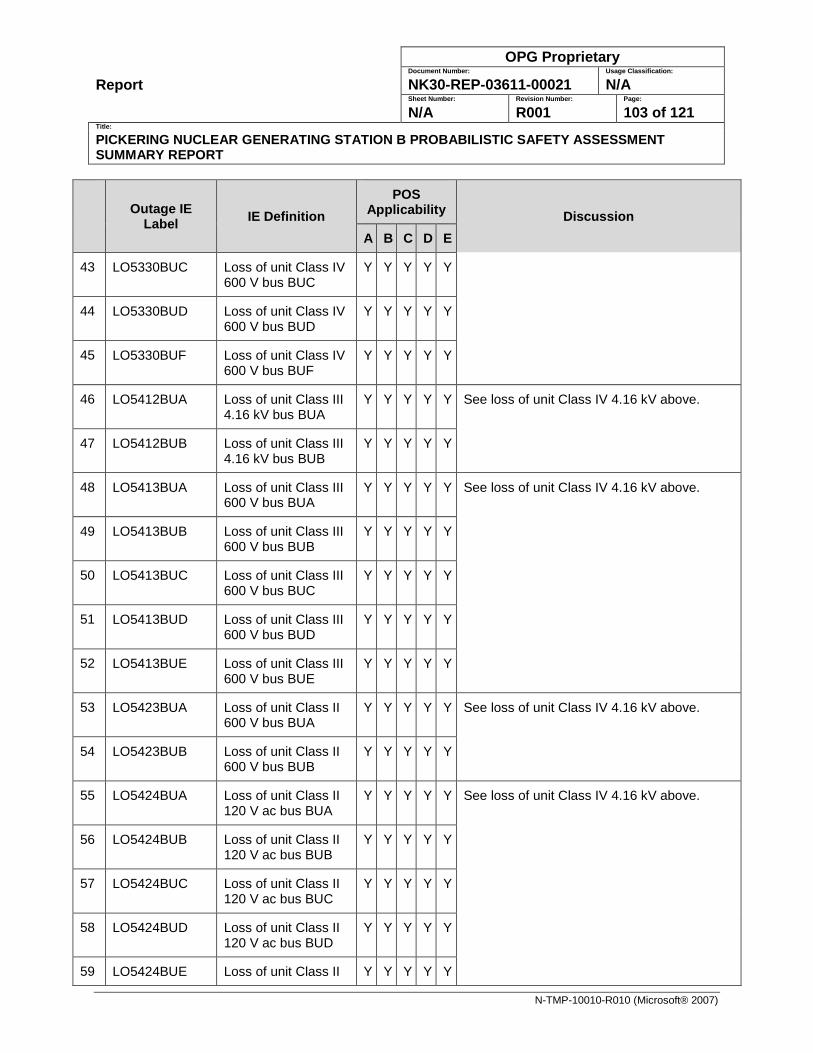
Report
OPG Proprietary Document Number: Usage Classification:
NK30-REP-03611-00021 N/A Sheet Number: Revision Number: Page:
N/A R001 103 of 121 Title:
PICKERING NUCLEAR GENERATING STATION B PROBABILISTIC SAFETY ASSESSMENT SUMMARY REPORT
N-TMP-10010-R010 (Microsoft® 2007)
Outage IE
Label IE Definition POS
Applicability Discussion A B C D E
43 LO5330BUC Loss of unit Class IV 600 V bus BUC
Y Y Y Y Y
44 LO5330BUD Loss of unit Class IV 600 V bus BUD
Y Y Y Y Y
45 LO5330BUF Loss of unit Class IV 600 V bus BUF
Y Y Y Y Y
46 LO5412BUA Loss of unit Class III 4.16 kV bus BUA
Y Y Y Y Y See loss of unit Class IV 4.16 kV above.
47 LO5412BUB Loss of unit Class III 4.16 kV bus BUB
Y Y Y Y Y
48 LO5413BUA Loss of unit Class III 600 V bus BUA
Y Y Y Y Y See loss of unit Class IV 4.16 kV above.
49 LO5413BUB Loss of unit Class III 600 V bus BUB
Y Y Y Y Y
50 LO5413BUC Loss of unit Class III 600 V bus BUC
Y Y Y Y Y
51 LO5413BUD Loss of unit Class III 600 V bus BUD
Y Y Y Y Y
52 LO5413BUE Loss of unit Class III 600 V bus BUE
Y Y Y Y Y
53 LO5423BUA Loss of unit Class II 600 V bus BUA
Y Y Y Y Y See loss of unit Class IV 4.16 kV above.
54 LO5423BUB Loss of unit Class II 600 V bus BUB
Y Y Y Y Y
55 LO5424BUA Loss of unit Class II 120 V ac bus BUA
Y Y Y Y Y See loss of unit Class IV 4.16 kV above.
56 LO5424BUB Loss of unit Class II 120 V ac bus BUB
Y Y Y Y Y
57 LO5424BUC Loss of unit Class II 120 V ac bus BUC
Y Y Y Y Y
58 LO5424BUD Loss of unit Class II 120 V ac bus BUD
Y Y Y Y Y
59 LO5424BUE Loss of unit Class II Y Y Y Y Y
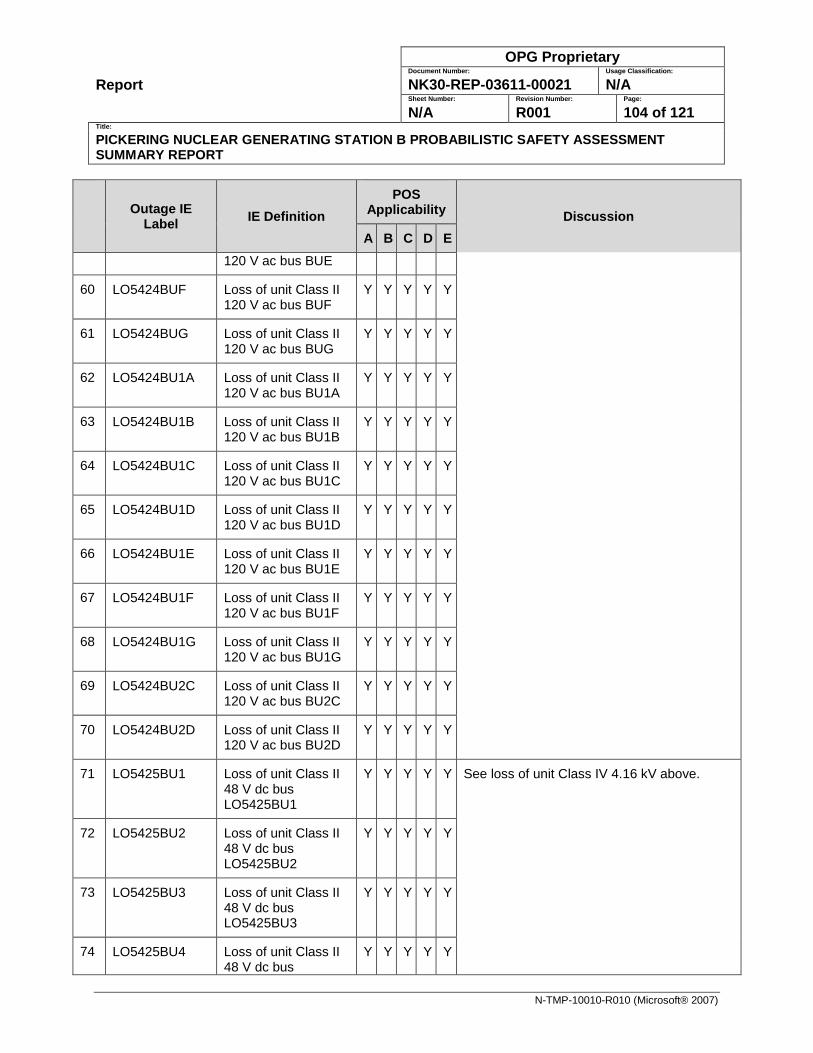
Report
OPG Proprietary Document Number: Usage Classification:
NK30-REP-03611-00021 N/A Sheet Number: Revision Number: Page:
N/A R001 104 of 121 Title:
PICKERING NUCLEAR GENERATING STATION B PROBABILISTIC SAFETY ASSESSMENT SUMMARY REPORT
N-TMP-10010-R010 (Microsoft® 2007)
Outage IE
Label IE Definition POS
Applicability Discussion A B C D E
120 V ac bus BUE
60 LO5424BUF Loss of unit Class II 120 V ac bus BUF
Y Y Y Y Y
61 LO5424BUG Loss of unit Class II 120 V ac bus BUG
Y Y Y Y Y
62 LO5424BU1A Loss of unit Class II 120 V ac bus BU1A
Y Y Y Y Y
63 LO5424BU1B Loss of unit Class II 120 V ac bus BU1B
Y Y Y Y Y
64 LO5424BU1C Loss of unit Class II 120 V ac bus BU1C
Y Y Y Y Y
65 LO5424BU1D Loss of unit Class II 120 V ac bus BU1D
Y Y Y Y Y
66 LO5424BU1E Loss of unit Class II 120 V ac bus BU1E
Y Y Y Y Y
67 LO5424BU1F Loss of unit Class II 120 V ac bus BU1F
Y Y Y Y Y
68 LO5424BU1G Loss of unit Class II 120 V ac bus BU1G
Y Y Y Y Y
69 LO5424BU2C Loss of unit Class II 120 V ac bus BU2C
Y Y Y Y Y
70 LO5424BU2D Loss of unit Class II 120 V ac bus BU2D
Y Y Y Y Y
71 LO5425BU1 Loss of unit Class II 48 V dc bus LO5425BU1
Y Y Y Y Y See loss of unit Class IV 4.16 kV above.
72 LO5425BU2 Loss of unit Class II 48 V dc bus LO5425BU2
Y Y Y Y Y
73 LO5425BU3 Loss of unit Class II 48 V dc bus LO5425BU3
Y Y Y Y Y
74 LO5425BU4 Loss of unit Class II 48 V dc bus
Y Y Y Y Y
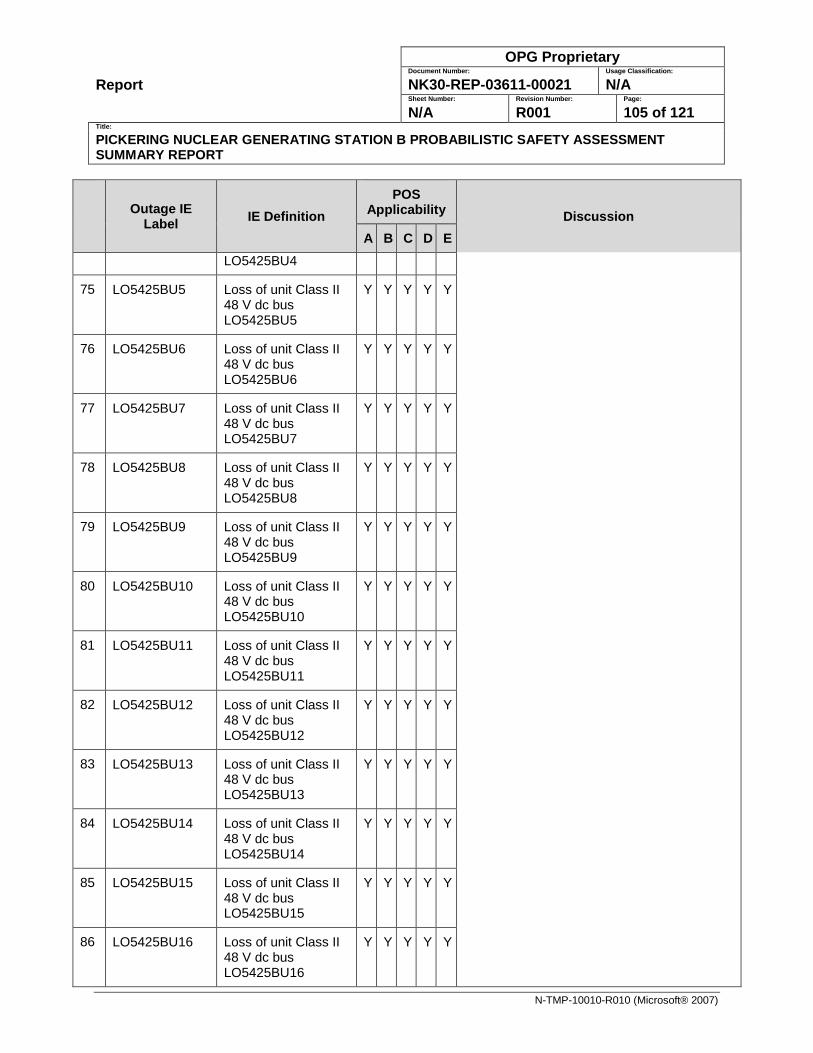
Report
OPG Proprietary Document Number: Usage Classification:
NK30-REP-03611-00021 N/A Sheet Number: Revision Number: Page:
N/A R001 105 of 121 Title:
PICKERING NUCLEAR GENERATING STATION B PROBABILISTIC SAFETY ASSESSMENT SUMMARY REPORT
N-TMP-10010-R010 (Microsoft® 2007)
Outage IE
Label IE Definition POS
Applicability Discussion A B C D E
LO5425BU4
75 LO5425BU5 Loss of unit Class II 48 V dc bus LO5425BU5
Y Y Y Y Y
76 LO5425BU6 Loss of unit Class II 48 V dc bus LO5425BU6
Y Y Y Y Y
77 LO5425BU7 Loss of unit Class II 48 V dc bus LO5425BU7
Y Y Y Y Y
78 LO5425BU8 Loss of unit Class II 48 V dc bus LO5425BU8
Y Y Y Y Y
79 LO5425BU9 Loss of unit Class II 48 V dc bus LO5425BU9
Y Y Y Y Y
80 LO5425BU10 Loss of unit Class II 48 V dc bus LO5425BU10
Y Y Y Y Y
81 LO5425BU11 Loss of unit Class II 48 V dc bus LO5425BU11
Y Y Y Y Y
82 LO5425BU12 Loss of unit Class II 48 V dc bus LO5425BU12
Y Y Y Y Y
83 LO5425BU13 Loss of unit Class II 48 V dc bus LO5425BU13
Y Y Y Y Y
84 LO5425BU14 Loss of unit Class II 48 V dc bus LO5425BU14
Y Y Y Y Y
85 LO5425BU15 Loss of unit Class II 48 V dc bus LO5425BU15
Y Y Y Y Y
86 LO5425BU16 Loss of unit Class II 48 V dc bus LO5425BU16
Y Y Y Y Y
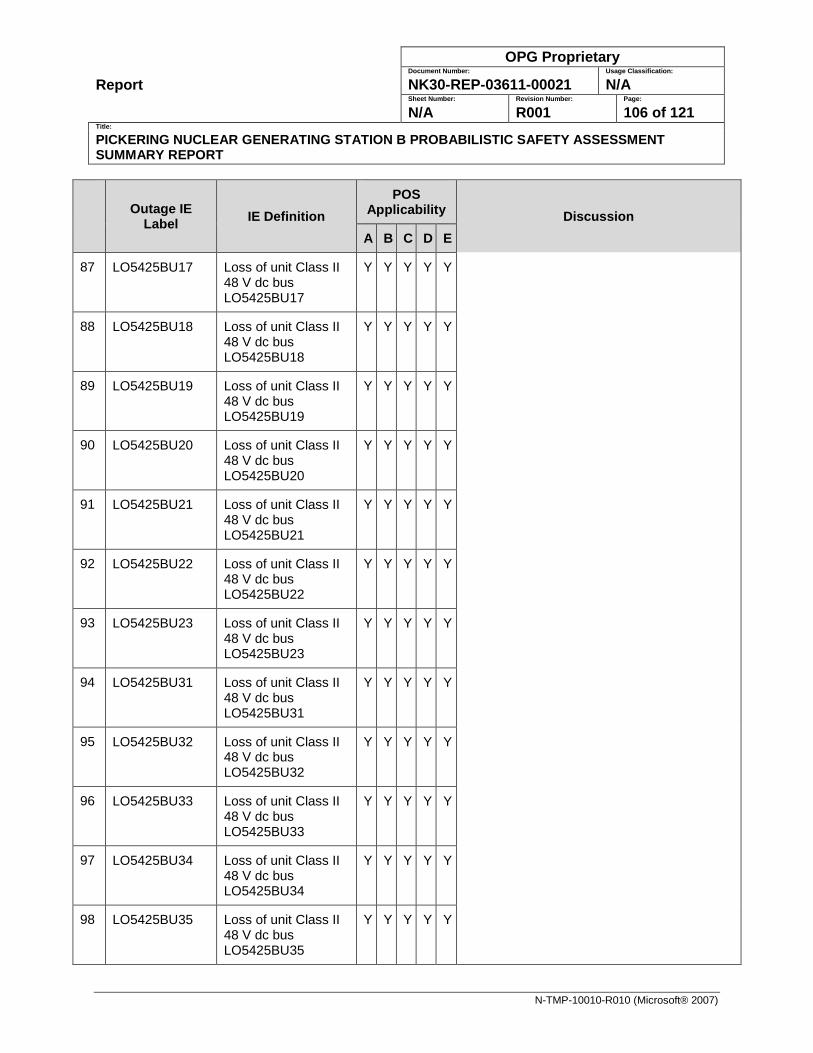
Report
OPG Proprietary Document Number: Usage Classification:
NK30-REP-03611-00021 N/A Sheet Number: Revision Number: Page:
N/A R001 106 of 121 Title:
PICKERING NUCLEAR GENERATING STATION B PROBABILISTIC SAFETY ASSESSMENT SUMMARY REPORT
N-TMP-10010-R010 (Microsoft® 2007)
Outage IE
Label IE Definition POS
Applicability Discussion A B C D E
87 LO5425BU17 Loss of unit Class II 48 V dc bus LO5425BU17
Y Y Y Y Y
88 LO5425BU18 Loss of unit Class II 48 V dc bus LO5425BU18
Y Y Y Y Y
89 LO5425BU19 Loss of unit Class II 48 V dc bus LO5425BU19
Y Y Y Y Y
90 LO5425BU20 Loss of unit Class II 48 V dc bus LO5425BU20
Y Y Y Y Y
91 LO5425BU21 Loss of unit Class II 48 V dc bus LO5425BU21
Y Y Y Y Y
92 LO5425BU22 Loss of unit Class II 48 V dc bus LO5425BU22
Y Y Y Y Y
93 LO5425BU23 Loss of unit Class II 48 V dc bus LO5425BU23
Y Y Y Y Y
94 LO5425BU31 Loss of unit Class II 48 V dc bus LO5425BU31
Y Y Y Y Y
95 LO5425BU32 Loss of unit Class II 48 V dc bus LO5425BU32
Y Y Y Y Y
96 LO5425BU33 Loss of unit Class II 48 V dc bus LO5425BU33
Y Y Y Y Y
97 LO5425BU34 Loss of unit Class II 48 V dc bus LO5425BU34
Y Y Y Y Y
98 LO5425BU35 Loss of unit Class II 48 V dc bus LO5425BU35
Y Y Y Y Y

Report
OPG Proprietary Document Number: Usage Classification:
NK30-REP-03611-00021 N/A Sheet Number: Revision Number: Page:
N/A R001 107 of 121 Title:
PICKERING NUCLEAR GENERATING STATION B PROBABILISTIC SAFETY ASSESSMENT SUMMARY REPORT
N-TMP-10010-R010 (Microsoft® 2007)
Outage IE
Label IE Definition POS
Applicability Discussion A B C D E
99 LO5425BU36 Loss of unit Class II 48 V dc bus LO5425BU36
Y Y Y Y Y
100 LO5425BU37 Loss of unit Class II 48 V dc bus LO5425BU37
Y Y Y Y Y
101 LO5425BU38 Loss of unit Class II 48 V dc bus LO5425BU38
Y Y Y Y Y
102 LO5425BU39 Loss of unit Class II 48 V dc bus LO5425BU39
Y Y Y Y Y
103 LO5425BU40 Loss of unit Class II 48 V dc bus LO5425BU40
Y Y Y Y Y
104 LO5425BU41 Loss of unit Class II 48 V dc bus LO5425BU41
Y Y Y Y Y
105 LO5425BU42 Loss of unit Class II 48 V dc bus LO5425BU42
Y Y Y Y Y
106 LO5425BU43 Loss of unit Class II 48 V dc bus LO5425BU43
Y Y Y Y Y
107 LO5425BU44 Loss of unit Class II 48 V dc bus LO5425BU44
Y Y Y Y Y
108 LO5425BU45 Loss of unit Class II 48 V dc bus LO5425BU45
Y Y Y Y Y
109 LO5425BU46 Loss of unit Class II 48 V dc bus LO5425BU46
Y Y Y Y Y
110 LO5425BU47 Loss of unit Class II 48 V dc bus LO5425BU47
Y Y Y Y Y
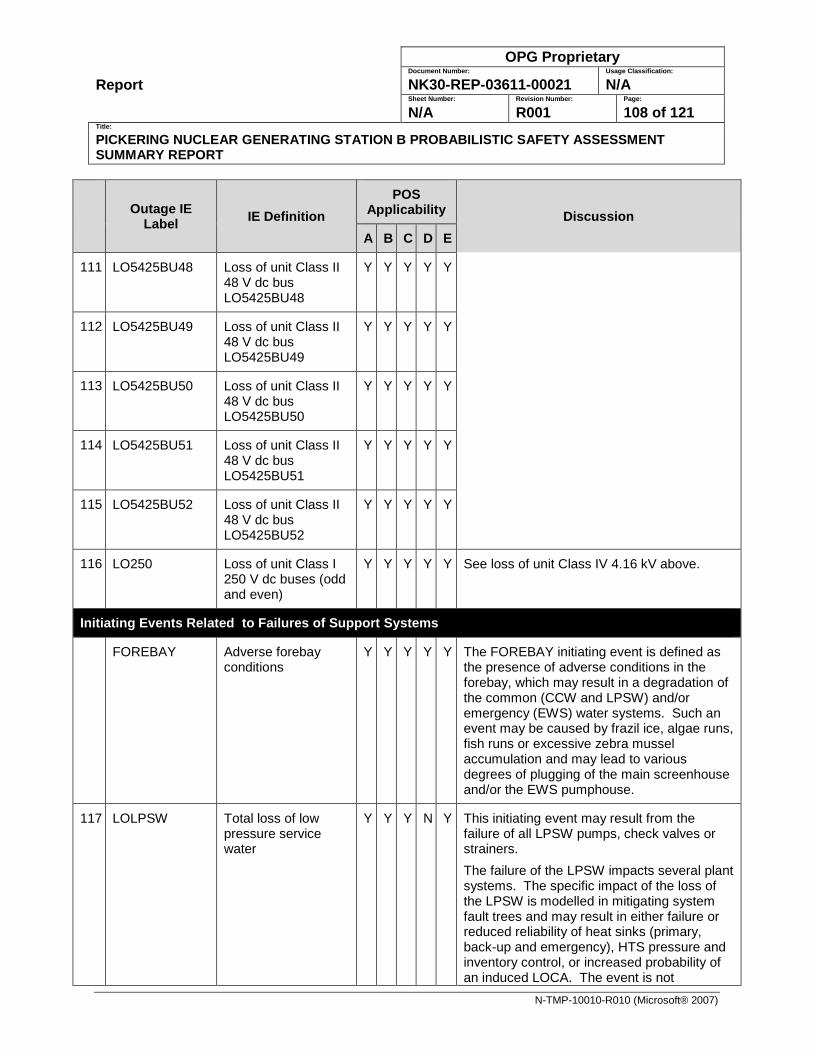
Report
OPG Proprietary Document Number: Usage Classification:
NK30-REP-03611-00021 N/A Sheet Number: Revision Number: Page:
N/A R001 108 of 121 Title:
PICKERING NUCLEAR GENERATING STATION B PROBABILISTIC SAFETY ASSESSMENT SUMMARY REPORT
N-TMP-10010-R010 (Microsoft® 2007)
Outage IE
Label IE Definition POS
Applicability Discussion A B C D E
111 LO5425BU48 Loss of unit Class II 48 V dc bus LO5425BU48
Y Y Y Y Y
112 LO5425BU49 Loss of unit Class II 48 V dc bus LO5425BU49
Y Y Y Y Y
113 LO5425BU50 Loss of unit Class II 48 V dc bus LO5425BU50
Y Y Y Y Y
114 LO5425BU51 Loss of unit Class II 48 V dc bus LO5425BU51
Y Y Y Y Y
115 LO5425BU52 Loss of unit Class II 48 V dc bus LO5425BU52
Y Y Y Y Y
116 LO250 Loss of unit Class I 250 V dc buses (odd and even)
Y Y Y Y Y See loss of unit Class IV 4.16 kV above.
Initiating Events Related to Failures of Support Systems
FOREBAY Adverse forebay conditions
Y Y Y Y Y The FOREBAY initiating event is defined as the presence of adverse conditions in the forebay, which may result in a degradation of the common (CCW and LPSW) and/or emergency (EWS) water systems. Such an event may be caused by frazil ice, algae runs, fish runs or excessive zebra mussel accumulation and may lead to various degrees of plugging of the main screenhouse and/or the EWS pumphouse.
117 LOLPSW Total loss of low pressure service water
Y Y Y N Y This initiating event may result from the failure of all LPSW pumps, check valves or strainers. The failure of the LPSW impacts several plant systems. The specific impact of the loss of the LPSW is modelled in mitigating system fault trees and may result in either failure or reduced reliability of heat sinks (primary, back-up and emergency), HTS pressure and inventory control, or increased probability of an induced LOCA. The event is not
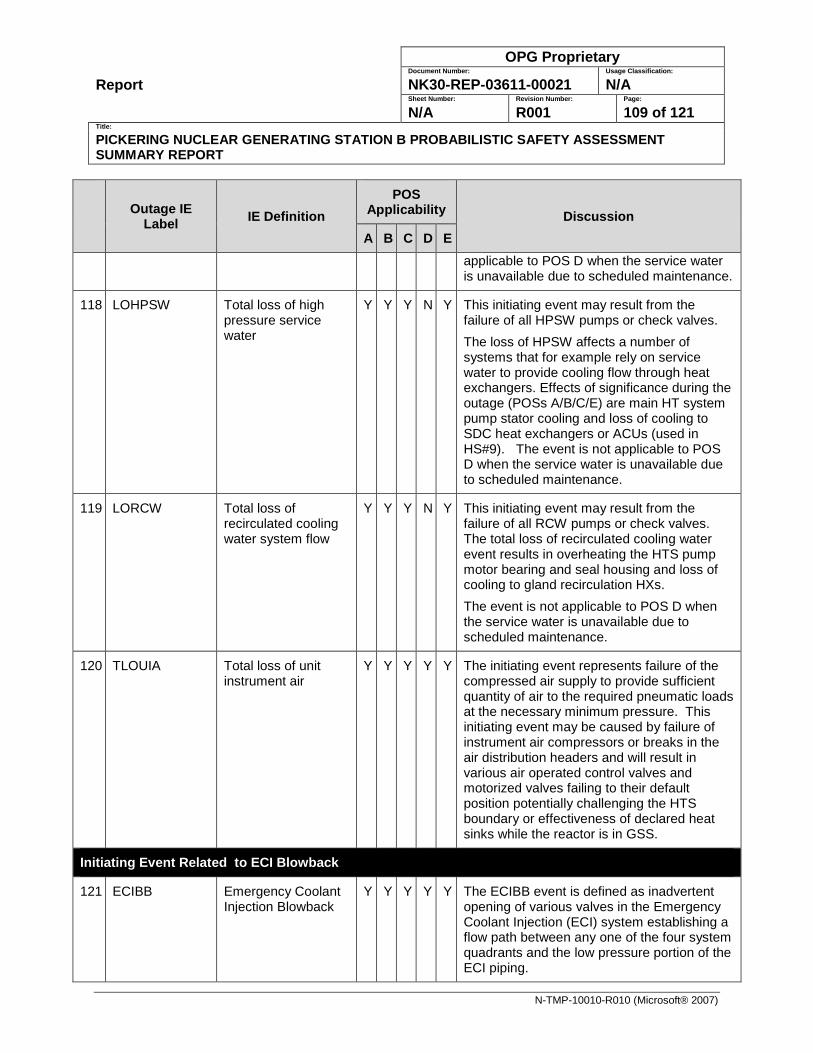
Report
OPG Proprietary Document Number: Usage Classification:
NK30-REP-03611-00021 N/A Sheet Number: Revision Number: Page:
N/A R001 109 of 121 Title:
PICKERING NUCLEAR GENERATING STATION B PROBABILISTIC SAFETY ASSESSMENT SUMMARY REPORT
N-TMP-10010-R010 (Microsoft® 2007)
Outage IE
Label IE Definition POS
Applicability Discussion A B C D E
applicable to POS D when the service water is unavailable due to scheduled maintenance.
118 LOHPSW Total loss of high pressure service water
Y Y Y N Y This initiating event may result from the failure of all HPSW pumps or check valves. The loss of HPSW affects a number of systems that for example rely on service water to provide cooling flow through heat exchangers. Effects of significance during the outage (POSs A/B/C/E) are main HT system pump stator cooling and loss of cooling to SDC heat exchangers or ACUs (used in HS#9). The event is not applicable to POS D when the service water is unavailable due to scheduled maintenance.
119 LORCW Total loss of recirculated cooling water system flow
Y Y Y N Y This initiating event may result from the failure of all RCW pumps or check valves. The total loss of recirculated cooling water event results in overheating the HTS pump motor bearing and seal housing and loss of cooling to gland recirculation HXs. The event is not applicable to POS D when the service water is unavailable due to scheduled maintenance.
120 TLOUIA Total loss of unit instrument air
Y Y Y Y Y The initiating event represents failure of the compressed air supply to provide sufficient quantity of air to the required pneumatic loads at the necessary minimum pressure. This initiating event may be caused by failure of instrument air compressors or breaks in the air distribution headers and will result in various air operated control valves and motorized valves failing to their default position potentially challenging the HTS boundary or effectiveness of declared heat sinks while the reactor is in GSS.
Initiating Event Related to ECI Blowback
121 ECIBB Emergency Coolant Injection Blowback
Y Y Y Y Y The ECIBB event is defined as inadvertent opening of various valves in the Emergency Coolant Injection (ECI) system establishing a flow path between any one of the four system quadrants and the low pressure portion of the ECI piping.
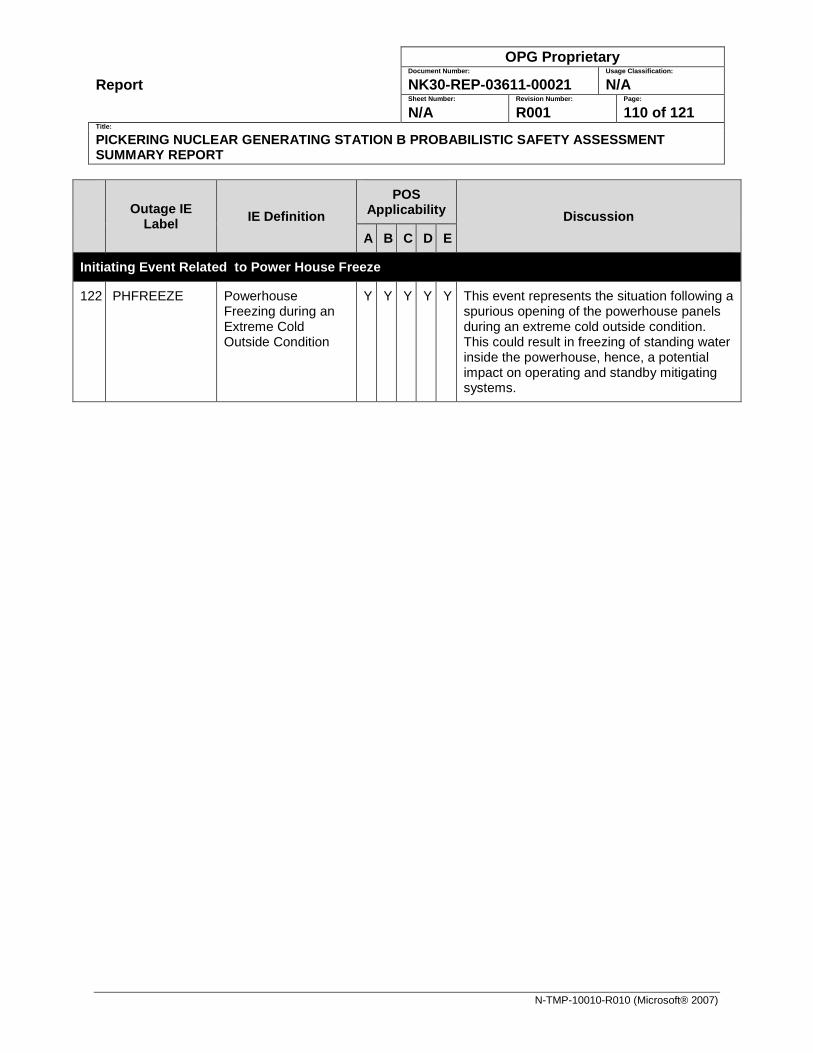
Report
OPG Proprietary Document Number: Usage Classification:
NK30-REP-03611-00021 N/A Sheet Number: Revision Number: Page:
N/A R001 110 of 121 Title:
PICKERING NUCLEAR GENERATING STATION B PROBABILISTIC SAFETY ASSESSMENT SUMMARY REPORT
N-TMP-10010-R010 (Microsoft® 2007)
Outage IE
Label IE Definition POS
Applicability Discussion A B C D E
Initiating Event Related to Power House Freeze
122 PHFREEZE Powerhouse Freezing during an Extreme Cold Outside Condition
Y Y Y Y Y This event represents the situation following a spurious opening of the powerhouse panels during an extreme cold outside condition. This could result in freezing of standing water inside the powerhouse, hence, a potential impact on operating and standby mitigating systems.
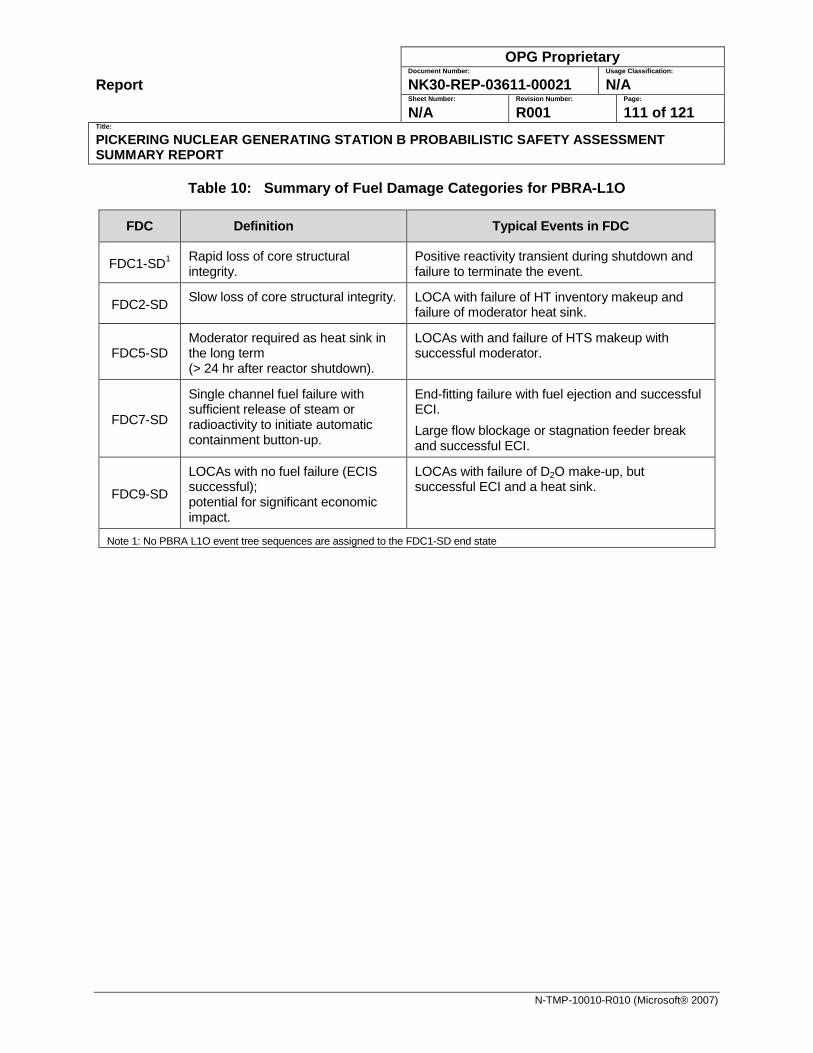
Report
OPG Proprietary Document Number: Usage Classification:
NK30-REP-03611-00021 N/A Sheet Number: Revision Number: Page:
N/A R001 111 of 121 Title:
PICKERING NUCLEAR GENERATING STATION B PROBABILISTIC SAFETY ASSESSMENT SUMMARY REPORT
N-TMP-10010-R010 (Microsoft® 2007)
Table 10: Summary of Fuel Damage Categories for PBRA-L1O
FDC Definition Typical Events in FDC
FDC1-SD1 Rapid loss of core structural integrity.
Positive reactivity transient during shutdown and failure to terminate the event.
FDC2-SD Slow loss of core structural integrity. LOCA with failure of HT inventory makeup and failure of moderator heat sink.
FDC5-SD Moderator required as heat sink in the long term (> 24 hr after reactor shutdown).
LOCAs with and failure of HTS makeup with successful moderator.
FDC7-SD
Single channel fuel failure with sufficient release of steam or radioactivity to initiate automatic containment button-up.
End-fitting failure with fuel ejection and successful ECI. Large flow blockage or stagnation feeder break and successful ECI.
FDC9-SD
LOCAs with no fuel failure (ECIS successful); potential for significant economic impact.
LOCAs with failure of D2O make-up, but successful ECI and a heat sink.
Note 1: No PBRA L1O event tree sequences are assigned to the FDC1-SD end state
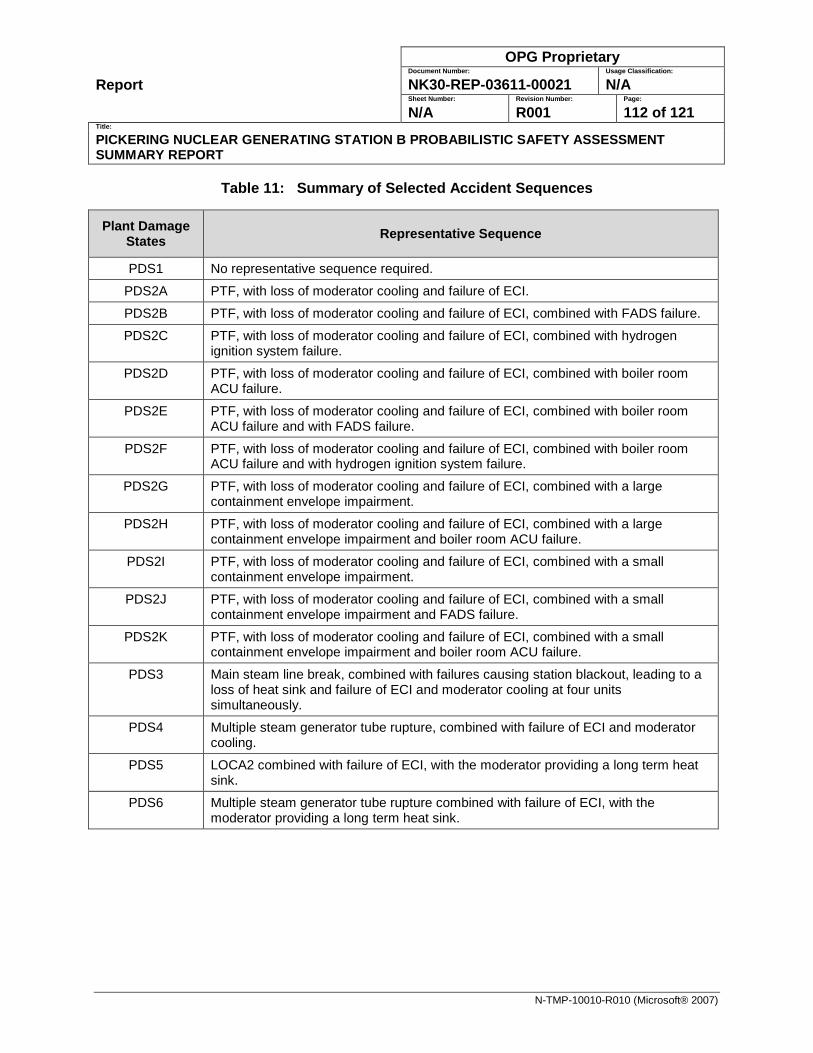
Report
OPG Proprietary Document Number: Usage Classification:
NK30-REP-03611-00021 N/A Sheet Number: Revision Number: Page:
N/A R001 112 of 121 Title:
PICKERING NUCLEAR GENERATING STATION B PROBABILISTIC SAFETY ASSESSMENT SUMMARY REPORT
N-TMP-10010-R010 (Microsoft® 2007)
Table 11: Summary of Selected Accident Sequences
Plant Damage States Representative Sequence
PDS1 No representative sequence required.
PDS2A PTF, with loss of moderator cooling and failure of ECI.
PDS2B PTF, with loss of moderator cooling and failure of ECI, combined with FADS failure.
PDS2C PTF, with loss of moderator cooling and failure of ECI, combined with hydrogen ignition system failure.
PDS2D PTF, with loss of moderator cooling and failure of ECI, combined with boiler room ACU failure.
PDS2E PTF, with loss of moderator cooling and failure of ECI, combined with boiler room ACU failure and with FADS failure.
PDS2F PTF, with loss of moderator cooling and failure of ECI, combined with boiler room ACU failure and with hydrogen ignition system failure.
PDS2G PTF, with loss of moderator cooling and failure of ECI, combined with a large containment envelope impairment.
PDS2H PTF, with loss of moderator cooling and failure of ECI, combined with a large containment envelope impairment and boiler room ACU failure.
PDS2I PTF, with loss of moderator cooling and failure of ECI, combined with a small containment envelope impairment.
PDS2J PTF, with loss of moderator cooling and failure of ECI, combined with a small containment envelope impairment and FADS failure.
PDS2K PTF, with loss of moderator cooling and failure of ECI, combined with a small containment envelope impairment and boiler room ACU failure.
PDS3 Main steam line break, combined with failures causing station blackout, leading to a loss of heat sink and failure of ECI and moderator cooling at four units simultaneously.
PDS4 Multiple steam generator tube rupture, combined with failure of ECI and moderator cooling.
PDS5 LOCA2 combined with failure of ECI, with the moderator providing a long term heat sink.
PDS6 Multiple steam generator tube rupture combined with failure of ECI, with the moderator providing a long term heat sink.
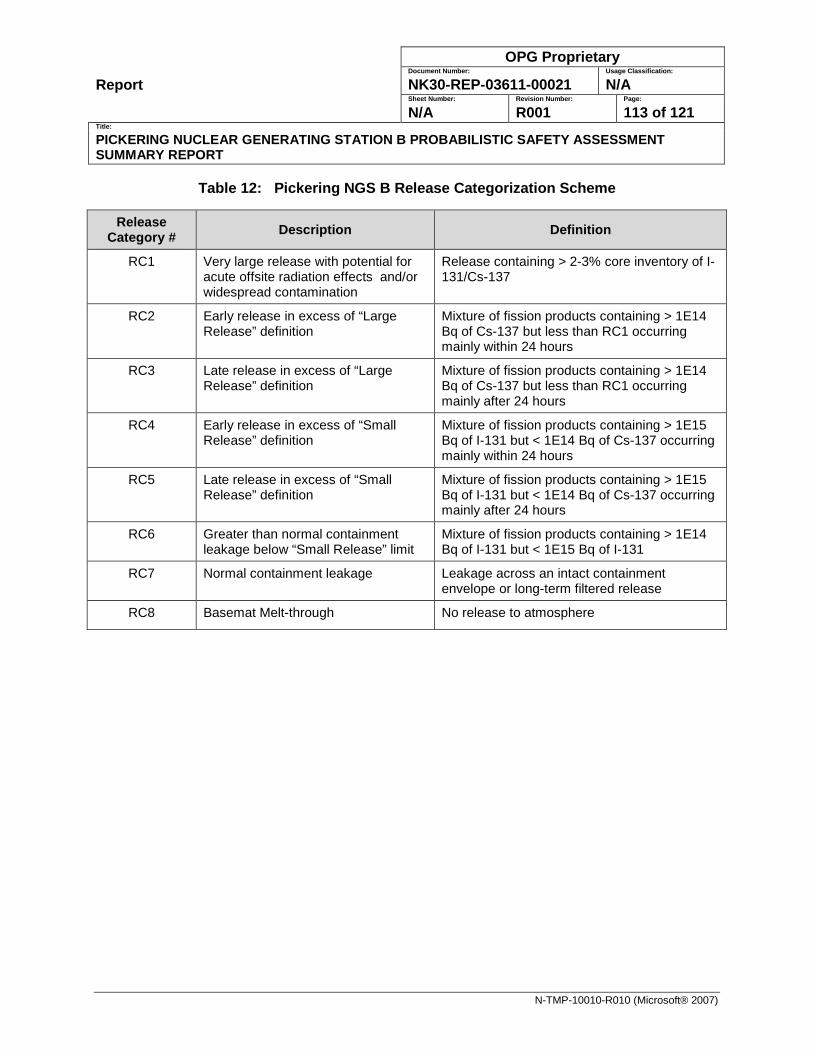
Report
OPG Proprietary Document Number: Usage Classification:
NK30-REP-03611-00021 N/A Sheet Number: Revision Number: Page:
N/A R001 113 of 121 Title:
PICKERING NUCLEAR GENERATING STATION B PROBABILISTIC SAFETY ASSESSMENT SUMMARY REPORT
N-TMP-10010-R010 (Microsoft® 2007)
Table 12: Pickering NGS B Release Categorization Scheme
Release Category # Description Definition
RC1 Very large release with potential for acute offsite radiation effects and/or widespread contamination
Release containing > 2-3% core inventory of I-131/Cs-137
RC2 Early release in excess of “Large Release” definition
Mixture of fission products containing > 1E14 Bq of Cs-137 but less than RC1 occurring mainly within 24 hours
RC3 Late release in excess of “Large Release” definition
Mixture of fission products containing > 1E14 Bq of Cs-137 but less than RC1 occurring mainly after 24 hours
RC4 Early release in excess of “Small Release” definition
Mixture of fission products containing > 1E15 Bq of I-131 but < 1E14 Bq of Cs-137 occurring mainly within 24 hours
RC5 Late release in excess of “Small Release” definition
Mixture of fission products containing > 1E15 Bq of I-131 but < 1E14 Bq of Cs-137 occurring mainly after 24 hours
RC6 Greater than normal containment leakage below “Small Release” limit
Mixture of fission products containing > 1E14 Bq of I-131 but < 1E15 Bq of I-131
RC7 Normal containment leakage Leakage across an intact containment envelope or long-term filtered release
RC8 Basemat Melt-through No release to atmosphere
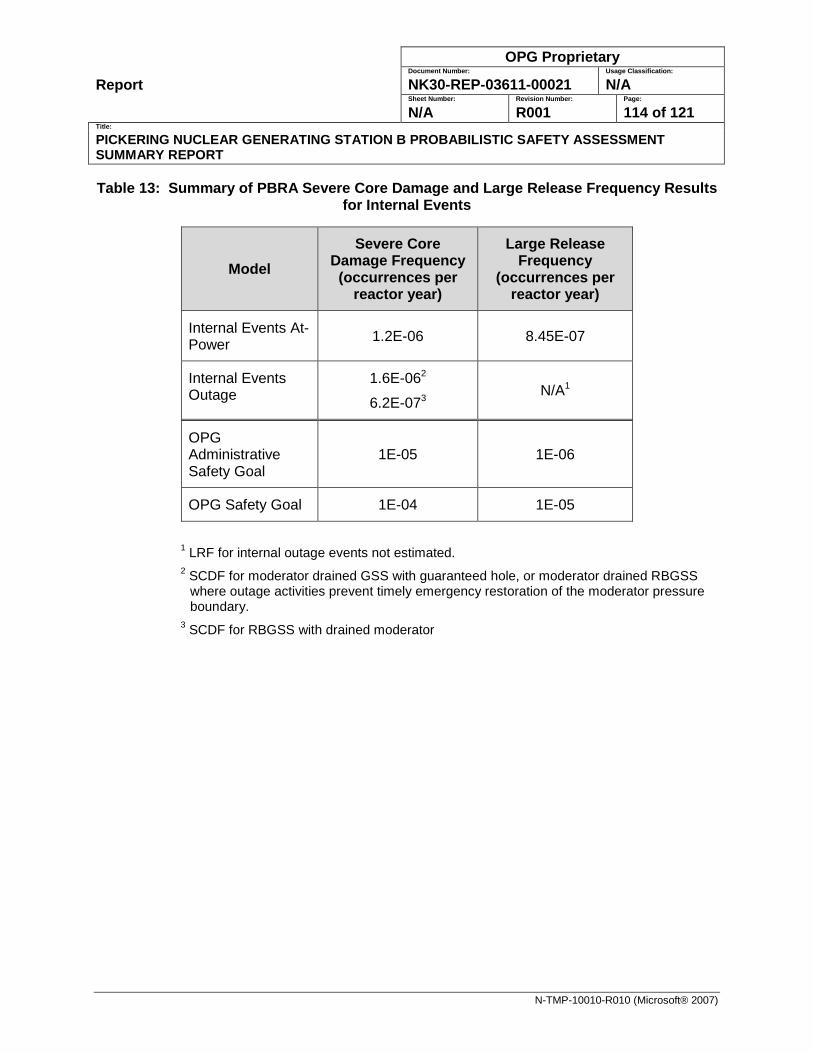
Report
OPG Proprietary Document Number: Usage Classification:
NK30-REP-03611-00021 N/A Sheet Number: Revision Number: Page:
N/A R001 114 of 121 Title:
PICKERING NUCLEAR GENERATING STATION B PROBABILISTIC SAFETY ASSESSMENT SUMMARY REPORT
N-TMP-10010-R010 (Microsoft® 2007)
Table 13: Summary of PBRA Severe Core Damage and Large Release Frequency Results for Internal Events
Model Severe Core
Damage Frequency (occurrences per
reactor year)
Large Release Frequency
(occurrences per reactor year)
Internal Events At-Power 1.2E-06 8.45E-07
Internal Events Outage
1.6E-062
6.2E-073 N/A1
OPG Administrative Safety Goal
1E-05 1E-06
OPG Safety Goal 1E-04 1E-05
1 LRF for internal outage events not estimated. 2 SCDF for moderator drained GSS with guaranteed hole, or moderator drained RBGSS
where outage activities prevent timely emergency restoration of the moderator pressure boundary.
3 SCDF for RBGSS with drained moderator
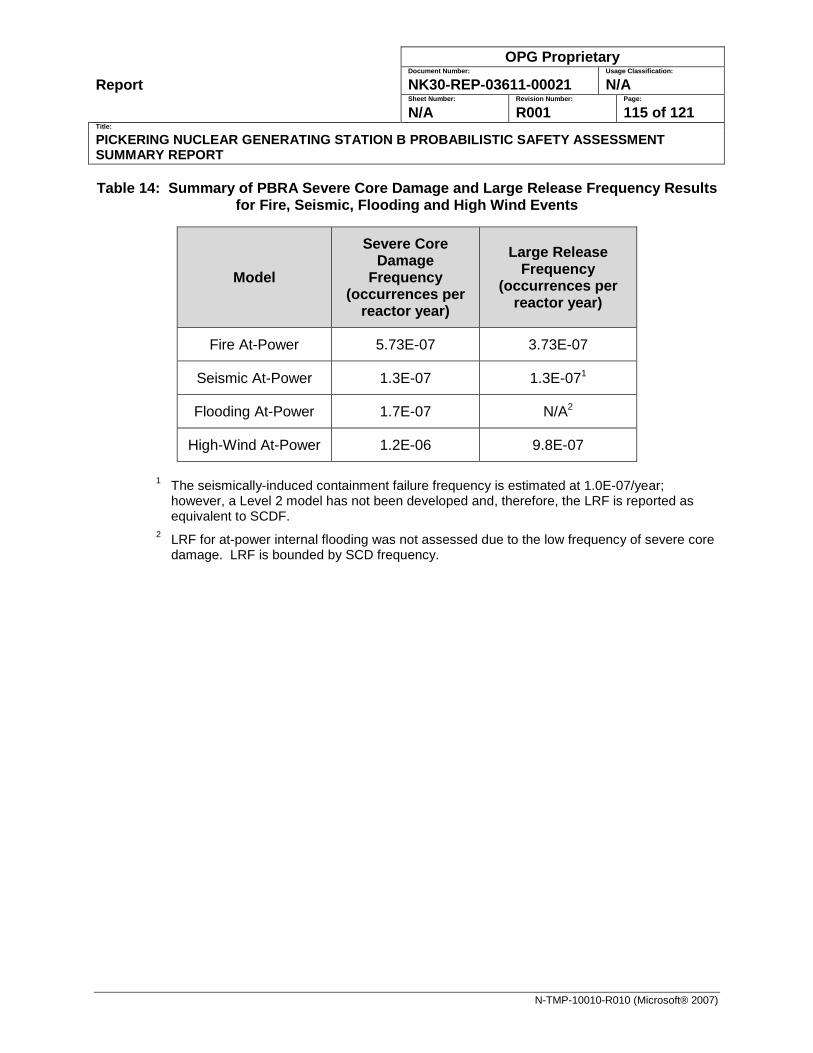
Report
OPG Proprietary Document Number: Usage Classification:
NK30-REP-03611-00021 N/A Sheet Number: Revision Number: Page:
N/A R001 115 of 121 Title:
PICKERING NUCLEAR GENERATING STATION B PROBABILISTIC SAFETY ASSESSMENT SUMMARY REPORT
N-TMP-10010-R010 (Microsoft® 2007)
Table 14: Summary of PBRA Severe Core Damage and Large Release Frequency Results for Fire, Seismic, Flooding and High Wind Events
Model
Severe Core Damage
Frequency (occurrences per
reactor year)
Large Release Frequency
(occurrences per reactor year)
Fire At-Power 5.73E-07 3.73E-07
Seismic At-Power 1.3E-07 1.3E-071
Flooding At-Power 1.7E-07 N/A2
High-Wind At-Power 1.2E-06 9.8E-07
1 The seismically-induced containment failure frequency is estimated at 1.0E-07/year; however, a Level 2 model has not been developed and, therefore, the LRF is reported as equivalent to SCDF.
2 LRF for at-power internal flooding was not assessed due to the low frequency of severe core damage. LRF is bounded by SCD frequency.
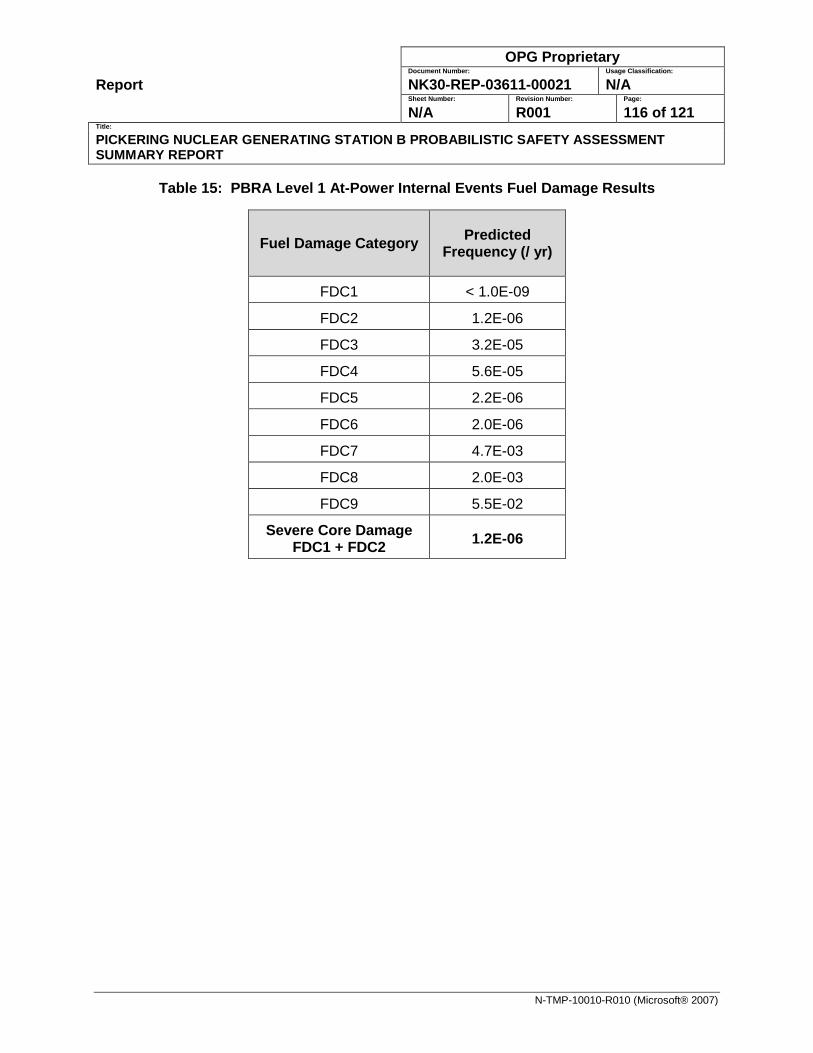
Report
OPG Proprietary Document Number: Usage Classification:
NK30-REP-03611-00021 N/A Sheet Number: Revision Number: Page:
N/A R001 116 of 121 Title:
PICKERING NUCLEAR GENERATING STATION B PROBABILISTIC SAFETY ASSESSMENT SUMMARY REPORT
N-TMP-10010-R010 (Microsoft® 2007)
Table 15: PBRA Level 1 At-Power Internal Events Fuel Damage Results
Fuel Damage Category Predicted Frequency (/ yr)
FDC1 < 1.0E-09
FDC2 1.2E-06
FDC3 3.2E-05
FDC4 5.6E-05
FDC5 2.2E-06
FDC6 2.0E-06
FDC7 4.7E-03
FDC8 2.0E-03
FDC9 5.5E-02
Severe Core Damage FDC1 + FDC2 1.2E-06
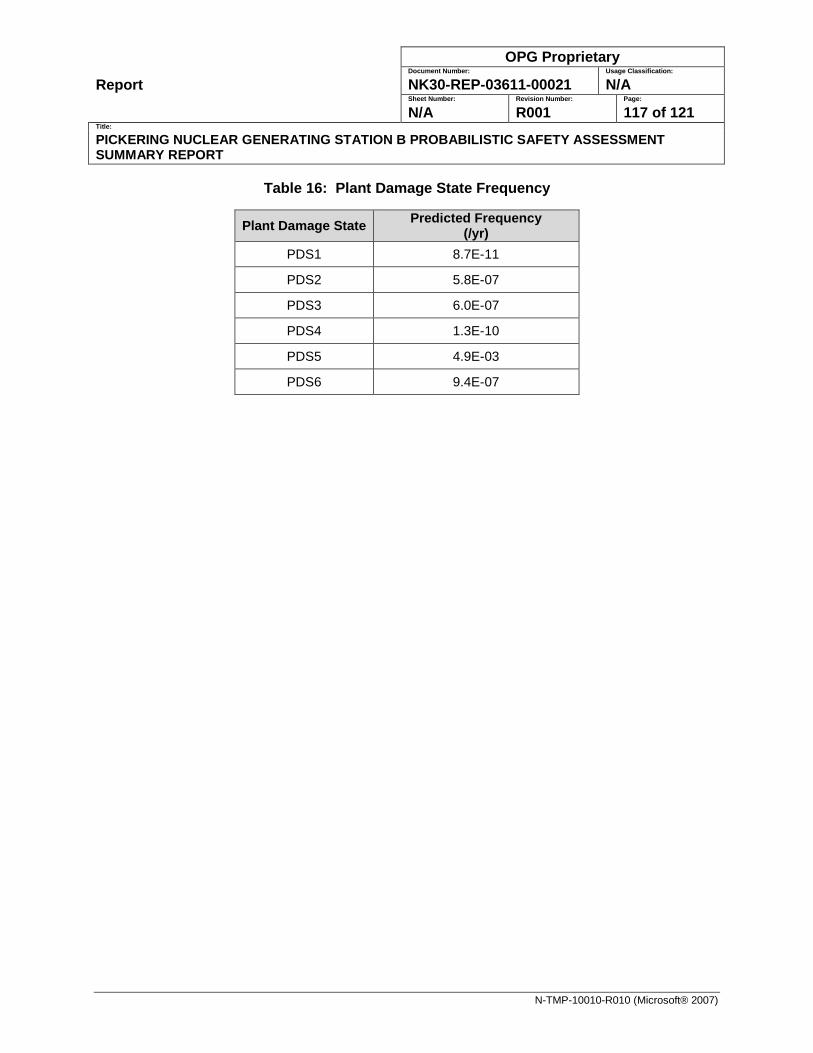
Report
OPG Proprietary Document Number: Usage Classification:
NK30-REP-03611-00021 N/A Sheet Number: Revision Number: Page:
N/A R001 117 of 121 Title:
PICKERING NUCLEAR GENERATING STATION B PROBABILISTIC SAFETY ASSESSMENT SUMMARY REPORT
N-TMP-10010-R010 (Microsoft® 2007)
Table 16: Plant Damage State Frequency
Plant Damage State Predicted Frequency (/yr)
PDS1 8.7E-11
PDS2 5.8E-07
PDS3 6.0E-07
PDS4 1.3E-10
PDS5 4.9E-03
PDS6 9.4E-07
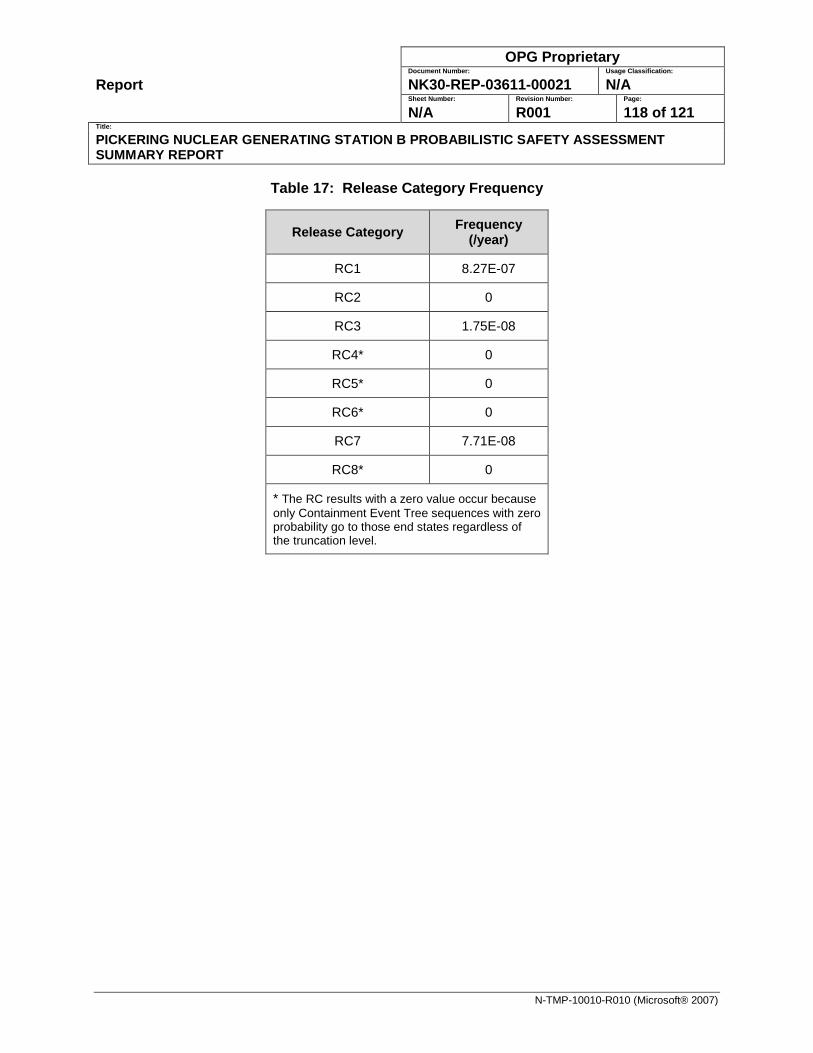
Report
OPG Proprietary Document Number: Usage Classification:
NK30-REP-03611-00021 N/A Sheet Number: Revision Number: Page:
N/A R001 118 of 121 Title:
PICKERING NUCLEAR GENERATING STATION B PROBABILISTIC SAFETY ASSESSMENT SUMMARY REPORT
N-TMP-10010-R010 (Microsoft® 2007)
Table 17: Release Category Frequency
Release Category Frequency (/year)
RC1 8.27E-07
RC2 0
RC3 1.75E-08
RC4* 0
RC5* 0
RC6* 0
RC7 7.71E-08
RC8* 0
* The RC results with a zero value occur because only Containment Event Tree sequences with zero probability go to those end states regardless of the truncation level.
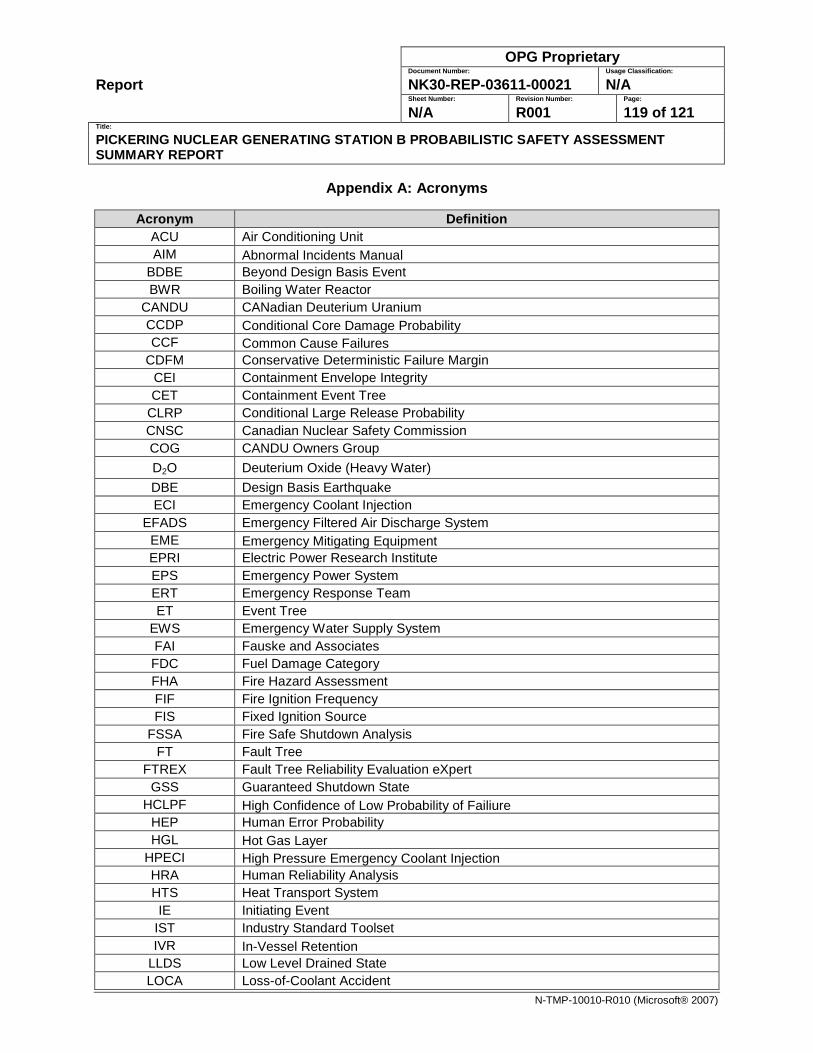
Report
OPG Proprietary Document Number: Usage Classification:
NK30-REP-03611-00021 N/A Sheet Number: Revision Number: Page:
N/A R001 119 of 121 Title:
PICKERING NUCLEAR GENERATING STATION B PROBABILISTIC SAFETY ASSESSMENT SUMMARY REPORT
N-TMP-10010-R010 (Microsoft® 2007)
Appendix A: Acronyms
Acronym Definition ACU Air Conditioning Unit AIM Abnormal Incidents Manual
BDBE Beyond Design Basis Event BWR Boiling Water Reactor
CANDU CANadian Deuterium Uranium CCDP Conditional Core Damage Probability CCF Common Cause Failures
CDFM Conservative Deterministic Failure Margin CEI Containment Envelope Integrity CET Containment Event Tree
CLRP Conditional Large Release Probability CNSC Canadian Nuclear Safety Commission COG CANDU Owners Group D2O Deuterium Oxide (Heavy Water) DBE Design Basis Earthquake ECI Emergency Coolant Injection
EFADS Emergency Filtered Air Discharge System EME Emergency Mitigating Equipment EPRI Electric Power Research Institute EPS Emergency Power System ERT Emergency Response Team ET Event Tree
EWS Emergency Water Supply System FAI Fauske and Associates FDC Fuel Damage Category FHA Fire Hazard Assessment FIF Fire Ignition Frequency FIS Fixed Ignition Source
FSSA Fire Safe Shutdown Analysis FT Fault Tree
FTREX Fault Tree Reliability Evaluation eXpert GSS Guaranteed Shutdown State
HCLPF High Confidence of Low Probability of Failiure HEP Human Error Probability HGL Hot Gas Layer
HPECI High Pressure Emergency Coolant Injection HRA Human Reliability Analysis HTS Heat Transport System IE Initiating Event
IST Industry Standard Toolset IVR In-Vessel Retention
LLDS Low Level Drained State LOCA Loss-of-Coolant Accident
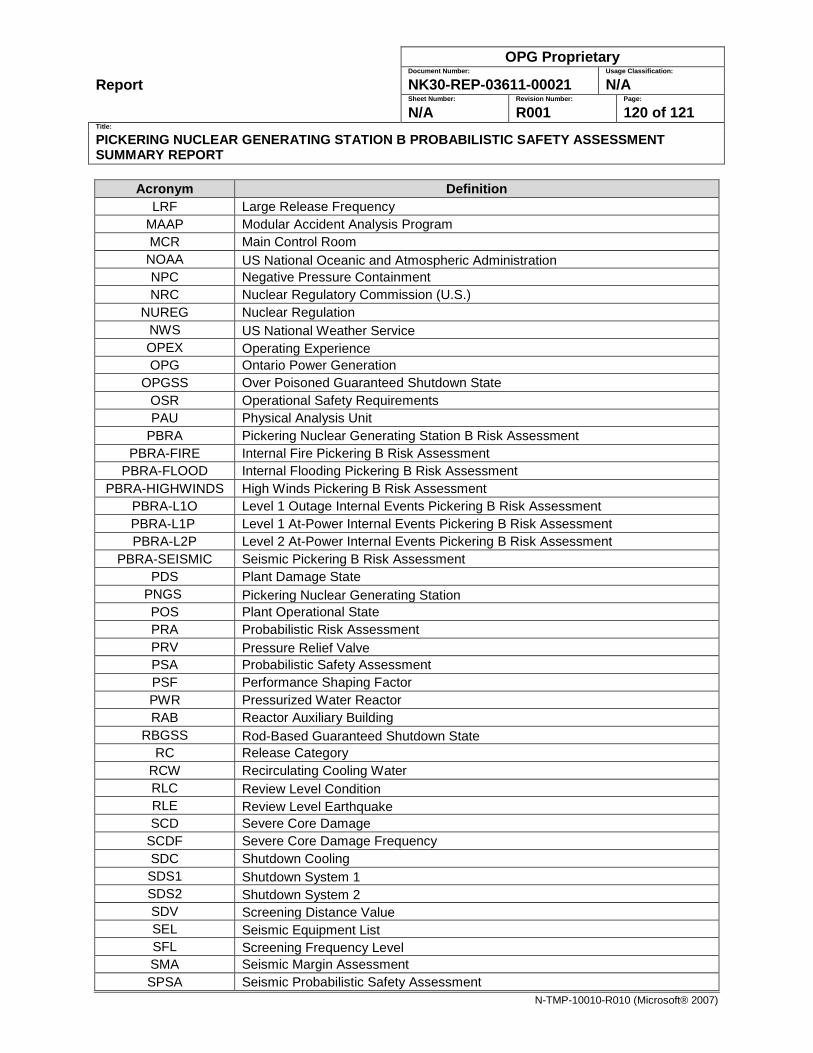
Report
OPG Proprietary Document Number: Usage Classification:
NK30-REP-03611-00021 N/A Sheet Number: Revision Number: Page:
N/A R001 120 of 121 Title:
PICKERING NUCLEAR GENERATING STATION B PROBABILISTIC SAFETY ASSESSMENT SUMMARY REPORT
N-TMP-10010-R010 (Microsoft® 2007)
Acronym Definition LRF Large Release Frequency
MAAP Modular Accident Analysis Program MCR Main Control Room NOAA US National Oceanic and Atmospheric Administration NPC Negative Pressure Containment NRC Nuclear Regulatory Commission (U.S.)
NUREG Nuclear Regulation NWS US National Weather Service OPEX Operating Experience OPG Ontario Power Generation
OPGSS Over Poisoned Guaranteed Shutdown State OSR Operational Safety Requirements PAU Physical Analysis Unit
PBRA Pickering Nuclear Generating Station B Risk Assessment PBRA-FIRE Internal Fire Pickering B Risk Assessment
PBRA-FLOOD Internal Flooding Pickering B Risk Assessment PBRA-HIGHWINDS High Winds Pickering B Risk Assessment
PBRA-L1O Level 1 Outage Internal Events Pickering B Risk Assessment PBRA-L1P Level 1 At-Power Internal Events Pickering B Risk Assessment PBRA-L2P Level 2 At-Power Internal Events Pickering B Risk Assessment
PBRA-SEISMIC Seismic Pickering B Risk Assessment PDS Plant Damage State
PNGS Pickering Nuclear Generating Station POS Plant Operational State PRA Probabilistic Risk Assessment PRV Pressure Relief Valve PSA Probabilistic Safety Assessment PSF Performance Shaping Factor PWR Pressurized Water Reactor RAB Reactor Auxiliary Building
RBGSS Rod-Based Guaranteed Shutdown State RC Release Category
RCW Recirculating Cooling Water RLC Review Level Condition RLE Review Level Earthquake SCD Severe Core Damage
SCDF Severe Core Damage Frequency SDC Shutdown Cooling SDS1 Shutdown System 1 SDS2 Shutdown System 2 SDV Screening Distance Value SEL Seismic Equipment List SFL Screening Frequency Level SMA Seismic Margin Assessment SPSA Seismic Probabilistic Safety Assessment
Report
OPG Proprietary Document Number: Usage Classification:
NK30-REP-03611-00021 N/A Sheet Number: Revision Number: Page:
N/A R001 121 of 121 Title:
PICKERING NUCLEAR GENERATING STATION B PROBABILISTIC SAFETY ASSESSMENT SUMMARY REPORT
N-TMP-10010-R010 (Microsoft® 2007)
Acronym Definition SRV Steam Reject Valve SSC Systems Structures and Components
THERP Technique for Human Error Rate Prediction UECC Unit Emergency Control Centre UPS Uninterruptable Power Supply USA United States of America