Embed Size (px)
Citation preview
University of VictoriaFaculty of Engineering
Summer 2009 Work Term Report
Portable Vibration Analyzers
British Columbia Ferries services Inc.
James HerriotWork Term 1
Mechanical [email protected]
27/03/10
In partial fulfillment of the requirements of theB.Eng. Degree
Supervisor's Approval: To be completed by Co-op Employer
I approve the release of this report to the University of Victoria for evaluation purposes only. The report is to be considered (select one): NOT CONFIDENTIAL CONFIDENTIAL Signature: Position: Date: Name (print): E-Mail: Fax #:
If a report is deemed CONFIDENTIAL, a non-disclosure form signed by an evaluator will be faxed to the employer. The report will be destroyed following evaluation. If the report is NOT CONFIDENTIAL, it will be returned to the student following evaluation.
Portable Vibration Analyzers
Letter of Transmittal
19-1742 Newton St.Victoria, British ColumbiaV8R 2R2 Mrs. Meeta KhuranaCo-op CoordinatorFaculty of EngineeringUniversity of VictoriaP.O. Box 1700Victoria, B.C.V8W 2Y2
27/03/10 Dear Mrs. Khurana,
Please accept this work term report entitled “Portable Vibration Analyzers.”
During my Co-op term I worked under the Director of the Fleet Support Unit as a technical assistant, preforming research into condition monitoring equipment including portable vibration analyzers and ultrasonic thickness gauges. I also prepared documents and reports and contacted manufacturers and suppliers for quotes on condition monitoring equipment.
This report was created during my work term for the purpose of analyzing and reviewing vibration testing equipment for the Fleet Support Unit of BC Ferries. I was tasked with researching the current technology available, presenting the research in a clear manner and to provide recommendations on the selection of equipment which would meet the companies demands. This would require contacting many companies and suppliers for price quotes and information, scheduling product demos and testing, and many hours of research.
I would like to thank my supervisor, John Constable, Erica East and the rest of the FSU members for giving me this job opportunity and welcoming me into their organization.
Sincerely,
James Herriot
2
Portable Vibration Analyzers
Portable Vibration Analyzers
Prepared by: James Herriot
Date: 08-02-29
Department: Fleet Support Unit
Prepared for: John Constable
3
Portable Vibration Analyzers
Index
1. OUTLINE:...............................................................................................................................................42. VIBRATION ANALYZERS REVIEWED:.....................................................................................4
3. FINDINGS:.............................................................................................................................................4
4. TERMS AND INFORMATION:.......................................................................................................5
4.1 TIME WAVEFORM:.................................................................................................................5 4.2 FAST FERRIER TRANSFORMATION (FFT):......................................................................5 4.3 SYNCHRONOUS AVERAGING:..............................................................................................6 4.4 AMPLITUDE DEMODULATION:.............................................................................................6 4.5 THE ACCELEROMETER:.........................................................................................................7
5. PRINCIPALS OF OPERATION:.....................................................................................................9
5.1 TEST CONDITIONS:................................................................................................................9 5.2 WARM UP:..............................................................................................................................9 5.3 MACHINERY TESTING SCHEDULE:....................................................................................10 5.4 TRENDING OF VIBRATION DATA:......................................................................................10
5. SUMMARY OF PORTABLE FFT VIBRATION ANALYZERS:.........................................11
6. CONCLUSION/RECOMMENDATIONS:...................................................................................16
7. REFERENCES:....................................................................................................................................19
8. Brochures and Price Quotes: Error! Bookmark not defined.
4
1. Outline:This report covers information on vibration analysis and portable vibration analyzers
gathered between January and February 2008. Vibration Analysis is the back bone of effective
condition monitoring, allowing maintenance to be scheduled, or repairs to be made before the
equipment experiences catastrophic failure. Generally machines do not fail or malfunction
suddenly without showing some symptoms or warnings, which are often in the form of changing
or increasing vibration levels. Vibration data can be recorded in many number of ways, typically
with a hand held FFT analyzers or a vibration meter. Data is collected on a regular basis and is
trended over time, using graphs and other tools. By examining this data, a well trained analyst
can often identify the type and location of problem, and schedule corrective action. Using this
approach maintenance strategies can be moved away from the current system of “run to failure”
and scheduled replacement to predictive maintenance, usually resulting in substantial cost
savings.
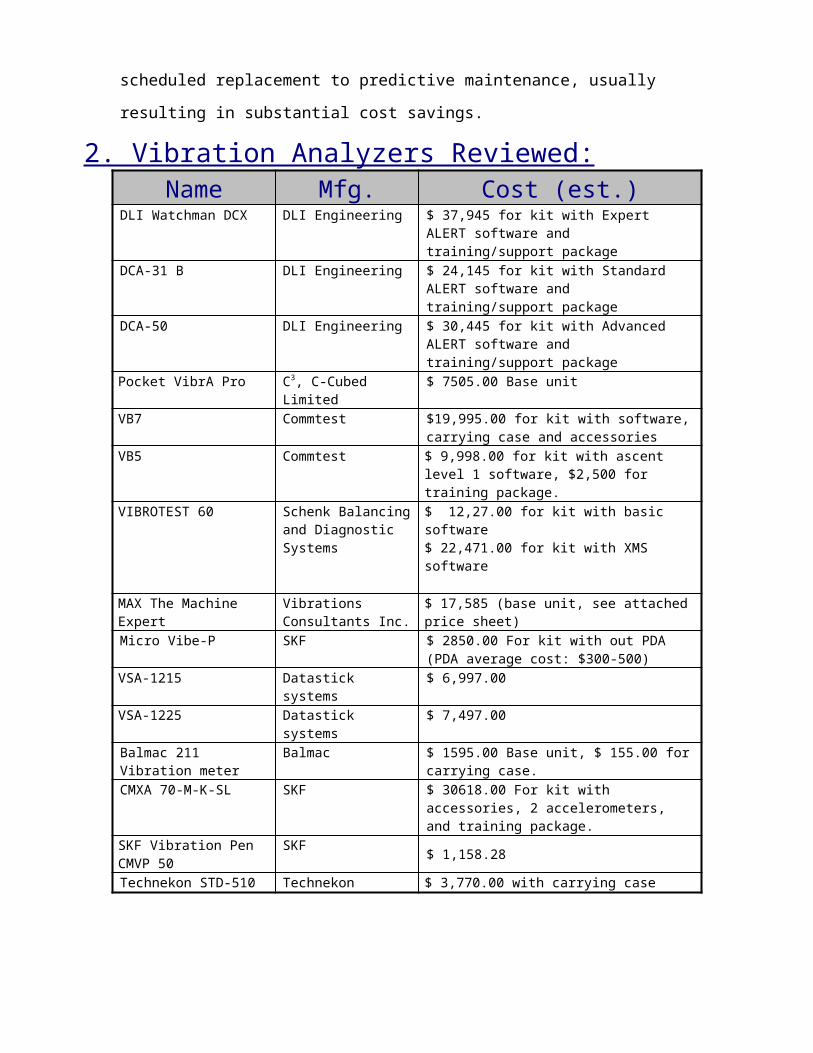
2. Vibration Analyzers Reviewed: Name Mfg. Cost (est.)
DLI Watchman DCX DLI Engineering $ 37,945 for kit with Expert ALERT software and training/support package
DCA-31 B DLI Engineering $ 24,145 for kit with Standard ALERT software and training/support package
DCA-50 DLI Engineering $ 30,445 for kit with Advanced ALERT software and training/support package
Pocket VibrA Pro C3, C-Cubed Limited $ 7505.00 Base unitVB7 Commtest $19,995.00 for kit with software, carrying case
and accessoriesVB5 Commtest $ 9,998.00 for kit with ascent level 1 software,
$2,500 for training package.
VIBROTEST 60 Schenk Balancing and Diagnostic Systems
$ 12,27.00 for kit with basic software$ 22,471.00 for kit with XMS software
MAX The Machine Expert Vibrations Consultants Inc.
$ 17,585 (base unit, see attached price sheet)
Micro Vibe-P SKF $ 2850.00 For kit with out PDA (PDA average cost: $300-500)
VSA-1215 Datastick systems $ 6,997.00VSA-1225 Datastick systems $ 7,497.00Balmac 211 Vibration meter
Balmac $ 1595.00 Base unit, $ 155.00 for carrying case.
CMXA 70-M-K-SL SKF $ 30618.00 For kit with accessories, 2 accelerometers, and training package.
SKF Vibration Pen CMVP 50
SKF $ 1,158.28
Technekon STD-510 Technekon $ 3,770.00 with carrying case
3. Findings:Portable vibration analyzers vary greatly in price and performance and can be categorized
into two main groups: Overall vibration meters and time waveform/FFT analyzers.
Overall vibration meters measure the total vibration level of a machine and display the
results in numerical terms of acceleration, velocity and displacement. They are very straight
forward to use, do not require extensive training, and have a much lower cost versus an FFT
analyzer. There are a number of drawbacks with overall vibration meters, given that they cannot
display a graph of results or store data, they are a poor choice for trending and predictive
maintenance. It is also very difficult to pinpoint specific problems with overall vibration meters
as they can only display how much a machine is vibrating or how loud the machine is, rather
then where the sound is coming from. This makes it very difficult to diagnose large, complex
machines.
FFT analyzers can perform the same functions as an overall vibration meter and can
display the results in graphical form, allowing for frequency analysis and spectrum analysis. All
of the FFT analyzers reviewed have data storage capabilities and most can download this data to
a PC for analysis and trending. It is common to examine the individual frequencies imbedded in
the signal. These frequencies correspond to individual components in the machine, such as a
pump or a bearing. By analyzing these frequencies, a skilled analyst can often identify the source
and location of the problem. This allows repairs to be much simpler as the root cause of the
problem can often be identified. However, interpreting the vibration signal is a complex process
requiring specialized training and experience.
It would also be worthwhile to note the limitations of vibration analysis; though
implementing a vibration monitoring strategy can greatly reduce the likelihood of unnoticed
failure of equipment, it does not improve the reliability of the machine being monitored. Also,
most vibration monitoring strategies call for measurements to be taken from machines at regular
intervals; it is still possible for the machine to fail suddenly between these intervals. One solution
is permanently mounted vibration monitoring equipment to critical machines for continuous
monitoring.
Any equipment used in a marine environment will likely be dropped or come in contact
with moisture; equipment with good IP ratings for impact and water resistance should be
preferred.
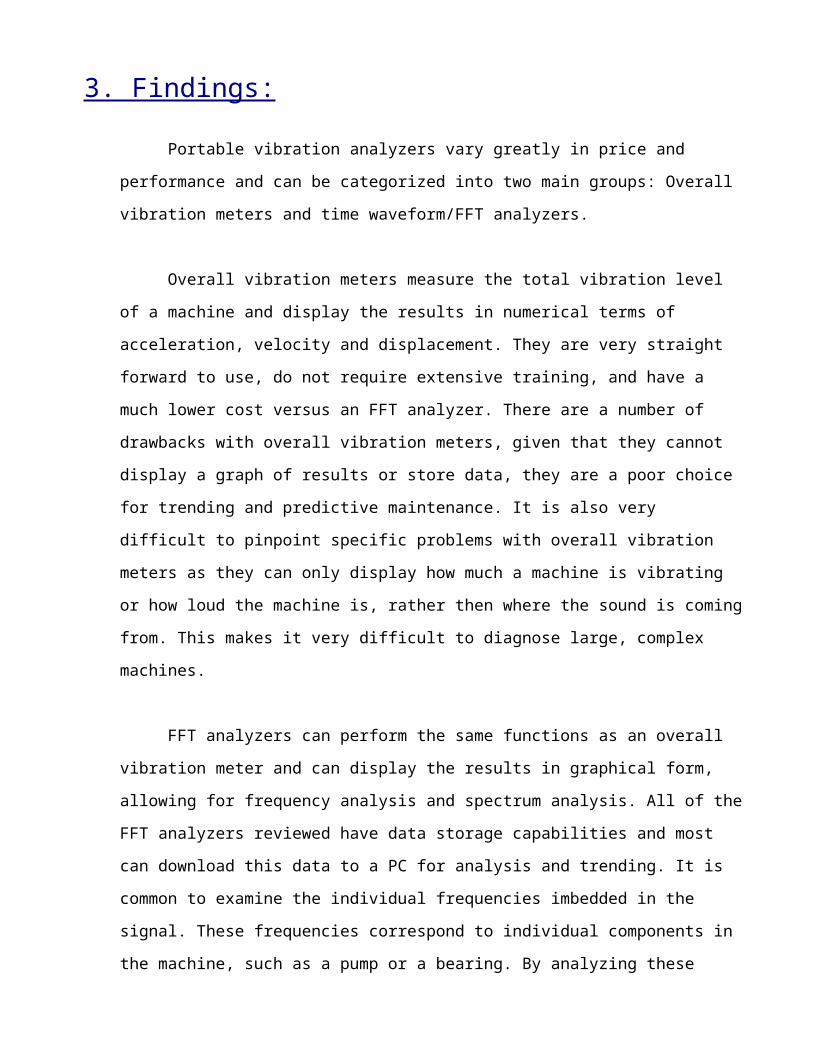
4. Terms and Information: 4.1 Time Waveform:
The time waveform is the raw vibration signal
displayed by the analyzer on a graph with
amplitude and time as axis. Time waveform
analysis has been around for a long time, in its
simplest form the vibration data was viewed on an
oscilloscope and frequency components were
calculated by hand. Time waveform analysis is
still useful in low speed applications, sleeve
bearing machines, and detecting looseness, rubs
and beating. It is common to supplement the information presented by the FFT spectrum with
time waveform analysis to achieve more accurate results. In the next picture we see a comparison
between a simple time waveform (top) and the corresponding FFT frequency spectrum (bottom).
In the time waveform graph we can see two distinct wave forms interacting with each other,
while on the FFT the two different frequencies are represented by two spikes on the graph.
(a)
(t)
(a)
(f)
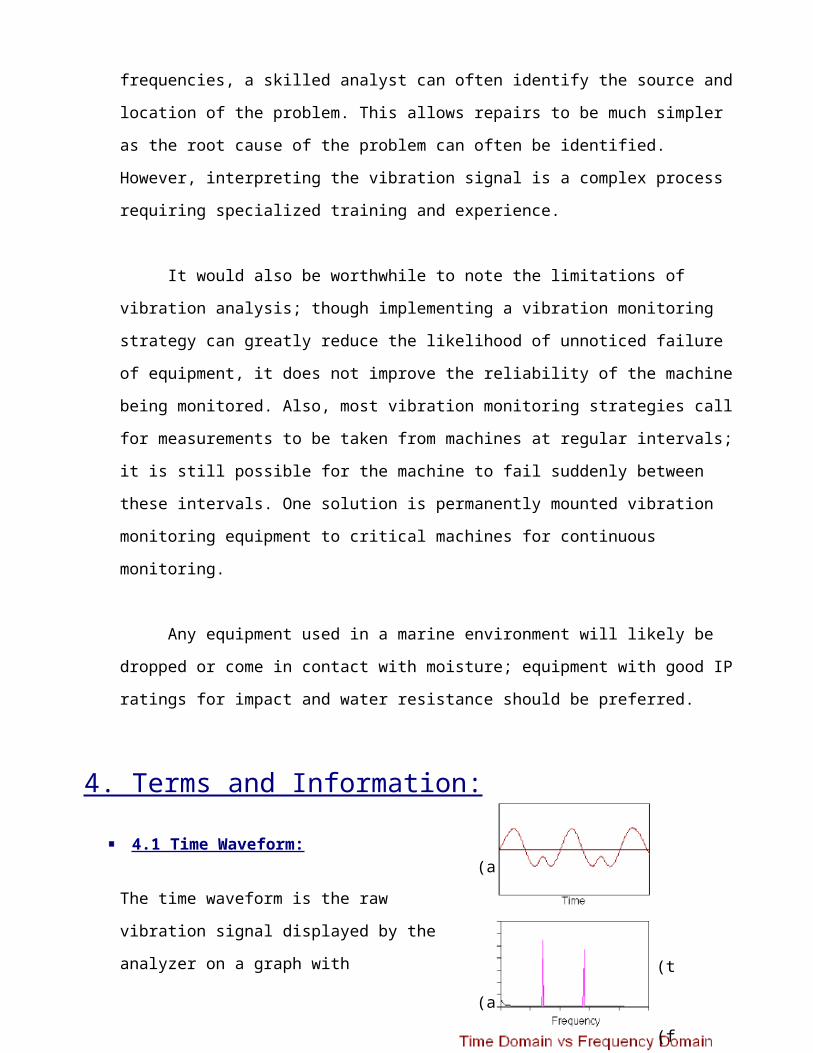
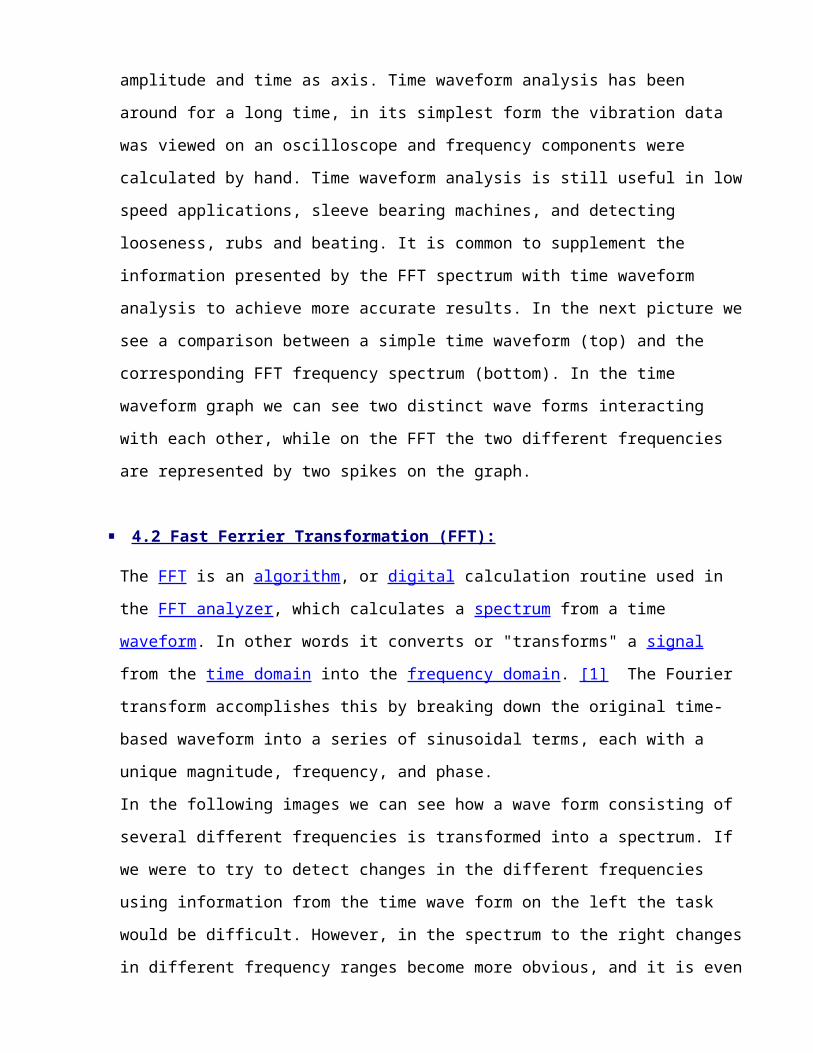
4.2 Fast Ferrier Transformation (FFT):
The FFT is an algorithm, or digital calculation routine used in the FFT analyzer, which calculates
a spectrum from a time waveform. In other words it converts or "transforms" a signal from the
time domain into the frequency domain. [1] The Fourier transform accomplishes this by
breaking down the original time-based waveform into a series of sinusoidal terms, each with a
unique magnitude, frequency, and phase.
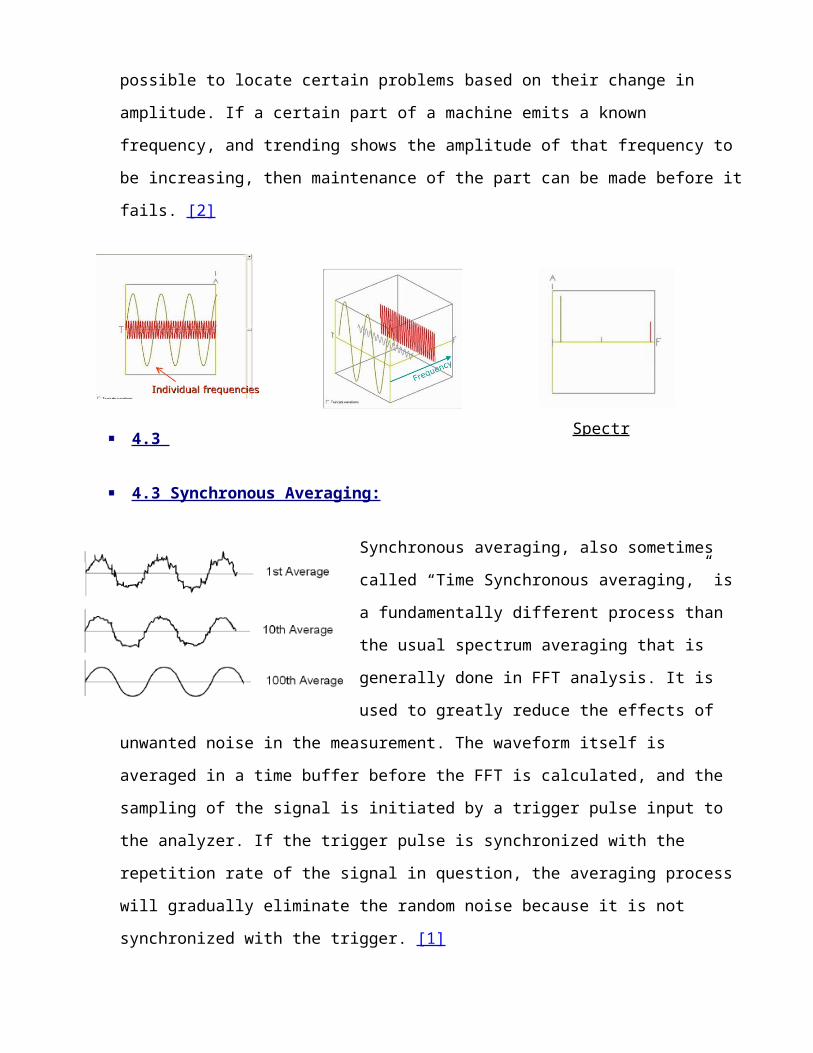
In the following images we can see how a wave form consisting of several different frequencies
is transformed into a spectrum. If we were to try to detect changes in the different frequencies
using information from the time wave form on the left the task would be difficult. However, in
the spectrum to the right changes in different frequency ranges become more obvious, and it is
even possible to locate certain problems based on their change in amplitude. If a certain part of a
machine emits a known frequency, and trending shows the amplitude of that frequency to be
increasing, then maintenance of the part can be made before it fails. [2]
4.3
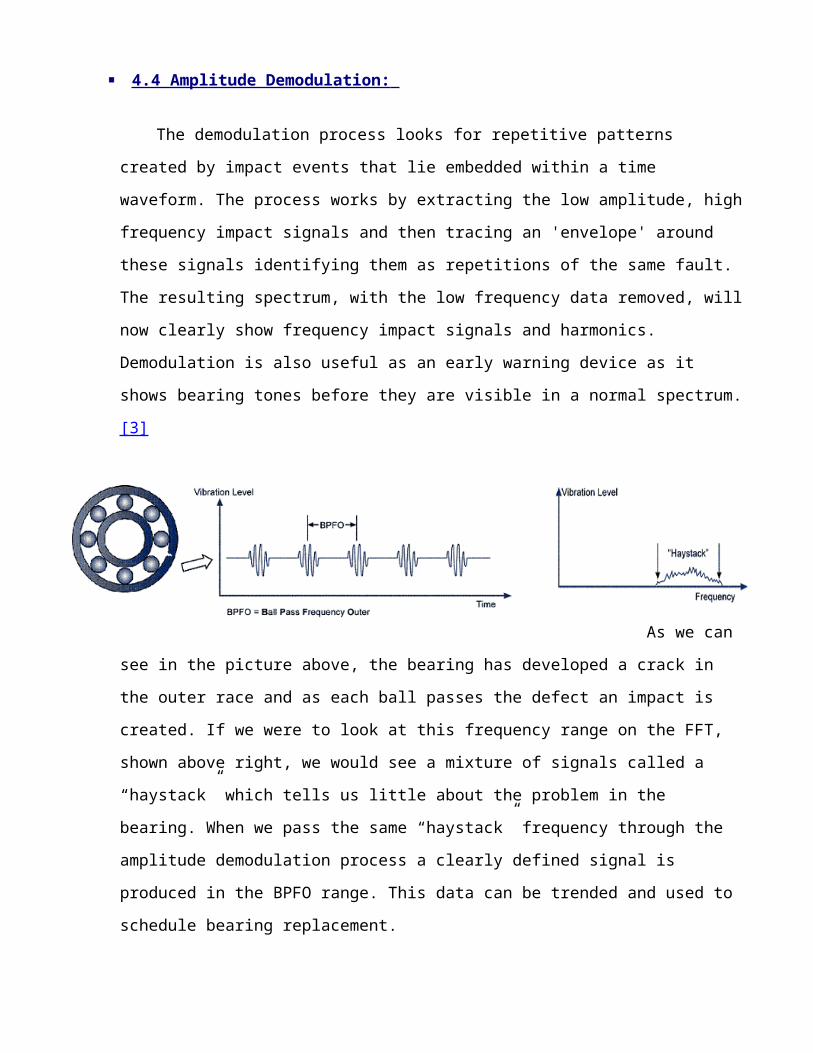
4.3 Synchronous Averaging:
Synchronous averaging, also sometimes called “Time
Synchronous averaging,” is a fundamentally different
process than the usual spectrum averaging that is generally
done in FFT analysis. It is used to greatly reduce the effects
of unwanted noise in the measurement. The waveform
itself is averaged in a time buffer before the FFT is
calculated, and the sampling of the signal is initiated by a trigger pulse input to the analyzer. If
the trigger pulse is synchronized with the repetition rate of the signal in question, the averaging
process will gradually eliminate the random noise because it is not synchronized with the trigger.
[1]
Spectrum
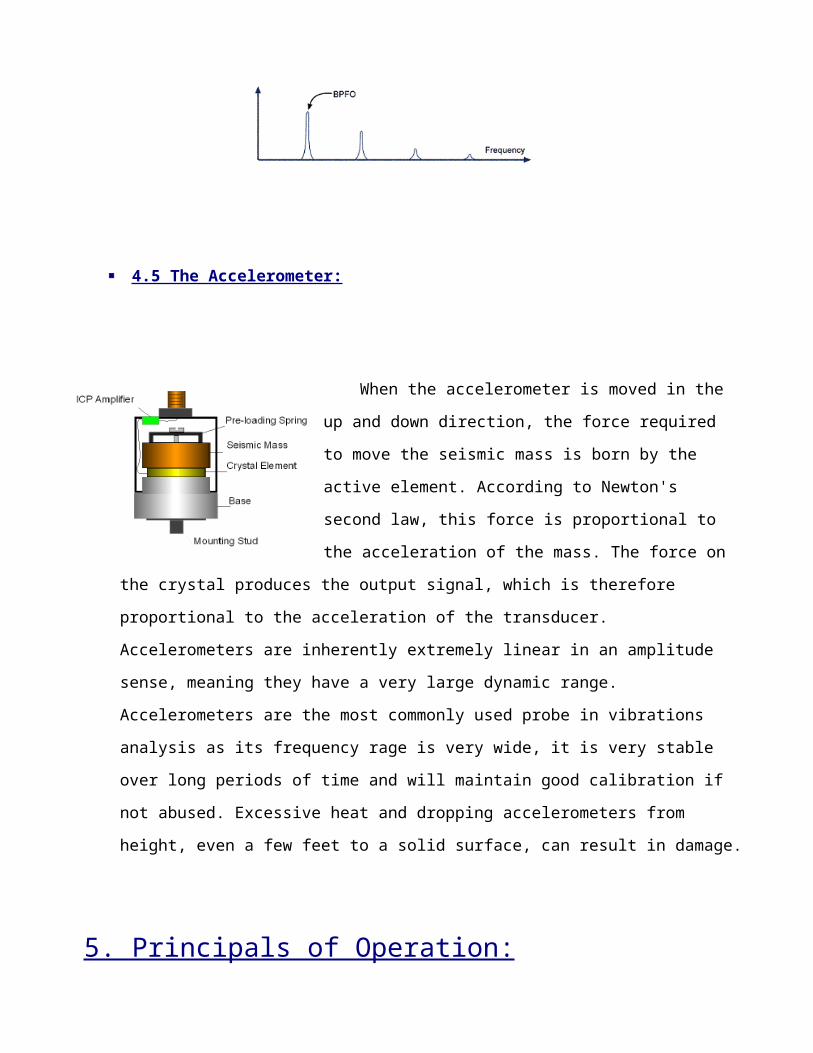
4.4 Amplitude Demodulation:
The demodulation process looks for repetitive patterns created by impact events that lie
embedded within a time waveform. The process works by extracting the low amplitude, high
frequency impact signals and then tracing an 'envelope' around these signals identifying them as
repetitions of the same fault. The resulting spectrum, with the low frequency data removed, will
now clearly show frequency impact signals and harmonics. Demodulation is also useful as an
early warning device as it shows bearing tones before they are visible in a normal spectrum. [3]
As we can see
in the picture above, the bearing has developed a crack in the outer race and as each ball passes
the defect an impact is created. If we were to look at this frequency range on the FFT, shown
above right, we would see a mixture of signals called a “haystack” which tells us little about the
problem in the bearing. When we pass the same “haystack” frequency through the amplitude
demodulation process a clearly defined signal is produced in the BPFO range. This data can be
trended and used to schedule bearing replacement.
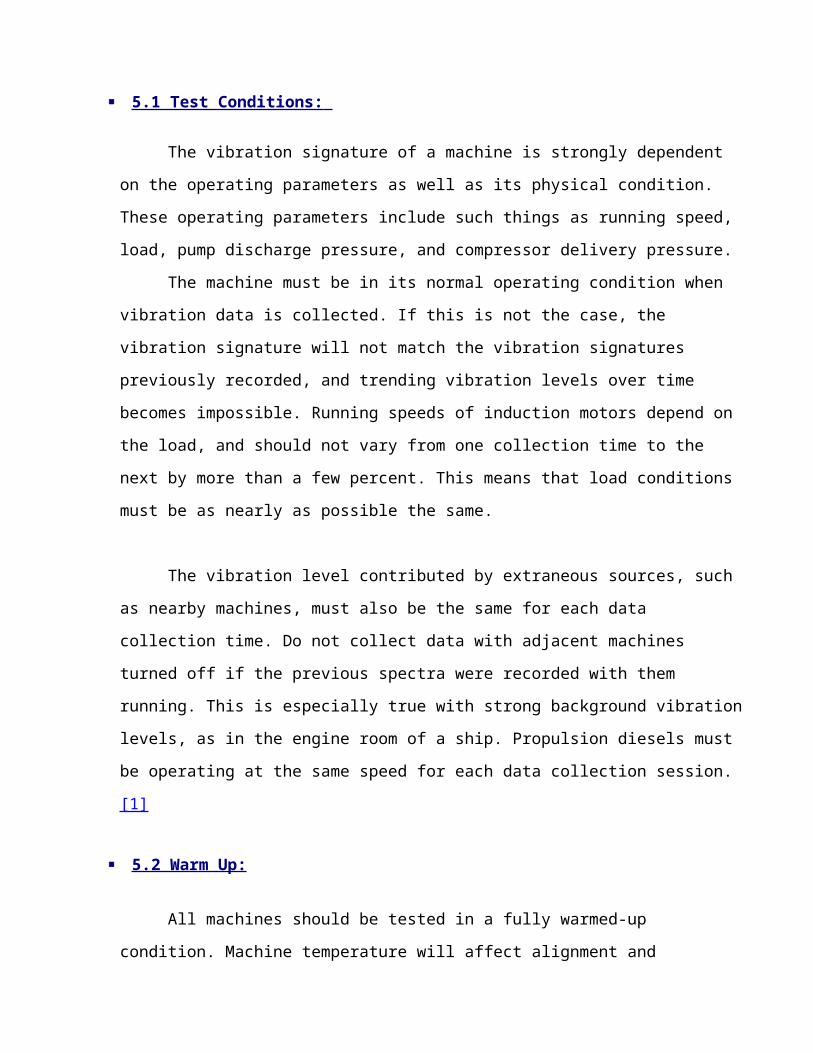
4.5 The Accelerometer:
When the accelerometer is moved in the up and down
direction, the force required to move the seismic mass is born by
the active element. According to Newton's second law, this force is proportional to the
acceleration of the mass. The force on the crystal produces the output signal, which is therefore
proportional to the acceleration of the transducer. Accelerometers are inherently extremely linear
in an amplitude sense, meaning they have a very large dynamic range. Accelerometers are the
most commonly used probe in vibrations analysis as its frequency rage is very wide, it is very
stable over long periods of time and will maintain good calibration if not abused. Excessive heat
and dropping accelerometers from height, even a few feet to a solid surface, can result in
damage.
5. Principals of Operation: 5.1 Test Conditions:
The vibration signature of a machine is strongly dependent on the operating parameters
as well as its physical condition. These operating parameters include such things as running
speed, load, pump discharge pressure, and compressor delivery pressure.
The machine must be in its normal operating condition when vibration data is collected.
If this is not the case, the vibration signature will not match the vibration signatures previously
recorded, and trending vibration levels over time becomes impossible. Running speeds of
induction motors depend on the load, and should not vary from one collection time to the next by
more than a few percent. This means that load conditions must be as nearly as possible the same.
The vibration level contributed by extraneous sources, such as nearby machines, must
also be the same for each data collection time. Do not collect data with adjacent machines turned
off if the previous spectra were recorded with them running. This is especially true with strong
background vibration levels, as in the engine room of a ship. Propulsion diesels must be
operating at the same speed for each data collection session. [1]
5.2 Warm Up:
All machines should be tested in a fully warmed-up condition. Machine temperature will
affect alignment and operating clearances due to thermal expansion. A cold machine will have a
different vibration signature than a warmed-up machine, sometimes extremely different. [1]
5.3 Machinery Testing schedule:
For a successful monitoring program, machinery measurements must be carried out on a
scheduled periodic basis. Most equipment should be tested monthly, with certain less important
machines on a 3-month schedule. Weekly testing is common for critical machines. In any case, it
is important to tailor measurement schedules to suit the machines and their condition. As
experience is gained, it will be easy to revise the testing schedule accordingly.
5.4 Trending of vibration data:
Trending is the storage of vibration signatures recorded at specific time intervals and
plotting the changes in vibration levels at the forcing frequencies vs. time. An upward trend in
level indicates a developing problem.
The simplest way to utilize the concept of vibration trending is to establish a
representative vibration spectrum of a normally operating machine as a reference, and compare
this reference to spectra measured at later times on the same machine.
The operating conditions of the machine when measuring the new vibration data must
match as closely as possible the conditions under which the reference spectrum was recorded.
Otherwise, the spectra will not be comparable and gross errors can be made.
The vibration data must be recorded in exactly the same way that the reference data were
measured. The transducer must be mounted in exactly the same location, and its calibration must
be accurate. If possible, the same transducer should be used for all successive measurements on
the machine.
When taking vibration data with an FFT analyzer, or data collector, it is important to
average several instantaneous spectra together to reduce random variations and the effects of
extraneous noise in the measured signal. The number of spectral averages recorded to produce
the spectra must be sufficient to produce a uniform and steady signature. Usually from six to ten
averages will do this, but on some machines with a relatively high random noise content in their
vibration signature, longer averaging times may be needed. A rule of thumb is to record a
spectrum with several averages and then immediately record another one with twice as many
averages. If the spectra are significantly different, the number of averages should be doubled
again and another spectrum recorded. If the latter two spectra are similar, then the previous
number of averages is adequate for this machine. [1]
5. Summary of Portable FFT Vibration Analyzers:
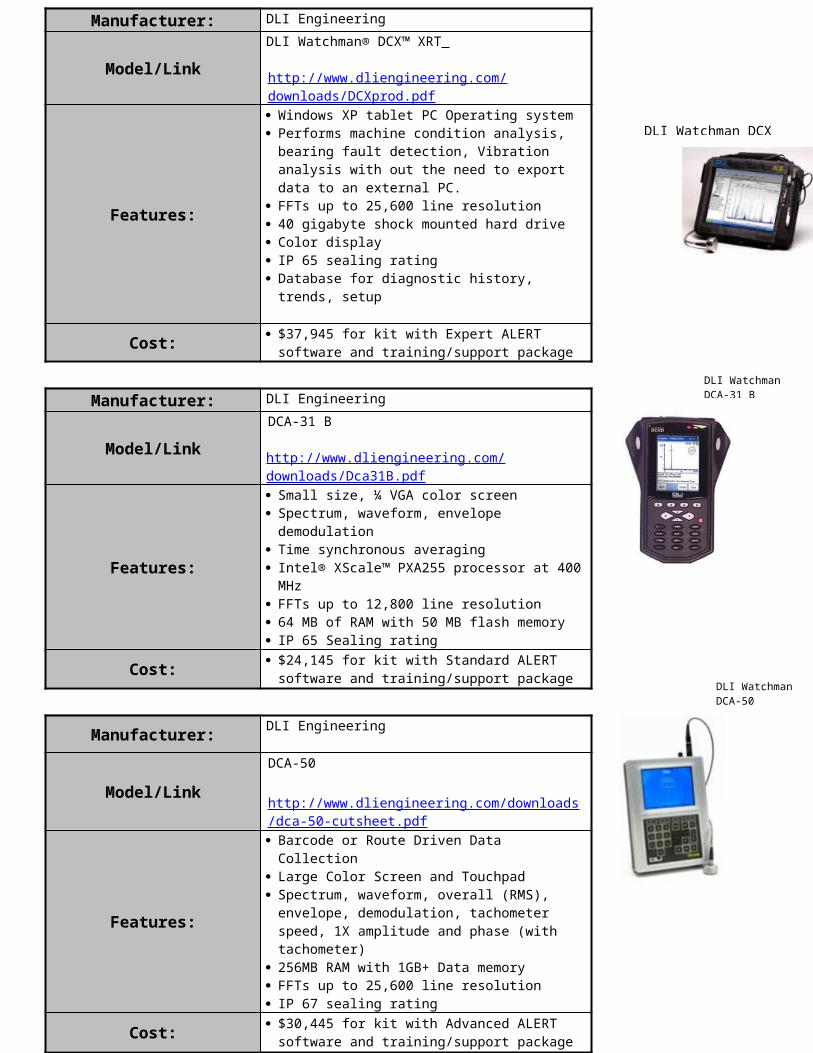
Manufacturer: DLI Engineering
Model/LinkDLI Watchman® DCX™ XRT
http://www.dliengineering.com/downloads/DCXprod.pdf
Features:
Windows XP tablet PC Operating system Performs machine condition analysis, bearing
fault detection, Vibration analysis with out the need to export data to an external PC.
FFTs up to 25,600 line resolution 40 gigabyte shock mounted hard drive Color display IP 65 sealing rating Database for diagnostic history, trends, setup
Cost: $37,945 for kit with Expert ALERT software and training/support package
Manufacturer: DLI Engineering
Model/LinkDCA-31 B
http://www.dliengineering.com/downloads/Dca31B.pdf
Features:
Small size, ¼ VGA color screen Spectrum, waveform, envelope demodulation Time synchronous averaging Intel® XScale™ PXA255 processor at 400
MHz FFTs up to 12,800 line resolution 64 MB of RAM with 50 MB flash memory IP 65 Sealing rating
Cost: $24,145 for kit with Standard ALERT software and training/support package
Manufacturer: DLI Engineering
Model/LinkDCA-50 http://www.dliengineering.com/downloads/dca-50-cutsheet.pdf
Features:
Barcode or Route Driven Data Collection Large Color Screen and Touchpad Spectrum, waveform, overall (RMS),
envelope, demodulation, tachometer speed, 1X amplitude and phase (with tachometer)
256MB RAM with 1GB+ Data memory FFTs up to 25,600 line resolution IP 67 sealing rating
Cost: $30,445 for kit with Advanced ALERT software and training/support package
DLI Watchman DCA-50
DLI Watchman DCX
DLI Watchman DCA-31 B
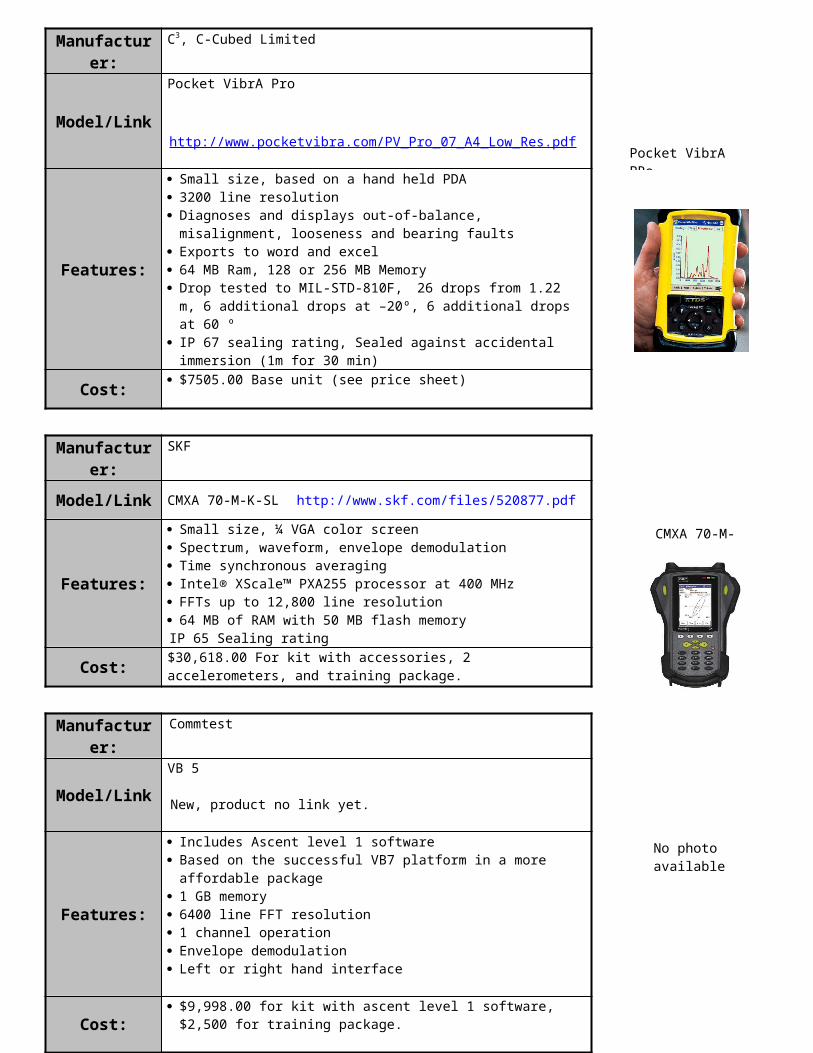
Manufacturer: C3, C-Cubed Limited
Model/LinkPocket VibrA Pro
http://www.pocketvibra.com/PV_Pro_07_A4_Low_Res.pdf
Features:
Small size, based on a hand held PDA 3200 line resolution Diagnoses and displays out-of-balance, misalignment,
looseness and bearing faults Exports to word and excel 64 MB Ram, 128 or 256 MB Memory Drop tested to MIL-STD-810F, 26 drops from 1.22 m, 6
additional drops at –20º, 6 additional drops at 60 º IP 67 sealing rating, Sealed against accidental immersion
(1m for 30 min)
Cost: $7505.00 Base unit (see price sheet)
Manufacturer: SKF
Model/Link CMXA 70-M-K-SL http://www.skf.com/files/520877.pdf
Features:
Small size, ¼ VGA color screen Spectrum, waveform, envelope demodulation Time synchronous averaging Intel® XScale™ PXA255 processor at 400 MHz FFTs up to 12,800 line resolution 64 MB of RAM with 50 MB flash memoryIP 65 Sealing rating
Cost:$30,618.00 For kit with accessories, 2 accelerometers, and training package.
Manufacturer: Commtest
Model/LinkVB 5
New, product no link yet.
Features:
Includes Ascent level 1 software Based on the successful VB7 platform in a more affordable
package 1 GB memory 6400 line FFT resolution 1 channel operation Envelope demodulation Left or right hand interface
Cost: $9,998.00 for kit with ascent level 1 software, $2,500 for
training package.
Pocket VibrA PRo
CMXA 70-M-
No photo available
Manufacturer: Commtest
Model/Link
VB 7
http://www.commtest.com/content/products/vbSeries/vb7.aspx
Features:
Includes Ascent level 2 software 1 GB memory 6400 line FFT resolution Support for acceleration, displacement, Velocity and current
sensors 2 channel operation Envelope demodulation Left or right hand interface Balancing feature
Cost: $19,999.00 with software, carrying case and
Manufacturer: Schenk Balancing and Diagnostic Systems
Model/LinkVIBROTEST 60 http://www.reliabilitydirect.com/vibrationmeterproducts/pdf/RDI_VB1000V.pdf
Features:
FFT-spectrum resolution with 12,800 lines 1 Hz – 20 kHz usable frequency range Compact flash card for expandable memory Optional balancing software PC software available Averaging function for noise and beat influence reduction
Cost: $12,27.00 for kit with basic software $22,471.00 for kit with XMS software (see attached price
list)
Manufacturer: Vibrations Consultants Inc.
Model/LinkMAX The Machine Expert http://www.vibcons.com/
Features:
4 channel data collection Based on a Table PC, 1.4 GHz processor Able to analyze signals on site without transferring to a PC 256 MB RAM, 40GB shock mounted hard drive IP 52 sealing rating, Shock resistant Vibration correction - balancing and alignment Large database support
Cost: $17,585 (base unit, see attached price sheet)
VB 7
VIBROTEST 60
MAX The Machine Expert
Manufacturer: SKF
Model/LinkMicroVibe-P http://www.monarchserver.com/SKF%20MicroVibe%20P.pdf
Features:
Vibration analyzer attachment that works with most PDA’s compact flash card.
Displays overall vibration, time-waveform and FFT spectra for detailed analysis.
Upload overall scalar data to PC for trending. Kit includes MicroVibe-P Module, accelerometer and cable,
batteries, magnetic base, stinger probe, earphones and carrying case (does not include PDA).
PDA must use Windows mobile OS to be compatible
Cost: $2850.00 For kit with out PDA (PDA average cost: $300-500)
Manufacturer: Datastick systems
Model/Link VSA-1225http://www.datastick.com/pdfs/VSA1214-5CDL.pdf
Features:
Uses and powers standard ICP-type piezoelectric accelerometers.
Attaches to Palm TX handheld computer, provides better screen resolution then the 1225.
Includes Datastick Spectrum handheld software and Datastick Reporting System PC software for analysis and trending.
Provides vibration waveforms and FFTs, as well as overall vibration with color-coded ISO (or custom) alert levels.
Extremely low noise floor.
Uses removable SD cards for memory storage, up to 2GB of data storage.
Cost: $6,997.00
Manufacturer: Datastick systems
Model/Link VSA-1225http://www.datastick.com/pdfs/VSA-1225-Med.pdf
Features:
Uses and powers standard ICP-type piezoelectric accelerometers.
Attaches to HP iPAQ hx2400-series and iPAQ hx2700-series handheld computers.
Includes Datastick Spectrum handheld software and Datastick Reporting System PC software for analysis and trending.
Provides vibration waveforms and FFTs, as well as overall vibration with color-coded ISO (or custom) alert levels.
Extremely low noise floor.
iPAQ hx2495 handheld stores up to 3000 individual signal captures, and SD memory cards provide up to 2GB of additional storage.
Cost: $7,297.00
MicroVibe-P
VSA-1225
VSA-1215
Model/LinkBallmac 211 vibration meter
http://www.balmacinc.com/pdfs/Mod211.pdf
Features: Simple operation Comes with stereo headphones/ electronic stethoscope. Displacement, velocity, and acceleration reading. Mils (pk-pk), In/sec (pk), g's (pk) 120 to 150,000 RPM
Cost: $1595.00
Manufacturer: SKF
Model/LinkSKF Vibration Pen CMVP 50
http://www.reliabilitydirectstore.com/CMVP-50-Vibration-Pen-Plus-Metric-p/skf-cmvp%2050-en.htm
Features:
Small size Measurement range of 0.7 to 55.0 mm/s (RMS) Measures overall vibration 10Hz to 1,000 Hz Displacement, velocity, and acceleration reading. Auto power off
Cost: $1,158.28
Manufacturer: Technikon
Model/LinkTechnekon STD-510 Vibration Data collector http://www.reliabilitydirectstore.com/Technekon-STD-510-Vibration-Data-Collector-p/tkn-std-510.htm
Features:
Single channel data collection 8 MB storage Built in FFT analysis Able to transfer data to a PC for analysis 3200 line resolution FFT Measures acceleration, velocity, displacement
Cost: $3,770.00 with carrying case
Technekon STD-510
SKF Vibration Pen CMVP
Balmac 211
6. Conclusion/Recommendations:
The products offered by DLI Engineering excel in terms of product features, software,
support and training. The DLI Watchman DCX offers the most features and options of all the
analyzers reviewed. It is based on a tablet PC and has the ability to trend, analyze and store all of
the collected data, this eliminates the need to transfer data to another computer for analysis.
Coupled with the company’s Expert Alert software this would be a powerful tool for condition
monitoring and DLI has, according to their website, placed a number of these units in marine
applications including the US Coast Guard and the US Navy. It is also the most expensive
analyzer reviewed, but the price includes 6 days of onsite training and familiarization.
A less expensive but equally capable alternative to the DCX is The Machine Expert
analyzer offered by Vibrations Consultants Inc. Like the DCX, The Machine Expert is based on
a tablet PC with a 40 GB hard drive and offers the same capability to perform on site analysis of
Vibration data. Although about half the price of the DCX it does not have software that is in the
same league, as quoted form their website: “Our Diagnostic Toolbox Software is a standalone,
hardware independent package that can assist you in diagnostics, frequency calculations and
training”. Also, the quoted price did not include training for the unit.
Moving into the large hand held units there were a number of good contenders. The DCA
50 from DLI Engineering offers a good compromise from the performance of the bigger tablet
PC based analyzers. It offers one of the best IP ratings for water resistance and impact protection
(IP 67), FFT resolution up to 25,600 lines, and expandable memory storage. The price includes
the companies Advanced Alert software and a 6 day training/support packaged.
The VB7 from Commtest is another good handheld Analyzer. It can be operated with either
the left or right hand, has 1GB of memory, and comes with excellent support software. The
software supplied with the unit, Ascent 2007, won the Plant Engineering award for best product
of the year.
The Vibrotest 60 from Schenk Balancing and Diagnostic System is a well rounded
analyzer. It offers a wide range of monitoring features and can be loaded up with different
modules depending on the type of monitoring to be done. The use of PC-cards allows the
operator to store data in a removable medium. This analyzer also comes with very good software
support.
The smaller FFT analyzers and PDA based FFT analyzers can perform much of the same
tasks of the larger purpose built analyzers and are much less expensive. Both the SKF
MicroVibe-P and the data Stick Systems VSA 1225 and VSA1215 are separate attachments for
PDA’s. This gives them the benefit of low cost and good performance, as the computing power
and memory of newer PDA’s actually exceeds that of the other larger analyzers. The software
included with the Micro Vib-P appears to be very minimalist; it allows data to be transferred to a
desktop PC but offers little in the way of data management and trending support. The software
supplied with the VSA 1225 is based on Excel and allows stored data to be easily transferred to a
PC for further analysis and trending.
The SKF CMXA 70-M-K-SL and the DLI DCA-31 B appear to be based same platform,
with the same key layout and processor. They both have good features such as a VGA color
screen, 400MHz processor, a good list of features, and removable memory cards (SD cards)
which are easy to find and can now store up to 4GB of data. Coupled to their small size and good
environmental rating (IP 65) they would be a good choice for a hand held analyzer. The SKF
CMXA 70-M-K-SL was listed for more then the DLI DCA-31 B but the SKF model included
more accessories and 2 sets of accelerometers, cables and magnetic bases. Both come with good
analysis software, which can transfer data to another PC and supports route based data collection
and trending.
Included in the review section were several overall vibration meters, while these are not
suitable for detailed analysis they were included since they are an economical means of detecting
problems in simple rotating machines. They cost a fraction of the dedicated FFT analyzers and
are very simple to operate, requiring very little training. It was suggested by a sales rep that used
to do condition monitoring in large plants and factories to use an overall vibration meter to take
regular measurements of rotation machinery and when a problem was detected a more advanced
FFT analyzer would be used to diagnose the machine. This allows less experienced personnel to
take data from more equipment and stretches the number of machines that can be monitored
effectively with one of the more expensive FFT analyzers.
The selection and purchase of an FFT analyzer should not be based on the performance of
the analyzers alone. Almost all of the higher end analyzers have similar features and capabilities
but what sets them apart significantly lies in the accompanying software and service/support
from the company. Also the cost of training should not be discounted from the price of a portable
analyzer. Most of the companies which supplied price quotes for this report recommended on
site training to familiarize users to their product and often included a price for training in the
supplied quote.

7. References:[1] http://www.dliengineering.com/vibman.htm
[2] http://www.dataq.com/support/documentation/pdf/article_pdfs/an11.pdf
[3] http://www.commtest.com/uploadGallery/pdfs/vb7_Reference_Guide_230108.pdf
9.Additional Links:
http://www.plant-maintenance.com/articles/ConMon21stCentury.shtml
http://www.vibrotek.com/article.php?article=articles/newgen/index.htm
http://en.wikipedia.org/wiki/Condition_monitoring
http://www.desmaint.com/
http://www.e-vibrationtesting.com/
http://ezinearticles.com/?Vibration-Analysis&id=278535
http://www.reliabilitydirectstore.com/Vibration-Meters-s/55.htm
http://www.ilearninteractive.com/
http://www.unitechinc.com/pdf/IntroductiontoTimeWaveformAnalysis.pdf
http://www.dataq.com/support/documentation/pdf/article_pdfs/an11.pdf
http://jet-server.commtest.co.nz/kb2/11692.htm
http://www.calright.com/_coreModules/common/categoryDetail.aspx?entityType=6&categoryID=69&gclid=CITgm6rZv5ECFQY3gwod6CNZSA