Embed Size (px)
Citation preview

JANUARY 2017 R: 16-09-A
REPORT
PUTTING YOUR MONEY WHERE YOUR METER ISA STUDY OF PAY-FOR-PERFORMANCE ENERGY EFFICIENCY PROGRAMS IN THE UNITED STATESPrepared for the Natural Resources Defense Council and Vermont Energy Investment Corporation

About NRDCThe Natural Resources Defense Council is an international nonprofit environmental organization with more than 2.4 million members and online activists. Since 1970, our lawyers, scientists, and other environmental specialists have worked to protect the world’s natural resources, public health, and the environment. NRDC has offices in New York City, Washington, D.C., Los Angeles, San Francisco, Chicago, Montana, and Beijing. Visit us at nrdc.org.
NRDC Acting Chief Communications Officer: Michelle EganNRDC Deputy Directors of Communications: Lisa Goffredi and Jenny PowersNRDC Senior Editor, Policy Publications: Mary Annaïse HeglarDesign and Production: www.suerossi.com
© Natural Resources Defense Council 2017
Primary Author:Julia SzinaiThe author conducted this study initially as part of the program of professional education at the Goldman School of Public Policy, University of California–Berkeley, and with the support of the Natural Resources Defense Council and Vermont Energy Investment Corporation.
Contributing Authors:Merrian Borgeson, Natural Resources Defense Council (NRDC)NRDC is a nonprofit organization that works to safeguard the earth—its people, its plants and animals, and the natural systems on which all life depends. NRDC combines the power of more than two million members and online activists with the expertise of some 500 scientists, lawyers, and policy advocates across the globe to ensure the rights of all people to the air, the water, and the wild.
Emily Levin, Vermont Energy Investment Corporation (VEIC)VEIC is a nonprofit organization dedicated to reducing the economic and environmental costs of energy use. Through its comprehensive energy efficiency utilities and implementation and consulting services, VEIC works with utilities, government agencies, and foundations in the design and delivery of energy efficiency and renewable energy services.
The judgments and conclusions of this report are those of the authors and are not necessarily endorsed by the Goldman School of Public Policy, the University of California, NRDC, or VEIC.
AcknowledgmentsThe authors would like to thank everyone who gave their feedback and time reviewing this report. Reviews do not indicate authorship or an endorsement of the report and its findings.
Reviewers included:Jennifer Amann, Rachel Cluett, Martin Kushler, Maggie Molina, and Steve Nadel, American Council for an Energy-Efficient Economy (ACEEE)Greg Baker, VEICSerj Berelson and Charlie Buck, OpowerJordana Cammarata, FirstFuelLeo Carrillo, Pacific Gas & ElectricSheryl Carter, NRDC Christina Swanson, NRDC Science CenterKate Desrochers, VEICTerry Egnor, EnergyRMAndy Frank, SealedMargie Gardner, California Energy Efficiency Industry CouncilMatt Golden, OpenEEmeterJessica Granderson and Charles Goldman, Lawrence Berkeley National LaboratoryDian Grueneich, Precourt Energy Efficiency Center, Stanford UniversityRob Harmon, MEETSBob Hinkle, MetrusBryan Landry, Southern California EdisonAndrew Meiman, ARC Alternatives

Page 3 PUTTING YOUR MONEY WHERE YOUR METER IS NRDC
Table of Contents
Acronyms .....................................................................................................................................................................5
Glossary of Key Terms ................................................................................................................................................ 6
Executive Summary .................................................................................................................................................... 8 Lessons Learned from Case Studies .............................................................................................................................................8
Basic Design Features ...............................................................................................................................................................8
How Performance Is Measured ................................................................................................................................................9
How Payment Is Determined ....................................................................................................................................................9
Risk Management of P4P Models ..................................................................................................................................................9
Policy Considerations for Regulators and Utilities .................................................................................................................... 10
Using P4P to Capture EE as a Grid Resource ........................................................................................................................ 10
Maintaining a DSM Portfolio That Reaches All Sectors and Savings Opportunities .......................................................... 10
Estimating Net Versus Gross Energy Savings ....................................................................................................................... 10
Engaging Private Markets to Scale EE ........................................................................................................................................ 10
Conclusion ....................................................................................................................................................................................11
1. Introduction ...........................................................................................................................................................12 Relevance of P4P to Current Energy Policy ............................................................................................................................... 12
Better Meter Data and Analytics May Streamline the Estimation of Energy Savings ......................................................... 12
Aggressive EE and Grid Goals in Some States May Require More Innovative Approaches ................................................ 13
Organization of This Report ....................................................................................................................................................... 14
2. What Is P4P and How Does It Compare with Other EE Approaches? .................................................................. 15 Common EE Savings Determination and Payment Approaches ................................................................................................ 15
Pay for Performance .................................................................................................................................................................... 16
3. Case Studies: Historical Context and Evolution of P4P ......................................................................................... 17 Historical Context: DSM Bidding and Standard Offer Programs .............................................................................................. 18
Demand-Side Management (DSM) Bidding Programs .......................................................................................................... 18
Standard Offer Programs ....................................................................................................................................................... 19
Evolution of P4P Since the 1990s .............................................................................................................................................. 20
P4P Approaches in Utility DSM Programs ........................................................................................................................... 20
EE Participation in Wholesale Capacity Markets .................................................................................................................22
Private Sector P4P Business Models .....................................................................................................................................22
4. P4P Program Taxonomy and Comparison of Case Study Design Features .......................................................... 23 Taxonomy of P4P Design Features and Evaluation Framework ................................................................................................23
Lessons on Key Design Features from Case Studies ..................................................................................................................24
Basic Design Features .............................................................................................................................................................24
How Performance Is Measured ..............................................................................................................................................27
How Payment Is Determined ..................................................................................................................................................30

Page 4 PUTTING YOUR MONEY WHERE YOUR METER IS NRDC
5. Policy Considerations for P4P Design .................................................................................................................. 33 Risk Management ........................................................................................................................................................................33
Customers ...............................................................................................................................................................................34
Implementers or Aggregators ................................................................................................................................................34
Utilities ...................................................................................................................................................................................34
Regulators/Utility Customers ................................................................................................................................................35
P4P Considerations for Regulators and Utilities .......................................................................................................................35
Using P4P to Capture EE as a Grid Resource ........................................................................................................................35
Maintaining a DSM Portfolio That Reaches All Sectors and Savings Opportunities ..........................................................36
Estimating Net Versus Gross Energy Savings .......................................................................................................................37
Engaging Private Markets to Scale EE ........................................................................................................................................37
Conclusion ...................................................................................................................................................................................38
Appendix 1: Case Studies .......................................................................................................................................... 40 Energy Service Companies (ESCOs)—Energy Service Performance Contracts ......................................................................40
Consolidated Edison Integrated Demand-Side Management Bidding Program ........................................................................ 41
New Jersey Public Service Electric & Gas Standard Offer Program .........................................................................................42
California Nonresidential Standard Performance Contract (1998–1999, 2000–2005) ...........................................................43
New York Energy Services Industry Program Standard Performance Contract— New York State Energy Research and Development Authority (NYSERDA) ......................................................................44
Texas Standard Offer Energy Efficiency Programs ....................................................................................................................45
Consolidated Edison—Targeted Demand-Side Management Program .....................................................................................46
University of California/California State University/Investor-Owned Utility Energy Efficiency Partnership Monitoring-Based Commissioning Program .....................................................................................................47
Independent System Operator—New England Forward Capacity Market ...............................................................................48
Opower Home Energy Report Behavioral EE Program .............................................................................................................49
Bonneville Power Administration Strategic Energy Management—Energy Smart Industrial Partnership ............................50
Metrus—Efficiency Services Agreements .................................................................................................................................. 51
New Jersey Commercial & Industrial P4P Program ..................................................................................................................52
Sealed—Managed Energy Services Agreements ........................................................................................................................53
Southern California Edison Local Capacity Requirement Request for Offers ..........................................................................53
Seattle City Light Commercial Pay for Performance Pilot Program .........................................................................................54
PG&E Commercial Whole-Building Pilot Program ....................................................................................................................55
Efficiency Vermont—Continuous Energy Improvement (CEI) Pilot Program ..........................................................................56
National Grid Pay for Performance Program .............................................................................................................................. 57
MEETS—Metered Energy Efficiency Transaction Structure ....................................................................................................58
PG&E Residential Pay for Performance Pilot Program .............................................................................................................59
Appendix 2: Works Cited .......................................................................................................................................... 60

Page 5 PUTTING YOUR MONEY WHERE YOUR METER IS NRDC
AC Air Conditioner AMI Advanced Metering InfrastructureAMR Advanced Meter ReadingASHRAE American Society of Heating, Refrigerating and Air-Conditioning EngineersBPA Bonneville Power AdministrationC&I Commercial and IndustrialCEI Continuous Energy Improvement CFL Compact Fluorescent LampsCPUC California Public Utilities CommissionDEER Database for Energy Efficiency Resources DR Demand ResponseDSM Demand-Side ManagementEE Energy EfficiencyEEU Energy Efficiency UtilityEMIS Energy Management Information SystemEMS Energy Management SystemEPA Environmental Protection AgencyESA Efficiency Services AgreementESCO Energy Services CompanyESPC Energy Service Performance Contract FCM Forward Capacity MarketHVAC Heating, Ventilation, and Air-ConditioningIPMVP International Performance Measurement and Verification ProtocolISO Independent System OperatorkW kilowattkWh kilowatt-hourLBNL Lawrence Berkeley National LaboratoryLED Light-Emitting DiodeM&V Measurement and VerificationMBCx Monitoring-Based CommissioningMEETS Metered Energy Efficiency Transaction Structure MESA Managed Energy Services AgreementMUSH Municipal, University, Schools, HospitalsMW megawattNRDC Natural Resources Defense CouncilNYSERDA New York State Energy Research and Development AuthorityP4P Pay for PerformancePACE Property Assessed Clean EnergyPG&E Pacific Gas and Electric CompanyPPA Power Purchase AgreementPSE&G Public Service Electric & Gas RCT Randomized Control TrialREV Reforming the Energy Vision RFO Request for OffersRFP Request for ProposalsRTO Regional Transmission OperatorSaaS Software as a ServiceSEM Strategic Energy ManagementSCE Southern California EdisonSCL Seattle City LightSDG&E San Diego Gas and ElectricSPC Standard Performance ContractUC/CSU/IOU University of California/California State University/Investor-Owned UtilityVEIC Vermont Energy Investment Corporation
Acronyms

Page 6 PUTTING YOUR MONEY WHERE YOUR METER IS NRDC
Glossary of Key Terms
Aggregator: Aggregators implement energy efficiency measures for a large group or portfolio of customers from a certain sector and sell the total savings to the program administrator.1 They could be loan providers, technology vendors, contractors, or other program implementers.1
Deemed savings: This is the amount of energy saved per unit, typically determined in advance of installation, based on prior field data collected from a sample of customers.2 These deemed (or stipulated) savings values are usually collected in a Technical Reference Manual overseen by a state utility regulator and periodically updated to reflect changes in building codes, technologies, or other factors.2 In order to calculate total energy savings from a deemed savings program, the number of units installed is verified and multiplied by the deemed savings amount per unit.3
Energy efficiency (EE) measure: An EE measure is any intervention implemented to lower the energy usage of a building.3 This can include installing a device (e.g., replacing an old air conditioner with a more efficient one), implementing a behavioral practice (e.g., pre-cooling a space or turning off lights in unoccupied spaces), or conducting an operational/retro-commissioning action (e.g., adjusting the controls and/or equipment of a building to operate more efficiently).2
Energy efficiency project: A project includes one or more EE measures implemented at a single building site to lower energy usage.3 A typical project is a building retrofit, which can include multiple measures such as installing efficient lighting, replacing appliances, adding insulation, etc.4
Energy efficiency program: An EE program encompasses a set of activities with similar characteristics and applications (e.g., providing rebates, educating customers) administered by an entity or set of organizations to promote the adoption of EE measures.2 Programs are usually defined by a particular mix of strategy, targeted customer segment, marketing approach, and type of measure.4
Energy efficiency or demand-side management (DSM) portfolio: An EE or DSM portfolio consists of the collection of EE programs administered by an organization, such as a utility.2,4
Energy Services Company (ESCO) or Energy Efficiency Services Provider: ESCOs are companies that contract with private or public-sector energy users to provide EE retrofits.� Performance contracting, in which an ESCO guarantees energy and/or dollar savings for a project, is a core part of the ESCO business.6
Evaluation, Measurement & Verification (EM&V): This phrase encompasses a set of processes to determine project and/or program energy savings impacts.4 The measurement and verification steps are often referred to jointly as M&V. The definitions below describe the three processes in the order in which they are typically conducted.
n Measurement: This step estimates the amount of energy and/or demand savings resulting from the implementation of an EE measure. There are several common methods of estimating savings, involving a combination of physical measurements, engineering calculations, statistical analysis, and/or computer simulation of buildings. Because EE savings are the difference between actual usage and a counterfactual baseline, “measured” savings are actually all estimations, with varying levels of confidence around the prediction.2
n Verification: Program staff or third parties verify (often with on-site field inspection) that EE measures have been implemented and are operating properly.2 This may entail counting the number of measures that have been implemented.
n Evaluation: After a given program or portfolio is completed, evaluations analyze its performance and operation, including total energy savings relative to predictions, impact on markets, and cost effectiveness.2
Implementer: In some programs or EE models, a program administrator contracts out the operation of a program to an external organization that conducts tasks such as marketing, technical and financial assistance, and EE project implementation.2
International Performance Measurement and Verification Protocol (IPMVP): Among several building industry guidelines on energy savings, the most well-known is the IPMVP. First published in 1996, it provides best practices for four different ways of estimating savings for individual projects:7
n Option A: Estimates savings for an individual EE measure using engineering calculations (customized and calculated for specific projects). Only the key parameter(s) are measured through short-term or continuous measurement.8 The remaining inputs to the calculations are primarily stipulated values (based on manufacturer specifications, historical data, or engineering judgment) rather than measurements; therefore Option A is often likened to deemed estimates.

Page 7 PUTTING YOUR MONEY WHERE YOUR METER IS NRDC
Glossary of Key Terms (cont.)
n Option B: Estimates savings for an individual EE measure using engineering calculations (customized and calculated for specific projects). This option measures all of the relevant parameters of system energy use on either a short-term or continuous basis.8
n Option C: Estimates whole-building energy savings using whole-building meter or bill data or submetered data. This option uses either simple comparison or mathematical modeling, such as regression analysis, of pre- and post- intervention energy use to estimate the energy savings.8 Continuous measurements are required. Data are normalized for routine adjustments (such as weather), and nonroutine adjustments (such as occupancy changes) are made as required.8
n Option D: Estimates whole-building savings (though it can also isolate a subfacility EE measure).8 A building simulation model is calibrated with hourly or monthly utility bill and/or interval meter data to predict energy usage after an intervention.7
Normalization: In order to isolate the effect of an EE project when comparing a site’s pre- and post-intervention energy usage, normalization removes the effect of common variables on the two sets of data.9 For example, outdoor air temperature is a common variable affecting the energy consumption of heating and cooling end uses. The most basic savings estimates normalize, usually with regression analysis, the pre- and post- implementation meter data for weather differences during those periods. Some programs also normalize for other factors such as occupancy levels and hours of operation.
Net energy savings versus gross energy savings: Energy savings can often occur for reasons other than the presence of an EE program (e.g., some people may have bought more-efficient appliances even without an EE program incentive; the size of a household may shrink, causing energy usage to decrease).2 Net savings are energy savings attributable only to the EE program. Net energy savings calculations subtract these estimated “naturally occurring” savings and remove the effect of “free riders” who benefit from program incentives but whose actions are not attributable to the program. Net savings also try to account for “spillover effects” which are savings from nonparticipants who lower their energy usage but do not receive incentives from the program.2 Program evaluators typically estimate the net versus gross savings with customer surveys or statistical experiments to understand what savings would have occurred without the effect of the EE program.2
Program administrator: A program administrator manages an EE program and may also manage a portfolio of several EE programs.2 The program administrator could be a utility, or it could be a third-party entity such as a nonprofit or private sector organization.2

Page 8 PUTTING YOUR MONEY WHERE YOUR METER IS NRDC
Decreasing energy consumption by making buildings more energy efficient can avoid the construction of new power plants, reduce grid infrastructure costs, and lower carbon emissions—in addition to saving customers money on their energy bills. Most leading states offer energy efficiency (EE) programs that encourage lower energy usage to achieve these significant public benefits. Many of these programs provide customers an incentive payment for installing energy-efficient equipment (a type of EE measure), estimating (or “deeming”) future savings on the basis of detailed technical analyses and the results of efficiency evaluations. This approach has served efficiency programs well for years—and in many sectors will continue to play a vital role in the future. However, the need to further ramp up EE to avoid greenhouse gas emissions from energy generation, along with an interest in better use of digital energy meter data and analytics to encourage efficiency, has led policymakers in states like California and New York to consider expanding the use of pay-for-performance, or P4P, EE programs. P4P programs reward energy savings on an ongoing basis as the savings occur, often by examining data from a building’s energy meters, rather than providing up-front payments to fund energy-saving measures. Pay for performance has been suggested to be, and is examined in this report, a way to increase those savings, and their persistence over time, while stimulating innovation in the efficiency programs that help deliver them.
The concept of P4P is not new—EE programs based on pay-for-performance have existed in different forms for more than 25 years across the country. However, with the converging effects of policy reforms and data advancements, there is a need to understand P4P model components, the history of P4P, the potential pros and cons of these efforts, and ways in these approaches might contribute to energy savings overall. This report collects experiences from past and current P4P examples—implemented across the United States and using a spectrum of energy savings estimation methods, payment structures, and other factors—to inform policymakers and advocates as they design and enable new EE efforts. After first outlining the history and evolution of P4P, the report constructs a taxonomy of key P4P features and uses the framework to analyze a set of 22 case studies. Last, the report addresses risk management, private-sector business models, and other policy considerations of P4P approaches relative to more traditional EE programs.
LESSONS LEARNED FROM CASE STUDIES
BASIC DESIGN FEATURESn Overall motivation for the P4P examples falls into five
general areas: meeting EE or broader demand-side management (DSM) goals for energy savings, using EE as a resource on the grid, financing EE investments using cash flow from the energy savings, targeting specific sectors for EE savings, and developing an EE services market. Each of these motivations drives subsequent program design choices, mainly regarding eligible customer segments, targeted measures, and savings estimation methodology.
Executive Summary
n The targeted customer segment is one of the biggest drivers of P4P program design. Historically and to this day, few utility customer–funded P4P programs have been open to residential users. Many private-sector P4P efforts, such as ESCO performance contracts and newer financing and performance-sharing agreements, also focus almost exclusively on large commercial, industrial, or institutional customers.
n Early utility-based P4P programs targeted individual EE measures, and most of the savings came from lighting. Several of the newer P4P examples are aiming for whole-building EE improvements by focusing on comprehensive, multi-measure projects. P4P programs for retro-commissioning, operational improvements, and behavioral change, where it is difficult to deem savings in advance, can also achieve significant savings through “non-widget” EE improvements.
n P4P features explicitly designed to accomplish deeper savings, such as tiered incentive payments for different savings levels or higher-saving measures, minimum saving level requirements, or requirements for multi-measure projects, are key to success. Without such features, efforts are less likely to achieve savings beyond the lowest-hanging fruit—the easiest-to-obtain savings.
n Program goals and eligible measures are key determinants of the type of savings rewarded. Most P4P program examples incentivize energy (kilowatt-hour and therm) savings. P4P may not be appropriate for EE measures that require a switch from an unmetered fuel to electricity, as overall energy savings cannot be readily quantified.

Page 9 PUTTING YOUR MONEY WHERE YOUR METER IS NRDC
HOW PERFORMANCE IS MEASUREDn Seven of the case studies in this report use some sort of
normalized meter data or billing data collected before and after implementation to estimate savings. Other cases use a wide range of other savings estimation methods, including deemed savings calculations, building simulations, and engineering calculations with direct device measurement.
n Smart meter data with analytics may offer opportunities to lower measurement and verification (M&V) costs by estimating savings in a more automated and less intrusive way. Automated M&V currently is only in the pilot phase, but if P4P models do use the results of such a M&V process, program administrators, implementers, regulators, and customers must agree in advance on the data required and any methodology of data cleaning and analysis.
n Even with the best available models and data, some buildings are too variable in their energy usage to establish a well-fitting baseline estimate with smart meter data. As a result, a P4P program that employs a normalized metering approach can screen out less predictable buildings, include a backup methodology such as a building simulation, or estimate savings across a portfolio of many buildings.
n In choosing a methodology to estimate savings from a P4P model, administrators must consider their tolerance for uncertainty and the magnitude of savings expected from the program, as well as the number of buildings included in the portfolio if the savings are aggregated (underestimated buildings can cancel out overestimated ones).
n The level and quality of data required for measurement depend on the chosen measurement methodology. Especially with normalized meter data analysis, program administrators must decide on open-source statistical models and/or proprietary models to conduct savings estimation.
HOW PAYMENT IS DETERMINEDn Most of the utility customer–funded P4P programs attach
payments partially to certain milestones and partially to energy savings performance. Some models have extra payments for deeper savings, non-lighting measures, demand reductions, or net savings versus gross savings.
n Across the case studies, the duration of performance periods or contract periods varies widely, from as short as 1 year to as long as 20 to 25 years. More commonly, performance periods are around 3 years long.
n In general, aggregating savings estimates across a large sample size of buildings and customers can improve the certainty of overall savings because underestimated buildings can cancel out the overestimated ones.
RISK MANAGEMENT OF P4P MODELSPredictability and certainty of energy savings drive the participation and investment decisions for many EE stakeholders. Compared with a typical up-front rebate program based on deemed savings, P4P can fundamentally shift the risks of EE performance for all entities involved: participants, utilities, implementers/aggregators, and regulators (representing broad customer interests). A primary difference between P4P and other program types is that the performance risk is more directly borne by the entity responsible for installing and maintaining the energy-savings measures (rather than the utility or another program administrator).
Certain program elements can be incorporated to manage the risks of P4P relative to traditional programs while incentivizing higher savings from projects:
n Pairing payments for installation milestones with performance-based incentives can alleviate some of the up-front financial burden of EE measures for aggregators and customers. For example, some P4P programs provide a partial incentive once the measures are installed, and then additional payments once the savings are measured over time. Aggregators can also pass along a small up-front payment to customers to help with the initial EE investment, or the project can be financed on the basis of the stream of payments expected from the project.
n Shorter performance periods can lower risk for implementers, although there is a trade-off in the ability to maintain savings persistence over the longer lifetimes of high-saving measures.
n Insurance coverage, quality assurance standards, and a diversified portfolio of buildings can also help mitigate performance risk.
n Rapid feedback on savings numbers through seasonal or monthly reports from meter data can indicate the trajectory of savings and signal whether implementers/aggregators or utilities need to procure more EE.
n Screening for predictable buildings and paying incentives for portfolio-level savings can increase the certainty of savings estimates and lower the risk of not meeting targets.
n Requirements for a minimum level of savings or incentives to pursue more comprehensive projects can help prevent “cream skimming,” when only measures that are easy to achieve are targeted.
n Standardized performance metrics to verify and compare savings estimation models will help make savings calculations more transparent and auditable, especially when comparing proprietary and public software.

Page 10 PUTTING YOUR MONEY WHERE YOUR METER IS NRDC
POLICY CONSIDERATIONS FOR REGULATORS AND UTILITIES
USING P4P TO CAPTURE EE AS A GRID RESOURCEWhen customers save energy during the grid’s critical times, especially in constrained locations, EE can serve as a system capacity resource and/or defer distribution system infrastructure upgrades. If energy savings from a utility customer–funded P4P program are to be used as a grid resource, one important consideration in program design is whether P4P will be incorporated as part of the utility’s DSM portfolio (alongside other EE programs) or outside of it (competing against supply resources or at the distribution level). Because there are potential pitfalls when operating multiple models side by side (e.g., soliciting bids from ESCOs via competitive solicitation while also allowing them to access incentives through a DSM program), it is preferable to make this decision up front.
MAINTAINING A DSM PORTFOLIO THAT REACHES ALL SECTORS AND SAVINGS OPPORTUNITIESA key utility challenge when adopting a P4P approach is maintaining a broad DSM portfolio that addresses the full range of EE sectors and savings opportunities. Some types of customers, such as low-income customers and small businesses, will tend to be underrepresented in P4P programs because they have lower potential for energy savings and the savings usually cost more to obtain. P4P programs run the risk of cream-skimming, unless they are carefully designed to go after a full range of savings opportunities (lighting, HVAC, controls, etc.). Comprehensive packages of multiple EE measures—including commissioning, operational, and behavioral measures—should be encouraged. P4P will likely not be able to replace EE programs that focus on market transformation or work with manufacturers, distributors, and retailers (upstream/midstream programs). Given the challenges in using P4P to address some sectors and program types, many utilities will likely choose to maintain some traditional DSM programs alongside a P4P program. To avoid double-counting savings—and to keep participants from double-dipping incentives—utilities and regulators will also need to track which customers have received which payments from which program, and where savings are counted.
ESTIMATING NET VERSUS GROSS ENERGY SAVINGS Utilities will still face net versus gross savings challenges even if programs shift to P4P:
n If administrators want to target net savings directly through program design, P4P programs aimed at underserved customers or using comparison groups can help ensure the incrementality of savings from the start, although this may be difficult to do in practice.
n Unless some of the non-program-related factors are controlled for, additional net-to-gross surveys or experimental studies may be needed to isolate program-specific impacts.
ENGAGING PRIVATE MARKETS TO SCALE EEIn addition to obtaining energy and demand savings, P4P models can potentially facilitate a private market of EE program implementers or aggregators who compete to deliver EE. They can also attract private capital to finance improvements. Private investors and companies may have more flexibility and agility to try new, creative models and may be willing to assume performance risk if performance is measured by delivery of savings across multiple buildings or customers or if risk is hedged with some other mechanism. If P4P programs are open-ended enough so that utilities simply pay private third-party implementers by unit of savings, third parties can experiment with business model designs. However, there is no guarantee that competing private actors will be more effective than a central administrator at delivering cost-effective energy savings or overcoming program barriers. Policymakers and regulators will need to experiment to figure out what works in each region and for each market sector.
Key design considerations for regulators and utilities interested in engaging the private market through P4P approaches to EE include:
n Standardized M&V methods. Development of standardized M&V methods is a critical step in allowing a competitive market for EE to flourish. M&V standards can reduce costs for aggregators and other implementers and ensure that EE savings are being counted consistently and transparently by all parties involved. P4P pilots can incorporate side-by-side testing to compare the accuracy of energy savings from automated M&V with savings based on deemed and modeled methods.
n Data access. Aggregators and other service providers will need access to customer utility data in consistent, machine-readable formats, similar to the access available through the Green Button and Connect My Data tools, once the customer authorizes such access.
n Market access and fairness. It is important to ensure that procurement processes are transparent and that procurements are conducted often enough to allow new market actors to participate. Fairness is also a key concern as utilities both administer competitive procurements and continue to implement EE programs.
It is also worth noting that there are ways to promote innovation in EE program delivery other than turning service delivery over to the private market. It is possible to give utilities and other EE program administrators the flexibility to continually improve programs, adjust portfolios based on evolving goals or market needs, and pilot innovative approaches.

Page 11 PUTTING YOUR MONEY WHERE YOUR METER IS NRDC
CONCLUSIONP4P is not a panacea, but is a promising tool that can achieve savings. As demonstrated by the large variations across program elements in the case studies of this report, P4P may not be appropriate in all circumstances. P4P has been most tested in the commercial sector, where large customers and high savings potential make more complex M&V (as compared with deemed savings) worthwhile for implementers. Most of the historical programs have also been widget-focused, achieving savings primarily from lighting measures, but more recent programs and several current pilots are trying a whole-building approach. Comprehensive whole-building programs can achieve higher savings levels and lend themselves to a meter-based measurement approach. With smart meter data, whole-building measurement—automated or semiautomated—may lower costs and make M&V for P4P more cost-effective for other sectors, such as residential and low-income.
Though P4P is not a substitute for all traditional EE programs, a “second-generation” P4P effort, incorporating certain features described above, may be a promising way to achieve larger-scale savings, attract additional investment, and encourage new business models. However, based on a review of the case studies, more experimentation will be required to better assess the relative performance of different approaches, because it is not yet clear from the data collected whether P4P models will be able to achieve more savings than traditional programs or to achieve improved cost effectiveness. It is likely that multiple types of EE models will continue to be needed to capture the range of possible savings across market segments.

Page 12 PUTTING YOUR MONEY WHERE YOUR METER IS NRDC
Approximately 40 percent of the total energy used in the United States was consumed in residential and commercial buildings in 2015.10 Decreasing energy consumption by making buildings more energy efficient can avoid the construction of new power plants, reduce grid infrastructure costs, and lower carbon emissions—in addition to saving customers money on their energy bills.11 Utilities across the United States offer energy efficiency (EE) programs that encourage lower energy usage to achieve these significant public benefits.2 Many of these programs provide customers an incentive payment for installing energy-efficient equipment (a type of EE measure), which helps defray some of the initial hardware and installation cost.12 The payment is based on the EE measure’s anticipated level of energy savings, usually predicted from some combination of engineering estimates, measurements, and sampling from different customers or time periods. Once a customer receives the one-time payment, however, it is difficult for program administrators to motivate and closely track sustained energy savings over the long term. Additionally, engineering calculations of savings (often used as the basis of up-front incentives for complicated projects) may over- or underestimate savings that actually occur, in some cases because they do not account for interactions between EE measures or because EE measures were not installed, operated, or maintained as expected.13
While there is a spectrum of approaches, a “pay for performance” (P4P) model usually differs from these traditional EE programs in its combination of dynamic payment and savings estimation mechanisms (although some traditional programs do integrate P4P elements). This report uses the term P4P to generally mean an EE approach in which payments are awarded for energy savings, indicating the EE project’s performance, on an ongoing basis as the savings occur. Some P4P program strategies focus on compensating customers directly for their savings performance, and others instead pay an aggregating entity for the performance of a set of buildings whose savings are delivered together. Many, but not all, approaches evaluate savings using some form of meter data or utility bill data collected before and after an EE intervention. Most models pay for savings in installments, in order to motivate persistent savings during, and possibly beyond, a set period after the implementation of an EE measure. Because the majority of these P4P payments are awarded only on the basis of an EE project’s actual performance, these models are intended to lower the risk of paying up front for energy savings that do not later materialize.
The concept of P4P is not new—EE programs based on pay for performance have existed in different forms for more than 25 years across the country—but the converging effects of policy reforms and data advancements are stirring interest in updated P4P approaches as a way to meet EE, climate, and grid goals. With this resurgence, there is a need to understand P4P model components, the history of P4P, the potential pros and cons of these efforts, and how these approaches might contribute to energy savings overall.
This report collects experiences from past and current P4P examples—implemented across the United States and using a range of energy savings estimation methods, payment structures, and other factors—to inform policymakers and advocates as they design and enable new EE efforts. After first outlining the history and evolution of P4P, the report constructs a taxonomy of key P4P features and uses the framework to analyze a set of 22 case studies. Last, the report addresses risk management, private sector business models, and other policy considerations of P4P approaches relative to more traditional EE programs.
RELEVANCE OF P4P TO CURRENT ENERGY POLICYThe concurrence of several factors makes a discussion of P4P EE efforts especially timely. New tools (widespread digital meter data and analytics) and new goals (primarily state legislation in California and initiatives in New York) have generated greater interest in ensuring that savings are real and persistent, so that EE can contribute to ambitious climate goals and a resilient electric grid.
BETTER METER DATA AND ANALYTICS MAY STREAMLINE THE ESTIMATION OF ENERGY SAVINGS With all EE interventions, energy savings can never be directly measured because savings (sometimes referred to as “negawatts,” as opposed to generated megawatts of electricity) are the difference between how much energy is actually used and how much would have been used, but for the intervention. All energy savings rely in large part on the accuracy of this counterfactual or “baseline” approximation, yet it is impossible to establish this baseline with complete confidence, and therefore all energy savings remain estimates. Figure 1, following, illustrates one of the methods (consistent with the International Performance Measurement & Verification Protocol described in the Glossary of Key Terms) used in P4P models to estimate savings for individual buildings: Energy savings are equal to a projected baseline minus the actual metered usage in the reporting period, with adjustments to account for factors that are unrelated to the EE intervention but that affect energy usage (such as weather or building occupancy).
Introduction

Page 13 PUTTING YOUR MONEY WHERE YOUR METER IS NRDC
To date, of the P4P examples that have used meter data to estimate savings for individual buildings with this method, most have relied on monthly meter/billing data, which in many cases is sufficient to run a P4P program. However, higher-resolution meter data is now more prevalent across much of the country—thanks to an electricity sector–wide move to a “smart grid” with increased information and controls—and this may create opportunities for new P4P programs. About two-thirds of large commercial and industrial customers have some form of a digital meter—either Advanced meter reading (AMR), which usually communicates one-way from the customer to the utility, or two-way communicating Advanced metering infrastructure (AMI), also called smart meters.14 In the past 10 years, more than 50 million smart meters, have been installed in more than 40 percent of all homes across the United States.2 Smart meters typically record electric usage in 15-minute or hourly intervals. In contrast, conventional analog meters must be read manually by a meter reader and usually provide only monthly-level usage information. While smart meters were deployed primarily for other reasons (including improved utility outage management, increased visibility into grid operations, and the implementation of more dynamic tariffs), they also enable a more data-driven approach to EE. AMI allows utilities and analytics companies to remotely analyze trends in customers’ daily energy usage in a way that was not possible with previous meter technology. In addition to smart meters, more devices such as smart thermostats are connected to the Internet and to other machines, which enables automated analysis and visibility into the energy usage patterns of customers.2
The challenges of accurately estimating energy savings will certainly not go away by using smart meter data in a P4P approach, and there may be new issues of handling the storage, security, and analysis of a large volume of high-resolution data.15 However, the availability of more data combined with advancements in analytics can potentially streamline the calculation of baseline estimates and lower the cost of savings measurement and verification (M&V), especially for EE projects with multiple measures.2,16 The increased use of data from higher-resolution smart meters enables statistical models to produce savings estimates that are potentially more accurate than those based on monthly data, and also makes it possible to detect smaller levels of savings with greater certainty.17
AGGRESSIVE EE AND GRID GOALS IN SOME STATES MAY REQUIRE MORE INNOVATIVE APPROACHESAlongside the widespread rollout of smart meters, recent policies in several states have emphasized more aggressive EE deployment to either meet climate goals or serve as a grid resource.
California: In 2015, California passed legislation (SB 350) mandating a doubling of EE savings—with an emphasis on “metered savings” and explicit mention of P4P programs—as part of a suite of ambitious climate policies to cut greenhouse gas emissions. The required twofold increase in energy savings by 2030 relative to 2014 levels comes out to approximately 89,000 GWh of electricity and 1,300 million therms of natural gas saved.18 Based on projections of energy demand, this amount of EE means that 2030 electricity usage should be about 10 percent lower than the state’s usage in 2014.19,20
FIGURE 1: ENERGY CONSUMPTION BEFORE, DURING, AND AFTER A PROJECT IS IMPLEMENTED (STATE AND LOCAL ENERGY EFFICIENCY ACTION NETWORK 2010)
State and Local Energy efficiency Action Network. 2012. Energy Efficiency Program Impact Evaluation Guide. Prepared by Steven R. Schiller, Schiller Consul ting, Inc., www.seeac on.energy.gov.

Page 14 PUTTING YOUR MONEY WHERE YOUR METER IS NRDC
A companion law (AB 802) encourages the state to better capture savings available in existing buildings and, where possible, to adopt EE programs that tie incentive payments to performance measured at the meter. The law enables EE programs to bring existing California buildings up to and above the current state building efficiency codes and standards.21 It also better allows the state to reduce energy use through operational and behavioral improvements in addition to physical retrofits—with an emphasis on using metered energy use to estimate savings where possible.21
While California’s building codes, appliance standards, and EE programs have collectively saved about $90 billion on customer energy bills in the past 40 years—and lowered energy demand enough to avoid building at least 30 large power plants—the state needs to significantly ramp up efforts to produce the savings required by these laws.11 Without innovation in the EE sector, the state is unlikely to meet the doubling goal.
New York: In New York, through its Reforming the Energy Vision (REV) initiative, regulators are exploring the role of distributed energy resources in the electric grid.22 The industry reform goals are to empower customers to better manage their energy consumption and to stimulate the distributed energy resources market in order to increase the system’s efficiency, lower environmental impacts, and increase affordability.23 Electric system operators plan to use EE as part of a distributed resource portfolio to defer distribution system upgrades, along with other benefits. Accurate, predictable, and persistent energy savings can help EE serve as a grid resource to manage local reliability and reduce system costs, and P4P approaches may be one mechanism to deliver savings to meet these goals.
Individual P4P pilots and full-scale programs (not necessarily driven by statewide policy) are also in place in other regions and states, including the Pacific Northwest, New England, New Jersey, and Texas.
ORGANIZATION OF THIS REPORTThe report is organized as follows:
Background n Description of common existing utility EE models, and
comparison with a P4P approach
History and Evolution of P4P n Historical context and the evolution of P4P since the
1980s, using case study examples
P4P Taxonomy and Lessons from Case Studies n Taxonomy of P4P design features, and analysis of trends
and lessons from the case studies
Discussion of Policy Considerations and Conclusion n Risk management, other policy considerations, and
recommendations for future P4P programs

Page 15 PUTTING YOUR MONEY WHERE YOUR METER IS NRDC
COMMON EE SAVINGS DETERMINATION AND PAYMENT APPROACHES Many EE programs provide customers or implementers one-time, initial incentive payments for implementing efficiency measures, based on the expectation of a certain amount of energy savings from that measure over its effective useful lifetime. Deemed savings, custom savings, and savings based on comparison groups are three examples of how these utility customer–funded programs estimate and incentivize EE savings outcomes.
Deemed Savings Programs: Some of the most common utility EE programs (especially for the residential sector) pay customers incentives to lower the initial costs of implementing an EE measure, such as installing efficient lighting. Incentives can be applied “downstream,” as rebates paid to an end-use customer, or “midstream” via retailers and distributors. For most of these programs, the expected amount of energy saved over each measure’s lifetime is calculated, or “deemed,” in advance, based on field data collected from a sample of customers.2 These deemed values are usually collected in a technical reference manual (TRM) overseen by a state utility regulator and periodically updated to reflect changes in building codes, higher equipment standards, technology advancements, or other factors.3 In order to calculate total energy savings from a program with deemed savings, the number of units installed needs to be verified after installation and multiplied by deemed savings per unit.
Custom Savings Programs: For more complicated projects (often for large commercial or industrial buildings with complex measures), some programs calculate and pay for energy savings specific to the project, rather than
using standardized deemed savings and rebate values.2 Total incentive amounts are customized to the project and the customer, usually based on a set $/unit savings multiplied by the estimated potential or measured energy savings of the site. In many states, these programs use one of the IPMVP options (as described in the Glossary) to calculate project-level savings and award incentives after an inspection verifying that the EE measures have been installed. Some programs use an IPMVP method to estimate savings for a sample of participating projects and extrapolate the results to the whole program.15
Programs Basing Savings on Comparison Groups: This savings estimation approach is often used for Home Energy Report (HER) programs and other behavior programs that expose different groups of customers to varying levels of educational messaging to encourage them to save energy. For example, comparison groups can be used for statistical experiments such as randomized control trials (RCT) or randomized encouragement designs to evaluate the effect of energy conservation messaging on a treatment population, relative to a control group who did not receive the messages. This option measures savings from behavioral changes across a large population, rather than from EE retrofit measures installed project by project. To date, software as a service (SaaS) companies like Opower, which provide a platform for these behavioral experiments, have usually been paid up front based on the number of participating households and not on savings achieved.24
Figure 2 summarizes the EE savings estimation methodologies from these common programs.3 Deemed savings are calculated by unit, measurement and verification (M&V) of savings for custom programs are usually conducted project by project, and comparison group savings
What Is P4P and How Does It Compare with Other EE Approaches?
TYPE
SCALE
METHOD
DEEMED SAVINGS BY UNIT
PRE-CALCULATED SAVINGS OPTION A OPTION B OPTION C OPTION D
COMPARISON GROUPS BY POPULATION
STATISTICAL EXPERIMENT
PROJECT-BASED MEASUREMENT AND VERIFICATION OF SAVINGS
INDIVIDUAL MEASURE SAVINGS WHOLE BUILDING SAVINGS
FIGURE 2: COMMON SAVINGS ESTIMATION METHODOLOGIES BY TYPE, SCALE, AND CALCULATION METHOD

Page 16 PUTTING YOUR MONEY WHERE YOUR METER IS NRDC
are estimated at the population level. Deemed savings and some of the M&V measurements (IPMVP Option A and B) are conducted for individual EE measures (e.g., a lightbulb or air conditioner), and other M&V options (IPMVP Option C and D) and comparison groups with statistical experiments all estimate whole-building savings.
These approaches have served efficiency programs well for years—and in many sectors, will continue to play a vital role in the future. However, several challenges come with both the savings estimation and payment structures of these common EE programs, especially those with one-time rebates based on deemed savings. First, once the rebate is awarded up front, it is difficult to motivate and closely track sustained performance (persistence of savings over time), and the verification of savings after the fact can be expensive and time consuming. Second, pre-calculated deemed savings values require well-defined, simple, and consistent EE measures and conditions. Deemed savings are therefore not applicable to complex projects or to measures where the savings may be inconsistent among units or program participants.3 Additionally, engineering calculations (such as Options A and B, which are the basis of payments for more complex projects) may over- or underestimate actual energy savings from a particular project, especially if they do not account for interactions among different EE measures or if measures are not properly installed or operating.13
PAY FOR PERFORMANCEAn examination of historical and current examples indicates that there is a spectrum of both payment structures (“pay”) and measurement methods (“performance”) that have been and continue to be used in P4P models, including some of those described above used by various traditional EE
programs. While there is a wide range of models, a “pay for performance” approach to EE is usually marked by a combination of dynamic savings estimation and payments. This report uses the term P4P to generally mean an EE approach in which payments are awarded for energy savings, indicating the EE project’s performance, on an ongoing basis as the savings occur.
n Pay: P4P models offer incentives or other payments in installments at least partly after the efficiency improvement has been made, based on the level of savings estimated during a performance period.* Some models compensate customers directly for savings performance in individual buildings, and others instead pay an aggregating entity for the performance of a set of buildings whose savings are delivered together. If payments are made entirely up front, the program typically has some form of penalty for nonperformance during a set period.
n Performance: P4P models evaluate performance as the electricity (kilowatt-hours, or kWh), gas (therms), and/or demand (kilowatts, or kW) savings estimated from EE interventions including equipment upgrades and building retrofits, as well as behavioral, operational, and retro-commissioning activities. Current policy discussions have focused on smart meter-based savings estimation to measure performance. Many program examples examined in this report use meter data of some kind (monthly, submetering, or interval data from smart meters) to estimate savings using an Option C–type normalized meter data analysis. Other case studies use Options A, B, or D or comparison groups as detailed above. Several case study examples, usually ones that span several customer sectors or eligible measures, use a mix of measurement methods.
* Opower is included in this paper as an example of a data analytics–enabled savings measurement approach, even though it cannot be considered P4P because the payments do not depend on the level of savings achieved.

Page 17 PUTTING YOUR MONEY WHERE YOUR METER IS NRDC
This report provides 22 examples of P4P models from across the country. The cases illustrate the variety of P4P design options, offer lessons on key features, provide historical context for the development of P4P, and form the basis for this report’s recommendations on future P4P design choices.
The cases have been selected from academic literature primarily from Lawrence Berkeley National Laboratory (LBNL), program evaluations and industry reports, interviews with experts, and institutional knowledge at the Natural Resources Defense Council (NRDC) and Vermont Energy Investment Corporation (VEIC). While these cases constitute a far from exhaustive list of P4P instances, they represent a wide range of approaches from the late 1980s to the present. Even though many of the historical and current P4P cases have been clustered in certain regions, this analysis is applicable across the United States. The case studies are presented in detail in Appendix 1: Case Studies.
The report focuses on P4P primarily funded by utility customers (often through a public benefit charge on customer bills) and usually administered by utilities to meet EE goals and support the grid. Even among this subset
of examples, there are significant differences across state regulatory regimes, program sizes, and goals, among other factors. The report also looks at P4P examples from the private sector. In these cases, companies are integrating P4P elements into business models that aim to monetize EE investments based on the customer’s cash flow from the energy bill savings, without relying on incentives from traditional DSM programs. While their goals and constraints may be different from those of programs funded by utility customers, private sector P4P business models are informative about the potential for P4P approaches to engage the private sector in scaling up investments in EE.
The case study names, locations, and start years are listed in Table 1 below. Given the large variation in models, standardized outcome data for each P4P case were not always available. Whenever possible, kWh, kW and therm savings are listed in the detailed Appendix 1: Case Studies, in addition to payment levels, percent of savings, and number of customers served. Demand response programs were not explicitly studied for this report, although some case studies incentivizing demand savings are included.
Case Studies: Historical Context and Evolution of P4P
TABLE 1: P4P CASE STUDIESSTUDY TYPE STUDY NAME STATE DURATION
P4P Energy Efficiency Programs
Con Edison Integrated Demand-Side Management Bidding NY 1990–2003 (13 years)
Public Service Electric & Gas Standard Offer NJ 1993–Present (23 years)
Non-Residential Standard Performance Contract (1998—1999) CA 1998–1999 (1 year)
Energy Services Industry Program Standard Performance Contract—NYSERDA NY 1999–Present (17 years)
Non-Residential Standard Performance Contract (2000—2005) CA 2000–2005 (5 years)
Texas Standard Offers TX 2000–Present (16 years)
Con Edison Targeted Demand-Side Management NY 2003–Present (13 years)
University of California/California State University/Investor-Owned Utilities Monitoring-Based Commissioning CA 2004–Present (12 years)
Independent System Operator—New England Forward Capacity Market New England 2006–Present (10 years)
Opower Behavioral Energy Efficiency Across US 2008–Present (8 years)
Bonneville Power Administration Strategic Energy Management Pacific NW 2009–Present (7 years)
New Jersey Commercial & Industrial Pay for Performance NJ 2009–Present (7 years)
Southern California Edison Local Capacity Requirement Request for Offers CA 2013–Present (3 years)
Seattle City Light Commercial Pay for Performance WA 2013–Present (3 years)
Pacific Gas & Electric Commercial Whole Building Program CA 2013–Present (3 years)
Efficiency Vermont Continuous Energy Improvement VT 2014–Present (2 years)
National Grid P4P for Monitoring-Based Commissioning and Retro-Commissioning MA 2014–Present (2 years)Pacific Gas & Electric Residential Pay for Performance CA 2016–Present (0 years)
P4P Business Models
ESCO Energy Savings Performance Contracting Across US 1980–Present (36 years)Metrus Efficiency Services Agreement Across US 2009–Present (7 years)
Sealed Managed Energy Savings Agreement NY 2012–Present (4 years)
Metered Energy Efficiency Transaction Structure WA 2015–Present (2 years)

Page 18 PUTTING YOUR MONEY WHERE YOUR METER IS NRDC
HISTORICAL CONTEXT: DSM BIDDING AND STANDARD OFFER PROGRAMS Starting in the late 1980s, demand-side management (DSM) bidding and standard offer programs developed as the first generation of utility administered P4P programs, changing the way utilities acquired energy savings. Both procurement mechanisms typically used similar contractual agreements in which an implementer or aggregating entity conducted retrofits for customers and received incentive payments for the resulting savings over time from the utility. The implementing entity often passed some or all of the incentive through in their prices to customers for EE projects.
DEMAND-SIDE MANAGEMENT (DSM) BIDDING PROGRAMSCon Edison’s 1990 Integrated DSM Bidding program in New York, the earliest case study in this report, is one of the first examples of a DSM bidding program.25 In the 1980s and throughout the 1990s, the electricity industry, made up largely of vertically integrated utilities, came under political and regulatory pressure to compete with private third-party-owned generation (due to the passing of the federal Public Utilities Regulatory Policies Act).25 Utilities also started to plan their resource portfolios, including their demand-side resources like EE, in a more integrated way.26 During this period utilities used DSM bidding somewhat commonly to procure energy savings.27 However, while about 30 utilities offered DSM bidding around this time, these programs accounted for only a small portion (about 5 percent) of the total energy savings across the country, relative to the portion of savings from traditional utility rebate programs.28 Overall, DSM bidding programs across the country from 1989 to 1998 produced about 530 MW of demand savings.29
Under a DSM bidding program, utilities conduct an auction solicitation for a kWh or kW savings quantity to be achieved over a multi-year period. The solicitation can be either integrated (also referred to as “all source”) to also procure traditional generation resources, or restricted to demand-side resources. For demand-side resources, the program implementers—such as energy services companies (ESCOs), contractors, consulting firms, manufacturers, or some large individual customers—submit bids for the level of savings they can provide at a certain price. Utilities then evaluate and choose bids using a predetermined scoring
system, usually comparing bid prices to the avoided cost of generation (which is the alternative to energy savings). Utilities then negotiate performance contracts with winning bidders.
ESCOs are companies that contract with customers to implement EE retrofits, and they usually offer an energy savings guarantee for the retrofits.5 While ESCOs existed prior to DSM bidding programs (and some, like Honeywell and Johnson Controls, did not participate in them), this type of solicitation further spurred the development of the ESCO industry in the late 1980s.30,31
Through a large body of literature and case studies from LBNL during this period, one can identify several overarching lessons from this first generation of DSM bidding programs that still apply today:
A bidding program has to balance attracting a robust, competitive market for energy savings with screening for viable projects. On the one hand, a small offering of bids defeats the goal of a competitive market process, and if the up-front requirements for a solicitation bid are too onerous, binding, or expensive (contributing to high transaction costs)—such as those that ESCOs complained about in Con Edison’s 1990 program—few bidders will participate.25 Because of its emphasis on reliability, Con Edison required bidding ESCOs to submit a letter of intent for each participating customer, including the specific EE intervention planned and its expected savings. The program did not allow substitutions if customers withdrew.25 On the other hand, programs lacking strict eligibility screening criteria may accept bids that are “too good to be true” and risk under-delivering energy savings.27 In order to hedge against contracts that may fall short, some utilities sign more contracts than they need.27 Alternatively, bidding programs can include performance milestones for project implementers to reach so that program administrators do not end up with under-delivering contracts.
DSM bidding programs have usually been unsuccessful when competing with traditional utility programs for the same market segment. Many DSM bidding programs existed alongside other utility rebate programs, and sometimes the two programs had overlapping measures and/or targeted customers.26 If the utility rebates were more favorable (or just simpler to access), this would limit participation in DSM bidding programs.25
FIGURE 3: DSM BIDDING PROGRAM FEATURES
MARKET APPROACH
ALL-SOURCE OR DEMAND-SIDE ONLY
LONG-TERM CONTRACTS FOR SAVINGS
• UTILITIES SET UP AUCTION FOR TARGETED SAVINGS AMOUNT• BIDDERS SUBMIT BIDS OF SAVINGS QUANTITY THEY CAN DELIVER AT CERTAIN PRICE
• AUCTIONS CAN SEEK EITHER EE SAVINGS ONLY, OR SUPPLY-SIDE RESOURCES AS WELL
• UTILITIES RANK THE BIDS ON PRICE AND OTHER CRITERIA• AFTER NEGOTIATIONS WITH SHORT-LISTED WINNERS, UTILITIES SIGN CONTRACTS WITH WINNERS TO DELIVER SAVINGS

Page 19 PUTTING YOUR MONEY WHERE YOUR METER IS NRDC
Challenges arise when EE competes against other resources in an all-source auction. Bid scoring, especially when demand-side resources are in competition with supply-side bids, is difficult because the resources have inherently different characteristics and nuances.32 Many early programs ranked bids primarily on the basis of price, but at the expense of other factors, such as prioritizing what kind of measures would be used to achieve savings.33 Choosing bids primarily by price can drive implementers to “cream skimming”—doing only the easiest and least expensive measures, but not necessarily ones that are persistent or achieve deep savings. Integrated auctions should be carefully designed to account for EE’s unique characteristics (compared with wholesale generators), such as the challenges of measuring the absence of energy use, or the involvement of many distributed customer sites.
The costs of DSM bidding programs relative to traditional utility rebate programs depend in part on the level of risk assumed by ESCOs.28 DSM bidding programs were often more expensive in terms of total resource costs or administration costs than traditional utility rebate programs in the commercial and industrial sectors, at least partly because they shifted risk (arising from EM&V uncertainty, project financing, and new technology) onto the ESCOs.29
Overall policy recommendations from the LBNL literature on these early DSM bidding programs included the following: 1) Separate utility demand-side resource procurement auctions from supply-side; 2) have ESCOs and utilities partner instead of compete; 3) design the bid evaluation process to better match EE resource characteristics;26 4) incentivize comprehensive packages of multiple EE measures instead of only individual ones (like lighting);28 and 5) reduce transaction costs for providers.
In addition to the first-generation Con Edison case, this report includes two more recent examples of geographically targeted DSM bidding: Con Edison’s Targeted DSM program starting in 2003, and Southern California Edison’s (SCE) 2013 integrated supply-side and demand-side auction.
STANDARD OFFER PROGRAMS The standard offer type of P4P program was developed in the early 1990s in response to some of the problems with DSM bidding, including high transaction costs and limits
on eligible sectors or measures. Some ESCOs had also complained that DSM bidding programs left too many losers among bidders, essentially creating a regional franchise for winning implementers.32 Under a standard offer program, a utility sets a price it will pay for a measured unit of energy or demand savings (e.g. five cents per kwh saved for lighting and 15-20 cents per kWh for HVAC end uses). The utility signs long-term contracts, usually 5 to 15 years, with implementers (e.g., ESCOs, contractors, large customers, or other implementers) to deliver the savings. Because they do not rank bids or negotiate contracts, standard offer programs limit the discretionary role of utilities as program administrators.29 Unlike DSM bidding, where competition primarily occurs among ESCOs in the utility auction process, under a standard offer ESCOs compete for customers to enroll in their EE projects.34 Contracts are signed on a first-come, first-served basis until the desired savings levels are reached or the funding pool runs out. Available funding is usually the limiting constraint.30
New Jersey’s Public Service Electric & Gas (PSE&G) implemented an early example of a standard offer program in 1993, after discontent from the energy services industry about the utility’s 1989 all-source bidding program.34 With an original target of 150 MW of savings, the program was larger than any other utility EE program at the time that relied on ESCOs and contractors to deliver energy savings.34 The program had a first wave of commitments of only 40 MW; while significantly lower than the target, this was higher than what most DSM bidding programs saw during that period.34 Across the first and second set of contracts, lighting measures contributed the majority of the savings (60 percent).35 In some sectors, such as large commercial buildings, the penalties for nonperformance and the long contract terms dissuaded customers from signing up with the program. A subsidiary of PSE&G also participated in the program, crowding out potential third-party ESCO participants, many of which dropped out of the program after disagreements with the subsidiary. Competition among ESCOs was highest in the commercial and industrial sector, where the program evaluation found the standard offer concept to be most appropriate for retrofits (as opposed to new construction or other types of EE interventions). Even though the program was open to residential customers, their participation rates were low.35 Transaction costs and risks were too high for the residential sector, especially
FIGURE 4: STANDARD OFFER PROGRAM FEATURES
PRESET PRICE
FIRST COME, FIRST SERVED
LONG-TERM PERFORMANCE CONTRACTS
• UTILITY SETS PRICE IT WILL PAY FOR A UNIT OF SAVINGS• PRICE CAN BE FOR TIME- OR MEASURE-SPECIFIC SAVINGS
• PROGRAM HAS POOL OF FUNDS AND/OR TARGET LEVEL OF SAVINGS• ESCOS OR ELIGIBLE CUSTOMERS SIGN CONTRACTS WITHOUT BIDDING
• ESCOS OR CUSTOMERS DIRECTLY DELIVER SAVINGS WITH LONG-TERM PERFORMANCE CONTRACTS• PARTICIPATING CUSTOMERS ARE OFTEN NOT ACQUIRED IN ADVANCE

Page 20 PUTTING YOUR MONEY WHERE YOUR METER IS NRDC
as existing rebate programs already targeted those customers.34 By 2000 the program had procured about 230 MW of savings, but at a steep cost, since incentives covered 80 to 90 percent of total project costs.29
The findings from an LBNL evaluation of the PSE&G Standard Offer program are summarized below:
n The initial program evaluation of the New Jersey program found that as the standard offer and prior DSM bidding program shifted performance risk away from utility bill payers and onto implementing ESCOs or customers (with penalties for non-delivery or under-delivery of savings), the cost per kWh of savings (mainly from lighting) was higher than a rebate program by about 1–2.5 cents/kWh.34 The evaluation concluded that while the more established rebate programs would likely have higher customer penetration, the persistence of those savings would be less certain than those from the standard offer program, which was focused on recurring payments for lasting savings.34
n In order to incentivize deeper savings, the initial program evaluation recommended tiered incentive payments that paid more for non-lighting measures.34 Differentiated pricing for higher energy saving measures or higher energy saving levels per site is one way to discourage cream-skimming (when only measures that are easy to achieve are targeted).
n The program’s more rigorous savings measurement methodology was more expensive than that of a typical program but improved accuracy. The M&V for lighting savings (the majority of the measures from the program) was based on continuously monitoring the lighting run-time of a sample of circuits at a given site, multiplied by the difference in the manufacturer’s rating on the previous and new lighting fixtures.34 Though the program evaluation found issues with certain aspects of the M&V practices and could not verify the supposed 90 percent confidence interval of savings estimates, it found that the overall accuracy of the estimates was improved.34
n As compared with DSM bidding, standard offer programs can be administered centrally and consistently across utilities in a state, better align with ESCO business models, and provide customers the choice of implementer.34 On the other hand, a standard offer has the fundamental challenge of setting the price and therefore does not benefit from the “price discovery” process of the DSM bidding programs.33 It is difficult
to know if the set price is the optimal one, and the administrative price determination process can be subject to lobbying and political pressure from ESCOs.29
In addition to the New Jersey program, this report includes other examples of standard offer-type cases: California’s Nonresidential Standard Performance Contract (SPC) program starting in 1998, New York’s Energy Services Industry SPC program starting in 1999, and Texas’s standard offer programs starting around 2000.
EVOLUTION OF P4P SINCE THE 1990S During the time of the first-generation P4P EE programs (DSM bidding and standard offers), the most common utility EE programs continued to use deemed savings and up-front rebates. Even programs that may have started with metered measurement sometimes moved toward deemed savings to make it simpler to estimate savings. However, in the past 10 years or so, P4P EE efforts employing whole-building, meter-based approaches, new financing mechanisms, and operational savings have emerged. Many of these approaches have been enabled by the availability of smart meter data and companies that conduct data analytics (Energy Savvy, EnerNOC, FirstFuel, Opower, and OpenEEmeter, among others). Some of these newer financing and contracting approaches are private sector P4P programs operating outside the purview of utility customer–funded programs. This section summarizes a variety of P4P approaches that have been tried in recent years: P4P within utility DSM programs, P4P EE in wholesale capacity markets, and P4P in private sector models. In addition, utilities have continued to use standard offer and DSM bidding approaches to procure EE. For example, SCE held an integrated supply-side and demand-side auction in 2013.
P4P APPROACHES IN UTILITY DSM PROGRAMSIndustrial and Commercial Strategic Energy Management Several utilities have behavioral and operational programs that focus on changing companies’ culture and business practices to be more energy efficient through management education and skills training.2 The effect of the approach is usually measured with statistical analysis of meter data before and after corporate training and the completion of any EE measures. This report includes strategic energy management (SEM) examples in the Pacific Northwest in Bonneville Power Administration’s service territory and Efficiency Vermont’s Continuous Energy Improvement program.
FIGURE 5: STRATEGIC ENERGY MANAGEMENT PROGRAM FEATURES
ENERGY MANAGEMENT CHANGES• IMPLEMENTER PROVIDES TECHNICAL SUPPORT AND EDUCATION PRIMARILY TO INDUSTRIAL CUSTOMERS. THE GOAL IS TO CHANGE THEIR BUSINESS PRACTICES AND CULTURE TO BETTER MANAGE ENERGY

Page 21 PUTTING YOUR MONEY WHERE YOUR METER IS NRDC
Commissioning and Retro-commissioningCommissioning and retro-commissioning programs seek low-cost or zero-cost energy savings by tuning and optimizing existing building equipment to run more efficiently. “Commissioning” is the tune-up that happens right after the building is constructed; “retro-commissioning” is a tune-up after the building has been in service for many years. These programs are not new, but past versions paid up front for expected savings from a one-time tune-up. Research has shown that the energy savings from a one-time retro-commissioning intervention degrade significantly over time, making continuous monitoring valuable.36 Among this report’s cases are the University of California/California State University/Investor-Owned Utility (UC/CSU/IOU) Monitoring-Based Commissioning (MBCx) program, which estimates savings by continuously observing whole-building energy performance after commissioning, and the National Grid P4P program, which offers performance-based incentives for savings from commissioning and retro-commissioning.
Whole-Building ProgramsA whole-building program uses a comprehensive set of EE measures (e.g., air-conditioning, building envelope, lighting, refrigeration, and windows) and can also include operational and behavioral adjustments. The savings estimation is completed for the building as a whole instead of intervention by intervention. Most programs focus on commercial buildings and measure savings of the whole project using either billing or meter data with weather normalization, or calibrated building simulation.
On the commercial and industrial side, this analysis includes case studies of the Seattle City Light (SCL) Commercial P4P pilot, Pacific Gas and Electric (PG&E) Commercial Whole Building pilot program, and New Jersey’s Commercial and Industrial (C&I) P4P program. All of these examples are still relatively small programs with a handful of participants (up to 25 buildings in the New Jersey program). PG&E’s Residential P4P pilot, launched in late 2016, is the first known attempt to scale a whole-building program to the diverse residential sector with a normalized metering-based approach.1
Residential Behavioral Programs Utilities send targeted messages and reports about energy usage and potential savings opportunities to customers to try to change their behavior and increase energy savings. Often the messages apply social pressure by comparing a customer’s usage with that of their neighbors.37 Such behavioral programs are most popular in the residential sector, and Opower works with 95 utilities on programs of this type across nine countries, serving about 15 million households.38 The programs usually measure energy savings and the effect of targeted messaging using randomized control trials of treatment and control groups of customers. Even though Opower is not paid based on the level of savings from its platform and reports, this report includes a case study with several examples of Opower’s efforts because they represent an innovative savings estimation model to capture behavioral savings in the residential sector.
FIGURE 6: RETRO-COMMISSIONING AND COMMISSIONING PROGRAM FEATURES
FIGURE 7: WHOLE-BUILDING P4P PROGRAM FEATURES
FIGURE 8: RESIDENTIAL BEHAVIORAL PROGRAM FEATURES
BUILDING OPERATIONAL TUNE-UPS
COMPREHENSIVE SET OF EE MEASURES
EXPERIMENTAL DESIGN
• AFTER BUILDING EQUIPMENT IS TUNED TO OPTIMAL CONDITIONS, ENERGY SAVINGS ARE MEASURED AND MONITORED FOR ANOMOLIES
• IMPLEMENTERS INSTALL A COMPREHENSIVE SET OF MEASURES AND ALSO ACCOUNT FOR OPERATIONAL CHANGES IN WHOLE-BUILDING ENERGY SAVINGS
• THIRD PARTY SENDS EE TARGETED MESSAGING TO A RANDOMIZED SET OF “TREATMENT” CUSTOMERS AND CALCULATES ENERGY SAVINGS RELATIVE TO A “CONTROL” GROUP

Page 22 PUTTING YOUR MONEY WHERE YOUR METER IS NRDC
EE PARTICIPATION IN WHOLESALE CAPACITY MARKETSWholesale capacity markets are auctions established by the regional transmission operator (also known as an independent system operator, or ISO) to ensure sufficient capacity is available for meeting future system peak loads. Auction players can bid in generation, demand response, and EE to satisfy capacity needs. The winners are compensated at auction-determined rates. Capacity provided by EE is verified by thorough EM&V, either through customized analysis of efficiency measures or through deemed savings estimates. This report includes a case study of EE participation in the ISO New England Forward Capacity Market (FCM), which is similar to that of the PJM Forward Capacity Market (not included in this report).
PRIVATE SECTOR P4P BUSINESS MODELSThe examples described above are all utility or third-party-administered EE programs funded by utility customers to pay for the delivery of EE savings. This report also includes examples of EE business models and transactional structures that incorporate P4P principles (payments in installments for energy savings estimated over time) but are run by companies that work directly with customers to deliver and finance EE investments that are paid for by the resulting energy bill savings—often without any involvement of a utility. In these transactions, savings and risks are shared by multiple private sector entities that provide the financing, project design, implementation, and EM&V of an EE project. For example, one entity might guarantee the performance of the contract (the quantity of energy savings), and another might guarantee the project financing.
This report includes case studies of several varieties of privately funded and implemented EE business models, including the energy service performance contract (ESPC), efficiency services agreement (ESA), managed energy services agreement (MESA), and metered energy efficiency transaction structure (MEETS) approaches.
FIGURE 9: WHOLESALE CAPACITY MARKET PROGRAM FEATURES
EE AS A GRID CAPACITY RESOURCE • EE CONTRACTS ARE BID INTO REGIONAL CAPACITY MARKETS FOR THREE-YEAR-AHEAD COMMITMENTS OF DEMAND REDUCTIONS

Page 23 PUTTING YOUR MONEY WHERE YOUR METER IS NRDC
TAXONOMY OF P4P DESIGN FEATURES AND EVALUATION FRAMEWORKThis report constructs a taxonomy of key P4P components (see Figure 10). The taxonomy can roughly be divided into three categories: Basic Design Features, How Performance Is Measured, and How Payment Is Determined. The report uses this framework to review the 22 case studies and the features of each (described in more detail in Appendix 1: Case Studies).
For each element, the P4P program case studies have one or more of the following attributes:
Basic Design Features
1. Purpose: reach DSM savings goals; deliver EE as a grid resource; finance EE investments using cash flow from the energy savings; target specific sectors; develop EE services market
2. Targeted Customer Segment: residential; commercial; industrial; municipal, university, schools, and hospitals (MUSH)/institutional
3. Targeted Measure(s): individual retrofit measures (such as lighting, HVAC, or building shell); comprehensive set of multiple measures/whole-building retrofit; behavioral; retro-commissioning; operational measures/whole-building level
4. Type of Savings Rewarded: kWh (energy–electricity); kW (demand–electricity); therms (energy–natural gas)
5. Source of Funding: utility customer funds; financing based on energy savings
6. Who Administers: utility; third-party administrator (public or private sector); private sector business model
How Performance Is Measured
7. Savings Estimation Methodology: deemed savings; IPMVP Option A—isolation retrofit, mainly stipulated inputs; IPMVP Option B—isolation retrofit, all parameters measured; IPMVP Option C or other normalized whole-building metering; IPMVP Option D—calibrated computer simulation; randomized control trial/experimental; mix of measurement methods (including deemed and Options A–D)
8. Baseline Used: normalized pre-implementation meter data; pre-implementation operating/device data; deemed savings/technical reference manual; mix of measurement methods
9. Data Required: monthly or other non-AMI billing/meter data; AMI/interval meter data; submetering; other electrical metering; device manufacturing specifications; deemed savings/technical reference manual; mix of measurement methods
How Payment Is Determined
10. Payment Structure: all up-front; all performance-based; partially up-front, partially performance-based
11. Bonuses and Penalties: bonus for non-lighting savings/deeper savings; bonus for net savings; bonus for time-of-use savings; up-front collateral investment/financial security for delivery; other penalties for nonperformance
12. Duration of Performance Period/Contract: 1 to 25 years
13. Aggregated Portfolio Savings or Individual Project Savings: aggregated portfolio; individual project
P4P Program Taxonomy and Comparison of Case Study Design Features
FIGURE 10: TAXONOMY OF P4P DESIGN FEATURES
12. DURATION OF PERFORMANCE
PERIOD/CONTRACT
13. AGGREGATED PORTFOLIO OR
INDIVIDUAL PROJECT LEVEL SAVINGS
10. PAYMENT STRUCTURE
4. TYPE OF SAVINGS REWARDED
11. BONUSES AND PENALTIES
5. SOURCE OF FUNDING
6. WHO ADMINISTERS
7. SAVINGS ESTIMATION
METHODOLOGY
1. PURPOSE
BASIC DESIGN FEATURES
HOW PAYMENT IS DETERMINEDHOW PERFORMANCE IS MEASURED
8. BASELINE USED
2. TARGETED CUSTOMER SEGMENT
9. DATA REQUIRED
3. TARGETED MEASURE(S)

Page 24 PUTTING YOUR MONEY WHERE YOUR METER IS NRDC
LESSONS ON KEY DESIGN FEATURES FROM CASE STUDIESThis section discusses observations and most important considerations drawn from a review of the case studies. It is broken into the three major categories of Figure 10.
BASIC DESIGN FEATURESPurposeThe overall purpose or motivation for the P4P examples in this report fall into five broad areas: reaching EE or broader DSM goals for energy savings, delivering EE as a grid resource, financing EE investments using cash flow from the energy savings, targeting EE savings in specific sectors, and developing an EE services market. Each of these motivations drives subsequent P4P design choices, mainly in relation to the targeted customer segments, eligible measures, and savings estimation methodology.
Reach DSM goals for energy savings: Several utilities have designed their P4P programs to meet a state’s EE or demand-side goals. For example, Texas’s standard offer programs reach all sectors to better meet the statewide EE mandate.39
Deliver EE as a grid resource: Other P4P programs focus on delivering EE savings as a resource to the grid, beyond specific DSM goals for energy savings. The ISO New England Forward Capacity Market, for example, captures the capacity value of EE for meeting future system peak loads. In California, during the state’s energy crisis, the nonresidential SPC program also delivered capacity
savings by incentivizing EE during peak times.40 Similarly, the SCE local capacity RFO procured EE that could lower capacity needs in constrained areas of the grid after the retirement of a nuclear plant.41 These programs may target particular EE measures that reduce loads coincident with peak system demand, and they may offer bonus incentives for savings during peak times. Con Edison’s targeted DSM program addresses geographically specific deficiencies on the distribution grid.42 Because it relies on EE savings as a resource to defer upgrades to its distribution system infrastructure, Con Edison’s targeted DSM program employs a rigorous M&V method and imposes high penalties on participating ESCOs if promised energy savings fall short.42 SCE’s local capacity RFO contracts have similar penalty provisions.
Finance EE investments using cash flow from the energy savings: For newer private sector–financed examples such as MEETS, Metrus, and Sealed, P4P models can offer value streams to engage private capital and commodify EE savings as a “transactable” resource for investors. Depending on the design, EE financiers and/or aggregators can finance the up-front project costs and receive recurring payments based on energy savings over time.
Target specific sectors: Some programs focus on a certain sector with untapped savings potential, such as the industrial and commercial sector-targeted Bonneville Power Administration and Vermont Strategic Energy Management programs and the New Jersey C&I P4P program.
FIGURE 11: BASIC DESIGN FEATURE ATTRIBUTES
1. PURPOSE
REACH DSM SAVINGS GOALS RESIDENTIAL
INDIVIDUAL RETROFIT
MEASURES
KWh(ENERGY -ELECTRICITY)
UTILITY CUSTOMER FUNDS UTILITY
DELIVER EE AS A RESOURCE COMMERCIAL
COMPREHENSIVE SET OF MULTIPLE
MEASURES/WHOLE BUILDING
KW (DEMAND- ELECTRICITY)
FINANCING BASED ON ENERGY
SAVINGS
THIRD-PARTY ADMINISTRATOR
FINANCE EE INVESTMENTS USING
ENERGY SAVINGS CASH FLOW
INDUSTRIAL
BEHAVIORAL, RETRO-COMMISSIONING,
OPERATIONAL SAVINGS/WHOLE
BUILDING
THERMS (ENERGY –
NATURAL GAS)
PRIVATE SECTOR BUSINESS MODEL
TARGET SPECIFIC SECTORS
INSTITUTIONAL/ MUSH
DEVELOP EE SERVICES MARKET
2. TARGETED CUSTOMER SEGMENT
3. TARGETED MEASURES
4. TYPE OF SAVINGS REWARDED
5. SOURCE OF FUNDING
6. WHO ADMINISTERS
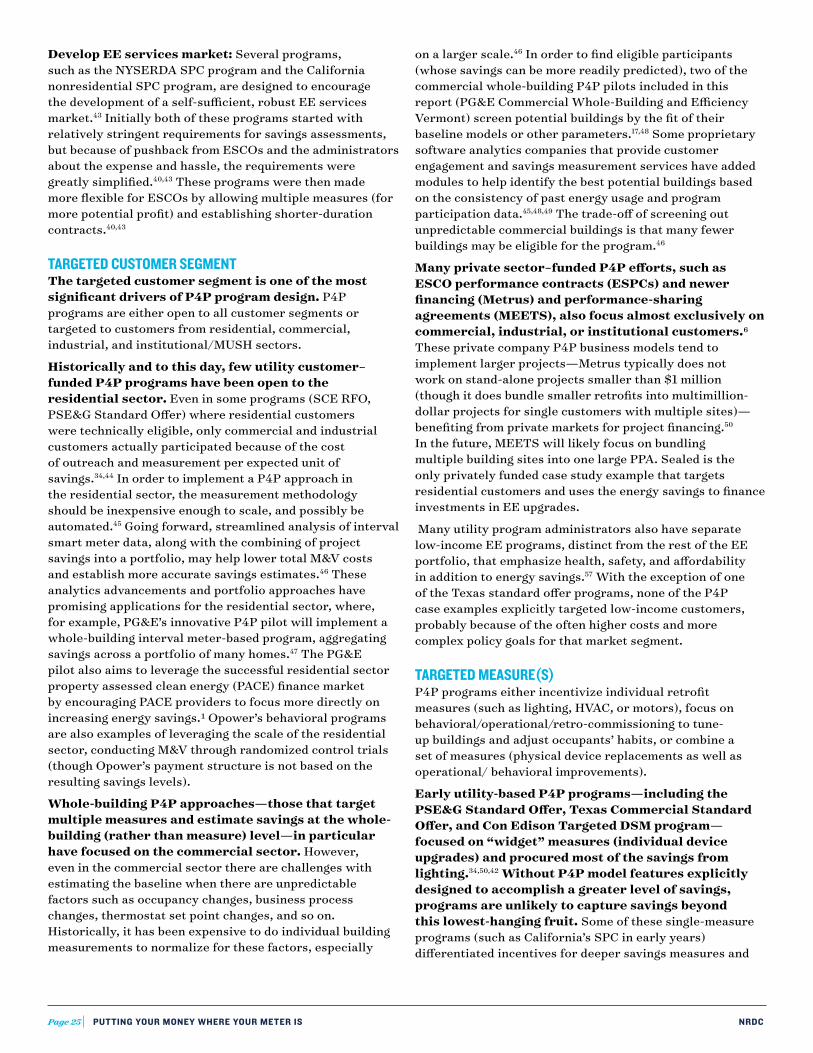
Page 25 PUTTING YOUR MONEY WHERE YOUR METER IS NRDC
Develop EE services market: Several programs, such as the NYSERDA SPC program and the California nonresidential SPC program, are designed to encourage the development of a self-sufficient, robust EE services market.43 Initially both of these programs started with relatively stringent requirements for savings assessments, but because of pushback from ESCOs and the administrators about the expense and hassle, the requirements were greatly simplified.40,43 These programs were then made more flexible for ESCOs by allowing multiple measures (for more potential profit) and establishing shorter-duration contracts.40,43
TARGETED CUSTOMER SEGMENT The targeted customer segment is one of the most significant drivers of P4P program design. P4P programs are either open to all customer segments or targeted to customers from residential, commercial, industrial, and institutional/MUSH sectors.
Historically and to this day, few utility customer–funded P4P programs have been open to the residential sector. Even in some programs (SCE RFO, PSE&G Standard Offer) where residential customers were technically eligible, only commercial and industrial customers actually participated because of the cost of outreach and measurement per expected unit of savings.34,44 In order to implement a P4P approach in the residential sector, the measurement methodology should be inexpensive enough to scale, and possibly be automated.45 Going forward, streamlined analysis of interval smart meter data, along with the combining of project savings into a portfolio, may help lower total M&V costs and establish more accurate savings estimates.46 These analytics advancements and portfolio approaches have promising applications for the residential sector, where, for example, PG&E’s innovative P4P pilot will implement a whole-building interval meter-based program, aggregating savings across a portfolio of many homes.47 The PG&E pilot also aims to leverage the successful residential sector property assessed clean energy (PACE) finance market by encouraging PACE providers to focus more directly on increasing energy savings.1 Opower’s behavioral programs are also examples of leveraging the scale of the residential sector, conducting M&V through randomized control trials (though Opower’s payment structure is not based on the resulting savings levels).
Whole-building P4P approaches—those that target multiple measures and estimate savings at the whole-building (rather than measure) level—in particular have focused on the commercial sector. However, even in the commercial sector there are challenges with estimating the baseline when there are unpredictable factors such as occupancy changes, business process changes, thermostat set point changes, and so on. Historically, it has been expensive to do individual building measurements to normalize for these factors, especially
on a larger scale.46 In order to find eligible participants (whose savings can be more readily predicted), two of the commercial whole-building P4P pilots included in this report (PG&E Commercial Whole-Building and Efficiency Vermont) screen potential buildings by the fit of their baseline models or other parameters.17,48 Some proprietary software analytics companies that provide customer engagement and savings measurement services have added modules to help identify the best potential buildings based on the consistency of past energy usage and program participation data.45,48,49 The trade-off of screening out unpredictable commercial buildings is that many fewer buildings may be eligible for the program.46
Many private sector–funded P4P efforts, such as ESCO performance contracts (ESPCs) and newer financing (Metrus) and performance-sharing agreements (MEETS), also focus almost exclusively on commercial, industrial, or institutional customers.6 These private company P4P business models tend to implement larger projects—Metrus typically does not work on stand-alone projects smaller than $1 million (though it does bundle smaller retrofits into multimillion-dollar projects for single customers with multiple sites)—benefiting from private markets for project financing.50 In the future, MEETS will likely focus on bundling multiple building sites into one large PPA. Sealed is the only privately funded case study example that targets residential customers and uses the energy savings to finance investments in EE upgrades.
Many utility program administrators also have separate low-income EE programs, distinct from the rest of the EE portfolio, that emphasize health, safety, and affordability in addition to energy savings.57 With the exception of one of the Texas standard offer programs, none of the P4P case examples explicitly targeted low-income customers, probably because of the often higher costs and more complex policy goals for that market segment.
TARGETED MEASURE(S) P4P programs either incentivize individual retrofit measures (such as lighting, HVAC, or motors), focus on behavioral/operational/retro-commissioning to tune-up buildings and adjust occupants’ habits, or combine a set of measures (physical device replacements as well as operational/ behavioral improvements).
Early utility-based P4P programs—including the PSE&G Standard Offer, Texas Commercial Standard Offer, and Con Edison Targeted DSM program—focused on “widget” measures (individual device upgrades) and procured most of the savings from lighting.34,50,42 Without P4P model features explicitly designed to accomplish a greater level of savings, programs are unlikely to capture savings beyond this lowest-hanging fruit. Some of these single-measure programs (such as California’s SPC in early years) differentiated incentives for deeper savings measures and

Page 26 PUTTING YOUR MONEY WHERE YOUR METER IS NRDC
successfully steered customers away from lighting-only upgrades.40 Another option is to set a minimum expected “savings depth” for a project or portfolio of projects as a prerequisite for participation in a P4P program.
Several of the newer P4P examples are targeting deeper savings from whole-building EE improvements by focusing on comprehensive, multi-measure projects. In these cases, payments for the performance of specific measures are not appropriate because savings are measured at the whole-building, not “widget,” level. To incentivize more savings for whole-building programs, P4P models can award a sliding scale of payments (for example, paying $0.05/kWh for savings of up to 15 percent and $0.10/kWh for savings greater than 15 percent).30 The New Jersey C&I P4P and the SCL programs have this type of incentive mechanism. Alternatively, the contract can offer a longer-term duration to allow deeper (and usually more expensive) savings measures to pay back over time.
P4P programs focusing on retro-commissioning and operational and behavioral improvements can also achieve additional savings through non-widget EE measures. One study of a sample of buildings from the UC/CSU/IOU Monitoring-Based Commissioning program found a median energy savings of 9 percent (range: 1–17 percent) and demand savings of 4 percent (range: 3–11 percent) from making building operational changes.52 Strategic energy management (e.g., the Vermont and BPA programs) is an example of a type of behavioral and operational program targeting cohorts of large industrial or commercial customers with personalized training and peer learning benefits.53 The Vermont program, aimed at industrial facilities, focuses on both operational changes and capital investments and targets savings of 10 percent to 15 percent in the first three years (after subtracting savings from widgets that are already counted via other Efficiency Vermont programs).54
TYPE OF SAVINGS REWARDEDP4P programs reward savings of electricity—both energy (kWh) and demand (kW)—and/or natural gas (therms). A program’s goals and eligible measures are key determinants of the type of savings rewarded.
Most P4P program examples incentivize energy (kWh and therm) savings. In some situations, when EE is serving as a grid resource as described above, programs may have an additional payment for demand savings. For example, during the critical times of the California energy crisis, the state’s SPC program added a peak demand (kW) savings incentive to help avoid summer blackouts.40 PG&E’s Residential P4P pilot initially is looking only for kWh and therm savings but may add bonus incentives for locational or time-of-use energy savings.1
Programs that offer incentives for both kWh and therm savings are usually focused on comprehensive, whole-building measures and measurement. For example, buildings participating in UC/CSU/IOU’s Monitoring-Based
Commissioning program have separate meters for each building energy utility (which could include electricity, natural gas, hot water, steam, or chilled water) and therefore can reward electricity and other energy savings.55
In the Northeast, many homes rely on unregulated fuels that are not metered, such as heating oil. For example, in Vermont, only electric usage is metered in most homes, though it is just a small part of overall energy usage for a typical household.56 P4P may not be appropriate for EE measures that require a switch from an unmetered fuel to electricity as overall energy savings cannot be readily quantified.
SOURCE OF FUNDING The majority of the P4P examples included in this report are funded by utilities, whose funds ultimately comes from ratepayers. Utilities and their regulators view EE as a public resource that provides benefits to all customers by displacing new power plants and their emissions and by deferring or replacing transmission and distribution system upgrades. Utility EE programs exist to correct for the market failure of low individual investment in EE measures that provide these benefits for everyone.2
In many states, a small public benefit charge or other adder is collected on utility customers’ monthly utility bills, and these charges, when pooled across the state or utility service territory, are used to fund EE programs. Across the United States, utility customer funds invest more than $8 billion in EE programs each year.2 Some other utilities include EE spending in their rate base or consider it an operating expense, paying for it in a way similar to how they would procure supply-side energy or capacity.
In some cases, program administrators of utility customer–funded EE programs may not want to take risks using P4P models with novel measurement methods or technology. If energy savings end up lower than expected—even if there are penalties for under-delivering savings in P4P contracts—load-serving entities risk running short of resources, missing EE goals, and not receiving credit from the regulator (and associated shareholder incentives). Therefore, programs often pursue the safest options for savings that are predictable and easily estimated with deemed values, such as lighting, or shift the performance risk onto implementation contractors. Many utility customer–funded programs (Con Edison Targeted DSM program, PSE&G Standard Offer program, Texas’s Commercial Standard Offer Program) did indeed claim the majority of savings from lighting. In addition, regulators in many states want to limit free ridership and authorize utilities to use customer funds only to pay for energy savings that program participants would not have pursued otherwise.
Future utility customer-funded P4P programs will need to allow for more innovation to incentivize higher savings. For example, to overcome risk aversion from unrealized savings and give third-party program
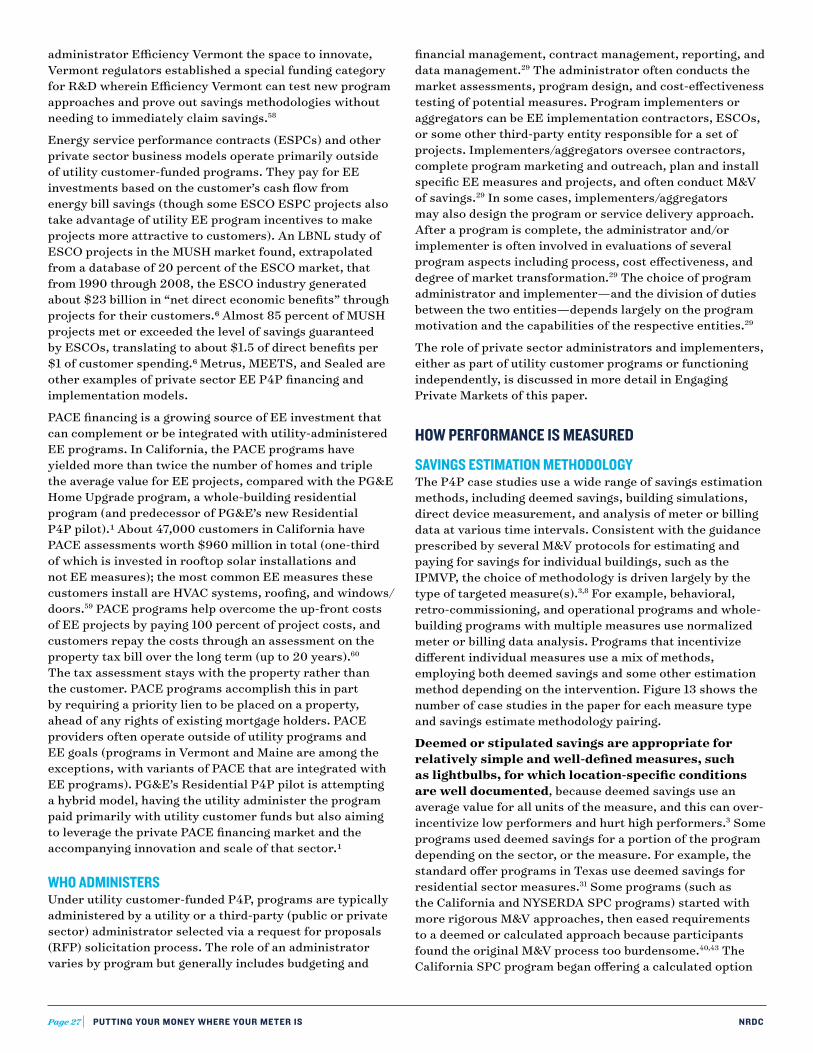
Page 27 PUTTING YOUR MONEY WHERE YOUR METER IS NRDC
administrator Efficiency Vermont the space to innovate, Vermont regulators established a special funding category for R&D wherein Efficiency Vermont can test new program approaches and prove out savings methodologies without needing to immediately claim savings.58
Energy service performance contracts (ESPCs) and other private sector business models operate primarily outside of utility customer-funded programs. They pay for EE investments based on the customer’s cash flow from energy bill savings (though some ESCO ESPC projects also take advantage of utility EE program incentives to make projects more attractive to customers). An LBNL study of ESCO projects in the MUSH market found, extrapolated from a database of 20 percent of the ESCO market, that from 1990 through 2008, the ESCO industry generated about $23 billion in “net direct economic benefits” through projects for their customers.6 Almost 85 percent of MUSH projects met or exceeded the level of savings guaranteed by ESCOs, translating to about $1.5 of direct benefits per $1 of customer spending.6 Metrus, MEETS, and Sealed are other examples of private sector EE P4P financing and implementation models.
PACE financing is a growing source of EE investment that can complement or be integrated with utility-administered EE programs. In California, the PACE programs have yielded more than twice the number of homes and triple the average value for EE projects, compared with the PG&E Home Upgrade program, a whole-building residential program (and predecessor of PG&E’s new Residential P4P pilot).1 About 47,000 customers in California have PACE assessments worth $960 million in total (one-third of which is invested in rooftop solar installations and not EE measures); the most common EE measures these customers install are HVAC systems, roofing, and windows/doors.59 PACE programs help overcome the up-front costs of EE projects by paying 100 percent of project costs, and customers repay the costs through an assessment on the property tax bill over the long term (up to 20 years).60 The tax assessment stays with the property rather than the customer. PACE programs accomplish this in part by requiring a priority lien to be placed on a property, ahead of any rights of existing mortgage holders. PACE providers often operate outside of utility programs and EE goals (programs in Vermont and Maine are among the exceptions, with variants of PACE that are integrated with EE programs). PG&E’s Residential P4P pilot is attempting a hybrid model, having the utility administer the program paid primarily with utility customer funds but also aiming to leverage the private PACE financing market and the accompanying innovation and scale of that sector.1
WHO ADMINISTERSUnder utility customer-funded P4P, programs are typically administered by a utility or a third-party (public or private sector) administrator selected via a request for proposals (RFP) solicitation process. The role of an administrator varies by program but generally includes budgeting and
financial management, contract management, reporting, and data management.29 The administrator often conducts the market assessments, program design, and cost-effectiveness testing of potential measures. Program implementers or aggregators can be EE implementation contractors, ESCOs, or some other third-party entity responsible for a set of projects. Implementers/aggregators oversee contractors, complete program marketing and outreach, plan and install specific EE measures and projects, and often conduct M&V of savings.29 In some cases, implementers/aggregators may also design the program or service delivery approach. After a program is complete, the administrator and/or implementer is often involved in evaluations of several program aspects including process, cost effectiveness, and degree of market transformation.29 The choice of program administrator and implementer—and the division of duties between the two entities—depends largely on the program motivation and the capabilities of the respective entities.29
The role of private sector administrators and implementers, either as part of utility customer programs or functioning independently, is discussed in more detail in Engaging Private Markets of this paper.
HOW PERFORMANCE IS MEASURED
SAVINGS ESTIMATION METHODOLOGYThe P4P case studies use a wide range of savings estimation methods, including deemed savings, building simulations, direct device measurement, and analysis of meter or billing data at various time intervals. Consistent with the guidance prescribed by several M&V protocols for estimating and paying for savings for individual buildings, such as the IPMVP, the choice of methodology is driven largely by the type of targeted measure(s).3,8 For example, behavioral, retro-commissioning, and operational programs and whole-building programs with multiple measures use normalized meter or billing data analysis. Programs that incentivize different individual measures use a mix of methods, employing both deemed savings and some other estimation method depending on the intervention. Figure 13 shows the number of case studies in the paper for each measure type and savings estimate methodology pairing.
Deemed or stipulated savings are appropriate for relatively simple and well-defined measures, such as lightbulbs, for which location-specific conditions are well documented, because deemed savings use an average value for all units of the measure, and this can over-incentivize low performers and hurt high performers.3 Some programs used deemed savings for a portion of the program depending on the sector, or the measure. For example, the standard offer programs in Texas use deemed savings for residential sector measures.31 Some programs (such as the California and NYSERDA SPC programs) started with more rigorous M&V approaches, then eased requirements to a deemed or calculated approach because participants found the original M&V process too burdensome.40,43 The California SPC program began offering a calculated option

Page 28 PUTTING YOUR MONEY WHERE YOUR METER IS NRDC
in addition to the original, more rigorous M&V, and in program year 2001, most participants chose the calculated option, despite the 10 percent higher incentive payment for measured savings. In contrast, the Con Edison Targeted DSM program used deemed savings from the start, but because the utility was relying on EE to defer infrastructure upgrades, it imposed rigor into the process by verifying 100 percent of existing and newly installed equipment.42 In the residential sector, the program implementers “tagged and bagged” each lightbulb that was replaced, matching it with the packaging of the new bulb to record the savings difference.42
IPMVP Options A and B calculate savings from an isolated retrofit of a device, combining some sort of field measurement with stipulated values into an engineering calculation.8 Option A is very close to a deemed estimate as it requires measurement of only one variable and relies largely on stipulated values for engineering estimates. Option B requires all parameters of the engineering calculation to be directly measured on a short-term or an ongoing basis. Metrus’s ESA relies on a mix of these methods to determine the service charges paid by customers for energy savings.61
IPMVP Option D develops a model simulating the energy use of the building, which is calibrated to actual historical usage.8 The model is then used to predict the savings after an EE implementation. Typically this savings estimation technique requires the expertise of a trained engineer to set up and customize for a specific building.8 The M&V for the MEETS model uses an Option D–based software called Delta Meter, which generates an auto-calibrated baseline model
FIGURE 13: COMPARISON OF CASE STUDY SAVINGS ESTIMATION METHODS AND TARGETED MEASURES
FIGURE 12: HOW PERFORMANCE IS MEASURED
7. SAVINGS ESTIMATION
METHODOLOGY
DEEMED SAVINGS
NORMALIZED PRE-IMPLEMENTATION
METER DATA
MONTHLY OR OTHER NON-AMI BILLING/
METER DATA
DEVICE MANUFACTURER’S
SPECIFICATIONS
IPMVP OPTION A – ISOLATION RETROFIT
PRE-IMPLEMENTATION OPERATING/DEVICE
DATASUB-METERING
DEEMED SAVINGS/TECHNICAL
REFERENCE MANUAL
IPMVP OPTION B – ISOLATION RETROFIT,
ALL PARAMETERS MEASURED
DEEMED SAVINGS/TECHNICAL
REFERENCE MANUAL
OTHER ELECTRICAL METERING
MIX OF MEASUREMENT
METHODS
IPMVP OPTION C OR OTHER NORMALIZED
WHOLE BUILDING ESTIMATION
MIX OF MEASUREMENT
METHODS
MIX OF MEASUREMENT
METHODS
8. BASELINE USED
9. DATA REQUIRED
Targeted Measures Deemed Savings
IPMVP Option A, B
(isolation retrofit)
IPMVP Option B, C or D (not A, mainly
stipulated savings)
IPMVP Option C
(or similar whole-building
normalized meter/bill analysis)
IPMVP Option D
(calibrated computer
simulation)
Mix of measurement
methods (deemed and
M&V methods)Randomized control trial
Individual retrofit measures 2 2 2
Behavioral, retro-comissioning,
operational measures
1 3 1
Comprehensive set of multiple
measures1 4 2 4
Number of Cases
1 2 3 4

Page 29 PUTTING YOUR MONEY WHERE YOUR METER IS NRDC
using monthly or hourly meter data and allows nonroutine changes in the building to be tracked.62
Seven of the case studies in this paper use some type of normalized meter or billing data culled pre- and post-implementation (usually in the style of IPMVP Option C) to estimate savings. This type of savings estimation is most suited to a whole-building P4P approach when multiple measures are implemented at a project; a single measure alone may have only a small effect on overall usage, and the statistical “signal” from a small savings impact is harder to isolate from the “noise” of other, confounding effects.16 The guidelines vary, but the IPMVP recommends a savings of at least 10 percent of the baseline energy of individual projects to distinguish the savings from other variations in energy usage.8 For example, PG&E’s Commercial Whole-Building pilot targets a discernible savings level of 15 percent in order to improve the certainty of estimates. Smaller savings can be determined depending on the building’s “predictability” and the availability of interval meter data. P4P programs (historically and currently) without more granular interval data (such as BPA’s Strategic Energy Management program) estimate savings through “billing analysis” by comparing pre- and post- implementation monthly bills of customers.
M&V can be expensive (on average, all-in M&V costs are 3–5 percent of total project costs), but smart meter data with analytics may offer opportunities to lower costs by estimating savings in a more automated and less intrusive way.63,16 Up to now, M&V automation with smart meter data has been used primarily to identify customers who could be good candidates for EE programs and to allow EE service providers to monitor the performance of underway projects.15 It is possible that if automated or semi-automated M&V is used for whole-building EE P4P, analysis of savings can be conducted more rapidly and provide feedback on results for program administrators on an ongoing basis, rather than only at the completion of the program.15 Currently these approaches to produce final savings values for EE programs are only in the pilot phase, and their true overall cost effectiveness relative to other evaluation methods is still untested.15 If P4P models do use the results of any kind of automated process, program administrators, implementers/aggregators, regulators, and customers must agree in advance on the data required, and any methodology of data cleaning and analysis to arrive at savings estimates.15
Even with the best available models and smart meter data, some buildings are too variable in their energy usage to establish a well-fitting baseline estimate. As a result, a program that employs an Option C normalized metering approach (such as the PG&E Commercial Whole-Building pilot) can screen out less predictable buildings or allow a backup methodology, like IPMVP Option D, as the UC/CSU/IOU MBCx program did in special cases. If a screening approach is applied, the reliability of the savings estimates increases substantially, but at the cost of lowering the number of participating buildings.46 To
account for possible errors in estimation of savings among different buildings, the savings estimates can be aggregated across a set of buildings and the over- and underestimates of savings can cancel out.46 Typically, the accuracy of the aggregated savings estimates increases with more buildings in the portfolio. PG&E’s Residential P4P pilot will use this portfolio-based approach to accommodate the large variation in energy usage from home to home.1
Overall, the uncertainty of savings estimates (how they compare with “real” savings that actually occur) directly relates to the uncertainty of the baseline estimation, if projects are in a portfolio, and other factors such as nonroutine adjustments that influence buildings’ predictability.46 In choosing a methodology to estimate savings from a P4P model, administrators must consider their tolerance for uncertainty, the magnitude of savings expected from the program, and whether the savings are aggregated in a portfolio (allowing underestimated buildings to cancel out overestimated ones, producing more reliable portfolio savings estimates). One challenge is that deemed savings and engineering calculations often assume zero uncertainty in the gross savings estimates, and therefore it can be difficult to compare meter-based estimates with these values.
BASELINE USEDThe baseline encompasses the counterfactual set of conditions that would have occurred without the implementation of the EE measure. Energy savings are calculated as the difference between this baseline and actual usage after an intervention. The choice of baseline is related to the measurement methodology used, and in some cases to state policy regarding allowable savings.
California has historically allowed only for energy savings above the efficiency level required by the existing building code, with the understanding that buildings should all be up to code and that public money should be spent only on above-code savings. California’s new AB 802 legislation allows utilities to count “to code” savings from EE measures that bring the building up to the required building code efficiency, and not just above what is required.21 Some programs also distinguish the baseline for devices that are early replacements versus those that are being installed because the existing device has reached the end of its useful life.
For isolated retrofits, such as those in the New Jersey PSE&G Standard Offer program, the baseline typically reflects documentation of the existing equipment specifications, operating hours, and other conditions in combination with some actual measurement of equipment.
If the measurement methodology is for the whole building, the baseline is typically meter data from a period of time prior to the intervention, normalized for that period’s weather and/or other variables. How long that period should be can vary; programs have used baseline periods as short as three months (UC/CSU/IOU Monitoring-Based

Page 30 PUTTING YOUR MONEY WHERE YOUR METER IS NRDC
Commissioning program) and as long as two years (BPA Strategic Energy Management program). Depending on the building, if the baseline period is shorter than one year, the data can be extrapolated to construct a full-year baseline period; however, to account for seasons, one year is typically recommended. Some models can adjust for building occupancy and other variables, if buildings stay relatively consistent through the baseline and post-implementation period, but as most of that information is not available publicly, estimation software accounts primarily for weather differences and time of day.46 For example, the SCL Commercial P4P pilot and PG&E Residential P4P pilot account only for time and weather.
With a calibrated building simulation, like Option D, software can model the specific building’s energy usage and then calibrate the baseline to actual historical meter data.8 Option D software often also models baselines for different levels of code.
The experimental programs of Opower rely on the energy usage of a control group of customers to serve as the baseline for the treatment group of customers who receive targeted EE messaging.
DATA REQUIRED The resolution and quality of data required for savings estimation depend on the chosen estimation methodology.
Engineering calculations such as Option A and Option B often use data from manufacturers’ specifications for existing equipment and the new EE measure, along with short-term or continuous measurements of certain parameters such as power draw or run time of the device.8
Larger commercial and industrial facilities, in addition to whole-building meters, may have submetering installed, enabling retrofit-specific measurement such as Option B measurement. However, submetering can be expensive to implement if the infrastructure is not already installed for another (non-EE) reason. Commercial facilities also often have a building management system or energy management system (EMS) that can track both building-level energy usage and system operational parameters.2 Some programs such as the UC/CSU/IOU Monitoring-Based Commissioning or the SCE RFO can take advantage of data from an EMS system to supplement whole-building meter data in isolating the usage of specific equipment and/or verifying that EE measures are operating as expected.64,65
Historically, normalized whole-building meter savings have been estimated on a monthly level, matching the regularity of billing data. However, use of interval data can produce more accurate estimates in some buildings. For example, in the UC/CSU/IOU MBCx program, whole-building meters were installed for projects to capture 15-minute interval data because monthly data were not granular enough to help identify potential problems, estimate savings, or monitor ongoing persistence of savings.64 With Option C–style savings measurement, in addition to the meter or billing
data, program implementers must collect data on weather and other variables, such as building occupancy, that may affect energy usage independent of the EE measure.
Especially with whole-building meter data analysis, program administrators also have to choose whether to allow open-source statistical models and/or proprietary models to conduct normalized metering estimates. Public models such as OpenEEmeter usually normalize only for publicly available parameters such as weather and day of week. Many proprietary models can include other parameters, but these data may still not be readily available for all buildings or sectors. In any case, stakeholders must agree on the source, granularity, and location of weather data.66 If using a mix of proprietary and public models, it is useful to have performance metrics and test procedures to compare them for accuracy and uncertainty of savings estimates.46
HOW PAYMENT IS DETERMINED
PAYMENT STRUCTUREGenerally, payments for savings to implementers/aggregators or customers can vary in the number of installments and the portion of the total payment that is based on energy savings versus verified installation of a measure or another metric. Several examples not funded by utility customers have additional payers, payees, and transactions involved in the model.
Most of the utility customer–funded programs attach payments partially to certain milestones and partially to energy savings performance. In many cases, an initial payment is made to the program implementer or EE service provider once installation of the EE measure had been verified (as in the NYSERDA and California SPCs), or after an energy reduction plan had been made (as in the New Jersey C&I P4P program); subsequently, several performance-based payments are made for measured and verified savings. Some models base incentive payments entirely on performance and do not make any up-front payments (UC/CSU/IOU Monitoring-Based Commissioning program in its current form, PG&E P4P Residential pilot).
A key distinction is whether utilities make incentive payments to individual customers, as in most retro-commissioning programs offered within DSM portfolios, or to implementers/aggregators, as in DSM bidding and standard offer programs. Figure 15 illustrates the typical flow of incentive payments and energy savings in many P4P programs that involve aggregators. In these programs, the utility pays an implementer/aggregator (ESCO, contractor, or other service provider) who contracts with customers to install the EE measures and delivers energy savings to the program administrator. The price and other contract terms for EE measure installation and maintenance may be determined between the customer and implementer/aggregator, as with the Texas standard offer programs. The implementer/aggregator entity often passes some or all of the incentive through in their prices

Page 31 PUTTING YOUR MONEY WHERE YOUR METER IS NRDC
to customers for EE projects. The customer’s project costs are recovered through bill savings resulting from the EE measures. In some programs (such as PSE&G), customers are able to directly deliver savings and receive incentive payments.
The earliest and most successful example of an approach not funded by utility customers is the ESCO ESPC business model, which was developed in the 1980s and early 1990s. ESPCs focus on retrofits to federal government buildings and institutional buildings in the MUSH (municipal, university, K-12 school, and hospital) market. ESCOs provide a performance guarantee to the customer that the project will achieve a certain level of savings. Most of the ESCO ESPC projects in the institutional sector do not receive publicly funded incentives, and the customer usually signs a separate financing agreement with a financial institution to cover some of the up-front costs of the EE project.
A newer type of EE service seen in the private commercial, industrial, higher education, and health care sectors is the efficiency services agreement (ESA), whereby a financing company, such as Metrus, funds 100 percent of the up-front project costs for EE and water efficiency measures (usually implemented by an ESCO) and customers pay for realized energy and water savings.50
The Sealed program for residential customers in parts of New York is an example of a managed energy services agreement (MESA). Under a MESA, the implementer (Sealed in this case) completes the retrofit and then takes over the utility bill, paying the utility directly.67 Customers then make payments to Sealed for both energy usage and energy savings, which has a set price per unit.
FIGURE 14: PAYMENT STRUCTURE ATTRIBUTES
FIGURE 15: COMMON PAYMENT STRUCTURE FOR UTILITY CUSTOMER-FUNDED P4P
10. PAYMENT STRUCTURE
UTILITY/PROGRAM ADMINISTRATOR
IMPLEMENTER/SERVICE PROVIDER
PARTICIPATING CUSTOMER
ALL UPFRONTBONUS FOR
NON-LIGHTING/DEEPER SAVINGS
UPFRONT COLLATERAL /
FINANCIAL SECURITY
1 YEAR – 25 YEARS AGGREGATED PROJECTS
ALL PERFORMANCE-
BASED
BONUS FOR NET SAVINGS
OTHER PENALTIES FOR NON-
PERFORMANCE
INDIVIDUAL PROJECTS
PARTIALLY UPFRONT, PARTIALLY
PERFORMANCE- BASED
BONUS FOR SAVINGS AT
CERTAIN TIMES
PRIVATE SECTOR BUSINESS MODEL:
ESPC, ESA, MESA, OR MEETS
11. PENALITES 12. PENALITES13. DURATION
OF CONTRACT/ PERFORMANCE PERIOD
14. PORTFOLIO OR PROJECT
PROVIDE INCENTIVE PAYMENTS
IMPLEMENT EE
MEASURES, WHICH
PROVIDE CUSTOMER
BILL SAVINGS
DELIVER ENERGY SAVINGS
PAY CONTRACTED
SHARE OF PROJECT
COST

Page 32 PUTTING YOUR MONEY WHERE YOUR METER IS NRDC
Under the Metered Energy Efficiency Transaction Structure (MEETS) model, currently piloted in one Seattle building, an investor-funded “energy tenant” implements and maintains EE improvements to a building, making monthly lease payments to the building owner for hosting the building’s EE installation.68 The building owner or tenant pays the utility for both energy saved and energy used (i.e., the energy bill they would have paid absent the EE improvements), and the utility pays the energy tenant under a power purchase agreement (PPA) for the value of the resulting saved energy. DeltaMeter (a dynamic baseline EE meter) software tracks saved energy and reports to all parties.69 A more detailed explanation of the payment flows can be found in the MEETS case study in Appendix 1: Case Studies.
BONUSES AND PENALTIESSome programs have extra incentives for deeper savings, measures that go beyond lighting, demand reductions, or net savings versus gross savings.
For example, the California SPC program included higher payments for non-lighting measures, and during the California energy crisis it also had bonus incentives for peak demand reduction. Under the current SCL P4P and the New Jersey C&I P4P models, the incentive payment per unit increases with higher levels of savings. The PSE&G Standard Offer and NYSERDA’s SPC program also had incentive payments keyed to time of use.
The PG&E Residential P4P pilot will have a bonus to incentivize implementers to pursue net, rather than gross, savings.
Penalties are incorporated into several programs, such as the Con Edison Targeted DSM program. Similar to the penalty terms commonly found in PPAs for under-delivery of energy by conventional generators, EE implementers have to pay high liquidated damages if the verified savings amount is lower than the contracted savings amount. Programs that are using EE as a reliability resource to replace supply-side capacity (such as the SCE RFO and some DSM bidding programs) have more stringent requirements for performance and therefore may also demand that ESCOs post collateral/security to participate. High penalties or other barriers to entry, such as stringent administrative requirements, can deter implementers from participating (as with Con Edison’s DSM bidding program initially).
DURATION OF PERFORMANCE PERIOD/CONTRACTThe duration of P4P performance or contract periods varies widely from as short as one year (UC/CSU/IOU MBCx, the later California SPC program, PG&E Commercial P4P, New Jersey C&I P4P, National Grid P4P) to as long as 20 to 25 years (some ESPC contracts and MEETS). Most commonly, performance periods are around three years long.
If P4P contracts or performance periods are long,
they place financial and performance risk on implementers over an extended period. However, longer performance periods can incentivize deeper and more persistent savings from measures with longer payback periods. According to guidance from IPMVP, program designers should consider the expected lifetime of the EE measure and the likelihood that the savings will degrade over time when deciding on the duration of the program’s performance period.8 In Seattle, the MEETS PPA (20 years) assumes that as EE measures degrade, the “energy tenant” will make necessary improvements to maintain performance. Because the energy tenant is paid only for performance, the assumption is that it has an ongoing incentive to maintain and improve that performance. In contrast, the PG&E residential pilot runs for only two years, but the utility intends to track savings for an additional one to three years to evaluate savings persistence.1 This post-program tracking appears to be a useful way to test the ideal duration of performance periods and any degradation of savings.
AGGREGATED PORTFOLIO OR INDIVIDUAL PROJECT–LEVEL SAVINGS While some P4P models pay for savings on an individual project level, other approaches award payments for savings across a portfolio of projects. In general, aggregating savings estimates across a large sample size of buildings and customers can improve the certainty of overall savings because underestimated and overestimated buildings can cancel each other out.46
The residential sector is one promising application to leverage portfolio-based P4P. The PG&E Residential P4P pilot program will reward aggregators for savings across the whole portfolio, to account for the often large variability in savings among homes. Because many commercial buildings are also not very predictable when normalized meter data analysis is used, commercial whole-building programs may also consider rewarding savings on a portfolio level so that as more buildings participate, they can still maintain a high degree of savings accuracy across the portfolio.46 However, even if savings are claimed by aggregators for an overall portfolio, the programs will still need to sort out how the incentives will be allocated within the portfolio to individual customers/buildings (if at all), especially if results from high and low performers are grouped together to form the overall portfolio savings. PG&E’s Residential P4P pilot will pay incentives to the aggregators but does not specify if and how the aggregators should pass along a portion of the incentive payment to the customer.
Programs that measure energy savings of several buildings on the same site, such as a university campus (as in the UC/CSU/IOU Monitoring-Based Commissioning program), may be suitable for a portfolio approach where the total savings estimate is more accurate than that of individual buildings.36

Page 33 PUTTING YOUR MONEY WHERE YOUR METER IS NRDC
RISK MANAGEMENT Because climate goals, large sums of public funding, replacement or deferral of significant physical infrastructure, and legally mandated EE targets can be at stake, EE program designers should consider the risk implications, relative to other EE programs, of using P4P models to deliver energy savings.
Predictability and certainty of energy and monetary savings drive the participation and investment decisions for many EE stakeholders. Compared with typical up-front rebate programs, which are often based on deemed savings, P4P models can shift the risks and rewards for all entities involved: participants, utilities, implementers/aggregators, and regulators.
Currently many utility customer–funded rebate programs pay incentives to customers and/or implementers based on predetermined deemed savings or custom engineering calculations. The majority of the examples of P4P approaches in this paper pay at least partially on the level of performance as estimated from some form of meter data or direct measurement. A primary reason to use these direct measurements over time is performance risk—the risk that the EE measure will not deliver the expected energy savings.
The table and discussion below analyze risk and reward implications of the typical utility customer–funded P4P approach relative to common up-front rebate programs, examining the effects on the participating customer, the implementer or aggregator, the utility, and the regulator (representing broad customer interests).
Policy Considerations for P4P Design
TABLE 2: SUMMARY OF RISKS AND MITIGATION OPTIONS ACROSS ENTITIES, WITH UP-FRONT REBATE VERSUS P4P
AFFECTED ENTITY RISKS WITH TYPICAL NON-P4P VERSUS P4P MODELS POSSIBLE P4P RISK
MITIGATION OPTIONS
Participating Customer
+/–Mixed Impacton Risk
Non-P4P: Customers usually receive up-front incentive from program administrator or implementer to defray some EE measure costs, based on the expected deemed savings. The risk is that the measures will not perform or the savings will not persist as expected.
P4P: Risk is the same that savings will not persist as expected (it is unclear what the uncertainty of deemed savings is relative to “measured” savings), but in many cases the project-implementing ESCO or other aggregator/ service provider takes on that performance risk. The customer may not receive a predetermined incentive.
• Up-front payment from aggregator to customer
Implementer/Aggregator
+More
Risk with P4P
Non-P4P: Contractors, ESCOs, or other service providers often sign a contract with a customer (directly or via the program administrator) to implement a project, and the payment is set in advance, to be paid after installation of the EE measure.
P4P: In most models the aggregator/service provider delivers the savings to the utility and takes on the performance risk of the EE measures. To compensate for taking on the risk, they may receive a higher payment per unit of savings. If the measures do not perform, an aggregator may receive lower payments or a penalty.
• Mix of up-front and performance-based payments
• Shorter performance period with requirement for minimum savings
• Insurance products• Use of portfolios to diversify risk• Quality assurance and standards
Utility +/–Mixed Impact on Risk
Non-P4P: Utilities can estimate savings from predetermined deemed savings, but savings verified after the completion of the program could be lower than expected, and the utility may not be able to “keep the lights on” if relying on EE as a resource (or may have to procure more energy). Utilities may also not reach emissions or EE targets or receive EE shareholder incentives.
P4P: Even if savings are estimated and paid for on an ongoing basis, actual savings may still turn out lower than expected. However, the utility pays only for savings that materialize and can procure additional savings if needed. Another risk is cream-skimming if aggregators only do easy but not more comprehensive measures.
• Feedback through regular reports to ascertain savings trajectory and determine need to procure more
• Incentives based on portfolio of savings
• Screening for predictable or high-savings-potential buildings
• Penalties to aggregators for not delivering savings
Regulator/ All Utility
Customers
– Less
Risk with P4P
Non-P4P: Utilities/ program administrators use customer funds to pay up front for deemed savings; the risk is that anticipated savings do not materialize.
P4P: Customer funds are used only for “measured” savings, and customers avoid paying for unrealized savings (although there is still risk that savings will be less than expected). There is also risk that not all customers will be served because P4P may be a better fit for some than for others. Another risk is cream-skimming.
• Performance metrics to verify and compare estimation models
• Regular reports on savings trajectory
• Incentives to encourage utilities to serve a wide range of customers and to pursue comprehensive projects

Page 34 PUTTING YOUR MONEY WHERE YOUR METER IS NRDC
CUSTOMERSIf risks increase for customers, they may not be willing to participate in a program. With typical deemed savings programs that offer up-front incentives, customers receive a payment at the beginning of the program, which helps defray some of the EE measure’s cost. Customers may also finance their EE projects based on an expectation of the energy savings from the project, but there is a risk that some of the promised savings may not materialize. Particularly for owner-occupied buildings, often up-front costs are the biggest obstacles for customers to do EE upgrades. For non-owner-occupied buildings, the “split incentive”—when building owners do not have an incentive to invest in EE upgrades to the building because they do not pay the tenant’s energy bill—is a major barrier.
Risk: Under a P4P model, there is still a risk that the savings will not persist as expected (it is unclear what the uncertainty of deemed savings is relative to “measured” savings), but in most cases an aggregator or another service provider takes on the performance risk of the EE measure from the customer. The customer may not necessarily receive the same level of incentive from the aggregator.
Mitigation: In order to relieve a customer of some of the up-front cost barriers of participating in an EE project, an aggregator could provide some modest initial payments to the customer (passing through some of the incentive payment).
IMPLEMENTERS OR AGGREGATORSIf P4P increases risk to implementers/aggregators, this could increase the cost of their services or discourage their participation altogether. With first-generation P4P programs, such as early DSM programs, ESCOs bore the majority of the technology risk and financing risk, often leading the programs to be more expensive than existing utility rebate programs. But as technologies matured, third parties such as banks and efficiency financing companies began to finance projects; subsequently the ESCO market expanded, and individual ESCO risk and costs decreased.31
Risk: If under a P4P program implementers are paid by utilities one or more years after implementing a measure, and only on the basis of metered savings, the implementers will have to bear the risk of not being paid if savings do not materialize—which is appropriate given that they are responsible for the work. However, this may encourage them to do cream-skimming and only target easy measures that will achieve energy savings targets with relative certainty. Such measures may not necessarily achieve persistent or deep savings without program design that promotes more comprehensive projects.
Mitigation: A mix of up-front and recurring performance-based payments can alleviate the risk and up-front financial burden for implementers. Insurance coverage or a diversified portfolio of buildings can also help implementers mitigate risk. Shorter performance periods (five years or fewer) can also lower the risks (and M&V costs) for implementers. However, the duration of the performance
period should still be commensurate with the lifetime of the installed EE measure and long enough to motivate depth and persistence in savings. Frequent program updates on savings estimates, made possible with meter-based data, can also alert implementers if savings are lower than expected and an EE measure is not working as intended. Quality assurance and standards can also help implementers guarantee performance. Aggregating savings across a large portfolio of buildings can diversify risk across over-performing and under-performing buildings.
UTILITIESWith deemed savings estimates, the savings value an EE measure can claim is determined in advance, but the post-program verification and evaluation process may show savings to be lower than expected. If the utility is counting on the EE savings as a resource, it may not be able to “keep the lights on” (or may have to generate more energy). Utilities may also fall short of emissions or EE targets or not receive full shareholder incentives for EE savings.
Risk: With P4P based on meter/billing data, utilities will still bear some of the risk of savings not materializing. If savings as reflected by meter data are lower than expected, utilities may not be able to meet their load obligations, achieve EE savings targets, or earn shareholder incentives. It is unclear what the uncertainty of meter-based savings is relative to deemed savings, which are based on a sample of customers and average conditions. However, the utility pays the implementer/aggregator only for savings that materialize and can procure additional savings if needed. Another risk is cream-skimming if aggregators only do easy measures and not more comprehensive ones.
Mitigation: As with implementers, utilities can mitigate risk of lower-than-expected savings by receiving more immediate feedback on savings numbers on a seasonal or monthly basis. If the trajectory of savings is lower than expected, utilities can work with implementers to either repair failed measures or procure more EE. Programs designed to award savings on a portfolio level can also mitigate the risk of some projects having lower-than-expected savings, as poorly performing buildings may be offset by projects with higher-than-expected savings. The certainty of meter-based savings estimates increases with the number of buildings in a portfolio. Requirements for a minimum level of savings can also help prevent cream-skimming. In addition to these program elements, utilities can design other, more traditional programs for buildings or sectors that may be less suited to a P4P approach, such as buildings with more variable energy usage, or midstream and upstream programs for purchase of efficient products. A hybrid portfolio of EE programs that includes both P4P and traditional programs should make sure that savings (and incentives) are not double-counted across programs. Last, P4P on its own will not eliminate the net versus gross savings risk, unless the program explicitly targets sectors or customers who are not covered by current programs and for whom the savings from a P4P approach would be additional (i.e., net) by design.

Page 35 PUTTING YOUR MONEY WHERE YOUR METER IS NRDC
REGULATORS/UTILITY CUSTOMERSRisk: In most cases, regulators approve utilities’ use of customer funds to pay up front for deemed savings. Savings are verified at the end of the program and may end up lower than expected. Meter-based data estimate energy savings along the way, and utility customer funds are awarded only for performance as the program proceeds. These savings could be lower than predicted, but utilities are only paying along the way for the savings that materialize.
Mitigation: From the regulator and utility customer perspective, a P4P program based on metered savings could lower the risk of spending public funds up front for savings that are not achieved, although the risk of savings not materializing as expected still exists with metered savings (it is unclear how that risk compares with estimates from deemed savings). In order to ensure transparency and accuracy of metered savings estimates, the regulator should analyze the models used to calculate savings estimates and establish standardized performance metrics for the accuracy of those estimates. Standardized performance metrics will be particularly important when both proprietary and public models are used to estimate savings values.
P4P CONSIDERATIONS FOR REGULATORS AND UTILITIESThere are several key considerations for utilities on how to incorporate P4P. These include using P4P to capture EE as a grid resource, fitting P4P into a balanced DSM portfolio addressing all sectors, and the issue of net versus gross savings.
USING P4P TO CAPTURE EE AS A GRID RESOURCE When customers save energy during the grid’s critical times, especially in constrained locations, EE can serve as a resource to 1) lower capacity needs and displace supply-side energy generation; and/or 2) lower demand on parts on the distribution system to defer infrastructure upgrades.
If energy savings from a utility customer-funded P4P program are to be used as a grid resource, one important consideration in the program design is whether P4P will be incorporated as part of the utility’s DSM portfolio or outside of it. Typically, the process for procuring EE savings is separate from the process for procuring supply-side resources or planning infrastructure upgrades. In a traditional DSM program, an administrator screens potential EE measures and programs based on expected avoided energy use and capacity costs and then offers a “cost effective” program.70 The resulting energy savings, which are often estimated or deemed, are deducted from the load forecast (the predicted energy consumption in a certain area). In this model, EE does not directly compete against supply-side resources. Rather, its value as a grid resource—if energy savings can be obtained for less than the cost of alternative supply options—is assessed a priori.
Many of the case studies examined, including the PG&E residential and commercial programs, the Efficiency
Vermont Continuous Energy Improvement program, the BPA Strategic Energy Management program, the New Jersey C&I P4P program, the National Grid P4P program, and the UC/CSU/IOU Monitoring-Based Commissioning program, include P4P as one program within a broader DSM portfolio. With this model, a central administrator, either a utility or an EE program administrator, is responsible for program design. The energy savings that result from P4P efforts contribute to the savings goals for the DSM portfolios, which in turn help to modify the load forecast.
An alternative P4P approach is for utilities to directly procure energy savings through DSM bidding or standard offer programs. The implementers/aggregators who respond to these procurements are usually responsible for designing the service delivery approach and signing up individual customers. They then provide aggregated energy savings to the utility and are compensated at either a set price (if a standard offer) or a negotiated price (if a DSM bidding program). California and New York, in particular, are focused on the increasing importance of distributed energy resources to the electric grid, and the potential for EE and other distributed resources (e.g., storage, demand response, rooftop PV) to avoid or defer infrastructure upgrades and other capital investments. Recent procurements in these states, such as the SCE RFO and Con Edison’s Targeted DSM program, have focused on addressing specific regions of the grid that faced capacity or distribution constraints. In the Con Edison program, for example, ESCOs bid for load reduction at a $/kW value, and Con Edison evaluated the bids relative to a threshold price that varied by network, according to the cost of the distribution infrastructure upgrade alternative.42 When the EE bids were less expensive than the capital improvement, the EE option was executed.42
Utilities may design a solicitation for energy savings just from demand-side resources, or they may open a solicitation to all types of resources. Several early utility-run DSM bidding programs included all-source competitive solicitations in which EE competed directly against supply-side resources. These auctions had mixed results in procuring EE resources due to high transaction costs, especially when utility EE rebate programs existed for the same market segment. Additional challenges arose when EE competed against generation resources without enough consideration of the inherent differences between supply-side and demand-side bids. More recently, the SCE RFO successfully procured about 140 MW of EE resources for local capacity-constrained areas, but that was about 8 percent of the approximately 1,698 MW of fossil generation procured in the same solicitation (which made up 76 percent of the total capacity procured).44
Another P4P option is to bid EE savings as a resource into a regional wholesale capacity market, competing directly with capacity from supply-side bids to meet system reliability needs. For example, ISO New England’s Forward Capacity Market places EE (and demand response) in a regional solicitation with supply-side resources to secure capacity during peak demand times. Since 2008, EE’s participation

Page 36 PUTTING YOUR MONEY WHERE YOUR METER IS NRDC
in the market more than tripled to 2,250 MW (6.3 percent of the total market).71 Still, the majority of savings comes from states where EE mandates already exist and utility customer funds pay for EE programs. These utility customer funds cover the bulk of the cost of acquiring energy savings because revenues from the capacity market alone are not sufficient. The benefit of participating in these capacity markets is that the utilities can formally document the savings from individual utility EE programs in the auction, help avoid their double-counting in load forecasts, and monetize the additional system capacity benefit from EE savings.
The decision about the level at which to procure energy savings—via a P4P track within a DSM portfolio to reduce load, or through a competitive solicitation offered by a utility to address capacity or infrastructure constraints, or at the wholesale level to provide peak capacity—depends on the goal. Each approach involves trade-offs. Because there are potential pitfalls when operating multiple models side by side (e.g., soliciting bids from ESCOs via competitive solicitation while also allowing them to access incentives through a DSM program), it is preferable to make this decision up front. That way, the state, utility, or other program administrator can thoughtfully design its EE portfolio to include P4P approaches while reducing customer and market confusion and avoiding double-dipping of incentives and savings.
MAINTAINING A DSM PORTFOLIO THAT REACHES ALL SECTORS AND SAVINGS OPPORTUNITIESOne challenge when considering a P4P approach is how to maintain a broad and deep DSM portfolio that addresses the full range of EE sectors and savings opportunities. For example, most P4P programs offered to date have focused on the commercial sector. Policymakers in states such as California want to move to estimating EE savings with meter data, but the P4P models that have used meter-based estimation have also focused on commercial customers; most P4P programs open to residential customers have used deemed savings estimates. The PG&E P4P pilot under development is one of the first to test out a smart meter–based savings estimation approach with the residential sector.
Even in the commercial sector, with the best available models and data, some buildings are too variable in their energy usage to establish a well-fitting baseline using meter data. Utilities can address variability among buildings and the challenges of baseline prediction by aggregating savings and payments across a portfolio of buildings. Even so, P4P approaches will tend to give preference to building and customer types that are most likely to yield higher savings. While this makes sense in theory, in practice there is some risk of gaming if an aggregator identifies customers with expected changes in energy usage unrelated to an installed EE measure.72 In one notorious case in an early P4P program, contractors targeted households that included
high school seniors, thereby obtaining energy savings through occupancy changes as the seniors graduated rather than via real investments in energy efficiency.72
Some types of customers, such as low-income customers and small businesses, may tend to be underrepresented in P4P programs because savings in these sectors may cost more to obtain. One option for program designers is to build in provisions to specifically target these customers, through adders to pay more for the savings in these sectors, or to target them through a separate procurement.
Likewise, P4P programs run the risk of cream-skimming, for example by obtaining most or all savings from lighting measures (as was the case with early utility customer–funded P4P programs), unless they are carefully designed to go after a full range of savings opportunities (not only lighting but HVAC, controls, etc.). With increasing EE targets in many states, scaling up EE will likely require aggressive programs that enable deeper savings. Comprehensive packages of multiple EE measures—including commissioning, operational, and behavioral measures—should be incentivized to avoid procuring savings only from the easiest and lowest-saving individual measures. Retro-commissioning, for example, specifically targets low- or no-cost measures to fine-tune building operations and can achieve an average of about 10 percent savings (as with the UC/CSU/IOU Monitoring-Based Commissioning program).
Importantly, P4P approaches based on metered savings are not well suited to address one of the significant savings opportunities that DSM programs target: market opportunities. “Market opportunity” programs focus on new construction or on the replacement of equipment at the end of its life, when it was to be replaced anyway. Unlike a P4P program, where savings are usually calculated against a baseline of pre-measure energy usage (after adjustment for weather), in a market opportunity program, savings are calculated by comparing an efficient new building or piece of equipment to a standard new home or piece of equipment. Market opportunity programs are a significant component of most utility DSM portfolios. They include residential, multifamily, and commercial new construction and major renovation programs; appliance rebates; HVAC rebates; and midstream lighting and HVAC programs that provide instant discounts for efficient products at the point of sale. A recent order in California specifically designated upstream and midstream incentive programs and market transformation programs as statewide initiatives to be administered by a single lead administrator.73 The order noted that statewide upstream and midstream programs are not well suited to P4P approaches; P4P is a better match for utility-run programs that can meter savings directly and shift risk—and responsibility for program design—to third-party implementers and aggregators.
Given the challenges in using P4P to address some sectors and the desire to continue to obtain savings from market opportunity programs, many utilities will likely

Page 37 PUTTING YOUR MONEY WHERE YOUR METER IS NRDC
choose to maintain traditional DSM programs alongside a P4P program. In this way, the utility can use other DSM programs to target customer types and savings opportunities that are not well suited to P4P, and P4P becomes one track within a broader DSM portfolio. While there are clear benefits to maintaining a traditional DSM program in addition to a P4P track, there are challenges as well. In the past, when utilities had P4P programs that overlapped with rebate programs in the same sector or for the same measures, P4P lost out against more lucrative and/or easier-to-access rebate offers. To ensure participation in P4P, the cost per unit of savings should be similar across programs serving the same customer segments. To avoid double-counting savings—and participants double-dipping incentives—utilities and regulators will also need to track which customers have received which payments from which program, and where savings are counted. Newer P4P programs such as SCE’s Local Capacity RFO explicitly prohibit participating in other incentives, and some, such as PG&E residential pilot, have an added complication of requiring data from solar PV customers (because solar generation data can mask effects of EE measures in a meter read of a whole building). As mentioned above, avoiding double-counting of savings with P4P programs will be particularly critical in cases where the EE savings are being used to avoid construction of physical infrastructure and to meet local capacity constraints during peak times.
ESTIMATING NET VERSUS GROSS ENERGY SAVINGSBecause most EE programs are funded through a charge on utility customer bills, utilities in many states can only claim net savings attributable directly to a program. These claimed savings count toward mandated EE targets or can earn utility shareholder incentives in some states. Estimating net program savings can also help prevent double-counting across programs so that load forecasts are accurate.
The regulator typically adjusts gross savings numbers to net claimable values based on an ex-post program evaluation. The adjustments are often based on self-reported surveys of a sample of customers, and utilities do not necessarily know in advance how much their savings values will be discounted by regulators.
Utilities will still face these net versus gross challenges if programs shift to P4P, unless the program is designed from the beginning to procure net savings. For example, a P4P program targeting a set of customers unserved by any other program (which can be challenging to find) may be able to claim net savings directly (though it may also be necessary to account for building codes, depending on the regulation in the state). Alternatively, a randomized control trial or another experimental design comparing the usage of a treatment group of customers with that of a control group not receiving program benefits can estimate net savings from the program directly.74 These statistical experiments can be expensive and difficult to run.
Option C savings estimation, as it is conducted on the meter data for a whole building, naturally leads to calculation of gross savings74 (as do Options A, B, and D). With Option C, the savings calculation has to address nonroutine adjustments to be sure that changes in metered use are correctly attributed to the implemented measure(s) rather than to factors like reduced occupancy or increases in internal loads. Option D building simulation modeling (as used by MEETS at the Bullitt Center in Seattle) can create individual building baselines for both “existing conditions” and any other metric agreed to by the parties. Unless some of the non-program-related factors are controlled for, additional net-to-gross surveys or experimental studies (as proposed by the PG&E Residential P4P pilot) may be needed to isolate the program-specific impacts.
ENGAGING PRIVATE MARKETS TO SCALE EEIn addition to the primary goal of obtaining energy and demand savings, P4P models have the potential to engage the private sector in scaling up EE investments and savings beyond what can be accomplished through programs funded by utility ratepayers. Procurement approaches like standard offers and DSM bidding may be able to drive innovation in EE service delivery, as implementers/aggregators compete to create new business models, attract customers and private investors, and lower costs through competition. California and New York are particularly focused on engaging private markets to achieve greater EE savings. In California, the CPUC recently mandated that at least 60 percent of a utility’s total budgeted EE portfolio be third-party designed and delivered by the end of 2020.73 In New York, one of the REV initiative’s main goals is animating markets to drive innovation. Audrey Zibelman, chair of the New York Public Service Commission, commented on what made the Con Edison Targeted DSM program different: “They just went out and said, ‘We need 52 MW of demand reductions over the next several years. Market, come at us.’ As a result, we’re getting incredibly innovative solutions. Because rather than a bunch of regulators and utility engineers sitting there saying, ‘We know best,’ we’re asking the market. We’re saying, ‘We have a problem. Can you solve it?’ ”75
A large and growing industry of private sector EE providers and financiers are strong candidates to participate in competitive procurements to deliver and finance energy savings. For example, ESCO-implemented performance contracts have completed billions of dollars of MUSH/institutional EE projects, largely outside the purview of utilities. Meanwhile, the property assessed clean energy (PACE) industry is rapidly growing to finance both EE and distributed generation projects, with a large market in the residential sector in California and Florida.60 Sealed is also focused on financing residential sector EE. Other third-party financing models such as Metrus and MEETS are focused on the commercial, industrial, and institutional sectors, where there are large savings opportunities and interested private investors and customers.

Page 38 PUTTING YOUR MONEY WHERE YOUR METER IS NRDC
Opening up program delivery to a wider range of market actors and implementation models is one way to drive innovation and, potentially, higher levels of energy savings. In some cases, utilities may not want to or be allowed to take risks with innovative P4P programs with untested measurement and technology elements if the risk of underperformance remains with the utilities.76 Private investors and companies may have more flexibility and agility to try new, creative models and may be willing to assume performance risk if it is measured by delivery of savings across a portfolio of buildings or customers, or hedged via some other mechanism. If P4P programs are open-ended enough so that utilities simply pay aggregators by unit of savings after metered savings are estimated, third parties can experiment with alternative business model designs. Utilities can also leverage the innovation and the analysis of large amounts of meter data by analytics companies to deploy P4P in places and for people who need it most, targeting certain sectors and locations not served by existing programs.
Key design considerations for regulators and utilities interested in engaging the private market through P4P approaches to EE include:
n Standardized M&V methods. Development of standardized M&V methods is a critical step to allowing a competitive market for EE to flourish. M&V standards can reduce costs for aggregators and other implementers and ensure that EE savings are counted consistently and transparently by all parties. OpenEEmeter is one example of a standardized EE meter and is being used in the PG&E Residential P4P pilot. P4P pilots can incorporate side-by-side testing to compare the accuracy of energy savings from automated M&V with savings based on deemed and modeled methods.
n Data access. Aggregators and other service providers will need access to customer utility data in consistent, machine-readable formats, similar to the access available through the Green Button and Connect My Data tools, once the customer authorizes such access.77 P4P efforts can also take advantage of standard specifications for data exchange, such as HPXML (Home Performance Extensible Markup Language) and BEDES (Building Energy Data Exchange Specification). One option, first proposed in California, is to create an energy data center to aggregate, clean, and sort customer data. Aggregators could access the energy data center to 1) access and analyze anonymized data, with appropriate privacy protections; 2) unlock personally identifiable information with signed authorization from a utility account holder; and 3) register projects and provide information on energy savings.76
n Market access and fairness. It is important to ensure that procurement processes are transparent and that procurements are conducted often enough to allow new market actors to participate. Fairness is also a key concern as utilities both administer competitive procurements and continue to implement EE programs.
One question is whether utilities or utility subsidiaries should be able to participate in EE procurements as aggregators, while also serving as market administrators. In one early standard offer program from PSE&G, a subsidiary of PSE&G participated in the program, crowding out potential third-party ESCO participants. Many ESCOs dropped out after disagreements with the subsidiary.34
It is also worth noting that there are ways to promote innovation in EE program delivery other than turning service delivery over to the private market. While some states have regulatory oversight or EE policy guidelines that may stifle innovation, it is possible to give utilities and other energy efficiency program administrators the flexibility to continually improve programs, adjust portfolios based on evolving goals or market needs, and pilot innovative approaches.78 Regulatory frameworks can be structured to incentivize program administrators to pursue energy and demand savings as well as complementary goals such as carbon reductions, green job creation, and market transformation.
Using P4P to facilitate private-market program implementation opens up some risks as well. First, there is a risk of confusion among customers as they interact with multiple players marketing various offers. Second, there is no guarantee that private actors will be more effective than a central administrator at delivering cost-effective energy savings or overcoming program barriers. Whether a central program administrator is responsible for program design, or an aggregator for service design, both will need to understand the barriers that prevent customers from investing in EE and design interventions to overcome those barriers.
CONCLUSIONP4P approaches across the United States have a long and varied history, with many distinct designs that reflect policy goals and regulatory and market influences of the particular time and place. While there is a wide range of models, this paper uses the term P4P to generally mean an EE approach in which payments are awarded for energy savings on an ongoing basis, as they occur. Many, but not all, P4P approaches estimate savings using some form of meter or bill data collected before and after an EE intervention. Some P4P strategies focus on compensating customers directly for savings performance on individual buildings, and others instead pay for the performance of a portfolio of buildings whose savings are delivered together by an aggregating entity. Most models pay for savings in installments, in order to motivate persistent savings during a performance period and possibly beyond. Because the majority of these P4P payments are awarded only on the basis of an EE measure’s performance, these models are intended to lower the risk of paying for energy savings that do not later materialize.
As demonstrated by the large variations across program elements in the case studies of this paper, P4P is not a panacea and may not be appropriate in all circumstances.

Page 39 PUTTING YOUR MONEY WHERE YOUR METER IS NRDC
P4P has been most tested in the commercial sector, where large customers and high savings opportunities make more complex M&V (as compared with deemed savings) worthwhile for implementers. Most of the historical programs have also been widget-focused—achieving savings primarily from lighting measures—but more recent programs and several current pilots are trying a whole-building approach. Comprehensive-measure whole-building programs can achieve higher savings levels and lend themselves to a meter-based measurement approach. With smart meter data, the cost of whole-building measurement—in an automated or semiautomated way—may be reduced, making M&V for P4P more practical for other sectors such as residential and low income. In addition to retrofits that install new equipment or improve the building itself, whole-building measurement can enable programs to also include operational and behavioral improvements to increase overall savings.
Though P4P is not a substitute for all traditional EE programs, with certain features described above, a second-generation P4P effort may be a promising way to achieve significant, larger-scale savings and attract additional investment and new business models. A significant difference between P4P and other program types is that the EE measures’ performance risk is more
directly borne by the entity responsible for installing and maintaining the measures (rather than the utility or another program administrator). The implications of this on program outcomes will need to be carefully examined by policymakers. Based on a review of the case studies, more experimentation will be required to better assess the relative performance of different approaches, because it is not yet clear if P4P models will be able to achieve more savings than traditional efficiency programs, to achieve these savings at a lower cost, or to achieve different types of savings. It is likely that multiple types of EE models will continue to be needed to capture the range of possible savings across market segments.
Newly available smart meter data and software analytics can provide utilities and other market players with better insights on the energy usage of customers, enabling them to target EE activities and learn what works best for long-lasting and deep savings. In order for P4P models to take advantage of these advancements in analytics for energy savings estimation, regulators and program administrators need to support piloting and learning from both successes and failures. Going forward, rapid sharing of lessons learned—across programs, states, program administrators, the private sector market, and regulators—will be essential.
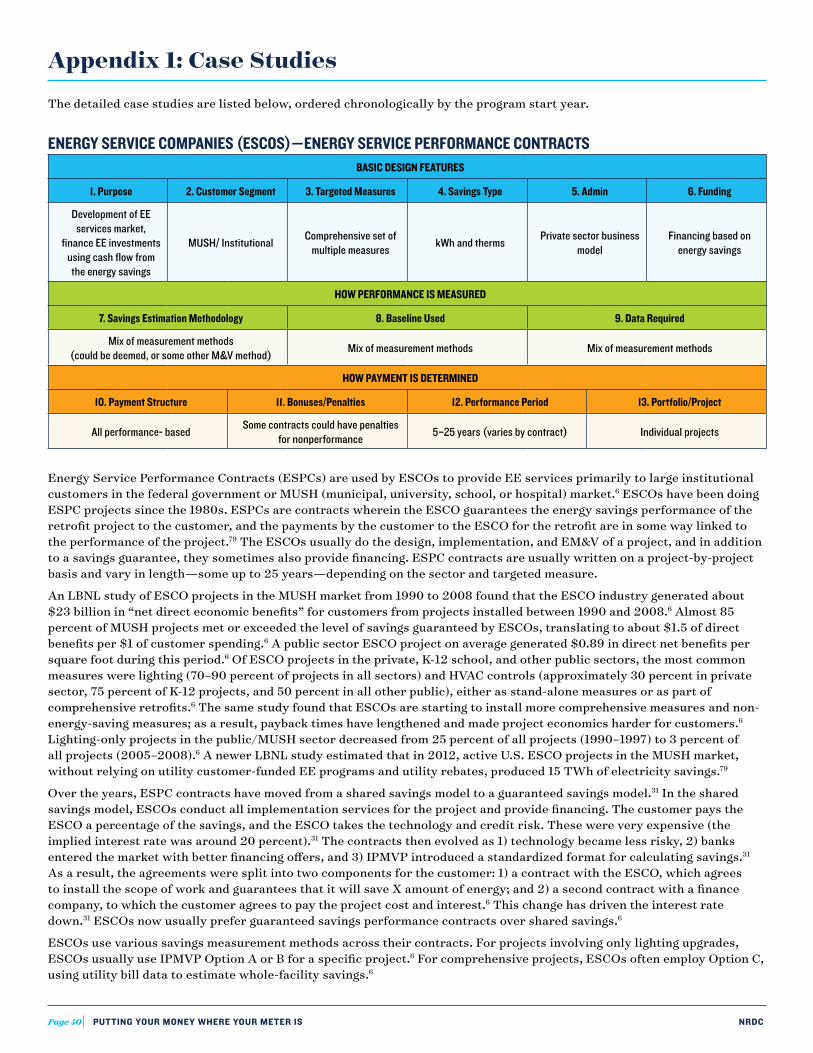
Page 40 PUTTING YOUR MONEY WHERE YOUR METER IS NRDC
Appendix 1: Case Studies
The detailed case studies are listed below, ordered chronologically by the program start year.
ENERGY SERVICE COMPANIES (ESCOS)—ENERGY SERVICE PERFORMANCE CONTRACTSBASIC DESIGN FEATURES
1. Purpose 2. Customer Segment 3. Targeted Measures 4. Savings Type 5. Admin 6. Funding
Development of EE services market,
finance EE investments using cash flow from the energy savings
MUSH/ Institutional Comprehensive set of multiple measures kWh and therms Private sector business
modelFinancing based on
energy savings
HOW PERFORMANCE IS MEASURED
7. Savings Estimation Methodology 8. Baseline Used 9. Data Required
Mix of measurement methods (could be deemed, or some other M&V method) Mix of measurement methods Mix of measurement methods
HOW PAYMENT IS DETERMINED
10. Payment Structure 11. Bonuses/Penalties 12. Performance Period 13. Portfolio/Project
All performance- based Some contracts could have penalties for nonperformance 5–25 years (varies by contract) Individual projects
Energy Service Performance Contracts (ESPCs) are used by ESCOs to provide EE services primarily to large institutional customers in the federal government or MUSH (municipal, university, school, or hospital) market.6 ESCOs have been doing ESPC projects since the 1980s. ESPCs are contracts wherein the ESCO guarantees the energy savings performance of the retrofit project to the customer, and the payments by the customer to the ESCO for the retrofit are in some way linked to the performance of the project.79 The ESCOs usually do the design, implementation, and EM&V of a project, and in addition to a savings guarantee, they sometimes also provide financing. ESPC contracts are usually written on a project-by-project basis and vary in length—some up to 25 years—depending on the sector and targeted measure.
An LBNL study of ESCO projects in the MUSH market from 1990 to 2008 found that the ESCO industry generated about $23 billion in “net direct economic benefits” for customers from projects installed between 1990 and 2008.6 Almost 85 percent of MUSH projects met or exceeded the level of savings guaranteed by ESCOs, translating to about $1.5 of direct benefits per $1 of customer spending.6 A public sector ESCO project on average generated $0.89 in direct net benefits per square foot during this period.6 Of ESCO projects in the private, K-12 school, and other public sectors, the most common measures were lighting (70–90 percent of projects in all sectors) and HVAC controls (approximately 30 percent in private sector, 75 percent of K-12 projects, and 50 percent in all other public), either as stand-alone measures or as part of comprehensive retrofits.6 The same study found that ESCOs are starting to install more comprehensive measures and non-energy-saving measures; as a result, payback times have lengthened and made project economics harder for customers.6 Lighting-only projects in the public/MUSH sector decreased from 25 percent of all projects (1990–1997) to 3 percent of all projects (2005–2008).6 A newer LBNL study estimated that in 2012, active U.S. ESCO projects in the MUSH market, without relying on utility customer-funded EE programs and utility rebates, produced 15 TWh of electricity savings.79
Over the years, ESPC contracts have moved from a shared savings model to a guaranteed savings model.31 In the shared savings model, ESCOs conduct all implementation services for the project and provide financing. The customer pays the ESCO a percentage of the savings, and the ESCO takes the technology and credit risk. These were very expensive (the implied interest rate was around 20 percent).31 The contracts then evolved as 1) technology became less risky, 2) banks entered the market with better financing offers, and 3) IPMVP introduced a standardized format for calculating savings.31 As a result, the agreements were split into two components for the customer: 1) a contract with the ESCO, which agrees to install the scope of work and guarantees that it will save X amount of energy; and 2) a second contract with a finance company, to which the customer agrees to pay the project cost and interest.6 This change has driven the interest rate down.31 ESCOs now usually prefer guaranteed savings performance contracts over shared savings.6
ESCOs use various savings measurement methods across their contracts. For projects involving only lighting upgrades, ESCOs usually use IPMVP Option A or B for a specific project.6 For comprehensive projects, ESCOs often employ Option C, using utility bill data to estimate whole-facility savings.6

Page 41 PUTTING YOUR MONEY WHERE YOUR METER IS NRDC
CONSOLIDATED EDISON INTEGRATED DEMAND-SIDE MANAGEMENT BIDDING PROGRAMBASIC DESIGN FEATURES
1. Purpose 2. Customer Segment 3. Targeted Measures 4. Savings Type 5. Admin 6. Funding
EE as a grid resource Residential, commercial, industrial Individual measures kW Utility Utility customer funds
HOW PERFORMANCE IS MEASURED
7. Savings Estimation Methodology 8. Baseline Used 9. Data Required
Installation verification and annual certification Installation verification and annual certification Installation verification
HOW PAYMENT IS DETERMINED
10. Payment Structure 11. Bonuses/Penalties 12. Performance Period 13. Portfolio/Project
Awarded installation verification and annual certification None 10 years
Portfolio of single-measure projects by ESCO, required letters
of intent for each customer
This case is an example of a demand-side management (DSM) bidding program, which is an auction solicitation that can either be integrated (as an “all source” solicitation) to also procure traditional generation resources, or restricted to only demand-side resources. Under this general program type, utilities announce a kWh or kW savings quantity desired out of the competitive solicitation. For demand-side resources, either program implementers—such as energy services companies (ESCOs), contractors, consulting firms, and manufacturers—or individual customers submit bids for savings they can provide at a given price. Utilities then evaluate and choose bids using a predetermined scoring system, usually comparing prices with the avoided cost of generation capacity or energy. Utilities negotiate final, binding, long-term contracts with winning bidders.
Starting in 1988, the New York Public Service Commission ordered the seven investor-owned utilities (IOUs) in the state to develop competitive bidding solicitations for both supply and DSM resources in response to forecast capacity shortfalls. The overall program design was therefore greatly influenced by the utility’s emphasis on reliability.25 Consolidated Edison (Con Edison) in New York issued a request for proposals (RFP) in 1990 for 200 MW of capacity, which could come from demand-side resources or generation resources, and used a scoring system to rank the bids on price and other factors.25 Participants had to bid contract terms of 10 or more years.25 After evaluating the bids using a $/kW price adjusted for non-price factors such as viability and risk, Con Edison chose 3 out of 4 proposed DSM projects worth 10.5 MW, and 5 of 43 proposed supply projects worth 204 MW. As of 1993, Con Edison had signed contracts with two of the winning DSM bidders, totaling 8.2 MW; the third winning DSM bidder, for commercial lighting energy savings, dropped out during the negotiations when one of its signed customers withdrew.25 The average levelized total resource cost of the two signed DSM bids was 5.6 cents/kWh (compared with 7.0 cents/kWh for supply-side bids).25
The program was open to residential, small and large commercial, and industrial customers, and the minimum bid was 100 kW for one site or a consolidated set of sites.25 Con Edison administered the program, and the EE measures were implemented by ESCOs, individual customers, or customer cooperatives.25 For the residential sector, the eligible measures were compact fluorescent lamps (CFLs), timers on water heaters and pool pumps, timers and efficient air conditioners (AC), and alternative-fueled water heaters. For the commercial and industrial sectors, the eligible measures were CFLs, efficient fluorescent lamps, efficient ballast and lamp combos, high-efficiency motors, efficient electric AC, and gas AC.25 Bids could not exceed ceiling prices that were set for each of the eligible measures. To avoid cream-skimming, all measures had to have a payback period longer than two years.25 Even for their larger customers, ESCOs could not include projects in their bids that had comprehensive packages of multiple measures—one of the main specialties of ESCOs; Con Edison also limited the eligible measures to those with which the utility had the most experience (through rebate programs) so it could more easily evaluate the results of the program.25 Incentives were awarded after a pre- and post-installation verification of measures, and on a recurring basis after an annual certification.25 The program was funded with utility customer funds.
Compared with other utilities’ DSM solicitations, the market response from ESCOs was small, mainly because of the stringent and complex eligibility requirements and the limited list of allowable measures.25 Con Edison chose high-threshold requirements because of concerns about project viability, requiring ESCOs to sign letters of intent when they submitted their bids, and not allowing any substitution of projects if one fell through at a later point.25 The up-front cost of bid preparation was also high for individual customers. DSM bids came in lower than the price ceilings and the avoided supply cost, but the avoided cost forecast decreased over time, including during the negotiation period (which took 10 to 18 months, instead of the expected 4 months).25 Price factors (as opposed to monetized environmental factors) had the largest effect on bid scoring. The winning DSM bids were for commercial lighting and motors projects.25

Page 42 PUTTING YOUR MONEY WHERE YOUR METER IS NRDC
NEW JERSEY PUBLIC SERVICE ELECTRIC & GAS STANDARD OFFER PROGRAMBASIC DESIGN FEATURES
1. Purpose 2. Customer Segment 3. Targeted Measures 4. Savings Type 5. Admin 6. Funding
EE as a grid resource, development of EE
services market
Residential, commercial, industrial
Comprehensive set of multiple measures kWh and kW Utility Utility customer funds
HOW PERFORMANCE IS MEASURED
7. Savings Estimation Methodology 8. Baseline Used 9. Data Required
Mix of measurement methods (could be deemed, or some other M&V method) Pre-implementation operating/device data Other electrical metering
HOW PAYMENT IS DETERMINED
10. Payment Structure 11. Bonuses/Penalties 12. Performance Period 13. Portfolio/Project
All performance-basedBonus for time-differentiated savings;
penalties for nonperformance; liquidated damages
5, 10, or 15 years Aggregated portfolio of projects by ESCO
New Jersey’s Public Service Electric & Gas (PSE&G) implemented an early example of a standard offer program in 1993, after discontent from the energy services industry about the utility’s 1989 all-source bidding program.34 Under the standard offer program, PSE&G set a price it would pay for a measured unit of energy savings over a certain time period and signed long-term contracts (of 5, 10, or 15 years) with ESCOs or customers directly to deliver the savings. The PSE&G program had few restrictions on allowed measures; was open to residential, commercial, and industrial sectors; and was open to new construction projects in addition to retrofits.34 At an initially targeted 150 MW of energy savings, the program was larger than any contemporary utility EE program that relied on ESCOs and contractors to deliver energy savings.34
The program had a first wave of commitments of only 40 MW; while less than the target of 150 MW, this was higher than most DSM bidding programs at the time.34 In some sectors, such as large commercial office buildings, the penalties for nonperformance and the long contract terms dissuaded customers from signing up with ESCOs to the program. Participants had to pay penalties if they did not deliver energy savings or if they did not maintain 80 percent of the forecast demand reductions during summer.34 Participants also had to pay liquidated damages if projects did not come online within three months of the agreed operational date.34 A subsidiary of PSE&G also participated in the program, causing problems in crowding out potential third-party ESCO participants, many of which dropped out of the program after disagreements with the subsidiary.34 In the first set of contracts, lighting projects were most popular (66 percent of savings).34 The total resource cost of measures averaged 5.9 cents/kWh for lighting only, 7.3 cents/kWh for fuel-switching in combination with other measures, and 7.8 cents/kWh for lighting in combination with other measures.34 Bidders were able to bundle together projects in their proposals.34
The M&V for lighting savings was based on continuously monitoring the lighting run-time of a sample of circuits of the site, multiplied by the difference in the manufacturer’s ratings on the previous and new lighting fixtures.34 Though the program evaluation found issues with certain aspects of the M&V practices of the standard offer program and could not verify the supposed 90 percent confidence interval of savings estimates, it found that the overall added accuracy of the estimates was worth the additional cost.34
Competition between ESCOs was highest in the commercial and industrial sector, where the program evaluation found the standard offer concept to be most appropriate for retrofits, as opposed to new construction or in situations requiring emergency replacements (where the customer had a short time frame in which to invest in new equipment).34 Transaction costs and risk were high for the residential sector, especially as existing rebate programs already targeted those customers.34
By 2000 the program had procured about 230 MW of savings, but at a high cost to the utility, since its incentives covered 80–90 percent of total project costs.29 The initial program evaluation found that as the standard offer and prior DSM bidding programs shifted risk away from utility customers and onto the implementing ESCOs or participants, the cost per kWh of savings (mainly from lighting) was higher than that of a rebate program (by about 1–2.5 cents/kWh).34 While the more established rebate programs would likely have higher customer penetration, the persistence of savings would be less certain (as performance is not incentivized over time).34

Page 43 PUTTING YOUR MONEY WHERE YOUR METER IS NRDC
CALIFORNIA NONRESIDENTIAL STANDARD PERFORMANCE CONTRACT (1998–1999, 2000–2005)BASIC DESIGN FEATURES (1998—1999)
1. Purpose 2. Customer Segment 3. Targeted Measures 4. Savings Type 5. Admin 6. Funding
EE as a grid resource, development of EE
services market
Commercial and Industrial (C&I) Individual measures kWh Utility Utility customer funds
HOW PERFORMANCE IS MEASURED
7. Savings Estimation Methodology 8. Baseline Used 9. Data Required
IPMVP Option B, C, or D (not A, stipulated savings) Mix of measurement methods Mix of measurement methods
HOW PAYMENT IS DETERMINED
10. Payment Structure 11. Bonuses/Penalties 12. Performance Period 13. Portfolio/Project
Partially up-front, partially performance-based
Bonus for non-lighting savings/deeper savings 2 years Aggregated portfolio
of projects by ESCO
BASIC DESIGN FEATURES (2000—2005)
1. Purpose 2. Customer Segment 3. Targeted Measures 4. Savings Type 5. Admin 6. Funding
EE as a grid resource Commercial and Industrial (C&I) Individual measures kWh and kW Utility Utility Customer Funds
HOW PERFORMANCE IS MEASURED
7. Savings Estimation Methodology 8. Baseline Used 9. Data Required
Mix of measurement methods (could be calculated, or some other M&V method) Mix of measurement methods Mix of measurement methods
HOW PAYMENT IS DETERMINED
10. Payment Structure 11. Bonuses/Penalties 12. Performance Period 13. Portfolio/Project
Partially Up-front, Partially Performance- Based Bonus for time-differentiated savings 1 year (measured) or
6 months (calculated)Aggregated portfolio of projects by ESCO
The Nonresidential Standard Performance Contract (SPC) program was developed in late 1997, coincident with California’s electricity sector deregulation. At the time, the California Public Utilities Commission (CPUC) wanted to encourage the development of a self-sustaining EE services industry and test whether EE could stand as a value-added product in the deregulated market.40,80 From public utility customer funds, utilities offered a fixed $/kWh for energy savings, with all the terms (payment, M&V, operating rules) in a standard contract implemented by EE service providers or customers directly.40 The program started as a combined nonresidential SPC program and then in 1999 split into large customers (>500 kW) and small customers (<500 kW) programs.40 The small nonresidential SPC program in 1999–2000 tried to do “M&V light” with a shorter performance period and lower eligibility requirement, but it did not last long because it was still too much hassle for implementers of small projects, and competed with overlapping incentive programs.80,81
The programs were open to almost any equipment replacement or retrofit project with a useful life of greater than three years, and for which savings could be measured and verified.40 Example measures included lighting and lighting controls, variable-speed drives on electric motors, and HVAC.40 To qualify for the large SPC program, a project needed to produce a minimum level of energy savings; however, two or more projects with the same measures and similar sites could be aggregated to meet this requirement.40 In the 1998–1999 program years IPMVP Options B, C, and D were allowed to estimate savings; Option A (mainly stipulated savings) was not allowed.82 Option B (metered savings of all equipment or systems) was recommended and most commonly used because it required short-term or continuous monitoring and was used to calculate measure-level savings.82 During the performance period, project sponsors received payments in three installments: 40 percent up front for installation, and 30 percent for each subsequent year of measurement.83 The incentive was based on average measured savings during each of the two one-year performance periods. From the program’s beginning until 2000, the incentives were lowest for lighting-only measures (7.5 cents/kWh in 1998 and 5 cents/kWh in 1999–2000). They were highest for HVAC and refrigeration (21 cents/kWh in 1998 and 16.5 cents/kWh in 1999–2000) and gas savings (27 cents/therm in 1999–2000).40 All the incentives increased in 2001, but the relative ranking of measures

Page 44 PUTTING YOUR MONEY WHERE YOUR METER IS NRDC
remained the same.40 The differentiated pricing for higher-saving measures appeared to be effective at changing consumer behavior.83 The portion of savings from lighting measures fell from about 33 percent in 1998 to about 25 percent in 2001.40
In 2000, tension grew between program administrators and participants about the complexity and cost of M&V.82 Some customers and EE service providers complained that the program M&V was expensive relative to the incentive size.80 Conversely, some ESCOs liked the M&V as it was more aligned with what they already did for large customers and investment-grade audits, thus giving them a competitive advantage over other program implementers.80 Additionally, utilities had to do a lot of work to track savings of “year 1” and “year 2” for different program-start-year cohorts.80 Therefore, between the 2000 and 2001 program years, a calculated savings approach was offered in addition to the measured savings approach (which was incentivized with a higher payment).40 The program is listed as two case studies in this report because of this significant change. The calculated approach could use either 1) reference tables provided for lighting and variable-speed drives for HVAC; 2) estimation software; or 3) engineering calculations.40 In addition, the performance period length was shortened. The incentive had been paid over a two-year performance period in the 1998–99 and 2000–2001 programs.40 In 2001, the required performance period fell from two years to one year for the measured approach, and to six months for the calculated approach.40 In program year 2001, most participants chose the calculated option despite the 10 percent higher incentive for measured savings.40
During the energy crisis starting in 2000–2001, a peak summer incentive was offered. During this time, program funding for SPC decreased, and there was also increased competition for EE programs by local government initiatives.40 As a result, the SPC program was pushed, step by step, to a calculated rebate program, as measured savings were more complicated and did not pay enough relative to calculated programs.80 In 2005, the total program across California achieved yearly net savings of about 350 million kWh, 43,000 kW, and 8.2 million therms.84 The program essentially ended in 2005, and in 2006 the utilities started running calculated incentive programs, similar to current custom rebate programs.80 Around this time, the shareholder incentive mechanism started, EE goals increased for utilities, and utilities did not have an incentive to require measured savings.80
NEW YORK ENERGY SERVICES INDUSTRY PROGRAM STANDARD PERFORMANCE CONTRACT— NEW YORK STATE ENERGY RESEARCH AND DEVELOPMENT AUTHORITY (NYSERDA)
BASIC DESIGN FEATURES
1. Purpose 2. Customer Segment 3. Targeted Measures 4. Savings Type 5. Admin 6. Funding
EE as a grid resource, development of EE
services market
Residential, commercial, industrial,
MUSHIndividual measures kWh and kW Statewide third-party
public admin Utility customer funds
HOW PERFORMANCE IS MEASURED
7. Savings Estimation Methodology 8. Baseline Used 9. Data Required
IPMVP Option B, C, or D (not A, stipulated savings) Mix of measurement methods Mix of measurement methods
HOW PAYMENT IS DETERMINED
10. Payment Structure 11. Bonuses/Penalties 12. Performance Period 13. Portfolio/Project
Partially up-front, partially performance-based
Bonus for time-differentiated savings; smaller sites received additional 20 percent over normal incentive levels
2 years Aggregated portfolio of projects by ESCO
The Energy Services Industry program began in 1999, administered by the statewide third-party New York State Energy Research and Development Authority (NYSERDA) and implemented by ESCOs. The program included a dedicated standard performance contract (SPC) program started in 1999 and did not allow direct customer participation because it aimed to build up the ESCO market.43 The SPC program was paired with a financing program providing incentives to cover up to 50 percent or $50,000 of the expense of developing a contract for the institutional market.43 Initially the program did not have high participation because the incentives were too low to cover the proposed stringent and expensive M&V of the program.31 There also was a 10 percent cap on how much of the total program funds an individual ESCO could earn in incentives, in order to limit each one’s market share.43 The National Association of Energy Service Companies (NAESCO) then negotiated relatively simple changes to M&V: increases to the market cap for individual ESCOs, increases to the incentive levels from about 15 percent to 25 percent of project cost, and an added bonus for NOx emissions reductions.31,43 After these changes, the program increased uptake from seven participating companies to 28 ESCOs in 2000 (with 55 project applications totaling $13.3 million in incentives).43 In 2000, the program gave out about $2 million in incentives per month.43 The program was fully booked for about a decade and paid out a fraction of the long-term avoided costs for savings.31

Page 45 PUTTING YOUR MONEY WHERE YOUR METER IS NRDC
The program paid fixed $/kWh incentives that differed by technology installed, which included lighting, motors, and cooling. The highest incentive was paid for cooling measures.85 Initially the program incentivized only kWh but later also paid for kW savings, with bonuses for summer peak savings.31,85 The savings estimation methodology depended on the IPMVP option selected, but participants could not use Option A.43 The program paid 40 percent of incentives to ESCOs after verifying EE measure installation and paid the remainder over the two-year performance period.43 The program was funded by utility customer funds (through a public benefit charge) and was open to large commercial, industrial, MUSH, and multifamily buildings.43
A later report refers to the same program as the New York Energy $mart C/I Performance program.85 According to that 2002 report, since 1999 the program has committed more than $65 million in incentives for 344 projects implemented by 80 unique ESCOs.85 The projects were expected to contribute annual energy savings of 412 million kWh and a summer peak demand reduction of 90 MW.85 The annual incentives were 10.5 cents/kWh for lighting, 12.8 cents/kWh for motors, 28.8 cents/kWh for cooling, and customized for other measures. The total incentive per project was calculated by multiplying the average annual energy savings by the incentive rate.85 Smaller projects and summer peak demand reductions from high-efficiency electric chillers or unitary AC units received additional bonus incentive payments.85 The Energy $mart C/I Performance appears to have since evolved into the C/I Performance Program, which become the Enhanced C/I Performance Program and then the currently operating Existing Facilities Program.86
TEXAS STANDARD OFFER ENERGY EFFICIENCY PROGRAMSBASIC DESIGN FEATURES
1. Purpose 2. Customer Segment 3. Targeted Measures 4. Savings Type 5. Admin 6. Funding
DSM goals for energy savings, development of EE services market, EE as a grid resource
Residential, commercial, industrial Individual measures kWh and kW Utility Utility customer funds
HOW PERFORMANCE IS MEASURED
7. Savings Estimation Methodology 8. Baseline Used 9. Data Required
Mix of measurement methods (residential programs deemed, other sectors could be using other M&V) Mix of measurement methods Mix of measurement methods
HOW PAYMENT IS DETERMINED
10. Payment Structure 11. Bonuses/Penalties 12. Performance Period 13. Portfolio/Project
All performance-based (other than deemed savings) Information unavailable Information unavailable Aggregated portfolio
of projects by ESCO
In 2000 TXU Electric began its Texas Energy Efficiency Matters standard offer pilot, expanding on prior standard offer programs.43 This was part of an effort to meet statewide energy efficiency standards in Texas (SB7 passed in 1999, requiring EE to meet 10 percent of annual demand growth), spur the private sector energy services market post-deregulation, lower peak capacity requirements, and open EE standard offer programs to all customer classes.87 The first-come, first-served incentive program started with the Large Commercial and Industrial Retrofit program and Small Air Conditioner Distributor program.43 The retrofit program was a standard offer program that awarded a fixed $/kWh for verified annual savings from a preapproved list of measures, with the possibility of additions (if a measure had a life exceeding 10 years and provided peak savings).43 Fuel-switching measures from electric to gas were also eligible.43 Customers could directly participate as long as they met the program requirements.
The TXU program offered different options for M&V: deemed, simple M&V, or full M&V.43 The deemed savings were stipulated in advance based on typical operating characteristics and manufacturers’ equipment specifications.43 The simple M&V option involved pre-implementation engineering calculations augmented by short-term testing or long-term metering.43 Full M&V (mainly for custom projects) entailed whole-building billing analysis, calibrated simulation, or metered savings of equipment or systems.43 The M&V option chosen for each project depended on available data for equipment from previous programs, predictability of equipment, and the benefits of more complex M&V relative to its cost.43
Since the TXU pilot, the Texas state EE mandate was increased to 20 percent of annual demand growth by 2009, and 30 percent by 2013. In 2013 Public Utilities Commission rulemaking and legislation changed the EE standard to a percentage of peak demand.87 Now utilities all over the state have standard offer programs for all sectors (residential, small and medium commercial, large commercial, low income), and EE in Texas is procured mainly through standard offer programs

Page 46 PUTTING YOUR MONEY WHERE YOUR METER IS NRDC
or market transformation programs (including for distributors, retro-commissioning, and school programs).51 In program year 2014, more than 100 unique EE service providers across Texas implemented projects for the commercial standard offer program, and more than 200 participated in the residential standard offer program.51 Transmission and distribution utilities administer the programs, and retail electric providers, contractors, and ESCOs implement them.87 As part of the standard offer programs, customers select the EE service provider and decide on the measures to install, warranty, and financing.39 The program incentives are funded by utility customer funds.43
According to a report on the statewide EE results, in program year 2014 (PY2014) the 10 Texas investor-owned electric utilities regulated by the Public Utility Commission of Texas delivered statewide savings of 180 million kWh from commercial standard offer programs (33 percent of statewide energy savings that year) and about 140 million kWh from the residential standard offer program (about 27 percent of statewide savings that year); the remaining savings came from market transformation, low-income/hard-to-reach programs, or load management programs.51 The residential standard offer program achieved about 50,000 kW of demand savings (13 percent of total demand savings), and the commercial program achieved about 40,000 kW (9 percent of total demand savings) demand savings in PY2014.51 Across the commercial sector (where 71 percent of kW savings were from standard offer programs), 77 percent of the energy savings and 59 percent of the demand savings were from lighting, and 10 percent of energy savings and 20 percent of demand savings came from HVAC (the next-highest measure category).51 In the residential sector, building shell upgrades contributed 46 percent of demand and 33 percent of energy savings, and HVAC had 29 percent of demand savings and 44 percent of energy savings; lighting contributed only 2 percent of the demand savings and 3 percent of the energy savings in the sector.51
CONSOLIDATED EDISON—TARGETED DEMAND-SIDE MANAGEMENT PROGRAM BASIC DESIGN FEATURES
1. Purpose 2. Customer Segment 3. Targeted Measures 4. Savings Type 5. Admin 6. Funding
EE as a grid resource Residential, commercial, industrial Individual measures kW Utility Utility customer funds
HOW PERFORMANCE IS MEASURED
7. Savings Estimation Methodology 8. Baseline Used 9. Data Required
Deemed savings or engineering estimates Deemed savings/Technical Reference Manual Deemed savings/Technical Reference Manual
HOW PAYMENT IS DETERMINED
10. Payment Structure 11. Bonuses/Penalties 12. Performance Period 13. Portfolio/Project
All performance-based Up-front security; liquidated damages; time-differentiated savings
Was originally 10 years, dropped to 5 years
Aggregated portfolio of projects by ESCO
In response to several parts of the New York City distribution system approaching its capacity (the system is mainly underground and therefore very expensive to upgrade), Con Edison deployed a targeted DSM program in 2003.42 The program, to reduce peak load, began as a pilot primarily with commercial and industrial customers and then grew to a much larger program that included residential customers.42 ESCOs bid for load reduction at a $/kW value, and Con Edison evaluated the bids relative to a threshold price.42 Initially Con Edison did not reveal the threshold price to the ESCOs, but in the expanded program the threshold was made public (and bids subsequently came in just under the ceiling).42 The savings estimates came from engineering calculations (with manufacturers’ specifications) or deemed values and did not use any physical measurements.42 Because Con Edison was relying on EE to reduce peak load so it would not have to make physical distribution capacity upgrades, the company conducted stringent inspection of every site to determine the baseline and verify EE measure installation.42
The program started with a pilot Phase I, which ran until 2007 and achieved 40 MW of savings (in Manhattan, Brooklyn, and the Bronx).42 As ESCOs were 7 MW short of the contracted amount (presumably because they did not reach enough customers, or because some of the installations did not pass the post-installation verification), Con Edison collected a large dollar amount of liquidated damages from the ESCOs.88 In later phases the program expanded to a wider geographic area (Manhattan, Staten Island, Westchester County).42 As of 2010, the program achieved 89 MW of load reductions with more than 40,000 participating customers.42 Between 2003 and 2010, after program costs, Con Edison saved $75 million in avoided transmission and distribution upgrades and more than $300 million in total efficiency benefits.88

Page 47 PUTTING YOUR MONEY WHERE YOUR METER IS NRDC
Individual measures with load during the grid’s peaking hours, such as lighting, HVAC, and motors, were eligible for the program; no measures relying on control systems were allowed because they were considered harder to monitor.42 The savings were deemed for lighting and were estimated for HVAC and other measures using engineering calculations, based on the load in use during peak hours.42 All of the sites were verified for existing equipment (to establish the baseline) and newly installed equipment.42 There were also supplemental inspections to ensure the persistence of load reduction.42 For residential customers added in Phase II of the program, Con Edison developed a savings tracking system called “tag and bag”: ESCOs saved every old lamp along with the packaging for the replacement lamp.42 Any savings degradation due to the removal of the load reduction equipment (usually because of relocation, remodeling, or failure) had to be addressed within 30 days of discovery during an inspection, or Con Edison would hold back 10 percent of invoiced payments to the ESCO.42
Natural turnover in New York City and the economic recession had mixed impacts on the program (load naturally went down, but so did participation in the program).42,88 Lighting contributed the majority of reductions (96 percent as of 2010) because it was cheapest, had a quick payback, and was easy to market.42 In some areas of the grid such as lower Manhattan, with high EE goals and an already high penetration of efficient lighting, ESCOs began seeking bigger upgrades such as HVAC.42 Because the follow-up inspections were costly, the program was eventually modified for Con Edison and its contractor, ICF, to do random inspections and modify some of the ESCO payments.42 In its current iteration of the program, Con Edison is using more data and modeling tools to achieve higher-precision targeting for planning future projects, such as a proposed $200M Brooklyn–Queens project.88
UNIVERSITY OF CALIFORNIA/CALIFORNIA STATE UNIVERSITY/INVESTOR-OWNED UTILITY ENERGY EFFICIENCY PARTNERSHIP MONITORING-BASED COMMISSIONING PROGRAM
BASIC DESIGN FEATURES
1. Purpose 2. Customer Segment 3. Targeted Measures 4. Savings Type 5. Admin 6. Funding
DSM goals for energy savings MUSH/Institutional
Behavioral, retro-commissioning, operational savings/
whole-building
kWh and therms Utility Utility customer funds
HOW PERFORMANCE IS MEASURED
7. Savings Estimation Methodology 8. Baseline Used 9. Data Required
Meter-based measurement (IPMVP Option C or other normalized metering) Normalized pre-implementation meter data AMI/interval meter data
HOW PAYMENT IS DETERMINED
10. Payment Structure 11. Bonuses/Penalties 12. Performance Period 13. Portfolio/Project
All performance-based None 1 year Individual projects
The University of California (UC) and California State University (CSU) systems and their combined 33 campuses have partnerships with the major California investor-owned utilities (IOUs) to do EE programs including retrofit, monitoring-based commissioning (MBCx), training, and education.52 The UC/CSU/IOU Partnership pays for the programs with public benefit funds.52 The MBCx program started as a pilot in 2004 and is still running today.89 The program includes ongoing monitoring partly in response to research showing that one-time retro-commissioning did not lead to persistence in savings. The IOUs administer the program, and external or internal commissioning agents implement the EE measures for the campuses. The program focuses on retro-commissioning and monitoring of equipment—including HVAC equipment, boilers, chillers, and lighting—for buildings greater than 25,000 square feet or clusters of smaller buildings near each other.55 The program especially targets buildings with mechanical air conditioning and high baseline energy use. Participating buildings cannot receive any other utility incentive during the program period.55
After benchmarking buildings and selecting a project, the campus installs monitoring and data acquisition systems such as whole-building metering or connections to the campus or building energy management system/energy information system. The campus then collects whole-building meter data for all energy sources (and possibly submetering, if the campus wants to isolate certain loads) for at least three months (not including January or July) to determine an annual baseline.55 For energy savings estimates, the program prefers an analysis like IPMVP Option C (normalized whole-building), though it does not mandate strict adherence. Other IPMVP options may be used if circumstances preclude the use of Option C (e.g., if the energy savings will be small relative to whole-building energy use).55 Possible M&V tools to do the calculations include Universal Translator 3 (UT3) or Equest.55

Page 48 PUTTING YOUR MONEY WHERE YOUR METER IS NRDC
According to an evaluation of the results from 2009 through 2011, the program achieved savings of 20 million kWh/year and 1.7 million therms/year, and realization rates (the ratio of verified to predicted savings) remained high at 90 percent and 97 percent, respectively.36 A report examining a sample of 24 MBCx projects in the University of California and California State University systems found that the median of building kWh and kW savings were 9 percent and 4 percent, respectively, with a median simple payback period of 2.5 years.52 The report found that MBCx on a portfolio level was highly cost-effective for achieving savings, and that monitoring helped to uphold persistence in savings.52 A another study evaluated a sample of 20 MBCx-participating University of California buildings with savings of at least 10 percent, finding the uncertainty of savings estimates to be low (based on a uncertainty metric incorporating the model’s variability, sample size, and savings level).89 Campus labs had the most predictable baselines, and classrooms had the least predictable values.89 Savings for higher-energy-intensity buildings were also easier to predict.89
Incentives for the MBCx program are currently (and have been since 2006) payments of $0.24/kWh and $1.00/therm saved in the first year, capped at 80 percent of verified project costs.36,55 The incentives are paid to the campuses after the first year of verified performance. The program does not pay an incentive for kW savings, but campuses must submit an analysis of peak demand savings.55 Initially the incentive payments were based on modeled expected savings, and then changed to be 100 percent performance-based on verified savings for the 2009–2012 program cycle.36 During some of the program years (2006–2012), hybrid projects with retrofits in addition to MBCx were allowed.36
INDEPENDENT SYSTEM OPERATOR—NEW ENGLAND FORWARD CAPACITY MARKETBASIC DESIGN FEATURES
1. Purpose 2. Customer Segment 3. Targeted Measures 4. Savings Type 5. Admin 6. Funding
EE as a grid resourceResidential,
commercial, industrial, MUSH
Comprehensive set of multiple measures kW Independent System
Operator (ISO)Capacity procurement
funds
HOW PERFORMANCE IS MEASURED
7. Savings Estimation Methodology 8. Baseline Used 9. Data Required
Mix of measurement methods (could be deemed, or project-by-project M&V) Mix of measurement methods Mix of measurement methods
HOW PAYMENT IS DETERMINED
10. Payment Structure 11. Bonuses/Penalties 12. Performance Period 13. Portfolio/Project
All performance- based Up-front collateral investment/financial security for delivery 3 years Aggregated portfolio of projects
Forward capacity markets are auctions established by the regional transmission operator (RTO), also called the independent system operator (ISO), to ensure sufficient capacity is available for meeting future peak loads. Auction players can bid in generation or demand response and EE to satisfy capacity needs. The Forward Capacity Market (FCM) in ISO–New England (covering Vermont, Rhode Island, New Hampshire, Massachusetts, Maine, and Connecticut) is a wholesale market with both supply and demand, and annual auctions are held three years before the needed capacity would be delivered.90 Over multiple auction rounds, bidders indicate their willingness to deliver a certain quantity of EE savings within the range of floor and ceiling prices, and market-clearing quantities and prices are determined.91 EE from all sectors is eligible: single family/multifamily residential, small/medium/large commercial, MUSH (municipal, university, schools, hospitals), and industrial.
An EE portfolio must be qualified by ISO–NE to participate in the auction through submission and approval of a formal Qualifications Package, which indicates the capacity bid and includes plans for customer acquisition, funding and cost analysis, and M&V.71 Bidders also must post financial assurance of the EE capacity.92 The players are compensated at auction-determined rates. EE capacity is verified either through customized project-by-project analysis of measures in commercial buildings (using IPMVP Options A–D),93 or through deemed measures using a Technical Reference Manual.93 Participants are paid for the expected lifetime of the installed EE measure and can do a comprehensive set of interventions except for behavioral EE.71 For retrofit projects the baseline is the pre-existing building condition, and for EE measures replacing failed equipment the baseline is the most stringent of either the government’s equipment standard or industry standard practice.71 The FCM counts gross and not net savings, because market operators only need to know the change in capacity that they can rely on, not how much of those reductions can be clearly attributed to the program (capacity from generators is counted as gross as well).71

Page 49 PUTTING YOUR MONEY WHERE YOUR METER IS NRDC
Efficiency Vermont, utilities, and other third-party players bid into the FCM.2 In 2014, Efficiency Vermont delivered 81.4 MW of demand savings into the FCM, generating about $4.7 million in revenues.94 In the first seven auctions, overcapacity in the market kept prices low.95 After a brief shortage of capacity and high prices, market rules changed and new capacity competed in the market to bring prices slightly down.95 Auction clearing price started at $4.50/kW-month (price floor) in the first auction commitment period of 2010/2011, and most recently was $7.03/kW-month for the 2019/2020 auction commitment period.95 Incentives are paid by ISO–NE FCM capacity procurement funds, and installments are also funded by a charge on utility bills.
OPOWER HOME ENERGY REPORT BEHAVIORAL EE PROGRAMBASIC DESIGN FEATURES
1. Purpose 2. Customer Segment 3. Targeted Measures 4. Savings Type 5. Admin 6. Funding
DSM goals for energy savings Residential
Behavioral, retro-commissioning, operational savings/
whole-building
kWh, kW, and therm Utility Utility customer funds
HOW PERFORMANCE IS MEASURED
7. Savings Estimation Methodology 8. Baseline Used 9. Data Required
Randomized control trial/experimental Control group AMI data or monthly billing data
HOW PAYMENT IS DETERMINED
10. Payment Structure 11. Bonuses/Penalties 12. Performance Period 13. Portfolio/Project
All up-front (usually by number of households) None 1 year Aggregated portfolio of projects
Opower is a software as a service (SaaS) company that provides a platform for utilities to run behavioral EE programs. Through this platform, utilities send targeted messages and home energy reports (HER) about energy usage and potential savings opportunities to customers to nudge them to change their behavior.38 Utilities typically pay for Opower’s platform with a set fee per household (for services such as access to the web portal and the HER) rather than a payment based on the energy savings outcome.24 Therefore, this program is not a true P4P example, but given the detailed measurement of savings, programs like this could be a model for performance estimation in the future.
Behavioral programs are most popular in the residential sector, and Opower works with 95 utilities on programs of this type across nine countries, serving about 15 million households.38 The programs usually measure energy savings and the effect of targeted messaging using randomized control trials of treatment and control groups of customers. Because customers are assigned to random groups and no other individualized reporting is available to them, the Opower program produces net savings, and no additional net-to-gross adjustment is needed.96 As of 2012, Opower’s programs across the country have delivered 1.5 terawatt-hours of energy savings.97 A 2011 study estimated the average cost of an Opower program to be $0.033 per kWh saved.97 If some persistence of savings is applied, the costs decrease to $0.0135 to $0.0179/kWh.98
Several recent evaluations provide a sense of the savings from Opower behavioral programs across the country. In its HER program, Potomac Edison (serving Maryland and West Virginia) sends customers information on how their usage compares with their own previous usage and to that of neighbors with similar homes, as well as tips on how to reduce consumption.96 The program is a randomized control trial, and customers are randomly assigned to a treatment group receiving the reports and a control group not receiving the reports. In 2014 the program saved 22,084 MWh, and the 75,600 participants on average reduced their electricity usage by 1.63 percent, in the range of 1 to 2 percent savings from typical HER programs.96 There were 26,250 residential control group customers.96 Another example is from San Diego Gas and Electric (SDG&E), which has had a HER program since 2011.99 In its 2014 HER with 40,000 households, the utility achieved 3,575 MWh and 124,000 therms in adjusted program savings.99

Page 50 PUTTING YOUR MONEY WHERE YOUR METER IS NRDC
BONNEVILLE POWER ADMINISTRATION STRATEGIC ENERGY MANAGEMENT— ENERGY SMART INDUSTRIAL PARTNERSHIP
BASIC DESIGN FEATURES
1. Purpose 2. Customer Segment 3. Targeted Measures 4. Savings Type 5. Admin 6. Funding
Sector-targeted energy savings Industrial
Behavioral, retro-commissioning, operational savings/
whole-building
kWh and therms Utility Utility customer funds
HOW PERFORMANCE IS MEASURED
7. Savings Estimation Methodology 8. Baseline Used 9. Data Required
Meter based measurement (IPMVP Option C or other normalized metering) Normalized pre-implementation meter data Monthly or other non-AMI billing/meter data
HOW PAYMENT IS DETERMINED
10. Payment Structure 11. Bonuses/Penalties 12. Performance Period 13. Portfolio/Project
Partially up-front, partially performance- based Bonus for annually sustained savings 3 or 5 years Individual Projects
Bonneville Power Administration (BPA) has jurisdiction in Idaho, Oregon, Washington, and western Montana; it also covers small parts of eastern Montana, California, Nevada, Utah, and Wyoming. BPA first launched the Energy Smart Industrial program in 2009, including the Energy Management pilot, which is an example of a strategic energy management (SEM) program.100 SEM programs focus on changing companies’ culture and business practices to be more energy efficient through management education and skills training.2 The effect of the approach is usually measured with statistical analysis of meter data before and after corporate training and the completion of any EE measures. In addition to a High Performance Energy Management (HPEM) component, the BPA pilot included a funding component and a Track and Tune program (for operational and maintenance savings).100
The pilot began with two facilities enrolled in the Track and Tune program and 15 facilities in the HPEM program.100 Both components were implemented by Cascade Energy and are still continuing today. The HPEM program offers cohort and non-cohort implementations, depending on geographic and proprietary restrictions that may prevent cohort participation. A cohort approach means that a group of six to 12 noncompetitive industrial customers are coached together on energy management, technical assessment, and employee engagement. The goal is to encourage both peer learning and friendly competition.53
During the pilot period, the evaluator of the program verified savings of 13,084 MWh and 38,736 therms from operational, maintenance, and capital measures during the first year of the program, including both Track and Tune and HPEM.100 The program was cost-effective from the total resource cost test (benefit/cost ratio of 1.1), utility cost test (1.03), and participant cost test (1.2) perspectives if the participants continued with the program for at least three years.100 As of March 2014, the program had 18 Track and Tune agreements across 20 facilities, leading to 20.7 million kWh of savings.101 The facilities included sites with municipal water treatment, pulp and paper manufacturing, malt processing, and ammonia refrigeration.101 Almost 40 facilities were enrolled in the HPEM program, achieving a cumulative 20.8 million kWh of savings.101
To estimate savings for the HPEM participants, the program uses a regression model with a two-year baseline period normalized for weather and production, with monthly utility bill data.102 The performance period is between three to five years, as that is approximately how long it takes most companies to incorporate energy conservation best practices into their processes.101 The HPEM program pays incentives of $0.025/kWh per year. The program targets industrial customers with a minimum average demand of 0.5 MW per site.102
The Track and Tune program estimates savings with a regression model, with baseline periods ranging from 60 days to two years.102 The program has a five-year performance period and measure life of ten years.102 Track and Tune participants are eligible for 1) up to $0.0025/kWh annual consumption for the installation of a performance tracking system; 2) the lesser of $0.075/kWh savings or 70 percent of documented implementation costs for tune-up action items; and 3) and an annual sustained savings incentive of $0.025/kWh of verified savings.101 The program targets industrial customers with annual energy usage of at least 4 million kWh per site.102

Page 51 PUTTING YOUR MONEY WHERE YOUR METER IS NRDC
METRUS—EFFICIENCY SERVICES AGREEMENTSBASIC DESIGN FEATURES
1. Purpose 2. Customer Segment 3. Targeted Measures 4. Savings Type 5. Admin 6. Funding
Finance EE investments using cash flow from
energy savings
Commercial, industrial, and MUSH
Comprehensive set of multiple measures kWh and therms Private sector
business model Financing based on
ENERGY SAVINGS
7. Savings Estimation Methodology 8. Baseline Used 9. Data Required
IPMVP Option A, B Pre-implementation operating/device data Pre-implementation operating/device data
HOW PAYMENT IS DETERMINED
10. Payment Structure 11. Bonuses/Penalties 12. Performance Period 13. Portfolio/Project
All performance-based None 10 years Individual projects
Metrus, an EE financing company started in 2009, offers an efficiency services agreement (ESA) through which it provides project financing to pay for EE measures (usually implemented by an ESCO). Metrus’s ESA is a pay-for-performance financing solution that allows customers to implement EE projects with zero up-front capital expenditure.103 Through the ESA, Metrus pays for all project development and construction costs. After a project is operational, the customer uses a portion of the cost savings associated with reduced energy consumption to make service payments to Metrus.103 Under the ESA, payments to Metrus are an operating expense—just like a regular utility bill, except it is based on realized energy savings.103 The customers then still pay a normal utility bill for their remaining energy usage. Currently Metrus agreements do not involve the utility, although participating customers can receive utility incentives.103 In each billing period, Metrus notifies customers of the quantity of verified energy savings. The kWh savings are multiplied by the agreed-upon ESA service charge, which is set as a $/kWh saved rate below regular energy prices, resulting in reduced operating expenses for customers.50 Most Metrus agreements are for 10 years or less.50 Metrus maintains ownership of the EE equipment through the contract term, after which customers can either buy it at market rate, extend the contract, or have the equipment removed by Metrus.50 Through a separate Energy Savings Performance Contract (ESPC) agreement, Metrus pays an ESCO or contractor to implement and maintain the energy efficiency project.
Metrus targets large commercial, industrial, and MUSH market customers with average total annual energy spending greater than $1 million and a total facility size of more than 250,000 square feet.50 Metrus can fund smaller projects for customers that are interested in aggregating projects as part of a multi-facility EE investment. EE projects are multi-measure comprehensive retrofits that may include HVAC systems, lighting, energy management systems, motors, pumps, refrigeration systems, boilers, furnaces, and cogeneration and distributed renewable energy systems.103 ESA payments are calculated using U.S. Department of Energy measurement guidelines for energy savings, using Option A or B of IPMVP, with ongoing M&V for every year of the contract.61 Rewarded savings are usually for kWh or therms as well as non-energy savings.61
Among Metrus’s EE customers is BAE Systems, with five sites in New Jersey, New York, and New Hampshire.104 Through $10 million of EE upgrades (including lighting, building automation, boiler replacement, and operational best practices) financed through a Metrus ESA, the program has achieved total energy savings of $4.1 million with a combined annual savings of 3.6 million kWh, 153,000 therms of natural gas, and 260,000 gallons of fuel oil.104 The program has achieved a cumulative 10.8 million kWh of savings to date.104 Siemens was the ESCO partner that installed the EE upgrades.104 Additional projects are currently under development.

Page 52 PUTTING YOUR MONEY WHERE YOUR METER IS NRDC
NEW JERSEY COMMERCIAL & INDUSTRIAL P4P PROGRAMBASIC DESIGN FEATURES
1. Purpose 2. Customer Segment 3. Targeted Measures 4. Savings Type 5. Admin 6. Funding
DSM goals for energy savings, sector-
targeted energy savings
Commercial, industrial, and MUSH
Comprehensive set of multiple measures kWh and therms Statewide third-party
admin Utility customer funds
HOW PERFORMANCE IS MEASURED
7. Savings Estimation Methodology 8. Baseline Used 9. Data Required
IPMVP Option D: Calibrated computer simulation Normalized pre-implementation meter data Monthly or other non-AMI billing/meter data
HOW PAYMENT IS DETERMINED
10. Payment Structure 11. Bonuses/Penalties 12. Performance Period 13. Portfolio/Project
Partially up-front, partially performance-based Bonus incentives for deeper savings 1 year Individual projects
The New Jersey Commercial and Industrial (C&I) P4P program, launched in 2009, targets whole-building EE in existing commercial, institutional, large multifamily and industrial buildings.105 The program is open to commercial, industrial, and institutional customers with peak demand 200 kW or greater in any of the preceding 12 months.106 The participation threshold is 100 kW for multifamily facilities.106 NJ Clean Energy program (NJCEP)—a statewide, third-party administrator of EE programs in New Jersey—offers the program, and implementers are selected from a network of program partners through a request for qualifications process. There are more than 100 participating program partners.105
NJCEP funds, which come from surcharges on electric and gas bills, pay for the program.107 Once approved, partners provide technical services to program participants, including the development of an energy reduction plan that includes whole-building simulation, and a financial plan to determine how the customer will pay for the energy saving upgrades.105 The energy reduction plan must include a comprehensive mix of measures to reduce energy use by 15 percent or more; lighting cannot make up more than 50 percent of the total projected savings.106,108 Fuel oil and other fuels can count toward the 15 percent savings requirement but do not receive explicit incentives; solar distributed generation cannot count toward the savings minimum.109
Participants receive incentives for three milestones: 1) submitting an energy reduction plan; 2) installing recommended EE measures; and 3) completing a post-installation report verifying savings. Incentive 1 is based on the square footage of the building(s) and is paid at $0.10 per square foot, with a maximum incentive of $50,000 and minimum of $5,000, capped at 50 percent of the annual energy expense.106 Incentive 2 is based on projected first-year savings. For electricity it ranges from $0.09/kWh for the minimum 15 percent savings up to $0.11/kWh, with an additional $0.005/kWh given for each 1 percent savings over the minimum.110 For projected gas savings, the incentive ranges from $0.90/therm for the minimum 15 percent savings, with an additional $0.05/therm per additional 1 percent savings over the minimum. Incentive 3 pays for the remaining 50 percent of the total possible incentive after the first year, after savings are verified.110
The achievement of the energy reduction goal is verified using 12 months of pre-/post-retrofit billing data, normalized for weather, using EPA Portfolio Manager methodology.105 If the 15 percent savings minimum is not reached 24 months after implementation, Incentive 3 is not awarded.109 Projects may not apply for incentives from other NJCEP programs while enrolled in the P4P program for the same facility.108 Utility incentives are capped at $1 million per electric account and $1 million per natural gas account per fiscal year, not to exceed $2 million per project.110
The program has about 25 participating buildings per year with installed measures.108 The total annual savings (projected in 2016) are 2,889 kW, 11,444 MWh, and 926,640 therms.108

Page 53 PUTTING YOUR MONEY WHERE YOUR METER IS NRDC
SEALED—MANAGED ENERGY SERVICES AGREEMENTSBASIC DESIGN FEATURES
1. Purpose 2. Customer Segment 3. Targeted Measures 4. Savings Type 5. Admin 6. Funding
Finance EE investments using cash flow from the energy savings
Residential Comprehensive set of multiple measures
kWh, therms, and gallons
Private sector business model
Financing based on the energy savings
HOW PERFORMANCE IS MEASURED
7. Savings Estimation Methodology 8. Baseline Used 9. Data Required
Actuarial analyses consistent with Option C Normalized pre-implementation meter data Monthly or other non-AMI billing/meter data, home and project characteristics
HOW PAYMENT IS DETERMINED
10. Payment Structure 11. Bonuses/Penalties 12. Performance Period 13. Portfolio/Project
All performance- based None 15–20 years Individual projects
Founded in 2012, Sealed is a residential, whole-building EE services and financing company that currently serves customers in New York. The Sealed program is variant of a managed energy services agreement (MESA). Under a typical MESA program, the implementer completes a building retrofit and then takes over the utility bill, paying the utility directly.67 In this case, Sealed first conducts a home energy audit as part of NYSERDA’s Home Performance with EnergyStar® program, then implements any EE measures recommended by the audit, paying for some or all of the up-front project cost.76 Sealed then provides a savings guarantee for the EE measures by replacing customers’ normal bills for electricity and heating fuel with a Sealed energy bill, which includes charges for both energy usage and energy savings (kWh, gallons, or therms).111 Savings payments are made at a set price per unit of savings, paying back to Sealed the up-front EE measure installation costs.111 The Sealed energy bill is guaranteed to reflect a certain percentage efficiency performance.112 Sealed profits if customers save more money than the guaranteed savings.76 The savings agreement lasts 15 to 20 years.111 As part of the home retrofits, Sealed facilitates multiple measures including reducing air leakage, adding insulation, installing new boilers/furnaces and water heaters, installing efficient lighting, and adding smart thermostats.113 Savings methodology is based on Sealed’s proprietary, patent-pending analytics, with costs based on local contractor pricing.
SOUTHERN CALIFORNIA EDISON LOCAL CAPACITY REQUIREMENT REQUEST FOR OFFERSBASIC DESIGN FEATURES
1. Purpose 2. Customer Segment 3. Targeted Measures 4. Savings Type 5. Admin 6. Funding
EE as a grid resource Commercial and Industrial (C&I)
Comprehensive set of multiple measures kWh and kW Utility Utility customer funds
HOW PERFORMANCE IS MEASURED
7. Savings Estimation Methodology 8. Baseline Used 9. Data Required
Mix of measurement methods (could be deemed, or some other M&V method) Mix of measurement methods Mix of measurement methods
HOW PAYMENT IS DETERMINED
10. Payment Structure 11. Bonuses/Penalties 12. Performance Period 13. Portfolio/Project
Partially up-front, partially performance- based
Up-front collateral investment/financial security for delivery Pro-forma contracts are for 4 years Individual Projects
When Southern California Edison (SCE) retired its 2,200 MW San Onofre Nuclear Generating Station in June 2013, the California Public Utilities Commission (CPUC) authorized that its replacement had to include a minimum of 150 MW (with an allowed additional 600 MW) of preferred resources such as EE, distributed generation, demand response, and energy storage.114 In order to meet the capacity needs in the two transmission-constrained local capacity areas around the retired plant by 2021, SCE issued an all-source RFO in 2013 seeking both fossil generation and preferred resources. The supply- and demand-side bids were evaluated on a “least-cost, best-fit” basis.115 Of the 2,220 MW total procured in the RFO for

Page 54 PUTTING YOUR MONEY WHERE YOUR METER IS NRDC
the two affected local capacity areas, 136 MW (about 6 percent of the total) came from EE (from 32 contracts signed with four sellers).44 One challenge in the all-source RFO was procuring both gas-fired generation and EE and other preferred resources on the same timeline, as the majority of preferred resources do not need more than a few years of lead time to develop.41 The solicitation was open to all sectors for EE, including residential, but winning bids came from implementers serving large commercial and industrial customers.116 Because security was required to submit a bid, only large vendors could afford to participate and take the risk.116 As of the writing of this report, not all the EE contracts have yet been approved by the CPUC.116
SCE’s pro forma EE contract term is four years.117 Winning bids include a variety of individual EE measures in the commercial and industrial sectors: pre-cooling rooftop AC units and air-cooled chillers; refrigeration, chiller, and compressed air measures at industrial sites; lighting; industrial process improvements; HVAC control optimization; and EMS.44 Contracts reward kW savings, summer on-peak and off-peak energy savings (kWh), and winter on-peak energy savings (kWh).117 Each contract has to specify the M&V methodology (some are calculated, others are based on metered measurement) and must be consistent with SCE’s Customized Calculated Guidelines, IPMVP guidelines, and California’s EE evaluation protocol standards.117 Savings have to be for measures that are above code (Title 24 and/or Title 20).117 Pre-installation site inspections and measurements are used to estimate the individual measure and aggregated measure baseline.117 Though some contracts use IPMVP Option A or B savings estimation methods that isolate the effect of individual retrofit measures, whenever possible, winning contracts use whole-building savings estimation techniques either with meter data directly or through data from the building’s energy management system.65
Incentive payments are based on the achievement of project milestones. SCE will pay the implementers in five installments: 50 percent after the project completion/online date, 20 percent after the first year of operation, 10 percent after the second year, 10 percent after the third year, and 10 percent after the fourth year of operation.117 The winning projects cannot receive an incentive from any other rebate or utility program.117 The savings from the program are gross savings and do not count toward SCE’s EE targets.65 EE savings from the program are meant to be incremental to existing utility DSM programs, and when ranking the bids, SCE prioritized innovative solutions, especially those with lower costs, over more expensive projects or those that overlapped with existing program offerings.65
SEATTLE CITY LIGHT COMMERCIAL PAY FOR PERFORMANCE PILOT PROGRAMBASIC DESIGN FEATURES
1. Purpose 2. Customer Segment 3. Targeted Measures 4. Savings Type 5. Admin 6. Funding
DSM goals for energy savings, sector-
targeted energy savingsCommercial Comprehensive set of
multiple measures kWh Utility Utility customer funds
HOW PERFORMANCE IS MEASURED
7. Savings Estimation Methodology 8. Baseline Used 9. Data Required
Meter-based measurement (IPMVP Option C or other normalized metering) Normalized pre-implementation meter data Monthly or other non-AMI billing/meter data
HOW PAYMENT IS DETERMINED
10. Payment Structure 11. Bonuses/Penalties 12. Performance Period 13. Portfolio/Project
All performance- based Bonus for net savings 3 years Individual projects Seattle City Light (SCL) started a three-year pilot P4P program in 2013 with three office buildings of various occupancies selected through a competitive solicitation process.118 SCL administers the program and a contractor implements the measures, which are comprehensive retrofits including HVAC and lighting. The program targets commercial buildings, each with at least 50,000 square feet of conditioned floor area and a minimum 85 percent office-type occupancy).118 SCL pays incentives annually based on verified energy savings.118 The incentive payment per kWh increases with higher levels of savings. The savings estimates are based on daily whole-building meter data, normalized for weather.119
One participating building, a 34-floor commercial office building in downtown Seattle, has achieved 3.3 million kWh of savings since the beginning of the pilot project (April 2013), as estimated by the public Universal Translator 3 model.120 Despite an increase in building occupancy to 58 percent from 37 percent since the baseline period, the baseline energy model was normalized only for weather.120 The cumulative savings to date for the project are $619,308.120 The reduction in energy usage has lowered the building’s energy usage intensity (EUI) by 10.36 kBtu per square foot over the baseline year, which is a reduction of 17.68 percent.120 The incentive rate paid by SCL for energy savings was $0.116/kWh.

Page 55 PUTTING YOUR MONEY WHERE YOUR METER IS NRDC
PG&E COMMERCIAL WHOLE-BUILDING PILOT PROGRAMBASIC DESIGN FEATURES
1. Purpose 2. Customer Segment 3. Targeted Measures 4. Savings Type 5. Admin 6. Funding
DSM goals for energy savings Commercial Comprehensive set of
multiple measures kWh, kW, and therms Utility Utility customer funds
HOW PERFORMANCE IS MEASURED
7. Savings Estimation Methodology 8. Baseline Used 9. Data Required
Meter-based measurement (IPMVP Option C or other normalized metering), or Option D Normalized pre-/post-implementation meter data AMI/Interval meter data
HOW PAYMENT IS DETERMINED
10. Payment Structure 11. Bonuses/Penalties 12. Performance Period 13. Portfolio/Project
Partially up-front, partially performance- based None 1 year Individual projects
PG&E is considering extending and expanding its existing Commercial Whole-Building Demonstration program to a full program under California’s AB 802 legislation. The program is multi-measure and includes retrofit, retro-commissioning, behavioral, and operational savings.121 The program targets commercial customers and aims to achieve savings of 15 percent or more on electric usage (lower for kW and therms) on a per facility basis.121 PG&E is the administrator, and the program is implemented by third parties. Participants must include at least three qualifying measures, and retrofits have to be above code.121 Incentive payments are paid in two installments: 1) an implementation incentive after installation; and 2) a performance-based incentive after the first year of implementation, based on achieved energy savings over the year compared with the pre-intervention period.121 The extended program will test different methods of measurement: existing conditions without baseline adjustments, and pre/post analysis of weather-normalized metered consumption (IPMVP Option C), if feasible, or else calibrated simulation (Option D). PG&E is testing open source and proprietary savings estimation models.122 To calculate net savings, the program will use self-reported questionnaires for all projects.121
The program specifically targets small and medium-size commercial customers, and targeted segments include office, retail, grocery, governmental, and educational facilities typically between 10,000 and 100,000 square feet in size.121 PG&E screens for combination electric and gas service customers in owner-occupied and single-tenant, long-term-leased commercial buildings with a year or more of interval meter data.121 Hospitals, industrial facilities, and data centers are not eligible, nor are campuses with significant on-site generation.121 The buildings must have a minimum of 12 months of stable operations by the earliest possible commitment date, and expectations of at least 24 months or more of stable building operations (and for lessees, at least three years remaining on their leases).121 To participate, customers cannot be enrolled in any other efficiency incentive or demand response program.121 One unique element of this program is that participants gain access to an interactive web portal where they can view how their building is tracking throughout the post-implementation period. FirstFuel is one of the SaaS platforms that support the targeting, engagement, and tracking of savings for this program.
The extension of the program is based on the results from 12 commercial buildings in the demonstration phase, from 2013–2017.121 Based on verified simulations for 8 buildings, the results to date are as follows: the average number of EE measures installed is four, customer kWh savings are greater than 20 percent on average, average estimated reported kWh savings using a code baseline is 12 percent, and the weighted average estimated lifetime of measures is more than seven years.121 As a percentage of the total number of measures installed, the measure mix was approximately 40 percent HVAC, 40 percent refrigeration, and 20 percent lighting measures.121

Page 56 PUTTING YOUR MONEY WHERE YOUR METER IS NRDC
EFFICIENCY VERMONT—CONTINUOUS ENERGY IMPROVEMENT (CEI) PILOT PROGRAMBASIC DESIGN FEATURES
1. Purpose 2. Customer Segment 3. Targeted Measures 4. Savings Type 5. Admin 6. Funding
Sector-targeted energy Savings, DSM goals for
energy savings
Commercial and Industrial (C&I)
Behavioral, comprehensive set of
multiple measureskWh Statewide third-party
admin Utility customer funds
HOW PERFORMANCE IS MEASURED
7. Savings Estimation Methodology 8. Baseline Used 9. Data Required
Meter based measurement (IPMVP Option C or other normalized metering) Normalized pre-implementation meter data AMI data, Submetering, energy driver facility data
such as production data, labor hours
HOW PAYMENT IS DETERMINED
10. Payment Structure 11. Bonuses/Penalties 12. Performance Period 13. Portfolio/Project
All up-front to defer cost of developing building dashboard None 3 years Individual projects
Efficiency Vermont, an energy efficiency utility (EEU) administered by the nonprofit Vermont Energy Investment Corporation, initiated a continuous energy improvement (CEI) program in 2014.123 EVT’s initiative focuses on measured savings for large, account-managed commercial and industrial customers, with a focus on industrial customers. “CEI Lite,” targeting small and medium-size nonindustrial businesses, will roll out in 2017.124
The program is similar to strategic energy management based on International Organization for Standardization management system standard number 50001. Businesses that sign up make an upper-management commitment to set an annual goal for energy savings; develop and implement energy management plans; and use systems to monitor, track, and report on energy performance. Progress is measured continuously based on actual savings against a modeled baseline, and the focus is to holistically measure the savings from the full suite of activities in the facility. Energy savings can come from both operational and behavioral changes as well as installation of measures and major capital projects. The program threshold for participation is the ability to calculate a baseline model that is strongly correlated to baseline energy usage. As the program has focused on industrial customers, there are challenges with normalizing on the basis of production data.124
Participating facilities are organized into cohorts to support best-practice sharing with peers. Nine businesses joined the initial cohort starting in 2014 (including manufacturers, a ski area, and a hospital).124 Another cohort (four customers at six sites) focused on dairy processing operations with ammonia refrigeration equipment. Refrigeration is a major energy load for dairy facilities and has potential for operational improvements as well as equipment upgrades.124
As part of the program, some of the participating customers have hired a contractor to create an energy management information system (EMIS) dashboard to track their progress, which typically costs around $15,000 to $20,000 per year. Efficiency Vermont shares with customers the expense of building this dashboard. It also provides significant up-front and ongoing technical assistance and account management to support participating businesses and facilitate the cohort.123 The program exists alongside other rebate programs, but because it is focused explicitly on non-widget measures, the savings from widgets from other EVT programs are subtracted from the savings totals.124
The program awards kWh savings. AMI data are not required. Instead, participants use dedicated meters in electric panels to capture facility-level energy usage through an energy management information system.123 The program does not just use prior-year energy consumption because industrial production can vary dramatically; facilities may swing 20 percent year to year, which can swamp the effects of energy savings activities. The savings estimation method has the following steps: 1) program administrator models the previous year’s electric usage data and weather with a linear regression; 2) program administrator compares modeled usage to actual usage to confirm that the model is accurate (within 3 percent); 3) facility develops energy management plan, commits to at least monthly meetings to manage usage, and implements energy management strategies; and 4) the dashboard displays actual usage compared with the baseline for that day (how much energy would have been used on a typical day with that weather and production level).124 All the daily savings against the baseline are aggregated at the end of the year to calculate the annual energy savings.

Page 57 PUTTING YOUR MONEY WHERE YOUR METER IS NRDC
Efficiency Vermont has been measuring savings since 2015 but is not currently claiming the savings as the program is still in a pilot phase. The CEI program saved 1,700 MWh in 2014 and 2015 through behavioral and operational approaches, and also led to an “uplift” of 2,200 MWh in additional capital savings claimed through other Efficiency Vermont incentive programs. Efficiency Vermont anticipates being able to claim the energy savings for CEI starting in 2018 or possibly 2017, pending approval by the Vermont Public Service Board. During the pilot, EVT has opted to cover more of the start-up costs associated with metering and dashboards, as well as ongoing technical support and assistance, in lieu of offering participants P4P incentives.123 The program is funded by an EE charge on electric ratepayers.
NATIONAL GRID PAY FOR PERFORMANCE PROGRAMBASIC DESIGN FEATURES
1. Purpose 2. Customer Segment 3. Targeted Measures 4. Savings Type 5. Admin 6. Funding
DSM goals for energy savings Commercial, MUSH Retro-commissioning kWh and therms Utility Utility customer funds
HOW PERFORMANCE IS MEASURED
7. Savings Estimation Methodology 8. Baseline Used 9. Data Required
IPMVP Option A or B Pre-implementation operating/device data Pre-implementation operating/device data
HOW PAYMENT IS DETERMINED
10. Payment Structure 11. Bonuses/Penalties 12. Performance Period 13. Portfolio/Project
All performance- based None 1 year Individual projects National Grid in Massachusetts is one of several program administrators in the state that offer P4P as an alternative incentive option for large commercial customers who are engaged in commissioning and retro-commissioning.125 The National Grid P4P program works with participating vendors to identify and implement low-cost/no-cost energy efficiency measures (typically with payback in less than one year) such as monitoring and performance optimization. Vendors submit potential P4P projects for prequalification. Prequalification involves benchmarking facility annual energy use, describing the facility’s HVAC and lighting systems and EMS system, conducting a walk-through assessment similar to an ASHRAE Level 1 audit, and developing preliminary costs and energy savings estimates.125
The program administrator pays incentives for low-cost/no-cost operational improvements at $0.12 per kWh and $1.20 per therm saved to customers in the first year. Savings are calculated using IPMVP Option A or B at the measure level, based on engineering calculations and pre- and post- installation operating conditions.125 Standard energy efficiency measures are eligible for additional incentives through National Grid’s standard prescriptive or custom programs. In this way, P4P incentives are an added layer on top of the standard rebate programs.125
The program targets buildings that are good candidates for retro-commissioning. That includes large C&I facilities with centralized building automation systems, such as hospitals, colleges and universities, large office buildings, and buildings with complex HVAC systems. To date, the program has had relatively limited participation, around 25 buildings a year. The retro-commissioning market in Massachusetts faces a number of barriers, ranging from high up-front costs for monitoring and metering systems to lack of qualified engineering firms. Some evidence suggests that a purely P4P program design, in which incentives are paid a year or more post-installation, may not be sufficient to overcome these market barriers and drive high levels of retro-commissioning activity.126

Page 58 PUTTING YOUR MONEY WHERE YOUR METER IS NRDC
MEETS—METERED ENERGY EFFICIENCY TRANSACTION STRUCTURE BASIC DESIGN FEATURES
1. Purpose 2. Customer Segment 3. Targeted Measures 4. Savings Type 5. Admin 6. Funding
Finance EE investments using cash flow from
energy savingsCommercial Comprehensive set of
multiple measures kWh and Therms Private sector business model
Financing based on the energy savings
HOW PERFORMANCE IS MEASURED
7. Savings Estimation Methodology 8. Baseline Used 9. Data Required
IPMVP Option D—Auto-calibrated computer simulation
Dynamic baseline model from pre-implementation meter data
Monthly, hourly, or other whole-building non-AMI billing/meter data
HOW PAYMENT IS DETERMINED
10. Payment Structure 11. Bonuses/Penalties 12. Performance Period 13. Portfolio/Project
All performance- based None 20 years Individual projects The Metered Energy Efficiency Transaction Structure (MEETS), currently piloted with a net-zero energy commercial office building (the Bullitt Center) in Seattle, focuses on overcoming barriers to EE investment and deep savings through a set of agreements among the utility, building owner, tenant, and investor. Under the MEETS program, there is an “energy tenant” (who could be the building owner or a third-party entity), usually financed by an investor, who signs a rental agreement with a building owner to harvest the EE savings.68 In turn, the energy tenant pays for and maintains comprehensive EE retrofits to the building.68,69 The utility pays the energy tenant each month under a 20-year power purchase agreement (PPA) for the value of the resulting saved energy.68 The building owner and/or tenant pay the utility for the sum of the energy saved and the energy used (as if they had a single pre EE project energy bill).69 The energy tenant pays back the financing investor for the retrofit with the revenues received from the utility for the energy savings.68 DeltaMeter software (by EnergyRM) tracks energy saved and energy used for the whole building and reports to all parties.69 This transaction structure gives building owners a way to finance efficiency upgrades, and also helps with the split incentive problem that usually discourages building owners from investment in buildings where tenants pay the energy bills.69
The DeltaMeter uses an Option D building simulation model, derived from one year of all fuels’ monthly billing data and local temperatures. This modeling approach includes a regression analysis that uses physical building parameters to create an Option D “dynamic baseline” model as the counterfactual for calculating energy savings at future temperatures and occupancy conditions.62 The DeltaMeter then takes the dynamic baseline and compares it with a parallel “as improved” Option D simulated building model that incorporates EE measures to predict savings potential.62 To determine savings after EE measures are implemented, the dynamic baseline is adjusted to current conditions on a monthly basis, and that predicted counterfactual usage minus that month’s actual meter data is used to estimate the monthly savings.62 The savings are reported monthly.62
The DeltaMeter also analyzes savings persistence. The actual meter data (post-measure implementation) can also be used to calibrate an “as improved” building model using the same Option D approach. In future performance periods, this calibrated “as improved” building model is compared with actual energy usage to make sure EE measures continue performing as expected.62 Any nonroutine building changes that are detected can be incorporated into the dynamic baseline counterfactual model as specified in the governing contract.62
The Bullitt Center pilot MEETS project began in April 2015, and has a 20-year contract with the utility Seattle City Light (SCL).127 Under the MEETS contract, SCL pays for energy savings at 8.41 cents/kWh with a 2 percent escalator (on all but 2.5 cents of the per kWh payment, which is a product of the negotiation of this specific contract).68 In contrast, retail rates for commercial customers are about 6 cents/kWh and are expected to increase about 4.5 percent per year, making energy more expensive than savings over time.68 In the first year of the contract, the project generated about $54,000 in energy savings payments for the investor, who had paid $84,000 up front to fund the EE upgrades for the building.128 Assuming the building’s high efficiency levels persist, the MEETS PPA is expected to pay the Bullitt Center $1.2 million over the 20-year term.68

Page 59 PUTTING YOUR MONEY WHERE YOUR METER IS NRDC
PG&E RESIDENTIAL PAY FOR PERFORMANCE PILOT PROGRAMBASIC DESIGN FEATURES
1. Purpose 2. Customer Segment 3. Targeted Measures 4. Savings Type 5. Admin 6. Funding
DSM goals for energy savings, EE as a grid
resourceResidential Comprehensive set of
multiple measures kWh and therms Utility Utility customer funds
HOW PERFORMANCE IS MEASURED
7. Savings Estimation Methodology 8. Baseline Used 9. Data Required
Meter based measurement (IPMVP Option C or other normalized metering) Normalized pre-implementation meter data AMI/interval meter data
HOW PAYMENT IS DETERMINED
10. Payment Structure 11. Bonuses/Penalties 12. Performance Period 13. Portfolio/Project
All performance- based Bonus for net savings 2 years Aggregated portfolio savings PG&E has proposed a P4P residential whole-building pilot as part of the High Opportunity Projects and Programs (AB 802) call for proposals in California. PG&E’s pilot proposal was approved by the CPUC in June 2016. The utility will pay a set $/kWh payment for weather-normalized gross delivered savings at the meter to third-party aggregators for residential savings across their portfolios of projects through comprehensive retrofit, behavioral, and operational interventions.1 The structure of the pilot is based largely on lessons learned from the existing residential Home Upgrade program (which has funded 14,000 residential upgrades to date, reaching 0.5 percent of approximately 3 million eligible customers).129 The Home Upgrade program has had challenges with high administrative costs, low cost-effectiveness ratios, and lack of consumer flexibility.1 Savings from the Home Upgrade program are based on modeled or deemed savings and do not allow behavioral or operational savings.1
PG&E proposes to pay a set $1.8/therm and $0.80/kWh rate to implementers for gross savings annually for two years (final incentive rates to be determined). The program will not provide any up-front payments for savings.129 An additional 5–10 percent bonus incentive will be offered to aggregators for net savings. Kickers eventually may be added to motivate higher savings, longer life measures, and bigger net savings. PG&E will continue to measure and claim savings for one to three years after the two-year pilot period to test savings persistence. PG&E will use IPMVP Option C, with weather-normalized AMI data, and an existing-conditions baseline (to code and above code savings) to estimate savings. The program will use 12 months of pre-implementation AMI data for each customer.1 The savings estimates will be conducted through the CalTRACK system, a data analysis process for estimating energy savings focused on transparency, standardization, and broad stakeholder input.1 When complete, CalTRACK code and methods will be open source and available to compare savings estimates.1 The savings estimated from each house will be added together to calculate the aggregator’s portfolio performance, mitigating the risk that some homes will have neutral or negative savings.1 Participating customers cannot receive any other utility EE incentives.1 Customers with solar must submit detailed generation information to the implementer to enable them to calculate EE savings.1 To calculate claimable net savings, PG&E will use several EM&V methods, including a quasi-experimental approach with nonequivalent comparison groups that matches “treatment” and “control” customers.1 This approach will be in addition to self-reported surveys to estimate net-to-gross ratios.1
The new pilot has a proposed budget of $5 million for incentives (and an additional $1 million for program administration) and will last for three years.8 PG&E launched a request for proposals for aggregators in September 2016. The program is targeting a total savings of 4.83 GWh of energy, 4.725 MW of demand, and 0.945 MM therms of gas (equal to 6 percent electric and 16 percent gas savings per home) by 2019.1 PG&E anticipates 4,200 customer enrollments in the pilot and expects PACE providers to be among the participating aggregators.1

Page 60 PUTTING YOUR MONEY WHERE YOUR METER IS NRDC
Appendix 2: Works Cited
1. Jacobson, E. PG&E Advice Letter 3698-G/4813-E to California Public Utilities Commission: Submission of High Opportunity Projects and Programs (HOPPs) Proposal - Residential Pay-for-Performance Program. (2016).
2. Rogers, E. A., Carley, E., Deo, S. & Grossberg, F. How Information and Communications Technologies Will Change the Evaluation, Measurement, and Verification of Energy Efficiency Programs. (American Council for an Energy-Efficient Economy, 2015).
3. US EPA, O. Draft Evaluation, Measurement and Verification Guidance for Demand-Side Energy Efficiency. (US Environmental Protection Agency, 2015).
4. Slote, S., Sherman, M. & Crossley, D. Energy Efficiency Evaluation, Measurement, and Verification: A Regional Review of Practices in China, the European Union, India, and the United States. (Regulatory Assistance Project, 2014).
5. NAESCO || National Association of Energy Service Companies. Available at: http://www.naesco.org/. (Accessed: 10th April 2016)
6. Larsen, P., Goldman, C. A. & Satchwell, A. Evolution of the U.S. Energy Service Company Industry: Market Size and Project Performance from 1990-2008. (Lawrence Berkeley National Laboratory, 2012).
7. International Performance Measurement & Verification Protocol: Concepts and Options for Determining Energy and Water Savings Volume I. (International Performance Measurement & Verification Protocol Committee, 2002).
8. IPMVP Core Concepts 2014. (Efficiency Valuation Organization (EVO), 2014).
9. Granderson, J., Piette, M. A., Rosenblum, B. & Hu, L. Energy Information Handbook: Applications for Energy-Efficient Building Operations.
10. How much energy is consumed in residential and commercial buildings in the United States? - FAQ - U.S. Energy Information Administration (EIA). U.S. Energy Information Administration Frequently Asked Questions Available at: http://www.eia.gov/tools/faqs/faq.cfm?id=86&t=1. (Accessed: 24th April 2016)
11. Ettenson, L. & Heavey, C. California’s Golden Energy Efficiency Opportunity: Ramping Up Success to Save Billions and Meet Climate Goals. (Natural Resources Defense Council (NRDC) and Environmental Enrepreneurs (E2), 2015).
12. Goldman, C., Reid, M., Levy, R. & Silverstein, A. Coordination of Energy Efficiency and Demand Response. Lawrence Berkeley Natl. Lab. (2010).
13. Gillingham, K. & Palmer, K. Bridging the Energy Efficiency Gap: Policy Insights from Economic Theory and Empirical Evidence. Rev. Environ. Econ. Policy 8, 18–38 (2014).
14. Advanced Metering Count by Technology Type. 2007 Through 2014. U.S. Energy Information Administration Available at: http://www.eia.gov/electricity/annual/html/epa_10_10.html. (Accessed: 15th April 2016)
15. Prepared by DNV GL for the NEEP Regional EM&V Forum. The Changing EM&V Paradigm | NEEP. (Northeast Energy Efficiency Partnerships, Regional Evaluation, Measurement and Verification Forum, 2015).
16. Granderson, J. et al. Accuracy of automated measurement and verification (M&V) techniques for energy savings in commercial buildings. Appl. Energy 173, 296–308 (2016).
17. Jessica Granderson, Lawrence Berkeley National Laboratory. Interview by Julia Szinai. (2016).
18. Ettenson, L. California Formalizes Big Energy Efficiency Step - Now the Hard Work Begins. NRDC (2015).
19. Electric Sales, Revenue, and Average Price 2011 - Energy Information Administration. 2014 Average Monthly Bill- Residential, Table 5-A Available at: http://www.eia.gov/electricity/sales_revenue_price/pdf/table5_a.pdf. (Accessed: 9th April 2016)
20. Ettenson, L. What Do California’s Latest Commitments to Get More Energy Efficiency Really Mean? NRDC (2015).
21. Borgeson, M. California Legislature Doubles Down on Energy Efficiency. NRDC (2015).
22. Tweed, K. New York Launches Major Regulatory Reform for Utilities. Greentech Media (2014).
23. Marco Padula, Acting Deputy Director - Market Structure. New York State’s Reforming the Energy Vision. (2016).
24. Serj Berelson, Opower & Charlie Buck, Opower. Interview by Julia Szinai. (2016).
25. Goldman, C. A., Busch, J. F., Kahn, E. F., Baldick, R. & Milne, A. Review of Consolidated Edison’s Integrated Resource Bidding Program. (Lawrence Berkeley National Laboratory, 1993).
26. When demand-side management competes in an electric resource solicitation - Issues from a case study in New York. Util. Policy 10 (1993).
27. Goldman, C. At the Electricity Resource Bazaar: Lessons from Case Studies of Integrated Bidding in New York. Energy Stud. Rev. Vol. 6, 18 (1994).
28. Goldman, C. A. & Kito, S. M. Demand-Side Bidding: Six Years Later and the Results Are Coming In. (Lawrence Berkeley National Laboratory, 1994).
29. Goldman, C. Role of Third Parties in Energy Efficiency Programs: A Review of Alternative Approaches and Experiences. (Prepared for Connecticut Light and Power, 2000).
30. Charles Goldman, Lawrence Berkeley National Laboratory. Interview by Julia Szinai. (2016).
31. Donald Gilligan. Interview by Julia Szinai. (2016).
32. Wolcott, D. & Goldman, C. Moving Beyond Demand-Side Bidding: A More Constructive Role for Energy Service Companies. (RCG/Hagler. Bailly, Inc. and Lawrence Berkeley Laboratory, 1992).
33. Steven Schiller, Lawrence Berkeley National Laboratory. Interview by Julia Szinai. (2016).
34. Goldman, C., Kito, S. M. & Moezzi, M. Evaluation of Public Service Electric & Gas Company’s Standard Offer Program. (Lawrence Berkeley National Laboratory, 1995).
35. Martin Kushler, ACEEE & George Edgar, Wisconsin Energy Conservation Corporation. Lessons From Granddaddy: Observations From The Evaluation Of The New Jersey PSE&G Standard Offer Program. (International Energy Program Evaluation Conference, 1999).
36. Meiman, A., Anderson, M. & Brown, K. Monitoring-Based Commissioning: Tracking the Evolution and Adoption of a Paradigm-Shifting Approach to Retro-Commissioning. (2012).
37. Allcott, H. Social norms and energy conservation. J. Public Econ. 95, 1082–1095 (2011).
38. Allcott, H. & Kessler, J. B. The Welfare Effects of Nudges: A Case Study of Energy Use Social Comparisons. (National Bureau of Economic Research, 2015).
39. Program Basics. Texas Energy Efficiency Available at: http://www.texasefficiency.com/index.php/utility-programs/program-basics. (Accessed: 27th April 2016)
40. 2000 and 2001 Nonresidential Large SPC Evaluation Study Final Report. (Prepared by Xenergy for Southern California Edison, 2001).
41. Track 1 Procurement Plan of Southern California Edison Company Submitted to Energy Division Pursuant to D. 13-02-015. (2013).

Page 61 PUTTING YOUR MONEY WHERE YOUR METER IS NRDC
42. Chris Gazze, Steven Mysholowsky, Rebecca Craft & Bruce Appelbaum. Con Edison’s Targeted Demand Side Management Program: Replacing Distribution Infrastructure with Load Reduction. (Consolidated Edison Company of New York and ICF International, 2010).
43. Schiller, S., Goldman, C. A. & Henderson, B. Public Benefit Charge Funded Performance Contracting Programs – Survey and Guidelines. (Schiller Associates, Lawrence Berkeley National Lab, New York State Energy Research & Development Authority, 2000).
44. Local Capacity Requirements (LCR) RFO. SCE.com Available at: https://www.sce.com/wps/portal/home/procurement/solicitation/lcr. (Accessed: 15th February 2016)
45. Terry Egnor, EnergyRM. Interview by Julia Szinai. (2016).
46. Granderson, J., Price, P. N., Jump, D., Addy, N. & Sohn, M. D. Automated measurement and verification: Performance of public domain whole-building electric baseline models. Appl. Energy 144, 106–113 (2015).
47. Randolph, E. Disposition approving Advice Letter 3698-G-A/4813-E-A, PG&E’s Residential Pay for Performance Program, as a High Opportunity Program.
48. Jordana Cammarata, FirstFuel. Interview by Julia Szinai. (2016).
49. Mona Tierney-Lloyd, EnerNOC. Interview by Julia Szinai. (2016).
50. Metrus FAQ. Available at: http://metrusenergy.com/wp-content/uploads/2013/02/Metrus-FAQ.pdf.
51. Public Utility Commission of Texas: Annual Statewide Portfolio Report for Program Year 2014—Volume I. (Prepared by Tetratech for the Public Utility Commission of Texas, 2015).
52. Mills, E. & Mathew, P. Monitoring Based Commissioning: Benchmarking Analysis of 24 UC/CSU/IOU Projects. (Lawrence Berkeley National Laboratory, 2009).
53. Overview of Strategic Energy Management Cohorts. (Cascade Energy).
54. Continuous Energy Improvement | Efficiency Vermont. Available at: https://www.efficiencyvermont.com/services/project-support/strategic-energy-management. (Accessed: 2nd May 2016)
55. MBCx Project Guidelines and Minimum Requirements: Monitoring Based Commissioning (MBCx) Program, 2010-2015 Higher Education / Investor Owned Utility (IOU) Partnership Programs. (2015).
56. Emily Levin (VEIC). Personal Communication with Julia Szinai. (2016).
57. Low-Income Programs | ACEEE. Available at: http://aceee.org/topics/low-income-programs. (Accessed: 6th May 2016)
58. Efficiency Vermont Triennial Plan 2015 - 2017. (Prepared for the Vermont Public Service Board by Vermont Energy Investment Corporation, 2014).
59. Emily Martin Fadrhonc et al. Residential Property Assessed Clean Energy in California: Feasibility of Studying Impacts on Mortgage Performance and Energy Savings. (Lawrence Berkeley National Laboratory, 2016).
60. What is PACE? PACENation Available at: http://www.pacenation.us/about-pace/. (Accessed: 2nd May 2016)
61. Bob Hinkle, Metrus Energy. Interview by Julia Szinai. (2016).
62. A Description and Assessment of Energy Resource Management’s Enhanced Measurement and Verification Process. (Prepared by Quantum Energy Services & Technologies, Inc. for Energy Resource Management, 2010).
63. Tina Jayaweera, The Cadmus Group & Hossein Haeri, The Cadmus Group. The Uniform Methods Project: Methods for Determining Energy Efficiency Savings for Specific Measures. (National Renewable Energy Laboratory, 2013).
64. Andrew Meiman, ARC Alternatives. Interview by Julia Szinai. (2016).
65. Bryan Landry, Southern California Edison. Interview by Julia Szinai. (2016).
66. Matt Gee, OpenEEmeter. Interview by Julia Szinai. (2016).
67. Fadrhonc, E. M., Leventis, G., Kramer, C. & Goldman, C. A. IN-REVIEW: Current Practices in Efficiency Financing: An Overview for State and Local Governments. (Lawrence Berkeley National Laboratory, 2016).
68. Unlocking Deep Efficiency in Commercial Buildings: The Metered Energy Efficiency Transaction Structure. (MEETS Accelerator Coalition and Bullitt Foundation, 2016).
69. How MEETS Works. MEETS Coalition Available at: http://www.meetscoalition.org?p=6. (Accessed: 29th April 2016)
70. Charles Goldman. Personal communication with Emily Levin, VEIC via email. (2016).
71. Chris Neme & Richard Cowart. Energy Efficiency Participation in Electricity Capacity Markets – The US Experience. (Energy Futures Group, Regulatory Assistance Project, 2014).
72. Robin LeBaron, Saul-Rinaldi, K. & Cowell, S. Energy Savings Prediction Methods for Residential Energy Efficiency Upgrades. (E4TheFuture for the DOE Building Technology Office RFI).
73. CPUC Rulemaking 13-11-005, Decision Providing Guidance for Initial Energy Efficiency Rolling Portfolio Business Plan Filings. (2016).
74. Granderson, J. R&D for M&V 2.0. (2016).
75. Savenije, D. Inside the REV: Audrey Zibelman’s bold plan to transform New York’s electricity market. Utility Dive (2014). Available at: http://www.utilitydive.com/news/inside-the-rev-audrey-zibelmans-bold-plan-to-transform-new-yorks-electri/328700/. (Accessed: 24th September 2016)
76. Frank, A. Letter from Andrew Frank, Founder and President of Sealed, Inc. to Honorable Kathleen Burgess, Secretary of New York Public Service Commission RE: Case 14-M-0094, Clean Energy Fund. (2015).
77. Ethan N. Elkind. Powering the Savings: How California Can Tap The Energy Efficiency Potential in Existing Commercial Buildings. (Berkeley Law Center for Law, Energy & the Environment and UCLA School of Law’s Emmett Institute on Climate Change and the Environment, 2016).
78. Hamilton, B. Taking the Efficiency Utility Model to the Next Level. (American Council for an Energy-Efficient Economy, 2008).
79. Carvallo, J. P., Larsen, P. H. & Goldman, C. A. Estimating customer electricity savings from projects installed by the U.S. ESCO industry. (Lawrence Berkeley National Laboratory, 2014).
80. Mike Rufo, Itron. Interview by Julia Szinai. (2016).
81. Sterrett, R., Bruder, D. M., Linderman, L. & Kelly, A. California’s Small Business Standard Performance Contract Program, The First Year. (Alternative Energy System Consulting, Inc, SCE, SDG&E, PG&E).
82. Nonresidential SPC M&V Case Study Report. (Prepared by XENERGY Inc. for Southern California Edison, 2002).
83. Goldman, C., Eto, J., Prahl, R. & Schlegel, J. California’s Nonresidential Standard Performance Contract Program. (Lawrence Berkeley National Laboratory, 1998).
84. 2004-2005 Statewide Nonresidential Standard Performance Contract Program Measurement and Evaluation Study: Impact, Process and Market Evaluation – Final Report. (Submitted by Itron to Southern California Edison, 2008).

Page 62 PUTTING YOUR MONEY WHERE YOUR METER IS NRDC
85. Schiller, S., Schroeder, C., Mapes, J., Henderson, B. & Gruen, W. Rate Payer Funds for Performance Contracting: Three Approaches to Measurement and Verification and Market Outreach. (Nexant, NYSERDA, Public Service Company of Colorado, 2002).
86. Existing Facilities Performance Based Incentive Program. DSIRE Available at: http://programs.dsireusa.org/system/program/detail/5662. (Accessed: 27th November 2016)
87. Industry Overview. Texas Energy Efficiency Available at: http://www.texasefficiency.com/index.php/about/industry-overview. (Accessed: 27th April 2016)
88. Neme, C. & Grevatt, J. Energy Efficiency as a T&D Resource: Lessons from Recent U.S. Efforts to Use Geographically Targeted Efficiency Programs to Defer T&D Investments. (Prepared by Energy Futures Group for the Northeast Energy Efficiency Partnerships, 2015).
89. Assessment of the Whole Building Savings Verification Approach in the University of California Monitoring-Based Commissioning Program. (Prepared by Quantum Energy Services and Technologies, Inc for PG&E and UCOP, 2015).
90. Forward Capacity Market. ISO New England Available at: http://www.iso-ne.com/markets-operations/markets/forward-capacity-market. (Accessed: 30th April 2016)
91. Forward Capacity Auction Mechanics. Available at: http://www.iso-ne.com/markets-operations/markets/forward-capacity-market/fcm-participation-guide/fcm-auction-mechanics. (Accessed: 30th April 2016)
92. Qualification Process for New Demand Resources. ISO New England Available at: http://www.iso-ne.com/markets-operations/markets/forward-capacity-market/fcm-participation-guide/qualification-process-for-new-demand-resources. (Accessed: 30th April 2016)
93. ISO New England Manual for Measurement and Verification of Demand Reduction Value from Demand Resources: Manual M-MVDR. (2014).
94. Efficiency Vermont Annual Report 2014. (Efficiency Vermont, 2015).
95. Key Grid and Market Stats. ISO New England Available at: http://www.iso-ne.com/about/key-stats/markets#fcaresults. (Accessed: 30th April 2016)
96. Kathleen Ward, Dana Max, Bill Provencher & Brent Barkett. Home Energy Reporting Program Evaluation Report (1/1/2014 – 12/31/2014). (Prepared by Navigant Consulting for Potomac Edison).
97. OPower Whitepaper: Successful Behavioral EE Programs. (OPower, 2012).
98. Allcott, H. & Rogers, T. The Short-Run and Long-Run Effects of Behavioral Interventions: Experimental Evidence from Energy Conservation. (National Bureau of Economic Research, 2012).
99. Impact Evaluation of 2014 San Diego Gas & Electric Home Energy Reports Program (Final Report). (Prepared for California Public Utilities Commission by DNV GL).
100. Ochsner, H., Stewart, J., Drake-McLaughlin, N. & Haeri, H. BPA Energy Management Pilot Impact Evaluation. (A Report to the Bonneville Power Administration by The Cadmus Group, Inc., 2013).
101. Eskil, J. Energy Smart Industrial Program. (2014).
102. Bonneville Power Administration. Comparison of Regional Energy Management Pilot Programs. (2011).
103. Metrus Energy. Available at: http://metrusenergy.com/. (Accessed: 29th April 2016)
104. Case Study: BAE Systems Multi-site Program. Available at: http://metrusenergy.com/wp-content/uploads/2016/02/BAE-ESA-Program-Case-Study_2016.pdf.
105. Healey, H., Rozanova, V., Rooney, T., Lorentzen, M. & Mosser, M. New Jersey’s Clean Energy Program: Pay for Performance: Integrating Performance Programs and ENERGY STAR. (TRC Energy Services and New Jersey Board of Public Utilities, 2010).
106. Pay for Performance | NJ OCE Web Site. Available at: http://www.njcleanenergy.com/commercial-industrial/programs/pay-performance. (Accessed: 11th April 2016)
107. New Jersey Pay for Performance Program Overview - DSIRE. DSIRE Available at: http://programs.dsireusa.org/system/program/detail/3330. (Accessed: 30th April 2016)
108. TRC. New Jersey’s Clean Energy Program Fiscal Year 2016 Program Descriptions and Budget: Commercial & Industrial Energy Efficiency Programs Managed by TRC as C&I Market Manager. (2016).
109. Frequently Asked Questions | NJ OCE Web Site. Available at: http://www.njcleanenergy.com/commercial-industrial/programs/pay-performance/faqs. (Accessed: 30th April 2016)
110. New Jersey’s Clean Energy Program: Pay for Performance - Existing Buildings Incentive Structure: July 1, 2015 – June 30, 2016.
111. McCarthy, A. How the **** does Sealed work?? (Andrew McCarthy). The Sealed Blog (2015).
112. McCarthy, A. [Reposted] Energy Savings Guarantees 101 (Part 2). The Sealed Blog (2014).
113. FAQ. Sealed Available at: http://sealed.com/faq/. (Accessed: 29th April 2016)
114. Decision Authorizing Long-term Procurement for Local Capacity Requirements, Rulemaking 12-03-014. (2013).
115. Sierra Martinez, NRDC. Interview by Julia Szinai. (2016).
116. Mark Wallenrod, Southern California Edison. Interview by Julia Szinai. (2016).
117. 2013 LCR RFO Energy Efficiency Agreement Pro-Forma between Seller and Southern California Edison Company. (2013).
118. Seattle Unveils ‘Pay for Performance’ Pilot Program. Rocky Mountain Institute: RMI Outlet Available at: http://blog.rmi.org/2013_02_25_seattle_unveils_pay_for_performance_pilot_program. (Accessed: 29th April 2016)
119. Stan Price, Northwest Energy Efficiency Council. Interview by Julia Szinai. (2016).
120. Energy Savings Report: 1111 Third Pay for Performance, Second Performance Year - Revised. (ATS Automation, 2015).
121. Carrillo, L. Commercial Whole Building Performance: 2016 HOPP Stakeholder Webinar. (2016).
122. Leo Carrillo, PG&E. Interview by Julia Szinai. (2016).
123. Burgess, J., Cross, M., Baker, G. & Vohra, P. The Second Generation of Strategic Energy Management Programs. (Consortium for Energy Efficiency (CEE), AEP Ohio, Efficiency Vermont, National Grid, 2015).
124. Goldman, E. Efficiency Vermont CEI program. (2016).
125. National Grid Pay-for-Performance Application for RCx and MBCx Services 2016 Retrofit Program. (2016).
126. Jen Chiodo. Personal Communication to Emily Levin, VEIC. (2016).
127. Pilot Projects. MEETS Coalition Available at: http://www.meetscoalition.org?p=38. (Accessed: 29th April 2016)
128. Rob Harmon, MEETS. Interview by Julia Szinai. (2016).
129. Review Sheet For 2016 HOPPs Proposals; PG&E Residential Pay For Performance AL#: 3698-G/4813-E. (2016).