Embed Size (px)
Citation preview
SINTEF Energy Research Thermal Energy 2017-01-24
TR A7629 - Unrestricted
Report
Superchilling of organic food Part 2: Storage test with superchilled organic salmon and pork chops Authors Ingrid Camilla Claussen Per Egil Gullsvåg; Michael Bantle; Ignat Tolstorebrov; Karoline Kvalsvik
PROJECT NO. 502000972 (SusOrganic)
REPORT NO. TR A7629
VERSION V1
2 of 19
Document history VERSION DATE VERSION DESCRIPTION
Version No. 1 2017-01-24 Summary of the performed experimental investigations in the SusOrganic project on the applied concept of super-chilling on organic pork and salmon.
PROJECT NO. 502000972 (SusOrganic)
REPORT NO. TR A7629
VERSION V1
3 of 19
Contents
1 Introduction .................................................................................................................................. 5
2 Materials and Method ................................................................................................................... 7 2.1 Superchilling of organic salmon fillets ........................................................................................... 7 2.2 Superchilling of organic pork chop ................................................................................................ 8 2.3 Microbiological analyses ................................................................................................................ 9 2.4 Physicals properties ....................................................................................................................... 9
2.4.1 Initial water content .......................................................................................................... 9 2.4.2 Water-holding capacity (WHC) ........................................................................................ 10 2.4.3 Colour .............................................................................................................................. 10 2.4.4 Drip loss analyses ............................................................................................................. 10
3 Results for superchilling of salmon filets ...................................................................................... 11 3.1 Microbiological analysis ............................................................................................................... 11 3.2 Physical properties ....................................................................................................................... 12
3.2.1 Initial water content (WC) ............................................................................................... 12 3.2.2 Drip loss ........................................................................................................................... 12 3.2.3 Water holding capacity (WHC) ........................................................................................ 13 3.2.4 Colour of organic salmon ................................................................................................. 13
4 Results for chilled and superchilled pork chop .............................................................................. 15 4.1 Microbiological analysis ............................................................................................................... 15 4.2 Physical properties ....................................................................................................................... 16
4.2.1 Initial Water content (WC)............................................................................................... 16 4.2.2 Drip loss ........................................................................................................................... 16 4.2.3 Water holding capacity (WHC) ........................................................................................ 17
4.3 Colour ........................................................................................................................................... 17
5 Conclusions ................................................................................................................................. 19
PROJECT NO. 502000972 (SusOrganic)
REPORT NO. TR A7629
VERSION V1
4 of 19
Table of Figure Figure 1: Packaging for salmon filets in the performed experiments. ................................................................................ 7 Figure 2: Number of colony forming units (CFU) in salmon fillets during storage of fresh, chilled and superchilled salmon filets processed after Method 1, with ice level of 15% (red) stored at -1.5ºC, and chilled reference samples stored at +3ºC (blue) ........................................................................................................................................................ 11 Figure 3: Percentile drip loss in super-chilled organic salmon fillets with ice level of 15% (red) stored at -1.5ºC, and chilled reference samples stored at +3ºC (blue)............................................................................................................... 12 Figure 4: Percentile water holding capacity of superchilled organic salmon fillets with ice level of 15% (red) stored at -1.5ºC and chilled reference samples stored at +3ºC (blue). ............................................................................................. 13 Figure 5: Colour changes L*a*b (expressed as delta E) for normal chilled and super-chilled salmon fillets with ice level of 15% (red) stored at -1.5ºC, and chilled reference samples stored at +3ºC (blue). ...................................................... 14 Figure 6: Color changes in Hunter coordinates L*a*b for normal chilled and superchilled organic slamon. fillets with ice level of 15% (red) stored at -1.5ºC, and chilled reference samples stored at +3ºC (blue) ......................................... 14 Figure 7: Number of colony forming units in pork with ice level of x (red) and chilled reference sample at +3ºC during storage .............................................................................................................................................................................. 15 Figure 8: Drip loss for organic and normal pork chop during 17 days of storage at +3ºC for normal, chilled sample and at -1,7ºC for organic super-chilled samples ..................................................................................................................... 16 Figure 9: Percentile water holding capacity of superchilled organic pork chops with ice level of x% (red) stored at -1.5ºC and chilled reference samples stored at +3ºC(blue) ............................................................................................... 17 Figure 10: Colour changes L*a*b (expressed as delta E) for normal chilled and super-chilled pork. ............................ 18 Figure 11: Color changes in Hunter coordinates L*a*b for normal chilled and superchilled pork chop ........................ 18 Table of Tables Table 1: Experimental setup for superchilling of organic Salmon. ................................................................... 8 Table 2: Experimental setup for superchilling of organic Pork chop. .............................................................. 9 Table 3: Documented shelf life for organic salmon and organic pork products. ............................................ 19

PROJECT NO. 502000972 (SusOrganic)
REPORT NO. TR A7629
VERSION V1
5 of 19
1 Introduction Organic production in Norway is a niche market and only 1.6 % of the sold products in supermarkets are organic. For meat products, only 1 % of the meat is organic and around 50 % of the produced organic meat is sold under conventional, non-organic labels. Long and time-consuming transportation in the cold chain from small or medium scale producers to the final consumer, might be one of the reasons. Extension of shelf life due to superchilling of organic meat and fish products could help to provide the market with fresh, high organic quality products. The increased availability of organic meat and fish products at the market can trigger future consumer demand and help to increase the market share of organic products. Superchilling is performed by freezing between 10 % and 20 % of the water content of the food, depending on the food product. Research and trials has shown that controlled partial freezing or superchilling of food products can result in significant shelf life extensions of the fresh foods. The amount of ice created in the freezing process directly reflex the quality of the product and if it can be defined as fresh or frozen. Superchilling experiments of different food products have shown that ice contents above 30 %, will in most cases be the intersection in defining the product as fresh or frozen. The ice functions as a thermal inertia during storage and transportation, which means that any shorter temperature raise will not affect the product temperature, and thus, nor the product shelf life. Superchilled product have in general an extended shelf life and the technology shows good potential for implementation in the cold chain, since the product quality is comparable with refrigerated products. Since the shelf life is extended for superchilled products, the industry can reduce the use of freezing/thawing as for production buffers. Superchilling is a robust method for conserving of fresh foods, and brings along many possibilities due to the extended product shelf life. This involves i.e. increased production capacity, simplified production planning as well as reaching new markets, reduced energy and labour costs. Another benefit for the industry is higher yield in further refine of the product; especially this has proved important for the fishing industry. The concept of superchilling is a new and improved cold chain process and this requires the implementation of a new temperature level at approximately -2°C (product depended) for the storage of products in the cold chain. In order to reach sufficient process control, it is recommended to implement a fast partial freezing in the first segments of the production line. Promising results have been achieved with blast or impingement freezing. Significant shelf life extensions are demonstrated in literature for certain superchilled meat and fish products. The concept can be used to substitute chilled ice transportation, which will have a direct impact on the carbon footprint in the transport sector. Earlier work have shown a potential for reduced environmental impacts by approximately 30 % for fish transportation. Superchilling has the potential to reduce a substantial impact from currently wasted meat and fish volumes; especially in high income regions with already existing cold chains, hereby contributing significantly to global food security. For industrial implementation, existing or modified equipment from today's cold chain can be used to achieve full utilization of the benefits the supershilling process requires improved process control. R&D has clearly identified the potential of this technology, especially for meat (chicken, lamb, pork) and fish (salmon, cod) products. However, the industry has somewhat overlook this technology, despite the clear benefits, the relative simple implementation also in existing production lines and the high technological readiness level. The first industrial implementations have demonstration positive effects on shelf life, product quality, production yield, energy demand and production costs. The aim of the SusOrganic project is to investigate the concept of superchilling for organic meat and fish products and to outline the potential of the concept for organic producers. The present study is summing up the performed experimental investigations with focus on the achievable shelf life extensions. Two different
PROJECT NO. 502000972 (SusOrganic)
REPORT NO. TR A7629
VERSION V1
6 of 19
products were investigated: organic pork chop and salmon fillets. The products were supplied from local organic producers in Norway. The potential of superchilling is discussed in the part 1 of the report. 1
1 Bantle, Michael; Claussen, Ingrid Camilla; Tolstorebrov, Ignat. Superchilling of organic Food: part 1: Concept, State-of-the-Art and Potential for small scale implementation. Trondheim: SINTEF Energi 2016 (ISBN 978-82-594-3671-9) SINTEF Energi. Rapport(TR A7583)
PROJECT NO. 502000972 (SusOrganic)
REPORT NO. TR A7629
VERSION V1
7 of 19
2 Materials and Method
2.1 Superchilling of organic salmon fillets The experiments were performed on 1-2 Kg salmon fillets delivered by SALMAR, Frøya, Norway (http://www.salmar.no/). The fish used in the current experiments was slaughtered and filleted pre-rigor. Fillets of organic salmon with skin were used in the storage test. Direct after slaughtering and filleting, the chilled fish was send on ice to the laboratory at SINTEF Energy Research/NTNU, where it arrived in the pre-rigor state after 24 hours. The salmon fillets were processed immediately after arrival and the superchilling was performed within 24 hours after the slaughtering in pre-rigor state. The fillets were cut into pieces of 300 g and labelled with a test number. Each sample was split in two; one sample of 100 g (nr. X, m) for microbiological analysis and one sample of 200 g (nr. X, p) for measuring the physical properties. All samples were vacuum packed before storage at -1.5 °C or +3 °C Samples for microbiological analyses were cut into pieces of 100 g vacuum packed and numbered with storage temperature and sample number. The cutting procedures were done using sterile gloves and disinfected knives. Vacuum-packed samples for microbiological analysis were analysed by an independent institute (Analysesenteret, Trondheim/Norway). within 3 hours from delivering. A number of 3 parallels was taken out for microbiological analysis and for physicals properties from day 0. Day 0 refers to the day when the fresh salmon fillets were placed into the cabinets. Two different processing methods of superchilling were performed:
1. Method 1: the samples were cut into 200 g samples, superchilled without the vacuum plastic bag, then vacuum packed with a moisture absorbing cotton piece on the skin side and stored the respective storage condition.
2. Method 2: the samples were cut into 200 g samples, vacuum packed with a moisture absorbing cotton piece on the skin side, then superchilled and stored at the respective storage conditions.
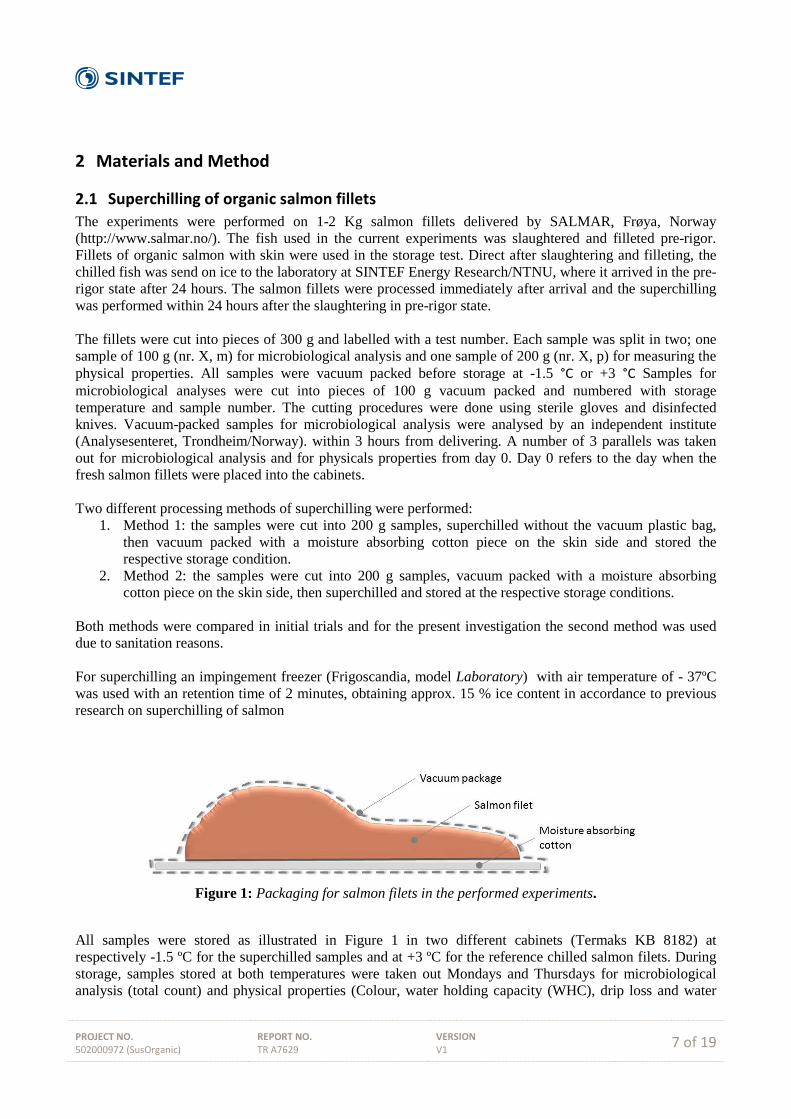
Both methods were compared in initial trials and for the present investigation the second method was used due to sanitation reasons. For superchilling an impingement freezer (Frigoscandia, model Laboratory) with air temperature of - 37ºC was used with an retention time of 2 minutes, obtaining approx. 15 % ice content in accordance to previous research on superchilling of salmon
Figure 1: Packaging for salmon filets in the performed experiments.
All samples were stored as illustrated in Figure 1 in two different cabinets (Termaks KB 8182) at respectively -1.5 ºC for the superchilled samples and at +3 ºC for the reference chilled salmon filets. During storage, samples stored at both temperatures were taken out Mondays and Thursdays for microbiological analysis (total count) and physical properties (Colour, water holding capacity (WHC), drip loss and water
PROJECT NO. 502000972 (SusOrganic)
REPORT NO. TR A7629
VERSION V1
8 of 19
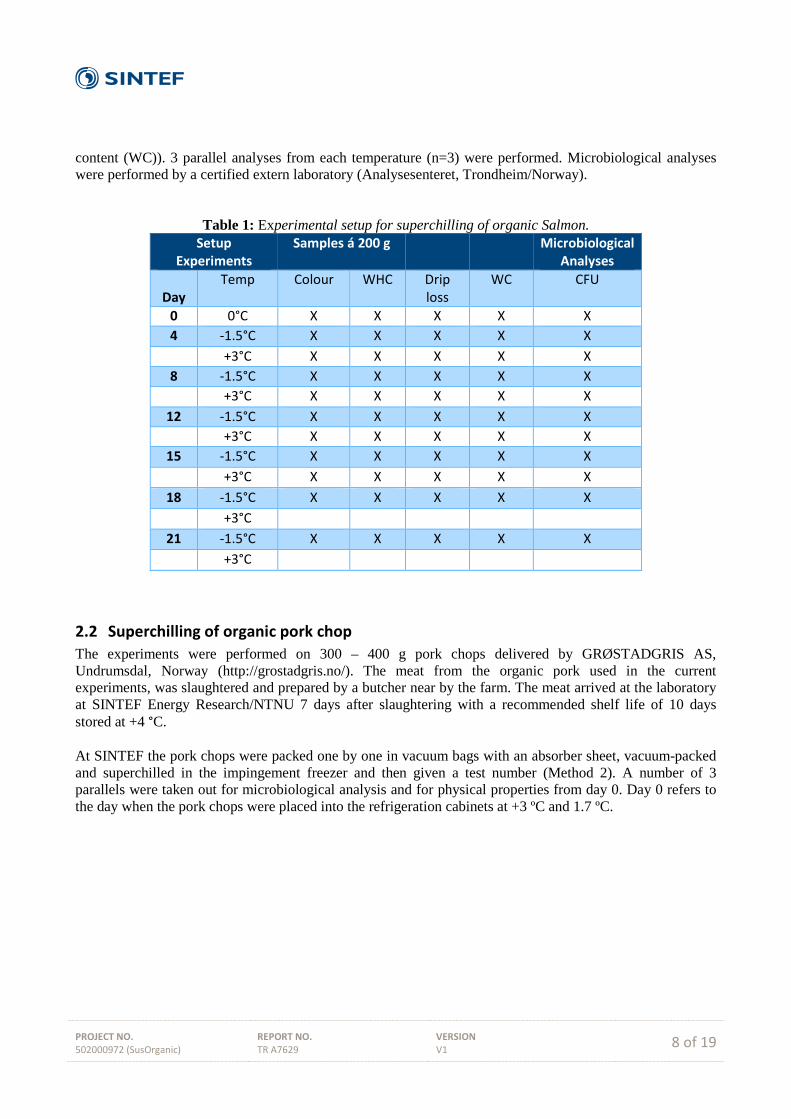
content (WC)). 3 parallel analyses from each temperature (n=3) were performed. Microbiological analyses were performed by a certified extern laboratory (Analysesenteret, Trondheim/Norway).
Table 1: Experimental setup for superchilling of organic Salmon.
Setup Experiments
Samples á 200 g Microbiological Analyses
Day
Temp Colour WHC Drip loss
WC CFU
0 0°C X X X X X 4 -1.5°C X X X X X +3°C X X X X X
8 -1.5°C X X X X X +3°C X X X X X
12 -1.5°C X X X X X +3°C X X X X X
15 -1.5°C X X X X X +3°C X X X X X
18 -1.5°C X X X X X +3°C
21 -1.5°C X X X X X +3°C
2.2 Superchilling of organic pork chop The experiments were performed on 300 – 400 g pork chops delivered by GRØSTADGRIS AS, Undrumsdal, Norway (http://grostadgris.no/). The meat from the organic pork used in the current experiments, was slaughtered and prepared by a butcher near by the farm. The meat arrived at the laboratory at SINTEF Energy Research/NTNU 7 days after slaughtering with a recommended shelf life of 10 days stored at +4 °C. At SINTEF the pork chops were packed one by one in vacuum bags with an absorber sheet, vacuum-packed and superchilled in the impingement freezer and then given a test number (Method 2). A number of 3 parallels were taken out for microbiological analysis and for physical properties from day 0. Day 0 refers to the day when the pork chops were placed into the refrigeration cabinets at +3 ºC and 1.7 ºC.
PROJECT NO. 502000972 (SusOrganic)
REPORT NO. TR A7629
VERSION V1
9 of 19
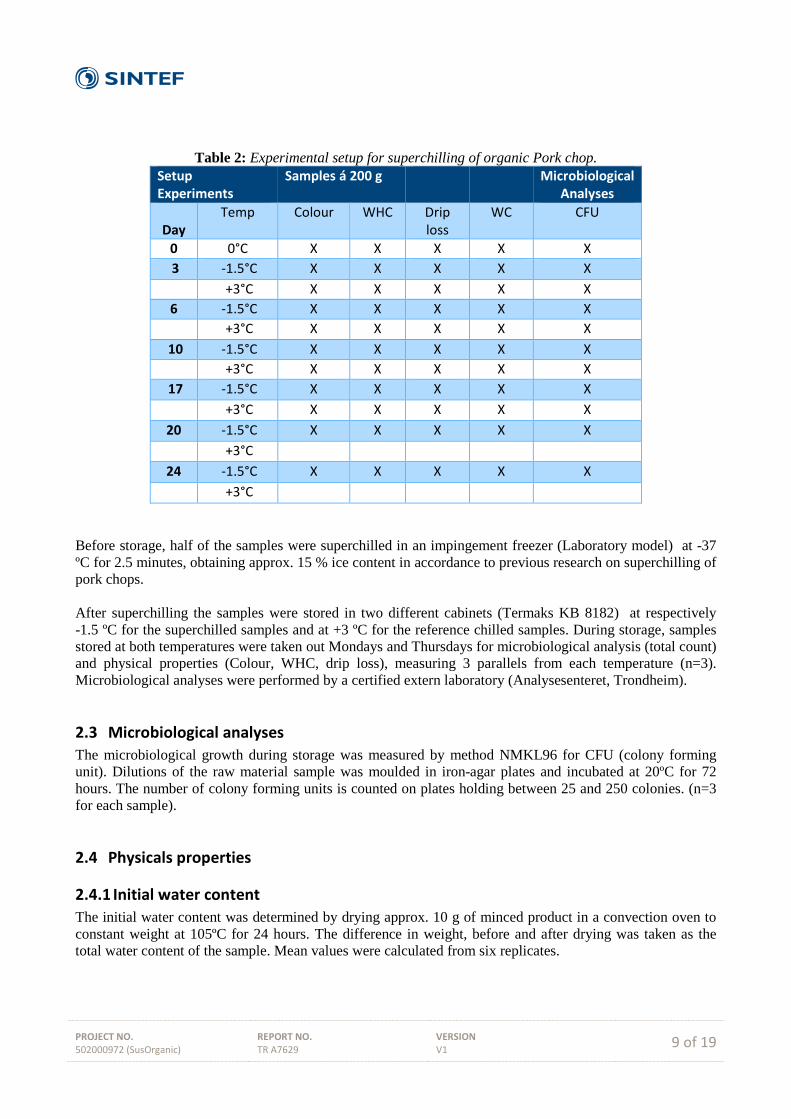
Table 2: Experimental setup for superchilling of organic Pork chop. Setup Experiments
Samples á 200 g Microbiological Analyses
Day
Temp Colour WHC Drip loss
WC CFU
0 0°C X X X X X 3 -1.5°C X X X X X +3°C X X X X X 6 -1.5°C X X X X X +3°C X X X X X
10 -1.5°C X X X X X +3°C X X X X X
17 -1.5°C X X X X X +3°C X X X X X
20 -1.5°C X X X X X +3°C
24 -1.5°C X X X X X +3°C
Before storage, half of the samples were superchilled in an impingement freezer (Laboratory model) at -37 ºC for 2.5 minutes, obtaining approx. 15 % ice content in accordance to previous research on superchilling of pork chops. After superchilling the samples were stored in two different cabinets (Termaks KB 8182) at respectively -1.5 ºC for the superchilled samples and at +3 ºC for the reference chilled samples. During storage, samples stored at both temperatures were taken out Mondays and Thursdays for microbiological analysis (total count) and physical properties (Colour, WHC, drip loss), measuring 3 parallels from each temperature (n=3). Microbiological analyses were performed by a certified extern laboratory (Analysesenteret, Trondheim).
2.3 Microbiological analyses The microbiological growth during storage was measured by method NMKL96 for CFU (colony forming unit). Dilutions of the raw material sample was moulded in iron-agar plates and incubated at 20ºC for 72 hours. The number of colony forming units is counted on plates holding between 25 and 250 colonies. (n=3 for each sample).
2.4 Physicals properties
2.4.1 Initial water content The initial water content was determined by drying approx. 10 g of minced product in a convection oven to constant weight at 105ºC for 24 hours. The difference in weight, before and after drying was taken as the total water content of the sample. Mean values were calculated from six replicates.

PROJECT NO. 502000972 (SusOrganic)
REPORT NO. TR A7629
VERSION V1
10 of 19
2.4.2 Water-holding capacity (WHC) To measure the water holding capacitive, the amount of fish from 3 parallels were mixed together in a food processor and then split into 3 samples of one gram each. Each sample was then placed between two filter papers (Schleicher & Schuell 597 roundfilter, 90 mm) and put on pressure by a 1 kg weight for 10 minutes The final weight of the parallel sample was compared to the weight before applying pressure. Then the WHC was calculated solving the following equation:
𝑊𝑊𝑊𝑊𝑊𝑊 = (1 −𝑚𝑚𝑏𝑏𝑏𝑏𝑏𝑏𝑏𝑏𝑏𝑏𝑏𝑏 𝑝𝑝𝑏𝑏𝑏𝑏𝑝𝑝𝑝𝑝𝑝𝑝𝑝𝑝𝑝𝑝 − �𝑚𝑚𝑏𝑏𝑏𝑏𝑏𝑏𝑏𝑏𝑏𝑏𝑏𝑏 𝑝𝑝𝑏𝑏𝑏𝑏𝑝𝑝𝑝𝑝𝑝𝑝𝑝𝑝𝑝𝑝 − �𝑚𝑚𝑏𝑏𝑝𝑝𝑓𝑓𝑓𝑓𝑏𝑏𝑏𝑏,𝑏𝑏𝑏𝑏𝑏𝑏𝑏𝑏𝑏𝑏𝑏𝑏 𝑝𝑝𝑏𝑏𝑏𝑏𝑝𝑝𝑝𝑝𝑝𝑝𝑝𝑝𝑝𝑝 − 𝑚𝑚𝑏𝑏𝑝𝑝𝑓𝑓𝑓𝑓𝑏𝑏𝑏𝑏,𝑎𝑎𝑏𝑏𝑓𝑓𝑏𝑏𝑏𝑏��
𝑚𝑚𝑏𝑏𝑏𝑏𝑏𝑏𝑏𝑏𝑏𝑏𝑏𝑏 𝑝𝑝𝑏𝑏𝑏𝑏𝑝𝑝𝑝𝑝𝑝𝑝𝑝𝑝𝑝𝑝)
Mean values were calculated from three replicates.
2.4.3 Colour The surface of the product was removed before a sample was taken out for colour analyses. The colour (L, a*, b*) was measured using a Hunter Lab (Coler Flex EZ, Benchtop). The colour of the samples were defined by measuring rate of lightness (L), redness (a*) and yellowness (b*). Samples were scanned and determined by average of 3 replicates. The instrument was calibrated before each test-run. The overall colour changes is expressed by the delta-E relation according to the following equation:
2.4.4 Drip loss analyses During packing of the samples, the weight of the fish, vacuum bag and absorber was weighed. When the samples were opened for testing, the new weight of the fish, bag and absorber were noted again. Then the drip loss was calculated based on the weight difference.
∆𝐸𝐸 = �(𝐿𝐿 − 𝐿𝐿0)2 + (𝑎𝑎 − 𝑎𝑎0)2 + (𝑏𝑏 − 𝑏𝑏0)2

PROJECT NO. 502000972 (SusOrganic)
REPORT NO. TR A7629
VERSION V1
11 of 19
3 Results for superchilling of salmon filets The storage temperature has a major influence on the shelf life of the fresh salmon filets, and to study this, microbiological growth, drip loss, colour change and water holding capacity (WHC) were evaluated during storage at different temperatures. The trials with ordinary chilled organic salmon (reference samples) ended always earlier because of common spoilage during the storage period.
3.1 Microbiological analysis Results from the microbiological analysis (CFU) during storage are presented in Figure 2. The quality limit of 107 CFU/g represents a usual microbiological quality measure, above which food is regarded as unfit for human consumption. The results in Figure 2 show an expected increase in microbiological counts development for both storage conditions. As expected, the CFU levels for salmon samples stored superchilled are considerably lower compared with high chilling temperatures. The CFU level for the samples stored at +3 °C exceeded the quality level already at day 14. This is the commonly accepted shelf life for Salmon filets chilled in ordinary refrigeration conditions.
Figure 2: Number of colony forming units (CFU) in salmon fillets during storage of fresh, chilled and superchilled salmon fillets processed after Method 1, with ice level of 15 % (red) stored at -1.5 ºC, and
chilled reference samples stored at +3 ºC (blue)
0,0001
0,001
0,01
0,1
1
10
100
0 2 4 6 8 10 12 14 16 18 20 22
Mic
robi
olog
ical
gro
wth
, CFU
/gM
illio
ns
Days
Organic Salmon
Normal chilled Salmon
Superchilled Salmon

PROJECT NO. 502000972 (SusOrganic)
REPORT NO. TR A7629
VERSION V1
12 of 19
3.2 Physical properties
3.2.1 Initial water content (WC) Initial water content for organic salmon was calculated to 69.5 % on wet basis (n=6). The average of initial water content for organic salmon was calculated to 69.5 %.
3.2.2 Drip loss Results from the drip loss during storage are presented in Figure 3. The curves shows the weight reduces in percentage from day zero (100 %). The values are the average from 3 parallels, from each temperature. The drip loss trends are almost equal from both storage temperatures. Superchilled salmon showed a slightly increase in drip loss in the beginning of the storage period. However, towards the end the differences in drip loss are equalized.
Figure 3: Percentile drip loss in superchilled organic salmon fillets with ice level of 15 % (red) stored at -1.5 ºC, and chilled reference samples stored at + 3ºC (blue).
94
95
96
97
98
99
100
0 5 10 15 20 25 30
Wei
ght (
%)
Days
Drip loss
superchilled salmon
normal chilled salmon
PROJECT NO. 502000972 (SusOrganic)
REPORT NO. TR A7629
VERSION V1
13 of 19
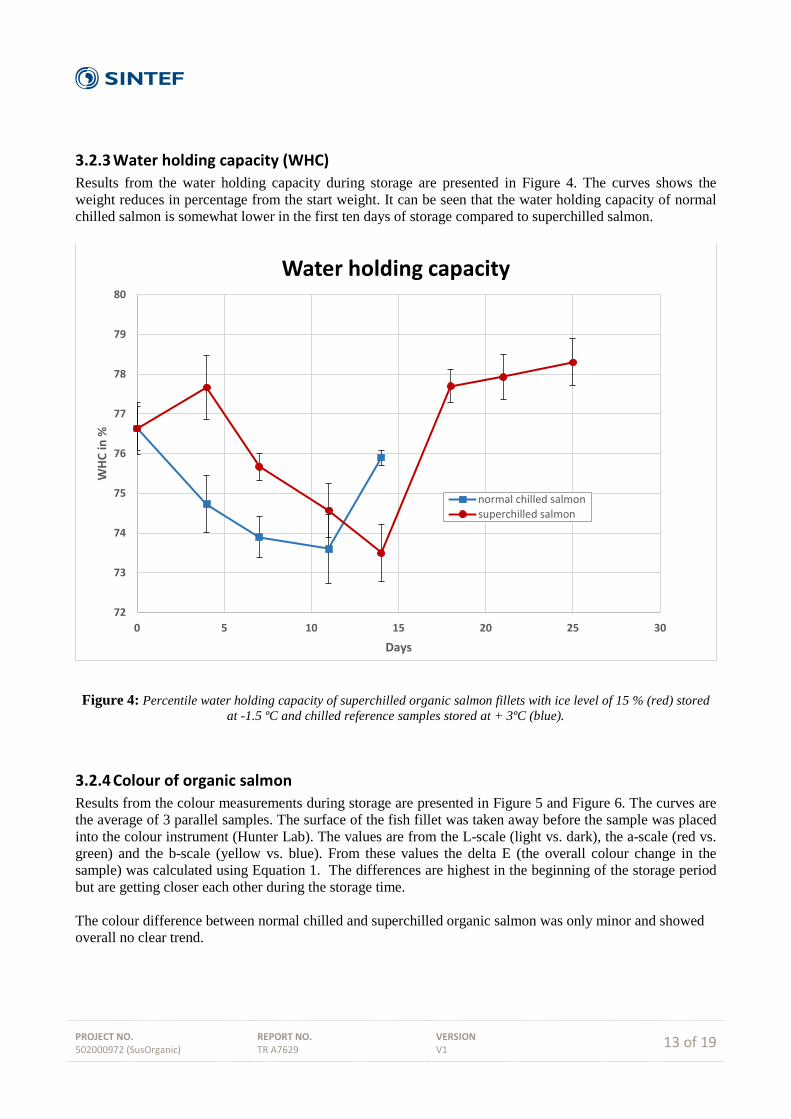
3.2.3 Water holding capacity (WHC) Results from the water holding capacity during storage are presented in Figure 4. The curves shows the weight reduces in percentage from the start weight. It can be seen that the water holding capacity of normal chilled salmon is somewhat lower in the first ten days of storage compared to superchilled salmon.
Figure 4: Percentile water holding capacity of superchilled organic salmon fillets with ice level of 15 % (red) stored at -1.5 ºC and chilled reference samples stored at + 3ºC (blue).
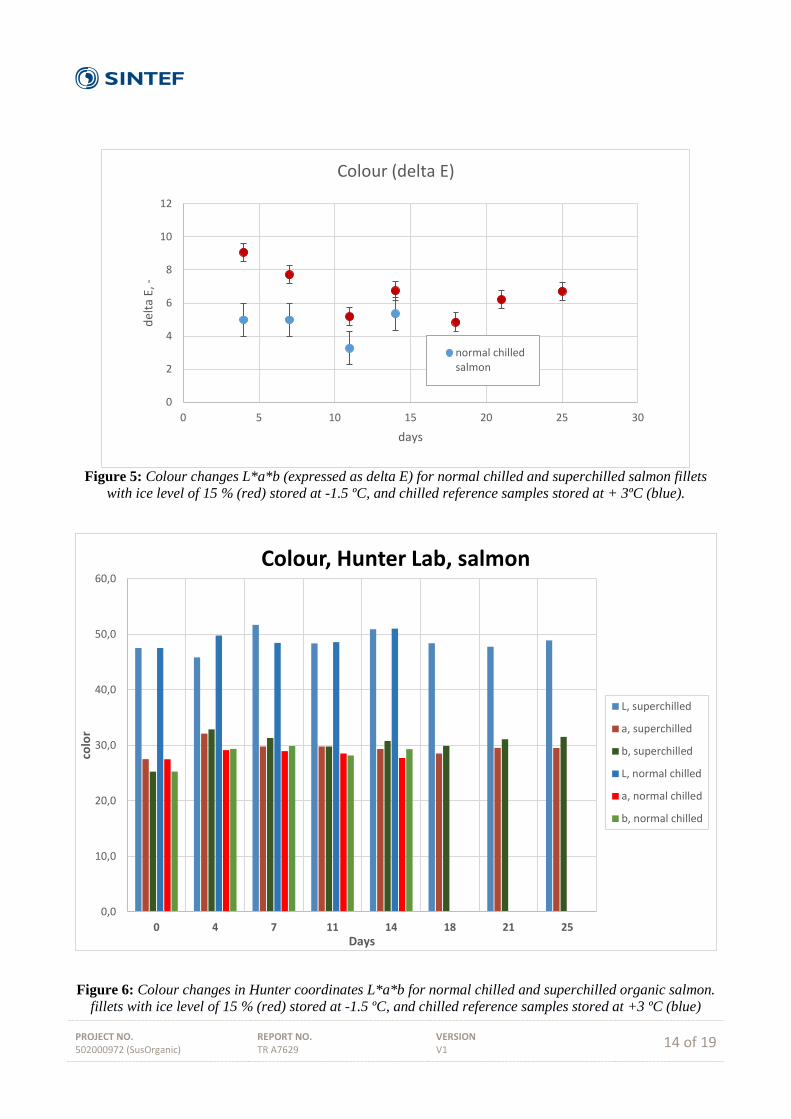
3.2.4 Colour of organic salmon Results from the colour measurements during storage are presented in Figure 5 and Figure 6. The curves are the average of 3 parallel samples. The surface of the fish fillet was taken away before the sample was placed into the colour instrument (Hunter Lab). The values are from the L-scale (light vs. dark), the a-scale (red vs. green) and the b-scale (yellow vs. blue). From these values the delta E (the overall colour change in the sample) was calculated using Equation 1. The differences are highest in the beginning of the storage period but are getting closer each other during the storage time. The colour difference between normal chilled and superchilled organic salmon was only minor and showed overall no clear trend.
72
73
74
75
76
77
78
79
80
0 5 10 15 20 25 30
WHC
in %
Days
Water holding capacity
normal chilled salmonsuperchilled salmon
PROJECT NO. 502000972 (SusOrganic)
REPORT NO. TR A7629
VERSION V1
14 of 19
Figure 5: Colour changes L*a*b (expressed as delta E) for normal chilled and superchilled salmon fillets
with ice level of 15 % (red) stored at -1.5 ºC, and chilled reference samples stored at + 3ºC (blue).
Figure 6: Colour changes in Hunter coordinates L*a*b for normal chilled and superchilled organic salmon. fillets with ice level of 15 % (red) stored at -1.5 ºC, and chilled reference samples stored at +3 ºC (blue)
0
2
4
6
8
10
12
0 5 10 15 20 25 30
delta
E, -
days
Colour (delta E)
normal chilledsalmon
0,0
10,0
20,0
30,0
40,0
50,0
60,0
0 4 7 11 14 18 21 25
colo
r
Days
Colour, Hunter Lab, salmon
L, superchilled
a, superchilled
b, superchilled
L, normal chilled
a, normal chilled
b, normal chilled

PROJECT NO. 502000972 (SusOrganic)
REPORT NO. TR A7629
VERSION V1
15 of 19
4 Results for chilled and superchilled pork chop
4.1 Microbiological analysis Results from the microbiological analysis (CFU) during storage are presented in Figure 7. The quality limit of 107 CFU/g represents a usual microbiological quality measure, above which food is regarded as unfit for human consumption. The normal refrigerated pork chop exceeded the bacterial count after approximately 8-9 days. This was shorter than expected, since the commonly accepted shelf life of pork is 14 days. The supplier however, specified that he needs to send the pigs to a slaughterhouse and that the deboned animals then is delivered back to the him after around 3 days in chilled conditions. This is because the SME owns no infrastructure (and licence) for slaughtering. First after 3 days the meat is then processed/chopped further and sent to the customer. This means that the product is already 7 days old when reaching the market and the time for selling the product is reduced accordingly. This time period should be added to the graphs (Figure 7 to Figure 11). This explains the documented shorter shelf life. However, Figure 7 shows that the shelf life of superchilled pork was extended by around 14 days, despite the fact the product is already 7 days old.
Figure 7: Number of colony forming units in pork with ice level of x (red) and chilled reference sample at +3 ºC during storage
0,0001
0,001
0,01
0,1
1
10
100
0 2 4 6 8 10 12 14 16 18 20 22 24
Mic
robi
olog
ical
gro
wth
, CFU
/gM
illio
ns
Days (+ 7 days )
Organic pork chop
normal chilled porksuperchilled pork

PROJECT NO. 502000972 (SusOrganic)
REPORT NO. TR A7629
VERSION V1
16 of 19
4.2 Physical properties
4.2.1 Initial Water content (WC) Initial water content for organic pork was calculated on wet basis (n=3). The average of initial water content for organic salmon was calculated to 63.4 %
4.2.2 Drip loss Results from the drip loss during storage are presented in Figure 8. The curves shows the weight reduces in percentage from day zero (100 %). The values are the average from 3 parallels, from each temperature. The drip loss trends are almost equal from both storage temperatures. Superchilled pork chop showed however, a higher drip loss than normal chilled pork. This can be explained by the freeze damages to the product during the partial freezing.
Figure 8: Drip loss for organic and normal pork chop during 17 days of storage at +3 ºC for normal, chilled sample and at -1,7 ºC for organic super-chilled samples
0
2
4
6
8
10
12
0 5 10 15 20
Drip
loss
(%)
Days
Pork chop
normal chilled pork
superchilled pork
PROJECT NO. 502000972 (SusOrganic)
REPORT NO. TR A7629
VERSION V1
17 of 19
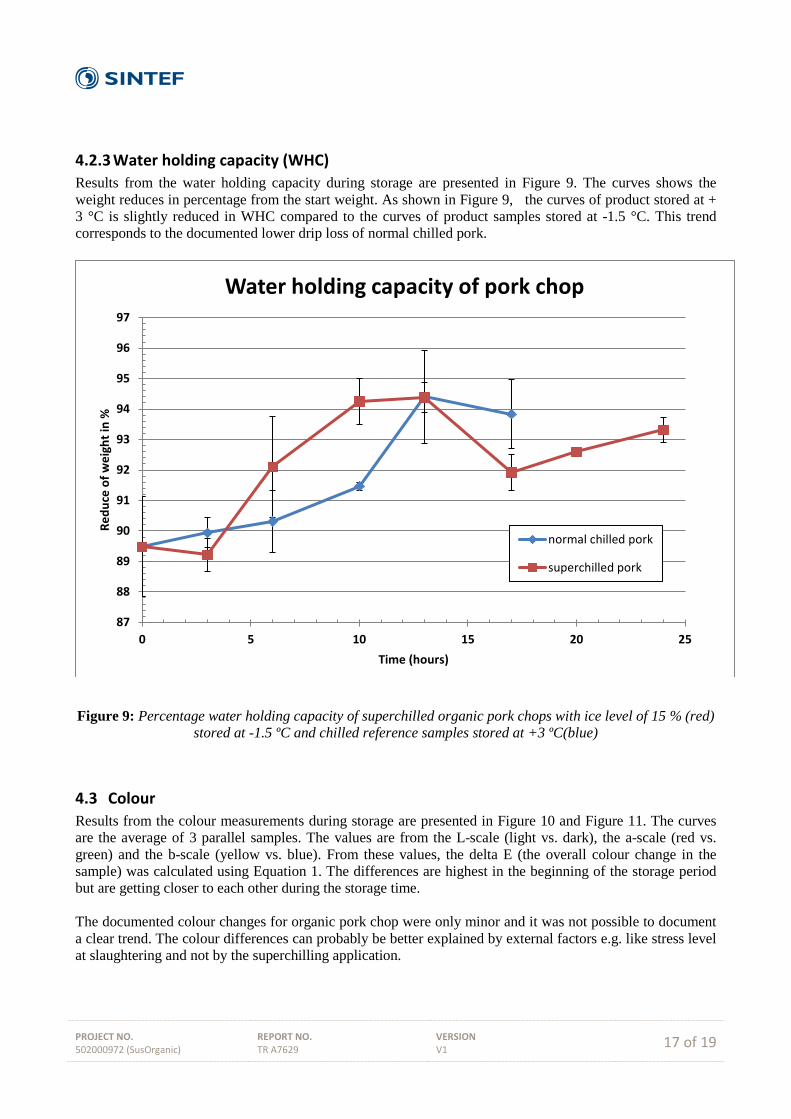
4.2.3 Water holding capacity (WHC) Results from the water holding capacity during storage are presented in Figure 9. The curves shows the weight reduces in percentage from the start weight. As shown in Figure 9, the curves of product stored at + 3 °C is slightly reduced in WHC compared to the curves of product samples stored at -1.5 °C. This trend corresponds to the documented lower drip loss of normal chilled pork.
Figure 9: Percentage water holding capacity of superchilled organic pork chops with ice level of 15 % (red) stored at -1.5 ºC and chilled reference samples stored at +3 ºC(blue)
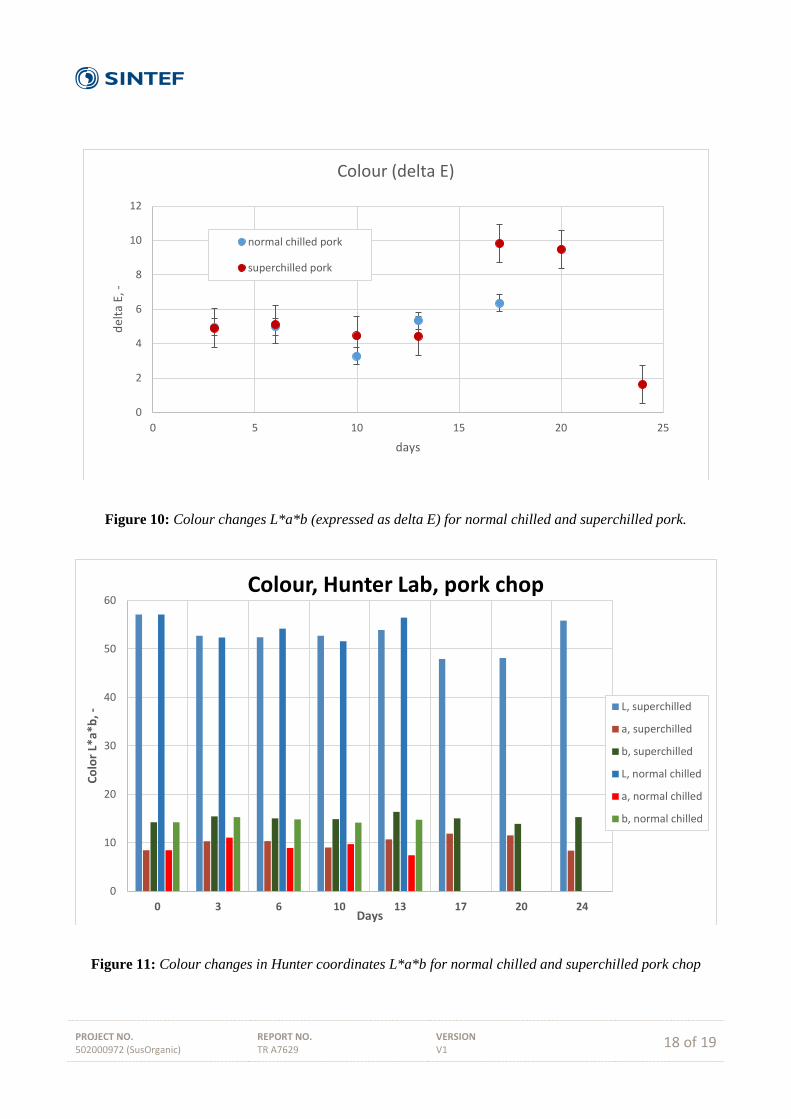
4.3 Colour Results from the colour measurements during storage are presented in Figure 10 and Figure 11. The curves are the average of 3 parallel samples. The values are from the L-scale (light vs. dark), the a-scale (red vs. green) and the b-scale (yellow vs. blue). From these values, the delta E (the overall colour change in the sample) was calculated using Equation 1. The differences are highest in the beginning of the storage period but are getting closer to each other during the storage time. The documented colour changes for organic pork chop were only minor and it was not possible to document a clear trend. The colour differences can probably be better explained by external factors e.g. like stress level at slaughtering and not by the superchilling application.
87
88
89
90
91
92
93
94
95
96
97
0 5 10 15 20 25
Redu
ce o
f wei
ght i
n %
Time (hours)
Water holding capacity of pork chop
normal chilled pork
superchilled pork
PROJECT NO. 502000972 (SusOrganic)
REPORT NO. TR A7629
VERSION V1
18 of 19
Figure 10: Colour changes L*a*b (expressed as delta E) for normal chilled and superchilled pork.
Figure 11: Colour changes in Hunter coordinates L*a*b for normal chilled and superchilled pork chop
0
2
4
6
8
10
12
0 5 10 15 20 25
delta
E, -
days
Colour (delta E)
normal chilled pork
superchilled pork
0
10
20
30
40
50
60
0 3 6 10 13 17 20 24
Colo
r L*a
*b, -
Days
Colour, Hunter Lab, pork chop
L, superchilled
a, superchilled
b, superchilled
L, normal chilled
a, normal chilled
b, normal chilled
PROJECT NO. 502000972 (SusOrganic)
REPORT NO. TR A7629
VERSION V1
19 of 19
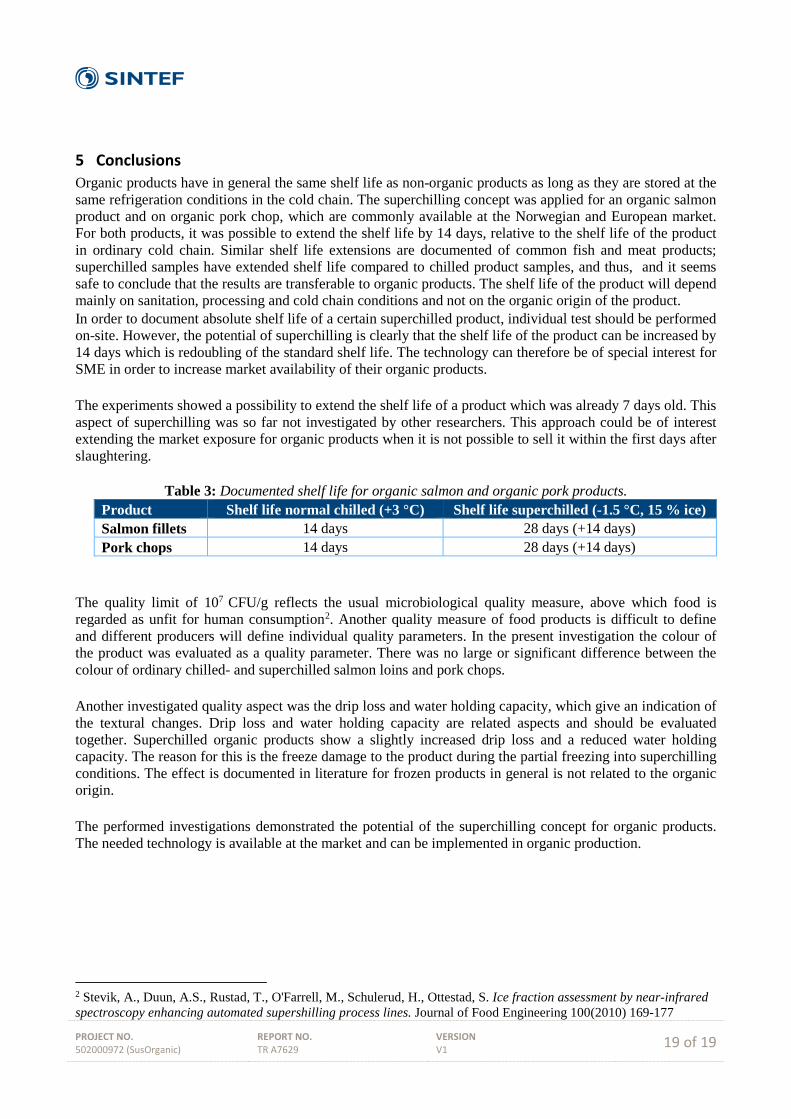
5 Conclusions Organic products have in general the same shelf life as non-organic products as long as they are stored at the same refrigeration conditions in the cold chain. The superchilling concept was applied for an organic salmon product and on organic pork chop, which are commonly available at the Norwegian and European market. For both products, it was possible to extend the shelf life by 14 days, relative to the shelf life of the product in ordinary cold chain. Similar shelf life extensions are documented of common fish and meat products; superchilled samples have extended shelf life compared to chilled product samples, and thus, and it seems safe to conclude that the results are transferable to organic products. The shelf life of the product will depend mainly on sanitation, processing and cold chain conditions and not on the organic origin of the product. In order to document absolute shelf life of a certain superchilled product, individual test should be performed on-site. However, the potential of superchilling is clearly that the shelf life of the product can be increased by 14 days which is redoubling of the standard shelf life. The technology can therefore be of special interest for SME in order to increase market availability of their organic products. The experiments showed a possibility to extend the shelf life of a product which was already 7 days old. This aspect of superchilling was so far not investigated by other researchers. This approach could be of interest extending the market exposure for organic products when it is not possible to sell it within the first days after slaughtering.
Table 3: Documented shelf life for organic salmon and organic pork products. Product Shelf life normal chilled (+3 °C) Shelf life superchilled (-1.5 °C, 15 % ice) Salmon fillets 14 days 28 days (+14 days) Pork chops 14 days 28 days (+14 days)
The quality limit of 107 CFU/g reflects the usual microbiological quality measure, above which food is regarded as unfit for human consumption2. Another quality measure of food products is difficult to define and different producers will define individual quality parameters. In the present investigation the colour of the product was evaluated as a quality parameter. There was no large or significant difference between the colour of ordinary chilled- and superchilled salmon loins and pork chops. Another investigated quality aspect was the drip loss and water holding capacity, which give an indication of the textural changes. Drip loss and water holding capacity are related aspects and should be evaluated together. Superchilled organic products show a slightly increased drip loss and a reduced water holding capacity. The reason for this is the freeze damage to the product during the partial freezing into superchilling conditions. The effect is documented in literature for frozen products in general is not related to the organic origin. The performed investigations demonstrated the potential of the superchilling concept for organic products. The needed technology is available at the market and can be implemented in organic production.
2 Stevik, A., Duun, A.S., Rustad, T., O'Farrell, M., Schulerud, H., Ottestad, S. Ice fraction assessment by near-infrared spectroscopy enhancing automated supershilling process lines. Journal of Food Engineering 100(2010) 169-177

Technology for a better society www.sintef.no