Embed Size (px)
Citation preview
Team TeevraBirla Institute of Technology & Science (BITS), Pilani
INDIA23 March 2010 | HPVC West Zone
Team Teevra • BITS Pilani • INDIA
BITS Pilani
Design Report HPVC WEST, 23-25 APRIL 2010
Table of Contents
Introduction! 2
Abstract! 3
Innovation & Design! 4
Design Methodology 4
Design Considerations 4
Frame 5
Drive Train 6
Braking System: 7
Steering System 11
Setting up the steering assembly 11
Steering Angle 12
Fairing Design Description 13
Analysis! 13
Frame analysis 13
Ergonomics (Biomechanical Analysis) 15
Aerodynamics 15
Stability 19
Project Cost Break-Up 21
Testing! 21
Safety! 23
Previous Work! 25
Conclusion! 26
Appendix! 27
Team Details 27
HPVC Details 28
Glossary of Bicycle terms 29
1
IntroductionThe Team
Human Powered Vehicle was a new concept for our team in April 2009. That was when some interested
individuals came together and decided to work towards this Challenge. We were not much of a team then.
Eleven months down the line, the final eleven members of TEAM -TEEVRA, having put in weeks of work
just researching and reading come together and discuss the future of the HPV is the world, the scope and
prospects. As a senior member of the team it is highly satisfying to see how work got us together and when
we look at the output that we have generated, it is truly a satisfying feeling.
Every member has made a significant contribution towards the successful completion of the project. It was
important for us to emphasize this fact in the introduction as one thing that we have come to believe at the
end of this year is that team is the most important aspect in the success of any effort.
The report contains facts and results that we concluded after long and interesting discussions. But on the
whole we are optimistic about our chances in the HPV Challenge and hope to make the fastest HPV in the
world in the near future.
We hope to making a lasting impression at the HPVC and are charged with determination of participating in
the competition.
Thank you for this opportunity and for providing us with this platform to show case our abilities. We would
also like to thank out college, BITS Pilani, our Professors and our Parents who have been with us at every
step, guiding and motivating us.
2
AbstractThe Vehicle
The Human Powered Vehicle designed by Team Teevra is the first of its kind build under the ASME Student
Chapter of BITS –Pilani. The vehicle will compete in the single rider category of HPVC 2010. Team
TEEVRA was founded in April 2009 with the goal to design a fast, efficient and practical HPV. The team
after doing extensive research came up with the design that is capable of competing with the best of its kind.
The team, after considering two initial designs, evolved the final design of the frame that met the desired
properties related to the practicality, usability and maneuverability of the vehicle .The final design is made
from a single steel tube which is bent into the desired frame without any welded joints in the main body.
We have used standard 9 speed derailleur gear with the lowest number of teeth being 11 and highest with 52
teeth in the front chain ring. Two disc brakes have been installed at both the front and rear wheels of the
vehicle.
To add to the stability of the vehicle, small innovations like two flaps with springs have been provided in the
fairing at the bottom that allows the rider to stabilize or stop the vehicle when desired using his feet. Also
notches have been provided in the fairing to ensure proper ventilation and keep the temperature in check.
Fairing has been made using Kevlar with an outer coating of Coroplast. We have used various CAD, CAM,
CFD, Mathematical softwares like Pro-Engineer, Fluent6, Catia V5.11, MathCAD, Design Foil Workshop
to get an optimum design for our vehicle.
The design was to made to ensure minimum frontal area, full frontal coverage and termination of trailing
edge as close to the rider as possible. Also the space above the driver is designed so as to protect the rider in
case of a rollover. Safety precaution have been given special importance in out design.
3
Innovation & DesignThe Concept
DESIGN METHODOLOGY
Design Considerations
When we studied and analyzed the designs of various HPVs, including the fastest HPV in the world (with a
record of 82 miles/hr), we identified the distinguishing factor in each of them. Some had 3 wheels for
greater stability, others had chain going over their heads. There were designs were riders were facing in the
opposite direction and lying on their chest while riding. All of them had certain positives. Even though we
could not incorporate all of them, we prioritized a few and then came with an initial design which got
scrapped eventually. But when we made the first prototype with that design we realized the flaws and
mistakes, areas that we had over looked. This gave rise to the second and final design, shown below, with
which we were satisfied.
While designing our HPV we gave priority to the following factors:
- Speed, Innovative Modifications & Efficiency
The reason for choosing these are to make an HPV that is capable of breaking world records. To ensure this
we need to maximize efficiency and also make the required modifications that make the Vehicle more
comfortable.
Firstly, to maximize speed we have complete fairing which reduced the drag by unto 70%, which is
considerable. We have taken all the possible ergonomic and stability precautions to ensure that this is
possible.
Then to improve the efficiency we have made considerations in the design like minimizing the frontal cross
sectional area and keeping the centre of gravity low. To ensure that every ounce of energy spent by a person
is converted into speed.
And finally to ensure a comfortable ride we have made some innovative customizations; we have made
improvisations like having spring flaps in the lower part of the fairing to ensure that even one person can
comfortable ride the HPV. The spring insures that while riding at higher speeds there is no drag caused by
those openings. Also he have made fins in the fairing to ensure good air circulation for the rider.
4
We also have tried to use the elastic property of Mild Steel to provide a cushioning effect (suspension effect)
which has never been used in any other deign before.
Other Design Variations that were Considered Earlier:
Our first design concept was to make a multi-rider with a new concept of having two driving wheels, each
driven by a different driver. But then the weight to speed gain ratio was not favorable and so we decided to
work on a single rider vehicle.
Then we designed and fabricated our first HPV, which was a single rider. But it had various flaws and
alignment problems. So after understanding our mistakes we then finally moved ahead with the fabrication
of the final HPV (Teevra).
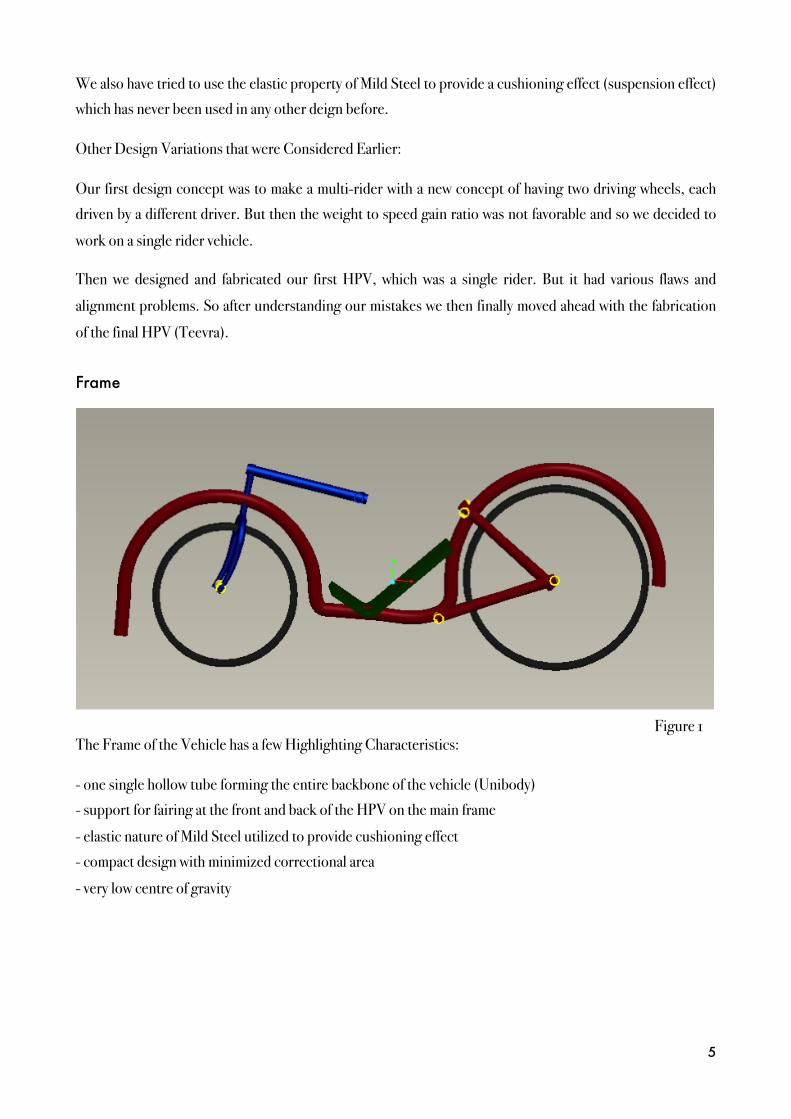
Frame
The Frame of the Vehicle has a few Highlighting Characteristics:
- one single hollow tube forming the entire backbone of the vehicle (Unibody)
- support for fairing at the front and back of the HPV on the main frame
- elastic nature of Mild Steel utilized to provide cushioning effect
- compact design with minimized correctional area
- very low centre of gravity
5
Figure 1
Drive Train
The drive train is one the most important aspects to ensure optimum energy utilization and acceleration.
Our initial choice was Elliptical Gears, but in the prototype that we made first did not give satisfactory
results with them, there were problems with the alignment and the gears and the chain slipped at higher
speeds, so we decided to go ahead with Derailleur Gear System.
The derailleur gear system used has 52 teeth in the front chain ring, and the rear cassette has 9 gears, of
which mainly gears with 11, 12, 13, 15, 17, and 19 teeth will be used. Shimano Sora Octalink crank set with 52
teeth and Shimano HG50 Tiagra cassette and have been used.
Most cyclists can drive at or around 100 rpm(cadence, ω), having peak cadence as high as 150 rpm(ωmax).
This cadence value will be used in calculating the maximum speed of the HPV, for the given derailleur gear
system.
Vmax = [ωmax * 2π/60)] * (FCT/RCT)max * (R * 0.0254)
Where,
ωmax=150 rpm,
FCT (Front Chain Teeth) = 52,
RCT (Rear Cog Teeth) = 11,
R=13.5’’= Driving wheel Radius.
This gives,
Vmax = 25.45 m/s = 91.62 kmph
So ideally speaking, in absence of friction and aerodynamic drag, this is the maximum possible speed of our
HPV. When these resistive factors are taken into account this idealistic speed is congruent with the team’s
aim of achieving speeds of 65-70 kmph.
6
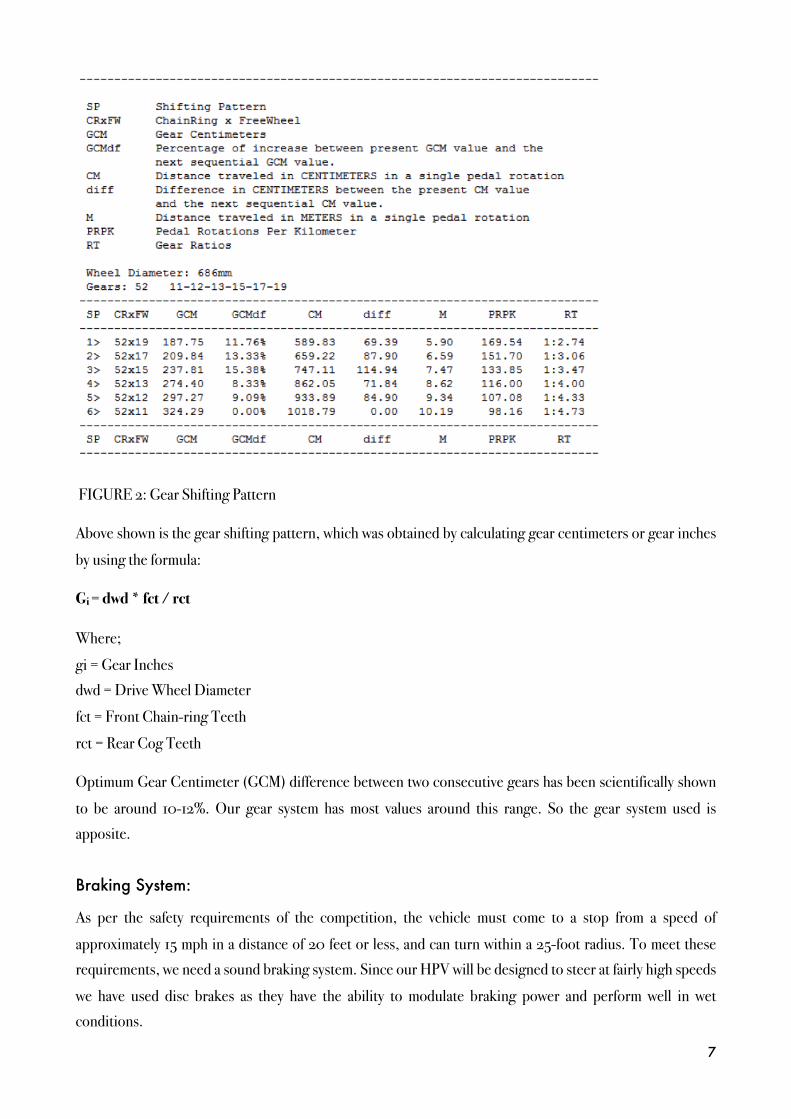
FIGURE 2: Gear Shifting Pattern
Above shown is the gear shifting pattern, which was obtained by calculating gear centimeters or gear inches
by using the formula:
Gi = dwd * fct / rct
Where;
gi = Gear Inches
dwd = Drive Wheel Diameter
fct = Front Chain-ring Teeth
rct = Rear Cog Teeth
Optimum Gear Centimeter (GCM) difference between two consecutive gears has been scientifically shown
to be around 10-12%. Our gear system has most values around this range. So the gear system used is
apposite.
Braking System:
As per the safety requirements of the competition, the vehicle must come to a stop from a speed of
approximately 15 mph in a distance of 20 feet or less, and can turn within a 25-foot radius. To meet these
requirements, we need a sound braking system. Since our HPV will be designed to steer at fairly high speeds
we have used disc brakes as they have the ability to modulate braking power and perform well in wet
conditions.
7
A comparative analysis of average loading of disc brakes with that of motor vehicles, gave us a picture of the
feasibility of its usage in our HPV because both have similar speeds. The brakes for modern motor vehicles
can be designed by allowing a certain horsepower (6 to 10 to be absorbed per square inch [6.94-11.56 X 10⁶
watts/sq.m] of braking surface for drum brakes. The power to be absorbed depends upon the speed and
mass of the vehicle and also on the time in which it is desired to stop.
For our HPV of mass 35 kg and rider of 75 kg, let us determine the power loading at the disc brake blocks
(safely assumed to have a total area of 4 sq in.) at the maximum possible retardation:
amax = (µk + Cr) g = 8.53m/s2 (I)
assuming maximum velocity of the HPV to be, V1 = 80 kmph [or 22.22 m/s]
Time ‘t’ for retardation is given by,
V2 = V1 + a t,
Where, V2 = 0 and V1 is the initial velocity.
Therefore, V1 = - (amax)t and so:
T = - V1/ amax = 2.622 s
The stopping distance is,
S = (V2 + V1) /2 * t=29.13 m
The initial kinetic energy is,
KE = 0.5 M V12 = 27.155 KJ.
Where,
M = total mass of vehicle = 35+75 = 110 Kg
The power dissipation falls from a peak at initial application of the brakes to zero when the bicycle comes to
rest. For determining brake duty-largely a function of surface heating-the mean power dissipation, KE/t, is
required:
Mean power dissipation
! = KE/t = 27.155*103/2.622
! = 10.357 KW.
Power absorbed per unit of brake-block area = 10.357/(2581*10-6) = 4*106 W/m2. This is less than half of
the average loading allowed in automobile-braking practice. Therefore the surface area is more than
adequate.
8
It is necessary in addition to be able to apply an adequate force to the brake system. Bicycle brakes are often
deficient in this respect, especially in wet weather when the coefficient of friction is greatly reduced, and
especially for the front wheel, where most of the braking capacity is available.
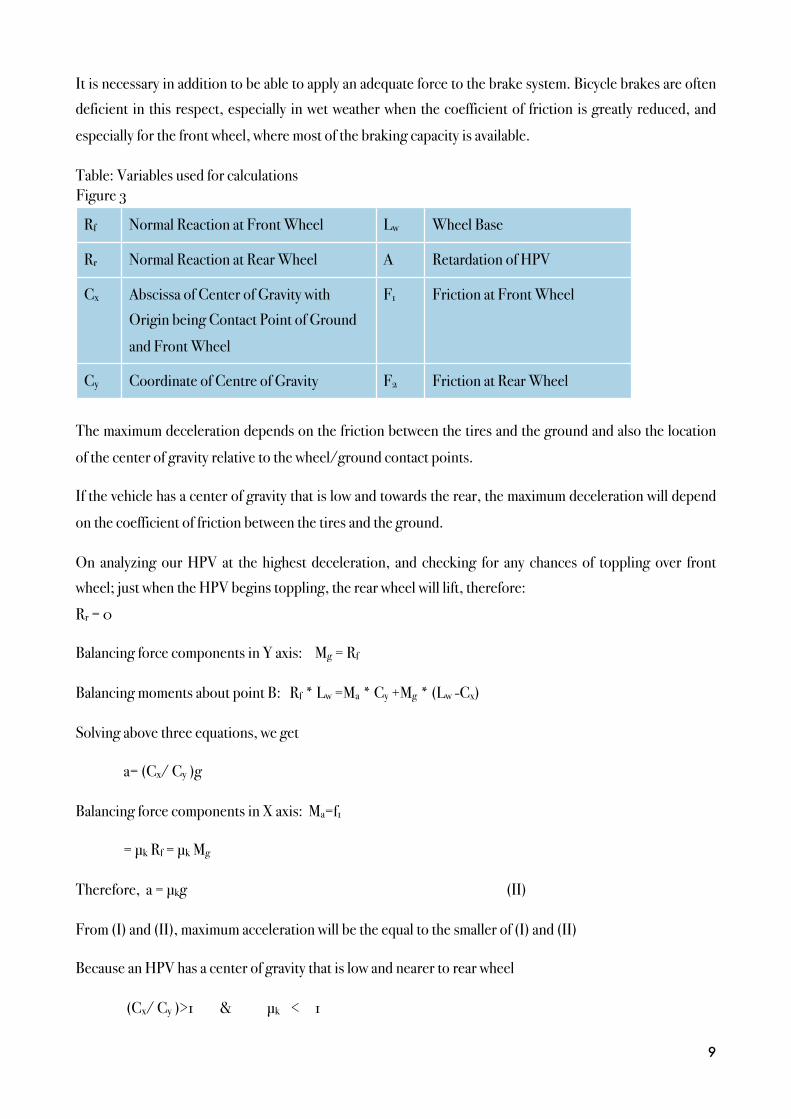
Table: Variables used for calculations
Rf Normal Reaction at Front Wheel Lw Wheel Base
Rr Normal Reaction at Rear Wheel A Retardation of HPV
Cx Abscissa of Center of Gravity with
Origin being Contact Point of Ground
and Front Wheel
F1 Friction at Front Wheel
Cy Coordinate of Centre of Gravity F2 Friction at Rear Wheel
The maximum deceleration depends on the friction between the tires and the ground and also the location
of the center of gravity relative to the wheel/ground contact points.
If the vehicle has a center of gravity that is low and towards the rear, the maximum deceleration will depend
on the coefficient of friction between the tires and the ground.
On analyzing our HPV at the highest deceleration, and checking for any chances of toppling over front
wheel; just when the HPV begins toppling, the rear wheel will lift, therefore:
Rr = 0
Balancing force components in Y axis: ! Mg = Rf
Balancing moments about point B: Rf * Lw =Ma * Cy +Mg * (Lw -Cx)
Solving above three equations, we get
! a= (Cx/ Cy )g
Balancing force components in X axis: Ma=f1
! = µk Rf = µk Mg
Therefore, a = µkg! ! ! ! ! ! ! (II)
From (I) and (II), maximum acceleration will be the equal to the smaller of (I) and (II)
Because an HPV has a center of gravity that is low and nearer to rear wheel
! (Cx/ Cy )>1 & ! µk < ! 1
9
Figure 3
Therefore, ! amax= µkg
So as long as the (Cx/ Cy ) ratio is larger than µk then there is little chance of the bike toppling forward and
the coefficient of friction between the tires and the road (µk) will define the maximum deceleration.
The team’s current design has a Cx/Cy ratio of 31.5’’/16’’= 1.97. The maximum µk for bicycle tires against
asphalt is about 0.84 . Since the vehicle’s Cx/Cy ratio is much higher than the µk this will cause the vehicle to
be safer and further investigation of the required braking system will revolve around the maximum
deceleration due to the coefficient of friction between the tires and the road.
The next step in determining an appropriate braking system is to analyze the actual friction forces against
the wheels. The same free body diagram was used to determine the normal forces at each wheel in a
maximum deceleration situation, thus allowing the friction forces to be determined. Summing the moments
and forces about the HPV:
! Rr + Rf =Mg;
! Ma= f1 + f2 = µk (Rr + Rf);
! Rf * Lw =Ma * Cy +Mg * (Lw -Cx)
Solving above three equations simultaneously we get:
! Rf =Mg [ Lw – (Cx- µkCy ) ]/ Lw =68 Kg-wt
&! Rr =Mg [(Cx- µkCy )/ Lw =41 Kg-wt
Now using f= µkR, f1 & f2 can also be determined.
For a controlled braking mechanism, maximum force required from the brakes can be just below the force
needed to stop the HPV in the maximum deceleration case. By summing the moments about the center of
the wheel the required force that each brake needs to apply to the wheel can be determined. We get:
! F = f*(Rtire/Rdisc)
Where, F=Braking Force, and f=friction between tire and wheel.
Relation between Friction force and normal force (N) at brakes is given by: N=F/µk’’
The coefficient of friction between the brake pads and the aluminum disc can be estimated to be about 0.9.
This equation produced the maximum needed brake forces to be 194.5Kg-wt and 117 kg-wt for the front and
rear wheels respectively with rider of 75 kg. The average person can apply about 29.5 Kg-wt of force using
his hand in a gripping action.
The required mechanical advantage thus can be approximated by calculating the ratio:
! 194.5/29.5 = 6.6 : 1 (approximately)
10
Standard side pull caliper brakes provide a mechanical advantage of about 5 : 1. They are also well suited to
the type of wheels that will be used on the HPV. The selection for a braking system will most likely be a mid
grade quality. The mechanical advantage of the brake lever and the brake are 5 : 1 and 2 : 1, approx.
respectively. This gives a total maximum mechanical advantage of (5*2) : 1 = 10 : 1 which is much greater
than the required 6.6:1 mechanical advantage. Hence the braking system is sufficient for the HPV.
The minimum stopping distance:
! Minimum stopping distance, Smin is calculated by using maximum deceleration.
! We found out earlier that, amax= µkg
However we didn’t take into account the effect of rolling resistance. For pneumatic bicycle tires, Coefficient
of rolling resistance Cr is approximately 0.02, therefore
amax= (µk +Cr)g=8.5347 m/s2
Smin =V2/2amax
As per ASME requirements, by substituting V=15mph, we get:
! Smin =8.54 feet which is much less than the 20 feet limit.
Steering System
The steering system should be designed so as to be in tune with the braking system in order to obtain more
efficient component parts. We will also need to take into consideration the position of the steering rod for
the driver’s comfort and safety.
Setting up the steering assembly
Steering plays a vital role in the stability of Human Powered Vehicle. There are many important concepts
involved in steering and hence the steering assembly is designed with precise pre calculations. To design the
front end geometry, we utilized the trail calculator, based on the Bill Patterson’s optimal trail equation
Where
K5 = steering feel, the calculator takes it as 1
B = horizontal distance of the cg from rear axle
M = mass
Kx = radius of gyration
h = cg height from ground
11
Figure 4
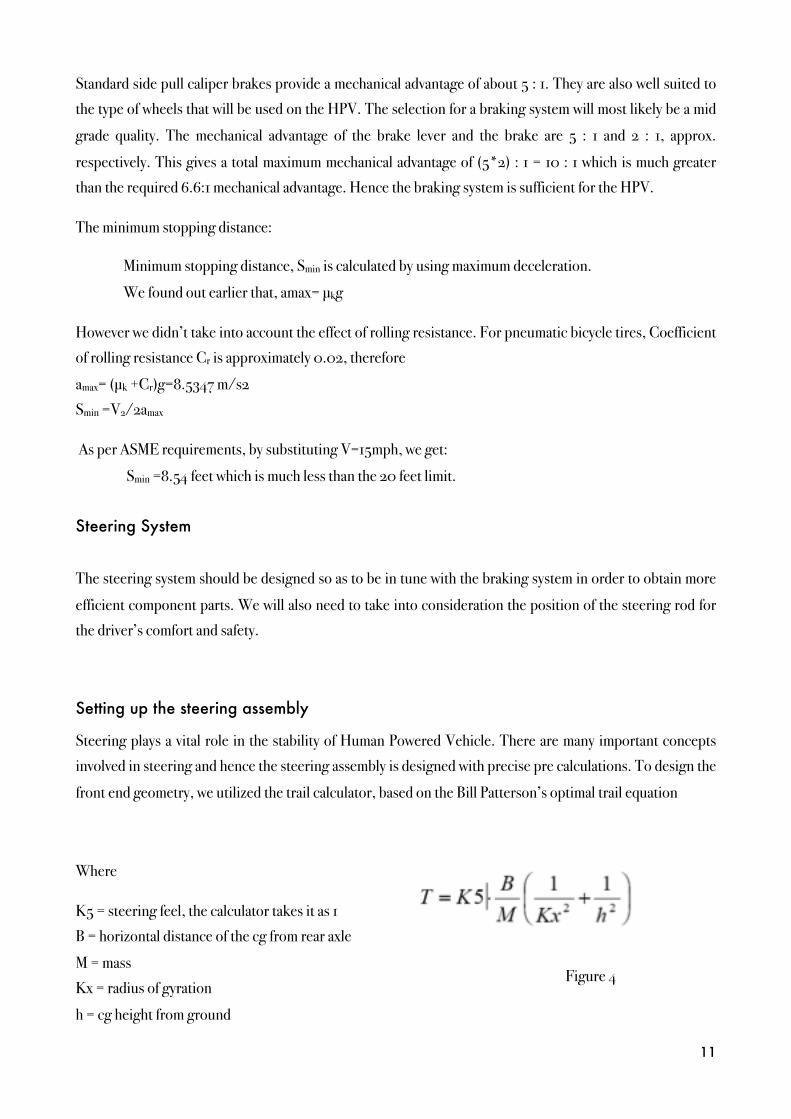
In figure 5 theoretical trail value
comes out to be 2.00116 in. and the
actual trail value is approximately
1 . 7 i n . H e n c e o u r d e s i g n
considerations are quite accurate.
Calculating maximum velocity for the
given turning radius of the vehicle
As per the rules, the vehicle shall be
able to turn within a radius of 25 feet
or 7.62m. For our bike we have a
wheel base of 48” or 1.2192m with a
distance between rare wheel center
and center of gravity to be 63.5cm.
The calculated trail came out to be
1.67” or approximately 4.5cm.
The moment of inertia about front tire is 0.085kg.m2. The mass of vehicle plus rider is assumed to be
approximately 105 kgs. Now by different calculations, we have plotted a curve between velocity and tilt angle
thus calculating the optimum velocity on turn for the maximum
feasible tilt angle.
W e c a n a s s u m e a s a f e
m a x i m u m t i l t a n g l e o f
35degrees thus giving us a
speed of around 25 kmph to
turn within a radius 25 feet.
Steering Angle
The high speed HPVs uses both the steering mechanism and the bending mechanism in order to take a
successful turn. The bending mechanism is discussed above where the effective tilting angle is calculated.
For the steering mechanism considering all the torques like gyroscopic or the kink torques etc. on the
steering we can calculate the required steering angle using the equations below.
The calculated steering angle for our vehicle comes out to be approximately 10.5o.
12
VelocityVelocity tilt angle
steer angle
m/s km/hr degree degree4 14.4 12.276 -10.3135 18 19.81 -10.3136 21.6 27.621 -10.3137 25.2 37.59 -10.3138 28.8 49.105 -10.313
Figure 7
Figure 6
Figure 5
Figure 9Figure 8
Fairing Design Description
A bike moving with high velocity faces opposing forces to the motion of the bike called ‘drag’. This drag is a
result of poor aerodynamic motion of fluid around a body. The nature presents us with enormous examples
of highly efficient aerodynamic structures or bodies, for example, bird’s flight, shark in the sea, and
streamlined bodies of fast running land animals etc. All these bodies have a thing in common that they have
adapted themselves in a best manner to reduce the effect of drag on their motion.
Streamlining is one of the key parameter in overcoming this problem. The boundary layer conditions of the
body to not to allow the formation of vacuum or very low pressure region at the end, which is termed as drag
or suction force, is the other key factor. To put it in simple words, the aerodynamic cover of the HPV is
called ‘fairing’. This shelters the rider and, more importantly, reduces the drag coefficient on the vehicle,
thus helping in maintaining the laminar flow. To get the speed advantage, we have designed the fairing of
our vehicle to get smooth airflow along surfaces. This is achieved by having small frontal area, full frontal
coverage and termination of trailing edge as close to the rider as possible.
Fairing also serves to meet the objective of protection. The space above the rider is designed so as to protect
the rider in case of rollover.
AnalysisConcept Verification & Optimization
Frame analysis
OBJECTIVE : To build a HPV frame with a sufficient factor of safety
Models of the frame were created in Pro -Engineer & SolidWorls (CAD Softwares). This design was then
analyzed for strength. The results are elaborated in the later paragraphs.
The forward portion of the frame is made of 2”diameter . 1.6 mm wall thickness mild steel tubing. Increasing
the diameter but reducing the wall thickness reduced buckling and increased structural rigidity in the frame
while keeping weight at a minimum.
The Load on the vehicle can be assumed at the seat; this includes the weight of rider + weight of the fairing.
Considering the average weight of team rider to be 75 kgs, the total stress can be estimated as 800 N.
Taking into account a factor safety of three because of road bumps and other road anomalies , a total load of
2400 N was applied on the frame for strength calculations.
13
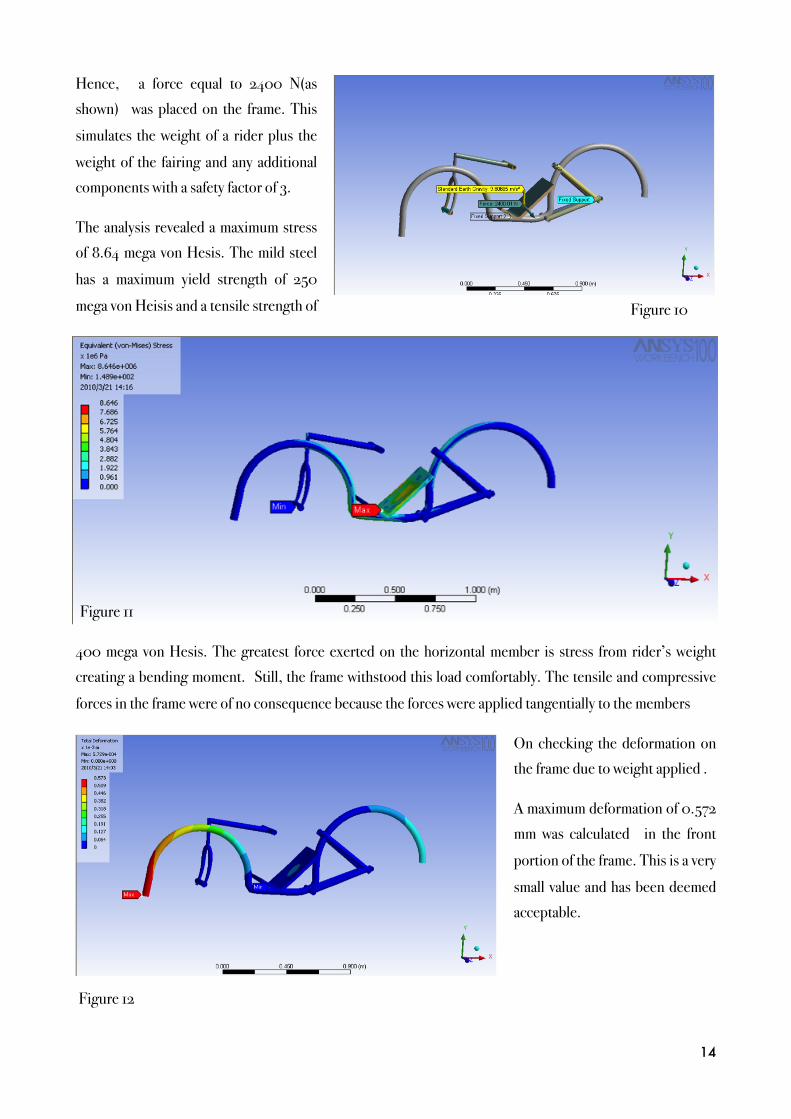
Hence, a force equal to 2400 N(as
shown) was placed on the frame. This
simulates the weight of a rider plus the
weight of the fairing and any additional
components with a safety factor of 3.
The analysis revealed a maximum stress
of 8.64 mega von Hesis. The mild steel
has a maximum yield strength of 250
mega von Heisis and a tensile strength of
400 mega von Hesis. The greatest force exerted on the horizontal member is stress from rider’s weight
creating a bending moment. Still, the frame withstood this load comfortably. The tensile and compressive
forces in the frame were of no consequence because the forces were applied tangentially to the members
On checking the deformation on
the frame due to weight applied .
A maximum deformation of 0.572
mm was calculated in the front
portion of the frame. This is a very
small value and has been deemed
acceptable.Figure 13 Figure 13
14
Figure 12
Figure 11
Figure 10
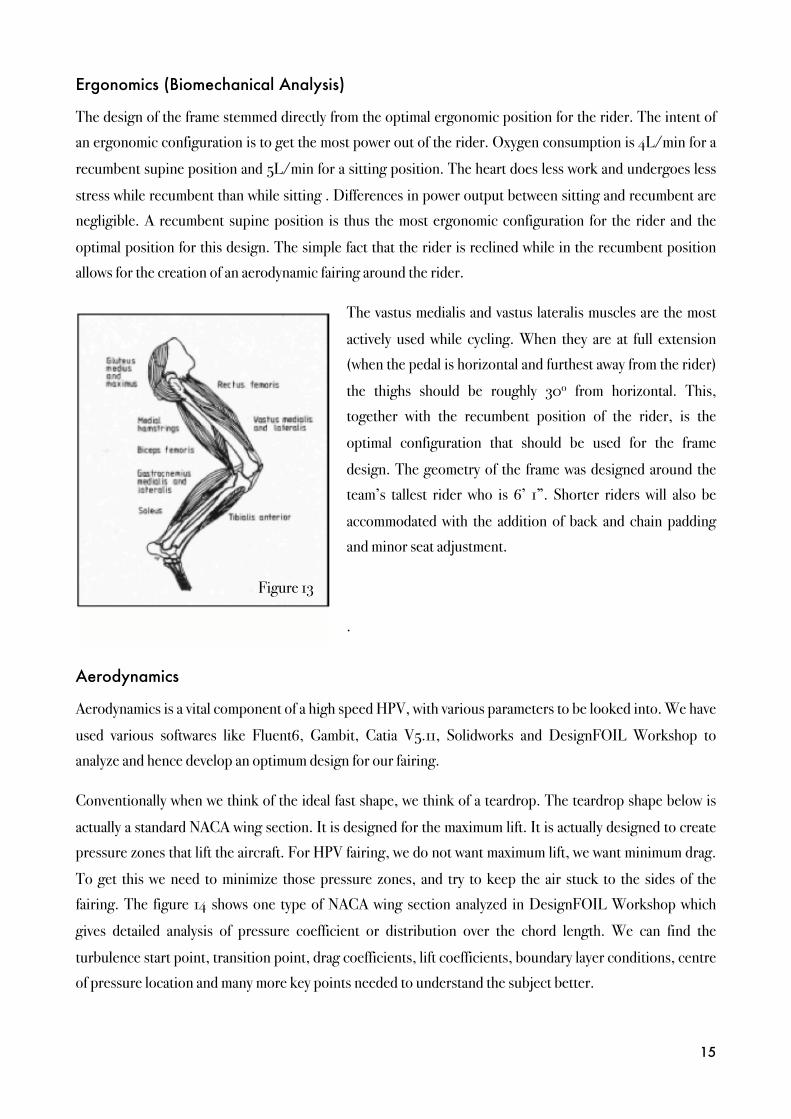
Ergonomics (Biomechanical Analysis)
The design of the frame stemmed directly from the optimal ergonomic position for the rider. The intent of
an ergonomic configuration is to get the most power out of the rider. Oxygen consumption is 4L/min for a
recumbent supine position and 5L/min for a sitting position. The heart does less work and undergoes less
stress while recumbent than while sitting . Differences in power output between sitting and recumbent are
negligible. A recumbent supine position is thus the most ergonomic configuration for the rider and the
optimal position for this design. The simple fact that the rider is reclined while in the recumbent position
allows for the creation of an aerodynamic fairing around the rider.
The vastus medialis and vastus lateralis muscles are the most
actively used while cycling. When they are at full extension
(when the pedal is horizontal and furthest away from the rider)
the thighs should be roughly 30o from horizontal. This,
together with the recumbent position of the rider, is the
optimal configuration that should be used for the frame
design. The geometry of the frame was designed around the
team’s tallest rider who is 6’ 1”. Shorter riders will also be
accommodated with the addition of back and chain padding
and minor seat adjustment.
.
Aerodynamics
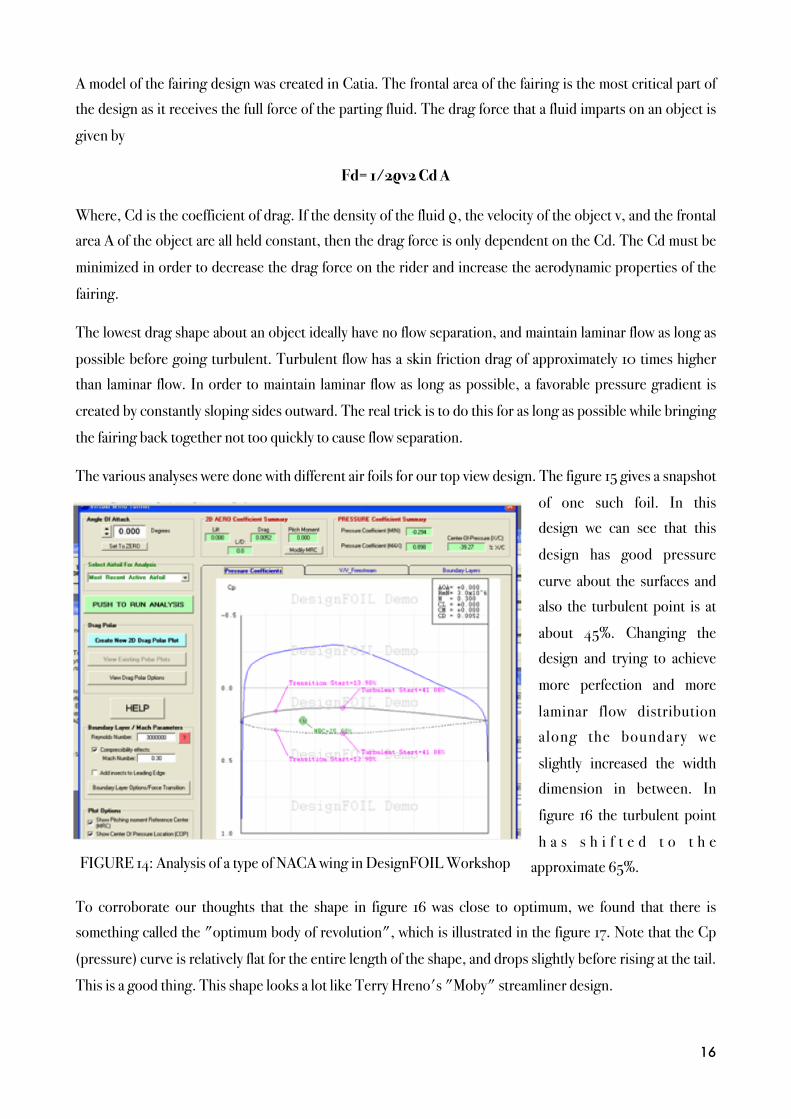
Aerodynamics is a vital component of a high speed HPV, with various parameters to be looked into. We have
used various softwares like Fluent6, Gambit, Catia V5.11, Solidworks and DesignFOIL Workshop to
analyze and hence develop an optimum design for our fairing.
Conventionally when we think of the ideal fast shape, we think of a teardrop. The teardrop shape below is
actually a standard NACA wing section. It is designed for the maximum lift. It is actually designed to create
pressure zones that lift the aircraft. For HPV fairing, we do not want maximum lift, we want minimum drag.
To get this we need to minimize those pressure zones, and try to keep the air stuck to the sides of the
fairing. The figure 14 shows one type of NACA wing section analyzed in DesignFOIL Workshop which
gives detailed analysis of pressure coefficient or distribution over the chord length. We can find the
turbulence start point, transition point, drag coefficients, lift coefficients, boundary layer conditions, centre
of pressure location and many more key points needed to understand the subject better.
15
Figure 13
A model of the fairing design was created in Catia. The frontal area of the fairing is the most critical part of
the design as it receives the full force of the parting fluid. The drag force that a fluid imparts on an object is
given by
Fd= 1/2ρv2 Cd A
Where, Cd is the coefficient of drag. If the density of the fluid ρ, the velocity of the object v, and the frontal
area A of the object are all held constant, then the drag force is only dependent on the Cd. The Cd must be
minimized in order to decrease the drag force on the rider and increase the aerodynamic properties of the
fairing.
The lowest drag shape about an object ideally have no flow separation, and maintain laminar flow as long as
possible before going turbulent. Turbulent flow has a skin friction drag of approximately 10 times higher
than laminar flow. In order to maintain laminar flow as long as possible, a favorable pressure gradient is
created by constantly sloping sides outward. The real trick is to do this for as long as possible while bringing
the fairing back together not too quickly to cause flow separation.
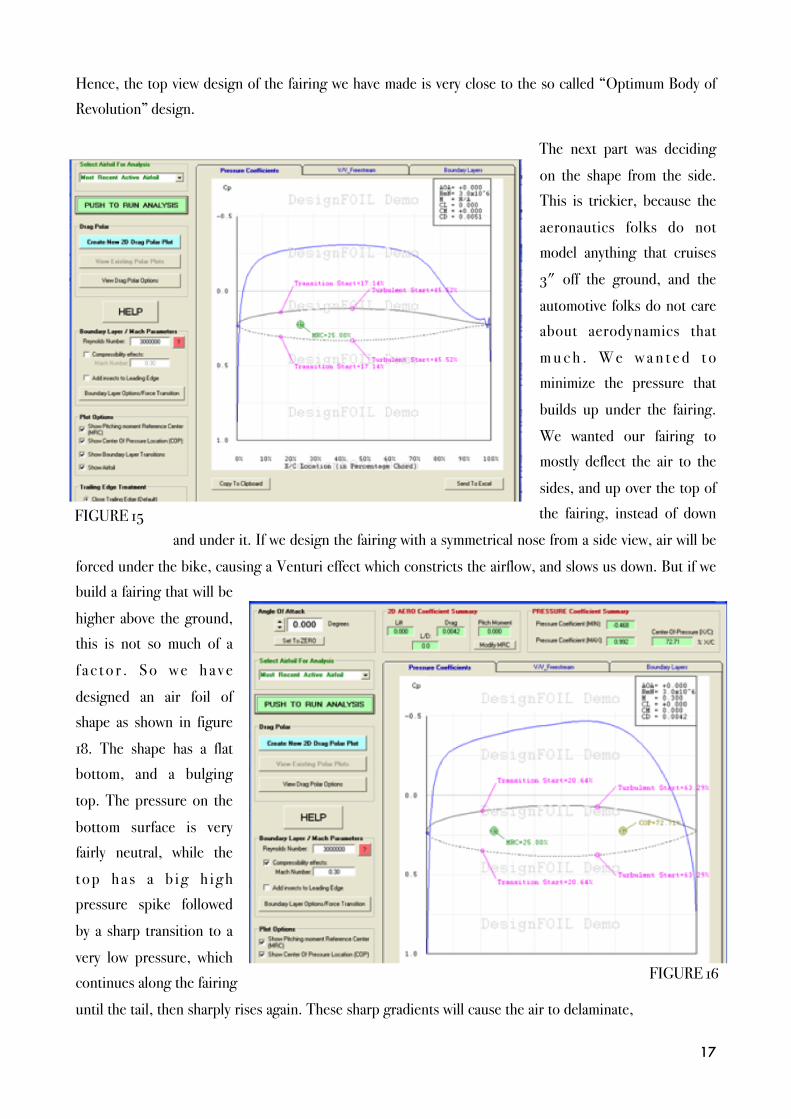
The various analyses were done with different air foils for our top view design. The figure 15 gives a snapshot
of one such foil. In this
design we can see that this
design has good pressure
curve about the surfaces and
also the turbulent point is at
about 45%. Changing the
design and trying to achieve
more perfection and more
laminar flow distribution
along the boundary we
slightly increased the width
dimension in between. In
figure 16 the turbulent point
h a s s h i f t e d t o t h e
approximate 65%.
To corroborate our thoughts that the shape in figure 16 was close to optimum, we found that there is
something called the "optimum body of revolution", which is illustrated in the figure 17. Note that the Cp
(pressure) curve is relatively flat for the entire length of the shape, and drops slightly before rising at the tail.
This is a good thing. This shape looks a lot like Terry Hreno's "Moby" streamliner design.
16
FIGURE 14: Analysis of a type of NACA wing in DesignFOIL Workshop
Hence, the top view design of the fairing we have made is very close to the so called “Optimum Body of
Revolution” design.
The next part was deciding
on the shape from the side.
This is trickier, because the
aeronautics folks do not
model anything that cruises
3" off the ground, and the
automotive folks do not care
about aerodynamics that
m u c h . W e w a n t e d t o
minimize the pressure that
builds up under the fairing.
We wanted our fairing to
mostly deflect the air to the
sides, and up over the top of
the fairing, instead of down
and under it. If we design the fairing with a symmetrical nose from a side view, air will be
forced under the bike, causing a Venturi effect which constricts the airflow, and slows us down. But if we
build a fairing that will be
higher above the ground,
this is not so much of a
f a c t o r . S o w e h a v e
designed an air foil of
shape as shown in figure
18. The shape has a flat
bottom, and a bulging
top. The pressure on the
bottom surface is very
fairly neutral, while the
t o p h a s a b i g h i g h
pressure spike followed
by a sharp transition to a
very low pressure, which
continues along the fairing
until the tail, then sharply rises again. These sharp gradients will cause the air to delaminate,
17
FIGURE 15
FIGURE 16
which raises the drag. On the real 3D fairing much
of the air is be deflected to the sides, rather than
over the top, reducing these radical pressure
variants.
The drag coefficient is also around .0041, which is
considerably better than many of the designs. The
length of our fairing is 7.875 feet. The main
consideration for this size is to make it more
practical to ride and easy maneuverability.
The CAD model of the fairing was made in
CatiaV5.11 and later imported to the Fluent® for
the computational fluent dynamics.
18
FIGURE 18
Figure 19 - CAD Model of Fairing
Figure 17
Stability
Most people who ride a bicycle observe that it is
harder to ride at first, and then becomes easier as
speed increases, indicating that bicycles are
inherently stable. A two wheeled vehicle appears to
be unstable at rest because it needs support to keep
it from falling over, but becomes stable when its
speed is high. The majority of the stabilizing effect
is instead caused by the tendency of the front wheel
to turn in the direction of radial acceleration, a
negative feedback system.
Although bicycles are inherently stable, they must also be controllable. The stability is defined as “the
resistance to control”. An acceptable balance between stability and control must be found, allowing the bike
to travel in a straight line without much effort and be controllable when a change in direction is desired. A
stable bicycle is also defined as one that is easy to ride without hands. A two-wheeled vehicle’s stability is a
function of many variables, including the mass of the rider and vehicle, the wheels’ moments of inertia, front
fork geometry, wheelbase, wheel diameter and many more. The physics behind a moving bicycle are quite
complicated, as shown by the many variables involved, and no study has ever correlated them all.
However, one study links the front wheel and front fork geometry to the bicycle’s stability. The study was
performed by chemist David Jones (Whitt & Wilson, 1982, p.218). He tried to build several unridable
bicycles with variations in geometry. Then, he used computational dynamics analysis to produce a formula,
as given below: (Whitt & Wilson, 1982, p. 221).
y/d = 0.00917[(90° - H)(sin H) + 4u]
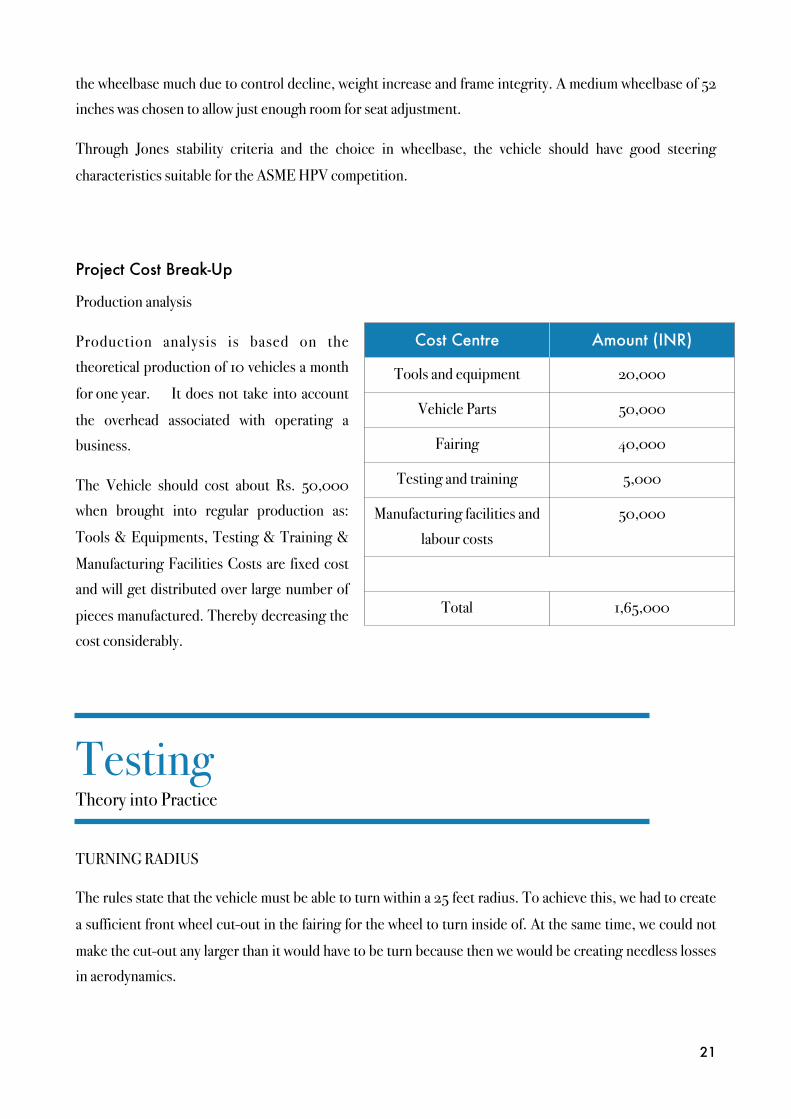
Jones also made graphs of experimental data that illustrate the formula. Figure: ‘Front Fork
Geometry’ (Whitt & Wilson, 1982, p. 216) depicts the front fork geometry of a two-wheeled vehicle, where y
19
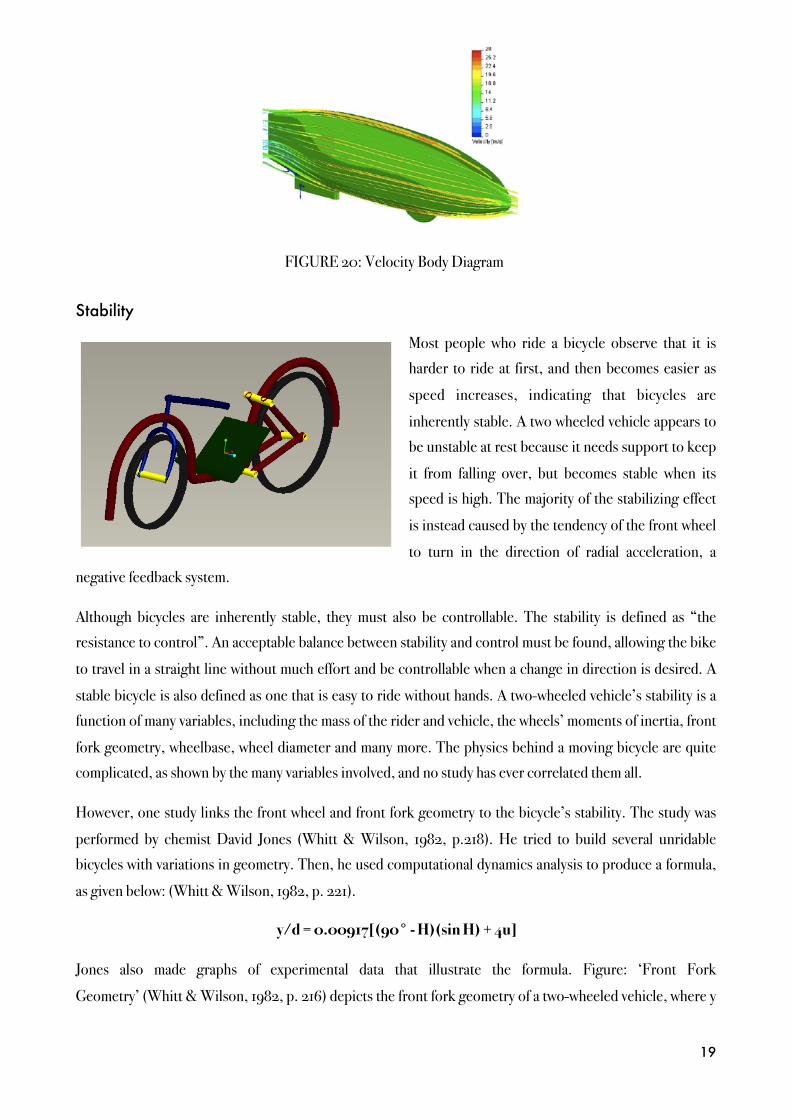
FIGURE 20: Velocity Body Diagram
is the front fork offset, d is the front wheel diameter, H is the head tube angle in degrees and u is the Jones
stability index.
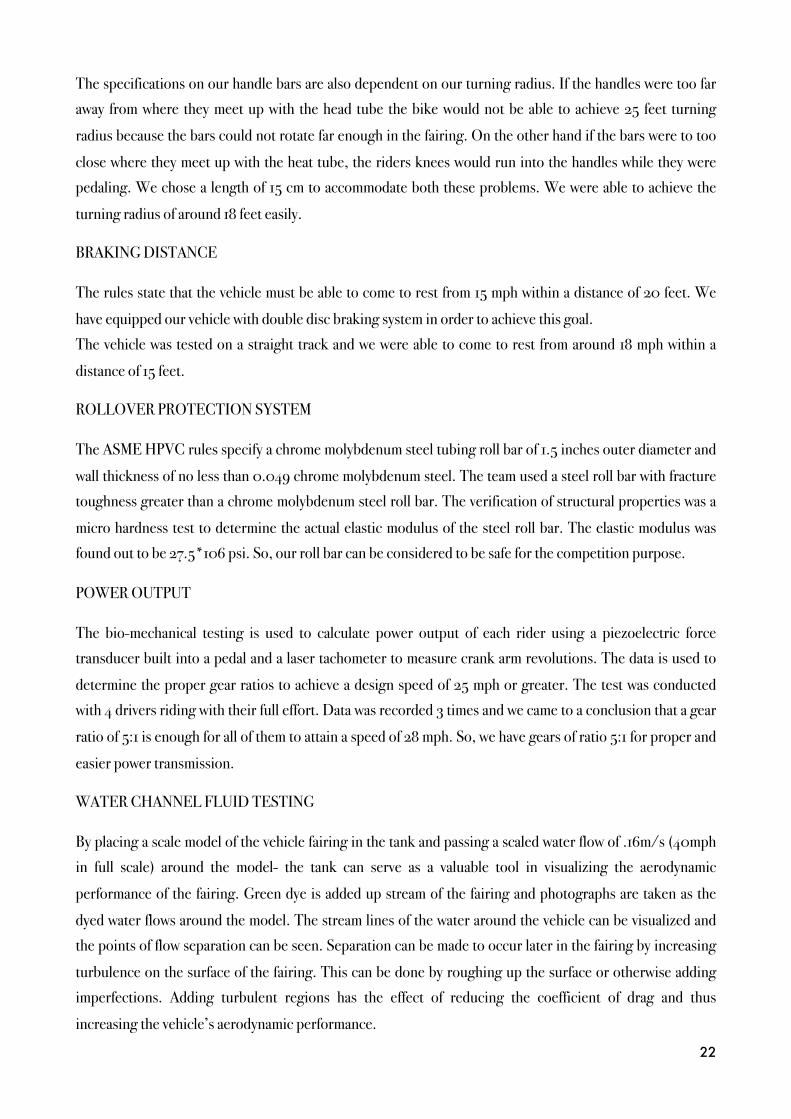
The stability index, u, can be solved for any bicycle geometry.
The smaller the index, the more stable the vehicle. Standard
bicycles produce a stability index between –1 and –3 and tend to
show good steering characteristics this range (Whitt & Wilson,
1982, p. 221).Refer to the figure below:
The various shapes represent several different styles of bicycles.
The large clump represents the standard bicycles. The two
extremes, lowest and highest u values, correspond to two of the
experimental bicycles created by Jones. The extreme black
triangle stands for the most difficult to ride vehicle he created and
the extreme white triangle
represents the most stable one.
We have decided to use a safety
factor of -2.75 based on our study
and keeping in mind the fact that
for our bike, there is a need for
better stability due to the high
speeds that may be reached, but
good control is needed for the
tight turns in the endurance
event.
The front wheel diameter and the fork
offset were already defined for the vehicle, due to other constraints. After selecting the stability index the
only variable left was the head tube angle. For our cycle y= 1.6632 inch and d = 20 inch, wheelbase is 52 in
and the u was taken as -2.75
H (head angle) comes out as 70.6325 (using MathCAD). This number was then used to refine the frame
dimensions.
The fact that long-wheelbase cycles tend to be more stable but less controllable and that short-wheelbase
cycles tend to be more responsive was used (Whitt & Wilson, 1982, p. 226) used to evaluate the different
bicycles. The minimum wheelbase that could be used for the current design was about 48 inches. This falls
in the medium wheelbase category thus making a small wheelbase not feasible. We did not want to increase 20
FIGURE 21: Front Fork Geometry
FIGURE 22: Graphical Representation of Jones Formula
the wheelbase much due to control decline, weight increase and frame integrity. A medium wheelbase of 52
inches was chosen to allow just enough room for seat adjustment.
Through Jones stability criteria and the choice in wheelbase, the vehicle should have good steering
characteristics suitable for the ASME HPV competition.
Project Cost Break-Up
Production analysis
Production analysis is based on the
theoretical production of 10 vehicles a month
for one year.! It does not take into account
the overhead associated with operating a
business.
The Vehicle should cost about Rs. 50,000
when brought into regular production as:
Tools & Equipments, Testing & Training &
Manufacturing Facilities Costs are fixed cost
and will get distributed over large number of
pieces manufactured. Thereby decreasing the
cost considerably.
TestingTheory into Practice
TURNING RADIUS
The rules state that the vehicle must be able to turn within a 25 feet radius. To achieve this, we had to create
a sufficient front wheel cut-out in the fairing for the wheel to turn inside of. At the same time, we could not
make the cut-out any larger than it would have to be turn because then we would be creating needless losses
in aerodynamics.
21
Cost Centre Amount (INR)
Tools and equipment 20,000
Vehicle Parts 50,000
Fairing 40,000
Testing and training 5,000
Manufacturing facilities and
labour costs
50,000
Total 1,65,000
The specifications on our handle bars are also dependent on our turning radius. If the handles were too far
away from where they meet up with the head tube the bike would not be able to achieve 25 feet turning
radius because the bars could not rotate far enough in the fairing. On the other hand if the bars were to too
close where they meet up with the heat tube, the riders knees would run into the handles while they were
pedaling. We chose a length of 15 cm to accommodate both these problems. We were able to achieve the
turning radius of around 18 feet easily.
BRAKING DISTANCE
The rules state that the vehicle must be able to come to rest from 15 mph within a distance of 20 feet. We
have equipped our vehicle with double disc braking system in order to achieve this goal.
The vehicle was tested on a straight track and we were able to come to rest from around 18 mph within a
distance of 15 feet.
ROLLOVER PROTECTION SYSTEM
The ASME HPVC rules specify a chrome molybdenum steel tubing roll bar of 1.5 inches outer diameter and
wall thickness of no less than 0.049 chrome molybdenum steel. The team used a steel roll bar with fracture
toughness greater than a chrome molybdenum steel roll bar. The verification of structural properties was a
micro hardness test to determine the actual elastic modulus of the steel roll bar. The elastic modulus was
found out to be 27.5*106 psi. So, our roll bar can be considered to be safe for the competition purpose.
POWER OUTPUT
The bio-mechanical testing is used to calculate power output of each rider using a piezoelectric force
transducer built into a pedal and a laser tachometer to measure crank arm revolutions. The data is used to
determine the proper gear ratios to achieve a design speed of 25 mph or greater. The test was conducted
with 4 drivers riding with their full effort. Data was recorded 3 times and we came to a conclusion that a gear
ratio of 5:1 is enough for all of them to attain a speed of 28 mph. So, we have gears of ratio 5:1 for proper and
easier power transmission.
WATER CHANNEL FLUID TESTING
By placing a scale model of the vehicle fairing in the tank and passing a scaled water flow of .16m/s (40mph
in full scale) around the model- the tank can serve as a valuable tool in visualizing the aerodynamic
performance of the fairing. Green dye is added up stream of the fairing and photographs are taken as the
dyed water flows around the model. The stream lines of the water around the vehicle can be visualized and
the points of flow separation can be seen. Separation can be made to occur later in the fairing by increasing
turbulence on the surface of the fairing. This can be done by roughing up the surface or otherwise adding
imperfections. Adding turbulent regions has the effect of reducing the coefficient of drag and thus
increasing the vehicle’s aerodynamic performance.
22
The fluids analysis revealed a strong vortex in the wake of the vehicle. Small particles added to the water can
be seen “swirling” behind the vehicle but travel in a straight line everywhere else. Additionally, the dye
travels smoothly over and around the front half of the vehicle but becomes dispersed and turbulent in the
wake. Small modifications to the final fairing product will decrease this wake. A simple solution is to drill
small holes in the rear of the vehicle. These holes will decrease the fluid pressure close to the surface of the
fairing and encourage the flow to separate later, thus reducing drag.
VISIBILITY
The fairing is designed to accommodate the helmeted head of the rider- this is why the fairing has a large
hump, or canopy. This canopy will have a series of holes cut into it to make a large frontal viewing window
and a series of side viewing portholes. A thin, clear, sheet of plastic will serve as a window and will be
stretched over the hole surfaces. The location of these holes will be positioned to allow for the maximum
viewing angle of the rider. The rider will have an unobstructed view of the area in front of the vehicle and to
the left and right of the vehicle. In addition, the rider will be able to look over her shoulder and into his blind
spot. The circular window holes will also 23 contribute to the aesthetics of the vehicle.
SafetyPrecautions & Preventive Measures
Stopping time:
ASME HPVC Requirement: Each vehicle must demonstrate that it can come to a stop from a speed of
approximately 15 miles per hour in a distance of 20 feet or less. Starting out with 30km/hr (18.63 miles/hr),
our HPV comes to a stop in a distance of less than 5 meters (16.4 feet). We have used disk brakes at both the
front and rear wheels in order to ensure a responsive and safe braking system.
Turning Radius:
ASME HPVC Requirement: HPV should turn within a 25-foot (7.62 meters) radius.
In order to meet the turning radius specifications, sufficient front wheel cut-out is created in the fairing and
the handle bars are placed to further decrease the turning radius keeping in mind that it does not rub against
the rider’s knees as well as the fairing from inside.
Travel in a straight line: ASME HPVC Requirement: HPV should travel for 100 feet (30.48 meters) in a
straight line.
23
Carefully aligned wheels, transmission, ergonomic seat and handle have enabled us to travel in a straight line
comfortably for distances more than 40 meters.
Roll over protection: Our HPV has a Rollover Protection System (RPS) in the form of an arched roll bar that
meets the top and side load requirements as follows:
Top Load: ASME HPVC Requirement: A load of 600 lb (272.15 Kg) shall be applied to the top of the roll
bar, directed downward and aft (towards the rear of the vehicle) at an angle of 12° from the vertical. The
maximum elastic deformation should be less than 2.0 inches (5.08 cms)
A similar test was conducted and the maximum deformation observed was approximately 4 to 4.5 cms.
The rider’s helmet and body does not come in contact with the deformed RPS roll bar after performing this
test. Ensuring complete safety of the rider.
Side Load: ASME HPVC Requirement: A load of 300 lb shall be applied horizontally to the side of the roll
bar at shoulder height. The maximum elastic deformation should be less than 1.5 inches (3.81 cms).
After performing a similar test, our maximum deformation observed was approximately 3 cms and again
neither the rider’s helmet nor his body comes in contact with the deformed RPS roll bar.
RPS Attachment: Our RPS system is firmly attached to the HPV frame and extends above the helmeted head
of the rider.
Safety Harness: We are using commercially available seat belts and harnesses for pedals which will secure
the rider to the HPV at all times.
Occupant and bystander hazards: All the interior and exterior surfaces of the HPV are free from sharp edges
and protrusions to prevent injury to the occupant (rider). We have used grinding and smooth finishing
processes to eliminate these hazards. The design and construction of our vehicle has been carried out with
due consideration of rider and bystander safety. In case of an accident, the roll over bar, RPS and fairing will
protect the rider from direct shock or injury. Exterior surface of the fairing is smooth enough to limit the
damage or injury to bystanders in case of an accident.
Clothing and Protective Equipment: Our riders have helmets meeting the CPSC Safety Standard for bicycle
helmets (16 CFR Part 1203) apart from appropriate racing clothing, gloves and shoes for protection.
24
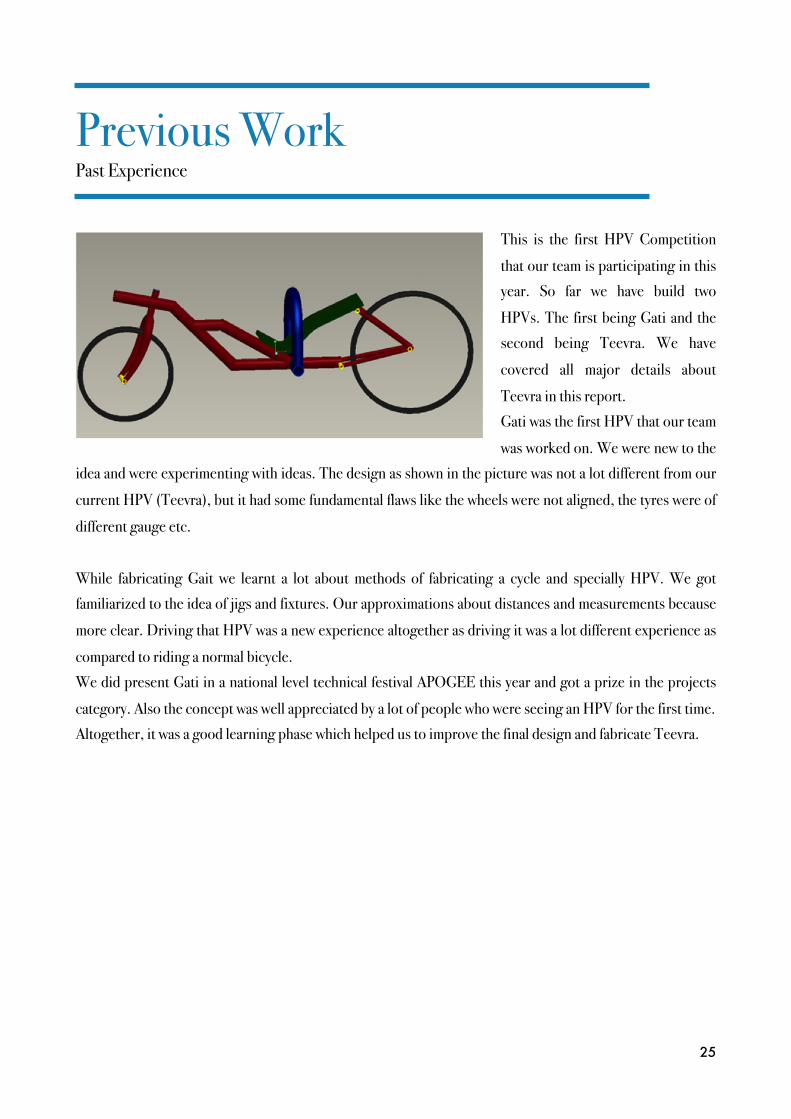
Previous WorkPast Experience
This is the first HPV Competition
that our team is participating in this
year. So far we have build two
HPVs. The first being Gati and the
second being Teevra. We have
covered all major details about
Teevra in this report.
Gati was the first HPV that our team
was worked on. We were new to the
idea and were experimenting with ideas. The design as shown in the picture was not a lot different from our
current HPV (Teevra), but it had some fundamental flaws like the wheels were not aligned, the tyres were of
different gauge etc.
While fabricating Gait we learnt a lot about methods of fabricating a cycle and specially HPV. We got
familiarized to the idea of jigs and fixtures. Our approximations about distances and measurements because
more clear. Driving that HPV was a new experience altogether as driving it was a lot different experience as
compared to riding a normal bicycle.
We did present Gati in a national level technical festival APOGEE this year and got a prize in the projects
category. Also the concept was well appreciated by a lot of people who were seeing an HPV for the first time.
Altogether, it was a good learning phase which helped us to improve the final design and fabricate Teevra.
25
ConclusionSummarizing the Report
Team TEEVRA has put loads of effort to make a design that maximizes top speed, efficiency, ergonomics,
and maneuverability to field the most competitive HPV within the limitations of the team budget. Working
to compete in this challenge provided both the freedom to design the HPV as the team sees fit and to make
many decisions taking into considerations the sources available in India, complications in the design,
assembly and fabrication of the parts. Below, we highlight main features of our HPV to provide the gist of
this report to the reader.
Drive Train
We have used derailleur gear system that has 52 teeth in the front chain ring, and the rear cassette has 9
gears out of which 11, 12, 13, 15, 17, and 19 teeth gears are generally used. The maximum calculated speed of
our HPV, taking into account Optimum Gear centimeter (GCM) difference, is around 65 kmph.
Frame
The analysis of the final frame was done in ANSYS® by applying a load of 2400N (safety factor = 3). A
maximum deformation of 0.572 mm was calculated in the front portion of the frame. This is a very small
value and has been deemed acceptable.
Steering and braking system
In order to fulfill the ASME HPVC 2010 rules, we have used disc brakes on both front and rear wheels. The
vehicle was tested on a straight track and we were able to come to rest from around 18 mph within a distance
of 15 feet.
In order to meet the turning radius specifications, sufficient front wheel cut-out is created in the fairing and
the handle bars are placed to further decrease the turning radius keeping in mind that it do not rub against
rider’s knees.
Apart from these we have added some innovative features unique to our HPV, like the cushioning effect due
to elasticity of Mild Steel, the spring loaded flaps at he both in the HPV and a few others.
On the whole, the project has been successful so far and we hope to continue that by doing well in the
competition as well.
26
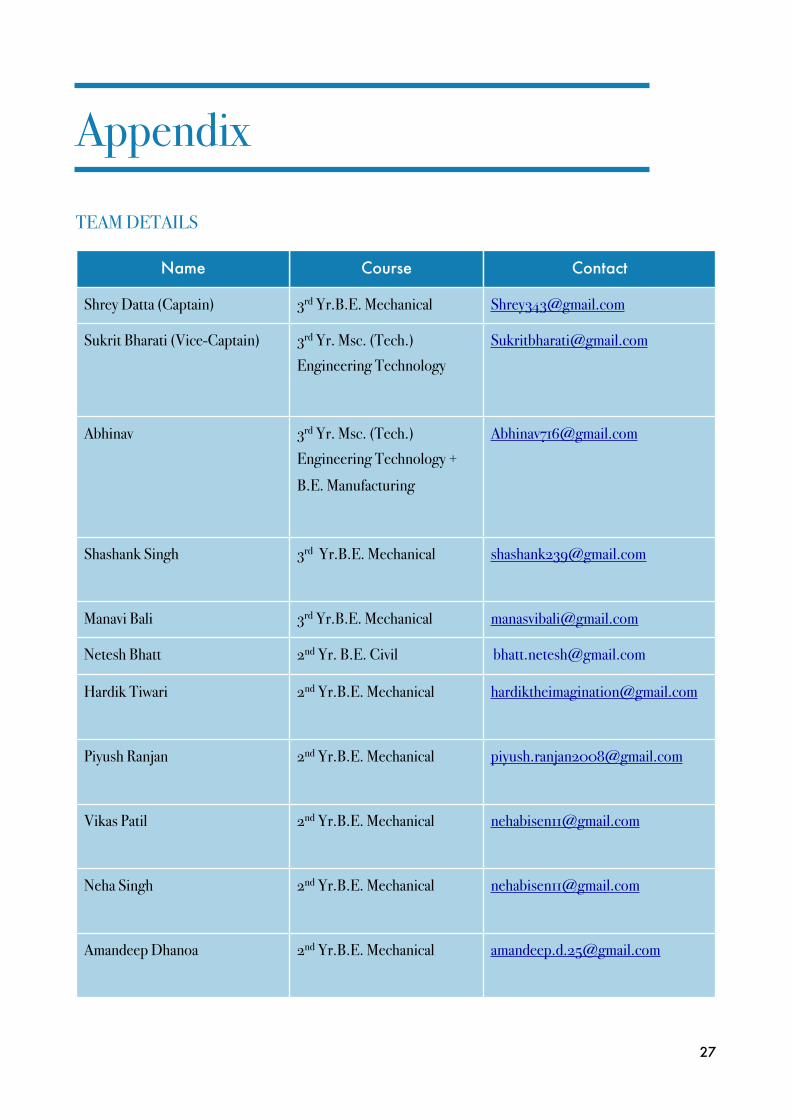
AppendixTEAM DETAILS
Name Course Contact
Shrey Datta (Captain) 3rd Yr.B.E. Mechanical [email protected]
Sukrit Bharati (Vice-Captain) 3rd Yr. Msc. (Tech.)
Engineering Technology
Abhinav 3rd Yr. Msc. (Tech.)
Engineering Technology +
B.E. Manufacturing
Shashank Singh 3rd Yr.B.E. Mechanical [email protected]
Manavi Bali 3rd Yr.B.E. Mechanical [email protected]
Netesh Bhatt 2nd Yr. B.E. Civil [email protected]
Hardik Tiwari 2nd Yr.B.E. Mechanical [email protected]
Piyush Ranjan 2nd Yr.B.E. Mechanical [email protected]
Vikas Patil 2nd Yr.B.E. Mechanical [email protected]
Neha Singh 2nd Yr.B.E. Mechanical [email protected]
Amandeep Dhanoa 2nd Yr.B.E. Mechanical [email protected]
27
HPVC DETAILS
The ASME HPV Competition is held annually in the spring at a competing university. This year the
California State University in Northridge CA will be hosting the competition. The competition will consist
of four events: A design event, a sprint or drag event, a utility endurance event, and a speed endurance
event. (Speed class winners compete in all events except the utility endurance event.)
Design event:
Officials are interested in the design process that engineering teams follow to produce their vehicles. Judges
will conduct design judging separate from and without regard to vehicle performance on the test course with
an emphasis on originality and soundness of the design. Judging will be based on: a written report, an oral
presentation, and examination of the vehicle.
Sprint or drag event:
The sprint or drag event will include single and multi-rider vehicles and will be a flying start sprint race or a
head-to-head drag race from standing start. The ASME Committee will announce which event will be held
well in advance of the competition. Each team will have the preceding distance of 400 to 600 meters for the
vehicles to gain speed before entering the timed zone, which will be followed by a 100 meter timed portion
straight-away, as well as a minimum of 200 meters at the end to allow the vehicles to slow down. Separate
scores for male and female riders will be recorded for this event.
Utility Endurance event:
In this event, teams will be scored on the practicality, performance and reliability of their vehicle in a typical
urban transportation role. The Utility Event will take place on a closed-loop course 1 to 2 km in length.
Obstacles designed to demonstrate the utilitarian nature of the vehicles will be provided on the course.
Speed endurance event:
Teams will be scored on the speed and reliability of their vehicles. The Speed Endurance event will take
place over a continuously paved course that includes turns in both directions and straight sections designed
to demonstrate the advantage of the vehicles' aerodynamic fairings. Individual laps will be approximately 2
km length, again to the extent that the event site permits; in no case, however, may the lap length be less
than 1km. Female riders will begin the Speed Endurance Event. The Speed Endurance Event will begin with
a standing start.
In addition to student competitors, representatives from the American Society of Mechanical Engineers will
be on hand to judge and run the competition. The event draws many who are interested to see new and
groundbreaking HPV designs.
28
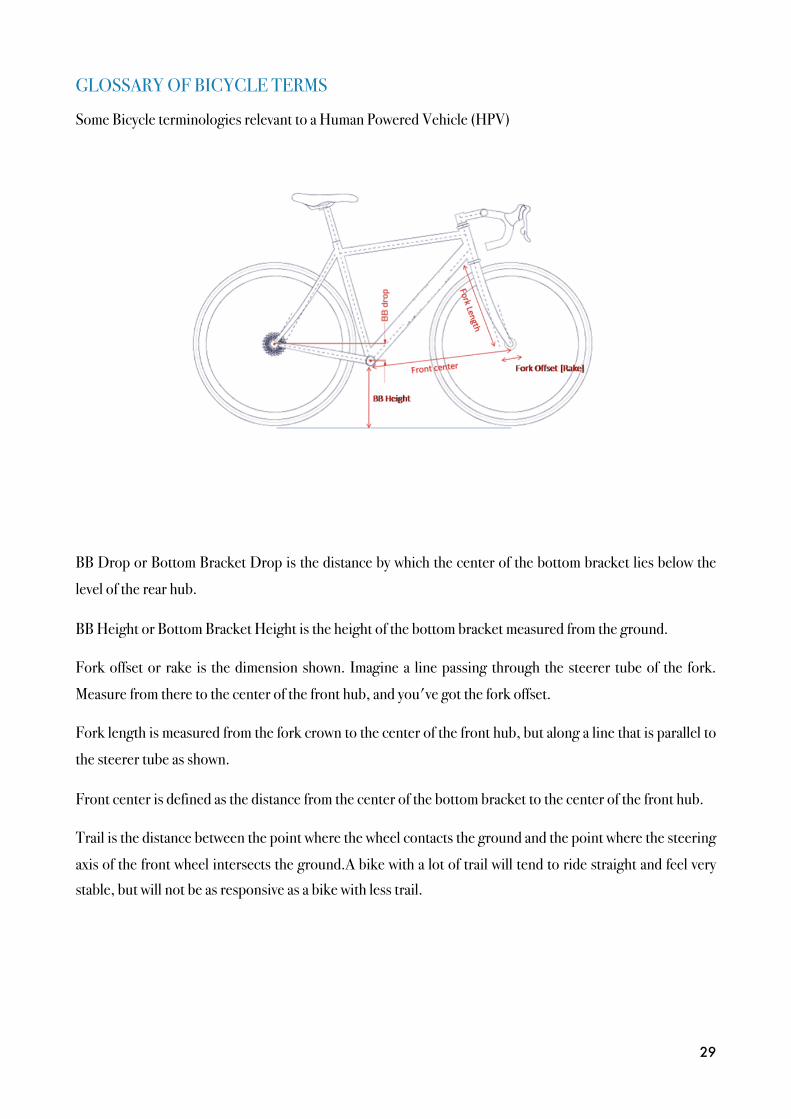
GLOSSARY OF BICYCLE TERMS
Some Bicycle terminologies relevant to a Human Powered Vehicle (HPV)
BB Drop or Bottom Bracket Drop is the distance by which the center of the bottom bracket lies below the
level of the rear hub.
BB Height or Bottom Bracket Height is the height of the bottom bracket measured from the ground.
Fork offset or rake is the dimension shown. Imagine a line passing through the steerer tube of the fork.
Measure from there to the center of the front hub, and you've got the fork offset.
Fork length is measured from the fork crown to the center of the front hub, but along a line that is parallel to
the steerer tube as shown.
Front center is defined as the distance from the center of the bottom bracket to the center of the front hub.
Trail is the distance between the point where the wheel contacts the ground and the point where the steering
axis of the front wheel intersects the ground.A bike with a lot of trail will tend to ride straight and feel very
stable, but will not be as responsive as a bike with less trail.
29