Embed Size (px)
Citation preview
Report to Congress on Medicaid and CHIP
MARCH 2016
Medicaid and CHIP Payment and Access Commission

About MACPAC The Medicaid and CHIP Payment and Access Commission (MACPAC) is a non-partisan legislative branch agency that provides policy and data analysis and makes recommendations to Congress, the Secretary of the U.S. Department of Health and Human Services, and the states on a wide array of issues affecting Medicaid and the State Children’s Health Insurance Program (CHIP). The U.S. Comptroller General appoints MACPAC’s 17 commissioners, who come from diverse regions across the United States and bring broad expertise and a wide range of perspectives on Medicaid and CHIP.
MACPAC serves as an independent source of information on Medicaid and CHIP, publishing issue briefs and data reports throughout the year to support policy analysis and program accountability. The Commission’s authorizing statute, 42 U.S.C. 1396, outlines a number of areas for analysis, including:
• payment;• eligibility; • enrollment and retention;• coverage;• access to care;• quality of care; and• the programs’ interaction with Medicare and the health care system generally.
MACPAC’s authorizing statute also requires the Commission to submit reports to Congress by March 15 and June 15 of each year. In carrying out its work, the Commission holds public meetings and regularly consults with state officials, congressional and executive branch staff, beneficiaries, health care providers, researchers, and policy experts.
Medicaid and CHIP Payment and Access Commission
MARCH 2016
Report to Congress on Medicaid and CHIP

Commissioners
Sara Rosenbaum, JD, ChairMarsha Gold, ScD, Vice ChairBrian BurwellSharon Carte, MHSAndrea Cohen, JDGustavo Cruz, DMD, MPHToby Douglas, MPP, MPHLeanna GeorgeChristopher Gorton, MD, MHSAHerman Gray, MD, MBAStacey Lampkin, FSA, MAAA, MPANorma Martínez Rogers, PhD, RN,
FAANCharles Milligan, JD, MPHSheldon Retchin, MD, MSPHPeter Szilagyi, MD, MPHPenny Thompson, MPAAlan Weil, JD, MPP
Anne L. Schwartz, PhD, Executive Director
March 15, 2016
The Honorable Joseph R. Biden, Jr. President of the Senate U.S. Capitol Washington, DC 20510
The Honorable Paul Ryan Speaker of the House U.S. House of Representatives Washington, DC 20515
Dear Mr. Vice President and Mr. Speaker:
On behalf of the Medicaid and CHIP Payment and Access Commission (MACPAC), I am pleased to submit the March 2016 Report to Congress on Medicaid and CHIP. In the March 2016 report, the Commission sharpens its focus on three important aspects of Medicaid and CHIP policy—support for safety-net hospitals, delivery of care for people with behavioral health conditions, and coverage for low- and moderate-income children.
The first three chapters of the March report reprise MACPAC’s inaugural Report to Congress on Medicaid Disproportionate Share Hospital Payment, originally released online in February 2016, in compliance with a provision of the Protecting Access to Medicare Act. Medicaid disproportionate share hospital (DSH) payments provide substantial support to safety-net hospitals by helping to offset uncompensated care costs for Medicaid and uninsured patients. In 2014, Medicaid made a total of $18 billion in DSH payments ($8 billion in state funds and $10 billion in federal funds).
About half of all U.S. hospitals receive DSH payments, with most going to hospitals that serve a particularly high share of Medicaid and other low-income patients. But more than one-third of DSH payments are made to hospitals that may not have the greatest need. Our analysis found little meaningful relationship between the amount of a hospital’s DSH allotment and its share of Medicaid and indigent patients, its uncompensated care burden, and its delivery of essential community services to these populations. Indeed, DSH allotments to states still reflect spending patterns of 25 years ago.
In the Commission’s view, DSH allotments and payments should be better targeted, consistent with DSH payments’ original statutory intent. But this cannot be achieved without greater transparency in hospital payment. To fill existing data gaps, MACPAC recommends that the Secretary of the U.S. Department of Health and Human Services collect and report hospital-specific data on all types of Medicaid payments for all hospitals that
Advising Congress onMedicaid and CHIP Policy
Medicaid and CHIP Paymentand Access Commission
1800 M Street NWSuite 650 South Washington, DC 20036
www.macpac.gov 202-350-2000202-273-2452

receive them. In addition, the Secretary should collect and report data on the sources of non-federal share necessary to determine net Medicaid payment at the provider level.
Chapter 4 of this report turns to considering how Medicaid programs are integrating behavioral and physical health. Medicaid is the single largest payer in the United States for behavioral health services, accounting for 26 percent of spending on behavioral health services in 2009. In 2011, the one in five Medicaid beneficiaries who had a behavioral health diagnosis accounted for almost half of Medicaid expenditures. Many policymakers, program administrators, clinicians, and patient advocates have suggested that integrating the delivery of behavioral and physical health services would not only improve health outcomes for these beneficiaries, but also help to reduce costs.
MACPAC’s examination finds the reality more complicated. Research suggests that integrating physical and behavioral health can reduce fragmentation of services and promote person-centered care for patients with some conditions. But in practice, patients with differing conditions may require different approaches to integration. At present, there are a limited but growing number of case studies and evaluations that specifically examine Medicaid integration initiatives and their effects on costs. Chapter 4 reviews a range of physical and behavioral health integration efforts, looking at different approaches to system and payment integration, specific integration efforts within Medicaid and for people who are dually eligible for Medicaid and Medicare, and barriers to integration, including workforce and billing issues, and inadequate information technology.
Chapter 5 continues MACPAC’s effort to consider how best to provide adequate affordable coverage to low- and moderate-income children. Specifically, it presents the Commission’s analysis of out-of-pocket spending for children in exchange coverage compared to that in separate CHIP in 36 states that offer this coverage. In no state does exchange coverage provide out-of-pocket protections comparable to CHIP. While CHIP prohibits such spending above 5 percent of family income, families do not have this protection in exchange coverage. Although children with chronic conditions experience high out-of-pocket spending in exchange coverage, otherwise healthy children who need treatment for an unexpected acute episode also incur high out-of-pocket costs. The chapter ends with a discussion of the policy issues raised by these findings, which the Commission will consider as it develops recommendations on the future of children’s coverage for release by the end of 2016.
MACPAC is committed to providing in-depth, non-partisan analyses of all aspects of Medicaid and CHIP. We hope the analyses in the March 2016 report will prove useful to Congress as it considers future policy development affecting Medicaid and CHIP. This document fulfills our statutory mandate to report each year by March 15.
Sincerely,
Sara Rosenbaum, JD Chair
Medicaid and CHIP Paymentand Access Commissionwww.macpac.gov

Report to Congress on Medicaid and CHIP vii
Commission Members and Terms
Commission Members and TermsSara Rosenbaum, JD, Chair Washington, DC
Marsha Gold, ScD, Vice Chair Washington, DC
Term Expires December 2016
Sharon Carte, MHS South Charleston, WV
Andrea Cohen, JD New York, NY
Herman Gray, MD, MBA Detroit, MI
Norma Martínez Rogers, PhD, RN, FAAN San Antonio, TX
Sara Rosenbaum, JD Washington, DC
Term Expires December 2017Gustavo Cruz, DMD, MPH New York, NY
Leanna George Benson, NC
Marsha Gold, ScD Washington, DC
Charles Milligan, JD, MPH Albuquerque, NM
Sheldon Retchin, MD, MSPH Columbus, OH
Peter Szilagyi, MD, MPH Los Angeles, CA
Term Expires December 2018Brian Burwell Cambridge, MA
Toby Douglas, MPP, MPH Davis, CA
Christopher Gorton, MD, MHSA Watertown, MA
Stacey Lampkin, FSA, MAAA, MPA Tallahassee, FL
Penny Thompson, MPA Ellicott City, MD
Alan Weil, JD, MPP Bethesda, MD

March 2016viii
Commission StaffAnne L. Schwartz, PhD, Executive Director
Office of the Executive DirectorAnnie Andrianasolo, MBA, Executive Assistant to the Executive Director
Kathryn Ceja, Director of Communications
Laura Beth Pelner, Communications/Graphic Design Specialist
Policy DirectorsAmy Bernstein, ScD, MHSA Policy Director and Contracting Officer
Moira Forbes, MBA, Policy Director
Mary Ellen Stahlman, MHSA, Policy and Congressional Affairs Director
Principal AnalystsKirstin Blom, MIPA
Martha Heberlein, MA
Joanne Jee, MPH
Chris Park, MS
Chris Peterson, MPP
Anna Sommers, PhD, MS, MPAff
Kristal Vardaman, MSPH
Senior AnalystsVeronica Daher, JD
Benjamin Finder, MPH
Sarah Melecki, MPAff
Robert Nelb, MPH
Katie Weider, MPH
AnalystsKacey Buderi, MPA Kayla Holgash, MPH
Research AssistantMadeline Britvec
Operations and FinanceRicardo Villeta, MBA, Deputy Director of Operations, Finance, and Management
James Boissonnault, MA, Chief Information Officer
Allissa Jones, Administrative Assistant
Ken Pezzella, Chief Financial Officer
Eileen Wilkie, Administrative Officer
Commission Staff
Report to Congress on Medicaid and CHIP ix
Acknowledgements
AcknowledgementsMACPAC is grateful to the following health policy experts, federal and state officials, and colleagues, whose contributions of expertise, perspective, and time were essential in preparing the March 2016 Report to Congress on Medicaid and CHIP:
Greg Berger, Tom Betlach, Matt Broaddus, Lindsey Browning, Theresa Coughlin, Richard Cuno, Chris Czvornyek, Joan DaVanzo, Al Dobson, Kristin Dybdal, Audrey El-Gamil, Beth Feldpush, Laura Galbreath, Richard Goldstein, Debbie Gough, Stuart Guterman, Allison Hamblin, Gretchen Hammer, Steven Heath, Douglas Henkel, Rory Howe, Lane Koenig, Marielle Kress, Kevin Londeen, Andrea Maresca, Caryn Marks, John McCarthy, Pam McDonald, Shannon McMahon, Benjamin Miller, Mark Miller, Dave Mosley, Jack Needleman, Molly Collins Offner, Erin O’Malley, Edwin Park, Christie Peters, Eric Rollins, Jack Rollins, Josh Saavoss, Matt Salo, Jessica Schubel, Tom Selden, Dennis Smith, Samuel Soltoff, Jeff Stensland, Vikki Wachino, and David Woodlock.
The Commission received valuable modeling and actuarial support from Cathi Callahan, Jim Mays, and Rodelle Williams of Actuarial Research Corporation.
The Commission also would like to acknowledge commissioners who completed their terms of service to MACPAC in 2015 for their perspective and guidance on the issues addressed in this report, particularly the chapters on DSH which were developed and approved during their tenure. In addition to our founding chair, Diane Rowland, they are Donna Checkett, Mark Hoyt, Patricia Gabow, Patricia Riley, and Steven Waldren. We are especially grateful to have been able to work with Commissioner Yvette Long, whose passing in August 2015 was a loss to all of us.
Finally, we would like to thank Paula Gordon for her indispensable copy editing and Kevin Kempske and his talented team at GKV for their assistance in publishing this report.
March 2016x
Table of Contents
Table of ContentsCommission Members and Terms .................................................................................................................... vii
Commission Staff ............................................................................................................................................. viii
Acknowledgements ............................................................................................................................................ ix
Executive Summary ........................................................................................................................................... xv
Chapter 1: Overview of Medicaid Policy on Disproportionate Share Hospital Payments ............................. 1
The History of Medicaid DSH Payment Policy ...................................................................................... 3
Current State DSH Allotments and Spending ........................................................................................ 7
Medicaid DSH Payments in Relation to Other Sources of Hospital Financing ................................... 8
Deemed DSH Hospital Characteristics ................................................................................................ 13
Medicaid DSH Allotment Reductions ................................................................................................... 14
Endnotes ................................................................................................................................................ 15
References ............................................................................................................................................. 15
APPENDIX 1A: History of Key Legislation ........................................................................................... 17
References ...................................................................................................................................... 19
Chapter 2: Analysis of Current and Future Disproportionate Share Hospital Allotments ........................... 21
Changes in the Number of Uninsured Individuals ............................................................................... 24
Changes in the Amount of Hospital Uncompensated Care ................................................................ 25
Hospitals with High Levels of Uncompensated Care That Also Provide Essential Community Services ............................................................................................................................. 30
DSH Allotment Projections ................................................................................................................... 32
Potential State Responses to Allotment Reductions .......................................................................... 37
Conclusion ............................................................................................................................................. 40
Endnotes ................................................................................................................................................ 40
References ............................................................................................................................................. 40
APPENDIX 2A: State-Level Data ............................................................................................................ 42
Chapter 3: Improving Data as the First Step to a More Targeted Disproportionate Share Hospital Policy ... 55
Data Limitations .................................................................................................................................... 58
Commission Recommendation ............................................................................................................ 61
Next Steps ............................................................................................................................................. 64
References ............................................................................................................................................. 67
APPENDIX 3A: Methodology and Data Limitations ............................................................................ 69
Primary Data Sources ..................................................................................................................... 69
Report to Congress on Medicaid and CHIP xi
Table of Contents
Working Definition of Essential Community Services .................................................................. 70
Projections of DSH Allotments and DSH Spending ...................................................................... 71
Preliminary Analysis of 2014 Medicare Cost Report Data ........................................................... 73
References ...................................................................................................................................... 73
Chapter 4: Integration of Behavioral and Physical Health Services in Medicaid ....................................... 75
Why Focus on Integrating Behavioral and Physical Health in Medicaid? .......................................... 79
Levels of Integration in Medicaid ......................................................................................................... 81
Medicaid Behavioral Health Integration Initiatives ............................................................................. 86
Behavioral Health Integration Efforts for Dually Eligible Beneficiaries .............................................. 91
Barriers to Behavioral and Physical Health Integration in Medicaid .................................................. 93
Conclusion ............................................................................................................................................. 97
Endnotes ................................................................................................................................................ 98
References ............................................................................................................................................. 98
APPENDIX 4A: Summary of Selected Medicaid Behavioral Health Integration Programs ............. 108
Chapter 5: Design Considerations for the Future of Children’s Coverage: Focus on Affordability ............ 113
Background .......................................................................................................................................... 116
Purpose and Results ........................................................................................................................... 117
Next Steps ........................................................................................................................................... 127
Endnotes .............................................................................................................................................. 128
References ........................................................................................................................................... 128
APPENDIX 5A: State-Level Tables from MACPAC Analysis of Affordability of Children’s Coverage ... 130
APPENDIX 5B: Data Sources and Assumptions for Modeling Children’s Out-of-Pocket Spending ... 147
Data Sources ................................................................................................................................. 147
Modeling Approach ....................................................................................................................... 147
Endnotes ....................................................................................................................................... 150
References .................................................................................................................................... 150
Appendix .............................................................................................................................................. 151
Authorizing Language from the Social Security Act (42 USC 1396) ................................................ 153
Commission Vote on Recommendation ............................................................................................ 160
Biographies of Commissioners .......................................................................................................... 161
Biographies of Staff ............................................................................................................................ 165
March 2016xii
Table of Contents
List of BoxesBOX 1-1. Glossary of Key Medicaid Disproportionate Share Hospital (DSH) Terminology ...................... 4
BOX 1-2. Disproportionate Share Hospital (DSH) Payments to Institutions for Mental Diseases .......... 6
BOX 2-1. Definitions and Data Sources for Uncompensated Care Costs ............................................... 25
BOX 2-2. Identifying Hospitals with High Levels of Uncompensated Care That Provide Essential Community Services for Low-Income, Uninsured, and Other Vulnerable Populations ........... 31
BOX 2-3. Factors Used in Disproportionate Share Hospital (DSH) Health Reform Reduction Methodology ............................................................................................................................... 34
BOX 3-1. Prior Federal Reports on Medicaid Disproportionate Share Hospital (DSH) Policy ............... 66
BOX 4-1. Project TEACH (Training and Education for the Advancement of Children’s Health) ............. 83
BOX 4-2. Health Homes That Integrate Behavioral Health Services ....................................................... 90
BOX 4-3. Medicaid Accountable Care Organizations Integrating Behavioral Health Services .............. 91
BOX 4-4. Opportunities and Challenges for Medicaid Coverage of Services to Adults over Age 21 and under Age 65 Residing in Institutions for Mental Diseases ................................. 95
List of FiguresFIGURE 1-1. State DSH Spending as a Share of Total Medicaid Medical Assistance Expenditures, FY 2014 .......................................................................................................................................... 8
FIGURE 1-2. Share of Hospitals Receiving DSH Payments by State, SPRY 2011 ........................................ 10
FIGURE 1-3. Distribution of DSH Spending on Hospitals by Decile of Medicaid and Low-Income Utilization, 2011 .......................................................................................................................... 11
FIGURE 2-1. Uncompensated Care as a Share of Hospital Operating Costs by State, 2013 ...................... 26
FIGURE 2-2. Uncompensated Care as a Percentage of Hospital Operating Costs, 2011–2014 ................. 29
FIGURE 2-3. Unreduced DSH Allotments as a Share of State Medicaid Benefit Spending, FY 2018 ......... 33
FIGURE 2-4. Projected Percentage Decrease in State DSH Allotments, FY 2018 ........................................ 35
FIGURE 2-5. Distribution of FY 2018 State DSH Allotments (Unreduced and Reduced) per Uninsured Individual, 2014 ......................................................................................................... 36
FIGURE 2-6. Distribution of FY 2018 State DSH Allotments (Unreduced and Reduced) as a Percentage of 2013 Hospital Uncompensated Care ................................................................. 36
FIGURE 2-7. Distribution of FY 2018 State DSH Allotments (Unreduced and Reduced) per Deemed DSH Hospital Providing at Least One Essential Community Service (millions) ...................... 38
FIGURE 3-1. Medicaid Payments to DSH Hospitals as a Percentage of Medicaid Costs, SPRY 2011 ....... 59
FIGURE 5-1. Share of Children Treated for Chronic versus Other Conditions among Children with High Out-of-Pocket Spending in Second Lowest Cost Silver Exchange Plans, 2015 ............ 126
Report to Congress on Medicaid and CHIP xiii
Table of Contents
List of TablesTABLE 1-1. Distribution of DSH Spending by Hospital Type, SPRY 2011 ..................................................... 9
TABLE 1-2. Selected Supplemental Funding and Other Support for Hospitals, 2013 (billions) ................ 11
TABLE 1-3. Characteristics of and Spending by Deemed and Non-Deemed DSH Hospitals, SPRY 2011 ... 12
TABLE 1-4. Aggregate Operating Margins Before and After DSH Payments, 2011 .................................... 13
TABLE 1-5. Share of Hospitals Providing Selected Services, 2013 ............................................................. 13
TABLE 1A-1. Timeline of Key Legislation Affecting Medicaid Disproportionate Share Hospital (DSH) Payment Policy ........................................................................................................................... 17
TABLE 2-1. Uninsured Rate by Age Group, 2013 and 2014 .......................................................................... 24
TABLE 2-2. Uncompensated Care and Cost Margins, Aggregated by Hospital Type, 2013 ....................... 27
TABLE 2-3. Selected Studies of the Effects of Coverage Expansions on Uncompensated Care .............. 28
TABLE 2-4. DSH Hospital Uncompensated Care as a Share of Hospital Operating Costs, 2011 .............. 32
TABLE 2-5. Estimated DSH Payments (Unreduced and Reduced) under Different Targeting Scenarios, FY 2018 ..................................................................................................................... 39
TABLE 2-6. Change in Aggregate State DSH Allotments under Different Medicaid Expansion Scenarios, FY 2018 ..................................................................................................................... 39
TABLE 2A-1. Current and Projected State DSH Allotments, FYs 2016–2017 (millions) .............................. 42
TABLE 2A-2. Projected FY 2018 DSH Allotments under Various Reduction Scenarios (millions) .............. 44
TABLE 2A-3. Projected FY 2018 DSH Payments under Various Reduction Scenarios by Hospital Type (millions) .............................................................................................................. 46
TABLE 2A-4. Number of Uninsured and Uninsured Rate by State, 2013–2014 ............................................ 47
TABLE 2A-5. State Levels of Uncompensated Care, 2013 ............................................................................. 49
TABLE 2A-6. Deemed DSH Hospitals that Provide at Least One Essential Community Service, 2011 ....... 51
TABLE 2A-7. Other Characteristics of Deemed DSH Hospitals, 2011 ........................................................... 53
TABLE 3-1. Total Medicaid Shortfall Reported on Medicaid DSH Audits and Medicare Cost Reports for Selected Hospitals, 2011 (billions) ....................................................................................... 60
TABLE 3A-1. Essential Community Services by Data Source ........................................................................ 71
TABLE 3A-2. Data Sources for Factors Used in the DSH Allotment Reduction Model ................................. 72
TABLE 4A-1. Key Attributes and Target Populations for Selected Medicaid Behavioral Health Integration Programs ................................................................................................................ 108
TABLE 4A-2. Key Organizations, Payment Models, and Integration Components Involved in Selected Medicaid Behavioral Health Integration Programs ................................................. 110
TABLE 5-1. Medicaid and CHIP Eligibility Criteria for Children Based on Family Income as a Percentage of FPL, by State, September 2015 ........................................................................ 118
March 2016xiv
Table of Contents
TABLE 5-2. Average Annual Cost Sharing and Premiums for Children in Separate CHIP versus Second Lowest Cost Silver Exchange Plans, 2015 ................................................................. 121
TABLE 5-3. Average Annual Cost Sharing and Premiums for Children in Separate CHIP versus Second Lowest Cost Silver Exchange Plans, by Income as a Share of FPL, 2015 ............... 122
TABLE 5-4. Example Thresholds for a Family of Four by Income as a Percentage of FPL, 2015 ........... 123
TABLE 5-5. Share of Children with Out-Of-Pocket Spending Exceeding Various Income Thresholds in 36 States with Separate CHIP, by Income as a Percentage of FPL, 2015 .......................... 124
TABLE 5A-1. Average Out-of-Pocket Spending for Separate CHIP and Exchange Plans by State, for Children at 133%–150% FPL, 2015 ..................................................................................... 130
TABLE 5A-2. Average Out-of-Pocket Spending for Separate CHIP and Exchange Plans by State, for Children at 151%–200% FPL, 2015 ..................................................................................... 132
TABLE 5A-3. Average Out-of-Pocket Spending for Separate CHIP and Exchange Plans by State, for Children at 201%–250% FPL, 2015 ..................................................................................... 134
TABLE 5A-4. Average Out-of-Pocket Spending for Separate CHIP and Exchange Plans by State, for Children at 251%–400% FPL, 2015 ..................................................................................... 136
TABLE 5A-5. Share of Individual Children above Spending Thresholds, by State, for Children at 133%–150% FPL, 2015 ............................................................................................................. 138
TABLE 5A-6. Share of Individual Children above Spending Thresholds, by State, for Children at 151%–200% FPL, 2015 ............................................................................................................. 140
TABLE 5A-7. Share of Individual Children above Spending Thresholds, by State, for Children at 201%–250% FPL, 2015 ............................................................................................................. 142
TABLE 5A-8. Share of Individual Children above Spending Thresholds, by State, for Children at 251%–400% FPL, 2015 ............................................................................................................. 144
TABLE 5A-9. Accounting for Combined Out-of-Pocket Spending of Multiple Children in Families: Share of Children with Out-Of-Pocket Spending Exceeding Various Income Thresholds in 36 States with Separate CHIP, by Income as a Percentage of FPL, 2015 .......................... 146
Report to Congress on Medicaid and CHIP xv
Executive Summary
Executive Summary: March 2016 Report to Congress on Medicaid and CHIP In the March 2016 Report to Congress on Medicaid and CHIP, the Medicaid and CHIP Payment and Access Commission (MACPAC) takes on important policy issues in three areas in which Medicaid and the State Children’s Health Insurance Program (CHIP) have significant roles—Medicaid payments to safety-net hospitals, new approaches to behavioral health care delivery, and the future of children’s coverage.
About half of all U.S. hospitals receive disproportionate share hospital (DSH) payments, which help offset uncompensated care costs for Medicaid and uninsured patients. Medicaid is the single largest payer for behavioral health care, and beneficiaries who need this care account for some of the largest expenditures in Medicaid. CHIP coverage has meant that millions of low- and moderate-income children no longer risk being uninsured if their families’ incomes exceed Medicaid eligibility thresholds. The March 2016 report suggests policy could be improved in each of these areas.
The first three chapters of the March report reprise MACPAC’s inaugural Report to Congress on Medicaid Disproportionate Share Hospital Payment, originally released online in February 2016 in compliance with a provision of the Protecting Access to Medicare Act (P.L. 113-93). Our analysis finds little meaningful relationship between DSH allotments and three aspects of DSH payment that Congress asked us to study: (1) the relationship of state DSH allotments to data relating to changes in the number of uninsured individuals, (2) data relating to the amount and sources of hospitals’ uncompensated care costs, and (3) data identifying hospitals with high levels of uncompensated care that also provide access to essential community
services for low-income, uninsured, and vulnerable populations. Indeed, DSH allotments to states still reflect spending patterns of 25 years ago. The Commission recommends that the Secretary of the U.S. Department of Health and Human Services take steps to fill gaps in data about all types of Medicaid payments for every hospital that receives a Medicaid payment, as well as the sources of non-federal share, because this data could help inform policies to target these payments to hospitals with the greatest need.
Chapter 4 reviews the efforts in multiple states and at the federal level to integrate behavioral and physical health to improve outcomes for Medicaid beneficiaries and reduce program costs. It also highlights the legal, administrative, and cultural barriers that can discourage integration efforts.
The final March chapter presents the Commission’s analysis of families’ out-of-pocket spending for children in exchange coverage compared to out-of-pocket spending for children in separate CHIP. This chapter is one of a number of analyses that lay the groundwork for recommendations on the future of children’s coverage that we plan to release by the end of 2016.
Chapter 1: Overview of Medicaid Policy on Disproportionate Share Hospital PaymentsStates began making Medicaid DSH payments in 1981, when Medicaid hospital payments were delinked from Medicare’s payment levels. Due to concerns that reductions in hospital payments might threaten the financial viability of hospitals that served large numbers of Medicaid and uninsured patients, Congress directed state Medicaid agencies to “take into account the situation of hospitals which serve a disproportionate number of low-income patients with special needs.”
Today, Medicaid DSH payments provide substantial support to safety-net hospitals. In 2014, Medicaid
March 2016xvi
made a total of $18 billion in DSH payments, with most going to those hospitals, known as deemed DSH hospitals, that serve a particularly high share of Medicaid and other low-income patients. However, analysis presented in Chapter 1 shows that more than one-third of DSH payments are made to non-deemed hospitals that may not have the greatest need.
Chapter 1 concludes with an overview of reductions in DSH allotments, originally required in fiscal year (FY) 2014 by the Patient Protection and Affordable Care Act (ACA, P.L. 111-148, as amended) but now scheduled to begin in FY 2018.
Chapter 2: Analysis of Current and Future Disproportionate Share Hospital AllotmentsChapter 2 compares current and future DSH allotments to the factors Congress directed MACPAC to study and reviews early reports of the effect of the ACA on DSH hospitals.
Pending reductions in DSH allotments are premised in part on the assumption that increased hospital revenues from the ACA’s coverage expansions will reduce uncompensated care and the need for DSH payments to safety-net hospitals. But the Commission finds little meaningful relationship between DSH allotments and the three key indicators singled out in the study requirement: the number of uninsured individuals; the amount and sources of hospitals’ uncompensated care costs; and the number of hospitals with high levels of uncompensated care that also provide access to essential community services for low-income, uninsured, and vulnerable populations.
Although early reports suggest that the coverage expansions are improving hospital finances in general, it is not yet clear how hospitals that are particularly reliant on Medicaid DSH payments are being affected. In addition, because post-2014 data on all sources of hospital uncompensated care are
not yet available, it is too early to evaluate how the pending DSH allotment reductions will affect these providers, especially because Medicaid shortfall may be increasing with increased Medicaid enrollment.
Chapter 3: Improving Data as the First Step to a More Targeted Disproportionate Share Hospital PolicyChapter 3 discusses the limited availability of data, which affects the Commission’s ability to analyze how best to improve DSH payment targeting. These data limitations provide the rationale behind our recommendation. In the Commission’s view, DSH allotments and payments should be better targeted, consistent with their original statutory intent. The scheduled reduction of Medicaid DSH allotments of 16 percent in FY 2018 rising to 55 percent in FY 2025 makes such targeting particularly important.
Greater transparency, which will lead to a more thorough understanding of total Medicaid payments at an institutional level, is needed to better analyze current policy and new approaches for targeting DSH payments. To fill existing data gaps, MACPAC recommends that the Secretary collect and report hospital-specific data on all types of Medicaid payments for all hospitals that receive them. In addition, the Secretary should collect and report data on the sources of non-federal share necessary to determine net Medicaid payment at the provider level.
In future reports on DSH payment policy, which MACPAC will include in its annual March reports to Congress, the Commission will continue to monitor the ACA’s effect on hospitals receiving DSH payments. We also plan to explore potential approaches to improving targeting of federal Medicaid DSH funding, including modifying the criteria for DSH payment eligibility, redefining uncompensated care for Medicaid DSH purposes, and rebasing states’ DSH allotments.
Executive Summary
Report to Congress on Medicaid and CHIP xvii
Chapter 4: Integration of Behavioral and Physical Health Services in MedicaidMedicaid is the single largest payer in the United States for behavioral health services, accounting for 26 percent of spending on behavioral health services in 2009. In 2011, the one in five Medicaid beneficiaries who had a behavioral health diagnosis accounted for almost half of Medicaid expenditures. Many policymakers, program administrators, clinicians, and patient advocates have suggested that integrating the delivery of behavioral and physical health services would not only improve health outcomes for these beneficiaries, but also help to reduce costs.
MACPAC’s examination finds the reality more complicated. Research suggests that integrating physical and behavioral health can reduce fragmentation of services and promote person-centered care for patients with some conditions. But in practice, patients with differing conditions may require different approaches to integration. At present, there are a limited but growing number of case studies and evaluations that specifically examine Medicaid integration initiatives and their effects on costs.
Chapter 4 reviews a range of physical and behavioral health integration efforts, looking at different approaches to system and payment integration, specific integration efforts within Medicaid and for people who are dually eligible for Medicaid and Medicare, and barriers to integration, including workforce and billing issues and inadequate information technology. The chapter also highlights a number of promising integration initiatives now underway.
In future analyses, the Commission plans to explore approaches to integrating additional services, such as pharmacy, long-term services and supports, and social determinants of health. We also intend to examine the impact of the Medicaid institutions for mental diseases (IMD) exclusion on behavioral health services and
Medicaid’s interaction with other systems that provide behavioral health services to the Medicaid population, such as the criminal justice system.
Chapter 5: Design Considerations for the Future of Children’s Coverage: Focus on AffordabilityChapter 5 continues MACPAC’s effort to consider how best to provide adequate affordable coverage to low- and moderate-income children. Specifically, it presents the Commission’s analysis of out-of-pocket spending for children in exchange coverage compared to out-of-pocket spending for children in separate CHIP in 36 states that offer this coverage.
The Commission finds that in no state does exchange coverage provide out-of-pocket protections comparable to CHIP. CHIP prohibits out-of-pocket spending above 5 percent of family income, but families do not have this protection in exchange coverage. But whether low- and moderate-income children are eligible for the cost sharing protections of CHIP depends on CHIP eligibility levels in the state where they reside.
The analysis also finds that differences between CHIP and exchange coverage are greatest above 200 percent of the federal poverty level (FPL), which is $48,500 for a family of four, reflecting the income-related design of cost sharing protection in exchange coverage. However, few CHIP enrollees have family income above 200 percent FPL.
We note that while children with chronic conditions make up the majority of children with high out-of-pocket spending in exchange coverage, any future design of children’s coverage must also take into account substantial out-of-pocket costs incurred by otherwise healthy children who need treatment for an unexpected acute episode. The chapter ends with some key policy issues raised by these findings, which the Commission will consider as it develops recommendations on the future of children’s coverage for release by the end of 2016.
Executive Summary

CHAPTER 1
Overview of Medicaid Policy on Disproportionate Share Hospital Payments
March 20162
Chapter 1: Overview of Medicaid Policy on Disproportionate Share Hospital Payments
Overview of Medicaid Policy on Disproportionate Share Hospital Payments
Key Points• State Medicaid programs are statutorily required to make disproportionate share hospital
(DSH) payments to hospitals that serve a high proportion of Medicaid and other low-income patients.
• States began making DSH payments in 1981, when Medicaid payments to hospitals were de-linked from Medicare payments. Congress first established federal limits on DSH spending in 1991, following a period of rapid growth in DSH spending.
• Under current law, DSH payments to individual hospitals cannot exceed each hospital’s uncompensated care, which includes the shortfall (if any) between Medicaid payments and the cost of providing services to Medicaid patients as well as the unpaid costs of care for the uninsured.
• State DSH spending is also limited by federal allotments, which vary by state, ranging from less than $10 million to more than $1 billion. The current variation in state DSH allotments stems from the variation that existed in state DSH spending in 1992.
• In 2014, Medicaid made a total of $18 billion ($8 billion in state funds and $10 billion in federal funds) in DSH payments to hospitals.
• About half of all U.S. hospitals receive DSH payments. Some states make DSH payments to almost all of the hospitals in the state, and other states make DSH payments to only one or two hospitals.
• In 2011, about one-third of DSH hospitals qualified as deemed DSH hospitals, meaning that they were required to receive DSH payments because they served a particularly high share of low-income patients. These deemed DSH hospitals received about two-thirds of all DSH payments nationally, but reported negative operating margins even after DSH payments.
• Under the Patient Protection and Affordable Care Act (ACA, P.L. 111-148, as amended), Congress established a schedule for reducing federal DSH allotments to account for an anticipated decrease in uncompensated care as a result of an increase in the number of people with insurance. Originally set to go into effect beginning in fiscal year (FY) 2014, the reductions are now scheduled to begin in FY 2018 at $2 billion and increase to $8 billion by FY 2025.
Report to Congress on Medicaid and CHIP 3
Chapter 1: Overview of Medicaid Policy on Disproportionate Share Hospital Payments
CHAPTER 1: Overview of Medicaid Policy on Disproportionate Share Hospital Payments State Medicaid programs are statutorily required to make disproportionate share hospital (DSH) payments to hospitals that serve a high proportion of Medicaid and other low-income patients. State DSH payments are limited by annual federal DSH allotments, which vary widely by state. DSH payments to hospitals are also limited by the total amount of uncompensated care that hospitals provide to Medicaid patients and the uninsured. The Patient Protection and Affordable Care Act (ACA, P.L. 111-148, as amended) includes reductions to federal DSH allotments under the assumption that increased health care coverage would lead to reductions in hospital uncompensated care. With the onset of these reductions currently scheduled for fiscal year (FY) 2018, Congress has instructed the Commission to report annually on Medicaid DSH policy issues.
We begin this report with a description of the history of and context for Medicaid DSH payments. First we outline the evolution of DSH payment policy, including the enactment of state- and hospital-specific limits. Then we discuss variation in DSH allotments and spending among states and describe the types of hospitals that receive DSH payments. We end with an overview of the reductions in DSH allotments enacted under the ACA.
The History of Medicaid DSH Payment PolicyStates began making Medicaid DSH payments in 1981, when Medicaid hospital payments were de-linked from Medicare payment levels. Beginning with Medicaid’s enactment in 1965, states were required to mirror Medicare’s hospital payment policies in order to pay hospitals’ reasonable costs for Medicaid services. In 1981, states were given broader discretion over hospital payment when Congress amended the Social Security Act (the Act) to remove the requirement to pay hospitals according to Medicare cost principles. Because of concerns that state flexibility to reduce hospital payments might threaten hospitals serving large numbers of Medicaid and uninsured patients, Congress also directed state Medicaid agencies to “take into account the situation of hospitals which serve a disproportionate number of low-income patients with special needs” (§ 1902(a)(13)(A)(iv) of the Act).
States were initially slow to make DSH payments. As a result, Congress clarified in the Omnibus Budget Reconciliation Act of 1986 (P.L. 99-509) that Medicaid’s hospital payment limitations did not apply to DSH payments. Then, in 1987, Congress required states to make DSH payments to certain hospitals that serve the highest share of low-income patients, which were referred to as deemed DSH hospitals (§ 1923(b) of the Act).
Prior to these congressional actions, a 1985 federal regulation permitted states to use both public and private donations as sources of non-federal Medicaid financing. In 1987, policy guidance from the federal government indicated that taxes that were imposed only on Medicaid providers could also be used to finance Medicaid (Matherlee 2002). The combination of the lack of limits on DSH payments and the flexibility in raising the non-federal share of payments was soon followed by substantial growth in DSH spending. The total amount of DSH payments increased from $1.3 billion in 1990 to $17.7 billion in 1992 (Holahan et al. 1998).
March 20164
Chapter 1: Overview of Medicaid Policy on Disproportionate Share Hospital Payments
As DSH spending increased, federal policymakers grew concerned over both the level of DSH spending and the possibility that some states were misusing DSH funds by making large DSH payments to hospitals operated by state or local governments that were then transferred back to the state and used for other purposes. Congress acted to address these concerns: In 1991, it enacted national and state-specific caps on the amount of federal funds that could be used to make DSH
payments, and in 1993 it created hospital-specific DSH payment limits equal to the actual cost of uncompensated care for hospital services provided to Medicaid and uninsured patients.
State allotmentsThe caps on the federal DSH funds that are available to each state are referred to as allotments, and the amount of each state’s allotment is calculated
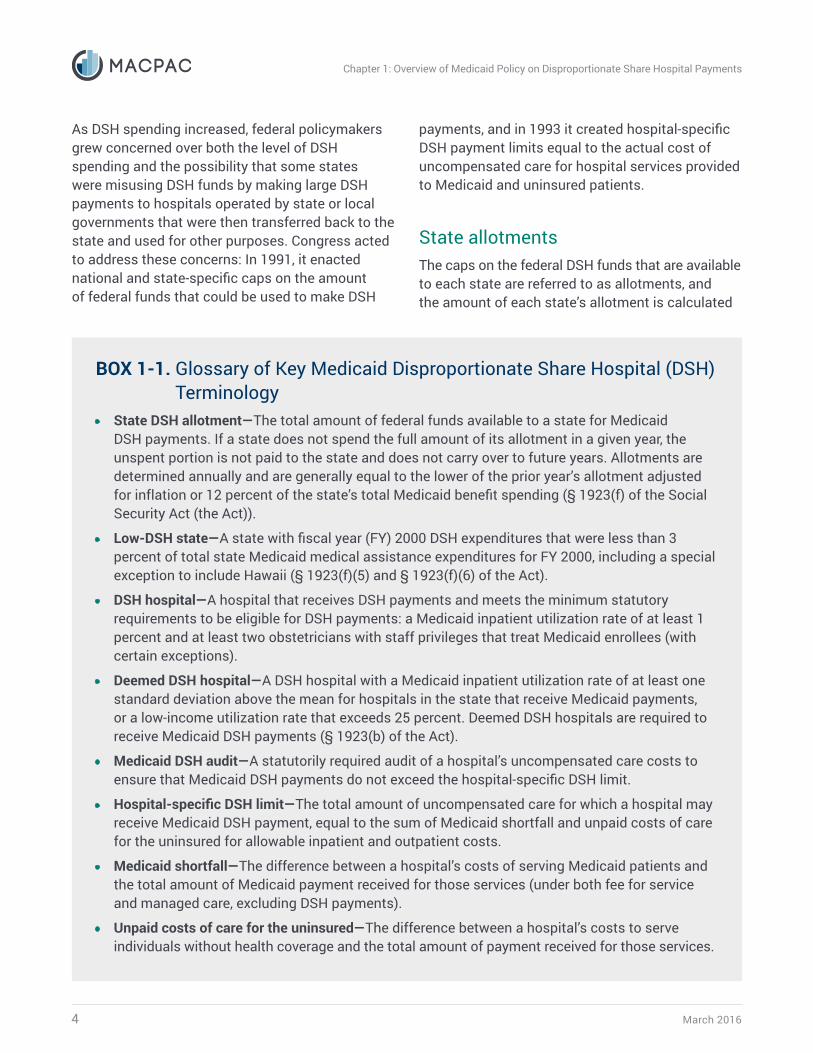
BOX 1-1. Glossary of Key Medicaid Disproportionate Share Hospital (DSH) Terminology
• State DSH allotment—The total amount of federal funds available to a state for Medicaid DSH payments. If a state does not spend the full amount of its allotment in a given year, the unspent portion is not paid to the state and does not carry over to future years. Allotments are determined annually and are generally equal to the lower of the prior year’s allotment adjusted for inflation or 12 percent of the state’s total Medicaid benefit spending (§ 1923(f) of the Social Security Act (the Act)).
• Low-DSH state—A state with fiscal year (FY) 2000 DSH expenditures that were less than 3 percent of total state Medicaid medical assistance expenditures for FY 2000, including a special exception to include Hawaii (§ 1923(f)(5) and § 1923(f)(6) of the Act).
• DSH hospital—A hospital that receives DSH payments and meets the minimum statutory requirements to be eligible for DSH payments: a Medicaid inpatient utilization rate of at least 1 percent and at least two obstetricians with staff privileges that treat Medicaid enrollees (with certain exceptions).
• Deemed DSH hospital—A DSH hospital with a Medicaid inpatient utilization rate of at least one standard deviation above the mean for hospitals in the state that receive Medicaid payments, or a low-income utilization rate that exceeds 25 percent. Deemed DSH hospitals are required to receive Medicaid DSH payments (§ 1923(b) of the Act).
• Medicaid DSH audit—A statutorily required audit of a hospital’s uncompensated care costs to ensure that Medicaid DSH payments do not exceed the hospital-specific DSH limit.
• Hospital-specific DSH limit—The total amount of uncompensated care for which a hospital may receive Medicaid DSH payment, equal to the sum of Medicaid shortfall and unpaid costs of care for the uninsured for allowable inpatient and outpatient costs.
• Medicaid shortfall—The difference between a hospital’s costs of serving Medicaid patients and the total amount of Medicaid payment received for those services (under both fee for service and managed care, excluding DSH payments).
• Unpaid costs of care for the uninsured—The difference between a hospital’s costs to serve individuals without health coverage and the total amount of payment received for those services.
Report to Congress on Medicaid and CHIP 5
Chapter 1: Overview of Medicaid Policy on Disproportionate Share Hospital Payments
according to statutory requirements and published annually in the Federal Register. Allotments were initially established for FY 1993 and were generally based on each state’s 1992 DSH spending (P.L. 102-234).
Congress has acted on several occasions to make incremental adjustments to state DSH allotments, but the 1992 DSH spending amounts still serve as the basis for most state allotments today, meaning the states that spent the most in 1992 now have the largest allotments and the states that spent the least in 1992 now have the smallest allotments.
At first, the original legislation implementing caps on federal DSH funds allowed the allotments for the lowest spending states to grow annually while holding allotments for the highest spending states unchanged. The Balanced Budget Act of 1997 (P.L. 105-33) temporarily replaced the calculated allotments with fixed allotments, specified in statute, which reduced total DSH allotments by about half. The fixed allotments were in place from FY 1998 through FY 2000. Following this period of fixed allotments, state allotments were again calculated based on the prior year’s allotment, starting from the FY 2000 allotment as the baseline.1 Beginning in 2000, recognizing that some states still had much lower DSH allotments than others, Congress enacted special rules allowing the allotments for so-called low-DSH states to grow more quickly through FY 2008.
Congress has also provided several temporary increases in state DSH allotments in response to state fiscal pressures, most recently in 2009 during the recession. Since then, the only other changes in state DSH allotments have been adjustments for inflation.2 (See Appendix 1A for a timeline of key legislation affecting Medicaid DSH payment policy.)
Hospital-specific limitsIn 1993, shortly after establishing the state DSH allotments, Congress also established hospital-specific limits for DSH payments (P.L. 103-166).
These limits were based on a hospital’s overall uncompensated care for low-income patients, defined as the sum of Medicaid shortfall and unpaid costs of care for the uninsured for DSH-allowable services.3 Specifically, states cannot pay a hospital more than the hospital’s cost of inpatient and outpatient services to Medicaid and uninsured patients minus payments received by or on behalf of Medicaid (including supplemental payments) and from uninsured individuals.4 Costs associated with physician services and hospital-based clinics do not count toward the hospital-specific limit.5
DSH reporting and audits In 2003, Congress added statutory requirements for states to submit annual reports and, separately, to submit for each hospital an annual independent certified audit of DSH payments (P.L. 108-173). The annual reports for each DSH hospital must include the following: the hospital-specific DSH limit, the Medicaid inpatient utilization rate, the low-income utilization rate, the state-defined DSH qualification criteria, and all Medicaid payments (including fee-for-service, managed care, and non-DSH supplemental payments) (§ 1923(j) of the Act and 42 CFR 447.299). The annual independent audits must certify that each DSH hospital qualifies for payment, that DSH payments do not exceed allowable uncompensated care costs, and that the hospital accurately reported payments, spending, and utilization.
The Centers for Medicare & Medicaid Services (CMS) finalized DSH audit regulations in 2008, and the first set of DSH audit reports were submitted in 2010 for state plan rate years (SPRYs) 2005–2007.6 SPRYs 2005–2010 were designated transition years to allow CMS, states, hospitals, and auditors time to develop and refine their procedures without financial penalties. Beginning with the reports for SPRY 2011, which were due to CMS by December 31, 2014, DSH payments that exceed hospital-specific limits will be considered overpayments and states will be required either to return the federal share or, if specified in the state plan, to redistribute it to other hospitals that are below their limits (CMS 2008). CMS regulations permit states to
March 20166
Chapter 1: Overview of Medicaid Policy on Disproportionate Share Hospital Payments
submit DSH audits approximately three years after a state plan rate year ends so that all claims can be included and audits can be completed. CMS posts DSH audit data on its website after its review, typically about five years after a state plan rate year ends.
State distribution of DSH paymentsAs mentioned previously, federal statute specifies that hospitals must receive DSH payments if they meet the minimum requirements for DSH hospitals and also meet one of the following criteria for deemed DSH hospitals:7
• they have a Medicaid inpatient utilization rate of at least one standard deviation above the mean for hospitals in the state that receive Medicaid payments; or
• they have a low-income utilization rate in excess of 25 percent.
However, states may also make DSH payments to other hospitals as long as they have a Medicaid inpatient utilization rate of at least 1 percent and, with certain exceptions, at least two obstetricians with staff privileges that treat Medicaid enrollees.
This flexibility results in a wide variety of hospitals being designated as DSH hospitals.
State DSH payment methodologies are specified within their Medicaid state plans, which are reviewed and approved by CMS. Federal statute requires that payments to DSH hospitals must be determined using one of the following methodologies:
• the Medicare DSH adjustment methodology;
• a methodology that increases DSH payments in proportion to the extent that a hospital’s Medicaid inpatient utilization exceeds one standard deviation above the mean; or,
• a methodology that varies by hospital type (such as teaching hospitals, children’s hospitals, etc.) and that applies equally to all hospitals of each type and is reasonably related to Medicaid and low-income utilization.
DSH payments are subject to hospital-specific limits based on a hospital’s overall uncompensated care costs for low-income patients. Federal statute also limits the amount of DSH payments that each state can make to institutions for mental diseases or other mental health facilities (Box 1-2).
BOX 1-2. Disproportionate Share Hospital (DSH) Payments to Institutions for Mental Diseases
States may make DSH payments to institutions for mental diseases (IMDs), which are defined by the Social Security Act (the Act) as hospitals, nursing facilities, or other institutions of more than 16 beds that primarily serve individuals with mental diseases (§ 1905(i) of the Act). Because IMDs cannot receive Medicaid payment for individuals age 21–64 (§ 1905(a)(B) of the Act), IMD services provided to Medicaid enrollees in this age range are classified as unpaid costs of care for the uninsured, a type of uncompensated care that is eligible for DSH funding.
The amount of a state’s federal DSH funds available for IMDs is limited. Each state’s IMD limit is the lesser amount of either the DSH allotment the state paid to IMDs and other mental health facilities in fiscal year (FY) 1995 or 33 percent of the state’s FY 1995 DSH allotment.
In 2011, IMDs accounted for 6 percent of DSH hospitals but received 18 percent of DSH payments ($3 billion). Delaware and Maine made DSH payments exclusively to IMDs in 2011, and six states made more than half of their DSH payments to IMDs.
Report to Congress on Medicaid and CHIP 7
Chapter 1: Overview of Medicaid Policy on Disproportionate Share Hospital Payments
However, states have broad flexibility within these requirements in determining the amount of DSH payments that are made to each provider. There is no minimum DSH payment that must be made to DSH hospitals (including deemed DSH hospitals).
Current State DSH Allotments and Spending
State DSH allotmentsA total of $11.7 billion in federal funds ($20.7 billion in state and federal funds combined) was allotted to states for DSH payments in FY 2014 (CMS 2014). Large disparities in allotments persist today despite past legislation intended to reduce them. State allotments in FY 2014 ranged from about $10 million or less in four states (Wyoming, Delaware, North Dakota, and Hawaii) to over $1 billion in three states (California, New York, and Texas) (CMS 2014). In 2014, 17 states were classified as low-DSH states and had average DSH allotments of $30 million, while the remaining 34 states had average DSH allotments of $337 million. (State allotments are given in TABLE 2A-1.)
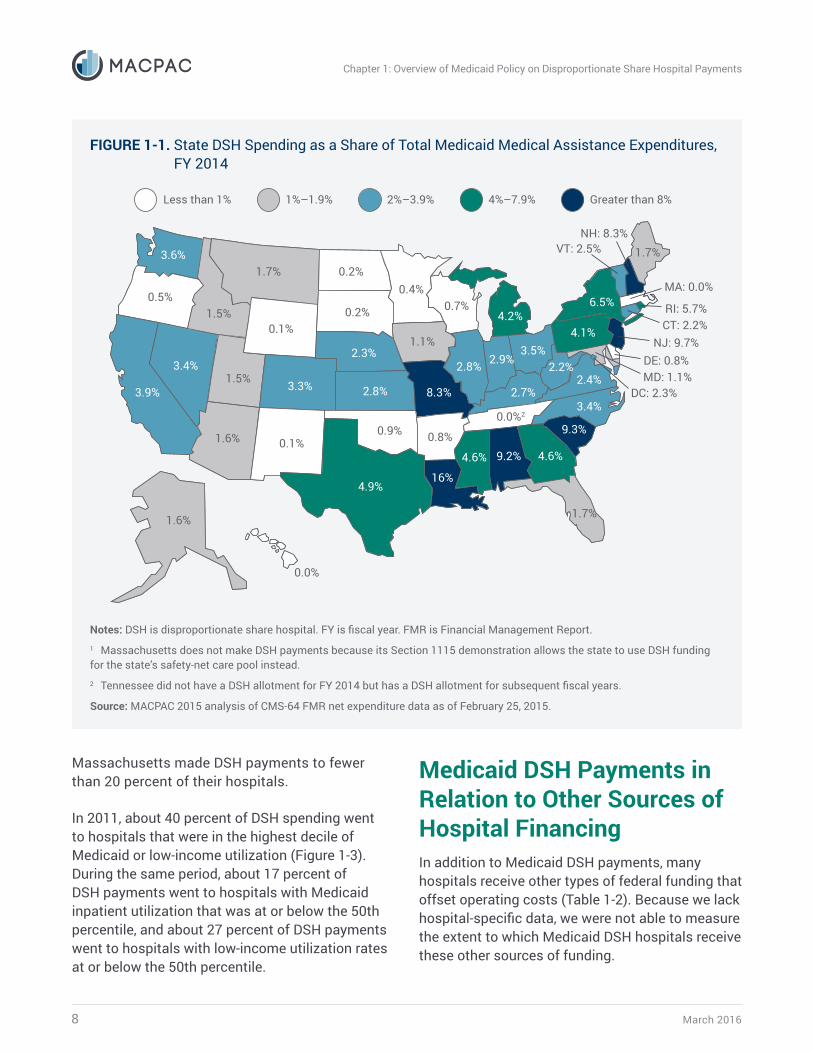
DSH spending by stateIn FY 2014, states spent a total of $10.2 billion in federal funds on DSH payments ($18.1 billion in state and federal funds combined). The amount of DSH expenditures and the percentage of Medicaid spending that DSH payments account for vary widely among states. DSH spending as a percentage of Medicaid service spending ranged from less than 1 percent to 16 percent (Figure 1-1). Ten states account for more than two-thirds of total DSH spending. Seven of these ten (California, Texas, Michigan, New Jersey, New York, Ohio, and Pennsylvania) are also among the top ten in total Medicaid service spending. The other three (Missouri, Louisiana, and South Carolina), rank 19th, 23rd, and 27th respectively in Medicaid service spending. Nationally, DSH spending
accounted for 3.9 percent of total Medicaid service spending in FY 2014.
Historically, some states do not spend their full DSH allotments. As of November 2015, $1.2 billion in federal DSH allotments for FY 2012 were unspent ($2.1 billion in state and federal funds combined). Four states accounted for half of unspent DSH allotments in FY 2012.8 Because states must provide state matching funds to draw down DSH payments at the same matching rate as other Medicaid service expenditures, some states may choose to apply their state funding to other types of Medicaid payments. Although other Medicaid payments are not limited by federal allotments, regular Medicaid hospital payments are subject to different rules that may limit the ability of states to make the same amount of Medicaid payments to hospitals without using DSH funding.9
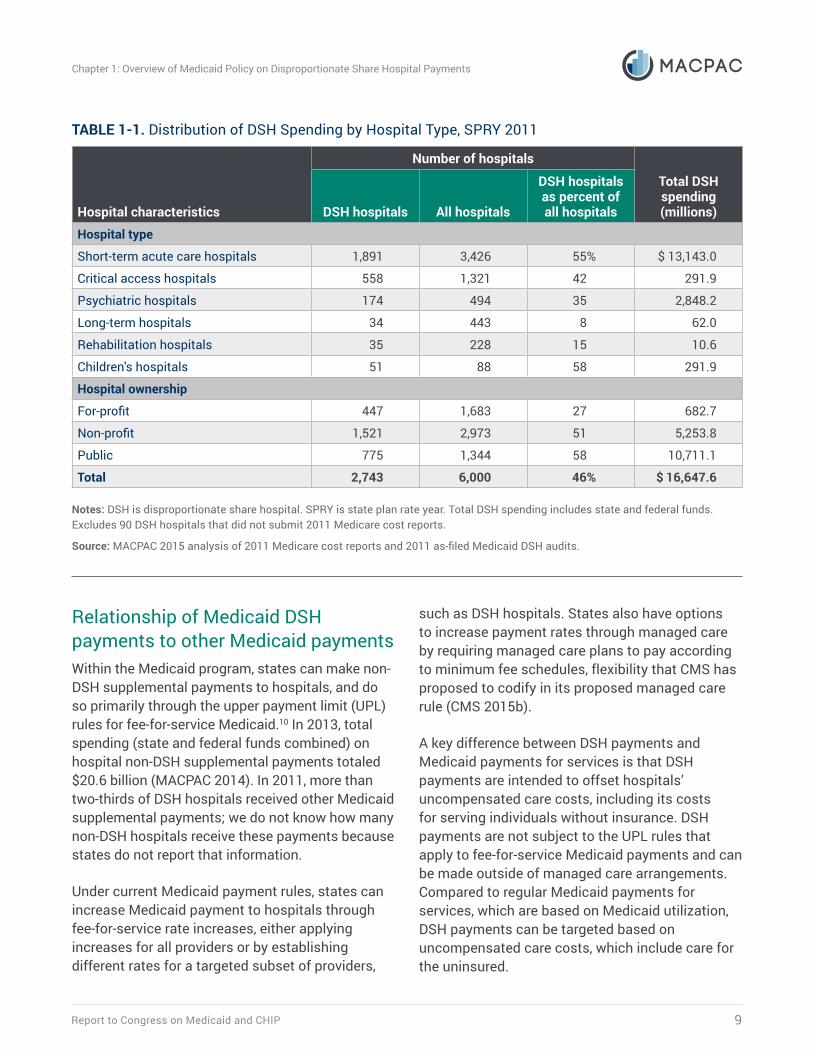
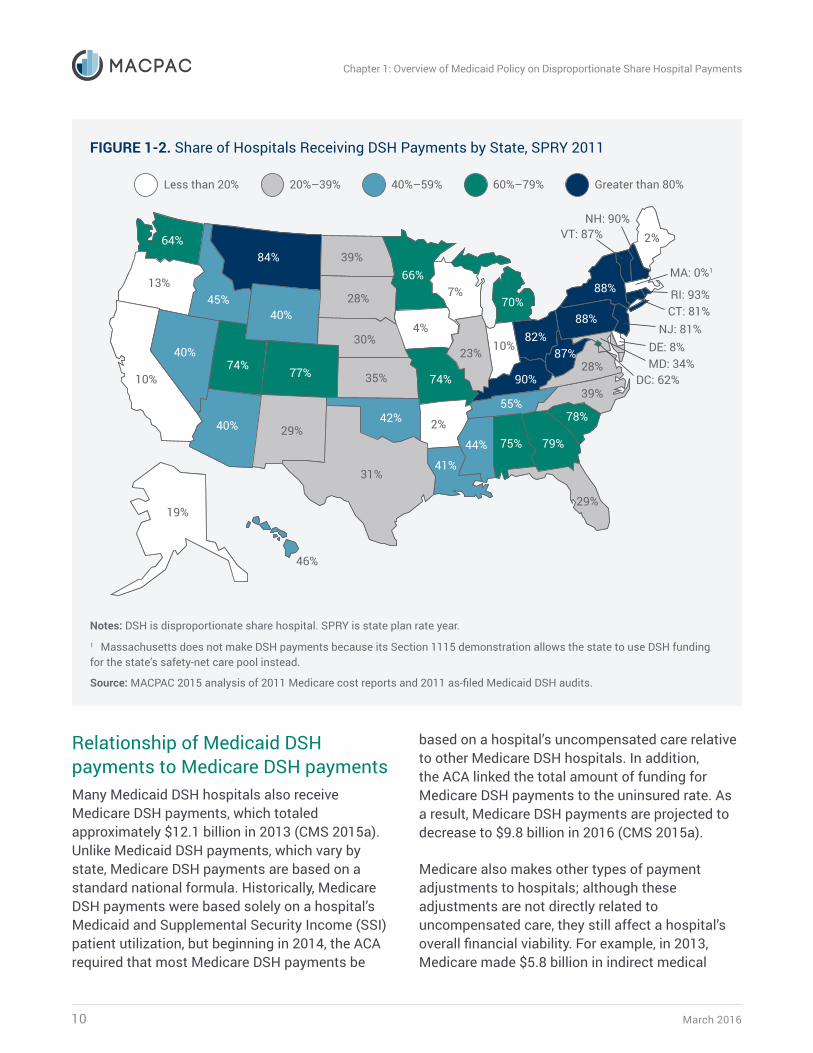
DSH spending by hospital typeAbout half of all U.S. hospitals received DSH payments in 2011. The majority of DSH payments were made to short-term acute care hospitals and public hospitals (Table 1-1). However, all hospital types received at least some DSH payments in 2011.
The share of hospitals that receive DSH payments varies widely from state to state (Figure 1-2). For example, in 2011, 10 states provided DSH payments to less than 20 percent of hospitals, while 11 states provided DSH payments to more than 80 percent of hospitals in their state. In general, states with larger DSH allotments make DSH payments to a greater proportion of hospitals, but there are exceptions. In 2011, the 17 low-DSH states made DSH payments to an average of 32 percent of the hospitals in their respective states, but Minnesota, Montana, and Utah made DSH payments to more than 60 percent of their hospitals. Those states not classified as low-DSH states (33 states and the District of Columbia) made DSH payments to an average of 49 percent of the hospitals in their respective states, but California, Maine, and
March 20168
Chapter 1: Overview of Medicaid Policy on Disproportionate Share Hospital Payments
Massachusetts made DSH payments to fewer than 20 percent of their hospitals.
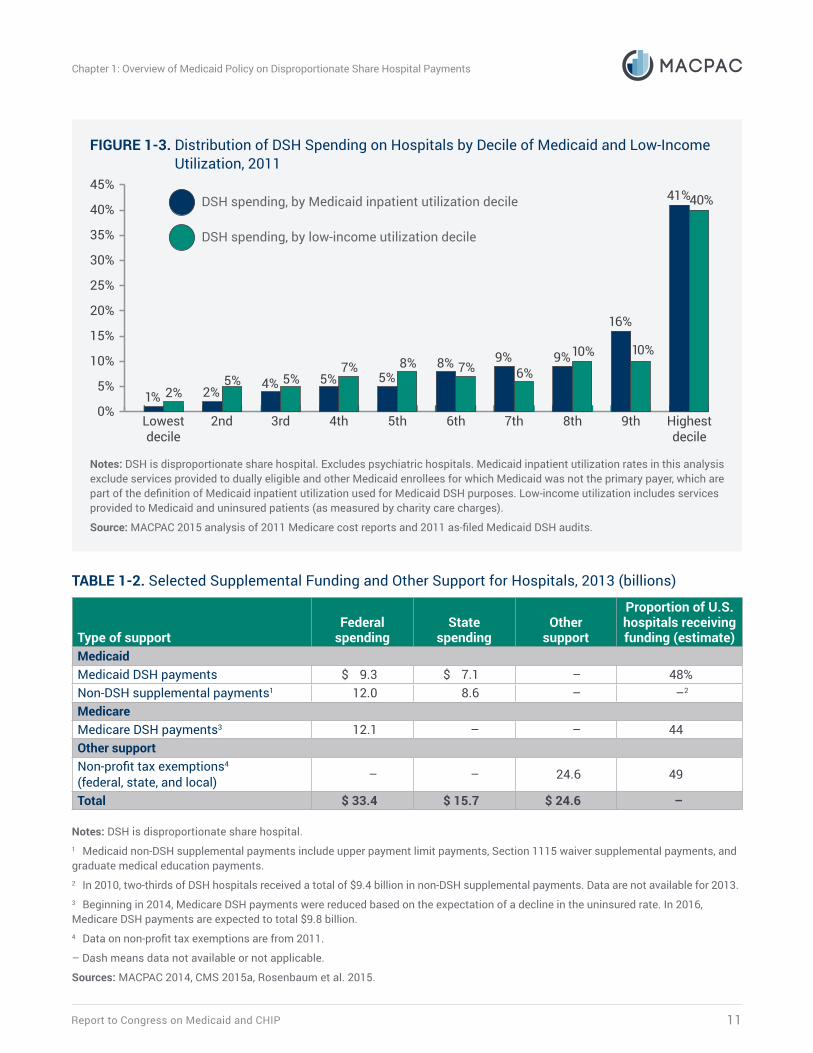
In 2011, about 40 percent of DSH spending went to hospitals that were in the highest decile of Medicaid or low-income utilization (Figure 1-3). During the same period, about 17 percent of DSH payments went to hospitals with Medicaid inpatient utilization that was at or below the 50th percentile, and about 27 percent of DSH payments went to hospitals with low-income utilization rates at or below the 50th percentile.
Medicaid DSH Payments in Relation to Other Sources of Hospital FinancingIn addition to Medicaid DSH payments, many hospitals receive other types of federal funding that offset operating costs (Table 1-2). Because we lack hospital-specific data, we were not able to measure the extent to which Medicaid DSH hospitals receive these other sources of funding.
FIGURE 1-1. State DSH Spending as a Share of Total Medicaid Medical Assistance Expenditures, FY 2014
16%
1.5%
1.5%
1.7%
0.7%
2.8%
2.9%
0.0%23.4%
NH: 8.3%
MA: 0.0%
VT: 2.5%
4.1%
2.4%
CT: 2.2%NJ: 9.7%
DE: 0.8%MD: 1.1%
RI: 5.7%
0.0%
1.6%
9.3%
4.6%
4.9%
1.7%
9.2%4.6%
0.1%1.1%
2.3%
0.2%
1.7%
8.3%
0.9%
DC: 2.3%
1.6%
3.6%
0.4%0.2%
3.3%
0.5%
3.4%
3.9%
4.2%
3.5%
6.5%
2.7%
2.2%
0.1%
2.8%
0.8%
Less than 1% 1%–1.9% Greater than 8% 4%–7.9%2%–3.9%
Notes: DSH is disproportionate share hospital. FY is fiscal year. FMR is Financial Management Report.1 Massachusetts does not make DSH payments because its Section 1115 demonstration allows the state to use DSH funding for the state’s safety-net care pool instead. 2 Tennessee did not have a DSH allotment for FY 2014 but has a DSH allotment for subsequent fiscal years.
Source: MACPAC 2015 analysis of CMS-64 FMR net expenditure data as of February 25, 2015.
Report to Congress on Medicaid and CHIP 9
Chapter 1: Overview of Medicaid Policy on Disproportionate Share Hospital Payments
Relationship of Medicaid DSH payments to other Medicaid paymentsWithin the Medicaid program, states can make non-DSH supplemental payments to hospitals, and do so primarily through the upper payment limit (UPL) rules for fee-for-service Medicaid.10 In 2013, total spending (state and federal funds combined) on hospital non-DSH supplemental payments totaled $20.6 billion (MACPAC 2014). In 2011, more than two-thirds of DSH hospitals received other Medicaid supplemental payments; we do not know how many non-DSH hospitals receive these payments because states do not report that information.
Under current Medicaid payment rules, states can increase Medicaid payment to hospitals through fee-for-service rate increases, either applying increases for all providers or by establishing different rates for a targeted subset of providers,
such as DSH hospitals. States also have options to increase payment rates through managed care by requiring managed care plans to pay according to minimum fee schedules, flexibility that CMS has proposed to codify in its proposed managed care rule (CMS 2015b).
A key difference between DSH payments and Medicaid payments for services is that DSH payments are intended to offset hospitals’ uncompensated care costs, including its costs for serving individuals without insurance. DSH payments are not subject to the UPL rules that apply to fee-for-service Medicaid payments and can be made outside of managed care arrangements. Compared to regular Medicaid payments for services, which are based on Medicaid utilization, DSH payments can be targeted based on uncompensated care costs, which include care for the uninsured.
TABLE 1-1. Distribution of DSH Spending by Hospital Type, SPRY 2011
Hospital characteristics
Number of hospitals
Total DSH spending (millions)DSH hospitals All hospitals
DSH hospitals as percent of all hospitals
Hospital type
Short-term acute care hospitals 1,891 3,426 55% $ 13,143.0
Critical access hospitals 558 1,321 42 291.9
Psychiatric hospitals 174 494 35 2,848.2
Long-term hospitals 34 443 8 62.0
Rehabilitation hospitals 35 228 15 10.6
Children's hospitals 51 88 58 291.9
Hospital ownership
For-profit 447 1,683 27 682.7
Non-profit 1,521 2,973 51 5,253.8
Public 775 1,344 58 10,711.1
Total 2,743 6,000 46% $ 16,647.6
Notes: DSH is disproportionate share hospital. SPRY is state plan rate year. Total DSH spending includes state and federal funds. Excludes 90 DSH hospitals that did not submit 2011 Medicare cost reports.
Source: MACPAC 2015 analysis of 2011 Medicare cost reports and 2011 as-filed Medicaid DSH audits.
March 201610
Chapter 1: Overview of Medicaid Policy on Disproportionate Share Hospital Payments
Relationship of Medicaid DSH payments to Medicare DSH paymentsMany Medicaid DSH hospitals also receive Medicare DSH payments, which totaled approximately $12.1 billion in 2013 (CMS 2015a). Unlike Medicaid DSH payments, which vary by state, Medicare DSH payments are based on a standard national formula. Historically, Medicare DSH payments were based solely on a hospital’s Medicaid and Supplemental Security Income (SSI) patient utilization, but beginning in 2014, the ACA required that most Medicare DSH payments be
based on a hospital’s uncompensated care relative to other Medicare DSH hospitals. In addition, the ACA linked the total amount of funding for Medicare DSH payments to the uninsured rate. As a result, Medicare DSH payments are projected to decrease to $9.8 billion in 2016 (CMS 2015a).
Medicare also makes other types of payment adjustments to hospitals; although these adjustments are not directly related to uncompensated care, they still affect a hospital’s overall financial viability. For example, in 2013, Medicare made $5.8 billion in indirect medical
FIGURE 1-2. Share of Hospitals Receiving DSH Payments by State, SPRY 2011
41%
45%
74%
84%
7%
35%
10%
55%39%
NH: 90%
MA: 0%1
VT: 87%
88%
28%
CT: 81%NJ: 81%
DE: 8%MD: 34%
RI: 93%
46%
19%
78%
79%
31%
29%
75%44%
40%4%
30%
28%
2%
74%
42%
DC: 62%
40%
64%
66%39%
77%
13%
40%
10%
70%
82%
88%
90%
87%
29%
23%
2%
Less than 20% 20%–39% Greater than 80% 60%–79%40%–59%
Notes: DSH is disproportionate share hospital. SPRY is state plan rate year.1 Massachusetts does not make DSH payments because its Section 1115 demonstration allows the state to use DSH funding for the state’s safety-net care pool instead.
Source: MACPAC 2015 analysis of 2011 Medicare cost reports and 2011 as-filed Medicaid DSH audits.
Report to Congress on Medicaid and CHIP 11
Chapter 1: Overview of Medicaid Policy on Disproportionate Share Hospital Payments
FIGURE 1-3. Distribution of DSH Spending on Hospitals by Decile of Medicaid and Low-Income Utilization, 2011
0%
5%
10%
15%
20%
25%
30%
35%
40%
45%
Lowestdecile
2nd
DSH spending, by Medicaid inpatient utilization decile
DSH spending, by low-income utilization decile
1% 2% 2%5%
3rd
4% 5%
4th
5%7%
5th
5%8%
6th
8% 7%
7th
9%6%
8th
9%10%
9th
16%
10%
Highestdecile
41%40%
Notes: DSH is disproportionate share hospital. Excludes psychiatric hospitals. Medicaid inpatient utilization rates in this analysis exclude services provided to dually eligible and other Medicaid enrollees for which Medicaid was not the primary payer, which are part of the definition of Medicaid inpatient utilization used for Medicaid DSH purposes. Low-income utilization includes services provided to Medicaid and uninsured patients (as measured by charity care charges).
Source: MACPAC 2015 analysis of 2011 Medicare cost reports and 2011 as-filed Medicaid DSH audits.
TABLE 1-2. Selected Supplemental Funding and Other Support for Hospitals, 2013 (billions)
Type of supportFederal
spendingState
spendingOther
support
Proportion of U.S. hospitals receiving funding (estimate)
MedicaidMedicaid DSH payments $ 9.3 $ 7.1 – 48%Non-DSH supplemental payments1 12.0 8.6 – –2
MedicareMedicare DSH payments3 12.1 – – 44Other supportNon-profit tax exemptions4 (federal, state, and local) – – 24.6 49
Total $ 33.4 $ 15.7 $ 24.6 –
Notes: DSH is disproportionate share hospital. 1 Medicaid non-DSH supplemental payments include upper payment limit payments, Section 1115 waiver supplemental payments, and graduate medical education payments.2 In 2010, two-thirds of DSH hospitals received a total of $9.4 billion in non-DSH supplemental payments. Data are not available for 2013.3 Beginning in 2014, Medicare DSH payments were reduced based on the expectation of a decline in the uninsured rate. In 2016, Medicare DSH payments are expected to total $9.8 billion.4 Data on non-profit tax exemptions are from 2011.
– Dash means data not available or not applicable.
Sources: MACPAC 2014, CMS 2015a, Rosenbaum et al. 2015.
March 201612
Chapter 1: Overview of Medicaid Policy on Disproportionate Share Hospital Payments
education payments to offset the higher costs of care of teaching hospitals. In addition, critical access hospitals, which are not eligible for Medicare DSH payments, receive higher base Medicare payment rates to offset their operating costs (MedPAC 2015).11 Medicare also includes adjustments related to hospital uncompensated care in its pricing for Medicare Advantage plans, and there is some evidence to suggest that Medicare Advantage plans may pass these higher rates on to hospitals (Berenson et al. 2015).
Other types of support for hospitalsIn addition to direct supplemental payments, some hospitals also receive other types of support, such as special payment rates or tax breaks. In 2013, eligible entities that qualified for the 340b
drug discount program (entities which include but are not limited to non-profit and government hospitals that serve a high proportion of Medicaid and low-income Medicare patients) received an estimated $3.8 billion in discounts from drug manufacturers (MedPAC 2015). In 2011, non-profit hospitals received indirect tax benefits estimated at $24.6 billion (Rosenbaum et al. 2015). Non-profit hospitals are required to report community benefit spending to the Internal Revenue Service in order to maintain their non-profit status, but there is no required level of community benefit spending. Government-owned public hospitals are also exempt from many federal, state, and local taxes, but we do not have data on the amount of indirect tax benefits that they receive.
TABLE 1-3. Characteristics of and Spending by Deemed and Non-Deemed DSH Hospitals, SPRY 2011
Hospital characteristics
DSH hospitals DSH spending
Number of hospitals
Deemed as percent of
total
Total spending (millions)
Deemed as percent of
total
Deemed DSH
hospitalsAll DSH
hospitals
Deemed DSH
hospitalsAll DSH
hospitalsHospital type
Short-term acute care hospitals 472 1,891 25% $ 7,622.8 $ 13,143.0 58%
Critical access hospitals 112 558 20 86.4 291.9 30
Psychiatric hospitals 139 174 80 2,558.3 2,848.2 90
Long-term hospitals 19 34 56 45.1 62.0 73
Rehabilitation hospitals 6 35 17 1.6 10.6 15
Children's hospitals 50 51 98 291.8 291.9 100
Hospital ownership
For-profit 137 447 31 254.3 682.7 37
Non-profit 368 1,521 24 1,917.0 5,253.8 36
Public 293 775 38 8,434.7 10,711.1 79
Total 798 2,743 29% $ 10,606.0 $ 16,647.6 64%
Notes: DSH is disproportionate share hospital. SPRY is state plan rate year. Excludes 90 hospitals that did not submit 2011 Medicare cost reports. Deemed DSH status was estimated based on available Medicaid and low-income utilization data. For further discussion of the methodology and limitations, see Appendix 3A.
Source: MACPAC 2015 analysis of 2011 Medicare cost reports and 2011 as-filed Medicaid DSH audits.
Report to Congress on Medicaid and CHIP 13
Chapter 1: Overview of Medicaid Policy on Disproportionate Share Hospital Payments
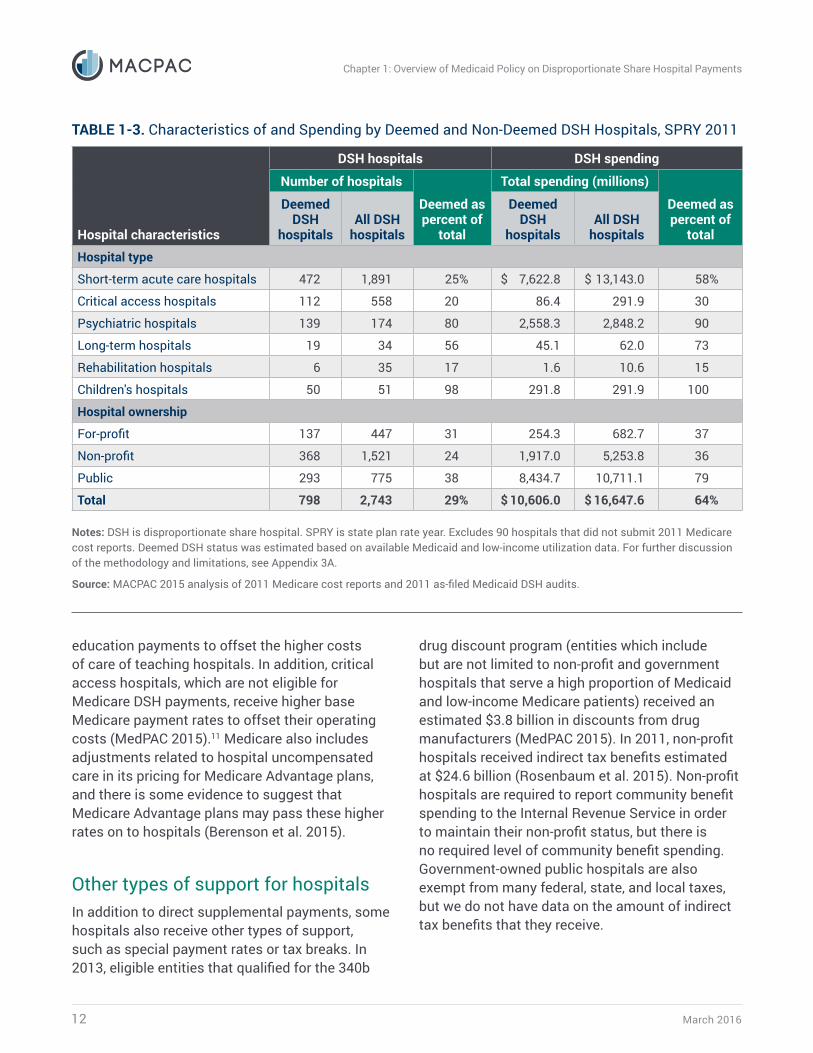
Deemed DSH Hospital CharacteristicsIn 2011, about 29 percent of DSH hospitals were deemed DSH hospitals, meaning that they were statutorily required to receive DSH payments. The amount of DSH funding that deemed DSH hospitals receive is not specified in statute, but deemed DSH hospitals received the majority of DSH payments in 2011 (Table 1-3). Based on our analysis, deemed DSH hospitals accounted for nearly one-third of DSH hospitals, and most of the psychiatric, long-term, and children’s hospitals that received DSH payments in 2011 qualified as deemed DSH hospitals. Although non-deemed DSH hospitals meet the minimum statutory requirements to qualify for receiving DSH payments, they are not statutorily required to receive them. In 2011, 36 percent of DSH payments were made to non-deemed DSH hospitals.
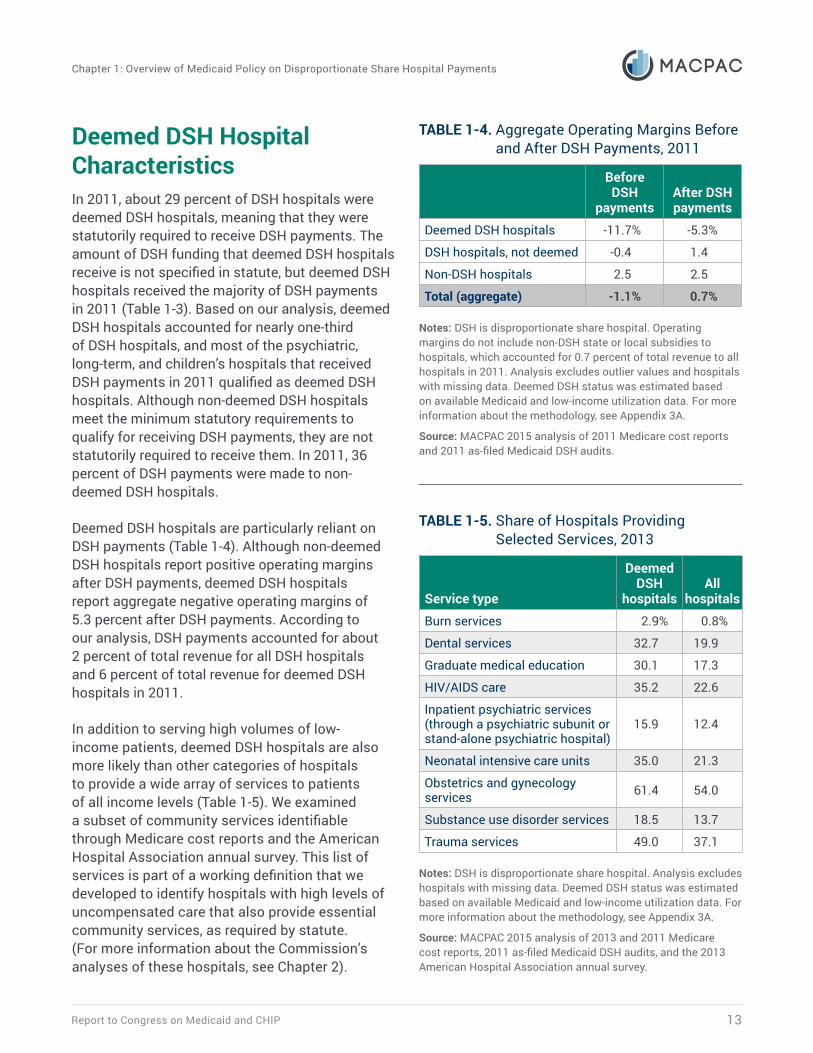
Deemed DSH hospitals are particularly reliant on DSH payments (Table 1-4). Although non-deemed DSH hospitals report positive operating margins after DSH payments, deemed DSH hospitals report aggregate negative operating margins of 5.3 percent after DSH payments. According to our analysis, DSH payments accounted for about 2 percent of total revenue for all DSH hospitals and 6 percent of total revenue for deemed DSH hospitals in 2011.
In addition to serving high volumes of low-income patients, deemed DSH hospitals are also more likely than other categories of hospitals to provide a wide array of services to patients of all income levels (Table 1-5). We examined a subset of community services identifiable through Medicare cost reports and the American Hospital Association annual survey. This list of services is part of a working definition that we developed to identify hospitals with high levels of uncompensated care that also provide essential community services, as required by statute. (For more information about the Commission’s analyses of these hospitals, see Chapter 2).
TABLE 1-4. Aggregate Operating Margins Before and After DSH Payments, 2011
Before DSH
paymentsAfter DSH payments
Deemed DSH hospitals -11.7% -5.3%
DSH hospitals, not deemed -0.4 1.4
Non-DSH hospitals 2.5 2.5
Total (aggregate) -1.1% 0.7%
Notes: DSH is disproportionate share hospital. Operating margins do not include non-DSH state or local subsidies to hospitals, which accounted for 0.7 percent of total revenue to all hospitals in 2011. Analysis excludes outlier values and hospitals with missing data. Deemed DSH status was estimated based on available Medicaid and low-income utilization data. For more information about the methodology, see Appendix 3A.
Source: MACPAC 2015 analysis of 2011 Medicare cost reports and 2011 as-filed Medicaid DSH audits.
TABLE 1-5. Share of Hospitals Providing Selected Services, 2013
Service type
Deemed DSH
hospitalsAll
hospitalsBurn services 2.9% 0.8%
Dental services 32.7 19.9
Graduate medical education 30.1 17.3
HIV/AIDS care 35.2 22.6
Inpatient psychiatric services (through a psychiatric subunit or stand-alone psychiatric hospital)
15.9 12.4
Neonatal intensive care units 35.0 21.3
Obstetrics and gynecology services 61.4 54.0
Substance use disorder services 18.5 13.7
Trauma services 49.0 37.1
Notes: DSH is disproportionate share hospital. Analysis excludes hospitals with missing data. Deemed DSH status was estimated based on available Medicaid and low-income utilization data. For more information about the methodology, see Appendix 3A.
Source: MACPAC 2015 analysis of 2013 and 2011 Medicare cost reports, 2011 as-filed Medicaid DSH audits, and the 2013 American Hospital Association annual survey.

March 201614
Chapter 1: Overview of Medicaid Policy on Disproportionate Share Hospital Payments
Medicaid DSH Allotment Reductions Under the ACA, Congress established a schedule for reducing federal DSH allotments to account for an anticipated decrease in uncompensated care expected to occur as a result of the increased number of people with insurance due to Medicaid expansions and the availability of subsidized exchanged coverage. These reductions have since been delayed five times. Originally set to take effect beginning in FY 2014, the reductions are now scheduled to begin in FY 2018 in the following annual amounts:
• $2.0 billion in FY 2018;
• $3.0 billion in FY 2019;
• $4.0 billion in FY 2020;
• $5.0 billion in FY 2021;
• $6.0 billion in FY 2022;
• $7.0 billion in FY 2023;
• $8.0 billion in FY 2024; and
• $8.0 billion in FY 2025.
Congress directed CMS to develop a reduction methodology in such a way as to encourage better targeting of DSH payments across states. Specifically, CMS is required to apply greater DSH reductions to states that have historically high DSH payments and lower percentages of uninsured individuals. In addition, the reduction methodology is intended to reward states that target DSH payments towards hospitals with high levels of uncompensated care and hospitals that serve high volumes of Medicaid patients.
Before the implementation of DSH allotment reductions was delayed, CMS developed a reduction methodology for FYs 2014 and 2015, which we describe and model in Chapter 2. CMS has not yet proposed a reduction methodology
for FY 2018, but CMS has noted that it will be evaluating the implications of state decisions to expand Medicaid coverage and will consider options to account for state coverage decisions in its methodology (CMS 2013).
Report to Congress on Medicaid and CHIP 15
Chapter 1: Overview of Medicaid Policy on Disproportionate Share Hospital Payments
Endnotes1 Fixed allotments were intended to continue through FY 2002, but the Medicare, Medicaid, and SCHIP Benefits Improvement and Protection Act of 2000 (P.L. 106-554) ended them after FY 2000.
2 The methodology described here applies to most states, although there are some exceptions. Hawaii and Tennessee each have specific methodologies outlined in the Medicaid statute. In addition, each state’s federal DSH allotment can be no more than 12 percent of its total Medicaid medical assistance expenditures (state and federal funds combined) during the fiscal year (§ 1923(f)(3)(B) of the Act).
3 Total annual uncompensated care costs are defined in federal regulation as “the total cost of care for furnishing inpatient hospital and outpatient hospital services to Medicaid eligible individuals and to individuals with no source of third party coverage for the hospital services they receive less the sum of regular Medicaid FFS [fee-for-service] rate payments, Medicaid managed care organization payments, supplemental or enhanced Medicaid payments, uninsured revenues, and Section 1011 payments for inpatient and outpatient hospital services” (42 CFR 447.299).
4 For California public hospitals, the limit is 175 percent of uncompensated costs.
5 In a 1994 letter to state Medicaid directors, the Centers for Medicare & Medicaid Services (then the Health Care Financing Administration) instructed states that the cost of “hospital services” includes both inpatient and outpatient hospital costs (HCFA 1994). However, physician services provided by a hospital and hospital-based clinic services are not included in the calculation of the hospital-specific limit (CMS 2008).
6 Medicaid state plan rate year means the 12-month period defined by a state’s approved Medicaid state plan in which the state estimates eligible uncompensated care costs and determines corresponding DSH payments as well as all other Medicaid payment rates. The period usually corresponds to the state’s fiscal year or the federal fiscal year but it does not have to; it can correspond to any 12-month period defined by the state (42 CFR 455.301).
7 Deemed DSH hospitals must meet the minimum requirements for DSH hospitals: a Medicaid inpatient utilization rate of at least 1 percent and (with limited exceptions) at least two obstetricians with staff privileges that treat Medicaid enrollees (§ 1923(d) of the Act).
8 Two of the four states with the largest unspent DSH allotments use their DSH allotments for coverage expansions through a Section 1115 demonstration. In the other two states, DSH allotments appear to exceed the total amount of uncompensated care for low-income patients in the state, which may explain why amounts are not spent.
9 For example, aggregate Medicaid fee-for-service payments to hospitals cannot exceed what Medicare would have paid for these services; this is referred to as the upper payment limit (UPL).
10 Non-DSH supplemental payments also include graduate medical education (GME) payments and supplemental payments authorized through Section 1115 waiver expenditure authority. In FY 2014, 49 percent of non-DSH supplemental payments were made through UPL payments, 44 percent were made through Section 1115 expenditure authority, and 7 percent were made through GME (MACPAC 2015). More background information on Medicaid supplemental payments can be found in Chapter 6 of MACPAC’s March 2014 report to Congress.
11 Specifically, Medicare pays critical access hospitals 101 percent of reasonable costs for most inpatient and outpatient services.
ReferencesBerenson, R., J. Sunshine, D. Helms, and E. Lawton. 2015. Why Medicare Advantage plans pay hospitals traditional Medicare prices. Health Affairs 34, no. 8: 1289–1295. http://content.healthaffairs.org/content/34/8/1289.abstract.
Centers for Medicare & Medicaid Services (CMS), U.S. Department of Health and Human Services. 2015a. Medicare program: Hospital inpatient prospective payment systems for acute care hospitals and the long-term care hospital prospective payment system policy changes and fiscal year 2016 rates; revisions of quality reporting requirements for specific providers, including
March 201616
Chapter 1: Overview of Medicaid Policy on Disproportionate Share Hospital Payments
changes related to the electronic health record incentive program; extensions of the Medicare-dependent, small rural hospital program and the low-volume payment adjustment for hospitals. Final rule. Federal Register 80, no. 158 (August 17): 49325–49886. https://federalregister.gov/a/2015-19049.
Centers for Medicare & Medicaid Services (CMS), U.S. Department of Health and Human Services. 2015b. Medicaid and Children’s Health Insurance Program (CHIP) programs: Medicaid managed care, CHIP delivered in managed care, Medicaid and CHIP comprehensive quality strategies, and revisions related to third party liability. Proposed rule. Federal Register 80, no. 104 (June 1): 31097–31297. https://federalregister.gov/a/2015-12965.
Centers for Medicare & Medicaid Services (CMS), U.S. Department of Health and Human Services. 2014. Medicaid program: Preliminary disproportionate share hospital allotments (DSH) for fiscal year (FY) 2014 and the preliminary institutions for mental diseases disproportionate share hospital limits for FY 2014. Notice. Federal Register 79, no. 40 (February 28): 11436–11445. https://federalregister.gov/a/2014-04032.
Centers for Medicare & Medicaid Services (CMS), U.S. Department of Health and Human Services. 2013. Medicaid program: State disproportionate share hospital allotment reductions. Final rule. Federal Register 78, no. 181 (September 18): 57293–57313. https://federalregister.gov/a/2013-22686.
Centers for Medicare & Medicaid Services (CMS), U.S. Department of Health and Human Services. 2008. Medicaid program: Disproportionate share hospital payments. Final rule. Federal Register 73, no. 245 (December 19): 77904–77952. https://federalregister.gov/a/E8-30000.
Health Care Financing Administration (HCFA), U.S. Department of Health and Human Services. 1994. Letter from Sally K. Richardson to state Medicaid directors regarding “Summary of OBRA 93 DSH limit requirements.” August 17, 1994. http://downloads.cms.gov/cmsgov/archived-downloads/SMDL/downloads/SMD081794.pdf.
Holahan, J., B.K. Bruen, and D. Liska. 1998. The decline in Medicaid spending growth in 1996: Why did it happen? Washington, DC: The Urban Institute. http://webarchive.urban.org/UploadedPDF/410365.pdf.
Matherlee, K. 2002. The federal-state struggle over Medicaid matching funds: An update. Washington, DC: National Health Policy Forum. http://www.nhpf.org/library/background-papers/BP_UPL_5-02.pdf.
Medicaid and CHIP Payment and Access Commission (MACPAC). 2015. MACPAC analysis of CMS-64 FMR net expenditure data as of February 25, 2015, and CMS-64 Schedule C waiver report data as of August 18, 2015.
Medicaid and CHIP Payment and Access Commission (MACPAC). 2014. Report to the Congress on Medicaid and CHIP. March 2014. Washington, DC: MACPAC. https://www.macpac.gov/publication/report-to-the-congress-on-medicaid-and-chip-314.
Medicare Payment Advisory Commission (MedPAC). 2015. Report to the Congress: Overview of the 340B drug pricing program. Washington, DC: MedPAC. http://www.medpac.gov/documents/reports/may-2015-report-to-the-congress-overview-of-the-340b-drug-pricing-program.pdf.
Rosenbaum, S., D. Kindig, J. Bao, et al. 2015. The value of the nonprofit hospital tax exemption was $24.6 billion in 2011. Health Affairs 34, no. 7 (published online June 17): 1225–1223. http://content.healthaffairs.org/content/early/2015/06/18/hlthaff.2014.1424.
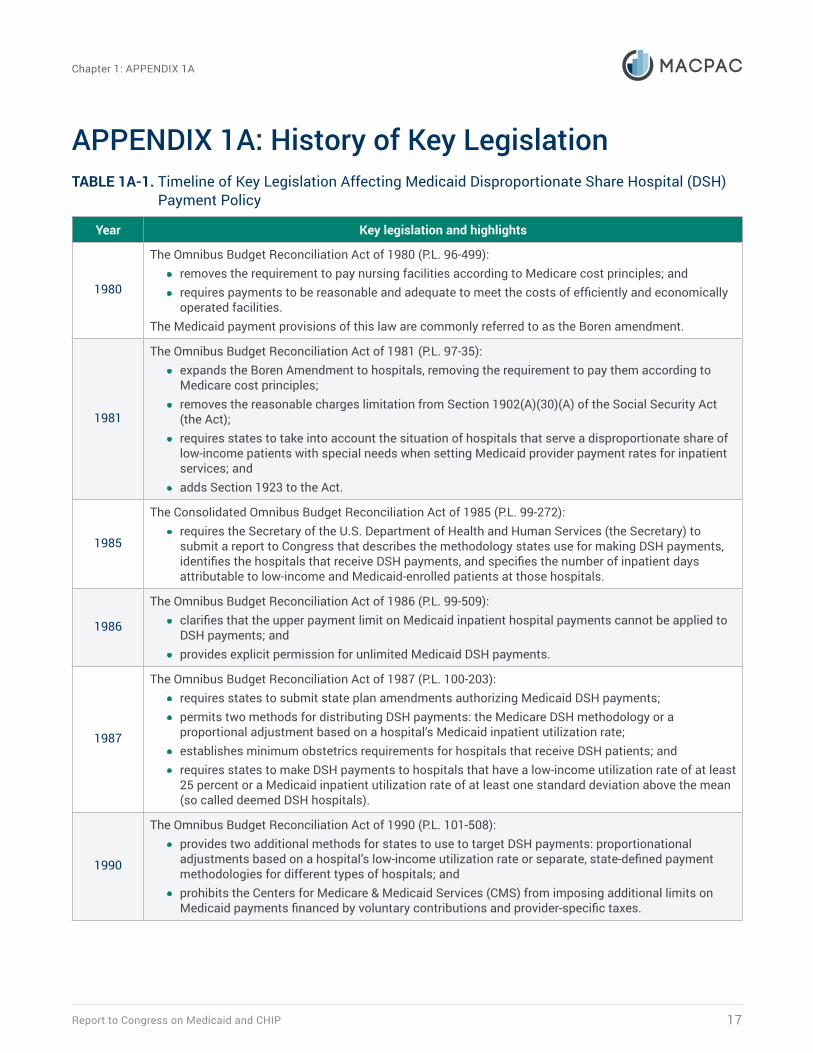
Report to Congress on Medicaid and CHIP 17
Chapter 1: APPENDIX 1A
APPENDIX 1A: History of Key LegislationTABLE 1A-1. Timeline of Key Legislation Affecting Medicaid Disproportionate Share Hospital (DSH)
Payment Policy
Year Key legislation and highlights
1980
The Omnibus Budget Reconciliation Act of 1980 (P.L. 96-499):• removes the requirement to pay nursing facilities according to Medicare cost principles; and• requires payments to be reasonable and adequate to meet the costs of efficiently and economically
operated facilities.The Medicaid payment provisions of this law are commonly referred to as the Boren amendment.
1981
The Omnibus Budget Reconciliation Act of 1981 (P.L. 97-35): • expands the Boren Amendment to hospitals, removing the requirement to pay them according to
Medicare cost principles; • removes the reasonable charges limitation from Section 1902(A)(30)(A) of the Social Security Act
(the Act);• requires states to take into account the situation of hospitals that serve a disproportionate share of
low-income patients with special needs when setting Medicaid provider payment rates for inpatient services; and
• adds Section 1923 to the Act.
1985
The Consolidated Omnibus Budget Reconciliation Act of 1985 (P.L. 99-272):• requires the Secretary of the U.S. Department of Health and Human Services (the Secretary) to
submit a report to Congress that describes the methodology states use for making DSH payments, identifies the hospitals that receive DSH payments, and specifies the number of inpatient days attributable to low-income and Medicaid-enrolled patients at those hospitals.
1986
The Omnibus Budget Reconciliation Act of 1986 (P.L. 99-509):• clarifies that the upper payment limit on Medicaid inpatient hospital payments cannot be applied to
DSH payments; and• provides explicit permission for unlimited Medicaid DSH payments.
1987
The Omnibus Budget Reconciliation Act of 1987 (P.L. 100-203):• requires states to submit state plan amendments authorizing Medicaid DSH payments; • permits two methods for distributing DSH payments: the Medicare DSH methodology or a
proportional adjustment based on a hospital’s Medicaid inpatient utilization rate; • establishes minimum obstetrics requirements for hospitals that receive DSH patients; and • requires states to make DSH payments to hospitals that have a low-income utilization rate of at least
25 percent or a Medicaid inpatient utilization rate of at least one standard deviation above the mean (so called deemed DSH hospitals).
1990
The Omnibus Budget Reconciliation Act of 1990 (P.L. 101-508):• provides two additional methods for states to use to target DSH payments: proportionational
adjustments based on a hospital’s low-income utilization rate or separate, state-defined payment methodologies for different types of hospitals; and
• prohibits the Centers for Medicare & Medicaid Services (CMS) from imposing additional limits on Medicaid payments financed by voluntary contributions and provider-specific taxes.
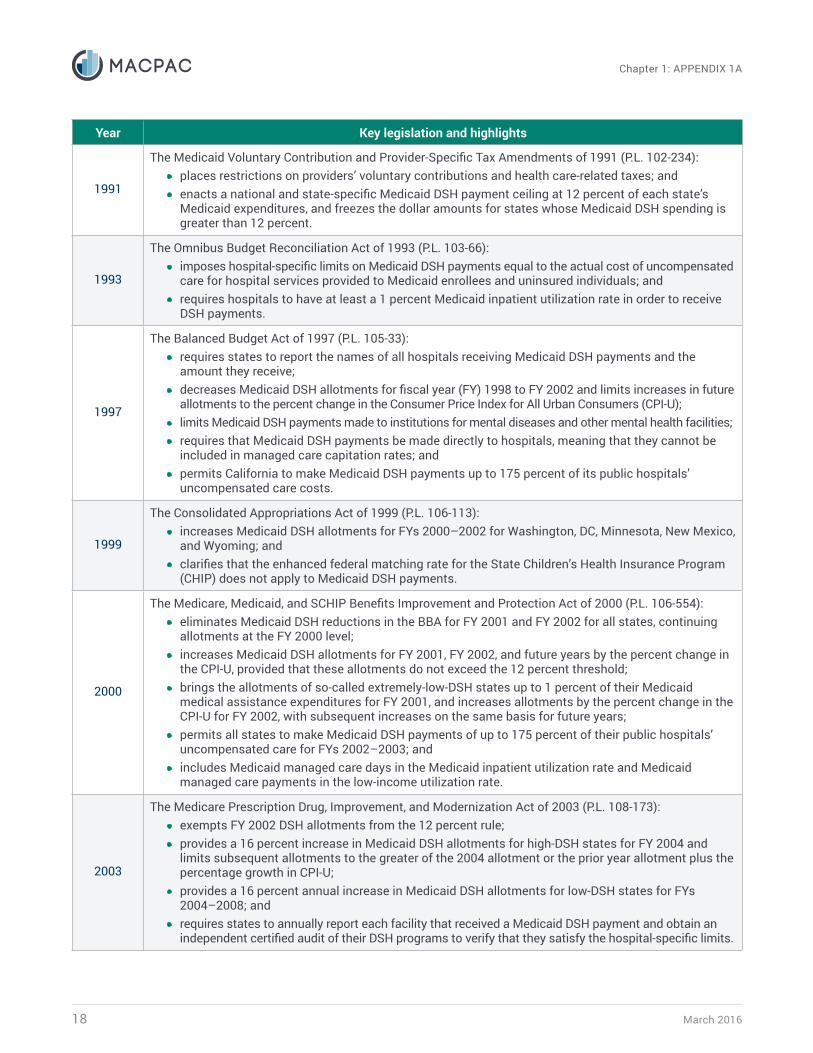
March 201618
Chapter 1: APPENDIX 1A
Year Key legislation and highlights
1991
The Medicaid Voluntary Contribution and Provider-Specific Tax Amendments of 1991 (P.L. 102-234):• places restrictions on providers’ voluntary contributions and health care-related taxes; and • enacts a national and state-specific Medicaid DSH payment ceiling at 12 percent of each state’s
Medicaid expenditures, and freezes the dollar amounts for states whose Medicaid DSH spending is greater than 12 percent.
1993
The Omnibus Budget Reconciliation Act of 1993 (P.L. 103-66): • imposes hospital-specific limits on Medicaid DSH payments equal to the actual cost of uncompensated
care for hospital services provided to Medicaid enrollees and uninsured individuals; and • requires hospitals to have at least a 1 percent Medicaid inpatient utilization rate in order to receive
DSH payments.
1997
The Balanced Budget Act of 1997 (P.L. 105-33):• requires states to report the names of all hospitals receiving Medicaid DSH payments and the
amount they receive; • decreases Medicaid DSH allotments for fiscal year (FY) 1998 to FY 2002 and limits increases in future
allotments to the percent change in the Consumer Price Index for All Urban Consumers (CPI-U); • limits Medicaid DSH payments made to institutions for mental diseases and other mental health facilities; • requires that Medicaid DSH payments be made directly to hospitals, meaning that they cannot be
included in managed care capitation rates; and • permits California to make Medicaid DSH payments up to 175 percent of its public hospitals’
uncompensated care costs.
1999
The Consolidated Appropriations Act of 1999 (P.L. 106-113):• increases Medicaid DSH allotments for FYs 2000–2002 for Washington, DC, Minnesota, New Mexico,
and Wyoming; and• clarifies that the enhanced federal matching rate for the State Children’s Health Insurance Program
(CHIP) does not apply to Medicaid DSH payments.
2000
The Medicare, Medicaid, and SCHIP Benefits Improvement and Protection Act of 2000 (P.L. 106-554): • eliminates Medicaid DSH reductions in the BBA for FY 2001 and FY 2002 for all states, continuing
allotments at the FY 2000 level;• increases Medicaid DSH allotments for FY 2001, FY 2002, and future years by the percent change in
the CPI-U, provided that these allotments do not exceed the 12 percent threshold; • brings the allotments of so-called extremely-low-DSH states up to 1 percent of their Medicaid
medical assistance expenditures for FY 2001, and increases allotments by the percent change in the CPI-U for FY 2002, with subsequent increases on the same basis for future years;
• permits all states to make Medicaid DSH payments of up to 175 percent of their public hospitals’ uncompensated care for FYs 2002–2003; and
• includes Medicaid managed care days in the Medicaid inpatient utilization rate and Medicaid managed care payments in the low-income utilization rate.
2003
The Medicare Prescription Drug, Improvement, and Modernization Act of 2003 (P.L. 108-173):• exempts FY 2002 DSH allotments from the 12 percent rule; • provides a 16 percent increase in Medicaid DSH allotments for high-DSH states for FY 2004 and
limits subsequent allotments to the greater of the 2004 allotment or the prior year allotment plus the percentage growth in CPI-U;
• provides a 16 percent annual increase in Medicaid DSH allotments for low-DSH states for FYs 2004–2008; and
• requires states to annually report each facility that received a Medicaid DSH payment and obtain an independent certified audit of their DSH programs to verify that they satisfy the hospital-specific limits.
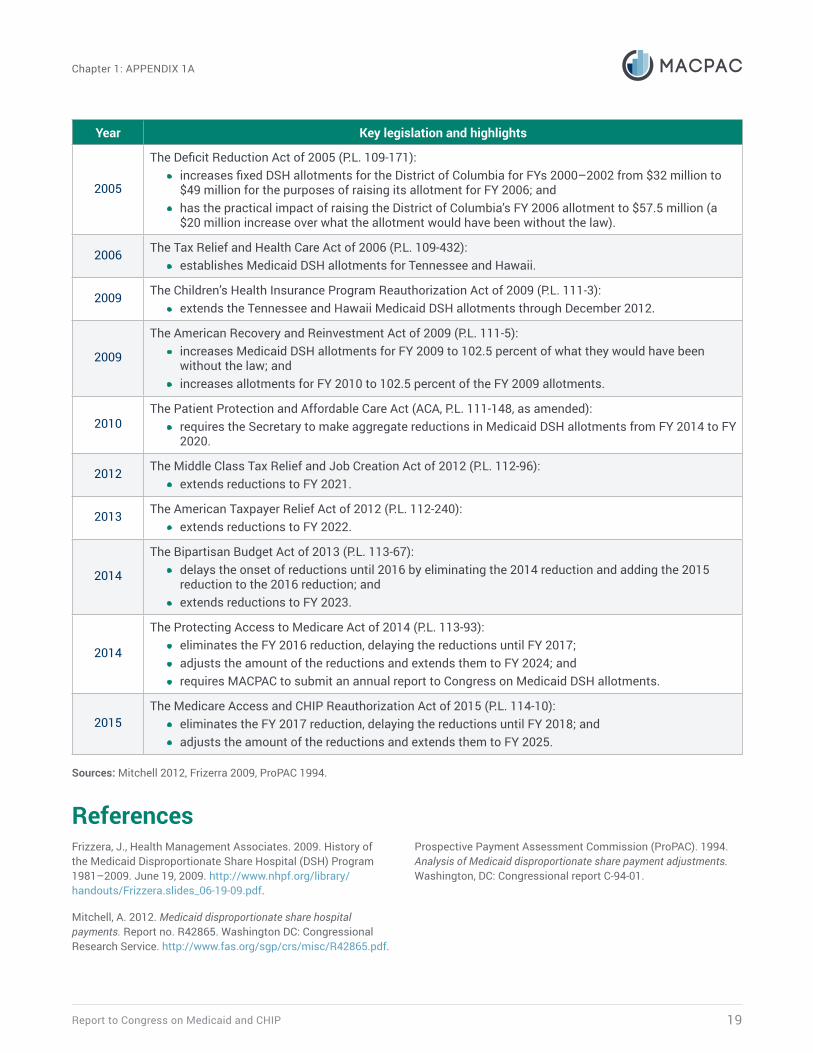
Report to Congress on Medicaid and CHIP 19
Chapter 1: APPENDIX 1A
Year Key legislation and highlights
2005
The Deficit Reduction Act of 2005 (P.L. 109-171):• increases fixed DSH allotments for the District of Columbia for FYs 2000–2002 from $32 million to
$49 million for the purposes of raising its allotment for FY 2006; and • has the practical impact of raising the District of Columbia’s FY 2006 allotment to $57.5 million (a
$20 million increase over what the allotment would have been without the law).
2006 The Tax Relief and Health Care Act of 2006 (P.L. 109-432):• establishes Medicaid DSH allotments for Tennessee and Hawaii.
2009 The Children’s Health Insurance Program Reauthorization Act of 2009 (P.L. 111-3):• extends the Tennessee and Hawaii Medicaid DSH allotments through December 2012.
2009
The American Recovery and Reinvestment Act of 2009 (P.L. 111-5):• increases Medicaid DSH allotments for FY 2009 to 102.5 percent of what they would have been
without the law; and • increases allotments for FY 2010 to 102.5 percent of the FY 2009 allotments.
2010The Patient Protection and Affordable Care Act (ACA, P.L. 111-148, as amended):
• requires the Secretary to make aggregate reductions in Medicaid DSH allotments from FY 2014 to FY 2020.
2012 The Middle Class Tax Relief and Job Creation Act of 2012 (P.L. 112-96):• extends reductions to FY 2021.
2013 The American Taxpayer Relief Act of 2012 (P.L. 112-240):• extends reductions to FY 2022.
2014
The Bipartisan Budget Act of 2013 (P.L. 113-67):• delays the onset of reductions until 2016 by eliminating the 2014 reduction and adding the 2015
reduction to the 2016 reduction; and • extends reductions to FY 2023.
2014
The Protecting Access to Medicare Act of 2014 (P.L. 113-93):• eliminates the FY 2016 reduction, delaying the reductions until FY 2017; • adjusts the amount of the reductions and extends them to FY 2024; and• requires MACPAC to submit an annual report to Congress on Medicaid DSH allotments.
2015The Medicare Access and CHIP Reauthorization Act of 2015 (P.L. 114-10):
• eliminates the FY 2017 reduction, delaying the reductions until FY 2018; and • adjusts the amount of the reductions and extends them to FY 2025.
Sources: Mitchell 2012, Frizerra 2009, ProPAC 1994.
ReferencesFrizzera, J., Health Management Associates. 2009. History of the Medicaid Disproportionate Share Hospital (DSH) Program 1981–2009. June 19, 2009. http://www.nhpf.org/library/handouts/Frizzera.slides_06-19-09.pdf.
Mitchell, A. 2012. Medicaid disproportionate share hospital payments. Report no. R42865. Washington DC: Congressional Research Service. http://www.fas.org/sgp/crs/misc/R42865.pdf.
Prospective Payment Assessment Commission (ProPAC). 1994. Analysis of Medicaid disproportionate share payment adjustments. Washington, DC: Congressional report C-94-01.

CHAPTER 2
Analysis of Current and Future Disproportionate Share Hospital Allotments
March 201622
Chapter 2: Analysis of Current and Future Disproportionate Share Hospital Allotments
Analysis of Current and Future Disproportionate Share Hospital Allotments
Key Points• The Commission finds little meaningful relationship between states’ disproportionate share
hospital (DSH) allotments and the three factors that Congress asked the Commission to study:
– the number of uninsured individuals;
– the amount and sources of hospitals’ uncompensated care costs; and
– the number of hospitals with high levels of uncompensated care that also provide access to essential community services for low-income, uninsured, and vulnerable populations.
• Early reports suggest that the coverage expansions under the Patient Protection and Affordable Care Act (ACA, P.L. 111-148, as amended) are improving hospital finances in general, but the ACA’s effects on hospitals that are particularly reliant on Medicaid DSH payments are not yet clear.
• The number of uninsured people declined in all states in 2014, with the largest declines in states that expanded Medicaid.
• Early reports also suggest that unpaid costs of care for the uninsured are declining in states that have expanded Medicaid. It is difficult to interpret these findings, however, because they do not include complete and timely data on hospital costs for Medicaid shortfall, which may increase with Medicaid expansion.
• Deemed DSH hospitals, which serve a higher share of low-income patients, are more likely to provide a range of primary and quaternary care services that are often not available at other hospitals. These hospitals also report more uncompensated care as a share of operating expenses than other DSH hospitals.
• Although DSH allotment reductions are required to account for state uninsured rates and factors related to state targeting of DSH payments to hospitals with high levels of uncompensated care, much of the current variation in state DSH allotments is projected to persist after DSH allotment reductions take effect in fiscal year (FY) 2018.
Report to Congress on Medicaid and CHIP 23
Chapter 2: Analysis of Current and Future Disproportionate Share Hospital Allotments
CHAPTER 2: Analysis of Current and Future Disproportionate Share Hospital Allotments Pending reductions to state disproportionate share hospital (DSH) allotments are premised in part on the assumption that increased hospital revenues from coverage expansions under the Patient Protection and Affordable Care Act (ACA, P.L. 111-148, as amended) will reduce uncompensated care and thus reduce the need for DSH payments to safety-net hospitals. Early reports suggest that the coverage expansions are improving hospital finances in general, but it is not yet clear how hospitals that are particularly reliant on Medicaid DSH payments are being affected. In addition, because post-2014 data on all sources of hospital uncompensated care (particularly Medicaid shortfall) are not yet available, it is too early to evaluate whether the size of pending DSH allotment reductions is appropriate.
In the Protecting Access to Medicare Act of 2014 (P.L. 113-93), Congress required MACPAC to report annually on Medicaid DSH allotments to better understand the effects of the ACA on hospitals and the relationship between state DSH allotments and several potential indicators of their need for DSH funds. This chapter provides the specific data and analyses that Congress requested and that we have been able to obtain including:
• changes in the number of uninsured individuals;
• the amount and sources of hospitals’ uncompensated care costs;
• the number of hospitals with high levels of uncompensated care that also provide
access to essential community services for low-income, uninsured, and vulnerable populations; and,
• the relationship between state DSH allotments and each of these factors.
The first three sections of the chapter describe what we know about the indicators that Congress specified. First we provide data on the number of uninsured individuals and the extent to which uninsured rates are declining under the ACA. We then describe the types and amounts of hospital uncompensated care, preliminary evidence on how these numbers are changing, and limits in our ability to draw conclusions. We also describe our initial approach to identifying hospitals with high levels of uncompensated care that also provide essential community services.
In the fourth section, we discuss current and projected state DSH allotments and the relationship of these allotments to the indicators above. Because states’ allotments are based primarily on historical spending, rather than an objective measure of their need for DSH payments, we do not find any meaningful relationships.
We close with a discussion of the effects that DSH allotment reductions may have on DSH payments to hospitals as well as policy changes that states may consider in response. We also project DSH allotments and payments to hospitals under a scenario in which all states would expand Medicaid to non-elderly adults at or below 138 percent of the federal poverty level (FPL), because state decisions about whether to expand Medicaid coverage will have important implications for the number of uninsured individuals and state levels of uncompensated care.1
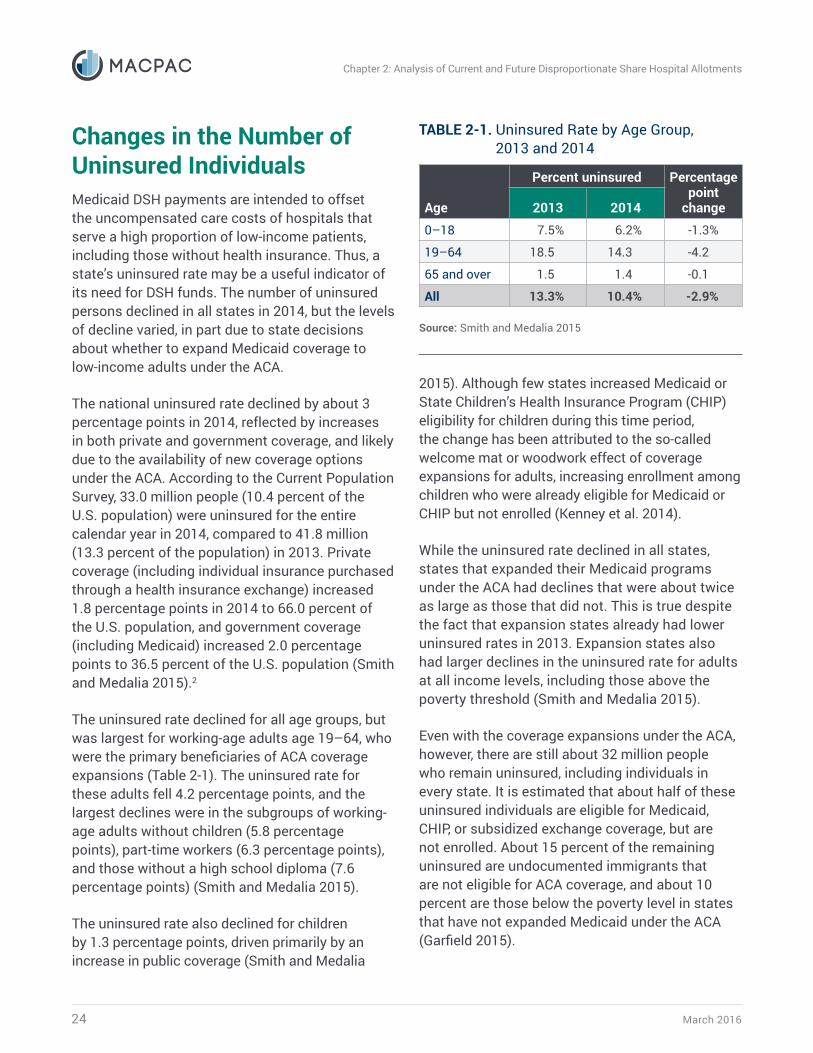
March 201624
Chapter 2: Analysis of Current and Future Disproportionate Share Hospital Allotments
Changes in the Number of Uninsured IndividualsMedicaid DSH payments are intended to offset the uncompensated care costs of hospitals that serve a high proportion of low-income patients, including those without health insurance. Thus, a state’s uninsured rate may be a useful indicator of its need for DSH funds. The number of uninsured persons declined in all states in 2014, but the levels of decline varied, in part due to state decisions about whether to expand Medicaid coverage to low-income adults under the ACA.
The national uninsured rate declined by about 3 percentage points in 2014, reflected by increases in both private and government coverage, and likely due to the availability of new coverage options under the ACA. According to the Current Population Survey, 33.0 million people (10.4 percent of the U.S. population) were uninsured for the entire calendar year in 2014, compared to 41.8 million (13.3 percent of the population) in 2013. Private coverage (including individual insurance purchased through a health insurance exchange) increased 1.8 percentage points in 2014 to 66.0 percent of the U.S. population, and government coverage (including Medicaid) increased 2.0 percentage points to 36.5 percent of the U.S. population (Smith and Medalia 2015).2
The uninsured rate declined for all age groups, but was largest for working-age adults age 19–64, who were the primary beneficiaries of ACA coverage expansions (Table 2-1). The uninsured rate for these adults fell 4.2 percentage points, and the largest declines were in the subgroups of working-age adults without children (5.8 percentage points), part-time workers (6.3 percentage points), and those without a high school diploma (7.6 percentage points) (Smith and Medalia 2015).
The uninsured rate also declined for children by 1.3 percentage points, driven primarily by an increase in public coverage (Smith and Medalia
2015). Although few states increased Medicaid or State Children’s Health Insurance Program (CHIP) eligibility for children during this time period, the change has been attributed to the so-called welcome mat or woodwork effect of coverage expansions for adults, increasing enrollment among children who were already eligible for Medicaid or CHIP but not enrolled (Kenney et al. 2014).
While the uninsured rate declined in all states, states that expanded their Medicaid programs under the ACA had declines that were about twice as large as those that did not. This is true despite the fact that expansion states already had lower uninsured rates in 2013. Expansion states also had larger declines in the uninsured rate for adults at all income levels, including those above the poverty threshold (Smith and Medalia 2015).
Even with the coverage expansions under the ACA, however, there are still about 32 million people who remain uninsured, including individuals in every state. It is estimated that about half of these uninsured individuals are eligible for Medicaid, CHIP, or subsidized exchange coverage, but are not enrolled. About 15 percent of the remaining uninsured are undocumented immigrants that are not eligible for ACA coverage, and about 10 percent are those below the poverty level in states that have not expanded Medicaid under the ACA (Garfield 2015).
TABLE 2-1. Uninsured Rate by Age Group, 2013 and 2014
Age
Percent uninsured Percentage point
change2013 20140–18 7.5% 6.2% -1.3%
19–64 18.5 14.3 -4.2
65 and over 1.5 1.4 -0.1
All 13.3% 10.4% -2.9%
Source: Smith and Medalia 2015
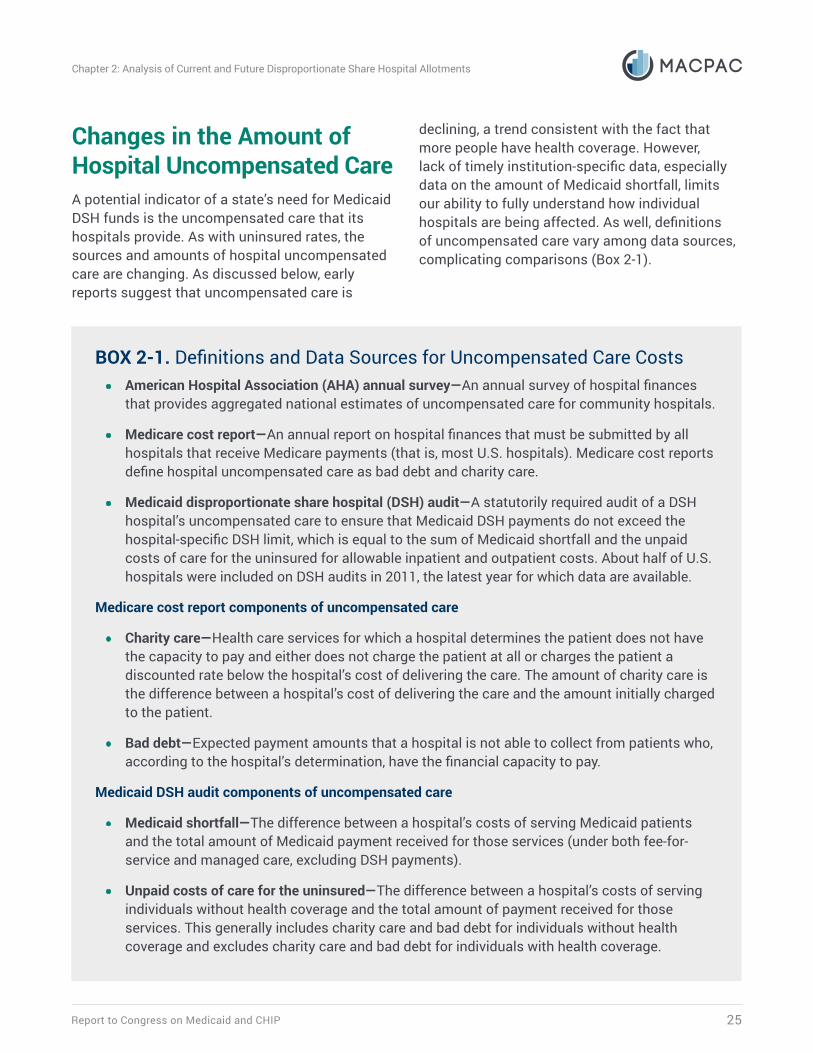
Report to Congress on Medicaid and CHIP 25
Chapter 2: Analysis of Current and Future Disproportionate Share Hospital Allotments
Changes in the Amount of Hospital Uncompensated CareA potential indicator of a state’s need for Medicaid DSH funds is the uncompensated care that its hospitals provide. As with uninsured rates, the sources and amounts of hospital uncompensated care are changing. As discussed below, early reports suggest that uncompensated care is
declining, a trend consistent with the fact that more people have health coverage. However, lack of timely institution-specific data, especially data on the amount of Medicaid shortfall, limits our ability to fully understand how individual hospitals are being affected. As well, definitions of uncompensated care vary among data sources, complicating comparisons (Box 2-1).
BOX 2-1. Definitions and Data Sources for Uncompensated Care Costs• American Hospital Association (AHA) annual survey—An annual survey of hospital finances
that provides aggregated national estimates of uncompensated care for community hospitals.
• Medicare cost report—An annual report on hospital finances that must be submitted by all hospitals that receive Medicare payments (that is, most U.S. hospitals). Medicare cost reports define hospital uncompensated care as bad debt and charity care.
• Medicaid disproportionate share hospital (DSH) audit—A statutorily required audit of a DSH hospital’s uncompensated care to ensure that Medicaid DSH payments do not exceed the hospital-specific DSH limit, which is equal to the sum of Medicaid shortfall and the unpaid costs of care for the uninsured for allowable inpatient and outpatient costs. About half of U.S. hospitals were included on DSH audits in 2011, the latest year for which data are available.
Medicare cost report components of uncompensated care
• Charity care—Health care services for which a hospital determines the patient does not have the capacity to pay and either does not charge the patient at all or charges the patient a discounted rate below the hospital’s cost of delivering the care. The amount of charity care is the difference between a hospital’s cost of delivering the care and the amount initially charged to the patient.
• Bad debt—Expected payment amounts that a hospital is not able to collect from patients who, according to the hospital’s determination, have the financial capacity to pay.
Medicaid DSH audit components of uncompensated care
• Medicaid shortfall—The difference between a hospital’s costs of serving Medicaid patients and the total amount of Medicaid payment received for those services (under both fee-for-service and managed care, excluding DSH payments).
• Unpaid costs of care for the uninsured—The difference between a hospital’s costs of serving individuals without health coverage and the total amount of payment received for those services. This generally includes charity care and bad debt for individuals without health coverage and excludes charity care and bad debt for individuals with health coverage.
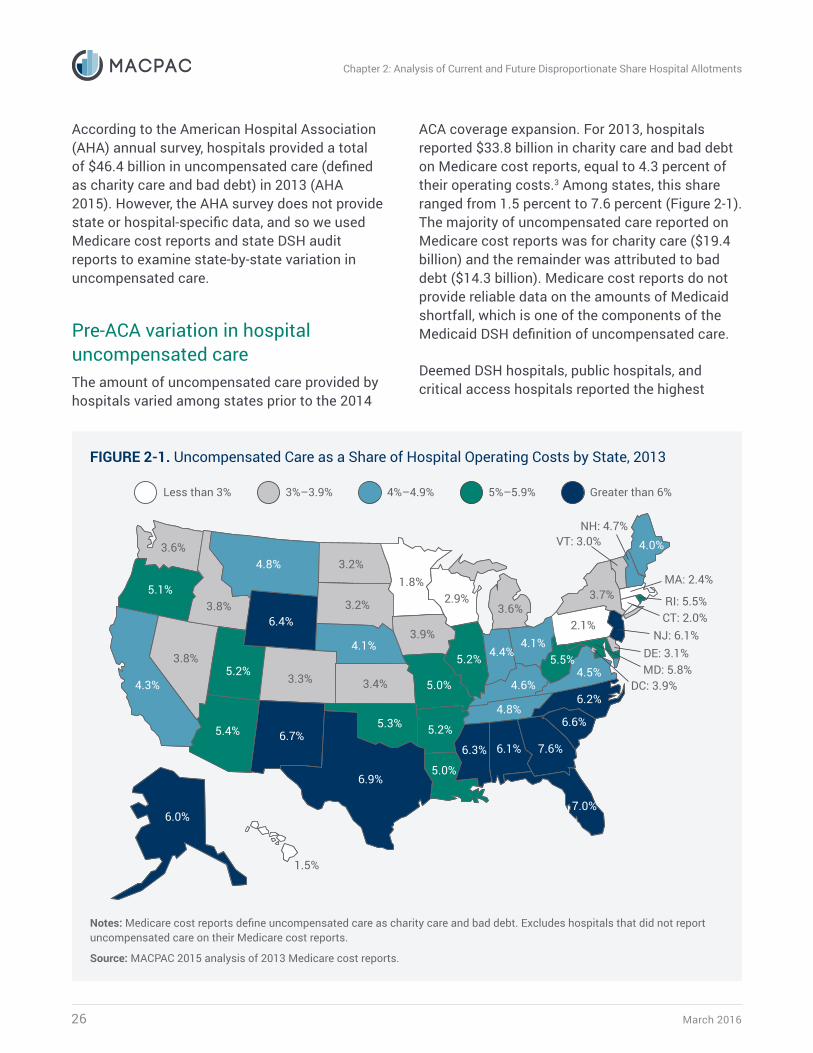
March 201626
Chapter 2: Analysis of Current and Future Disproportionate Share Hospital Allotments
According to the American Hospital Association (AHA) annual survey, hospitals provided a total of $46.4 billion in uncompensated care (defined as charity care and bad debt) in 2013 (AHA 2015). However, the AHA survey does not provide state or hospital-specific data, and so we used Medicare cost reports and state DSH audit reports to examine state-by-state variation in uncompensated care.
Pre-ACA variation in hospital uncompensated careThe amount of uncompensated care provided by hospitals varied among states prior to the 2014
ACA coverage expansion. For 2013, hospitals reported $33.8 billion in charity care and bad debt on Medicare cost reports, equal to 4.3 percent of their operating costs.3 Among states, this share ranged from 1.5 percent to 7.6 percent (Figure 2-1). The majority of uncompensated care reported on Medicare cost reports was for charity care ($19.4 billion) and the remainder was attributed to bad debt ($14.3 billion). Medicare cost reports do not provide reliable data on the amounts of Medicaid shortfall, which is one of the components of the Medicaid DSH definition of uncompensated care.
Deemed DSH hospitals, public hospitals, and critical access hospitals reported the highest
FIGURE 2-1. Uncompensated Care as a Share of Hospital Operating Costs by State, 2013
5.0%
3.8%
5.2%
4.8%
2.9%
3.4%
4.4%
4.8%6.2%
NH: 4.7%
MA: 2.4%
VT: 3.0%
2.1%
4.5%
CT: 2.0%NJ: 6.1%
DE: 3.1%MD: 5.8%
RI: 5.5%
1.5%
6.0%
6.6%
7.6%
6.9%
7.0%
6.1%6.3%
6.4%3.9%
4.1%
3.2%
4.0%
5.0%
5.3%
DC: 3.9%
5.4%
3.6%
1.8%3.2%
3.3%
5.1%
3.8%
4.3%
3.6%
4.1%
3.7%
4.6%
5.5%
6.7%
5.2%
5.2%
Less than 3% 3%–3.9% Greater than 6% 5%–5.9%4%–4.9%
Notes: Medicare cost reports define uncompensated care as charity care and bad debt. Excludes hospitals that did not report uncompensated care on their Medicare cost reports.
Source: MACPAC 2015 analysis of 2013 Medicare cost reports.
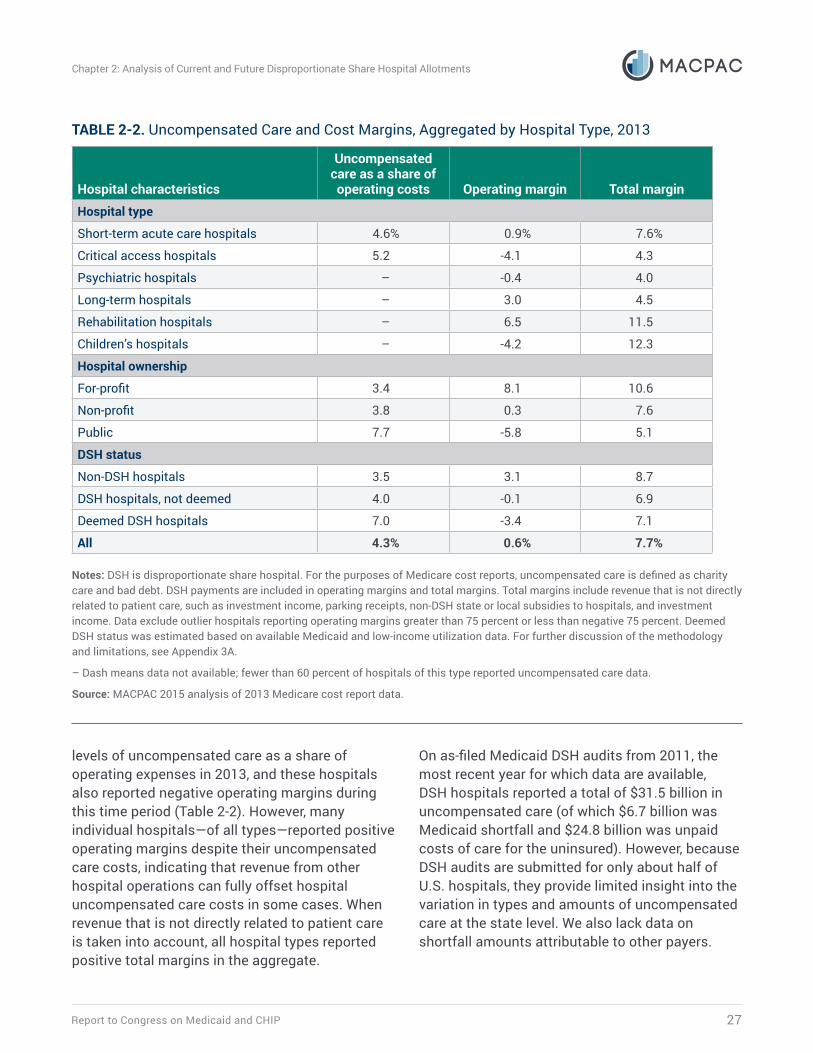
Report to Congress on Medicaid and CHIP 27
Chapter 2: Analysis of Current and Future Disproportionate Share Hospital Allotments
levels of uncompensated care as a share of operating expenses in 2013, and these hospitals also reported negative operating margins during this time period (Table 2-2). However, many individual hospitals—of all types—reported positive operating margins despite their uncompensated care costs, indicating that revenue from other hospital operations can fully offset hospital uncompensated care costs in some cases. When revenue that is not directly related to patient care is taken into account, all hospital types reported positive total margins in the aggregate.
On as-filed Medicaid DSH audits from 2011, the most recent year for which data are available, DSH hospitals reported a total of $31.5 billion in uncompensated care (of which $6.7 billion was Medicaid shortfall and $24.8 billion was unpaid costs of care for the uninsured). However, because DSH audits are submitted for only about half of U.S. hospitals, they provide limited insight into the variation in types and amounts of uncompensated care at the state level. We also lack data on shortfall amounts attributable to other payers.
TABLE 2-2. Uncompensated Care and Cost Margins, Aggregated by Hospital Type, 2013
Hospital characteristics
Uncompensated care as a share of operating costs Operating margin Total margin
Hospital type
Short-term acute care hospitals 4.6% 0.9% 7.6%
Critical access hospitals 5.2 -4.1 4.3
Psychiatric hospitals – -0.4 4.0
Long-term hospitals – 3.0 4.5
Rehabilitation hospitals – 6.5 11.5
Children’s hospitals – -4.2 12.3
Hospital ownership
For-profit 3.4 8.1 10.6
Non-profit 3.8 0.3 7.6
Public 7.7 -5.8 5.1
DSH status
Non-DSH hospitals 3.5 3.1 8.7
DSH hospitals, not deemed 4.0 -0.1 6.9
Deemed DSH hospitals 7.0 -3.4 7.1
All 4.3% 0.6% 7.7%
Notes: DSH is disproportionate share hospital. For the purposes of Medicare cost reports, uncompensated care is defined as charity care and bad debt. DSH payments are included in operating margins and total margins. Total margins include revenue that is not directly related to patient care, such as investment income, parking receipts, non-DSH state or local subsidies to hospitals, and investment income. Data exclude outlier hospitals reporting operating margins greater than 75 percent or less than negative 75 percent. Deemed DSH status was estimated based on available Medicaid and low-income utilization data. For further discussion of the methodology and limitations, see Appendix 3A.
– Dash means data not available; fewer than 60 percent of hospitals of this type reported uncompensated care data.
Source: MACPAC 2015 analysis of 2013 Medicare cost report data.
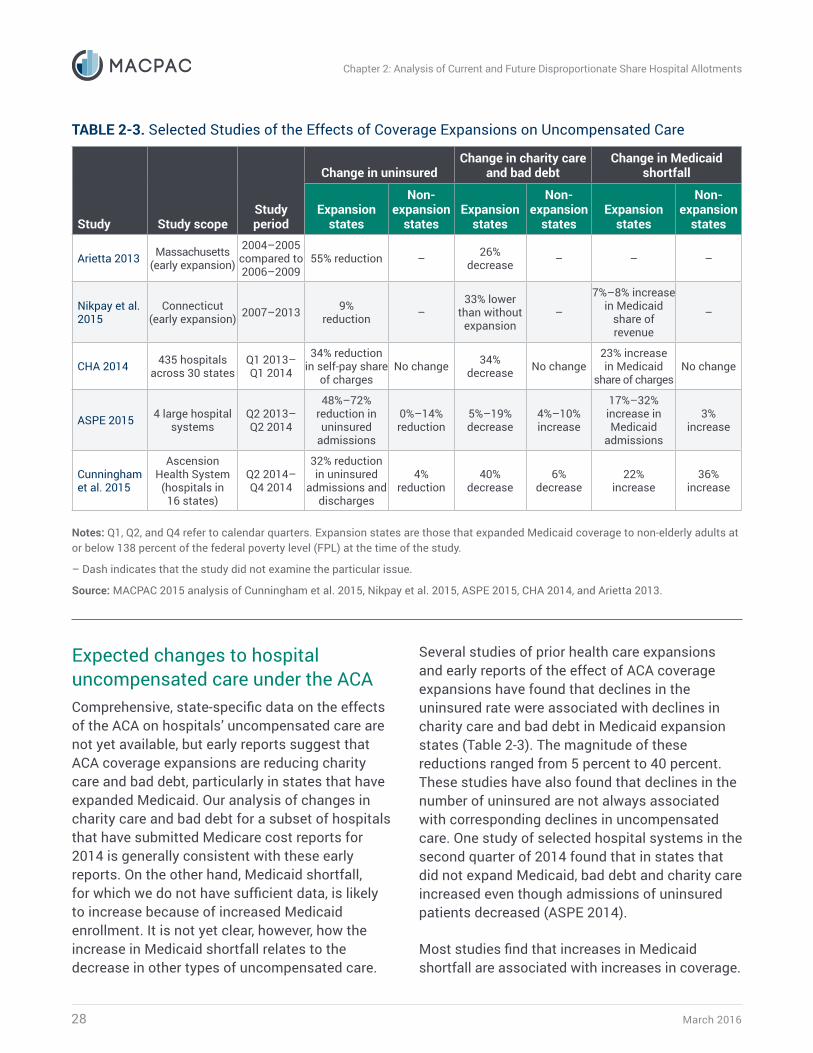
March 201628
Chapter 2: Analysis of Current and Future Disproportionate Share Hospital Allotments
Expected changes to hospital uncompensated care under the ACAComprehensive, state-specific data on the effects of the ACA on hospitals’ uncompensated care are not yet available, but early reports suggest that ACA coverage expansions are reducing charity care and bad debt, particularly in states that have expanded Medicaid. Our analysis of changes in charity care and bad debt for a subset of hospitals that have submitted Medicare cost reports for 2014 is generally consistent with these early reports. On the other hand, Medicaid shortfall, for which we do not have sufficient data, is likely to increase because of increased Medicaid enrollment. It is not yet clear, however, how the increase in Medicaid shortfall relates to the decrease in other types of uncompensated care.
Several studies of prior health care expansions and early reports of the effect of ACA coverage expansions have found that declines in the uninsured rate were associated with declines in charity care and bad debt in Medicaid expansion states (Table 2-3). The magnitude of these reductions ranged from 5 percent to 40 percent. These studies have also found that declines in the number of uninsured are not always associated with corresponding declines in uncompensated care. One study of selected hospital systems in the second quarter of 2014 found that in states that did not expand Medicaid, bad debt and charity care increased even though admissions of uninsured patients decreased (ASPE 2014).
Most studies find that increases in Medicaid shortfall are associated with increases in coverage.
TABLE 2-3. Selected Studies of the Effects of Coverage Expansions on Uncompensated Care
Study Study scopeStudy period
Change in uninsuredChange in charity care
and bad debtChange in Medicaid
shortfall
Expansion states
Non-expansion
statesExpansion
states
Non-expansion
statesExpansion
states
Non-expansion
states
Arietta 2013 Massachusetts (early expansion)
2004–2005 compared to 2006–2009
55% reduction – 26% decrease – – –
Nikpay et al. 2015
Connecticut (early expansion) 2007–2013 9%
reduction –33% lower
than without expansion
–
7%–8% increase in Medicaid
share of revenue
–
CHA 2014 435 hospitals across 30 states
Q1 2013– Q1 2014
34% reduction in self-pay share
of chargesNo change 34%
decrease No change23% increase in Medicaid
share of chargesNo change
ASPE 2015 4 large hospital systems
Q2 2013– Q2 2014
48%–72% reduction in uninsured
admissions
0%–14% reduction
5%–19% decrease
4%–10% increase
17%–32% increase in Medicaid
admissions
3% increase
Cunningham et al. 2015
Ascension Health System
(hospitals in 16 states)
Q2 2014– Q4 2014
32% reduction in uninsured
admissions and discharges
4% reduction
40% decrease
6% decrease
22% increase
36% increase
Notes: Q1, Q2, and Q4 refer to calendar quarters. Expansion states are those that expanded Medicaid coverage to non-elderly adults at or below 138 percent of the federal poverty level (FPL) at the time of the study.
– Dash indicates that the study did not examine the particular issue.
Source: MACPAC 2015 analysis of Cunningham et al. 2015, Nikpay et al. 2015, ASPE 2015, CHA 2014, and Arietta 2013.
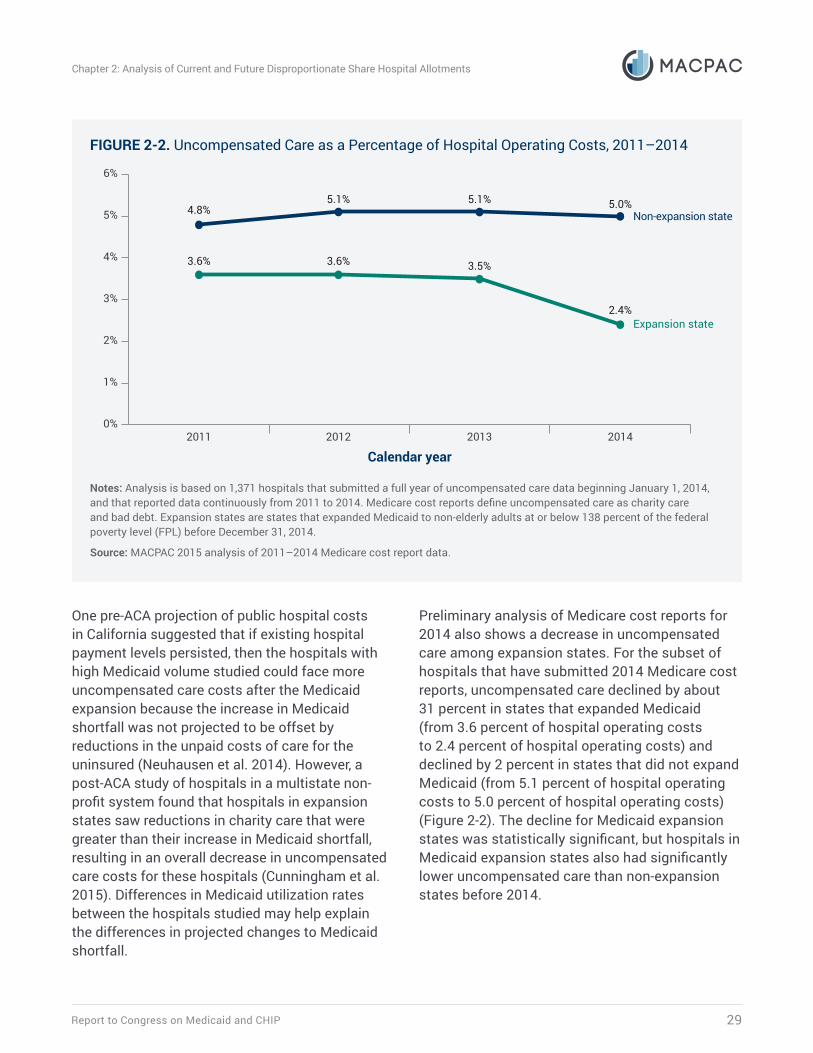
Report to Congress on Medicaid and CHIP 29
Chapter 2: Analysis of Current and Future Disproportionate Share Hospital Allotments
One pre-ACA projection of public hospital costs in California suggested that if existing hospital payment levels persisted, then the hospitals with high Medicaid volume studied could face more uncompensated care costs after the Medicaid expansion because the increase in Medicaid shortfall was not projected to be offset by reductions in the unpaid costs of care for the uninsured (Neuhausen et al. 2014). However, a post-ACA study of hospitals in a multistate non-profit system found that hospitals in expansion states saw reductions in charity care that were greater than their increase in Medicaid shortfall, resulting in an overall decrease in uncompensated care costs for these hospitals (Cunningham et al. 2015). Differences in Medicaid utilization rates between the hospitals studied may help explain the differences in projected changes to Medicaid shortfall.
Preliminary analysis of Medicare cost reports for 2014 also shows a decrease in uncompensated care among expansion states. For the subset of hospitals that have submitted 2014 Medicare cost reports, uncompensated care declined by about 31 percent in states that expanded Medicaid (from 3.6 percent of hospital operating costs to 2.4 percent of hospital operating costs) and declined by 2 percent in states that did not expand Medicaid (from 5.1 percent of hospital operating costs to 5.0 percent of hospital operating costs) (Figure 2-2). The decline for Medicaid expansion states was statistically significant, but hospitals in Medicaid expansion states also had significantly lower uncompensated care than non-expansion states before 2014.
FIGURE 2-2. Uncompensated Care as a Percentage of Hospital Operating Costs, 2011–2014
Expansion state
4.8%
2011 2012 2013 2014
3.6%
5.1%
3.6%
5.1%
3.5%
5.0%
2.4%
Non-expansion state
Calendar year
0%
1%
2%
3%
4%
5%
6%
Notes: Analysis is based on 1,371 hospitals that submitted a full year of uncompensated care data beginning January 1, 2014, and that reported data continuously from 2011 to 2014. Medicare cost reports define uncompensated care as charity care and bad debt. Expansion states are states that expanded Medicaid to non-elderly adults at or below 138 percent of the federal poverty level (FPL) before December 31, 2014.
Source: MACPAC 2015 analysis of 2011–2014 Medicare cost report data.
March 201630
Chapter 2: Analysis of Current and Future Disproportionate Share Hospital Allotments
We limited this analysis to 1,371 hospitals that had submitted a full year of uncompensated care data beginning January 1, 2014, to better isolate the effects of the ACA coverage expansion. The subset of hospitals that we used in this analysis includes a variety of hospitals from all states, including 624 DSH hospitals from 40 states. (For more information about our methods, see Appendix 3A.)
Based on our analysis, DSH hospitals experienced declines in uncompensated care similar to non-DSH hospitals, and bad debt and charity care both declined at similar rates. However, we do not yet have sufficient data to understand how deemed DSH hospitals in particular are being affected. Moreover, our ability to understand the full effects of the ACA on hospitals that serve high volumes of Medicaid patients is particularly limited because we do not have reliable data on Medicaid shortfall from Medicare cost reports.
Hospitals with High Levels of Uncompensated Care That Also Provide Essential Community ServicesThe third indicator to be considered when analyzing a state’s need for Medicaid DSH funds is the extent to which hospitals in the state with high levels of uncompensated care also provide access to what the Protecting Access to Medicare Act of 2014 (the statute calling for MACPAC’s study) calls essential community services. Although the statute does not provide a specific list of services falling into this category, it describes them as services that are important to low-income and other vulnerable communities that are not available at most hospitals. The concept of essential community services is not defined elsewhere in Medicaid statute or regulation.
Lacking clear direction for identifying such hospitals, MACPAC developed a working definition based on the types of services suggested in the study requirement and the limits of available data (Box 2-2). This working definition builds on the statutory definition of deemed DSH hospitals, because as discussed in Chapter 1, deemed DSH hospitals are more likely to provide a range of additional primary and quaternary care services that are not often available at other hospitals. DSH payments are an important source of revenue for these hospitals and may allow them to maintain access to these services that their patients may not be able to obtain elsewhere.
Among the 798 deemed DSH hospitals identified, 702 provided at least one of the included services, with 303 providing two of these services and 171 providing three or more of these services. In order to be as inclusive as possible in this first report, we considered provision of just one of these services to be sufficient for inclusion as a hospital that provides essential community services. More restrictive criteria may be applied in future reports.
The 702 hospitals that provided at least one essential community service represent about 11 percent of U.S. hospitals but about 37 percent of the uncompensated care reported on Medicare cost reports for all hospitals. The number of hospitals that were identified in each state is generally proportional to the size of each state’s population. Large states, including California, Texas, and New York, had more than 30 deemed DSH hospitals that provided at least one included service, while smaller states had only a few hospitals that met the criteria.
Using DSH audits, which all deemed DSH hospitals must submit, we can examine uncompensated care according to the Medicaid DSH definition, which includes Medicaid shortfall. The amount of uncompensated care as a share of hospital operating costs reported on Medicaid DSH audits by the hospitals that we identified as providing
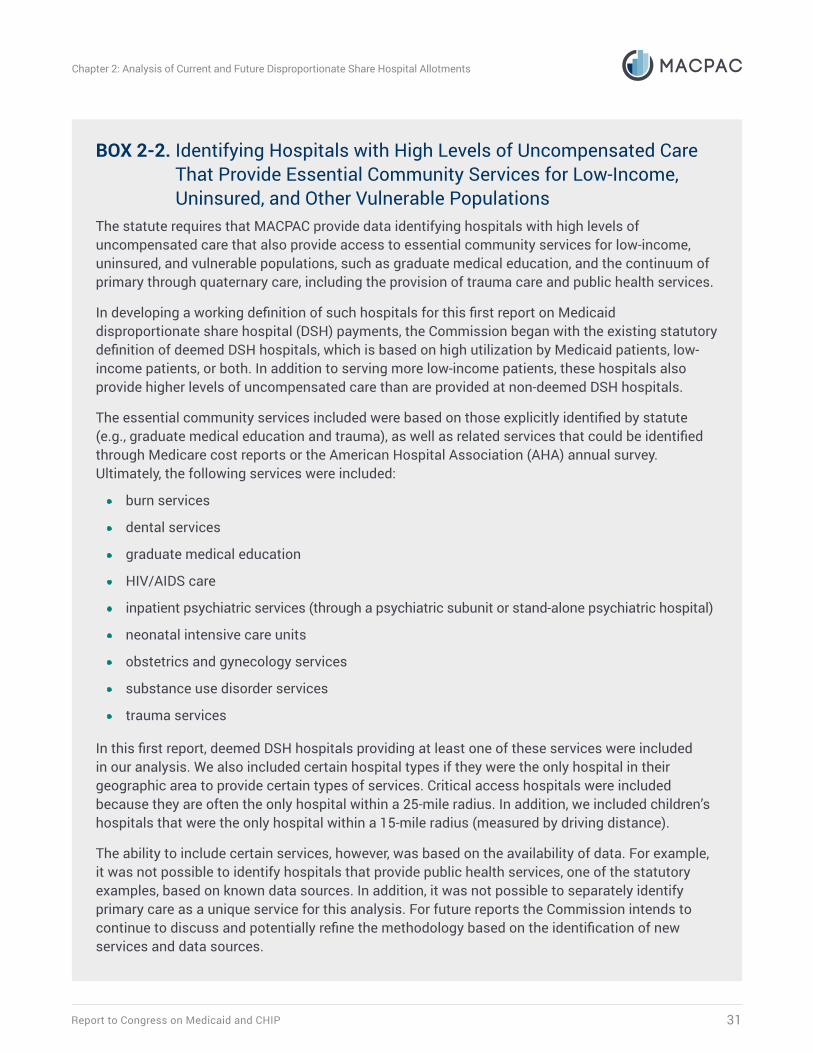
Report to Congress on Medicaid and CHIP 31
Chapter 2: Analysis of Current and Future Disproportionate Share Hospital Allotments
BOX 2-2. Identifying Hospitals with High Levels of Uncompensated Care That Provide Essential Community Services for Low-Income, Uninsured, and Other Vulnerable Populations
The statute requires that MACPAC provide data identifying hospitals with high levels of uncompensated care that also provide access to essential community services for low-income, uninsured, and vulnerable populations, such as graduate medical education, and the continuum of primary through quaternary care, including the provision of trauma care and public health services.
In developing a working definition of such hospitals for this first report on Medicaid disproportionate share hospital (DSH) payments, the Commission began with the existing statutory definition of deemed DSH hospitals, which is based on high utilization by Medicaid patients, low-income patients, or both. In addition to serving more low-income patients, these hospitals also provide higher levels of uncompensated care than are provided at non-deemed DSH hospitals.
The essential community services included were based on those explicitly identified by statute (e.g., graduate medical education and trauma), as well as related services that could be identified through Medicare cost reports or the American Hospital Association (AHA) annual survey. Ultimately, the following services were included:
• burn services
• dental services
• graduate medical education
• HIV/AIDS care
• inpatient psychiatric services (through a psychiatric subunit or stand-alone psychiatric hospital)
• neonatal intensive care units
• obstetrics and gynecology services
• substance use disorder services
• trauma services
In this first report, deemed DSH hospitals providing at least one of these services were included in our analysis. We also included certain hospital types if they were the only hospital in their geographic area to provide certain types of services. Critical access hospitals were included because they are often the only hospital within a 25-mile radius. In addition, we included children’s hospitals that were the only hospital within a 15-mile radius (measured by driving distance).
The ability to include certain services, however, was based on the availability of data. For example, it was not possible to identify hospitals that provide public health services, one of the statutory examples, based on known data sources. In addition, it was not possible to separately identify primary care as a unique service for this analysis. For future reports the Commission intends to continue to discuss and potentially refine the methodology based on the identification of new services and data sources.
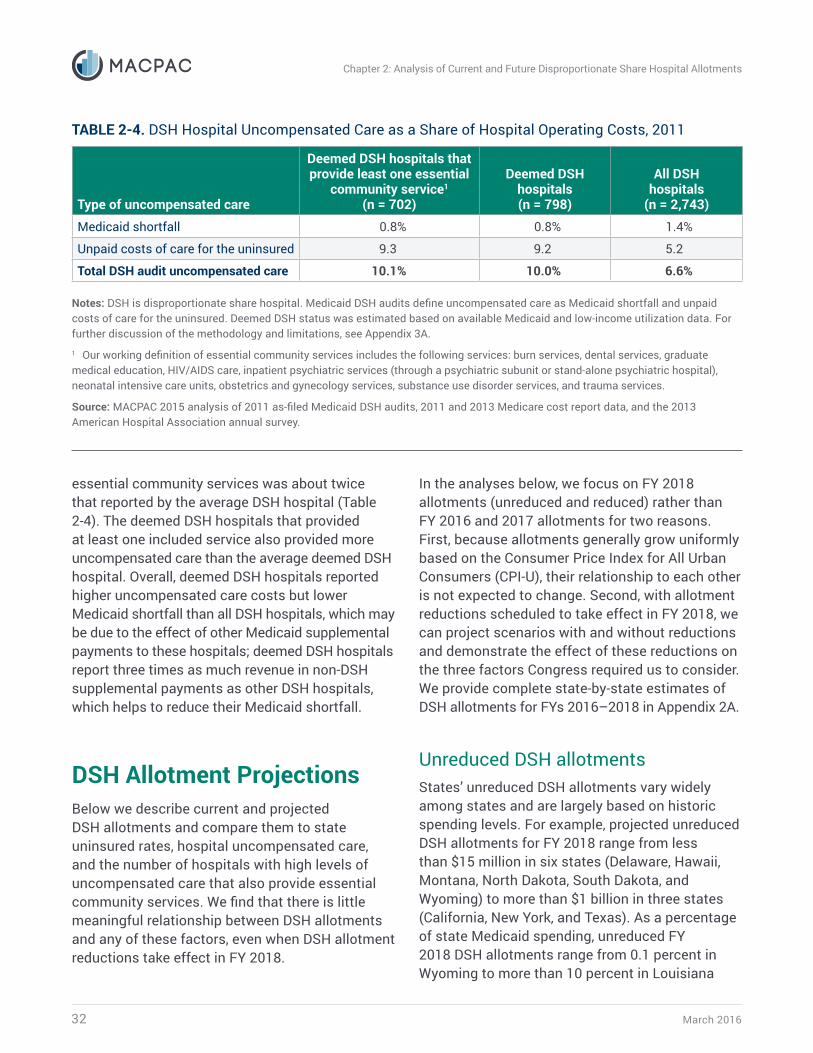
March 201632
Chapter 2: Analysis of Current and Future Disproportionate Share Hospital Allotments
essential community services was about twice that reported by the average DSH hospital (Table 2-4). The deemed DSH hospitals that provided at least one included service also provided more uncompensated care than the average deemed DSH hospital. Overall, deemed DSH hospitals reported higher uncompensated care costs but lower Medicaid shortfall than all DSH hospitals, which may be due to the effect of other Medicaid supplemental payments to these hospitals; deemed DSH hospitals report three times as much revenue in non-DSH supplemental payments as other DSH hospitals, which helps to reduce their Medicaid shortfall.
DSH Allotment ProjectionsBelow we describe current and projected DSH allotments and compare them to state uninsured rates, hospital uncompensated care, and the number of hospitals with high levels of uncompensated care that also provide essential community services. We find that there is little meaningful relationship between DSH allotments and any of these factors, even when DSH allotment reductions take effect in FY 2018.
In the analyses below, we focus on FY 2018 allotments (unreduced and reduced) rather than FY 2016 and 2017 allotments for two reasons. First, because allotments generally grow uniformly based on the Consumer Price Index for All Urban Consumers (CPI-U), their relationship to each other is not expected to change. Second, with allotment reductions scheduled to take effect in FY 2018, we can project scenarios with and without reductions and demonstrate the effect of these reductions on the three factors Congress required us to consider. We provide complete state-by-state estimates of DSH allotments for FYs 2016–2018 in Appendix 2A.
Unreduced DSH allotmentsStates’ unreduced DSH allotments vary widely among states and are largely based on historic spending levels. For example, projected unreduced DSH allotments for FY 2018 range from less than $15 million in six states (Delaware, Hawaii, Montana, North Dakota, South Dakota, and Wyoming) to more than $1 billion in three states (California, New York, and Texas). As a percentage of state Medicaid spending, unreduced FY 2018 DSH allotments range from 0.1 percent in Wyoming to more than 10 percent in Louisiana
TABLE 2-4. DSH Hospital Uncompensated Care as a Share of Hospital Operating Costs, 2011
Type of uncompensated care
Deemed DSH hospitals that provide least one essential
community service1
(n = 702)
Deemed DSH hospitals(n = 798)
All DSHhospitals
(n = 2,743)Medicaid shortfall 0.8% 0.8% 1.4%
Unpaid costs of care for the uninsured 9.3 9.2 5.2
Total DSH audit uncompensated care 10.1% 10.0% 6.6%
Notes: DSH is disproportionate share hospital. Medicaid DSH audits define uncompensated care as Medicaid shortfall and unpaid costs of care for the uninsured. Deemed DSH status was estimated based on available Medicaid and low-income utilization data. For further discussion of the methodology and limitations, see Appendix 3A.1 Our working definition of essential community services includes the following services: burn services, dental services, graduate medical education, HIV/AIDS care, inpatient psychiatric services (through a psychiatric subunit or stand-alone psychiatric hospital), neonatal intensive care units, obstetrics and gynecology services, substance use disorder services, and trauma services.
Source: MACPAC 2015 analysis of 2011 as-filed Medicaid DSH audits, 2011 and 2013 Medicare cost report data, and the 2013 American Hospital Association annual survey.
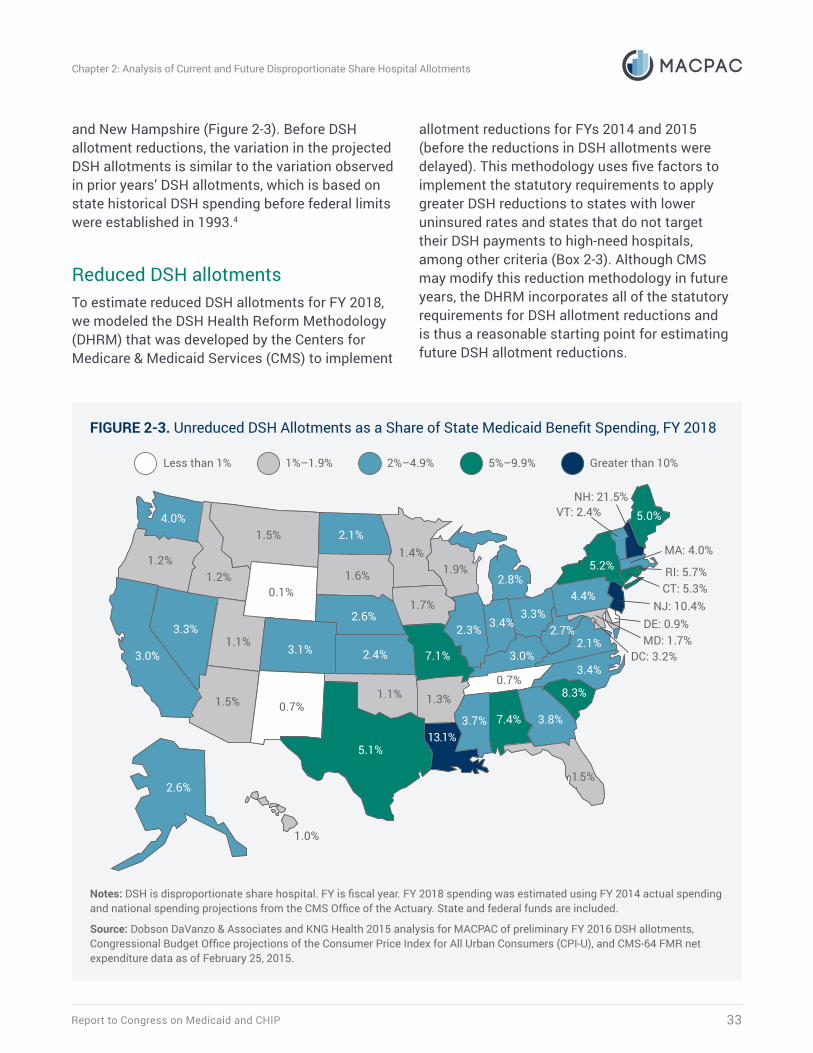
Report to Congress on Medicaid and CHIP 33
Chapter 2: Analysis of Current and Future Disproportionate Share Hospital Allotments
and New Hampshire (Figure 2-3). Before DSH allotment reductions, the variation in the projected DSH allotments is similar to the variation observed in prior years’ DSH allotments, which is based on state historical DSH spending before federal limits were established in 1993.4
Reduced DSH allotmentsTo estimate reduced DSH allotments for FY 2018, we modeled the DSH Health Reform Methodology (DHRM) that was developed by the Centers for Medicare & Medicaid Services (CMS) to implement
allotment reductions for FYs 2014 and 2015 (before the reductions in DSH allotments were delayed). This methodology uses five factors to implement the statutory requirements to apply greater DSH reductions to states with lower uninsured rates and states that do not target their DSH payments to high-need hospitals, among other criteria (Box 2-3). Although CMS may modify this reduction methodology in future years, the DHRM incorporates all of the statutory requirements for DSH allotment reductions and is thus a reasonable starting point for estimating future DSH allotment reductions.
FIGURE 2-3. Unreduced DSH Allotments as a Share of State Medicaid Benefit Spending, FY 2018
13.1%
1.2%
1.1%
1.5%
1.9%
2.4%
3.4%
0.7%3.4%
NH: 21.5%
MA: 4.0%
VT: 2.4%
4.4%
2.1%
CT: 5.3%NJ: 10.4%
DE: 0.9%MD: 1.7%
RI: 5.7%
1.0%
2.6%
8.3%
3.8%
5.1%
1.5%
7.4%3.7%
0.1%1.7%
2.6%
1.6%
5.0%
7.1%
1.1%
DC: 3.2%
1.5%
4.0%
1.4%2.1%
3.1%
1.2%
3.3%
3.0%
2.8%
3.3%
5.2%
3.0%
2.7%
0.7%
2.3%
1.3%
Less than 1% 1%–1.9% Greater than 10% 5%–9.9%2%–4.9%
Notes: DSH is disproportionate share hospital. FY is fiscal year. FY 2018 spending was estimated using FY 2014 actual spending and national spending projections from the CMS Office of the Actuary. State and federal funds are included.
Source: Dobson DaVanzo & Associates and KNG Health 2015 analysis for MACPAC of preliminary FY 2016 DSH allotments, Congressional Budget Office projections of the Consumer Price Index for All Urban Consumers (CPI-U), and CMS-64 FMR net expenditure data as of February 25, 2015.
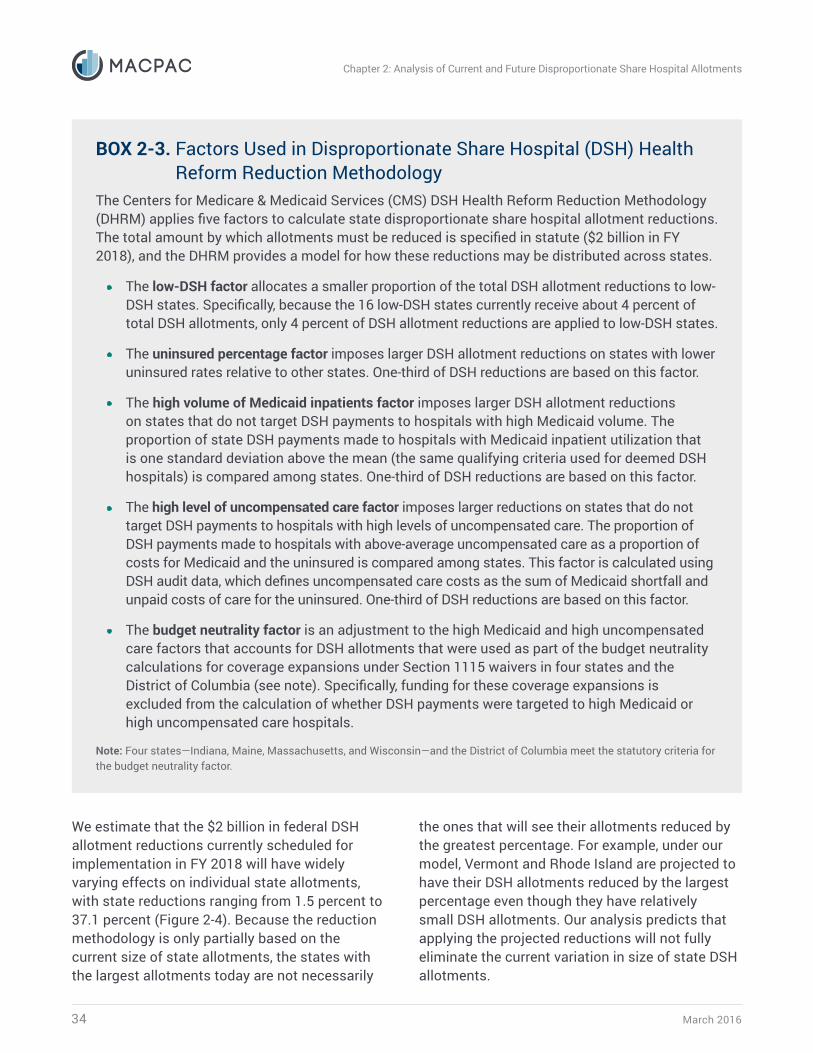
March 201634
Chapter 2: Analysis of Current and Future Disproportionate Share Hospital Allotments
We estimate that the $2 billion in federal DSH allotment reductions currently scheduled for implementation in FY 2018 will have widely varying effects on individual state allotments, with state reductions ranging from 1.5 percent to 37.1 percent (Figure 2-4). Because the reduction methodology is only partially based on the current size of state allotments, the states with the largest allotments today are not necessarily
the ones that will see their allotments reduced by the greatest percentage. For example, under our model, Vermont and Rhode Island are projected to have their DSH allotments reduced by the largest percentage even though they have relatively small DSH allotments. Our analysis predicts that applying the projected reductions will not fully eliminate the current variation in size of state DSH allotments.
BOX 2-3. Factors Used in Disproportionate Share Hospital (DSH) Health Reform Reduction Methodology
The Centers for Medicare & Medicaid Services (CMS) DSH Health Reform Reduction Methodology (DHRM) applies five factors to calculate state disproportionate share hospital allotment reductions. The total amount by which allotments must be reduced is specified in statute ($2 billion in FY 2018), and the DHRM provides a model for how these reductions may be distributed across states.
• The low-DSH factor allocates a smaller proportion of the total DSH allotment reductions to low-DSH states. Specifically, because the 16 low-DSH states currently receive about 4 percent of total DSH allotments, only 4 percent of DSH allotment reductions are applied to low-DSH states.
• The uninsured percentage factor imposes larger DSH allotment reductions on states with lower uninsured rates relative to other states. One-third of DSH reductions are based on this factor.
• The high volume of Medicaid inpatients factor imposes larger DSH allotment reductions on states that do not target DSH payments to hospitals with high Medicaid volume. The proportion of state DSH payments made to hospitals with Medicaid inpatient utilization that is one standard deviation above the mean (the same qualifying criteria used for deemed DSH hospitals) is compared among states. One-third of DSH reductions are based on this factor.
• The high level of uncompensated care factor imposes larger reductions on states that do not target DSH payments to hospitals with high levels of uncompensated care. The proportion of DSH payments made to hospitals with above-average uncompensated care as a proportion of costs for Medicaid and the uninsured is compared among states. This factor is calculated using DSH audit data, which defines uncompensated care costs as the sum of Medicaid shortfall and unpaid costs of care for the uninsured. One-third of DSH reductions are based on this factor.
• The budget neutrality factor is an adjustment to the high Medicaid and high uncompensated care factors that accounts for DSH allotments that were used as part of the budget neutrality calculations for coverage expansions under Section 1115 waivers in four states and the District of Columbia (see note). Specifically, funding for these coverage expansions is excluded from the calculation of whether DSH payments were targeted to high Medicaid or high uncompensated care hospitals.
Note: Four states—Indiana, Maine, Massachusetts, and Wisconsin—and the District of Columbia meet the statutory criteria for the budget neutrality factor.
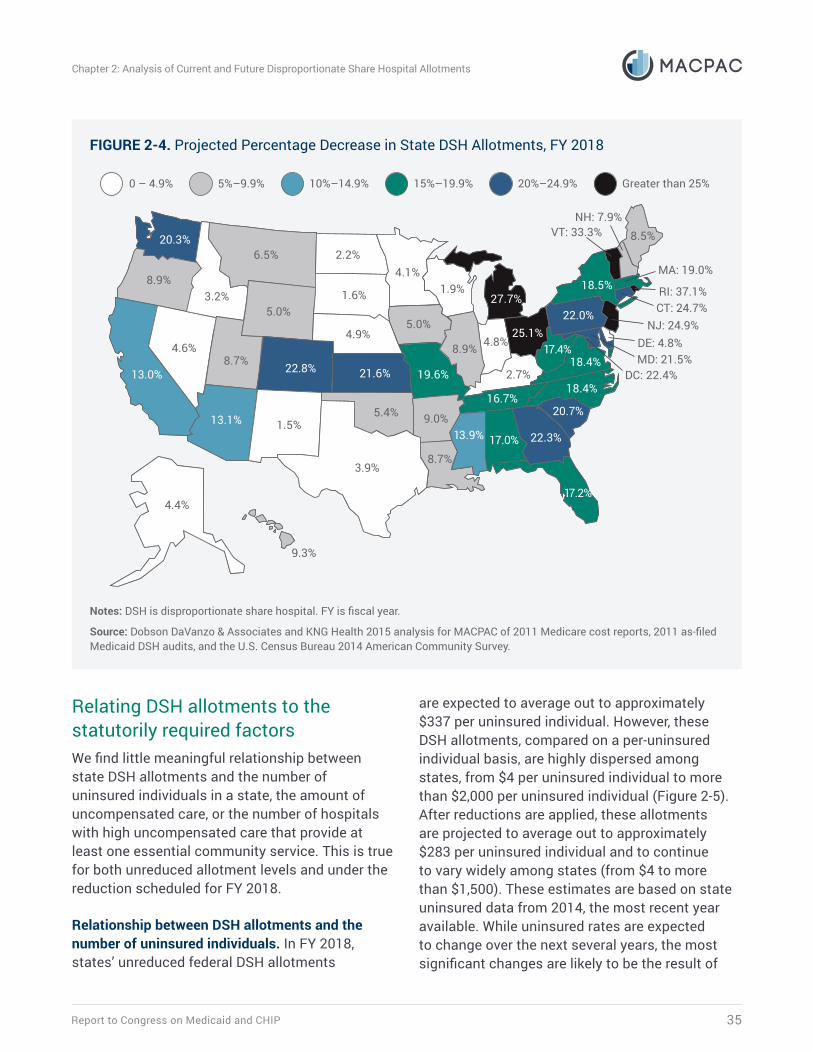
Report to Congress on Medicaid and CHIP 35
Chapter 2: Analysis of Current and Future Disproportionate Share Hospital Allotments
Relating DSH allotments to the statutorily required factorsWe find little meaningful relationship between state DSH allotments and the number of uninsured individuals in a state, the amount of uncompensated care, or the number of hospitals with high uncompensated care that provide at least one essential community service. This is true for both unreduced allotment levels and under the reduction scheduled for FY 2018.
Relationship between DSH allotments and the number of uninsured individuals. In FY 2018, states’ unreduced federal DSH allotments
are expected to average out to approximately $337 per uninsured individual. However, these DSH allotments, compared on a per-uninsured individual basis, are highly dispersed among states, from $4 per uninsured individual to more than $2,000 per uninsured individual (Figure 2-5). After reductions are applied, these allotments are projected to average out to approximately $283 per uninsured individual and to continue to vary widely among states (from $4 to more than $1,500). These estimates are based on state uninsured data from 2014, the most recent year available. While uninsured rates are expected to change over the next several years, the most significant changes are likely to be the result of
FIGURE 2-4. Projected Percentage Decrease in State DSH Allotments, FY 2018
8.7%
3.2%
8.7%
6.5%
1.9%
21.6%
4.8%
16.7%18.4%
NH: 7.9%
MA: 19.0%
VT: 33.3%
22.0%
18.4%
CT: 24.7%NJ: 24.9%
DE: 4.8%MD: 21.5%
RI: 37.1%
9.3%
4.4%
20.7%
22.3%
3.9%
17.2%
17.0%13.9%
5.0%5.0%
4.9%
1.6%
8.5%
19.6%
5.4%
DC: 22.4%
13.1%
20.3%
4.1%2.2%
22.8%
8.9%
4.6%
13.0%
27.7%
25.1%
18.5%
2.7%
17.4%
1.5%
8.9%
9.0%
0 – 4.9% 5%–9.9% Greater than 25% 15%–19.9% 20%–24.9%10%–14.9%
Notes: DSH is disproportionate share hospital. FY is fiscal year.
Source: Dobson DaVanzo & Associates and KNG Health 2015 analysis for MACPAC of 2011 Medicare cost reports, 2011 as-filed Medicaid DSH audits, and the U.S. Census Bureau 2014 American Community Survey.
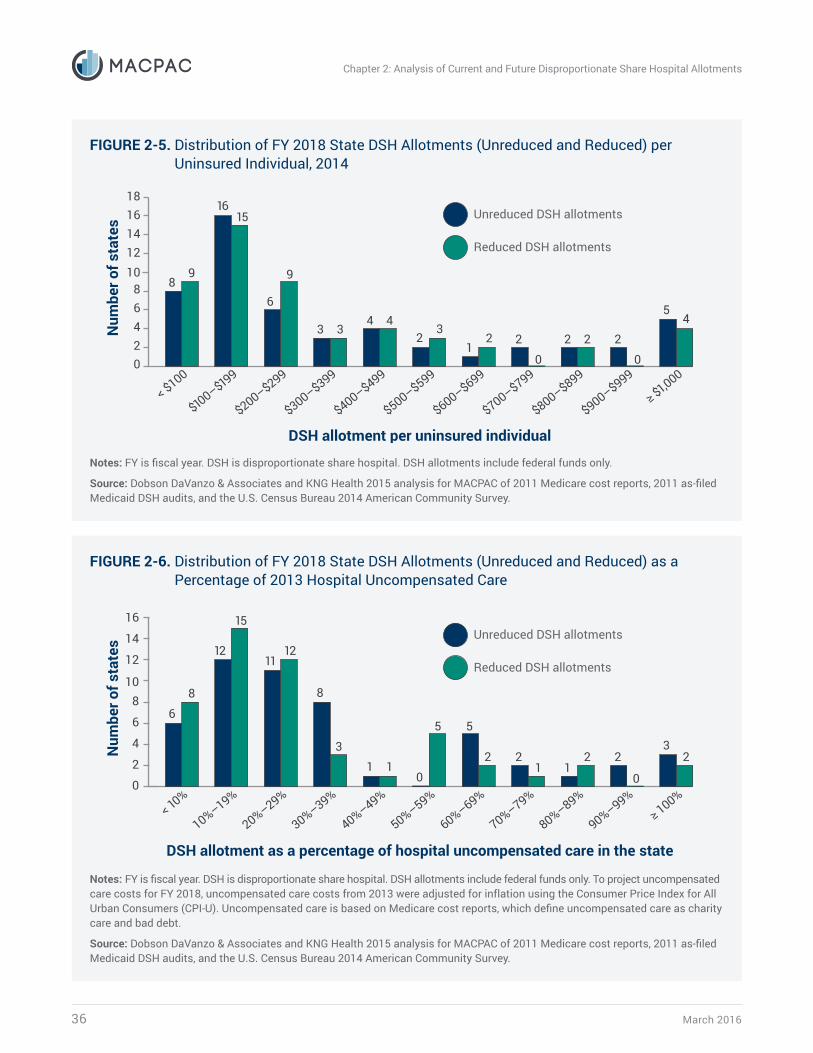
March 201636
Chapter 2: Analysis of Current and Future Disproportionate Share Hospital Allotments
FIGURE 2-5. Distribution of FY 2018 State DSH Allotments (Unreduced and Reduced) per Uninsured Individual, 2014
02468
1012141618
< $100
$100–$199
$200–$299
$300–$399
$400–$499
$500–$599
$600–$699
$700–$799
$800–$899
$900–$999
≥ $1,000
Unreduced DSH allotments
Reduced DSH allotments
89
6
9
3 34 4
2 2
54
2
0
2
01
223
1615
DSH allotment per uninsured individual
Num
ber o
f sta
tes
Notes: FY is fiscal year. DSH is disproportionate share hospital. DSH allotments include federal funds only.
Source: Dobson DaVanzo & Associates and KNG Health 2015 analysis for MACPAC of 2011 Medicare cost reports, 2011 as-filed Medicaid DSH audits, and the U.S. Census Bureau 2014 American Community Survey.
FIGURE 2-6. Distribution of FY 2018 State DSH Allotments (Unreduced and Reduced) as a Percentage of 2013 Hospital Uncompensated Care
0
2
4
6
810
12
14
16
< 10%
10%–19%
20%–29%
30%–39%
40%–49%
50%–59%
60%–69%
70%–79%
80%–89%
90%–99%≥ 100%
Unreduced DSH allotments
Reduced DSH allotments
6
8
1112
8
31 1 1
23
221
2
0
5
2
0
5
12
15
DSH allotment as a percentage of hospital uncompensated care in the state
Num
ber o
f sta
tes
Notes: FY is fiscal year. DSH is disproportionate share hospital. DSH allotments include federal funds only. To project uncompensated care costs for FY 2018, uncompensated care costs from 2013 were adjusted for inflation using the Consumer Price Index for All Urban Consumers (CPI-U). Uncompensated care is based on Medicare cost reports, which define uncompensated care as charity care and bad debt.
Source: Dobson DaVanzo & Associates and KNG Health 2015 analysis for MACPAC of 2011 Medicare cost reports, 2011 as-filed Medicaid DSH audits, and the U.S. Census Bureau 2014 American Community Survey.
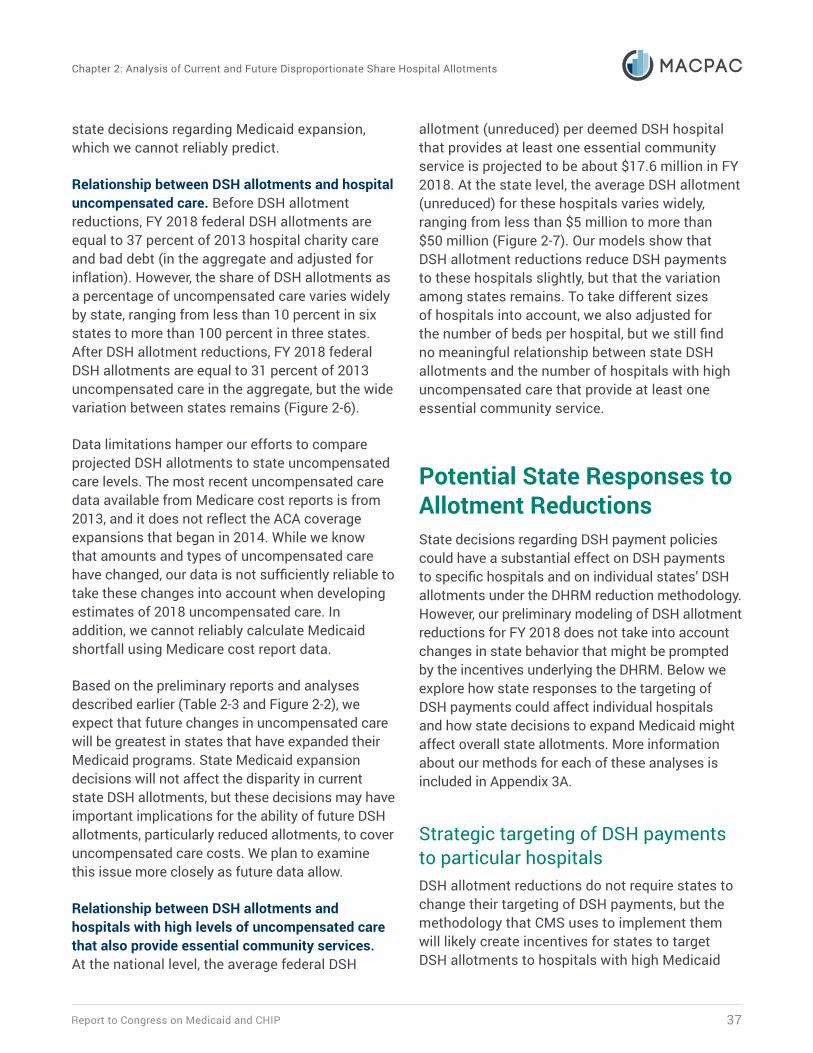
Report to Congress on Medicaid and CHIP 37
Chapter 2: Analysis of Current and Future Disproportionate Share Hospital Allotments
state decisions regarding Medicaid expansion, which we cannot reliably predict.
Relationship between DSH allotments and hospital uncompensated care. Before DSH allotment reductions, FY 2018 federal DSH allotments are equal to 37 percent of 2013 hospital charity care and bad debt (in the aggregate and adjusted for inflation). However, the share of DSH allotments as a percentage of uncompensated care varies widely by state, ranging from less than 10 percent in six states to more than 100 percent in three states. After DSH allotment reductions, FY 2018 federal DSH allotments are equal to 31 percent of 2013 uncompensated care in the aggregate, but the wide variation between states remains (Figure 2-6).
Data limitations hamper our efforts to compare projected DSH allotments to state uncompensated care levels. The most recent uncompensated care data available from Medicare cost reports is from 2013, and it does not reflect the ACA coverage expansions that began in 2014. While we know that amounts and types of uncompensated care have changed, our data is not sufficiently reliable to take these changes into account when developing estimates of 2018 uncompensated care. In addition, we cannot reliably calculate Medicaid shortfall using Medicare cost report data.
Based on the preliminary reports and analyses described earlier (Table 2-3 and Figure 2-2), we expect that future changes in uncompensated care will be greatest in states that have expanded their Medicaid programs. State Medicaid expansion decisions will not affect the disparity in current state DSH allotments, but these decisions may have important implications for the ability of future DSH allotments, particularly reduced allotments, to cover uncompensated care costs. We plan to examine this issue more closely as future data allow.
Relationship between DSH allotments and hospitals with high levels of uncompensated care that also provide essential community services. At the national level, the average federal DSH
allotment (unreduced) per deemed DSH hospital that provides at least one essential community service is projected to be about $17.6 million in FY 2018. At the state level, the average DSH allotment (unreduced) for these hospitals varies widely, ranging from less than $5 million to more than $50 million (Figure 2-7). Our models show that DSH allotment reductions reduce DSH payments to these hospitals slightly, but that the variation among states remains. To take different sizes of hospitals into account, we also adjusted for the number of beds per hospital, but we still find no meaningful relationship between state DSH allotments and the number of hospitals with high uncompensated care that provide at least one essential community service.
Potential State Responses to Allotment ReductionsState decisions regarding DSH payment policies could have a substantial effect on DSH payments to specific hospitals and on individual states’ DSH allotments under the DHRM reduction methodology. However, our preliminary modeling of DSH allotment reductions for FY 2018 does not take into account changes in state behavior that might be prompted by the incentives underlying the DHRM. Below we explore how state responses to the targeting of DSH payments could affect individual hospitals and how state decisions to expand Medicaid might affect overall state allotments. More information about our methods for each of these analyses is included in Appendix 3A.
Strategic targeting of DSH payments to particular hospitalsDSH allotment reductions do not require states to change their targeting of DSH payments, but the methodology that CMS uses to implement them will likely create incentives for states to target DSH allotments to hospitals with high Medicaid
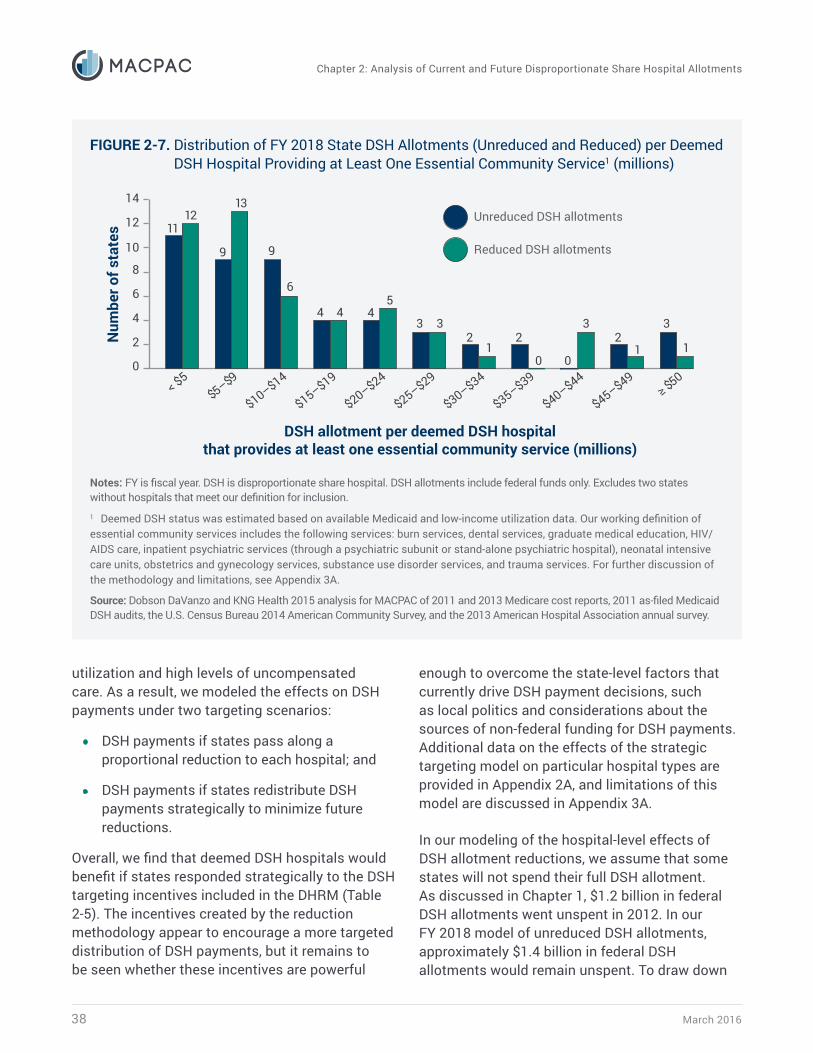
March 201638
Chapter 2: Analysis of Current and Future Disproportionate Share Hospital Allotments
utilization and high levels of uncompensated care. As a result, we modeled the effects on DSH payments under two targeting scenarios:
• DSH payments if states pass along a proportional reduction to each hospital; and
• DSH payments if states redistribute DSH payments strategically to minimize future reductions.
Overall, we find that deemed DSH hospitals would benefit if states responded strategically to the DSH targeting incentives included in the DHRM (Table 2-5). The incentives created by the reduction methodology appear to encourage a more targeted distribution of DSH payments, but it remains to be seen whether these incentives are powerful
enough to overcome the state-level factors that currently drive DSH payment decisions, such as local politics and considerations about the sources of non-federal funding for DSH payments. Additional data on the effects of the strategic targeting model on particular hospital types are provided in Appendix 2A, and limitations of this model are discussed in Appendix 3A.
In our modeling of the hospital-level effects of DSH allotment reductions, we assume that some states will not spend their full DSH allotment. As discussed in Chapter 1, $1.2 billion in federal DSH allotments went unspent in 2012. In our FY 2018 model of unreduced DSH allotments, approximately $1.4 billion in federal DSH allotments would remain unspent. To draw down
FIGURE 2-7. Distribution of FY 2018 State DSH Allotments (Unreduced and Reduced) per Deemed DSH Hospital Providing at Least One Essential Community Service1 (millions)
0
2
4
6
8
10
12
14
< $5$5–$9
$10–$14
$15–$19
$20–$24
$25–$29
$30–$34
$35–$39
$40–$44
$45–$49≥ $50
Unreduced DSH allotments
Reduced DSH allotments
1112
9
6
4 4 45
0
3 3
12
0
21
21
3 3
9
13
DSH allotment per deemed DSH hospitalthat provides at least one essential community service (millions)
Num
ber o
f sta
tes
Notes: FY is fiscal year. DSH is disproportionate share hospital. DSH allotments include federal funds only. Excludes two states without hospitals that meet our definition for inclusion. 1 Deemed DSH status was estimated based on available Medicaid and low-income utilization data. Our working definition of essential community services includes the following services: burn services, dental services, graduate medical education, HIV/AIDS care, inpatient psychiatric services (through a psychiatric subunit or stand-alone psychiatric hospital), neonatal intensive care units, obstetrics and gynecology services, substance use disorder services, and trauma services. For further discussion of the methodology and limitations, see Appendix 3A.
Source: Dobson DaVanzo and KNG Health 2015 analysis for MACPAC of 2011 and 2013 Medicare cost reports, 2011 as-filed Medicaid DSH audits, the U.S. Census Bureau 2014 American Community Survey, and the 2013 American Hospital Association annual survey.
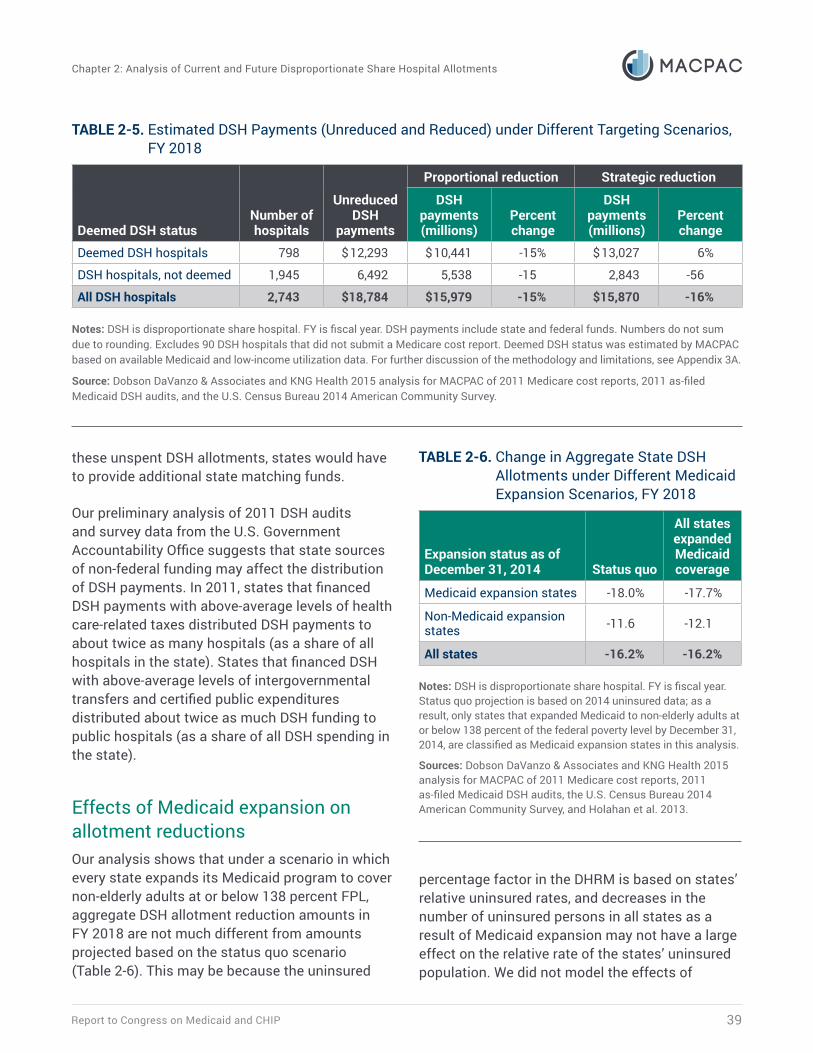
Report to Congress on Medicaid and CHIP 39
Chapter 2: Analysis of Current and Future Disproportionate Share Hospital Allotments
these unspent DSH allotments, states would have to provide additional state matching funds.
Our preliminary analysis of 2011 DSH audits and survey data from the U.S. Government Accountability Office suggests that state sources of non-federal funding may affect the distribution of DSH payments. In 2011, states that financed DSH payments with above-average levels of health care-related taxes distributed DSH payments to about twice as many hospitals (as a share of all hospitals in the state). States that financed DSH with above-average levels of intergovernmental transfers and certified public expenditures distributed about twice as much DSH funding to public hospitals (as a share of all DSH spending in the state).
Effects of Medicaid expansion on allotment reductionsOur analysis shows that under a scenario in which every state expands its Medicaid program to cover non-elderly adults at or below 138 percent FPL, aggregate DSH allotment reduction amounts in FY 2018 are not much different from amounts projected based on the status quo scenario (Table 2-6). This may be because the uninsured
percentage factor in the DHRM is based on states’ relative uninsured rates, and decreases in the number of uninsured persons in all states as a result of Medicaid expansion may not have a large effect on the relative rate of the states’ uninsured population. We did not model the effects of
TABLE 2-5. Estimated DSH Payments (Unreduced and Reduced) under Different Targeting Scenarios, FY 2018
Deemed DSH statusNumber of hospitals
Unreduced DSH
payments
Proportional reduction Strategic reduction
DSH payments (millions)
Percent change
DSH payments (millions)
Percent change
Deemed DSH hospitals 798 $ 12,293 $ 10,441 -15% $ 13,027 6%
DSH hospitals, not deemed 1,945 6,492 5,538 -15 2,843 -56
All DSH hospitals 2,743 $ 18,784 $ 15,979 -15% $ 15,870 -16%
Notes: DSH is disproportionate share hospital. FY is fiscal year. DSH payments include state and federal funds. Numbers do not sum due to rounding. Excludes 90 DSH hospitals that did not submit a Medicare cost report. Deemed DSH status was estimated by MACPAC based on available Medicaid and low-income utilization data. For further discussion of the methodology and limitations, see Appendix 3A.
Source: Dobson DaVanzo & Associates and KNG Health 2015 analysis for MACPAC of 2011 Medicare cost reports, 2011 as-filed Medicaid DSH audits, and the U.S. Census Bureau 2014 American Community Survey.
TABLE 2-6. Change in Aggregate State DSH Allotments under Different Medicaid Expansion Scenarios, FY 2018
Expansion status as of December 31, 2014 Status quo
All states expanded Medicaid coverage
Medicaid expansion states -18.0% -17.7%
Non-Medicaid expansion states -11.6 -12.1
All states -16.2% -16.2%
Notes: DSH is disproportionate share hospital. FY is fiscal year. Status quo projection is based on 2014 uninsured data; as a result, only states that expanded Medicaid to non-elderly adults at or below 138 percent of the federal poverty level by December 31, 2014, are classified as Medicaid expansion states in this analysis.
Sources: Dobson DaVanzo & Associates and KNG Health 2015 analysis for MACPAC of 2011 Medicare cost reports, 2011 as-filed Medicaid DSH audits, the U.S. Census Bureau 2014 American Community Survey, and Holahan et al. 2013.
March 201640
Chapter 2: Analysis of Current and Future Disproportionate Share Hospital Allotments
Medicaid expansion on other factors of the DHRM, but we do not expect large changes to these factors as a result of Medicaid expansion.5
ConclusionThe ACA is changing the number of uninsured patients and the amount of hospital uncompensated care, but state DSH allotments are unlikely to bear any meaningful relationship to these factors, even under pending DSH allotment reductions. The incentives included in CMS’s initial methodology for reducing DSH allotments would encourage states to target more DSH payments to deemed DSH hospitals; at the same time, it appears that they would not discourage states from expanding Medicaid coverage. However, because comprehensive state- and hospital-specific data are not yet available, we cannot make projections based on the full effects of the ACA.
The following chapter explores our data limitations in detail, including the Commission’s recommendations for data improvements that are necessary to fully understand the effects of DSH allotment reductions.
Endnotes1 The ACA set a single income eligibility disregard equal to 5 percentage points of the federal poverty level (FPL). For this reason, eligibility is often referred to at its effective level of 138 percent FPL, even though the federal statute specifies 133 percent FPL.
2 In the Current Population Survey, a monthly survey of households conducted by the U.S. Census Bureau for the U.S. Bureau of Labor Statistics, estimates of health insurance coverage are not mutually exclusive. People can be covered by more than one type of health insurance during the year.
3 Only 74 percent of all hospitals reported uncompensated care on Medicare cost reports in 2013. In light of questions about the reliability of Medicare cost report data, the Centers for Medicare & Medicaid Services (CMS) is working with hospitals to improve the accuracy and completeness of uncompensated care reporting (CMS 2015).
4 Before DSH allotment reductions take effect in FY 2018, DSH allotments are scheduled to increase according to the Consumer Price Index for All Urban Consumers.
5 Although overall Medicaid utilization and uncompensated care are expected to change in states that expand Medicaid, such changes are not expected to have a substantial effect on the high volume of Medicaid inpatients factor or the high level of uncompensated care factor used in the CMS DSH Health Reform Reduction Methodology, since these factors are calculated based on relative Medicaid utilization and relative uncompensated care within a state.
ReferencesAmerican Hospital Association (AHA). 2015. Uncompensated hospital care cost fact sheet. http://www.aha.org/research/policy/finfactsheets.shtml.
Arietta, A. 2013. The impact of the Massachusetts health care reform on unpaid medical bills. Inquiry: Journal of Health Care Organization, Provision, and Financing 50, no. 3: 165–176. http://inq.sagepub.com/content/50/3/165.full.pdf.
Report to Congress on Medicaid and CHIP 41
Chapter 2: Analysis of Current and Future Disproportionate Share Hospital Allotments
Assistant Secretary for Planning and Evaluation (ASPE), U.S. Department of Health and Human Services. 2014. Impact of insurance expansion on hospital uncompensated care costs in 2014. Washington, DC: ASPE. https://aspe.hhs.gov/report/impact-insurance-expansion-hospital-uncompensated-care-costs-2014.
Centers for Medicare & Medicaid Services (CMS), U.S. Department of Health and Human Services. 2015. Medicare program: Hospital inpatient prospective payment systems for acute care hospitals and the long-term care hospital prospective payment system policy changes and fiscal year 2016 rates; revisions of quality reporting requirements for specific providers, including changes related to the electronic health record incentive program; extensions of the Medicare-dependent, small rural hospital program and the low-volume payment adjustment for hospitals. Final rule. Federal Register 80, no. 158 (August 17): 49325–49886. https://federalregister.gov/a/2015-19049.
Colorado Hospital Association (CHA). 2014. Impact of Medicaid expansion on hospitals: Updated for second-quarter 2014. Greenwood Village, CO: CHA Center for Health Information and Data Analytics. http://www.cha.com/Documents/CHA-Study/FINAL-CHA-Medicaid-Expansion-Study-Q2-Sept-2014.aspx.
Cunningham, P., R. Garfield, and R. Rudowitz. 2015. How are hospitals faring under the Affordable Care Act? Early experiences from Ascension Health. Washington, DC: Kaiser Commission on Medicaid and the Uninsured, Kaiser Family Foundation. http://kff.org/health-reform/issue-brief/how-are-hospitals-faring-under-the-affordable-care-act-early-experiences-from-ascension-health/.
Garfield, R., A. Damico, C. Cox, et al. 2015. New estimates of eligibility for ACA coverage among the uninsured. Washington, DC: Kaiser Family Foundation. http://kff.org/health-reform/issue-brief/new-estimates-of-eligibility-for-aca-coverage-among-the-uninsured/.
Holahan, J., M. Buettgens, and S. Dorn. 2013. The cost of not expanding Medicaid. Washington, DC: Kaiser Commission on Medicaid and the Uninsured, Kaiser Family Foundation. http://kff.org/medicaid/report/the-cost-of-not-expanding-medicaid/.
Kenney, G.M., J. Alker, N. Anderson, et al. 2014. A first look at children’s health insurance coverage under the ACA in 2014. Washington, DC: Urban Institute Health Policy Center and Georgetown University Center for Children and Families. http://hrms.urban.org/briefs/Childrens-Health-Insurance-Coverage-under-the-ACA-in-2014.html.
Neuhausen, K., A.C. Davis, J. Needleman, et al. 2014. Disproportionate-share hospital payment reductions may threaten the financial stability of safety-net hospitals. Health Affairs 33, no. 6: 988–996. http://content.healthaffairs.org/content/33/6/988.abstract.
Nikpay, S., T. Buchmueller, and H. Levy. 2015. Early Medicaid expansion in Connecticut stemmed the growth in hospital uncompensated care. Health Affairs 34, no. 7: 1170–1179. http://content.healthaffairs.org/content/34/7/1170.full.html.
Smith, J., and C. Medalia. 2015. Health insurance coverage in the United States: 2014. Current Population Reports, P60-253. Washington, DC: U.S. Census Bureau. https://www.census.gov/content/dam/Census/library/publications/2015/demo/p60-253.pdf.
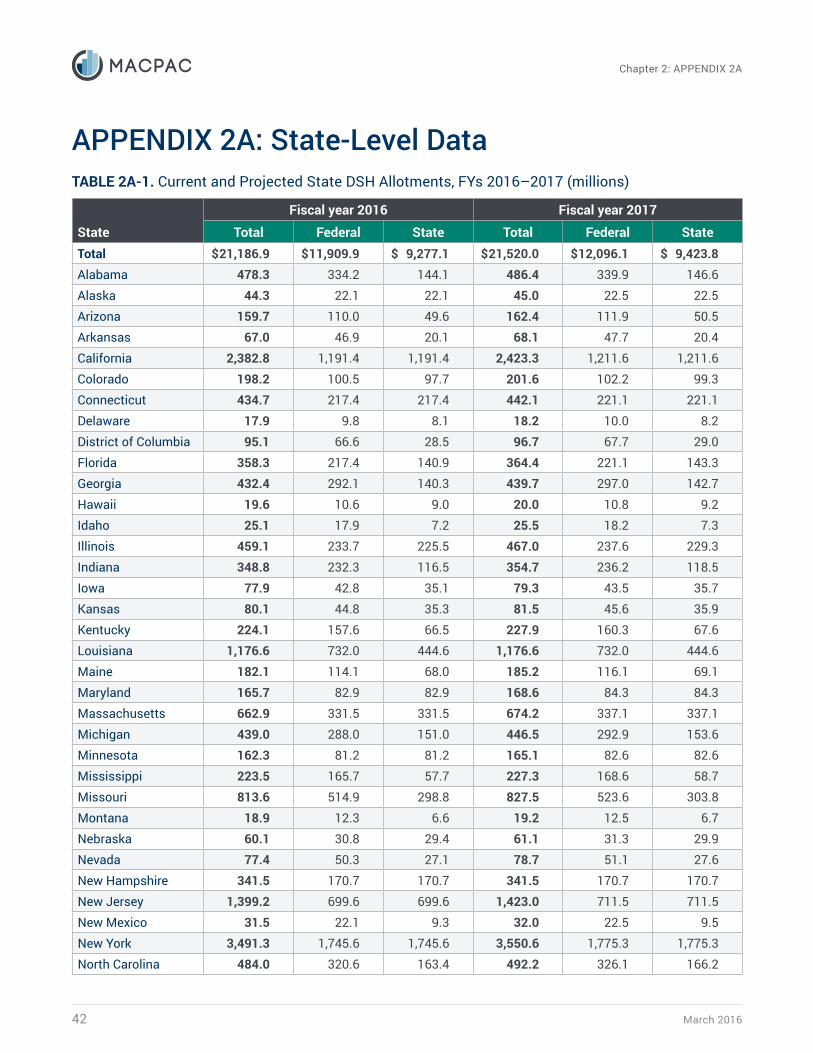
March 201642
Chapter 2: APPENDIX 2A
APPENDIX 2A: State-Level DataTABLE 2A-1. Current and Projected State DSH Allotments, FYs 2016–2017 (millions)
State
Fiscal year 2016 Fiscal year 2017
Total Federal State Total Federal StateTotal $ 21,186.9 $ 11,909.9 $ 9,277.1 $ 21,520.0 $ 12,096.1 $ 9,423.8Alabama 478.3 334.2 144.1 486.4 339.9 146.6Alaska 44.3 22.1 22.1 45.0 22.5 22.5Arizona 159.7 110.0 49.6 162.4 111.9 50.5Arkansas 67.0 46.9 20.1 68.1 47.7 20.4California 2,382.8 1,191.4 1,191.4 2,423.3 1,211.6 1,211.6Colorado 198.2 100.5 97.7 201.6 102.2 99.3Connecticut 434.7 217.4 217.4 442.1 221.1 221.1Delaware 17.9 9.8 8.1 18.2 10.0 8.2District of Columbia 95.1 66.6 28.5 96.7 67.7 29.0Florida 358.3 217.4 140.9 364.4 221.1 143.3Georgia 432.4 292.1 140.3 439.7 297.0 142.7Hawaii 19.6 10.6 9.0 20.0 10.8 9.2Idaho 25.1 17.9 7.2 25.5 18.2 7.3Illinois 459.1 233.7 225.5 467.0 237.6 229.3Indiana 348.8 232.3 116.5 354.7 236.2 118.5Iowa 77.9 42.8 35.1 79.3 43.5 35.7Kansas 80.1 44.8 35.3 81.5 45.6 35.9Kentucky 224.1 157.6 66.5 227.9 160.3 67.6Louisiana 1,176.6 732.0 444.6 1,176.6 732.0 444.6Maine 182.1 114.1 68.0 185.2 116.1 69.1Maryland 165.7 82.9 82.9 168.6 84.3 84.3Massachusetts 662.9 331.5 331.5 674.2 337.1 337.1Michigan 439.0 288.0 151.0 446.5 292.9 153.6Minnesota 162.3 81.2 81.2 165.1 82.6 82.6Mississippi 223.5 165.7 57.7 227.3 168.6 58.7Missouri 813.6 514.9 298.8 827.5 523.6 303.8Montana 18.9 12.3 6.6 19.2 12.5 6.7Nebraska 60.1 30.8 29.4 61.1 31.3 29.9Nevada 77.4 50.3 27.1 78.7 51.1 27.6New Hampshire 341.5 170.7 170.7 341.5 170.7 170.7New Jersey 1,399.2 699.6 699.6 1,423.0 711.5 711.5New Mexico 31.5 22.1 9.3 32.0 22.5 9.5New York 3,491.3 1,745.6 1,745.6 3,550.6 1,775.3 1,775.3North Carolina 484.0 320.6 163.4 492.2 326.1 166.2
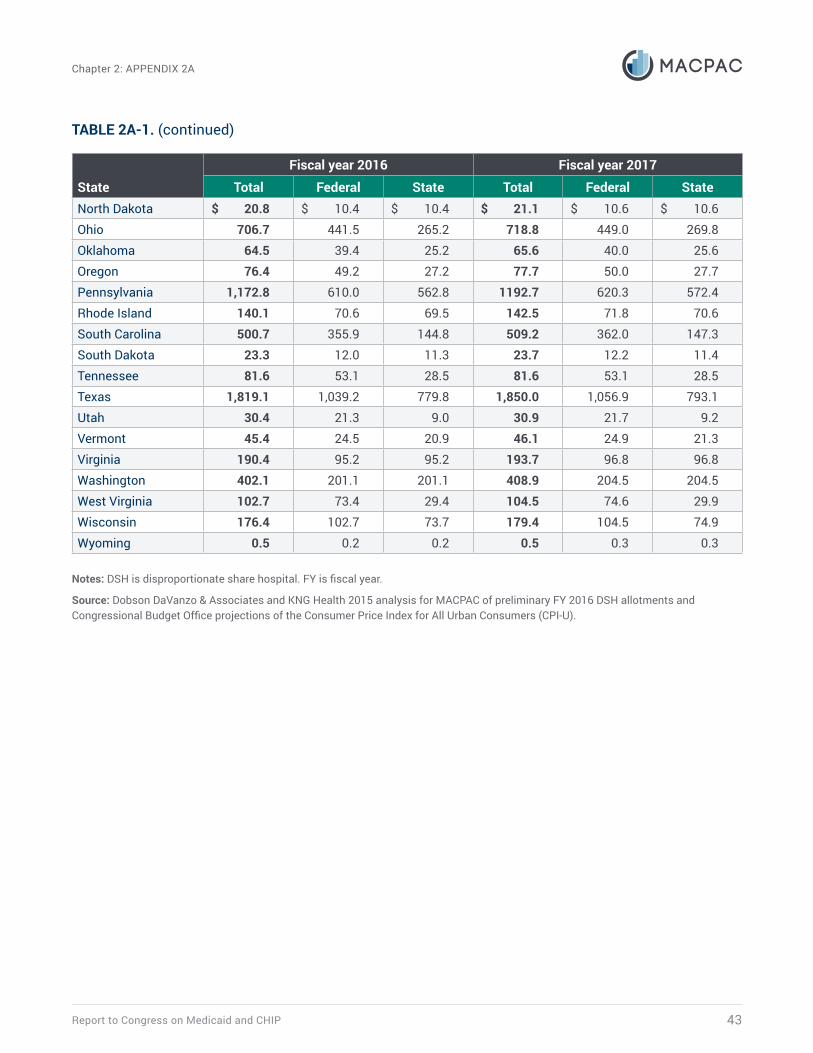
Report to Congress on Medicaid and CHIP 43
Chapter 2: APPENDIX 2A
State
Fiscal year 2016 Fiscal year 2017
Total Federal State Total Federal StateNorth Dakota $ 20.8 $ 10.4 $ 10.4 $ 21.1 $ 10.6 $ 10.6Ohio 706.7 441.5 265.2 718.8 449.0 269.8Oklahoma 64.5 39.4 25.2 65.6 40.0 25.6Oregon 76.4 49.2 27.2 77.7 50.0 27.7Pennsylvania 1,172.8 610.0 562.8 1192.7 620.3 572.4Rhode Island 140.1 70.6 69.5 142.5 71.8 70.6South Carolina 500.7 355.9 144.8 509.2 362.0 147.3South Dakota 23.3 12.0 11.3 23.7 12.2 11.4Tennessee 81.6 53.1 28.5 81.6 53.1 28.5Texas 1,819.1 1,039.2 779.8 1,850.0 1,056.9 793.1Utah 30.4 21.3 9.0 30.9 21.7 9.2Vermont 45.4 24.5 20.9 46.1 24.9 21.3Virginia 190.4 95.2 95.2 193.7 96.8 96.8Washington 402.1 201.1 201.1 408.9 204.5 204.5West Virginia 102.7 73.4 29.4 104.5 74.6 29.9Wisconsin 176.4 102.7 73.7 179.4 104.5 74.9Wyoming 0.5 0.2 0.2 0.5 0.3 0.3
Notes: DSH is disproportionate share hospital. FY is fiscal year.
Source: Dobson DaVanzo & Associates and KNG Health 2015 analysis for MACPAC of preliminary FY 2016 DSH allotments and Congressional Budget Office projections of the Consumer Price Index for All Urban Consumers (CPI-U).
TABLE 2A-1. (continued)
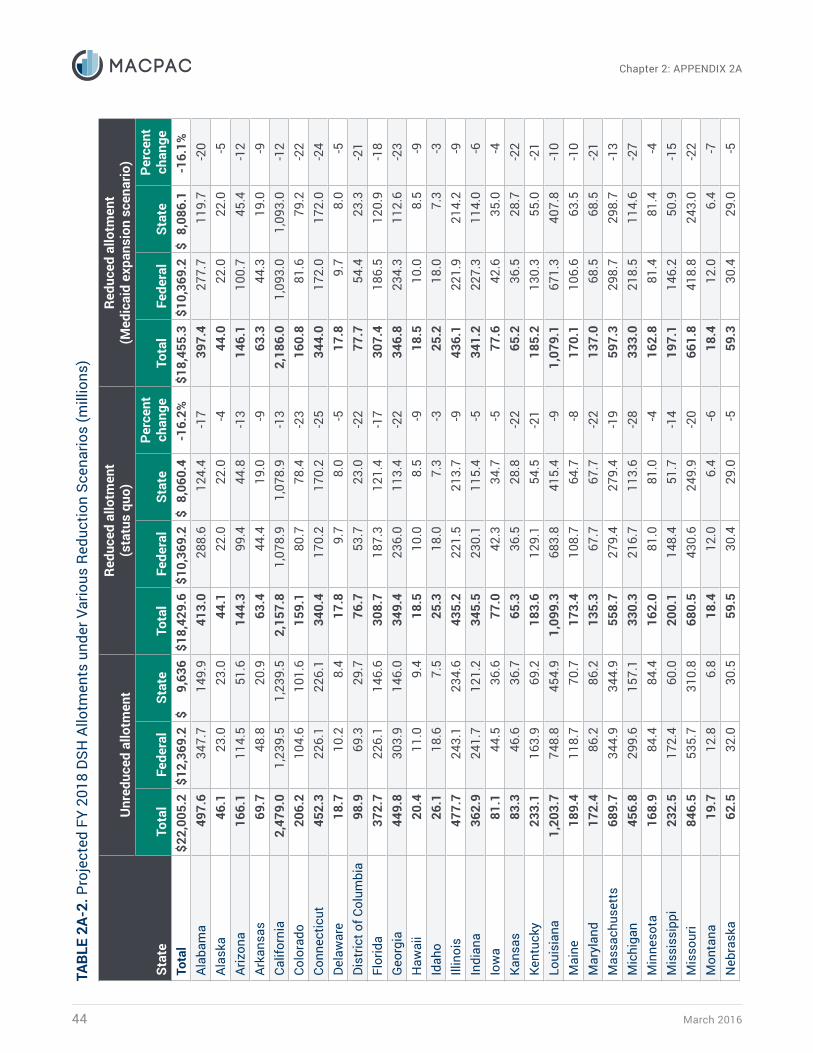
March 201644
Chapter 2: APPENDIX 2ATA
BLE
2A-2
. Pro
ject
ed F
Y 20
18 D
SH A
llotm
ents
und
er V
ario
us R
educ
tion
Scen
ario
s (m
illio
ns)
Stat
e
Unr
educ
ed a
llotm
ent
Redu
ced
allo
tmen
t (s
tatu
s qu
o)Re
duce
d al
lotm
ent
(Med
icai
d ex
pans
ion
scen
ario
)
Tota
lFe
dera
lSt
ate
Tota
lFe
dera
lSt
ate
Perc
ent
chan
geTo
tal
Fede
ral
Stat
ePe
rcen
t ch
ange
Tota
l$ 2
2,00
5.2
$ 12,
369.
2$
9,63
6$ 1
8,42
9.6
$ 10,
369.
2$
8,06
0.4
-16.
2%$ 1
8,45
5.3
$ 10,
369.
2$
8,08
6.1
-16.
1%Al
abam
a49
7.6
347.
714
9.9
413.
028
8.6
124.
4-1
739
7.4
277.
711
9.7
-20
Alas
ka46
.123
.023
.044
.122
.022
.0-4
44.0
22.0
22.0
-5Ar
izon
a16
6.1
114.
551
.614
4.3
99.4
44.8
-13
146.
110
0.7
45.4
-12
Arka
nsas
69.7
48.8
20.9
63.4
44.4
19.0
-963
.344
.319
.0-9
Calif
orni
a2,
479.
01,
239.
51,
239.
52,
157.
81,
078.
91,
078.
9-1
32,
186.
01,
093.
01,
093.
0-1
2Co
lora
do20
6.2
104.
610
1.6
159.
180
.778
.4-2
316
0.8
81.6
79.2
-22
Conn
ectic
ut45
2.3
226.
122
6.1
340.
417
0.2
170.
2-2
534
4.0
172.
017
2.0
-24
Dela
war
e18
.710
.28.
417
.89.
78.
0-5
17.8
9.7
8.0
-5Di
stric
t of C
olum
bia
98.9
69.3
29.7
76.7
53.7
23.0
-22
77.7
54.4
23.3
-21
Flor
ida
372.
722
6.1
146.
630
8.7
187.
312
1.4
-17
307.
418
6.5
120.
9-1
8G
eorg
ia44
9.8
303.
914
6.0
349.
423
6.0
113.
4-2
234
6.8
234.
311
2.6
-23
Haw
aii
20.4
11.0
9.4
18.5
10.0
8.5
-918
.510
.08.
5-9
Idah
o26
.118
.67.
525
.318
.07.
3-3
25.2
18.0
7.3
-3Ill
inoi
s47
7.7
243.
123
4.6
435.
222
1.5
213.
7-9
436.
122
1.9
214.
2-9
Indi
ana
362.
924
1.7
121.
234
5.5
230.
111
5.4
-534
1.2
227.
311
4.0
-6Io
wa
81.1
44.5
36.6
77.0
42.3
34.7
-577
.642
.635
.0-4
Kans
as83
.346
.636
.765
.336
.528
.8-2
265
.236
.528
.7-2
2Ke
ntuc
ky23
3.1
163.
969
.218
3.6
129.
154
.5-2
118
5.2
130.
355
.0-2
1Lo
uisi
ana
1,20
3.7
748.
845
4.9
1,09
9.3
683.
841
5.4
-91,
079.
167
1.3
407.
8-1
0M
aine
189.
411
8.7
70.7
173.
410
8.7
64.7
-817
0.1
106.
663
.5-1
0M
aryl
and
172.
486
.286
.213
5.3
67.7
67.7
-22
137.
068
.568
.5-2
1M
assa
chus
etts
689.
734
4.9
344.
955
8.7
279.
427
9.4
-19
597.
329
8.7
298.
7-1
3M
ichi
gan
456.
829
9.6
157.
133
0.3
216.
711
3.6
-28
333.
021
8.5
114.
6-2
7M
inne
sota
168.
984
.484
.416
2.0
81.0
81.0
-416
2.8
81.4
81.4
-4M
issi
ssip
pi23
2.5
172.
460
.020
0.1
148.
451
.7-1
419
7.1
146.
250
.9-1
5M
isso
uri
846.
553
5.7
310.
868
0.5
430.
624
9.9
-20
661.
841
8.8
243.
0-2
2M
onta
na19
.712
.86.
818
.412
.06.
4-6
18.4
12.0
6.4
-7N
ebra
ska
62.5
32.0
30.5
59.5
30.4
29.0
-559
.330
.429
.0-5
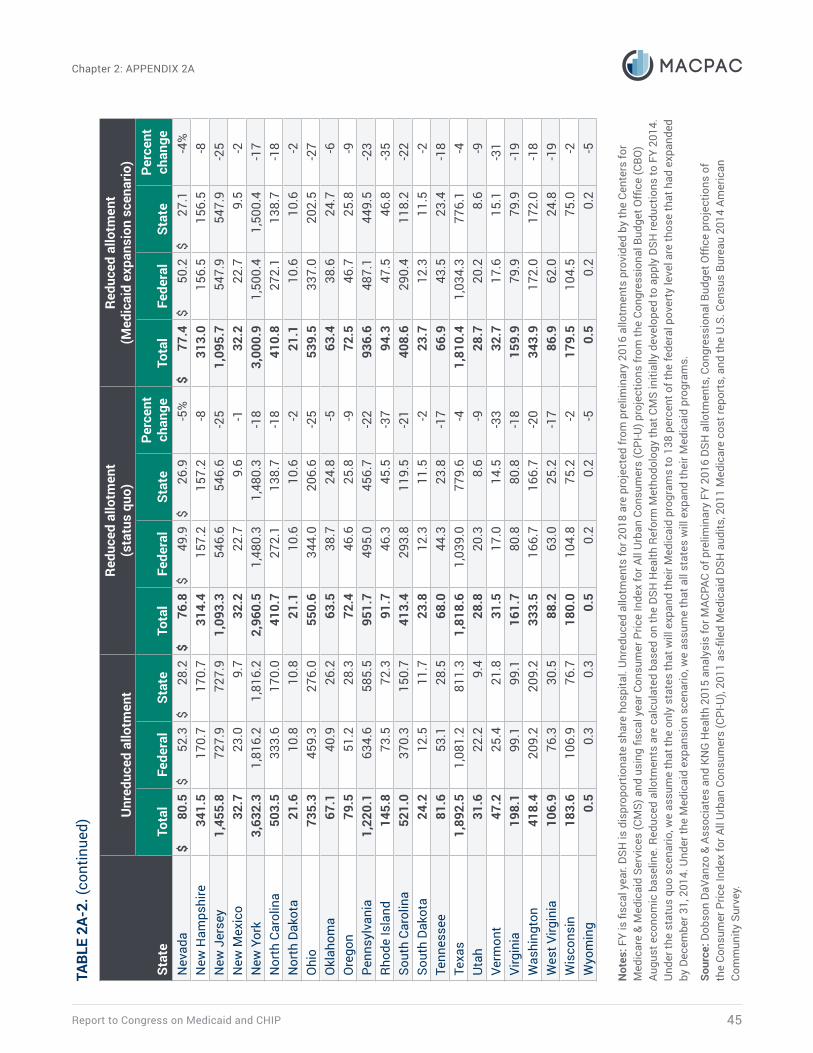
Report to Congress on Medicaid and CHIP 45
Chapter 2: APPENDIX 2A
Stat
e
Unr
educ
ed a
llotm
ent
Redu
ced
allo
tmen
t (s
tatu
s qu
o)Re
duce
d al
lotm
ent
(Med
icai
d ex
pans
ion
scen
ario
)
Tota
lFe
dera
lSt
ate
Tota
lFe
dera
lSt
ate
Perc
ent
chan
geTo
tal
Fede
ral
Stat
ePe
rcen
t ch
ange
Nev
ada
$ 80
.5$
52.3
$ 28
.2$
76.8
$ 49
.9$
26.9
-5%
$ 77
.4$
50.2
$ 27
.1-4
%N
ew H
amps
hire
341.
517
0.7
170.
731
4.4
157.
215
7.2
-831
3.0
156.
515
6.5
-8N
ew J
erse
y1,
455.
872
7.9
727.
91,
093.
354
6.6
546.
6-2
51,
095.
754
7.9
547.
9-2
5N
ew M
exic
o32
.723
.09.
732
.222
.79.
6-1
32.2
22.7
9.5
-2N
ew Y
ork
3,63
2.3
1,81
6.2
1,81
6.2
2,96
0.5
1,48
0.3
1,48
0.3
-18
3,00
0.9
1,50
0.4
1,50
0.4
-17
Nor
th C
arol
ina
503.
533
3.6
170.
041
0.7
272.
113
8.7
-18
410.
827
2.1
138.
7-1
8N
orth
Dak
ota
21.6
10.8
10.8
21.1
10.6
10.6
-221
.110
.610
.6-2
Ohi
o73
5.3
459.
327
6.0
550.
634
4.0
206.
6-2
553
9.5
337.
020
2.5
-27
Okl
ahom
a67
.140
.926
.263
.538
.724
.8-5
63.4
38.6
24.7
-6O
rego
n79
.551
.228
.372
.446
.625
.8-9
72.5
46.7
25.8
-9Pe
nnsy
lvan
ia1,
220.
163
4.6
585.
595
1.7
495.
045
6.7
-22
936.
648
7.1
449.
5-2
3Rh
ode
Isla
nd14
5.8
73.5
72.3
91.7
46.3
45.5
-37
94.3
47.5
46.8
-35
Sout
h Ca
rolin
a52
1.0
370.
315
0.7
413.
429
3.8
119.
5-2
140
8.6
290.
411
8.2
-22
Sout
h Da
kota
24.2
12.5
11.7
23.8
12.3
11.5
-223
.712
.311
.5-2
Tenn
esse
e81
.653
.128
.568
.044
.323
.8-1
766
.943
.523
.4-1
8Te
xas
1,89
2.5
1,08
1.2
811.
31,
818.
61,
039.
077
9.6
-41,
810.
41,
034.
377
6.1
-4U
tah
31.6
22.2
9.4
28.8
20.3
8.6
-928
.720
.28.
6-9
Verm
ont
47.2
25.4
21.8
31.5
17.0
14.5
-33
32.7
17.6
15.1
-31
Virg
inia
198.
199
.199
.116
1.7
80.8
80.8
-18
159.
979
.979
.9-1
9W
ashi
ngto
n41
8.4
209.
220
9.2
333.
516
6.7
166.
7-2
034
3.9
172.
017
2.0
-18
Wes
t Virg
inia
106.
976
.330
.588
.263
.025
.2-1
786
.962
.024
.8-1
9W
isco
nsin
183.
610
6.9
76.7
180.
010
4.8
75.2
-217
9.5
104.
575
.0-2
Wyo
min
g0.
50.
30.
30.
50.
20.
2-5
0.5
0.2
0.2
-5
Not
es: F
Y is
fisc
al y
ear.
DSH
is d
ispr
opor
tiona
te s
hare
hos
pita
l. U
nred
uced
allo
tmen
ts fo
r 201
8 ar
e pr
ojec
ted
from
pre
limin
ary
2016
allo
tmen
ts p
rovi
ded
by th
e Ce
nter
s fo
r M
edic
are
& M
edic
aid
Serv
ices
(CM
S) a
nd u
sing
fisc
al y
ear C
onsu
mer
Pric
e In
dex
for A
ll U
rban
Con
sum
ers
(CPI
-U) p
roje
ctio
ns fr
om th
e Co
ngre
ssio
nal B
udge
t Offi
ce (C
BO)
Augu
st e
cono
mic
bas
elin
e. R
educ
ed a
llotm
ents
are
cal
cula
ted
base
d on
the
DSH
Hea
lth R
efor
m M
etho
dolo
gy th
at C
MS
initi
ally
dev
elop
ed to
app
ly D
SH re
duct
ions
to F
Y 20
14.
Und
er th
e st
atus
quo
sce
nario
, we
assu
me
that
the
only
sta
tes
that
will
exp
and
thei
r Med
icai
d pr
ogra
ms
to 1
38 p
erce
nt o
f the
fede
ral p
over
ty le
vel a
re th
ose
that
had
exp
ande
d by
Dec
embe
r 31,
201
4. U
nder
the
Med
icai
d ex
pans
ion
scen
ario
, we
assu
me
that
all
stat
es w
ill e
xpan
d th
eir M
edic
aid
prog
ram
s.
Sour
ce: D
obso
n Da
Vanz
o &
Asso
ciat
es a
nd K
NG
Hea
lth 2
015
anal
ysis
for M
ACPA
C of
pre
limin
ary
FY 2
016
DSH
allo
tmen
ts, C
ongr
essi
onal
Bud
get O
ffice
pro
ject
ions
of
the
Cons
umer
Pric
e In
dex
for A
ll U
rban
Con
sum
ers
(CPI
-U),
2011
as-
filed
Med
icai
d DS
H a
udits
, 201
1 M
edic
are
cost
repo
rts,
and
the
U.S
. Cen
sus
Bure
au 2
014
Amer
ican
Co
mm
unity
Sur
vey.
TABL
E 2A
-2. (
cont
inue
d)
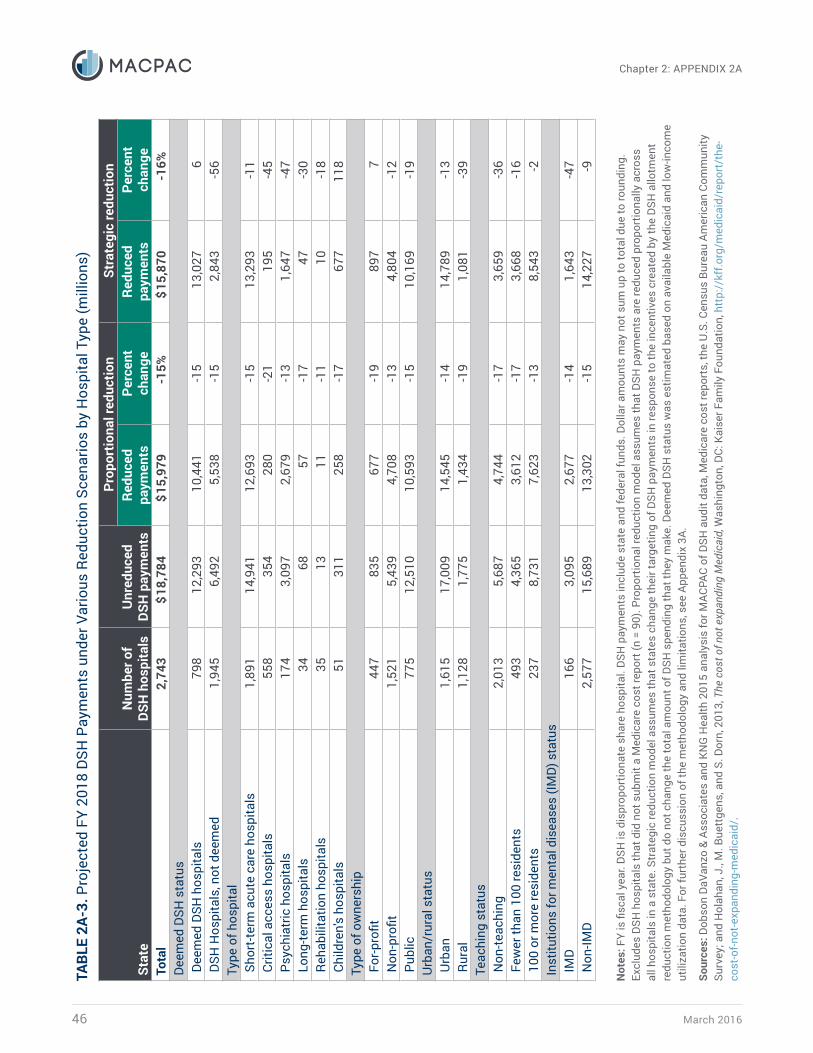
March 201646
Chapter 2: APPENDIX 2ATA
BLE
2A-3
. Pro
ject
ed F
Y 20
18 D
SH P
aym
ents
und
er V
ario
us R
educ
tion
Scen
ario
s by
Hos
pita
l Typ
e (m
illio
ns)
Stat
eN
umbe
r of
DSH
hos
pita
lsU
nred
uced
DS
H p
aym
ents
Prop
ortio
nal r
educ
tion
Stra
tegi
c re
duct
ion
Redu
ced
paym
ents
Perc
ent
chan
geRe
duce
d pa
ymen
tsPe
rcen
t ch
ange
Tota
l2,
743
$ 18,
784
$ 15,
979
-15%
$ 15,
870
-16%
Deem
ed D
SH s
tatu
s D
eem
ed D
SH h
ospi
tals
798
12,2
9310
,441
-15
13,0
276
DSH
Hos
pita
ls, n
ot d
eem
ed1,
945
6,49
25,
538
-15
2,84
3-5
6Ty
pe o
f hos
pita
l S
hort
-term
acu
te c
are
hosp
itals
1,89
114
,941
12,6
93-1
513
,293
-11
Crit
ical
acc
ess
hosp
itals
558
354
280
-21
195
-45
Psy
chia
tric
hos
pita
ls17
43,
097
2,67
9-1
31,
647
-47
Lon
g-te
rm h
ospi
tals
3468
57-1
747
-30
Reh
abili
tatio
n ho
spita
ls35
1311
-11
10-1
8 C
hild
ren'
s ho
spita
ls51
311
258
-17
677
118
Type
of o
wne
rshi
p F
or-p
rofit
447
835
677
-19
897
7 N
on-p
rofit
1,52
15,
439
4,70
8-1
34,
804
-12
Pub
lic77
512
,510
10,5
93-1
510
,169
-19
Urb
an/r
ural
sta
tus
Urb
an1,
615
17,0
0914
,545
-14
14,7
89-1
3 R
ural
1,12
81,
775
1,43
4-1
91,
081
-39
Teac
hing
sta
tus
Non
-teac
hing
2,01
35,
687
4,74
4-1
73,
659
-36
Few
er th
an 1
00 re
side
nts
493
4,36
53,
612
-17
3,66
8-1
6 1
00 o
r mor
e re
side
nts
237
8,73
17,
623
-13
8,54
3-2
Inst
itutio
ns fo
r men
tal d
isea
ses
(IMD)
sta
tus
IMD
166
3,09
52,
677
-14
1,64
3-4
7 N
on-IM
D2,
577
15,6
8913
,302
-15
14,2
27-9
Not
es: F
Y is
fisc
al y
ear.
DSH
is d
ispr
opor
tiona
te s
hare
hos
pita
l. DS
H p
aym
ents
incl
ude
stat
e an
d fe
dera
l fun
ds. D
olla
r am
ount
s m
ay n
ot s
um u
p to
tota
l due
to ro
undi
ng.
Excl
udes
DSH
hos
pita
ls th
at d
id n
ot s
ubm
it a
Med
icar
e co
st re
port
(n =
90)
. Pro
port
iona
l red
uctio
n m
odel
ass
umes
that
DSH
pay
men
ts a
re re
duce
d pr
opor
tiona
lly a
cros
s al
l hos
pita
ls in
a s
tate
. Str
ateg
ic re
duct
ion
mod
el a
ssum
es th
at s
tate
s ch
ange
thei
r tar
getin
g of
DSH
pay
men
ts in
resp
onse
to th
e in
cent
ives
cre
ated
by
the
DSH
allo
tmen
t re
duct
ion
met
hodo
logy
but
do
not c
hang
e th
e to
tal a
mou
nt o
f DSH
spe
ndin
g th
at th
ey m
ake.
Dee
med
DSH
sta
tus
was
est
imat
ed b
ased
on
avai
labl
e M
edic
aid
and
low
-inco
me
utili
zatio
n da
ta. F
or fu
rthe
r dis
cuss
ion
of th
e m
etho
dolo
gy a
nd li
mita
tions
, see
App
endi
x 3A
.
Sour
ces:
Dob
son
DaVa
nzo
& As
soci
ates
and
KN
G H
ealth
201
5 an
alys
is fo
r MAC
PAC
of D
SH a
udit
data
, Med
icar
e co
st re
port
s, th
e U
.S. C
ensu
s Bu
reau
Am
eric
an C
omm
unity
Su
rvey
; and
Hol
ahan
, J.,
M. B
uett
gens
, and
S. D
orn,
201
3, T
he c
ost o
f not
exp
andi
ng M
edic
aid,
Was
hing
ton,
DC:
Kai
ser F
amily
Fou
ndat
ion,
htt
p://
kff.o
rg/m
edic
aid/
repo
rt/t
he-
cost
-of-n
ot-e
xpan
ding
-med
icai
d/.
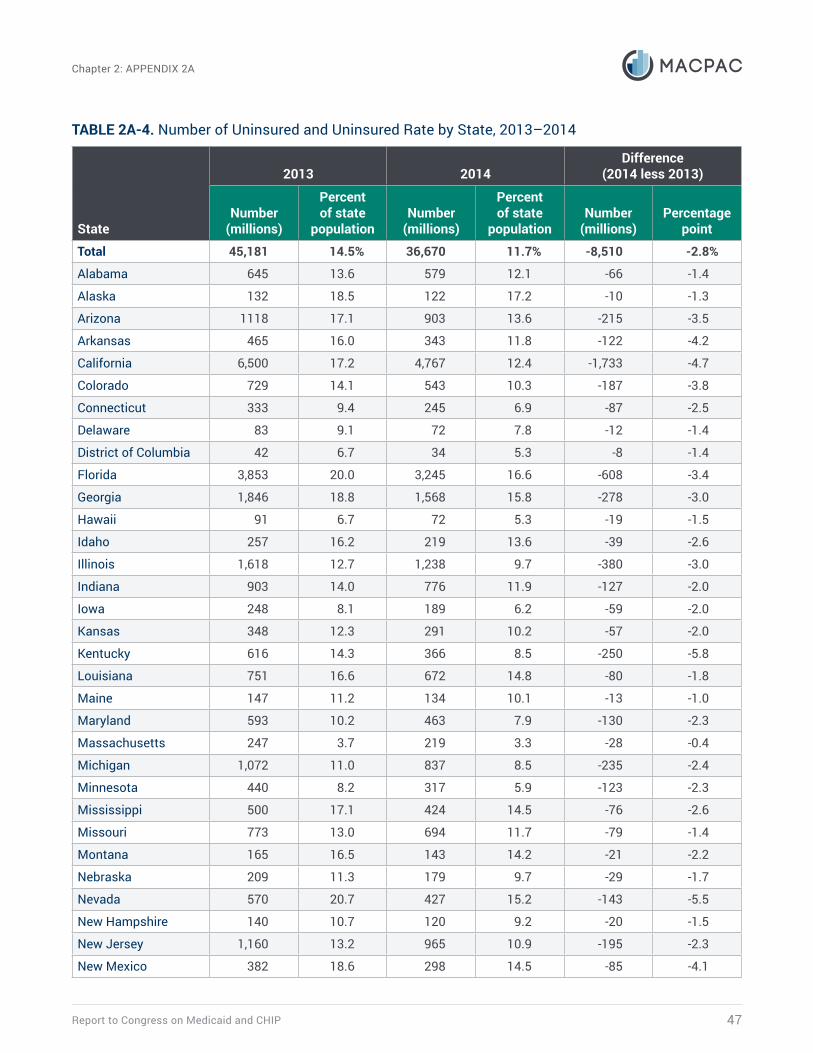
Report to Congress on Medicaid and CHIP 47
Chapter 2: APPENDIX 2A
TABLE 2A-4. Number of Uninsured and Uninsured Rate by State, 2013–2014
State
2013 2014Difference
(2014 less 2013)
Number (millions)
Percent of state
populationNumber
(millions)
Percent of state
populationNumber
(millions)Percentage
point
Total 45,181 14.5% 36,670 11.7% -8,510 -2.8%
Alabama 645 13.6 579 12.1 -66 -1.4
Alaska 132 18.5 122 17.2 -10 -1.3
Arizona 1118 17.1 903 13.6 -215 -3.5
Arkansas 465 16.0 343 11.8 -122 -4.2
California 6,500 17.2 4,767 12.4 -1,733 -4.7
Colorado 729 14.1 543 10.3 -187 -3.8
Connecticut 333 9.4 245 6.9 -87 -2.5
Delaware 83 9.1 72 7.8 -12 -1.4
District of Columbia 42 6.7 34 5.3 -8 -1.4
Florida 3,853 20.0 3,245 16.6 -608 -3.4
Georgia 1,846 18.8 1,568 15.8 -278 -3.0
Hawaii 91 6.7 72 5.3 -19 -1.5
Idaho 257 16.2 219 13.6 -39 -2.6
Illinois 1,618 12.7 1,238 9.7 -380 -3.0
Indiana 903 14.0 776 11.9 -127 -2.0
Iowa 248 8.1 189 6.2 -59 -2.0
Kansas 348 12.3 291 10.2 -57 -2.0
Kentucky 616 14.3 366 8.5 -250 -5.8
Louisiana 751 16.6 672 14.8 -80 -1.8
Maine 147 11.2 134 10.1 -13 -1.0
Maryland 593 10.2 463 7.9 -130 -2.3
Massachusetts 247 3.7 219 3.3 -28 -0.4
Michigan 1,072 11.0 837 8.5 -235 -2.4
Minnesota 440 8.2 317 5.9 -123 -2.3
Mississippi 500 17.1 424 14.5 -76 -2.6
Missouri 773 13.0 694 11.7 -79 -1.4
Montana 165 16.5 143 14.2 -21 -2.2
Nebraska 209 11.3 179 9.7 -29 -1.7
Nevada 570 20.7 427 15.2 -143 -5.5
New Hampshire 140 10.7 120 9.2 -20 -1.5
New Jersey 1,160 13.2 965 10.9 -195 -2.3
New Mexico 382 18.6 298 14.5 -85 -4.1
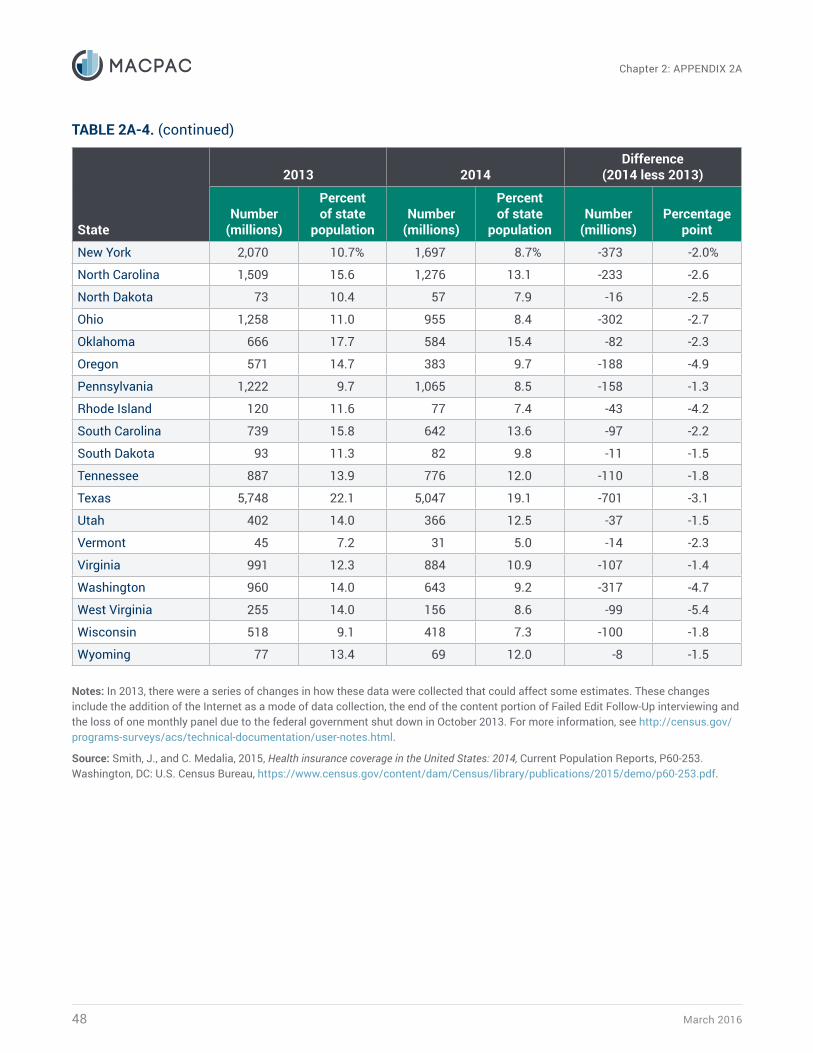
March 201648
Chapter 2: APPENDIX 2A
State
2013 2014Difference
(2014 less 2013)
Number (millions)
Percent of state
populationNumber
(millions)
Percent of state
populationNumber
(millions)Percentage
point
New York 2,070 10.7% 1,697 8.7% -373 -2.0%
North Carolina 1,509 15.6 1,276 13.1 -233 -2.6
North Dakota 73 10.4 57 7.9 -16 -2.5
Ohio 1,258 11.0 955 8.4 -302 -2.7
Oklahoma 666 17.7 584 15.4 -82 -2.3
Oregon 571 14.7 383 9.7 -188 -4.9
Pennsylvania 1,222 9.7 1,065 8.5 -158 -1.3
Rhode Island 120 11.6 77 7.4 -43 -4.2
South Carolina 739 15.8 642 13.6 -97 -2.2
South Dakota 93 11.3 82 9.8 -11 -1.5
Tennessee 887 13.9 776 12.0 -110 -1.8
Texas 5,748 22.1 5,047 19.1 -701 -3.1
Utah 402 14.0 366 12.5 -37 -1.5
Vermont 45 7.2 31 5.0 -14 -2.3
Virginia 991 12.3 884 10.9 -107 -1.4
Washington 960 14.0 643 9.2 -317 -4.7
West Virginia 255 14.0 156 8.6 -99 -5.4
Wisconsin 518 9.1 418 7.3 -100 -1.8
Wyoming 77 13.4 69 12.0 -8 -1.5
Notes: In 2013, there were a series of changes in how these data were collected that could affect some estimates. These changes include the addition of the Internet as a mode of data collection, the end of the content portion of Failed Edit Follow-Up interviewing and the loss of one monthly panel due to the federal government shut down in October 2013. For more information, see http://census.gov/programs-surveys/acs/technical-documentation/user-notes.html.
Source: Smith, J., and C. Medalia, 2015, Health insurance coverage in the United States: 2014, Current Population Reports, P60-253. Washington, DC: U.S. Census Bureau, https://www.census.gov/content/dam/Census/library/publications/2015/demo/p60-253.pdf.
TABLE 2A-4. (continued)
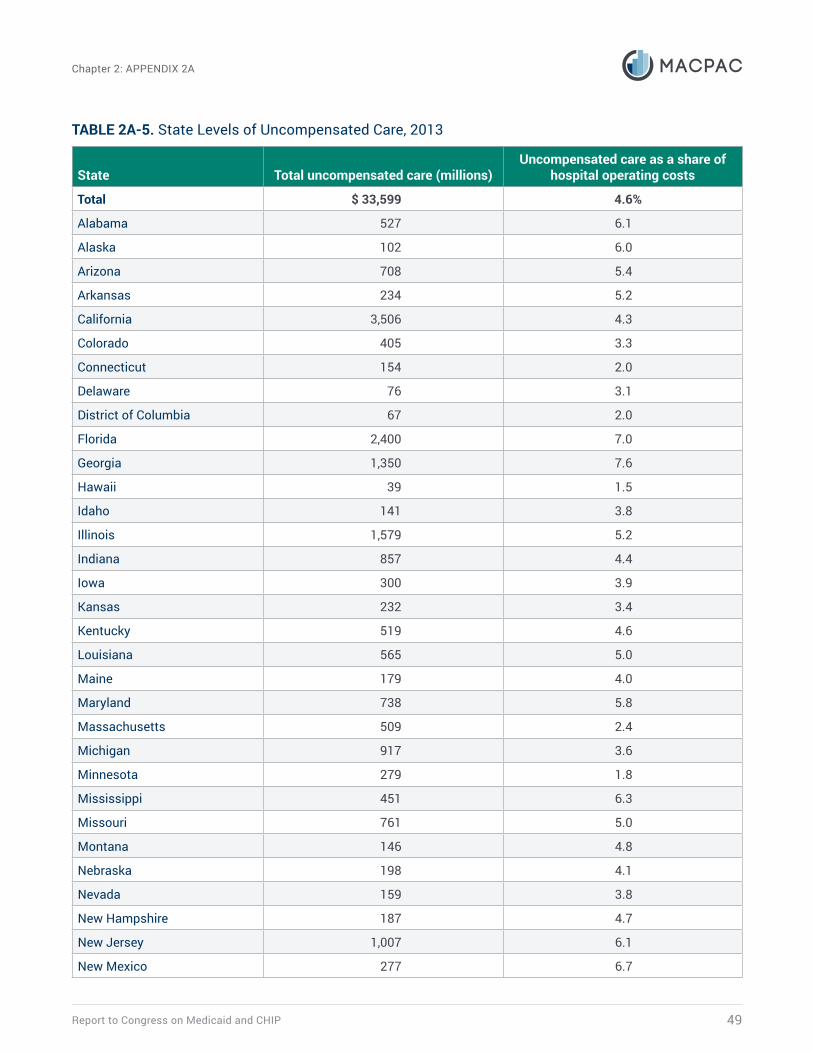
Report to Congress on Medicaid and CHIP 49
Chapter 2: APPENDIX 2A
TABLE 2A-5. State Levels of Uncompensated Care, 2013
State Total uncompensated care (millions)Uncompensated care as a share of
hospital operating costs
Total $ 33,599 4.6%
Alabama 527 6.1
Alaska 102 6.0
Arizona 708 5.4
Arkansas 234 5.2
California 3,506 4.3
Colorado 405 3.3
Connecticut 154 2.0
Delaware 76 3.1
District of Columbia 67 2.0
Florida 2,400 7.0
Georgia 1,350 7.6
Hawaii 39 1.5
Idaho 141 3.8
Illinois 1,579 5.2
Indiana 857 4.4
Iowa 300 3.9
Kansas 232 3.4
Kentucky 519 4.6
Louisiana 565 5.0
Maine 179 4.0
Maryland 738 5.8
Massachusetts 509 2.4
Michigan 917 3.6
Minnesota 279 1.8
Mississippi 451 6.3
Missouri 761 5.0
Montana 146 4.8
Nebraska 198 4.1
Nevada 159 3.8
New Hampshire 187 4.7
New Jersey 1,007 6.1
New Mexico 277 6.7
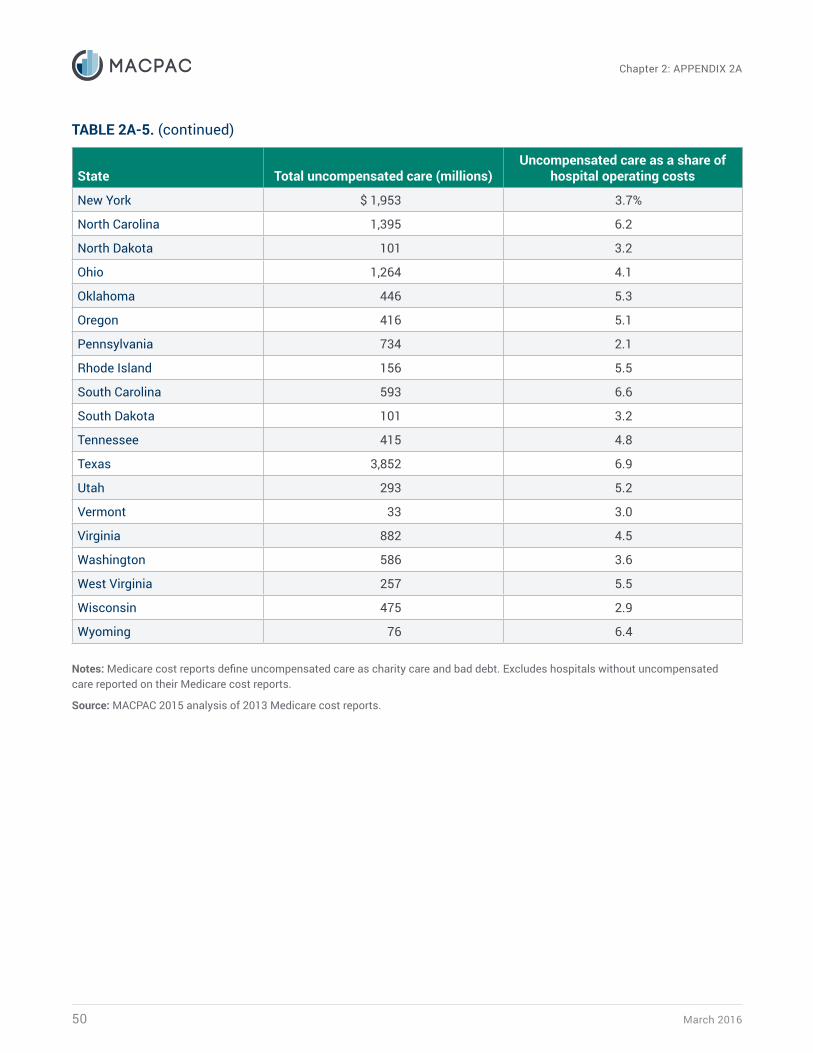
March 201650
Chapter 2: APPENDIX 2A
State Total uncompensated care (millions)Uncompensated care as a share of
hospital operating costs
New York $ 1,953 3.7%
North Carolina 1,395 6.2
North Dakota 101 3.2
Ohio 1,264 4.1
Oklahoma 446 5.3
Oregon 416 5.1
Pennsylvania 734 2.1
Rhode Island 156 5.5
South Carolina 593 6.6
South Dakota 101 3.2
Tennessee 415 4.8
Texas 3,852 6.9
Utah 293 5.2
Vermont 33 3.0
Virginia 882 4.5
Washington 586 3.6
West Virginia 257 5.5
Wisconsin 475 2.9
Wyoming 76 6.4
Notes: Medicare cost reports define uncompensated care as charity care and bad debt. Excludes hospitals without uncompensated care reported on their Medicare cost reports.
Source: MACPAC 2015 analysis of 2013 Medicare cost reports.
TABLE 2A-5. (continued)
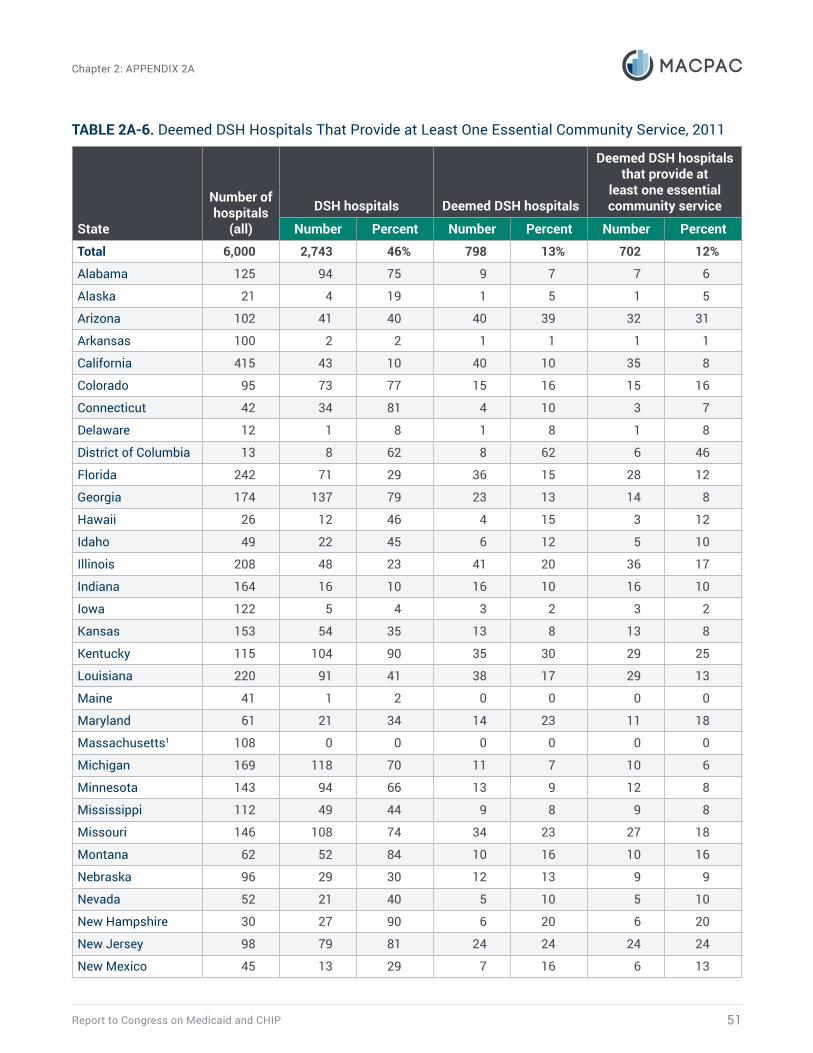
Report to Congress on Medicaid and CHIP 51
Chapter 2: APPENDIX 2A
TABLE 2A-6. Deemed DSH Hospitals That Provide at Least One Essential Community Service, 2011
State
Number of hospitals
(all)
DSH hospitals Deemed DSH hospitals
Deemed DSH hospitals that provide at
least one essential community service
Number Percent Number Percent Number Percent
Total 6,000 2,743 46% 798 13% 702 12%
Alabama 125 94 75 9 7 7 6
Alaska 21 4 19 1 5 1 5
Arizona 102 41 40 40 39 32 31
Arkansas 100 2 2 1 1 1 1
California 415 43 10 40 10 35 8
Colorado 95 73 77 15 16 15 16
Connecticut 42 34 81 4 10 3 7
Delaware 12 1 8 1 8 1 8
District of Columbia 13 8 62 8 62 6 46
Florida 242 71 29 36 15 28 12
Georgia 174 137 79 23 13 14 8
Hawaii 26 12 46 4 15 3 12
Idaho 49 22 45 6 12 5 10
Illinois 208 48 23 41 20 36 17
Indiana 164 16 10 16 10 16 10
Iowa 122 5 4 3 2 3 2
Kansas 153 54 35 13 8 13 8
Kentucky 115 104 90 35 30 29 25
Louisiana 220 91 41 38 17 29 13
Maine 41 1 2 0 0 0 0
Maryland 61 21 34 14 23 11 18
Massachusetts1 108 0 0 0 0 0 0
Michigan 169 118 70 11 7 10 6
Minnesota 143 94 66 13 9 12 8
Mississippi 112 49 44 9 8 9 8
Missouri 146 108 74 34 23 27 18
Montana 62 52 84 10 16 10 16
Nebraska 96 29 30 12 13 9 9
Nevada 52 21 40 5 10 5 10
New Hampshire 30 27 90 6 20 6 20
New Jersey 98 79 81 24 24 24 24
New Mexico 45 13 29 7 16 6 13
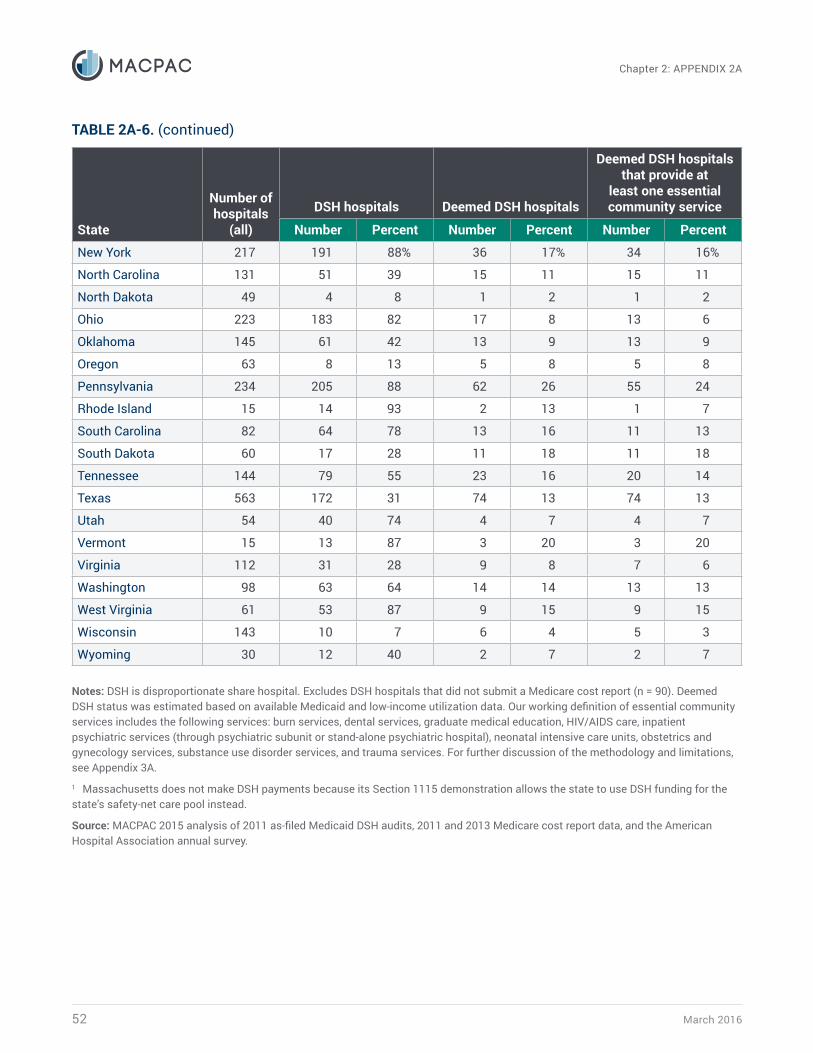
March 201652
Chapter 2: APPENDIX 2A
State
Number of hospitals
(all)
DSH hospitals Deemed DSH hospitals
Deemed DSH hospitals that provide at
least one essential community service
Number Percent Number Percent Number Percent
New York 217 191 88% 36 17% 34 16%
North Carolina 131 51 39 15 11 15 11
North Dakota 49 4 8 1 2 1 2
Ohio 223 183 82 17 8 13 6
Oklahoma 145 61 42 13 9 13 9
Oregon 63 8 13 5 8 5 8
Pennsylvania 234 205 88 62 26 55 24
Rhode Island 15 14 93 2 13 1 7
South Carolina 82 64 78 13 16 11 13
South Dakota 60 17 28 11 18 11 18
Tennessee 144 79 55 23 16 20 14
Texas 563 172 31 74 13 74 13
Utah 54 40 74 4 7 4 7
Vermont 15 13 87 3 20 3 20
Virginia 112 31 28 9 8 7 6
Washington 98 63 64 14 14 13 13
West Virginia 61 53 87 9 15 9 15
Wisconsin 143 10 7 6 4 5 3
Wyoming 30 12 40 2 7 2 7
Notes: DSH is disproportionate share hospital. Excludes DSH hospitals that did not submit a Medicare cost report (n = 90). Deemed DSH status was estimated based on available Medicaid and low-income utilization data. Our working definition of essential community services includes the following services: burn services, dental services, graduate medical education, HIV/AIDS care, inpatient psychiatric services (through psychiatric subunit or stand-alone psychiatric hospital), neonatal intensive care units, obstetrics and gynecology services, substance use disorder services, and trauma services. For further discussion of the methodology and limitations, see Appendix 3A.1 Massachusetts does not make DSH payments because its Section 1115 demonstration allows the state to use DSH funding for the state’s safety-net care pool instead.
Source: MACPAC 2015 analysis of 2011 as-filed Medicaid DSH audits, 2011 and 2013 Medicare cost report data, and the American Hospital Association annual survey.
TABLE 2A-6. (continued)
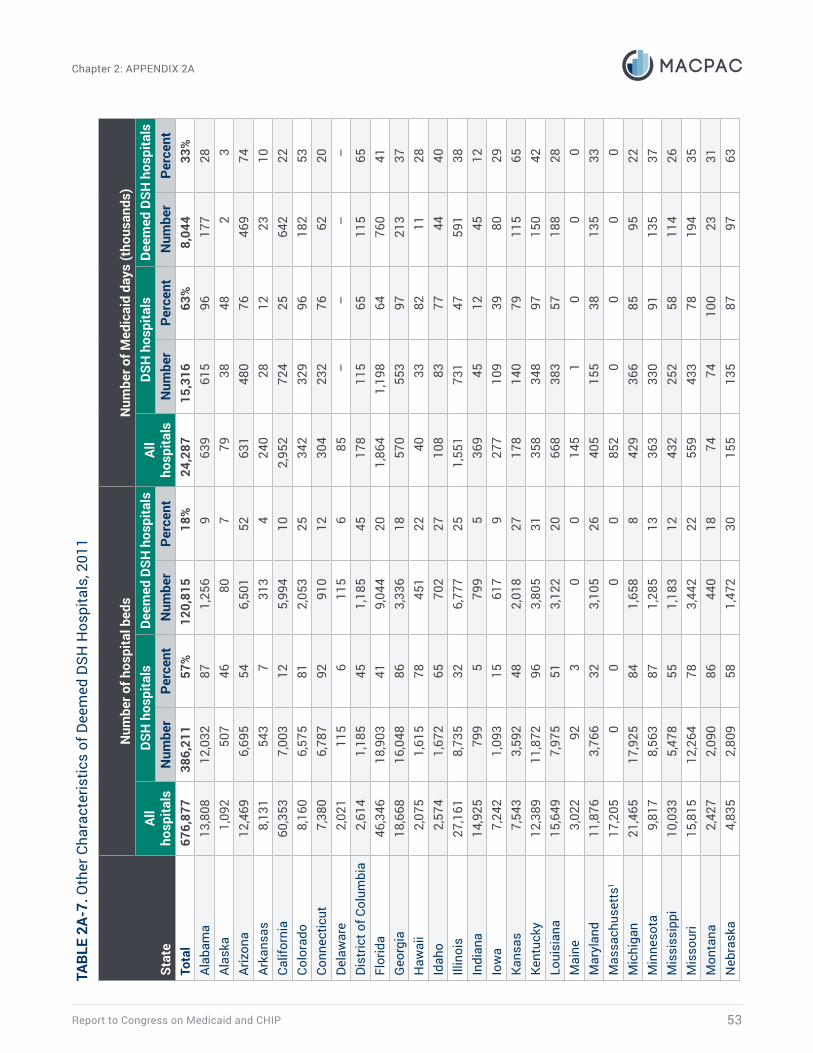
Report to Congress on Medicaid and CHIP 53
Chapter 2: APPENDIX 2ATA
BLE
2A-7
. Oth
er C
hara
cter
istic
s of
Dee
med
DSH
Hos
pita
ls, 2
011
Stat
e
Num
ber o
f hos
pita
l bed
sN
umbe
r of M
edic
aid
days
(tho
usan
ds)
All
hosp
itals
DSH
hos
pita
lsDe
emed
DSH
hos
pita
lsAl
l ho
spita
lsDS
H h
ospi
tals
Deem
ed D
SH h
ospi
tals
Num
ber
Perc
ent
Num
ber
Perc
ent
Num
ber
Perc
ent
Num
ber
Perc
ent
Tota
l67
6,87
738
6,21
157
%12
0,81
518
%24
,287
15,3
1663
%8,
044
33%
Alab
ama
13,8
0812
,032
871,
256
963
961
596
177
28Al
aska
1,09
250
746
807
7938
482
3Ar
izon
a12
,469
6,69
554
6,50
152
631
480
7646
974
Arka
nsas
8,13
154
37
313
424
028
1223
10Ca
lifor
nia
60,3
537,
003
125,
994
102,
952
724
2564
222
Colo
rado
8,16
06,
575
812,
053
2534
232
996
182
53Co
nnec
ticut
7,38
06,
787
9291
012
304
232
7662
20De
law
are
2,02
111
56
115
685
–
––
–Di
stric
t of C
olum
bia
2,61
41,
185
451,
185
4517
811
565
115
65Fl
orid
a46
,346
18,9
0341
9,04
420
1,86
41,
198
6476
041
Geo
rgia
18,6
6816
,048
863,
336
1857
055
397
213
37H
awai
i2,
075
1,61
578
451
2240
3382
1128
Idah
o2,
574
1,67
265
702
2710
883
7744
40Ill
inoi
s27
,161
8,73
532
6,77
725
1,55
173
147
591
38In
dian
a14
,925
799
579
95
369
4512
4512
Iow
a7,
242
1,09
315
617
927
710
939
8029
Kans
as7,
543
3,59
248
2,01
827
178
140
7911
565
Kent
ucky
12,3
8911
,872
963,
805
3135
834
897
150
42Lo
uisi
ana
15,6
497,
975
513,
122
2066
838
357
188
28M
aine
3,02
292
30
014
51
00
0M
aryl
and
11,8
763,
766
323,
105
2640
515
538
135
33M
assa
chus
etts
117
,205
00
00
852
00
00
Mic
higa
n21
,465
17,9
2584
1,65
88
429
366
8595
22M
inne
sota
9,81
78,
563
871,
285
1336
333
091
135
37M
issi
ssip
pi10
,033
5,47
855
1,18
312
432
252
5811
426
Mis
sour
i15
,815
12,2
6478
3,44
222
559
433
7819
435
Mon
tana
2,42
72,
090
8644
018
7474
100
2331
Neb
rask
a4,
835
2,80
958
1,47
230
155
135
8797
63
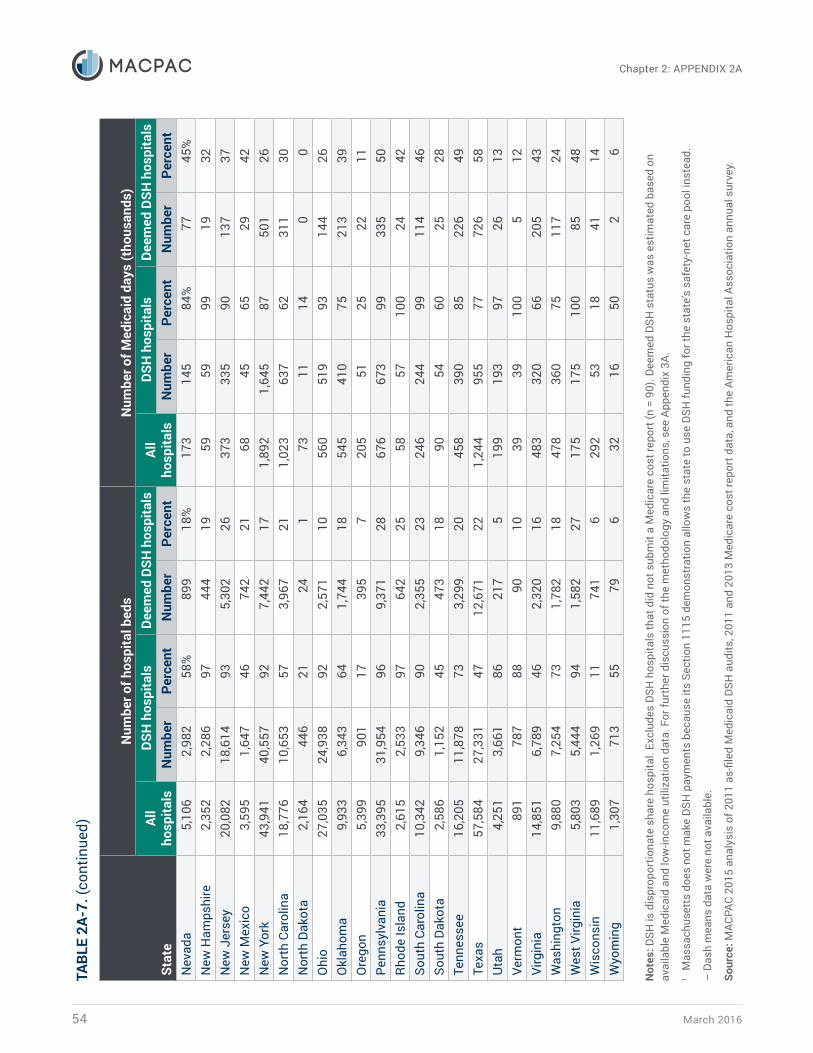
March 201654
Chapter 2: APPENDIX 2A
Stat
e
Num
ber o
f hos
pita
l bed
sN
umbe
r of M
edic
aid
days
(tho
usan
ds)
All
hosp
itals
DSH
hos
pita
lsDe
emed
DSH
hos
pita
lsAl
l ho
spita
lsDS
H h
ospi
tals
Deem
ed D
SH h
ospi
tals
Num
ber
Perc
ent
Num
ber
Perc
ent
Num
ber
Perc
ent
Num
ber
Perc
ent
Nev
ada
5,10
62,
982
58%
899
18%
173
145
84%
7745
%N
ew H
amps
hire
2,35
22,
286
9744
419
5959
9919
32N
ew J
erse
y20
,082
18,6
1493
5,30
226
373
335
9013
737
New
Mex
ico
3,59
51,
647
4674
221
6845
6529
42N
ew Y
ork
43,9
4140
,557
927,
442
171,
892
1,64
587
501
26N
orth
Car
olin
a18
,776
10,6
5357
3,96
721
1,02
363
762
311
30N
orth
Dak
ota
2,16
444
621
241
7311
140
0O
hio
27,0
3524
,938
922,
571
1056
051
993
144
26O
klah
oma
9,93
36,
343
641,
744
1854
541
075
213
39O
rego
n5,
399
901
1739
57
205
5125
2211
Penn
sylv
ania
33,3
9531
,954
969,
371
2867
667
399
335
50Rh
ode
Isla
nd2,
615
2,53
397
642
2558
5710
024
42So
uth
Caro
lina
10,3
429,
346
902,
355
2324
624
499
114
46So
uth
Dako
ta2,
586
1,15
245
473
1890
5460
2528
Tenn
esse
e16
,205
11,8
7873
3,29
920
458
390
8522
649
Texa
s57
,584
27,3
3147
12,6
7122
1,24
495
577
726
58U
tah
4,25
13,
661
8621
75
199
193
9726
13Ve
rmon
t89
178
788
9010
3939
100
512
Virg
inia
14,8
516,
789
462,
320
1648
332
066
205
43W
ashi
ngto
n9,
880
7,25
473
1,78
218
478
360
7511
724
Wes
t Virg
inia
5,80
35,
444
941,
582
2717
517
510
085
48W
isco
nsin
11,6
891,
269
1174
16
292
5318
4114
Wyo
min
g1,
307
713
5579
632
1650
26
Not
es: D
SH is
dis
prop
ortio
nate
sha
re h
ospi
tal.
Excl
udes
DSH
hos
pita
ls th
at d
id n
ot s
ubm
it a
Med
icar
e co
st re
port
(n =
90)
. Dee
med
DSH
sta
tus
was
est
imat
ed b
ased
on
avai
labl
e M
edic
aid
and
low
-inco
me
utili
zatio
n da
ta. F
or fu
rthe
r dis
cuss
ion
of th
e m
etho
dolo
gy a
nd li
mita
tions
, see
App
endi
x 3A
.1
Mas
sach
uset
ts d
oes
not m
ake
DSH
pay
men
ts b
ecau
se it
s Se
ctio
n 11
15 d
emon
stra
tion
allo
ws
the
stat
e to
use
DSH
fund
ing
for t
he s
tate
’s s
afet
y-ne
t car
e po
ol in
stea
d.
– D
ash
mea
ns d
ata
wer
e no
t ava
ilabl
e.
Sour
ce: M
ACPA
C 20
15 a
naly
sis
of 2
011
as-fi
led
Med
icai
d DS
H a
udits
, 201
1 an
d 20
13 M
edic
are
cost
repo
rt d
ata,
and
the
Amer
ican
Hos
pita
l Ass
ocia
tion
annu
al s
urve
y.
TABL
E 2A
-7. (
cont
inue
d)
CHAPTER 3
Improving Data as the First Step to a More Targeted Disproportionate Share Hospital Policy
March 201656
Chapter 3: Improving Data as the First Step to a More Targeted Disproportionate Share Hospital Policy
Improving Data as the First Step to a More Targeted Disproportionate Share Hospital Policy
Recommendation• The Secretary of the U.S. Department of Health and Human Services should collect and report
hospital-specific data on all types of Medicaid payments for all hospitals that receive them. In addition, the Secretary should collect and report data on the sources of non-federal share necessary to determine net Medicaid payment at the provider level.
Key Points• In the Commission’s view, Medicaid disproportionate share hospital (DSH) payments should
be better targeted to the hospitals that serve a disproportionate share of Medicaid and low-income patients and have higher levels of uncompensated care, consistent with the original statutory intent.
• The scheduled reduction of Medicaid DSH allotments of 16 percent in fiscal year (FY) 2018 and up to 55 percent in FY 2025 makes such targeting particularly important.
• Lack of complete and timely data on Medicaid shortfall creates substantial challenges in considering how to better target payments in the future.
– DSH audits suggest that some hospitals receive Medicaid payments that exceed their costs, but these audits do not include information about provider contributions to the state’s Medicaid share, which could be considered an additional cost, thus reducing net payments.
– Existing data sources do not include complete provider-level data on non-DSH supplemental payments, which are a substantial source of Medicaid revenue for many hospitals.
• In future reports, the Commission will continue to monitor the effects of the Patient Protection and Affordable Care Act (ACA, P.L. 111-148, as amended) on hospitals receiving DSH payments.
• The Commission will also more fully explore potential policy approaches to improving the targeting of federal Medicaid DSH funding, including:
– modifying the criteria for DSH payment eligibility;
– redefining uncompensated care for Medicaid DSH purposes; and
– rebasing states’ DSH allotments.
Report to Congress on Medicaid and CHIP 57
Chapter 3: Improving Data as the First Step to a More Targeted Disproportionate Share Hospital Policy
CHAPTER 3: Improving Data as the First Step to a More Targeted Disproportionate Share Hospital Policy MACPAC’s analyses find wide variation in the level and distribution of current state DSH allotments, which have little meaningful relationship to measures meant to identify those safety net institutions most in need. In the Commission’s view, Medicaid DSH payments should be better targeted toward the hospitals that serve a disproportionate share of Medicaid and low-income patients and have higher levels of uncompensated care, consistent with the original statutory intent. The scheduled reduction of Medicaid DSH allotments of 16 percent in fiscal year (FY) 2018 and up to 55 percent in FY 2025 makes such targeting particularly important. It also creates an opportunity to do so, as states will need to review their DSH spending in response to the allotment reductions.
The Commission will continue analyzing federal policy approaches to improve the targeting of Medicaid DSH payments in future reports. To this end, we plan to examine several key questions, including:
• Are there better measures to identify states and hospitals that should be targeted for DSH funding?
• To what extent do DSH hospitals receive other supplemental payments from Medicaid, Medicare, and other sources, which may affect their amount of uncompensated care regardless of their low-income utilization?
• To what extent should the source of non-federal share affect the distribution of DSH payments?
• How do DSH payments relate to community benefit expenditures for non-profit hospitals?
• How should DSH payments relate to the adequacy of regular Medicaid payments to hospitals?
• What policy approaches would strike the right balance between providing flexibility to states in designing payment and financing methods and ensuring that limited federal DSH dollars are distributed appropriately?
• What policy approaches would best align with the statutory principles for Medicaid payment policy: efficiency, economy, quality, and access?
Our ability to answer these questions will be affected by the availability of timely and reliable data at the institutional level. Existing data sources have substantial limitations for identifying hospitals with the highest levels of uncompensated care, and particularly their amounts of Medicaid shortfall. Available data are also insufficient for assessing the amount of total Medicaid payments (including all supplemental payments) an institution receives and the extent to which the institution contributes to the state’s Medicaid share.
Because of the importance of these data for developing DSH policy and improving payment transparency and accountability, the Commission recommends that the Secretary of the U.S. Department of Health and Human Services should collect and report hospital-specific data on all types of Medicaid payments for all hospitals that receive them. In addition, the Secretary should collect and report data on the sources of non-federal share necessary to determine net Medicaid payment at the provider level.
March 201658
Chapter 3: Improving Data as the First Step to a More Targeted Disproportionate Share Hospital Policy
We begin this chapter by describing the limitations of current data sources for purposes of analyzing and improving DSH payment policy. We then present the Commission’s rationale for recommending improved federal collection of provider-level Medicaid payment data. We conclude by outlining some topics for future analysis and broad approaches to improving the targeting of Medicaid DSH payments; we intend to develop these ideas in future reports.
Data LimitationsAnalyses of approaches to improve the targeting of Medicaid DSH payments require complete and timely hospital-level financial data, including costs attributable to different patient populations and sources of revenue (e.g., Medicaid, private pay, and other government subsidies). Currently, there are only two national data sources that provide this information. Although they have helped us begin to understand current Medicaid DSH policy and potential policy options for further exploration, it is important to keep in mind the limitations described below to avoid drawing conclusions that may not be fully supported.
Medicaid DSH audit reports States are required to submit to the Centers for Medicare & Medicaid Services (CMS) audited financial reports of all hospitals that receive Medicaid DSH payments. These reports include information about Medicaid patient revenue, supplemental payments, and the costs of care for Medicaid and uninsured patients. Primary limitations include the following:
• Timely data are not available. Data are published about five years after payments are made, and thus may not reflect current DSH payment policies and levels of uncompensated care (e.g., there are no current data from the period following Medicaid expansion in 2014).
• Comparable data are not available for about half of U.S. hospitals. Because DSH audits are limited to hospitals that receive DSH payments, these data are not sufficient to determine the full amount of a state’s uncompensated care or how well a state targets its DSH payments to high-need hospitals.
Medicare cost reports All hospitals that receive Medicare payments (that is, virtually all U.S. hospitals with the exception of some children’s hospitals) are required to submit annual reports on hospital finances, including data on uncompensated care. Primary limitations include the following:
• These data do not describe Medicaid payments in adequate detail. For example, Medicaid DSH payments are not distinguished from other Medicaid revenue, meaning that Medicaid shortfall cannot be determined reliably.
• The definition of uncompensated care in the Medicare cost reports differs from that used for Medicaid DSH payments. Medicare cost reports provide data on charity care and bad debt only, a scope that differs from the uncompensated care measures on Medicaid DSH audits. Further, there are questions about the current reliability of the Medicare cost report uncompensated care data due to outliers and missing data (CMS 2015).
Additionally, neither the Medicare cost report nor the Medicaid DSH audit fully account for the non-federal share of Medicaid payments that is contributed by hospitals themselves, resulting in a potential overstatement of the net amount of Medicaid payments that hospitals receive. Although hospital provider taxes are included in calculations of Medicaid costs, intergovernmental transfers (IGTs) and certified public expenditures (CPEs) are not. The amount of money represented by this absence is significant: in 2012, about two-thirds of DSH payments were financed by non-state
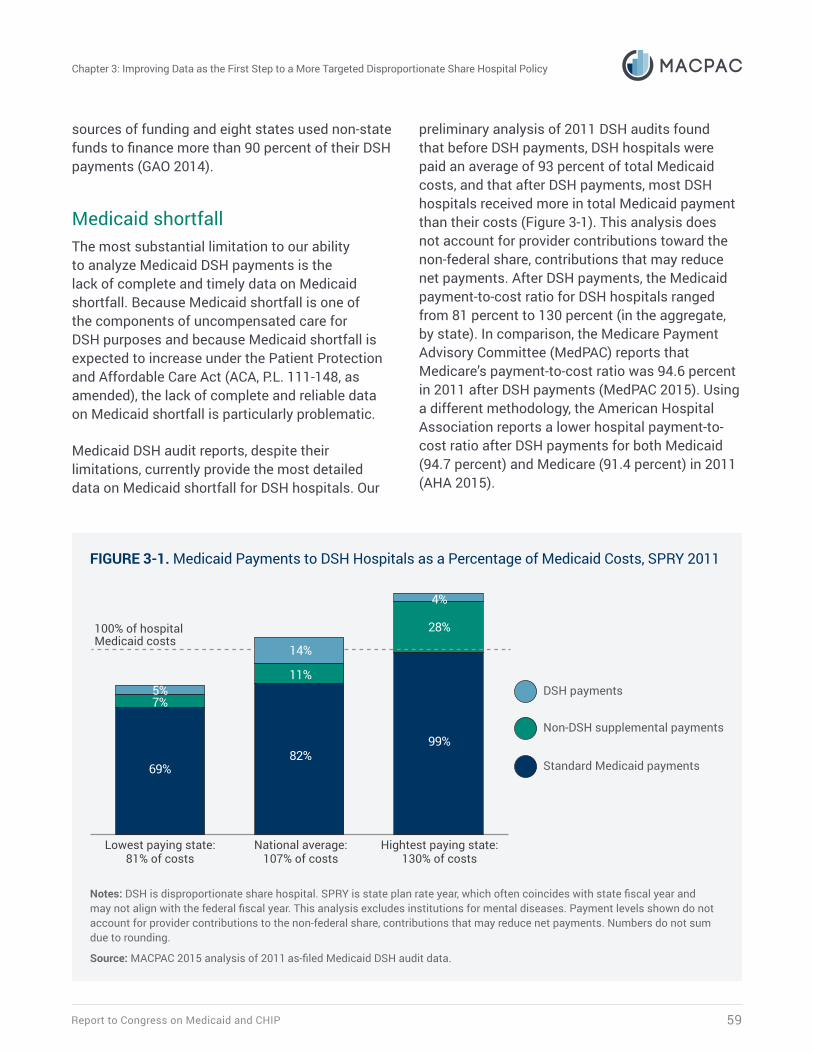
Report to Congress on Medicaid and CHIP 59
Chapter 3: Improving Data as the First Step to a More Targeted Disproportionate Share Hospital Policy
sources of funding and eight states used non-state funds to finance more than 90 percent of their DSH payments (GAO 2014).
Medicaid shortfallThe most substantial limitation to our ability to analyze Medicaid DSH payments is the lack of complete and timely data on Medicaid shortfall. Because Medicaid shortfall is one of the components of uncompensated care for DSH purposes and because Medicaid shortfall is expected to increase under the Patient Protection and Affordable Care Act (ACA, P.L. 111-148, as amended), the lack of complete and reliable data on Medicaid shortfall is particularly problematic.
Medicaid DSH audit reports, despite their limitations, currently provide the most detailed data on Medicaid shortfall for DSH hospitals. Our
preliminary analysis of 2011 DSH audits found that before DSH payments, DSH hospitals were paid an average of 93 percent of total Medicaid costs, and that after DSH payments, most DSH hospitals received more in total Medicaid payment than their costs (Figure 3-1). This analysis does not account for provider contributions toward the non-federal share, contributions that may reduce net payments. After DSH payments, the Medicaid payment-to-cost ratio for DSH hospitals ranged from 81 percent to 130 percent (in the aggregate, by state). In comparison, the Medicare Payment Advisory Committee (MedPAC) reports that Medicare’s payment-to-cost ratio was 94.6 percent in 2011 after DSH payments (MedPAC 2015). Using a different methodology, the American Hospital Association reports a lower hospital payment-to-cost ratio after DSH payments for both Medicaid (94.7 percent) and Medicare (91.4 percent) in 2011 (AHA 2015).
FIGURE 3-1. Medicaid Payments to DSH Hospitals as a Percentage of Medicaid Costs, SPRY 2011
Lowest paying state:81% of costs
National average:107% of costs
100% of hospitalMedicaid costs
Hightest paying state:130% of costs
Standard Medicaid payments
Non-DSH supplemental payments
DSH payments
69%
7%5%
82%
11%
99%
28%
4%
14%
Notes: DSH is disproportionate share hospital. SPRY is state plan rate year, which often coincides with state fiscal year and may not align with the federal fiscal year. This analysis excludes institutions for mental diseases. Payment levels shown do not account for provider contributions to the non-federal share, contributions that may reduce net payments. Numbers do not sum due to rounding.
Source: MACPAC 2015 analysis of 2011 as-filed Medicaid DSH audit data.
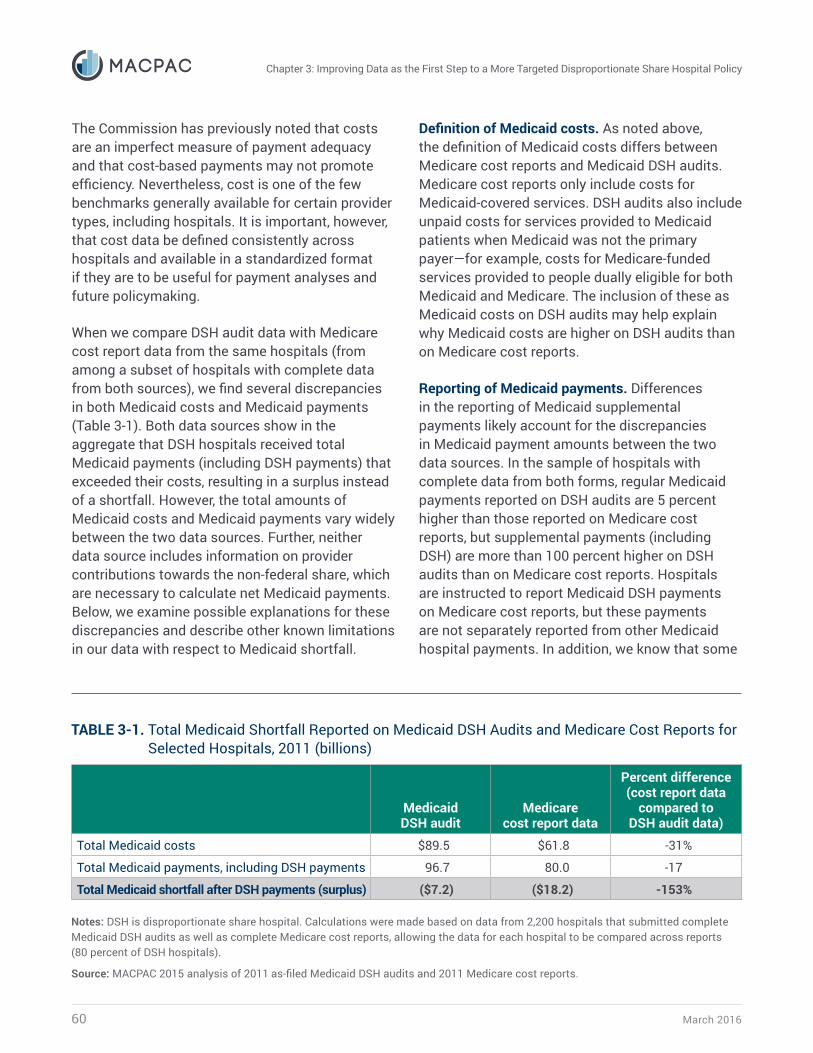
March 201660
Chapter 3: Improving Data as the First Step to a More Targeted Disproportionate Share Hospital Policy
The Commission has previously noted that costs are an imperfect measure of payment adequacy and that cost-based payments may not promote efficiency. Nevertheless, cost is one of the few benchmarks generally available for certain provider types, including hospitals. It is important, however, that cost data be defined consistently across hospitals and available in a standardized format if they are to be useful for payment analyses and future policymaking.
When we compare DSH audit data with Medicare cost report data from the same hospitals (from among a subset of hospitals with complete data from both sources), we find several discrepancies in both Medicaid costs and Medicaid payments (Table 3-1). Both data sources show in the aggregate that DSH hospitals received total Medicaid payments (including DSH payments) that exceeded their costs, resulting in a surplus instead of a shortfall. However, the total amounts of Medicaid costs and Medicaid payments vary widely between the two data sources. Further, neither data source includes information on provider contributions towards the non-federal share, which are necessary to calculate net Medicaid payments. Below, we examine possible explanations for these discrepancies and describe other known limitations in our data with respect to Medicaid shortfall.
Definition of Medicaid costs. As noted above, the definition of Medicaid costs differs between Medicare cost reports and Medicaid DSH audits. Medicare cost reports only include costs for Medicaid-covered services. DSH audits also include unpaid costs for services provided to Medicaid patients when Medicaid was not the primary payer—for example, costs for Medicare-funded services provided to people dually eligible for both Medicaid and Medicare. The inclusion of these as Medicaid costs on DSH audits may help explain why Medicaid costs are higher on DSH audits than on Medicare cost reports.
Reporting of Medicaid payments. Differences in the reporting of Medicaid supplemental payments likely account for the discrepancies in Medicaid payment amounts between the two data sources. In the sample of hospitals with complete data from both forms, regular Medicaid payments reported on DSH audits are 5 percent higher than those reported on Medicare cost reports, but supplemental payments (including DSH) are more than 100 percent higher on DSH audits than on Medicare cost reports. Hospitals are instructed to report Medicaid DSH payments on Medicare cost reports, but these payments are not separately reported from other Medicaid hospital payments. In addition, we know that some
TABLE 3-1. Total Medicaid Shortfall Reported on Medicaid DSH Audits and Medicare Cost Reports for Selected Hospitals, 2011 (billions)
Medicaid DSH audit
Medicare cost report data
Percent difference (cost report data
compared to DSH audit data)
Total Medicaid costs $89.5 $61.8 -31%
Total Medicaid payments, including DSH payments 96.7 80.0 -17
Total Medicaid shortfall after DSH payments (surplus) ($7.2) ($18.2) -153%
Notes: DSH is disproportionate share hospital. Calculations were made based on data from 2,200 hospitals that submitted complete Medicaid DSH audits as well as complete Medicare cost reports, allowing the data for each hospital to be compared across reports (80 percent of DSH hospitals).
Source: MACPAC 2015 analysis of 2011 as-filed Medicaid DSH audits and 2011 Medicare cost reports.
Report to Congress on Medicaid and CHIP 61
Chapter 3: Improving Data as the First Step to a More Targeted Disproportionate Share Hospital Policy
Medicaid supplemental payments are not reported on DSH audits. These unreported payments include incentive payments to hospitals that are not directly related to services provided, such as Delivery System Reform Incentive Payments (DSRIP), which totaled $6.7 billion in FY 2015 (for more background about DSRIP, see the Commission’s June 2014 report to Congress).
Recently, the U.S. Government Accountability Office (GAO) reviewed Medicaid hospital payments in three states and concluded that limited data and unclear policy on supplemental payments restricted its ability analyze payments to individual hospitals (GAO 2015). In one state analysis, GAO identified $750 million in supplemental payments to three DSH hospitals that were not reported on DSH audits. In another, GAO found that a multihospital system received large non-DSH supplemental payments at one hospital facility and large DSH payments at other hospital facilities. In both cases, they found that DSH payments to these hospitals would have been lower if all Medicaid supplemental payments had been taken into account when determining uncompensated care.
Accounting for sources of non-federal share. Neither Medicaid DSH audits nor Medicare cost reports account for the cost to some hospitals of supplying the non-federal share of DSH payments through IGTs or CPEs. These provider contributions can be substantial and they may reduce the net amount of Medicaid payments that these hospitals receive. In 2012, IGTs and CPEs accounted for 44.6 percent of the non-federal share of DSH payments nationally (GAO 2014). Costs for health care-related taxes also need to be identified. Taxes paid by providers are often included in calculations of Medicaid costs, but they are not separately identified in a way that enables analysis. In 2012, provider taxes accounted for 18.5 percent of the non-federal share of DSH payments nationally (GAO 2014).
Commission Recommendation
Recommendation 3.1The Secretary of the U.S. Department of Health and Human Services should collect and report hospital-specific data on all types of Medicaid payments for all hospitals that receive them. In addition, the Secretary should collect and report data on the sources of non-federal share necessary to determine net Medicaid payment at the provider level.
RationaleThe policy of making special Medicaid payments to hospitals serving a disproportionate share of Medicaid beneficiaries and other low-income patients has been a feature of the Medicaid program since 1981. As the analysis in this report illustrates, DSH allotments are largely based on state spending in 1992, and they have little meaningful relationship with potential measures of need for DSH payments today. Further, apart from the requirement that deemed DSH hospitals receive DSH payments, states are generally not required to target DSH payments in a particular manner. Some states provide DSH payments to virtually all hospitals in their state, while others make DSH payments to just one or two hospitals.
In light of the congressional directive to the Commission to study the relationship of current and future DSH allotments to measures of need, greater transparency in how hospitals are being paid is important to understanding states’ use of Medicaid funds and the extent to which state policies are consistent with federal requirements. Specifically, complete and reliable data regarding all Medicaid payments to hospitals and the sources of the non-federal share of such payments are important for analyzing current policy and for developing more targeted strategies in the future. Given the historical variation in state payment policy and the differences in how states distribute payments
March 201662
Chapter 3: Improving Data as the First Step to a More Targeted Disproportionate Share Hospital Policy
today, provider-level data is needed to understand how different policy approaches would affect not only states but also individual institutions.
Complete data on net Medicaid payments for all providers are important for accurate analyses of the extent to which DSH payments are targeted to providers that serve a disproportionate share of Medicaid and low-income patients and have disproportionate levels of uncompensated care. These data are also important to project the potential effects of policies to improve the targeting of DSH payments. In particular, payment data are needed to calculate Medicaid shortfall, one of the components of uncompensated care that Medicaid DSH covers. Our analysis in this report suggests that Medicaid payments do not necessarily result in a shortfall for all institutions in all states, pointing to the need for better data that can be used to design DSH policy in the future.
This recommendation builds on the Commission’s March 2014 recommendation that the Secretary collect and report non-DSH supplemental payment data. Although CMS has begun collecting some provider-specific data on these payments, these data are not publicly available in a format that enables analysis. Moreover, states are increasingly making other types of supplemental payments to providers through Section 1115 expenditure authority (such as DSRIP and uncompensated care pools), and data about these payments are not being systematically collected.
The Commission recommends the collection of all types of Medicaid payments to capture all direct payments for Medicaid services, under both fee-for-service and managed care, and all supplemental payments that are not directly related to services, including upper payment limit (UPL) and Section 1115 supplemental payments. Such data are needed to provide a complete picture of Medicaid’s current role in supporting safety-net hospitals, a task that is now not possible given substantial variation in state payment policies and methods. Improvements in DSH policy cannot be achieved by considering DSH
payments in isolation. Rather, a full accounting of all Medicaid payments individual hospitals receive is needed to ensure that states are paying these institutions consistent with statutory principles of economy, efficiency, quality, and access.
The Commission has also previously noted that a lack of data on the source of non-federal share for Medicaid payments complicates Medicaid payment analyses. In 47 states and the District of Columbia, some of the non-federal share of Medicaid spending was contributed by local governments and providers in 2012. Such contributions, which are specifically permitted by statute, are particularly important for financing DSH payments. About two-thirds of DSH payments were financed by providers and local governments, and eight states used these funds to finance more than 90 percent of their DSH payments (GAO 2014). Understanding the sources of these funds is important to an overall understanding of Medicaid shortfall because in cases where providers contribute non-federal share, their net payment may be lower than payment data alone indicate. Future policy development must also consider the extent to which the distribution of DSH payments is related to the sources of non-federal share.
This recommendation is consistent with the work of others studying Medicaid payments. Specifically, GAO has also recommended that CMS collect provider-level Medicaid payment data (GAO 2012), as well as provider-level data on the sources of funds used to finance the non-federal share of payments (GAO 2014). GAO’s recommended strategies for collecting non-federal share data included, in the short-term, adding these data to CMS’s current UPL compliance efforts and, in the longer term, collecting them through the Transformed Medicaid Statistical Information System (T-MSIS). In written comments to GAO, CMS agreed with the importance of collecting information on non-DSH supplemental payments, but disagreed with the need to collect facility-level data on non-federal share as well as the recommendation that such data be collected through T-MSIS.
Report to Congress on Medicaid and CHIP 63
Chapter 3: Improving Data as the First Step to a More Targeted Disproportionate Share Hospital Policy
Considerations for data collectionThe Commission has not recommended specific methods for data collection, recognizing that the need for data must be balanced with the burden of collecting them. However, it makes sense to build upon existing data collection efforts to the extent possible. Further, the Commission recognizes that some payment data (e.g., managed care payments) might be challenging to obtain. If the Secretary does not have the authority to collect certain data, legislation may be needed.
Claims data alone (including data obtained through T-MSIS) may not provide all of the information that the Commission has recommended collecting, particularly the source of non-federal share. Still, collecting complete payment data though T-MSIS could be considered, along with supplementing these data with a separate collection of data to identify sources of non-federal share.
Another option would be to expand DSH audits to include all hospitals that receive Medicaid payments. However, the burden on states and hospitals of conducting full audits and the resulting data lag could be considerable. Further, because the legislation that requires DSH audits and reporting is specific to DSH hospitals, the Secretary may not have statutory authority to extend auditing to other hospitals, perhaps requiring congressional action. Nevertheless, DSH audit reporting could serve as a model for broader payment data collection.
Besides DSH audit data, CMS also collects some non-DSH supplemental payment data through annual reports submitted by states to demonstrate their compliance with the UPL regulations. These reports also include the names of entities providing IGTs or CPEs and the amounts (CMS 2013a). However, these reports are not required to be submitted in a standardized format and, thus far, are not available for analysis outside of CMS. They also do not include data related to Medicaid managed care enrollees because managed care payments are not subject to the UPL.
In January 2014, CMS issued a solicitation seeking assistance in oversight and analysis of DSH payments and state UPL submissions (CMS 2014). Although the solicitation does not indicate plans for making data publicly available, specific tasks include compiling a database of DSH and non-DSH supplemental payment data, analyzing payments at state and provider-specific levels, and assessing the utility of T-MSIS data. We will monitor the status of this effort and its potential to address the issues that we have raised in this report and others.
The Commission is concerned about the lack of both the timeliness of data and the ability to link data with other sources. Given the rapid evolution of the U.S. health care system and frequent changes in state Medicaid payment policy, analyses of Medicaid payment should reflect current conditions to the greatest extent possible. Although it may be difficult to reduce the time lag in DSH audit data because of the amount of time needed to ensure accurate accounting for all costs and associated revenues, there may be ways to make other types of Medicaid payment data (e.g., UPL demonstrations) available in a more timely fashion, especially data that are submitted quarterly or annually.
The ability to link different sources of data for the same providers is useful, especially for analyses of payments, such as DSH payments, that offset uncompensated care costs for Medicaid and uninsured patients. CMS recently required that Medicaid DSH audit data include Medicare provider identification numbers, which help link these data to Medicare cost reports. We are also interested in the ability to link Medicaid data with other sources, such as the community benefit report provided to the Internal Revenue Service (IRS).
Implications of the Commission’s RecommendationFederal spending. In 2014, the Congressional Budget Office estimated that the collection of
March 201664
Chapter 3: Improving Data as the First Step to a More Targeted Disproportionate Share Hospital Policy
non-DSH supplemental payment data would not affect federal Medicaid spending, and we assume that their cost estimates would be similar for this recommendation. Depending on the method of collection, it could result in increased administrative effort in developing reporting standards, making required changes to information technology systems, and making the data publicly available, but these activities are not expected to result in increased spending.
States. Reporting of provider-specific Medicaid payments and non-federal share contributions would likely require some increased administrative effort by states to the extent that payment information may need to be compiled from different data systems. Although most of these data should be available in state systems due to existing federal requirements, previous GAO reports about efforts to compile state data on hospital payments noted the challenge of matching records at the provider level (GAO 2015). Moreover, while states that already collect DSH audit data for most hospitals in their state are experienced in reporting hospital-level Medicaid payment data, those with smaller DSH programs would likely face more administrative burdens.
Providers and enrollees. State reporting of provider-level payment and non-federal share data would not have a direct effect on Medicaid payments to providers. Over time, however, increased transparency could lead to modifications in state payment methodologies including state DSH payments.1
Next StepsThis is the first of the Commission’s annual reports on Medicaid DSH policy. (Future reports will be included within our annual March report to Congress.) In future reports, the Commission will not only continue to monitor the distribution of DSH payments across states and hospitals, but will also work to understand how changes
brought about by the ACA are affecting safety-net institutions. In addition, notwithstanding the limitations of currently available Medicaid payment data, the Commission will explore additional work that can be done using current data sources to better understand the role of DSH payments and other sources of financial support to hospitals. The Commission will also more fully explore potential policy approaches to improving the targeting of federal Medicaid DSH funding.
Data explorationThe Commission will explore opportunities to link the hospital-specific data from Medicaid DSH audits and Medicare cost reports with other available sources of hospital data. Reconciling Medicaid DSH data with other data sources will help us better understand whether uncompensated care costs are being reported consistently and whether hospitals are receiving other types of payments for uncompensated care that are not being captured on Medicaid DSH audits.
Community benefit reporting. While only about half of DSH hospitals are non-profit hospitals, community benefit spending data can be linked to DSH audit data to better understand uncompensated care for these hospitals. The IRS requires non-profit hospitals to report their community benefit spending to maintain their non-profit status, and these data are publicly available. These reports include information on Medicaid shortfall and hospital charity care policies (IRS 2014). In 2011, Medicaid shortfall was the single largest category of community benefit expenditures that non-profit hospitals reported (IRS 2015).
Other sources of direct and indirect support for uncompensated care. Medicare cost reports provide hospital-specific information about Medicare DSH payments and other additional Medicare payments that hospitals receive, and MACPAC will use these data to better understand the relationship between Medicare and Medicaid DSH payments. As discussed in

Report to Congress on Medicaid and CHIP 65
Chapter 3: Improving Data as the First Step to a More Targeted Disproportionate Share Hospital Policy
Chapter 1, Medicare DSH payments are one of the largest direct federal payments for hospital uncompensated care, totaling approximately $12.1 billion in 2013.
The Commission is still exploring the availability of hospital-specific data on 340b funding, which is a large indirect source of support for hospitals. The 340b drug program is overseen by the Health Resources and Services Administration (HRSA) but the drug rebates are administered by drug manufacturers, so it is difficult to obtain data on drug rebates at the hospital level. However, HRSA does provide information about which hospitals are eligible for 340b funding, which can potentially be combined with claims data on drug spending at these hospitals to estimate the amount of drug rebates that hospitals receive.
Costs and utilization for dually eligible beneficiaries. The Commission also plans to examine available data about individuals dually eligible for Medicaid and Medicare to better understand the effect of these individuals on our estimates of Medicaid utilization and costs. Accurate data on Medicaid inpatient utilization are particularly important because it is one of the qualifying criteria for deemed DSH hospitals. In 2014, CMS began requiring states to report state-level Medicaid inpatient utilization rates according to Medicaid DSH definitions, but with the delay in implementing DSH allotment reductions, few states have begun reporting these data (CMS 2013b).
As discussed earlier in this chapter, Medicare cost reports and Medicaid DSH audits differ in their treatment of costs and utilization for Medicaid enrollees when Medicaid is not the primary payer. This difference affects reporting of costs and revenue related to services provided to dually eligible beneficiaries, who accounted for 15 percent of Medicaid enrollment and 34 percent of Medicaid spending in 2010 (MACPAC and MedPAC 2015). Medicaid DSH audits include all services provided to Medicaid enrollees, including inpatient services for dually eligible beneficiaries that are
paid for by Medicare, but Medicare cost reports classify costs and utilization based on the primary payer for the service.
Essential community services. The Commission will continue to explore available data to identify hospitals that provide access to essential community services. As discussed in Chapter 2, there is no statutory definition of essential community services and there are few data sources that provide national data on the specific services that hospitals provide. For example, in preparing this report, we were unable to identify hospitals that provide primary care or public health services because these services were not separately identifiable on Medicare cost reports or the American Hospital Association annual survey. MACPAC is exploring the use of Medicaid claims and encounter data to gain insight into the types of services—particularly primary care and public health services—that enrollees use at DSH hospitals.
Policy design explorationExisting federal parameters for defining state allotments and making DSH payments provide a starting point for thinking about federal approaches to improve the targeting of DSH payments. Potential changes to federal statute that the Commission intends to consider include modifying the criteria for DSH payment eligibility, redefining uncompensated care for Medicaid DSH payment purposes, and rebasing state DSH allotments. The Commission is also reviewing other past proposals to improve Medicaid DSH policy (Box 3-1).
Modifying provider eligibility standards. By statute, the minimum qualifying criteria for hospitals receiving DSH payments is a Medicaid inpatient utilization rate of 1 percent, a standard that nearly all U.S. hospitals currently meet. This eligibility threshold could be increased to better target DSH payments to hospitals that serve more Medicaid or low-income patients. Examples of other thresholds to consider include basing eligibility on the average Medicaid inpatient utilization of all providers in
March 201666
Chapter 3: Improving Data as the First Step to a More Targeted Disproportionate Share Hospital Policy
a state or on one standard deviation above the average (which is the current threshold used to determine deemed DSH hospitals which must receive DSH payments). In addition, low-income utilization rates, which also account for care for the uninsured, could be factored into the determination of provider eligibility for DSH payments.
Raising the provider eligibility threshold would primarily affect hospitals with lower levels of
Medicaid or low-income utilization that currently receive DSH payments. In 2011, about 17 percent of DSH payments went to hospitals with Medicaid inpatient utilization rates at or below the 50th percentile, and about 27 percent of DSH payments were made to hospitals with low-income utilization rates at or below the 50th percentile.
Redefining eligible uncompensated care costs. Under current law, DSH payments to hospitals
BOX 3-1. Prior Federal Reports on Medicaid Disproportionate Share Hospital (DSH) Policy
On at least two occasions, federal policy advisors have published reports on Medicaid disproportionate share hospital (DSH) policy, highlighting many of the same issues that we raise here.
In the early 1990s, when Medicaid DSH allotments were first established, Congress required the Prospective Payment Assessment Commission (ProPAC), one of the precursor commissions to the Medicare Payment Advisory Commission (MedPAC), to review the criteria used in designating Medicaid DSH hospitals (P.L. 102-234). ProPAC’s report, issued in 1994, examined state DSH spending and the role of Medicaid DSH payments on hospital financial status, and it raised many of the same issues we raise in this report (ProPAC 1994). The report recommended that DSH payments should not exceed 12 percent of state Medicaid spending (which is now current law) and also made four recommendations that have not been implemented:
• establish a uniform designation of Medicaid DSH hospitals based on the proportion of care that hospitals provide to Medicaid enrollees and other persons unable to pay for their care;
• set minimum and maximum DSH payment adjustments related to a hospital’s uncompensated care;
• apply separate criteria for different hospital types (e.g., teaching, psychiatric, or children’s hospitals); and
• set aside 10 percent of DSH spending for primary care services that could promote access for Medicaid enrollees and the uninsured.
In 2002, the U.S. Department of Health and Human Services Assistant Secretary for Planning and Evaluation contracted with researchers from RAND and the Urban Institute to analyze the distribution of DSH payments in both Medicaid and Medicare (Wynn et al. 2002). This report did not make any recommendations, but it analyzed several alternative DSH allocation policies, including joint distribution of Medicare and Medicaid DSH payments and distribution policies based on low-income volume or uncompensated care. The report also suggested that a national database with data on each hospital’s uncompensated care and shortfalls from Medicaid and local indigent care programs would be needed to understand the potential effects of alternative allocation policies. It also highlighted the need for data on sources of non-federal share.
Report to Congress on Medicaid and CHIP 67
Chapter 3: Improving Data as the First Step to a More Targeted Disproportionate Share Hospital Policy
cannot exceed their uncompensated care costs, which are defined for Medicaid DSH purposes as the sum of Medicaid shortfall and unpaid costs of care for the uninsured. This definition could be narrowed by excluding particular components, such as Medicaid shortfall, or it could be expanded by adding additional components, such as bad debt for insured individuals or physician services that hospitals provide.
Changing the definition of uncompensated care for Medicaid DSH purposes would change the maximum amount of DSH funding that a hospital could receive, and thus would primarily affect hospitals that are already at their hospital-specific DSH limit. In 2011, 6 percent of DSH hospitals received DSH payments that were equal to 90 percent or more of their hospital-specific limit.
Rebasing state DSH allotments. Current DSH allotments, based on historical spending from 1992, vary widely by state and bear little relationship to objective measures of need. To smooth this state-by-state variation, Congress could rebase DSH allotments according to objective criteria, such as the number of uninsured people or the levels of uncompensated care of high-need hospitals in a state.
For an incremental approach, Congress could incorporate rebased DSH allotments into the formula for pending DSH allotment reductions. However, the current schedule of DSH allotment reductions reduces DSH allotments by more than half by FY 2025, so before taking this approach, the size of pending DSH allotment reductions should be considered.
Endnotes1 The full text of the Commission’s recommendation and vote can be found on page 160.
ReferencesAmerican Hospital Association (AHA). 2015. Chapter 4: Trends in hospital financing. In Trends affecting hospitals and health systems. Washington, DC: AHA. http://www.aha.org/research/reports/tw/chartbook/ch4.shtml.
Centers for Medicare & Medicaid Services (CMS), U.S. Department of Health and Human Services. 2015. Medicare program; Hospital inpatient prospective payment systems for acute care hospitals and the long-term care hospital prospective payment system policy changes and fiscal year 2016 rates; revisions of quality reporting requirements for specific providers, including changes related to the electronic health record incentive program; extensions of the Medicare-dependent, small rural hospital program and the low-volume payment adjustment for hospitals. Final rule. Federal Register 80, no. 158 (August 17): 49325–49886. https://federalregister.gov/a/2015-19049.
Centers for Medicare & Medicaid Services (CMS), U.S. Department of Health and Human Services. 2014. Solicitation no. APP140426 regarding “Medicaid upper payment limit and disproportionate share hospital demonstration.” January 23, 2014.
Centers for Medicare & Medicaid Services (CMS), U.S. Department of Health and Human Services. 2013a. Letter from Cindy Mann to state Medicaid directors regarding “Federal and state oversight of Medicaid expenditures.” March 18, 2013. http://www.medicaid.gov/Federal-Policy-Guidance/Downloads/SMD-13-003-02.pdf.
Centers for Medicare & Medicaid Services (CMS), U.S. Department of Health and Human Services. 2013b. Medicaid program: State disproportionate share hospital allotment reductions. Final rule. Federal Register 78, no. 181 (September 18): 57293–57313. https://federalregister.gov/a/2013-22686.
March 201668
Chapter 3: Improving Data as the First Step to a More Targeted Disproportionate Share Hospital Policy
Medicaid and CHIP Payment and Access Commission (MACPAC) and Medicare Payment Advisory Commission (MedPAC). 2015. Databook: Beneficiaries dually eligible for Medicare and Medicaid. January 2015. Washington, DC: MACPAC and MedPAC. http://www.medpac.gov/documents/data-book/january-2015-medpac-and-macpac-data-book-beneficiaries-dually-eligible-for-medicare-and-medicaid.pdf?sfvrsn=2.
Medicare Payment Advisory Commission (MedPAC). 2015. Databook: Health care spending and the Medicare program. June 2015. Washington, DC: MedPAC. http://www.medpac.gov/documents/data-book/june-2015-databook-health-care-spending-and-the-medicare-program.pdf.
Prospective Payment Assessment Commission (ProPAC). 1994. Analysis of Medicaid disproportionate share payment adjustments. Congressional Report C-94-01.
U.S. Government Accountability Office (GAO). 2015. CMS oversight of provider payments is hampered by limited data and unclear policy. Report no. GAO-15-322. Washington, DC: GAO. http://www.gao.gov/products/GAO-15-322.
U.S. Government Accountability Office (GAO). 2014. States’ increased reliance on funds from health care providers and local governments warrants improved CMS data collection. Report no. GAO-14-627. Washington, DC: GAO. http://www.gao.gov/products/GAO-14-627.
U.S. Government Accountability Office (GAO). 2012. More transparency of and accountability for supplemental payments are needed. Report no. GAO-13-48. Washington, DC: GAO. http://www.gao.gov/products/GAO-13-48.
U.S. Internal Revenue Service (IRS), U.S. Department of the Treasury. 2015. Report to Congress on private tax-exempt, taxable, and government-owned hospitals. Washington, DC: IRS.
U.S. Internal Revenue Service (IRS), U.S. Department of the Treasury. 2014. Instructions for Schedule H (Form 990). https://www.irs.gov/pub/irs-pdf/i990sh.pdf.
Wynn, B, T. Coughlin, S. Bondarenko, and B. Bruen. 2002. Analysis of the joint distribution of disproportionate share hospital payments. Project memorandum PM-1387-ASPE to the Assistant Secretary of Planning and Evaluation, U.S. Department of Health and Human Services. September 20, 2002. Washington, DC: RAND. http://aspe.hhs.gov/health/Reports/02/DSH/index.htm.
Report to Congress on Medicaid and CHIP 69
Chapter 3: APPENDIX 3A
APPENDIX 3A: Methodology and Data LimitationsMACPAC used data from several different sources to analyze and describe Medicaid disproportionate share hospital (DSH) payments and their relationship to factors such as uninsured rates, uncompensated care, and DSH hospitals with high levels of uncompensated care that provide access to essential services. We also modeled DSH allotment reductions and simulated DSH payments under a variety of scenarios. Below we describe the data sources used in this analysis and the limitations associated with each one, and we review the modeling assumptions we made for our projections of DSH allotments and payments.
Primary Data Sources
DSH audit dataWe used 2011 DSH audit reports to examine historic DSH spending and the distribution of DSH spending among a variety of hospital types. These data were provided by the Centers for Medicare & Medicaid Services (CMS) on an as-filed basis and may be subject to change as CMS completes its internal review of state DSH audit reports.
Because 2011 DSH audit data were not available for Minnesota, 2010 DSH audit data were used instead. Minnesota’s 2010 DSH audit data were adjusted to 2011 values using the Consumer Price Index for All Urban Consumers (CPI-U). DSH audit data were also not available for Massachusetts, which is exempt from DSH requirements under the terms of the state’s Section 1115 demonstration waiver.
Overall, 2,743 hospitals receiving DSH payments are represented in our analysis. Some states
provided DSH audit data for hospitals that did not receive DSH payments, and some hospitals received DSH payments from multiple states. We removed 59 non-DSH hospitals from our analysis and combined the data for 33 pairs of duplicate hospitals so that each hospital would only appear once in the dataset.
Medicare cost reportsWe used Medicare cost report data to examine uncompensated care for all hospitals in each state. A hospital that receives Medicare payments must file an annual Medicare cost report, which includes a range of financial and non-financial data about hospital performance and services provided. We excluded religious non-medical health care institutions and hospitals participating in special Medicare demonstration projects (28 hospitals were excluded under these criteria). These facilities submit Medicare cost reports but do not receive Medicare DSH payments.
We linked DSH audit data and Medicare cost report data to create descriptive analyses of DSH hospitals and to identify deemed DSH hospitals. We were unable to identify the Medicare cost reports for 90 DSH hospitals, and so we excluded those 90 hospitals from this analysis.
When using Medicare cost reports to analyze hospital operating margins, we excluded hospitals with operating margins that had an absolute value of greater than 75 percent (976 hospitals were excluded under this criterion). This approach is consistent with other published studies of hospital margins using Medicare cost report data (Wynn et al. 2002). Operating margins are calculated by subtracting operating expenses (OE) from net patient revenue (NPR) and dividing the result by net patient revenue: (NPR–OE)/NPR. Total margins, in contrast, include additional types of hospital revenue, such as state or local subsidies and revenue from other facets of hospital operations (e.g., parking lot receipts).
March 201670
Chapter 3: APPENDIX 3A
Working Definition of Essential Community ServicesThe statute requires that MACPAC’s analysis include data identifying hospitals with high levels of uncompensated care that also provide access to essential community services for low-income, uninsured, and vulnerable populations, such as graduate medical education, and the continuums of primary through quaternary care, including the provision of trauma care and public health services.
Our working definition to identify such hospitals in our first report is based on a two part test:
• Is the hospital a deemed DSH hospital?
• Does the hospital provide at least one essential service?
Deemed DSH hospital statusHospitals must meet one of two criteria to qualify as a deemed DSH hospital: (1) a Medicaid inpatient utilization rate greater than one standard deviation above the mean for hospitals in the state or (2) a low-income utilization rate greater than 25 percent (§ 1923(b)(1) of the Social Security Act). Because deemed DSH hospitals are statutorily required to receive DSH payments, we excluded from our analysis hospitals that did not receive DSH payments in 2011.
Calculation of the Medicaid inpatient utilization rate threshold for each state requires data from all hospitals in that state, and we relied on Medicare cost reports to make those calculations and to determine which hospitals exceeded this threshold. A major limitation of this approach is that Medicaid inpatient utilization reported on Medicare cost reports does not include services provided to Medicaid enrollees that were not paid for by Medicaid (e.g., Medicare-funded services for individuals who are dually eligible for Medicare and Medicaid). However, the Medicaid DSH definition
of Medicaid inpatient utilization includes services provided to anyone that is eligible for Medicaid, even if Medicaid is not the primary payer. Thus, our identification of deemed DSH hospitals may omit some hospitals with high utilization by dually eligible beneficiaries and overstate the extent to which hospitals with low utilization by dually eligible beneficiaries (e.g., children’s hospitals) exceed the threshold.
The low-income utilization rate threshold for deemed DSH hospitals is the same for all states (25 percent), so we were able to use Medicaid DSH audit data to determine whether hospitals met this criterion. However, about one-quarter of DSH hospitals did not provide data on the rate of low-income utilization on their DSH audits, and these omissions limited our ability to identify all deemed DSH hospitals.
Provision of essential community servicesBecause the term essential community services is not otherwise defined in statute or regulation, MACPAC convened a technical advisory panel in April 2015 to discuss potential data sources and criteria that could be used to identify such services. The panel included representatives of state Medicaid programs, CMS, and hospital associations as well as researchers and state consultants on DSH policy. Feedback from the technical advisory panel was further discussed at the Commission’s May 2015 public meeting.
We identified a number of services that could be considered essential community services using available data from 2013 Medicare cost reports and the 2013 American Hospital Association (AHA) annual survey (Table 3A-1). Services were selected for inclusion if they were directly mentioned in the statute requiring this report or if they were related services mentioned in the cost reports or the AHA annual survey.
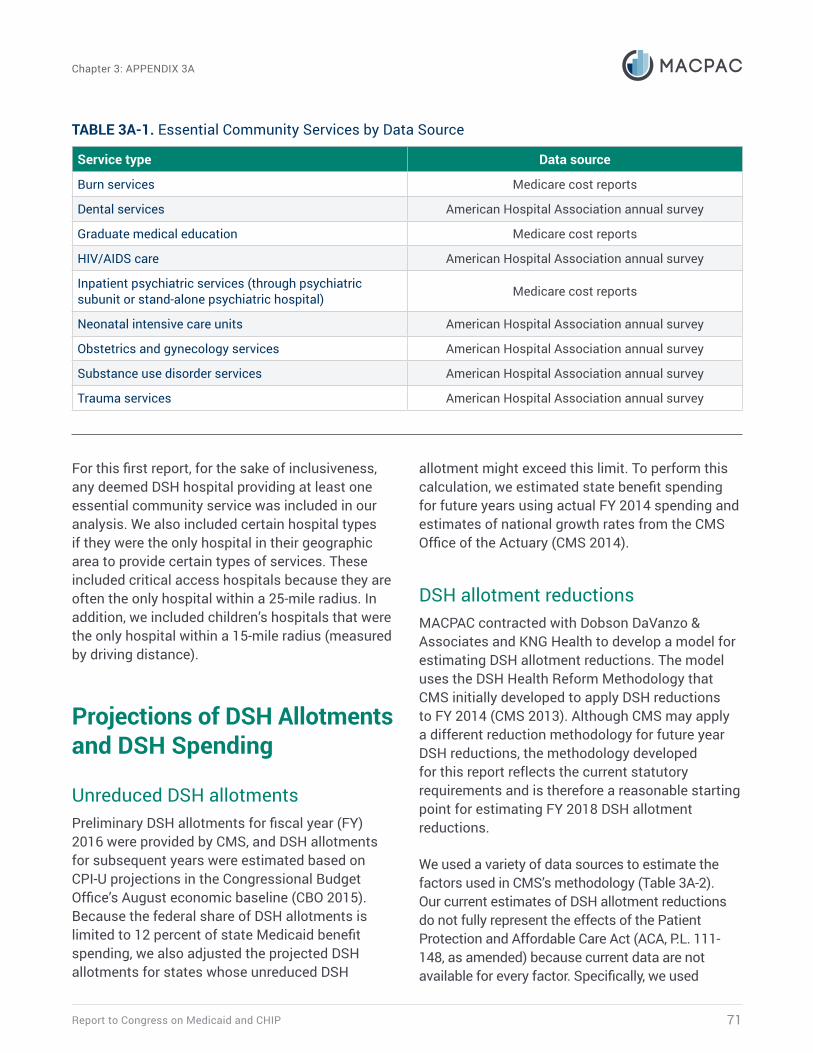
Report to Congress on Medicaid and CHIP 71
Chapter 3: APPENDIX 3A
For this first report, for the sake of inclusiveness, any deemed DSH hospital providing at least one essential community service was included in our analysis. We also included certain hospital types if they were the only hospital in their geographic area to provide certain types of services. These included critical access hospitals because they are often the only hospital within a 25-mile radius. In addition, we included children’s hospitals that were the only hospital within a 15-mile radius (measured by driving distance).
Projections of DSH Allotments and DSH Spending
Unreduced DSH allotmentsPreliminary DSH allotments for fiscal year (FY) 2016 were provided by CMS, and DSH allotments for subsequent years were estimated based on CPI-U projections in the Congressional Budget Office’s August economic baseline (CBO 2015). Because the federal share of DSH allotments is limited to 12 percent of state Medicaid benefit spending, we also adjusted the projected DSH allotments for states whose unreduced DSH
allotment might exceed this limit. To perform this calculation, we estimated state benefit spending for future years using actual FY 2014 spending and estimates of national growth rates from the CMS Office of the Actuary (CMS 2014).
DSH allotment reductionsMACPAC contracted with Dobson DaVanzo & Associates and KNG Health to develop a model for estimating DSH allotment reductions. The model uses the DSH Health Reform Methodology that CMS initially developed to apply DSH reductions to FY 2014 (CMS 2013). Although CMS may apply a different reduction methodology for future year DSH reductions, the methodology developed for this report reflects the current statutory requirements and is therefore a reasonable starting point for estimating FY 2018 DSH allotment reductions.
We used a variety of data sources to estimate the factors used in CMS’s methodology (Table 3A-2). Our current estimates of DSH allotment reductions do not fully represent the effects of the Patient Protection and Affordable Care Act (ACA, P.L. 111-148, as amended) because current data are not available for every factor. Specifically, we used
TABLE 3A-1. Essential Community Services by Data Source
Service type Data source
Burn services Medicare cost reports
Dental services American Hospital Association annual survey
Graduate medical education Medicare cost reports
HIV/AIDS care American Hospital Association annual survey
Inpatient psychiatric services (through psychiatric subunit or stand-alone psychiatric hospital) Medicare cost reports
Neonatal intensive care units American Hospital Association annual survey
Obstetrics and gynecology services American Hospital Association annual survey
Substance use disorder services American Hospital Association annual survey
Trauma services American Hospital Association annual survey
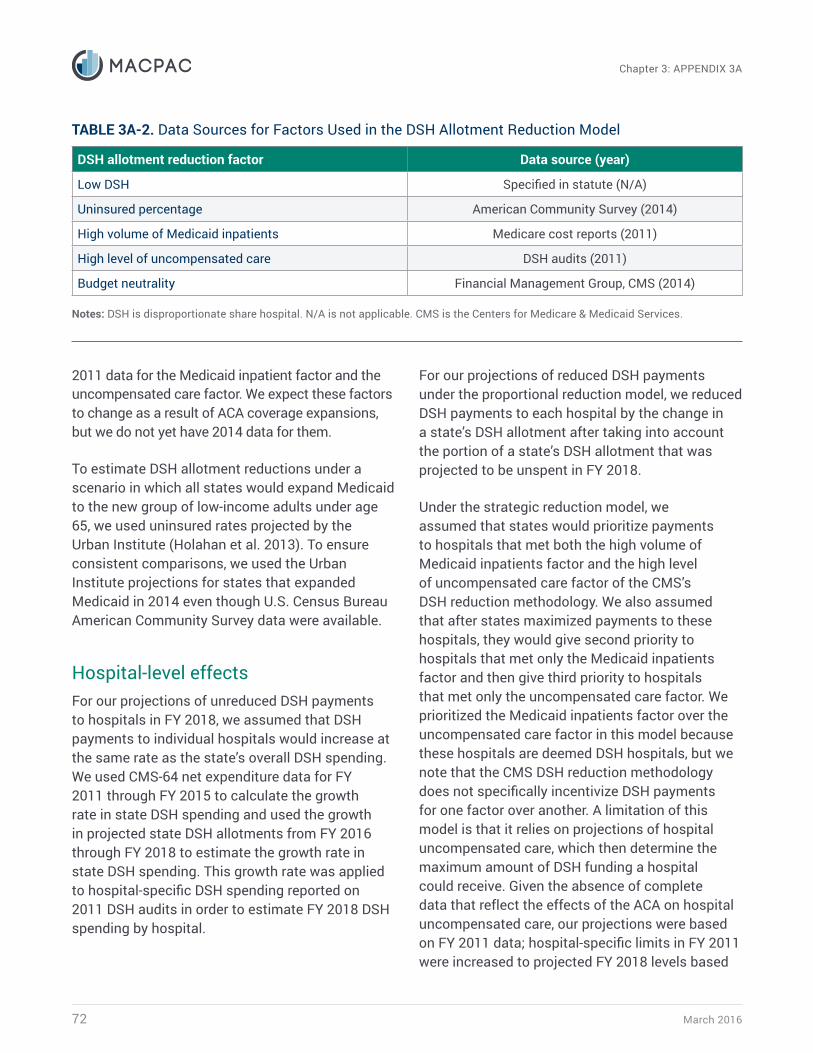
March 201672
Chapter 3: APPENDIX 3A
2011 data for the Medicaid inpatient factor and the uncompensated care factor. We expect these factors to change as a result of ACA coverage expansions, but we do not yet have 2014 data for them.
To estimate DSH allotment reductions under a scenario in which all states would expand Medicaid to the new group of low-income adults under age 65, we used uninsured rates projected by the Urban Institute (Holahan et al. 2013). To ensure consistent comparisons, we used the Urban Institute projections for states that expanded Medicaid in 2014 even though U.S. Census Bureau American Community Survey data were available.
Hospital-level effectsFor our projections of unreduced DSH payments to hospitals in FY 2018, we assumed that DSH payments to individual hospitals would increase at the same rate as the state’s overall DSH spending. We used CMS-64 net expenditure data for FY 2011 through FY 2015 to calculate the growth rate in state DSH spending and used the growth in projected state DSH allotments from FY 2016 through FY 2018 to estimate the growth rate in state DSH spending. This growth rate was applied to hospital-specific DSH spending reported on 2011 DSH audits in order to estimate FY 2018 DSH spending by hospital.
For our projections of reduced DSH payments under the proportional reduction model, we reduced DSH payments to each hospital by the change in a state’s DSH allotment after taking into account the portion of a state’s DSH allotment that was projected to be unspent in FY 2018.
Under the strategic reduction model, we assumed that states would prioritize payments to hospitals that met both the high volume of Medicaid inpatients factor and the high level of uncompensated care factor of the CMS’s DSH reduction methodology. We also assumed that after states maximized payments to these hospitals, they would give second priority to hospitals that met only the Medicaid inpatients factor and then give third priority to hospitals that met only the uncompensated care factor. We prioritized the Medicaid inpatients factor over the uncompensated care factor in this model because these hospitals are deemed DSH hospitals, but we note that the CMS DSH reduction methodology does not specifically incentivize DSH payments for one factor over another. A limitation of this model is that it relies on projections of hospital uncompensated care, which then determine the maximum amount of DSH funding a hospital could receive. Given the absence of complete data that reflect the effects of the ACA on hospital uncompensated care, our projections were based on FY 2011 data; hospital-specific limits in FY 2011 were increased to projected FY 2018 levels based
TABLE 3A-2. Data Sources for Factors Used in the DSH Allotment Reduction Model
DSH allotment reduction factor Data source (year)
Low DSH Specified in statute (N/A)
Uninsured percentage American Community Survey (2014)
High volume of Medicaid inpatients Medicare cost reports (2011)
High level of uncompensated care DSH audits (2011)
Budget neutrality Financial Management Group, CMS (2014)
Notes: DSH is disproportionate share hospital. N/A is not applicable. CMS is the Centers for Medicare & Medicaid Services.
Report to Congress on Medicaid and CHIP 73
Chapter 3: APPENDIX 3A
on CMS national health expenditure projections for hospitals.
Preliminary Analysis of 2014 Medicare Cost Report DataTo explore the effects of the ACA on hospital uncompensated care, we examined data from 1,371 hospitals that submitted a full year of uncompensated care data beginning January 1, 2014 (comprising about 23 percent of all U.S. hospitals). We excluded from our analysis hospitals that had not submitted complete uncompensated care data for 2011–2013. DSH hospitals from 40 states accounted for about half of the hospitals in this analysis, which is similar to their share of all U.S. hospitals. All hospital types were included, but children’s hospitals, long-term care facilities, and psychiatric hospitals were underrepresented (in the aggregate accounting for less than 10 percent of the total) because of a lack of complete uncompensated care data on Medicare cost reports. Categorized by ownership status, our preliminary analysis included approximately 25 percent of all U.S. non-profit hospitals, 23 percent of all U.S. for-profit hospitals, and 17 percent of all U.S. public hospitals.
ReferencesCenters for Medicare & Medicaid Services (CMS), U.S. Department of Health and Human Services. 2013. Medicaid program: State disproportionate share hospital allotment reductions. Final rule. Federal Register 78, no. 181 (September 18): 57293–57313. https://federalregister.gov/a/2013-22686.
Congressional Budget Office (CBO). 2015. An update to the budget and economic outlook: 2015 to 2025. August 25. Washington, DC: CBO. https://www.cbo.gov/publication/50724.
Holahan, J., M. Buettgens, and S. Dorn. 2013. The cost of not expanding Medicaid. Washington, DC: Kaiser Commission on Medicaid and the Uninsured, Kaiser Family Foundation. http://kff.org/medicaid/report/the-cost-of-not-expanding-medicaid/.
Wynn, B, T. Coughlin, S. Bondarenko, and B. Bruen. 2002. Analysis of the joint distribution of disproportionate share hospital payments. Project memorandum PM-1387-ASPE to the Assistant Secretary of Planning and Evaluation, U.S. Department of Health and Human Services. September 20, 2002. Washington, DC: RAND. http://aspe.hhs.gov/health/Reports/02/DSH/index.htm.

CHAPTER 4
Integration of Behavioral and Physical Health Services in Medicaid
March 201676
Chapter 4: Integration of Behavioral and Physical Health Services in Medicaid
Integration of Behavioral and Physical Health Services in Medicaid
Key Points• Services for physical health and behavioral health (which includes mental health and
substance use disorders) historically have been financed and delivered under separate systems. As a result, Medicaid enrollees with behavioral health conditions often find themselves interacting with multiple public and private agencies and receiving care from myriad providers funded from different sources.
• Given the large numbers of Medicaid beneficiaries with a behavioral health diagnosis and the substantial costs associated with their care, state Medicaid programs are looking for ways to improve care and reduce expenses. Clinicians and program administrators are also looking for better ways to treat behavioral health conditions and prevent these conditions from getting worse or contributing to a decline in physical health.
• Integrating physical and behavioral health has been shown to reduce fragmentation of services and promote patient-centered care for adults with depression and anxiety disorders. However, current evidence is limited or inconclusive for children and adolescents and for individuals with substance use disorders or serious mental illness. The growing number of behavioral health integration evaluations underway will provide additional information on how these efforts are affecting outcomes and costs.
• There is no one-size-fits-all model for behavioral health integration. Efforts to integrate care can encompass clinical, financial, and administrative domains. State Medicaid programs are adopting different approaches to integrate behavioral health and physical health care, including comprehensive managed care, health homes, and accountable care organizations.
• Legal, administrative, and cultural barriers can discourage integration efforts. These barriers include billing restrictions, privacy requirements and data sharing restrictions, the Medicaid institutions for mental diseases (IMD) exclusion, and separate professional training of physical health and behavioral health providers.
• The Commission plans to explore approaches to integrating additional services, such as pharmacy, long-term services and supports, and social determinants of health. We also intend to examine the impact of the Medicaid IMD exclusion on behavioral health services and Medicaid’s interaction with other systems that provide behavioral health services to the Medicaid population, such as the criminal justice system.
Report to Congress on Medicaid and CHIP 77
Chapter 4: Integration of Behavioral and Physical Health Services in Medicaid
CHAPTER 4: Integration of Behavioral and Physical Health Services in MedicaidHistorically, services for physical health and behavioral health (which includes both mental health and substance use disorders) have been financed and delivered under separate systems. That means Medicaid enrollees with behavioral health conditions often find themselves interacting with multiple public and private agencies and receiving care from myriad providers funded from different sources. This fragmentation can impede access to care and result in inappropriate use of services, poor health status, and increased costs (Melek et al. 2014, IOM 2006, deGruy 1996). As policymakers, program administrators, clinicians, and patient advocates consider ways to improve the delivery of services for individuals with behavioral health disorders, some are pointing to integration of the delivery of behavioral and physical health services as critical to both providing care more cost effectively and improving health outcomes.
The term behavioral health integration is used to describe a wide range of activities designed to provide care to the whole person (including physical health, behavioral health, and other services) in contrast to approaches that focus on specific body systems, diagnoses, or conditions. Efforts to integrate behavioral and physical health extend across the continuum of care, from prevention to rehabilitation. These efforts include colocating physical and behavioral health providers, sharing data and information, blending funding streams, and consolidating Medicaid and state behavioral health agencies. The Agency for Healthcare Research and Quality (AHRQ), in its Lexicon for Behavioral Health and Primary Care Integration, defines integration as “the care that results from a practice team of primary care and
behavioral health clinicians, working together with patients and families, using a systematic and cost-effective approach to provide patient-centered care for a defined population. This care may address mental health and substance abuse conditions, health behaviors (including their contribution to chronic medical illnesses), life stressors and crises, stress-related physical symptoms, and ineffective patterns of health care utilization” (Peek and NIAC 2013). This broad definition can be used to characterize the many different approaches that clinical providers and state Medicaid programs have used to implement integration, which can occur across varying levels (e.g., clinical, payment, and administrative).
There is a burgeoning evidence base that suggests integration efforts can lead to improved care and reduced costs when focused on certain populations or certain circumstances. For example, randomized control trials, systematic literature reviews, and meta-analyses have documented the effectiveness of integrating behavioral health into primary care settings for adults with depression and anxiety disorders (Miller et al. 2013, Archer et al. 2012, Woltmann et al. 2012). The evidence base supporting integration models for individuals with substance use disorders or serious mental illness, however, is limited and has shown mixed results (Asarnow et al. 2015, Gerrity 2014). Additionally, there are relatively few studies examining the effect of integration models on outcomes for children and adolescents (Asarnow et al. 2015). Furthermore, most studies have focused on clinical integration at the practice level, leaving many questions unanswered about the effects of financial and administrative integration efforts that are underway in Medicaid programs.
There is no one-size-fits-all model for behavioral and physical health integration due to the variation in recommended treatment and treatment location for different behavioral health conditions. The National Council for Community Behavioral Healthcare’s Four Quadrant Model suggests that individuals who are at the lowest risk for behavioral
March 201678
Chapter 4: Integration of Behavioral and Physical Health Services in Medicaid
and physical complications are best served in a physical health setting with on-site behavioral health clinicians. Individuals with high behavioral health needs and low physical needs might be better served in behavioral health settings that have linkages to physical care. Those with high physical and high behavioral health needs may benefit most from bidirectional models of care, in which the individual is served in both health care settings with close collaboration between the two sites (Mauer 2009).
The integration of behavioral and physical health should not be viewed as a panacea. Breaking down silos in the payment and administration of behavioral health does not ensure that individuals with behavioral health disorders will receive appropriate services in the most cost-effective manner. Moreover, compared to physical health, there are fewer performance measures for behavioral health and fewer proven strategies for implementing measures that do exist to improve quality and outcomes (Barry et al. 2015, Kilbourne et al. 2010). Such knowledge gaps make it difficult to evaluate the effectiveness of interventions, generalize about the benefits of integration, and determine which integration elements can lead to improved health care outcomes or cost savings.
Even so, state Medicaid programs are increasingly adopting varying degrees of behavioral health integration to address the needs of the 20 percent of Medicaid beneficiaries with behavioral health disorders (MACPAC 2015a, SHADAC 2015). Federal efforts, such as the Centers for Medicare & Medicaid Services (CMS) Medicaid Innovation Accelerator Program, are encouraging state integration initiatives by providing program support and funding to states to improve or expand their current mental and physical health integration efforts (CMS 2015a). These efforts take different approaches and focus on different levels of integration—clinical, payment, and administrative. However, the ability to implement specific integration strategies may be affected by state and federal policies as well as the structure
of clinical practice. Medicaid programs are working with partners to overcome some of these barriers. In addition, the 114th Congress is considering legislation to address known barriers to integration efforts—including policies about data sharing and same-day billing for physical and behavioral health services—and to provide incentives for mental health professionals to adopt electronic health records.
This chapter builds on the Commission’s earlier work documenting the compelling need to find more cost-effective ways to treat individuals with behavioral health conditions—compelling because of the number of Medicaid beneficiaries in need of care and their share of total Medicaid expenditures. These individuals comprise a diverse group, ranging from young children who need screening, referral, and treatment for attention deficit hyperactivity disorder or depression to chronically homeless adults with serious mental illness (MACPAC 2015a).
In this chapter, we provide an overview of the different ways that behavioral health can be integrated at the clinical, payer, and administrative levels within Medicaid programs. Our review of recently implemented models includes comprehensive managed care arrangements, health homes, and accountable care organizations (ACOs) (SHADAC 2015). We do not draw conclusions about which models of physical and behavioral integration are most effective. Rather, we discuss the factors that impede behavioral and physical health integration at both the practice and the program levels, such as billing and data sharing restrictions, variation in covered services, and licensing requirements—areas the Commission will investigate more fully in future work analyzing how behavioral health services are delivered in Medicaid.
Report to Congress on Medicaid and CHIP 79
Chapter 4: Integration of Behavioral and Physical Health Services in Medicaid
Why Focus on Integrating Behavioral and Physical Health in Medicaid?Integrating physical and behavioral health is one approach that states and the federal government are turning to in order to improve care and reduce expenses for high-cost, high-need beneficiaries. Clinicians and program administrators are looking for better ways to treat behavioral health conditions and better ways to prevent behavioral health conditions from getting worse or contributing to a decline in physical health.
As noted in the Commission’s June 2015 report to Congress, Medicaid is the single largest payer in the United States for behavioral health services, accounting for 26 percent of such expenditures in 2009. In 2011, one in five Medicaid beneficiaries had a behavioral health diagnosis, but care for these individuals accounted for almost half of total Medicaid expenditures. Certain Medicaid eligibility groups have the highest prevalence of, and expenditures for, behavioral health services. For example, in 2011, almost half of non-dually eligible adults enrolled in Medicaid on the basis of a disability had a behavioral health diagnosis. Similarly, the 44 percent of children eligible on the basis of receiving child welfare assistance who had behavioral health diagnoses accounted for 78 percent of total expenditures for this eligibility group. Enrollees with a behavioral health diagnosis have higher total expenditures than their counterparts with no behavioral health diagnosis in every eligibility group examined. Furthermore, many people with serious behavioral health disorders have a substantial number of comorbid acute or chronic medical conditions (MACPAC 2015a).
Hundreds of collaborative and integrated care initiatives are now underway, as evidenced by the growing number of new clinical practice manuals and websites offering information on how to integrate behavioral health and medical care as well as the development of new business
ventures to help providers integrate care (Miller et al. 2014a). State Medicaid programs that contract with managed care organizations are increasingly moving toward carve-in models, meaning that behavioral health services are covered along with physical health services under a managed care benefit package, capitation rate, and network, rather than being covered separately. At least seven states (Alabama, Colorado, Iowa, Louisiana, Nebraska, New York, and Washington) are currently planning to end their Medicaid behavioral health carve outs (OpenMinds 2016). There also is movement within Medicaid programs to use health homes and ACO models to integrate the delivery of physical and behavioral health services (SHADAC 2015).
While there is general agreement among researchers, advocates, and clinicians that the integration of physical and behavioral can improve health outcomes and reduce spending, the research supporting this belief is inconclusive and does not support one model of integration as being superior to others. The majority of research examining behavioral and physical integration has documented the effectiveness of collaborative care and integration for adults with depression and anxiety disorders (Archer et al. 2012, Woltmann et al. 2012, Miller et al. 2013). Results from these evaluations suggest that collaborative models demonstrate improvements in depression and anxiety, mental and physical quality of life, medication use, and social role function. However, in practice, clinical settings have a unique set of patients with different severities of behavioral health disorders resulting in different approaches to integration. Given the diversity of patient populations and approaches to integration, no single element has emerged as essential to the success of the model, and researchers have not been able to identify specific populations, settings, or trial implementation factors associated with better or worse performance of the integration model (Miller et al. 2013, Woltmann et al. 2012).

March 201680
Chapter 4: Integration of Behavioral and Physical Health Services in Medicaid
There are fewer studies that examine the effect of collaborative care and integration models on improving health care outcomes for children and adolescents with behavioral health disorders (Asarnow et al. 2015). Available research suggests that integrating behavioral health care within primary medical care for children and adolescents with depression, anxiety, or behavioral disorders can improve behavioral health outcomes; however, the benefits of integrating medical and behavioral health have not been shown to be statistically significant for children and adolescents with substance use disorders (Asarnow et al. 2015, Kolko et al. 2014).
In general, published research has not focused on examining the effects of integration on individuals with serious mental illness or substance use disorders. One literature review suggests that the approaches of fully integrating care and enhancing collaboration through care management both appear to improve mental health outcomes for and use of preventive services by adult patients with serious mental illness (Gerrity 2014). However, colocating primary care in chemical-dependency treatment settings without further integration of services or collaboration between providers may have little impact on outcomes for individuals with substance use disorders (Gerrity 2014). Programs focusing on integrating behavioral and physical health for individuals with serious mental illness have produced improvements in control of diabetes, cholesterol, and hypertension, but have not shown improvements in obesity or smoking, and have not suggested a clear connection between integrated care and most behavioral health outcomes (Scharf et al. 2014).
Of note, none of the above studies explicitly discusses how or if Medicaid beneficiaries were included in the study populations. However, as Medicaid programs begin implementing behavioral health integration initiatives, case studies are surfacing that highlight the effects of these programs. For example, Hennepin Health, an ACO in Minnesota that was created specifically to serve
adults newly covered under the state’s Medicaid expansion, has assembled multidisciplinary care teams, initiated data sharing through unified electronic health records, and embedded behavioral health providers in primary care settings to integrate behavioral and physical health. The program has documented decreases in emergency room and inpatient admissions and increases in outpatient visits and the number of patients receiving optimal diabetes, vascular, and asthma care (Sandberg et al. 2014).
There are a limited but growing number of case studies that specifically examine Medicaid integration initiatives and their effects on costs.1 For example, Missouri’s Community Mental Health Center Health Homes initiative, which is designed to provide integrated, patient-centered care to Medicaid beneficiaries with serious mental illness and those with other behavioral health problems combined with certain chronic conditions or tobacco use, decreased costs by $7.4 million after 18 months (Parks 2014). More information on the effects of behavioral health integration on costs to Medicaid will become available through an independent, five-year evaluation of the new health home model that was authorized under Section 2703 of the Patient Protection and Affordable Care Act (ACA, P.L. 111-148, as amended) and as longitudinal data from other initiatives become available (Spillman et al. 2014).
Research suggests that integrating physical and behavioral health can reduce fragmentation of services and promote patient-centered care. However, integrating care is complex and the success of the endeavor will depend on variables such as population characteristics, geography, market infrastructure, and types of behavioral health services delivered. We explore physical and behavioral health integration efforts, especially those being implemented within the context of the Medicaid program, in the following sections.
Report to Congress on Medicaid and CHIP 81
Chapter 4: Integration of Behavioral and Physical Health Services in Medicaid
Levels of Integration in MedicaidIntegration of behavioral and physical health can occur at different levels. Clinical integration occurs at the point of service and refers to the actions clinicians and care coordinators take to bridge the divide between the physical and behavioral health delivery systems and provide person-centered care. System integration occurs at the program policy and administration level and includes actions payers and administrators of behavioral health services take, such as blending funding streams and consolidating the administration of services.
Clinical integration Physical and behavioral health providers typically practice in separate facilities and have different philosophies and training on how best to treat patients. (A divide can exist even among behavioral health providers; for example, mental health and substance use services are often provided in separate settings, by different providers, with diverse expertise.) Separate systems for physical and behavioral health can result in beneficiaries with comorbid conditions bouncing between care settings. Such fragmentation can be confusing for patients to navigate and confusing for providers who are unaware of treatment plans or prescriptions recommended by other professionals. It can result in inappropriate, uncoordinated, and often inefficient care and lead to poor health outcomes and increased costs (IOM 2006).
Behavioral health conditions are often first diagnosed and treated in a primary care setting or in the emergency room (Anderson et al. 2015, Kessler 2012, Downey et al. 2009, Kessler and Stafford 2008). This reliance on primary care diagnosis for behavioral health conditions may reflect the high prevalence of comorbid physical conditions, limited access to behavioral health providers, or the prevailing stigma associated with seeking and receiving behavioral health
treatment (MACPAC 2015a, Klein and Hostetter 2014). Complicating matters, physical health providers may not be trained to diagnose or treat behavioral health conditions or make referrals to appropriate clinicians, and as a result, individuals with behavioral health conditions may leave a health care setting without receiving appropriate treatment or referrals (Klein and Hostetter 2014).
Clinical integration can occur in three ways—bringing physical health care into traditional behavioral health settings, bringing behavioral health care into traditional physical health settings, or doing both. At its best, clinical integration can change the focus of care delivery from isolated episodes of treatment to a comprehensive approach in which services are delivered in a consistent and coordinated manner with accountability not only for health outcomes but also for costs (Cohen et al. 2015). Integrating physical and behavioral health services can promote patient referrals and follow-up, foster collaboration in decision making, and connect beneficiaries to needed resources, resulting in more effective and efficient care (Heath et al. 2013, Peek and NIAC 2013, Brown et al. 2012).
Although there is no one model of clinical integration or definitive set of core features that will always lead to improved health outcomes and reduced costs, components of integration at the clinical level can include the following:
Care coordination/care management. Care coordinators (also referred to as care managers) act as single points of contact for patients and as hubs for the multiple providers treating a patient. They can facilitate the appropriate delivery of behavioral and physical health services to patients by assessing patient needs and goals, creating care plans, helping the patient transition from an institutional setting to the community, following up after appointments, monitoring compliance with doctors’ orders, supporting the patient’s self-management goals, and linking patients to community resources (Nardone et al. 2014, Heath
March 201682
Chapter 4: Integration of Behavioral and Physical Health Services in Medicaid
et al. 2013, Peek and NIAC 2013, IOM 2006). Care coordinators can be located in behavioral health, physical health, or other settings, for instance, within the state or local Medicaid program office.
Colocation. Colocation refers to physically locating behavioral health and physical health providers in the same facility (Miller et al. 2014b). For the Medicaid population, colocation can decrease out-of-pocket costs, such as transportation and child care associated with making trips to multiple locations, and encourage follow-up with referred providers (Nardone et al. 2014). For providers, colocation can encourage face-to-face contact between providers; foster communication about shared patients; improve the efficiency of services though sharing intake, billing, and administrative services; and enhance quality through a team-based approach to care (Heath et al. 2013).
Data sharing. Sharing clinical and other patient information can help care managers and providers from different disciplines communicate and coordinate care (Cifuentes et al. 2015). Electronic health records can give authorized individuals immediate access to patient data and support knowledge transfer and informed decision making among providers (Cifuentes et al. 2015, Peek and NIAC 2013, IOM 2006). The state of Michigan, for example, developed the Michigan Health Information Network Shared Services system to share electronic health information between health care providers, Michigan’s health insurance exchange, CMS, Department of Veterans’ Affairs, and the Social Security Administration (MiHIN 2015). The system connects networks of providers focused on physical health with behavioral health and substance abuse treatment organizations, allowing providers to share a range of patient data, including demographics, type of insurance coverage, hospital admissions, medications, lab results, diagnoses, allergies, treatment plans, clinical documentation, appointments, care team information, and activity logs (MiHIN 2015, SAMHSA-HRSA 2015).
Formal or informal agreements with external partners. Formal and informal arrangements between providers of behavioral health, physical health, or auxiliary services (e.g., transportation, housing) can ensure beneficiary access to a full complement of services. For example, a substance use treatment center or mental health organization might contract with a medical group to provide physical examinations and routine medical care for its patients, or health care providers might create referral relationships with community partners providing transportation services. Such arrangements would allow providers to use community resources without colocating services, which can be difficult and costly to implement.
Screening and referral to treatment. Screening and referral to treatment refers to a comprehensive and integrated approach to identifying appropriate treatments and preventive care and recommending the appropriate source of care for identified treatments (Kessler et al. 2014). Screening and referrals can occur in both physical health and behavioral health settings. For example, physical health providers can use tools to identify specific behavioral health conditions and then help the patient take steps to get additional treatment. Conversely, behavioral health providers can be trained to monitor basic physical health conditions (Nardone et al. 2014). An evidence-based method called Screening, Brief Intervention, and Referral to Treatment (SBIRT) can be used to identify, reduce, and prevent problematic use of alcohol and illicit drugs (SBIRT Colorado 2011). Providers can use SBIRT to assess patients for risky behaviors, engage patients who exhibit risky behaviors, and make referrals to additional treatment as needed. It also helps providers and patients understand the potential health consequences of substance abuse and take steps to reduce risky behaviors. SBIRT has been shown to reduce emergency room usage and health care costs (SBIRT Colorado 2011). SBIRT is covered by some Medicaid programs (CMS 2014a); it is used by other programs, such as coordinated care organizations in Oregon, as a benchmark and improvement measure (Oregon Health Authority 2015).
Report to Congress on Medicaid and CHIP 83
Chapter 4: Integration of Behavioral and Physical Health Services in Medicaid
Provider education and training. Introducing concepts of behavioral health, interdisciplinary care teams, and integration to provider education and training programs can influence the future health care workforce’s expertise and expectations about clinical practice (Box 4-1). Residency training in family medicine and psychiatry is evolving to address these barriers to integration. Family medicine residents are now required to receive training in behavioral health, and psychiatry residents are required to complete a portion of the first year of residency training in a primary care setting (ACGME 2014a, 2014b). However, such training is not required in other medical specialties (ACGME 2013, Leigh et al. 2008).
Clinical integration of behavioral and physical health is being implemented at the federal and the state level. At the federal level, the Protecting Access to Medicare Act of 2014 (P.L. 113-93) authorized a demonstration of a new provider
type: certified community behavioral health clinics. These clinics are designed to provide community-based behavioral health services and are required to support care coordination, partner with other state and federal agencies delivering behavioral health services, hire staff with diverse disciplinary backgrounds, and develop formal relationships with other providers to ensure appropriate referrals and delivery of necessary treatment. Certified clinics are eligible for enhanced Medicaid funding through a prospective payment system that supports the delivery of evidence-based and integrated care. Additionally, states can receive an enhanced Medicaid federal match for services delivered by certified community behavioral health clinics (SAMHSA 2015a). As of October 2015, 24 states received planning grants to support the development of the demonstration. After the planning grant ends, up to eight states will be eligible to participate in the demonstration (SAMHSA 2015b).
BOX 4-1. Project TEACH (Training and Education for the Advancement of Children’s Health)
In 2007, New York State created Project TEACH as a way to strengthen and support the ability of primary care physicians to provide mental health services to children, adolescents, and families. Project TEACH provides primary care providers with 15 hours of in-person training over 3 days, a 6-month case-based clinical distance learning program (including 12 hour-long consultation calls), and a set of web-based learning tools. Project TEACH has two component programs: Child and Adolescent Psychiatry for Primary Care and Child and Adolescent Psychiatry Education and Support. Both component programs provide primary care providers with training, education, and assistance as well as information about specialized mental health centers located in their practice region (IDEAS Center 2015).
An evaluation of the programs found that participating primary care providers reported more confidence interacting with families, assessing the severity of behavioral health conditions, prescribing medication, and developing treatment plans for children and adolescents with mental health conditions. Providers also reported better interactions with mental health specialists. There were, however, reports of barriers to implementing Project TEACH practices. Providers reported that time constraints and competing priorities limited their ability to talk to patients about mental health conditions and to treat mental health conditions holistically. Some providers also expressed the belief that negative patient impressions or the stigmas associated with mental health disorders and treatment would limit their ability to implement Project TEACH practices (Gadomski et al. 2014).
March 201684
Chapter 4: Integration of Behavioral and Physical Health Services in Medicaid
At the local level, providers are implementing clinical integration efforts. Cherokee Health Systems, a community mental health center and federally qualified health center with 45 clinical locations in 13 Tennessee counties, is one of the most well-known Medicaid providers doing so. Cherokee Health Systems has embedded licensed behavioral health consultants as members of its primary care teams. It also makes psychiatrists available for consultation on site or through telepsychiatry, promotes and encourages provider communication and comanagement of shared patients, and uses shared electronic medical records (Cherokee Health Systems 2015, Freeman 2010). Cherokee Health Systems also provides consultation to other practices, providing both financial and technical support in linking physical health practices with behavioral health services (Takach et al. 2010). Cherokee Health Systems reports that its model has improved health outcomes, decreased referrals to specialty mental health care, increased patient compliance, and increased provider and patient satisfaction. Cherokee Health Systems has also documented reduced costs, hospital use, and emergency room visits compared to other regional providers (Freeman 2010).
System integration Behavioral and physical health integration is also being achieved at the system level through changes in payment and administration. Such efforts are often led by the state Medicaid agency through collaboration with payers and other state and federal agencies (e.g., the Substance Abuse and Mental Health Services Administration (SAMHSA), or state behavioral health agencies). These efforts include blending multiple funding streams and consolidating agencies that administer behavioral health services. They can have widespread effects on the delivery of behavioral health services, and they are often difficult to implement.
Payment integration. Multiple government agencies are involved in the financing and delivery
of behavioral health services for low-income populations. Thus, Medicaid beneficiaries can receive services from many different federal, state, and local agencies, including mental health and substance use agencies, school systems, criminal and juvenile justice departments, and child welfare agencies. Funding for these services comes from multiple sources, including state general funds, federal Medicaid matching dollars, and grants from federal agencies such as SAMHSA, and state administrators must often work to cobble together financing for the continuum of behavioral health services. In addition, state behavioral health agencies can use state funding as a portion of the state’s share of Medicaid spending, which allows the state to draw down additional federal dollars to support behavioral health services. In 2013, states used Medicaid, mental health block grants from SAMHSA, and state general funds most frequently to cover community mental health center services such as outpatient testing and treatment, crisis services, and case management services. However, many states also used state general funds to cover supported employment, residential board and care, and state psychiatric hospitals. Medicare was used most frequently to support inpatient hospital services (NRI et al. 2015).
Although different programs can work together to maximize the delivery of behavioral health services, historical, political, legislative, and regulatory barriers may impede integration efforts. For example, these programs often have their own provider networks, eligibility systems, and billing procedures and rates. Even within Medicaid, a state may provide behavioral health services through a combination of payment approaches (e.g., fee for service or managed care), and authorities (e.g., waiver or state plan). In 2013, 30 states and the District of Columbia used both fee-for-service and managed care approaches to pay for mental health services, 15 relied only on fee-for-service approaches, and 4 used only managed care (NRI et al. 2015).2 Many states also use Section 1115 research and demonstration waivers, Section 1915(b) managed care waivers, Section 1915(c)
Report to Congress on Medicaid and CHIP 85
Chapter 4: Integration of Behavioral and Physical Health Services in Medicaid
home and community-based services waivers, Section 1915(i) home and community-based services, or the state plan rehabilitation option to provide mental health or substance use services (NRI et al. 2015).
The use of different purchasing models for different types of services and providers may limit the ability of states to completely blend funding streams. Medicaid pays for services under fee for service to individual providers and through capitated payments to plans, whereas behavioral health agencies traditionally either employ providers or make direct payments to a network of specialty behavioral health providers. In addition, the use of state behavioral health agency funding for Medicaid match could divert state dollars away from individuals with behavioral health disorders who do not meet Medicaid eligibility rules as well as from programs that otherwise have limited funding or no dedicated funding source (State Health Care Spending Project 2015, Garfield 2011, Frank et al. 2003).
Integration of administration and oversight. State mental health and substance use agencies play a large role in administering behavioral health services for Medicaid beneficiaries and their ability to work closely with Medicaid is affected by the organizational structure of the state government. In most states, either the state Medicaid agency and the state mental health agency are located in the same umbrella department, or they are located in different departments but have an interagency agreement for planning and delivering mental health services. In some states (Arizona, California, Michigan, and Pennsylvania), the state mental health agency is part of the state Medicaid agency (Betlach 2015, NRI et al. 2015).
State Medicaid agencies have authority over all Medicaid services, but they can delegate responsibility for certain services and functions to other agencies. In some states the Medicaid agency delegates responsibility for Medicaid behavioral health payment and clinical policies
(e.g., certifying and enrolling providers, defining covered services, and collecting and reporting data) to state mental health and substance use agencies. States also take varying approaches to setting rates. For example, according to SAMHSA, 19 state mental health agencies are responsible for setting Medicaid rates for mental health services, 16 are responsible for setting Medicaid rates for those services provided by state mental health agency funded providers, 15 set Medicaid rates only for mental health services provided by state mental health agency operated providers, and 4 are responsible for setting Medicaid rates for mental health services provided by organizations that do not receive state mental health agency funding (NRI et al. 2015).
Responsibility for delivery of behavioral health services can also be spread across multiple agencies depending on populations served and geographic areas. For example, in Florida, most Medicaid enrollees are enrolled in a Medicaid managed care plan. The state has contracted with a specialty managed care plan, Magellan Complete Care, in certain regions of the state to serve Medicaid beneficiaries with serious mental illness, covering and coordinating both physical and behavioral health services for enrollees. Those with serious mental illness who do not live in a county in which Magellan Complete Care operates receive both physical and behavioral health care through another managed care plan that may not offer specialized benefits or coordination (AHCA Florida 2015).
Historically, state Medicaid and behavioral health agencies served different populations that were treated by separate providers in isolated care settings using different funding streams. In addition, authority and oversight of behavioral health services were often assumed by multiple agencies. When Medicaid delegates responsibility for Medicaid behavioral health services, it further divides monitoring and provision of physical and behavioral health services within the Medicaid program. Variation in organizational mission,
March 201686
Chapter 4: Integration of Behavioral and Physical Health Services in Medicaid
expertise, and leadership across agencies may make it difficult to integrate services under one organization or to hold any one actor accountable for outcomes (Bachrach et al. 2014).
States are addressing the fragmented nature of the behavioral health system in different ways. Some states are addressing these concerns by consolidating agencies. For example, from 2012 to 2013, California eliminated the Department of Alcohol and Drug Programs and the Department of Mental Health, transferring functions and responsibilities to the state’s Medicaid agency. The goal was to create efficiencies for state government, counties, and providers and to promote coordination of services (Bachrach et al. 2014, Rawson and Lee 2011, California Health and Human Services Agency 2011).
Other states are merging mental health and substance abuse agencies into a single agency or parallel agencies under the same umbrella organization. In 2013, the state of Ohio merged the Ohio Department of Alcohol and Drug Addiction Services and the Ohio Department of Mental Health (Johnson 2013, ODADAS and ODMH 2012).
States are also developing stronger or more formalized relationships between Medicaid and other agencies. Some state Medicaid programs and criminal justice departments are beginning to work together to help individuals transitioning into and out of the criminal justice system (Gates et al. 2014, Salt Lake County Local Authority 2014, Sutcliffe 2014). Although federal law prohibits federal funding for most Medicaid services provided to incarcerated individuals, Medicaid and criminal justice programs in a growing number of states and localities are working together to facilitate the Medicaid eligibility determination and enrollment process as individuals return to the community (Smith et al. 2005). Given the high prevalence of behavioral health conditions among the incarcerated population, facilitating Medicaid enrollment for eligible individuals may improve
health outcomes, reduce rates of recidivism, and lower costs to the state (Gates et al. 2014).
Along similar lines, Medicaid agencies are collaborating with the child welfare system to integrate the delivery of behavioral health services furnished by these separate agencies. Title IV-E of the Social Security Act provides federal funding for child welfare assistance for low-income children who have been removed from their homes. Individuals receiving federal child welfare assistance under Title IV-E are automatically eligible for Medicaid, and often need a range of Medicaid-covered physical and behavioral health services—in 2011, 44 percent of children who received child welfare assistance had a behavioral health diagnosis (MACPAC 2015a). Child welfare agencies, in addition to ensuring the safety of these children, must also ensure that their health needs are met. However, federal child welfare funds under Title IV-E cannot be used for health care-related services. To better serve child welfare-involved youth, therefore, state Medicaid agencies and child welfare agencies are working together to share data, facilitate Medicaid enrollment, and maximize federal funding for services provided to these children. One such state is Tennessee, where the Department of Child Services and TennCare, the state Medicaid agency, have an interagency agreement with specific provisions for coordinating the enrollment of and ongoing provision of health services to all children in state custody (MACPAC 2015a). (For more information on the intersection of Medicaid and the child welfare system, refer to Chapter 3 of the Commission’s June 2015 report to Congress.)
Medicaid Behavioral Health Integration InitiativesState Medicaid programs vary in their approaches to integrate behavioral health and physical health care. The following section describes how states
Report to Congress on Medicaid and CHIP 87
Chapter 4: Integration of Behavioral and Physical Health Services in Medicaid
use comprehensive managed care, ACOs, and health homes models to integrate physical and behavioral health.
Much of the presented information is drawn from a scan of Medicaid efforts to integrate behavioral and physical health services that was conducted for the Commission by the State Health Access Data Assistance Center (SHADAC) at the University of Minnesota School of Public Health. This project consisted of a comprehensive web search of state program information, as of March 2015, across all 50 states and the District of Columbia. The scan found that most behavioral health integration efforts could be categorized as one of the following delivery approaches: comprehensive managed care, health homes, ACOs, primary care case management, and patient-centered medical homes.
The research team focused on identifying behavioral health integration efforts implemented through state Medicaid programs and policies. These could include statewide or county efforts, but not initiatives driven by providers or plans. The review also excluded programs that integrated other services concurrently, such as long-term services and supports, to be sure that any effects seen in individuals with behavioral health disorders could be attributed primarily to behavioral health integration efforts.3
Although this review is not a comprehensive list of all behavioral health integration efforts underway that might affect Medicaid beneficiaries, it illustrates the types of payment models, integration mechanisms, target populations, and provider types that characterize Medicaid behavioral health integration initiatives.4 In total, the effort detailed 19 behavioral health integration efforts across 17 states. Most of these programs are relatively new; only 3 date to 2010 or earlier, with 16 having been developed since 2011, including 8 programs implemented since 2014. Half of the programs are classified as health homes, and half target individuals with serious mental illness. (A summary of all findings can be found in Appendix 4A.)
The review also shows the variety of approaches that states are testing and how each approach uses different mechanisms to integrate care. About half of the programs we studied chose to integrate physical health into behavioral health care environments; several integrated behavioral health into physical health care settings; and a few opted for two-way integration. Only a few of the programs were using a colocation approach. However, most of the documentation we found described efforts at a programmatic level, so it is possible that more individual practices have colocated providers than we could detect.
We found little information on how the goals and elements of integration are implemented at the practice level, particularly for data sharing, care coordination, and case management. There was also limited information on the effects of these programs on health outcomes and costs. More time and study are needed to determine the effectiveness of these programs and to understand which components of integration are most conducive to achieving program goals. The complete catalog of Medicaid initiatives has been posted on the MACPAC website (SHADAC 2015).
Comprehensive managed care For many years, state Medicaid programs have contracted with managed care organizations to provide physical and behavioral health services. The reliance on managed care is increasing and its use varies widely by states, both in the arrangements used and the populations served. Some states carve behavioral health services completely out of their managed care contracts or separate the delivery of mental health services from substance use services by including only one set of services in the state’s primary Medicaid managed care contract. But a growing number of states are moving toward carve-in models, so that a single managed care entity holds financial and administrative responsibility for both behavioral and physical health services.
March 201688
Chapter 4: Integration of Behavioral and Physical Health Services in Medicaid
Carve in. In recent years, many states have carved behavioral health services into their primary Medicaid managed care contracts, and at least seven states are either planning or currently implementing carve in of behavioral health services (OpenMinds 2016). Behavioral health carve in centralizes accountability for quality and costs within one organization. Tennessee’s Medicaid program integrates physical health, behavioral health, and long-term services and supports for all Medicaid beneficiaries into its managed care contracts, putting plans at full risk for all services. (Previously, behavioral health benefits were managed by the Tennessee Department of Mental Health and Substance Abuse Services.) The state reports that this approach has reduced inpatient utilization and emergency room visits and has led to improvements in care and decreased costs (TennCare 2015, Stanek 2014, Hamblin et al. 2011).
Carve-in structures are sometimes limited to individuals with certain behavioral health conditions, such as serious mental illness. The Minnesota Preferred Integrated Network Program is a public-private partnership between Dakota County and a Medicaid managed care organization that coordinates physical and behavioral health care services for Medicaid-eligible adults under age 65 who have serious mental illness and for children with serious emotional disturbances. Enrollees have access to the full continuum of services, and a single point of contact is held accountable for delivery of services (SHADAC 2015).
Some stakeholders have raised concerns that carving behavioral health services into a comprehensive managed care contract does not guarantee successful integration of physical and behavioral health services, particularly if the managed care organization does not have stable relationships with appropriate providers or expertise or experience in managing behavioral health conditions. Additionally, stakeholders have commented that in such arrangements, coverage of behavioral health services can be limited,
especially if plans focus on other aspects of care or take other steps to keep costs within the limitations of a capitated payment (Bachrach et al. 2014, National Council 2011).
Carve out. Many states are unable to carve behavioral health services into their managed care contracts due to a combination of financial constraints, policy restrictions, historical precedent, managed care experience and penetration in the state, and stakeholder opposition. As a result, some states or localities contract separately with specialized provider networks or with managed behavioral health organizations to provide these services, which may operate under capitated or fee-for-service arrangements.
Another reason carve outs have been used is that these services can be capitated, which may help keep down spending growth relative to fee for service. Carve outs also allow managed behavioral health organizations to create a network of experts experienced in managing behavioral health problems of specific populations, and the managed behavioral health organization can focus on developing performance standards and monitor quality of care specific to behavioral health populations that may be overlooked or emphasized less by other providers (Bachrach et al. 2014, Mechanic 2003).
For example, in 2011, Maryland started the stakeholder process of developing a model of integrated behavioral and physical health (Maryland Department of Health and Mental Hygiene 2012a). Previously, mental health services for Medicaid were carved out of Medicaid managed care, and an administrative services organization was responsible for the provision of mental health services. Substance use services were managed separately by eight Medicaid managed care organizations as part of an integrated benefit with physical health. In addition, management responsibilities for mental health and substance use disorder services were shared among three
Report to Congress on Medicaid and CHIP 89
Chapter 4: Integration of Behavioral and Physical Health Services in Medicaid
state agencies—the Alcohol and Drug Abuse Administration, the Mental Health Administration, and Medicaid—all within the Maryland Department of Health and Mental Hygiene (McMahon 2015).
In 2012, the state changed its approach, consolidating the Mental Hygiene Administration and the Alcohol and Drug Abuse Administration into a new Behavioral Health Administration. It also carved both mental health and substance use services out of Medicaid and began delivering these through one administrative services organization. Now, Medicaid oversees the financing of behavioral health services while the administrative services organization is responsible for delivery of services. As a result, the state benefits from the behavioral health experience of a specialized administrative services organization and shifts financial risk to the managed care organization (Maryland Department of Health and Mental Hygiene 2012b, 2011).
Maryland’s change in approach allowed the state to reach all Medicaid beneficiaries, including dually eligible beneficiaries who are not mandatorily enrolled in Maryland’s Medicaid managed care program. These dually eligible beneficiaries would have been excluded from a behavioral health carve in model, creating the need for a separate behavioral health carve out for this population. Also avoided was the situation in which Medicaid-only beneficiaries turning 65 and becoming dually eligible would have been forced to leave their existing plan and providers. A carve-out model allows individuals to stay with their administrative service organization to access behavioral health services regardless of transitions from Medicaid-only to dually eligible status. Additionally, in a behavioral health carve-out model, behavioral health providers are spared the administrative burdens associated with complying with the credentialing, prior authorization, utilization review, payment rates, and contracting practices of each of the state’s eight managed care organizations. Finally, the carve-out model is helpful in situations
where income changes cause individuals with behavioral health conditions to churn between Medicaid coverage and exchange plans. Given that the administrative service organization serves as the single point of contact for entities outside Medicaid interfacing with the Medicaid behavioral health system, this may allow coordinated transitions for individuals between Medicaid and exchange plans. Smoother transitions are also expected when individuals transition from local and state behavioral health programs to Medicaid (Boozang et al. 2014, Maryland Department of Health and Mental Hygiene 2012a).
However, carve-out models can lead to segmentation of care, poor coordination, restrictions on choice, and disruptions in continuity of care (Bachrach et al. 2014). Carving behavioral health services out of managed care plans can create complications for providers and beneficiaries. If behavioral health services are carved out and the plan has a separate behavioral health network, providers may not know that behavioral health benefits are carved out of the patient’s primary Medicaid managed care plan, or even if they themselves are within the managed behavioral health organization’s network. Behavioral health providers may also need separate prior authorizations to be paid for non-emergency behavioral health services. In such situations, providers simply may not get paid if prior authorization procedures are not followed (AMA 2015). For beneficiaries, carve-out models involve multiple points of contact for accessing services.
Health homesAs noted earlier, the health homes program created by the ACA is designed to ensure whole-person care, integrating primary, acute, and behavioral health care as well as long-term services and supports and social and family supports. The law also provides a fiscal incentive in the form of a temporary
March 201690
Chapter 4: Integration of Behavioral and Physical Health Services in Medicaid
enhanced 90 percent federal match for the first two years of state health home programs.5 States are increasingly using health homes to integrate physical and behavioral health (CMS 2015b).
The health homes option provides flexibility for states in program design but is available only for individuals with certain chronic conditions—those with two or more chronic conditions, one chronic condition and risk factors for another, or serious mental illness (Box 4-2). As of December 2015, 20 states and the District of Columbia were operating a total of 27 approved Medicaid health home models, serving over 1 million enrollees. Of these 27 health home models, 14 are targeted to a specific mental health or substance use population (CMS 2015b, 2015c).
ACOsACOs have recently emerged in Medicaid, and a few states are using these structures to integrate behavioral and physical health. An ACO is typically a provider-led organization comprised of different types of providers who deliver care across multiple care settings for a defined population. Providers contract directly with payers. The ACO structure often marries care delivery reforms with new provider payment strategies, such as shared savings/risk programs and global payments or budgeting (Brown and McGinnis 2014).
States can encourage behavioral health integration by including behavioral health services in ACO payments, or requiring ACOs to include behavioral health providers or behavioral health into quality
BOX 4-2. Health Homes That Integrate Behavioral Health ServicesMissouri Community Mental Health Center Healthcare Homes. The Missouri Community Mental Health Center Healthcare Homes initiative is focused exclusively on high-cost Medicaid beneficiaries with either serious mental illness or other behavioral health problems combined with other chronic conditions or tobacco use. Only community mental health centers are eligible to participate as health homes under this initiative. Participating community mental health centers provide comprehensive care management, care coordination, health promotion, transitional care, patient and family support, referral to community and social support services, and use of health information technology to link services for Medicaid beneficiaries. The program has reported decreased blood pressure, low-density lipoprotein cholesterol levels, and hemoglobin A1C levels (a blood test used for diabetes management) in enrollees and has been shown to reduce hospitalizations, emergency room visits, and spending (SHADAC 2015).6
West Virginia Health Homes. West Virginia’s health homes program is currently limited to Medicaid beneficiaries with bipolar disorder who are at risk of or are infected with hepatitis type B, type C, or both who reside within a six-county region (the six counties with the largest number of enrollees with bipolar disorder). Approved behavioral health homes include federally qualified health centers, other specialty care centers, and community mental health centers. The program provides Medicaid beneficiaries with comprehensive care management, care coordination, health promotion services, transitional care, patient and family support, and referrals to community and social support services (SHADAC 2015).
Report to Congress on Medicaid and CHIP 91
Chapter 4: Integration of Behavioral and Physical Health Services in Medicaid
and performance metrics (Box 4-3) (CHCS 2015). Most Medicaid ACOs are in their infancy, and they vary significantly based on a state’s health care environment. More research is needed to understand how these models can successfully integrate behavioral health and if they can improve outcomes and reduce costs for individuals with behavioral health conditions.
Behavioral Health Integration Efforts for Dually Eligible Beneficiaries The 10 million people dually eligible for Medicare and Medicaid account for a disproportionate share of Medicare and Medicaid spending (MedPAC and MACPAC 2016). Their high costs are associated with complex health needs, including high
BOX 4-3. Medicaid Accountable Care Organizations Integrating Behavioral Health Services
Accountable Care Collaborative, Colorado. Through its Accountable Care Collaborative initiative, Colorado contracts with five regional care collaborative organizations to establish networks of primary care providers and to provide care coordination for Medicaid enrollees at the regional level. In the first phase, behavioral health was carved out of the Accountable Care Collaborative and financed through capitated payments with behavioral health organizations. However, in 2015, the initiative entered the second phase, which is realizing the long-term vision of the program to integrate behavioral health and long-term services and supports with physical health. Regional care collaborative organizations have improved the referral process by providing enrollees with timely referrals to behavioral health services and have instituted a communication feedback loop with primary care providers. They are also developing telehealth video conferencing options for linking behavioral health providers to primary care provider sites, and they are aiding primary care providers by bringing behavioral health professionals on site (Colorado Department of Health Care Policy and Financing 2015, SHADAC 2015).
Southern Prairie Community Care, Minnesota. Southern Prairie Community Care is a collaborative effort among 12 Minnesota counties that share the desire to enhance the quality of life for citizens through the integration of services and supports provided throughout their communities. The collaborative is the first multicounty partnership to join Minnesota’s Medicaid accountable care organization demonstration, called the Integrated Health Partnerships program. Under a contract with the State of Minnesota, Southern Prairie Community Care’s total cost of care for Medicaid enrollees will be measured against targets for both cost and quality, and providers in its network can share in savings resulting from the program. Southern Prairie Community Care collects, analyzes, and uses clinical data across collaborating partners to improve outcomes, engages patients to manage their own health and outcomes, and facilitates coordination across providers. Southern Prairie Community Care providers assess Medicaid enrollees for medical and psychosocial issues. Medicaid enrollees are identified by three levels of risk. Individuals identified as high risk receive care coordination for 6–12 months to address complex medical and psychosocial issues; individuals identified as intermediate risk receive care coordination for 1–3 months; and individuals identified as low risk receive usual care (SHADAC 2015).
March 201692
Chapter 4: Integration of Behavioral and Physical Health Services in Medicaid
prevalence of behavioral health disorders. In 2009, approximately 44 percent of dually eligible Medicare and Medicaid enrollees had at least one mental or cognitive condition, compared to 19 percent of all other Medicare beneficiaries (Kasper et al. 2010). Like other dually eligible beneficiaries, those with behavioral health disorders must navigate a Medicare benefit that is usually provided through two separate programs—original Medicare (Parts A and B) for acute and postacute care services and Medicare Part D for prescription drugs—while also managing separate Medicaid coverage for certain out-of-pocket costs and services that Medicare does not cover, including the home- and community-based services often needed by this population.7 Several initiatives are underway to align Medicare and Medicaid program financing, administration, and care delivery for dually eligible beneficiaries, including the Financial Alignment Initiative, the Dual Eligible Special Needs Plans, and the Program of All-Inclusive Care for the Elderly. The goal of these initiatives is to fully integrate the clinical delivery of Medicare and Medicaid behavioral health services while aligning the financial and administrative structures of Medicare and Medicaid.
Financial Alignment Initiative The Financial Alignment Initiative, a three-year demonstration, is testing models of integrated care and payment. As of October 2015, 13 states are participating, with over 380,000 individuals enrolled (CMS 2015d, 2011). Each state model is unique, with different target populations, benefits, care coordination services, and payment frameworks. Ten states are participating under the capitated model, two are participating under managed fee for service, and one is participating under an alternative model.
A key component of the capitated model of the Financial Alignment Initiative is the coordination and integration of Medicare and Medicaid benefits, including behavioral health services, through a single health plan. Required elements include care coordination, health assessments, individualized
care plans, interdisciplinary care teams, and methods for ensuring care continuity. Some states also have chosen to expand behavioral health and other benefits under the demonstration. Under the demonstration, the state of Massachusetts is expanding diversionary behavioral health services to demonstration enrollees.8 It is also requiring participating plans to complete a health risk assessment and a care plan for each enrollee, to maintain enrollees’ current providers and service authorizations for a period of up to 90 days (or until the health risk assessment and care plans are completed), and to contract with community-based organizations for the coordination of long-term services and supports (MACPAC 2015b).
However, some states in the Financial Alignment Initiative demonstration have elected to continue to separate Medicare and Medicaid payment of behavioral health services by carving behavioral health out of the demonstration. For example, in California, although plans are financially responsible for all Medicare behavioral health services, some Medicaid specialty mental health services that are not covered by Medicare and certain Medi-Cal drug benefits are not included in the capitated payment.9 These services are financed and administered by county agencies under the state’s Medicaid managed care waiver and its state plan (MACPAC 2015b, California Department of Health Care Services 2013).
Dual Eligible Special Needs Plans (D-SNPs) Dual Eligible Special Needs Plans (D-SNPs) are a type of Medicare Advantage plan that enable better coordination of services for dually eligible beneficiaries. D-SNPs must provide a coordinated Medicare and Medicaid benefit package that offers more integrated care than regular Medicare Advantage plans or Medicare fee for service. In each state in which they operate, D-SNPs must have a contract with the state Medicaid agency to provide Medicaid benefits or must arrange
Report to Congress on Medicaid and CHIP 93
Chapter 4: Integration of Behavioral and Physical Health Services in Medicaid
for benefits to be provided (Verdier et al. 2015). However, D-SNPs often do not clinically or financially integrate Medicaid benefits, and most D-SNP contracts do not cover all of Medicaid’s behavioral health services (MedPAC 2013). As a result, even plans that are designed to integrate behavioral health benefits across Medicare and Medicaid for dually eligible beneficiaries can be limited in their ability to do so (MedPAC 2013).
Fully Integrated Dual Eligible Special Needs Plans (FIDE SNPs) are a special type of D-SNP authorized by the ACA that are designed to promote the full integration and coordination of Medicare and Medicaid benefits for dually eligible beneficiaries by a single managed care organization. FIDE SNPs must meet several specific requirements, including coordination of Medicare and Medicaid physical health services, behavioral health services, and long-term services and supports (Verdier et al. 2015). However, there are relatively few of these plans. Compared to 336 D-SNPs serving over 1.7 million enrollees, there are only 37 FIDE SNPs, which serve under 113,000 beneficiaries across seven states (Verdier 2015).
Program of All-Inclusive Care for the Elderly (PACE) The PACE program provides comprehensive medical and social services to certain frail, community-dwelling individuals age 65 and older who are dually eligible for Medicare and Medicaid. The program is designed to provide beneficiaries with a comprehensive service package that enables them to remain in the community rather than receive care in a nursing home. PACE is a Medicare program, although states can elect to provide PACE services to Medicaid beneficiaries as an optional Medicaid benefit. The PACE financing model combines payments from Medicare and Medicaid and private pay sources into one flat-rate payment to cover a range of treatments and services, including behavioral health services. PACE organizations provide care and services in the home, in the
community, and in PACE centers. Although PACE programs are allowed to contract with separate behavioral health specialists, some have begun including behavioral health providers in their on-site care teams. One study showed that integrating behavioral health providers within a PACE program increased the number of appointments to mental health clinicians, and reduced psychiatric inpatient utilization (Ginsburg and Eng 2009). Overall, the PACE program has shown that integrating the financing of Medicare and Medicaid, coupled with integrating care for physical health, behavioral health, long-term services and supports, and ancillary services can lead to both improved health outcomes and reduced expenses over time for a high-cost, high-needs population (Hirth et al. 2009).
One noticeable weakness of the PACE program is its limited flexibility and scalability: there are only 116 PACE programs in 32 states (National PACE Association 2015). Legislation enacted in late 2015 (P.L. 114-85) extended the authority of the Secretary of the U.S. Department of Health and Human Services to change program features to try to improve the program. Permissible changes include altering payment rates and benefits and expanding eligibility to those under the age of 55, possibly providing new opportunities to integrate physical and behavioral health for dually eligible beneficiaries.
Barriers to Behavioral and Physical Health Integration in MedicaidThere is evidence to suggest that programs to integrate behavioral and physical health can be effective in improving care and controlling costs, both in general and within Medicaid, and an increasing number of Medicaid agencies are initiating such programs. However, implementation is far from universal. Legal, administrative, and cultural barriers discourage integration efforts; some of these are described below.
March 201694
Chapter 4: Integration of Behavioral and Physical Health Services in Medicaid
Billing policies and restrictionsBeing able to provide physical and behavioral health services on the same day encourages providers to colocate and implement integration efforts. However, some state Medicaid programs prohibit a provider from billing for both a behavioral health and physical health visit on the same day or to bill for more than one medical, behavioral health, or dental encounter per day.10 These billing restrictions are designed to reduce inappropriate billing (such as sending a patient for unnecessary referrals or tests while they are at the provider location), but they have unintended consequences that can limit access to care. These policies are of particular concern to colocated providers who provide both medical and behavioral health services at the same site. Some states have addressed this issue through state policy (Houy and Bailit 2015, NACHC 2012, SAMHSA 2010).
Coverage of behavioral health servicesMedicaid coverage of behavioral health services varies considerably across states and may not include all the services needed by individuals with behavioral health conditions. To the extent that services are not covered, integration of those services with others cannot be accomplished. For example, state coverage of substance use services can be limited or dependent upon the authority a state uses to provide services, the beneficiary’s eligibility pathway, or financial support from other funders, such as SAMHSA or state mental health agencies. These variables also affect the coverage of services that facilitate behavioral and physical health integration, such as SBIRT and telehealth (Houy and Bailit 2015).
Institutions for mental diseases (IMD) exclusionThe Medicaid IMD exclusion is a statutory provision that prohibits federal Medicaid reimbursement for inpatient care provided to individuals over age 21 and under age 65 who are patients in an IMD, as well as other benefits
provided to IMD residents whether these are furnished inside or outside the IMD. IMDs can include psychiatric hospitals, nursing facilities and chemical dependency treatment facilities. This means states will not use Medicaid dollars for beneficiaries who are over age 21 and under age 65 who are patients of an IMD for these services (Box 4-4) (Rosenbaum et al. 2002).
The IMD exclusion serves as a barrier to integration in several ways. First, it creates a disincentive for physical health providers to provide care in IMDs and accept patient referrals of individuals who are residents of IMDs because Medicaid will not pay for the provision of these services. Second, it discourages certain residential facilities, such as long-term care facilities, from treating and accepting Medicaid patients with behavioral health diagnoses because they run the risk of being classified as an IMD and losing federal financial participation for their Medicaid patients (McMahon 2015, Edwards 1997, Office of Technology Assessment 1987).
Provider ability to bill MedicaidBehavioral health integration often relies on many types of providers, including physicians, psychologists, social workers, and peer counselors. States often limit the types of practitioners who can bill Medicaid for behavioral health services. For example, psychologists are often restricted in the types of services they can provide and might be required to have a relationship with the ordering physician, and psychologists in training (i.e., supervised interns, residents, and postdoctoral trainees) might not be able to bill Medicaid. Such policies limit the ability of medical facilities to integrate these professionals into their care teams (Houy and Bailit 2015, APA 2012).
Privacy and data sharingThe ability to share data among providers and between providers and patients is a fundamental component of behavioral health integration. However, rules preventing the exchange of health
Report to Congress on Medicaid and CHIP 95
Chapter 4: Integration of Behavioral and Physical Health Services in Medicaid
data create barriers to integrating care. At the federal level, privacy rules established by the Health Insurance Portability and Accountability Act of 1996 (HIPAA, P.L. 104-191) often prevent parents, family members, and caregivers from receiving health information about family members with serious mental illness, particularly those over the age of 18 (English and Ford 2004). Federal rules authorized by the Comprehensive Alcohol Abuse and Alcoholism Prevention, Treatment, and Rehabilitation Act (P.L. 114-38) and the Drug Abuse Prevention, Treatment, and Rehabilitation Act of 1972 (P.L. 96-181) limit, with few exceptions, the disclosure of identifiable information by a federally assisted substance abuse
treatment program to any entity, even for treatment, without signed consent from the patient to authorize the disclosure to specific data recipients (42 CFR 2.1—2.67). Federal and state privacy requirements can lead to the exclusion of behavioral health data from health information exchange regulations (Truven Health Analytics 2014). States often impose additional limitations on sharing behavioral health information across providers and between providers and insurers (Jost 2006). Although these restrictions were put in place to protect the privacy of individuals with behavioral health disorders, they also impede the sharing of information among providers—sharing that could benefit patients.
BOX 4-4. Opportunities and Challenges for Medicaid Coverage of Services to Adults over Age 21 and under Age 65 Residing in Institutions for Mental Diseases
Through Section 1115 waivers, Medicaid managed care, and the Medicaid Emergency Psychiatric Demonstration states can cover services for a Medicaid beneficiary who is over the age of 21 and under the age 65 who is an IMD resident (Maryland Department of Health and Mental Hygiene 2015; CMS 2015e, 2015f). However, the pathways to cover IMD services are often limited:
• CMS approved IMD exclusion Section 1115 waivers in 10 states, which allowed these states to cover services for IMD residents, but in fiscal year 2006 CMS began to phase out these waivers. Maryland is currently seeking an amendment to its HealthChoice Section 1115 demonstration that would allow Medicaid to pay for services in IMDs (Maryland Department of Health and Mental Hygiene 2015).
• On June 1, 2015, CMS published a notice of proposed rulemaking to modernize Medicaid managed care regulations. This proposed rule allows managed care organizations and prepaid inpatient health plans to receive full federal match on a monthly capitation payment for an enrollee over age 21 and under age 65 who spends less than 15 days in an IMD during that month. Although this allows Medicaid managed care plans to pay for and receive full federal match for services provided to individuals in an IMD, it is limited to only 15 days during a month, which may not be sufficient to meet all patient needs (CMS 2015f).
• The Medicaid Emergency Psychiatric Demonstration, established in Section 2707 of the ACA, permits Medicaid payment to participating private psychiatric facilities for treatment of Medicaid beneficiaries, over age 21 and under age 65. This demonstration is limited to 27 private psychiatric facilities across 11 states and the District of Columbia. This three-year demonstration program ended six months early but was allowed to be extended through 2019 under the Improving Access to Emergency Psychiatric Care Act (P.L. 114-97) (CMS 2015e).
March 201696
Chapter 4: Integration of Behavioral and Physical Health Services in Medicaid
Adoption of health information technologyThe ability to share data and fully integrate care delivery is dependent on provider ability to adopt electronic health records. Behavioral health providers often have limited working capital to invest in technology, and some behavioral health facilities and providers are ineligible to receive incentive payments to adopt electronic health records. For example, behavioral health facilities are not eligible for Medicaid meaningful use incentive facility payments because only hospitals are eligible for these payments. Furthermore, only certain providers working in behavioral health—physicians, nurse practitioners and certain physician assistants—are eligible for the Medicaid incentive payments. Of behavioral health providers who are eligible, few have been able to meet meaningful use standards (CMS 2015g, Bachrach et al. 2014, National Council 2012).
Temporary fundingAs noted throughout the chapter, many of the opportunities states and providers have to integrate behavioral and physical health care are only made possible by temporary funding streams. For example, the Medicaid Emergency Psychiatric Demonstration is a time-limited demonstration program, the health homes program has a temporary 90 percent federal match for the first two years, and the CMS Medicaid Innovation Accelerator Program focusing on behavioral and physical integration will offer states time-limited technical assistance and support to expand existing integration efforts. Without sustained funding, states and providers might have to end current behavioral and physical health integration efforts. Some may choose not to pursue integration efforts knowing that funding will be terminated or decreased over time.
Licensing requirementsHealth care facilities are required to adhere to state licensing requirements that are meant
to protect patients and ensure the appropriate delivery of services. However, the involvement of multiple state agencies can result in conflicting, overlapping, or duplicate licensing requirements that impede the delivery of integrated care. Typically, facility and staffing requirements assume that physical and behavioral health services are provided in separate settings with different providers. For example, if a mental health organization provides basic physical health services (e.g., blood pressure monitoring, checking vital signs), the facility may be required to meet the standards of the physical health provider (e.g., regarding exam rooms, bathrooms, drug storage, or lab services) even if the mental health provider does not plan to offer extensive physical health services. Similarly, a physical health provider organization seeking to include behavioral health providers on site could be required to meet all the staffing requirements for a mental health clinic, such as the presence of a psychiatrist, certain education levels for all behavioral health providers, or a multidisciplinary care team (Houy and Bailit 2015, Bachrach et al. 2014).
Behavioral health workforcePhysical and behavioral health integration is dependent on the availability and patient capacity of behavioral health professionals (Burke et al. 2013). The general shortage and geographic maldistribution of behavioral health providers coupled with the unwillingness of some to serve the Medicaid population limits access for Medicaid beneficiaries (Hyde 2013, Decker 2012). The Health Resources and Services Administration (HRSA) reports that in 2015 there were over 4,200 areas in the United States with a shortage of mental health professionals (HRSA 2015a).11 HRSA and SAMHSA have worked together to increase the number of primary care and behavioral health providers of all levels who are committed to serving an underserved population through the National Health Service Corps program, the Graduate Psychology Education program, and the Behavioral Health Workforce Education and Training for Professionals and Paraprofessionals

Report to Congress on Medicaid and CHIP 97
Chapter 4: Integration of Behavioral and Physical Health Services in Medicaid
program (HRSA 2015b, 2015c). State Medicaid programs can also support behavioral health provider and integration training by leveraging their use of Medicaid graduate medical education funding.12 States can use this funding to support residency training in community health centers, to require that training programs include a module on behavioral health integration, and to support the training of behavioral health specialists and providers willing to serve Medicaid beneficiaries (IOM 2014, Spero et al. 2013).
Infrastructure capacityBehavioral health and physical health providers that seek to integrate care may need to add staff, conduct training, and build infrastructure (e.g., billing, clinical workflows, and human resource management) to serve patients with complex needs. However, the ability of providers to scale up is often limited by financial constraints and the availability of trained providers. Federal and state agencies have recognized that integration is not a simple task, and some have offered financial support to providers to expand their service lines (Colorado Department of Health Care Policy and Financing 2015, HRSA 2015d).
Professional cultural and training barriersPhysical health and behavioral health providers typically train and practice separately. This leads to differences in treatment philosophies, working styles, and patient-communication practices. Lack of knowledge regarding the different fields and different workforce cultures can impede the delivery of integrated care. Training the future physical and behavioral health workforce to practice collaboratively and in team settings with multiple levels of providers can foster integration while also making the core components (e.g., care coordination, colocation, screening and referral to treatment) the new norm for care delivery (Lewin Group and Institute for Healthcare Improvement 2012, Leigh et al. 2008).
Conclusion The integration of physical and behavioral health systems, services, and providers can play a role in improving health outcomes and reducing costs for a high-cost, high-need population. In addition, Medicaid enrollees with behavioral health conditions almost always have problems with their physical health. The behavioral and physical conditions can interact with and exacerbate each other, and they often lead to worse outcomes if not treated in a coordinated manner (MACPAC 2015a).
The increasing number of behavioral health integration efforts reflects movement in understanding how best to treat behavioral health conditions and prevent them from getting worse or contributing to a decline in physical health. Behavioral health integration within the Medicaid program is not defined by one model and can encompass clinical, financial, and administrative domains. However, the spectrum of integration models—plus research gaps, policy and practice barriers, and limited quality measures for behavioral health outcomes—makes it difficult for policymakers and program administrators to determine which model or hybrid would work best to improve health outcomes and reduce costs in a given setting.
The Commission plans to continue working in this area; for instance, exploring the integration of additional types of services like pharmacy, long-term services and supports, and services that affect the social determinants of health such as housing. Additionally, we intend to examine the Medicaid IMD exclusion and Medicaid’s interaction with other systems that provide behavioral health services to the Medicaid population such as the criminal justice system. In doing so, we will continue to highlight the needs of individuals with behavioral health disorders and consider whether recommendations for Medicaid policy changes are warranted.
March 201698
Chapter 4: Integration of Behavioral and Physical Health Services in Medicaid
Endnotes1 It is worth noting that the definition of included costs affects results. Most studies consider the costs of administering an integration initiative, such as provider and case manager salaries and benefits, overhead, record keeping, and program materials, in their calculations. However, it is often unclear if and how these studies incorporate start-up costs, such as program planning, recruitment, and training. Additionally, it is not clear if programs that receive start-up funds or a temporary enhanced federal match can sustain their efforts after that initial funding period is over.
2 The state of Kansas did not report its Medicaid payment approaches for mental health services in the cited SAMHSA report. However, Kansas has since reported that it covers all behavioral health services through managed care (NRI et al. 2015, CMS 2014b).
3 For purposes of this project, behavioral health disorders encompassed all mental health conditions. Programs in the planning and development stages or programs that had expired as of March 1, 2015, were excluded.
4 For an overview of behavioral health and physical health integration efforts that are occurring at the clinical level across the country, see AHRQ’s interactive integration map at http://integrationacademy.ahrq.gov/ahrq_map (AHRQ 2015).
5 States receive eight fiscal quarters of 90 percent federal match for specific health home services. These services include: comprehensive care management, care coordination and health promotion, comprehensive transitional care, individual and family support services, linkage and referral to community and social support services, and use of health information technology (Spillman et al. 2014).
6 Missouri has another health home, the Primary Care Health Home. This health home targets individuals with chronic conditions, and as a result was not included in the catalog.
7 For dually eligible beneficiaries, Medicaid covers services that are not covered under Medicare, such as long-term services and supports. Certain dually eligible beneficiaries might also have their Medicare premiums and cost-sharing paid for by Medicaid (MACPAC 2015c).
8 Diversionary behavioral health services can include, but are not limited to, community crisis stabilization, community support programs, transitional care units, structured outpatient addiction programs, and psychiatric day treatment (Massachusetts Executive Office of Health and Human Services 2016).
9 Specialty mental health services not covered by Medicare include intensive day treatment, day rehabilitation, crisis intervention, crisis stabilization, adult residential treatment services, crisis residential treatment services, targeted case management, portions of inpatient psychiatric hospital services, and medication support services. Certain Medi-Cal drug benefits include levoalphacetylmethadol (LAAM) and methadone maintenance therapy, day care rehabilitation, outpatient individual and group counseling, perinatal residential services, and naltrexone treatment for narcotic dependence (MACPAC 2015b).
10 In 2010, SAMHSA identified 30 states that paid for both a behavioral health visit and medical visit on the same day, 14 states that prohibited same-day billing for behavioral health and medical visits, and 3 states that allowed for same-day billing in fee for service, but not for federally qualified health centers. SAMHSA was unable to determine same-day billing policies for the remaining three states (SAMHSA 2010).
11 HRSA developed the health professional shortage areas criteria to define and designate areas characterized by a shortage of primary medical, dental, or mental health providers (HRSA 2015b).
12 Graduate medical education is the period of medical education that occurs after physicians graduate from medical or dental school.
ReferencesAccreditation Council for Graduate Medical Education (ACGME). 2014a. ACGME program requirements for graduate medical education in psychiatry. Chicago, IL: ACGME. https://www.acgme.org/acgmeweb/portals/0/pfassets/programrequirements/400_psychiatry_07012014.pdf.
Accreditation Council for Graduate Medical Education (ACGME). 2014b. ACGME program requirements for graduate medical education in family medicine. Chicago, IL: ACGME.
Report to Congress on Medicaid and CHIP 99
Chapter 4: Integration of Behavioral and Physical Health Services in Medicaid
https://www.acgme.org/acgmeweb/Portals/0/PFAssets/ProgramRequirements/120_family_medicine_07012014.pdf.
Accreditation Council for Graduate Medical Education (ACGME). 2013. ACGME program requirements for graduate medical education in internal medicine. Chicago, IL: ACGME. https://www.acgme.org/acgmeweb/Portals/0/PFAssets/2013-PR-FAQ-PIF/140_internal_medicine_07012013.pdf.
Agency for Healthcare Research and Quality (AHRQ), U.S. Department of Health and Human Services. 2015. Where integration is happening. Rockville, MD: AHRQ. http://integrationacademy.ahrq.gov/ahrq_map.
American Medical Association (AMA). 2015. Texas Medicaid provider procedures manual, January 2016: Medicaid managed care handbook. http://www.tmhp.com/tmppm/tmppm_living_manual_current/Vol2_Medicaid_Managed_Care_Handbook.pdf.
American Psychological Association (APA). 2012. Compilation of Medicaid state barriers to psychological services. Washington, DC: APA. http://www.apapracticecentral.org/update/2012/09-27/compilation-medicaid.pdf.
Anderson, E., M. Chen, J. Perrin, and J. Van Cleave. 2015. Outpatient visits and medication prescribing for U.S. children with mental health conditions. Pediatrics 136, no. 5: 1178–1185. http://pediatrics.aappublications.org/content/early/2015/10/06/peds.2015-0807.full.pdf.
Archer, J., P. Bower, S. Gilbody, et al. 2012. Collaborative care for depression and anxiety problems. Cochrane Database Systematic Reviews. http://onlinelibrary.wiley.com/doi/10.1002/14651858.CD006525.pub2/abstract.
Asarnow, J.R., M. Rozenman, J. Wiblin, and L. Zeltzer. 2015. Integrated medical-behavioral care compared with usual primary care for child and adolescent behavioral health: a meta-analysis. JAMA Pediatrics 169, no. 10: 929–937. http://archpedi.jamanetwork.com/article.aspx?articleid=2422331#poi150036r13.
Bachrach, D., S. Anthony, and A. Detty. 2014. State strategies for integrating physical and behavioral health services in a changing Medicaid environment. New York, NY: The Commonwealth Fund. http://www.commonwealthfund.
org/~/media/files/publications/fund-report/2014/aug/1767_bachrach_state_strategies_integrating_phys_behavioral_hlt_827.pdf.
Barry, C., E.A. Stuart, J.M. Donohue, et al. 2015. The early impact of the ‘alternative quality contract’ on mental health service use and spending in Massachusetts. Health Affairs 34, no. 12: 2077–2085. http://content.healthaffairs.org/content/34/12/2077.full.pdf+html.
Betlach, T. 2015. AHCCCS update 2015 NAMD. Presentation before the 2015 NAMD Conference, November 3, 2015, Arlington, VA. http://medicaiddirectors.org/wp-content/uploads/2015/11/reaching_the_next_level_in_the_climb_to_integrated_physical_and_behavioral_health_care_tom_betlach.pdf.
Bonner, L. 2015. NC legislature approves Medicaid privatization. The News & Observer, September 22. http://www.newsobserver.com/news/politics-government/state-politics/article36223626.html.
Boozang, P., D. Bachrach, and A. Detty. 2014. Coverage and delivery of adult substance abuse services in Medicaid managed care. Baltimore, MD: Centers for Medicare & Medicaid Services, U.S. Department of Health and Human Services. https://www.medicaid.gov/Medicaid-CHIP-Program-Information/By-Topics/Benefits/Downloads/CMS-Adult-Substance-Abuse-Services-Coverage.pdf.
Brown, D., and T. McGinnis. 2014. Considerations for integrating behavioral health services within Medicaid accountable care organizations. Hamilton, NJ: Center for Health Care Strategies. http://www.chcs.org/media/ACO-LC-BH-Integration-Paper-0709141.pdf.
Brown Levey, S.M., B.F. Miller, and F.V. deGruy. 2012. Behavioral health integration: An essential element of population-based healthcare redesign. Translational Behavioral Medicine 2, no. 3: 364–371. http://www.ncbi.nlm.nih.gov/pmc/articles/PMC3717906/.
Burke, B.T., B.F. Miller, M. Proser, et al. 2013. A needs-based method for estimating the behavioral health staff needs of community health centers. BMC Health Services Research 2013,13:245. http://bmchealthservres.biomedcentral.com/articles/10.1186/1472-6963-13-245.
March 2016100
Chapter 4: Integration of Behavioral and Physical Health Services in Medicaid
California Department of Health Care Services. 2013. The Coordinated Care Initiative and behavioral health services: Frequently asked questions. Sacramento, CA: California Department of Health Care Services. http://www.calduals.org/wp-content/uploads/2013/03/FAQ-BH.pdf.
California Health and Human Services Agency. 2011. DADP/DMH/DHCS reorganization. June 2, 2011, policy position statement. Sacramento, CA: State of California Health and Human Services Agency. http://thearcca.org/policy/Medicaid%20Consolidation%206.2.11.pdf.
Center for Health Care Strategies (CHCS). 2015. State approaches for integrating behavioral health into Medicaid accountable care organizations. Hamilton, NJ: CHCS. http://www.chcs.org/media/ACO-LC-BH-Integration-TA_Final-9.22.pdf.
Center for Implementation-Dissemination of Evidence-Based Practices among States (IDEAS Center). 2015. Training and Education for the Advancement of Children’s Health (TEACH) evaluation project. New York, NY: IDEAS Center. http://www.ideas4kidsmentalhealth.org/project-teach-evaulation.html.
Centers for Medicare & Medicaid Services (CMS), U.S. Department of Health and Human Services. 2015a. Physical and mental health integration. Baltimore, MD: CMS. https://www.medicaid.gov/state-resource-center/innovation-accelerator-program/physical-and-mental-health-integration/physical-and-mental-health-integration.html.
Centers for Medicare & Medicaid Services (CMS), U.S. Department of Health and Human Services. 2015b. Medicaid health homes: An overview. Baltimore, MD: CMS. http://www.medicaid.gov/state-resource-center/medicaid-state-technical-assistance/health-homes-technical-assistance/downloads/medicaid-health-homes-overview.pdf.
Centers for Medicare & Medicaid Services (CMS), U.S. Department of Health and Human Services. 2015c. Approved Medicaid health home state plan amendments. Baltimore, MD: CMS. http://www.medicaid.gov/state-resource-center/medicaid-state-technical-assistance/health-homes-technical-assistance/downloads/hh-map_v50.pdf.
Centers for Medicare & Medicaid Services (CMS), U.S. Department of Health and Human Services. 2015d. Financial Alignment Initiative. Baltimore, MD: CMS.
http://www.cms.gov/Medicare-Medicaid-Coordination/Medicare-and-Medicaid-Coordination/Medicare-Medicaid-Coordination-Office/FinancialAlignmentInitiative/FinancialModelstoSupportStatesEffortsinCareCoordination.html.
Centers for Medicare & Medicaid Services (CMS), U.S. Department of Health and Human Services. 2015e. Medicaid Emergency Psychiatric Demonstration. Baltimore, MD: CMS. https://innovation.cms.gov/initiatives/medicaid-emergency-psychiatric-demo/.
Centers for Medicare & Medicaid Services (CMS), U.S. Department of Health and Human Services. 2015f. Medicaid and Children’s Health Insurance Program (CHIP) Programs: Medicaid Managed Care, CHIP delivered in Managed Care, Medicaid and CHIP comprehensive quality strategies, and revisions related to third party liability. Proposed rule. Federal Register 80, no. 104 (June 1): 31098–31297. https://federalregister.gov/a/2015-12965.
Centers for Medicare & Medicaid Services (CMS), U.S. Department of Health and Human Services. 2015g. Electronic health record incentive programs: Eligibility. Baltimore, MD: CMS. https://www.cms.gov/regulations-and-guidance/legislation/ehrincentiveprograms/eligibility.html.
Centers for Medicare & Medicaid Services (CMS), U.S. Department of Health and Human Services. 2014a. Screening, Brief Intervention, and Referral to Treatment (SBIRT) services. Baltimore, MD: CMS. https://www.cms.gov/Outreach-and-Education/Medicare-Learning-Network-MLN/MLNProducts/downloads/SBIRT_Factsheet_ICN904084.pdf.
Centers for Medicare & Medicaid Services (CMS), U.S. Department of Health and Human Services. 2014b. Managed care in Kansas. Baltimore, MD: CMS. https://www.medicaid.gov/medicaid-chip-program-information/by-topics/delivery-systems/managed-care/downloads/kansas-mcp.pdf.
Centers for Medicare & Medicaid Services (CMS), U.S. Department of Health and Human Services. 2011. Letter from Cindy Mann and Melanie Bella to state Medicaid directors regarding “Financial models to support state efforts to integrate care for Medicare–Medicaid enrollees.” July 8, 2011. http://www.cms.gov/Medicare-Medicaid-Coordination/Medicare-and-Medicaid-Coordination/Medicare-Medicaid-Coordination-Office/Downloads/Financial_Models_Supporting_Integrated_Care_SMD.pdf.
Report to Congress on Medicaid and CHIP 101
Chapter 4: Integration of Behavioral and Physical Health Services in Medicaid
Cifuentes, M., M. Davis, D. Fernald, et al. 2015. Electronic health record challenges, workarounds, and solutions observed in practices integrating behavioral health and primary care. Journal of the American Board of Family Medicine 28, Supplement 1: S63—S73. http://www.ncbi.nlm.nih.gov/pubmed/26359473.
Cherokee Health Systems. 2015. Corporate profile. Knoxville, TN: Cherokee Health Systems. http://www.cherokeehealth.com/index.php?page=About-Us-Corporate-Profile.
Cohen, D.J., M. Davis, B.A. Balasubramanian, et al. 2015. Integrating behavioral health and primary care: Consulting, coordinating and collaborating among professionals. Journal of the American Board of Family Medicine 28, Supplement 1: S21–S31. http://www.jabfm.org/content/28/Supplement_1/S21.full.pdf+html.
Colorado Department of Health Care Policy and Financing. 2015. Accountable Care Collaborative Phase II concept paper. Denver, CO: Colorado Department of Health Care Policy and Financing. https://www.colorado.gov/pacific/sites/default/files/ACC%20Phase%20II%20Concept%20Paper.pdf.
Decker, S. 2012. In 2011 nearly one-third of physicians said they would not accept new Medicaid patients, but rising fees may help 31, no. 8: 1673—1679. http://content.healthaffairs.org/content/31/8/1673.full.pdf.
deGruy, F. 1996. Mental health care in the primary care setting. In Primary care: America’s health in a new era, edited by M.S. Donaldson, K.D. Yordy, K.N. Lohr, and N.A. Vanselow. Washington, DC: National Academy Press. http://www.nap.edu/read/5152/chapter/16.
Downey, L.A., L.S. Zun, and S.J. Gonzales. 2009. Utilization of emergency department by psychiatric patients. Primary Psychiatry 16, no. 4: 60–64. http://primarypsychiatry.com/wp-content/uploads/import/0409PP_Downey.pdf.
Edwards, J.F. 1997. The outdated institution for mental disease exclusion: A call to re-examine and repeal the Medicaid IMD exclusion. http://mentalillnesspolicy.org/imd/imd-legal-analysis.pdf.
English, A., and C.A. Ford. 2004. The HIPAA privacy rule and adolescents: Legal questions and clinical challenges. Perspectives on Sexual and Reproductive Health 36, no. 2: 80–86. https://www.guttmacher.org/pubs/journals/3608004.html.
Florida Agency for Health Care Administration (AHCA Florida). 2015. A snapshot of the Florida Medicaid managed medical assistance program. Tallahassee, FL: AHCA Florida. https://ahca.myflorida.com/Medicaid/statewide_mc/pdf/mma/SMMC_MMA_Snapshot.pdf.
Frank, R.G., H.H. Goldman, and M. Hogan. 2003. Medicaid and mental health: Be careful what you ask for. Health Affairs 22, no. 1: 101–113. http://content.healthaffairs.org/content/22/1/101.full.pdf.
Freeman, D.S. 2010. Taking a road less traveled: Evolution of the Cherokee Health Systems integrated behavioral health and primary care system. Presentation before the Substance Abuse and Mental Health Services Administration, April 28, 2010, Washington, DC. http://www.integration.samhsa.gov/pbhci-learning-community/Evolving_from_a_CMHC_to_an_FQHC.pdf.
Gadomski, A.M., L.S. Wissow, L. Palinkas. et al. 2014. Encouraging and sustaining integration of child mental health into primary care: Interviews with primary care providers participating in Project TEACH (CAPES and CAP PC) in NY. General Hospital Psychiatry 36, no. 6: 555–562. http://www.ncbi.nlm.nih.gov/pmc/articles/PMC4240770/.
Gates, A., S. Artiga, and R. Rudowitz. 2014. Health coverage and care for the adult criminal justice-involved population. Washington, DC: Kaiser Commission on Medicaid and the Uninsured, Kaiser Family Foundation. http://kff.org/uninsured/issue-brief/health-coverage-and-care-for-the-adult-criminal-justice-involved-population/.
Garfield, R.L. 2011. Mental health financing in the United States: A primer. Washington, DC: Kaiser Commission on Medicaid and the Uninsured, Kaiser Family Foundation. https://kaiserfamilyfoundation.files.wordpress.com/2013/01/8182.pdf.
Gerrity, M. 2014. Integrating primary care into behavioral health settings: What works for individuals with serious mental illness. New York, NY: Milbank Memorial Fund. http://www.milbank.org/uploads/documents/papers/Integrating-Primary-Care-Exec-Sum.pdf.
Ginsburg, I.F., and C. Eng. 2009. On-site mental health services for PACE (Program of All-Inclusive Care for the Elderly) centers. Journal of the American Medical Directors
March 2016102
Chapter 4: Integration of Behavioral and Physical Health Services in Medicaid
Association 10, no. 4: 277–280. http://www.ncbi.nlm.nih.gov/pubmed/19426945.
Hamblin, A., J. Verdier, and M. Au. 2011. State options for integrating physical and behavioral health care: Technical assistance brief. Baltimore, MD: Centers for Medicare & Medicaid Services (CMS), U.S. Department of Health and Human Services. Baltimore, MD: CMS. http://www.healthtransformation.ohio.gov/LinkClick.aspx?fileticket=0zJCWaw_O3Q%3D&tabid=122.
Health Resources and Services Administration (HRSA), U.S. Department of Health and Human Services. 2015a. Health professional shortage areas. Rockville, MD: HRSA. http://datawarehouse.hrsa.gov/topics/shortageareas.aspx.
Health Resources and Services Administration (HRSA), U.S. Department of Health and Human Services. 2015b. Mental/behavioral health: HRSA-SAMHSA collaborative grants. Rockville, MD: HRSA. http://bhpr.hrsa.gov/grants/mentalbehavioral/index.html.
Health Resources and Services Administration (HRSA), U.S. Department of Health and Human Services. 2015c. National Health Service Corps. Rockville, MD: HRSA. http://nhsc.hrsa.gov/.
Health Resources and Services Administration (HRSA), U.S. Department of Health and Human Services. 2015d. FY 2016 substance abuse service expansion technical assistance. Rockville, MD: HRSA. http://bphc.hrsa.gov/programopportunities/fundingopportunities/substanceabuse/.
Heath B., P. Wise Romero, and K. Reynolds. 2013. A standard framework for levels of integrated healthcare. Washington, DC: SAMHSA-HRSA Center for Integrated Health Solutions. http://www.integration.samhsa.gov/integrated-care-models/A_Standard_Framework_for_Levels_of_Integrated_Healthcare.pdf.
Hirth, V., J. Baskins, and M. Denver-Bumba. 2009. Program of All-Inclusive Care (PACE): Past, present, and future. Journal of the American Medical Directors Association 2009, no. 10: 155–160. http://www.dhcs.ca.gov/provgovpart/Documents/Waiver%20Renewal/PACE_Article_JAMDA_091.pdf.
Houy, M., and M. Bailit. 2015. Barriers to behavioral and physical health integration in Massachusetts. Boston, MA:
Blue Cross Blue Shield Foundation Massachusetts. http://bluecrossfoundation.org/sites/default/files/download/publication/Barriers%20to%20Behavioral%20and%20Physical%20Health%20Integration%20in%20MA_Final.pdf.
Hyde, P. 2013. Report to Congress on the Nation’s Substance Abuse and Mental Health Workforce Issues. Rockville, MD: Substance Abuse and Mental Health Services Administration, U.S. Department of Health and Human Services. https://store.samhsa.gov/shin/content/PEP13-RTC-BHWORK/PEP13-RTC-BHWORK.pdf.
Institute of Medicine (IOM), Committee on the Governance and Financing of Graduate Medical Education, and Board on Health Care Services. 2014. Graduate medical education that meets the nation’s health needs. Washington, DC: National Academies Press. http://iom.nationalacademies.org/Reports/2014/Graduate-Medical-Education-That-Meets-the-Nations-Health-Needs.aspx.
Institute of Medicine (IOM), Committee on Crossing the Quality Chasm: Adaptation to Mental Health and Addictive Disorders, and Board on Health Care Services. 2006. Improving the quality of health care for mental and substance-use conditions: Quality chasm series. Washington, DC: National Academies Press. http://www.nap.edu/catalog/11470.html232.
Johnson, A. 2013. Merged state agency to tackle mental-health, addiction issues. The Columbus Dispatch, July 2. http://www.dispatch.com/content/stories/local/2013/07/01/New-state-agency.html.
Jost, T.S. 2006. Appendix 2A: Constraints on sharing mental health and substance-use treatment information imposed by federal and state medical records privacy laws. In Improving the quality of health care for mental and substance-use conditions: Quality chasm series. Washington, DC: National Academies Press. http://www.ncbi.nlm.nih.gov/books/NBK19829/.
Kasper, J., M. O’Mally Watts, and B. Lyons. 2010. Chronic disease and co-morbidity among dual eligibles: Implications for patterns of Medicaid and Medicare service use and spending. Washington DC: Kaiser Commission on Medicaid and the Uninsured, Kaiser Family Foundation. https://kaiserfamilyfoundation.files.wordpress.com/2013/01/8081.pdf.
Report to Congress on Medicaid and CHIP 103
Chapter 4: Integration of Behavioral and Physical Health Services in Medicaid
Kessler, R., B.F. Miller, M. Kelley, et al. 2014. Mental health, substance abuse, and health behavior services in patient-centered medical homes. Journal of the American Board of Family Medicine 27, no. 5: 637–644, E1–E5. http://www.aafp.org/dam/AAFP/documents/patient_care/nrn/kessler-mental-health-pcmh.pdf.
Kessler, R. 2012. Mental health care treatment initiation when mental health services are incorporated into primary care practice. Journal of the American Board of Family Medicine 25, no. 2: 255–259. http://www.jabfm.org/content/25/2/255.full.pdf.
Kessler, R. and D. Stafford. 2008. Primary care is the de facto mental health system. In Collaborative medicine case studies: Evidence in practice. New York, NY: Springer. http://link.springer.com/chapter/10.1007%2F978-0-387-76894-6_2.
Kilbourne, A.M., D. Keyser, and H.A. Pincus. 2010. Challenges and opportunities in measuring the quality of mental health care. Canadian Journal of Psychiatry 55, no. 9: 549–557. http://www.ncbi.nlm.nih.gov/pmc/articles/PMC3084488/pdf/nihms287024.pdf.
Klein, S., and M. Hostetter. 2014. In focus: Integrating behavioral health and primary care. Quality Matters 2014, August/September (newsletter). New York, NY: The Commonwealth Fund. http://www.commonwealthfund.org/publications/newsletters/quality-matters/2014/august-september/in-focus.
Kolko, D.J., J. Campo, A.M. Kilbourne, et al. 2014. Collaborative care outcomes for pediatric behavioral health problems: A cluster randomized trial. Pediatrics 133, no. 4: e981–e992. http://pediatrics.aappublications.org/content/pediatrics/early/2014/03/19/peds.2013-2516.full.pdf.
Leigh, H., R. Mallios, and D. Stewart. 2008. Teaching psychiatry in primary care residencies: Do training directors of primary care and psychiatry see eye to eye? Academic Psychiatry 32, no. 6: 504–509. http://www.ncbi.nlm.nih.gov/pubmed/19190296.
Lewin Group and Institute for Healthcare Improvement. 2012. Approaches to integrating physical health services into behavioral health organizations. Falls Church, VA: The Lewin Group. http://www.integration.samhsa.gov/Approaches_to_Integrating_Physical_Health_Services_into_BH_Organizations_RIC.pdf.
Maryland Department of Health and Mental Hygiene. 2015. Institutions for mental disease (IMD) exclusion waiver. May 26, 2015, fact sheet and public notice. Annapolis, MD: Maryland Department of Health and Mental Hygiene. http://dhmh.maryland.gov/docs/IMD%20Exclusion%20Waiver%20Fact%20Sheet%20and%20Public%20Notice%20v2.pdf.
Maryland Department of Health and Mental Hygiene. 2012a. An integration model for Medicaid-financed behavioral health services: Recommendation delivered to Secretary Sharfstein, October 1, 2012. Baltimore, MD: Maryland Department of Health and Mental Hygiene. http://www.healthtransformation.ohio.gov/LinkClick.aspx?fileticket=Q-JnTeGGEt0%3D&tabid=122.
Maryland Department of Health and Mental Hygiene. 2012b Behavioral health integration. August 1, 2012, project planning document. Annapolis, MD: Maryland Department of Health and Mental Hygiene. http://dhmh.maryland.gov/bhd/Documents/AppendixX_DetailedDescriptionofPhasesandModels.pdf.
Maryland Department of Health and Mental Hygiene. 2011. Memo from Joshua Sharfstein regarding “2011 Joint Chairman’s Report (p. 68–M00K01.01)—Progress update on behavioral health integration.” December 27, 2011. http://dhmh.maryland.gov/bhd/Documents/68_BHD_BehavioralHealthIntegrationFinalSigned%20_12_27_11_OGA_1205.pdf.
Massachusetts Executive Office of Health and Human Services. 2016. Behavioral health covered services. Boston, MA: Massachusetts Executive Office of Health and Human Services. http://www.mass.gov/eohhs/docs/eohhs/braininjury/110801-appendix-lem-roberson.pdf.
Mauer, B.J. 2009. Behavioral health/primary care integration and the person-centered healthcare home. Washington, DC: National Council for Community Behavioral Healthcare. http://www.integration.samhsa.gov/BehavioralHealth andPrimaryCareIntegrationandthePCMH-2009.pdf.
McMahon, S. 2015. Presentation before the Medicaid and CHIP Payment and Access Commission. September 15, 2015, Washington, DC. https://www.macpac.gov/wp-content/uploads/2014/12/September-2015-Public-Meeting.pdf.
March 2016104
Chapter 4: Integration of Behavioral and Physical Health Services in Medicaid
Mechanic D. 2003. Managing behavioral health in Medicaid. New England Journal of Medicine 348, no. 19: 1914–1916. http://www.nejm.org/doi/pdf/10.1056/NEJMe030040.
Medicaid and CHIP Payment and Access Commission (MACPAC). 2015a. Report to Congress on Medicaid and CHIP. June 2015. Washington, DC: MACPAC. https://www.macpac.gov/publication/june-2015-report-to-congress-on-medicaid-and-chip/.
Medicaid and CHIP Payment and Access Commission (MACPAC). 2015b. Financial alignment initiative for beneficiaries dually eligible for Medicaid and Medicare. Washington, DC: MACPAC. https://www.macpac.gov/publication/financial-alignment-initiative-for-beneficiaries-dually-eligible-for-medicaid-and-medicare/.
Medicaid and CHIP Payment and Access Commission (MACPAC). 2015c. Report to Congress on Medicaid and CHIP. March 2015. Washington, DC: MACPAC. https://www.macpac.gov/publication/march-2015-report-to-congress-on-medicaid-and-chip/.
Medicare Payment Advisory Commission. 2013. Report to the Congress: Medicare payment policy. March 2013. Washington, DC: MedPAC. http://www.medpac.gov/documents/reports/mar13_entirereport.pdf?sfvrsn=0.
Medicare Payment Advisory Commission (MedPAC) and Medicaid and CHIP Payment and Access Commission (MACPAC). 2016. Data book: Beneficiaries dually eligible for Medicare and Medicaid. January 2016. Washington, DC: MedPAC and MACPAC. http://www.medpac.gov/documents/publications/january-2016-medpac-and-macpac-data-book-beneficiaries-dually-eligible-for-medicare-and-medicaid.pdf?sfvrsn=0.
Melek, S.P., D.T. Norris, and J. Paulus. 2014. Economic impact of integrated medical-behavioral healthcare: Implications for psychiatry. Denver, CO: Milliman, Inc., and American Psychiatric Association. http://www.psychiatry.org/File%20Library/Psychiatrists/Practice/Professional-Topics/Integrated-Care/Milliman-Report-Economic-Impact-Integrated-Implications-Psychiatry.pdf.
Michigan Health Information Network (MiHIN). 2015. Health Information Exchanges. East Lansing, MI: MiHIN. http://mihin.org/exchanges/.
Miller B.F., S. Petterson, S.M. Brown Levey, et al. 2014a. Primary care, behavioral health, provider colocation, and rurality. Journal of the American Board of Family Medicine 27, no. 3: 367–374. http://www.jabfm.org/content/27/3/367.full.pdf+html.
Miller B.F., S. Petterson, B.T. Burke, et al. 2014b. Proximity of providers: Colocating behavioral health and primary care and the prospects for an integrated workforce. American Psychologist 69, no. 4: 443–451. https://www.apa.org/pubs/journals/releases/amp-a0036093.pdf.
Miller C.J., A. Grogan-Kaylor, B.E. Perron, et al. 2013. Collaborative chronic care models for mental health conditions: Cumulative meta-analysis and metaregression to guide future research and implementation. Medical Care 51, no. 10: 922–930. http://www.ncbi.nlm.nih.gov/pubmed/23938600.
Nardone, M., S. Snyder, and J. Paradise. 2014. Integrating physical and behavioral health care: Promising Medicaid models. Washington, DC: Kaiser Commission on Medicaid and the Uninsured, Kaiser Family Foundation. http://kff.org/medicaid/issue-brief/integrating-physical-and-behavioral-health-care-promising-medicaid-models/.
National Association of Community Health Centers (NACHC). 2012. Medicaid reimbursement for multiple same-day encounters: Florida’s experience. Issue brief no. 7. Washington, DC: NACHC. https://www.nachc.com/client/Medicaid%20Same%20Day%20Visits%20FINAL.pdf.
National Association of State Mental Health Program Directors Research Institute, Inc. (NRI), the National Association of State Alcohol/Drug Abuse Directors (NASADAD), and Truven Health Analytics Inc. 2015. Funding and characteristics of single state agencies for substance abuse services and state mental health agencies, 2013. Substance Abuse and Mental Health Services Administration (SAMHSA), U.S. Department of Health and Human Services. Rockville, MD: SAMHSA. http://store.samhsa.gov/shin/content//SMA15-4926/SMA15-4926.pdf.
National Council for Community Behavioral Healthcare (National Council). 2012. HIT adoption and readiness for meaningful use in community behavioral health: Report on the 2012 National Council survey. Washington, DC: National Council. http://www.thenationalcouncil.org/wp-content/uploads/2012/10/HIT-Survey-Full-Report.pdf.
Report to Congress on Medicaid and CHIP 105
Chapter 4: Integration of Behavioral and Physical Health Services in Medicaid
National Council for Community Behavioral Healthcare (National Council). 2011. Increasing access to behavioral healthcare: Managed care options and requirements. Washington, DC: National Council. http://www.thenationalcouncil.org/wp-content/uploads/2013/01/Increasing-Access-to-Managed-Care-Report.pdf.
National PACE Association. 2015. Find a PACE program in your neighborhood. Alexandria, VA: National PACE Association. http://www.npaonline.org/pace-you/find-pace-program-your-neighborhood.
Office of Technology Assessment, United States Congress. 1987. Medicaid and Medicare as sources of funding for long-term care of persons with dementia. In Losing a million minds: Confronting the tragedy of Alzheimer’s disease and other dementias. Washington, DC: U.S. Government Printing Office. https://www.princeton.edu/~ota/disk2/1987/8715/871513.PDF.
Ohio Department of Alcohol and Drug Addiction Services (ODADAS) and the Ohio Department of Mental Health (ODMH). 2012. Consolidation of Ohio Departments of Mental Health and Alcohol and Drug Addiction Services. Columbus, OH: ODADAS and ODMH. http://www.ohiocounseling.org/Resources/Documents/Legislative%20ODADAS_ODMH%20Consolidation%20Summary.pdf.
OpenMinds. 2016. Which state Medicaid plans carve out behavioral health benefits? Gettysburg, PA: OpenMinds.
Oregon Health Authority. 2015. Technical specifications and guidance documents for CCO incentive measures. http://www.oregon.gov/oha/analytics/Pages/CCO-Baseline-Data.aspx.
Parks, J. 2014. Integrating primary care and behavioral health care. Presentation before the National Association of Medicaid Directors, November 3–5, 2014, Washington, DC. http://medicaiddirectors.org/wp-content/uploads/2015/08/realizing_behavioral_health_integration_in_medicaid_parks.pdf.
Peek, C.J., and National Integration Academy Council (NIAC). 2013. Lexicon for behavioral health and primary care integration: Concepts and definitions developed by expert consensus. Rockville, MD: Agency for Healthcare Research and Quality (AHRQ), U.S. Department of Health and Human Services. http://integrationacademy.ahrq.gov/sites/default/files/Lexicon.pdf.
Rawson, R., and S. Lee. 2011. Considerations for reorganization: California’s Departments of Mental Health and Alcohol and Drug programs. Los Angeles, CA: University of California at Los Angeles. http://caade.org/sites/default/files/2011_ADP_Transfer_UCLAISAP_SUD_MH__document__Sept_13_KLRR.pdf.
Rosenbaum, S., J. Teitelbaum, and R. Mauery. 2002. An analysis of the Medicaid IMD exclusion. Washington, DC: Center for Health Services Research and Policy, George Washington School of Public Health and Health Services. https://publichealth.gwu.edu/departments/healthpolicy/DHP_Publications/pub_uploads/dhpPublication_22CE3B02-5056-9D20-3DFE8F13074D0E21.pdf.
Salt Lake County Local Authority. 2014. Salt Lake County Local Authority SFY 2015 area plan for behavioral health services. Salt Lake City, UT: Salt Lake County. http://dsamh.utah.gov/pdf/contracts_and_monitoring/FY15%20area%20plans/Salt%20Lake%20County%20Behavioral%20Health%20Services%20FY15%20Completed%20Area%20Plan.pdf.
Sandberg, S.F., C. Erikson, R. Owen, et al. 2014. Hennepin Health: A safety-net accountable care organization for the expanded Medicaid population. Health Affairs 33, no. 11: 1975–1984. http://content.healthaffairs.org/content/33/11/1975.abstract.
SBIRT Colorado. 2011. Why SBIRT? SBIRT Colorado improving health changing lives. Denver, CO: SBIRT Colorado. http://www.integration.samhsa.gov/clinical-practice/sbirt/SBIRT_Colorado_WhySBIRT.pdf.
Scharf. D.M., N.K. Eberhart, N.S. Hackbarth, et al. 2014. Evaluation of the SAMHSA Primary and Behavioral Health Care Integration (PBHCI) grant program: Final report. Washington, DC: RAND. http://www.rand.org/pubs/research_reports/RR546.html.
Smith, G., C. Kennedy, S. Knipper, J. O’Brien, and J. O’Keefe. 2005. Using Medicaid to support working age adults with serious mental illness in the community: A handbook. Office of the Assistant Secretary for Planning and Evaluation (ASPE), U.S. Department of Health and Human Services. Washington, DC: ASPE. https://aspe.hhs.gov/legacy-page/using-medicaid-support-working-age-adults-serious-mental-illnesses-community-handbook-142751.
March 2016106
Chapter 4: Integration of Behavioral and Physical Health Services in Medicaid
Spero, J.C., E.P. Fraher, T.C. Ricketts, and P.H. Rockey. 2013. GME in the United States: A review of state initiatives. Chapel Hill, NC: Cecil G. Sheps Center for Health Services Research, The University of North Carolina at Chapel Hill. http://dhhs.nv.gov/uploadedFiles/dhhs.nv.gov/content/About/GMETF/2014/2014-05-14_Item12b_GMEstateReview_Sept20131.pdf.
Spillman, B.C., E. Richardson, A. Spencer, and E. Allen. 2014. Evaluation of the Medicaid health home option for beneficiaries with chronic conditions: Annual report year two. Washington, DC: Urban Institute and Office of Disability, Aging and Long-Term Care Policy, U.S. Department of Health and Human Services. https://aspe.hhs.gov/basic-report/evaluation-medicaid-health-home-option-beneficiaries-chronic-conditions-annualreport-year-two#theme.
Stanek, M. 2014. Promoting physical and behavioral health integration: Considerations for aligning federal and state policy. Washington, DC: National Academy for State Health Policy. http://www.nashp.org/sites/default/files/Promoting_Integration.pdf.
State Health Access Data Assistance Center (SHADAC), University of Minnesota School of Public Health. 2015. Catalog of Medicaid initiatives focusing on integrating behavioral and physical health care: Final report. Washington, DC: Medicaid and CHIP Payment and Access Commission. https://www.macpac.gov/wp-content/uploads/2015/09/Catalog-of-Behavioral-and-Physical-Health-Integration-Initiatives.pdf.
State Health Care Spending Project. 2015. Mental health and the role of the states. Washington, DC: The Pew Charitable Trust and the John D. and Catherine T. MacArthur Foundation. http://www.pewtrusts.org/~/media/assets/2015/06/mentalhealthandroleofstatesreport.pdf?la=en.
Substance Abuse and Mental Health Services Administration (SAMHSA), U.S. Department of Health and Human Services. 2015a. Planning grants for certified community behavioral health clinics. Request for applications no. SM-16-001. Rockville, MD: SAMHSA. http://www.samhsa.gov/sites/default/files/grants/pdf/sm-16-001.pdf.
Substance Abuse and Mental Health Services Administration (SAMHSA), U.S. Department of Health and Human Services. 2015b. HHS awards up to $22.9 million
in planning grants for certified community behavioral health clinics. October 19, 2015, press release. Rockville, MD: SAMHSA. http://www.samhsa.gov/newsroom/press-announcements/201510191200.
Substance Abuse and Mental Health Services Administration (SAMHSA), U.S. Department of Health and Human Services. 2010. States paying for behavioral health visits on same day as medical visit. Rockville, MD: SAMHSA. http://www.integration.samhsa.gov/financing/Paying_for_BH_visits_on_same_day_as_medical_visit.pdf.
Substance Abuse and Mental Health Services Administration and Health Resources and Services Administration (SAMHSA-HRSA) Center for Integrated Health Solutions, U.S. Department of Health and Human Services. 2015. What is integrated care. Rockville, MD: SAMHSA-HRSA Center for Integrated Health Solutions. http://www.integration.samhsa.gov/about-us/what-is-integrated-care.
Sutcliffe, J. 2014. A culture of coverage for justice-involved adults in Illinois. Presentation before the National Association of State Health Policy, September 17, 2014. http://www.nashpcloud.org/2014-presentations/public/session.19.sutcliffe.j.pdf.
Takach, M., K. Purington, and E. Osius. 2010. A tale of two systems: A look at state efforts to integrate primary care and behavioral health in safety net settings. Washington, DC: National Academy for State Health Policy. http://www.nashp.org/sites/default/files/TwoSystems_0.pdf.
TennCare. 2015. TennCare overview. Nashville, TN: TennCare. https://www.tn.gov/tenncare/article/tenncare-overview.
Truven Health Analytics Inc. 2014. Projections of national expenditures for treatment of mental and substance use disorders, 2010–2020. Substance Abuse and Mental Health Services Administration (SAMHSA), U.S. Department of Health and Human Services Rockville, MD: SAMHSA. http://store.samhsa.gov/shin/content//SMA14-4883/SMA14-4883.pdf.
Verdier, J.M. 2015. SNP and MMP development: A national profile and key issues for the future. Presentation before the SNP Alliance Leadership Forum, November 2, 2015, Washington, DC. https://www.mathematica-mpr.com/~/
Report to Congress on Medicaid and CHIP 107
Chapter 4: Integration of Behavioral and Physical Health Services in Medicaid
media/publications/pdfs/health/snpalliance_snp-mmp_112015_verdier.pdf.
Verdier, J., A. Kruse, R. Sweetland Lester, et al. 2015. State contracting with Medicare Advantage dual eligible special needs plans: Issues and options. Washington, DC: Integrated Care Resource Center. http://www.mathematica-mpr.com/~/media/publications/pdfs/health/icrc_statecontracting_medicare.pdf.
Woltmann E., A. Grogan-Kaylor, B. Perron, et al. 2012. Comparative effectiveness of collaborative chronic care models for mental health conditions across primary, specialty, and behavioral health care settings: Systematic review and meta-analysis. American Journal of Psychiatry 169, no. 8: 790–804. http://www.ncbi.nlm.nih.gov/pubmed/22772364.
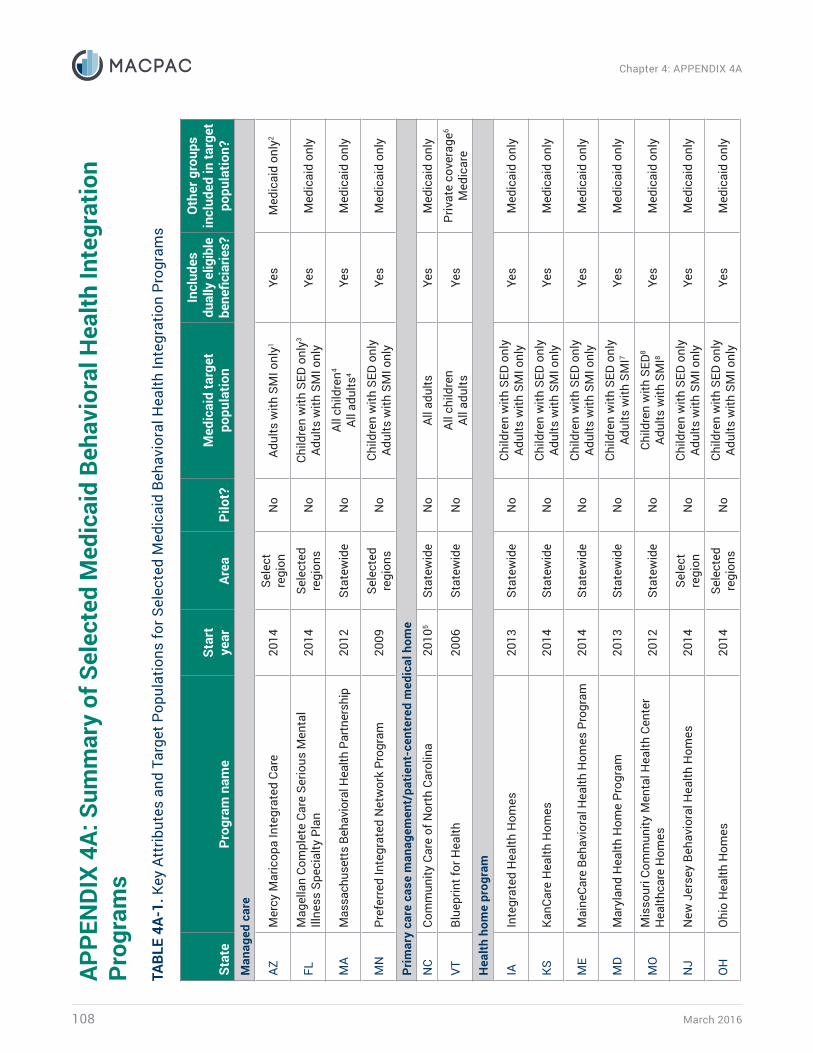
March 2016108
Chapter 4: APPENDIX 4A
APPE
NDI
X 4A
: Sum
mar
y of
Sel
ecte
d M
edic
aid
Beha
vior
al H
ealth
Inte
grat
ion
Prog
ram
sTA
BLE
4A-1
. Key
Att
ribut
es a
nd T
arge
t Pop
ulat
ions
for S
elec
ted
Med
icai
d Be
havi
oral
Hea
lth In
tegr
atio
n Pr
ogra
ms
Stat
ePr
ogra
m n
ame
Star
t ye
arAr
eaPi
lot?
Med
icai
d ta
rget
po
pula
tion
Incl
udes
du
ally
elig
ible
be
nefic
iarie
s?
Oth
er g
roup
s in
clud
ed in
targ
et
popu
latio
n?M
anag
ed c
are
AZM
ercy
Mar
icop
a In
tegr
ated
Car
e20
14Se
lect
re
gion
No
Adul
ts w
ith S
MI o
nly 1
Yes
Med
icai
d on
ly2
FLM
agel
lan
Com
plet
e Ca
re S
erio
us M
enta
l Ill
ness
Spe
cial
ty P
lan
2014
Sele
cted
re
gion
sN
oCh
ildre
n w
ith S
ED o
nly3
Adul
ts w
ith S
MI o
nly
Yes
Med
icai
d on
ly
MA
Mas
sach
uset
ts B
ehav
iora
l Hea
lth P
artn
ersh
ip20
12St
atew
ide
No
All c
hild
ren4
All a
dults
4Ye
sM
edic
aid
only
MN
Pref
erre
d In
tegr
ated
Net
wor
k Pr
ogra
m20
09Se
lect
ed
regi
ons
No
Child
ren
with
SED
onl
yAd
ults
with
SM
I onl
yYe
sM
edic
aid
only
Prim
ary
care
cas
e m
anag
emen
t/pa
tient
-cen
tere
d m
edic
al h
ome
NC
Com
mun
ity C
are
of N
orth
Car
olin
a20
105
Stat
ewid
eN
oAl
l adu
ltsYe
sM
edic
aid
only
VTBl
uepr
int f
or H
ealth
20
06St
atew
ide
No
All c
hild
ren
All a
dults
Yes
Priv
ate
cove
rage
6
Med
icar
e
Hea
lth h
ome
prog
ram
IAIn
tegr
ated
Hea
lth H
omes
2013
Stat
ewid
eN
oCh
ildre
n w
ith S
ED o
nly
Adul
ts w
ith S
MI o
nly
Yes
Med
icai
d on
ly
KSKa
nCar
e H
ealth
Hom
es20
14St
atew
ide
No
Child
ren
with
SED
onl
yAd
ults
with
SM
I onl
yYe
sM
edic
aid
only
ME
Mai
neCa
re B
ehav
iora
l Hea
lth H
omes
Pro
gram
2014
Stat
ewid
eN
oCh
ildre
n w
ith S
ED o
nly
Adul
ts w
ith S
MI o
nly
Yes
Med
icai
d on
ly
MD
Mar
ylan
d H
ealth
Hom
e Pr
ogra
m20
13St
atew
ide
No
Child
ren
with
SED
onl
yAd
ults
with
SM
I7Ye
sM
edic
aid
only
MO
Mis
sour
i Com
mun
ity M
enta
l Hea
lth C
ente
r H
ealth
care
Hom
es20
12St
atew
ide
No
Child
ren
with
SED
8
Adul
ts w
ith S
MI8
Yes
Med
icai
d on
ly
NJ
New
Jer
sey
Beha
vior
al H
ealth
Hom
es20
14Se
lect
re
gion
No
Child
ren
with
SED
onl
yAd
ults
with
SM
I onl
yYe
sM
edic
aid
only
OH
Ohi
o H
ealth
Hom
es20
14Se
lect
ed
regi
ons
No
Child
ren
with
SED
onl
yAd
ults
with
SM
I onl
yYe
sM
edic
aid
only
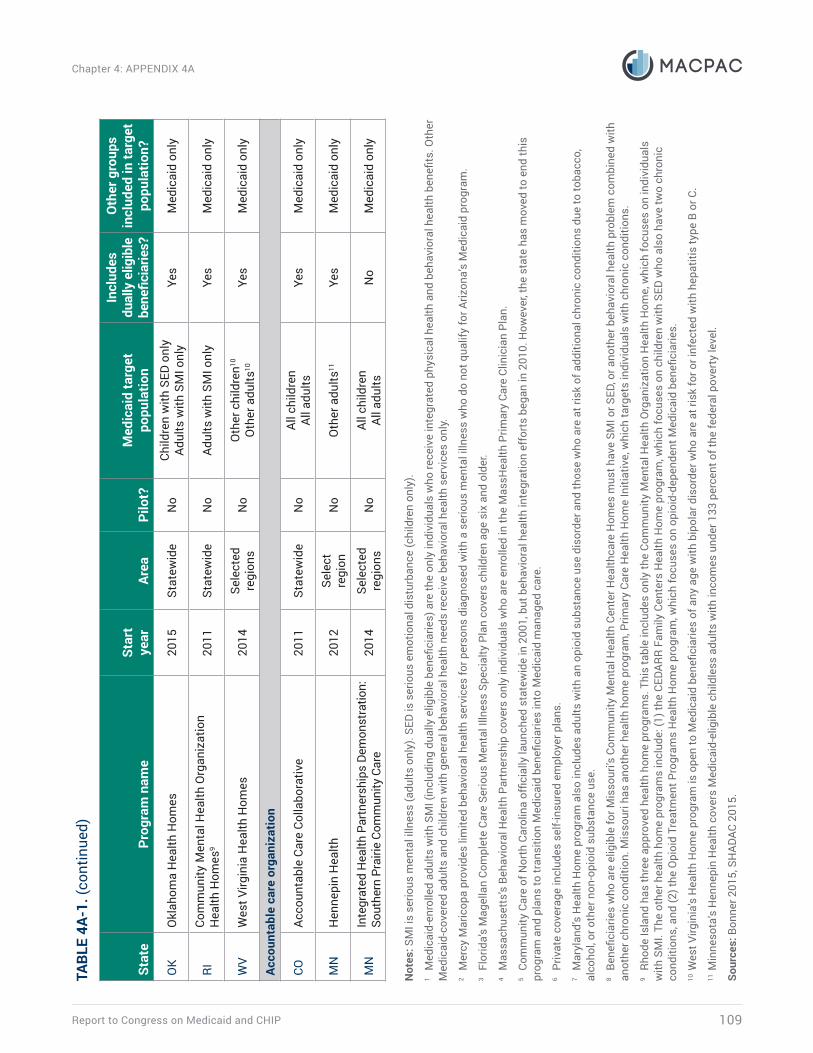
Report to Congress on Medicaid and CHIP 109
Chapter 4: APPENDIX 4A
Stat
ePr
ogra
m n
ame
Star
t ye
arAr
eaPi
lot?
Med
icai
d ta
rget
po
pula
tion
Incl
udes
du
ally
elig
ible
be
nefic
iarie
s?
Oth
er g
roup
s in
clud
ed in
targ
et
popu
latio
n?
OK
Okl
ahom
a H
ealth
Hom
es20
15St
atew
ide
No
Child
ren
with
SED
onl
yAd
ults
with
SM
I onl
yYe
sM
edic
aid
only
RICo
mm
unity
Men
tal H
ealth
Org
aniz
atio
n H
ealth
Hom
es9
2011
Stat
ewid
eN
oAd
ults
with
SM
I onl
yYe
sM
edic
aid
only
WV
Wes
t Virg
inia
Hea
lth H
omes
2014
Sele
cted
re
gion
sN
oO
ther
chi
ldre
n10
Oth
er a
dults
10Ye
sM
edic
aid
only
Acco
unta
ble
care
org
aniz
atio
n
COAc
coun
tabl
e Ca
re C
olla
bora
tive
2011
Stat
ewid
eN
oAl
l chi
ldre
nAl
l adu
ltsYe
sM
edic
aid
only
MN
Hen
nepi
n H
ealth
20
12Se
lect
re
gion
No
Oth
er a
dults
11Ye
sM
edic
aid
only
MN
Inte
grat
ed H
ealth
Par
tner
ship
s De
mon
stra
tion:
So
uthe
rn P
rairi
e Co
mm
unity
Car
e20
14Se
lect
ed
regi
ons
No
All c
hild
ren
All a
dults
No
Med
icai
d on
ly
Not
es: S
MI i
s se
rious
men
tal i
llnes
s (a
dults
onl
y). S
ED is
ser
ious
em
otio
nal d
istu
rban
ce (c
hild
ren
only
). 1
Med
icai
d-en
rolle
d ad
ults
with
SM
I (in
clud
ing
dual
ly e
ligib
le b
enefi
ciar
ies)
are
the
only
indi
vidu
als
who
rece
ive
inte
grat
ed p
hysi
cal h
ealth
and
beh
avio
ral h
ealth
ben
efits
. Oth
er
Med
icai
d-co
vere
d ad
ults
and
chi
ldre
n w
ith g
ener
al b
ehav
iora
l hea
lth n
eeds
rece
ive
beha
vior
al h
ealth
ser
vice
s on
ly.
2 M
ercy
Mar
icop
a pr
ovid
es li
mite
d be
havi
oral
hea
lth s
ervi
ces
for p
erso
ns d
iagn
osed
with
a s
erio
us m
enta
l illn
ess
who
do
not q
ualif
y fo
r Ariz
ona’
s M
edic
aid
prog
ram
.3
Flor
ida’
s M
agel
lan
Com
plet
e Ca
re S
erio
us M
enta
l Illn
ess
Spec
ialty
Pla
n co
vers
chi
ldre
n ag
e si
x an
d ol
der.
4 M
assa
chus
etts
’s B
ehav
iora
l Hea
lth P
artn
ersh
ip c
over
s on
ly in
divi
dual
s w
ho a
re e
nrol
led
in th
e M
assH
ealth
Prim
ary
Care
Clin
icia
n Pl
an.
5 Co
mm
unity
Car
e of
Nor
th C
arol
ina
offici
ally
laun
ched
sta
tew
ide
in 2
001,
but
beh
avio
ral h
ealth
inte
grat
ion
effo
rts
bega
n in
201
0. H
owev
er, t
he s
tate
has
mov
ed to
end
this
pr
ogra
m a
nd p
lans
to tr
ansi
tion
Med
icai
d be
nefic
iarie
s in
to M
edic
aid
man
aged
car
e.
6 Pr
ivat
e co
vera
ge in
clud
es s
elf-i
nsur
ed e
mpl
oyer
pla
ns.
7 M
aryl
and’
s H
ealth
Hom
e pr
ogra
m a
lso
incl
udes
adu
lts w
ith a
n op
ioid
sub
stan
ce u
se d
isor
der a
nd th
ose
who
are
at r
isk
of a
dditi
onal
chr
onic
con
ditio
ns d
ue to
toba
cco,
al
coho
l, or
oth
er n
on-o
pioi
d su
bsta
nce
use.
8 Be
nefic
iarie
s w
ho a
re e
ligib
le fo
r Mis
sour
i’s C
omm
unity
Men
tal H
ealth
Cen
ter H
ealth
care
Hom
es m
ust h
ave
SMI o
r SED
, or a
noth
er b
ehav
iora
l hea
lth p
robl
em c
ombi
ned
with
an
othe
r chr
onic
con
ditio
n. M
isso
uri h
as a
noth
er h
ealth
hom
e pr
ogra
m, P
rimar
y Ca
re H
ealth
Hom
e In
itiat
ive,
whi
ch ta
rget
s in
divi
dual
s w
ith c
hron
ic c
ondi
tions
. 9
Rhod
e Is
land
has
thre
e ap
prov
ed h
ealth
hom
e pr
ogra
ms.
Thi
s ta
ble
incl
udes
onl
y th
e Co
mm
unity
Men
tal H
ealth
Org
aniz
atio
n H
ealth
Hom
e, w
hich
focu
ses
on in
divi
dual
s w
ith S
MI.
The
othe
r hea
lth h
ome
prog
ram
s in
clud
e: (1
) the
CED
ARR
Fam
ily C
ente
rs H
ealth
Hom
e pr
ogra
m, w
hich
focu
ses
on c
hild
ren
with
SED
who
als
o ha
ve tw
o ch
roni
c co
nditi
ons,
and
(2) t
he O
pioi
d Tr
eatm
ent P
rogr
ams
Hea
lth H
ome
prog
ram
, whi
ch fo
cuse
s on
opi
oid-
depe
nden
t Med
icai
d be
nefic
iarie
s.
10 W
est V
irgin
ia’s
Hea
lth H
ome
prog
ram
is o
pen
to M
edic
aid
bene
ficia
ries
of a
ny a
ge w
ith b
ipol
ar d
isor
der w
ho a
re a
t ris
k fo
r or i
nfec
ted
with
hep
atiti
s ty
pe B
or C
.11
Min
neso
ta’s
Hen
nepi
n H
ealth
cov
ers
Med
icai
d-el
igib
le c
hild
less
adu
lts w
ith in
com
es u
nder
133
per
cent
of t
he fe
dera
l pov
erty
leve
l.
Sour
ces:
Bon
ner 2
015,
SH
ADAC
201
5.
TABL
E 4A
-1. (
cont
inue
d)
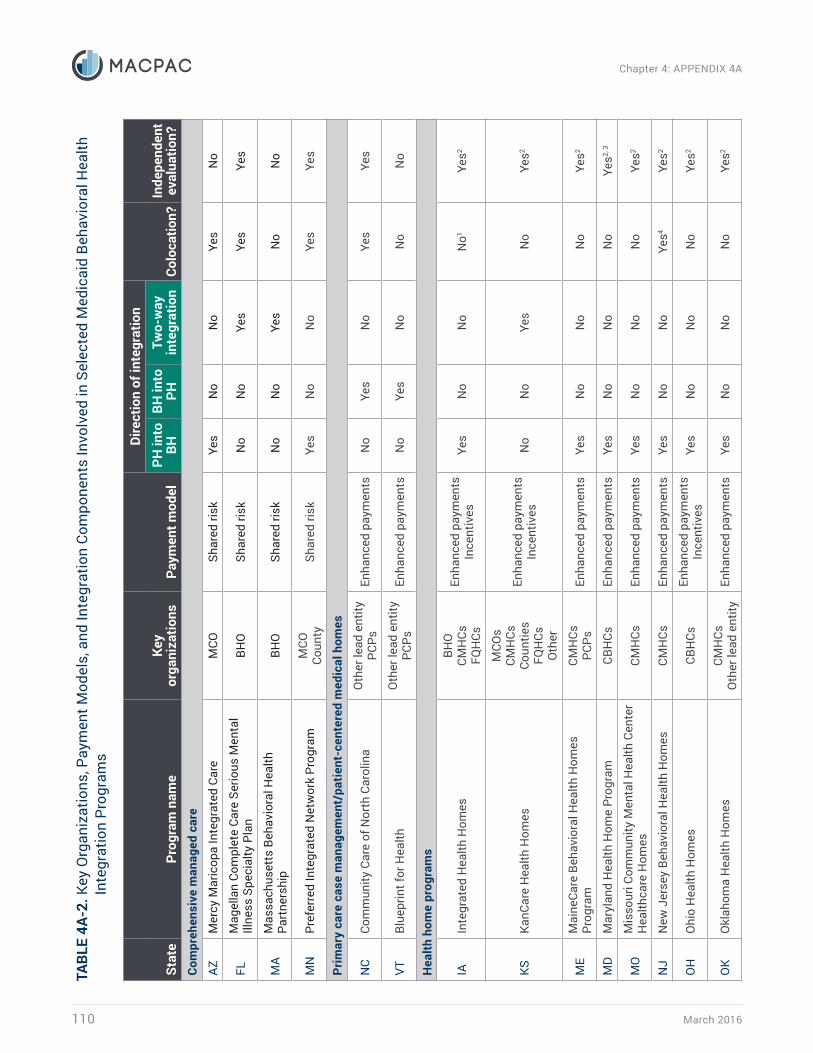
March 2016110
Chapter 4: APPENDIX 4ATA
BLE
4A-2
. Key
Org
aniz
atio
ns, P
aym
ent M
odel
s, a
nd In
tegr
atio
n Co
mpo
nent
s In
volv
ed in
Sel
ecte
d M
edic
aid
Beha
vior
al H
ealth
In
tegr
atio
n Pr
ogra
ms
Stat
ePr
ogra
m n
ame
Key
or
gani
zatio
nsPa
ymen
t mod
el
Dire
ctio
n of
inte
grat
ion
Colo
catio
n?In
depe
nden
t ev
alua
tion?
PH in
to
BHBH
into
PH
Two-
way
in
tegr
atio
nCo
mpr
ehen
sive
man
aged
car
e
AZM
ercy
Mar
icop
a In
tegr
ated
Car
eM
COSh
ared
risk
Yes
No
No
Yes
No
FLM
agel
lan
Com
plet
e Ca
re S
erio
us M
enta
l Ill
ness
Spe
cial
ty P
lan
BHO
Shar
ed ri
skN
oN
oYe
sYe
sYe
s
MA
Mas
sach
uset
ts B
ehav
iora
l Hea
lth
Part
ners
hip
BHO
Shar
ed ri
skN
oN
oYe
sN
oN
o
MN
Pref
erre
d In
tegr
ated
Net
wor
k Pr
ogra
mM
COCo
unty
Shar
ed ri
skYe
sN
oN
oYe
sYe
s
Prim
ary
care
cas
e m
anag
emen
t/pa
tient
-cen
tere
d m
edic
al h
omes
NC
Com
mun
ity C
are
of N
orth
Car
olin
aO
ther
lead
ent
ityPC
PsEn
hanc
ed p
aym
ents
No
Yes
No
Yes
Yes
VTBl
uepr
int f
or H
ealth
O
ther
lead
ent
ityPC
PsEn
hanc
ed p
aym
ents
No
Yes
No
No
No
Hea
lth h
ome
prog
ram
s
IAIn
tegr
ated
Hea
lth H
omes
BHO
CMH
CsFQ
HCs
Enha
nced
pay
men
tsIn
cent
ives
Yes
No
No
No1
Yes2
KSKa
nCar
e H
ealth
Hom
es
MCO
sCM
HCs
Coun
ties
FQH
CsO
ther
Enha
nced
pay
men
tsIn
cent
ives
No
No
Yes
No
Yes2
ME
Mai
neCa
re B
ehav
iora
l Hea
lth H
omes
Pr
ogra
mCM
HCs
PCPs
Enha
nced
pay
men
tsYe
sN
oN
oN
oYe
s2
MD
Mar
ylan
d H
ealth
Hom
e Pr
ogra
mCB
HCs
Enha
nced
pay
men
tsYe
sN
oN
oN
oYe
s2, 3
MO
Mis
sour
i Com
mun
ity M
enta
l Hea
lth C
ente
r H
ealth
care
Hom
esCM
HCs
Enha
nced
pay
men
tsYe
sN
oN
oN
oYe
s2
NJ
New
Jer
sey
Beha
vior
al H
ealth
Hom
esCM
HCs
Enha
nced
pay
men
tsYe
sN
oN
oYe
s4Ye
s2
OH
Ohi
o H
ealth
Hom
esCB
HCs
Enha
nced
pay
men
tsIn
cent
ives
Yes
No
No
No
Yes2
OK
Okl
ahom
a H
ealth
Hom
esCM
HCs
Oth
er le
ad e
ntity
Enha
nced
pay
men
tsYe
sN
oN
oN
oYe
s2
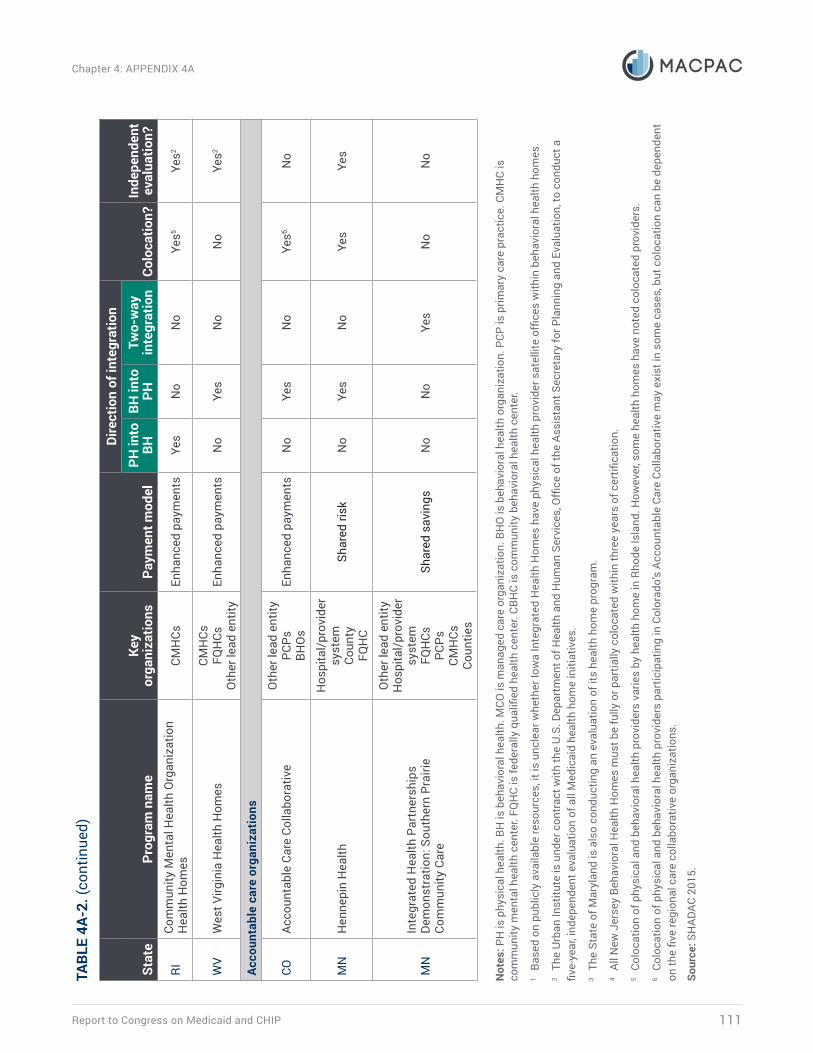
Report to Congress on Medicaid and CHIP 111
Chapter 4: APPENDIX 4A
Stat
ePr
ogra
m n
ame
Key
or
gani
zatio
nsPa
ymen
t mod
el
Dire
ctio
n of
inte
grat
ion
Colo
catio
n?In
depe
nden
t ev
alua
tion?
PH in
to
BHBH
into
PH
Two-
way
in
tegr
atio
n
RICo
mm
unity
Men
tal H
ealth
Org
aniz
atio
n H
ealth
Hom
esCM
HCs
Enha
nced
pay
men
tsYe
sN
oN
oYe
s5Ye
s2
WV
Wes
t Virg
inia
Hea
lth H
omes
CMH
CsFQ
HCs
Oth
er le
ad e
ntity
Enha
nced
pay
men
tsN
oYe
sN
oN
oYe
s2
Acco
unta
ble
care
org
aniz
atio
ns
COAc
coun
tabl
e Ca
re C
olla
bora
tive
Oth
er le
ad e
ntity
PCPs
BHO
sEn
hanc
ed p
aym
ents
No
Yes
No
Yes6
No
MN
Hen
nepi
n H
ealth
Hos
pita
l/pr
ovid
er
syst
emCo
unty
FQH
C
Shar
ed ri
skN
oYe
sN
oYe
sYe
s
MN
Inte
grat
ed H
ealth
Par
tner
ship
s De
mon
stra
tion:
Sou
ther
n Pr
airie
Co
mm
unity
Car
e
Oth
er le
ad e
ntity
Hos
pita
l/pr
ovid
er
syst
emFQ
HCs
PCPs
CMH
CsCo
untie
s
Shar
ed s
avin
gsN
oN
oYe
sN
oN
o
Not
es: P
H is
phy
sica
l hea
lth. B
H is
beh
avio
ral h
ealth
. MCO
is m
anag
ed c
are
orga
niza
tion.
BH
O is
beh
avio
ral h
ealth
org
aniz
atio
n. P
CP is
prim
ary
care
pra
ctic
e. C
MH
C is
co
mm
unity
men
tal h
ealth
cen
ter.
FQH
C is
fede
rally
qua
lified
hea
lth c
ente
r. CB
HC
is c
omm
unity
beh
avio
ral h
ealth
cen
ter.
1 Ba
sed
on p
ublic
ly a
vaila
ble
reso
urce
s, it
is u
ncle
ar w
heth
er Io
wa
Inte
grat
ed H
ealth
Hom
es h
ave
phys
ical
hea
lth p
rovi
der s
atel
lite
office
s w
ithin
beh
avio
ral h
ealth
hom
es.
2 Th
e U
rban
Inst
itute
is u
nder
con
trac
t with
the
U.S
. Dep
artm
ent o
f Hea
lth a
nd H
uman
Ser
vice
s, O
ffice
of t
he A
ssis
tant
Sec
reta
ry fo
r Pla
nnin
g an
d Ev
alua
tion,
to c
ondu
ct a
fiv
e-ye
ar, i
ndep
ende
nt e
valu
atio
n of
all
Med
icai
d he
alth
hom
e in
itiat
ives
.3
The
Stat
e of
Mar
ylan
d is
als
o co
nduc
ting
an e
valu
atio
n of
its
heal
th h
ome
prog
ram
. 4
All N
ew J
erse
y Be
havi
oral
Hea
lth H
omes
mus
t be
fully
or p
artia
lly c
oloc
ated
with
in th
ree
year
s of
cer
tifica
tion.
5 Co
loca
tion
of p
hysi
cal a
nd b
ehav
iora
l hea
lth p
rovi
ders
var
ies
by h
ealth
hom
e in
Rho
de Is
land
. How
ever
, som
e he
alth
hom
es h
ave
note
d co
loca
ted
prov
ider
s.6
Colo
catio
n of
phy
sica
l and
beh
avio
ral h
ealth
pro
vide
rs p
artic
ipat
ing
in C
olor
ado’
s Ac
coun
tabl
e Ca
re C
olla
bora
tive
may
exi
st in
som
e ca
ses,
but
col
ocat
ion
can
be d
epen
dent
on
the
five
regi
onal
car
e co
llabo
rativ
e or
gani
zatio
ns.
Sour
ce: S
HAD
AC 2
015.
TABL
E 4A
-2. (
cont
inue
d)

CHAPTER 5
Design Considerations for the Future of Children’s Coverage: Focus on Affordability
March 2016114
Chapter 5: Design Considerations for the Future of Children’s Coverage: Focus on Affordability
Design Considerations for the Future of Children’s Coverage: Focus on AffordabilityKey Points
• MACPAC’s analysis of out-of-pocket spending for children in the State Children’s Health Insurance Program (CHIP) income range in 36 states that cover children under separate CHIP examines three key questions:
– How do premiums and cost sharing differ between separate CHIP and exchange coverage?
– What share of children will face a substantially greater financial burden if they move to exchange coverage?
– What are the characteristics of children in the CHIP income range who would face the largest out-of-pocket spending in exchange coverage?
• Children’s premiums and cost sharing average $158 per year across 36 states with separate CHIP.
• In no state does exchange coverage offer out-of-pocket protections comparable to CHIP. In subsidized exchange coverage, these same children would face $1,073 in average annual out-of-pocket spending if enrolled in the second lowest cost silver plan.
• The differences between CHIP and exchange coverage are greatest above 200 percent of the federal poverty level (FPL)—$48,500 for a family of four—reflecting the income-related design of cost sharing protection in exchange coverage. However, few CHIP enrollees have family income above 200 percent FPL.
• Whether low- and moderate-income children are eligible for the cost sharing protections of CHIP depends on CHIP eligibility levels in the state where they reside.
• In every state with separate CHIP, some children face out-of-pocket spending in exchange coverage exceeding 5 percent of income, levels that are prohibited under CHIP.
• Children being treated for chronic conditions comprise a majority of those who would have high out-of-pocket spending in exchange coverage. However, there is also a sizeable group of otherwise healthy children who experience an unexpected acute episode that causes high health care spending.
– Well over half (59 percent) of children whose out-of-pocket spending in exchange coverage would exceed 5 percent of income were treated for a chronic condition.
– More than a third (34 percent) of children whose out-of-pocket spending would exceed 5 percent of income in exchange coverage were treated for an acute condition—for example, for trauma or an infection—and had no chronic conditions.
• Affordability of coverage to families is one of several policy objectives the Commission will be considering as it prepares recommendations on the design of children’s coverage and the future of CHIP.
Report to Congress on Medicaid and CHIP 115
Chapter 5: Design Considerations for the Future of Children’s Coverage: Focus on Affordability
CHAPTER 5: Design Considerations for the Future of Children’s Coverage: Focus on AffordabilityOver the past several years, MACPAC has spent considerable time discussing the future of coverage for low- and moderate-income children, first prompted by the then-impending expiration of federal funding for the State Children’s Health Insurance Program (CHIP) after fiscal year (FY) 2015. In our March and June 2014 reports to Congress, the Commission documented the historical contributions of CHIP and Medicaid to reducing uninsurance among this population and analyzed available evidence on the effects of an abrupt end to CHIP funding. We found that many children now served by the program would not have a smooth transition to another source of coverage offering comparable benefits and cost sharing. The number of uninsured children would rise, and the out-of-pocket spending for children obtaining other coverage would often be significantly higher. Moreover, in the Commission’s view at the time, it was not clear that the plans available through health insurance exchanges were ready to serve as an adequate alternative for children enrolled in CHIP.
Concerns around these issues led the Commission to recommend in our June 2014 report to Congress that CHIP funding be extended by two years and that the time be used to address limitations in the availability and adequacy of other sources of pediatric coverage, particularly through the exchanges. In our March 2015 report, the Commission reiterated this recommendation based on additional evidence related to projected rates of uninsurance, higher burdens from cost sharing, and concerns about provider networks and comparability of benefits.
Given that the Medicare Access and CHIP Reauthorization Act of 2015 (MACRA, P.L. 114-10) provided new federal CHIP allotments in FY 2016 and FY 2017, policymakers have more time to consider options. The Commission is now focusing analyses and deliberations on how to ensure that low- and moderate-income children have access to high quality health coverage that is affordable to families and is integrated with the full array of available coverage options, including Medicaid, exchange, and employer-sponsored coverage.
Beginning in the summer of 2015, the Commission began conducting a new set of analyses to inform the design of future policy for children’s coverage. Our analyses were undertaken to accomplish the following:
• compare out-of-pocket spending—that is, accounting for both premiums and cost sharing—in the exchanges to separate CHIP (the focus of the rest of this chapter);
• examine the impact of out-of-pocket spending on children’s use and access to care;
• assess the impact of an end to CHIP funding on Medicaid-expansion CHIP;
• document how states implemented the transition of so-called stairstep children (6- to 18-year-olds between 100 percent and 138 percent of the federal poverty level) from separate CHIP to Medicaid;
• inventory the design of subsidies under other federal programs providing assistance to low-income families;
• document the experience of low- and moderate-income families covered by employer-sponsored insurance; and
• assess the use of premium assistance both before and after implementation of the Patient Protection and Affordable Care Act (ACA, P.L. 111-148, as amended).
March 2016116
Chapter 5: Design Considerations for the Future of Children’s Coverage: Focus on Affordability
Throughout 2016, the Commission will be drawing upon these analyses as we discuss the concerns about children’s coverage, the available options for addressing these concerns, and what the trade-offs would be for each alternative. Our goal is to have a package of recommendations completed by the time a new Congress convenes in 2017, when policymakers will once again face the exhaustion of federal CHIP funding.
As we consider various alternatives for ensuring adequate and affordable coverage for low- and moderate-income children, the Commission will be discussing several fundamental issues, among them affordability to families, effects on coverage and uninsurance, adequacy of covered benefits, and the effects on federal and state budgets. In this chapter, we begin with the issue of affordability—in particular, the challenge of designing a policy that provides incentives for prudent and appropriate use of services while ensuring that coverage is affordable to families with limited means. Our analyses account for affordability of coverage premiums as well as expenses at the point of service (cost sharing).
The new analyses described in this chapter provide additional insights into affordability by assessing out-of-pocket spending for children across the CHIP income range and across 36 states that cover children under separate CHIP.1 This work points to four important findings. First, no exchange coverage offers out-of-pocket protections comparable to CHIP, a finding recently confirmed in a study from the U.S. Department of Health and Human Services (CMS 2015).2 Second, the children for whom such cost sharing protection is available differ markedly across states due to wide variation in income eligibility requirements for separate CHIP coverage. Third, although CHIP prohibits out-of-pocket spending above 5 percent of family income, that level is exceeded for some children (1 percent to 17 percent, depending on the state and income level) in exchange coverage. And fourth, although children with treatment for chronic conditions comprise a majority of those with high out-of-pocket spending
in exchange coverage, there is also a sizeable group of otherwise healthy children who experience an unexpected acute episode that causes high health care spending. The chapter ends with some key policy issues raised by these findings, issues that will figure prominently in the Commission’s consideration of potential options going forward. Data sources and assumptions used in the model are described in Appendix 5B.
Research literature and surveys of households indicate that affordability of coverage is important to families (MACPAC 2015b, Rudowitz 2015). However, affordability is only one of several policy objectives the Commission will be considering as we develop recommendations regarding the design of children’s coverage. Improving affordability may conflict with achieving other policy goals. For example, reducing cost sharing and premiums for children’s coverage could increase spending by the federal government and states, which may not be desirable. Therefore, as the Commission contemplates the effects of various policy alternatives, we will also explore associated trade-offs.
BackgroundCHIP was enacted in 1997 to extend eligibility to children in families whose income was too high to qualify for Medicaid but for whom employer-sponsored insurance was either unavailable or unaffordable. In the intervening years, increased enrollment of children in both CHIP and Medicaid reduced the number of uninsured children from 9.9 million in 1997 to 3.3 million in 2015 (Martinez and Cohen 2012, 2015).
Under CHIP, states can choose to operate their programs as an expansion of Medicaid, as entirely separate from Medicaid, or as a combination of both approaches. Under Medicaid-expansion CHIP, federal Medicaid rules apply, with limited or no premiums and cost sharing. Under separate CHIP, which is the focus of this chapter, states have more flexibility to charge premiums and cost sharing,
Report to Congress on Medicaid and CHIP 117
Chapter 5: Design Considerations for the Future of Children’s Coverage: Focus on Affordability
subject to the 5 percent of income ceiling that also applies in Medicaid for populations where cost sharing is permissible.3 Forty states operate combination programs, generally covering higher-income children in separate CHIP (Table 5-1).4 While states’ current CHIP eligibility levels extend as high as 400 percent of the federal poverty level (FPL), the vast majority (88.8 percent) of CHIP-enrolled children in FY 2013 were at or below 200 percent FPL (Table 5-1, MACPAC 2014).
Under subsidized exchange coverage, there are out-of-pocket maximum amounts for premiums and for cost sharing, but the limits and subsidies are determined separately. Premium subsidies are available for income levels up to 400 percent FPL, or $97,000 for a family of four in the 48 contiguous states and the District of Columbia. Families eligible for premium subsidies are required to pay only up to a percentage of their income for the second lowest cost silver exchange plan available to them. A silver plan is one with an actuarial value of 70 percent, meaning that the plan will pay an average of 70 percent of the spending on covered benefits for a standard population, with enrollees paying the remainder in cost sharing—30 percent, on average. However, cost sharing will vary among individual enrollees depending on their health care use and the structure of the plan’s cost sharing.
In subsidized exchange coverage, cost sharing reductions are also available for people with income at or below 250 percent FPL, or $60,625 for a family of four in the 48 contiguous states and the District of Columbia. Insurers with exchange plans are to provide actuarial values of 94 percent for eligible individuals at or below 150 percent FPL, 87 percent for those at 151 percent through 200 percent FPL, and 73 percent for those at 201 percent through 250 percent FPL. For those above 250 percent FPL, no cost sharing subsidies are available, and people enrolled in a silver plan face the typical actuarial value of 70 percent, with average cost sharing for enrollees of 30 percent. As a result, cost sharing differs substantially in exchange coverage across these four income groups.
Purpose and ResultsThe analyses in this chapter were designed to answer three key questions. First, by how much do premiums and cost sharing differ between separate CHIP and exchange coverage? The first set of results answers this by comparing average out-of-pocket spending if the same nationally representative group of low- and moderate-income children enrolled in each state’s separate CHIP versus subsidized exchange coverage.5 The state-level estimates for this analysis appear in Appendix 5A, Tables 5A-1 through 5A-4. The findings reemphasize the well-established point that CHIP requires less out-of-pocket spending, on average, than exchange coverage.
The second question concerns the share of children that will face a substantially greater financial burden if they move to exchange coverage. This second part of the analysis shows the percentage of children in the CHIP income range whose out-of-pocket spending exceeds various spending thresholds in separate CHIP versus the percentage of these same children whose out-of-pocket spending would exceed the same spending thresholds in exchange coverage. The state-level estimates from this analysis appear in Appendix 5A, Tables 5A-5 through 5A-8. This line of inquiry shows that 5 percent to 7 percent of children at 151 percent through 200 percent FPL in most states would experience out-of-pocket spending in exchange coverage that exceeds 5 percent of their family’s income, that is, out-of-pocket spending at levels currently prohibited by CHIP (Table 5A-6).
Third, what are the characteristics of children in the CHIP income range who would face the largest out-of-pocket spending in exchange coverage? We conducted the analysis to determine if certain characteristics were predictive of high out-of-pocket spending and therefore could be used in designing a policy to protect those with high needs. We found that the majority of children facing the highest out-of-pocket spending in exchange coverage were treated for chronic conditions,
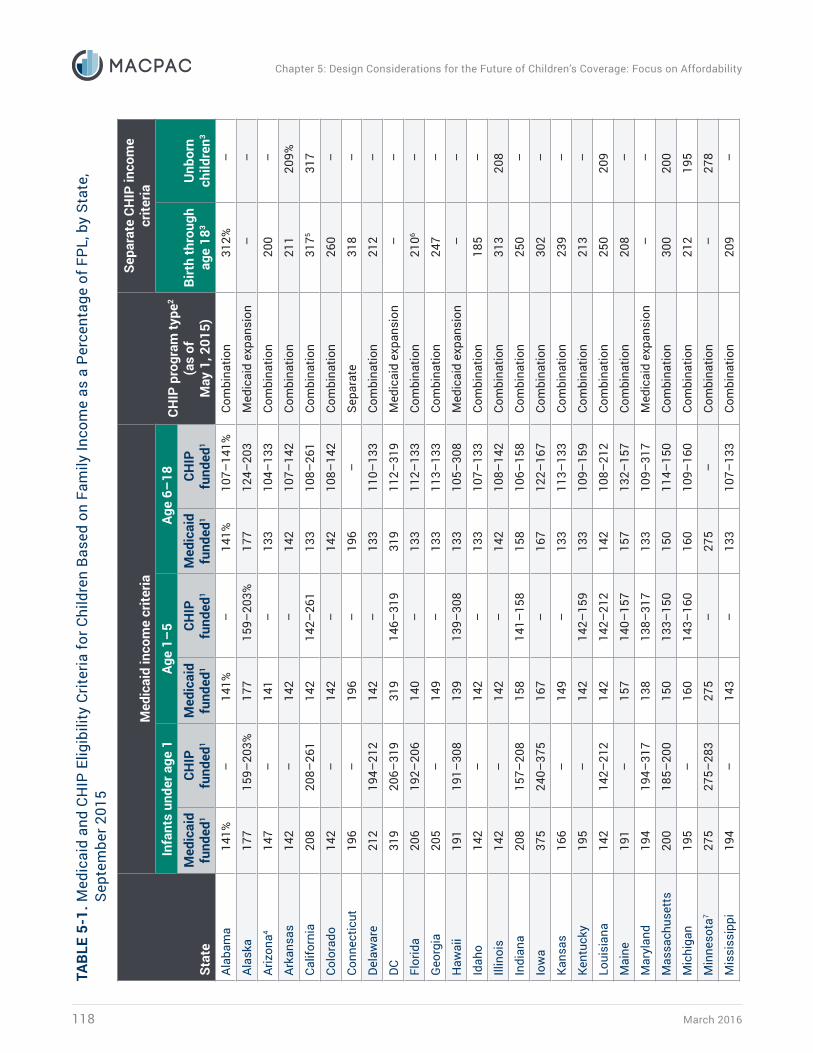
March 2016118
Chapter 5: Design Considerations for the Future of Children’s Coverage: Focus on AffordabilityTA
BLE
5-1.
Med
icai
d an
d CH
IP E
ligib
ility
Crit
eria
for C
hild
ren
Base
d on
Fam
ily In
com
e as
a P
erce
ntag
e of
FPL
, by
Stat
e,
Sept
embe
r 201
5
Stat
e
Med
icai
d in
com
e cr
iteria
CHIP
pro
gram
type
2 (a
s of
M
ay 1
, 201
5)
Sepa
rate
CH
IP in
com
e cr
iteria
Infa
nts
unde
r age
1Ag
e 1–
5Ag
e 6–
18Bi
rth
thro
ugh
age
183
Unb
orn
child
ren3
Med
icai
d fu
nded
1CH
IP
fund
ed1
Med
icai
d fu
nded
1CH
IP
fund
ed1
Med
icai
d fu
nded
1CH
IP
fund
ed1
Alab
ama
141%
–14
1%–
141%
107–
141%
Com
bina
tion
312%
–
Alas
ka
177
159–
203%
177
159–
203%
177
124–
203
Med
icai
d ex
pans
ion
––
Ariz
ona4
147
–14
1–
133
104–
133
Com
bina
tion
200
–
Arka
nsas
142
–14
2–
142
107–
142
Com
bina
tion
211
209%
Calif
orni
a20
820
8–26
114
214
2–26
113
310
8–26
1Co
mbi
natio
n31
7531
7
Colo
rado
14
2–
142
–14
210
8–14
2Co
mbi
natio
n26
0–
Conn
ectic
ut
196
–19
6–
196
–Se
para
te31
8–
Dela
war
e 21
219
4–21
214
2–
133
110–
133
Com
bina
tion
212
–
DC31
920
6–31
931
914
6–31
931
911
2–31
9M
edic
aid
expa
nsio
n–
–
Flor
ida
206
192–
206
140
–13
311
2–13
3Co
mbi
natio
n21
06–
Geo
rgia
20
5–
149
–13
311
3–13
3Co
mbi
natio
n24
7–
Haw
aii
191
191–
308
139
139–
308
133
105–
308
Med
icai
d ex
pans
ion
––
Idah
o 14
2–
142
–13
310
7–13
3Co
mbi
natio
n18
5–
Illin
ois
142
–14
2–
142
108–
142
Com
bina
tion
313
208
Indi
ana
208
157–
208
158
141–
158
158
106–
158
Com
bina
tion
250
–
Iow
a37
524
0–37
516
7–
167
122–
167
Com
bina
tion
302
–
Kans
as
166
–14
9–
133
113–
133
Com
bina
tion
239
–
Kent
ucky
19
5–
142
142–
159
133
109–
159
Com
bina
tion
213
–
Loui
sian
a 14
214
2–21
214
214
2–21
214
210
8–21
2Co
mbi
natio
n25
020
9
Mai
ne
191
–15
714
0–15
715
713
2–15
7Co
mbi
natio
n20
8–
Mar
ylan
d 19
419
4–31
713
813
8–31
713
310
9–31
7M
edic
aid
expa
nsio
n–
–
Mas
sach
uset
ts20
018
5–20
015
013
3–15
015
011
4–15
0Co
mbi
natio
n30
020
0
Mic
higa
n 19
5–
160
143–
160
160
109–
160
Com
bina
tion
212
195
Min
neso
ta7
275
275–
283
275
–27
5–
Com
bina
tion
–27
8
Mis
siss
ippi
19
4–
143
–13
310
7–13
3Co
mbi
natio
n20
9–

Report to Congress on Medicaid and CHIP 119
Chapter 5: Design Considerations for the Future of Children’s Coverage: Focus on Affordability
Stat
e
Med
icai
d in
com
e cr
iteria
CHIP
pro
gram
type
2 (a
s of
M
ay 1
, 201
5)
Sepa
rate
CH
IP in
com
e cr
iteria
Infa
nts
unde
r age
1Ag
e 1–
5Ag
e 6–
18Bi
rth
thro
ugh
age
183
Unb
orn
child
ren3
Med
icai
d fu
nded
1CH
IP
fund
ed1
Med
icai
d fu
nded
1CH
IP
fund
ed1
Med
icai
d fu
nded
1CH
IP
fund
ed1
Mis
sour
i19
6%–
148%
148–
150%
148%
110–
150%
Com
bina
tion
300%
–
Mon
tana
143
–14
3–
133
109–
143
Com
bina
tion
261
–
Neb
rask
a 16
216
2–21
3%14
514
5–21
313
310
9–21
3Co
mbi
natio
n–
197%
Nev
ada
160
–16
0–
133
122–
133
Com
bina
tion
200
–
New
Ham
pshi
re
196
196–
318
196
196–
318
196
196–
318
Med
icai
d ex
pans
ion
––
New
Jer
sey
194
–14
2–
142
107–
142
Com
bina
tion
350
–
New
Mex
ico
240
200–
300
240
200–
300
190
138–
240
Med
icai
d ex
pans
ion
––
New
Yor
k 21
819
6–21
814
9–
149
110–
149
Com
bina
tion
400
–
Nor
th C
arol
ina
210
194–
210
210
141–
210
133
107–
133
Com
bina
tion
2118
–
Nor
th D
akot
a14
7–
147
–13
311
1–13
3Co
mbi
natio
n17
0–
Ohi
o15
614
1–20
615
614
1–20
615
610
7–20
6M
edic
aid
expa
nsio
n–
–
Okl
ahom
a20
516
9–20
520
515
1–20
520
511
5–20
5Co
mbi
natio
n–
205
Ore
gon
185
133–
185
133
–13
310
0–13
3Co
mbi
natio
n30
018
5
Penn
sylv
ania
21
5–
157
–13
311
9–13
3Co
mbi
natio
n31
4–
Rhod
e Is
land
190
190–
261
142
142–
261
133
109–
261
Com
bina
tion
–25
3
Sout
h Ca
rolin
a19
419
4–20
814
314
3–20
813
310
7–20
8M
edic
aid
expa
nsio
n–
–
Sout
h Da
kota
18
217
7–18
218
217
7–18
218
212
4–18
2Co
mbi
natio
n20
4–
Tenn
esse
e919
5–
142
–13
310
9–13
3Co
mbi
natio
n25
025
0
Texa
s19
8–
144
–13
310
9–13
3Co
mbi
natio
n20
120
2
Uta
h13
9–
139
–13
310
5–13
3Co
mbi
natio
n20
0–
Verm
ont
312
237–
312
312
237–
312
312
237–
312
Med
icai
d ex
pans
ion
––
Virg
inia
143
–14
3–
143
109–
143
Com
bina
tion
200
–
Was
hing
ton
210
–21
0–
210
–Se
para
te31
219
3
Wes
t Virg
inia
15
8–
141
–13
310
8–13
3Co
mbi
natio
n30
0–
Wis
cons
in
301
–18
6–
133
101–
151
Com
bina
tion
301
301
Wyo
min
g 15
4–
154
–13
311
9–13
3Co
mbi
natio
n20
0–
TABL
E 5-
1. (c
ontin
ued)
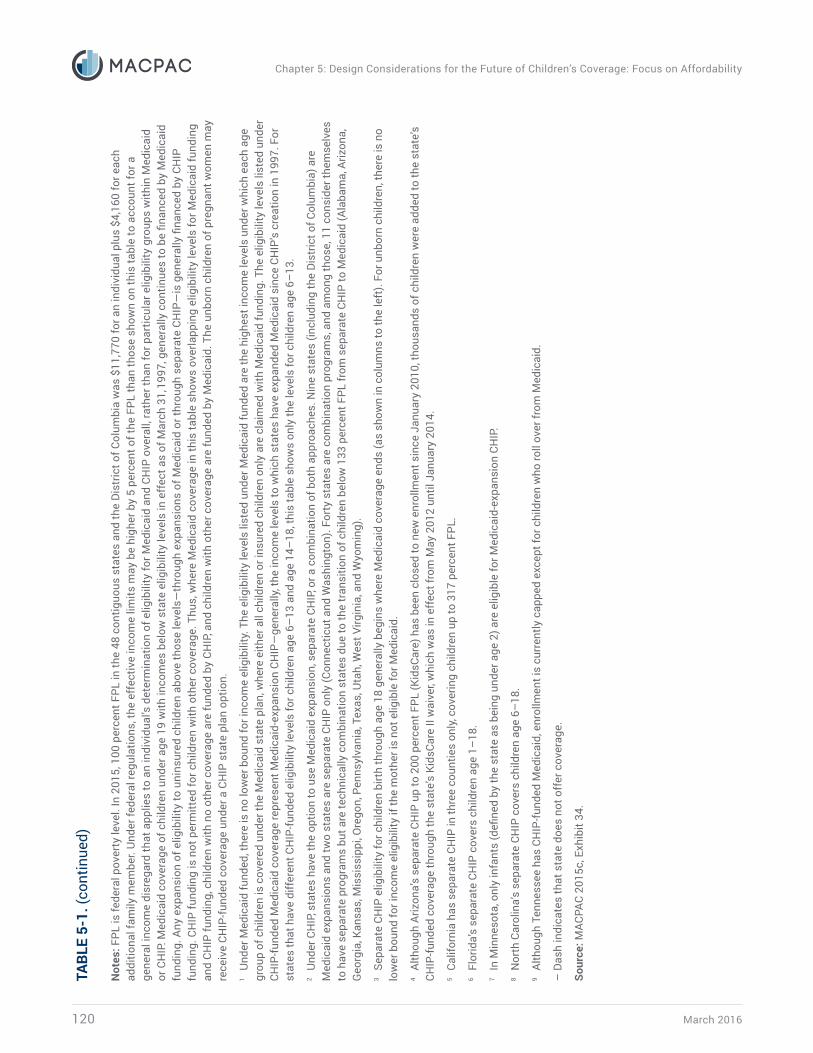
March 2016120
Chapter 5: Design Considerations for the Future of Children’s Coverage: Focus on Affordability
Not
es: F
PL is
fede
ral p
over
ty le
vel.
In 2
015,
100
per
cent
FPL
in th
e 48
con
tiguo
us s
tate
s an
d th
e Di
stric
t of C
olum
bia
was
$11
,770
for a
n in
divi
dual
plu
s $4
,160
for e
ach
addi
tiona
l fam
ily m
embe
r. U
nder
fede
ral r
egul
atio
ns, t
he e
ffec
tive
inco
me
limits
may
be
high
er b
y 5
perc
ent o
f the
FPL
than
thos
e sh
own
on th
is ta
ble
to a
ccou
nt fo
r a
gene
ral i
ncom
e di
sreg
ard
that
app
lies
to a
n in
divi
dual
’s d
eter
min
atio
n of
elig
ibili
ty fo
r Med
icai
d an
d CH
IP o
vera
ll, ra
ther
than
for p
artic
ular
elig
ibili
ty g
roup
s w
ithin
Med
icai
d or
CH
IP. M
edic
aid
cove
rage
of c
hild
ren
unde
r age
19
with
inco
mes
bel
ow s
tate
elig
ibili
ty le
vels
in e
ffec
t as
of M
arch
31,
199
7, g
ener
ally
con
tinue
s to
be
finan
ced
by M
edic
aid
fund
ing.
Any
exp
ansi
on o
f elig
ibili
ty to
uni
nsur
ed c
hild
ren
abov
e th
ose
leve
ls—
thro
ugh
expa
nsio
ns o
f Med
icai
d or
thro
ugh
sepa
rate
CH
IP—
is g
ener
ally
fina
nced
by
CHIP
fu
ndin
g. C
HIP
fund
ing
is n
ot p
erm
itted
for c
hild
ren
with
oth
er c
over
age.
Thu
s, w
here
Med
icai
d co
vera
ge in
this
tabl
e sh
ows
over
lapp
ing
elig
ibili
ty le
vels
for M
edic
aid
fund
ing
and
CHIP
fund
ing,
chi
ldre
n w
ith n
o ot
her c
over
age
are
fund
ed b
y CH
IP, a
nd c
hild
ren
with
oth
er c
over
age
are
fund
ed b
y M
edic
aid.
The
unb
orn
child
ren
of p
regn
ant w
omen
may
re
ceiv
e CH
IP-fu
nded
cov
erag
e un
der a
CH
IP s
tate
pla
n op
tion.
1
Und
er M
edic
aid
fund
ed, t
here
is n
o lo
wer
bou
nd fo
r inc
ome
elig
ibili
ty. T
he e
ligib
ility
leve
ls li
sted
und
er M
edic
aid
fund
ed a
re th
e hi
ghes
t inc
ome
leve
ls u
nder
whi
ch e
ach
age
grou
p of
chi
ldre
n is
cov
ered
und
er th
e M
edic
aid
stat
e pl
an, w
here
eith
er a
ll ch
ildre
n or
insu
red
child
ren
only
are
cla
imed
with
Med
icai
d fu
ndin
g. T
he e
ligib
ility
leve
ls li
sted
und
er
CHIP
-fund
ed M
edic
aid
cove
rage
repr
esen
t Med
icai
d-ex
pans
ion
CHIP
—ge
nera
lly, t
he in
com
e le
vels
to w
hich
sta
tes
have
exp
ande
d M
edic
aid
sinc
e CH
IP’s
cre
atio
n in
199
7. F
or
stat
es th
at h
ave
diff
eren
t CH
IP-fu
nded
elig
ibili
ty le
vels
for c
hild
ren
age
6–13
and
age
14–
18, t
his
tabl
e sh
ows
only
the
leve
ls fo
r chi
ldre
n ag
e 6–
13.
2 U
nder
CH
IP, s
tate
s ha
ve th
e op
tion
to u
se M
edic
aid
expa
nsio
n, s
epar
ate
CHIP
, or a
com
bina
tion
of b
oth
appr
oach
es. N
ine
stat
es (i
nclu
ding
the
Dist
rict o
f Col
umbi
a) a
re
Med
icai
d ex
pans
ions
and
two
stat
es a
re s
epar
ate
CHIP
onl
y (C
onne
ctic
ut a
nd W
ashi
ngto
n). F
orty
sta
tes
are
com
bina
tion
prog
ram
s, a
nd a
mon
g th
ose,
11
cons
ider
them
selv
es
to h
ave
sepa
rate
pro
gram
s bu
t are
tech
nica
lly c
ombi
natio
n st
ates
due
to th
e tr
ansi
tion
of c
hild
ren
belo
w 1
33 p
erce
nt F
PL fr
om s
epar
ate
CHIP
to M
edic
aid
(Ala
bam
a, A
rizon
a,
Geo
rgia
, Kan
sas,
Mis
siss
ippi
, Ore
gon,
Pen
nsyl
vani
a, T
exas
, Uta
h, W
est V
irgin
ia, a
nd W
yom
ing)
.3
Sepa
rate
CH
IP e
ligib
ility
for c
hild
ren
birt
h th
roug
h ag
e 18
gen
eral
ly b
egin
s w
here
Med
icai
d co
vera
ge e
nds
(as
show
n in
col
umns
to th
e le
ft).
For u
nbor
n ch
ildre
n, th
ere
is n
o lo
wer
bou
nd fo
r inc
ome
elig
ibili
ty if
the
mot
her i
s no
t elig
ible
for M
edic
aid.
4
Alth
ough
Ariz
ona’
s se
para
te C
HIP
up
to 2
00 p
erce
nt F
PL (K
idsC
are)
has
bee
n cl
osed
to n
ew e
nrol
lmen
t sin
ce J
anua
ry 2
010,
thou
sand
s of
chi
ldre
n w
ere
adde
d to
the
stat
e’s
CHIP
-fund
ed c
over
age
thro
ugh
the
stat
e’s
Kids
Care
II w
aive
r, w
hich
was
in e
ffec
t fro
m M
ay 2
012
until
Jan
uary
201
4.5
Calif
orni
a ha
s se
para
te C
HIP
in th
ree
coun
ties
only
, cov
erin
g ch
ildre
n up
to 3
17 p
erce
nt F
PL.
6 Fl
orid
a’s
sepa
rate
CH
IP c
over
s ch
ildre
n ag
e 1–
18.
7 In
Min
neso
ta, o
nly
infa
nts
(defi
ned
by th
e st
ate
as b
eing
und
er a
ge 2
) are
elig
ible
for M
edic
aid-
expa
nsio
n CH
IP.
8 N
orth
Car
olin
a’s
sepa
rate
CH
IP c
over
s ch
ildre
n ag
e 6–
18.
9 Al
thou
gh T
enne
ssee
has
CH
IP-fu
nded
Med
icai
d, e
nrol
lmen
t is
curr
ently
cap
ped
exce
pt fo
r chi
ldre
n w
ho ro
ll ov
er fr
om M
edic
aid.
– D
ash
indi
cate
s th
at s
tate
doe
s no
t off
er c
over
age.
Sour
ce: M
ACPA
C 20
15c,
Exh
ibit
34.
TABL
E 5-
1. (c
ontin
ued)

Report to Congress on Medicaid and CHIP 121
Chapter 5: Design Considerations for the Future of Children’s Coverage: Focus on Affordability
but also that there was a sizeable proportion of otherwise healthy children who unexpectedly needed hospitalization or other costly care.
The Commission is interested in the affordability of exchange coverage because exchange coverage would be one of the two main alternatives (along with employer-sponsored insurance) replacing separate CHIP coverage in the absence of federal CHIP funding. The Commission has also published estimates on the cost of employer-sponsored insurance for children (MACPAC 2016a, MACPAC 2016b). Other MACPAC analyses indicate that in the absence of separate CHIP, more than one-third (36 percent) of children who would be eligible for exchange coverage would not enroll, largely because of the cost of coverage described in this chapter. The affordability of these two sources of coverage will be important factors in the Commission’s deliberation of policy alternatives for the coverage of low- and moderate-income children.
Out-of-pocket spending in separate CHIP versus exchange coverageChildren face less out-of-pocket spending in separate CHIP than in subsidized exchange coverage (Table 5-2). In 2015, the combined premiums and cost sharing of separate CHIP in 36 states average $158 per year per child. Most of that spending is for premiums ($127), with the remainder being spent on cost sharing ($31). On average, separate CHIP enrollees face cost sharing of 2 percent of covered medical benefits, with the plans covering 98 percent—that is, separate CHIP coverage has an effective actuarial value of 98 percent.6
These same children, if enrolled in the second lowest cost silver exchange plan, face $1,073 in average annual out-of-pocket spending—$806 for premiums and $266 in cost sharing (Table 5-2). The effective actuarial value in these plans averages 82 percent, with families paying for the remaining 18 percent through cost sharing.
TABLE 5-2. Average Annual Cost Sharing and Premiums for Children in Separate CHIP versus Second Lowest Cost Silver Exchange Plans, 2015
Coverage type Effective
actuarial valueAverage
cost sharingAverage
premiums
Total (of average cost sharing and
premiums)
Separate CHIP 98% $31 $127 $158
Second lowest cost silver exchange plan 82 266 806 1,073
Notes: Effective actuarial value is the percentage of covered benefits paid on average by the plans for the children in the analysis. The second lowest cost silver exchange plan is based on the plan in each state’s county with the most children and includes applicable cost sharing reductions. These results are on an annual per-child basis, without regard to additional premiums and cost sharing or limitations on out-of-pocket spending in families with multiple enrolled children. The Actuarial Research Corporation (ARC) results are provided by state and for four income categories based on percentage of the federal poverty level. The national numbers are based on state-level enrollment in separate CHIP in fiscal year 2014 as reported by states in the CHIP Statistical Enrollment Data System and assuming that individuals are evenly distributed across four income categories, with the exception of Alabama, New York, Pennsylvania, and Tennessee. For these four states, the income distribution was altered to reflect data reported by state governors in their letters to congressional committees in late 2014.
Sources: MACPAC 2015 analysis of results from ARC, which model 36 states’ separate CHIP cost sharing and premium parameters and the second lowest cost silver exchange plan in those states, using 2012 data from the Household Component of the Medical Expenditure Panel Survey adjusted to 2015 levels, and Energy and Commerce Committee 2014.
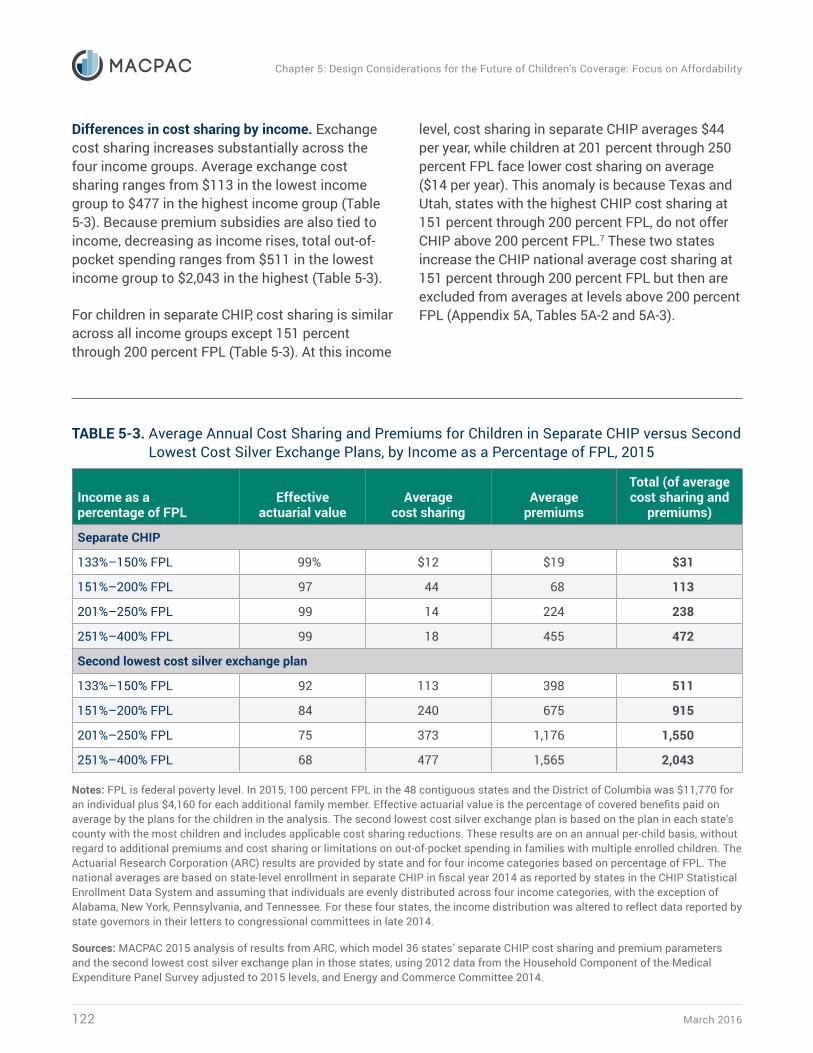
March 2016122
Chapter 5: Design Considerations for the Future of Children’s Coverage: Focus on Affordability
Differences in cost sharing by income. Exchange cost sharing increases substantially across the four income groups. Average exchange cost sharing ranges from $113 in the lowest income group to $477 in the highest income group (Table 5-3). Because premium subsidies are also tied to income, decreasing as income rises, total out-of-pocket spending ranges from $511 in the lowest income group to $2,043 in the highest (Table 5-3).
For children in separate CHIP, cost sharing is similar across all income groups except 151 percent through 200 percent FPL (Table 5-3). At this income
level, cost sharing in separate CHIP averages $44 per year, while children at 201 percent through 250 percent FPL face lower cost sharing on average ($14 per year). This anomaly is because Texas and Utah, states with the highest CHIP cost sharing at 151 percent through 200 percent FPL, do not offer CHIP above 200 percent FPL.7 These two states increase the CHIP national average cost sharing at 151 percent through 200 percent FPL but then are excluded from averages at levels above 200 percent FPL (Appendix 5A, Tables 5A-2 and 5A-3).
TABLE 5-3. Average Annual Cost Sharing and Premiums for Children in Separate CHIP versus Second Lowest Cost Silver Exchange Plans, by Income as a Percentage of FPL, 2015
Income as a percentage of FPL
Effective actuarial value
Average cost sharing
Average premiums
Total (of average cost sharing and
premiums)
Separate CHIP
133%–150% FPL 99% $12 $19 $31
151%–200% FPL 97 44 68 113
201%–250% FPL 99 14 224 238
251%–400% FPL 99 18 455 472
Second lowest cost silver exchange plan
133%–150% FPL 92 113 398 511
151%–200% FPL 84 240 675 915
201%–250% FPL 75 373 1,176 1,550
251%–400% FPL 68 477 1,565 2,043
Notes: FPL is federal poverty level. In 2015, 100 percent FPL in the 48 contiguous states and the District of Columbia was $11,770 for an individual plus $4,160 for each additional family member. Effective actuarial value is the percentage of covered benefits paid on average by the plans for the children in the analysis. The second lowest cost silver exchange plan is based on the plan in each state’s county with the most children and includes applicable cost sharing reductions. These results are on an annual per-child basis, without regard to additional premiums and cost sharing or limitations on out-of-pocket spending in families with multiple enrolled children. The Actuarial Research Corporation (ARC) results are provided by state and for four income categories based on percentage of FPL. The national averages are based on state-level enrollment in separate CHIP in fiscal year 2014 as reported by states in the CHIP Statistical Enrollment Data System and assuming that individuals are evenly distributed across four income categories, with the exception of Alabama, New York, Pennsylvania, and Tennessee. For these four states, the income distribution was altered to reflect data reported by state governors in their letters to congressional committees in late 2014.
Sources: MACPAC 2015 analysis of results from ARC, which model 36 states’ separate CHIP cost sharing and premium parameters and the second lowest cost silver exchange plan in those states, using 2012 data from the Household Component of the Medical Expenditure Panel Survey adjusted to 2015 levels, and Energy and Commerce Committee 2014.
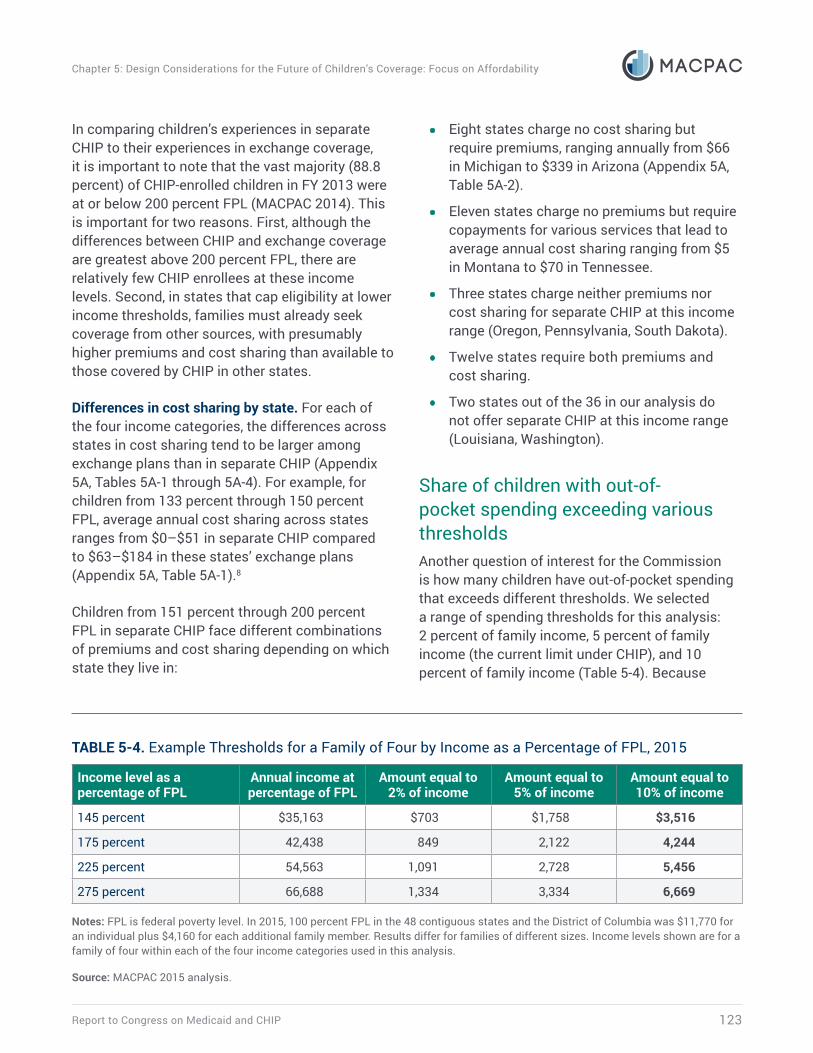
Report to Congress on Medicaid and CHIP 123
Chapter 5: Design Considerations for the Future of Children’s Coverage: Focus on Affordability
In comparing children’s experiences in separate CHIP to their experiences in exchange coverage, it is important to note that the vast majority (88.8 percent) of CHIP-enrolled children in FY 2013 were at or below 200 percent FPL (MACPAC 2014). This is important for two reasons. First, although the differences between CHIP and exchange coverage are greatest above 200 percent FPL, there are relatively few CHIP enrollees at these income levels. Second, in states that cap eligibility at lower income thresholds, families must already seek coverage from other sources, with presumably higher premiums and cost sharing than available to those covered by CHIP in other states.
Differences in cost sharing by state. For each of the four income categories, the differences across states in cost sharing tend to be larger among exchange plans than in separate CHIP (Appendix 5A, Tables 5A-1 through 5A-4). For example, for children from 133 percent through 150 percent FPL, average annual cost sharing across states ranges from $0–$51 in separate CHIP compared to $63–$184 in these states’ exchange plans (Appendix 5A, Table 5A-1).8
Children from 151 percent through 200 percent FPL in separate CHIP face different combinations of premiums and cost sharing depending on which state they live in:
• Eight states charge no cost sharing but require premiums, ranging annually from $66 in Michigan to $339 in Arizona (Appendix 5A, Table 5A-2).
• Eleven states charge no premiums but require copayments for various services that lead to average annual cost sharing ranging from $5 in Montana to $70 in Tennessee.
• Three states charge neither premiums nor cost sharing for separate CHIP at this income range (Oregon, Pennsylvania, South Dakota).
• Twelve states require both premiums and cost sharing.
• Two states out of the 36 in our analysis do not offer separate CHIP at this income range (Louisiana, Washington).
Share of children with out-of-pocket spending exceeding various thresholdsAnother question of interest for the Commission is how many children have out-of-pocket spending that exceeds different thresholds. We selected a range of spending thresholds for this analysis: 2 percent of family income, 5 percent of family income (the current limit under CHIP), and 10 percent of family income (Table 5-4). Because
TABLE 5-4. Example Thresholds for a Family of Four by Income as a Percentage of FPL, 2015
Income level as a percentage of FPL
Annual income at percentage of FPL
Amount equal to 2% of income
Amount equal to 5% of income
Amount equal to 10% of income
145 percent $35,163 $703 $1,758 $3,516
175 percent 42,438 849 2,122 4,244
225 percent 54,563 1,091 2,728 5,456
275 percent 66,688 1,334 3,334 6,669
Notes: FPL is federal poverty level. In 2015, 100 percent FPL in the 48 contiguous states and the District of Columbia was $11,770 for an individual plus $4,160 for each additional family member. Results differ for families of different sizes. Income levels shown are for a family of four within each of the four income categories used in this analysis.
Source: MACPAC 2015 analysis.
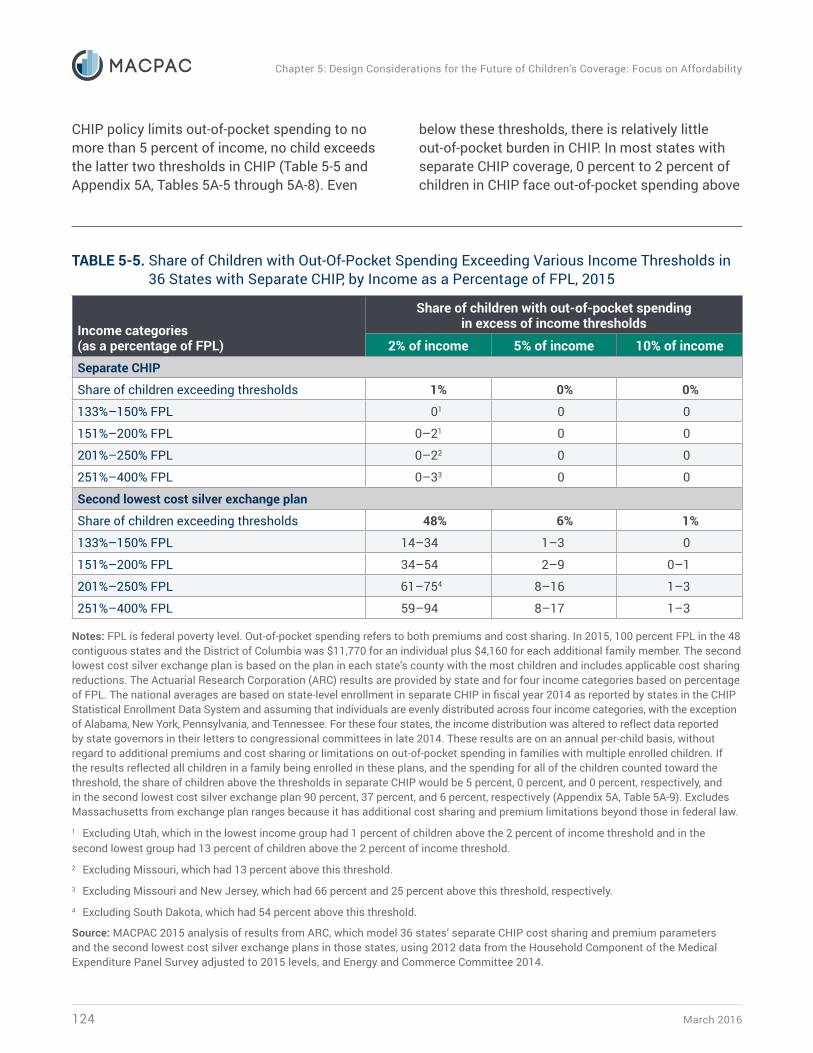
March 2016124
Chapter 5: Design Considerations for the Future of Children’s Coverage: Focus on Affordability
CHIP policy limits out-of-pocket spending to no more than 5 percent of income, no child exceeds the latter two thresholds in CHIP (Table 5-5 and Appendix 5A, Tables 5A-5 through 5A-8). Even
below these thresholds, there is relatively little out-of-pocket burden in CHIP. In most states with separate CHIP coverage, 0 percent to 2 percent of children in CHIP face out-of-pocket spending above
TABLE 5-5. Share of Children with Out-Of-Pocket Spending Exceeding Various Income Thresholds in 36 States with Separate CHIP, by Income as a Percentage of FPL, 2015
Income categories (as a percentage of FPL)
Share of children with out-of-pocket spending in excess of income thresholds
2% of income 5% of income 10% of incomeSeparate CHIP
Share of children exceeding thresholds 1% 0% 0%
133%–150% FPL 01 0 0
151%–200% FPL 0–21 0 0
201%–250% FPL 0–22 0 0
251%–400% FPL 0–33 0 0
Second lowest cost silver exchange plan
Share of children exceeding thresholds 48% 6% 1%
133%–150% FPL 14–34 1–3 0
151%–200% FPL 34–54 2–9 0–1
201%–250% FPL 61–754 8–16 1–3
251%–400% FPL 59–94 8–17 1–3
Notes: FPL is federal poverty level. Out-of-pocket spending refers to both premiums and cost sharing. In 2015, 100 percent FPL in the 48 contiguous states and the District of Columbia was $11,770 for an individual plus $4,160 for each additional family member. The second lowest cost silver exchange plan is based on the plan in each state’s county with the most children and includes applicable cost sharing reductions. The Actuarial Research Corporation (ARC) results are provided by state and for four income categories based on percentage of FPL. The national averages are based on state-level enrollment in separate CHIP in fiscal year 2014 as reported by states in the CHIP Statistical Enrollment Data System and assuming that individuals are evenly distributed across four income categories, with the exception of Alabama, New York, Pennsylvania, and Tennessee. For these four states, the income distribution was altered to reflect data reported by state governors in their letters to congressional committees in late 2014. These results are on an annual per-child basis, without regard to additional premiums and cost sharing or limitations on out-of-pocket spending in families with multiple enrolled children. If the results reflected all children in a family being enrolled in these plans, and the spending for all of the children counted toward the threshold, the share of children above the thresholds in separate CHIP would be 5 percent, 0 percent, and 0 percent, respectively, and in the second lowest cost silver exchange plan 90 percent, 37 percent, and 6 percent, respectively (Appendix 5A, Table 5A-9). Excludes Massachusetts from exchange plan ranges because it has additional cost sharing and premium limitations beyond those in federal law.1 Excluding Utah, which in the lowest income group had 1 percent of children above the 2 percent of income threshold and in the second lowest group had 13 percent of children above the 2 percent of income threshold.2 Excluding Missouri, which had 13 percent above this threshold.3 Excluding Missouri and New Jersey, which had 66 percent and 25 percent above this threshold, respectively.4 Excluding South Dakota, which had 54 percent above this threshold.
Source: MACPAC 2015 analysis of results from ARC, which model 36 states’ separate CHIP cost sharing and premium parameters and the second lowest cost silver exchange plans in those states, using 2012 data from the Household Component of the Medical Expenditure Panel Survey adjusted to 2015 levels, and Energy and Commerce Committee 2014.
Report to Congress on Medicaid and CHIP 125
Chapter 5: Design Considerations for the Future of Children’s Coverage: Focus on Affordability
2 percent of family income (Table 5-5 and Appendix 5A, Tables 5A-5 through 5A-8).
In the 13 states with separate CHIP above 250 percent FPL, the share of children in CHIP with out-of-pocket spending above 2 percent of income ranges from 0 percent to 66 percent, which generally reflects CHIP premiums rather than cost sharing (Appendix 5A, Table 5A-8). In 11 of these 13 states, the share of children with out-of-pocket spending above the 2 percent of income threshold is 0 percent to 3 percent (Table 5-5). The other two states are New Jersey (25 percent) and Missouri (66 percent). For example, at 251 percent through 300 percent FPL, families with a child in Missouri’s separate CHIP face average annual premiums of $1,586 but no cost sharing (Appendix 5A, Table 5A-4). For FY 2013, Missouri reported that 4.2 percent of its separate CHIP enrollees were above 250 percent FPL (MACPAC 2014).
Across every state and income level analyzed, more children face out-of-pocket spending in excess of various thresholds in exchange coverage than in separate CHIP (Table 5-5 and Appendix 5A, Tables 5A-5 through 5A-8). In every state with separate CHIP, some children (1 percent to 17 percent, depending on the state and income level) face out-of-pocket spending for exchange coverage exceeding 5 percent of income.
These results are on an annual per-child basis, without regard to combined premiums and cost sharing in families with multiple enrolled children. Our analysis was done this way so that our assessment of the characteristics of children with high out-of-pocket spending, discussed below, would reflect each child’s own health care needs. If the results reflected the combined spending of all children in a family, the share of children with spending above the thresholds would be higher than those shown in Table 5-5 (compare Table 5-5 to Appendix 5A, Table 5A-9).
Health care use and health conditions of children with high out-of-pocket spending in exchange coverageThe Commission also sought insights into the health status and health care use among children who would face the highest out-of-pocket spending if enrolled in an exchange plan rather than separate CHIP. The results show that children receiving treatment for chronic conditions comprise a majority of those with the highest out-of-pocket spending in exchange coverage (Figure 5-1). However, because there is also a sizeable group of otherwise healthy children who experience an unexpected acute episode that causes high health care spending, a policy targeted only to specific chronic conditions would leave many children vulnerable to high out-of-pocket spending in exchange coverage.
Because the share of children exceeding the highest spending threshold within each income group is so small, the sample of children in the analysis is inadequate to support estimates by state or income group. Therefore, we present national estimates for all 36 states in our analysis across all four income groups.
Health care use among children exceeding spending thresholds. Although relatively few children are hospitalized during the year, hospitalizations are common among children with the highest out-of-pocket spending in exchange coverage. Just 5 percent of children with out-of-pocket spending above the 2 percent of income threshold have a hospitalization, while over half (56 percent) of children above the 10 percent of income threshold have a hospitalization. About one-quarter (27 percent) of children above the 5 percent of income threshold have a hospitalization.
Visiting the emergency department and having three or more prescriptions filled during the year are also more common among the children exceeding the highest spending thresholds in exchange coverage. Twenty percent of children
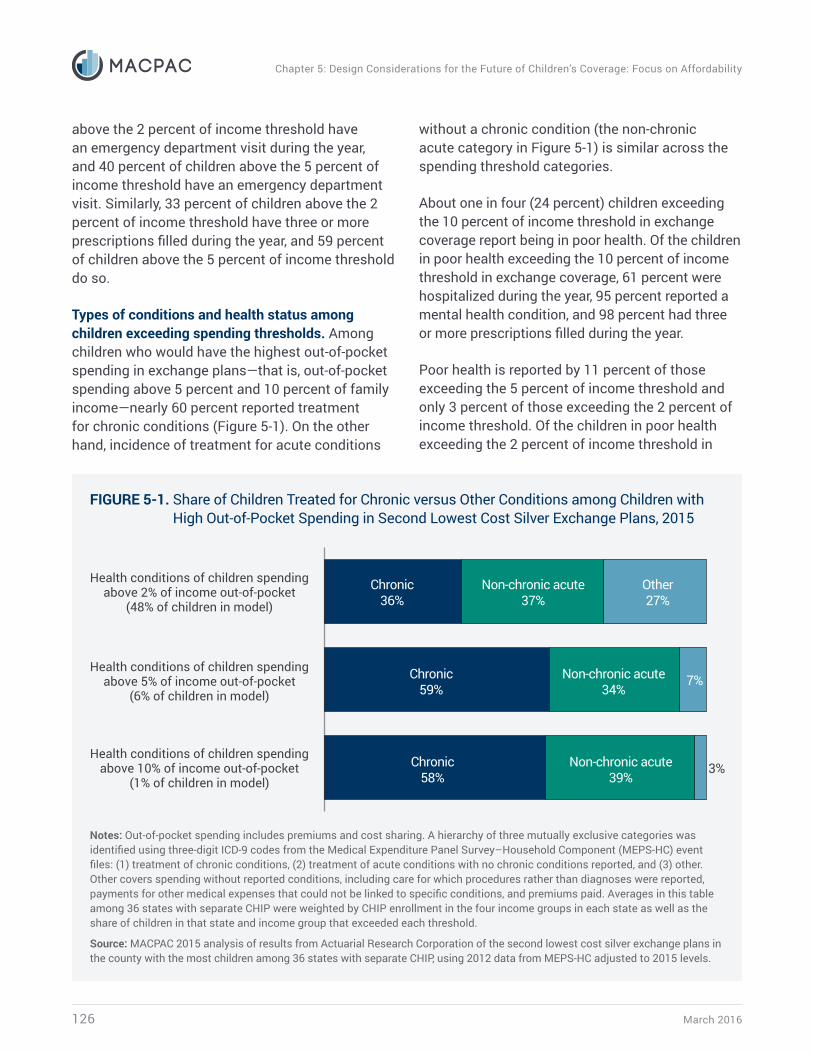
March 2016126
Chapter 5: Design Considerations for the Future of Children’s Coverage: Focus on Affordability
above the 2 percent of income threshold have an emergency department visit during the year, and 40 percent of children above the 5 percent of income threshold have an emergency department visit. Similarly, 33 percent of children above the 2 percent of income threshold have three or more prescriptions filled during the year, and 59 percent of children above the 5 percent of income threshold do so.
Types of conditions and health status among children exceeding spending thresholds. Among children who would have the highest out-of-pocket spending in exchange plans—that is, out-of-pocket spending above 5 percent and 10 percent of family income—nearly 60 percent reported treatment for chronic conditions (Figure 5-1). On the other hand, incidence of treatment for acute conditions
without a chronic condition (the non-chronic acute category in Figure 5-1) is similar across the spending threshold categories.
About one in four (24 percent) children exceeding the 10 percent of income threshold in exchange coverage report being in poor health. Of the children in poor health exceeding the 10 percent of income threshold in exchange coverage, 61 percent were hospitalized during the year, 95 percent reported a mental health condition, and 98 percent had three or more prescriptions filled during the year.
Poor health is reported by 11 percent of those exceeding the 5 percent of income threshold and only 3 percent of those exceeding the 2 percent of income threshold. Of the children in poor health exceeding the 2 percent of income threshold in
FIGURE 5-1. Share of Children Treated for Chronic versus Other Conditions among Children with High Out-of-Pocket Spending in Second Lowest Cost Silver Exchange Plans, 2015
Health conditions of children spendingabove 2% of income out-of-pocket
(48% of children in model)
Health conditions of children spendingabove 5% of income out-of-pocket
(6% of children in model)
Health conditions of children spendingabove 10% of income out-of-pocket
(1% of children in model)
Other27%
Non-chronic acute37%
Chronic36%
7%Non-chronic acute34%
Chronic59%
3%Non-chronic acute39%
Chronic58%
Notes: Out-of-pocket spending includes premiums and cost sharing. A hierarchy of three mutually exclusive categories was identified using three-digit ICD-9 codes from the Medical Expenditure Panel Survey–Household Component (MEPS-HC) event files: (1) treatment of chronic conditions, (2) treatment of acute conditions with no chronic conditions reported, and (3) other. Other covers spending without reported conditions, including care for which procedures rather than diagnoses were reported, payments for other medical expenses that could not be linked to specific conditions, and premiums paid. Averages in this table among 36 states with separate CHIP were weighted by CHIP enrollment in the four income groups in each state as well as the share of children in that state and income group that exceeded each threshold.
Source: MACPAC 2015 analysis of results from Actuarial Research Corporation of the second lowest cost silver exchange plans in the county with the most children among 36 states with separate CHIP, using 2012 data from MEPS-HC adjusted to 2015 levels.

Report to Congress on Medicaid and CHIP 127
Chapter 5: Design Considerations for the Future of Children’s Coverage: Focus on Affordability
exchange coverage, 20 percent were hospitalized during the year, 78 percent reported a mental health condition, and 79 percent had three or more prescriptions filled during the year.
Specific conditions among children exceeding spending thresholds. Children who would have the highest out-of-pocket spending in exchange coverage are more likely to receive treatment for mental health conditions, asthma, or trauma, the top three conditions among children in terms of direct medical spending (Soni 2015). Twenty-nine percent of children with out-of-pocket spending exceeding 5 percent of family income reported treatment for a mental health condition, compared to 12 percent of those with out-of-pocket spending exceeding 2 percent of family income. Children in families with out-of-pocket spending exceeding 5 percent of income are nearly twice as likely to be treated for asthma or trauma as children in families with spending exceeding 2 percent of income. These results also raise questions about the adequacy of benefits for common childhood conditions, another topic the Commission will continue to explore.
Next StepsThe results presented in this chapter provide more evidence that exchange coverage is more costly to families than CHIP. In addition, they go deeper in detail, showing that in 36 states where separate CHIP exists, some children would face out-of-pocket spending levels in exchange coverage that are prohibited by CHIP. Differences across states in income eligibility criteria for CHIP enrollment mean that the group of children receiving CHIP cost sharing protection varies by state. These results also show that the children facing high out-of-pocket spending do not all have predictable, chronic health care needs, but that some of these children are healthy children who unexpectedly need a hospitalization or other costly care.
The results of this analysis on affordability of coverage raise several policy questions for discussion, including:
• Are current levels of premiums and cost sharing in subsidized exchange coverage appropriate for low- and moderate-income children?
• How much variation in premiums and cost sharing should exist across states—either in CHIP or exchange coverage—for low- and moderate-income children?
• How can information on the characteristics of children with high health care spending be used in designing a policy to ensure that coverage is affordable?
The Commission is now considering these questions as it evaluates and weighs various policy solutions to ensure that low- and moderate-income children have access to adequate and affordable coverage. Over the coming months, the Commission will develop recommendations on the range of issues affecting children’s coverage, including affordability, coverage, benefits, and access.
March 2016128
Chapter 5: Design Considerations for the Future of Children’s Coverage: Focus on Affordability
Endnotes1 Prior research has shown that low- and moderate-income children would face substantially higher out-of-pocket costs with exchange coverage than with CHIP coverage (MACPAC 2015a, GAO 2015, Bly et al. 2014). These prior analyses were limited to either a handful of states or to children at particular income levels.
2 On November 25, 2015, the U.S. Department of Health and Human Services (HHS) released a congressionally mandated study of whether exchange benefits and cost sharing are comparable to separate CHIP (CMS 2015). Consistent with our findings, HHS found that no exchange plans are comparable to CHIP with respect to premiums and cost sharing. The HHS study also looked at covered benefits and found that benefit packages in CHIP are generally more comprehensive for dental, vision, and habilitation services and are more comprehensive for children with special health care needs than exchange plans. For benefits typically covered by commercial plans, such as physician, laboratory, and radiological services, HHS found that coverage is similar between CHIP and exchange plans. This is also consistent with MACPAC’s prior analyses (MACPAC 2015a, MACPAC 2014).
3 Premiums are defined as fees that an enrollee must pay to remain insured, generally payable on a monthly basis. Cost sharing is the portion of covered medical expenses that the insured person must pay, including deductibles, coinsurance, and copayments.
4 Four states are considered combination states for a different reason. In Minnesota, Nebraska, Oklahoma, and Rhode Island, all CHIP-funded children age 0–18 are in Medicaid-expansion CHIP coverage. However, these states also use CHIP funding to cover unborn children, which is only permissible under separate CHIP. (In total, 15 states cover unborn children in CHIP.)
5 This chapter focuses on separate CHIP, but the differences between Medicaid-expansion CHIP and exchange coverage would likely be even larger. This is because Medicaid-expansion CHIP offers states much less flexibility to charge cost sharing and premiums than separate CHIP does.
6 The term effective actuarial value as used in this chapter refers to the percentage of covered benefits paid for, on average, by the plan for the particular group of children in our analysis. Although cost sharing reductions for exchange plans are required by law to meet certain actuarial values, these values are assigned using a different standard population and other varying assumptions. Thus, where the effective actuarial values in this chapter do not match the statutory levels, this does not necessarily indicate that an exchange plan is out of compliance, but more likely that the cost sharing reductions were set based on a different population than modeled in this chapter.
7 Utah has the highest cost sharing and the lowest actuarial value of any separate CHIP. At an income level of 151 percent through 200 percent FPL, cost sharing averages $214 per year, with an effective actuarial value of 86 percent for the children included in the analysis (Appendix 5A, Table 5A-2). Although Utah’s separate CHIP has the lowest actuarial value of all the states, the actuarial value still exceeds that of the second lowest cost silver exchange plan analyzed for Utah, which has an effective actuarial value for the same children of 83 percent, with average cost sharing of $256 per year. Utah is the only separate CHIP in the country with a deductible—$40 for children at or below 150 percent FPL and $500 for those at 151 percent through 200 percent FPL. For children at 151 percent through 200 percent FPL, non-preventive office visits require a copayment of $25 to $40, with an inpatient coinsurance of 20 percent after meeting the deductible (Cardwell et al. 2014). In Texas, for children at 151 percent through 200 percent FPL, cost sharing in separate CHIP averages $94 per year, with an effective actuarial value of 94 percent for the children included in the analysis (Appendix 5A, Table 5A-2).
8 This range excludes Massachusetts, which funds additional premium and cost sharing reductions beyond the standard amounts for exchange coverage.
ReferencesBly, A., J. Lerche, and K. Rustagi. 2014. Comparison of benefits and cost sharing in Children’s Health Insurance Programs to qualified health plans. Englewood, CO: Wakely Consulting Group. http://www.wakely.com/wp-content/
Report to Congress on Medicaid and CHIP 129
Chapter 5: Design Considerations for the Future of Children’s Coverage: Focus on Affordability
uploads/2014/07/FINAL-CHIP-vs-QHP-Cost-Sharing-and-Benefits-Comparison-First-Focus-July-2014-.pdf.
Cardwell, A., J. Jee, C. Hess, et al. 2014. Benefits and cost sharing in separate CHIP programs. Washington, DC: Georgetown University Center for Children and Families and National Academy for State Health Policy. http://www.nashp.org/wp-content/uploads/sites/default/files/Benefits.Cost_.Sharing.Separate.CHIP_.Programs.pdf.
Centers for Medicare & Medicaid Services (CMS), U.S. Department of Health and Human Services. 2015. Certification of comparability of pediatric coverage offered by qualified health plans. November 25, 2015. Baltimore, MD: CMS. http://www.medicaid.gov/chip/downloads/certification-of-comparability-of-pediatric-coverage-offered-by-qualified-health-plans.pdf.
Energy and Commerce Committee, U.S. House of Representatives. 2014. Responses to bipartisan, bicameral letters to governors regarding CHIP. December 2014. https://energycommerce.house.gov/letter/responses-bipartisan-bicameral-letters-governors-regarding-chip.
Martinez, M.E., and R.A. Cohen. 2015. Health insurance coverage: Early release of estimates from the National Health Interview Survey, January–June 2015. Hyattsville, MD: National Center for Health Statistics. http://www.cdc.gov/nchs/data/nhis/earlyrelease/insur201511.pdf.
Martinez, M.E., and R.A. Cohen. 2012. Health insurance coverage: Early release of estimates from the National Health Interview Survey, January–June 2012. Hyattsville, MD: National Center for Health Statistics. http://www.cdc.gov/nchs/data/nhis/earlyrelease/insur201212.pdf.
Medicaid and CHIP Payment and Access Commission (MACPAC). 2016a. Employer-sponsored insurance for low- and moderate-income children. Washington, DC: MACPAC. https://www.macpac.gov/publication/employer-sponsored-insurance-for-low-and-moderate-income-children/.
Medicaid and CHIP Payment and Access Commission (MACPAC). 2016b. Affordability for children in separate CHIP versus employer-sponsored insurance. Presentation before the Medicaid and CHIP Payment and Access Commission, January 28, 2016, Washington, DC. https://www.macpac.gov/publication/affordability-for-children-in-separate-chip-versus-employer-sponsored-insurance/.
Medicaid and CHIP Payment and Access Commission (MACPAC). 2015a. Report to Congress on Medicaid and CHIP. March 2015. Washington, DC: MACPAC. https://www.macpac.gov/publication/march-2015-report-to-congress-on-medicaid-and-chip/.
Medicaid and CHIP Payment and Access Commission (MACPAC). 2015b. The effect of premiums and cost sharing on access and outcomes for low-income children. March 2015. Washington, DC: MACPAC. https://www.macpac.gov/publication/the-effect-of-premiums-and-cost-sharing-on-access-and-outcomes-for-low-income-children/.
Medicaid and CHIP Payment and Access Commission (MACPAC). 2015c. MACStats: Medicaid and CHIP Data Book. December 2015. Washington, DC: MACPAC. https://www.macpac.gov/publication/macstats-medicaid-and-chip-data-book-2/.
Medicaid and CHIP Payment and Access Commission (MACPAC). 2014. Report to Congress on Medicaid and CHIP. March 2014. Washington, DC: MACPAC. https://www.macpac.gov/publication/report-to-the-congress-on-medicaid-and-chip-314/.
Rudowitz, R. 2015. Children’s coverage: What matters most to parents—results from focus groups in 6 cities. Menlo Park, CA: Henry J. Kaiser Family Foundation. http://kff.org/medicaid/issue-brief/childrens-coverage-what-matters-most-to-parents-results-from-focus-groups-in-6-cities/.
Soni, A. 2015. Top five most costly conditions among children, age 0–17, 2012: Estimates for the U.S. civilian noninstitutionalized population. Statistical Brief no. 47. Rockville, MD: Agency for Healthcare Research and Quality (AHRQ). http://meps.ahrq.gov/mepsweb/data_files/publications/st472/stat472.pdf.
U.S. Government Accountability Office (GAO). 2015. Children’s health insurance: Coverage of services and costs to consumers in selected CHIP and private health plans in five states. Report no. GAO-15-323. Washington, DC: GAO. http://www.gao.gov/assets/670/668677.pdf.
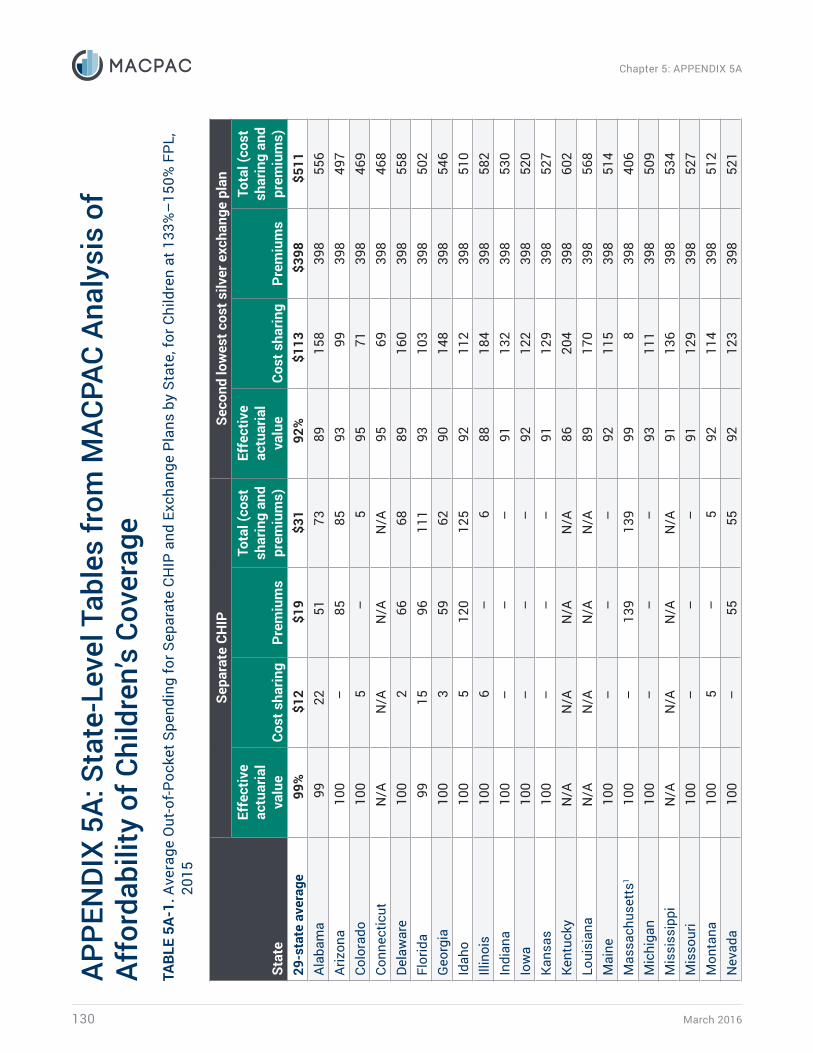
March 2016130
Chapter 5: APPENDIX 5A
APPE
NDI
X 5A
: Sta
te-L
evel
Tab
les
from
MAC
PAC
Anal
ysis
of
Affo
rdab
ility
of C
hild
ren’
s Co
vera
geTA
BLE
5A-1
. Ave
rage
Out
-of-P
ocke
t Spe
ndin
g fo
r Sep
arat
e CH
IP a
nd E
xcha
nge
Plan
s by
Sta
te, f
or C
hild
ren
at 1
33%
–15
0% F
PL,
2015
Stat
e
Sepa
rate
CH
IPSe
cond
low
est c
ost s
ilver
exc
hang
e pl
anEf
fect
ive
actu
aria
l va
lue
Cost
sha
ring
Prem
ium
s
Tota
l (co
st
shar
ing
and
prem
ium
s)
Effe
ctiv
e ac
tuar
ial
valu
eCo
st s
harin
gPr
emiu
ms
Tota
l (co
st
shar
ing
and
prem
ium
s)29
-sta
te a
vera
ge99
%$1
2 $1
9 $3
1 92
%$1
13
$398
$5
11
Alab
ama
99 2
2 5
1 7
3 89
158
398
556
Ariz
ona
100
–
85
85
9399
398
497
Colo
rado
100
5
–
5
9571
398
469
Conn
ectic
utN
/AN
/AN
/AN
/A95
6939
846
8De
law
are
100
2
66
68
8916
039
855
8Fl
orid
a99
15
96
111
93
103
398
502
Geo
rgia
100
3
59
62
9014
839
854
6Id
aho
100
5
120
1
25
9211
239
851
0Ill
inoi
s10
0 6
–
6
88
184
398
582
Indi
ana
100
–
–
–
9113
239
853
0Io
wa
100
–
–
–
9212
239
852
0Ka
nsas
100
–
–
–
9112
939
852
7Ke
ntuc
kyN
/AN
/AN
/AN
/A86
204
398
602
Loui
sian
aN
/AN
/AN
/AN
/A89
170
398
568
Mai
ne10
0 –
–
–
92
115
398
514
Mas
sach
uset
ts1
100
–
139
1
39
998
398
406
Mic
higa
n10
0 –
–
–
93
111
398
509
Mis
siss
ippi
N/A
N/A
N/A
N/A
9113
639
853
4M
isso
uri
100
–
–
–
9112
939
852
7M
onta
na10
0 5
–
5
92
114
398
512
Nev
ada
100
–
55
55
9212
339
852
1
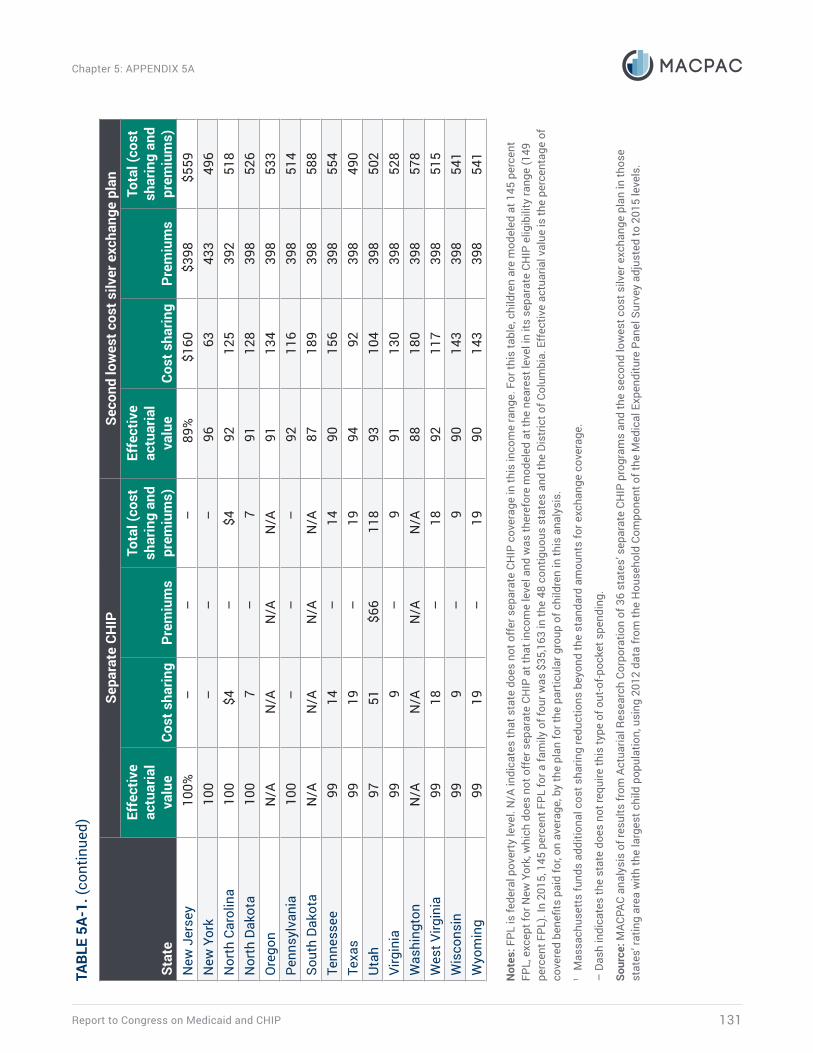
Report to Congress on Medicaid and CHIP 131
Chapter 5: APPENDIX 5A
Stat
e
Sepa
rate
CH
IPSe
cond
low
est c
ost s
ilver
exc
hang
e pl
anEf
fect
ive
actu
aria
l va
lue
Cost
sha
ring
Prem
ium
s
Tota
l (co
st
shar
ing
and
prem
ium
s)
Effe
ctiv
e ac
tuar
ial
valu
eCo
st s
harin
gPr
emiu
ms
Tota
l (co
st
shar
ing
and
prem
ium
s)N
ew J
erse
y10
0% –
–
–
89
%$1
60$3
98$5
59N
ew Y
ork
100
–
–
–
9663
433
496
Nor
th C
arol
ina
100
$4
–
$4
9212
539
251
8N
orth
Dak
ota
100
7
–
7
9112
839
852
6O
rego
nN
/AN
/AN
/AN
/A91
134
398
533
Penn
sylv
ania
100
–
–
–
9211
639
851
4So
uth
Dako
taN
/AN
/AN
/AN
/A87
189
398
588
Tenn
esse
e99
14
–
14
9015
639
855
4Te
xas
99 1
9 –
1
9 94
9239
849
0U
tah
97 5
1 $6
6 1
18
9310
439
850
2Vi
rgin
ia99
9
–
9
9113
039
852
8W
ashi
ngto
nN
/AN
/AN
/AN
/A88
180
398
578
Wes
t Virg
inia
99 1
8 –
1
8 92
117
398
515
Wis
cons
in99
9
–
9
9014
339
854
1W
yom
ing
99 1
9 –
1
9 90
143
398
541
Not
es: F
PL is
fede
ral p
over
ty le
vel.
N/A
indi
cate
s th
at s
tate
doe
s no
t off
er s
epar
ate
CHIP
cov
erag
e in
this
inco
me
rang
e. F
or th
is ta
ble,
chi
ldre
n ar
e m
odel
ed a
t 145
per
cent
FP
L, e
xcep
t for
New
Yor
k, w
hich
doe
s no
t off
er s
epar
ate
CHIP
at t
hat i
ncom
e le
vel a
nd w
as th
eref
ore
mod
eled
at t
he n
eare
st le
vel i
n its
sep
arat
e CH
IP e
ligib
ility
rang
e (1
49
perc
ent F
PL).
In 2
015,
145
per
cent
FPL
for a
fam
ily o
f fou
r was
$35
,163
in th
e 48
con
tiguo
us s
tate
s an
d th
e Di
stric
t of C
olum
bia.
Eff
ectiv
e ac
tuar
ial v
alue
is th
e pe
rcen
tage
of
cove
red
bene
fits
paid
for,
on a
vera
ge, b
y th
e pl
an fo
r the
par
ticul
ar g
roup
of c
hild
ren
in th
is a
naly
sis.
1 M
assa
chus
etts
fund
s ad
ditio
nal c
ost s
harin
g re
duct
ions
bey
ond
the
stan
dard
am
ount
s fo
r exc
hang
e co
vera
ge.
– D
ash
indi
cate
s th
e st
ate
does
not
requ
ire th
is ty
pe o
f out
-of-p
ocke
t spe
ndin
g.
Sour
ce: M
ACPA
C an
alys
is o
f res
ults
from
Act
uaria
l Res
earc
h Co
rpor
atio
n of
36
stat
es’ s
epar
ate
CHIP
pro
gram
s an
d th
e se
cond
low
est c
ost s
ilver
exc
hang
e pl
an in
thos
e st
ates
’ rat
ing
area
with
the
larg
est c
hild
pop
ulat
ion,
usi
ng 2
012
data
from
the
Hou
seho
ld C
ompo
nent
of t
he M
edic
al E
xpen
ditu
re P
anel
Sur
vey
adju
sted
to 2
015
leve
ls.
TABL
E 5A
-1. (
cont
inue
d)
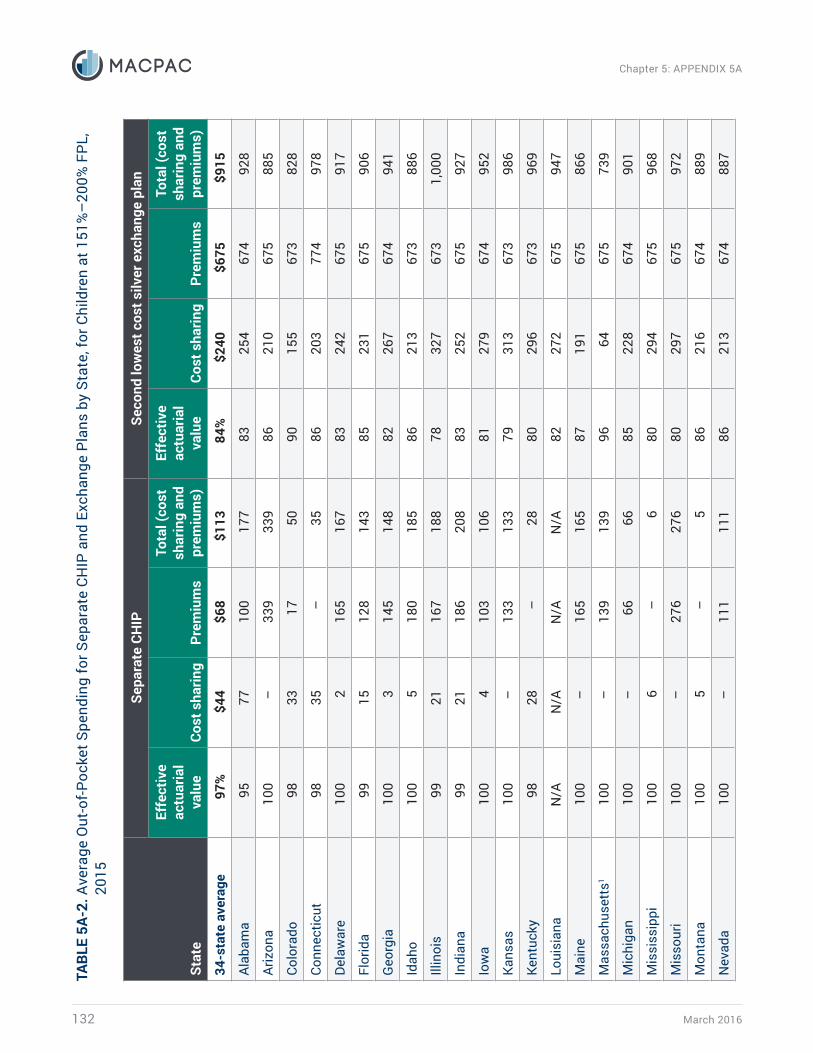
March 2016132
Chapter 5: APPENDIX 5ATA
BLE
5A-2
. Ave
rage
Out
-of-P
ocke
t Spe
ndin
g fo
r Sep
arat
e CH
IP a
nd E
xcha
nge
Plan
s by
Sta
te, f
or C
hild
ren
at 1
51%
–20
0% F
PL,
2015
Stat
e
Sepa
rate
CH
IPSe
cond
low
est c
ost s
ilver
exc
hang
e pl
an
Effe
ctiv
e ac
tuar
ial
valu
eCo
st s
harin
gPr
emiu
ms
Tota
l (co
st
shar
ing
and
prem
ium
s)
Effe
ctiv
e ac
tuar
ial
valu
eCo
st s
harin
gPr
emiu
ms
Tota
l (co
st
shar
ing
and
prem
ium
s)
34-s
tate
ave
rage
97%
$44
$68
$113
84
%$2
40
$675
$9
15
Alab
ama
95 7
7 1
00
177
83
254
674
928
Ariz
ona
100
–
339
3
39
8621
067
588
5
Colo
rado
98 3
3 1
7 5
0 90
155
673
828
Conn
ectic
ut98
35
–
35
8620
377
497
8
Dela
war
e10
0 2
1
65
167
83
242
675
917
Flor
ida
99 1
5 1
28
143
85
231
675
906
Geo
rgia
100
3
145
1
48
8226
767
494
1
Idah
o10
0 5
1
80
185
86
213
673
886
Illin
ois
99 2
1 1
67
188
78
327
673
1,00
0
Indi
ana
99 2
1 1
86
208
83
252
675
927
Iow
a10
0 4
1
03
106
81
279
674
952
Kans
as10
0 –
1
33
133
79
313
673
986
Kent
ucky
98 2
8 –
2
8 80
296
673
969
Loui
sian
aN
/AN
/AN
/AN
/A82
272
675
947
Mai
ne10
0 –
1
65
165
87
191
675
866
Mas
sach
uset
ts1
100
–
139
1
39
9664
675
739
Mic
higa
n10
0 –
6
6 6
6 85
228
674
901
Mis
siss
ippi
100
6
–
6
8029
467
596
8
Mis
sour
i10
0 –
2
76
276
80
297
675
972
Mon
tana
100
5
–
5
8621
667
488
9
Nev
ada
100
–
111
1
11
8621
367
488
7
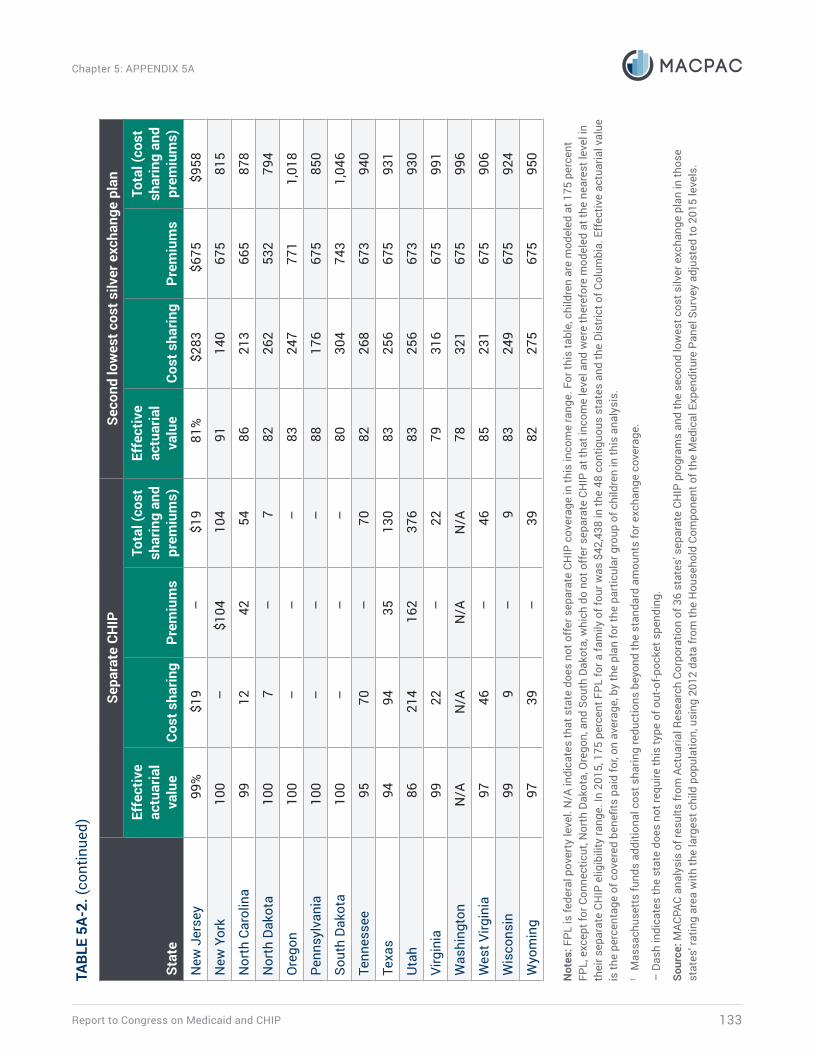
Report to Congress on Medicaid and CHIP 133
Chapter 5: APPENDIX 5A
Stat
e
Sepa
rate
CH
IPSe
cond
low
est c
ost s
ilver
exc
hang
e pl
an
Effe
ctiv
e ac
tuar
ial
valu
eCo
st s
harin
gPr
emiu
ms
Tota
l (co
st
shar
ing
and
prem
ium
s)
Effe
ctiv
e ac
tuar
ial
valu
eCo
st s
harin
gPr
emiu
ms
Tota
l (co
st
shar
ing
and
prem
ium
s)
New
Jer
sey
99%
$19
–
$1
9 81
%$2
83$6
75$9
58
New
Yor
k10
0 –
$1
04
104
91
140
675
815
Nor
th C
arol
ina
99 1
2 4
2 5
4 86
213
665
878
Nor
th D
akot
a10
0 7
–
7
82
262
532
794
Ore
gon
100
–
–
–
8324
777
11,
018
Penn
sylv
ania
100
–
–
–
8817
667
585
0
Sout
h Da
kota
100
–
–
–
8030
474
31,
046
Tenn
esse
e95
70
–
70
8226
867
394
0
Texa
s94
94
35
130
83
256
675
931
Uta
h86
214
1
62
376
83
256
673
930
Virg
inia
99 2
2 –
2
2 79
316
675
991
Was
hing
ton
N/A
N/A
N/A
N/A
7832
167
599
6
Wes
t Virg
inia
97 4
6 –
4
6 85
231
675
906
Wis
cons
in99
9
–
9
8324
967
592
4
Wyo
min
g97
39
–
39
8227
567
595
0
Not
es: F
PL is
fede
ral p
over
ty le
vel.
N/A
indi
cate
s th
at s
tate
doe
s no
t off
er s
epar
ate
CHIP
cov
erag
e in
this
inco
me
rang
e. F
or th
is ta
ble,
chi
ldre
n ar
e m
odel
ed a
t 175
per
cent
FP
L, e
xcep
t for
Con
nect
icut
, Nor
th D
akot
a, O
rego
n, a
nd S
outh
Dak
ota,
whi
ch d
o no
t off
er s
epar
ate
CHIP
at t
hat i
ncom
e le
vel a
nd w
ere
ther
efor
e m
odel
ed a
t the
nea
rest
leve
l in
thei
r sep
arat
e CH
IP e
ligib
ility
rang
e. In
201
5, 1
75 p
erce
nt F
PL fo
r a fa
mily
of f
our w
as $
42,4
38 in
the
48 c
ontig
uous
sta
tes
and
the
Dist
rict o
f Col
umbi
a. E
ffec
tive
actu
aria
l val
ue
is th
e pe
rcen
tage
of c
over
ed b
enefi
ts p
aid
for,
on a
vera
ge, b
y th
e pl
an fo
r the
par
ticul
ar g
roup
of c
hild
ren
in th
is a
naly
sis.
1 M
assa
chus
etts
fund
s ad
ditio
nal c
ost s
harin
g re
duct
ions
bey
ond
the
stan
dard
am
ount
s fo
r exc
hang
e co
vera
ge.
– D
ash
indi
cate
s th
e st
ate
does
not
requ
ire th
is ty
pe o
f out
-of-p
ocke
t spe
ndin
g.
Sour
ce: M
ACPA
C an
alys
is o
f res
ults
from
Act
uaria
l Res
earc
h Co
rpor
atio
n of
36
stat
es’ s
epar
ate
CHIP
pro
gram
s an
d th
e se
cond
low
est c
ost s
ilver
exc
hang
e pl
an in
thos
e st
ates
’ rat
ing
area
with
the
larg
est c
hild
pop
ulat
ion,
usi
ng 2
012
data
from
the
Hou
seho
ld C
ompo
nent
of t
he M
edic
al E
xpen
ditu
re P
anel
Sur
vey
adju
sted
to 2
015
leve
ls.
TABL
E 5A
-2. (
cont
inue
d)

March 2016134
Chapter 5: APPENDIX 5ATA
BLE
5A-3
. Ave
rage
Out
-of-P
ocke
t Spe
ndin
g fo
r Sep
arat
e CH
IP a
nd E
xcha
nge
Plan
s by
Sta
te, f
or C
hild
ren
at 2
01%
–25
0% F
PL,
2015
Stat
e
Sepa
rate
CH
IPSe
cond
low
est c
ost s
ilver
exc
hang
e pl
an
Effe
ctiv
e ac
tuar
ial
valu
eCo
st s
harin
gPr
emiu
ms
Tota
l (co
st
shar
ing
and
prem
ium
s)
Effe
ctiv
e ac
tuar
ial
valu
eCo
st s
harin
gPr
emiu
ms
Tota
l (co
st
shar
ing
and
prem
ium
s)
21-s
tate
ave
rage
99%
$14
$224
$2
38
75%
$373
$1
,176
$1
,550
Alab
ama
95 7
8 1
00
178
75
376
1,18
51,
561
Ariz
ona
N/A
N/A
N/A
N/A
7931
81,
193
1,51
1
Colo
rado
97 5
2 5
1 1
03
6256
41,
129
1,69
3
Conn
ectic
ut98
35
–
35
7931
81,
199
1,51
6
Dela
war
eN
/AN
/AN
/AN
/A73
385
1,19
21,
577
Flor
ida
N/A
N/A
N/A
N/A
7734
51,
190
1,53
4
Geo
rgia
100
321
021
376
355
1,18
31,
538
Idah
oN
/AN
/AN
/AN
/A74
394
1,12
61,
521
Illin
ois
98 3
6 4
12
447
68
476
1,13
81,
614
Indi
ana
99 2
1 3
19
341
72
418
1,19
61,
614
Iow
a10
0 4
2
05
209
69
440
1,17
61,
616
Kans
as10
0 –
3
32
332
79
317
1,14
31,
460
Kent
ucky
N/A
N/A
N/A
N/A
6650
71,
131
1,63
8
Loui
sian
a10
0 –
3
32
332
69
457
1,19
31,
650
Mai
neN
/AN
/AN
/AN
/A77
350
1,19
11,
541
Mas
sach
uset
ts1
100
–
231
2
31
9310
01,
190
1,29
0
Mic
higa
nN
/AN
/AN
/AN
/A84
237
1,16
61,
403
Mis
siss
ippi
N/A
N/A
N/A
N/A
7635
51,
189
1,54
4
Mis
sour
i10
0 –
8
97
897
76
352
1,19
01,
542
Mon
tana
100
5
–
5
7339
81,
170
1,56
9
Nev
ada
N/A
N/A
N/A
N/A
7636
31,
170
1,53
2

Report to Congress on Medicaid and CHIP 135
Chapter 5: APPENDIX 5A
Stat
e
Sepa
rate
CH
IPSe
cond
low
est c
ost s
ilver
exc
hang
e pl
an
Effe
ctiv
e ac
tuar
ial
valu
eCo
st s
harin
gPr
emiu
ms
Tota
l (co
st
shar
ing
and
prem
ium
s)
Effe
ctiv
e ac
tuar
ial
valu
eCo
st s
harin
gPr
emiu
ms
Tota
l (co
st
shar
ing
and
prem
ium
s)
New
Jer
sey
98%
$22
$287
$3
10
76%
$361
$1,1
95$1
,555
New
Yor
k10
0 –
1
73
173
79
315
1,20
11,
516
Nor
th C
arol
ina
N/A
N/A
N/A
N/A
7931
21,
176
1,48
8
Nor
th D
akot
aN
/AN
/AN
/AN
/A76
365
1,19
41,
558
Ore
gon
100
–
–
–
7143
51,
134
1,56
9
Penn
sylv
ania
100
–
522
5
22
7931
41,
188
1,50
2
Sout
h Da
kota
100
–
–
–
7537
396
61,
339
Tenn
esse
e95
71
–
71
7536
71,
108
1,47
5
Texa
sN
/AN
/AN
/AN
/A77
345
1,19
11,
535
Uta
hN
/AN
/AN
/AN
/A66
506
1,16
41,
670
Virg
inia
N/A
N/A
N/A
N/A
6355
41,
191
1,74
4
Was
hing
ton
100
–
206
2
06
6453
91,
193
1,73
2
Wes
t Virg
inia
96 6
1 3
61
422
73
400
1,19
21,
592
Wis
cons
in97
42
90
132
75
361
1,19
51,
556
Wyo
min
gN
/AN
/AN
/AN
/A75
366
1,20
01,
567
Not
es: F
PL is
fede
ral p
over
ty le
vel.
N/A
indi
cate
s th
at s
tate
doe
s no
t off
er s
epar
ate
CHIP
cov
erag
e in
this
inco
me
rang
e. F
or th
is ta
ble,
chi
ldre
n ar
e m
odel
ed a
t 225
per
cent
FP
L, e
xcep
t for
Sou
th D
akot
a, w
hich
doe
s no
t off
er s
epar
ate
CHIP
at t
hat i
ncom
e le
vel a
nd w
as th
eref
ore
mod
eled
at t
he n
eare
st le
vel i
n its
sep
arat
e CH
IP e
ligib
ility
rang
e (2
04
perc
ent F
PL).
In 2
015,
225
per
cent
FPL
for a
fam
ily o
f fou
r was
$54
,563
in th
e 48
con
tiguo
us s
tate
s an
d th
e Di
stric
t of C
olum
bia.
Add
ition
al v
aria
tion
betw
een
stat
es’ a
vera
ge
out-o
f-poc
ket p
rem
ium
for c
hild
rens
’ sub
sidi
zed
exch
ange
cov
erag
e re
sults
bec
ause
the
tota
l pre
miu
m a
s a
shar
e of
fam
ily in
com
e is
too
low
to q
ualif
y fo
r pre
miu
m s
ubsi
dies
. Ef
fect
ive
actu
aria
l val
ue is
the
perc
enta
ge o
f cov
ered
ben
efits
pai
d fo
r, on
ave
rage
, by
the
plan
for t
he p
artic
ular
gro
up o
f chi
ldre
n in
this
ana
lysi
s.1
Mas
sach
uset
ts fu
nds
addi
tiona
l cos
t sha
ring
redu
ctio
ns b
eyon
d th
e st
anda
rd a
mou
nts
for e
xcha
nge
cove
rage
.
– D
ash
indi
cate
s th
e st
ate
does
not
requ
ire th
is ty
pe o
f out
-of-p
ocke
t spe
ndin
g.
Sour
ce: M
ACPA
C an
alys
is o
f res
ults
from
Act
uaria
l Res
earc
h Co
rpor
atio
n of
36
stat
es’ s
epar
ate
CHIP
pro
gram
s an
d th
e se
cond
low
est c
ost s
ilver
exc
hang
e pl
an in
thos
e st
ates
’ rat
ing
area
with
the
larg
est c
hild
pop
ulat
ion,
usi
ng 2
012
data
from
the
Hou
seho
ld C
ompo
nent
of t
he M
edic
al E
xpen
ditu
re P
anel
Sur
vey
adju
sted
to 2
015
leve
ls.
TABL
E 5A
-3. (
cont
inue
d)

March 2016136
Chapter 5: APPENDIX 5ATA
BLE
5A-4
. Ave
rage
Out
-of-P
ocke
t Spe
ndin
g fo
r Sep
arat
e CH
IP a
nd E
xcha
nge
Plan
s by
Sta
te, f
or C
hild
ren
at 2
51%
–40
0% F
PL,
2015
Stat
e
Sepa
rate
CH
IPSe
cond
low
est c
ost s
ilver
exc
hang
e pl
an
Effe
ctiv
e ac
tuar
ial
valu
eCo
st s
harin
gPr
emiu
ms
Tota
l (co
st
shar
ing
and
prem
ium
s)
Effe
ctiv
e ac
tuar
ial
valu
eCo
st s
harin
gPr
emiu
ms
Tota
l (co
st
shar
ing
and
prem
ium
s)
13-s
tate
ave
rage
99%
$18
$455
$4
72
68%
$477
$1
,565
$2
,043
Alab
ama
95 7
9 1
00
179
59
611
1,50
02,
111
Ariz
ona
N/A
N/A
N/A
N/A
7340
31,
644
2,04
7
Colo
rado
N/A
N/A
N/A
N/A
5960
51,
247
1,85
2
Conn
ectic
ut97
40
272
3
13
7932
01,
770
2,09
0
Dela
war
eN
/AN
/AN
/AN
/A65
497
1,64
72,
144
Flor
ida
N/A
N/A
N/A
N/A
6945
51,
560
2,01
5
Geo
rgia
N/A
N/A
N/A
N/A
6650
01,
479
1,97
9
Idah
oN
/AN
/AN
/AN
/A70
441
1,24
21,
683
Illin
ois
98 3
6 4
12
447
70
445
1,27
21,
717
Indi
ana
N/A
N/A
N/A
N/A
6650
01,
713
2,21
3
Iow
a10
0 4
2
05
209
68
455
1,43
41,
889
Kans
asN
/AN
/AN
/AN
/A65
523
1,28
51,
808
Kent
ucky
N/A
N/A
N/A
N/A
6157
51,
253
1,82
7
Loui
sian
aN
/AN
/AN
/AN
/A59
611
1,63
32,
244
Mai
neN
/AN
/AN
/AN
/A68
483
1,58
82,
072
Mas
sach
uset
ts1
100
–
323
3
23
7241
21,
577
1,98
9
Mic
higa
nN
/AN
/AN
/AN
/A70
444
1,37
31,
817
Mis
siss
ippi
N/A
N/A
N/A
N/A
6650
41,
554
2,05
8
Mis
sour
i10
0 –
1
,586
1
,586
68
477
1,56
72,
045
Mon
tana
N/A
N/A
N/A
N/A
7044
11,
393
1,83
3
Nev
ada
N/A
N/A
N/A
N/A
6651
01,
390
1,90
0
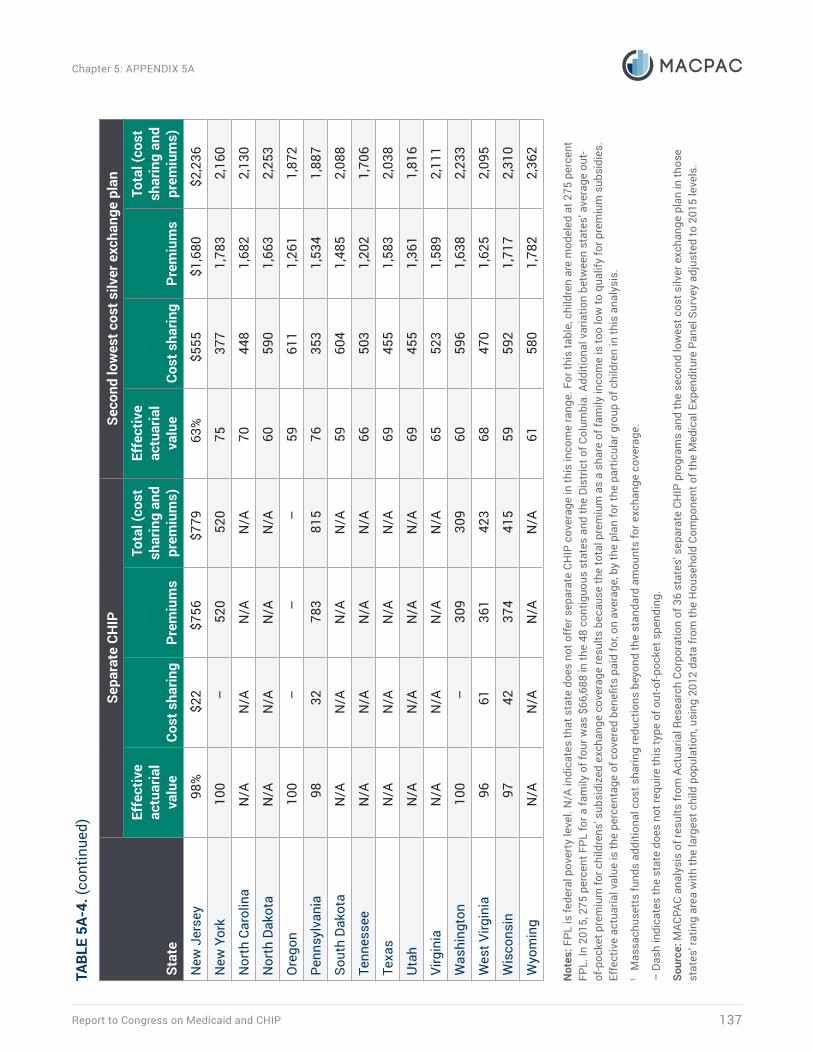
Report to Congress on Medicaid and CHIP 137
Chapter 5: APPENDIX 5A
Stat
e
Sepa
rate
CH
IPSe
cond
low
est c
ost s
ilver
exc
hang
e pl
an
Effe
ctiv
e ac
tuar
ial
valu
eCo
st s
harin
gPr
emiu
ms
Tota
l (co
st
shar
ing
and
prem
ium
s)
Effe
ctiv
e ac
tuar
ial
valu
eCo
st s
harin
gPr
emiu
ms
Tota
l (co
st
shar
ing
and
prem
ium
s)
New
Jer
sey
98%
$22
$756
$7
79
63%
$555
$1,6
80$2
,236
New
Yor
k10
0 –
5
20
520
75
377
1,78
32,
160
Nor
th C
arol
ina
N/A
N/A
N/A
N/A
7044
81,
682
2,13
0
Nor
th D
akot
aN
/AN
/AN
/AN
/A60
590
1,66
32,
253
Ore
gon
100
–
–
–
5961
11,
261
1,87
2
Penn
sylv
ania
98 3
2 7
83
815
76
353
1,53
41,
887
Sout
h Da
kota
N/A
N/A
N/A
N/A
5960
41,
485
2,08
8
Tenn
esse
eN
/AN
/AN
/AN
/A66
503
1,20
21,
706
Texa
sN
/AN
/AN
/AN
/A69
455
1,58
32,
038
Uta
hN
/AN
/AN
/AN
/A69
455
1,36
11,
816
Virg
inia
N/A
N/A
N/A
N/A
6552
31,
589
2,11
1
Was
hing
ton
100
–
309
3
09
6059
61,
638
2,23
3
Wes
t Virg
inia
96 6
1 3
61
423
68
470
1,62
52,
095
Wis
cons
in97
42
374
4
15
5959
21,
717
2,31
0
Wyo
min
gN
/AN
/AN
/AN
/A61
580
1,78
22,
362
Not
es: F
PL is
fede
ral p
over
ty le
vel.
N/A
indi
cate
s th
at s
tate
doe
s no
t off
er s
epar
ate
CHIP
cov
erag
e in
this
inco
me
rang
e. F
or th
is ta
ble,
chi
ldre
n ar
e m
odel
ed a
t 275
per
cent
FP
L. In
201
5, 2
75 p
erce
nt F
PL fo
r a fa
mily
of f
our w
as $
66,6
88 in
the
48 c
ontig
uous
sta
tes
and
the
Dist
rict o
f Col
umbi
a. A
dditi
onal
var
iatio
n be
twee
n st
ates
’ ave
rage
out
-of
-poc
ket p
rem
ium
for c
hild
rens
’ sub
sidi
zed
exch
ange
cov
erag
e re
sults
bec
ause
the
tota
l pre
miu
m a
s a
shar
e of
fam
ily in
com
e is
too
low
to q
ualif
y fo
r pre
miu
m s
ubsi
dies
. Ef
fect
ive
actu
aria
l val
ue is
the
perc
enta
ge o
f cov
ered
ben
efits
pai
d fo
r, on
ave
rage
, by
the
plan
for t
he p
artic
ular
gro
up o
f chi
ldre
n in
this
ana
lysi
s.1
Mas
sach
uset
ts fu
nds
addi
tiona
l cos
t sha
ring
redu
ctio
ns b
eyon
d th
e st
anda
rd a
mou
nts
for e
xcha
nge
cove
rage
.
– D
ash
indi
cate
s th
e st
ate
does
not
requ
ire th
is ty
pe o
f out
-of-p
ocke
t spe
ndin
g.
Sour
ce: M
ACPA
C an
alys
is o
f res
ults
from
Act
uaria
l Res
earc
h Co
rpor
atio
n of
36
stat
es’ s
epar
ate
CHIP
pro
gram
s an
d th
e se
cond
low
est c
ost s
ilver
exc
hang
e pl
an in
thos
e st
ates
’ rat
ing
area
with
the
larg
est c
hild
pop
ulat
ion,
usi
ng 2
012
data
from
the
Hou
seho
ld C
ompo
nent
of t
he M
edic
al E
xpen
ditu
re P
anel
Sur
vey
adju
sted
to 2
015
leve
ls.
TABL
E 5A
-4. (
cont
inue
d)
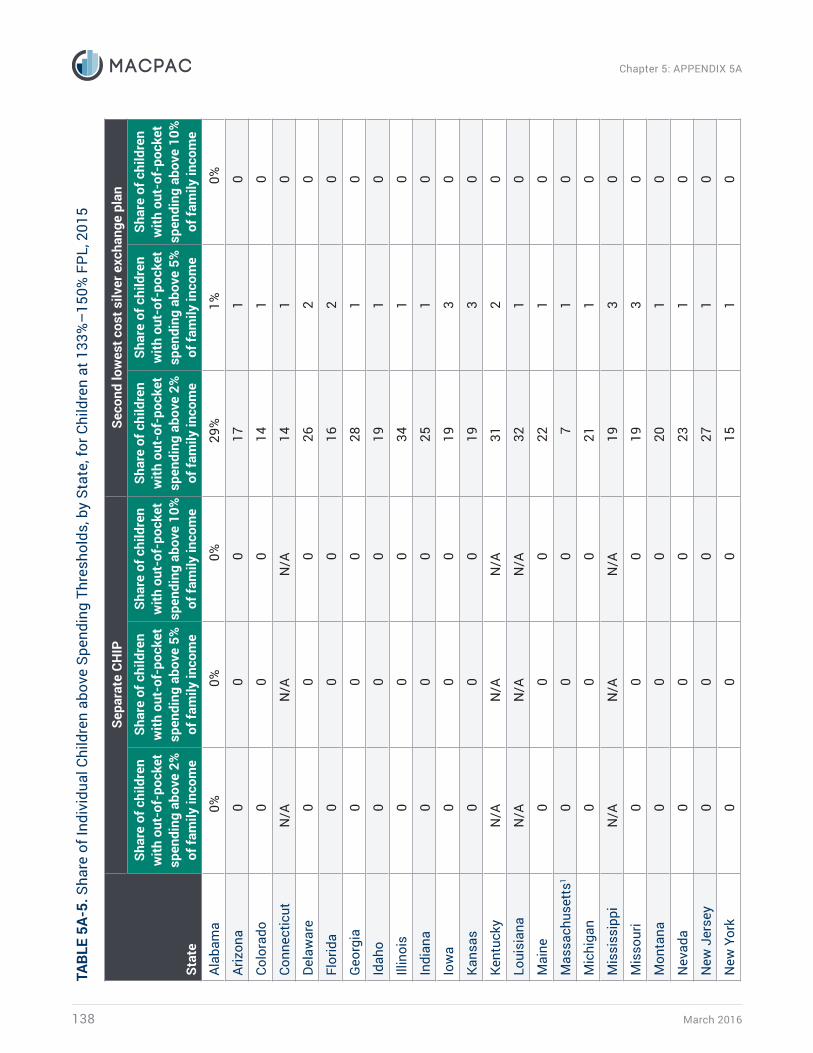
March 2016138
Chapter 5: APPENDIX 5ATA
BLE
5A-5
. Sha
re o
f Ind
ivid
ual C
hild
ren
abov
e Sp
endi
ng T
hres
hold
s, b
y St
ate,
for C
hild
ren
at 1
33%
–15
0% F
PL, 2
015
Stat
e
Sepa
rate
CH
IPSe
cond
low
est c
ost s
ilver
exc
hang
e pl
an
Shar
e of
chi
ldre
n w
ith o
ut-o
f-po
cket
sp
endi
ng a
bove
2%
of
fam
ily in
com
e
Shar
e of
chi
ldre
n w
ith o
ut-o
f-po
cket
sp
endi
ng a
bove
5%
of
fam
ily in
com
e
Shar
e of
chi
ldre
n w
ith o
ut-o
f-po
cket
sp
endi
ng a
bove
10%
of
fam
ily in
com
e
Shar
e of
chi
ldre
n w
ith o
ut-o
f-po
cket
sp
endi
ng a
bove
2%
of
fam
ily in
com
e
Shar
e of
chi
ldre
n w
ith o
ut-o
f-po
cket
sp
endi
ng a
bove
5%
of
fam
ily in
com
e
Shar
e of
chi
ldre
n w
ith o
ut-o
f-po
cket
sp
endi
ng a
bove
10%
of
fam
ily in
com
e
Alab
ama
0%0%
0%29
%1%
0%
Ariz
ona
00
017
10
Colo
rado
00
014
10
Conn
ectic
utN
/AN
/AN
/A14
10
Dela
war
e0
00
262
0
Flor
ida
00
016
20
Geo
rgia
00
028
10
Idah
o0
00
191
0
Illin
ois
00
034
10
Indi
ana
00
025
10
Iow
a0
00
193
0
Kans
as0
00
193
0
Kent
ucky
N/A
N/A
N/A
312
0
Loui
sian
aN
/AN
/AN
/A32
10
Mai
ne0
00
221
0
Mas
sach
uset
ts1
00
07
10
Mic
higa
n0
00
211
0
Mis
siss
ippi
N/A
N/A
N/A
193
0
Mis
sour
i0
00
193
0
Mon
tana
00
020
10
Nev
ada
00
023
10
New
Jer
sey
00
027
10
New
Yor
k0
00
151
0

Report to Congress on Medicaid and CHIP 139
Chapter 5: APPENDIX 5A
Stat
e
Sepa
rate
CH
IPSe
cond
low
est c
ost s
ilver
exc
hang
e pl
an
Shar
e of
chi
ldre
n w
ith o
ut-o
f-po
cket
sp
endi
ng a
bove
2%
of
fam
ily in
com
e
Shar
e of
chi
ldre
n w
ith o
ut-o
f-po
cket
sp
endi
ng a
bove
5%
of
fam
ily in
com
e
Shar
e of
chi
ldre
n w
ith o
ut-o
f-po
cket
sp
endi
ng a
bove
10%
of
fam
ily in
com
e
Shar
e of
chi
ldre
n w
ith o
ut-o
f-po
cket
sp
endi
ng a
bove
2%
of
fam
ily in
com
e
Shar
e of
chi
ldre
n w
ith o
ut-o
f-po
cket
sp
endi
ng a
bove
5%
of
fam
ily in
com
e
Shar
e of
chi
ldre
n w
ith o
ut-o
f-po
cket
sp
endi
ng a
bove
10%
of
fam
ily in
com
e
Nor
th C
arol
ina
0%0%
0%19
%2%
0%
Nor
th D
akot
a0
00
202
0
Ore
gon
N/A
N/A
N/A
261
0
Penn
sylv
ania
00
020
10
Sout
h Da
kota
N/A
N/A
N/A
341
0
Tenn
esse
e0
00
291
0
Texa
s0
00
152
0
Uta
h1
00
162
0
Virg
inia
00
019
30
Was
hing
ton
N/A
N/A
N/A
311
0
Wes
t Virg
inia
00
022
10
Wis
cons
in0
00
221
0
Wyo
min
g0
00
222
0
Not
es: F
PL is
fede
ral p
over
ty le
vel.
N/A
indi
cate
s th
at s
tate
doe
s no
t off
er s
epar
ate
CHIP
cov
erag
e in
this
inco
me
rang
e. In
201
5, 1
45 p
erce
nt F
PL fo
r a fa
mily
of f
our w
as
$35,
163
in th
e 48
con
tiguo
us s
tate
s an
d th
e Di
stric
t of C
olum
bia.
1 M
assa
chus
etts
fund
s ad
ditio
nal c
ost s
harin
g re
duct
ions
bey
ond
the
stan
dard
am
ount
s fo
r exc
hang
e co
vera
ge.
Sour
ce: M
ACPA
C an
alys
is o
f res
ults
from
Act
uaria
l Res
earc
h Co
rpor
atio
n of
36
stat
es’ s
epar
ate
CHIP
pro
gram
s an
d th
e se
cond
low
est c
ost s
ilver
exc
hang
e pl
an in
thos
e st
ates
’ rat
ing
area
with
the
larg
est c
hild
pop
ulat
ion,
usi
ng 2
012
data
from
the
Hou
seho
ld C
ompo
nent
of t
he M
edic
al E
xpen
ditu
re P
anel
Sur
vey
adju
sted
to 2
015
leve
ls.
TABL
E 5A
-5. (
cont
inue
d)

March 2016140
Chapter 5: APPENDIX 5ATA
BLE
5A-6
. Sha
re o
f Ind
ivid
ual C
hild
ren
abov
e Sp
endi
ng T
hres
hold
s, b
y St
ate,
for C
hild
ren
at 1
51%
–20
0% F
PL, 2
015
Stat
e
Sepa
rate
CH
IPSe
cond
low
est c
ost s
ilver
exc
hang
e pl
an
Shar
e of
chi
ldre
n w
ith o
ut-o
f-po
cket
sp
endi
ng a
bove
2%
of
fam
ily in
com
e
Shar
e of
chi
ldre
n w
ith o
ut-o
f-po
cket
sp
endi
ng a
bove
5%
of
fam
ily in
com
e
Shar
e of
chi
ldre
n w
ith o
ut-o
f-po
cket
sp
endi
ng a
bove
10%
of
fam
ily in
com
e
Shar
e of
chi
ldre
n w
ith o
ut-o
f-po
cket
sp
endi
ng a
bove
2%
of
fam
ily in
com
e
Shar
e of
chi
ldre
n w
ith o
ut-o
f-po
cket
sp
endi
ng a
bove
5%
of
fam
ily in
com
e
Shar
e of
chi
ldre
n w
ith o
ut-o
f-po
cket
sp
endi
ng a
bove
10%
of
fam
ily in
com
e
Alab
ama
2%0%
0%46
%5%
0%
Ariz
ona
10
044
40
Colo
rado
00
040
20
Conn
ectic
ut0
00
484
0
Dela
war
e0
00
435
0
Flor
ida
00
043
51
Geo
rgia
00
045
60
Idah
o0
00
425
0
Illin
ois
00
050
70
Indi
ana
10
044
60
Iow
a0
00
458
0
Kans
as0
00
479
1
Kent
ucky
00
047
70
Loui
sian
aN
/AN
/AN
/A48
60
Mai
ne0
00
405
0
Mas
sach
uset
ts1
00
032
10
Mic
higa
n0
00
444
0
Mis
siss
ippi
00
051
60
Mis
sour
i0
00
459
0
Mon
tana
00
043
50
Nev
ada
00
043
40
New
Jer
sey
00
052
51
New
Yor
k0
00
392
0
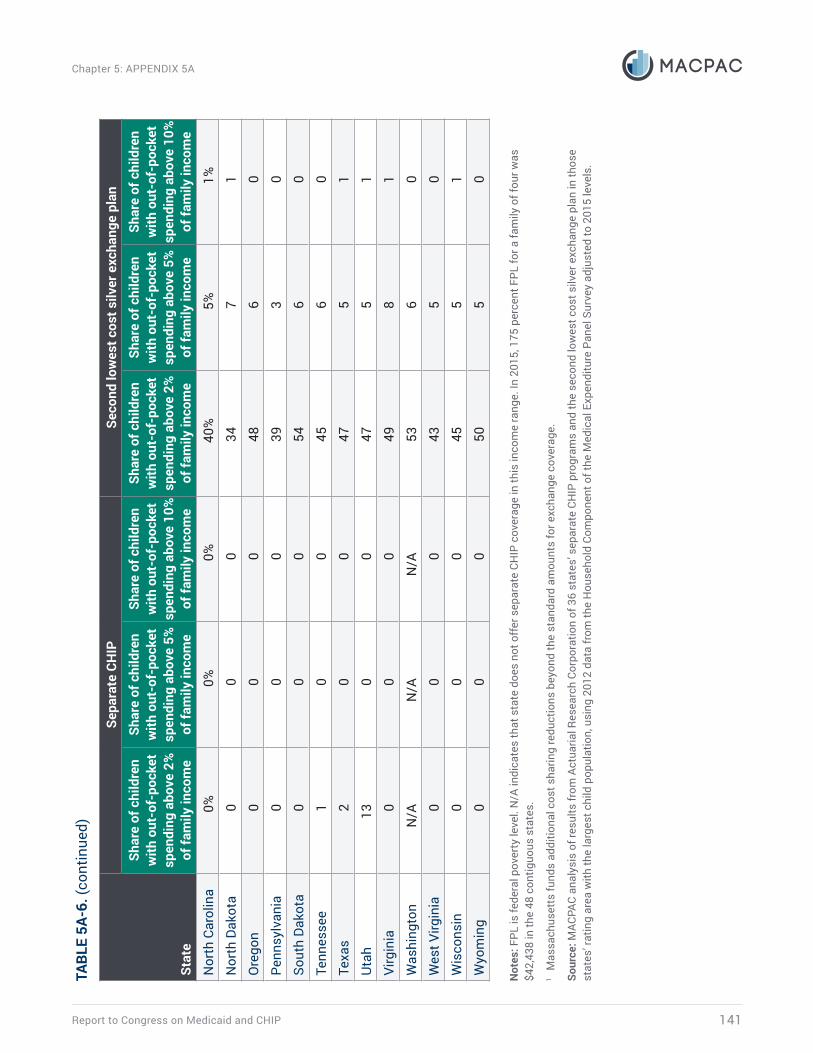
Report to Congress on Medicaid and CHIP 141
Chapter 5: APPENDIX 5A
Stat
e
Sepa
rate
CH
IPSe
cond
low
est c
ost s
ilver
exc
hang
e pl
an
Shar
e of
chi
ldre
n w
ith o
ut-o
f-po
cket
sp
endi
ng a
bove
2%
of
fam
ily in
com
e
Shar
e of
chi
ldre
n w
ith o
ut-o
f-po
cket
sp
endi
ng a
bove
5%
of
fam
ily in
com
e
Shar
e of
chi
ldre
n w
ith o
ut-o
f-po
cket
sp
endi
ng a
bove
10%
of
fam
ily in
com
e
Shar
e of
chi
ldre
n w
ith o
ut-o
f-po
cket
sp
endi
ng a
bove
2%
of
fam
ily in
com
e
Shar
e of
chi
ldre
n w
ith o
ut-o
f-po
cket
sp
endi
ng a
bove
5%
of
fam
ily in
com
e
Shar
e of
chi
ldre
n w
ith o
ut-o
f-po
cket
sp
endi
ng a
bove
10%
of
fam
ily in
com
e
Nor
th C
arol
ina
0%0%
0%40
%5%
1%
Nor
th D
akot
a0
00
347
1
Ore
gon
00
048
60
Penn
sylv
ania
00
039
30
Sout
h Da
kota
00
054
60
Tenn
esse
e1
00
456
0
Texa
s2
00
475
1
Uta
h13
00
475
1
Virg
inia
00
049
81
Was
hing
ton
N/A
N/A
N/A
536
0
Wes
t Virg
inia
00
043
50
Wis
cons
in0
00
455
1
Wyo
min
g0
00
505
0
Not
es: F
PL is
fede
ral p
over
ty le
vel.
N/A
indi
cate
s th
at s
tate
doe
s no
t off
er s
epar
ate
CHIP
cov
erag
e in
this
inco
me
rang
e. In
201
5, 1
75 p
erce
nt F
PL fo
r a fa
mily
of f
our w
as
$42,
438
in th
e 48
con
tiguo
us s
tate
s.1
Mas
sach
uset
ts fu
nds
addi
tiona
l cos
t sha
ring
redu
ctio
ns b
eyon
d th
e st
anda
rd a
mou
nts
for e
xcha
nge
cove
rage
.
Sour
ce: M
ACPA
C an
alys
is o
f res
ults
from
Act
uaria
l Res
earc
h Co
rpor
atio
n of
36
stat
es’ s
epar
ate
CHIP
pro
gram
s an
d th
e se
cond
low
est c
ost s
ilver
exc
hang
e pl
an in
thos
e st
ates
’ rat
ing
area
with
the
larg
est c
hild
pop
ulat
ion,
usi
ng 2
012
data
from
the
Hou
seho
ld C
ompo
nent
of t
he M
edic
al E
xpen
ditu
re P
anel
Sur
vey
adju
sted
to 2
015
leve
ls.
TABL
E 5A
-6. (
cont
inue
d)

March 2016142
Chapter 5: APPENDIX 5ATA
BLE
5A-7
. Sha
re o
f Ind
ivid
ual C
hild
ren
abov
e Sp
endi
ng T
hres
hold
s, b
y St
ate,
for C
hild
ren
at 2
01%
–25
0% F
PL, 2
015
Stat
e
Sepa
rate
CH
IPSe
cond
low
est c
ost s
ilver
exc
hang
e pl
an
Shar
e of
chi
ldre
n w
ith o
ut-o
f-po
cket
sp
endi
ng a
bove
2%
of
fam
ily in
com
e
Shar
e of
chi
ldre
n w
ith o
ut-o
f-po
cket
sp
endi
ng a
bove
5%
of
fam
ily in
com
e
Shar
e of
chi
ldre
n w
ith o
ut-o
f-po
cket
sp
endi
ng a
bove
10%
of
fam
ily in
com
e
Shar
e of
chi
ldre
n w
ith o
ut-o
f-po
cket
sp
endi
ng a
bove
2%
of
fam
ily in
com
e
Shar
e of
chi
ldre
n w
ith o
ut-o
f-po
cket
sp
endi
ng a
bove
5%
of
fam
ily in
com
e
Shar
e of
chi
ldre
n w
ith o
ut-o
f-po
cket
sp
endi
ng a
bove
10%
of
fam
ily in
com
e
Alab
ama
1%0%
0%67
%12
%2%
Ariz
ona
N/A
N/A
N/A
679
1
Colo
rado
10
072
152
Conn
ectic
ut0
00
719
1
Dela
war
eN
/AN
/AN
/A67
112
Flor
ida
N/A
N/A
N/A
669
2
Geo
rgia
00
066
102
Idah
oN
/AN
/AN
/A68
102
Illin
ois
10
071
103
Indi
ana
10
072
112
Iow
a0
00
7011
2
Kans
as1
00
658
1
Kent
ucky
N/A
N/A
N/A
6713
3
Loui
sian
a1
00
7214
2
Mai
neN
/AN
/AN
/A66
92
Mas
sach
uset
ts1
00
063
20
Mic
higa
nN
/AN
/AN
/A63
61
Mis
siss
ippi
N/A
N/A
N/A
6710
2
Mis
sour
i13
00
669
2
Mon
tana
00
069
112
Nev
ada
N/A
N/A
N/A
6610
2
New
Jer
sey
10
068
112
New
Yor
k0
00
719
1
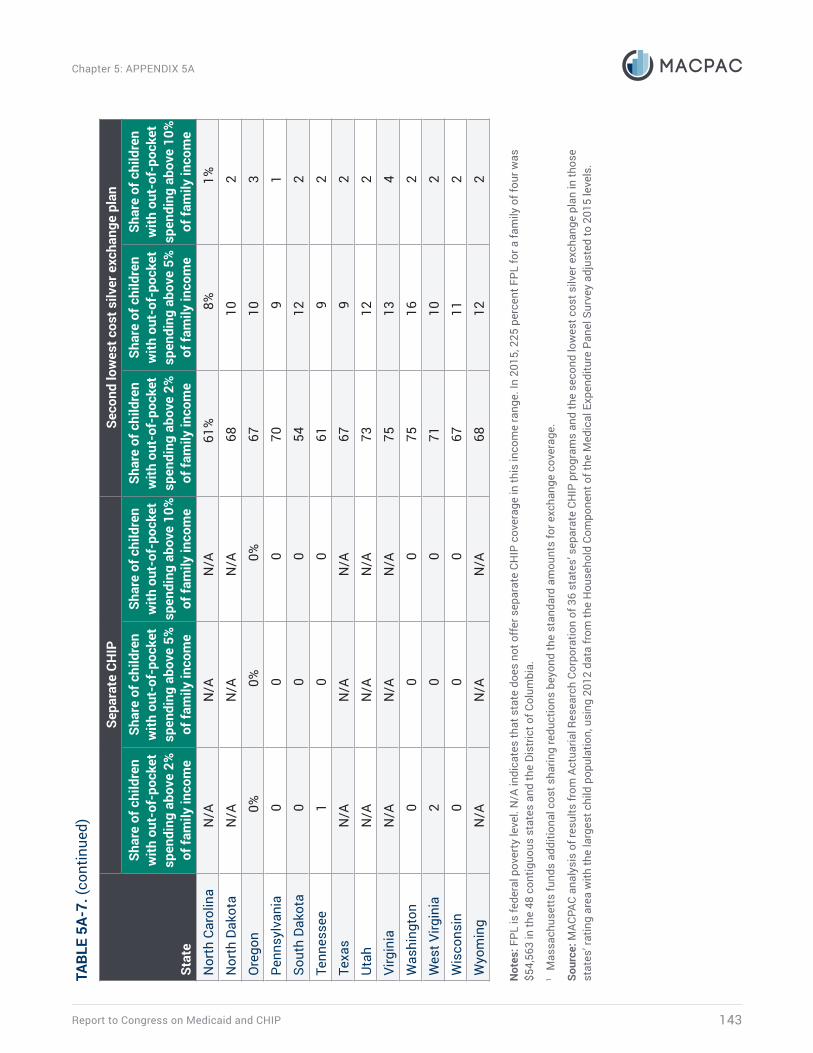
Report to Congress on Medicaid and CHIP 143
Chapter 5: APPENDIX 5A
Stat
e
Sepa
rate
CH
IPSe
cond
low
est c
ost s
ilver
exc
hang
e pl
an
Shar
e of
chi
ldre
n w
ith o
ut-o
f-po
cket
sp
endi
ng a
bove
2%
of
fam
ily in
com
e
Shar
e of
chi
ldre
n w
ith o
ut-o
f-po
cket
sp
endi
ng a
bove
5%
of
fam
ily in
com
e
Shar
e of
chi
ldre
n w
ith o
ut-o
f-po
cket
sp
endi
ng a
bove
10%
of
fam
ily in
com
e
Shar
e of
chi
ldre
n w
ith o
ut-o
f-po
cket
sp
endi
ng a
bove
2%
of
fam
ily in
com
e
Shar
e of
chi
ldre
n w
ith o
ut-o
f-po
cket
sp
endi
ng a
bove
5%
of
fam
ily in
com
e
Shar
e of
chi
ldre
n w
ith o
ut-o
f-po
cket
sp
endi
ng a
bove
10%
of
fam
ily in
com
e
Nor
th C
arol
ina
N/A
N/A
N/A
61%
8%1%
Nor
th D
akot
aN
/AN
/AN
/A68
102
Ore
gon
0%0%
0%67
103
Penn
sylv
ania
00
070
91
Sout
h Da
kota
00
054
122
Tenn
esse
e1
00
619
2
Texa
sN
/AN
/AN
/A67
92
Uta
hN
/AN
/AN
/A73
122
Virg
inia
N/A
N/A
N/A
7513
4
Was
hing
ton
00
075
162
Wes
t Virg
inia
20
071
102
Wis
cons
in0
00
6711
2
Wyo
min
gN
/AN
/AN
/A68
122
Not
es: F
PL is
fede
ral p
over
ty le
vel.
N/A
indi
cate
s th
at s
tate
doe
s no
t off
er s
epar
ate
CHIP
cov
erag
e in
this
inco
me
rang
e. In
201
5, 2
25 p
erce
nt F
PL fo
r a fa
mily
of f
our w
as
$54,
563
in th
e 48
con
tiguo
us s
tate
s an
d th
e Di
stric
t of C
olum
bia.
1 M
assa
chus
etts
fund
s ad
ditio
nal c
ost s
harin
g re
duct
ions
bey
ond
the
stan
dard
am
ount
s fo
r exc
hang
e co
vera
ge.
Sour
ce: M
ACPA
C an
alys
is o
f res
ults
from
Act
uaria
l Res
earc
h Co
rpor
atio
n of
36
stat
es’ s
epar
ate
CHIP
pro
gram
s an
d th
e se
cond
low
est c
ost s
ilver
exc
hang
e pl
an in
thos
e st
ates
’ rat
ing
area
with
the
larg
est c
hild
pop
ulat
ion,
usi
ng 2
012
data
from
the
Hou
seho
ld C
ompo
nent
of t
he M
edic
al E
xpen
ditu
re P
anel
Sur
vey
adju
sted
to 2
015
leve
ls.
TABL
E 5A
-7. (
cont
inue
d)

March 2016144
Chapter 5: APPENDIX 5ATA
BLE
5A-8
. Sha
re o
f Ind
ivid
ual C
hild
ren
abov
e Sp
endi
ng T
hres
hold
s, b
y St
ate,
for C
hild
ren
at 2
51%
–40
0% F
PL, 2
015
Stat
e
Sepa
rate
CH
IPSe
cond
low
est c
ost s
ilver
exc
hang
e pl
an
Shar
e of
chi
ldre
n w
ith o
ut-o
f-po
cket
sp
endi
ng a
bove
2%
of
fam
ily in
com
e
Shar
e of
chi
ldre
n w
ith o
ut-o
f-po
cket
sp
endi
ng a
bove
5%
of
fam
ily in
com
e
Shar
e of
chi
ldre
n w
ith o
ut-o
f-po
cket
sp
endi
ng a
bove
10%
of
fam
ily in
com
e
Shar
e of
chi
ldre
n w
ith o
ut-o
f-po
cket
sp
endi
ng a
bove
2%
of
fam
ily in
com
e
Shar
e of
chi
ldre
n w
ith o
ut-o
f-po
cket
sp
endi
ng a
bove
5%
of
fam
ily in
com
e
Shar
e of
chi
ldre
n w
ith o
ut-o
f-po
cket
sp
endi
ng a
bove
10%
of
fam
ily in
com
e
Alab
ama
1%0%
0%81
%14
%2%
Ariz
ona
N/A
N/A
N/A
8910
2
Colo
rado
N/A
N/A
N/A
6313
1
Conn
ectic
ut0
00
9412
1
Dela
war
eN
/AN
/AN
/A92
122
Flor
ida
N/A
N/A
N/A
8710
2
Geo
rgia
N/A
N/A
N/A
7810
2
Idah
oN
/AN
/AN
/A56
82
Illin
ois
10
059
82
Indi
ana
N/A
N/A
N/A
9213
2
Iow
a0
00
749
2
Kans
asN
/AN
/AN
/A62
102
Kent
ucky
N/A
N/A
N/A
5811
3
Loui
sian
aN
/AN
/AN
/A89
162
Mai
neN
/AN
/AN
/A86
103
Mas
sach
uset
ts1
00
087
102
Mic
higa
nN
/AN
/AN
/A73
92
Mis
siss
ippi
N/A
N/A
N/A
8711
2
Mis
sour
i66
00
8610
3
Mon
tana
N/A
N/A
N/A
748
2
Nev
ada
N/A
N/A
N/A
759
3
New
Jer
sey
250
092
152
New
Yor
k0
00
9413
2

Report to Congress on Medicaid and CHIP 145
Chapter 5: APPENDIX 5A
Stat
e
Sepa
rate
CH
IPSe
cond
low
est c
ost s
ilver
exc
hang
e pl
an
Shar
e of
chi
ldre
n w
ith o
ut-o
f-po
cket
sp
endi
ng a
bove
2%
of
fam
ily in
com
e
Shar
e of
chi
ldre
n w
ith o
ut-o
f-po
cket
sp
endi
ng a
bove
5%
of
fam
ily in
com
e
Shar
e of
chi
ldre
n w
ith o
ut-o
f-po
cket
sp
endi
ng a
bove
10%
of
fam
ily in
com
e
Shar
e of
chi
ldre
n w
ith o
ut-o
f-po
cket
sp
endi
ng a
bove
2%
of
fam
ily in
com
e
Shar
e of
chi
ldre
n w
ith o
ut-o
f-po
cket
sp
endi
ng a
bove
5%
of
fam
ily in
com
e
Shar
e of
chi
ldre
n w
ith o
ut-o
f-po
cket
sp
endi
ng a
bove
10%
of
fam
ily in
com
e
Nor
th C
arol
ina
N/A
N/A
N/A
90%
12%
2%
Nor
th D
akot
aN
/AN
/AN
/A93
153
Ore
gon
0%0%
0%63
113
Penn
sylv
ania
30
086
81
Sout
h Da
kota
N/A
N/A
N/A
8114
2
Tenn
esse
eN
/AN
/AN
/A54
92
Texa
sN
/AN
/AN
/A87
112
Uta
hN
/AN
/AN
/A74
92
Virg
inia
N/A
N/A
N/A
8711
3
Was
hing
ton
00
089
162
Wes
t Virg
inia
10
087
112
Wis
cons
in1
00
9317
2
Wyo
min
gN
/AN
/AN
/A94
202
Not
es: F
PL is
fede
ral p
over
ty le
vel.
N/A
indi
cate
s th
at s
tate
doe
s no
t off
er s
epar
ate
CHIP
cov
erag
e in
this
inco
me
rang
e. In
201
5, 2
75 p
erce
nt F
PL fo
r a fa
mily
of f
our w
as
$66,
688
in th
e 48
con
tiguo
us s
tate
s an
d th
e Di
stric
t of C
olum
bia.
1 M
assa
chus
etts
fund
s ad
ditio
nal c
ost s
harin
g re
duct
ions
bey
ond
the
stan
dard
am
ount
s fo
r exc
hang
e co
vera
ge.
Sour
ce: M
ACPA
C an
alys
is o
f res
ults
from
Act
uaria
l Res
earc
h Co
rpor
atio
n of
36
stat
es’ s
epar
ate
CHIP
pro
gram
s an
d th
e se
cond
low
est c
ost s
ilver
exc
hang
e pl
an in
thos
e st
ates
’ rat
ing
area
with
the
larg
est c
hild
pop
ulat
ion,
usi
ng 2
012
data
from
the
Hou
seho
ld C
ompo
nent
of t
he M
edic
al E
xpen
ditu
re P
anel
Sur
vey
adju
sted
to 2
015
leve
ls.
TABL
E 5A
-8. (
cont
inue
d)
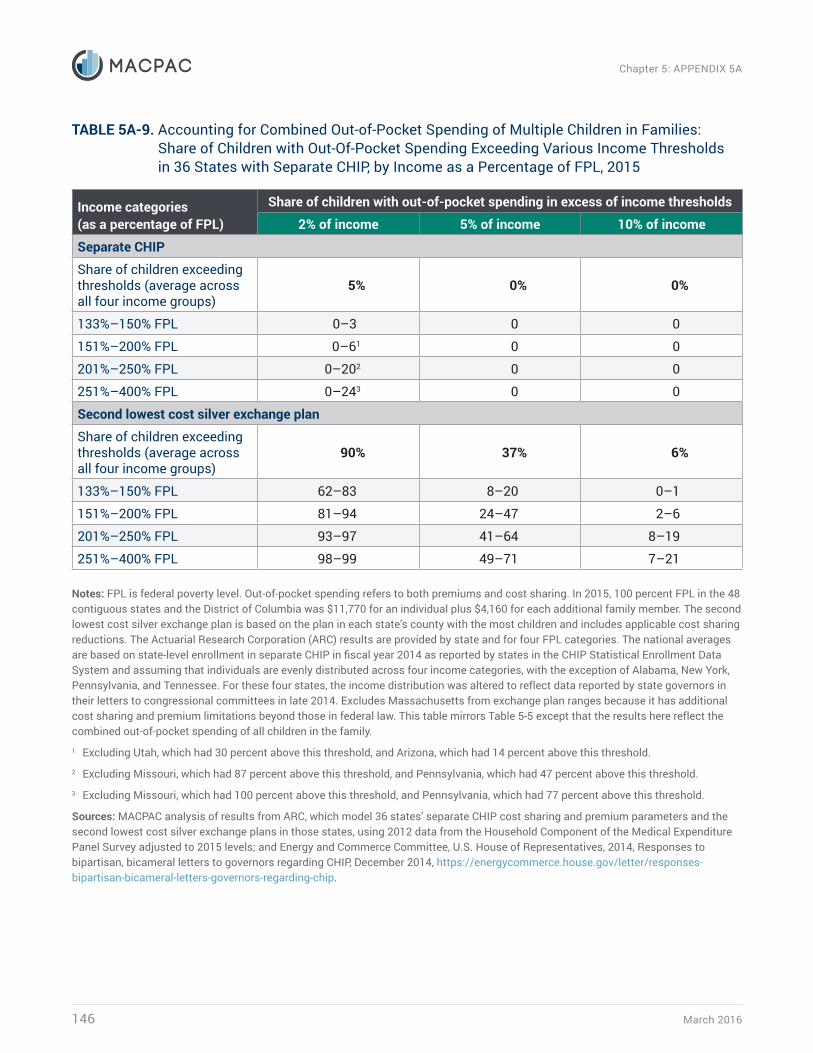
March 2016146
Chapter 5: APPENDIX 5A
TABLE 5A-9. Accounting for Combined Out-of-Pocket Spending of Multiple Children in Families: Share of Children with Out-Of-Pocket Spending Exceeding Various Income Thresholds in 36 States with Separate CHIP, by Income as a Percentage of FPL, 2015
Income categories (as a percentage of FPL)
Share of children with out-of-pocket spending in excess of income thresholds
2% of income 5% of income 10% of income
Separate CHIP
Share of children exceeding thresholds (average across all four income groups)
5% 0% 0%
133%–150% FPL 0–3 0 0
151%–200% FPL 0–61 0 0
201%–250% FPL 0–202 0 0
251%–400% FPL 0–243 0 0
Second lowest cost silver exchange plan
Share of children exceeding thresholds (average across all four income groups)
90% 37% 6%
133%–150% FPL 62–83 8–20 0–1
151%–200% FPL 81–94 24–47 2–6
201%–250% FPL 93–97 41–64 8–19
251%–400% FPL 98–99 49–71 7–21
Notes: FPL is federal poverty level. Out-of-pocket spending refers to both premiums and cost sharing. In 2015, 100 percent FPL in the 48 contiguous states and the District of Columbia was $11,770 for an individual plus $4,160 for each additional family member. The second lowest cost silver exchange plan is based on the plan in each state’s county with the most children and includes applicable cost sharing reductions. The Actuarial Research Corporation (ARC) results are provided by state and for four FPL categories. The national averages are based on state-level enrollment in separate CHIP in fiscal year 2014 as reported by states in the CHIP Statistical Enrollment Data System and assuming that individuals are evenly distributed across four income categories, with the exception of Alabama, New York, Pennsylvania, and Tennessee. For these four states, the income distribution was altered to reflect data reported by state governors in their letters to congressional committees in late 2014. Excludes Massachusetts from exchange plan ranges because it has additional cost sharing and premium limitations beyond those in federal law. This table mirrors Table 5-5 except that the results here reflect the combined out-of-pocket spending of all children in the family.1 Excluding Utah, which had 30 percent above this threshold, and Arizona, which had 14 percent above this threshold.2 Excluding Missouri, which had 87 percent above this threshold, and Pennsylvania, which had 47 percent above this threshold.3 Excluding Missouri, which had 100 percent above this threshold, and Pennsylvania, which had 77 percent above this threshold.
Sources: MACPAC analysis of results from ARC, which model 36 states’ separate CHIP cost sharing and premium parameters and the second lowest cost silver exchange plans in those states, using 2012 data from the Household Component of the Medical Expenditure Panel Survey adjusted to 2015 levels; and Energy and Commerce Committee, U.S. House of Representatives, 2014, Responses to bipartisan, bicameral letters to governors regarding CHIP, December 2014, https://energycommerce.house.gov/letter/responses-bipartisan-bicameral-letters-governors-regarding-chip.
Report to Congress on Medicaid and CHIP 147
Chapter 5: APPENDIX 5B
APPENDIX 5B: Data Sources and Assumptions for Modeling Children’s Out-of-Pocket SpendingThis appendix describes the sources of data used by MACPAC and the Actuarial Research Corporation (ARC) to produce the results discussed in this chapter. This appendix also describes our modeling approach and some limitations because some results may vary under different modeling assumptions.
Data SourcesThis analysis relies on the Household Component of the 2012 Medical Expenditure Panel Survey (MEPS). MEPS is a nationally representative survey of the U.S. non-institutionalized civilian population administered by the Agency for Healthcare Research and Quality. MEPS contains detailed person- and family-level demographic and income information, as well as information about medical spending and utilization by type of service. Income and medical spending were adjusted to 2015 levels.
The state-specific cost sharing and premium parameters for State Children’s Health Insurance Program (CHIP) and exchange plans come from publicly available sources. For separate CHIP plans, ARC generally relied on premium and cost sharing specifications approved through CHIP state plans through 2013 (Cardwell et al. 2014, Heberlein et al. 2013).
For exchange plans, MACPAC provided ARC with plan parameters for each state’s second lowest cost silver exchange plan in the rating area with the highest child population. The second lowest cost silver plans were used because they are the basis for calculating individuals’ premium tax credits.
The exchange plan parameters were obtained from two publicly available datasets—one on the premiums and cost sharing parameters of all silver exchange plans and another on the effects of the statutorily required cost sharing reductions on those plans (Breakaway Policy Strategies 2015). MACPAC determined each state’s most populous rating area based on the definitions of the rating areas posted by the federal government and from county-level child population estimates from the U.S. Census Bureau (CMS 2014, U.S. Census Bureau 2015).
Modeling ApproachTo provide results that were comparable across states and plans, a standardized population of children from MEPS was run through each state’s separate CHIP and exchange plan parameters. Five different populations of children in MEPS were assessed in an attempt to balance the trade-offs of being broad enough to obtain adequate sample size but narrow enough to represent children in the typical CHIP income range. Ultimately, we selected a sample of children age 1–18 with income of 138 percent through 400 percent of the federal poverty level (FPL) and infants (age 0) with income of 188 percent through 400 percent FPL. This provided a sample of 3,926 children to represent approximately 30 million children, the largest sample of the five populations tested. The other samples, including one that varied based on each state’s CHIP eligibility levels, were smaller and displayed differences that were affected more by the smaller sample sizes than by plan parameters.
Income assumptionsIncome as a percentage of FPL is the primary characteristic that determines the cost sharing families will face in exchange plans and in separate CHIP in many states. The typical silver exchange plan has an actuarial value of 70 percent. This means that, on average across a standard
March 2016148
Chapter 5: APPENDIX 5B
population, the plan is expected to pay for 70 percent of spending on covered benefits, with enrollees covering the other 30 percent in cost sharing. Cost sharing reductions are available for those with income at or below 250 percent FPL, with required actuarial values as follows:
• 94 percent for those at or below 150 percent FPL;
• 87 percent for those at 151 percent through 200 percent FPL;
• 73 percent for those at 201 percent through 250 percent FPL; and
• 70 percent for those above 250 percent FPL.
In the 36 states that offer separate CHIP for children age 0–18, the entire sample of 3,926 children’s records was run through the second lowest cost silver exchange plan four times—once for each of the four income categories—because the cost sharing differs substantially in each. Each state’s CHIP cost sharing parameters were then associated with the same four income categories that aligned most closely by FPL. Then the entire sample of children’s records was run through as many of the four income categories as appropriate depending on the CHIP eligibility range in the state. For each of the four income categories, children were generally assigned to the following family income levels:1
• For the category of at or below 150 percent FPL, children’s income was modeled at 145 percent FPL;
• For the category of 151 percent through 200 percent FPL, children’s income was modeled at 175 percent FPL;
• For the category of 201 percent through 250 percent FPL, children’s income was modeled at 225 percent FPL; and
• For the category of above 250 percent FPL, children’s income was modeled at 275 percent FPL.
These assumptions ensured the largest sample of children that would be standardized across the income categories so that differences in the results would be driven by the plan parameters rather than the differing samples or incomes.
Premium assumptionsFor this analysis, another challenge was deciding what portion of a family’s total out-of-pocket exchange premiums to assign to the child. Premium tax credits for a family’s exchange coverage begin once their contribution to premiums reaches certain thresholds—for example, 3.02 percent of income for a family at 133 percent FPL, and 9.56 percent of income for a family at 301 percent through 400 percent FPL in 2015. On the one hand, if one assumes parents are already enrolled in exchange coverage and receiving premium tax credits because the required premium contribution has been reached, then no additional premium contribution would be required from the family to add a child. On the other hand, if no one is enrolled in exchange coverage, then covering the entire family, or only the child, would require the full premium contribution. Obviously, the findings resulting from assigning to the child none of the required out-of-pocket premiums will differ dramatically from findings resulting from assigning to the child all of the required out-of-pocket premiums. This is why in MACPAC’s prior work, we provided estimates under both assumptions (MACPAC 2015).
In this analysis, we use a different approach. We assume all family members are enrolled in exchange coverage because prior research found that few children would be enrolled in exchange coverage without a parent; generally, either all family members would be enrolled or none would be (MACPAC 2015). We also assume that the child’s share of the family’s premium contribution is the same as the child’s share of the total family premium.
Report to Congress on Medicaid and CHIP 149
Chapter 5: APPENDIX 5B
For example, a parent and a child (a family of two) could face unsubsidized exchange premiums of $4,100, the sum of the parent’s premiums of $2,550 and the child’s premiums of $1,550 (or 38 percent of the total). If this family’s income is at 225 percent FPL, then their premium contribution is 7.22 percent of their income, or $2,588, for the premiums of the second lowest cost silver plan. For this analysis, then, we attributed 38 percent of the $2,588 required contribution, or $978, to the child. This assigned a share of the premium to the child based on the family’s total premium contribution, without facing either extreme case of the child’s share being all or none of the premium.
Thresholds for out-of-pocket spendingFor the share of children exceeding various out-of-pocket spending levels, three thresholds were used: 2 percent of family income, 5 percent of family income, and 10 percent of family income. Two percent of family income was included to provide a comparison group representing children with modest out-of-pocket spending. Five percent of income was used because it is the ceiling for out-of-pocket spending in both CHIP and Medicaid. Ten percent of family income was used because it is a common threshold in the research literature to connote a high family burden (Banthin 2011, Cunningham and Carrier 2014).2
LimitationsAs with all such modeling efforts, there are limitations that could affect the results. For example:
• We model children’s enrollment into the second lowest cost silver plan in the state’s rating area with the greatest child population. However, children may enroll in a plan other than the second lowest cost silver plan, and in a different rating area where the premium and cost sharing parameters differ from those modeled.
• The model includes spending and utilization for a standard medical benefit package, limited to hospital, physician, and other professional services, as well as prescription drugs. Thus, it does not capture differences between separate CHIP and exchange coverage in spending on dental, vision, or certain other benefits (e.g., home health).
• Children who are actually enrolled in separate CHIP may differ, particularly in each state, from the nationally representative sample used for this analysis. For example, low- and moderate-income children in some states may be healthier and use less health care than in other states.
• The CHIP premium and cost sharing levels by FPL are based primarily on CHIP state plan amendments (SPAs) approved through 2013 (Cardwell et al. 2014). Because these reflect FPLs prior to the 2014 conversion to modified adjusted gross income (MAGI), the income categories align well with those used in this analysis. However, our results might have been different if we had included CHIP SPAs approved since 2013 that reflect MAGI conversion and any changes in CHIP premiums and cost sharing. However, we believe that given the limited changes states tend to make in CHIP cost sharing, any effects would be relatively small. In addition, a state’s ability to increase premiums is limited by the maintenance of effort currently in effect for children’s Medicaid and CHIP coverage. Only limited inflation-related adjustments to premiums are permitted (CMS 2011).
• The model’s results reflect the application of broad cost sharing parameters to categories of covered services, such as prescription drugs and visits to physicians for preventive services. The results may not reflect more detailed cost sharing policies on specific types of covered services.
March 2016150
Chapter 5: APPENDIX 5B
Endnotes1 Exceptions were if the state did not include these particular points in its CHIP eligibility range. For example, if a state’s CHIP eligibility only went up to 220 percent FPL, then children’s income for the 201 percent through 250 percent FPL category would be modeled at 220 percent FPL rather than 225 percent FPL. These differences did not substantially affect the results.
2 Some research also uses 20 percent of family income as a threshold for assessing affordability (Banthin 2011). We do not use such a high threshold because so few children would exceed it. One reason so few would exceed it is because, unlike much of the research, our analysis is not assessing the spending for all family members but only for individual children. This was done so that our assessment of the characteristics of children with high out-of-pocket spending would reflect each child’s own health care needs. Although including all family members’ coverage would provide a more comprehensive assessment of the family’s affordability picture in exchange coverage, this was not the purpose of our analysis. For broad comparison’s sake, however, we include an analysis of the share of children exceeding the out-of-pocket spending thresholds taking into account the combined out-of-pocket spending from all the children in the family (Appendix 5A, Table 5A-9).
ReferencesBanthin, J.S. 2011. High out of pocket financial burdens for health care. Presentation before the Institute of Medicine’s Essential Health Benefits Committee, March 2, 2011, Washington, DC. https://iom.nationalacademies.org/~/media/91EC52F4D5B045D8812068751415E7DE.ashx.
Breakaway Policy Strategies. 2015. 2015 ACA Silver Plan Dataset. Washington, DC: Robert Wood Johnson Foundation.
Cardwell, A., J. Jee, C. Hess, et al. 2014. Benefits and cost sharing in separate CHIP programs. Washington, DC: Georgetown University Center for Children and Families and National Academy for State Health Policy. http://www.nashp.org/wp-content/uploads/sites/default/files/Benefits.Cost_.Sharing.Separate.CHIP_.Programs.pdf.
Centers for Medicare & Medicaid Services (CMS), U.S. Department of Health and Human Services. 2014. Market rating reforms: State specific geographic rating areas. May 2014. https://www.cms.gov/CCIIO/Programs-and-Initiatives/Health-Insurance-Market-Reforms/state-gra.html.
Centers for Medicare & Medicaid Services (CMS), U.S. Department of Health and Human Services. 2011. Letter from Cindy Mann to state Medicaid directors regarding “Maintenance of effort.” February 25, 2011. http://downloads.cms.gov/cmsgov/archived-downloads/SMDL/downloads/smd11001.pdf.
Cunningham, P., and E. Carrier. 2014. Trends in the financial burden of medical care for nonelderly adults with diabetes, 2001 to 2009. American Journal of Managed Care 20, no. 2: 135–142.
Heberlein, M., T. Brooks, J. Alker, et al. 2013. Getting into gear for 2014: Findings from a 50-state survey of eligibility, enrollment, renewal, and cost-sharing policies in Medicaid and CHIP, 2012–2013. Washington, DC: Kaiser Family Foundation. http://www.kff.org/medicaid/upload/8401.pdf.
Medicaid and CHIP Payment and Access Commission (MACPAC). 2015. Report to Congress on Medicaid and CHIP. March 2015. Washington, DC: MACPAC. https://www.macpac.gov/publication/march-2015-report-to-congress-on-medicaid-and-chip/.
U.S. Census Bureau. 2015. County characteristics datasets: Annual county resident population estimates by age, sex, race, and Hispanic origin: April 1, 2010 to July 1, 2014. http://www.census.gov/popest/data/counties/asrh/2014/CC-EST2014-ALLDATA.html.

Appendix

Report to Congress on Medicaid and CHIP 153
MACPAC Authorizing Language
Authorizing Language from the Social Security Act (42 USC 1396)
Medicaid and CHIP Payment and Access Commission(a) ESTABLISHMENT.—There is hereby established the Medicaid and CHIP Payment and Access
Commission (in this section referred to as ‘‘MACPAC’’).
(b) DUTIES.—
(1) REVIEW OF ACCESS POLICIES FOR ALL STATES AND ANNUAL REPORTS.—MACPAC shall—
(A) review policies of the Medicaid program established under this title (in this section referred to as ‘‘Medicaid’’) and the State Children’s Health Insurance Program established under title XXI (in this section referred to as ‘‘CHIP’’) affecting access to covered items and services, including topics described in paragraph (2);
(B) make recommendations to Congress, the Secretary, and States concerning such access policies;
(C) by not later than March 15 of each year (beginning with 2010), submit a report to Congress containing the results of such reviews and MACPAC’s recommendations concerning such policies; and
(D) by not later than June 15 of each year (beginning with 2010), submit a report to Congress containing an examination of issues affecting Medicaid and CHIP, including the implications of changes in health care delivery in the United States and in the market for health care services on such programs.
(2) SPECIFIC TOPICS TO BE REVIEWED.—Specifically, MACPAC shall review and assess the following:
(A) MEDICAID AND CHIP PAYMENT POLICIES.—Payment policies under Medicaid and CHIP, including—
(i) the factors affecting expenditures for the efficient provision of items and services in different sectors, including the process for updating payments to medical, dental, and health professionals, hospitals, residential and long-term care providers, providers of home and community based services, Federally-qualified health centers and rural health clinics, managed care entities, and providers of other covered items and services;
(ii) payment methodologies; and
(iii) the relationship of such factors and methodologies to access and quality of care for Medicaid and CHIP beneficiaries (including how such factors and methodologies enable such beneficiaries to obtain the services for which they are eligible, affect provider supply, and affect providers that serve a disproportionate share of low-income and other vulnerable populations).
(B) ELIGIBILITY POLICIES.—Medicaid and CHIP eligibility policies, including a determination of the degree to which Federal and State policies provide health care coverage to needy populations.
March 2016154
MACPAC Authorizing Language
(C) ENROLLMENT AND RETENTION PROCESSES.—Medicaid and CHIP enrollment and retention processes, including a determination of the degree to which Federal and State policies encourage the enrollment of individuals who are eligible for such programs and screen out individuals who are ineligible, while minimizing the share of program expenses devoted to such processes.
(D) COVERAGE POLICIES.—Medicaid and CHIP benefit and coverage policies, including a determination of the degree to which Federal and State policies provide access to the services enrollees require to improve and maintain their health and functional status.
(E) QUALITY OF CARE.—Medicaid and CHIP policies as they relate to the quality of care provided under those programs, including a determination of the degree to which Federal and State policies achieve their stated goals and interact with similar goals established by other purchasers of health care services.
(F) INTERACTION OF MEDICAID AND CHIP PAYMENT POLICIES WITH HEALTH CARE DELIVERY GENERALLY.—The effect of Medicaid and CHIP payment policies on access to items and services for children and other Medicaid and CHIP populations other than under this title or title XXI and the implications of changes in health care delivery in the United States and in the general market for health care items and services on Medicaid and CHIP.
(G) INTERACTIONS WITH MEDICARE AND MEDICAID.—Consistent with paragraph (11), the interaction of policies under Medicaid and the Medicare program under title XVIII, including with respect to how such interactions affect access to services, payments, and dually eligible individuals.
(H) OTHER ACCESS POLICIES.—The effect of other Medicaid and CHIP policies on access to covered items and services, including policies relating to transportation and language barriers and preventive, acute, and long-term services and supports.
(3) RECOMMENDATIONS AND REPORTS OF STATE-SPECIFIC DATA.—MACPAC shall—
(A) review national and State-specific Medicaid and CHIP data; and
(B) submit reports and recommendations to Congress, the Secretary, and States based on such reviews.
(4) CREATION OF EARLY-WARNING SYSTEM.—MACPAC shall create an early-warning system to identify provider shortage areas, as well as other factors that adversely affect, or have the potential to adversely affect, access to care by, or the health care status of, Medicaid and CHIP beneficiaries. MACPAC shall include in the annual report required under paragraph (1)(D) a description of all such areas or problems identified with respect to the period addressed in the report.
(5) COMMENTS ON CERTAIN SECRETARIAL REPORTS AND REGULATIONS.—
(A) CERTAIN SECRETARIAL REPORTS.—If the Secretary submits to Congress (or a committee of Congress) a report that is required by law and that relates to access policies, including with respect to payment policies, under Medicaid or CHIP, the Secretary shall transmit a copy of the report to MACPAC. MACPAC shall review the report and, not later than 6 months after the date of submittal of the Secretary’s report to Congress, shall submit to the appropriate committees
Report to Congress on Medicaid and CHIP 155
MACPAC Authorizing Language
of Congress and the Secretary written comments on such report. Such comments may include such recommendations as MACPAC deems appropriate.
(B) REGULATIONS.—MACPAC shall review Medicaid and CHIP regulations and may comment through submission of a report to the appropriate committees of Congress and the Secretary, on any such regulations that affect access, quality, or efficiency of health care.
(6) AGENDA AND ADDITIONAL REVIEWS.—
(A) IN GENERAL.—MACPAC shall consult periodically with the chairmen and ranking minority members of the appropriate committees of Congress regarding MACPAC’s agenda and progress towards achieving the agenda. MACPAC may conduct additional reviews, and submit additional reports to the appropriate committees of Congress, from time to time on such topics relating to the program under this title or title XXI as may be requested by such chairmen and members and as MACPAC deems appropriate.
(B) REVIEW AND REPORTS REGARDING MEDICAID DSH.—
(i) IN GENERAL.—MACPAC shall review and submit an annual report to Congress on disproportionate share hospital payments under section 1923. Each report shall include the information specified in clause (ii).
(ii) REQUIRED REPORT INFORMATION.—Each report required under this subparagraph shall include the following:
(I) Data relating to changes in the number of uninsured individuals.
(II) Data relating to the amount and sources of hospitals’ uncompensated care costs, including the amount of such costs that are the result of providing unreimbursed or under-reimbursed services, charity care, or bad debt.
(III) Data identifying hospitals with high levels of uncompensated care that also provide access to essential community services for low-income, uninsured, and vulnerable populations, such as graduate medical education, and the continuum of primary through quarternary care, including the provision of trauma care and public health services.
(IV) State-specific analyses regarding the relationship between the most recent State DSH allotment and the projected State DSH allotment for the succeeding year and the data reported under subclauses (I), (II), and (III) for the State.
(iii) DATA.—Notwithstanding any other provision of law, the Secretary regularly shall provide MACPAC with the most recent State reports and most recent independent certified audits submitted under section 1923(j), cost reports submitted under title XVIII, and such other data as MACPAC may request for purposes of conducting the reviews and preparing and submitting the annual reports required under this subparagraph.
(iv) SUBMISSION DEADLINES.—The first report required under this subparagraph shall be submitted to Congress not later than February 1, 2016. Subsequent reports shall be submitted as part of, or with, each annual report required under paragraph (1)(C) during the period of fiscal years 2017 through 2024.
March 2016156
MACPAC Authorizing Language
(7) AVAILABILITY OF REPORTS.—MACPAC shall transmit to the Secretary a copy of each report submitted under this subsection and shall make such reports available to the public.
(8) APPROPRIATE COMMITTEE OF CONGRESS.—For purposes of this section, the term ‘‘appropriate committees of Congress’’ means the Committee on Energy and Commerce of the House of Representatives and the Committee on Finance of the Senate.
(9) VOTING AND REPORTING REQUIREMENTS.—With respect to each recommendation contained in a report submitted under paragraph (1), each member of MACPAC shall vote on the recommendation, and MACPAC shall include, by member, the results of that vote in the report containing the recommendation.
(10) EXAMINATION OF BUDGET CONSEQUENCES.—Before making any recommendations, MACPAC shall examine the budget consequences of such recommendations, directly or through consultation with appropriate expert entities, and shall submit with any recommendations, a report on the Federal and State-specific budget consequences of the recommendations.
(11) CONSULTATION AND COORDINATION WITH MEDPAC.—
(A) IN GENERAL.—MACPAC shall consult with the Medicare Payment Advisory Commission (in this paragraph referred to as ‘‘MedPAC’’) established under section 1805 in carrying out its duties under this section, as appropriate and particularly with respect to the issues specified in paragraph (2) as they relate to those Medicaid beneficiaries who are dually eligible for Medicaid and the Medicare program under title XVIII, adult Medicaid beneficiaries (who are not dually eligible for Medicare), and beneficiaries under Medicare. Responsibility for analysis of and recommendations to change Medicare policy regarding Medicare beneficiaries, including Medicare beneficiaries who are dually eligible for Medicare and Medicaid, shall rest with MedPAC.
(B) INFORMATION SHARING.—MACPAC and MedPAC shall have access to deliberations and records of the other such entity, respectively, upon the request of the other such entity.
(12) CONSULTATION WITH STATES.—MACPAC shall regularly consult with States in carrying out its duties under this section, including with respect to developing processes for carrying out such duties, and shall ensure that input from States is taken into account and represented in MACPAC’s recommendations and reports.
(13) COORDINATE AND CONSULT WITH THE FEDERAL COORDINATED HEALTH CARE OFFICE.—MACPAC shall coordinate and consult with the Federal Coordinated Health Care Office established under section 2081 of the Patient Protection and Affordable Care Act before making any recommendations regarding dually eligible individuals.
(14) PROGRAMMATIC OVERSIGHT VESTED IN THE SECRETARY.— MACPAC’s authority to make recommendations in accordance with this section shall not affect, or be considered to duplicate, the Secretary’s authority to carry out Federal responsibilities with respect to Medicaid and CHIP.
(c) MEMBERSHIP.—
(1) NUMBER AND APPOINTMENT.—MACPAC shall be composed of 17 members appointed by the Comptroller General of the United States.
Report to Congress on Medicaid and CHIP 157
MACPAC Authorizing Language
(2) QUALIFICATIONS.—
(A) IN GENERAL.—The membership of MACPAC shall include individuals who have had direct experience as enrollees or parents or caregivers of enrollees in Medicaid or CHIP and individuals with national recognition for their expertise in Federal safety net health programs, health finance and economics, actuarial science, health plans and integrated delivery systems, reimbursement for health care, health information technology, and other providers of health services, public health, and other related fields, who provide a mix of different professions, broad geographic representation, and a balance between urban and rural representation.
(B) INCLUSION.—The membership of MACPAC shall include (but not be limited to) physicians, dentists, and other health professionals, employers, third-party payers, and individuals with expertise in the delivery of health services. Such membership shall also include representatives of children, pregnant women, the elderly, individuals with disabilities, caregivers, and dually eligible individuals, current or former representatives of State agencies responsible for administering Medicaid, and current or former representatives of State agencies responsible for administering CHIP.
(C) MAJORITY NONPROVIDERS.—Individuals who are directly involved in the provision, or management of the delivery, of items and services covered under Medicaid or CHIP shall not constitute a majority of the membership of MACPAC.
(D) ETHICAL DISCLOSURE.—The Comptroller General of the United States shall establish a system for public disclosure by members of MACPAC of financial and other potential conflicts of interest relating to such members. Members of MACPAC shall be treated as employees of Congress for purposes of applying title I of the Ethics in Government Act of 1978 (Public Law 95–521).
(3) TERMS.—
(A) IN GENERAL.—The terms of members of MACPAC shall be for 3 years except that the Comptroller General of the United States shall designate staggered terms for the members first appointed.
(B) VACANCIES.—Any member appointed to fill a vacancy occurring before the expiration of the term for which the member’s predecessor was appointed shall be appointed only for the remainder of that term. A member may serve after the expiration of that member’s term until a successor has taken office. A vacancy in MACPAC shall be filled in the manner in which the original appointment was made.
(4) COMPENSATION.—While serving on the business of MACPAC (including travel time), a member of MACPAC shall be entitled to compensation at the per diem equivalent of the rate provided for level IV of the Executive Schedule under section 5315 of title 5, United States Code; and while so serving away from home and the member’s regular place of business, a member may be allowed travel expenses, as authorized by the Chairman of MACPAC. Physicians serving as personnel of MACPAC may be provided a physician comparability allowance by MACPAC in the same manner as Government physicians may be provided such an allowance by an agency under section 5948 of title 5, United States Code, and for such purpose subsection (i) of such section shall apply to MACPAC in the same manner as it applies to the Tennessee Valley Authority. For purposes of pay (other than pay of members of MACPAC) and employment benefits, rights, and privileges, all personnel of MACPAC shall be treated as if they were employees of the United States Senate.
March 2016158
MACPAC Authorizing Language
(5) CHAIRMAN; VICE CHAIRMAN.—The Comptroller General of the United States shall designate a member of MACPAC, at the time of appointment of the member as Chairman and a member as Vice Chairman for that term of appointment, except that in the case of vacancy of the Chairmanship or Vice Chairmanship, the Comptroller General of the United States may designate another member for the remainder of that member’s term.
(6) MEETINGS.—MACPAC shall meet at the call of the Chairman.
(d) DIRECTOR AND STAFF; EXPERTS AND CONSULTANTS.—Subject to such review as the Comptroller General of the United States deems necessary to assure the efficient administration of MACPAC, MACPAC may—
(1) employ and fix the compensation of an Executive Director (subject to the approval of the Comptroller General of the United States) and such other personnel as may be necessary to carry out its duties (without regard to the provisions of title 5, United States Code, governing appointments in the competitive service);
(2) seek such assistance and support as may be required in the performance of its duties from appropriate Federal and State departments and agencies;
(3) enter into contracts or make other arrangements, as may be necessary for the conduct of the work of MACPAC (without regard to section 3709 of the Revised Statutes (41 USC 5));
(4) make advance, progress, and other payments which relate to the work of MACPAC;
(5) provide transportation and subsistence for persons serving without compensation; and
(6) prescribe such rules and regulations as it deems necessary with respect to the internal organization and operation of MACPAC.
(e) POWERS.—
(1) OBTAINING OFFICIAL DATA.—MACPAC may secure directly from any department or agency of the United States and, as a condition for receiving payments under sections 1903(a) and 2105(a), from any State agency responsible for administering Medicaid or CHIP, information necessary to enable it to carry out this section. Upon request of the Chairman, the head of that department or agency shall furnish that information to MACPAC on an agreed upon schedule.
(2) DATA COLLECTION.—In order to carry out its functions, MACPAC shall—
(A) utilize existing information, both published and unpublished, where possible, collected and assessed either by its own staff or under other arrangements made in accordance with this section;
(B) carry out, or award grants or contracts for, original research and experimentation, where existing information is inadequate; and
(C) adopt procedures allowing any interested party to submit information for MACPAC’s use in making reports and recommendations.
Report to Congress on Medicaid and CHIP 159
MACPAC Authorizing Language
(3) ACCESS OF GAO TO INFORMATION.—The Comptroller General of the United States shall have unrestricted access to all deliberations, records, and nonproprietary data of MACPAC, immediately upon request.
(4) PERIODIC AUDIT.—MACPAC shall be subject to periodic audit by the Comptroller General of the United States.
(f) FUNDING.—
(1) REQUEST FOR APPROPRIATIONS.—MACPAC shall submit requests for appropriations (other than for fiscal year 2010) in the same manner as the Comptroller General of the United States submits requests for appropriations, but amounts appropriated for MACPAC shall be separate from amounts appropriated for the Comptroller General of the United States.
(2) AUTHORIZATION.—There are authorized to be appropriated such sums as may be necessary to carry out the provisions of this section.
(3) FUNDING FOR FISCAL YEAR 2010.—
(A) IN GENERAL.—Out of any funds in the Treasury not otherwise appropriated, there is appropriated to MACPAC to carry out the provisions of this section for fiscal year 2010, $9,000,000.
(B) TRANSFER OF FUNDS.—Notwithstanding section 2104(a)(13), from the amounts appropriated in such section for fiscal year 2010, $2,000,000 is hereby transferred and made available in such fiscal year to MACPAC to carry out the provisions of this section.
(4) AVAILABILITY.—Amounts made available under paragraphs (2) and (3) to MACPAC to carry out the provisions of this section shall remain available until expended.
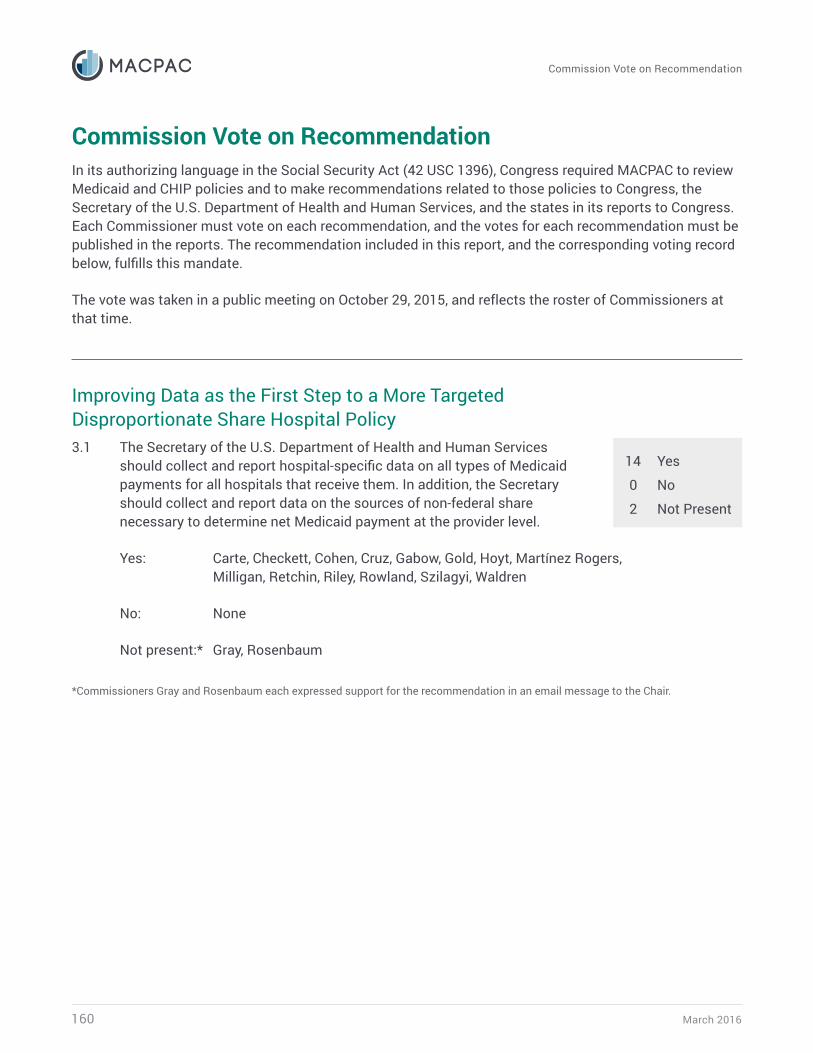
March 2016160
Commission Vote on RecommendationIn its authorizing language in the Social Security Act (42 USC 1396), Congress required MACPAC to review Medicaid and CHIP policies and to make recommendations related to those policies to Congress, the Secretary of the U.S. Department of Health and Human Services, and the states in its reports to Congress. Each Commissioner must vote on each recommendation, and the votes for each recommendation must be published in the reports. The recommendation included in this report, and the corresponding voting record below, fulfills this mandate.
The vote was taken in a public meeting on October 29, 2015, and reflects the roster of Commissioners at that time.
Improving Data as the First Step to a More Targeted Disproportionate Share Hospital Policy3.1 The Secretary of the U.S. Department of Health and Human Services
14 Yes
0 No
2 Not Present
should collect and report hospital-specific data on all types of Medicaid payments for all hospitals that receive them. In addition, the Secretary should collect and report data on the sources of non-federal share necessary to determine net Medicaid payment at the provider level.
Yes: Carte, Checkett, Cohen, Cruz, Gabow, Gold, Hoyt, Martínez Rogers, Milligan, Retchin, Riley, Rowland, Szilagyi, Waldren
No: None
Not present:* Gray, Rosenbaum
*Commissioners Gray and Rosenbaum each expressed support for the recommendation in an email message to the Chair.
Commission Vote on Recommendation

Report to Congress on Medicaid and CHIP 161
Biographies of Commissioners
Biographies of Commissioners
Sara Rosenbaum, JD (Chair), is founding chair of the Department of Health Policy and the Harold and Jane Hirsh Professor of Health Law and Policy at The George Washington University Milken Institute School of Public Health. She also serves on the faculties of The George Washington Schools of Law and Medicine. Professor Rosenbaum’s research has focused on how the law intersects with the nation’s health care and public health systems, with a particular emphasis on insurance coverage, managed care, the health care safety net, health care quality, and civil rights. She is a member of the National Academy of Medicine (formerly the Institute of Medicine), and has served on the boards of numerous national organizations, including AcademyHealth. Professor Rosenbaum is a past member of the Centers for Disease Control and Prevention’s (CDC) Advisory Committee on Immunization Practices and also serves on the CDC Director’s Advisory Committee. She has advised Congress and presidential administrations since 1977 and served on the staff of the White House Domestic Policy Council during the Clinton administration. Professor Rosenbaum is the lead author of Law and the American Health Care System, published by Foundation Press (2012). She received her law degree from Boston University School of Law.
Marsha Gold, ScD (Vice Chair), is a senior fellow emeritus at Mathematica Policy Research, where she previously served as a lead investigator and project director on research in the areas of Medicare, Medicaid, managed care design, and delivery system reform in both public and private health insurance, and access to care. Other prior positions include director of research and analysis at the Group Health Association of America, assistant professor with the Department of Health Policy and Administration at The University of North Carolina, and director of policy analysis and program evaluation at the Maryland Department of Health and Mental Hygiene. Dr. Gold is on the
editorial board of Health Affairs and Health Services Research. She received her doctorate of science in health services and evaluation research from Harvard School of Public Health.
Brian Burwell is vice president, community living systems at Truven Health Analytics in Cambridge, Massachusetts. Mr. Burwell conducts research, provides consulting services, policy analysis, and technical assistance in financing and delivery of long-term services and supports, and data analysis related to integrated care models for dually eligible beneficiaries and managed long-term services and supports. He has been with Truven Health Analytics and its predecessor companies for 30 years. Mr. Burwell received his bachelor of arts degree from Dartmouth College.
Sharon Carte, MHS, has served as executive director of the West Virginia Children’s Health Insurance Program since 2001. From 1992 to 1998, Ms. Carte was deputy commissioner for the Bureau for Medical Services, overseeing West Virginia’s Medicaid program. Previously, she was an administrator of skilled and intermediate-care nursing facilities and a coordinator of human resources development in the West Virginia Department of Health. Ms. Carte’s experience includes work with senior centers and aging programs throughout West Virginia as well as with policy issues related to behavioral health and long-term services and supports for children. She received her master of health science from the Johns Hopkins University School of Hygiene and Public Health.
Andrea Cohen, JD, is senior vice president for program at the United Hospital Fund, a non-profit health services research and philanthropic organization with the mission to shape positive change in health care for New Yorkers. She directs the Fund’s program work and oversees grant making and conference activities. From 2009 to 2014, she served as director of health services in the New York City Office of the Mayor, where she coordinated and developed strategies to
March 2016162
Biographies of Commissioners
improve public health and health services. Prior professional positions include counsel with Manatt, Phelps & Phillips, LLP; senior policy counsel at the Medicare Rights Center; health and oversight counsel for the U.S. Senate Committee on Finance; and trial attorney with the U.S. Department of Justice. She received her law degree from Columbia University School of Law.
Gustavo Cruz, DMD, MPH, is an oral health policy consultant and senior advisor to Health Equity Initiative, a professional membership organization in New York City that brings together community leaders and professionals in diverse fields to promote innovations in health equity. He also serves as resident advisor to the dental public health residency at Lutheran Medical Center and as adjunct associate professor in the Department of Epidemiology and Health Promotion at New York University College of Dentistry (NYUCD). Dr. Cruz was a Robert Wood Johnson Foundation Health Policy Fellow in 2009–2010, working in the office of the Secretary of the U.S. Department of Health and Human Services. Subsequently, he served as chief of the Oral Health Branch, Bureau of Health Professions, at the Health Resources and Services Administration. He previously served as director of public health and health promotion at NYUCD and as governing faculty of New York University’s master’s degree program in global public health. Dr. Cruz has conducted numerous research studies on the oral health of U.S. immigrants, oral health disparities, oral and pharyngeal cancers, and access to oral health care among underserved populations, as well as on the effects of race, ethnicity, acculturation, and culturally influenced behaviors on oral health outcomes and health services utilization. He received his degree in dentistry from the University of Puerto Rico and his master of public health from Columbia University’s School of Public Health. He is a diplomate of the American Board of Dental Public Health.
Toby Douglas, MPP, MPH, is senior vice president for Medicaid solutions at Centene Corporation. Mr. Douglas was a long-standing state Medicaid
official, serving for 10 years as an executive in California Medicaid. He served as the director of the California Department of Health Care Services as well as California Medicaid director for six years, during which time he also served as a board member of the National Association of Medicaid Directors and as a CHIP Director. Earlier in his career, Mr. Douglas worked for the San Mateo County Health Department in California, as a research associate at the Urban Institute, as a consultant with Kaiser Permanente Consulting on pharmacy utilization, and as a VISTA volunteer. Prior to joining Centene, he was an independent consultant and senior advisor for Sellers Dorsey, assisting organizations involved with Medicaid, health insurance exchanges, and Medicare. He received his master of public policy and master of public health from the University of California, Berkeley.
Leanna George is the parent of a 13-year-old with a disability who is covered under Medicaid and a 9-year-old covered under the State Children’s Health Insurance Program (CHIP). A resident of Benson, North Carolina, Ms. George serves on the Johnston County Consumer and Family Advisory Committee, which advises the Board of the County Mental Health Center. She also serves on the Alliance Innovations Stakeholders Group, which advises a Medicaid managed care organization and the state of North Carolina about services and coverage for developmentally disabled enrollees, and on the Client Rights Committee of the Autism Society of North Carolina, a Medicaid provider agency.
Christopher Gorton, MD, MHSA, is the president of public plans at Tufts Health Plan, a non-profit health plan in Massachusetts, Rhode Island, and New Hampshire. Previously, Dr. Gorton was chief executive officer of a regional health plan that was acquired by the Inova Health System of Falls Church, Virginia. Other positions have included vice president for medical management and worldwide health care strategy for Hewlett Packard Enterprise Services and president and chief medical officer for APS Healthcare, a behavioral health plan and care management organization based in Silver
Report to Congress on Medicaid and CHIP 163
Biographies of Commissioners
Spring, Maryland. After beginning his career as a practicing pediatrician in federally qualified health centers in Pennsylvania and Missouri, Dr. Gorton served as chief medical officer in the Pennsylvania Department of Public Welfare. Dr. Gorton received his degree in medicine from Columbia University’s College of Physicians and Surgeons and his master of health systems administration from the College of Saint Francis in Joliet, Illinois.
Herman Gray, MD, MBA, is president and CEO of United Way for Southeastern Michigan. Prior to assuming this post in September 2015, he served as executive vice president for pediatric health services for the Detroit Medical Center, a position he accepted after eight years as CEO/president of the Detroit Medical Center Children’s Hospital of Michigan. At Children’s Hospital of Michigan, Dr. Gray also served as chief operating officer, chief of staff, and vice chief of education in the department of pediatrics. He also served as vice president for graduate medical education (GME) at the Detroit Medical Center and associate dean for GME at Wayne State University School of Medicine. Dr. Gray has served as the chief medical consultant at the Michigan Department of Public Health, Children’s Special Health Care Services, as well as vice president/medical director of clinical affairs at Blue Care Network, a subsidiary of Blue Cross Blue Shield of Michigan. He has received the Michigan Hospital Association Health Care Leadership Award and Modern Healthcare’s Top 25 Minority Executives in Healthcare Award and is a member of the board of trustees for the Skillman Foundation. He received his medical degree from the University of Michigan, a master of business administration from the University of Tennessee, and completed his pediatrics training at the Children’s Hospital of Michigan/Wayne State University.
Stacey Lampkin, FSA, MAAA, MPA, is an actuary and principal with Mercer Government Human Services Consulting where she leads actuarial work for several state Medicaid programs. She previously served as actuary and assistant deputy secretary for Medicaid finance and analytics at
Florida’s Agency for Health Care Administration, and as an actuary at Milliman. She has also served as a member of the Federal Health Committee of the American Academy of Actuaries (AAA), as vice chairperson of AAA’s Uninsured Work Group, and as a member of the Society of Actuaries project oversight group for research on evaluating medical management interventions. Ms. Lampkin is a fellow in the Society of Actuaries and a member of the AAA. She received her master of public administration from Florida State University.
Charles Milligan, JD, MPH, is CEO of United Healthcare Community Plan of New Mexico, a Medicaid managed care organization with enrolled members in all Medicaid eligibility categories (including dually eligible beneficiaries and adults in Medicaid expansion programs) that provides somatic, behavioral, and managed long-term services and supports. Mr. Milligan is a former state Medicaid and CHIP director in New Mexico and Maryland. He also served as executive director of the Hilltop Institute, a health services research center at the University of Maryland at Baltimore County, and as vice president at The Lewin Group. Mr. Milligan directed the 2005–2006 Commission on Medicaid and has conducted Medicaid-related research projects in numerous states. He received his master of public health from the University of California, Berkeley, and his law degree from Harvard Law School.
Sheldon Retchin, MD, MSPH, is executive vice president for health sciences and chief executive officer of The Ohio State University Wexner Medical Center in Columbus. Dr. Retchin’s research and publications have addressed costs, quality, and outcomes of health care as well as workforce issues. From 2003 until his appointment at Ohio State in 2015, he served as senior vice president for health sciences at Virginia Commonwealth University (VCU) and as CEO of the VCU Health System, in Richmond, Virginia. Dr. Retchin also led a Medicaid health maintenance organization with approximately 200,000 covered lives through which, for 15 years, he and his colleagues helped
March 2016164
Biographies of Commissioners
manage care for 30,000 uninsured individuals in the Virginia Coordinated Care program. Dr. Retchin received his medical degree from The University of North Carolina School of Medicine and his master of science in public health from The University of North Carolina School of Public Health.
Norma Martínez Rogers, PhD, RN, FAAN, is a professor of family nursing at The University of Texas (UT) Health Science Center at San Antonio. She has held clinical and administrative positions in psychiatric nursing and at psychiatric hospitals, including the William Beaumont Army Medical Center in Fort Bliss during Operation Desert Storm. She is dedicated to working with those who face health disparities in the health care system, and is the founder and president of the National Latino Nurse Faculty Association. She has initiated a number of programs at the UT Health Science Center, including a mentorship program for retention of minorities in nursing education. She was a founding board member of a non-profit organization, Martínez Street Women’s Center, designed to provide support and educational services to women and teenage girls. Dr. Martínez Rogers is a fellow of the American Academy of Nursing and a past president of the National Association of Hispanic Nurses. She received her master of science in psychiatric nursing from the UT Health Science Center at San Antonio and her doctorate in cultural foundations in education from The University of Texas at Austin.
Peter Szilagyi, MD, MPH, was recently named vice chair for clinical research in the Department of Pediatrics at the University of California, Los Angeles. Until that appointment, he served as chief of the division of general pediatrics and professor of pediatrics at the University of Rochester and as associate director of the Center for Community Health within the University of Rochester’s Clinical Translational Research Institute. His research has addressed CHIP and child health insurance, access to care, quality of care, and health outcomes, including the delivery of primary care with a focus on immunization delivery, health care financing,
and children with chronic disease. For the past 18 years, he was chairman of the board of the Monroe Plan for Medical Care, a large Medicaid and CHIP managed care plan in upstate New York. He is editor in chief of Academic Pediatrics and has served as the president of the Academic Pediatric Association. Dr. Szilagyi received his medical and public health degrees from the University of Rochester.
Penny Thompson, MPA, is principal of Penny Thompson Consulting, LLC, and provides consulting services in the areas of health care delivery and payment, information technology development, and program integrity. Previously, she served as deputy director of the Center for Medicaid and CHIP Services at the Centers for Medicare & Medicaid Services (CMS). Ms. Thompson has held senior positions in management consulting at information technology companies, and was director of health care strategy and planning for Hewlett Packard’s health care business unit. In addition, she previously served as CMS’s director of program integrity and as chief of the health care branch within the Office of Inspector General at the U.S. Department of Health and Human Services. Ms. Thompson received her master of public administration from The George Washington University.
Alan Weil, JD, MPP, is editor-in-chief of Health Affairs, a multidisciplinary peer-reviewed health policy journal, in Bethesda, Maryland. He is an elected member of the National Academy of Medicine and served six years on its Board on Health Care Services. He is a trustee of the Consumer Health Foundation and a member of the Kaiser Commission on Medicaid and the Uninsured. He previously served as executive director of the National Academy for State Health Policy, director of the Urban Institute’s Assessing the New Federalism Project, executive director of the Colorado Department of Health Care Policy and Financing, and assistant general counsel in the Massachusetts Department of Medical Security. He received a master’s degree from Harvard University’s John F. Kennedy School of Government and a law degree from Harvard Law School.
Report to Congress on Medicaid and CHIP 165
Biographies of Staff
Biographies of StaffAnnie Andrianasolo, MBA, is executive assistant. She previously held the position of special assistant for global health at the Public Health Institute and was a program assistant for the World Bank. Ms. Andrianasolo has a bachelor of science in economics and a master of business administration from Johns Hopkins Carey Business School.
Amy Bernstein, ScD, MHSA, is a policy director and contracting officer. She manages and provides oversight and guidance for all MACPAC research, data, and analysis projects, including statements of work, research plans, and all deliverables and products. She also directs and conducts policy analyses. Her previous positions have included director of the Analytic Studies Branch at the U.S. Centers for Disease Control and Prevention’s (CDC) National Center for Health Statistics and senior analyst positions at the Alpha Center, the Prospective Payment Assessment Commission, the National Cancer Institute, and the Agency for Healthcare Research and Quality (AHRQ). Dr. Bernstein earned a master of health services administration from the University of Michigan School of Public Health and a doctor of science from the School of Hygiene and Public Health at Johns Hopkins University.
Kirstin Blom, MIPA, is a principal analyst. Prior to joining MACPAC, Ms. Blom was an analyst in health care financing at the Congressional Research Service (CRS). Before that, Ms. Blom worked as a principal analyst at the Congressional Budget Office where she estimated the costs of legislation impacting the Medicaid program. Ms. Blom has also been an analyst for the Medicaid program in Wisconsin and for the U.S. Government Accountability Office (GAO). She holds a master of international public affairs from the University of Wisconsin, Madison.
James Boissonnault, MA, is chief information officer. Prior to joining MACPAC, he was the information technology (IT) director and security
officer for OnPoint Consulting. At OnPoint, he also worked on several federal government projects, including those for the Missile Defense Agency, the U.S. Department of the Treasury, and the U.S. Department of Agriculture. He has nearly two decades of IT and communications experience. Mr. Boissonnault holds a master of arts in Slavic languages and literatures from The University of North Carolina and a bachelor of arts in Russian from the University of Massachusetts.
Madeline Britvec is research assistant. Prior to joining MACPAC, she held internships at the U.S. Chamber of Commerce, International Bridges to Justice, and CBS Detroit. Ms. Britvec holds a bachelor of arts in economics and applied statistics from Smith College.
Kacey Buderi, MPA, is an analyst. Prior to joining MACPAC, she worked in the Center for Congressional and Presidential Studies at American University and completed internships in the office of U.S. Senator Ed Markey and at the U.S. Department of Health and Human Services (HHS). Ms. Buderi holds a master of public administration and a bachelor of arts in political science, both from American University.
Kathryn Ceja is director of communications. Previously, she served as lead spokesperson for Medicare issues in the Centers for Medicare & Medicaid Services (CMS) press office. Prior to her tenure in the press office, Ms. Ceja was a speechwriter for the Secretary of HHS as well as the speechwriter for a series of CMS administrators. Ms. Ceja holds a bachelor of arts in international studies from American University.
Veronica Daher, JD, is a senior analyst. Previously, she was a health policy analyst for the Health Safety Net program at the Massachusetts Executive Office of Health and Human Services, where she focused on developing policy in response to the Patient Protection and Affordable Care Act (ACA, P.L. 111-148, as amended). Her work now focuses on how the ACA will affect Medicaid
March 2016166
Biographies of Staff
and the State Children’s Health Insurance Program (CHIP). Ms. Daher received her law degree from the University of Richmond and a bachelor of arts from the University of Virginia.
Benjamin Finder, MPH, is a senior analyst. His work focuses on benefits and payment policy. Prior to joining MACPAC, he served as an associate director in the Health Care Policy and Research Administration at the District of Columbia Department of Health Care Finance, and as an analyst at the Henry J. Kaiser Family Foundation. Mr. Finder holds a master of public health from The George Washington University, where he concentrated in health policy and health economics.
Moira Forbes, MBA, is a policy director, focusing on payment policy and the design, implementation, and effectiveness of program integrity activities in Medicaid and CHIP. Previously, she served as director of the division of health and social service programs in the Office of Executive Program Information at HHS and as a vice president in the Medicaid practice at The Lewin Group. At Lewin, Ms. Forbes worked with every state Medicaid and CHIP program on issues relating to program integrity and eligibility quality control. She has extensive experience with federal and state policy analysis, Medicaid program operations, and delivery system design. Ms. Forbes has a master of business administration from The George Washington University and a bachelor’s degree in Russian and political science from Bryn Mawr College.
Martha Heberlein, MA, is a principal analyst. Prior to joining MACPAC, she was the research manager at the Georgetown University Center for Children and Families, where she oversaw a national survey on Medicaid and CHIP eligibility, enrollment, and renewal procedures. Ms. Heberlein received a master of arts in public policy with a concentration in philosophy and social policy from The George Washington University and a bachelor of science in psychology from James Madison University.
Kayla Holgash, MPH, is an analyst focusing on payment policy. Prior to joining MACPAC, Ms. Holgash worked as a senior research assistant in the Department of Health Policy and Management at The George Washington University and as a health policy legislative intern for U.S. Senator Charles Grassley. Before that, she served as the executive manager of the Health and Wellness Network for the Homewood Children’s Village, a non-profit organization in Pittsburgh, Pennsylvania. Ms. Holgash holds a master of public health from The George Washington University and a bachelor of science in public and community health from the University of Maryland.
Joanne Jee, MPH, is a principal analyst focusing on CHIP and children’s coverage. Prior to joining MACPAC, she was a program director at the National Academy for State Health Policy, where she focused on children’s coverage issues. Ms. Jee also has been a senior analyst at GAO, a program manager at The Lewin Group, and a legislative analyst in the HHS Office of Legislation. Ms. Jee has a master of public health from the University of California, Los Angeles, and bachelor of science in human development from the University of California, Davis.
Allissa Jones is administrative assistant. Prior to joining MACPAC, she worked as an intern for Kaiser Permanente, where she helped coordinate health and wellness events in the Washington, DC area. Ms. Jones holds a bachelor of science with a concentration in health management from Howard University.
Sarah Melecki, MPAff, is a senior analyst focusing on a variety of issues, including Medicaid expansion, behavioral health services, the integration of Medicaid and other social programs, and dental coverage. Prior to joining MACPAC, she worked on ACA implementation and health care cost drivers at Consumers Union. Ms. Melecki also has served as district director to Texas state representative Jessica Farrar, and as a research assistant at the University of Nebraska Public
Report to Congress on Medicaid and CHIP 167
Biographies of Staff
Policy Center. She holds a master of public affairs from the LBJ School of Public Affairs at The University of Texas at Austin and a bachelor of arts in political science from the University of Nebraska at Lincoln.
Robert Nelb, MPH, is a senior analyst focusing on issues related to Medicaid payment and delivery system reform. Prior to joining MACPAC, he served as a health insurance specialist at CMS, leading projects related to CHIP and Medicaid Section 1115 demonstrations. Mr. Nelb has a master of public health and a bachelor’s degree in ethics, politics, and economics from Yale University.
Chris Park, MS, is a principal analyst. He focuses on issues related to managed care payment and Medicaid drug policy and has lead responsibility for MACStats. Prior to joining MACPAC, he was a senior consultant at The Lewin Group, where he provided quantitative analysis and technical assistance on Medicaid policy issues, including managed care capitation rate setting and pharmacy reimbursement and cost containment initiatives. Mr. Park holds a master of science in health policy and management from the Harvard School of Public Health and a bachelor of science in chemistry from the University of Virginia.
Laura Beth Pelner is communications and graphic design specialist. Prior to coming to MACPAC, Ms. Pelner worked in the Washington, DC, non-profit sector in the fields of communications and design. She also worked on the creative team of a New York City advertising agency. Ms. Pelner is a former Peace Corps Volunteer who served in Ghana, West Africa, where she taught IT at the college level. She holds a bachelor of fine arts in advertising from Syracuse University.
Chris Peterson, MPP, is a principal analyst. Prior to joining MACPAC, he was a specialist in health care financing at CRS, where he worked on major health legislation. Prior to that, he worked for AHRQ and the National Bipartisan Commission on the Future of Medicare. Mr. Peterson has a master of public
policy from Georgetown University and a bachelor of science in mathematics from Missouri Western State University.
Ken Pezzella is chief financial officer. He has more than 10 years of federal financial management and accounting experience in both the public and private sectors. Mr. Pezzella also has broad operations and business experience, and is a veteran of the U.S. Coast Guard. He holds a bachelor of science in accounting from Strayer University.
Anne L. Schwartz, PhD, is executive director. She previously served as deputy editor at Health Affairs; vice president at Grantmakers In Health, a national organization providing strategic advice and educational programs for foundations and corporate giving programs working on health issues; and special assistant to the executive director and senior analyst at the Physician Payment Review Commission, a precursor to the Medicare Payment Advisory Commission (MedPAC). Earlier, she held positions on committee and personal staff for the U.S. House of Representatives. Dr. Schwartz earned a doctorate in health policy from the School of Hygiene and Public Health at Johns Hopkins University.
Anna Sommers, PhD, MS, MPAff, is a principal analyst. Previously, she held research positions at the Center for Studying Health System Change (HSC), the Hilltop Institute, University of Maryland, and the Urban Institute. At HSC, she published Medicaid briefs on high-cost use, specialty care access, and physician workforce, and led design of the Autoworkers Health Care Survey. At Hilltop, she led an evaluation of New Mexico’s CHIP program and served as senior consultant on a range of analyses for Maryland’s Medicaid program and the Maryland Health Services and Cost Review Commission. Dr. Sommers has a doctorate and a master of science in health services research, policy, and administration from the University of Minnesota School of Public Health, and a master of public affairs from its Hubert H. Humphrey Institute of Public Affairs.

March 2016168
Biographies of Staff
Mary Ellen Stahlman, MHSA, is a policy and congressional affairs director. Previously, she held positions at the National Health Policy Forum, focusing on Medicare issues including private plans and the Medicare drug benefit. She served at CMS and its predecessor agency, the Health Care Financing Administration, for 18 years, including as deputy director of policy. Ms. Stahlman received a master of health services administration from The George Washington University and a bachelor of arts from Bates College.
Kristal Vardaman, MSPH, is a principal analyst focused on long-term services and supports and on high-cost, high-need populations. Previously, she was a senior analyst at the GAO and a consultant at Avalere Health. Ms. Vardaman holds a master of science in public health from The University of North Carolina at Chapel Hill and a bachelor of science from the University of Michigan. She currently is pursuing a doctorate in public policy from The George Washington University.
Ricardo Villeta, MBA, is deputy director for operations, finance, and management with overall responsibility for operations related to financial management and budget, procurement, human resources, and IT. Previously, he was the senior vice president and chief management officer for the Academy for Educational Development, a private non-profit educational organization that provided training, education and technical assistance throughout the United States and in more than 50 countries. Mr. Villeta holds a master of business administration from The George Washington University and a bachelor of science from Georgetown University.
Katie Weider, MPH, is a senior analyst. She focuses on issues related to individuals who are eligible for both Medicaid and Medicare. Prior to joining MACPAC, she served as a senior research assistant at The George Washington University and as a health policy intern for U.S. Senator Charles Grassley. Ms. Weider received a master of public health from The George Washington University and
a bachelor’s degree in health science and public health from Boston University.
Eileen Wilkie is administrative officer and is responsible for coordinating human resources, office maintenance, travel, and Commission meetings. Previously, she held similar roles at National Public Radio and the National Endowment for Democracy. Ms. Wilkie has a bachelor’s degree in political science from the University of Notre Dame.


Printed on recycled material
1800 M Street NWSuite 650 South Washington, DC 20036
www.macpac.gov 202-350-2000202-273-2452
Advising Congress on Medicaid and CHIP Policy