Embed Size (px)
Citation preview
Report to Congress:
“Vehicle Safety Recall Completion Rates Report”
Prepared by the
U.S. Department of Transportation
National Highway Traffic Safety Administration
May 2017
This report is submitted in response to the request by Congress under the new transportation reauthorization bill, the Fixing America’s Surface Transportation Act (FAST Act). The FAST Act authorizes funds for Federal-aid highways, highway-safety programs, transit programs, and
other purposes.

2
CONTENTS
I. INTRODUCTION
II. BACKGROUND
III. METHODOLOGY, DATA CONSTRAINTS, AND OTHER CONSIDERATIONS
a. Scope of this Report
b. Calculating Recall Completion Rates
c. Limitations of the Data
d. What Can and Cannot be Concluded from this Analysis
IV. ANNUAL RECALL COMPLETION RATES
a. Annual Rates by Manufacturer
b. Annual Rates by Model Year
c. Annual Rates by Component
d. Annual Rates by Vehicle Type
V. RECALL COMPLETION TRENDS AND SIGNIFICANT FACTORS
a. Adjustments to the Data
b. Exploratory Analysis and Data Visualization
c. Significant Factor Identification and Model Introduction
d. Model Fit with Recall Completion Rates
e. Model Results and Most Significant Factors
VI. SUMMARY OF FINDINGS
VII. ACTIONS TO IMPROVE RECALL COMPLETION RATES
3
I. INTRODUCTION
On December 4, 2015, President Obama signed into law the Fixing America’s Surface
Transportation Act (FAST Act). This bill provides long-term funding for Federal-aid highways,
highway-safety programs, transit programs, and other purposes.
Section 24104 of the FAST Act, “Recall Process” states that:
(c) RECALL COMPLETION RATES REPORT.— (1) IN GENERAL.—Not later than 1 year
after the date of enactment of this Act, and biennially thereafter for 4 years, the Secretary shall—
(A) conduct an analysis of vehicle safety recall completion rates to assess potential
actions by the National Highway Traffic Safety Administration to improve vehicle safety
recall completion rates; and
(B) submit to the Committee on Commerce, Science, and Transportation of the Senate
and the Committee on Energy and Commerce of the House of Representatives a report on
the results of the analysis.
(2) CONTENTS.—Each report shall include—
(A) the annual recall completion rate by manufacturer, model year, component (such as
brakes, fuel systems, and air bags), and vehicle type (passenger car, sport utility vehicle,
passenger van, and pick-up truck) for each of the 5 years before the year the report is
submitted;
(B) the methods by which the Secretary has conducted analyses of these recall
completion rates to determine trends and identify risk factors associated with lower recall
rates; and
4
(C) the actions the Secretary has planned to improve recall completion rates based on the
results of this data analysis.
This report responds to the FAST Act requirement that the Secretary of Transportation conduct
an analysis of vehicle safety recall completion rates and submit the findings of that report to the
Committee on Commerce, Science, and Transportation of the Senate and the Committee of
Energy and Commerce of the House of Representatives.
II. BACKGROUND
The National Highway Traffic Safety Administration (“NHTSA” or “the Agency”) works each
day to administer safety recalls in accordance with the Motor Vehicle Safety Act. Safety recalls
are conducted when manufacturers of motor vehicles or motor vehicle equipment determine that
a safety defect is present in the manufacturer’s product or that the product does not conform to
minimum safety standards1. When a manufacturer issues a safety recall, 49 CFR Parts 573 and
577 require, among other things, the manufacturer to complete the following:
i. Notify the Agency with a Part 573 Recall Report which identifies the recalled
product, summarizes the safety problem, and details the manufacturer’s plans to offer
a free remedy.
ii. Notify owners and purchasers, by First Class mail, of the recall and the available free
remedy to address the safety risk.
iii. Report to the Agency for six quarters the number of recalled products that have been
remedied by the manufacturer.
1 49 USC §30118 also authorizes the Secretary of Transportation to decide when a motor vehicle or motor vehicle equipment contains a safety defect or a noncompliance with a minimum safety standard.

5
Recall quarterly reports are submitted to the Agency for six quarters after a recall remedy
program is launched. These quarterly reports include counts for how many vehicles were
remedied; how many were inspected but no remedy was required; and how many were exported,
stolen, scrapped, or the owner could not be reached (e.g., undeliverable mail).
III. METHODOLOGY, DATA CONSTRAINTS, AND OTHER CONSIDERATIONS
NHTSA’s methodology for examining recall quarterly reports is as follows:
a. Scope of this Report
The FAST Act specifies light vehicle applications to be studied. NHTSA categorizes light
vehicles into three major categories: Light Trucks, Multipurpose Passenger Vehicles (“MPV”)
such as sport utility vehicles (“SUV”) and mini vans, and Passenger Cars. For each category the
Agency examined the number of vehicles that were reported as being remedied.
Many safety recalls involve more than one type of light vehicle. For example, FCA Chrysler
LLC recall 10V-009 (Subject: Brake Booster Input Rod Retaining Clip) includes the Chrysler
Sebring (passenger car), Dodge Ram (light truck), and Jeep Grand Cherokee (MPV), among
other models. Of the 964 recalls analyzed in this report, 185 recalls (19% of recalls analyzed)
involved a combination of passenger cars, MPVs, and light trucks. As such, the Agency created
an additional category labeled “Mix” for this report to indicate recalls that include a combination
of vehicle types.
For this report, the Agency examined recalls issued between 2010 and 2014, in which the
manufacturer reported the recall’s completion status for at least five quarters after the remedy
program became available (as of July 1, 2016). Recalls that had not reached this maturation
6
point—including recalls filed in calendar year (CY) 2015—were not included because these
recalls would distort the completion picture.
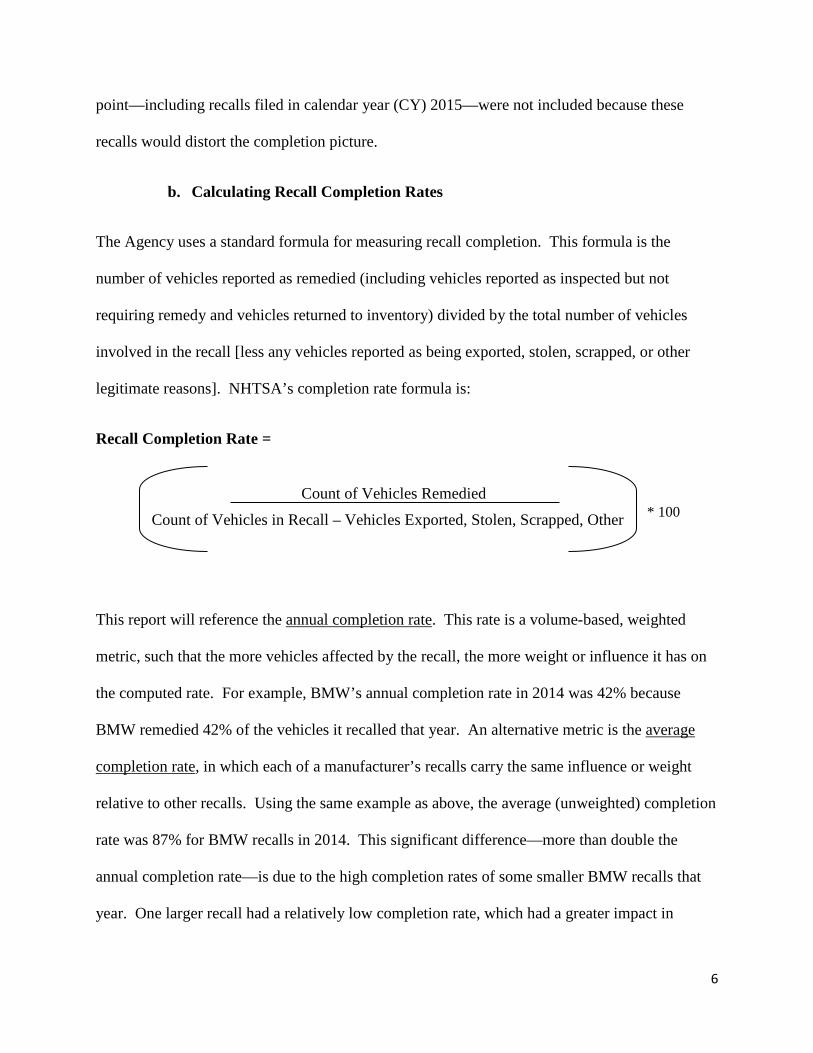
b. Calculating Recall Completion Rates
The Agency uses a standard formula for measuring recall completion. This formula is the
number of vehicles reported as remedied (including vehicles reported as inspected but not
requiring remedy and vehicles returned to inventory) divided by the total number of vehicles
involved in the recall [less any vehicles reported as being exported, stolen, scrapped, or other
legitimate reasons]. NHTSA’s completion rate formula is:
Recall Completion Rate = Count of Vehicles Remedied
Count of Vehicles in Recall – Vehicles Exported, Stolen, Scrapped, Other
* 100
This report will reference the annual completion rate. This rate is a volume-based, weighted
metric, such that the more vehicles affected by the recall, the more weight or influence it has on
the computed rate. For example, BMW’s annual completion rate in 2014 was 42% because
BMW remedied 42% of the vehicles it recalled that year. An alternative metric is the average
completion rate, in which each of a manufacturer’s recalls carry the same influence or weight
relative to other recalls. Using the same example as above, the average (unweighted) completion
rate was 87% for BMW recalls in 2014. This significant difference—more than double the
annual completion rate—is due to the high completion rates of some smaller BMW recalls that
year. One larger recall had a relatively low completion rate, which had a greater impact in
7
bringing down the annual completion rate. All unweighted averages referenced in this report
will be specifically designated as “unweighted.”
c. Limitations of the Data
This report compares recall completion rates among multiple variables, including the
manufacturers and vehicle components involved. However, the Agency feels it is important to
note that the findings provide only a partial picture. The Agency understands a myriad of factors
affect recall completion rates and many of these factors are intangible, difficult to measure
quantitatively (if not impossible), and/or not available to NHTSA. Accordingly, this report will
provide metrics and analysis based on data that NHTSA receives and maintains, but the
following caveats should be noted:
1. No demographic information: Owner demographics, including socioeconomic factors and
location of residence, as well as each owner’s subjective assessment of risk, are believed to play
a significant role in recall completion. However, this data is not available to the Agency.
2. Limited verification of manufacturer-supplied figures: With the available data, the Agency is
unable to verify the numbers of remedied vehicles reported by manufacturers. Likewise, the
Agency cannot verify the numbers of vehicles reported as exported, stolen, scrapped, or
otherwise legitimately deducted from the number of vehicles recalled.
3. Initial parts shortages and restrictions: Parts delays and shortages can affect the availability
of a recall remedy, particularly when a manufacturer first launches a remedy program. Such
delays and parts shortages could thus be a factor in recall completion, especially if vehicle
owners become frustrated or apathetic after attempting to obtain a remedy that is not yet
8
available. However, given the available data, the Agency is unable to reliably measure the
connection or the magnitude of any impact it may have on recall completion rates.
4. No detailed model year breakdown: As discussed later in this report (see Section IV.b), recall
completion rates appear to be significantly impacted by the age of the vehicles involved.
However, NHTSA only receives data for the total number of vehicles affected and repaired for a
given recall without any breakdown for vehicle age. A recall impacting 100,000 model years
2014 and 2015 Honda Civics might include 99,000 model year 2014 vehicles and 1,000 model
year 2015 vehicles, or vice versa. With the available data, however, NHTSA is unable to
determine how many vehicles of each model year had been remedied, and thus is limited in its
ability to measure the precise effect that vehicle age has on recall completion rates.
5. No detailed model breakdown: A safety recall can include a variety of models. However, as
with model years, manufacturers are not required to report their recall populations providing this
level of granularity. For example, a Ford recall for 1 million vehicles might include the Ford
Explorer and the Ford Mustang. However, the specific number of affected Explorers versus
Mustangs would not be provided. Similarly, when the manufacturer submits its quarterly
completion reports, it would not be clear how many Explorers were remedied versus the number
of Mustangs remedied.
6. No measure of severity: NHTSA does not categorize recalls according to the degree of risk
they pose. Although all recalls address safety risks, vehicle owners might be less motivated to
seek a remedy for a matter they perceive to be “low-risk.” In this analysis, NHTSA attempts to
control for severity by examining recalls whose descriptions mention a vehicle crash or fire. But
this control is imperfect. These terms may not necessarily be used in only the most high-risk
9
recalls, or they may be used when describing recalls that are not perceived to be particularly
high-risk. For example, the word “crash” might be included in the recall description for an
incorrect tire pressure label because overinflated tires could explode and cause a crash.
Nonetheless, some owners might not perceive the risk of an incorrect label as severe enough to
warrant obtaining the remedy.
7. No measure of cost: A vehicle owner may be more likely to take advantage of a free repair for
an issue he or she perceives would be costly under normal repair circumstances. However, the
Agency does not have data indicating how much each recall remedy costs (or is perceived by
owners to cost).
8. Inconsistent component classification: This analysis uses a component classification that is
determined by NHTSA’s analysis of the Part 573 Recall Reports it receives. While NHTSA
strives to be consistent in its classification choices, a degree of subjectivity is required in
classifying some vehicle components, given the variety of components that can necessitate a
recall. Also, inconsistencies across manufacturers can present challenges to utilizing a uniform
taxonomy for vehicle components.
9. Limited time period: The analysis in this report is based on recalls that were issued between
2010 and 2014. To the extent that the recalls undertaken during this time period were not
representative or materially different in other time periods, the results of this analysis might not
be applicable.
10
d. What Can and Cannot be Concluded from this Analysis
The analysis found in this report is presented in two parts. Sections IV and V.b present “raw
data” on which no statistical modeling has been performed. Sections V.c through V.e present
results from a statistical model.
Using the raw data, the Agency can draw some tentative conclusions, but these should be viewed
cautiously. For example, Figure 1 (see Section IV.a) indicates that some manufacturers tend to
have higher recall completion rates. However, this may be misleading because manufacturers
issued different types of recalls between 2010 and 2014. Some manufacturers had more airbag
recalls, while some had more seat belt recalls. Some manufacturers had multiple recalls
involving older vehicles, while some manufacturers had recalls for newer vehicles.
NHTSA attempted to draw stronger conclusions by developing a statistical model but those
results remain hampered by the information available to it. As noted above (see Section III.c),
the Agency lacks data on many factors that may affect recall completion rates to varying degrees.
For example, Toyota might perform better than a smaller manufacturer for a given recall (on
average, 20 percentage points better). While this is a valid assessment, the difference might be
explained by information not available to NHTSA, such as the demographics of Toyota owners,
the perceived risk of the defects, or the perceived costs of the remedies. The performance
differential could also be impacted by the particular recalls issued between 2010 and 2014. If the
Agency fit the same model to an earlier or later period of light vehicle recalls, the difference in
recall completion rates between Toyota and a smaller manufacturer could potentially increase or
decrease—or disappear entirely.
11
In essence, NHTSA cannot quantitatively conclude that any manufacturer truly performed
“better” than any other manufacturer, or that recalls for any particular component are truly
problematic. The figures that appear to support any such conclusion could, in theory, be
explained by data not available during the Agency’s analysis.
IV. ANNUAL RECALL COMPLETION RATES
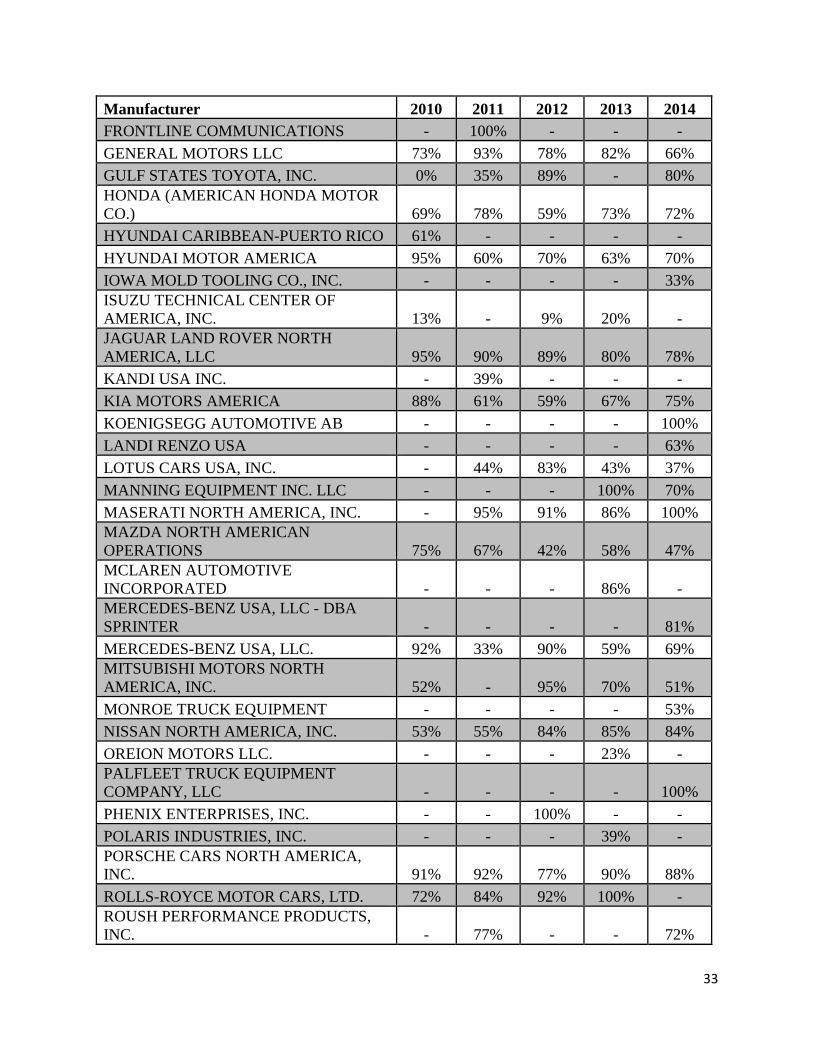
a. Annual Rates by Manufacturer
Appendix A details the annual recall completion rates, by manufacturer, for light vehicle recalls
issued between years 2010 and 2014. Seventy-five manufacturers are detailed in the table
located in Appendix A. However, the vast majority of light vehicles recalled between 2010 and
2014 (over 98%) were recalled by the major vehicle manufacturers which support NHTSA’s
VIN Look-up Tool found on www.safercar.gov2. Annual recall completion rates for these
manufacturers are provided below.
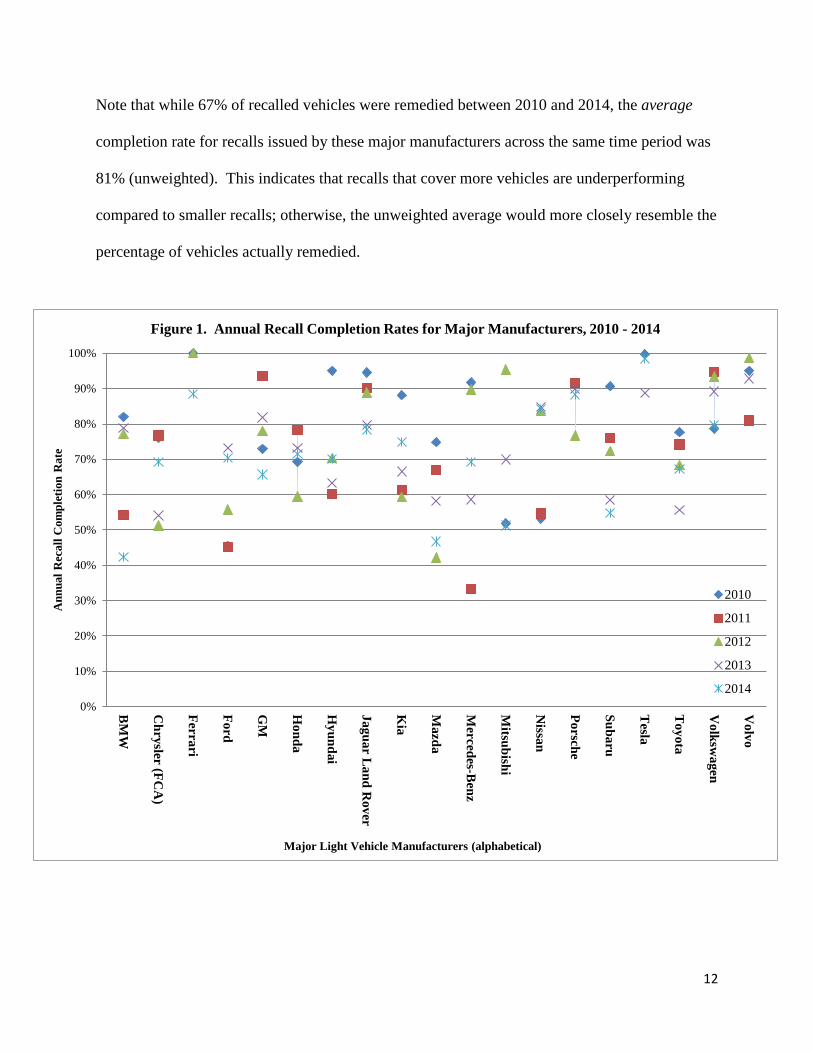
Figure 1 (shown below) displays the major manufacturers of light vehicles and the ranges of
their annual completion rates3. For these manufacturers, the combined annual completion rate is
67%, meaning 67% of all vehicles recalled were remedied. Ferrari and Tesla reached the highest
annual completion rates with 100% of their vehicles remedied in a given year. The lowest
annual completion rate was Mercedes-Benz with 33% of its vehicles being remedied for recalls
issued in 2011. In certain years, Mazda, BMW, and Ford also experienced relatively low
completion rates in the 40% range.
2 Manufacturers which support the Agency’s VIN Look-up Tool are listed here: https://vinrcl.safercar.gov/vin/. 3 Figure 1. does not imply any relationship between years.
12
Note that while 67% of recalled vehicles were remedied between 2010 and 2014, the average
completion rate for recalls issued by these major manufacturers across the same time period was
81% (unweighted). This indicates that recalls that cover more vehicles are underperforming
compared to smaller recalls; otherwise, the unweighted average would more closely resemble the
percentage of vehicles actually remedied.
0%
10%
20%
30%
40%
50%
60%
70%
80%
90%
100%
BM
W
Chrysler (FC
A)
Ferrari
Ford
GM
Honda
Hyundai
Jaguar Land R
over
Kia
Mazda
Mercedes-B
enz
Mitsubishi
Nissan
Porsche
Subaru
Tesla
Toyota
Volksw
agen
Volvo
Ann
ual R
ecal
l Com
plet
ion
Rat
e
Major Light Vehicle Manufacturers (alphabetical)
Figure 1. Annual Recall Completion Rates for Major Manufacturers, 2010 - 2014
2010
2011
2012
2013
2014
13
b. Annual Rates by Model Year
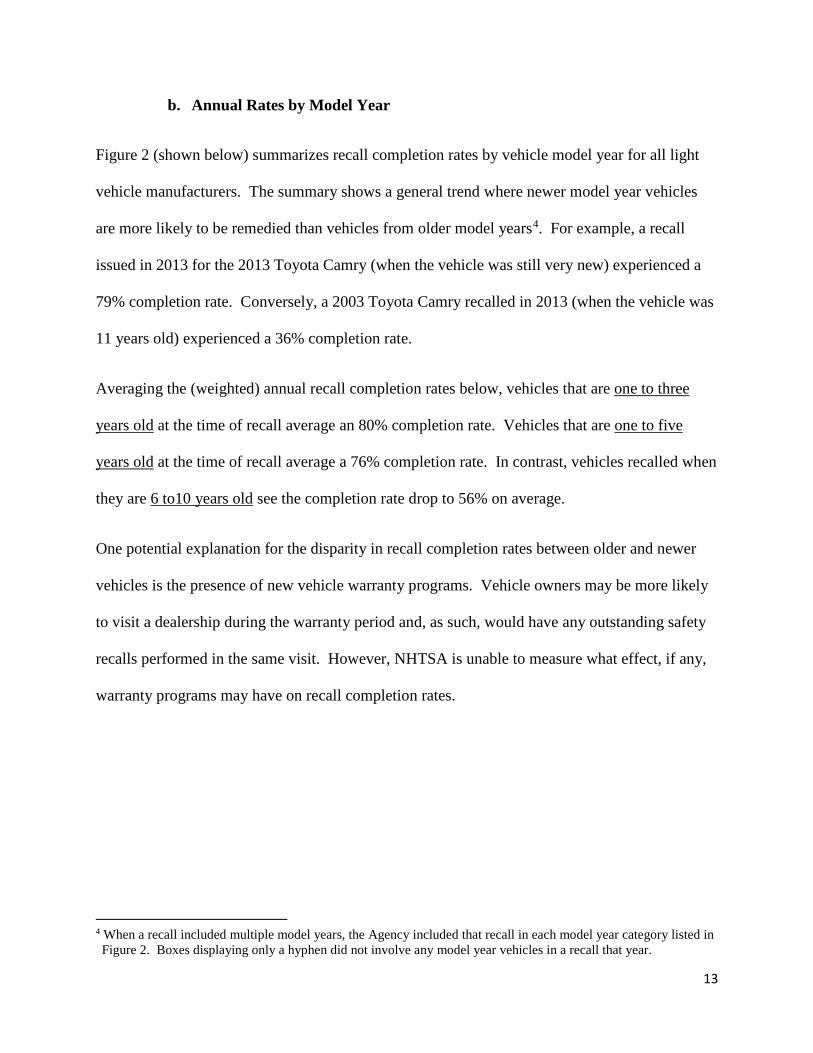
Figure 2 (shown below) summarizes recall completion rates by vehicle model year for all light
vehicle manufacturers. The summary shows a general trend where newer model year vehicles
are more likely to be remedied than vehicles from older model years4. For example, a recall
issued in 2013 for the 2013 Toyota Camry (when the vehicle was still very new) experienced a
79% completion rate. Conversely, a 2003 Toyota Camry recalled in 2013 (when the vehicle was
11 years old) experienced a 36% completion rate.
Averaging the (weighted) annual recall completion rates below, vehicles that are one to three
years old at the time of recall average an 80% completion rate. Vehicles that are one to five
years old at the time of recall average a 76% completion rate. In contrast, vehicles recalled when
they are 6 to10 years old see the completion rate drop to 56% on average.
One potential explanation for the disparity in recall completion rates between older and newer
vehicles is the presence of new vehicle warranty programs. Vehicle owners may be more likely
to visit a dealership during the warranty period and, as such, would have any outstanding safety
recalls performed in the same visit. However, NHTSA is unable to measure what effect, if any,
warranty programs may have on recall completion rates.
4 When a recall included multiple model years, the Agency included that recall in each model year category listed in Figure 2. Boxes displaying only a hyphen did not involve any model year vehicles in a recall that year.
14
Figure 2. Annual Recall Completion Rates by Vehicle Model Year
Recall Year Model Year 2010 2011 2012 2013 2014
1986 - - - 50% - 1990 13% - - - - 1991 13% - - - - 1992 13% - - - - 1994 - 15% - 36% 33% 1995 - 15% - 36% - 1996 - 42% - 36% - 1997 50% 37% - 36% 35% 1998 44% 37% 23% 36% 35% 1999 44% 37% 27% - 35% 2000 48% 37% 27% - 47% 2001 48% 38% 39% 29% 46% 2002 45% 41% 45% 36% 46% 2003 48% 52% 50% 36% 55% 2004 55% 56% 56% 39% 54% 2005 69% 66% 62% 45% 56% 2006 70% 68% 65% 52% 56% 2007 72% 71% 68% 54% 57% 2008 74% 72% 67% 58% 59% 2009 75% 75% 69% 63% 68% 2010 76% 77% 71% 64% 68% 2011 75% 83% 77% 66% 71% 2012 - 93% 86% 75% 72% 2013 - - 88% 79% 76% 2014 - - - 94% 78% 2015 - - - 95% 92%
c. Annual Rates by Component
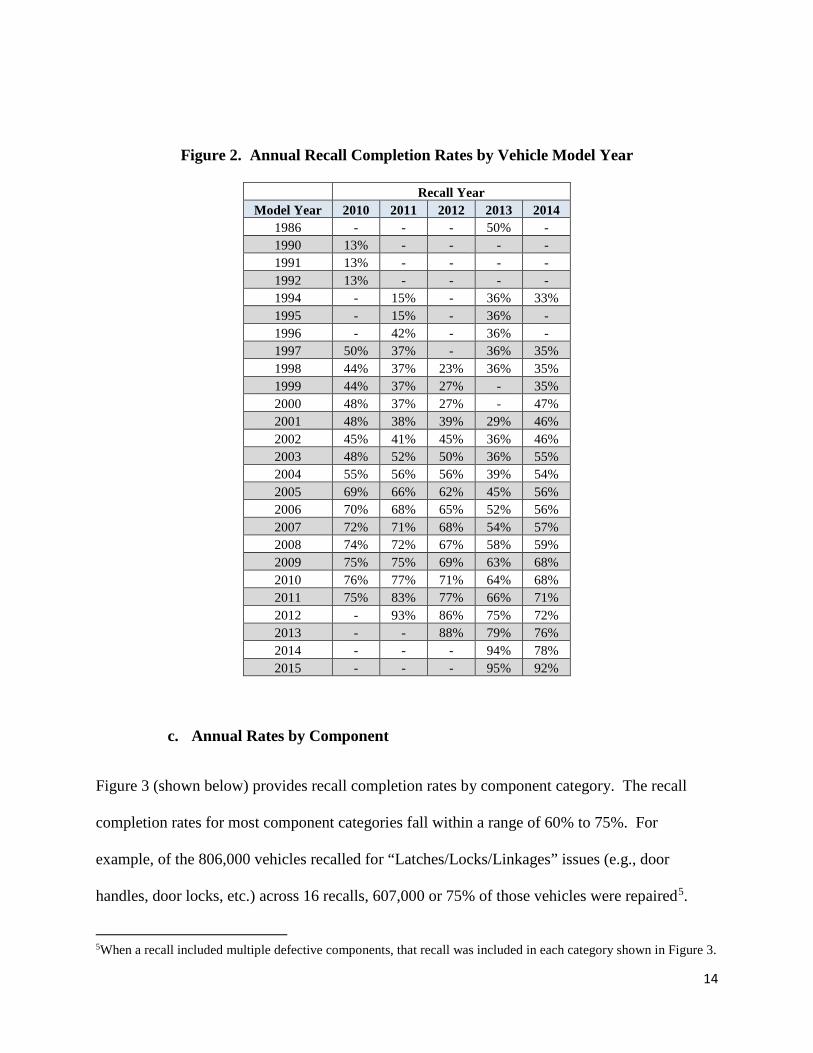
Figure 3 (shown below) provides recall completion rates by component category. The recall
completion rates for most component categories fall within a range of 60% to 75%. For
example, of the 806,000 vehicles recalled for “Latches/Locks/Linkages” issues (e.g., door
handles, door locks, etc.) across 16 recalls, 607,000 or 75% of those vehicles were repaired5.
5When a recall included multiple defective components, that recall was included in each category shown in Figure 3.
15
Recalls for the component categories “Structure,” “Lighting,” and “Suspension” did not perform
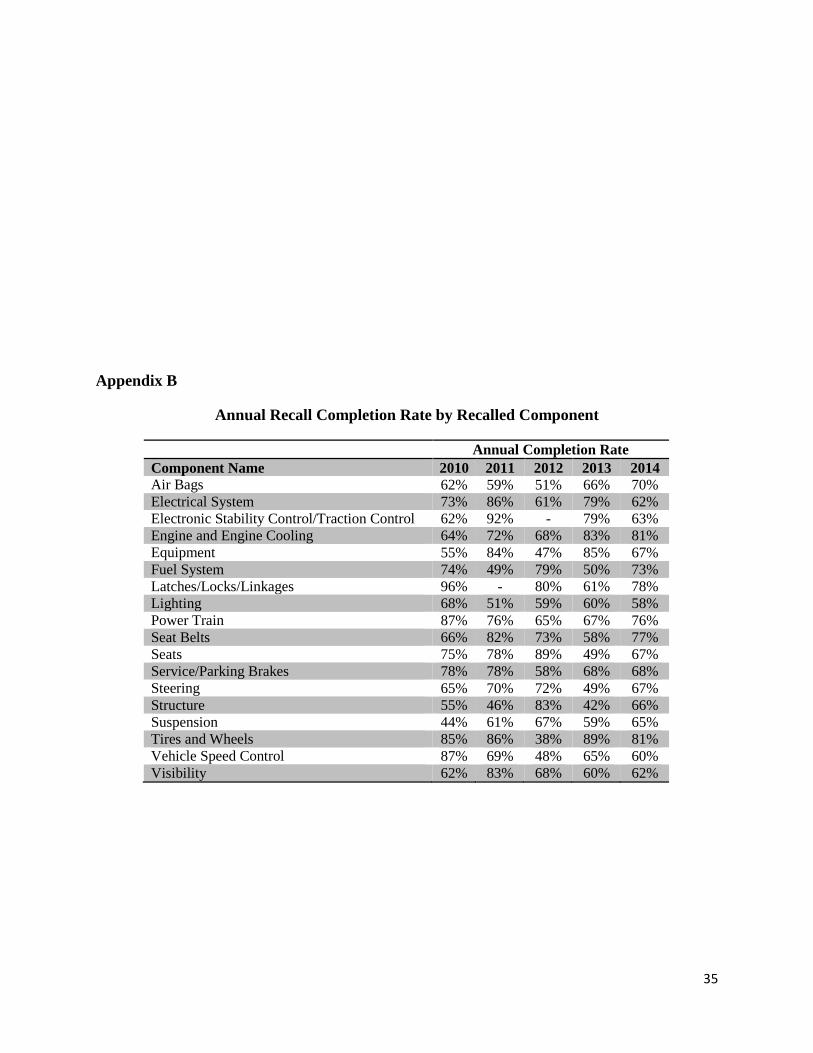
as well with between 51% and 59% of vehicles remedied for those issues. Appendix B provides
component category completion rates by recall year. In Figure 3, the number of recalls for each
component category is provided in parentheses beside the component category name. Also, the
horizontal axis has been magnified to display only 40% through 80% completion rates to better
highlight the distinctions between component categories.
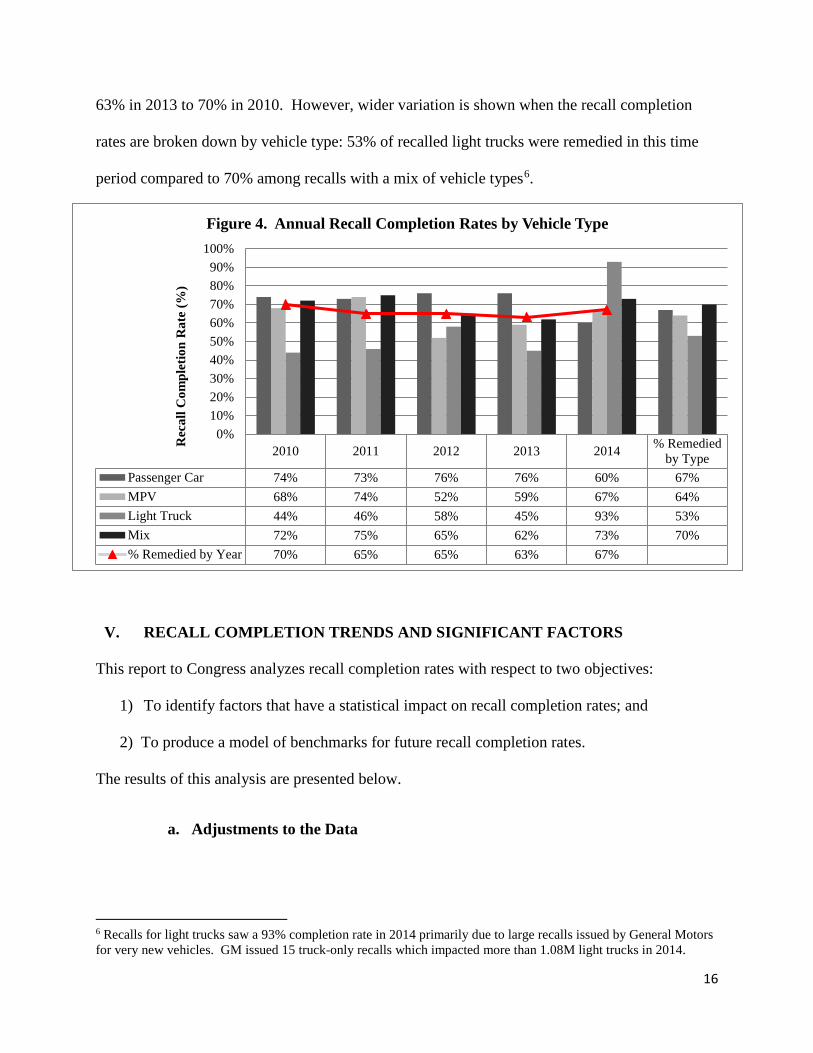
d. Annual Rates by Vehicle Type
Figure 4 (shown below) depicts annual recall completion rates based on vehicle type. As noted
in Section III, 19% of recalls include a mix of vehicles types and those are represented in the
“Mix” category. The annual recall completion rate, for all vehicles combined, ranged between
75%74%
73%72%72%
71%70%69%
67%66%65%65%65%
64%62%
59%59%
51%
40% 45% 50% 55% 60% 65% 70% 75% 80%
Latches/Locks/Linkages (16)Tires and Wheels (35)
Power Train (89)Equipment (69)Seat Belts (36)
Vehicle Speed Control (22)Parking/Service Brakes (86)
Engine and Engine Cooling (68)Visibility (46)
Electrical System (114)Air Bags (122)
Seats (38)Electronic Stabililty Control/Traction Control (12)
Steering (77)Fuel System (96)Suspension (56)
Lighting (54)Structure (30)
Recall Completion Rate (%)
Rec
alle
d C
ompo
nent
Cat
egor
y (#
of r
ecal
ls p
erfo
rmed
)
Figure 3. Annual Recall Completion Rates by Recalled Component
Completion%
16
63% in 2013 to 70% in 2010. However, wider variation is shown when the recall completion
rates are broken down by vehicle type: 53% of recalled light trucks were remedied in this time
period compared to 70% among recalls with a mix of vehicle types6.
2010 2011 2012 2013 2014 % Remediedby Type
Passenger Car 74% 73% 76% 76% 60% 67%MPV 68% 74% 52% 59% 67% 64%Light Truck 44% 46% 58% 45% 93% 53%Mix 72% 75% 65% 62% 73% 70%% Remedied by Year 70% 65% 65% 63% 67%
0%10%20%30%40%50%60%70%80%90%
100%
Rec
all C
ompl
etio
n R
ate
(%)
Figure 4. Annual Recall Completion Rates by Vehicle Type
V. RECALL COMPLETION TRENDS AND SIGNIFICANT FACTORS
This report to Congress analyzes recall completion rates with respect to two objectives:
1) To identify factors that have a statistical impact on recall completion rates; and
2) To produce a model of benchmarks for future recall completion rates.
The results of this analysis are presented below.
a. Adjustments to the Data
6 Recalls for light trucks saw a 93% completion rate in 2014 primarily due to large recalls issued by General Motors for very new vehicles. GM issued 15 truck-only recalls which impacted more than 1.08M light trucks in 2014.
17
Of the 964 light vehicle recalls examined for this report, the dataset utilized for the analysis
below uses 918 of them. Recalls that involved only one vehicle, as well as recalls that included
any medium and/or heavy-duty vehicles (in addition to light vehicles), were removed for this
analysis. Additionally, 61 recall completion rates received minor adjustments for technical
reasons: the analysis below could not properly incorporate rates of 0% or 100%, so recalls with
either of those completion rates were adjusted to just above 0% (2 recalls) and just below 100%
(59 recalls), as appropriate.
Approximately 53% of the recalls analyzed in this report included vehicles of multiple model
years7. As noted in Section III of this report, NHTSA does not receive a detailed itemization of
recalled vehicles by model year, only an overall total. For recalls that included vehicles in
multiple model years, only the oldest model year was considered in development of the model
below.
Approximately 6% of the recalls identified more than one defective component. Due to
technical reasons, only the first listed component for these recalls was considered in the model.
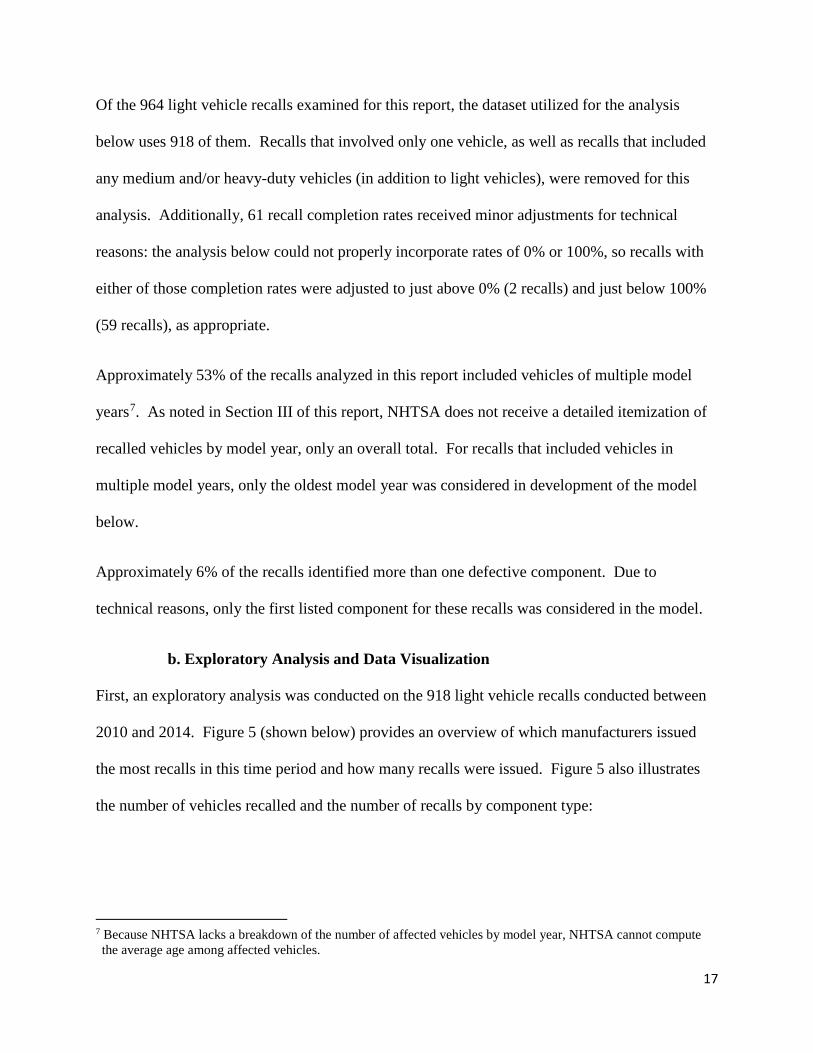
b. Exploratory Analysis and Data Visualization
First, an exploratory analysis was conducted on the 918 light vehicle recalls conducted between
2010 and 2014. Figure 5 (shown below) provides an overview of which manufacturers issued
the most recalls in this time period and how many recalls were issued. Figure 5 also illustrates
the number of vehicles recalled and the number of recalls by component type:
7 Because NHTSA lacks a breakdown of the number of affected vehicles by model year, NHTSA cannot compute the average age among affected vehicles.
18
Figure 5. Exploratory Data Analysis
Vehicles Recalled by Component
Recall Count by
Component
Other Components
Vehicles Recalled by
Manufacturer
Recall Count by
Manufacturer
Other Major MFRs
Totals: 918 recalls, affecting 110,221,095 vehicles
A significant number of vehicles recalled for this time period can be attributed to General Motors
and Toyota recalls and the component categories “Electrical System” and “Air Bags.”
Although not depicted in Figure 5, or any figure, there is considerable variation in the size of
recalls. More than a quarter of the recalls include less than 1,000 vehicles each; 3% of the recalls
include more than 1 million vehicles each. Additionally, Figure 5 does not take into account the
overall U.S. market share of each manufacturer, which may partially explain the numbers of
vehicles recalled.
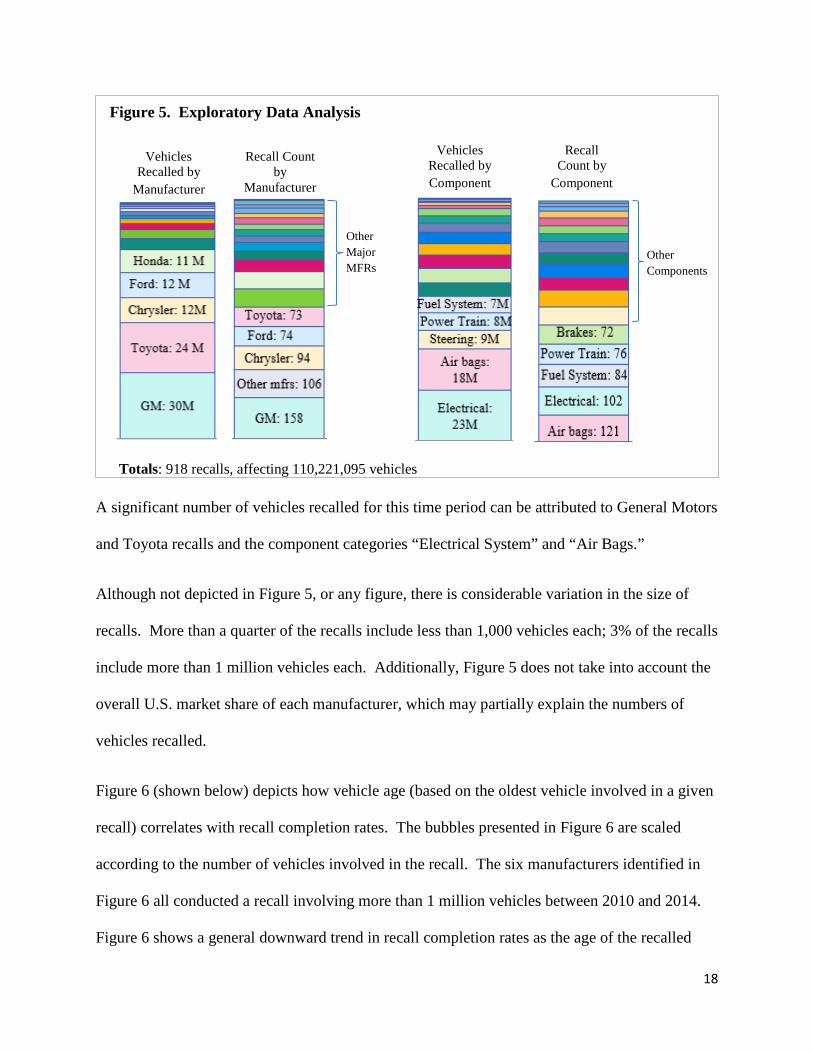
Figure 6 (shown below) depicts how vehicle age (based on the oldest vehicle involved in a given
recall) correlates with recall completion rates. The bubbles presented in Figure 6 are scaled
according to the number of vehicles involved in the recall. The six manufacturers identified in
Figure 6 all conducted a recall involving more than 1 million vehicles between 2010 and 2014.
Figure 6 shows a general downward trend in recall completion rates as the age of the recalled
19
vehicles increases. Generally, recalls involving newer vehicles have higher recall completion
rates than recalls involving older vehicles. The two large bubbles to the right of the chart
represent General Motors’ recalls for ignition switch defects in 2014. Together, these two recalls
affected more than 9 million vehicles, and some affected vehicles were up to 18 years old.
0%
20%
40%
60%
80%
100%
0 5 10 15 20
Rec
all C
ompl
etio
n R
ate
Age of the oldest vehicle in the recall
Figure 6. Impact of Vehicle Age on Recall Completion Rates[918 recalls]
Chrysler
Ford
GM
Honda
Hyundai
Toyota
Another manufacturer
Scale= 500,000 vehicles
= 1,000,000 vehicles
GM ignition switch, 9M vehicles total
Of the 918 recalls examined in creating this model:
661 recalls (72%) were for vehicles four years or less of age when the recall was issued.
96 of these (15% of 661) had completion rates less than 75%.
As noted above, recalls involving these newer vehicles should have a relatively high recall
completion rate, so it bears noting which recalls underperformed.
Figure 7 (shown below) illustrates the component categories identified in these recalls with a
completion rate less than 75% and where the involved vehicles were four years old or less.
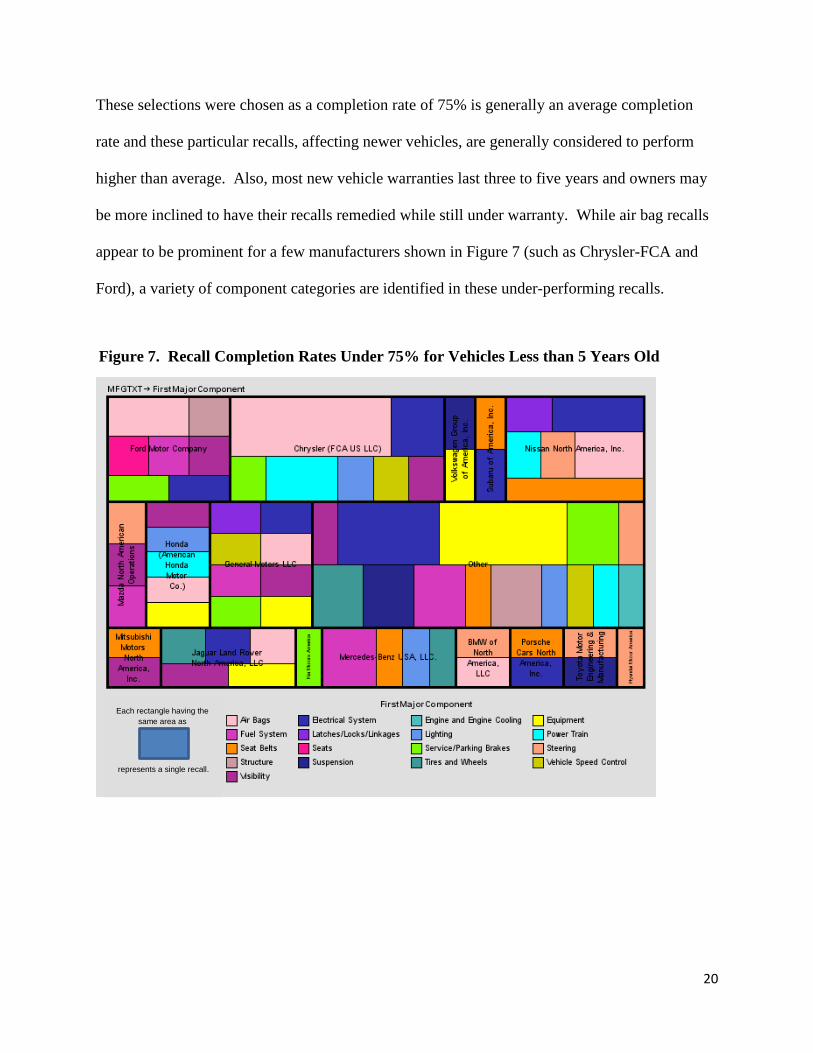
20
These selections were chosen as a completion rate of 75% is generally an average completion
rate and these particular recalls, affecting newer vehicles, are generally considered to perform
higher than average. Also, most new vehicle warranties last three to five years and owners may
be more inclined to have their recalls remedied while still under warranty. While air bag recalls
appear to be prominent for a few manufacturers shown in Figure 7 (such as Chrysler-FCA and
Ford), a variety of component categories are identified in these under-performing recalls.
Figure 7. Recall Completion Rates Under 75% for Vehicles Less than 5 Years Old
Each rectangle having the same area as
represents a single recall.
21
c. Significant Factor Identification and Model Introduction
When examining the multiple variables associated with safety recalls, the Agency identified six
primary factors that have a statistically significant effect on the recall completion rate:
1. The manufacturer;
2. The age of the oldest affected vehicle;
3. The vehicle type involved (i.e. passenger cars, lights trucks, MPVs);
4. The component category;
5. The recall safety risk description includes the word “crash” and;
6. The recall safety risk description includes the word “fire.”
NHTSA considered additional factors from the recall database, but ultimately did not incorporate
them into the model because they did not affect recall completion rates, created a
counterintuitive impact on rates, or introduced modeling issues. Factors that NHTSA considered
but decided not to incorporate include:
o The year the recall was issued;
o Whether the recall safety risk description included the words “death,” “injury,” or
“serious;”
o The quarter in which the most recent recall completion report was submitted to NHTSA;
o The number of affected vehicles in the recall; and
o Whether the recalls involved a safety compliance label issue.
22
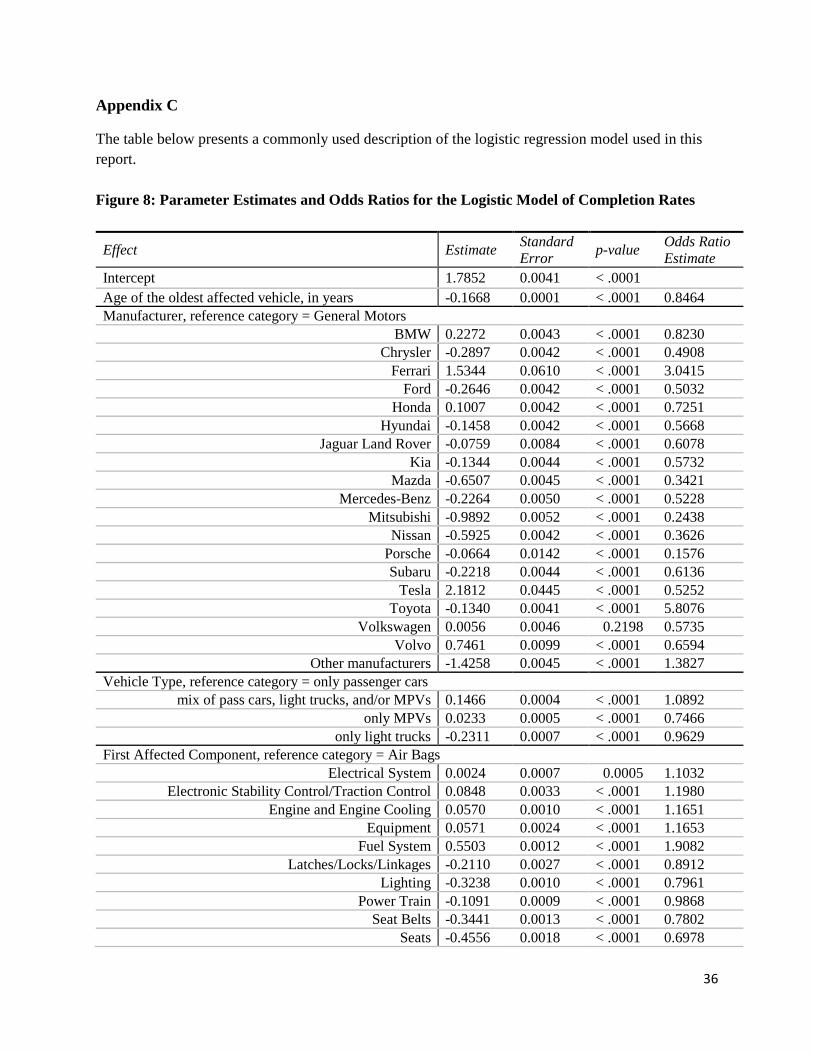
As for the six factors NHTSA did include, NHTSA developed a predictive model (namely, a
main effects logistic regression model8) to assess each factor’s relative impact and to aid in
projecting recall completion rates for future recalls. All 918 recalls contribute equally to the
model. Figure 8, located in Appendix C, presents standard statistical details for the model,
including parameter estimates and odds ratios.
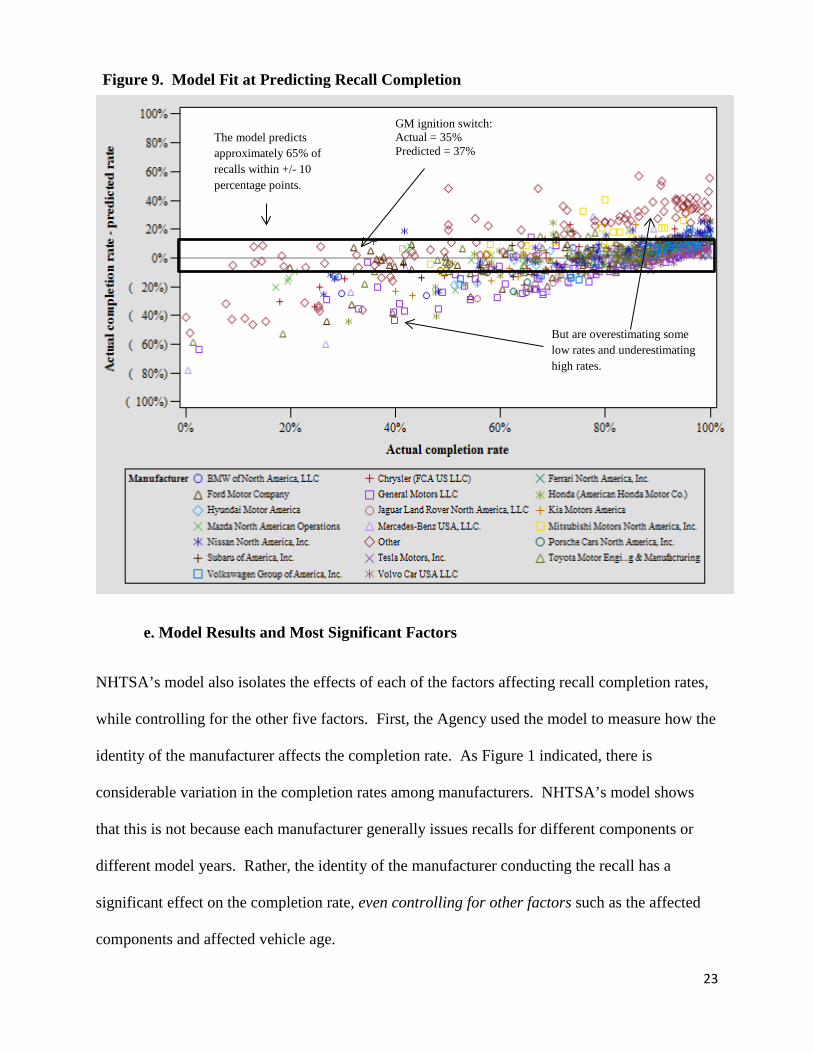
d. Model Fit with Recall Completion Rates
Figure 9 (shown below) illustrates the model. Every data point indicates a separate recall. The
figure shows that NHTSA’s model generally fits the data, but it is not a perfect predictor of recall
completion rates due to the limited data that NHTSA is able to collect, as previously discussed,
and the inherently imperfect nature of modeling. When the 918 light vehicle recalls from 2010
through 2014 were analyzed, the model predicted the correct completion rate for 65% of those
recalls, within plus or minus 10 percentage points. The model fit best for the “major”
manufacturers, such as those found on NHTSA’s VIN Look-up Tool. For these major
manufacturers, the model correctly predicted 67% of recall completion rates within plus or minus
10 percentage points. On the other hand, many of the recalls where the predicted completion
rates were off by more than 10 percentage points involved smaller manufacturers (labeled as
“Other” in Figure 9).
8 Thus NHTSA’s predictive model takes the form 𝑙𝑙𝑙𝑙 𝑟𝑟
1−𝑟𝑟= 𝑋𝑋𝑋𝑋, where r denotes the recall completion rate, X is the
design matrix for the predictors and an intercept term, β denotes the model’s parameter estimates, and ln denotes the natural logarithm.
23
The model predicts approximately 65% of recalls within +/- 10 percentage points.
e. Model Results and Most Significant Factors
NHTSA’s model also isolates the effects of each of the factors affecting recall completion rates,
while controlling for the other five factors. First, the Agency used the model to measure how the
identity of the manufacturer affects the completion rate. As Figure 1 indicated, there is
considerable variation in the completion rates among manufacturers. NHTSA’s model shows
that this is not because each manufacturer generally issues recalls for different components or
different model years. Rather, the identity of the manufacturer conducting the recall has a
significant effect on the completion rate, even controlling for other factors such as the affected
components and affected vehicle age.
GM ignition switch: Actual = 35% Predicted = 37%
But are overestimating some low rates and underestimating high rates.
Figure 9. Model Fit at Predicting Recall Completion
24
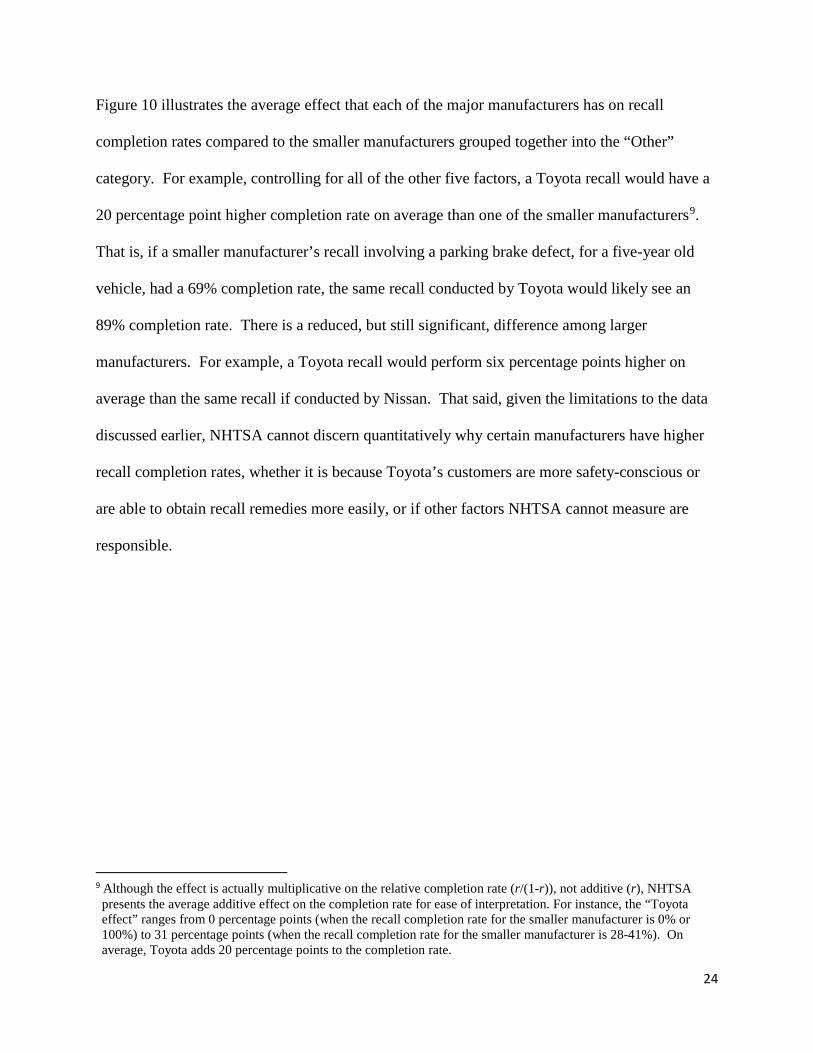
Figure 10 illustrates the average effect that each of the major manufacturers has on recall
completion rates compared to the smaller manufacturers grouped together into the “Other”
category. For example, controlling for all of the other five factors, a Toyota recall would have a
20 percentage point higher completion rate on average than one of the smaller manufacturers9.
That is, if a smaller manufacturer’s recall involving a parking brake defect, for a five-year old
vehicle, had a 69% completion rate, the same recall conducted by Toyota would likely see an
89% completion rate. There is a reduced, but still significant, difference among larger
manufacturers. For example, a Toyota recall would perform six percentage points higher on
average than the same recall if conducted by Nissan. That said, given the limitations to the data
discussed earlier, NHTSA cannot discern quantitatively why certain manufacturers have higher
recall completion rates, whether it is because Toyota’s customers are more safety-conscious or
are able to obtain recall remedies more easily, or if other factors NHTSA cannot measure are
responsible.
9 Although the effect is actually multiplicative on the relative completion rate (r/(1-r)), not additive (r), NHTSA presents the average additive effect on the completion rate for ease of interpretation. For instance, the “Toyota effect” ranges from 0 percentage points (when the recall completion rate for the smaller manufacturer is 0% or 100%) to 31 percentage points (when the recall completion rate for the smaller manufacturer is 28-41%). On average, Toyota adds 20 percentage points to the completion rate.
25
4238
3128
2524
222121
202020
1919
1918
1413
70
0 5 10 15 20 25 30 35 40 45
TeslaFerrariVolvo
GMBMWHonda
VWPorsche
JaguarToyota
KiaHyundai
SubaruMercedes
FordChrysler
NissanMazda
MitsubishiOther
Figure 10. Average Manufacturer Influence on Recall Completion Rates
All differences are statistically significant, except that "Tesla" and "Ferrari" have statistically similar completion rates. Note, however, that because "Tesla" and "Ferrari" each issued only 3 recalls, their estimated increases are not as reliable as for other manufacturers.
Average percentage point increase in the completion rate if the recall is from the given manufacturer, rather than from the manufacturers collectively designated as "Other"
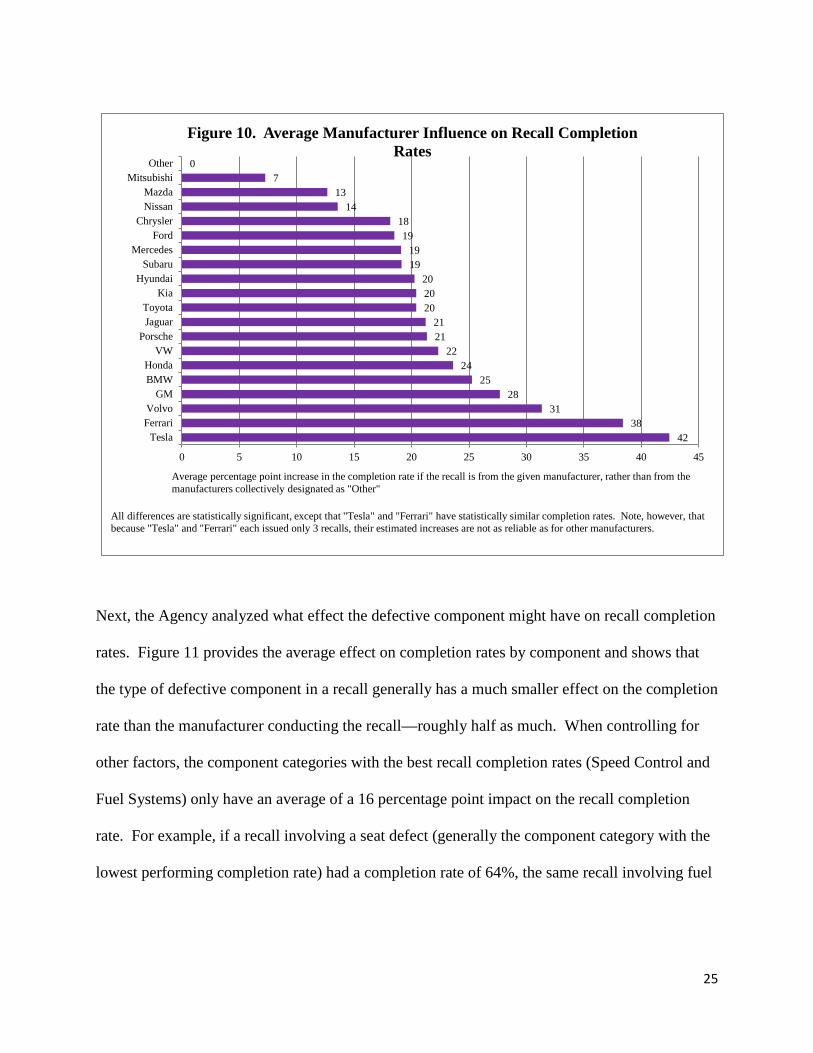
Next, the Agency analyzed what effect the defective component might have on recall completion
rates. Figure 11 provides the average effect on completion rates by component and shows that
the type of defective component in a recall generally has a much smaller effect on the completion
rate than the manufacturer conducting the recall—roughly half as much. When controlling for
other factors, the component categories with the best recall completion rates (Speed Control and
Fuel Systems) only have an average of a 16 percentage point impact on the recall completion
rate. For example, if a recall involving a seat defect (generally the component category with the
lowest performing completion rate) had a completion rate of 64%, the same recall involving fuel
26
systems instead would likely have an 80% completion rate.
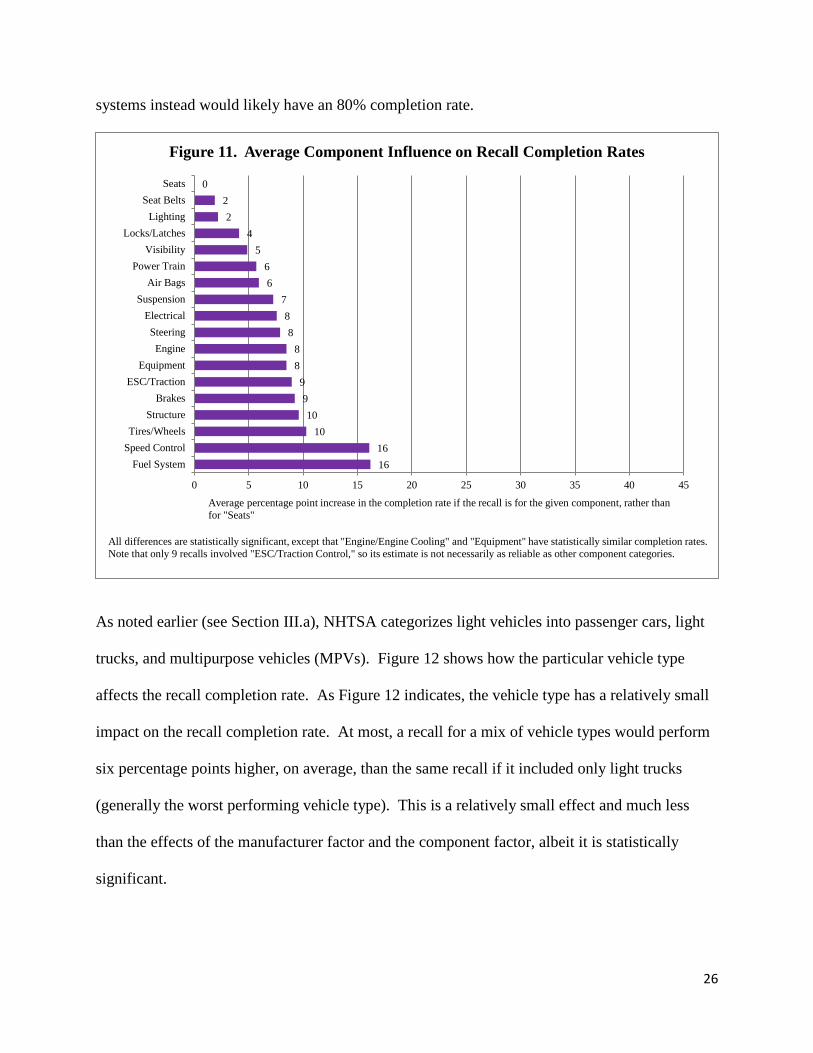
As noted earlier (see Section III.a), NHTSA categorizes light vehicles into passenger cars, light
trucks, and multipurpose vehicles (MPVs). Figure 12 shows how the particular vehicle type
affects the recall completion rate. As Figure 12 indicates, the vehicle type has a relatively small
impact on the recall completion rate. At most, a recall for a mix of vehicle types would perform
six percentage points higher, on average, than the same recall if it included only light trucks
(generally the worst performing vehicle type). This is a relatively small effect and much less
than the effects of the manufacturer factor and the component factor, albeit it is statistically
significant.
1616
1010
99
88
88
766
54
22
0
0 5 10 15 20 25 30 35 40 45
Fuel SystemSpeed ControlTires/Wheels
StructureBrakes
ESC/TractionEquipment
EngineSteering
ElectricalSuspension
Air BagsPower Train
VisibilityLocks/Latches
LightingSeat Belts
Seats
Figure 11. Average Component Influence on Recall Completion Rates
All differences are statistically significant, except that "Engine/Engine Cooling" and "Equipment" have statistically similar completion rates. Note that only 9 recalls involved "ESC/Traction Control," so its estimate is not necessarily as reliable as other component categories.
Average percentage point increase in the completion rate if the recall is for the given component, rather than for "Seats"
27
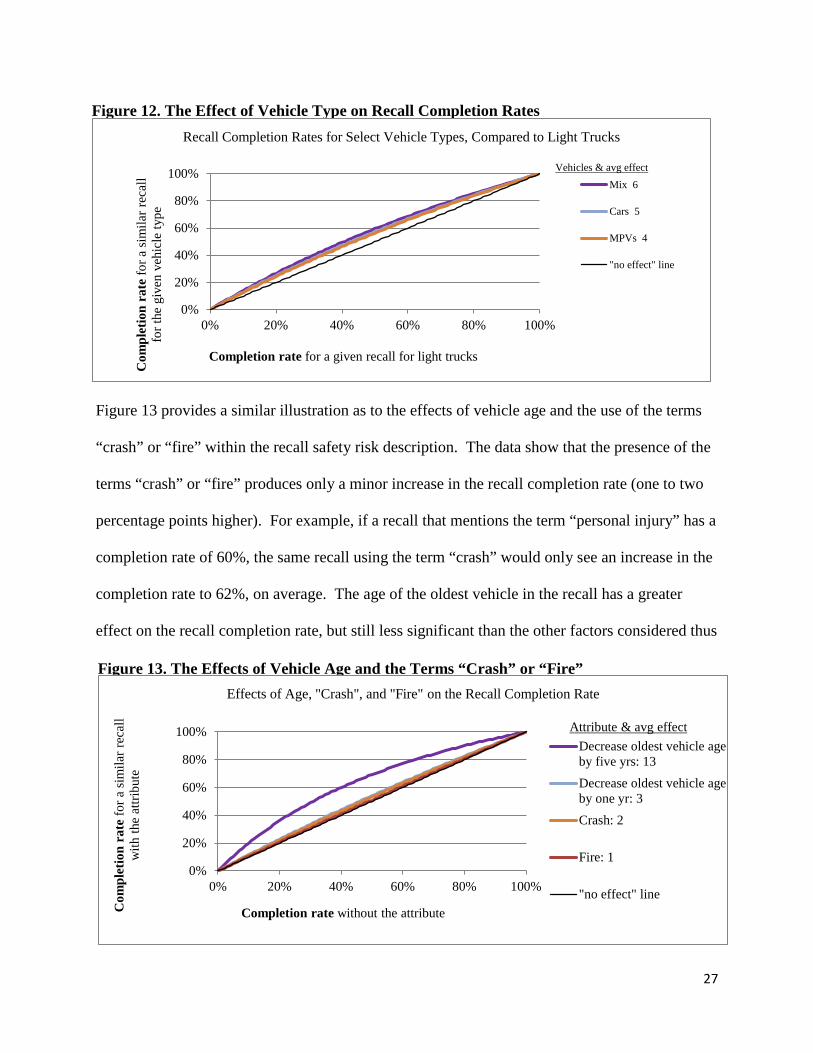
Figure 13 provides a similar illustration as to the effects of vehicle age and the use of the terms
“crash” or “fire” within the recall safety risk description. The data show that the presence of the
terms “crash” or “fire” produces only a minor increase in the recall completion rate (one to two
percentage points higher). For example, if a recall that mentions the term “personal injury” has a
completion rate of 60%, the same recall using the term “crash” would only see an increase in the
completion rate to 62%, on average. The age of the oldest vehicle in the recall has a greater
effect on the recall completion rate, but still less significant than the other factors considered thus
Figure 12. The Effect of Vehicle Type on Recall Completion Rates
0%
20%
40%
60%
80%
100%
0% 20% 40% 60% 80% 100%
Com
plet
ion
rate
for a
sim
ilar r
ecal
l fo
r the
giv
en v
ehic
le ty
pe
Completion rate for a given recall for light trucks
Recall Completion Rates for Select Vehicle Types, Compared to Light Trucks
Mix 6
Cars 5
MPVs 4
"no effect" line
Vehicles & avg effect
Figure 13. The Effects of Vehicle Age and the Terms “Crash” or “Fire”
0%
20%
40%
60%
80%
100%
0% 20% 40% 60% 80% 100%
Com
plet
ion
rate
for a
sim
ilar r
ecal
l w
ith th
e at
tribu
te
Completion rate without the attribute
Effects of Age, "Crash", and "Fire" on the Recall Completion Rate
Decrease oldest vehicle ageby five yrs: 13Decrease oldest vehicle ageby one yr: 3Crash: 2
Fire: 1
"no effect" line
Attribute & avg effect
28
far. All else equal, a recall in which the oldest vehicle is one year newer than in another recall
would increase the recall completion rate by three percentage points, on average. And a recall in
which the oldest vehicle is five years newer than that in another recall would increase the
completion rate by 13 percentage points, on average.
Note, however, that the available data cannot indicate the extent to which the vehicle age effect
is truly a function of age or whether other factors—such as the demographics of owners of new
vehicles or new vehicle warranty programs—play a significant role.
VI. SUMMARY OF FINDINGS
Based on the recall completion analysis provided in section IV and the statistical analysis that
controlled for certain factors in section V, NHTSA made the following findings:
67% of vehicles recalled by major, light vehicle manufacturers between 2010 and 2014 were remedied. The average recall completion rate during this period was 81% (unweighted) for recalls issued by those same manufacturers.
The annual recall completion rate varies significantly, even among major manufacturers. The identity of the manufacturer conducting the recall appears to be a major contributing factor, but for reasons that cannot be ascertained with the available data.
The recalled component is the second strongest factor in recall completion. Controlling for other relevant factors, a recall for fuel systems would perform 16 percentage points higher (on average) than the same recall if it instead involved seats.
The age of the recalled vehicle also plays a significant role in recall completion. Recalls for newer vehicles tend to have higher completion rates than recalls for older vehicles. Controlling for other relevant factors, reducing the age of the oldest vehicle in the recall by 5 years would increase the completion rate by 13 percentage points on average.
29
The model contained in this report predicts 65% of recall completion rates accurately within a 10 percentage point margin of error. This suggests that other factors relevant to recall completion rates are present but not identifiable with the available data.
VII. ACTIONS TO IMPROVE RECALL COMPLETION RATES
NHTSA strives each day to improve the safety recall process and to ensure as many owners as
possible seek remedies for recalled vehicles. The actions below detail the Agency’s recent
efforts to improve the recall process and its upcoming efforts to improve recall completion rates
in the future:
1) August 2013: NHTSA revised regulations concerning recall notification letters which owners
receive via U.S. Mail. Previously, vehicle manufacturers notified owners at unspecified times,
usually when the free recall remedy became available. If parts for the repair were delayed or the
manufacturer could not finalize the repair procedures, this notification could take months or, in
rare cases, even years. Now, under the revised regulations, vehicle manufacturers must issue
letters to owners within 60 days of notifying NHTSA of a safety recall. The Agency also issued
changes revising the language used in the owner notification letter, requiring the owner’s VIN to
be included in the letter, and mandating a new label (shown below) to be printed on every recall
notification envelope.
30
2) August 2014: NHTSA launched its VIN Look-up Tool on www.safercar.gov, which allows
owners to search for their particular vehicle by VIN (or Vehicle Identification Number) to learn
of outstanding safety recalls. NHTSA’s VIN Look-up Tool averages approximately 400,000
VIN search requests for 55 brands of passenger vehicles and motorcycles every week. Also in
August 2014, NHTSA required that vehicle manufacturers make available the same VIN-based
service on their respective websites and those online tools are available today.
3) April 2015: NHTSA hosted a day-long workshop that brought together leading transportation
officials, automotive industry representatives, safety advocates, and researchers to examine how
to improve low recall completion rates. Presentations, notes, and videos from this event can be
viewed here: http://www.nhtsa.gov/nhtsa/symposiums/april2015/index.html
4) January 2016: NHTSA launched a national, recall-focused campaign called Safe Cars Save
Lives. The campaign encourages vehicle owners to check their VINs for open recalls and to
have any recall remedied as soon as possible. The campaign ads can be seen across the internet
on social media and automotive focused websites, and they have performed above the industry
average resulting in over 3.2 million clicks and more than 200 million total impressions.
5) Summer 2016: Following a kickoff event in Atlanta on July 9, 2016, NHTSA’s Safe Cars
Save Lives bus tour traveled across America’s southern states from August 9th to 13th to raise
awareness about the Takata air bag recall and other vehicle safety messages. Real-time recall
checks were provided to motorists to raise awareness of ongoing safety recalls, in addition to
highlighting other NHTSA priorities such as tire maintenance and safety, child safety seats, and
heatstroke prevention. Details about the bus tour can be found here:
http://www.nhtsa.gov/nhtsa/tour/tour.html

31
6) September 2016: In accordance with Section 24104 of the FAST Act, the Agency issued a
notice of proposed rulemaking to require recall notification by electronic means, in addition to
First Class mail. NHTSA is working on a final rule.
7) October 2016: In accordance with Section 24105 of the Fixing America’s Surface
Transportation (FAST) Act, signed in December 2015, the Agency announced a pilot program to
evaluate the feasibility and effectiveness of a state process to inform consumers of open motor
vehicle recalls at the time of motor vehicle registration.
8) Future Potential Actions Being Evaluated:
The Agency is currently evaluating the following potential actions for the future:
a. Implementing predictive modeling to monitor recall completion rates and engaging with
manufacturers on specific strategies to improve rates on under-performing recalls.
b. Adjusting manufacturer’s recall completion reporting requirements in order to collect
information better tailored for recall completion analyses and trend identification.
c. Analyzing recall completion rates for non-light vehicles (e.g., buses, tractor trailers,
recreational vehicles, etc.) as well as equipment, including child seats and tires.
d. Studying owner motivation when evaluating safety recalls and identifying tools to target
specific, owner challenges (e.g., different communication delivery methods or formats
such as post cards and attention-grabbing mailers).

32
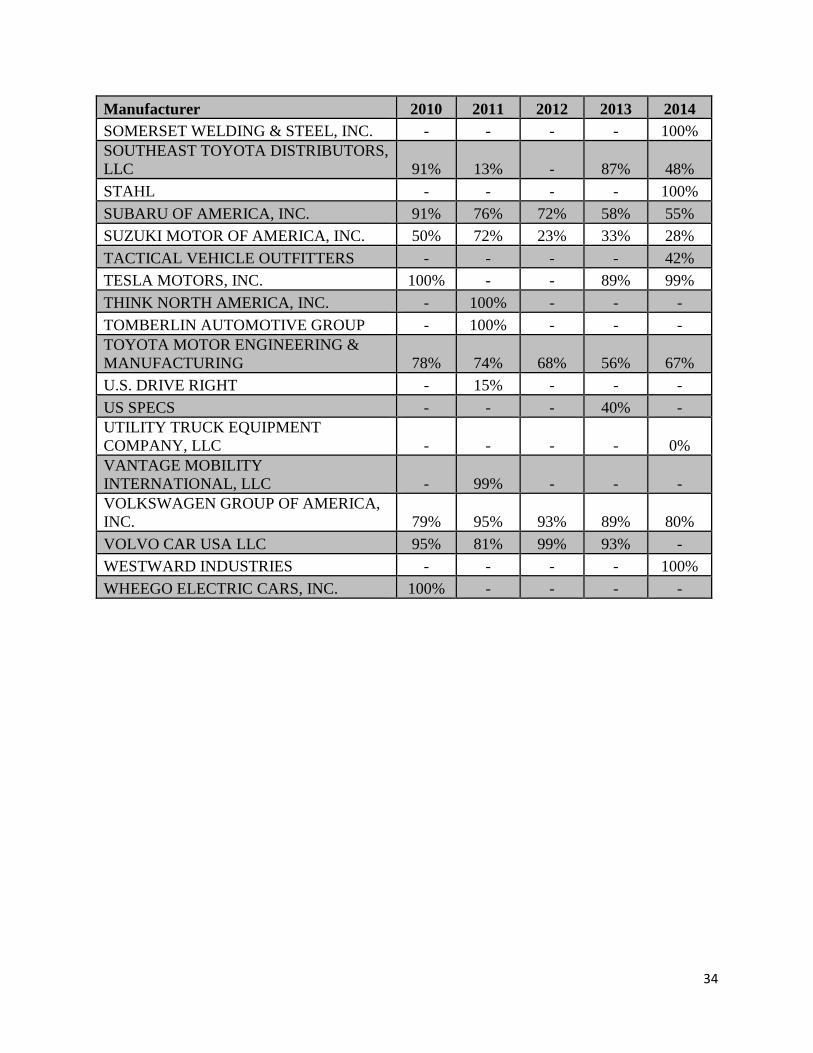
Appendix A
Annual Recall Completion Rates by Vehicle Manufacturer
The table below provides the annual recall completion rate for manufacturers recalling light vehicles between 2010 and 2014. This table includes companies that modify new motor vehicles before their first retail sale (vehicle alterers), certain manufacturer distributors, and some low-volume, specialty manufacturers (such as limousine
builders or electric vehicle manufacturers).
Manufacturer 2010 2011 2012 2013 2014 ADRIAN STEEL COMPANY - - - - 100% ALL IN ONE MOBILITY, INC. 50% - - - - ARIZONA MOBILITY PRODUCTS 100% - - - - ASTON MARTIN LAGONDA OF NORTH AMERICA 72% - 86% - 77% AUTOMOBILI LAMBORGHINI AMERICA LLC 84% - 58% 55% - BAD BOY ENTERPRISES, LLC 36% - - - - BENTLEY MOTORS, INC. 78% - - 73% - BMW OF NORTH AMERICA, LLC 82% 54% 77% 79% 42% BRAUN CORPORATION 47% 6% 95% 71% - CFMOTO POWERSPORTS, INC. - 8% - - - CHRYSLER (FCA US LLC) 76% 77% 51% 54% 69% CHRYSLER GROUP GLOBAL ELECTRIC MOTORCARS 25% - - - - CLUB CAR INC. 39% - - - - COLUMBIA PARCAR CORPORATION - 56% - - - CORP. MICRO BIRD INC. - 11% - - - CUMMINGS MOBILITY CONVERSION & SUPPLY - - - - 31% DAIHATSU AMERICA, INC. 13% - - - - DRIVING SPECIALTIES LTD 50% - - - - ELDORADO NATIONAL- KANSAS - - - 67% - ELKHART COACH - - - - 73% EXECUTIVE COACH BUILDERS 1% - 100% - - EXPLORER VAN COMPANY, INC. - - - 25% - FAIRPLAY ELECTRIC CARS - 39% - - - FERRARI NORTH AMERICA, INC. 100% - 100% - 88% FISKER AUTOMOTIVE INCORPORATED - 100% 97% - - FORD MOTOR COMPANY 45% 45% 56% 73% 70% FREEDOM MOTORS, INC. - - - - 32%
33
Manufacturer 2010 2011 2012 2013 2014 FRONTLINE COMMUNICATIONS - 100% - - - GENERAL MOTORS LLC 73% 93% 78% 82% 66% GULF STATES TOYOTA, INC. 0% 35% 89% - 80% HONDA (AMERICAN HONDA MOTOR CO.) 69% 78% 59% 73% 72% HYUNDAI CARIBBEAN-PUERTO RICO 61% - - - - HYUNDAI MOTOR AMERICA 95% 60% 70% 63% 70% IOWA MOLD TOOLING CO., INC. - - - - 33% ISUZU TECHNICAL CENTER OF AMERICA, INC. 13% - 9% 20% - JAGUAR LAND ROVER NORTH AMERICA, LLC 95% 90% 89% 80% 78% KANDI USA INC. - 39% - - - KIA MOTORS AMERICA 88% 61% 59% 67% 75% KOENIGSEGG AUTOMOTIVE AB - - - - 100% LANDI RENZO USA - - - - 63% LOTUS CARS USA, INC. - 44% 83% 43% 37% MANNING EQUIPMENT INC. LLC - - - 100% 70% MASERATI NORTH AMERICA, INC. - 95% 91% 86% 100% MAZDA NORTH AMERICAN OPERATIONS 75% 67% 42% 58% 47% MCLAREN AUTOMOTIVE INCORPORATED - - - 86% - MERCEDES-BENZ USA, LLC - DBA SPRINTER - - - - 81% MERCEDES-BENZ USA, LLC. 92% 33% 90% 59% 69% MITSUBISHI MOTORS NORTH AMERICA, INC. 52% - 95% 70% 51% MONROE TRUCK EQUIPMENT - - - - 53% NISSAN NORTH AMERICA, INC. 53% 55% 84% 85% 84% OREION MOTORS LLC. - - - 23% - PALFLEET TRUCK EQUIPMENT COMPANY, LLC - - - - 100% PHENIX ENTERPRISES, INC. - - 100% - - POLARIS INDUSTRIES, INC. - - - 39% - PORSCHE CARS NORTH AMERICA, INC. 91% 92% 77% 90% 88% ROLLS-ROYCE MOTOR CARS, LTD. 72% 84% 92% 100% - ROUSH PERFORMANCE PRODUCTS, INC. - 77% - - 72%
34
Manufacturer 2010 2011 2012 2013 2014 SOMERSET WELDING & STEEL, INC. - - - - 100% SOUTHEAST TOYOTA DISTRIBUTORS, LLC 91% 13% - 87% 48% STAHL - - - - 100% SUBARU OF AMERICA, INC. 91% 76% 72% 58% 55% SUZUKI MOTOR OF AMERICA, INC. 50% 72% 23% 33% 28% TACTICAL VEHICLE OUTFITTERS - - - - 42% TESLA MOTORS, INC. 100% - - 89% 99% THINK NORTH AMERICA, INC. - 100% - - - TOMBERLIN AUTOMOTIVE GROUP - 100% - - - TOYOTA MOTOR ENGINEERING & MANUFACTURING 78% 74% 68% 56% 67% U.S. DRIVE RIGHT - 15% - - - US SPECS - - - 40% - UTILITY TRUCK EQUIPMENT COMPANY, LLC - - - - 0% VANTAGE MOBILITY INTERNATIONAL, LLC - 99% - - - VOLKSWAGEN GROUP OF AMERICA, INC. 79% 95% 93% 89% 80% VOLVO CAR USA LLC 95% 81% 99% 93% - WESTWARD INDUSTRIES - - - - 100% WHEEGO ELECTRIC CARS, INC. 100% - - - -
35
Appendix B
Annual Recall Completion Rate by Recalled Component
Annual Completion Rate
Component Name 2010 2011 2012 2013 2014 Air Bags 62% 59% 51% 66% 70% Electrical System 73% 86% 61% 79% 62% Electronic Stability Control/Traction Control 62% 92% - 79% 63% Engine and Engine Cooling 64% 72% 68% 83% 81% Equipment 55% 84% 47% 85% 67% Fuel System 74% 49% 79% 50% 73% Latches/Locks/Linkages 96% - 80% 61% 78% Lighting 68% 51% 59% 60% 58% Power Train 87% 76% 65% 67% 76% Seat Belts 66% 82% 73% 58% 77% Seats 75% 78% 89% 49% 67% Service/Parking Brakes 78% 78% 58% 68% 68% Steering 65% 70% 72% 49% 67% Structure 55% 46% 83% 42% 66% Suspension 44% 61% 67% 59% 65% Tires and Wheels 85% 86% 38% 89% 81% Vehicle Speed Control 87% 69% 48% 65% 60% Visibility 62% 83% 68% 60% 62%
36
Appendix C
The table below presents a commonly used description of the logistic regression model used in this report. Figure 8: Parameter Estimates and Odds Ratios for the Logistic Model of Completion Rates
Effect Estimate Standard Error p-value Odds Ratio
Estimate Intercept 1.7852 0.0041 < .0001
Age of the oldest affected vehicle, in years -0.1668 0.0001 < .0001 0.8464 Manufacturer, reference category = General Motors
BMW 0.2272 0.0043 < .0001 0.8230 Chrysler -0.2897 0.0042 < .0001 0.4908
Ferrari 1.5344 0.0610 < .0001 3.0415 Ford -0.2646 0.0042 < .0001 0.5032
Honda 0.1007 0.0042 < .0001 0.7251 Hyundai -0.1458 0.0042 < .0001 0.5668
Jaguar Land Rover -0.0759 0.0084 < .0001 0.6078 Kia -0.1344 0.0044 < .0001 0.5732
Mazda -0.6507 0.0045 < .0001 0.3421 Mercedes-Benz -0.2264 0.0050 < .0001 0.5228
Mitsubishi -0.9892 0.0052 < .0001 0.2438 Nissan -0.5925 0.0042 < .0001 0.3626
Porsche -0.0664 0.0142 < .0001 0.1576 Subaru -0.2218 0.0044 < .0001 0.6136
Tesla 2.1812 0.0445 < .0001 0.5252 Toyota -0.1340 0.0041 < .0001 5.8076
Volkswagen 0.0056 0.0046 0.2198 0.5735 Volvo 0.7461 0.0099 < .0001 0.6594
Other manufacturers -1.4258 0.0045 < .0001 1.3827 Vehicle Type, reference category = only passenger cars
mix of pass cars, light trucks, and/or MPVs 0.1466 0.0004 < .0001 1.0892 only MPVs 0.0233 0.0005 < .0001 0.7466
only light trucks -0.2311 0.0007 < .0001 0.9629 First Affected Component, reference category = Air Bags
Electrical System 0.0024 0.0007 0.0005 1.1032 Electronic Stability Control/Traction Control 0.0848 0.0033 < .0001 1.1980
Engine and Engine Cooling 0.0570 0.0010 < .0001 1.1651 Equipment 0.0571 0.0024 < .0001 1.1653
Fuel System 0.5503 0.0012 < .0001 1.9082 Latches/Locks/Linkages -0.2110 0.0027 < .0001 0.8912
Lighting -0.3238 0.0010 < .0001 0.7961 Power Train -0.1091 0.0009 < .0001 0.9868
Seat Belts -0.3441 0.0013 < .0001 0.7802 Seats -0.4556 0.0018 < .0001 0.6978
37
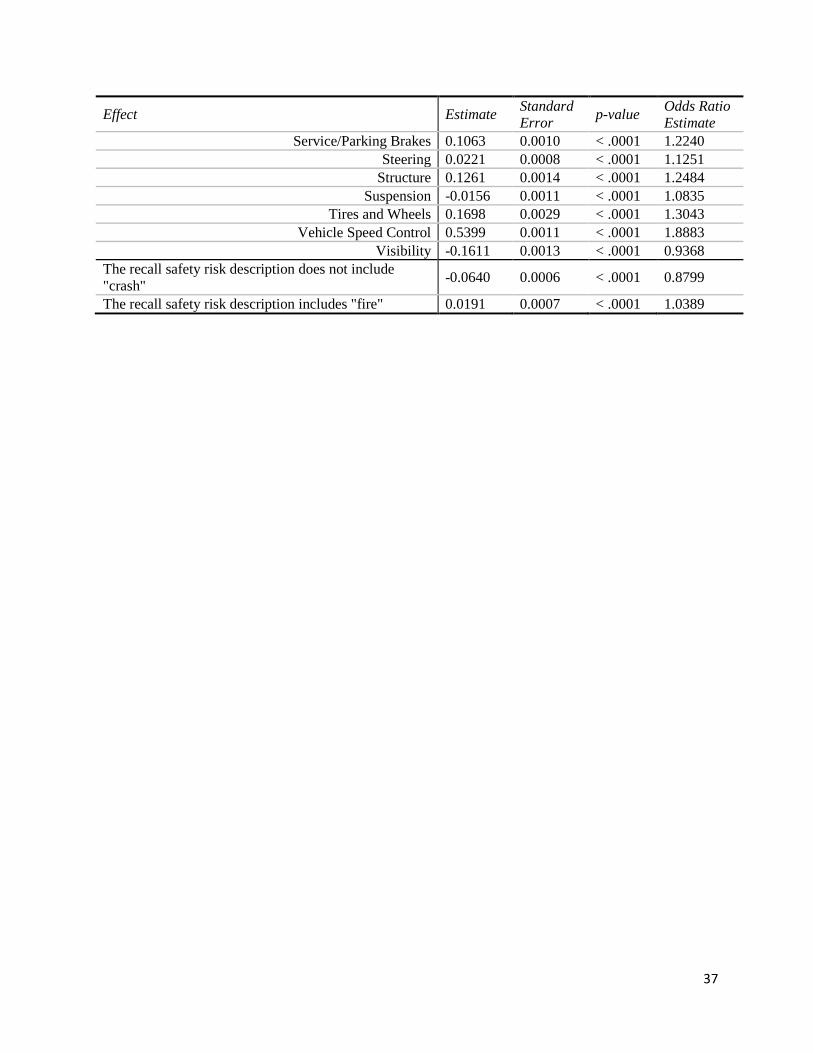
Effect Estimate Standard Error p-value Odds Ratio
Estimate Service/Parking Brakes 0.1063 0.0010 < .0001 1.2240
Steering 0.0221 0.0008 < .0001 1.1251 Structure 0.1261 0.0014 < .0001 1.2484
Suspension -0.0156 0.0011 < .0001 1.0835 Tires and Wheels 0.1698 0.0029 < .0001 1.3043
Vehicle Speed Control 0.5399 0.0011 < .0001 1.8883 Visibility -0.1611 0.0013 < .0001 0.9368
The recall safety risk description does not include "crash" -0.0640 0.0006 < .0001 0.8799
The recall safety risk description includes "fire" 0.0191 0.0007 < .0001 1.0389