Embed Size (px)
Citation preview
M E T R O P O L I T A N W A S H I N G T O N A I R P O R T S A U T H O R I T Y
REPORT TO THE FINANCE COMMITTEE
QUARTERLY REPORT ON
INVESTMENT PROGRAM
OCTOBER 2012
M E T R O P O L I T A N W A S H I N G T O N A I R P O R T S A U T H O R I T Y
2
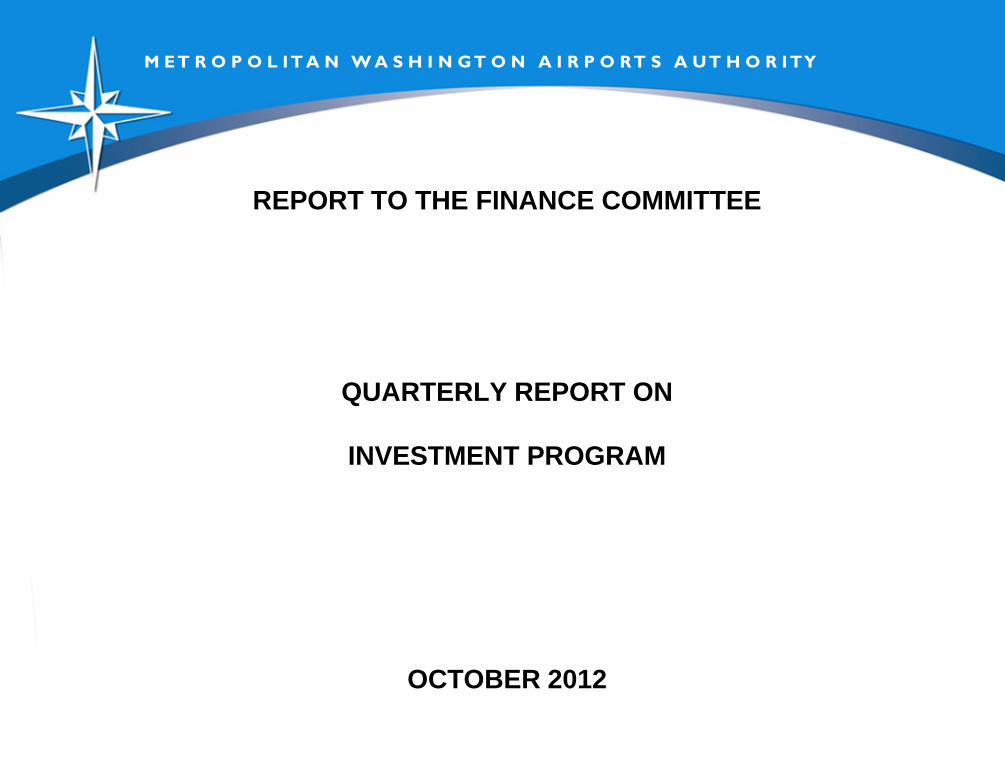
As of June 30, 2012, the Total Portfolio decreased by $103.5 million, from $1.64 billion to $1.54 billion.
REPORT TO THE FINANCE COMMITTEE
QUARTERLY REPORT ON
INVESTMENT PROGRAM
(in Millions) Jun 30 Mar 31 Change
Total Aviation 1,161.1$ 1,178.6$ (17.5)$
Total Dulles Corridor 374.1 460.0 (85.9)
Total 1,535.2$ 1,638.6$ (103.4)$
M E T R O P O L I T A N W A S H I N G T O N A I R P O R T S A U T H O R I T Y
3
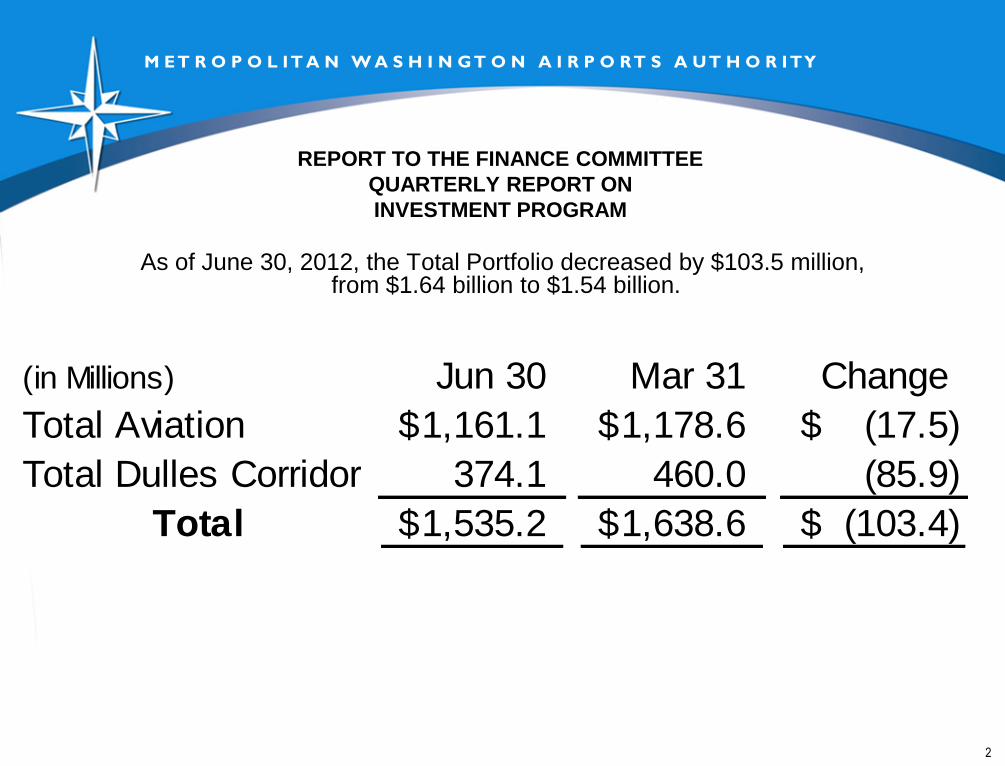
Aviation
Portfolio decreased $17.6 million
Aviation (in millions) Jun 30 Mar 31 Change
Operating 399.1$ 378.4$ 20.7$
Construction 122.9 147.3 (24.4)
Capitalized Interest 14.8 20.3 (5.5)
Cost of Issuance 1.9 2.0 (0.1)
PFC/Grants 76.6 68.6 8.0
Debt Service Reserve 377.1 374.0 3.1
Debt Service Interest 60.4 113.4 (53.0)
Debt Service Principal 102.0 68.1 33.9
FAA ATCT Escrow 6.3 6.5 (0.2)
Total 1,161.1$ 1,178.6$ (17.5)$
M E T R O P O L I T A N W A S H I N G T O N A I R P O R T S A U T H O R I T Y
4
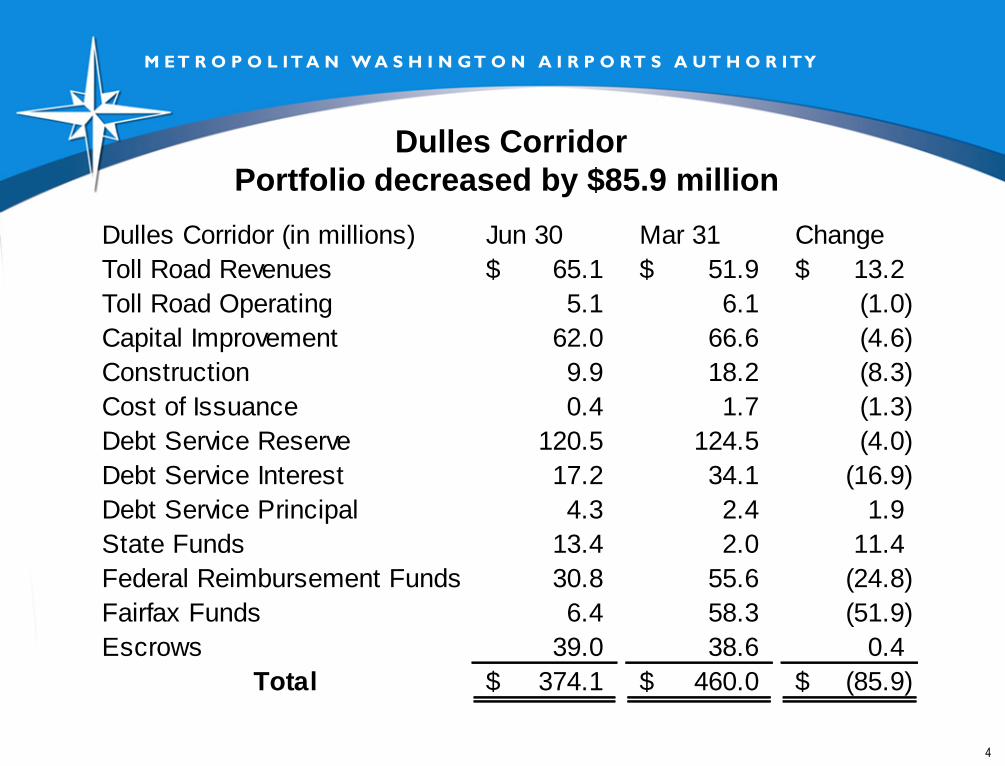
Dulles Corridor
Portfolio decreased by $85.9 million
Dulles Corridor (in millions) Jun 30 Mar 31 Change
Toll Road Revenues 65.1$ 51.9$ 13.2$
Toll Road Operating 5.1 6.1 (1.0)
Capital Improvement 62.0 66.6 (4.6)
Construction 9.9 18.2 (8.3)
Cost of Issuance 0.4 1.7 (1.3)
Debt Service Reserve 120.5 124.5 (4.0)
Debt Service Interest 17.2 34.1 (16.9)
Debt Service Principal 4.3 2.4 1.9
State Funds 13.4 2.0 11.4
Federal Reimbursement Funds 30.8 55.6 (24.8)
Fairfax Funds 6.4 58.3 (51.9)
Escrows 39.0 38.6 0.4
Total 374.1$ 460.0$ (85.9)$
M E T R O P O L I T A N W A S H I N G T O N A I R P O R T S A U T H O R I T Y
5
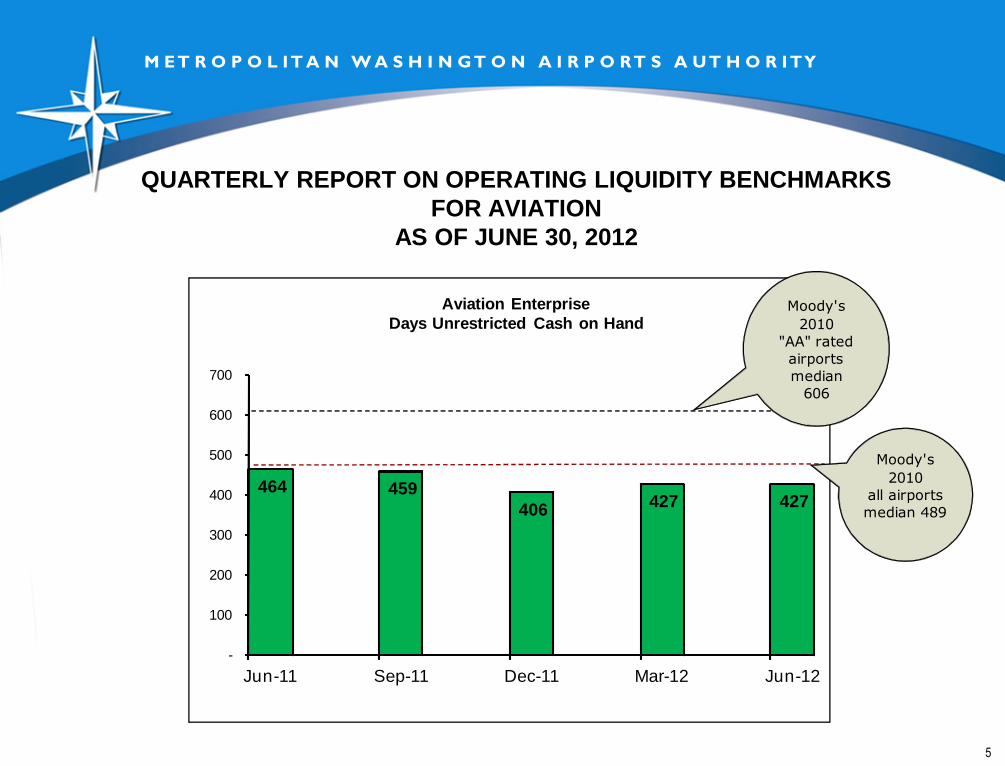
QUARTERLY REPORT ON OPERATING LIQUIDITY BENCHMARKS
FOR AVIATION
AS OF JUNE 30, 2012
464 459
406 427 427
-
100
200
300
400
500
600
700
Jun-11 Sep-11 Dec-11 Mar-12 Jun-12
Aviation Enterprise
Days Unrestricted Cash on HandMoody's
2010
"AA" rated
airports
median
606
Moody's
2010
all airports
median 489
M E T R O P O L I T A N W A S H I N G T O N A I R P O R T S A U T H O R I T Y
6
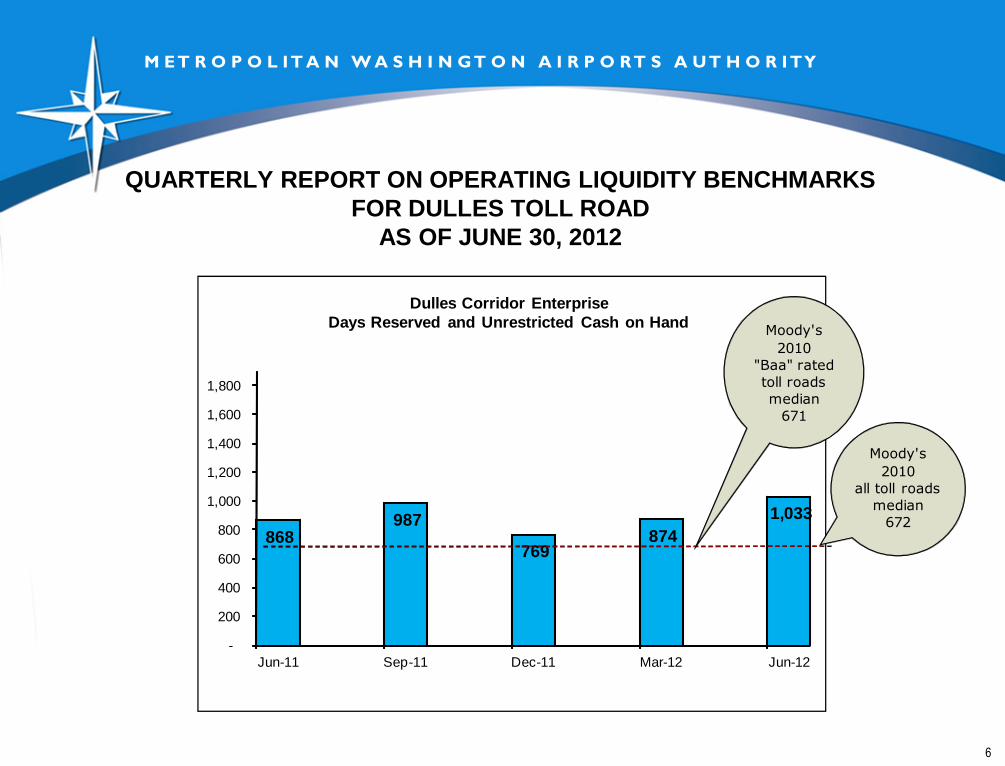
QUARTERLY REPORT ON OPERATING LIQUIDITY BENCHMARKS
FOR DULLES TOLL ROAD
AS OF JUNE 30, 2012
868 987
769 874
1,033
-
200
400
600
800
1,000
1,200
1,400
1,600
1,800
Jun-11 Sep-11 Dec-11 Mar-12 Jun-12
Dulles Corridor Enterprise
Days Reserved and Unrestricted Cash on HandMoody's
2010
"Baa" rated
toll roads
median
671
Moody's
2010
all toll roads
median
672
REPORT TO THE FINANCE COMMITTEE
QUARTERLY REPORT ON
INVESTMENT PROGRAM
OCTOBER 2012
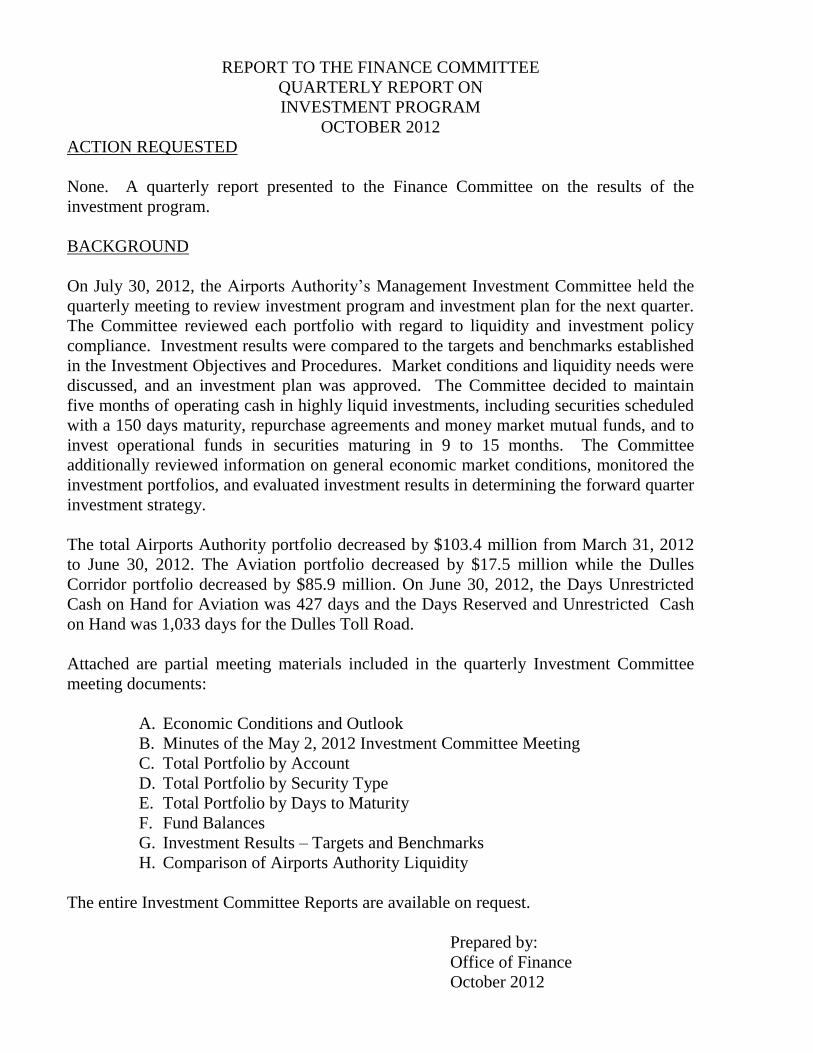
ACTION REQUESTED
None. A quarterly report presented to the Finance Committee on the results of the
investment program.
BACKGROUND
On July 30, 2012, the Airports Authority’s Management Investment Committee held the
quarterly meeting to review investment program and investment plan for the next quarter.
The Committee reviewed each portfolio with regard to liquidity and investment policy
compliance. Investment results were compared to the targets and benchmarks established
in the Investment Objectives and Procedures. Market conditions and liquidity needs were
discussed, and an investment plan was approved. The Committee decided to maintain
five months of operating cash in highly liquid investments, including securities scheduled
with a 150 days maturity, repurchase agreements and money market mutual funds, and to
invest operational funds in securities maturing in 9 to 15 months. The Committee
additionally reviewed information on general economic market conditions, monitored the
investment portfolios, and evaluated investment results in determining the forward quarter
investment strategy.
The total Airports Authority portfolio decreased by $103.4 million from March 31, 2012
to June 30, 2012. The Aviation portfolio decreased by $17.5 million while the Dulles
Corridor portfolio decreased by $85.9 million. On June 30, 2012, the Days Unrestricted
Cash on Hand for Aviation was 427 days and the Days Reserved and Unrestricted Cash
on Hand was 1,033 days for the Dulles Toll Road.
Attached are partial meeting materials included in the quarterly Investment Committee
meeting documents:
A. Economic Conditions and Outlook
B. Minutes of the May 2, 2012 Investment Committee Meeting
C. Total Portfolio by Account
D. Total Portfolio by Security Type
E. Total Portfolio by Days to Maturity
F. Fund Balances
G. Investment Results – Targets and Benchmarks
H. Comparison of Airports Authority Liquidity
The entire Investment Committee Reports are available on request.
Prepared by:
Office of Finance
October 2012
Attachment A
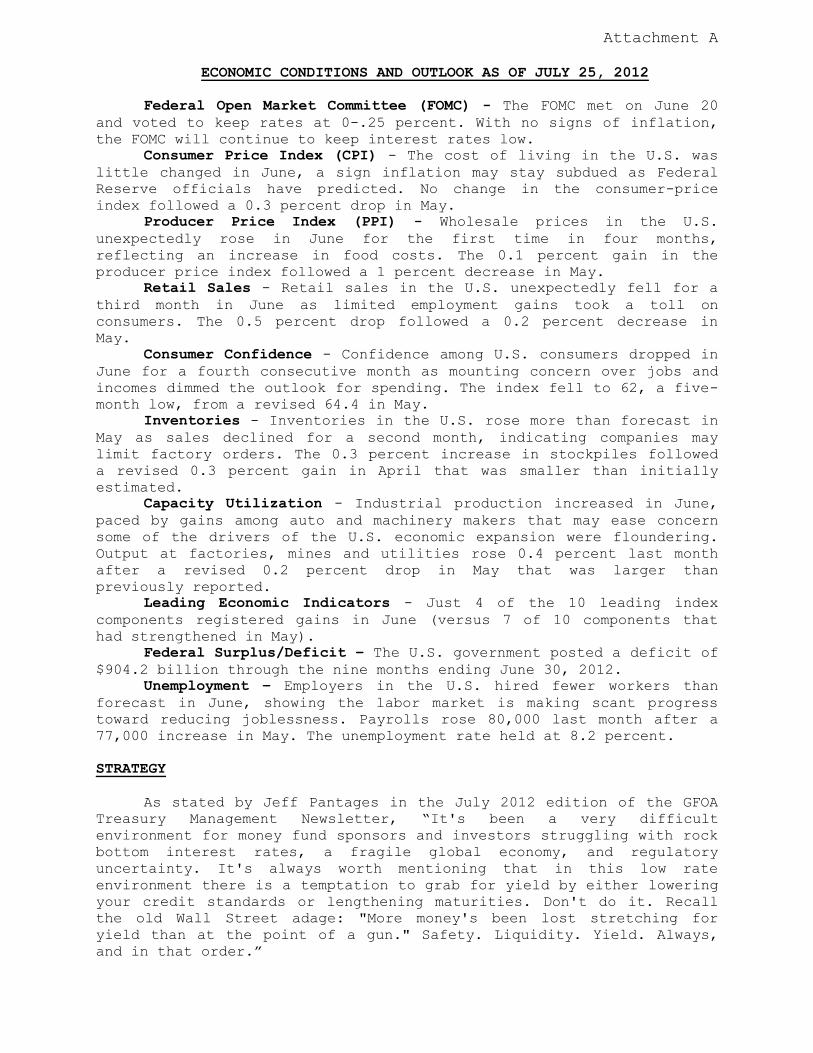
ECONOMIC CONDITIONS AND OUTLOOK AS OF JULY 25, 2012
Federal Open Market Committee (FOMC) - The FOMC met on June 20
and voted to keep rates at 0-.25 percent. With no signs of inflation,
the FOMC will continue to keep interest rates low.
Consumer Price Index (CPI) - The cost of living in the U.S. was
little changed in June, a sign inflation may stay subdued as Federal
Reserve officials have predicted. No change in the consumer-price
index followed a 0.3 percent drop in May.
Producer Price Index (PPI) - Wholesale prices in the U.S.
unexpectedly rose in June for the first time in four months,
reflecting an increase in food costs. The 0.1 percent gain in the
producer price index followed a 1 percent decrease in May.
Retail Sales - Retail sales in the U.S. unexpectedly fell for a
third month in June as limited employment gains took a toll on
consumers. The 0.5 percent drop followed a 0.2 percent decrease in
May.
Consumer Confidence - Confidence among U.S. consumers dropped in
June for a fourth consecutive month as mounting concern over jobs and
incomes dimmed the outlook for spending. The index fell to 62, a five-
month low, from a revised 64.4 in May.
Inventories - Inventories in the U.S. rose more than forecast in
May as sales declined for a second month, indicating companies may
limit factory orders. The 0.3 percent increase in stockpiles followed
a revised 0.3 percent gain in April that was smaller than initially
estimated.
Capacity Utilization - Industrial production increased in June,
paced by gains among auto and machinery makers that may ease concern
some of the drivers of the U.S. economic expansion were floundering.
Output at factories, mines and utilities rose 0.4 percent last month
after a revised 0.2 percent drop in May that was larger than
previously reported.
Leading Economic Indicators - Just 4 of the 10 leading index
components registered gains in June (versus 7 of 10 components that
had strengthened in May).
Federal Surplus/Deficit – The U.S. government posted a deficit of
$904.2 billion through the nine months ending June 30, 2012.
Unemployment – Employers in the U.S. hired fewer workers than
forecast in June, showing the labor market is making scant progress
toward reducing joblessness. Payrolls rose 80,000 last month after a
77,000 increase in May. The unemployment rate held at 8.2 percent.
STRATEGY
As stated by Jeff Pantages in the July 2012 edition of the GFOA
Treasury Management Newsletter, “It's been a very difficult
environment for money fund sponsors and investors struggling with rock
bottom interest rates, a fragile global economy, and regulatory
uncertainty. It's always worth mentioning that in this low rate
environment there is a temptation to grab for yield by either lowering
your credit standards or lengthening maturities. Don't do it. Recall
the old Wall Street adage: "More money's been lost stretching for
yield than at the point of a gun." Safety. Liquidity. Yield. Always,
and in that order.”
Attachment B
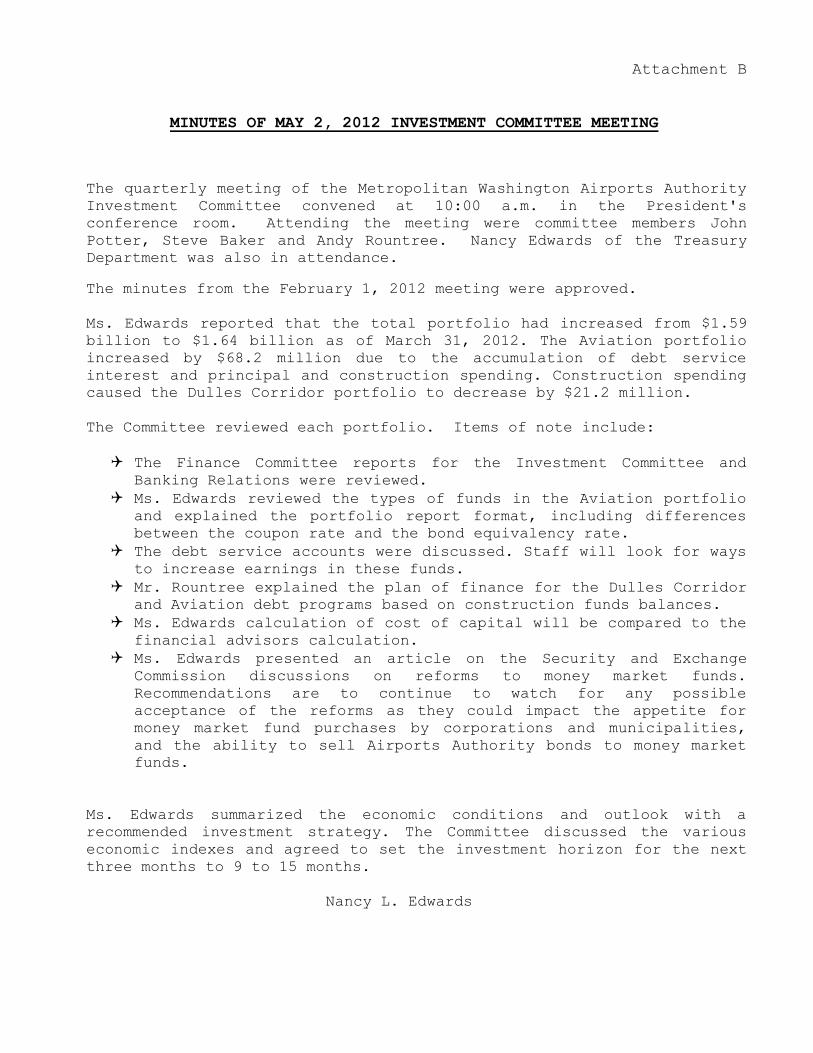
MINUTES OF MAY 2, 2012 INVESTMENT COMMITTEE MEETING
The quarterly meeting of the Metropolitan Washington Airports Authority
Investment Committee convened at 10:00 a.m. in the President's
conference room. Attending the meeting were committee members John
Potter, Steve Baker and Andy Rountree. Nancy Edwards of the Treasury
Department was also in attendance.
The minutes from the February 1, 2012 meeting were approved.
Ms. Edwards reported that the total portfolio had increased from $1.59
billion to $1.64 billion as of March 31, 2012. The Aviation portfolio
increased by $68.2 million due to the accumulation of debt service
interest and principal and construction spending. Construction spending
caused the Dulles Corridor portfolio to decrease by $21.2 million.
The Committee reviewed each portfolio. Items of note include:
The Finance Committee reports for the Investment Committee and
Banking Relations were reviewed.
Ms. Edwards reviewed the types of funds in the Aviation portfolio and explained the portfolio report format, including differences
between the coupon rate and the bond equivalency rate.
The debt service accounts were discussed. Staff will look for ways to increase earnings in these funds.
Mr. Rountree explained the plan of finance for the Dulles Corridor and Aviation debt programs based on construction funds balances.
Ms. Edwards calculation of cost of capital will be compared to the financial advisors calculation.
Ms. Edwards presented an article on the Security and Exchange
Commission discussions on reforms to money market funds.
Recommendations are to continue to watch for any possible
acceptance of the reforms as they could impact the appetite for
money market fund purchases by corporations and municipalities,
and the ability to sell Airports Authority bonds to money market
funds.
Ms. Edwards summarized the economic conditions and outlook with a
recommended investment strategy. The Committee discussed the various
economic indexes and agreed to set the investment horizon for the next
three months to 9 to 15 months.
Nancy L. Edwards
Attachment C
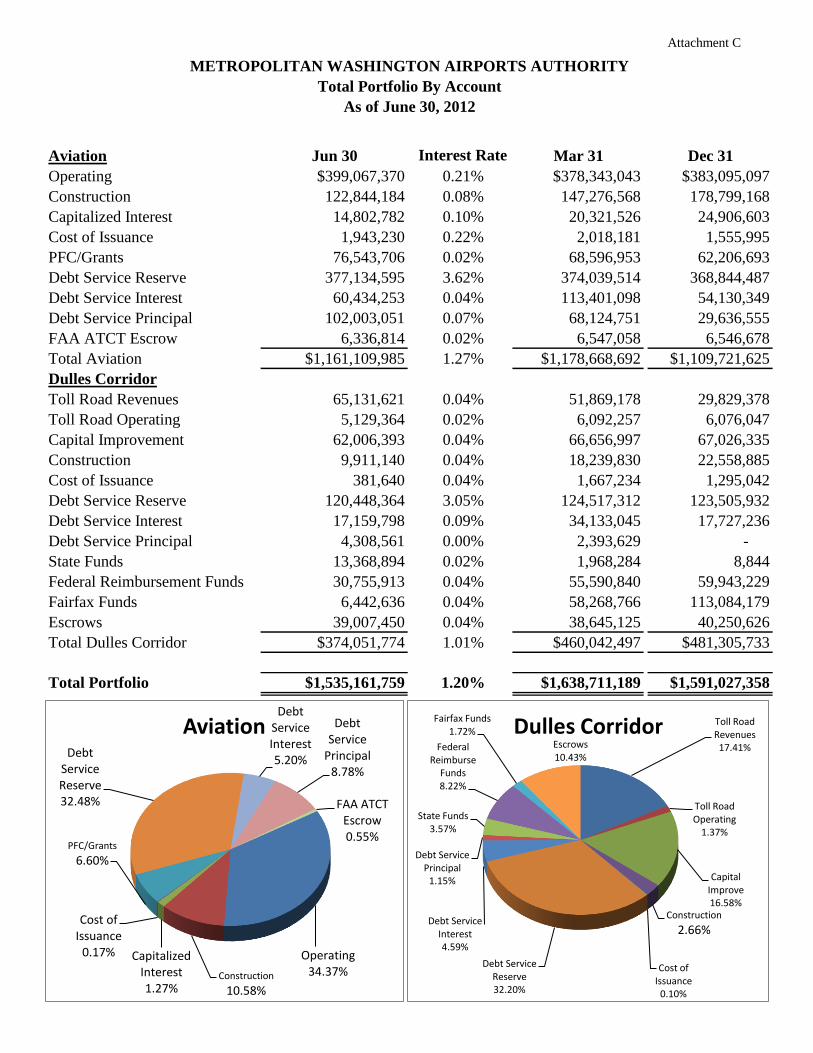
Aviation Jun 30 Interest Rate Mar 31 Dec 31
Operating $399,067,370 0.21% $378,343,043 $383,095,097
Construction 122,844,184 0.08% 147,276,568 178,799,168
Capitalized Interest 14,802,782 0.10% 20,321,526 24,906,603
Cost of Issuance 1,943,230 0.22% 2,018,181 1,555,995
PFC/Grants 76,543,706 0.02% 68,596,953 62,206,693
Debt Service Reserve 377,134,595 3.62% 374,039,514 368,844,487
Debt Service Interest 60,434,253 0.04% 113,401,098 54,130,349
Debt Service Principal 102,003,051 0.07% 68,124,751 29,636,555
FAA ATCT Escrow 6,336,814 0.02% 6,547,058 6,546,678
Total Aviation $1,161,109,985 1.27% $1,178,668,692 $1,109,721,625
Dulles Corridor
Toll Road Revenues 65,131,621 0.04% 51,869,178 29,829,378
Toll Road Operating 5,129,364 0.02% 6,092,257 6,076,047
Capital Improvement 62,006,393 0.04% 66,656,997 67,026,335
Construction 9,911,140 0.04% 18,239,830 22,558,885
Cost of Issuance 381,640 0.04% 1,667,234 1,295,042
Debt Service Reserve 120,448,364 3.05% 124,517,312 123,505,932
Debt Service Interest 17,159,798 0.09% 34,133,045 17,727,236
Debt Service Principal 4,308,561 0.00% 2,393,629 -
State Funds 13,368,894 0.02% 1,968,284 8,844
Federal Reimbursement Funds 30,755,913 0.04% 55,590,840 59,943,229
Fairfax Funds 6,442,636 0.04% 58,268,766 113,084,179
Escrows 39,007,450 0.04% 38,645,125 40,250,626
Total Dulles Corridor $374,051,774 1.01% $460,042,497 $481,305,733
Total Portfolio $1,535,161,759 1.20% $1,638,711,189 $1,591,027,358
METROPOLITAN WASHINGTON AIRPORTS AUTHORITY
Total Portfolio By Account
As of June 30, 2012
Operating 34.37% Construction
10.58%
Capitalized Interest 1.27%
Cost of Issuance
0.17%
PFC/Grants
6.60%
Debt Service Reserve 32.48%
Debt Service Interest 5.20%
Debt Service
Principal 8.78%
FAA ATCT Escrow 0.55%
Aviation Toll Road Revenues 17.41%
Toll Road Operating
1.37%
Capital Improve 16.58%
Construction
2.66%
Cost of Issuance
0.10%
Debt Service Reserve 32.20%
Debt Service Interest 4.59%
Debt Service Principal
1.15%
State Funds 3.57%
Federal Reimburse
Funds 8.22%
Fairfax Funds 1.72%
Escrows 10.43%
Dulles Corridor
Attachment D
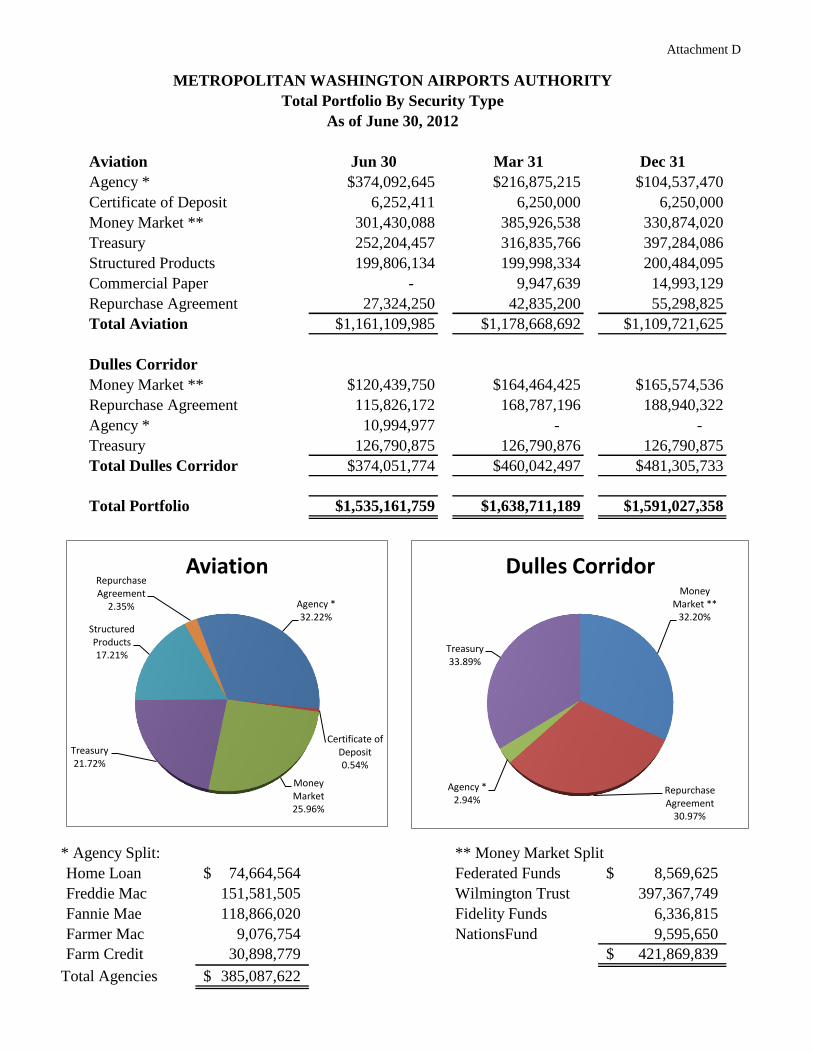
Aviation Jun 30 Mar 31 Dec 31
Agency * $374,092,645 $216,875,215 $104,537,470
Certificate of Deposit 6,252,411 6,250,000 6,250,000
Money Market ** 301,430,088 385,926,538 330,874,020
Treasury 252,204,457 316,835,766 397,284,086
Structured Products 199,806,134 199,998,334 200,484,095
Commercial Paper - 9,947,639 14,993,129
Repurchase Agreement 27,324,250 42,835,200 55,298,825
Total Aviation $1,161,109,985 $1,178,668,692 $1,109,721,625
Dulles Corridor
Money Market ** $120,439,750 $164,464,425 $165,574,536
Repurchase Agreement 115,826,172 168,787,196 188,940,322
Agency * 10,994,977 - -
Treasury 126,790,875 126,790,876 126,790,875
Total Dulles Corridor $374,051,774 $460,042,497 $481,305,733
Total Portfolio $1,535,161,759 $1,638,711,189 $1,591,027,358
* Agency Split: ** Money Market Split
Home Loan 74,664,564$ Federated Funds 8,569,625$
Freddie Mac 151,581,505 Wilmington Trust 397,367,749
Fannie Mae 118,866,020 Fidelity Funds 6,336,815
Farmer Mac 9,076,754 NationsFund 9,595,650
Farm Credit 30,898,779 421,869,839$
Total Agencies 385,087,622$
METROPOLITAN WASHINGTON AIRPORTS AUTHORITY
Total Portfolio By Security Type
As of June 30, 2012
Agency * 32.22%
Certificate of Deposit 0.54%
Money Market 25.96%
Treasury 21.72%
Structured Products 17.21%
Repurchase Agreement
2.35%
Aviation Money
Market ** 32.20%
Repurchase Agreement
30.97%
Agency * 2.94%
Treasury 33.89%
Dulles Corridor
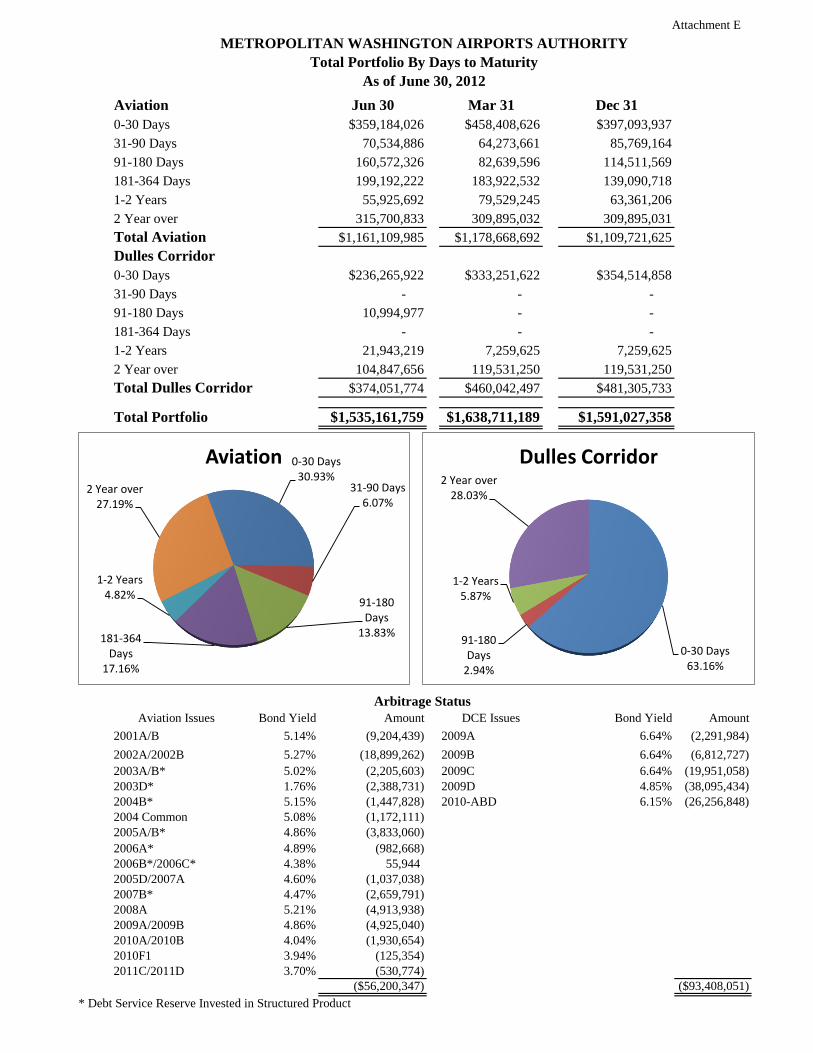
Attachment E
Aviation Jun 30 Mar 31 Dec 31
0-30 Days $359,184,026 $458,408,626 $397,093,937
31-90 Days 70,534,886 64,273,661 85,769,164
91-180 Days 160,572,326 82,639,596 114,511,569
181-364 Days 199,192,222 183,922,532 139,090,718
1-2 Years 55,925,692 79,529,245 63,361,206
2 Year over 315,700,833 309,895,032 309,895,031
Total Aviation $1,161,109,985 $1,178,668,692 $1,109,721,625
Dulles Corridor
0-30 Days $236,265,922 $333,251,622 $354,514,858
31-90 Days - - -
91-180 Days 10,994,977 - -
181-364 Days - - -
1-2 Years 21,943,219 7,259,625 7,259,625
2 Year over 104,847,656 119,531,250 119,531,250
Total Dulles Corridor $374,051,774 $460,042,497 $481,305,733
Total Portfolio $1,535,161,759 $1,638,711,189 $1,591,027,358
Aviation Issues Bond Yield Amount DCE Issues Bond Yield Amount
2001A/B 5.14% (9,204,439) 2009A 6.64% (2,291,984)
2002A/2002B 5.27% (18,899,262) 2009B 6.64% (6,812,727)
2003A/B* 5.02% (2,205,603) 2009C 6.64% (19,951,058)
2003D* 1.76% (2,388,731) 2009D 4.85% (38,095,434)
2004B* 5.15% (1,447,828) 2010-ABD 6.15% (26,256,848)
2004 Common 5.08% (1,172,111)
2005A/B* 4.86% (3,833,060)
2006A* 4.89% (982,668)
2006B*/2006C* 4.38% 55,944
2005D/2007A 4.60% (1,037,038)
2007B* 4.47% (2,659,791)
2008A 5.21% (4,913,938)
2009A/2009B 4.86% (4,925,040)
2010A/2010B 4.04% (1,930,654)
2010F1 3.94% (125,354)
2011C/2011D 3.70% (530,774)
($56,200,347) ($93,408,051)
* Debt Service Reserve Invested in Structured Product
METROPOLITAN WASHINGTON AIRPORTS AUTHORITY
Total Portfolio By Days to Maturity
As of June 30, 2012
Arbitrage Status
0-30 Days 30.93%
31-90 Days 6.07%
91-180 Days
13.83% 181-364 Days
17.16%
1-2 Years 4.82%
2 Year over 27.19%
Aviation
0-30 Days 63.16%
91-180 Days
2.94%
1-2 Years 5.87%
2 Year over 28.03%
Dulles Corridor
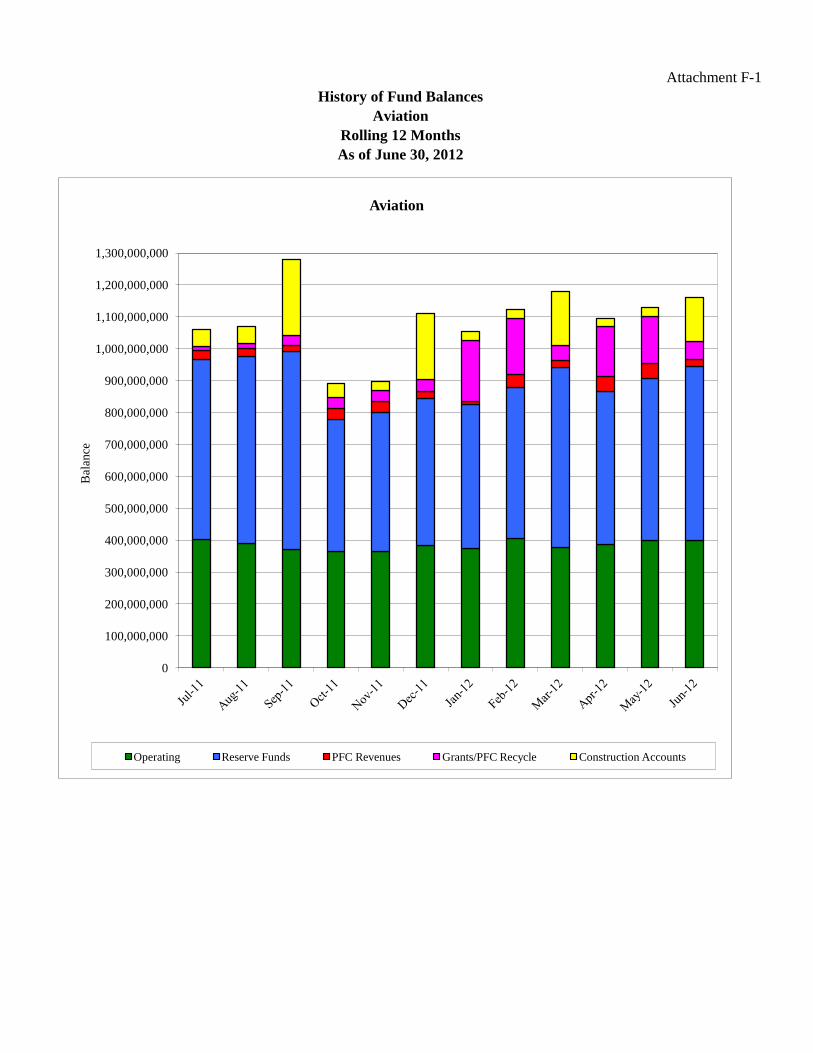
Attachment F-1
History of Fund Balances
Rolling 12 Months
As of June 30, 2012
Aviation
0
100,000,000
200,000,000
300,000,000
400,000,000
500,000,000
600,000,000
700,000,000
800,000,000
900,000,000
1,000,000,000
1,100,000,000
1,200,000,000
1,300,000,000
Bal
ance
Aviation
Operating Reserve Funds PFC Revenues Grants/PFC Recycle Construction Accounts
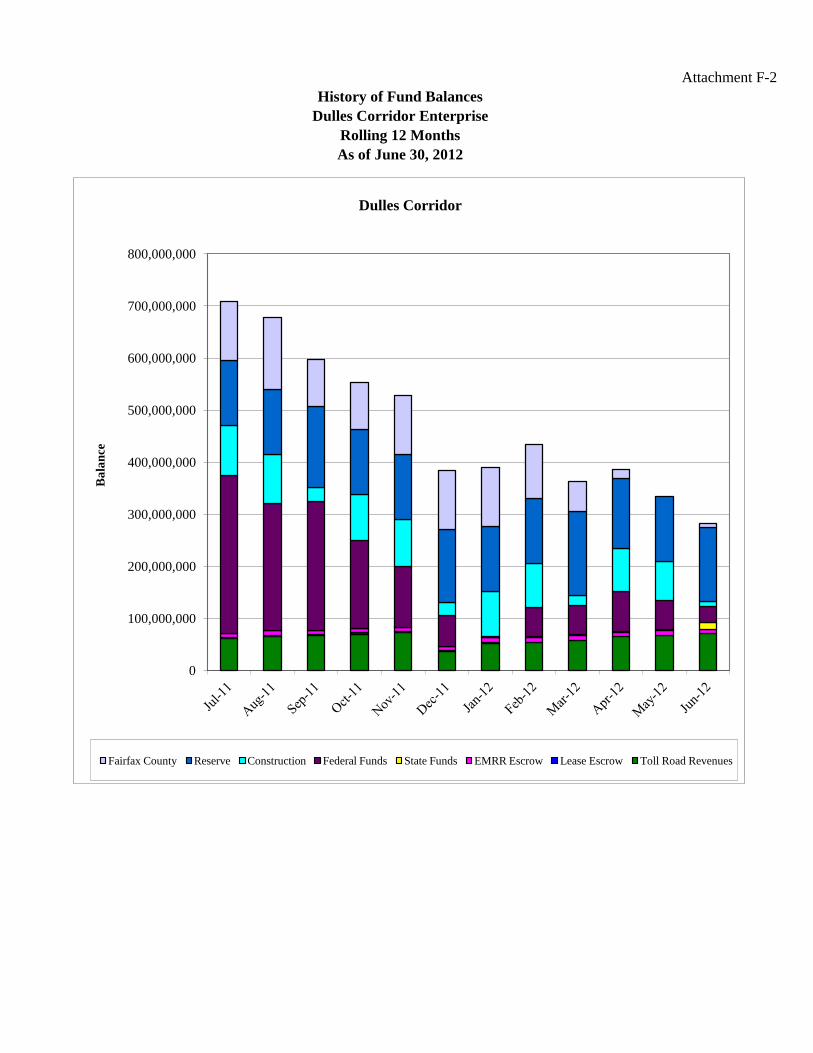
Attachment F-1 Attachment F-2
As of June 30, 2012
History of Fund Balances
Dulles Corridor Enterprise
Rolling 12 Months
0
100,000,000
200,000,000
300,000,000
400,000,000
500,000,000
600,000,000
700,000,000
800,000,000
Ba
lan
ce
Dulles Corridor
Fairfax County Reserve Construction Federal Funds State Funds EMRR Escrow Lease Escrow Toll Road Revenues
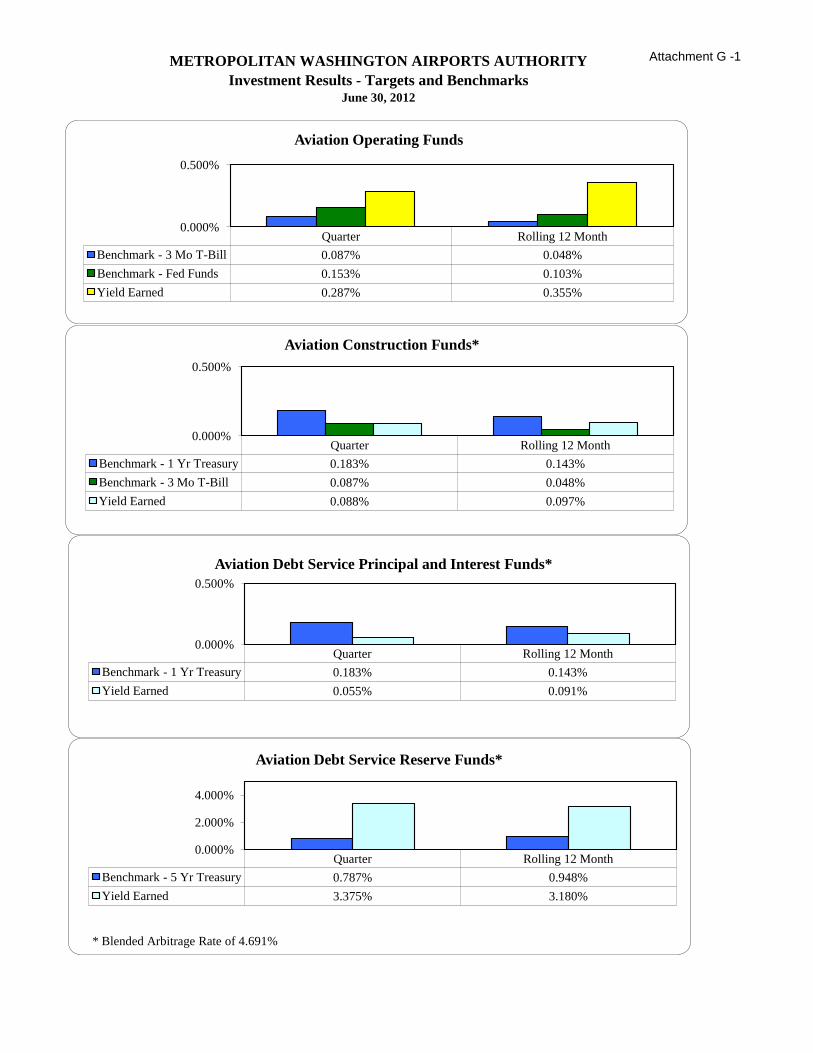
Attachment G -1METROPOLITAN WASHINGTON AIRPORTS AUTHORITY
Investment Results - Targets and BenchmarksJune 30, 2012
Quarter Rolling 12 Month
Benchmark - 3 Mo T-Bill 0.087% 0.048%
Benchmark - Fed Funds 0.153% 0.103%
Yield Earned 0.287% 0.355%
0.000%
0.500%
Aviation Operating Funds
Quarter Rolling 12 Month
Benchmark - 1 Yr Treasury 0.183% 0.143%
Benchmark - 3 Mo T-Bill 0.087% 0.048%
Yield Earned 0.088% 0.097%
0.000%
0.500%
Aviation Construction Funds*
Quarter Rolling 12 Month
Benchmark - 1 Yr Treasury 0.183% 0.143%
Yield Earned 0.055% 0.091%
0.000%
0.500%
Aviation Debt Service Principal and Interest Funds*
Quarter Rolling 12 Month
Benchmark - 5 Yr Treasury 0.787% 0.948%
Yield Earned 3.375% 3.180%
0.000%
2.000%
4.000%
Aviation Debt Service Reserve Funds*
* Blended Arbitrage Rate of 4.691%
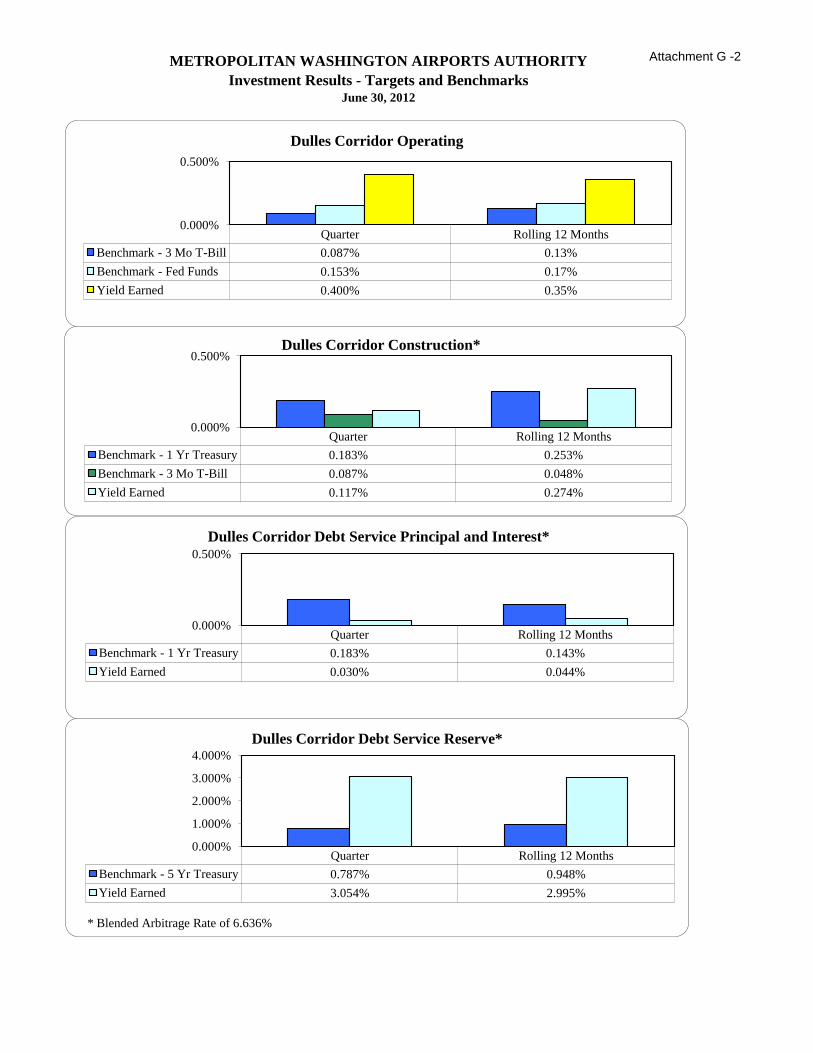
Attachment G -2METROPOLITAN WASHINGTON AIRPORTS AUTHORITY
Investment Results - Targets and BenchmarksJune 30, 2012
Quarter Rolling 12 Months
Benchmark - 3 Mo T-Bill 0.087% 0.13%
Benchmark - Fed Funds 0.153% 0.17%
Yield Earned 0.400% 0.35%
0.000%
0.500%
Dulles Corridor Operating
Quarter Rolling 12 Months
Benchmark - 1 Yr Treasury 0.183% 0.253%
Benchmark - 3 Mo T-Bill 0.087% 0.048%
Yield Earned 0.117% 0.274%
0.000%
0.500% Dulles Corridor Construction*
Quarter Rolling 12 Months
Benchmark - 1 Yr Treasury 0.183% 0.143%
Yield Earned 0.030% 0.044%
0.000%
0.500%
Dulles Corridor Debt Service Principal and Interest*
Quarter Rolling 12 Months
Benchmark - 5 Yr Treasury 0.787% 0.948%
Yield Earned 3.054% 2.995%
0.000%
1.000%
2.000%
3.000%
4.000%
Dulles Corridor Debt Service Reserve*
* Blended Arbitrage Rate of 6.636%
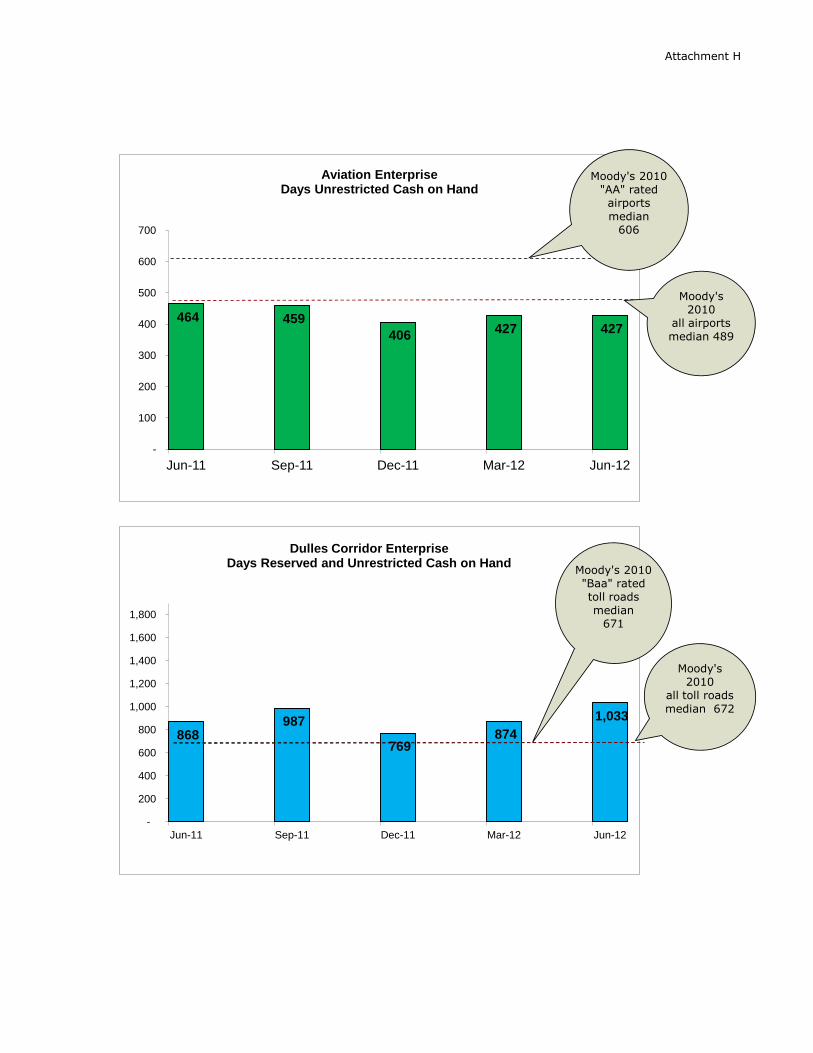
Attachment H
464 459
406 427 427
-
100
200
300
400
500
600
700
Jun-11 Sep-11 Dec-11 Mar-12 Jun-12
Aviation Enterprise Days Unrestricted Cash on Hand
Moody's 2010
"AA" rated
airports
median
606
Moody's 2010
all airports
median 489
868 987
769 874
1,033
-
200
400
600
800
1,000
1,200
1,400
1,600
1,800
Jun-11 Sep-11 Dec-11 Mar-12 Jun-12
Dulles Corridor Enterprise Days Reserved and Unrestricted Cash on Hand
Moody's 2010
"Baa" rated
toll roads
median 671
Moody's 2010
all toll roads
median 672