Embed Size (px)
Citation preview

!lr;,_
·Report to the NRC on Guidance for Preparing Scenaric s for Emergency Preparedness Exercises at Nuclear Generating Stations Draft Report for Comment
Prepared by G. F. Martin, E. E. Hickey, M. P. Moeller/PNL D. H. Schultz, G. W. Bethke/CC
Pacific Northwest Laboratory
Comex Corporation
Prepared for U.S. Nuclear Regulatory Commission
NOTICE
•
t

Dear Reader:
UNITED STATES NUCLEAR REGULATORY COMMISSION
WASHINGTON. 0, C. 20555
March 27, 1986
This handbook was prepared to assist emergency planners in developing scenarios for emergency preparedness exercises at nuclear power plants. In seeking public comments on this handbook we hope to take advantage of the wide experience of our licensees, their contractors, and state and local emergency planners in pre· paring scenarios and conducting and evaluating emergency preparedness exercises.
The official public comment period will end approximately 60 days from the date of this letter. Your comments will be most helpful if they are received during this period; however, comments will be accepted at any time. Comments should be directed to John 0. Philips, Chief, Rules and Procedures Branch, Room 4000 ""BB, Washington, OC 20555. If there are any questions, the agency contact is Edward M. Podolak, Jr., Senior EmergencY Preparedness Specialist, telephone: 301/492-7290. Thank you in advance for your assistance.
4t 1 ~~~4anofl,"'!i'-";""i;'-ctor Oivisi~~f Emergency Preparedness and Engineering Response
Office of Inspection and Enforcement

3 3679 00058 8899
Report to the NRC on
NUREG/CR-3366 PNL-4758
Guidance for Preparing Scenarios ·for Emergency Preparedness Exercises at Nuclear Generatmg Stations Draft Report for Comment
Manuscript Completed: March 1986 Date Published: March 1986
Prepared by G. F. Martin, E. E. Hickey, M.P. Moeller, Pacific Northwest Laboratory 0. H. Schultz, G. W. Bethke, Come)( Corporation
Pacific Northwest Laboratory Richland, WA 9936.2.
Comex Corporation 1419 Swootwatec Loop Olympia, WA 98602
Prepared for Division of Emergency Preparedness and Engineering Response Office of Inspection and Enforcement U.S. Nuclear Regulatory Commission Washington, D.C. 20556 NRC FIN 82311


ABSTRACT
A scenario guidance handbook was prepared to assist emergency planners in developing scenarios for emergency preparedness exercises at nuclear power plants. The handbook provides guidance for the development of the objectives of an exercise, the descriptions of scenario events and responses, and the Instructions to the participants. lnformation concerning implementation of the scenario~ critiques and findings* and generation and format of scenario data are also included. Finally, examples of manual calculational techniques for producing radiological data are Included as an appendix.
iii


EXECUTIVE SUMMARY
Current government regulations require that the licensee of a commercial U.S. nuclear power plant make provisions for the conduct of emergency preparedness exercises. Such provisions include the development and subsequent review of a scenario designed to drive the e~ercise. The purpose of this report is to provide guidance for the development of such a scenario. The guidance is intended for an individual in the role of emergency preparedness coordinator who is generally responsible for scenario development and review9 The guidance is presented as a step-by-step procedure and discussion with numerous examples deslgned to facilitate the development of a scenario adequate to test the plant's emergency preparedness objectives.
This report provides a detailed description of the key elements composing a scenario. The elements include exercise objectives. exercise participation, event description and data requirements~ In addition, guidance is provided for the scenario's technical review) preexercise instructions and postexercise activities. Finally, an appendix is included on manual calculational techniques for generating radiological data.
Exercise objectives provide both a basis for developing a scenario and a means to evaluate the response by the emergency preparedness organization. Specific exercise objectives may be associated with a need to test aspects of the licensee's emergency response plan, procedures and organization, or to test those of participating offsite agencies. Consequently, onsite, offsite, and joint objectives should be developed in areas including notification, accountability, chemistry analysis, offsite radiological monitoring, health physics support. accident assessment and evaluation, protective action recommendations, and communications.
Exercise participation identifies the appropriate onsite and offsite emergency response personnel involved in the exercise. The onsite response dur1ng an exercise should include accident detection and mitigation, event classification, appropriate notification, and communication of protective action recommendations to the appropriate offsite authorities. Offsite response should ensure that adequate assistance is provided to support the needs of the onsite organization and to effectively implement protective actions designed to protect the health and safety of the public.
The event description includes the sequence of accident events, the details and timing of these events. and followup events under reentry and recovery. A description of peripheral events, such as medical emergencies, is also Included in this section of the report. An essential goal of the selection of an accident sequence is to choose those events which wi,l initiate player responses designed to satisfy the exercise objectives. The complexity of the sequence of accident events is frequently dictated by the magnitude of the offsite radiological release necessary to satisfy the objective of participating offsite agencies.
Complete, consistent and appropriate data are necessary for a successful emergency preparedness exercise. When the exercise objectives are finalized and the sequence of accident events are established, data should be prepared for instrumentation in the control room, radiation detectors and alarms
v

throughout the plant, available meteorological systems, potential coolant sample analyses, and radiological and contamination data for affected inplant and offsite areas. In addition, radiological and contamination data should be prepared for the reentry and recovery phase as well as any peripheral events.
The selection of a multidisciplinary team to develop and subsequently review the scenario is recommended. Furthermore, the final review process should ensure that modifications made during the review process are evaluated to ensure that internal data consistency is maintained.
vi

CONTENTS
ABSTRACT . iii
EXECUTIVE SUMMARY v
TABLES • ix
ABBREVIATlONS xi
1.0 INTRODUCTION • 1.1
2,0 SCENARIO DEVELOPMENT 2.1
2.1 EXERCISE PARTICIPATION 2.1
2.1.1 Onsite Response 2.1
2.1.2 Offsite Response • 2.3
2.1.3 Control of Participation • 2.4
2.2 EXERCISE OBJECTIVES • • 2.7
2.3 EVENT DESCRIPTION 2.9
2. 3 .1 Summary of Key Events • 2.13
2.3.2 Details and Timing of Events 2.18
2.3.3 Peripheral Events • 2.21
2.3.4 Reentry/Recovery • • 2.23
2.4 DATA • • 2,25
2.4.1 Data Needs 2.25
2.4.2 Data Sources 2.28
2.4.3 Sequence and Method of Data Generation • 2.32
2,4.4 Data Format . • 2.35
2.5 FINAL TECHNICAL REVIEW • • 2.37
2.5.1 Overview 2.37
2.5.2 Inplant Data and Systems Status 2.38
2.5.3 Onsite But Out-of-Plant Radiological Data 2.39
vii

2,5,4 Release Pathways .
2.5.5 Offsite Radiological Data
2.5.6 Peripheral Events . •
2,40
2.40
2.41
2.5.7 Conflict of Scenario with Established Procedures 2.41
3.0 PREEXERCISE INSTRUCTIONS .
3.1 CONTROllERS' INSTRUCTIONS
3.2 PLAYERS' INSTRUCTIONS •
3.1
3.1
3.2
3.3 EVALUATORS' INSTRUCTIONS 3.3
4.0 POSTEXERCISE ACTIVITIES 4.1
REFERENCES R.l
APPENDIX - CONSIDERATIONS AND CALCULATIONAL METHODS FOR GENERATING RADIOLOGICAL DATA A.l
APPENDIX CONTENTS A.l
viii

TABLES
2.1 Examples of Exercise Objectives
2.2 Suggested Checklist and Timetable for Exercise Scenario Development
2,3 Exercise Chronology/Key Events Summary List
2.4 Example Page from a Master Scenario Events List
ix
2.8
2.10
2.13
2.19


A LARA ARM ATWS BOP BWR CAM CR CST CT OAS OOE EAL EBS ECCS EOC EOF EOP EPA EPIP EPZ ERF ERT FEMA FSAR GM HPCI IN PO LCO LOCA LPCI LWR MPC MWt NPS NRC NWS NTOL osc PAG PRA PRM PSAR PWR RCIC RCS RO RHR RWST
ABBREVIATIONS
as low as reasonably achievable area radiation monitor anticipated transient without scram balance of plant boiling water reactor continuous air monitor control room condensate storage tank chemistry technician data acquisition system U.S. Department of Energy emergency action level Emergency Broadcasting System emergency core cooling system emergency operations center emergency operations facility emergency operating procedure U.S. Environmental Protection Agency emergency plan implementing procedure emergency planning zone emergency response facility emergency response team Federal Emergency Management Agency final safety analysis report Geiger-Mueller high-pressure coolant injection Institute of Nuclear Power Operations limiting condition for operation loss-of-coolant accident low-pressure coolant injection light water reactor maximum permissible concentration megawatt thermal nuclear plant supervisor U.S. Nuclear Regulatory Commission National Weather Service near-term operating license operations support center protective action guideline probabilistic risk assessment process radiation monitor preliminary safety analysis report pressurized water reactor reactor core isolation cooling reactor coolant system reactor operator residual heat removal reactor water storage tank
xi

SASA SCBA SPOS TLO TM! TK
ABBRtVlATlONS (contd)
severe accident sequence analysis self-contained breathing apparatus safety parameter display system thermoluminescent dosimeter Three Mile Island Unit 2 technical support center
xii
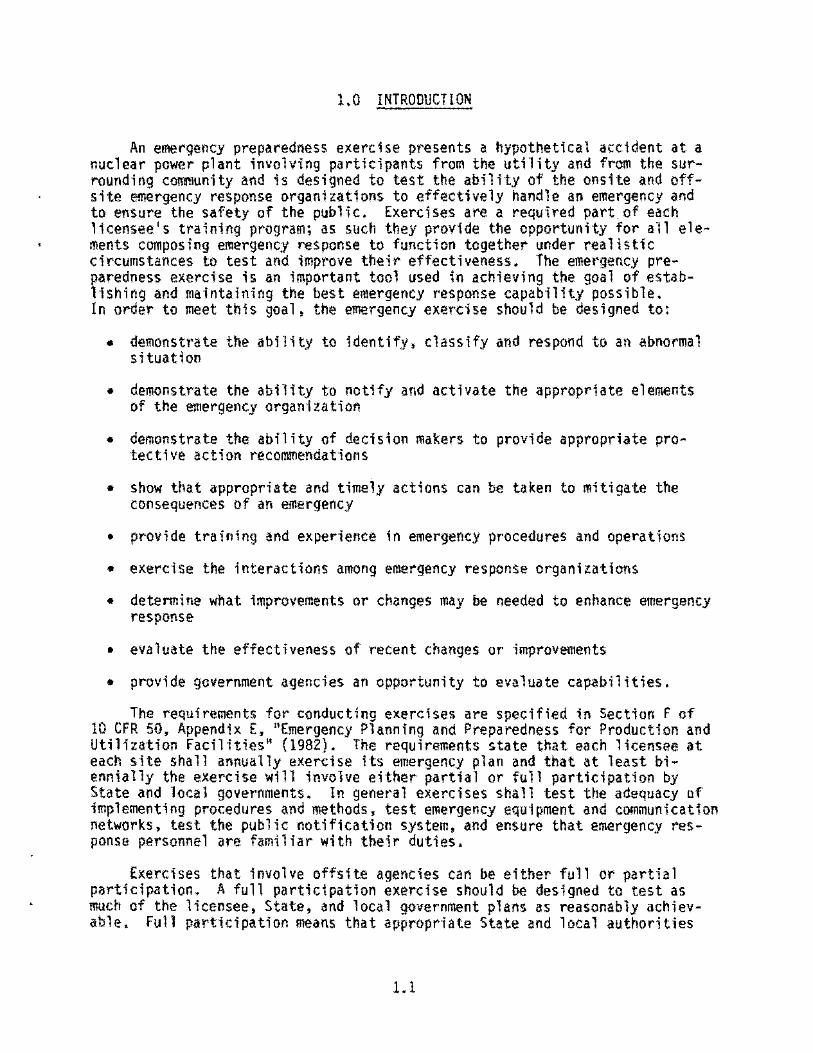
1.0 INTRODUCTION
An emetgency preparedness exercise presents a hypothetical accident at a nuclear power plant involving participants from the utility and from the surrounding community and is designed to test the ability of the onsite and offsite emergency response organizations to effectively hand1e an emergency and to ensure the safety of the public, Exercises are a required part of each licensee 1 s training program; as such they provide the opportunity for a11 elements composing emergency response to function together under realistic circumstances to test and improve their effectiveness. The emergency preparedness exercise is an important tool used in achieving the goal of establishing and maintaining the best emergency response capability possible. In order to meet this goal, the emergency exercise should be designed to:
• demonstrate the ability to identify! classify and respond to an abnormal situation
• demonstrate the ability to notify and activate the appropriate e1ements of the emergency organization
• demonstrate the ability of decision makers to provide approprlate protective action recommendations
• show that appropriate and timely actions can be taken to mitigate the consequences of an emergency
• provide training and experience in emergency procedures and operations
• exercise the interactions among emergency response organilations
• determine what improvements or changes may be needed to enhance emergency response
• evaluate the effectiveness of recent changes or improvements
• provide government agencies an opportunity to evaluate capabilities.
The requirements for conducting exercises are specified in Section F of 10 CFR 50, Appendix E, "Emergency Planning and Preparedness for Production and Utilization Facilities 1
' (1982). The requirements state that each licensee at each site shall annually exercise its emergency plan and that at least biennially the exercise will involve either partial or full participation by State and local governments. In general exercises shall test the adequacy of implementing procedures and methods, test emergency equipment and communication networks, test the public notification system, and ensure that emergency response personnel are familiar with their duties.
Exercises that involve offsite agencies can be either full or partial participation. A full participation exercise should be designed to test as much of the licensee, State, and local government plans as reasonably achievable. Full participation means that appropriate State and local authorities
1.1

and licensee personnel physically and actively take part in testing major observable portions of the onsite and offsite emergency plans and mobilize sufficient State. local. and licensee personal and resources to verify the capabi1ity to respond to the accident scenario. Partial participation means appropriate offsite authorities shal1 actively take part in the exercise to sufficiently test direction and contro1 functions such as protective action decision making and communications capabi1ities.
The foundation on which an emergency exercise is built is the accident scenario. The scenario serves as the master plan for an exercise and is its driving force. A realistic, well-planned scenario is essential in order to satisfy all the requirements mentloned above. The purpose of this document is to provide guidance for those who may be called upon to create a hypothetical accident scenario for an emergency exercise at a nuclear power reactor. Each step in preparing an exercise scenario is examined, and suggestions for accomplishing each step are offered. Also included are sections concerning the preparation of instructions for participants, the conduct of postexercise activities and an appendix containing considerations and calculational techniques for preparing radiological data.
In preparing this document, we have assumed that drills and partial exercises have already tested individual components of the emergency response organization; therefore, the scenario development described within is for a full participation exercise. Since preparing an accident scenario involving full, partial or no offsite involvement requires bas1cal1y the same steps, with appropriate consideration for the exercise objectives, the guidance in this handbook should apply to all three.
1.2

2.0 SCENAR!O DEVELOPMENT
The scenario, as the script for the emergency preparedness exercise, should contain all the information necessary for the participants to react realistically to the hypothetical accident. The scenario should present a realistic and challenging situation to the participants allowing them the opporturity to test and display their capabilities. A poorly developed or unchallenging scenario can significantly reduce the learning value and the display of capabilities. and can fail to adequately test the necessary elements of emergency response.
The basic steps in the development of a scenario are as follows: decide which onsite and offsite organizational elements are to participate~ develop exercise objectives! produce the accident event description, deve1op the technical data, and perform the final technical review. These steps are listed in roughly a logical sequential order. Each step is not necessarily independent of the others, and although some steps cannot begin until others are complete, several could proceed tn parallel. For the sake of clarity and simplicity, each of the above mentioned steps will be independently addressed in the remainder of this chapter.
2.1 EXERCISE PARTJC!PAT!ON
Which onsite and offsite organizational elements are to participate in the exercise emergency response and the level of that participation are affected by regulatory requirements, training considerations, previous deficiencies, workload, and specific objectives of organizationa1 elements. Section F of 10 CFR SO, Appendix £, states that a full participation exercise shall test 11 as much of the licensee, State, and local emergency plans as is reasonably achievab1e without mandatory public participation. 11 Because an exercise is also a training experience, training considerations may influenc~ participation. The existence of prior deficiencies may dictate the participation of a particular element in order to demonstrate that the deficiency has been remedied. Participation and 1evel of involvement of specific organizational elements may also be influenced by workload commitments (e.g.9 current outage) or specific organizational exercise objectives.
The onsite response to an exercise should include accident detection and mitigation, event classification, personnel and agency notification, and formulation of protective action recommendations to appropriate offsite authori~ ties. Offsite response should ensure that adequate assistance is available to support the needs of the ons1te organization and to implement protective actions to protect the health and safety of the general public and plant employees.
2.1.1 Onsite Response
Emergency planners should consider the impact of onsite response on the safe operation of the reactor plant. Plant personnel responding to the
2.1

exercise usually include management. operations, engineering·, chemistrys and health physics personnel. The staffing requirements of the exercise should not reduce the operating staff beT ow minimum required levels nor should exer~ cise involvement distract required staff from their primary functions. The scenario should summarize the extent of onsite participation by the controllers* players, and evaluators and should specify the method of preventing the exercise from interfering wlth normal reactor operations.
Players are personnel designated to make up the emergency response organization during an exercise. Players should be clearly identified to set them apart from those who are actually operating and maintaining the plant and to facilitate identification by evaluators and controllers. As a note, all participants should be clearly identified to ensure proper communication and an understanding of responsibilities and duties among participants.
The numbers and kinds of players selected depends on the scope of the exercise# Enough players should be designated to ensure that each element of the organization can perform the tasks required by the scenario. For instance, if the events in the scenario have extensive radiological consequences, enough health physics technicians should participate to support all the required survey efforts and any other actions that might require health physics support. It is recommended that key members of the emer9encr response organization (i.e., emergency directors. technical support center (TSC) and emergency operations facility (EOF) directors) be alternated between exercises to ensure that all individuals are trained~
No person should be allowed to participate as a player who has been involved with the scenario generation process or who has been privy to scenario details. Confidentiality of the scenario should be carefully maintained. Provisions should be made to maintain this confidentiality throughout scenario generation. review, and distribution*
Controllers control the flow of a scenario by introducing messages or data at appropriate times. In addition, controllers guard against actions that would adversely affect actual plant operations or that would ieopardize the flow of the scenario. The controllers are usually supervised by a lead controller who is responsible for the overall flow of the scenario and has the authority to alter the flow. The success of an exercise depends to a great extent on the proficiency of the controllers. Because controllers are critical to the success of an exercise, they should be selected with care. Controllers should be technically proficient in the areas to which they are assigned and should be able to communicate clearly and analyze situations quickly.
The number of controllers assigned for an exetcise depends on the exercise scope. In general, at least one controller is assigned to each event or sequence of events for which players need information or data~ or to each location where an action critical to the scenario is to take place, or to where an action is to he taken that may affect the safety of the plant or personnel. Some locations from which many teams are dispatched, such as the operations support center (OSC), may require more than one controller. Too few controllers can lead to a brea~down in the flow of the scenario. Controllers often are tasked with evaluations; however, they should focus their attention mainly
2.2

on controlling the flow of the scenario with observation as a se~ondary function. If possible it is recommended that controllers not be assigned evaluator responsibilities along with their control functions.
Evaluators observe and evaluate the total response to the scenario, and their comments provide the basis for postexercise evaluation. Evaluators should concentrate only on making observations; they have greater mobility than controllers during the exercise and can position themselves to obtain the best view of the task being performed. As a resultt evaluators often have the best overview of performance at their assigned location.
Evaluators should be selected for their knowledge of the areas to which they are assigned and of how those areas fit into the overall emergency response. The number of evaluators required depends on the complexlty of the scenario; generally, the more evaluators there are, the better the coverage. While it is difficult for a controller to handle more than one location, an evaluator can often cover more than one, provided that the activities at the different locations do not overlap and that time is available for the evaluators to move from one location to the next~ Enough evaluators should be supplied to ensure that all activlties critical to the achievement of the scenario objectives are covered.
2.1.2 Offsite Response
For a full participation designed to test as much of the licensee, State, and 1oca1 emergency plans as possible, the offsite response may involve many different organizations. Licensee support organizations may include ambulance services, hospitals, and laboratory analysis. Local agencies may include police, fire, and county emergency response organizations. State response may include state police, the state emergency response organizatlon, or specific state agencies with authority to respond to radiological emergencies~ federal agencies that may respond include the Nuclear Regulatory Commission (NRC), the Federal Emergency Management Association (FEMA), the Department of Energy (DOE), and in some cases the Coast Guard. The greater the number of offsite participants, the harder It is to design the scenario to meet all of their objectives. Scenario areas that become more critical are event timing, length of play, and quantity and type of data. Because of the number of organizations involved and the varying response and activation times, it is important for events to be timed so that appropriate organizations can react and respond. Since some offsite organizations are not activated until late in the scenario when the most serious emergency levels are encountered, it is important to ensure that play continues long enough for them to accomplish their objectives. To fully involve some organizations (such as medical, fire, police), special peripheral events and data may need to be created. It is important when coordinating the participation of offsite agencies to establish contact ear1y in the scenario development process to establish a clear line of communication, to determine each organization's exercise objectives, and to resolve potential conflicts.
Offsite technical support organizations and laboratories sometimes participate In an exercise. Unless the scenario specifically states that participation by these support groups is to be simulated, the onsite players
2.3

may activate these organizations and some interaction may result. If these organizations are not to be included in the exercise, then the scenario should state that participation by these groups will be simulated, and the information and support normally supplied by these organizations should be prov1ded by the scenario as controller messages.
Organizations that are not participating in, but may be affected by, the exercise should be informed. For instance, if helicopters are to be used, then loca1 airports may need to be notified. and if emergency vehicles are to be used or if traffic may be disrupted; then local po11ce should be informed. Any agency that may be contacted by the public with questions concerning exer~ cise related activities should be provided with appropriate information.
Extensive public involvement in an exercise is not recommended because it is of doubtful value in increasing preparedness for emergencies. However, the public can be involved in limited ways, for instance during the testing of procedures for operating relocation centers or the testing of public notifi~ cation, alerting, or warning systems.
When offsite participation is 1i~ely to generate actiYities that may impact or be observed by the general public. such as traffic controls, offsite monitoring activities, or siren activation! the following types of information should be publicized through the news media before the exercise to improve public understanding and confidence:
• It should be publicized that exercises are required to be conducted periodically.
• The date of any exercise involving offsite participants and the type of offsite activities involved should be made known to the public well in advance.
• On the day of the start of an exercise involving offsite participants, the public should be relnformed.
2.1.3 .Control of Participation
The need for both free play (undirected response) and a structured time line in the scenario should be considered when the sequence of events and chronology are being developed. The scenario shou1d provide the p1ayers significant opportunity for free play in their responses to the developing time line, yet provide sufficient structure to ensure that the exercise progresses on schedule to the desired conclusion. The larger the participation by offsite organizations, the less flexible the schedule becomes since so many other persons and activ1ties are predicated on the utility's response. As a minimum, the scenario should not dictate the player's actions; rather, if the action is inappropriate or insufficient, then a controller can intervene with a ''contingency message .. to ensure that the desired response occurs after the player has had the opportunity to perform. On the other hand, if players are given too much freedom, they will typically solve problems too quickly, thus terminating the event and preventing the more serious conditions 1n the scenario from developing. A balance between free play and structure is necessary
2.4

and will allow the greatest amount of freedom for the players yet ensure the smooth progression of scenario events.
Controllers with extremely comprehensive knowledge of the plant, who are able to analyze situations quickly, should be selected for the control room positions to permit the maximum amount of free play and yet ensure that they will be able to divert the quick fixes of the operators. Tabletop reviewing of the scenario to uncover and forecast all the possible operator branching paths will help prevent a premature termination of the sequence, and the attendant unrealistic declaration by the controller that the corrective action did not work.
Guiding the flow of the scenario without restricting free play lies in the ability of the controller(s) to direct the player•s actions subtly, by redirecting efforts with contingency messages if actions go too far awry and by using a scenario time line that controls the scenario events and the availability of systems and equipment.
In preparing the scenario, planners should decide whether actions and activities should be real or simulated. The actual operation of the plant should not be altered for the emergency exercise. In reality, the plant may be in any state of operation from nonoperational to full power. For the safety of the plant and personnel, actual manipulation of most plant systems is not recommended. However, this does not preclude the actual performance of many activities during an exercise.
When activities can actually be performed, the demands placed on personnel, equipment, and resources are more realistic and provide a better learning experience. Actions that do not affect plant operation should be performed to the maximum extent possible. However, simulation may be the only practical means of accomplishing actions that are too time consuming, too dangerous, or too costly to be performed during an exercise.
The scenario planners should use their discretion when deciding how much simulation to use during an exercise, keeping in mind that two of the main purposes for conducting an exercise are to demonstrate the adequacy of emergency response and to uncover weaknesses in the response structure. Too much simulation may leave the evaluators unable to evaluate the adequacy of response in certain areas and also reduce the responding organizations of the opportunity to demonstrate their capabilities under pressure.
Equipment and personnel operations that should be considered for actual performance include:
• donning of fire brigade clothing; operation of fire fighting equipment such as extinguishers and hoses outside of confined spaces
• operation of first-aid equipment, such as respirators, splint kits, gurneys, stretchers, etc.
• performance of vital-sign monitoring on victims
2.5

• operation of meters, portable pumps, and other repair equipment
• obtaining postaccident samples and containment/stack grab samples
• operation of all communications systems
• operation of dose assessment equipment
• establishing control pointst performing personnel decontamination, operating survey instruments, and wearing anticontamination gear including self-contained breathing apparatus (SCBAs).
The use of a simulator, if available, reduces the need for control room simulation by making engineering data input more realistic and allowing operators to respond realistically. The simulator also aids in ev~nt timing, creates a log of operator actions, which is helpful during postexercise evaluation, and limits the impact of the exercise on plant operations by moving the ~ction out of the real control room. Another consideration. if a simulator is to be used realistically, is whether or not it is capable of representing key control room data transmission and c~unications capabilities. For instance can all existing data transmission links. such as a saf~ty parameter display system (SPOS) or meteorological data link, between the control room and other response facilities be driven from the simulator? Also, are all the communication and notification capabilities of the control room, such as plant paging, dedicated phone lines, or automatic notification equipment, available from the simulator?
During the performance of an exercise, safety measures, including the ability to recognize and respond to a real emergency. should be maintained. The assigned operating shift personnel responsible for the startup, power, or shutdown operation of the plant should not be participants in the exercise. Exercise activities should not excessively distract personnel from their assigned duties of monitoring and controlling the safe operation of the power plant. In addition, the exercise scenario should not degrade the condition of vital systems, equipment, and supplies, or affect the ability of equipment or personnel to detect, assess, or respond to a real emergency. An example would be the use of a significant portion of the plants supply of SCBA cylinders without recharging during the exercise, leaving only a few or none to combat a real fire. The scenario should not contain any actions that endanger participants, other personnel. members of the public, or the environment.
ihe intent of the exercise is to allow the players as much freedom as possible to identify solutions to problems and to perform these tasks as required during an emergency. nowever, because no action that reduces plant or public safety should be taken, simulation of actions should be considered in situations where there is a conflict between these principles~ The potential for adversely affecting plant operations, radiological or otherwise, should be considered and specifically avoided in the scenario design.
If during the conduct of an exercise an actual emergency condition occurs, then exercise play should be terminated immediately and the full resources of the utility should be directed toward mitigating the emergency. All participants should have clear instructions concerning their responsibilities in such a situation. If appropriate, after the actual emergency conditions are overt
2.6

the exercise can be resumed smoothly if preplanned agreements exist to provide authority for restarting the exercise and to cover other administrative details (such as clock time, repositioning personnel, etc.).
2.2 EXERCISE OBJECTIVES
The objectives provide both a basis for developing yardstick against which to gauge exercise performance. tives of a full participation are to:
• test the overall response capability
the scenario Some genera 1
and a objec-
• test the adequacy of the emergency plan and implementing procedures
• develop the skills of emergency response personnel
• evaluate organizational interactions
• ensure that personnel know their emergency duties
• evaluate the suitability of assignments for individuals
• test communications
• evaluate equipment and facilities
• develop the confidence of personnel who should make decisions
• objectively critique the emergency response and identify significant deficiencies.
Specific exercise objectives can be prepared and grouped into main areas such as onsite objectives, offsite objectives, and joint objectives; these can be further broken into subcategories, such as communications, accident assessment and evaluation, health physics, offsite monitoring, etc. Onsite objectives are for the utility•s emergency response organization; offsite objectives are related to the various offsite emergency response organizations; and joint objectives concern the coordination among onsite and offsite organizations.
Each area should contain as many specific objectives as appropriate for the desired performance. The more specific the objectives are to the desired performance, the easier it will be for the evaluators to determine whether the objectives were met or to identify deficiencies that prevented them from being achieved. For example, an objective to "demonstrate the deployment of environmental monitoring teams" is fundamentally different from the objective to .. demonstrate the ability to rapidly and accurately assess environmental radiation fields ... Likewise, 11 demonstrate the activation of the TSC 11 falls far short of 11 Verify that the staff of the TSC is capable of timely and correct assessments of accident conditions." Some examples of scenario objectives are contained in Table 2.1.
The detailed objectives should reflect not only the areas that should be evaluated as required by 10 CFR 50, Appendix E, and as recommended in the
2. 7

TABLE 2.1. Examples of Exercise Objectives
Onsite Objectives
• Demonstrate the adequacy of the plant's communications system including: internal plant communications; communication links to offsite utility emergency centers; and communication links to county and state emergency centers and authorities.
• Demonstrate the ability to organize and implement an integrated radiological emergency response, including data gathering, receipt and analysis of data, sharing of data among the licensee, state and county for evaluation and verification.
• Demonstrate the capability of emergency personnel to de-escalate the emergency classification and institute reentry and recovery. This should include the ability to identify de-escalation criteria, assess and implement procedures for reentry, identify and designate staff assignments for a long-term recovery organization, and discuss and set priorities for a plan of action for recovery.
Offsite Objectives
• Demonstrate the capability of federal, state, and county emergency response agencies to identify and provide for resource requirements.
• Demonstrate the capability of the county and the state to alert and notify the affected permanent and transient public within the plume exposure emergency planning zone (EPZ) of an incident at the plant and to follow up with information as required. This will include activation of the prompt notification system (sirens and tone alert radios) and the Emergency Broadcast System (EBS).
• Demonstrate the capability to implement appropriate actions.
of elected and radiological
Joint Objectives
appointed emergency
officials response
• Demonstrate the ability of the licensee, state and county to calculate dose projections, compare the projections to the protective action guides (PAGs) and determine appropriate protective actions.
• Demonstrate the activation and staffing of the Emergency News Center by utility, state, and county public information personnel, and provide for periodic public information releases and rumor control.
2.8

TABLE 2.1. (contd)
_______ ;,:;Jo"'i"'n"'t-'0'-'b"".J.'l.c_t i ve• ( contd)
• Demonstrate the ability to administer first-aid treatment to a contaminated victim, provide for transportation to a hospital, provide medical treatment at the hospital~ decontaminate the victim~ and provide contamination control and health physics support throughout the exercise.
criteria of NUREG-0654/fEMA-REP-1, Revision 1 (NRC 1980a), but also the areas that the utility or offsite organizations and agencies may wish to evaluate for their own information or to demonstrate that a past problem has been resolved. For example, objectives for evaluatinq a new set of procedures1 a new agreement with an offsite a9ency, the correction of previous faults, or a generic area of national interest or regiona1 concern could be developed.
The emergency planner should work with utility management personnel to establish the onsite objectives and should obtain from each participating offsite organization a detailed list of its objectives for the exercise~ All joint objectives should be arrived at by agreement between the utility and the offsite organizations. Participating organizations should be contacted during the initial •tages of scenario development •o that each can establish its own objectives for the exercise. The objectives of each offsite organization should be compared with the objectives of the utility to determine whether any conflicts exist and to ensure that agreements are reached on the extent of participation by each organization. Agreement• on the timing and logistics for scenario events shou1d also be made. Depending on the exercise objec~ tives, the types of organizations that might participate include fire departments) ambulance services, polices and localt county, state, and federal agencies.
Once determined, the objectives establish the scope of the exercise and are used to determine the level of participation, the selection of events, and the technical data to be generated.
2.3 EVENT DESCRIPTION
A scenario development team that includes expertise in all disciplines necessary for an adequate scenario should be established early in the process. The team should normally be led by the emergency planning coordinator; other team members should include personnel from operations, engineering (reactor, mechanical, and electrical}, health physics, and safety engineering (medical and fire). Adequate authority and resources should be provided so that the team can produce an effective exercise. Table 2.2 will assist scenario planners in developing and preparing for an exercise, from the time it is fir•t discussed to the day before the exercise begins (T-1 Day).
2.9
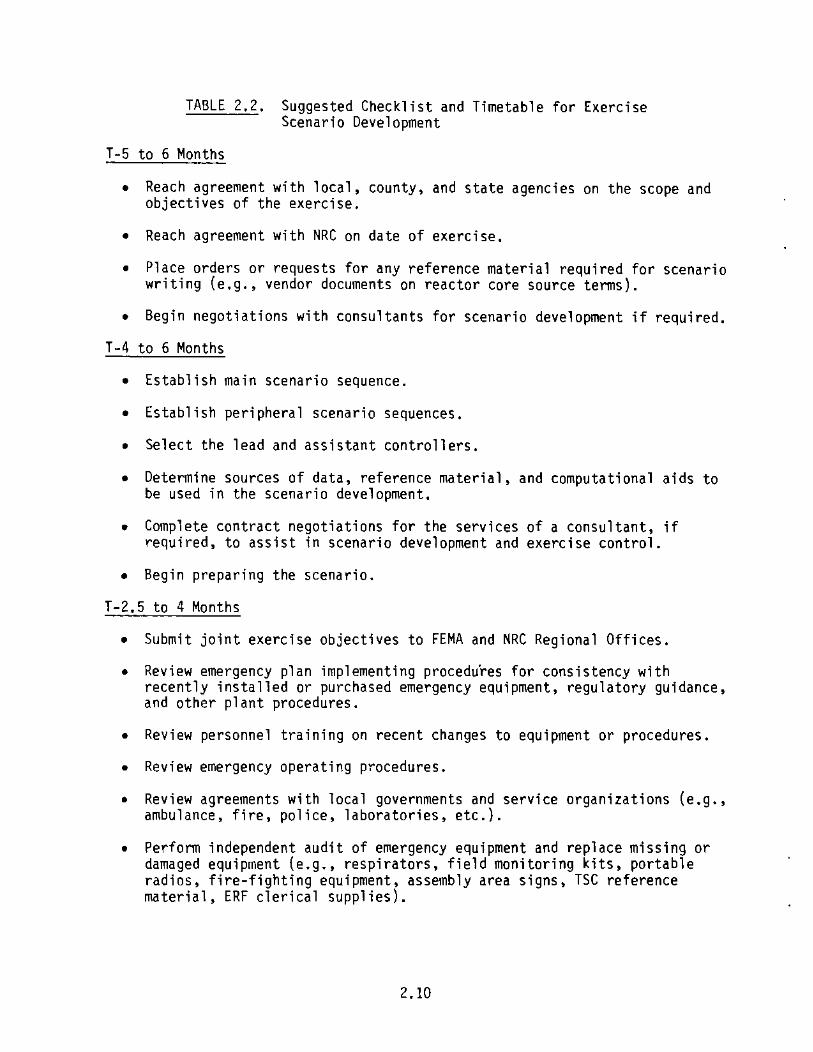
TABLE 2,2, Suggested Checklist and Timetable for Exercise Scenario Development
T-5 to 6 Months
• Reach agreement with local, county, and state agencies on the scope and objectives of the exercise.
• Reach agreement with NRC on date of exercise.
• Place orders or requests for any reference material required for scenario writing (e.g., vendor documents on reactor core source terms).
• Begin negotiations with consultants for scenario development if required.
T-4 to 6 Months
• Establish main scenario sequence.
• Establish peripheral scenario sequences.
• Select the lead and assistant controllers.
• Determine sources of data, reference material, and computational aids to be used in the scenario development.
• Complete contract negotiations for the services of a consultant, if required, to assist in scenario development and exercise control.
• Begin preparing the scenario.
T-2.5 to 4 Months
• Submit joint exercise objectives to FEMA and NRC Regional Offices.
• Review emergency plan implementing procedures for consistency with recently installed or purchased emergency equipment, regulatory guidance, and other plant procedures.
• Review personnel training on recent changes to equipment or procedures.
• Review emergency operating procedures.
• Review agreements with local governments and service organizations (e.g., ambulance, fire, police, laboratories, etc.).
• Perform independent audit of emergency equipment and replace missing or damaged equipment (e.g., respirators, field monitoring kits, portable radios, fire-fighting equipment, assembly area signs, TSC reference material, ERF clerical supplies).
2.10

TABLE 2.2. (contd)
• Arrange to use faci1ities that are not owned and controlled by the 1icensee (possible examples include a remote assembly area and a news or media center).
• Perform a table-top review of the scenar1o to identify events for which expert players will devise imaginative corrective actions or where actions may not occur as rapidly as first planned. Check data for gaps, format, form. etc. Revise the scenario as necessary. This review should be performed by personnel knowledgeable in scenario subjects and who are not participants in order to maintain scenario security.
T-1.5 to 2.5 Months
• Complete final draft of exercise scenario and data and obtain final approval from NRC and other participating agencies.
• Receive and incorporate, if appropriates review comments into exercise scenario.
• Establish distribution list for exercise scenario books.
• Conduct a thorough page check of emergency exercise scenario books.
• Make preliminary arrangements with mass media (newspapers, television stations, radio stations) to provide final notification to the public concerning the exercise during the last few days before the scheduled exercise date.
T-1.5 to 2.0 Months
• Submit complete exercise scenario to NRC and FEMA Regions for review.
• Lead controller: begin training the controller team.
• Prepare public information explaining the exercise, for distribution to the public in the area to be affected by the exercise. The number of copies prepared should be based on an updated distribution list.
• Arrange for a shift rotation in the operations department to provide for a second set of control room operators (drill crew) on the day of the exercise (do likewise for any other positions deemed necessary}.
• Reproduce adequate copies of exercise scenario books for all contro11ers and evaluators. Some sections may be omitted for selected controllers although all controllers should be <nowledgeable of the entire scenario.
• Distribute copies of scenario books to controllers$ evaluators, and NRC observers.
2.11

TABLE 2.2. (contd)
• Prepare identification (e.g., badges~ arm bands, hats, etc.) for all participants.
T-2 to 4 Weeks
• Provide information to the public in the area to be affected by the exercise, informing them of the times they may expect unusual events to occur (e.g., warning system activation, field monitoring team activities, road blocks).
• Continue controller training.
T-1 to 2 Weeks
• Ensure that clearance and/or approval letters for NRC observers and other official visitors are held by the security department and that names on list match list of observers.
• If necessary, arrange for meals to be provided for players, controllers, and evaluators.
• Lead controller should conduct final reviews and briefing on the scenario with controller team.
• Conduct final training for simulated victims and actors (e.g., contaminated injured personnel, missing personnel, terrorists).
• Brief site security personnel on enough of the scenario content to avoid confusion during the exercise and to ensure that real security matters that arise during conduct of the exercise are responded to properly.
• Ensure that any props to be used (e.g., moulages) are available.
• Assign and train personnel to be evaluators.
• Perform final test of any complex equipment to be used in the exercise (e.g., dose assessment computer, multiple-station call-up systems, post-accident sampling systems).
T-3 Days
• Make arrangements with the mass media (television, radio, newspapers, handbills, etc.) for final reminders {on the day of the exercise) to the public in the area to be affected by the exercise.
T-2 Days
• Provide any additional scenario data and any materials requested by the NRC observation team leader, who usually arrive in the area two days before the scheduled exercise date.
2.12

TABLE 2.2. (contd)
T-1Dg
• Be prepared to conduct training and badging of the NRC observation team and other official visitors (if required}.
• Conduct briefing for NRC observation team on the contents of the exercise scenario book and respond to any questions.
• Conduct preexercise briefing for utility controllers and evaluators.
2.3.1 Summary of Key Events
The scenario development team should write a general description of the events in the scenario. This can be a chronological list of the major events that will cause a Site Area Emergency or General Emergency condition to develop and cause the major response organizations to react. The list is an overview of initial plant conditions, simulated faults and status of reactor systems. key points concerning reactor system and containment integrity, and expected emergency classificatlon levels. Table 2.3 is an example of a summary list for an exercise.
TABLE 2.3. Exercise Chronology/Key Events Summary List
Time Event Summary
Scenario Day 1
January25,198
0600 (EDT) Unit 1 is in a maintenance outage that has existed for several months. Unit 2 is operating at 100% power and has been at that level for the past 5 months since the last startup. All equipment is in a normal lineup and in normal operating condition except C Charging Pump, which is out of commission for motor hearing replacement and will not be restored for at least 48 hours. All control rods are out except Group 6 rods~ which are at 102 1
' for flux shaping. The Toad dispatcher has indicated that the grid can use all the power the plant can produce. At 0500, an RCS chemistry sample was ordered following a minor plant transient. The nuclear plant supervisor (NPS) is awaiting the results. A severe weather advisory has been issued by the National Weather Service (NWS) for Hurricane Peter moving west-northwesterly toward the Florida coast at 15 mph, and due to arrlve at 2400 hours. The wind is currently from the northeast at 5 mph.
2.13

TABLE 2. 3. ( contd)
Time Event Summary
Scenario Day I (contd)
D62D
D63D
0655
0730
0810
0830
0900
liDO
IllS
1200 (approx)
1245 (approx)
Scenario Day 2
1300 + 24 hrs
1800 (approx)
Chemistry results indicate 1.0 ~Ci/gm 1311 dose equivalent (DE) and 13.1 "Ci/gm gross activity, indicating possible fuel element problem but not an emergency action level (EAL).
National Hurricane Center in Miami, Florida, advises hurricane ( 11 Warning 11
) approaching with sustained winds up to 120 mph. Alert classification required due to prediction of high winds.
Contaminated injury occurs in the hot machine shop.
Control element assembly ejection. LOCA greater that charging pump capacity; Site Area Emergency declared. Site evacuation initiated. Reactor tripped.
Low lube oil pressure in turbine-driven auxiliary feed pump. Emergency repair team dispatched.
National Hurricane Center, Miami, Florida, advises Hurricane Peter veering to the North, will not strike coast directly. Level of severity reduced to hurricane 11 Watch. 11
Failure of shield building equipment hatch results in initiation of an atmospheric radioactive release.
Federal agencies complete activation procedures; some respond to site and begin to provide offsite support.
Containment pressure reduces sufficiently to permit shield building equipment hatch to reseal. Atmospheric release is terminated.
Briefing for all players to be conducted in anticipation of exercise clock being advanced.
All EOCs are activated.
Exercise clock is advanced 24 Plant is in stable condition. and reentry.
hours. Plume Play resumes
Exercise concluded by lead controller(s).
2.14
is dispersed. for recovery
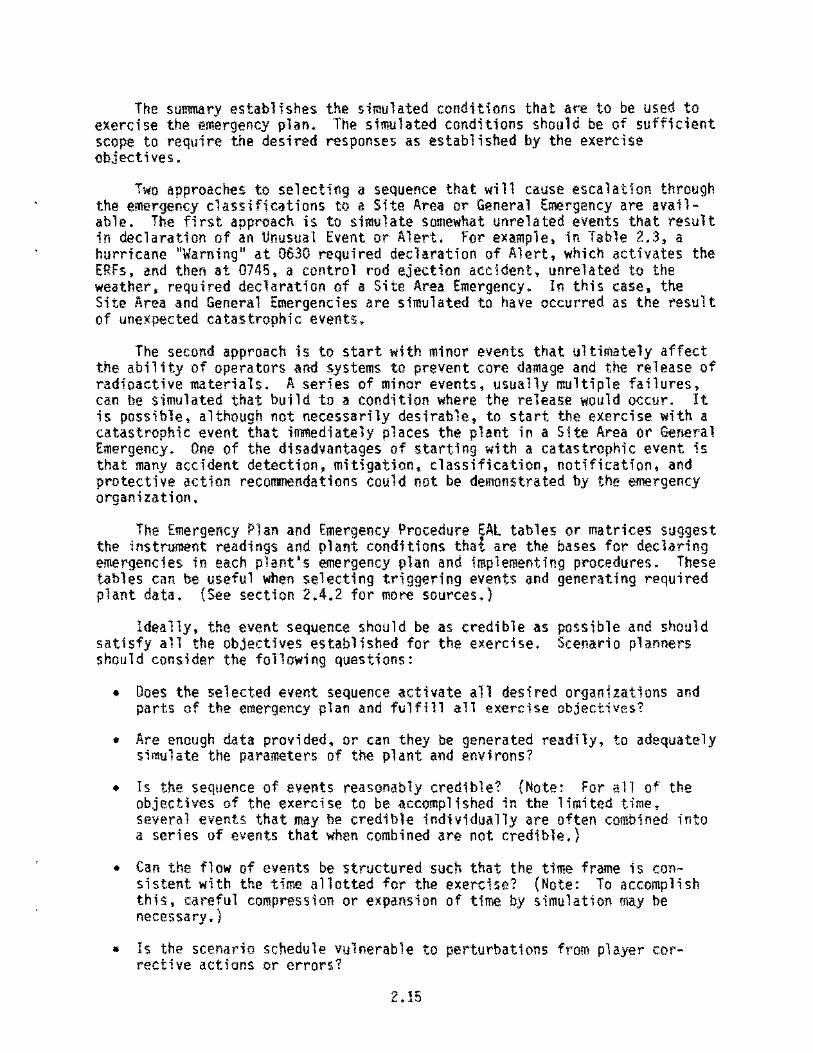
The summary establishes the simulated conditions that are to be used to exercise the emergency plan. The simulated conditions should be of sufficient scope to require the desired responses as established by the exercise objectives.
Two approaches to selecting a sequence that will cause escalation through the emergency classifications to a Site Area or General Emergency are available. The first approach is to simulate somewhat unrelated events that result in declaration of an Unusual Event or Alert. For example, in Table 2.3, a hurricane 11Warning 11 at 0630 required declaration of Alert, which activates the ERFs, and then at 0745, a control rod ejection accident, unrelated to the weather, required declaration of a Site Area Emergency~ In this cases the Site Area and Genera1 Emergencies are simulated to have occurred as the result of unexpected catastrophic events~
The second approach is to start with minor events that ultimately affect the ability of operators and systems to prevent core damage and the release of radioactive materials. A series of minor events, usually multiple failures, can be simulated that build to a condition where the release would occur. It is possible, although not necessarily desirable, to start the exercise with a catastrophic event that immediately places the plant in a Site Area or General Emergency. One of the disadvantages of starting with a catastrophic event is that many accident detection, mitigation, classification, notification, and protective action recommendations cou1d not be demonstrated by the emergency organization.
The Emergency Plan and Emergency Procedure ~Al tables or matrices suggest the instrument readings and plant conditions thai are the bases for declaring emergencies in each plant 1 S emergency plan and implementing procedures. These tables can be useful when selecting triggering events and generating required plant data. (See section 2.4.2 for more sources.)
ideally, the event sequence should be as credible as satisfy all the objectives established for the exercise. should consider the following questions:
possible and should Scenario planners
• Does the selected event sequence activate all desired organizations and parts of the emergency plan and fulfill all exercise objectives?
• Are enough data provided~ or can they be generated readily. to adequately simulate the parameters of the plant and environs?
• Is the sequence of events reasonably credible? (Note: For all of the objectives of the exercise to be accomplished in the limited time~ several events that may be credible individually are often combined into a series of events that when combined are not credible.)
• Can the flow of events be structured such that the time frame is consistent with the time allotted for the exercise? (Note: To accomplish this, careful compression or expansion of time by simulation may be necessary.)
• Is the scenario schedule vulnerable to perturbations from player corrective actions or errors?
2.15

During any exercise, unforeseen problems can develop. The ability to anticipate potential problems can eliminate the need for improvisions by the controllers. Selected experts from each functional area should examine the scenario in great detail for direct and interactive problems that would upset the flow of the exercise. The scenario writers should predict what information, data, personnel, and equipment are needed to make each segment run smoothly and consistently. They should anticipate operator actions and decide if those actions would lead to the desired results. They should also step through the pertinent plant procedures to uncover any potential flaws in the scenario. The writers should try to find potential problems that would hinder, alter, or impair the flow of the scenario and eliminate, where possible, the need for controller intervention.
Operations personnel base their decisions for corrective action on many discrete data describing plant status. If the data is insufficient or inconsistent, it can lead to misinterpretations and improper corrective actions. These problems can be avoided when the scenario planners anticipate and prepare for the potential reactions of the players by providing sufficient and consistent data, and by developing contingency plans or messages. The quantity of data required, their format, and their consistency with plant status and equipment should be reviewed carefully. Several sets of data may be necessary to match potential actions of the players if branching paths of corrective action are available.
The exercise objectives establish the level of participation or play by the various organizations. Once the level of participation is established for offsite organizations, the amount of simulated risk to the public and the severity of the protective action recommendations may be formulated. For a full participation, the utility should determine in their first meetings with the State and local governments, in accordance with their joint objectives, the radiation exposure to the public. The amount of simulated public exposure includes:
• whole-body dose
• dose commitment to child thyroid
• airborne activity in excess of maximum permissible concentrations (MPCs} of particulate fission products and radioiodines
• deposition in the ingestion exposure pathway.
Typically the latter two are not considered in most scenarios. However, if the utility chooses to play out a reentry/recovery scenario, deposition in the ingestion pathway should be considered.
The utility and the offsite participants should agree on the whole-body and thyroid doses and whether or not they should exceed PAGs, and they should decide which sectors of the EPZ are to be affected. The field exposure levels give the scenario writers a starting point from which to develop the scenario, since the exposure levels establish the required source term. Scenario planners can then assume some nominal meteorology and, using plant procedures or dose
2.16

assessment exposure. postulated
computers. compute a release rate that would result in the desired Once a release rate is determined, a sequence of events can be that will cause the desired release (Section 2,4.3),
In most exercisest it is desirable that a release pathway be selected that permits simulated monitoring of the release rate. For unmonitored release pathways, such as a ground~1eve1 release from the auxiliary building, successfu1 participation of the offsite organizations hinges on successful approximations of the source term by the utilities' engineering and technical groups. However, contingency messages may be used to correct problems caused by inadequate performance on the part of the utility staff in determining the source term.
The emergency classification can generally he re1ated to the failure of fission product barriers~ or the anticipated failure of a fission product barrier, based on current plant status. One barrier failure, or anticipated failure, would result in an Alert declaration; two barrier failures~ or anticipated barrier failures, would result in a Site Area Emergency; and three barrier failures would result in a General Emergency. To provide the potential for release of radioactive material, fission product barriers would have to fail in two or more of the following categories:
a. An event that threatens or removes the ability to control the reactivity in the reactor core~ including:
• loss of control rod manipulation resulting in two or more rods stuck out of the core
• uncontrolled injection of cooling water
• loss of borated coolant injection in a pressurized water reactor (PWR)
• collapse of voids in a boiling water reactor (BWR).
b. An event that threatens or removes the ability to continuously remove heat from the core or associated cooling systems, including:
• loss of high-pressure coolant inject,on systems (e.g., HPCit reactor core isolation coo1ing (RCIC}, or safety injection)
• loss of low~pressure coolant injection systems (e.g.~ LPCI, core spray)
• inabi1ity to depressurize the coolant system to allow LPCI
• loss of service water systems {e.g., residual heat removal, component cooling service water or emergency service water}
• loss of auxiliary or emergency feedwater.
c. An event that threatens or degrades the integrity of the fuel and the fuel cla~ding, including:
2.17
• sustained operation outside plant thermal limits
• continuing rod withdrawal problems
• loss of cooling water
• core uncoverage
• improper water chemistry control.
d. An event that threatens to breaches containment integrity, including:
• a physical break or cracK in a containment penetration
• containment overstressing by high temperature and pressure
• failure of a containment isolation circuitry or valve to operate.
e. An event that threatens or breaches the operation, capacity, or integrity of the liquid~ solid, or gaseous radwaste systems, including:
• failure of waste gas holdup tanks or their relief valves
• hydrogen recomblner or offgas piping failures
• inadvertent discharge of untreated or concentrated wastes.
f. An event that results in damage to expended fuel during refueling with the containment open (primary for PWRs, secondary for BWRs), including:
• shipping cask drop over spent fuel pool
• heavy equipment drop over open vessel
• loss of water 1eve1 in fuel pool or vessel.
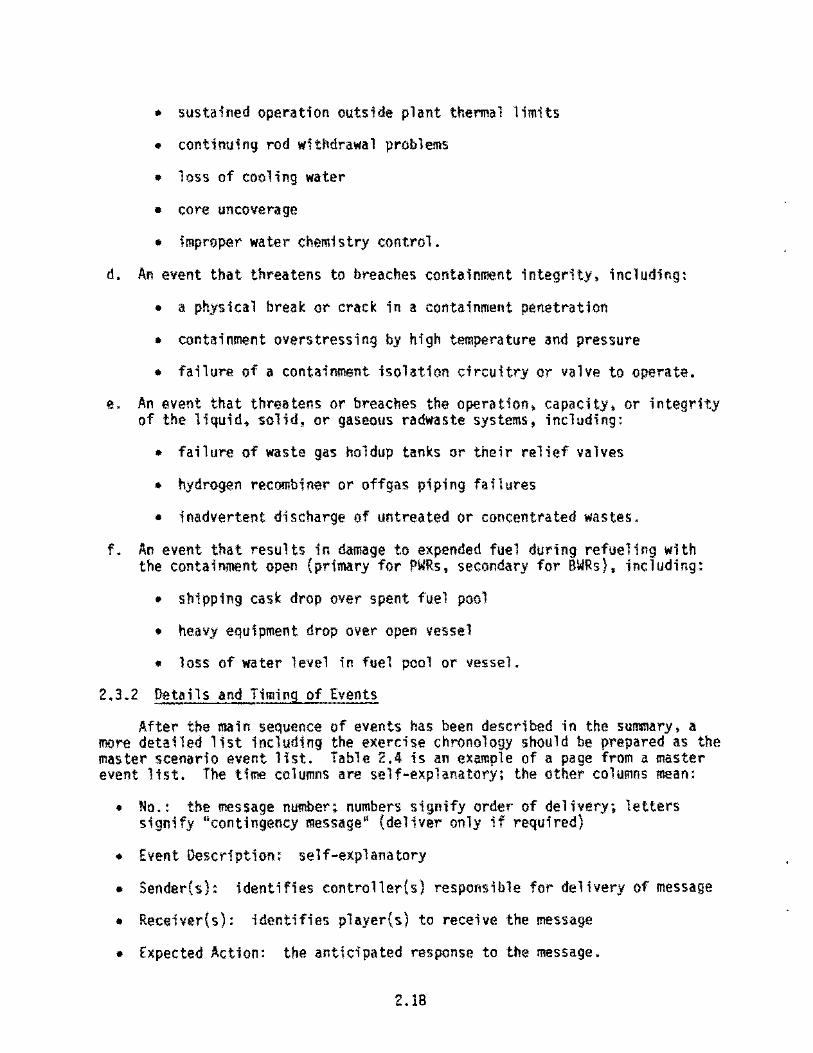
2.3.2 Details and Timing of Events
After the main se~uence of events has been described in the summary, a more detailed list including the exercise chronology should be prepared as the master scenario event list. Table 2.4 is an example of a page from a master event list. The time columns are self-explanatory; the other columns mean:
• No.: the message number; numbers signify order of delivery; letters signify "contingency message" (deliver only if required)
• Event Description: self-explanatory
• Sender(s): identifies controller(s) responsible for delivery of message
• Receiver(s): identifies player(sl to receive the message
• Expected Action: the anticipated response to the message.
2.18

Re-al TiMe Sc:Mari o (EDT) Time (EDT)
Aug 25 Oay 1 06()0 0600
Au9 25 Day 1 0600 to OGOO 0730
Avg 25 Day 1
"' 0617 0617 ~
"' Aug 25 Day 1 0617- 0617-(}745 0745
Aug 25 Oay 1 0625 0625
Aug 25 Day 1 0630 0630
Aug 25 Day 1 0630 0630
TABLE 2.4. Example from Master Scenario Events List
(For Exercise Controllers Only)
No. Event Descrfetioo Sender(s) Reeeiver{s)
1 lflitiel plant conditio~s 'll'ritten C·2 fn Control ""s summary issued, RoOO>
' lnith1 plant eonditfnns plant C·2 in Control NPS parameters sheets issued. R:oom
0505 RCS ~istry sample results C-B in Hot lab CT made available to C~emistry Technician.
Oe 1 ay pcwrer C-2 in Control NPS minutes. """"'
s Continsenc~ Messa~! Order RCS C~2 l n Cot!tf'O l NPS Chemistry ample. Room
• All pl~ot preparations completed c~z in Control RO for hurricaneJ cP!P-34. Room
5 National Hurricane Center in Hi ami) C-3 in Control RO Florfda Issues hurricane 11WARNtNG" Room for stor~ approaching plent sustained winds to 120 mph,
E~pected Action .. aware of plant conditiom~.
CR become aware of plant parameters.
s~mple results sent to NPS. NPS carry~ out procedures of Off-Normal RCS Chemistry. Order another RSC samp1e.
NPS maintains power.
NPS orders RCS eheroi stry $atllple.
H~kt~ report to NPS.
NPS declares AlERT emergency classification. Activates TSC, OSC.

All messages and data forms in the scenario book should be listed in the master event 1ist; the more complete the list, the easier the exercise coordination will be for the controllers.
When analyzing the sequence and timing of events for the master list, the scenario development team should consider:
• the time necessary to develop each scenario activity and involve the appropriate organizations
• the tiwe allotted for players to identify and react to each set of circumstances
• in what parts of the scenario it might be necessary to provide timecompressed simulation to keep the scenario on schedule.
It is seldom possible to gauge precisely the time requirements for each event. Therefore, the lead controller and the controllers should be prepared to make adjustments to the flow of the scenario as the exercise progresses*
During a real accident, the time required for the sequence of events to develop may span hours, dayst or even weeks. During an exercise, there is a limited amount of time (usually less than one day) in which to fully develop the sequence of events that makes up the scenario. Sometimes many activities involving a variety of organizations may need to be compressed into a limited time frame. In these cases, simulation of the action and time acceleration can be used to move the scenario action on to the next event.
The main sequence of events and organizational involvement usually determines the time scale of an exercise. Sufficient time should be allotted for realistic development of events and for the players to identify and respond to the problems presented. In addition, time should be provided to allow offsite agencies participating in the exercise to accomplish their stated objectives. For instance. offsite monitoring teams from other organizations need time to arrive at a scene and demonstrate their capabilities for collecting data. tracking the plume, and analyzing samples. It is important to coordinate with State and local governments to ensure that they can and will respond at the appropriate time. For example, the State and local governments may only be able to respond to an exercise during normal working hours because of overtime funding constraints• therefore~ the scenario time line may have to accommodate such a constraint. Some state and local agencies may not begin their participation unti1 late in the onsite scenario sequence, and they may wish to continue their portion of the exercise after the onsite portion has ended.
Sometimes repairs or corrective actions by the players may stop the sequence of events too early. 1n these cases~ the controllers need to block the player 1 s actions using messages about inoperative equipment, lack of parts! or other plausible excuses, so that the sequence of events can continue.
2.20

When lengthy time expansions or compressions (24 hr or more) are used, controllers should brief players on simulated events that have occurred during the time lapse. A complete script and data shou1d be prepared and given to the players during the briefing.
The key to guiding the progression of the exercise without inhibiting player response lies in the ability of controllers to direct player 1 S actions subtly by controlling the flow of play with carefully planned event timing and by controlling the availability of systems and equipment. Allowing the players just enough time to diagnose and respond to a sltuation before degrading or changing the situation, puts pressure on them to respond to a variety of challenging problems in a relatively short time. Allowing too much time between events gives players time to outguess the scenario instead of reacting to events as they occur. In a carefully planned scenario, systems and equipment that players could use to fix a problem too early can be put out of service or made to fail in a credible way. This may help avoid the frustration that can occur when a player 1 S innovative so1ution is blocked arbitrarily by a controller.
2.3.3 Peripheral Events
Within the scenario. there may be peripheral events, or events that test individual components of the onsite or offsite emergency organizations. Peripheral events can test the utility's response to selected emergencies such as fires, search and rescue missionsJ personnel injuries, breaches of security, or serious contamination prob1ems. They can also test utility and offsite responses to such occurrences as news media pressure, inquirles from politicians~ a contaminated injury requiring an ambulance for transport to a hospital. or citizen distress.
Peripheral event scenarios can be unrelated to the main flow of events or an integral, causative part of the main scenario. For example, a peripheral event involving a fire could simply test the response of the fire brigade, or the fire could affect systems or equipment vital to the safe operation of the plant. Other examples are:
• A fire in the switchyard or transformer yard can both cause offsite power to be lost and test the response of the fite brigade/offsite fire department.
• If a loss-of-coolant accident is to occur, a pipe break outside of containment could be postulated in which a burned and contaminated victim is involved to test first-aid, ambulance, hospital and health physics personnel.
Care should be exercised when using a peripheral event to escalate the emergency classification {and subsequent emergency response facility activation} before the main scenario events) e~g., using weather-related events to achieve Alert classification before a 1oss-of~coolant accident. Going outside the main scenario sequence to cause the classification to escalate can disrupt the players ability to understand and mitigate the accident as well as add an unrealistic element to the scenario.
2.21

The following are examples of peripheral events such as fires, missing persons, and public alarm that can be developed and integrated into the scenario.
A fire potentially affecting a critical plant system can initiate or escalate an exercise. A fire early in an exercise can cause equipment, such as emergency core cooling system(s) components, that would be used to cope with a later emergency to be incapacitated. A fire in an area containing radioactive materials could generate an airborne radioactive release or could affect habitability of vital areas.
If there is a fire in the scenario, the control room may be informed of the fire via an automatic fire alarm in the control room or a report from a player at the scene of the fire (both from controller messages). The con· troller provides only the information that an individual at the scene would obtain; for example, players at the scene of the fire could be given the message that they see smoke at a specific location, but since there would be no means of assessing damage, they should not be given a message about the extent of the damage.
Accountability of all personnel onsite within thirty minutes is a typical exercise objective and is usually included as a part of the exercise scenario. During a test of accountability, the security force should be able to provide a list of the names of individuals who are unaccounted for and some idea of where they might be. A search-and-rescue effort can be triggered by the results of an accountability test or by a witness 1s report to the control room that someone is missing and/or injured. A search-and-rescue can also be initiated by a controller selecting one or more players who subsequently "disappear11 from the exercise. The missing person{s) could be either injured and unable to report to an assembly area, or could be deliberately hiding (saboteurs).
If a personnel injury is part of the scenario. then the search and rescue team should be prepared to administer first aid and transport the 11 Victim11 for medical treatment~ The victim may or may not be conscious or contaminated when the rescue team arrives, and the controller should provide only information that would be readily discernible to the team with the resources available {e.g., contamination levels on the victim could not be provided if the team was not equipped with an appropriate survey meter}. In addition to contamination data, the controller should have available all pertinent medical data that the team could obtain using the equipment and techniques at their dis· posal {e~g,, location and extent of injuries, pulse rate, eye dilation, shock conditiont respiration. bleeding, and blood pressure}. If the victim requires hospitalization, similar data should be provided to the ambulance and hospital staffs.
A useful prop in an exercise is a moulage (marking) kit, which can be used to create the illusion of real injuries on the victim(s). Small, very low-activity, sealed radioactive sources (such as thorium mantels used in gas lanterns) can be concealed about the victim to simulate contamlnation; unsealed radioactive sources should never be used. To determine effectiveness of contamination control, consideration may be given tc placing powder about the victim 1 s injuries that florescence under ultraviolet light.
2.22

Simulations of injuries should be created with the assistance of someone experienced in such simulations. tt would detract from the realism of an exercise if the injuries simulated were not appropriate to the accident. For example) it is un1ike1y that a person splattered by caustic chemicals would receive a compound fracture. The victim(s) should also be briefed before the 11accident 11 as to the appropriate symptoms to display.
Emergency conditions can attract significant news media, political, and public interest. To simulate the circumstances as realistically as possible~ the utility may consider inviting area reporters to the news center for exercise briefings. Utility technical personnel may assist area reporters by asking probing questions that truly challenge the utility's spokesperson. Other news media pressure may be simulated by telephone calls from radio and TV stations simply requesting information or seeking permlssion to conduct a site visit with camera crews. A controller can act the role of a member of the news media or public from prepared message scripts that will accomplish the desired result. Script messages might include:
• time to inject message
• role to be assumed/played
• whom to call, including telephone number (such as utility rumor control center, news center, county emergency operating center (EOC). etc.)
• background information to help controller establish a frame of reference
• method of simulation, script or message
• props or logistical requirements.
If the exercise involves county and state EOCs, then public distress may be simulated by a controller acting out the role of a farmer with animals in the area of the plume seeking information and assistance or by the president of an environmental group seeking information on the effects of radioactivity on marine and wildlife and the government's involvement in their protection.
2.3.4 Reentry!Recovery
Reentry/recovery begins when the emergency coordinator/recovery manager downgrades the emergency classification based on the apparent stabilization of plant conditions with attendant reduction in the radiological impact to the plant and the public. Steps are then initiated to establish a long-term program to ultimately restore the p1ant to operation. Such a downgrade would be made after consultation with the cognizant authorities including the utility and local, State, and Federal governments as applicable.
To begin recovery, controllers may advance the exercise time to simulate the relatively s1ow progression of events before recovery, or they may wish to test the players' decision making process of downgrading the emergency classification by establishing the stabilized plant conditions that would prompt a downgrade. Once the downgrade has been mades the scenario may move directly
2.23

into a data collection phase to permit demonstration of evaluating the emergency events and establishing a recovery plan. Another method of demonstrating recovery that would involve more players is to advance the time to simulate a period during which a slowing of onsite and offsite activity occurs~ to demonstrate collection/correlation of data accumulated during the accident, and to demonstrate formulation of a recovery plan by the players.
If a time lapse method is used, advances of 12-hour increments can minimize confusion about clock time versus scenario time. Advancing the scenario clock 6 hours to 1800 but having the clock still read 1200 is an unnecessary difficulty. A time-advance message should be given to the players that includes:
• plant and radiological conditions when play stopped
• plant and radiological conditions when play resumes
• inplant repair or restoration of equipment occurring during the time lapse
• status of evacuation or relocation of the public
• status of offsite support from the local} State and federal authorities
• public utilities or facilities that have been disrupted.
Scenario writers may plan activities that will test the implementing procedures, including:
• implementing a long-term shift work schedule
• demonstrating coordination among the utility and 1oca1, State, and Federal government agencies to ensure maximum utilization of resources
• establishing financial resources for material and personnel acquisition
• demonstrating logistics support to the plant for materials such as diesel oil, water, nitrogen, etc.
• demonstrating response to increasing media and political pressure.
The following kinds of activities may be implemented by authorities offsite:
• evacuation/relocation activities by state and federal authorities
• characterization of radioactive materials deposited on the ground
• evaluation of pub1ic water and food supplies
• disposition of dairy animals, livestock, and produce crops in the ingestion pathway
2.24

• handling of public distress such as concern for contamination of animals, requests for thyroid blocking tablets, and missing persons information.
Many of these events could be initiated by a controller acting out the part of a concerned citizen or government official. Contingency messages to the recovery manager in the EOF may be required in case the player 1 s response or the procedure is inadequate for this phase of the scenario.
2.4 DATA
Complete, consistent, and appropriate data are mandatory for a successful emergency preparedness exercise. When the master scenario event list is complete and the objectives of all participants are agreed upon, including offsite radiological effects, complete data for the scenario should be prepared.
The data tor exercise scenarios should be realistic and of the correct order of magnitude based on the available reference materials and methods of analysis. Most important, the data should be complete and internally consistent. When considering what data to generate a general guideline is that if a number could be asked for, then it probably will be and it should be available to the controller.
Controllers will use the data and provide them to the players as needed. In many cases, these data will be the only bases for players 1 decisions and actions and therefore should be appropriate to initiate the desired responses. This section includes data needs, sources, generation and sequence, and format.
2.4.1 Data Needs
The scenario development team should identify all of the locations where data will be required. In many cases, the same data are required in several locations. The primary locations where data are needed and the general categories of data for each are:
Control Room
• status of controls for equipment and systems
• indications for all reactor plant system parameters
• indications necessary for the status of critical safety functions
• indications for all auxiliary systems monitored or controlled from the control room that affect the simulated events
• plant radiological status (ARMs, CAMs, process monitors, etc.)
• simulated reports to the control room from inplant operating staff {unless input is to come from an inplant player)
2.25

• meteorological data.
Technical Support Center
• habitability information
• laboratory results
• simulated response by outside support organizations contacted (e.g., vendorsl architect/engineert Nuclear Insurers, etc.).
• infonmation that would be available on installed monitoring systems (SPDS, radiological, meteorological, etc.).
Emergency Operations Facilltx
• habitability information (if applicable)
• simu1ated response by support organizations contacted (e.g., OOE, FEMA, EPA, Institute of Nuclear Power Operations (INPO), etc.)
• simulated ca11s from citizens, federal agencies, news media, politicians, etc.
• script for simulated participants (e.g., a staff member playing the part of a news media person in the information center).
• information that would be available on installed monitoring systems (SPOS, radiological, meteorological systems).
Qperations Sueeort Center
• radiological data affecting teams onsite and in the field
• habitability information
• simulated parts and logistics status.
Dose Assessment
• simulated meteorology parameters
• weather forecasts
• location of release.
Laboratories (chemistry and health phxsics)
• isotopic analysis (coolant. air, filters)
• chemical analysis (boron, pH)
2.26

• survey results
• TLD reader results
• bioassay results.
Inplant and Onsite
• simulated equipment conditions
• survey results (beta, gamma, airborne and surface contamination)
• other hazardous conditions (smoke, steam, toxic chemicals, explosive gas, thermal conditions)
• postaccident sampling (sample contact readings, system status).
Field Teams
• plume boundaries (width, distance, and direction from the release point)
• beta and gamma dose rates from airborne contribution
• beta and gamma dose rates from ground deposition
• airborne concentrations of noble gases, radioiodines, and particulates (raw data for field monitoring instruments)
• concentrations of surface contamination resulting from the deposition of iodines and particulates, in raw data form.
• team personnel exposure data.
News Media Center
• scripts for simulated reporters, telephone call-in inquiries, etc.
Peripheral Event Sites
• personnel injuries and vital signs
• personnel contamination levels
• damage to facilities by fire, nature, or sabotage
• script for personnel simulating others
• adverse weather conditions
• survey results.
2.27

Recovery/Reentry (affected facilities)
• aerial sur~ey results
• complete laboratory analyses of soil~ liquid, and vegetation samples
• dairy and crop sample analyses from local downwind farms
• field n.o readings
• extensive ~urface contamination results
• locations and numbers of personnel sheltered or evacuated
• locations and numbers of personnel at relocation centers
• locations and numbers of farm animals in the affected area
• simulated news media reaction
• information on Federal, State, and local government actions taken or requests for additional assistance from government agencies.
In addition to determining the full range of data that should be developed, the frequency at which data will be updated should be decided. The frequency at which plant data are p~ovided is important. During major transients, such as isolations, scrams, and turbine trips, an almost continuous flow of data from the controllers to the players could be required over a period of 5 or 10 minutes. Between major transients in the scenario, one set of data every 10 to 20 minutes is usually enough.
Once the types of data have been agreed upon. responsibility for data generation can be assigned to selected experts and the coordinated effort to produce the data can begin.
2.4.2 Data Sources
There are many sources for developing scenario data. Emergency planners are often unaware of some of them, since many of these sources are not in day-to-day use at the plants. Some of the possible sources are listed here for four major categories; 1) main sequence of events, 2) inplant system parameters, 3) inplant radiological data, and 4) offsite radiological data. Some sources can be used for more than one category of data but are listed only under the primary-use category.
Main Sequence of Events
• NRC accident studies (e.g., Rasmussen 1980, Haskin 1981, Cook et al. 1981, Darby et al. 1982, Condon et al. 1982, and Erickson 1978)
• data from preliminary and final safety analysis reports (PSARs and FSARs), specifically the accident studies in Chapter 15 (or equivalent) of such reports, which provide a range of accident parameters and conditions
2.28

• results of special ATWS (anticipated transient without scram) studies for the plant, which provide expected plant parameters and system-related data.
Following the accident at Three Mile Island (TMI), most utilities formed safety review committees or task forces to reevaluate a variety of plant safety issues, including plant transients. Studies of plant transients that utilities considered either credible or incredible could yield a wealth of information for use in generating data for an exercise scenario. Other potential sources of information include NUREG/CR-0578 (NRC 1979b), NUREG/CR-0585 (NRC 1979a), NUREG/CR-0660 (NRC 1g8Qc), and other NRC required studies: NRC Action Plan; Post-Accident Accessibility and Shieldin~ Requirements Review; and Identification of Gaseous and Li~uid Systems Outsi e Containment Which May Contain High Levels of Radioactive aterials Following an Accident.
Task analyses are currently in progress at nearly every nuclear power plant in the United States. Task analysis usually involves the development of 8 to 12 accident sequences, each having 3 to 6 possible internal branching points that are based on success or failure to operate safety equipment or satisfy critical safety functions. These task analysis efforts can be found at each plant by contactin9 personnel involved in response to NUREG-0737, Supplement 1, initiatives (SPDS installation, Detailed Control Room Design Review, Symptomatic EOP Development, Emergency Response Facility Construction and Outfitting, and Regulatory Guide 1.97 Instrumentation)(NRC 1980d). There may be one set of task analyses that is being applied to all of the above programs {as recommended by NRC) or there may be several different versions from which to extract possible exercise accident sequences. One of the very useful aspects of task analysis work is that it contains lists and references to the complete set of data that an operator requires in order to monitor and mitigate each accident sequence.
As a result of the accident at TMI, several severe accident sequence analysis {SASA) studies have been performed. These documents are usually distributed to all licensees operating a plant similar to the ones studied {e.g., a study on station blackout at Zion would be distributed to all Westinghouse PWR owners). All of these studies evaluate in detail the response of reactor plant and emergency core cooling systems {ECCSs) to specific accident sequences. Some have a second volume evaluating the inplant radiological consequences of the sequences. These SASA studies probably do not receive wide distribution within a plant, but can be located or ordered with a little effort. Examples of these studies are NUREG/CR-1988, NUREG/CR-1989, NUREG/CR-2182, and NUREG/CR-2825. These documents are available from:
GPO Sales Program Division of Technical Information and Document Control U.S. Nuclear Regulatory Commission Washington, D.C. 20555
The probabilistic risk analysis {PRA) studies performed by most utilities, like the SASA studies, are a potential source of accident sequences and detailed data. A number of recent exercises have been run using the PRA
2.29

report data almost directly. These exercises had the benefit of containing the most probable plant system failures and the detailed data developed through extensive study and calculations by the utility PRA group.
Since the accident at TMJ and the resulting changes to 10 CFR 50, all plants have conducted several formal exercises. One of the easier methods of obtaining a scenario for training and annual exercises is to trade scenarios with other utilities. Another source of past exercise scenarios is the Institute of Nuclear Power Operations (!NPO).
Ioplant System Parameters
• special computer codes (both inhouse and vendor}, such as RETRAN, RELAP, and IRT, which provide expected plant parameters and system-related data
• reports of special studies performed by a particular vendor, owner group, committee, or task force) which provide a range of accident para~eters and resulting conditions that might be expected
• SASA and PRA studies described in the previous section
• studies performed in response to NUR£G-0578 (NRC 1979b).
A si~ulator that plant is probably the tor plant parameters.
provides identical or almost identical modeling of a most useful tool available for generating data for reac
Some of the more useful features of simulators are:
• slow and fast time modes (to ease the task of making multiple data recording runs)
• hard copy of plant parameters available from the simulator computers
• stop action feature of most simulators, which allows scenario data for each data sheet time interval to be recorded
• studies performed and documented during the construction of the simulator to model the various accidents for which it is capable of simulating.
The drawbacks of using a simulator to develop scenario data are:
• Simulators do not model the uncovered or degraded core situation •
• Simulators in general do not model or display ARM readings, offsite power systems, all ventilation systems, and many other support systems •
• Most simulators have modeled a set number of scenario combinations. If the scenario's sequence of events for the exercise is beyond the capaM bilities of the simulator, then it will be of limited benefit in data development.
2.30

Inplant Radiological Data
• plant data generated in support of ALARA reviews
• reactor vendor documents, for use in simulating source term data based on scenario fuel failure modes (e.g., General Electric Nuclear Engineering Documents)
• special shielding studies for normal, special, and postaccident con~ ditions, which provide expected radiation levels and airborne concentrations inplant (NUREG-0578, Appendix A, 2.1.6.b, NRC 1979b)
• SASA studies, which have companion volumes for the radiological consequences, are valuable sources of data for both exact and similar sequences
• the Appendix of this handbook, which has simple formulas for calculating inplant radiological data.
Offsite Radiological Data
• source term, expected concentrations, and dose assessment data from documents listed above
• documentation from special modeling of site~specific emergency dose assessment used to develop computer or manual computational methods for dose assessment
• possible sources for other dose assessment models are INPO, other utilities, and public domain software such as !ROAM (NUREG/CR-3012, NRC 1983b)
• listings of some public domain software can be found in NUREG/CR-3011 (NRC 1983a) listed above and Radiological Assessment: A Textbook on Environmental Dose Analysis NUREG/CR-3332 (NRC 1983d)
• the Appendix of this handbook, which has simple formulas for calculating offsite radiological data
• MESOI Version 2,0: An Interactive Mo e it eposition an
Meteorological Data
• FSAR historical meteorological data
• trending information stored by some plant meteorological systems
• NWS or commercial weather service.
2.31
ersion

2,4.3 Sequence and Method of Data Generation
Generating data for a scenario is a major task requiring the involvement of many selected experts. As with any complex undertaking, the key to success lies in planning, leadership, and management support. The process of detailed data generation is iterative, as each calculation may affect several others. Therefore. the scenario development team should work together to coordinate the data. When the master scenario event list is complete and the desired offsite radiological effect is agreed upon by all participants, the following sequence is recommended for generating scenario data:
I. Choose the data formats for I) messages to players and 2) detailed data sheets (e.g., reactor plant parameter updates, chemistry sample isotopic analysis results) (see Section 2.<.4)
2. Transfer the basic information from the master events list to the controller instruction forms and to the player messages.
3. Coordinate the details ~~ong ~he event descriptions and the message forms; this will be an 1terat1ve process between the master event list and the data forms.
4. Develop detailed plant data for the data sheets that will accompany many of the controller messages. Most data from sources such as those 1isted earlier should be modified for the specific scenario. References such as the SASA and PRA studies contain mostly composite data. These data should be converted into plant specific system parameters {e.g~, if the total coolant flow is given in the reference, then this should be converted to individual loop flows, pump running status, etc.). Often specified plant details are generated by manual engineering calculations from some set of major plant parameters. The calculations necessary to achieve a credible scenario require ooly a basic knowledge of mass balance calculations. saturated steam tables, effects of decay heat rates on steam generator and reactor coolant inventories. and flow rates through valves and holes at various pressures. When performing these calculations, one should not be overly concerned that calculations do not precisely match those of a sophisticated computer program; most computer simulations do not match closely actual transients. The important requirement of data is that they be consistent. For example, 10,000 gpm is being drawn from a tank~ then the tank level shou1d be decreasing at 10,000 gpm or~ lf water is added to the reactor coolant system at 10,000 gpm with a simulated leakage rate of 5,000 gpm, then the coolant system inventory as indicated by 1eve1 instrumentation should be increasing at approximate1y 5,000 gpm. The data that should be developed at this stage include:
• all reactor coolant system temperatures, pressures, levels, and flows
• all tank levels (condensate storage tank, reactor water storage tank, boric acid tanks. etc.}
• ventilation system flow rates
2.32

• feed, condensate, turbine, and condenser parameters (if applicable)
• ECCS system pressures and flow rates
• sump and collecting tank levels
• containment temperatures and pressures.
5. Develop the inplant radiological data. Simple approximation formulas in the Appendix can be used for calculating inplant (adiological data. The operations and health physics personnel should work together on inplant radiological data development as TSC technical personnel work with the dose assessment group during an exercise or accident. The inplant radiological data should be consistent with the source term and plant systems status during the progression of the accident sequence. The information developed during this step should include:
6.
• gross coolant activity
• gross containment airborne activity
• release rate from containment in units of curies per second
• mixing of the released material with air from other areas of the plant and the filtration of the material as it flows to its environmental release point
• area and process radiological monitor readings
• stack monitor readings.
Generate the inplant chemistry and radiological sample results, portable instrument readings and detai ed equipment status. Much of this data is actually an outgrowth of the data developed in Item 5 and includes:
• contamination levels in each affected area of the plant
• portable survey instrument readings for areas in the plant where players will likely traverse
• isotopic data for simulated reactor coolant samples, ventilation system samples, containment atmosphere samples, containment sump water samples
• hydrogen sample results from containment atmosphere
• reactor coolant boron levels before and after safety injection or standby liquid control injection
• temperatures in containment and other plant areas
2.33

• detailed script for conditions encountered by inplant troubleshooters, such as simulated appearance of the insides of burned cabinets, local instrument rack readings, descriptions of failed equipment components, water on floors. and smoke and steam in cubicles.
7. Oevelo onsite data can has been culating include:
These
• source term data~ in curies released per second for noble gases, radioiodines, and particulates
• release height and pathway
• meteorological data
• iodine and particulate count rates for air sampling
• beta and gamma (open window and closed window) survey data for plume monitoring
• dose rate and contamination data for environmental monitoring.
The Appendix contains some discussion of points to be considered when generating the above data and some simple calcu1ationa1 techniques.
8. Generate data for peripheral events. Some inp1ant data may need to be coordinated with the peripheral event data. For example~ if a contaminated injury victim is to be simulated, the contamination levels developed 1n Items 5 and 6 above should be checked to ensure consistency.
9. If appropriate. enerate data for reentr recover activities. Section 2.4.1 contains a isting of possible, ata needs; actual needs will be determined by the specific exercise objectives and extent of p1ay. The Appendix contains a discussion of points to consider when generating reentry/recovery data and some simple calculational information for generating radiological information~
10. After the final technical review {see Section 2.5), correct errors, and add data and needed details in the messages and controller instructions. Extreme care should be taken when revising data included in the first draft. Almost every datum is related to a previous assumption or calculation. Changing any one parameter almost always has a ripple effect on several other parameters. and if care is not taken data inconsistencies can be introduced.
A detailed description of data yeneration methods is beyond the scope of this repott, and since there ls considerable expetience in the industry,
2.34

emphasis has been placed on the logical process of scenario development with attention to the omissions and inadequacies of currently used scenarios.
2.4.4. Data Format
The data sheets should be designed for the needs of their users. Controllers need data that allow them to easily look both backward and forward in time over the entire course of the scenario. The controller will always have access to the individual data sets for the players, but they should also have the same data in other formats such as time versus parameter plots, time versus parameter tables, isopleth plots and survey maps. All of these should be easy to read and use even in less than ideal conditions.
For offsite data, the most common data formats are tables, maps, and graphs. Tabular formats are most appropriate for data that is to be provided at fixed locations such as preselected monitoring points and mobile laboratories and for reentry/recovery data. Graphs and maps are most useful for data that may require interpolation due to variance in time or location. The data format should be easy to read and interpret and should require a minimum of manipulation by the controller. If the controller is required to apply correction factors or to manipulate the data, then the methods should be clearly explained and all correction factors provided. In general it is best to design the data to minimize the need for controller interpolation or manipulation. All maps should be legible and detailed enough for the controller to accurately locate the team position at all times. Maps should be of a size convenient for use inside a crowded moving vehicle. Regardless of the format chosen, data should be provided in units appropriate for the instrumentation and should be available at 15-30 minute intervals based on the intended scenario time line.
Players need a data format that is as close as possible to their normal operating data format. This implies that data should be presented in snapshot format for all cases where automatic trending is not available. Data s-hould also be presented in raw form as opposed to refined form. For example, if the installed letdown monitor reads in cpm then cpm should be provided as data rather than a refined value of ~Ci/cc, which is only available to operators after applying a conversion factor or formula. For plants with a safety parameter display system (SPDS) installed in the control room and data acquisition systems (OASs) installed in the emergency response facilities (ERFs), the controllers will be obligated to provide historical trending data and other more refined data to the players in these facilities.
The two basic types 2) detailed data sheets. this section.
of data forms are 1) messages to players and Each of these will be described in further detail in
1. Player messages: These messages describe to the player the simulated conditions beyond what can be expressed by numerical data sheets. Controller instructions direct the controllers when to pass out these player messages. The types of information that should be described in player messages include:
2.35

• the contents of incoming telephone calls that are not actually made by a controller (actual phone calls are better)
• completion of simulated actions ordered by the player that have not actually been carried out by other players. e.g., results of simulated lab analyses~ results of simulated inspections
• contin9ency messages that direct a player to perform an action or response that is overdue
• detailed descriptions of simulated equipment damage (this information should also be verbalized by the controller)
• detailed listings of complex sets of indications that would be easily observable to the player in the normal operating environment (e.g., a list of annunciators in alarmed condition).
2~ Detailed data sheets: This area encompasses a wide variety of data that are required by both controllers and players. As mentioned at the beginning of this section, the data needs of controllers and players are different; the controllers need to see the entire data set while players need a snapshot of the data. The set of detailed data sheets necessary is divided into controller and player sections below:
Data For Controllers
• graphs of individual reactor plant parameters versus time, e.g •• water levels vs time, pressure vs time, temperature vs time
• isopleths of plume passage in the EPZ
• deposition plots in the EPZ {for scenarios containing particulate or iodine in the release)
• time versus parameter graphs for radio1ogical parameters such as containment radiation 1evel, offgas monitor readings, stack monitor readings, and offsite and out-of-plant survey instrument readings
• tabless maps, or graphs of inplant and offsite radiation zones
• survey sheets marked with radiological simulation data
• conversion factors for survey instruments liKely to be used by players (inc1udin~ factors such as open versus closed window readings in the plume).
• A special case of controller data is the detailed script required for a controller to simulate a person or situation. Examples include controllers playing politicians, media personnel~ irate citizens, terrorists and injury victims. An experienced person may be able to play act any of these simulated individuals with a minimum of script~ but the detailed script is as much for the other controllers as it is for the controller playing the part. Script for
2.36
these personnel simulations should include all technical data and the necessary guidance for simulated location, attitude, desired response by players and props required.
Note: Sufficient information should be provided to allow the experienced controller to modify or create new data as necessary during the exercise.
Data for Players
• plant parameter sets at appropriate intervals {every minute during rapid transient, every 10 to 20 minutes at other times)
• ARM and PRM panel readings
• reactor coolant chemistry sample results
• containment atmosphere, ventilation system and other air sample analysis results
• source term, exposure rate, dose rate, and environmental data (for offsite field monitoring team players).
A thorough check should be made of the current state-of-the-art of control room and ERF instrumentation and communications systems to ensure that the data format reflects newly installed data acquisition and display equipment. This is particularly important if the facility is in the midst of implementing Regulatory Guide 1.97 (NRC 1980e).
2.5 FINAL TECHNICAL REVIEW
A final technical review should be accomplished just before the final draft of the scenario is sent to FEMA and NRC. Ongoing technical review is necessary during the course of scenario development, and so the techniques presented in this section are really applicable before the final draft. This section is presented as a checklist for the final review of the scenario. It focuses on the categories of scenario problems that NRC reviewers look for in their review.
2.5.1 Overview
• Was the main sequence of events selected from a reliable source? For example the FSAR, SASA studies, and probabilistic risk assessment studies.
• Has the addition of peripheral or main sequence events modified the original sequence to the extent that it is too complex or incredible?
• Is the onsite accident severity compatible with the desired offsite consequences?
2.37

• Were last minute changes made to the sequence or timing of events without correcting the affected data tables and graphs? For example the time for steam generator dryout may have been shifted a few minutes, but the loop temperature data were not corrected to reflect the loss of delta T.
2.5.2. lnplant Data and Systems Status
• Is there continuity in the source term from the core to the release point? Check for relationship between core damage, coolant activity, leaK rates, containment activity, filter efficiency, ventilation system lineup, and all radiological monitoring instrument readings.
• Are plausible reasons provided for equipment failures? Most scenarios require multiple equipment failures that are at the outer bounds of credibility, but care should be taken to provide at least a short explanation of each single failure.
• Are there possible corrective actions, bypasses and alternative modes of operation for major component failures? An experienced operator should assist in this portion of the review. Usually controller instructions need to be added on how to prevent rapid corrective actions by operators. Example: A motor-operated valve failed by loss of power to the motor is easily corrected by operating the valve manually. Scenario review may bring to light the need to mechanically fail the valve or preclude access to the valve through simulated high temperature or radiation in the area~
• Are any pieces of equipment simulated to be operable when an earlier loss of power would have made the equipment inoperable? This error occurs frequently for instrumentation and less frequently for larger equipment such as pump motors and vent fans.
• Are data present for operating equi'pment long after operators would have manually tutned it off? The most frequent example of this is reactor coolant pumps left running after operators would have tripped them by procedure on loss of plant pressure.
• Are any pumps running with no related flow in the system or is flow shown in systems where no pumps are running? This same check should be applied to ventilation systems as well as fluid systems.
• Are there traps in the scenario that may cause an operator to restart a pump or vent fan and initiate a second release path for which there is no scenario data? This happens most frequently in the case of multiple failures of RHR system trains when flow is reestablished to a previously failed heat exchanger or discharge piping.
• Are all saturation temperatures and pressures reasonably accurate with respect to each other? The reviewer should spot-check scenario data in several places using a set of steam tables. Mismatches occur most frequently when the scenario time line is modified after original data development.
2.38

• Are tank and vessel levels increased and decreased properly for the simulated suction and discharge rates? Simple mass balance checks should be run on all tanks, vessels, and sumps.
• Is the core damage simulated consistent with the conditions of vessel water level, core thermocouple readings and reactivity transients? The most frequent problem occurs when massive core melts are simulated with no reactivity transient, no core uncovery and no high core temperatures. If this problem is discovered, it is an indication of poor initial planning and is usually not correctable with simple modifications.
• Are vessel conditions consistent with the simulated accident? Major areas to be evaluated are natural circulation flow, decay of temperatures and pressures, and level of the reactor coolant system late in a scenario with the continued existence of a major break in the system.
• Are inplant radiation levels consistent with the simulated accident and system response? The exposure rate contributions from containment atmosphere, fluids in piping systems, releases through ventilation system ducts and airborne contamination in each area should be summed to arrive at the total dose rates. The most frequent errors are contact readings on ventilation ducts of a few millirem/hour when the release to the environment through that ducting is resulting in several rem/hr at 2 or 3 miles offsite.
• Are airborne contamination levels properly computed? The contributions of ECCS system pump and valve leakage, normal or elevated containment leakage and ventilation system mixing should be considered. The most frequent problem is failure to simulate high airborne activity in areas where major piping failures have been simulated.
• Are indications (data) provided for newly installed systems? This becomes a problem when scenarios are developed offsite by corporate personnel or consultants who are working with outdated drawings and reference material. Typical indications overlooked are newly installed radiological monitoring systems, vessel level instrumentation, subcooling margin monitors and SPDS displays.
2.5.3 Onsite But Out-of-Plant Radiological Data
• Do radiation maps for field controllers include data for the area surrounding the plant out to the site boundary? The most frequent problem is in simulation of very high radiation levels beyond the site boundary with rather low onsite dose rates or no onsite data at all. A review of the emergency procedure for onsite monitoring may help identify all necessary data.
• Are contributions to area radiation levels due to contained radiation sources considered? The contributions to area radiation levels due to contained sources in containment, ventilation systems or piping systems are frequently overlooked,
2.39

2.5.4. Release Pathways
• Is the simulated release pathway feasible? Check the postulated release path against general arrange~ent drawings and piping and instrument drawings.
• Have the effects of ventilation system m1x1ng and filtration been accounted for? A frequent problem is failure to thoroughly research the physical path that radioactive materials should follow to reach the plant stack.
• Can the simulated release path be easily blocked by operator action? Look closely at drawings to determine if there are any remote1y or manually operated bac~up valves or ventilation dampers in the release path. r.:;sable them in a reasor.able fashion, if necessary.
• Does the intended pathway for the release result in the severe airborne contamination of buildings or cubicles~ andf if so, have appropriate data been generated for these areas? For example, if the release is the result of a pipe break in the auxiliary building and the pathway is out through the auxiliary building ventilation system, then airborne activity levels in the auxiliary building should be correspondingly high.
• Does the scenario create the situation where activity levels increase as the radioactive material flows from the containment to the top of the stack? This is one of the most frequent errors found in scenarios. This problem is typically the result of separation of responsibility among writers during the development process. For example, one writer developed source term data from the core to the auxiliary building ventilation plenum while a second writer developed the data from the desired field dose rates back to the ventilation plenum; invariably a discontinuity results.
2.5.5 Offsite Radiological Data
• Are the offsite radiological data consistent with exercise objectives for monitoring noble gases iodines and/or particulates?
• Was the rr~ans of computing offsite doses for the scenario data consistent with but not identical to that normally used at the plant? It is not realistic to have field data match dose projections precisely. This can occur if the data are generated using the exact source term and meteorology provided in the scenario.
• Are the offsite radiological data comprehensive and easily used by field controllers? Ensure that data include whole-body and thytoid dose rates, airborne iodine concentrations, and comprehensive plume data as a function of time and location. If the scenario release involves iodine and particulates, then ground deposition dose rates and contamination levels, as well as gross airborne concentration data, will be needed. The rr~st frequent problem is failure to provide both open- and closed-window survey instrument readings for determination of whether the plume is at
2.40

ground level or not. Another frequent problem is refined data instead of observable instrument readings. For example, provision of data in units of ~Ci/cc instead of cpm on a filter. The scenario data sheets should provide instrument conversion factors for use by controllers in deve,oping on-the-spot data. Only the raw data as read on the meter should be provided to the player.
• If the scenario is to last more than one day or include an extensive recovery/reentry phase, then it should contain extensive data on contaminated milk, food, water supplies, and ground deposition.
2.5.6 Perieheral Events
• Have all peripheral events been incorporated at the proper times in the master scenario events list? This is particularly important for peripheral events that are designed to prompt activation of players in preparation for response to the more important portions of the exercise and for events upon which the main sequence of the scenario depends.
• Have appropriate data been generated for each peripheral event? For instance, often omitted from injury events are the victim 1 5 pulse rate, breathing rate, skin color, and other readily apparent physical features used by first-aid personnel to assess a victim's condition.
2.5.7 Conflict of Scenario with Established Procedures
• Do early events in the scenario (before plant trip), such as equipment failures, place the plant in a situation where the operators would begin an immediate shutdown? The most frequent problem is simulation of multiple equipment failures that place the plant in an imrr£diate shutdown limiting condition for operation (LCO) per plant technical specification before the major event in the scenario begins.
• Do simulated operator actions conflict with established emergency operating procedures (EOPs)? The scenario may require simulated operator errors, but controllers should be made aware of points in the scenario that deviate from normal operator responses to the accident. Scenario developers should be particularly aware of the changes taking place as operations personnel implement new symptom-oriented EOPs. Many operator responses are different under these procedures than they were under the old event-oriented EOPs.
• Oo expected classification escalation points and related contingency messages agree with the current revision of the emergency plan implementing procedures (EPIPs) on accident classification? This type of error usually occurs when the scenario authors fail to look at all EALs related to the simulated accident conditions. In most of these errors, the scenario writers are 1ate in predicting when the operators or TSC personnel will escalate to the next higher classification. The most frequently rr.isunderstood EAL (by scenario writers) appears to be the case of ''loss of 2 out of 3 fission product barriers with a severe cha11enge or
2,41

predicted rapid failure of the third, 11 This misunderstanding often results in the players making an emergency classification that is unexpected by the controllers.
• Does the scenario require the operators to go against their principles? An example of this is requiring the operators to maintain the plant at high power due to demands by the load dispatcher when they would otherwise reduce power or trip the plant, If at all possible the scenario should not require the operators to violate common sense.
2.42

3.0 PREEXERCISE INSTRUCTIONS
Before an exercise, controllers, players, and evaluators should receive instructions concerning their roles and responsibilities. Meetings with controllers and evaluators should address prompting, plant and personnel safety, and interactions with players. Controllers should also discuss controlling simulation, issuing messages, and handling unexpected actions. Players should be instructed on responsibility, safety measures, and ground rules for simulated actions. Evaluators should be advised on their responsibilities, interactions with players, and evaluation criteria.
3.1 CONTROLLERS' INSTRUCTIONS
In this section of the scenario, controller assignments and drill phone numbers should be given. The names of all controllers and the methods of communication during the exercise should be identified.
As the primary link between the scenario and the players, controllers need to exercise caution in their interaction with the players. Controllers should not allow players to take any actions that would adversely affect the safety of the plant. During the exercise, controllers should not prompt, coach, criticize, or correct players, or supply advance data or information that would reveal future conditions. Methods for handling unexpected player actions should be preplanned; these may include contingency messages, alternative data sets, and instructions for contacting a lead controller for guidance. Controller training should include instruction on the proper implementation of these methods. When actions are to be simulated, controllers should ensure that players talk through and explain the actions that they would have taken, so that an evaluation can be made of their knowledge level.
Adequately trained controllers are the key to a successful exercise. Controllers should receive preexercise training and instructions so that they are thoroughly familiar with the scenario, expected player actions, and their duties and responsibilities. As part of the training process, a preexercise briefing for controllers should be held. This briefing should cover the following areas of responsibility and concern:
• exercise safety
• review of the main events and the sequence of the scenario
• area assignments
• review of the scenario data - familiarization with message and data format - delivery of data to the players
interpolation of data
• simulation ground rules
3.1

• interactions with players and evaluators
• communications for controllers
• methods for handling unexpected player actions
• critique responsibility.
Controllers should provide data to the players on the same basis that data would normally be available during an actual event. Data that players would normally be monitoring or that would spontaneously draw their attention should be provided without a specific request; for example~ reactor control board indication, alarms and annunciators, and unusual noises, smoke~ and smells.
Data that players must take some action to obtain should not be provided until they perform the action.
under real conditions Examples are:
• auxiliary systems where status indications are provided on back panels
• equipment condition that can be ascertained only by going to the equipment or its local instrument panel
• information that requires a communication from someone at a remote location.
Results that must be derived by refining or analyzing raw data should be derived by the players from data supplied in the raw form with the proper units for the equipment from which the data was obtained. Examples include:
• calculation of the percentage of core damage using several data
• conversion of cpm on a survey meter into ~Ci/cc or mrem
• laboratory analysis of coolant or air samples.
If a time compression occurs in which the scenario is advanced a number of hours or days, data describing the events and actions that would have taken place during the elapsed time should be provided to the players.
3.2 PLAYERS' INSTRUCTIONS
Instructions for players can either be inc1uded in a set of general guidelines for everyone or in a separate section specifically for players. Instructions should include cautions to the players not to take any action that would endanger themselves, private property, or the operation of the plant. Players should be trained to react to the scenario events as if they were responding to an actual emergency and not try to outguess the scenario planners and begin corrective actions before events occur. Players should not dwell on the highly improbable nature of some of the scenario events. Each situation should be taken at face value and responded to appropriately. Finally~ players should actually perform all actions except when instructed before or duting the exercise by the controller to simulate the actions. All actions that are to be
3.2

simulated should be discussed by the players with the evaluators and controllers. The players should demonstrate their knowledge of the proper actions by discussing the scenario circumstances, the pertinent procedures, and the actions they would take if the accident were real. Within a week or two after the exercise, the players should be given instructive feedback concerning their performance, with information and plans for correcting identified weaknesses.
3.3 EVALUATORS' INSTRUCTIONS
Evaluators should be instructed on how to conduct and keep records of comments and observations during the exercise. Many of the instructions for the controllers also apply to the evaluators, and the instructions for the two roles are often combined. Evaluators should act and be treated as if they were invisible during an exercise. If possible, they should not have direct interaction with the players. If an evaluator has a question or wishes to have something clarified, the evaluator should approach the controller. If the controller cannot answer the question, the controller then should question the player. Only if a controller is not present and the information is vital to the evaluation should the evaluator directly approach a player. Instructions should be given cautioning evaluators about the types of questions that can be asked; inappropriate questions can serve to prompt the players concerning expected actions or upcoming events. Evaluators should be warned concerning the prompting of players. Evaluators should be familiar with the scenario events so that they can position themselves to observe the resulting action. They should also be familiar with the emergency plan, appropriate emergency procedures and the exercise objectives, as these will affect their evaluation of the response to the scenario. These guidelines should be followed by NRC evaluators as well as utility personnel.
An important additional responsibility for all evaluators is to function with controllers as safety monitors for an exercise. The evaluators lack of scenario-related responsibility and their mobility during the exercise give them a detachment from specific events. This detachment can help them identify potential safety risks that might be missed by others.
Evaluators should be knowledgeable and experienced in the activity that they evaluate. Each evaluator should be given a list of objectives and expected actions that should be observed and commented on. Establishing a standard set of evaluation criteria for all evaluators to use provides a common base for all observations and will make it easier for the evaluation team to coordinate comments. The evaluation criteria should allow the evaluator to grade the performance of players by a qualitative rating system, as well as by answering specific questions. General guidelines on what to watch for, records to be kept, and comments should be included in the evaluation criteria. It is not necessary to provide a comprehensive list for the evaluator. The evaluator should have enough expertise to judge actions taken and overall performance.
3.3


4,0 POSTEXERCISE ACTIVITIES
Evaluators~ controllers, and key players should critique the exercise as soon as practical after it has ended. When possible each ERF, including the control room, should hold an individual critique immediately following the exercise. This will allow all people involved in the exercise to comment on performance and suggest possible improvements. Controllers, evaluators, and the management level players should then have a joint critique. Even though the NRC observers will not present their findings at this time, they should attend. The NRC is often not aware of minor items that were identified and corrected immediately by the utility and therefore not mentioned in the formal critique.
Both the individual ERF critiques and the joint critique should address the players 1 performance in handling the events of the scenario and whether the exercise met the established objectives. Outstanding performances should be recognized, but the critiques should primarily focus on identifying deficiencies and developing followup plans to correct identified weaknesses.
Critiques should serve as a feedback mechanism to identify and correct faults discovered during the exercise. The discussions held by key players, controllers, and evaluators during the critique are often the only opportunity for integrating all comments and developing an accurate overall picture of performance during an exercise. The written logs and comments of each evaluator and the written comments of each controller will provide valuable information for later evaluation. However, each individual is capable of viewing only a small portion of an entire exercise and, in some cases, views only a small portion of a particular task. The critique serves to clear up misconceptions that may result from limited individual viewpoints, and it helps participants put all of the comments in perspective.
Critiques are required by 10 CFR 50, Appendix E (1982), and are usually attended by NRC, and sometimes FEMA, evaluators as part of the exercise process. During the critique, the utility is evaluated on:
• general conduct and format • ability to self-evaluate exercise performance and identify deficiencies • ability to analyze deficiencies and plan workable solutions.
The number of deficiencies identified by the licensee is not necessarily indicative of the quality or success of the exercise; consideration is given to the thoroughness of the self-evaluation and the ability to generate corrective actions resulting in improved emergency response. In addition to the critique involving primarily licensee personnel, a critique involving utility management and NRC, FEMA, and/or state and local organizations should be held. The details of the NRC critique are arranged between the utility representative and the NRC observation team leader.
Soon after the critques take place, the following information should be provided in writing to the organization responsible for compiling the final report on the exercise: 1) findings from the various critiques, 2) the
4.1

written comments offered by players~ evaluators, and controllers. and 3) inf~rmation received during debriefing with support agencies (e.g., ambulance~ fire department).
The final report should be produced within a reasonable time fo11ow;ng the exercise and should include the following information:
• the main elements of the emergency plan that were involved in the exercise
• the conditions under which the exercise was undertaken or simulated {i.e.~ winter, summer, night hours, meteorological conditions, etc.}
• the key players, their positions, and their organization
• positive aspects of performance
• recommendations for corrective action
• a schedule for implementation of corrective action.
Deficiencies should be identified as either specifics such as a problem with a postaccident sampling procedure, or generic, such as a problem in the overall training program. A followup plan and timetable for correcting deficiencies should be developed. The problems with the most serious impact on emergency preparedness should be addressed first. In some cases it can be useful to schedule a sma11~sca1e drill in a particular area to ensure that a problem is resolved.
4.2

REFERENCES
Condon, w. A., R. M. Herrington, s. R. Greene and S. A. Hodge. 1982. SBLOCA Outside Containment at Brown's Ferr Unit One: Accident Se uence Anal sis.
l - 67 , o . i ge, ennessee.
Cook, 0. H., et al. !981. Station Blackout at Browns ferr Unit One-Accident Sequence Analysis. G . . uc ear Regu ator~ Commission 1 Washington, U.C.
Darby, J. L., et al. 1982. Anal sis of H othetlcal Severe Accidents for the Zion Pressur ze ater eactor. Nuclear Regulatory Commission, Washington, D.~.
Erickson, 0. M., Jr. 1978. Exercise Scenarios. SAND Albuquerque, New Mexico.
Gifford, F. A., Jr. 1968. "An Outline of Theories of Diffusion in the Lower Layers of the Atmosphere." In Meteorology and Atomic Energy 1968, D. H. Slade, ed., pp. 65-116. TID-24196, available from National Technical Information Service~ Springf;eld, Virginia.
Haskin. F. L Inititiated eactor.
0. c.
1981. Aoalfisis of a Hypothetical Core Meltdown Accident b Loss" of ffslte ~ower for the Z1on l Pressurize([ Water
Hilsmeier, W. F., and F. A. Gifford, Jr. 1961. Graph for Estimating Atmospheric Dispersion. OR0-545, U.S. Atomic Energy Commissiony Washington, D.C.
Scherpelz, R. E., F. J. Borst and G. R. Hoenes. 1980. WRAITH - A Computer Code for Calcu1atin Internal and External Doses Resultin tmoseheric e ease of a 1oact ve ater1a . P -
Pacif1c Northwest laboratory, Richland, Washington.
Slade, D. H., ed. 1968. Meteorolofy and Atomic Energy 1968. TI0-24!90, available from National Technica Information Service, Springfield, Virginia.
U.S. Code of Federal Regulations (CfR). 1982. Title 10, Part 50, "Licensing of Production and Utilization Facilities,'' Appendix£, "Emergency Plans for Production and Utilization faci11ties. 11
U.S. ~uclear Regulatory Commission (NRC). 1976. Combining Model Responses and Spatial Components in Seismic Response Analysis. Regulatory Guide 1.92, Washington, D.C.
R. 1

U.S. Nuclear Regulatory Commission (NRC). 1977. Methods for Estimating Atmos heric Trans art and Dis ersion of Gaseous Effluents in Routine Releases rom 19 t-Water- oo e eactors. Regu atory ui e 1.11 , Rev. 1, Washington, D.C.
U.S. Nuclear Regulatory Commission (NRC). 1979a. TMI-2 Lessons Learned Task Force: Final Report. NUREG/CR-0585, Washington,
u.s. Nuclear Regulatory Commission (NRC). 1980a. and Evaluation of Radiolo ical Emer enc Res onse Sutport o uc ear ower ants. N - 6 b. .
U.S. Nuclear Regulatory Commission (NRC). 1980b. Meteorological Programs in Supaort of Nuclear Power Plants. Proposed revision to Regulatory Gui e 1.23, Washington, D.C.
U.S. Nuclear Regulatory Commission (NRC). 1g80c. NRC Action Plan Developed as a Result of the TMI-2 Accident. NUREG/CR-0660, Volumes I and 2, available from National Technical Information Service, Springfield, Virginia.
U.S. Nuclear Regulatory Commission (NRC). 1980d. Clarification of TMI Action Plan Requirements, NUREG-0737, Washington, D.C.
U.S. Nuclear Regulatory Commission (NRC). 1980e. Instrumentation for Li ht-Water-Cooled Nuclear Power Plants to Assess Plant and Environs ~o~n~1~· t;,:i~o;:,ns:-'llu:Cr;.-i n"'g'-'a"'n~-'o'-'-'-"'ow,_i!!n!>g'--"'"-'"'-"=e'-'n'-'t. egu a tory ui e Washington, D.C.
U.S. Nuclear Regulatory Commission (NRC). 1981. Emergency Action Levels for Light Water Reactors. NUREG-0818, Washington, D.C.
U.S. Nuclear Regulatory Commission (NRC). 1983b. Interactive Rapid Dose Assessment Model (!ROAM). NUREG/CR-3012, Washington, D.C.
and
U.S. Nuclear Regulatory Commission (NRC). 1983d. Radiological Assessment: A Textbook on Environmental Dose Analysis. NUREG/CR-3332, Washington, D.C.
Vallario, E. J. 1974. Evaluation of Radiation Emergencies and Accidents. Technical Reports Series No. 152, International Atomic Energy Agency (IAEA), Vienna.
R.2

APPENDIX
CONSIDERATIONS AND CALCULATIONAL METHODS
FOR GENERATING RADIOLOGICAL DATA

I. INPLANT RADIOLOGICAL DATA
DOSE RATE CALCULATIONS Point Sources Line Sources . Immersion Dose Rates Shielding •
SOURCE TERM DATA • • • Fission Product Inventories . . Effective or Representative Half-lives . • • Containment Radiation Levels and Percent Core Damage Estimation of Release Rates . . ~ ~ Estimating Radioactive Material Content
PERIPHERAL EVENTS
II. ONS!TE AND OFFSITE RADIOLOGICAL DATA
RELEASE PATHWAY • •
METEOROLOGICAL DATA
CALCULATION OF RADIONUCLIOE CONCENTRATIONS Gaussian Diffusion Equation . . Simple Offsite Dose Calculation Method Dry Deposition Calculations Wet Deposition Calculations
ENVIRONMENTAL DATA • . . Calculation of Exposure Rate Conversion to Meter Readings Reentry/Recovery Information
•
•
A.l
•
•
•
A.2
A.3 A,3 A.4 A.4 A.5
A.6 A,9
A.ll A.ll A.l3 A.l5
A.l5
A.l5
A.17
• A.l8
A.l9 A.20 A,30 A,32 A,43
A,44 A,45 A,49 A.54

This appendix is organized into two sections, Inplant Radiological Information and Onsite and Offsite Radiological Information. The lnplant Radiological Information section deals with considerations and calculational techniQues for preparing lnplant dose rate data, source term data, and radiological data for peripheral events. The Onsite and Offsite Radiological Information Section deals with re1ease pathway, radionuclide concentrations and environmental sampling data,
The rough calculational aids in this appendix can be used together with plant-specific data and the scenario sequence to generate adequate inplant, site area, and offsite radio1ogica1 data. For the chosen scenario, the radiological results to be simulated are often variable; the scenario planner has the option of simulating a wide variety of release pathways of radioactive material from the reactor core or other areas of high concentration {e~g., radwaste tanks) into various inplant, onsite or offsite locations.
I. lNPLANT RADIOLOGICAL DATA
Examples of the variables in the plant that affect the release and dispersion of radioactive material are:
• fuel damage, extent and type
• coolant activity
• reactor coolant system integrity and leakage rates
• reactor coolant flow rates outside containment
• containment integrity and leakage rates
• charcoal filter bed efficiencies and breakthrough
• ventilation system configuration, lineup, flow rates and integrity
• door seal efficiencies between buildings
• migration or diffusion rates up stairwells
• volumes of highly radioactive coolant or resin in various piping systems and tanks
• pump seal leakage rates
• deposition. plateout, absorption of various nuclides during various means of transport.
Computer analyses of postaccident radiation levels and airborne activity in a plant typically use a suming process for the various contributing
A.2

factors. If computer studies fitting the desired scenario are not available, a similar manual calculation can be performed using the simplified methods and approximations or i nterpo 1 at ion of data from more rigorous methods. Rough dose rate calculations for areas of the plant and the surrounding area involve su11111ing the major contributors to dose rate for the simulated plant conditions.
The following major contributors should be considered:
• dose rate from airborne radioactive material in the area
• dose rate from fluids in piping systems in the area (e.g., pipes and tanks)
• dose rate from major ga11111a sources outside the immediate area
• dose rate from contamination on floors and walls.
DOSE RATE CALCULATIONS
The following four sections discuss the calculation of dose rates from point sources, line sources, immersion in a radioactive cloud and dose reduction due to shielding.
1. Point Sources
A simple rule of thumb for approximating dose rate from a point gamma source is:
D ( 1 m) = Ci (1)
where
D (1m) =dose rate at 1m in R/hr Ci = number of curies of gamma source.
This equation, often referred to as the 11 Curie-meter11 rule, is accurate for 2.2 MeV gammas and valid within a factor of 2 for 0.7 MeV to 6 MeV ga11111as.
A more accurate statement of this rule of thumb considers the energy of the point gamma source:
D = 6 CiE/d2 (2)
where
D = dose rate in R/hr at distance d Ci = number of curies of the gamma source
A.3

E = total energy of emitted gamma rays in MeV d = distance in feet.
For the approximate dose rate from a point source when other dose rate information is available, use the simple inverse square law:
(3)
where 0
0 = dose rate d =distance (ensure that the same units are used for d1 and d2).
2. Line Sources
For line sources such as pipes and fuel assemblies, the formulas for a point source are fairly accurate at distances greater than half the major dimension of the line source away (i.e., inverse square law). For distances closer than one-half the major dimension, an almost directly increasing dose rate ratio applies until very near the source.
If L (length) is the major dimension of a line source, >1/2 L the line source may be treated as a point source,
and at distances <1/2 L,
where 0
D = dose rate d = distance.
3. Immersion Dose Rates
then at distances
(4)
(5)
The following equations should provide approximate values for gamma dose rates in clouds of radioactive gases and particulates:
For Infinite Clouds:
D = 2 o 106 (t) (X) (6)
Ao4

where . D = gamma dose rate (mR/hr) t = average gamma energy per disintegration (MeV/dis) 3 X= concentration of isotopes in the cloud (vCi/cc or Ci/m ).
For Semi-Infinite Clouds:
0 = 106 (t) (X) (7)
When r has not been calculated, a less conservative estimation based on a representative mixture of postaccident fission products can be made using the following rough factors for airborne concentrations of radioactivity:
lo-s vCi/cc " 0,5 mR/hr 10-4 vCi/cc = 5 mR/hr 10-3 vCi/cc _ 50 mR/hr.
Approximate values for ( describing a semi-infinite cloud of noble gas in a downwind plume are presented below (where E has not been determined by counting an in situ sample):
4. Shielding
Hours Since Reactor Scram
0 - 12 12 - 24 48+
t (MeV/dis)
0.40 0.20 0.10
The ability of shielding material to reduce the gamma flux of a specific-energy level emitter is usually expressed in half-value or tenth-value thickness, Formulas for determining dose rate reduction are:
where
TIT Half Thickness: o2 = 01 (1/2) 112
TIT Tenth Thickness: o2 = o1 (1/10) 1110
D = dose rate T = actual shield thickness
(T 112) =half thicknesses of shield material (T1110l • tenth thicknesses of shield material.
A.5
(8)
(9)

The figures below are approximate half-value and tenth-value thicknesses for some common power plant materials. The values are adequate for scenario data generation. They are appropriate for gamma energies of 2 to 4 MeV~ which are conservative for lower-energy fission and activation products:
1/2 1/10
Half- and Tenth-'/alue Thicknesses Rater Concrete Lead
8 24 to 26
3 to 4 10 to 18
0.6 2
(in inches) Iron
1.2 4
Note: Tenth thickness is about 3.32 times the half thickness for a particular material.
SOURCE TERM DATA
Source term data should include information that would normally be displayed to the plant operators. For example, process monitor readings and containment high-range radiation monitor readings would be available. Another potential source of infonnation for the p1ant operators is the postaccident sampling system. If an exercise objective is to demonstrate this system or if the operators are likely to ask for these samples, then the appropriate data shoutd be prepared. These data can include reactor coolant analysis data and containment atmosphere analysis data dependiog on the capabi1 ities of the particular sampling system at the plant. The scenario developer should have an understanding of the time tequired to obtain and analyze these samples in order to include a realistic time delay between a request for the sample and analyses results. A11 source term data should correspond to the accident scenario source term used for estimating i np 1 ant radio 1 ogi ca 1 consequences (e.g., area monitor readings and data for plant survey teams).
Examples of data related to the source term are contained in Tables A.l and A.2. Table A.! is an example of data that would be available to control room personnel at a plant equipped with an extensive radiation monitoring system presented on the standard form used during emergencies. During an exercise, this sheet could be handed directly to the players to simulate plant parameter readings according to the scenario. Table A.2 is an example of primary coolant system chemistry results presented in the same format as the plant 1 S postaccident sampling system computer results. During an exercise, this information would be given, after an appropriate time delay, to the player operating the system to simulate the results of a primary coolant sample analysis.
The following sections discuss considerations, information and calcula .. tional techniques for determining fission product inventories~ fission product half-lives, containment radiation levels and percentage of core damage, estimation of release rates, estimation of radioactive material content in some common containers used during postaccident sampling.
A.6

TABLE A.!. Radiation Monitoring System Data
Unit No. I Date Time 4:00 am
Data Taken by G. W. Bethke
I. VRS-1101 1.44£0 mR/HR 2. VRS-1202 3,89£-1 mR/HR 3. ERS-1301 3.72£-2 "Ci 4. ERS-1303 5.30£-3 "Ci 5. ERS-1305 2.32£-5 uCi/cc 6. ERS-1307 2.97£-4 uCi/cc 7. ERS-1309 1.59£0 uCi/cc 8. ERS-1401 2.40-2 uCi 9. ERS-1403 5.91£-3 "Ci
10. ERS-1405 1.59£-3 ;~Ci/cc 11. ERS-1407 1.44£-4 uCi/cc 12. ERS-1409 1.34£-2 "Ci/cc 13. VRS-1501 1.7£-4/1.62£-3 uCi 14. VRS-1502 1.7£-4/9.68£-4 "Ci 15. VRS-1505 6.19£-8/1.03£-6 "Ci/cc 16. VRS-1507 6.92£-5/8.29£-5 uCi/cc 17. VRS-1509 8.73£-1/2.14£0 uCi/cc 18. MRA-1601 4.16£0 uCi/cc 19. VRS-1602 5.99£-2 uCi/cc 20. MRA-1701 1.44£-2 "Ci/cc 21. MRA-1702 1.99£-0 "Ci/cc 22. SRA-1805 1,27£-6 uCi/cc 23. SRA-1807 2.74£-4 uCi/cc 24. SRA-1905 1.39£-6 uCi/cc 25. SRA-1907 3.91£-5 "Ci/cc 26. VRS-1310 1.02£0/2.62£0 R/hr 27. VRA-1410 9,68E-1/1.17EO R/hr 28, SFR-1810 4.52E2/4.1E2 CFM 29. SFR-1910 2.63E1/2.15E1 CFM 30. VFR-1510 8.33E4/6.2E4 CFM 31. Wind Speed 5 MPH 32. Wind Direction 235° (fROM) 33. Air Temp. •T -0.72'C
Data Reviewed by G. F. Martin
Upper Containment Area Upper Containment Area Lower Containment Airborne Particulate Lower Containment Airborne Iodine Lower Containment Airborne Noble Gas (LR) Lower Containment Airborne Noble Gas (MR) Lower Containment Airborne Noble Gas {HR) Lower Containment Airborne Particulate Lower Containment Airborne Iodine Lower Containment Airborne Noble Gas (LR) Lower Containment Airborne Noble Gas (MR) Lower Containment Airborne Noble Gas (HR) Unit Vent Effluent Particulate Unit Vent Effluent Iodine Unit Vent Effluent Noble Gas (LR) Unit Vent Effluent Noble Gas (MR) Unit Vent Effluent Noble Gas (HR) Steam Generator PORV loop 1 Steam Generator PORV Loop 4 Steam Generator PORV loop 2 Steam Generator PORV Loop 3 Gland Steam leakoff Noble Gas (LR) Gland Steam leakoff Noble Gas (MR) Steam Jet Air Ejector Noble Gas (LR) Steam Jet Air Ejector Noble Gas (MR) Containment High Range Area Containment High Range Area Gland Steam Leakoff Flow Steam Jet Air Ejector Flow Unit Vent Effluent Flow
A. 7

TABLE A.2. Primary Coolant System Chemistry Data
Sample Time 1230 Sample Item Simulated Results
Sample amount Sample container survey Aliquot size Dilution Volume reduction
Spectrum Analysis:
Nuclide Identification System Summary of Nuclide Activity
Total Lines in Spectrum Lines Not Listed in Library Identified in Summary Report
~vation.Product Report
NUCLIDE SBHR HLIFE
CR-5! AP 27.700 C0-58 AP 70.300 MN-54 AP 312.500 ZN-65 AP 243.900 CD-60 AP 5.27V NA-24 AP 15.00H MN-56 AP 2.58H
Halogen Fission Product Repo~t
~UCLIOE SBHR HLIFE
1-133 HFP 20,80H l-135 HFP 6.61H l-131 HFP 8,040 1-132 HFP 2.30H CS-137 HFP 30.00Y CS-134 HFP 2.06Y
49 18 23
soo mL 5 R/hr at l m
100 mL 50 mL 50 mL
46.94%
DECAY pCi(UNIT
1.006 2.982E -0 1.002 1.459£ -1 1.001 5,625E -2 1.001 4.640£ -3 1.000 4.518E -1 1.324 5 .022E -3 5.111 3.211E -0
OECAY "Ci/UNIT
1.224 2.370£ +3 1.890 5.292£ +2 1.022 2,920E +3 6.234 7 .911E +1 1.005 7.500E +0 1.164 3. 750E +0
A.B
l SIGMA ERROR
3.253E -4 5.786£ -5 5.520E -5 1.235E -4 6. 285E -5 8. 965R -5 3,280E -4
l SIGMA ERROR
6.289£ -5 3. 727E -4 3.763E -5 3.808E -4 1.309E -4 J.841E -3
% ERR
10.91 39.67 9.81
26.62 13.91 17.85 10.22
% ERR -3.96 9.96
33.47 13.64 3.31 4,09

1. Fission Product Inventories
Source term estimates are usually based on the total available fission products in a representative light water reactor near the end of core 1 ife following continuous high-power operation.
Table A.3 below presents the approximate total activity in a core for the times listed. Note that the table is in units of curies per MW thermal (i.e., for a 3000 MWt core, multiply the numbers below by 3000).
TABLE A.3. Approximate Total Activity in a Core following Shutdown
Immediately following Shutdown
Gases Halogens Solids
3. 5E5 3.8E5 3.5E6
Ci/MWt Ci /MWt Ci/MWt
24 hr After Shutdown
Gases Halogens Solids
7.0E4 9.0E4 7 .3E5
Ci/MWt Ci/MWt Ci /MWt
3 Days After Shutdown
Gases Halogens Solids
4.5E4 5.0E4 6.5E5
Ci/MWt Ci/MWt Ci/MWt
5 Days After Shutdown
Gases Halogens Sol ids
3.5E4 3.5E4 5.8E5
Ci/MWt Ci/MWt Ci/MWt
10 Oays After Shutdown
Gases Halogens Solids
2.0E4 1.8E4 S.OES
Ci/MWt Ci/MWt Ci/MWt
30 Oays After Shutdown
Gases Halogens Solids
l. 7E3 Ci /MWt 2.4E3 Ci/MWt 4.2E5 Ci/MWt
A.9

Example
To obtain the total number of curies in an expended fuel assembly 30 days after shutdown, multiply each of the numbers above by the core megawatt thermal rating and divide this quotient by the total number of fuel assemblies to obtain an order-of-magnitude value.
Therefore, for a 3000 MWt reactor with 1000 fuel assemblies, the total number of curies in an expended fuel assembly is as follows:
Gases (1.7E3 Ci/MWt) (3000 MWt)/1000 = 5.1E3 Ci Halogens (2.4£3 Ci/MWt) (3000 MWt)/1000 = 7.2E3 Ci
Solids (4.ZE5 Ci/MWt) (3000 MWt)/1000 = 1.3£6 Ci
Total number of curies in an extended fuel assembly = 1.3£6 Ci
Table A.4 shows the typical radioactive inventories of LWRs broken down into reactor locations.
TABLE A.4. Typical Radioactivity Inventories of LWRs for Approximately 1000 MWe (3200 MWTH)
Total ln~ento~l {Curies} fraction of Core lnv~ntorf Location Fuel tap Total Fuel Cap To al
Core(.;:) 8.0 X 10⁹ 1.4 X 10⁶ 6,1 X 10⁹ 9,6 X 10~t 1.6x10~2 j
Spent fuel Storage Pool (Max.)(b) 1.3 X 10⁹ 1.3 X 10⁷ 1.3 X 10⁹ 1,6 x tQ
_, i.b X 1((3 i.6x10~i
Spent Fuei Storage Pool (Avg.)(c) 3.6 X 10⁹ ).8 X 106 3,6 X 10⁸ 1<.5 X 10-2 r. .a x 10 -· "·5 )( 10~2
Shipping Ca$k(d) 2.2 X 10⁷ 3.1 !I( 106 2.2 X 10⁷ 2.7 X 10⁻³ 3.8 x iO~S 2.7 X 10~3
Refueling{e) 2.2 X 10⁷ 2 )( 1~ 2.2 X 10⁷ 2,1 X 10⁻³ 2.5 X 10-S 2.7 )I; 10-'3
Waste Cas Stor~ge 9.3 )I; 10-4 1.2 X 10~$ Tank
Uqufd 'f!aste $.5 X 101 1.2xiO~B Stor.a:ge Tank
{ai Core inventory ba$ed on activity 1.2 1'\our after shutdown, (b) Inventory of 2/l eore loading; l/3 core wlth three day decay and 1/l core with 150 day
decay. {c) Inventory of 1/2 core loading~ 1/6 core with 150 day decay 11nd 113 core wfth 60 day
decay. !d} Inventory !;laud on 7 P'f!R or 17 BWR fuel euembties with 150 day decay. {e) Inventory for one fue' assembly with three day decay,
A.10

2. Effective or Representative Half-Lives
The extremely complex mixture of isotopes in a reactor core decays with an equally complex number of individual half~ lives. Table A.5 presents representative half-lives during the early stages of an accident again assuming the worst case, a nearly expended core with long preceding high-power history.
TABLE A.5. Representative Half-lives During Early Stages of an Accident
Half-Lives for First 24 to 48 hrs After Shutdown
Gases Halogens Solids Mean (A11)
10.6 hr 11.8 hr 10.8 hr 10.9 hr
Half-lives for First 2 to 30 Oays Following Shutdown
Gases Halogens So 1i ds
130 hr 133 hr 36 days
The values are approximations that may prove useful in either developing a scenario or verifying values from a more rigorous approach for an orderof-magnitude accuracy. The licensee's reactor vendor and nuclear/reactor engineering and chemistry departments should be able to provide useful data on plant-specific source terms and on ranges for percent release of gap and fuel pellet fission product inventory for postulated accidents.
3, Containment Radiation Levels and Percent Core Damage
Table A.6 presents approximate radiation levels inside the containment of a large (1000 MWe) LWR following an accident initiated with 100% fission product inventory at equilibrium.
A.ll

TABLE A.6. Typical Exposure Rates Within Containment Following Severe Core Accidents
Event
100% Core Me 1 t
10% Core Melt
1% Core Melt
Gap Inventory Release
LOCA (With No Gap Release)
Maximum Exposure Rate in Containment Immediately
Following Accident
4 X JO' R/hr
6 X !05 R/hr
3 x 10s R/hr
1 x 10⁵ R/hr
4.0 R/hr
Note: The lowest predictions for this type of accident at any plant are approximately 25% the numbers listed, This assumes a plant size below 500 to 700 MWe rating and relatively large containments.
Estimation of Amroximate Containment Activity Concentration: During the first few days a ter an accident~ the following formulas should provide a rough order-of-magnitude estimate of containment conditions:
rem/hr (in containment) • (40) x (gross activity in "Ci/cc) (10)
Table A.? presents approximations for estimating core damage from ioplant indicators.
TASLE A. 7. Approximations for Es·timating Core Damage
In~lant Indicators Containment
Core Conditions Fuel Temperature Radiation Level (R/hr)
1) Core Intact - 600'F 0.01 - 102 Large Coolant Leak Probably <50
2) Clad Failure 1300'F - 2000'F 103 - 104
(Rupture/Oxidation) (20% of Fuel Pins)
3) TM~ Like >2400'F for 10 min 105 (Grain Boundary Release)
4) Core Me 1t >4500'F J06
A .12

in Core/Fuel Pool/Plant S stems: Under worst-case con tons 1.e., a recent e ue 1ng or re ue ng the entire contents of an spent fuel pool at a facility should contain about an order of magnitude (E-1) less total flssion products than the amount contained in the core at power. On the average, the rest of the plant systems (e.g., ECCS, Radwaste, BOP for BWRs) should contain at least two orders of magnitude (E-2) less total activity than that contained in the core at power. Many of these radioactive deposits in the rest of the plant systems are radioactive crud rather than fission products. For accidents involving a loss of cooling to fuel pools (not loss of water inventory), a minimum of 9 days and an average of 26 days would be required for pool boiloff to the point of uncovering the expended fuel.
Onset of fuel Pellet Melt: A containment radiation monitor reading of over 1000 rem/hr is a clear indication that something more than a gap release Is in progress (i.e.~ at least some core damage is occurring in addition to a gap release),
ld~itt~~~~~{t~~\JlriJ~~~\f'\~~:re The following data describe the ~ melt are projected to occur:
• Cladding rupture should occur between about 760 and 1200'C (1400 and 2200"F).
• Core melt should occur at about 2280'C (4136"F). A molten core would be in the range of 2000 to 3000'C (3632 to 5448'F).
4, Estimation of Release Rates
The release rates {source terms) can be obtained from:
( 11)
where
Qi = Release rate activity of radionuclide, i (Ci/sec)
c1 = Activity concentration of radionuclide, i in the effluent (Ci/m3)
V =flow rate of the effluent (m3/sec).
EXAMPLE
The containment purge flow rate is 6.4E3 ft 3/min (3m3/sec.). The corresponding activity concentrations of noble gas, 1311, gross iodine, and particulate are 200 Ci/m'. 0.19 Ci/m'. 0.43 Ci/m3 , and 0,04 Ci/m'. respectively.
A.l3

The release rate of noble gases is:
Ci m3 200 --3 X 3 --- " m sec 600 Ci/sec
The release rate of !llj is:
3 02 • 0.19 .q.3
m m __ • 60 Ci/sec sec
The release rate of gross iodine is:
Ci 0.43 3 X m
The release rate of particulates is:
Ci 04=0.043
m
1.3 Ci/sec
0.12 Ci/sec
Containment Leak Rates: The following values are usually good estimates for leakage under near noMma1 pressures:
• BWR drywall and PWR ice condenser containments: 0.5%/day
• PWR large dry containments: 0.1%/day
• All plant ECCS systems (operating): 1.0 gpm outside containment.
Note: Containment leakage percents are the percentage of containment volume.
Effect of Containment leakage Versus Failure: For postulated accidents involving fuel damage, the collective dose to the general population in the EPZ is increased significantly for the case of containment failure and the expected penetration leakage at elevated pressures versus normal containment leakage at normal pressures. Integrated doses in the downwind sectors for a containment failure scenario are a factor of 2000 to 3000 higher than for a similar fuel damage accident where containment integrity is essentially preserved and only increased leakage occurs. This estimation is not affected by the population density or meteorology in the downwind sectors because it estimates a factor increase that effects all inhabitants equally and is expressed in terms of a total person-rem ratio.
A.14

5. Estimating Radioactive Material Content
The conversion factors presented below provide an approximate (~ 50% to 200%) estimate of the radioactive material content in some common containers of radioactive liquid. These conversion factors can be useful for developing data for postaccident sampling stations and laboratories.
Method
• Measurement; Contact gamma dose rate 0 in mR/hr. • Activity A of the sample (oCi/mL):
Container Formula . .
100 ml Plastic Bottle (Full) 5E-3 D s A ~ l.SE-2 0 . . 250 ml Plastic Bottle (Full) 6E-3 D s A s !E-2 D . 1/2 in. Diameter Plastic Tubing 3E-2 D > A > 1E-2 0
PERIPHERAL EVENTS
Exercise seen a ri os frequent1 y include per1 ph era 1 events designed to eva 1 uate emergency response teams. Pel"'i phera 1 events that may require the generation of radiological data include breach of security, medical emergency, and fire. The types of data that may be needed includes area dose rates, air monitoring resu1 ts ~ surface contamination measurements, personnel contamination readings, and personnel exposures~
A typical example of a peripheral event is an inplant search and rescue of an injured and contaminated victim. As the players conduct the search for the victim, the controller can use inplant radiation zone maps to provide the exposure rates observed by the rescue team as the players traverse the areas being searched. If the victim were working on a high-pressure, high-temperature, contaminated fluid system that fractured, then the victim could suffer contaminated burns.
Assuming the gross activity of the fluid were 1 uCi/gm, typical of precladding failure in older plants, the contamination on the victim could be calculated as follows. Necessary assumptions are that a total of 10 gal of fluid was sprayed on the victim before the leak was isolated, that 10% of the activity remains distributed evenly over 2 ft 2 on the victim! and that 10% of activity remains airborne in a 10 x 10 x 10 ft room:
Count rate on victim:
(10 gal) (3.8E3 gm/gal) (10%/2 ft 2 } (1 "Ci/gm) (lE - 3 ft 2/cm 2 ) • 1.9 "Ci/cm2
A.15

assuming a Frisker using a pancake probe with a 10$ counting efficiency and a surface area of 15 em:
(1.9 •Ci/cm2 ) (15 cm2 ) (2.2 £6 dpm/vCi) (10%) • 6£6 cpm
Airborne activity:
(10 gal) (3,8 gm/gal) (10%/1,000 ftl) (1 vCi/gm) (3.5£-5 ft 3/cc) = 1.4£ - 4 vCi/cc
A diagram of the victim 1S injuries and contamination should be prepared for a controller illustrating the extent and nature of the injuries and the contamination levels consistent with the emergency response team's instrumentation. Similar data should be available for a whole-body count in the event of inhalation or ingestion of radioactive material. Tools and other equipment in the vicinity of a victim could be described as contaminated to the same approximate levels as the victim considering relative proximity.
A.!6

II. ONSITE AND OFFSITE RADIOLOGICAL DATA
Equations and examples in this section are intended to provide simple methods for developing onsite and offsite radiological data for scenarios.
During an exercise, the utility must provide estimated values for radiological information according to the scenario events. These values should approximate the offsite radiological concentrations and dose rates that would result if a radioactive plume had actually been released. In an actual emergency. these values would depend on 1) the characteristics and amounts of radioactive material released, 2} the release path, 3) the meteorological conditions present during the release, 4) the duration of the release. 5) the type of reactor core and its associated power history, and 6) the type of fuel failure involved (e.g., cladding perforation with gap release, fuel melt, or elevated temperatures resulting in zirconium-water reaction). Some example data are provided to illustrate several methods used to estimate and display offsite radiological information during the exercise. The methods and models used to generate source terms, radiation exposure rates, and environmental data are based on those developed and documented in NRC's reactor safety study (Rasmussen 1980).
Although the sequence of accident events and the relative magnitude of releases of radionucl ides to the atmosphere can vary at BWRs and PWRs, the methods and models used for analyzing the environmental consequences are similar for the two types of plants. This is true because the total amount of radioactivity available for release from the reactor core is about the same for BWRs and PWRs of simi1ar power densities given similar fue1 exposure histories (Rasmussen 1980). Therefore, no further distinction shall be made between PWR and BWR accidents in describing the methods and models used for estimating and displaying onsite and offsite radio1ogica1 consequences.
To estimate onsite and offsite radiological data. a scenario developer should have access to:
• source term data to approximate the quantity and radionuc1ide composition of radioactive materials that are likely to be released to the atmosphere as determined by the scenario. These data should include the activity release rateJ in units of curies per second, for noble gases, radioiodines, and particulates.
• release pathway information to determine the potential for filtration of the source material and the effective height of the release according to the sequence of events in the scenario.
• meteorological data to determine the transportation and dispersion of radioactive materials downwind. These data should include the wind direction, wind speed, and atmospheric stability.
• calculational methods. formulas. nomographs and/or tables or suitable computer models to determine downwind radionudide concentrations and radiation dose rates from the source term, release pathway~ and meteorological information.
A.ll

In the sections to follow, considerations, information and calculational techniques for determining re1ease pathway. meteorological data, radiological concentrations and environmental sampling data will be presented. The equations and examples in this section are intended to provide simple methods for developing onsite and offsite radiological data for scenarios.
RELEASE PATHWAY
The release pathway and resulting release height will have a direct effect on the offsite data. The release pathway can affect the release rate and radioactive material release composition (gaseous only, gases plus particulates}. The effective release height can affect the effective plume rise, plume touchdown point~ and release concentration. For example~ an accidental release from a stac~ at a nuclear power plant would probably result in a discharge whose ambient temperature is higher than the temperature of the surrounding air. Because the heat content of the release affects the plume buoyancy and plume momentum, it could increase s i gnif i cantl y the effective release height. Thfs would result in lower downwind radionuc1ide concentrations due to additional dilution of the release by the atmosphere.
METEOROLOGICAL DAoA
The key meteorological data required for estimating offsite concentra .. tions of radionuclides in a plume are the wind speed, wind direction, and atmospheric stability class. Depending on the method utilized at the plant, the atmospheric stability class can be calculated ma~ua1ly from the vertical temperature profile, from wind speed and observational information or calculated automatically utilizing meteorological instrumentation. Wind direction fluctuations may also be used to determine atmospheric stability class. These data should be available from the plant's meteorological instrumentation, unless the station is inoperable due to scenario events. If this were the case, then it would be available from the standard backup sources. Systems at many plants average data over a discrete time period (1 to 30 minutes typica11y) and. therefore~ provide a periodic output.
During meteorological data preparation~ special attention should be given to simulating particular site-specific meteorological conditions such as sea or lake breeze effects~ inversion layers~ fumigation, and river valley effects. Historical meteorological data for the plant site is very useful in determining when these effects are most likely to arise. These conditions can also be used to justify higher or lower radionuclide concentrations at particu1ar offsite locations to satisfy the needs of scenario objectives. The assistance of a meteorologist would be advisable for generating data that reflects. a more complex meteorological condition~ The use of these conditions may complicate the prediction of radionuclide concentrations in a plume since few dose assessment codes are currently capable of handling the more complex meteorological conditions. Some computer dose assessment codes such as MESOI and MESORAO, however~ are capable of ge~erating offsite radionuc1ide concentrations under the more complex meteorological conditions, assuming the assistance of a meteorologist is available to determine plume behavior.
A.18

CALCULATION OF RADIONUCLIDE CONCENTRATIONS
There are several methods for calculating the airborne concentrations of radionuclides. These include multiplying the relative concentrations at the plume centerline and near ground level by the source term. The equation most commonly employed in dose assessment models to calculate relative concentrations is the Gaussian Diffusion Equation. The most available means for calculating offsite radionuclide concentrations and the corresponding field data is the plant 's dose assessment model. Many different models are currently in use and they vary significantly in their complexity and approach. Consequently, each model has its own strengths and weaknesses.
In choosing a calculational model for generating scenario data, the most important factor to consider its applicability for data generation and its capability for special scenario considerations such as wind shift, site topography, precipitation, or complex meteorology.
If the same plant dose assessment model is used to generate the offsite field data as is used for dose assessment during the exercise, then the projected and field data would match exactly which is unrealistic. To avoid this situation, the scenario data could be altered by a reasonable factor or a different dose assessment model could be used.
Another factor to consider when calculating airborne concentrations of radionuclides is their reduction by the natural process of deposition (see Figure A.l). The two primary methods of deposition are dry and wet
Washout
Dry Deposition
FIGURE A.l. Atmospheric Dispersion and Removal Processes
A.19

deposition. These processes cause radioactive material to be deposited at the ground level which contributes to surface contamination levels. Most dose assessment models cannot handle the effects of deposition. Therefore, the effects of deposition must be considered separately when evaluating the results obtained using the model. Calculation could be performed manually or by computer to adjust the results. Such deposition calculations are not only important for correcting the radionuclide concentrations in the plume, but they also serve as the basis for calculating other environmental information such as sampling data for soil, water, and vegetation.
A final calculational consideration is that a realistic event sequence and the resulting source term may not allow the generation of offsite radionuclide concentrations at levels high enough to meet scenario objectives. For example, inadequate radionuclide concentrations could prohibit the emergency classification from reaching the desired level to initiate offsite activities. One possible solution to this problem is to increase the offsite radiological data by multiplying the source term by a constant factor. Another solution would be to increase the magnitude of the failure with a corresponding increase in all onsite data. If an adjustment is necessary, then caution is advised since either approach could introduce unrealistic or inconsistent data into the scenario which could confuse the players leading them into inappropriate corrective actions.
The following sections will discuss the use of the Gaussian diffusion equation for calculating airborne concentrations for ground and elevated releases, a simple method for calculating offsite dose, and methods for calculating the effects of deposition on plume concentrations.
1. Gaussian Diffusion Equation
For Ground-Level Releases:
For ground-level releases the Gaussian diffusion equation for determining the activity downwind of the release point is as follows:
where
x = {12)
X= activity concentration of radionuclides at the plume centerline at a distance x from the source (Ci/m3)
Q' = decay-corrected release rate (Ci/sec)
oy = Gaussian diffusion coefficient for the horizontal direction
az = Gaussian diffusion coefficient for the vertical direction
U = average wind speed at the 10 m level (m/sec)
A.20

y ~ horizontal dispersion coefficient (m)
z ~vertical dispersion coefficient (m}.
The horizontal and vertical dispersion coefficients are a function of atmospheric stability and distance from the release. Figures A.2 and A.3 are experimentally generated curves used for obtaining numerical values for o and o , respectively (Gifford 1968). Stability class is determined from Tabl~ A.B. T~e decay-corrected release rate, Q', must be estimated by plant personnel based on plant radiation instrument readings or other methods (EPA 1980). The correction for radioactive decay while the plume is traveling from the release point to the receptor point is:
where
Q'. =decay-corrected release rate at timet (Ci/sec) ,
(13)
Q; = release rate of radionuclide species i at the source (Ci/sec)
A; = radionuclide decay constant for nuclide i (hr-1)
t = transit time for plume travel from release point to receptor site (hr).
The decay constant for a radionuclide is based upon its half-life: ·
where
1n2 A; = r:-
1
A. ~radioactive decay constant for nuclide i (hr-1) , T. =radioactive half-life of nuclide, i, (hr}. ,
A.21
(14)

1-
l.ool' , / ~
/: /' ~ A~ ~· ~ / ~ ~
E c 10
3
-~
~~ v v ~ ~ ~ ~~ /c~ / v ~
D (.J --Q) 0
(.)
c
, , E , ~ 7
v , [/ ~ 7 F' / / r ~ ~ /
0 ·a; ,_ Q) Q. (I)
0 10
2 10
7/ / / ,~ ~
~~ V/ ~ v v~ ~..,.~ / -c
0 .!::! ,_ 0 :I:
i
, ~ , , / ',/ , / / ./ / A - Extremely Unstable
/ '/ /./
7.L/ ,/ ~ /1.1 B - Moderately Unstable C - Slightly Unstable
v ~ vv D- Neutral
~ E - Slightly Stable / F - Moderately Stable
7 ,--
/ ~ /
/ 7
Distance from Source (m)
FIGURE A.2. Lateral Diffusion, o , versus Downwind Distance from Source for Pasquill'~ Turbulence Types (Gifford 1968)
A.22

3x10³
2
103
I IJ
I ~ ~ ~"' J
II ~ I J
II ~ - 5 E I /
/ v --c: (I)
·u 2 :::
~ u
102 c: 0
~..,oioo'
/ ~~ / ~""' A
) 8/ v v / ~ ~"" j c.;; ,.,.,-
·u; .... II -(I) c. 5 .!!I 0 iti 0 - 2 .... (I)
> N
101 b
5
D .. ~ __,-7 II' II / I'E ""'
,.,. f7 v ~~ V/ ~~
/ v v 1.-'lo-' v v F
~ v v ~ ~ ~lo-' v ~ ~ l.o A- Extremely Unstable
7 B - Moderately Unstable ~ 7 ......
C - Slightly Unstable 7 ~
IZ/ ~ 0 - Neutral 7 17' 77 E - Sl ightly Stable
v F - Moderately Stable
2
Distance from Source (m)
FIGURE A.3. Vertical Diffusion, a , versus Downwind Distance from Source for Pasquill'szTurbulence Types (Gifford 1968)
A.23

TABLE A.B. Classification of Atmospheric Stability by Temperature Change with Height (NRC 1980b)
Chan~e in Temperature Stabi 1 i ty Pas qui 11 (6T with Change in
Classification Categories Height (!:J.z), °C/100 m
Extremely unstable A flT/6z :ri -1.9
Moderately unstable B -1.9 < AT/6z :ii -1.7
Slightly unstable c -1.7 < !:J.T/6Z :ri -1.5
Neutral 0 -1.5 < 6T/6z s -0.5
Slightly stable E -0.5 < 6T/6z :ii 1.5
Moderately stable F 1. 5 < AT /6z :ii 4.0
Extremely stable G 4.0 < 6T/6z
For Elevated Releases:
For an elevated release, the plume centerline concentration can be calculated using:
where
Q' X=-~-- exp ,. a a U
y z (15)
X= activity concen~ration of radionuclides at the plume centerline at a distance x from the source (Ci/m3 )
Q' = decay-corrected release rate {Ci/sec)
a = Gaussian diffusion coefficient for the horizontal direction y
a = Gaussian diffusion coefficient for the vertical direction z U = average wind speed at the 10 m level (m/sec)
h =effective stack height (m).
A.24

Figures A.4, A.5, and A.6 show plots of normalized ground-level average concentrations for effective source heights of 10m, 30m, and lOOm respectively (Hilsmeier and Gifford 1962).
The normalized ground-level average concentrations for a discrete effective stack height can be used as follows:
X = 1 exp -(~)
I
a-where
1 exp - ~lis the normalized ground-level average (
2 \
w· 0y 0 z oz )concentration for effective stack height h.
Example
Plant stack effluent monitors indicate that noble gases are being released at a rate 3 Ci/sec from a 100-m high stack. Calculate the radionuclide concentration at the plant boundary 1 km downwind from the stack.
The source of the noble 9ases is a waste gas decay storage tank containing Kr-85 (half-life 10.72 yr), Xe-131m (11.92 d), and Xe-132 (5.25 d). For adverse meteorology, the wind speed is assumed to be low (1 m/sec) and the atmospheric stability class is slightly unstable ' to moderately unstable as determined from the lapse rate method {see Table A.8). From Figure A.6, the normalized ground-level average concentration for a source height of 100m is about l.SE-5 at a downwind distance of 1 km. Assuming an adverse wind speed of 1 m/sec and an effective source height of 100 m, the concentration of longlived noble gases at the ground-level is:
X = 1
therefore,
X = l.SE-5 f
A.25
Ci = 4.5E-5 -
m3

h 10 m
10- 3 ~ ~ 'U' ., ~
cr I E
y 7"1: ~ 1\. v~ ~
I\: "' ~ ' \. 0 " I ::I J>c:
\ ~ ~ ~ " J ' " ' ~ ~ \
10- ·
J 1\ ' ~\ 1\ \ ~ ~ ~
I' ' ' __,.
' ' " ' 1\. l I\ ~
AI\ 8 c\ o\. E' F ~
\ ' \ ~ 1\ \.
' \ \ ' \ ~ ~ r\ ~
Travel Distance (m)
FIGURE A.4. Ground-Level Average Concentration Normalizing Factors for an Effective Source Height of 10 m as a Function of Distance from the Source (Hilsmeier and Gifford 1962). A-Fare Pasquill's diffusion categories.
A.26

h 30m r-
10- 4 V? K" ~~ ~~ r.-I E
I I ~ ' I'V' ~ ' I I& II' "' I I \ ~ " ~ """' .....
0 '
II I Ill '\. '\.. I"'
I I II ~ 1\. 1\ 1\. r-I :::I I)( I I \ \ ,r\
10- 5
I I I' II " \ I\ "' f\_ 1\ ~ " I\
11 \ -~ ' ' ' \ \. \. 1\. \ \ \. I\ [\
' ~ ' 1\. ~ ~ ~[\
i~ r\ c~ ~ ~r " \
F ~ 1 l
Travel Distance (m)
FIGURE A.S. Ground-Level Average Concentration Normalized Factors for an Effective Source Height of 30 m as a Function of Distance from the Source (Hilsmeier and Gifford 1962). A-Fare Pasquill's diffusion categories.
A. 27

h 100m
-10-5
'(' ~~to. I
j ~ j
I ' ~ -~-I E
a " t:::J
I ' , " ~ I J v .,.
"" ~A
I j 1\ J \. I 1/
I ' I t\. " f 7 ~ ' 1\. ~
\. ' ~ I><
10-6 \ ~ll' \ ~
1\ r--. \ I I' I' B
~ ~ 1\ 1\
" ~ c \ I
E\ I
r F
Travel Distance (m)
FIGURE A.6. Ground-level Average Concentration Normalized Factors for an Effective Source Height of 100 m as a Function of Distance from the Source (Hilsmeier and Gifford 1962). A - Fare Pasquill 's diffusion categories.
A. 28

For Additional Centerline Values:
To determine additional centerline concentrations, the following formula can be used (EPA 1980):
(16)
where
01 = concentration at known distance d1 •
Dz = concentration at new distance d2 •
X = function of atmospheric stability class ranging between 1 and 2.
The exponent X is a function of atmospheric stability class observed at the release point:
Stability Class
A & B c & 0 E & F
Value of X
2 1.5 1
For Off-Centerline Values:
Field calculation for concentrations on a line horizontally perpendicular to the plume centerline are useful for determining the plume boundary. By assuming a Gaussian distribution of radionuclide concentrations for points perpendicular to the centerline, the following formula can be used to calculate off-centerline values:
where
(17)
a. = activity concentration of radionuclide at perpendicular distance y 1 from the centerline position (Ci/m3)
A; = activity concentration of radionuclide i at the centerline position (Ci/m3)
y = perpendicular distance from the centerline (m)
o =horizontal diffusion coefficient at the centerline (m). y
A.29

2. Simple Offsite Dose Calculation Method
Procedure: If the noble gas and iodine release rates in curies per second have been measured, calculated or estimated and the stability class and wind speed are known, then the following form can be completed using the dose factors from Table A.9.
Note: The dose conversion factors 9ive dose rates in units of mrem/hr.
TABLE A.9. Off site Dose Calculations, mrem/hr per Ci/sec
Stability Class A
Wind Speed Groups, mph
Range >0 to 2 >2 to It >4 to 9 >9 to 18 >18 to 36 Miles WB THY WB THY WB THY WB THY WB THY
1 1.25 2990 0.416 998 0.208 499 0.104 250 .052 125 2 0.668 1600 0.223 534 0.11 1 267 0.0556 134 .0278 66.8 5 0.360 863 0.120 288 0.0599 144 0.0300 71.9 .015 36
10 0.360 863 0.120 288 0.0599 144 0.0300 71.9 .015 36
Stability Class B Wind Speed Groups, mph
Range >0 to 2 >2 to 4 >4 to 9 >9 to 18 >18 to 36 Miles WB THY WB THY WB THY WB THY WB THY
1 8.9 21400 2.97 7120 1.48 3560 0.742 1780 .371 890 2 2.26 5410 0.752 1800 0.376 902 0.188 451 .094 226 5 0.388 932 0.129 311 0.065 155 0.032 77.6 .016 38.8
10 0.360 863 0.120 288 0.059 144 0.030 71.9 .015 36.0
Stability Class C Wind Speed Groups, mph
Range >0 to 2 >2 to 4 >4 to 9 >9 to 18 >18 to 36 Hiles WB THY WB THY WB THY WB THY WB THY
1 22.5 54100 7.51 18000 3.75 9010 1.88 4510 .939 2250 2 6.54 15700 2.18 5240 1.09 2620 0.545 1310 .273 654 5 1.25 3000 0.417 1000 0.208 500 0.104 250 .052 125
10 0.468 1120 0.156 374 0.078 187 0.039 93.6 .020 46.8
A.30

TABLE A.9. (contd) Stability Class 0
\~ind SEeed GrouEs, mEh Range >o to 2 ~ to It >4 to 9 >9 to 18 >18 to 36 Hiles WB THY 118 THY W8 THY WB THY WB THY
1 46.2 1. 1E+S 15.4 3.7E+It 9.1 It 2.2E+4 5.40 1.3E+4 2.70 6480 2 18.9 4.5E+4 6.31 1.5E+4 3.51 8410 1.96 4710 .982 2360 5 5.5 1.3E+4 1.83 4400 0.964 2310 0.511 1230 .255 613
10 2.1 5030 0.70 1680 0.36 863 0.186 446 .093 223
Stability Class E Wind SEeed GrouEs, mEh
Range >o to 2 >2 to 4 >It to 9 >g to 18 >,a to 36 Miles W8 THY WB THY WB THY WB THY W8 THY
1 70.6 1.7E+5 23.5 5.7E+4 15.9 3 .8E+4 10.2 2 .SE+It 5., 1 .2E+Ii 2 33.1 7.9E+4 11.0 2.7E+4 6.73 1.6E+4 4.05 9710 2.02 4860 5 11.6 2.8E+It 3.87 9260 2.15 5150 1.18 2840 .592 1420
10 5.07 1. 2E+4 1.69 4050 0.897 2150 0.1175 1140 .237 570
Stability Class F Wind SEeed GrouQs, mEh
Range >o to 2 ~ to It >ft to 9 >9 to 16 >, 8 to 36 !!!l!! WB THY W8 THY W8 THY WB THY WB THY
1 125 3E+5 42 1E+5 31 7 .4E+4 19.5 4.5E+4 9.5 2.3E+It 2 64 1.5E+5 21.3 5.1E+4 14 3.4E+4 8.3 2E+4 4.3 1 E+lt 5 25.4 6E+4 8.5 2E+4 5.0 1.2E+It 2.9 6660 1.4 3330
10 12.1 2.9E+4 4.0 9670 2.2 5300 1.2 2840 .60 1420
Stability Class G Wind SEeed GrouEs, mEh
Range >o to 2 >z to 4 >4 to 9 >9 to 18 >t a to 16 Miles W8 THY WB THY WB THY WB THY W8 THY
1 196 4. 7E+5 65.3 1.6E+S 57 1.4E+5 31 7.4E+4 15.4 3.7E+4 2 111 2.7E+5 37 8.9E+4 28 6.7E+4 17 lt.OE+It 8.3 2.0E+4 5 52 1 .3E+5 17 4.1 E+4 11 2.7E+4 6.3 1.5E+4 3.2 7540
10 27.5 6.6E+4 9.2 2.2E+4 5.4 1.3E+4 2.9 6980 1.5 3490
A.31

3. Dry Deposition Calculations:
Dry deposition depletes a plume•s activity concentration as a function of distance from the source and atmospheric stability for both ground and elevated releases. Figures A.7, A.8, A.9, and A.lO indicate the fraction of the activity concentration remaining in the plume as a function of distance and Pasquill stability class for ground-level and elevated releases of height 30m, 60 m, and 100 m, respectively.
One method of calculating the deposition of radionuclides per unit area utilizes a relative deposition rate (m- 1 } term. This term describes the fractional amount of radionuclides deposited per meter as a function of downwind distance and atmospheric stability. The relative deposition rate (m-1) can be calculated from the deposition rate of the radionuclides per unit downwind distance (Ci/sec-m} divided_by the source strength (Ci/sec)(NRC 1977}. The relative deposition rate (m 1) is presented in Figures A.ll, A.12, A.13, and A.14 as a function of downwind distance and Pasquill stability class for ground-level and elevated releases of height 30m, 60 m, and 100m, respectively.
The average rate of deposition of radionuclides at a downwind distance (Ci/sec-m2) can be calculated using the relative deposition rate (m-1) term. This average rate of deposition assumes uniform concentration and deposition across the plume at a given downwind distance. Statistically, a simple correction can be made if the maximum or centerline is assumed to be a factor of three greater than the average. Using the appropriate relative rate of deposition value obtained from a figure (A.ll-A.l4), the width of plume at the downwind distance, and the decay-corrected activity concentration of the source term, the average rate of deposition of the radionuclide in the source term can be calculated. The effective plume width can be determined from Figure A.2. It is the lateral distance, cry' multiplied by 2.5. Therefore:
where
d; = ~ Qi (18)
d; = average rate of deposition of radionuclide i (Ci/m2-sec)
R =relative deposition rate (m-1)
W = appropriate plume width (m)
Q' i =decay-corrected source strength of radionuclide i {Ci/sec).
The activity of the radionuclides deposited on the ground per unit area (Cifm2) can be calculated if the duration of plume passage is known. The calculation of the activity deposited is based upon average rate of deposition which is a function of downwind distance, atmospheric stability, and release height. The equation assumes a constant concentration and deposition rate for the duration of the plume. Therefore:
A.32

where
(19}
Di =activity of radionuclide, i, deposited on the surface of the ground during plume passage (Cifm2)
d1 = average rate of deposition of radionuclide, z (Cifm2-sec)
6t = duration of plume passage (sec).
A.33

Q)
E :;)
~ c: C) c: ·c:
)> 10 . E w Q)
~ a:: c: 0 ·;:; (.)
10 ... LL.
1 .0
0.8
0.6
04
0 .2
0 0 .1
...... ~ .... ... looo
~ ............. .......... ..... " ~ ~~ ~
"" '- ' ~ " ' ~
1.0 10
Plume Travel Distance (kilometers)
FIGURE A.7. Plume Depletion for Ground-Level Releases (NRC 1977) all Atmospheric Stability Classes
~~--...
~
100 200

G)
E ::J
0:: c Cl c c co
)> E . Q)
w a: (.11 c
0 ·~ <.> co .. u..
1.0
0.9
0.8
0.7
0.6
0.5
0.4
0.3
0.2
0.1
0 0.1
- ... : F=::::::--
-~ ""~able (E,F,G) , .....
r--....... -..... ...:::: ~ :::: ~, ::: ::: ~loo. ~ ~ \
""" " ~ ~ ' ~ ..., Neutral (D)
\ " 1\ ~ ,""""" "~ '~ ~
Unstable (A,B,C~ ~
\
1.0 10 100 200
Plume Travel Distance (kilometers)
FIGURE A.B. Plume Depletion for 30-m Releases {NRC 1977) Letters Denote Pasqu111 Stability Class

Q,)
E :J
a: c Ol c
)::o . c w (I)
0\ E Q,)
a: c 0
·;:; (,) (I) ... u..
I l Stable (E,F,G)
1.0 - ---~ !""' ....
~~ 0.9
0.8
0.7
0.6
0 .5
0.4
0.3
0.2
0.1
0 0.1 1.0
---- ::::: ....... ...... .... -...... !""' .... ..... ........ =~ Neutral (0)
~"" Unstab~ (A,B,C)
10
Plume Travel Distance (kilometers)
"' ~ " " '"""' ........ ......
' \ \
FIGURE A.9. Plume Depletion for 60-m Releases (NRC 1977) Letters Denote Pasquill Stability Class
" 'l'ooo~
".......... ~ ~
' \ \
100 200

Q)
E :l 0:: c: 01 c: ·c co E Q)
a: )> c: . 0 w ·;::; -....I (.J
co ... u..
1.0
09
0.8
0.7
.....____ r--r-... r--. ~ r-...... """" ~ r--i"o
Neutral (D) i"oo.. -.....
"""' ~ roo~
~ ........_
~ """" r-..... Unstable ~ (A,B,C)
"" i'ooo..
' ~ I" '~ Stable (E.F.G)
~ 0.6
0.5
No Deplet1on ~ I
~ (Fraction Rema1ning - 1.0) ~
I'
0.4
03
0.2
0.1
0.1 1.0 10
Plume Travel Distance (kilometers)
FIGURE A.lO. Plume Depletion for 100-m Releases (NRC 1977) Letters Denote Pasqu111 Stabi 1 ity Class
"" ~~
\ \
100 200

-... Q) -Q)
E ... Q)
.!?; Q) ... ttl a:
~ r-....._ ......
1"'111
' ""' ' ~ ~ ~
.~ 10-5 ~" "" . ~
Cll 0 c. Q)
0 Q)
.2: ...
.!!1 CD a:
....... ' ' !"-...._
""" ...,
" ~I' r-
"' 7
1.0 10 100 200
Plume Travel Distance (kilometers)
FIGURE A.ll. Relative Depos;tion Rate for Ground-Level Releases (NRC 1977) all atmospher;c stab11ity classes
A.38

-... Q) -Q)
E ... Q)
~ Q) ... {I)
a: c: .~ .t: C/)
0 c. Q)
0 Q)
.~ ... ~ Q)
a:
Unstable (A,B,C) -~ i"'o..
I , ~
~ !IIi.: I'
~ ~ v '" Neutral
I ' ~~ 10-s
'I "" r' ~ I Neutral (D) ~~ Stable
I .-T ~ "" I ........
~ "'ii
J '" ....... ....... "' I I "' """ .... ~,
I I "' ' ~ ""'"
10-e I I ,, ~ ' Stable (E.F.G)
I ' IT I
II I I
I I I
1.0 10 100 200
Plume Travel Distance (kilometers)
FIGURE A.12. Relative Deposition Rate for 30-m Releases (NRC 1977) Letters Denote Pasquill Stability Class
A.39

-;:: Q) .... Q)
E .... Q)
~ Q) .... Ill a: c 0
.'!: (II
0 c. Q)
0 Q)
.~ iii ~ a:
V ~Unstable (A.B,C)
I ~"-.. i"""'oo...., Unstable
/ Neutral'-i' I"\.
II II
I I
I
Plume Travel Distance (kilometers)
FIGURE A.l3. Relative Deposition Rate for 60-m Releases (NRC 1977) Letters denote Pasquill stability class
A.40
I
i

-~ Q) ... Q)
E .... Q)
.s Q) ... ro a: c: 0 .~ Ill 0 c. Q)
0 Q)
.!:!: ... ro a:; a:
J
I
10-6 I I I I I I ~
10-7
10-8
0.1
I/ ~
I _I I
I I
'I
II j
v I I
I I /_
J
I
Unstable (A.B,C)
' 1"\.. ........
r--.... ....... ..... -- r"''
7
7 ......_ ......... 7 ..........._........_
/Neutral (D) .......... .......... I I'-. ~ l'oo.
17 r-..... ~~ ..... ~ " ~
~ ~~ '
"' I 'I
table (E,F,G) No Depletion
1.0 10 100 200
Plume Travel Distance (kilometers)
FIGURE A.14. Relative Deposition Rate for 100-m Releases {NRC 1977) Letters denote Pasquill stability class
A.41

Example
Radionuclides are released to the atmosphere from a reactor vent at an effective release height of 30 m. The Pasquill stability class is neutral (D) and the wind speed at 30 m is 5 m/sec. After five (5) hours of continuous venting, the vent is closed and the release terminates. During the release the concentration of elemental iodine in the effluent remained constant and the release rate was 1 Ci/sec. Calculate the concentration (Ci/m2 ) of elemental iodine on the surface of the ground at a distance of 10 km from the plant 6 hours after the release starts. Assume that no appreciable decay of radioiodine occurs during the 6 hour time period.
The time required for the plume to travel 10 km is about 33 minutes. Therefore, the plume has completely passed over the measurement location at the time of the measurement. From Figure A.12, the relative deposition rate (m- 1 ) for a 3m release at a distance of 10 km from the source is SE-6 m- 1 • From Figure A.2, the lateral diffusion distance a is about 550 m for neutral stability at a distance of 10 km. Because there ~s no appreciable decay, the decay corrected release rate, o• (Ci/sec), is equal to the release rate Q(Ci/sec). Therefore, from Equation 18, the average rate of deposition is:
( )-1 . 2 d; = ~ Q' = (~~S~(~50 m) (1.0 ;~c) = 5.8E-9 Ci / sec-m
where
W = 2.5 ay = (2.5)(550 m)
Q' = 1.0 Ci/sec.
The activity of iodine deposited on the ground per unit area (Ci/m2 ) as a result of the plume is:
o1 di 6t = (5.8E-9 Ci/sec-m2) (5 hr) (3600 ~~c) = 1.0E-4 Ci /m2 = 100 pCi/m2
where
d. = 5.89E-9 Ci/sec-m2 , 6t = (5 hr)(3600 sec/hr)
An alternative method for calculating the average deposition rate (Ci/secm2) is to multiply the concentration of radionuclides in air by the deposition velocity and to integrate over the time period of plume passage:
d x Q' v i = Q i i
A.42

where
x -Q-Q = v~ = ,
relative concentration factor (sec/m3) decay corrected release rate of radionuclide i Deposition velocity of radionuclide i (m/sec).
(Ci/sec)
Dose From Average Ground Deposition: For the first day or two after a plume has deposited iodines, cesiums, and noble gas particulate daughters on the ground, an approximate whole-body dose rate estimate can be made using the following formula:
WB Dose Rate (mR/hr) = (3.0£-9) X (Ground contamination in pCi/m2) (20)
4. Wet Deposition Calculations:
Wet deposition or precipitation removes radionuclides by two processes, washout and rainout. Washout occurs when particulates below a cloud are removed from the plume by impaction by falling rain or snow. Rainout occurs when particulates are mixed with a rain cloud prior to precipitation and are removed in droplets of moisture that form on the particulates. At most plant sites, precipitation amounts vary seasonally. Consequently, the likelihood of precipitation and the consequences of wet deposition should be considered in the preparation of accident scenarios. Wet deposition can be a significant environmental and recovery concern at plant sites where a well-defined rainy season corresponds with the grazing season of local stock animals (NRC 1977). For scenarios, the occurrence of precipitation can be simulated just as wind speed, direction, and stability class are scenario parameters.
The basic equations for wet deposition effects are based on the exponential depletion models for washout and rainout processes given respectively as:
where
X =
X = X e-at 0
XI =
radionuclide concentration in a plume after washout (Ci/m3) radionuclide concentration in plume after rainout (Ci/m3) initial radionuclide concentration (Ci/m3) xo =
a= washout removal rate (sec-1) b = rainout removal rate (sec-1) t =time of precipitation (sec).
A.43
(21)
The washout removal rate is dependent on raindrop size, distribution and plume particle size (Brank and Vogt 1981). In the Reactor Safety Study (USNRC 1975~, a washout removal rate of 10-4 sec-1 for stable conditions and 10-3 sec- for unstable conditions was used. Calculations of the rainout removal rate is complex and are reviewed in Brenk and Vogt (1968).
ENVIRONMENTAL DATA
Sampling and monitoring activities in an area downwind from the release point should simulate actions that would be taken during an actual emergency. Typically, radiation monitoring teams would be deployed to make instrument measurements at selected offsite locations downwind from the nuclear power plant. During the exercise, meteorological data can be used to guide radiation monitoring teams to 1) locate the plume centerline and plume front, and 2) make periodic measurements of airborne concentrations of noble gases, vegetation, and ground water in and around the ingestion exposure pathway to determine the levels of radioiodine and radioactive particulates on the ground. Such data and sample collections help to establish an exposure rate pattern useful for protecting the general population in the anticipated path of the radioactive plume.
Air sampling in and around the plume is necessary to determine the presence of radioiodine and particulate radiation. Direct radiation measurements using ion chamber survey meters should also be made to determine the presence of noble gases. Therefore, both air sampling equipment and instrumentation for measuring beta-gamma exposure rates are essential for determining contamination levels and projecting doses. Preparation for an exercise should, therefore, include the generation of data for airborne concentrations, openand closed-window (beta plus gamma versus gamma} ionization chamber readings, and surface contamination levels.
Exposure rate and radiological sample information can be generated to provide simulated instrument readings in the field during the exercise. The sample exposure rate information presented in Table A.lO is estimated for various times and locations within the plume exposure pathway. The radiological sample information presented in Table A.11 is generated for locations that are considered to be in the ingestion exposure pathway (NRC 1980a). For the plume exposure pathway, the data should be generated for locations within the 10-mile (16 km) EPZ.
Environmental data can be estimated by converting airborne activity (Ci/m3 ) and ground deposition activity (Ci/m2 ) to instrument readings and sample results. Instrument readings are in units of R/hr (or mR/ hr), counts per minute (cpm), and counts per channel per second. The airborne concentrations of noble gases can be converted to survey instrument readings using methods described in the Manual of Protective Action Guides and Protective Actions for Nuclear Incidents (EPA 1980). In order to ensure consistency, the environmental data projected for the scenario must be coordinated carefully with the planning of the main scenario sequence.
A.44

Refined data such as ~Ci/cc and Ci/m2 should be provided for use by controllers to evaluate the results obtained by players. Refined data also allows controllers to recognize -and compensate for erroneous player actions which might adversely affect the course of the scenario.
The sections which follow will discuss the calculation of exposure rates from exposure to a radioactive plume, the conversion of air and surface concentrations into meter readings, and the generation of data for reentry and recovery.
1. Calculation of Exposure Rate
If the gamma exposure rate from a semi-infinite cloud of airborne noble gases is to be determined as a function of time and distance from the source, then the following procedure can be used:
{1) Determine the concentration of noble gases in the air as a function of time using equations (12) or (15) and Figures A.2 and A.3.
(2} Calculate the exposure rate (mR/hr) using equation {7} and Table A.l2.
Thus:
where . 0 = total .
0. 1
= gamma
• M 0 = L D;
i =l
M = L 106 (E.)(X.)
i =1 1 1
gamma exposure rate (mR/hr) from noble gases
exposure rate (mR/hr) from ith radionuclide
X; =concentration of radionuclide i in the air (Ci/m3)
~; = average gamma-ray energy per disintegration radionuclide i (MeV)
M = number of noble gases.
Average gamma-ray energy per disintegration ratios are listed in Table A.l2 for noble gases and radionuclides. The radionuclide source term information is representative of inventories present in 1000 MWe (3200 Mwt) light water reactors during operation (Rasmussen lgBO). The relative concentration of radionuclides in the core of the reactor and in radioactive effluents can vary with time following shutdown because of radioactive decay as indicated in Table A.l3. A gamma dose rate to noble gas concentration in air ratio was calculated (EPA 1980) as a function of time following shutdown. The effect of the decay time on the conversion ratio rem/hr to Ci/m3 is shown in Table A.14. For gamma exposure, the approximation that 1R = 1 rem is reasonable considering the range of uncertainties involved in the conversion ratio calculation.
A.45

Time
1230 1245 1300 1315 1330 1345
TABLE A.10. Exposure Rate Information
Plume Monitoring Data
Downwind Location - X/Q = 3.3E-9 Filter Sample Volume - 25 ft3
Instrument - RM-14 (HP210 Probe) - R0-2, PIC-6
Particulate Iodine Dose Rate Noble Gas Filter Cartridge Window Orn {net c~m) {net CQm} {net c~m) (mR/hr
17 2.5 20 40 14 5.0 25 77 26 5.5 26 90 40 7.0 27 110 54 7.5 40 260 140 10
TABLE A.l1. Radiological Sample Information
Ground Survey Instrument Readings
Ingestion Monitoring Data (Field Teams)
Sample Station - ESE 19c, Short Edge Distance - 12.0 miles
Time - 1700 hours
Soil Vegetation Deposition Count Rate Liquid Sample Count Rate (cpm) 1.0 lb (cpm) 10 ga 1
Instrument Probe {cQm) SamQle SamQle
Model HP240 9.0 X 10² 5.3 X 10² 80 E140
HP260 2.9 X 10³
HP210 3.2 X 10²
A.46
Dose Rate Window Closed
(mR/hr)
2.0 4.0 4.5 5.0 5.5 7.0
Smear Sample (cpm) 1.0 ft 2
Smear
2.6 X 10³
8.7 X 10³
9.6 X 10³

Nuclide
85Kr 85mKr
87Kr 88Kr 133Xe 133mxe
135Xe 135mxe 131I 1321 1331 1341 135I
TABLE A.12. Radionuclide Source Data (EPA 1979)
Average Beta Average Gamma Energy per Energy per
Half-Life Initial Disintegration Disintegration {hr) Inventor~ (108 Ci) E (MeV) {MeV)
9.4 X 10⁴ 0.0056 0. 251 0.0022 4.48 0.24 0.226 0.18 1.27 0.47 1.33 0.79 2.8 0.68 0.249 2.2
127 1.7 0.102 0.030 53.5 0.04 0.0 0.020 9.17 0.34 0.310 0.26 0.27 0.19 0.0 0.53
193 0.85 0.185 0.39 2.29 1.2 0.525 2,2
20.8 1.7 0.417 0.60 0.877 1.9 0.691 2.6 6.59 1.5 0.394 1.5
TABLE A.13. Noble Gas and Iodine Inventory in the(~,actor Core and Containment as a Function of Time
Time After Total Iodine Total Noble Gas Shutdown Inventory Inventory
(hr) (108 Ci) {lo8 Ci)
o.o 7.2 3.7 1.0 5.6 3.4 2.0 4.7 3.2 3.0 4.1 3.0 4.0 3.8 2.9 6.0 3.2 2.8
12.0 2.4 2.5
(a) Based on the shutdown equilibrium core inventory of a typical 1000 MWe (3200 MWt} power reactor and zero containment leakage rate.
A.47

Example
TABLE A.14. Ratio of Noble Gas Gamma Dose Rate to Noble Gas Concentration, RGC , as a Function of Time After Shutdown (EPA 1979,
Time After Shutdown (hr)
0 1.5 2.5 3.5 4.5 6.5
12.5
RGCoo rem/hr n Ci/m3
5.3E + 02 5.0E + 02 4.3E + 02 3.7E + 02 3.1E + 02 2.3E + 02 1.2E + 02
A loss-of-coolant accident (LOCA) releases noble gases, radioiodines, and particulates to the atmosphere. The cumulative activity of noble gases released after 1 hour is 3.1E7 Ci. After 4 hours, the cumulative activity is 8.4E7 Ci. The airborne radionuclide concentrations are dominated by the noble gases during the time of plume passage over a location 10 km downwind from the plant. The atmospheric stability category is neutral (D) and wind speeds are 6 m/s at the effective release height of 100 m. Two hours after the LOCA the release rate of noble gases is about 6.0E3 Ci/sec at the effective release height of 100m. Calculate the centerline gamma exposure rate (mR/hr} at a downwind distance of 10 km at about 2.5 hours after the LOCA.
Since the time required for the plume to travel a distance of 10 km is about 0,5 hours, the decay of the noble gases is about 3% as indicated in Table A.l4. Therefore, plume reduction is negligible for noble gases during the 0.5-hour time period. The normalizing factor for ground-level average concentration of noble gases is about 3.0E-6 (m-2} at a distance of 104 m for a neutral (D) atmospheric stability category (see Figure A.6). The concentration of noble gases at the ground level is:
where
- Q· X = 3.0E-6 U
X = concentration of noble gases (Ci/m3) Q' = release rate U = wind speed (m/sec)
J.OE-6 = normalizing factor for ground-level average concentration (m-2)
therefore
6E+3 X = 3E-6 X ~ Ci = JE-3 ~ m"
A.48

From Table A.14, the ratio of noble gas gamma dose rate to noble gas concentration 2.5 hours after shutdown is 4.3E2 rem/hr per Ci/m3 • The gamma exposure rate is therefore:
R = 4.3E2 rem/hr x Ci/m3
2. Conversion to Meter Readings
Surface Contamination:
Ci 3E-3 - X m3
1.0 R rem
R = 1. 3 hr
The conversion of area concentrations of radionuclides on the surface of the ground to survey instrument readings is based on the following equation for a G-M counter with a metal tube wall thickness of 30 mg/cm2 (Vallario 1974).
Where
D R = F
R = G-M background reading at 0 to 5 em (100 counts/min) 0 = ground deposition of radionuclides (vCi/m2) F =ground contamination factor (vCi/m2 per 100 counts/min).
(23)
The area concentrations (Ci/m2) are estimated by using the method recommended by the NRC in 1:111 (USNRC 1977) and described previously. The concentration values obtained from Equations (VI-6) and (VI-7) need to be increased by a factor of 10E6 to yield Cifm2-sec and Cifm2 values, respectively. The ground contamination factors of various radionuclides are given in Table A.15. The conversion ratio for radioiodine is about 1 Cifm2 per 100 counts/minute.
A comparison of survey readings obtained at the surface of the ground with various instruments is presented in Table A.15. The G-M meter conversion factors are the same as those given in Table A.17. The term "Minor Scale Division" is intended to mean per 2 MR/hr. A summary of ground contamination factors for survey meter readings with windows closed at a distance of one meter (3ft) above the surface is given in Table A.17. Note that the factors are Ci/m2 per 10 3 counts/min. Equation (24) is used for estimating exposure rates at ground surface and at 3 feet above the surface.
A.49

TABLE A.15. Ground Surface Contamination Levels(a) of Various Nuclides Required to Yield 100 Counts/Min (net) on a GM Meter (open window) (Vallario 1974)
Radionuclide F (1J.Ci/m2 per
100 Counts/min)
95zr-95Nb l"+lCe
6
2
1 131J, lo3mRu, mixed Ru-Rh (100 d old) (b) 60Co, 89Sr, 90Sr, 9oy, 137Cs, l"+OBa, 140La
(a)
(b)
l44Ce + l44Pr, 106Ru + 106Rh, mixed
radioiodines (1 hr to 1 week old), mixed fission-products {100 d old) 0.3
Level varies with background readings, ground roughness and vegetation cover. Age refer~ to time since irradiation of the fuel from which the fission products were released.
TABLE A.16. Summary of Ground Contamination Factors for Readings (Window Open) at Surface (Vallario 1974)
Radionuclides
soc0 , 89Sr, 90Sr, 90y, 90Sr-90y 9ly, 137Cs, l"+OBa 140La, l"+OBa-l"+OLa, 141Ce, l44Ce-144Pr, Mixed Ce-Pr, 131J, 132Te-132J, 133J, 134J,
13SJ, mixed iodines (1 h - 1 week) 106Ru-106Rh, Mixed FP {cr 100 days} 95zr-Nb 103Ru-Rh
Mixed Ru-Rh (cr 100 days)
11Ci/m2Per Minor Scale Division (a)
CP Juno
15 30 75 75
5
10 30 30
(a) 2 mR. (b) Tube wall thickness = 30 mg/cm2.
11Ci/m2per 103 Counts/MiB> GM Meter Window Open
3{c)
60
15 15
(c) For I, use 10 instead of 3. ForCe, use 20 instead of 3.
A.SO
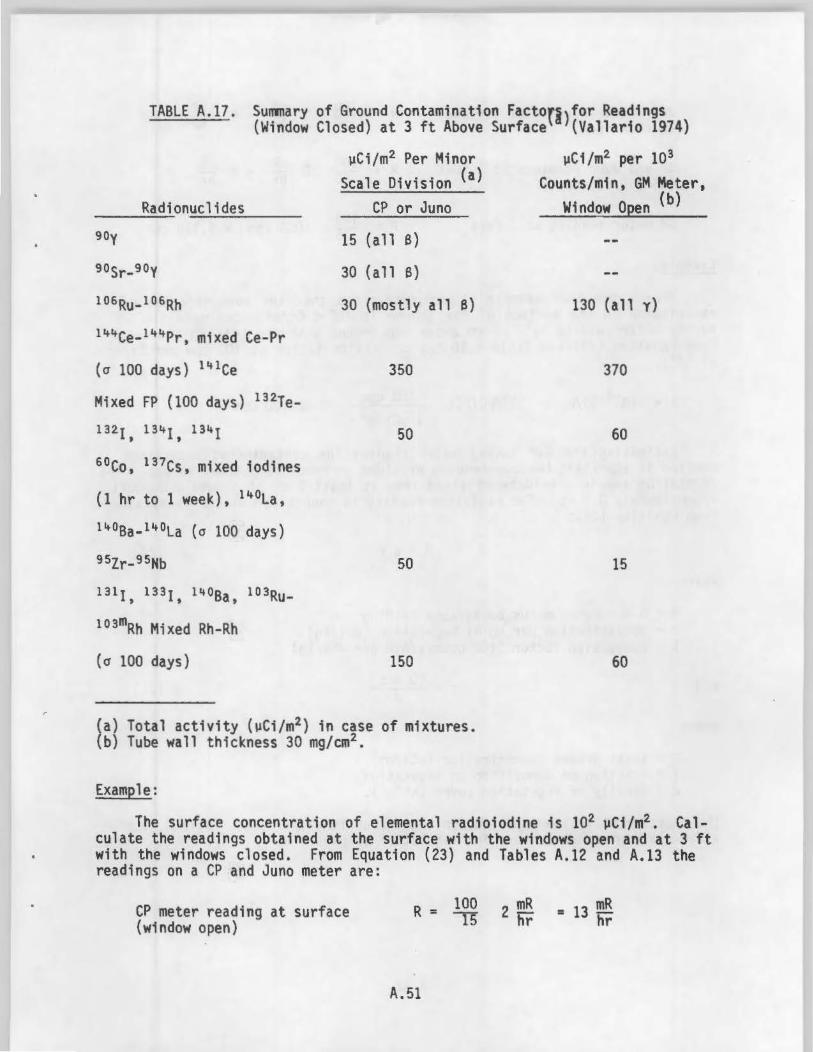
TABLE A.17. Summary of Ground Contamination FactOfJ}for Readings (Window Closed) at 3 ft Above Surface (Vallario 1974)
Radionuclides __ ......;.;.::~ 90y
90Sr-90y
106Ru-106Rh
(a 100 days) 1 ~ 1 Ce
Mixed FP (100 days} 132Te-
1321, 13~+1, 1341
60co, 137cs, mixed iodines
(1 hr to 1 week), 140La,
140Ba-140La (a 100 days)
9Szr_gsNb
131t, 1331, 1~osa, to3Ru-
103mRh Mixed Rh-Rh
(a 100 days)
~Ci/m2 Per Minor Scale Division (a}
CP or Juno
15 (all B)
30 (all B)
30 (mostly all B)
350
50
50
150
(a) Total activity (~Ci/m2 ) in case of mixtures. (b) Tube wall thickness 30 mg/cm2•
Example:
~Ci/m2 per 103
Counts/min, GM Meter, Window Open (b)
130 (all y)
370
60
15
60
The surface concentration of elemental radioiodine is 102 ~Ci/m2 • Calculate the readings obtained at the surface with the windows open and at 3 ft with the windows closed. From Equation (23} and Tables A.12 and A.13 the readings on a CP and Juno meter are:
CP meter reading at surface {window open)
R = 100 2 mR • 13 mR -rr hr hr
A.51

Juno meter reading at surface R = 100 2 mR = 40 mR -;o- hr hr (window open)
CP and Juno readings at 3 feet R = 100 2 mR = 4 mR (window closed) 50 hr hr
GM meter reading at 3 feet R = 100 1000 cpm = 6,170 cpm 15'
Example:
From a previous example it was detennined that the concentration of radioiodine on the surface of the ground is 10E-4 Ci/m2 • Estimate the GM survey meter reading held <5 em above the ground with the beta shield open. From Equation (23) and Table A.10 the conversion factor is 100 cpm per Ci/m2
of 1311.
R = 10-4 Ci /m 100 cpm 1 l!Citm2 = 10,000 cpm
Estimating the G-M survey meter reading for contaminated vegetation samples is important because herbage provides an exposure pathway to man. The vegetation sample should be obtained from at least 1 m2 of ground and equal approximately 0.3 kg. The radiation reading in counts per minute is obtained from Equation (24}:
R = k c
where
R = G-M reading minus background reading c = concentration per kg of vegetation {mCi/kg)
and
where
k = conversion factor (100 counts/min per l!Ci/kg)
c=i4--fl
D = total ground concentration (l!Ci/m2 ) f = fraction of deposition on vegetation d =density of vegetation cover {kg/m2).
(24)
{25)
The fraction of iodine deposited on vegetation is about 0.25. Table A.18 provides the conversion factors for vegetation samples.
A.52

Example:
TABLE A.18. Typical G-M Survey-Meter Readings Probe Inserted in the Center of a Large Sample of Vegetation (Vallario 1974)
Nuclide
B9sr, 90Sr+9oy I06Ru+106Rh 140Ba+l40La 1311, 137Cs
k (100 x Counts/Min Per ~Ci/kg)
20 50 10 4
From previous examples, it is estimated that the ground concentration of radioiodine is 100 ~Cijm2. The density of the vegetation cover is 0.3 kgfm2 of ground surface. If the fraction of iodine deposition on vegetation is 0.25, then calculate the radiation reading in counts/minute. The concentration per kg of vegetation is obtained from Equation (25):
c _ 100· X 0.25 ~Ci/m2 - 0.3 kg/m2
= 75 vCi/kg
From Table A.18 the conversion factor for 1311 is 400 counts/minute per pCi/kg. Therefore, the radiation reading is estimated from Equation (23):
R = 400 X 75
= 30,000 counts/minute
Air Sampling:
If a silver zeolite cartridge is read in the field using a frisker type instrument (e.g., Eberline RM-14) I-131 air concentration values can be converted to instrument readings using the following approximation:
where
cpm ~ Samp~~5~~lume I-131 Concentration (~Ci/cc)
cpm is counts per minute on frisker Sample Volume is in cc or ml Note: Volume conversion factor: cc or ml = (2.8E4)(cubic feet)
A.53
(26)

If the silver zeolite cartridge is measured using a survey instrument, the formula below provides the approximate relationship between iodine concentration and dose rates for contact readings on an iodine cartridge for a 1.0 cubic meter air sample.
mR/hr ~ Iodine concentration vCi/cc 1E6 (27)
If particulates are included in the chosen release for the scenario a rapid evaluation of air contamination from beta/gamma emitters is sometimes made in the field using a survey meter held in proximity to an exposed air filter paper. A reasonable assumption for filter collection efficiency (80%) and GM survey meter counter efficiency (2%) should be used. Table A.19, using these assumptions, denotes detection limits versus operating time for a 10 L/minute sample. Using these assumptions reasonable data can be generated for field surveys of particulate filters.
TABLE A.l9. Meter Readings on Air Filter Samples Versus Air Concentrations (Vallario 1974)
Air Concentration (vCi/m3 )
lE-6 1E-7 lE-8 lE-9
Operating Time at 10 L/min
1 min 5 min
30 min 4 hr
(a) Tube wall thickness = 30 mg/cmZ
3. Reentry/Recovery Information
GM Meter(a) Reading at Surface of Filter (counts/minute)
400 200 100 100
Scenarios that contain objectives to demonstrate recovery and reentry with the associated time lapse will need to provide more field sampling data to reflect the anticipated sampling occurring during the time lapse. If the time lapse is long, then additional data could be provided to reflect the extensive sampling and laboratory analysis that would be expected.
Data supplied for the reentry and recovery portion of the exercise should be provided in a more refined form such as in units of pCi/cc or Ci/m, to reflect the data processing during time lapse. Tables A.20 through A.22 present examples of data that may be necessary for reentry and recovery.
A.54

TABLE A.20. Example of Population Displacement Information for State and Local Agencies
1. At approximately 9:45a.m., a number of rumors offsite prompted some sporadic evacuation from several towns. It is estimated that approximately 1500 people evacuated at this time. Some of them are at hotels and are asking if they can be compensated.
2. Shortly after the siren actuation, several people within the two-mile area refused to leave and are still there.
3. At the time of radioactive release, the wind was predominantly in the NW (Sector Q) direction although at times it blew into the NNW (Sector R).
The following towns were evacuated on Saturday and simulated sending people to appropriate host communities (2-mile and 5-mile downwind).
TOWN
Rock town Midland Village Adams
HOST COMMUNITY
Higby Hawely Essig Norwalk
PEOPLE SHELTERED
2800 200 400 385
4. Approximately 300 pregnant women evacuated.
5. It appears that 75% of the evacuating population went to friends, relatives or hotels outside the EPZ.
6. Routes 33 East in East Village and 16/33 North in Portland are c 1 osed to traffic; Route 7 in Midland and Route 11 North in Connel are closed; Route 8 East in Madison is closed and Route 4 is being closed from Sternham and Marlow.
7. Recent reports indicate 100 to 200 people per hour are leaving the 10-mile radius from non-affected towns; also, it is estimated that as many as 4000 people have left the State.
8. It is being reported that other states will not accept shipments of any milk from the local area farms.
A. 55

)::.. . U'1 0'1
TABLE A.21. Examples of Field Monitoring Data for Recovery
Surface Contamination Levels in Sector R 2
in lJCi/111
Location 1-131 1-132 1-133 1-135 Cs-134 Cs-137 Te-132 Sr-89 Sr-90 IIIR/t-.r
R 1.1 '3.53 1.88 7.05 '3 .57 7.0 £-1 3.62E-1 '3.53 3.62E-2 3.62E-3 1.37 R 2.1 8.81E-1 11.71E-1 1.76 8.93E-1 1.75E-1 9.05E-2 8.81E-1 9.0SE-3 9.0SE-II 0.343 R 3.1 8.113E-2 4 .51E-2 1.71E-1 8.5SE-1 1.71E-2 8.65E-3 8.42E-2 8 .6SE-II 8.6SE-5 0.035 R 11.1 8.39E-2 4.48E-2 1.68E-1 8.51E-2 1 .67E-2 8.62E-3 8.36E-2 8.62E-II 8.62E-5 0.033 R 5.1 8.35E-2 11.45E-1 t .65E-1 8.47E-1 1 .64E-2 8.58E-3 8.3SE-2 8.57E-4 8.57E-S 0.03
Field TLD Data
In Plant Plan·t Related Direct Location Description Corrected Field Background Contribution Dose
SECTOR & Dist To.m and Street Pole I Other \.IR/hr ~ \JR/hr ~/hr IIIR X c x-c (A-C) X B'f1000
A (I) N .8111 Cro.~ell CLP 8.0 317 6.8 0.38 Road 10 656
A (0) N II.Om East Village SNET 8.1 317 8.0 0.015 Green Rd. l Rte. 17 21t0
0 (I) NW .1 Ill Onaite Fence 215155.7 317 13.7 93560 Boron Waste Tank
Q (I) NW ·""' Cromwell A.P. 34708.6 317 8.5 11000 Weldon Road Shelter
It is assumed that the TLDs were collected 211 hours after release ter•fnation and have been fn the field sfnce April 30 at 0800.

TABLE A.22. Examples of Dairy Sampling Data for Recovery
Cow and milk concentration 1 day after release termination ~Ci/1
Location I-131 I-132 I-133 I-135 Cs-134 Cs-137 Te-132 Sr-89 Sr-90
NW 6 mi 4.1 E-4 2.2 E-4 8.5 E-4 4.17E-4 1.56E-4 8.10E-5 3.41E-5 5.2E-7 5.4E-8 Phil Randle
NW8.5mi 1. OE-3 5.3E-4 2.0E-3 l.OlE-3 3.78E-4 1. 98E-4 8.3E-5 1. 27E-6 1. 32E-7 Brook Dairy
NNW 13 mi 3.08E-2 1.65E-2 6.0E-2 3.15E-2 1.18E-2 6. 1E-3 2.56E-3 3.91E-5 4.05E-6 Preston Milk
NNW 15 mi 2.94E-3 1.57E-3 5.9E-3 2.98E-3 1.12E-3 5.8E-4 2.45E-4 3.71E-6 3.85E-7 Ernie Hampel
)> Dairl Cows Within 15 Miles of the Plant U'l As of April 1983 ""'"'
Direction Distance Name No. of Cows
NW 6 miles Phil Randle 30
NW 8. 5 miles Brook Diary 75
NW 13 miles Preston Milk 32
NW 15 miles Ernie Hampel 29

Iodine Concentration in Milk:
A method for computing the iodine concentration in milk is:
C(t) = I00
1.86E - 2[exp(-0.114t)-exp{-0.90t)] (28)
where
C{t) = concentration in milk at time t (days) after event I = daily forage consumption by the cow (kg/day or m2/day)
D0
= initial activity present on the forage (pCi/kg)
Notes: Assume that the average dairy cow eats about 50m2 of forage per day. This formula is intended for primary use in projecting the milk activity for cows that are on contaminated feed on Day 1 of an accident and were then removed to clean pasture. The formula would tend to fall apart if the cow continued to eat the contaminated forage. Experts believe that the iodine should start to show up in the milk within 12 hours after ingestion of contaminated forage and the full affect will start to be seen in 24-48 hours.
Example:
1. Determine the total activity of radioiodine secreted into milk. Express this as a fraction of the first day's radioiodine intake by the cow.
2. Determine the fraction of first day's intake by cow delivered per liter if cows were removed from pasture and fed uncontaminated feed 1 day, 2 dayst and 1 week after the initial contamination.
Solution (1)--The first day's radioiodine intake by the cow is 100
so that the normalized equation is:
1.86 x 10⁻² [exp(-0.114t) - exp(-0.90t)]
The total secretion into milk is:
c1 = { c(t)dt 0
= lim 1•86 x 10-2[1 - exp(-0.114t) _ 1 - exp(-0.9t)] 0.114 0.9
= 1.86 X 10-Z (1/0.114 - l/0.90] = 0.14
A. 58

•
Solution (2)--The amounts that would be delivered if the cows were removed from pasture after various time intervals are obtained by inserting specific times into the above integral instead of the infinite upper limit. These evaluations give:
Time Cows Removed From Pasture After Contaminating Event
1 day 2 days 7 days
Value of Time-Dependent Term (in Braces Above)
D.286 0.861 3. 71
Fraction of First Day•s Intake by Cow Delivered by Delivered per liter
5.31E - D3 1.60E - 02 6.91E - 02
Table A.23 gives some limiting activity releases for iodine:
TABLE A.23. limiting Activity Releases Under Poor Meteorological Conditions for PAG Doses of 5 rem (WB) and 25 rem (THY) for Iodine
Dose Factor Source Term(a) ~Ci) for: Isotope Pathway (R-m3/Ci-sec) 5 rem WB 5 rem TRY
I-131 Milk 115,000 44 2.2 Inhalation 395 12,600 630
I-133 Milk 8280 600 30 Inhalation 174 28,80D 1440
(a) Above source term figures represent the total curies released. The very small numbers for milk assume that ~odine is deposited on one small field and eaten by one cow whose milk is consumed by one person.
Thyroid Commitment Due to Inhalation of Iodine: Table A.24 provides conversion factors for computing lifetime thyroid dose commitment as a result of breathing contaminated air at various times after reactor trip (activity is in pCi gross iodine- not D.E 1-131):
A. 59
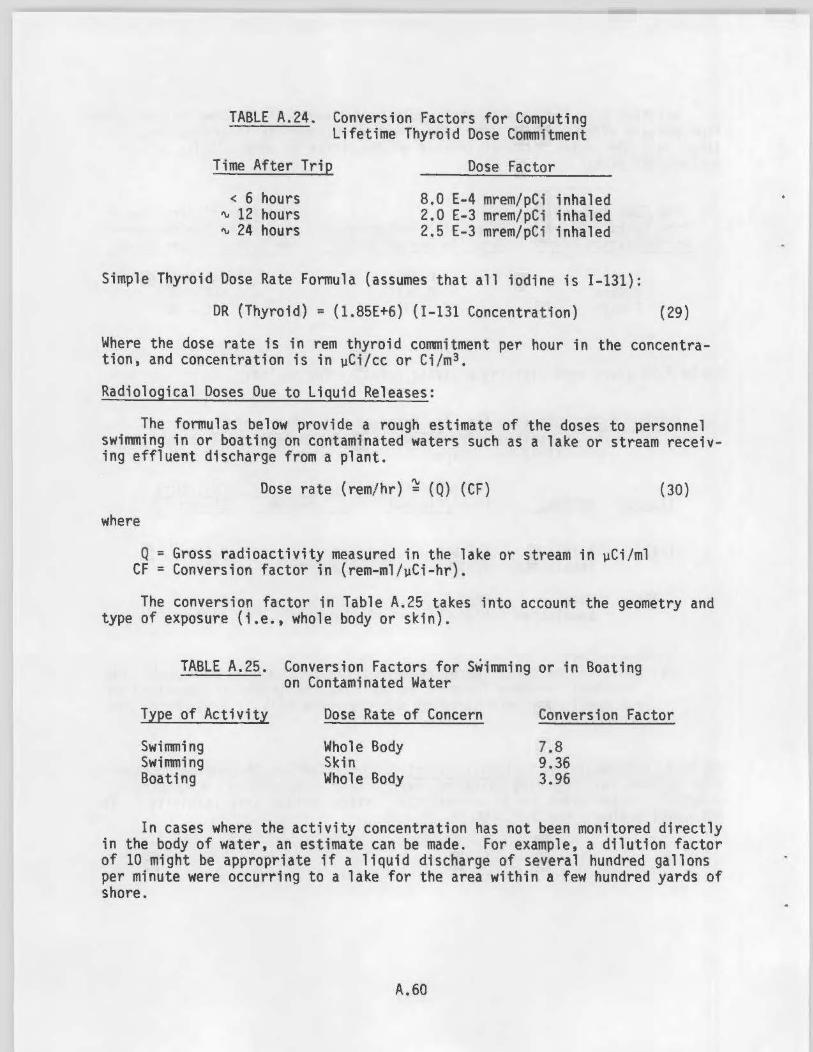
TABLE A.24. Conversion Factors for Computing lifetime Thyroid Dose Commitment
Time After Trip
< 6 hours "' 12 hours "' 24 hours
Dose Factor
8.0 E-4 mrem/pCi inhaled 2.0 E-3 mrem/pCi inhaled 2.5 E-3 mrem/pCi inhaled
Simple Thyroid Dose Rate Formula (assumes that all iodine is 1-131):
DR (Thyroid) = (1.85E+6) {1-131 Concentration) (29)
Where the dose rate is in rem thyroid commitment per hour in the concentration, and concentration is in ~Ci/cc or Cifm3.
Radiological Doses Oue to liquid Releases:
The formulas below provide a rough estimate of the doses to personnel swimming in or boating on contaminated waters such as a lake or stream receiving effluent discharge from a plant.
Dose rate (rem/hr) ~ (Q) (CF)
where
Q = Gross radioactivity measured in the lake or stream in ~Ci/ml CF =Conversion factor in (rem-ml/~Ci-hr).
(30)
The conversion factor in Table A.2S takes into account the geometry and type of exposure (i.e., whole body or skin).
TABLE A.25. Conversion Factors for Swimming or in Boating on Contaminated Water
Type of Activity
Swimming Swimming Boating
Dose Rate of Concern
Whole Body Skin Whole Body
Conversion Factor
7.8 9.36 3.96
In cases where the activity concentration has not been monitored directly in the body of water, an estimate can be made. For example, a dilution factor of 10 might be appropriate if a liquid discharge of several hundred gallons per minute were occurring to a lake for the area within a few hundred yards of shore.
A.60

Example:
A radwaste discharge has resulted in lakewater contamination of 0.5 ~Ci/ml. A man was known to be swimming in the lake for about two hours after the contamination occurred. What is his calculated dose to the whole body?
Dose rate • (0.5 ~Ci/ml) (7.8 rem-ml/~Ci-hr) = 3.9 rem/hr Dose= (3.9 rem/hr) (2 hours) = 7.8 rem Whole-Body Exposure
A.61


NRC fORM 335 12 841
U I . NUCLEAIIIIIGULATOIIY CO-ISSION
NRCM 1102. 3201.3202 BIBLIOGRAPHIC DATA SHEET
SEE INSTRUCTIONS ON THE REVERS£
2. TITLE AND SUBTITLE
Report to the NRC on Guidtnce for Preparing Scenarios for Emergency Preparedness Exercises at Nuclear Ge~erating Stations
Ora ft Reoort for CommPnt ~ AUTHORIS)
G.F. Martin, E.E. Hickey, M.P. Moeller, PNL D. H. Schultz, G.W. Bethke, Comex Corporation
7 PERFORMING OllvA•IIZATION NAME AND MAILII'IG ADDRESS (/nclut»Z!f> C-1
Pacific Northwest Laboratory Richland, WA 99352
Comex Corporation 1419 Sweetwater Loop Olympia, WA 98502
10 sPONSORING ORGAN IZATION NAME ANO MA ILING ADDRESS (/~~elu* Z1p C-1
1 REPORT NUMIIER IA11•.-<II>r T/DC. •dd Vol No ' ' •nvl
NUREG/CR-3365 Draft PNL-4758
3 lEAVE &LANK
4 DATe REPORT COMPlETED
MONTH I YEAR
March 1986 6. DATE REPORT ISSOED
MONTH YEAR
March 1986 8 PROJECT/TASK/WORK UIIIT NUMBER
40-1 0-01-03 9 FIN OR GRANT NUMBER
82311
111 TYPE OF REPORT
Division of Emergency Preparedness and Office of Inspection and Enforcement U.S. Nuclear Regulatory Commission Washington, D.C. 20555
Engineering Respons~ Technical b-P=E~RI~OD-C~O~VE=R~EO~(/~nc~~-~~~-.~~-~~-------------
12 SUPPLEMENTARY NOTES
13 ABSTRACT (200 wordt or Ioiii
A scenario guidance handbook was prepared to assist emergency planners in developing scenarios for emergency preparedness exercises at nuclear power plants. The handbook provides guidance for the development of the objectives of an exercise, the descriptions of scenario events and responses, and the instructions to the participants. Information concerning implementation of the scenario, critiques and findings, and generation and fonmat of scenario data are also included. Finally, examples of manual calculational techniques for producing radiological data are included as an appendix.
1• DOCUMENT ANALYS IS - a KEYWORDS/ DESCR IPTORS
emergency preparedness scenarios exercises nuclear power
b tOENTIFtERS/OPEN.ENOEO TER"'S
radiological data guidance handbook
15 AVAI LABI LilY STATEMENT
Unlimited 16 SECURITYCLASSIF ICATION
(Th,. poffel
Unclassified (Th,_rl
Unclassified 17 NUMBER Of PAGES
18 PR ICE