Embed Size (px)
Citation preview

REPORT UPDATE:
Effects of COVID-19 on Fashion, Apparel, and Accessory Ecommerce UPDATE: MAY 27TH 2020

About This ReportAt Nosto, we’re closely tracking real-time changes in the ecommerce landscape due to the global COVID-19 pandemic via our network of thousands of partner retailers.
This data snapshot looks at data for the Fashion, Apparel & Accessory industry, originally one of the hardest hit industries from the pandemic, from the 1st of March 2020 through the 26th of May 2020.
Fashion sales, visits, orders, and conversion rates are all still up year-over-year. All four of these KPIs seem to be staying relatively flat now after weeks of dramatic fluctuation.
Average order value remains down year-over-year and actually dropped dramatically over the past week — which interestingly continues to mirror the week-to-week pattern seen in 2019.
At this point, it appears sales, visits, orders, and conversion rates for fashion, apparel, and accessory ecommerce will have grown year-over-year despite a few turbulent weeks due to the pandemic shutdowns.

Notes on MethodologyTo generate useful comparisons, all YOY analysis is based on a 7-day rolling median, baselined to a point in time (T= 0) where the days of the week align between 2020 and 2019. This is because ecommerce activity varies depending on the day of the week and across different seasons, and the general trend is that ecommerce sales and activity are increasing overall.
The full dataset for the May 26th snapshot covers a period of 86 days across 271 merchants that represent a good cross-section of the Fashion, Apparel & Accessory industry.
For 2020, the analysis begins on Sunday March 1st, 2020 (Day 0 for 2020) and goes through Tuesday May 26th. The comparison period for 2019 begins on Sunday March 3rd 2019 (Day 0 for 2019) and goes through Tuesday May 28th, 2019. Note that chart Y-axes vary where appropriate.
Since the equivalent time period in 2019 had limited change in underlying metrics with the exception of the typical decrease around the April holidays of Easter and Passover, it’s a useful ongoing “point in time” snapshot to compare against to observe the effects of COVID-19.
SALES CHANGE VS 2019 AOV change by 19th March 2020 vs 201
United States 50%
United Kingdom 44%
France 21%
Germany 42%
Sweden -16%
ANZ 30%
Every region except the United Kingdom and Germany saw a decrease in sales week-over-week.
Sales are now down significantly year-over-year in Sweden, which is strange considering how much sales are up in all other regions.
With the exception of Sweden, sales are up on average almost 38% year-over-year in the regions, which is huge growth. The higher traffic and greater amount of orders seem to easily be making up for the decrease in average order value.
SALES DECREASED WEEK-OVER-WEEK FOR MOST REGIONS WITH SOME EXCEPTIONS AGAIN:
VISITS CHANGE VS 2019 AOV change by 19th March 2020 vs 201
United States 19%
United Kingdom 26%
France 1%
Germany 15%
Sweden 3%
ANZ 2%
The United States and United Kingdom saw only slight growth week-to-week.
Sweden and France both went from down year-over-year to up, with France making a drastic rebound week-to-week.
Germany and Australia and New Zealand both saw quite dramatic decreases in visits week-over-week. Interestingly, these two regions saw the largest increase in visits year-over-year out of any of the regions being tracked.
VISITS INCREASED WEEK-OVER-WEEK FOR MOST AND PUT EVERYONE UP YOY:

AOV CHANGE VS 2019 AOV change by 19th March 2020 vs 201
United States -9%
United Kingdom -4%
France -5%
Germany -5%
Sweden -5%
ANZ 6%
AVERAGE ORDER VALUE (AOV) INCREASES FOR MANY BUT MOSTLY STAYS DOWN YOY:
CR CHANGE VS 2019 AOV change by 19th March 2020 vs 201
United States 40%
United Kingdom 8%
France 18%
Germany 24%
Sweden 7%
ANZ -20%
CONVERSION RATE (CR) IS DOWN WEEK-TO-WEEK FOR MOST BUT REMAINS STRONG YOY FOR MOST:
Conversion rates remain up YOY in all regions except Australia and New Zealand where the conversion rate tanked over the past week.
Germany was the only region that saw an increase in conversion rate week-to-week.
France and Sweden, like Australia and New Zealand, saw relatively dramatic drops in their conversion rates over the past week but continue to see a comfortable increase YOY. The United States and United Kingdom both saw smaller change in their conversion rates week-to-week.
The United States and the United Kingdom saw AOV increase slightly week-over-week, but AOV remains down YOY in both regions.
Germany and France saw AOV stay flat week-to-week while Sweden saw a minuscule decrease over the past week.
Australia and New Zealand saw AOV increase enough over the past week that it is now up YOY for the region. This region continues to be the only one that has been seeing AOV up YOY regularly since the beginning of the pandemic shutdowns.

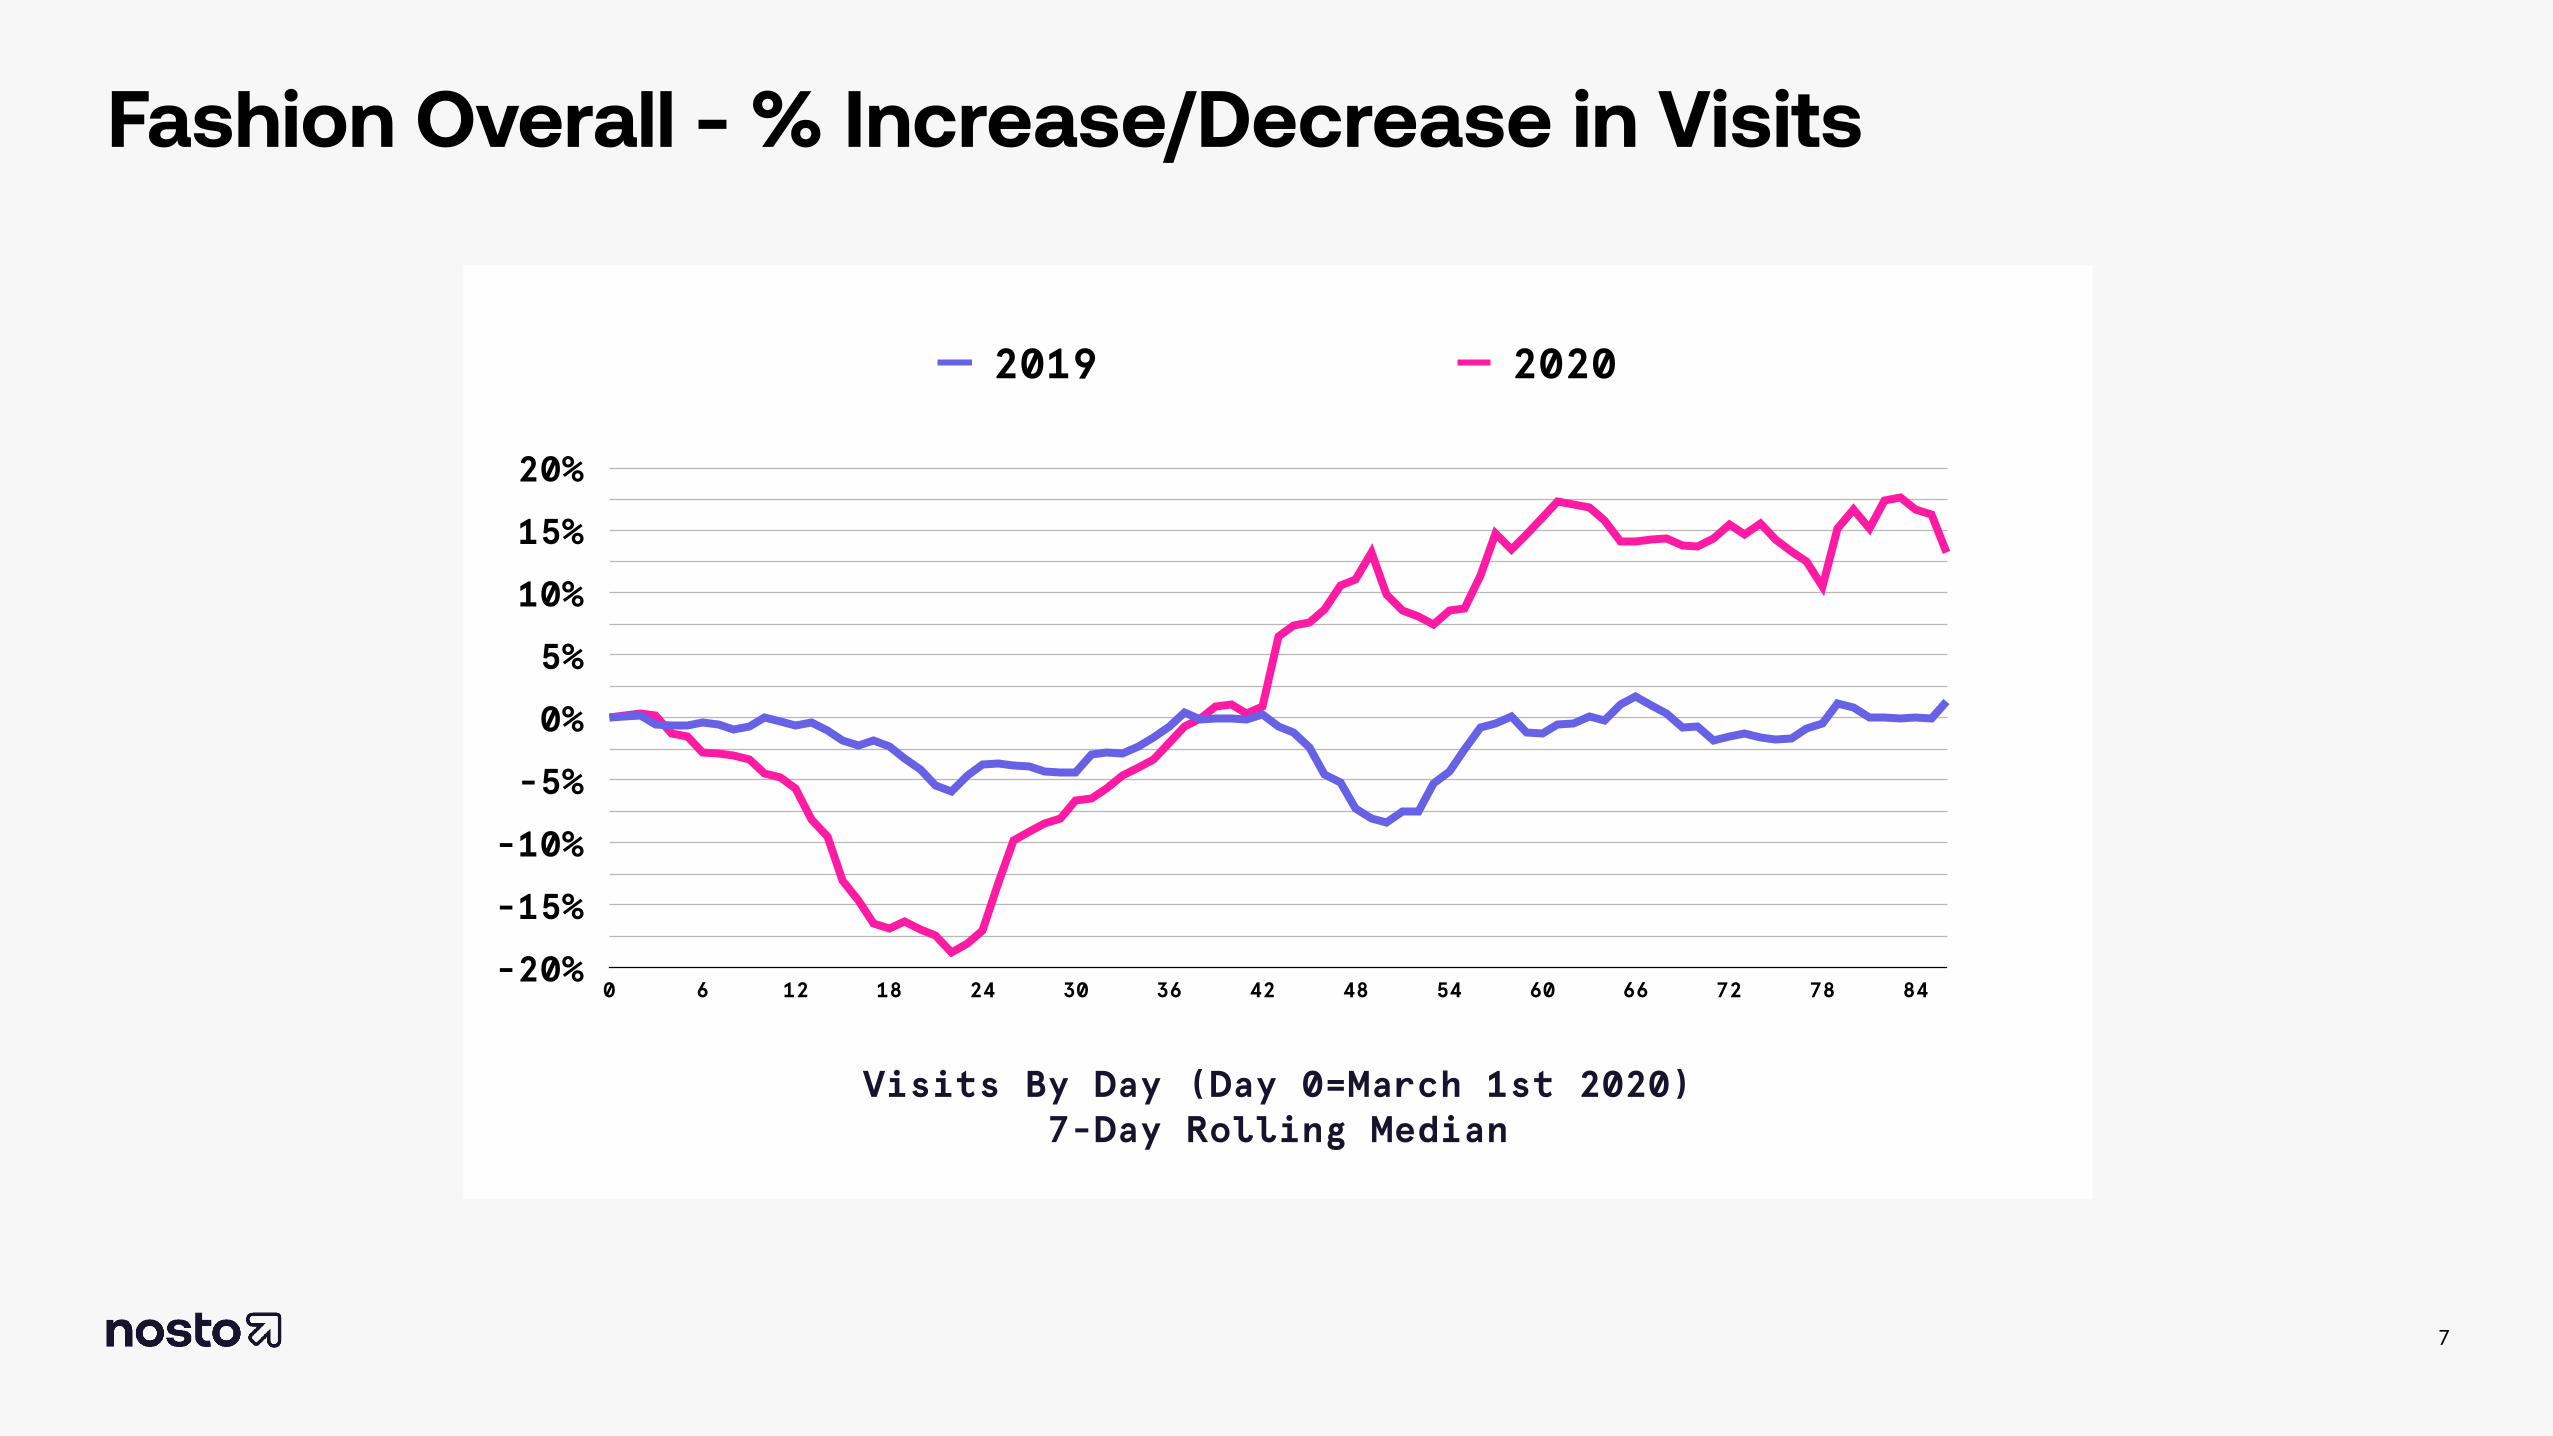
Global Data – Aggregated TrendsLooking back on the overall trends of fashion ecommerce KPIs since March 1st, we saw a dramatic drop and then rebound at the beginning of the shutdowns for all metrics other than average order value.
Orders and total sales saw the most dramatic change between their low point and high point, by far. Interestingly, these two KPIs seem like they will end up with the largest growth year-over-year.
With visits, orders, and sales all still up year-over-year as countries begin to reopen, it does seem like fashion ecommerce is going to have benefitted from the closing of physical stores.
As fashion retailers across the globe continue to suffer from the economic fallout of entire countries shutting down to protect their citizens from COVID-19, it appears to be a safe bet to dedicate more effort into ecommerce operations as shoppers move more online.
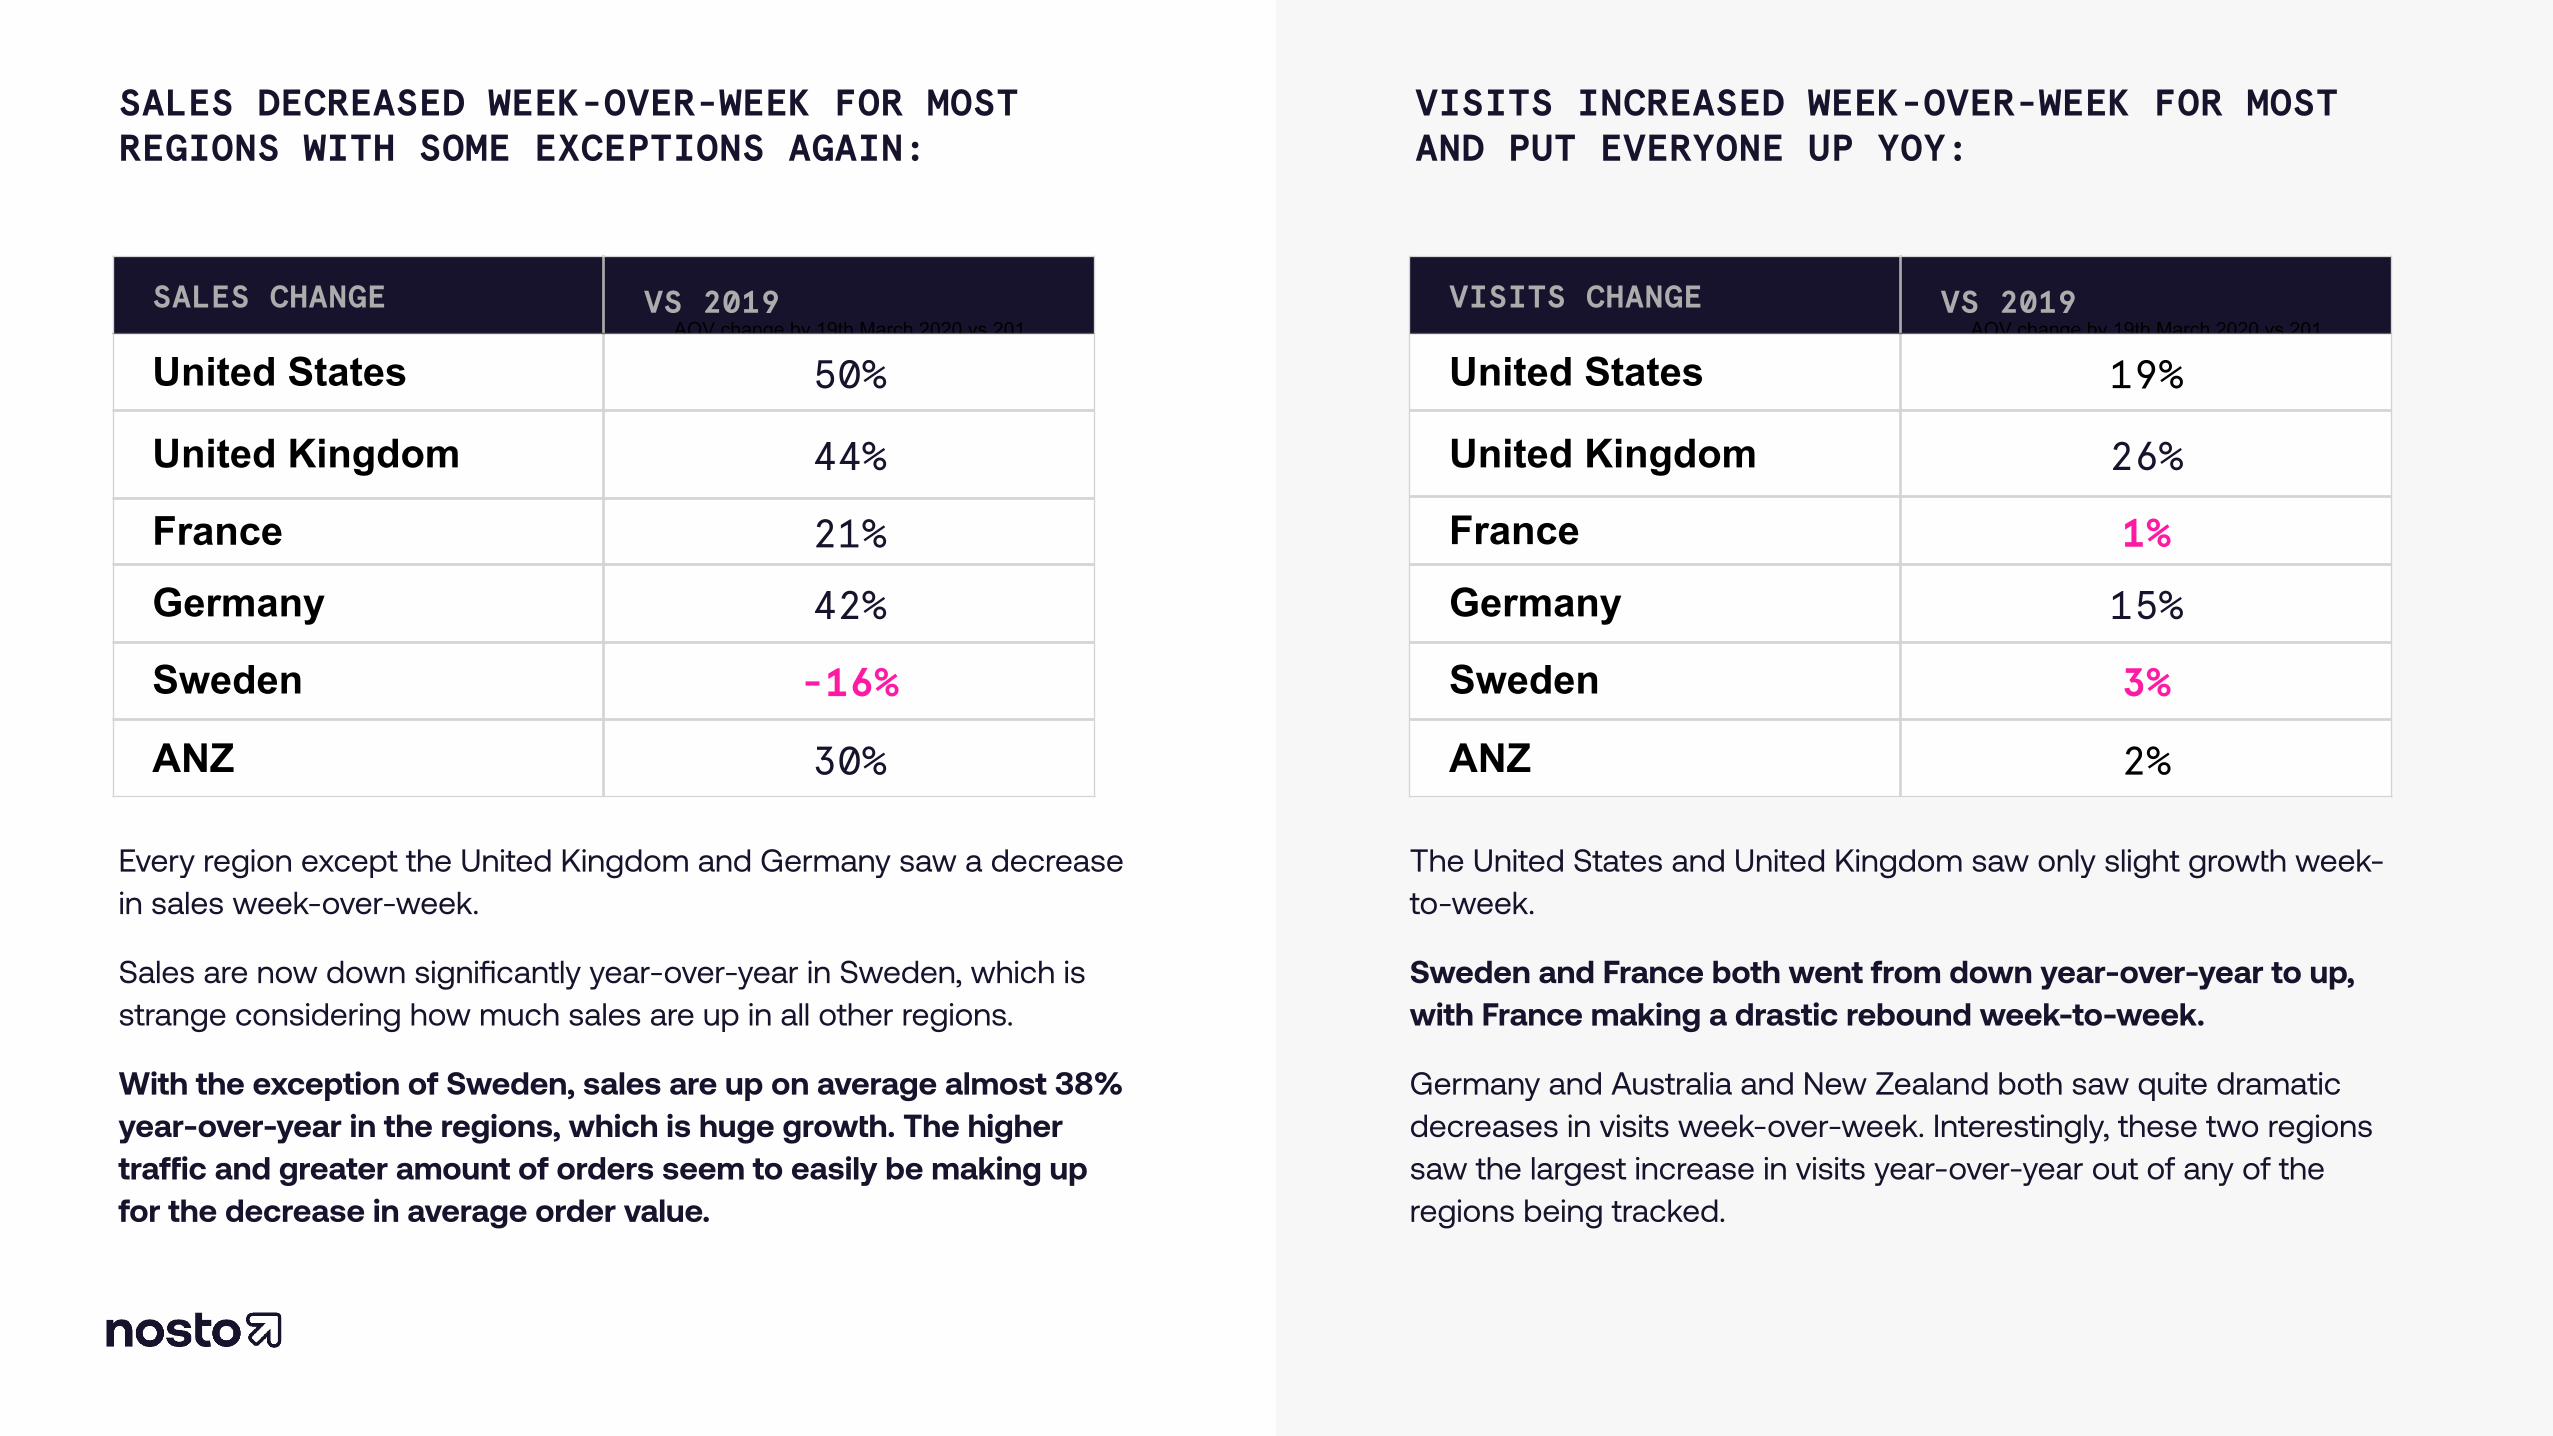
Fashion Overall - % Increase/Decrease in Visits
7
-20%
-15%
-10%
-5%
0%
5%
10%
15%
20%
Visits By Day (Day 0=March 1st 2020) 7-Day Rolling Median
0 6 12 18 24 30 36 42 48 54 60 66 72 78 84
2019 2020
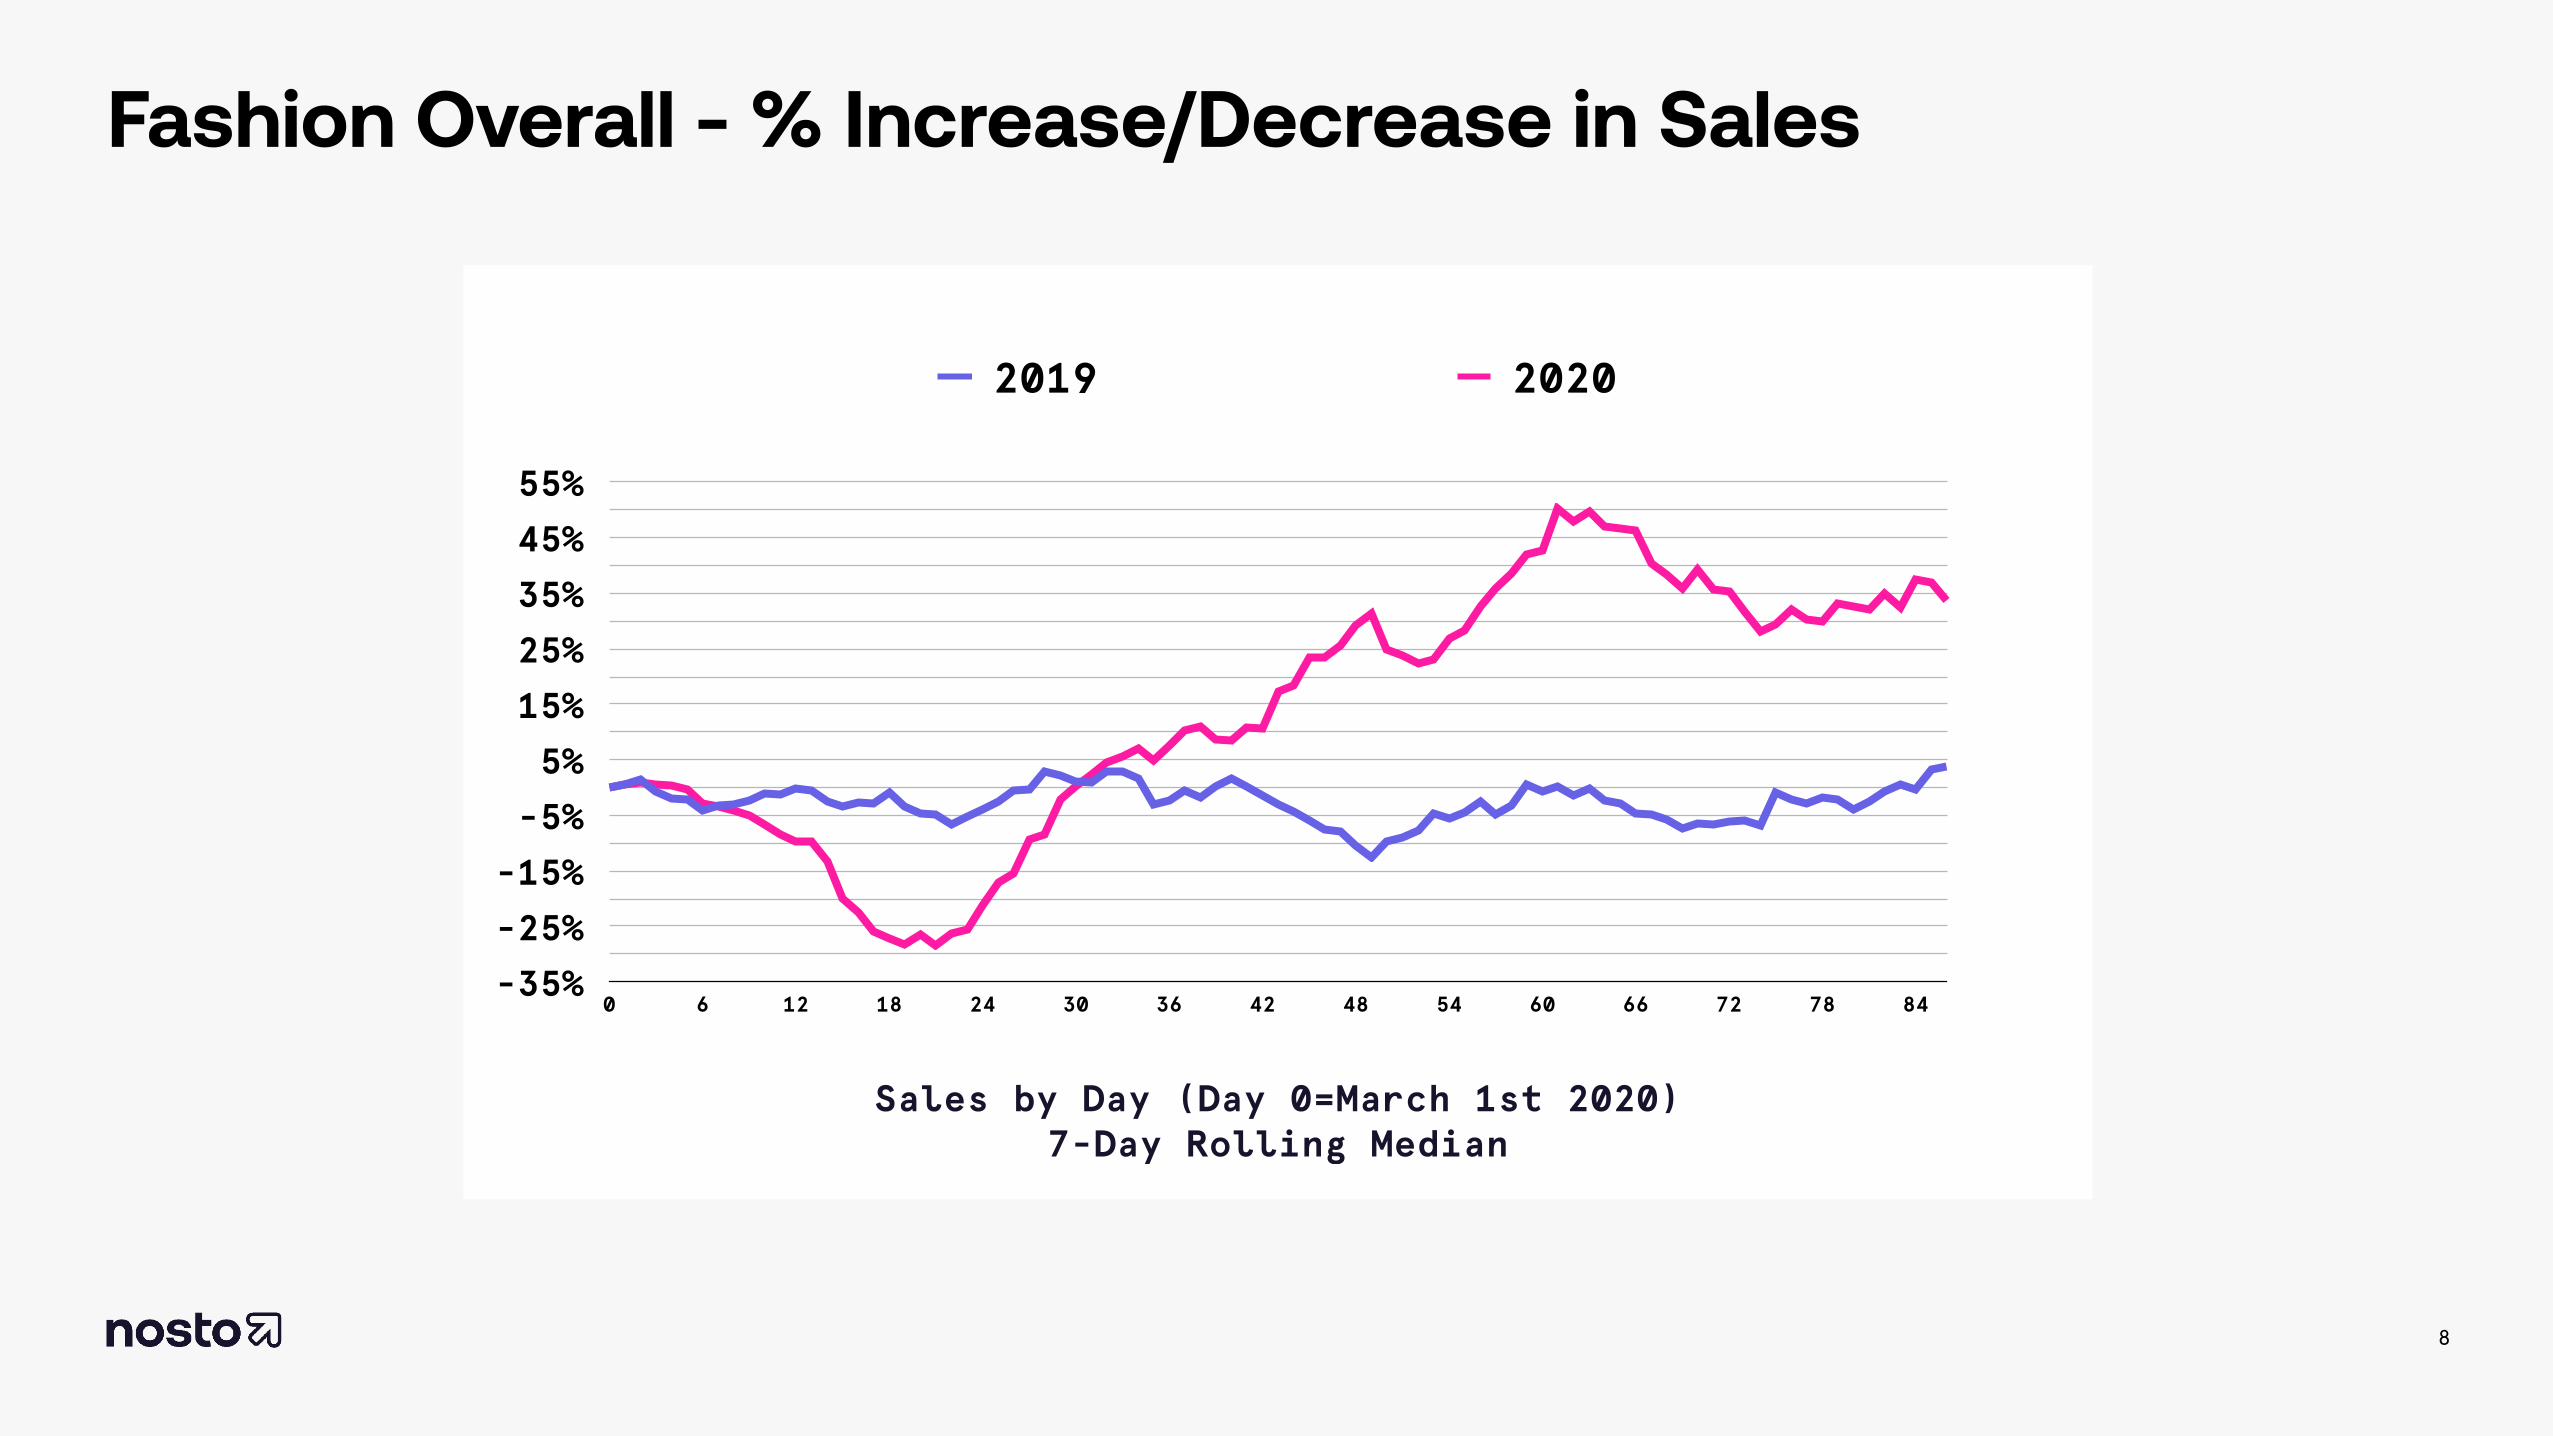
Fashion Overall - % Increase/Decrease in Sales
8
-35%
-25%
-15%
-5%
5%
15%
25%
35%
45%
55%
Sales by Day (Day 0=March 1st 2020) 7-Day Rolling Median
0 6 12 18 24 30 36 42 48 54 60 66 72 78 84
2019 2020
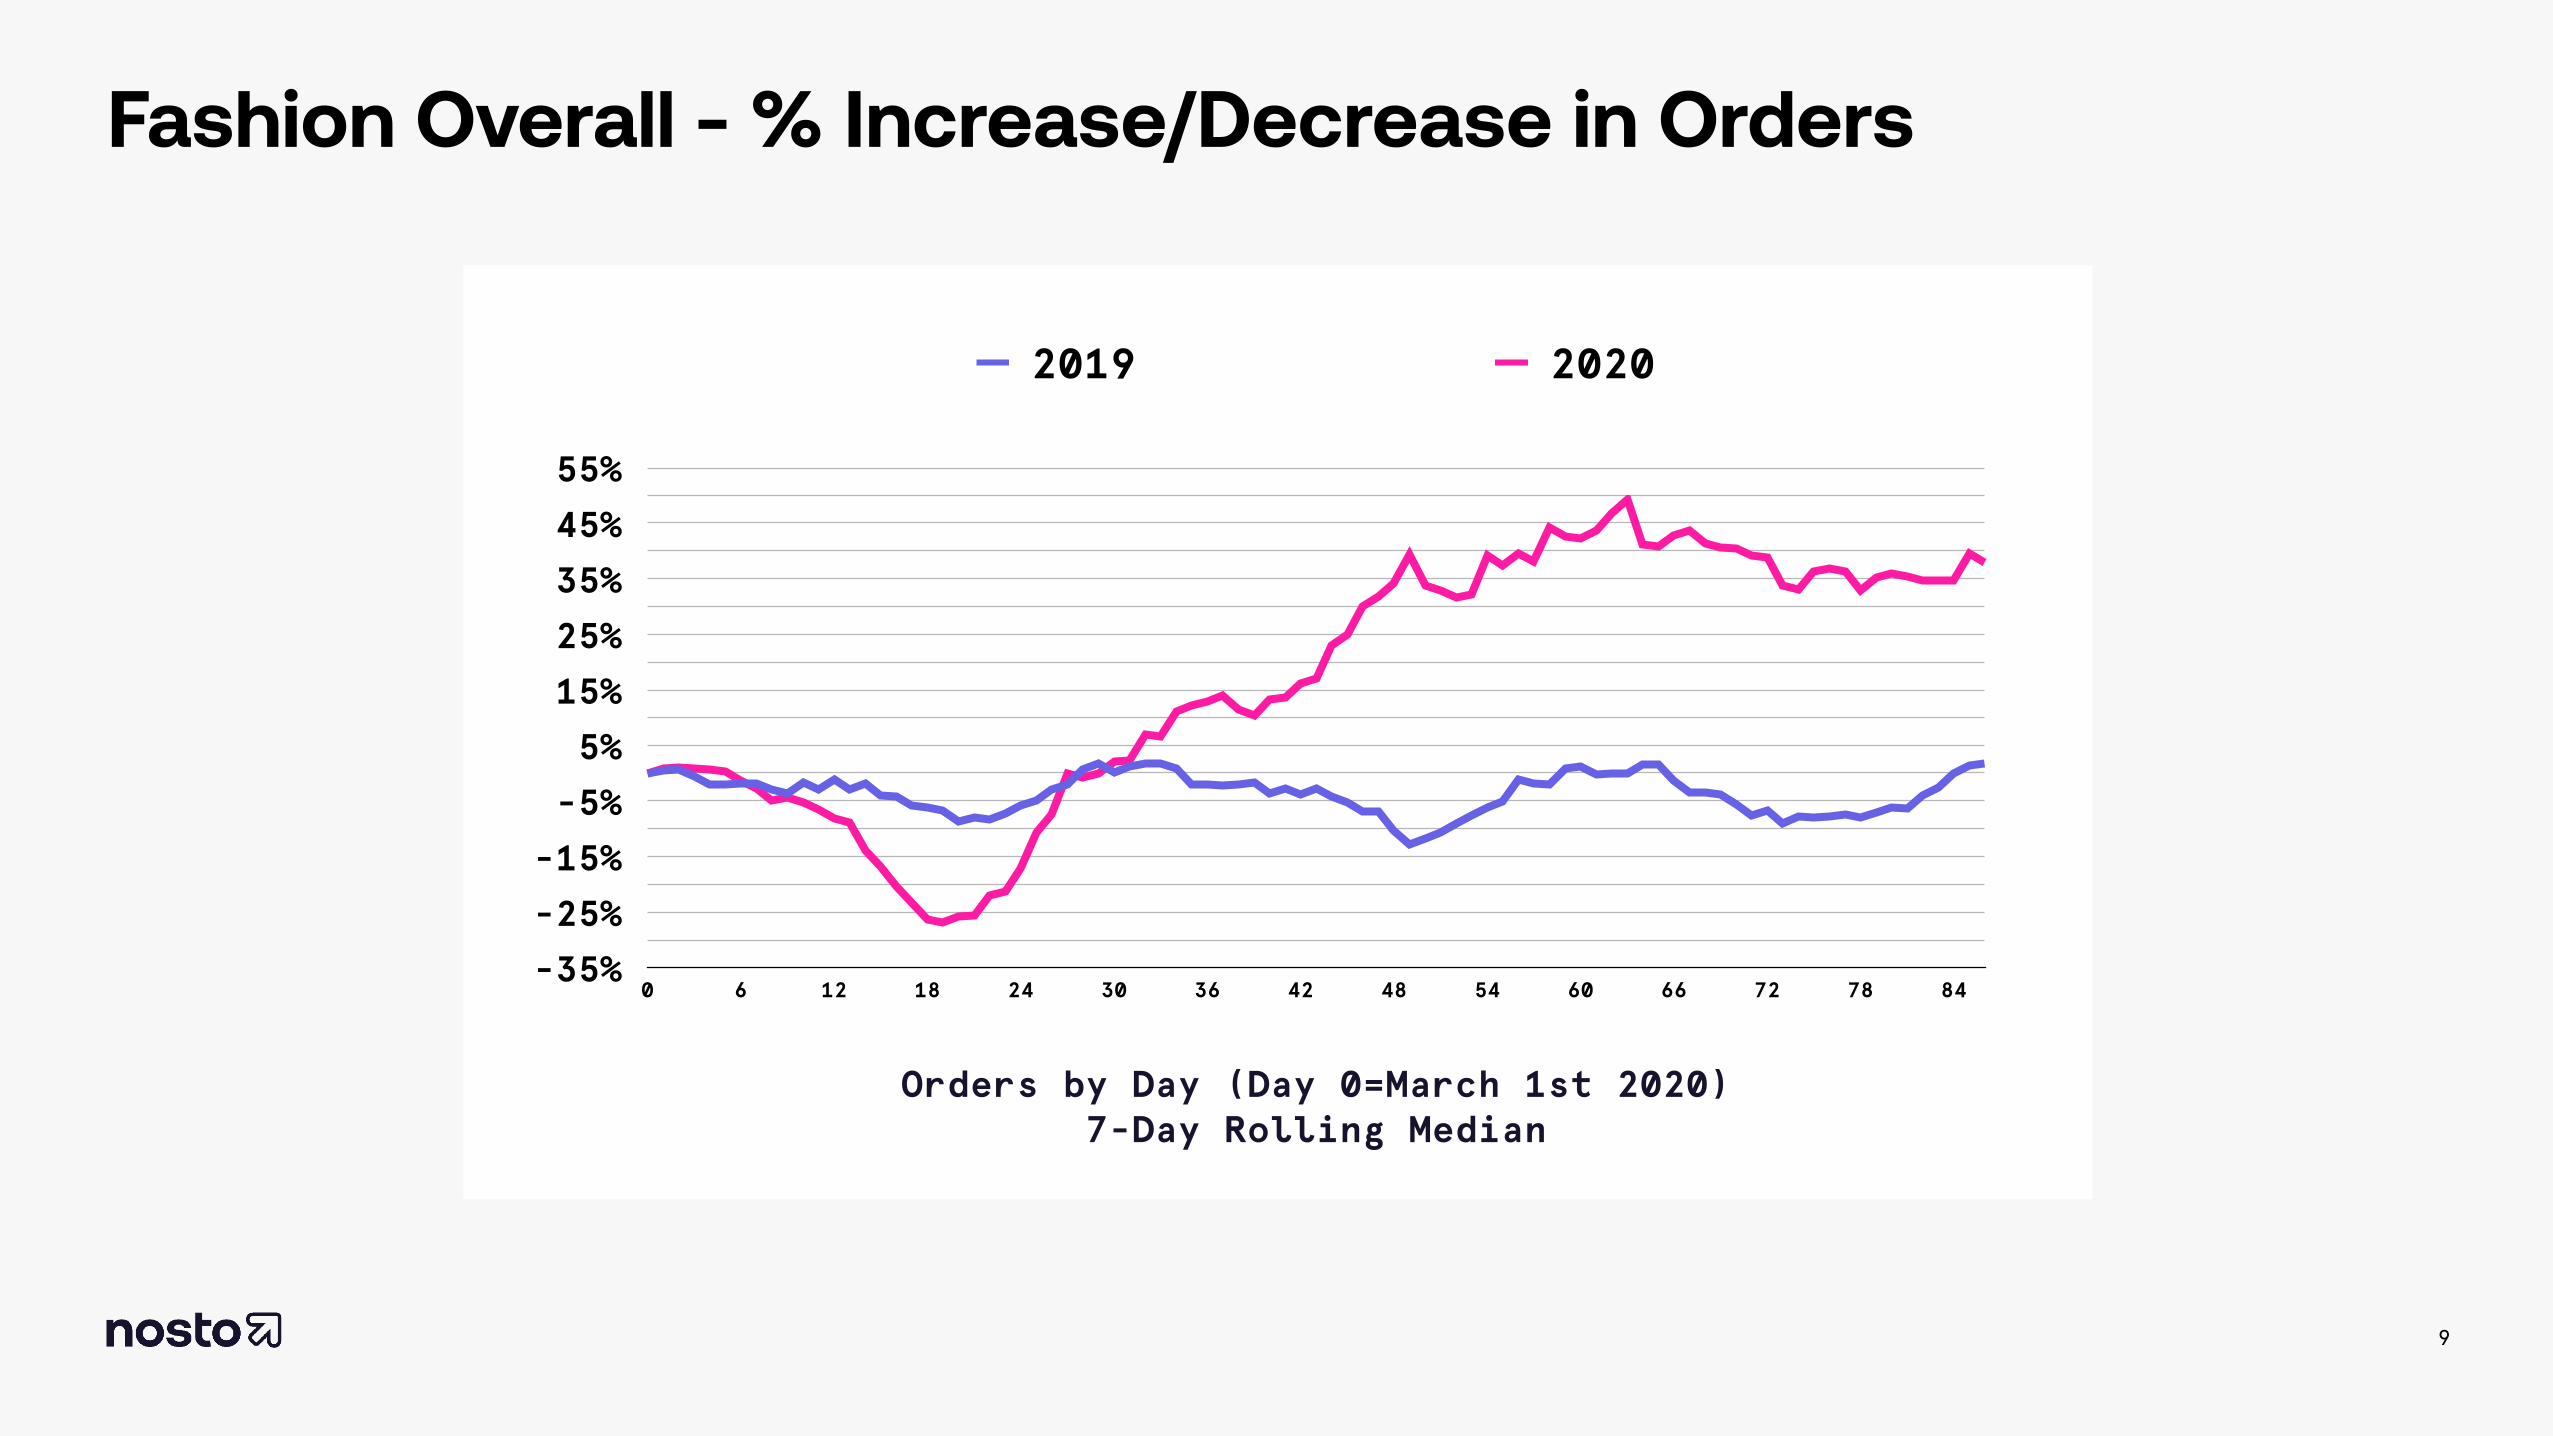
Fashion Overall - % Increase/Decrease in Orders
9
-35%
-25%
-15%
-5%
5%
15%
25%
35%
45%
55%
Orders by Day (Day 0=March 1st 2020) 7-Day Rolling Median
0 6 12 18 24 30 36 42 48 54 60 66 72 78 84
2019 2020
Average order value (AOV) continues to be down year-over-year (YOY) and seems like it will remain there.
Conversion Rate (CR), on the other hand, has continued to stay up YOY, and has definitely reached plateau for now.
If the pattern holds, fashion retailers should operate under the assumption that there will be more shoppers buying things online
but each order will be less valuable than previously.
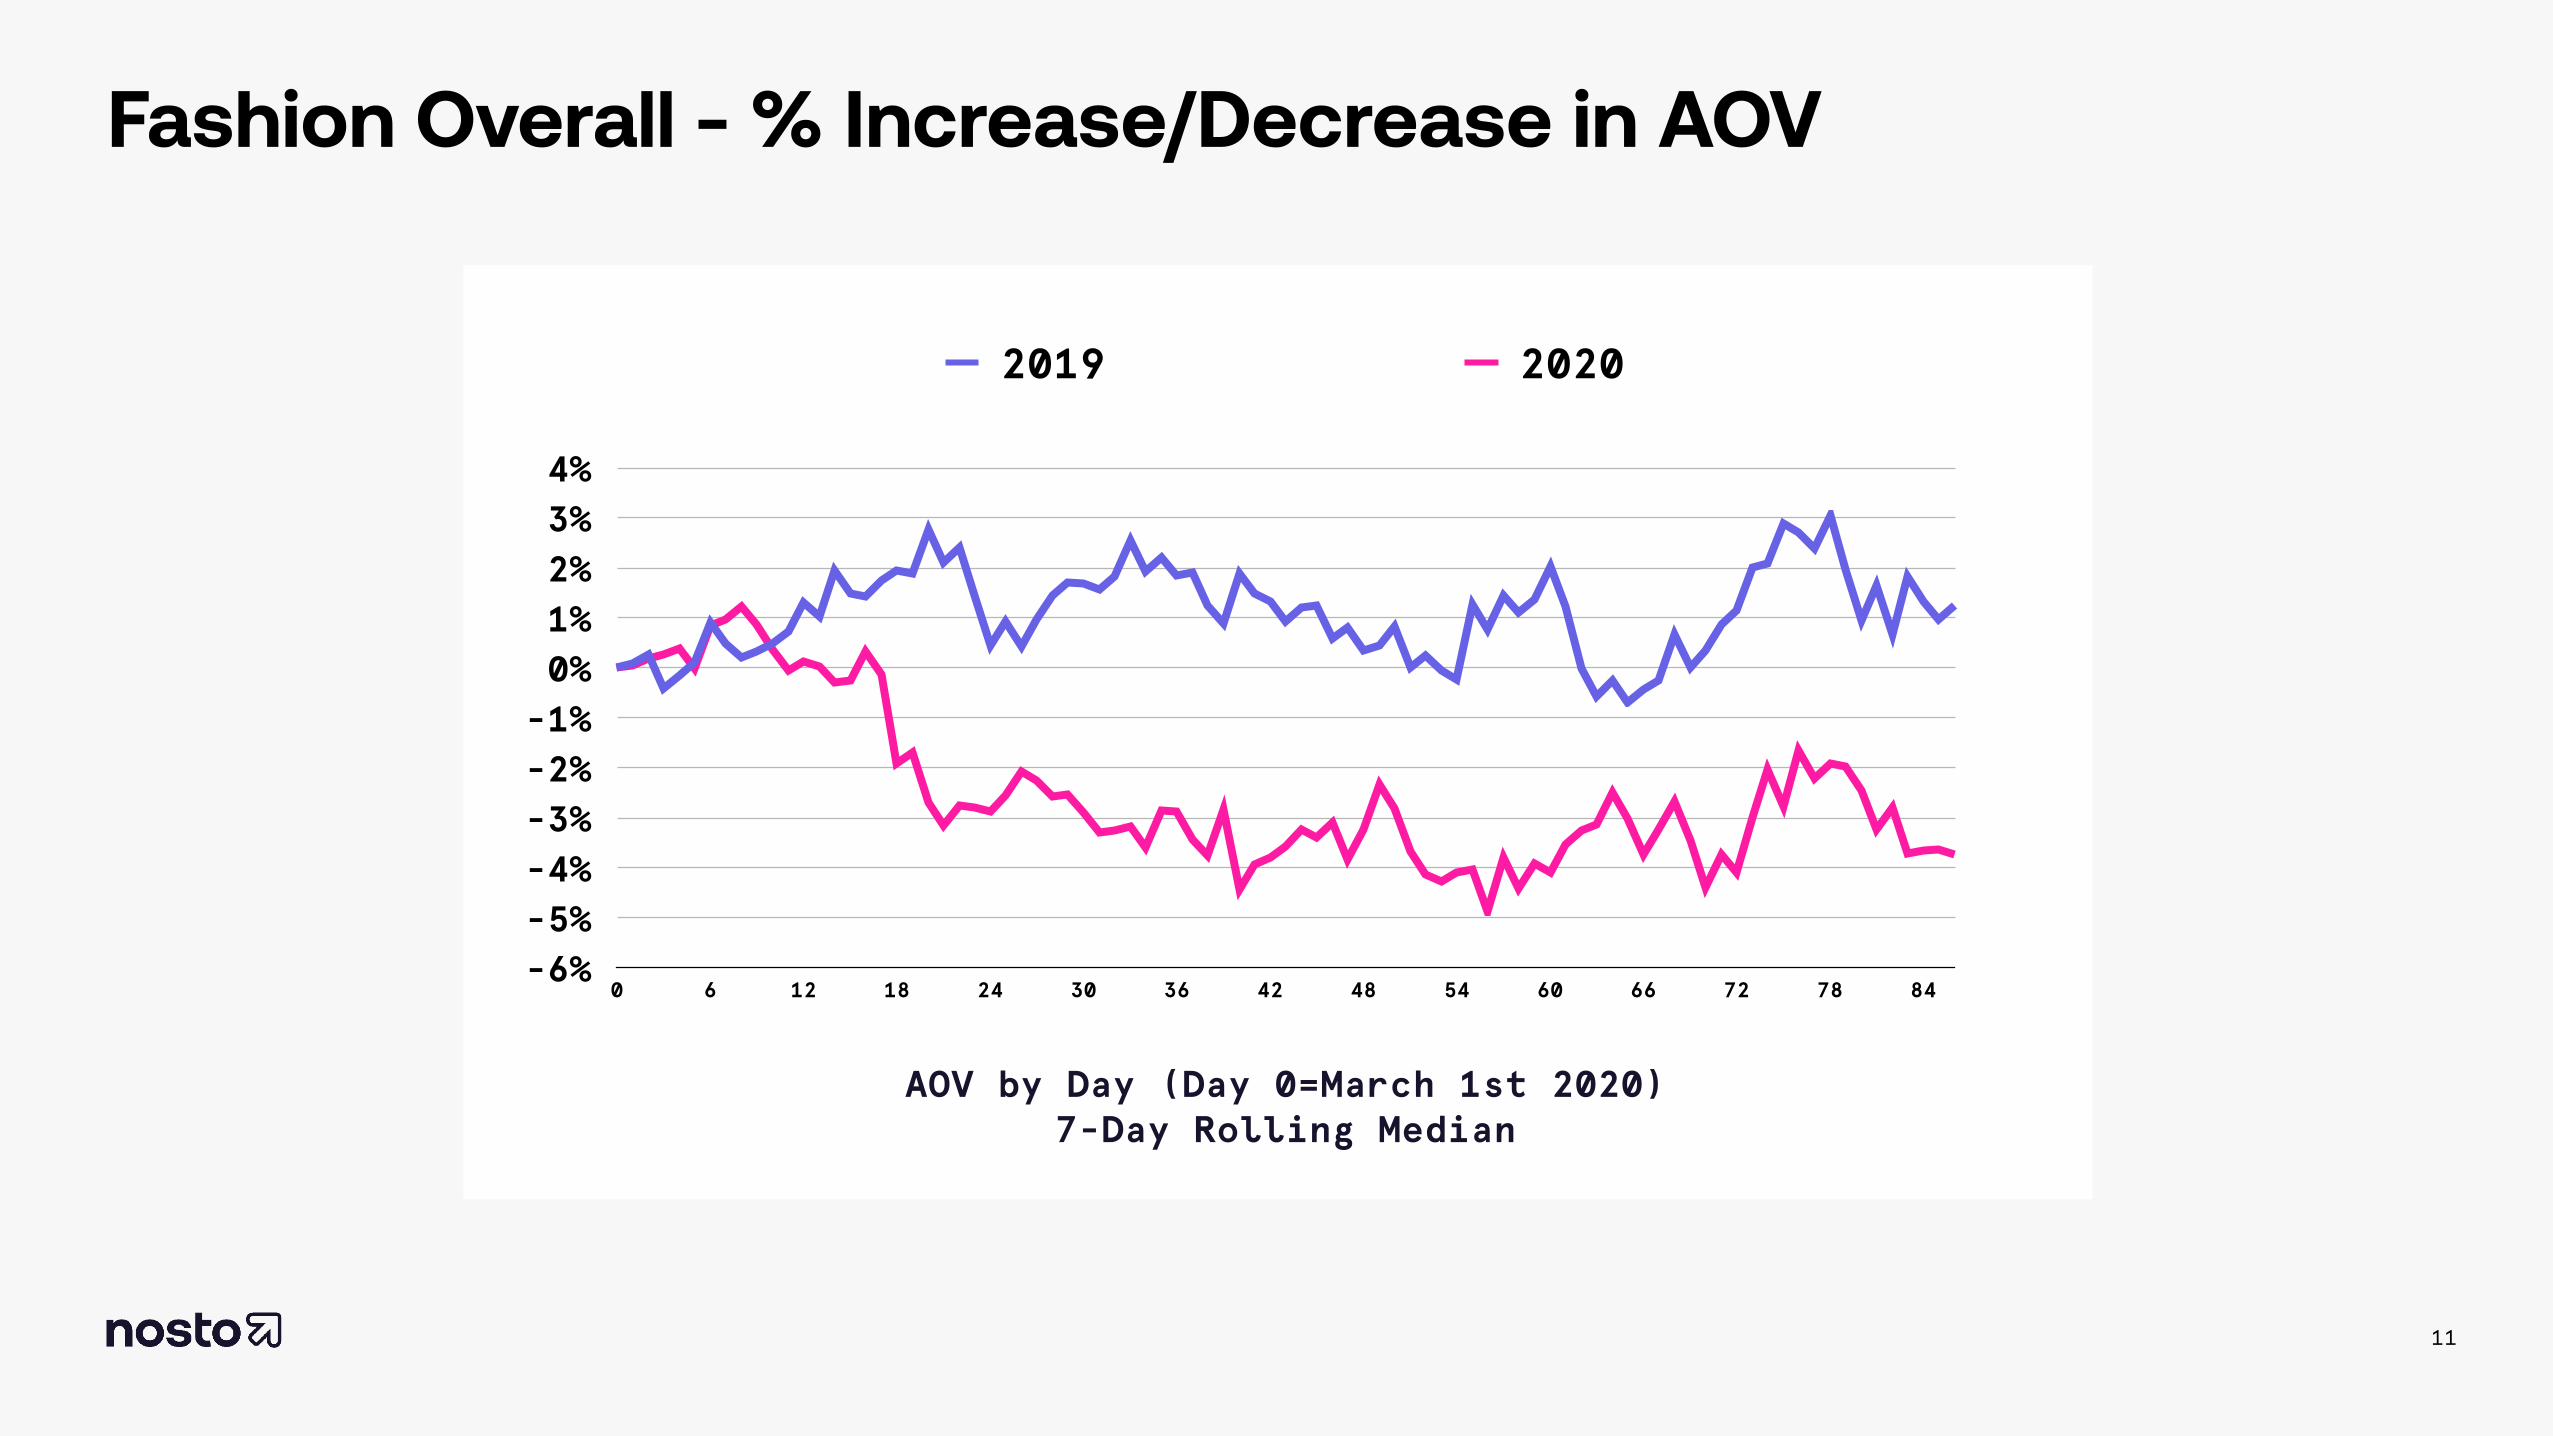
Fashion Overall - % Increase/Decrease in AOV
11
-6%-5%-4%-3%-2%-1%0%1%2%3%4%
AOV by Day (Day 0=March 1st 2020) 7-Day Rolling Median
0 6 12 18 24 30 36 42 48 54 60 66 72 78 84
2019 2020
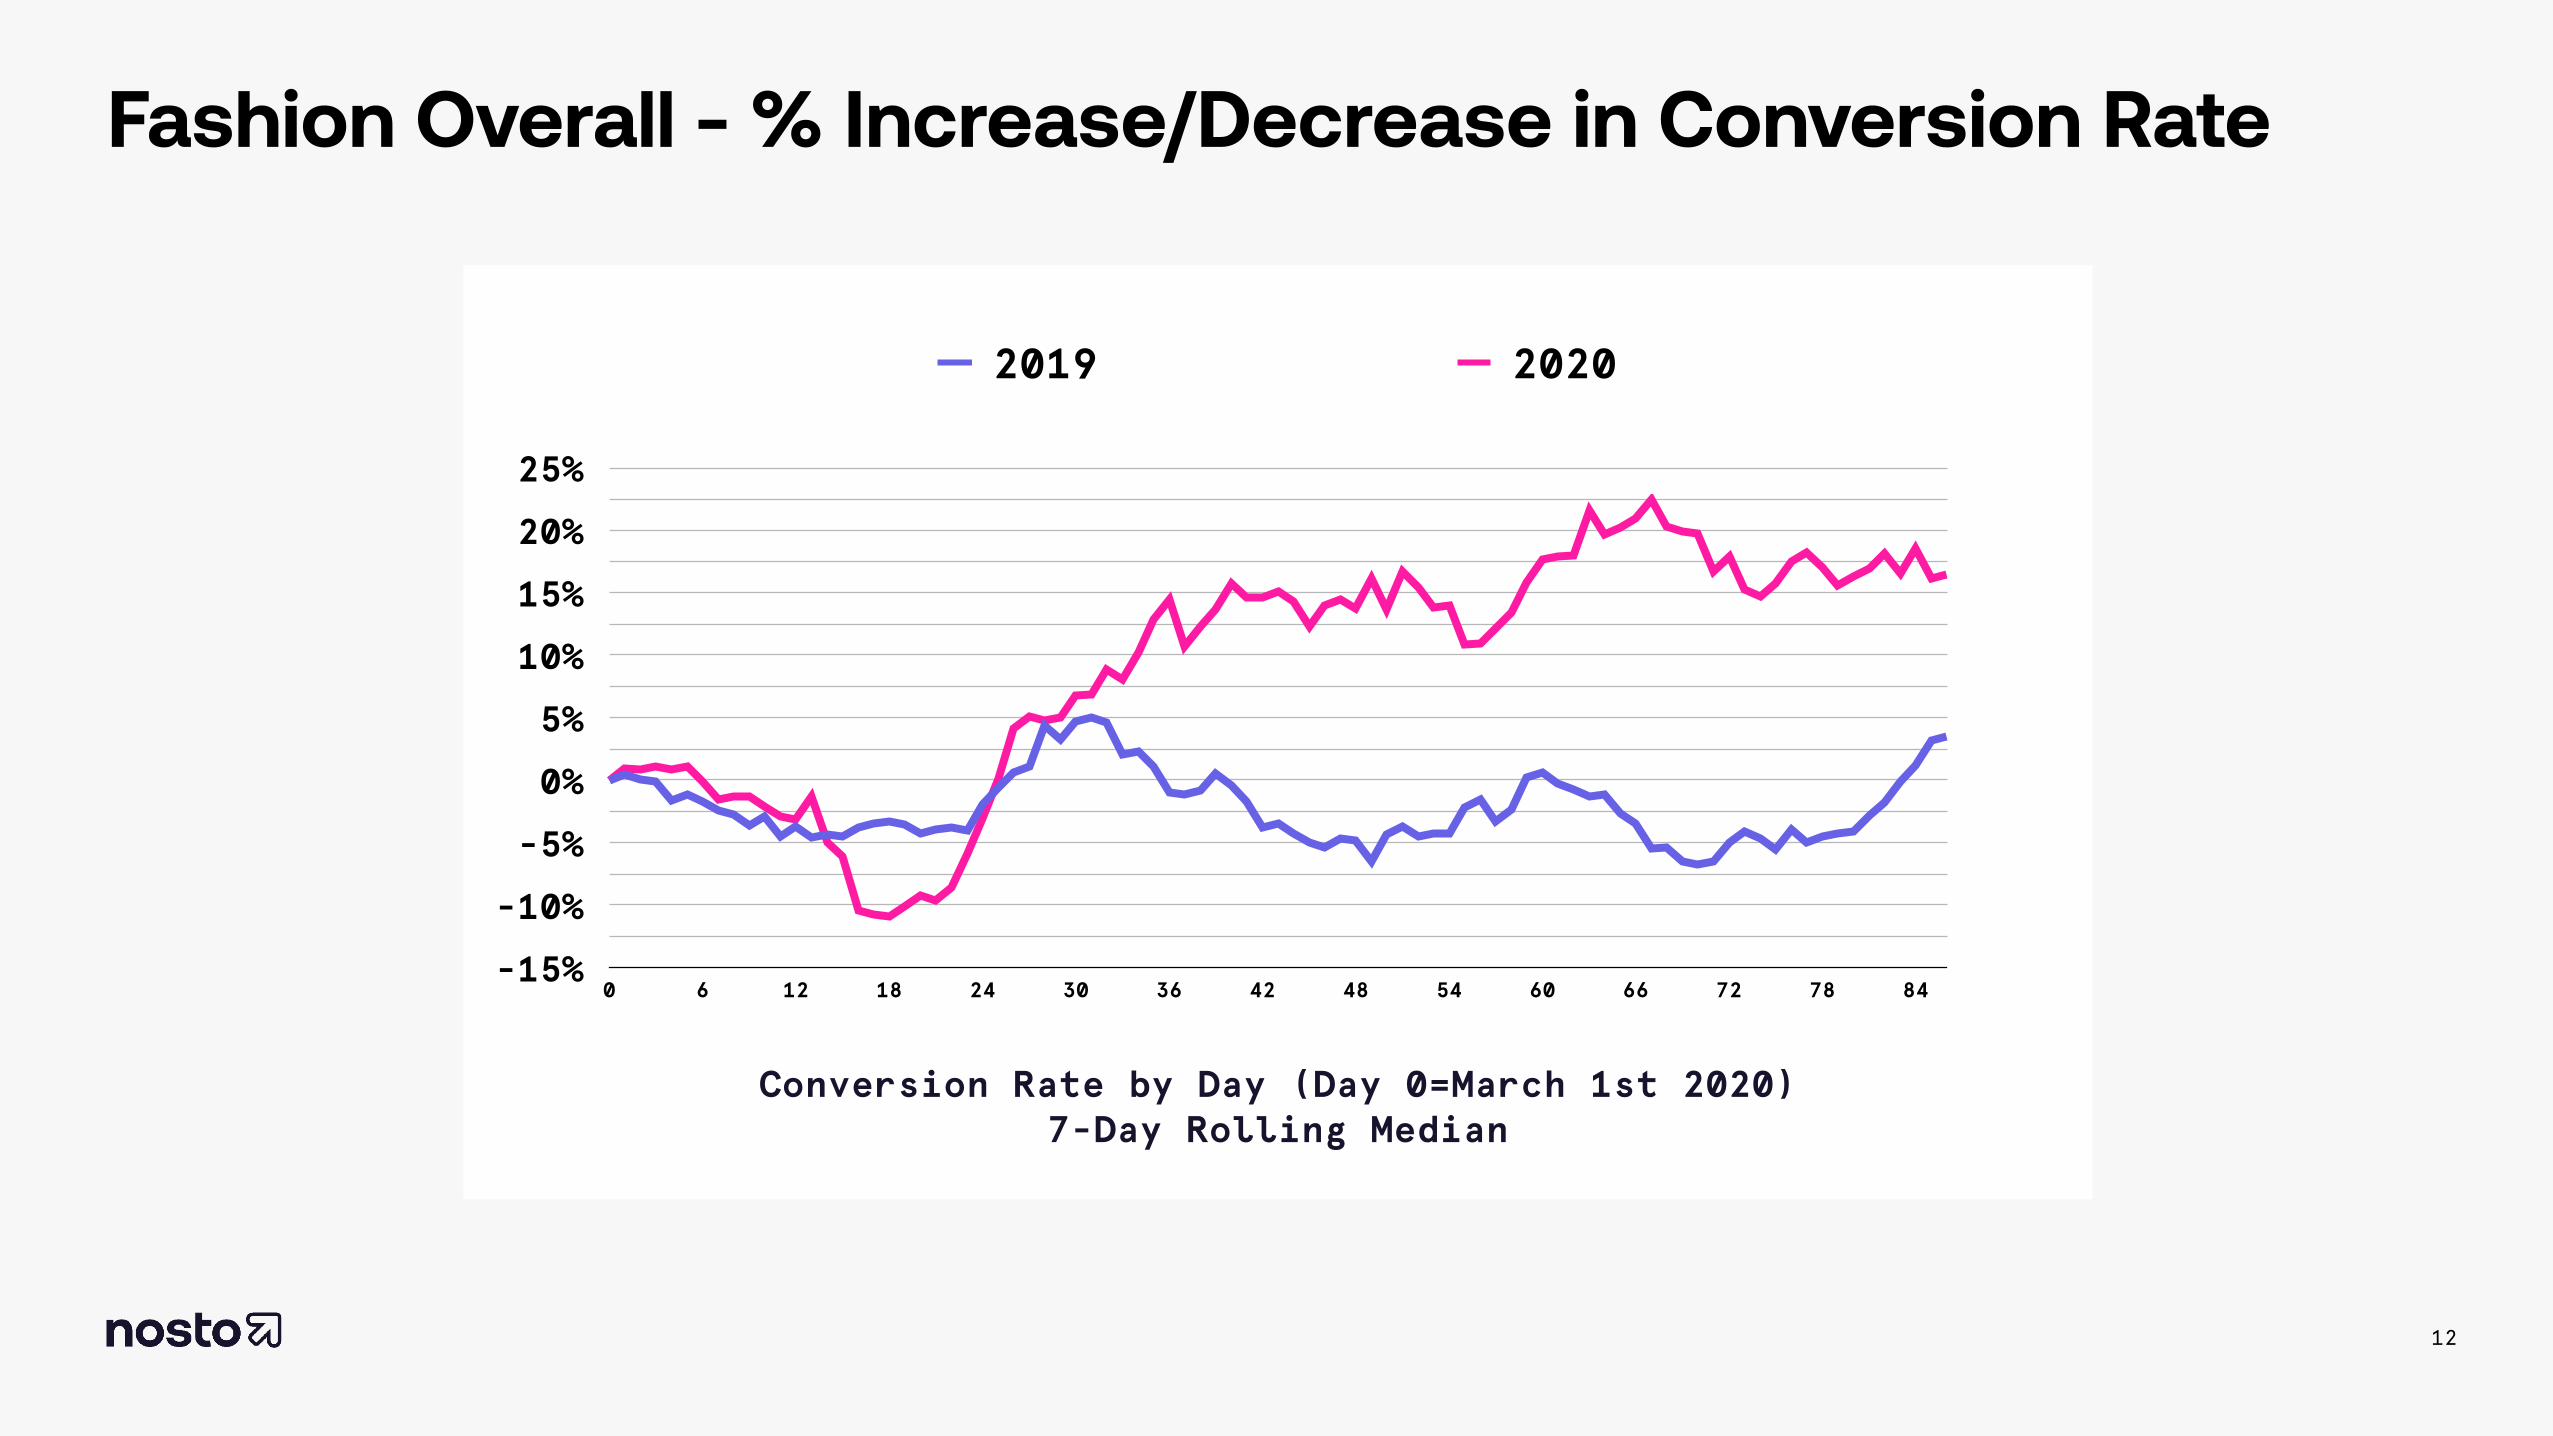
Fashion Overall - % Increase/Decrease in Conversion Rate
12
-15%
-10%
-5%
0%
5%
10%
15%
20%
25%
Conversion Rate by Day (Day 0=March 1st 2020) 7-Day Rolling Median
0 6 12 18 24 30 36 42 48 54 60 66 72 78 84
2019 2020

Data By CountryThe next charts directly compare the difference between 2019 and 2020 in a single line for 6 major regions (US, UK, Sweden, France, Germany, and Australia/ New Zealand).
Visits are now up YOY in all regions. France, Sweden, and Australia and New Zealand are currently only seeing a slight increase in visits YOY with their growth being between 1-3%.
The past week has been noticeably poor for sales with Sweden suffering the most. Even with week-to-week decreases, sales remain up YOY in all regions other than Sweden, whose sales are down 16%. Growth in sales for fashion ecommerce appears to have greatly benefitted from the regional lockdowns.
Orders remain up everywhere except in Sweden and Australia and New Zealand. Orders have been slowly dropping in Sweden across a long period of time, but orders in Australia and New Zealand saw a peculiarly dramatic drop over the past week or two.
AOV stays down YOY for all but Australia and New Zealand, who continue to be the only region that regularly sees this metric in the green since this whole thing started.
Germany, Sweden, the UK, and the US have seen conversion rate stay relatively level. France and Australia and New Zealand continue to have great variation week-to-week when it comes to conversion rate, with ANZ now falling in the red YOY.

Fashion Visits By Country - % Net Change (2020 vs 2019)
14
-40%-30%-20%-10%0%10%20%30%40%50%60%70%
Visits by Day (Day 0=March 1st 2020) 7-Day Rolling Median
0 6 12 18 24 30 36 42 48 54 60 66 72 78 84
ANZ DE FR SE UK US

Fashion Sales By Country - % Net Change (2020 vs 2019)
15
-80%
-50%
-20%
10%
40%
70%
100%
130%
160%
Sales by Day (Day 0=March 1st 2020) 7-Day Rolling Median
0 6 12 18 24 30 36 42 48 54 60 66 72 78 84
ANZ DE FR SE UK US
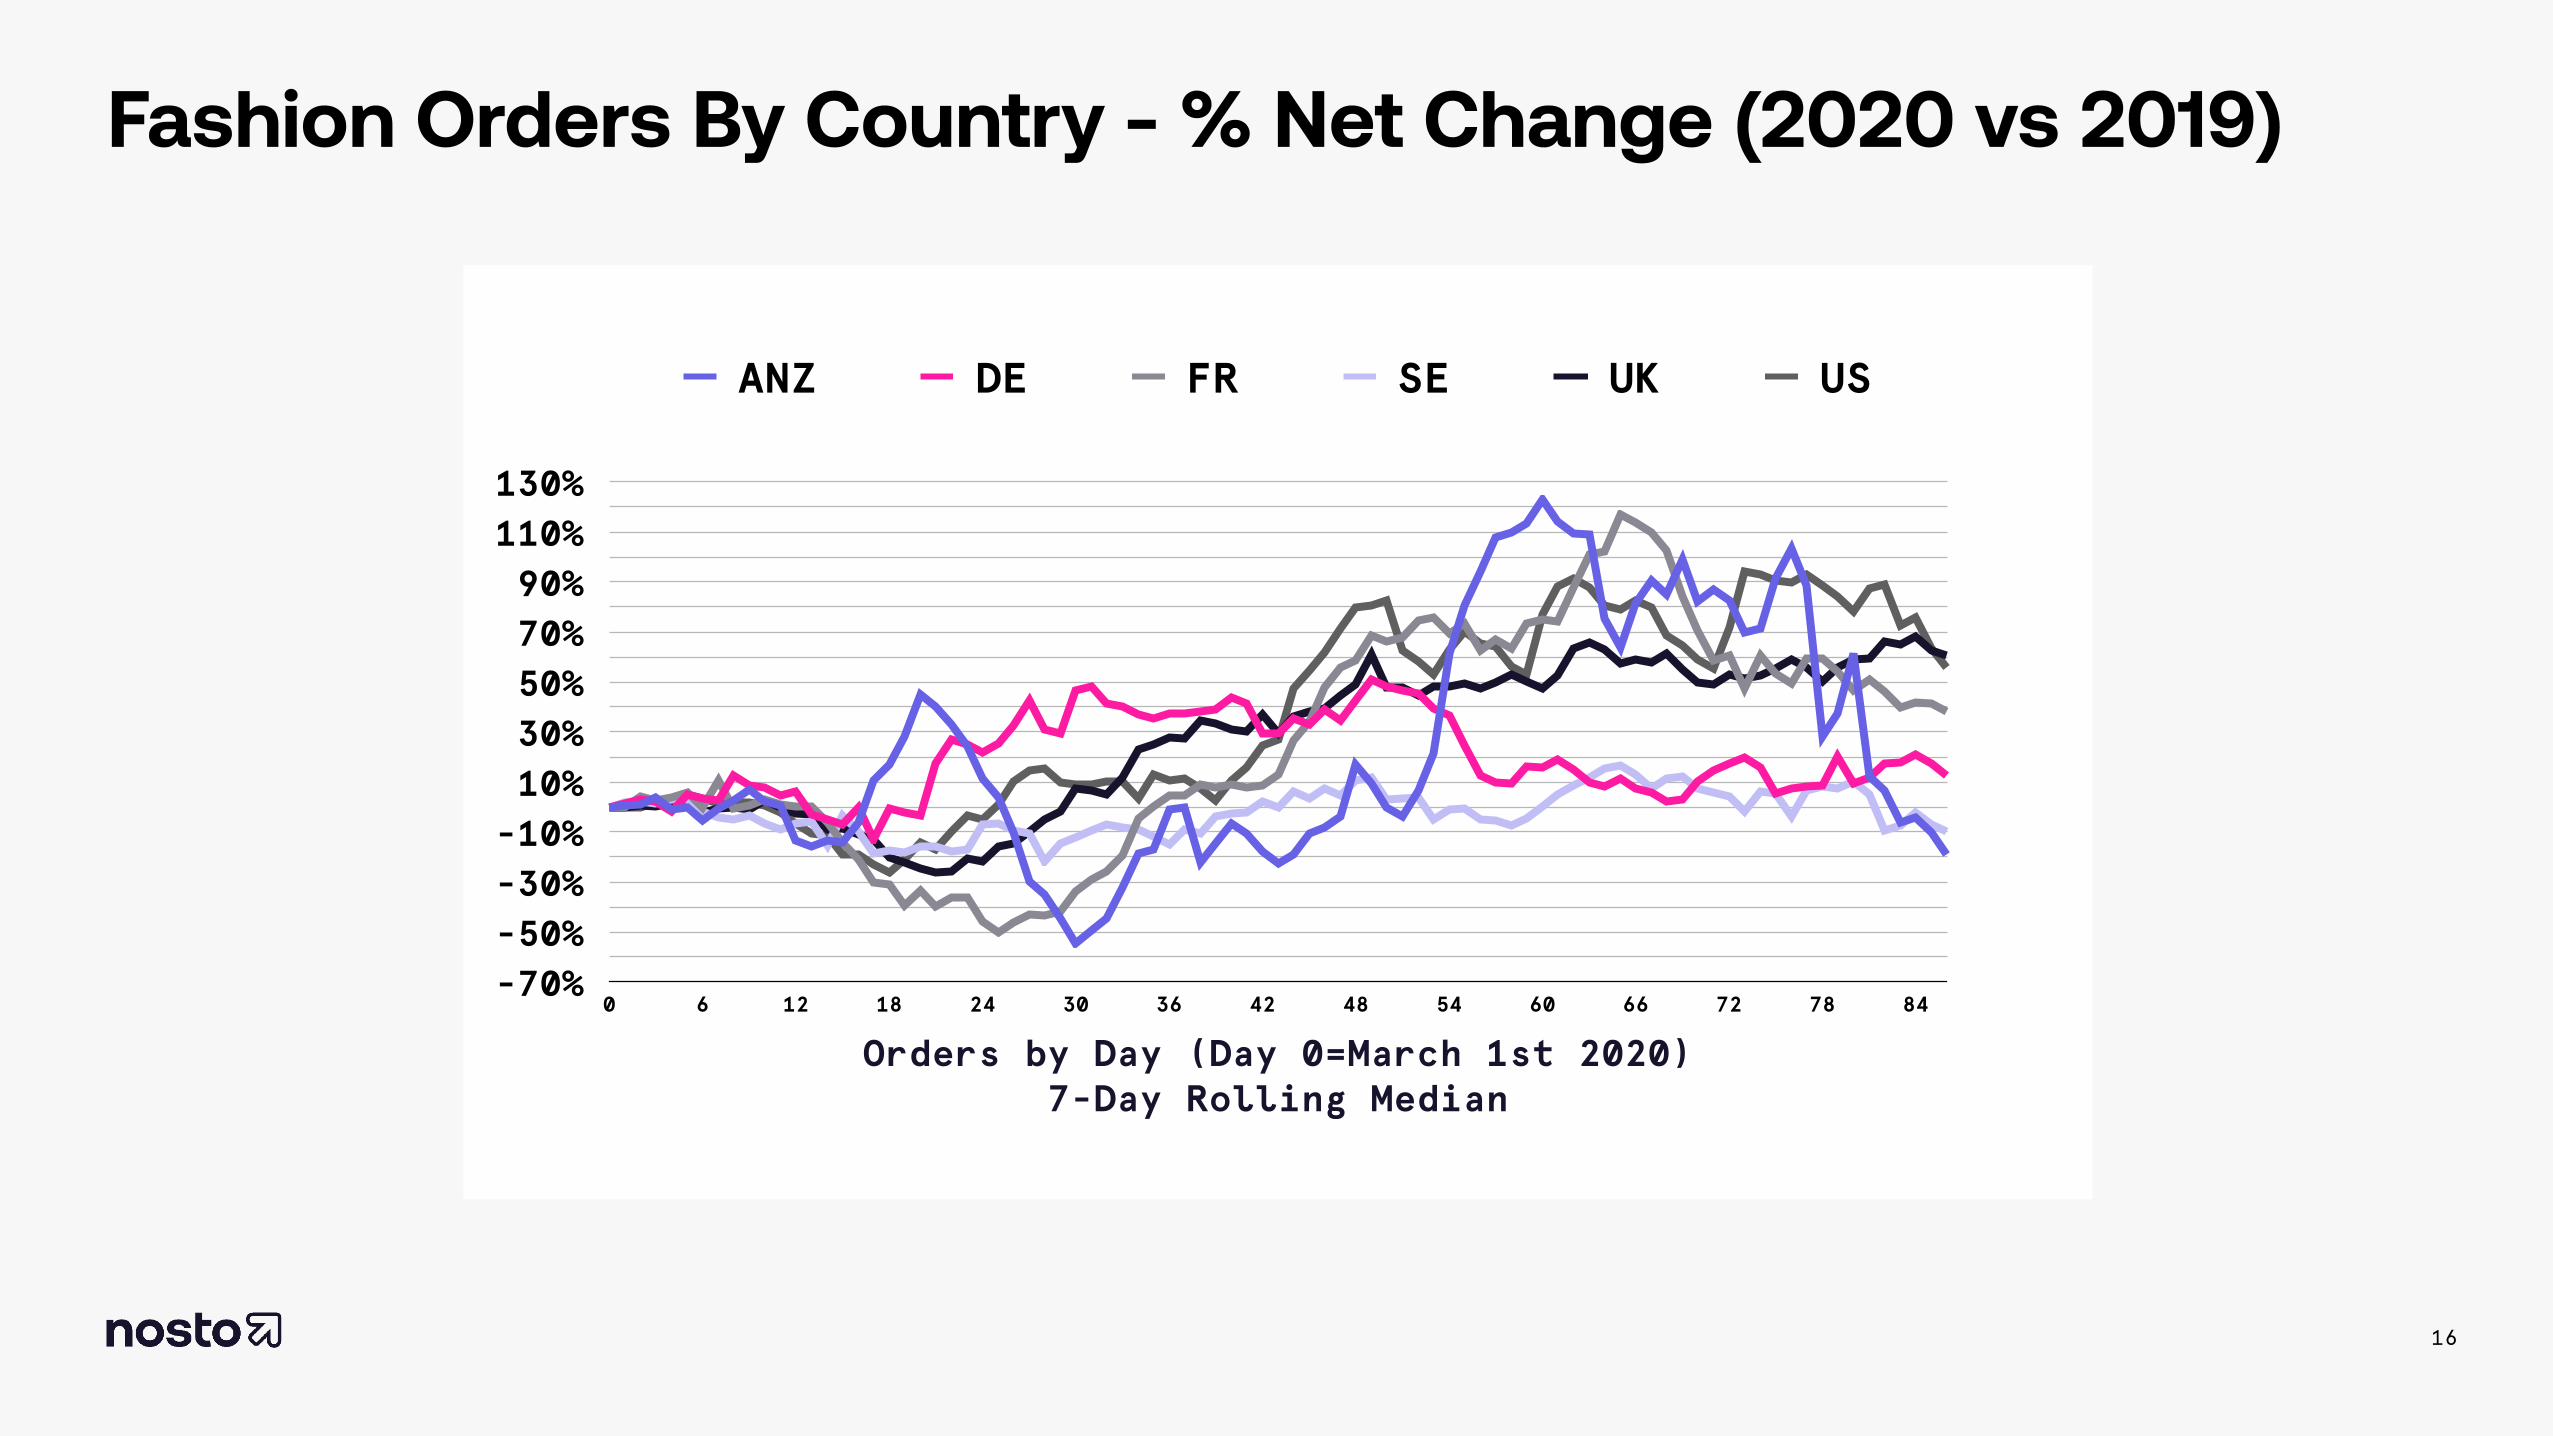
Fashion Orders By Country - % Net Change (2020 vs 2019)
16
-70%-50%-30%-10%10%30%50%70%90%110%130%
Orders by Day (Day 0=March 1st 2020) 7-Day Rolling Median
0 6 12 18 24 30 36 42 48 54 60 66 72 78 84
ANZ DE FR SE UK US
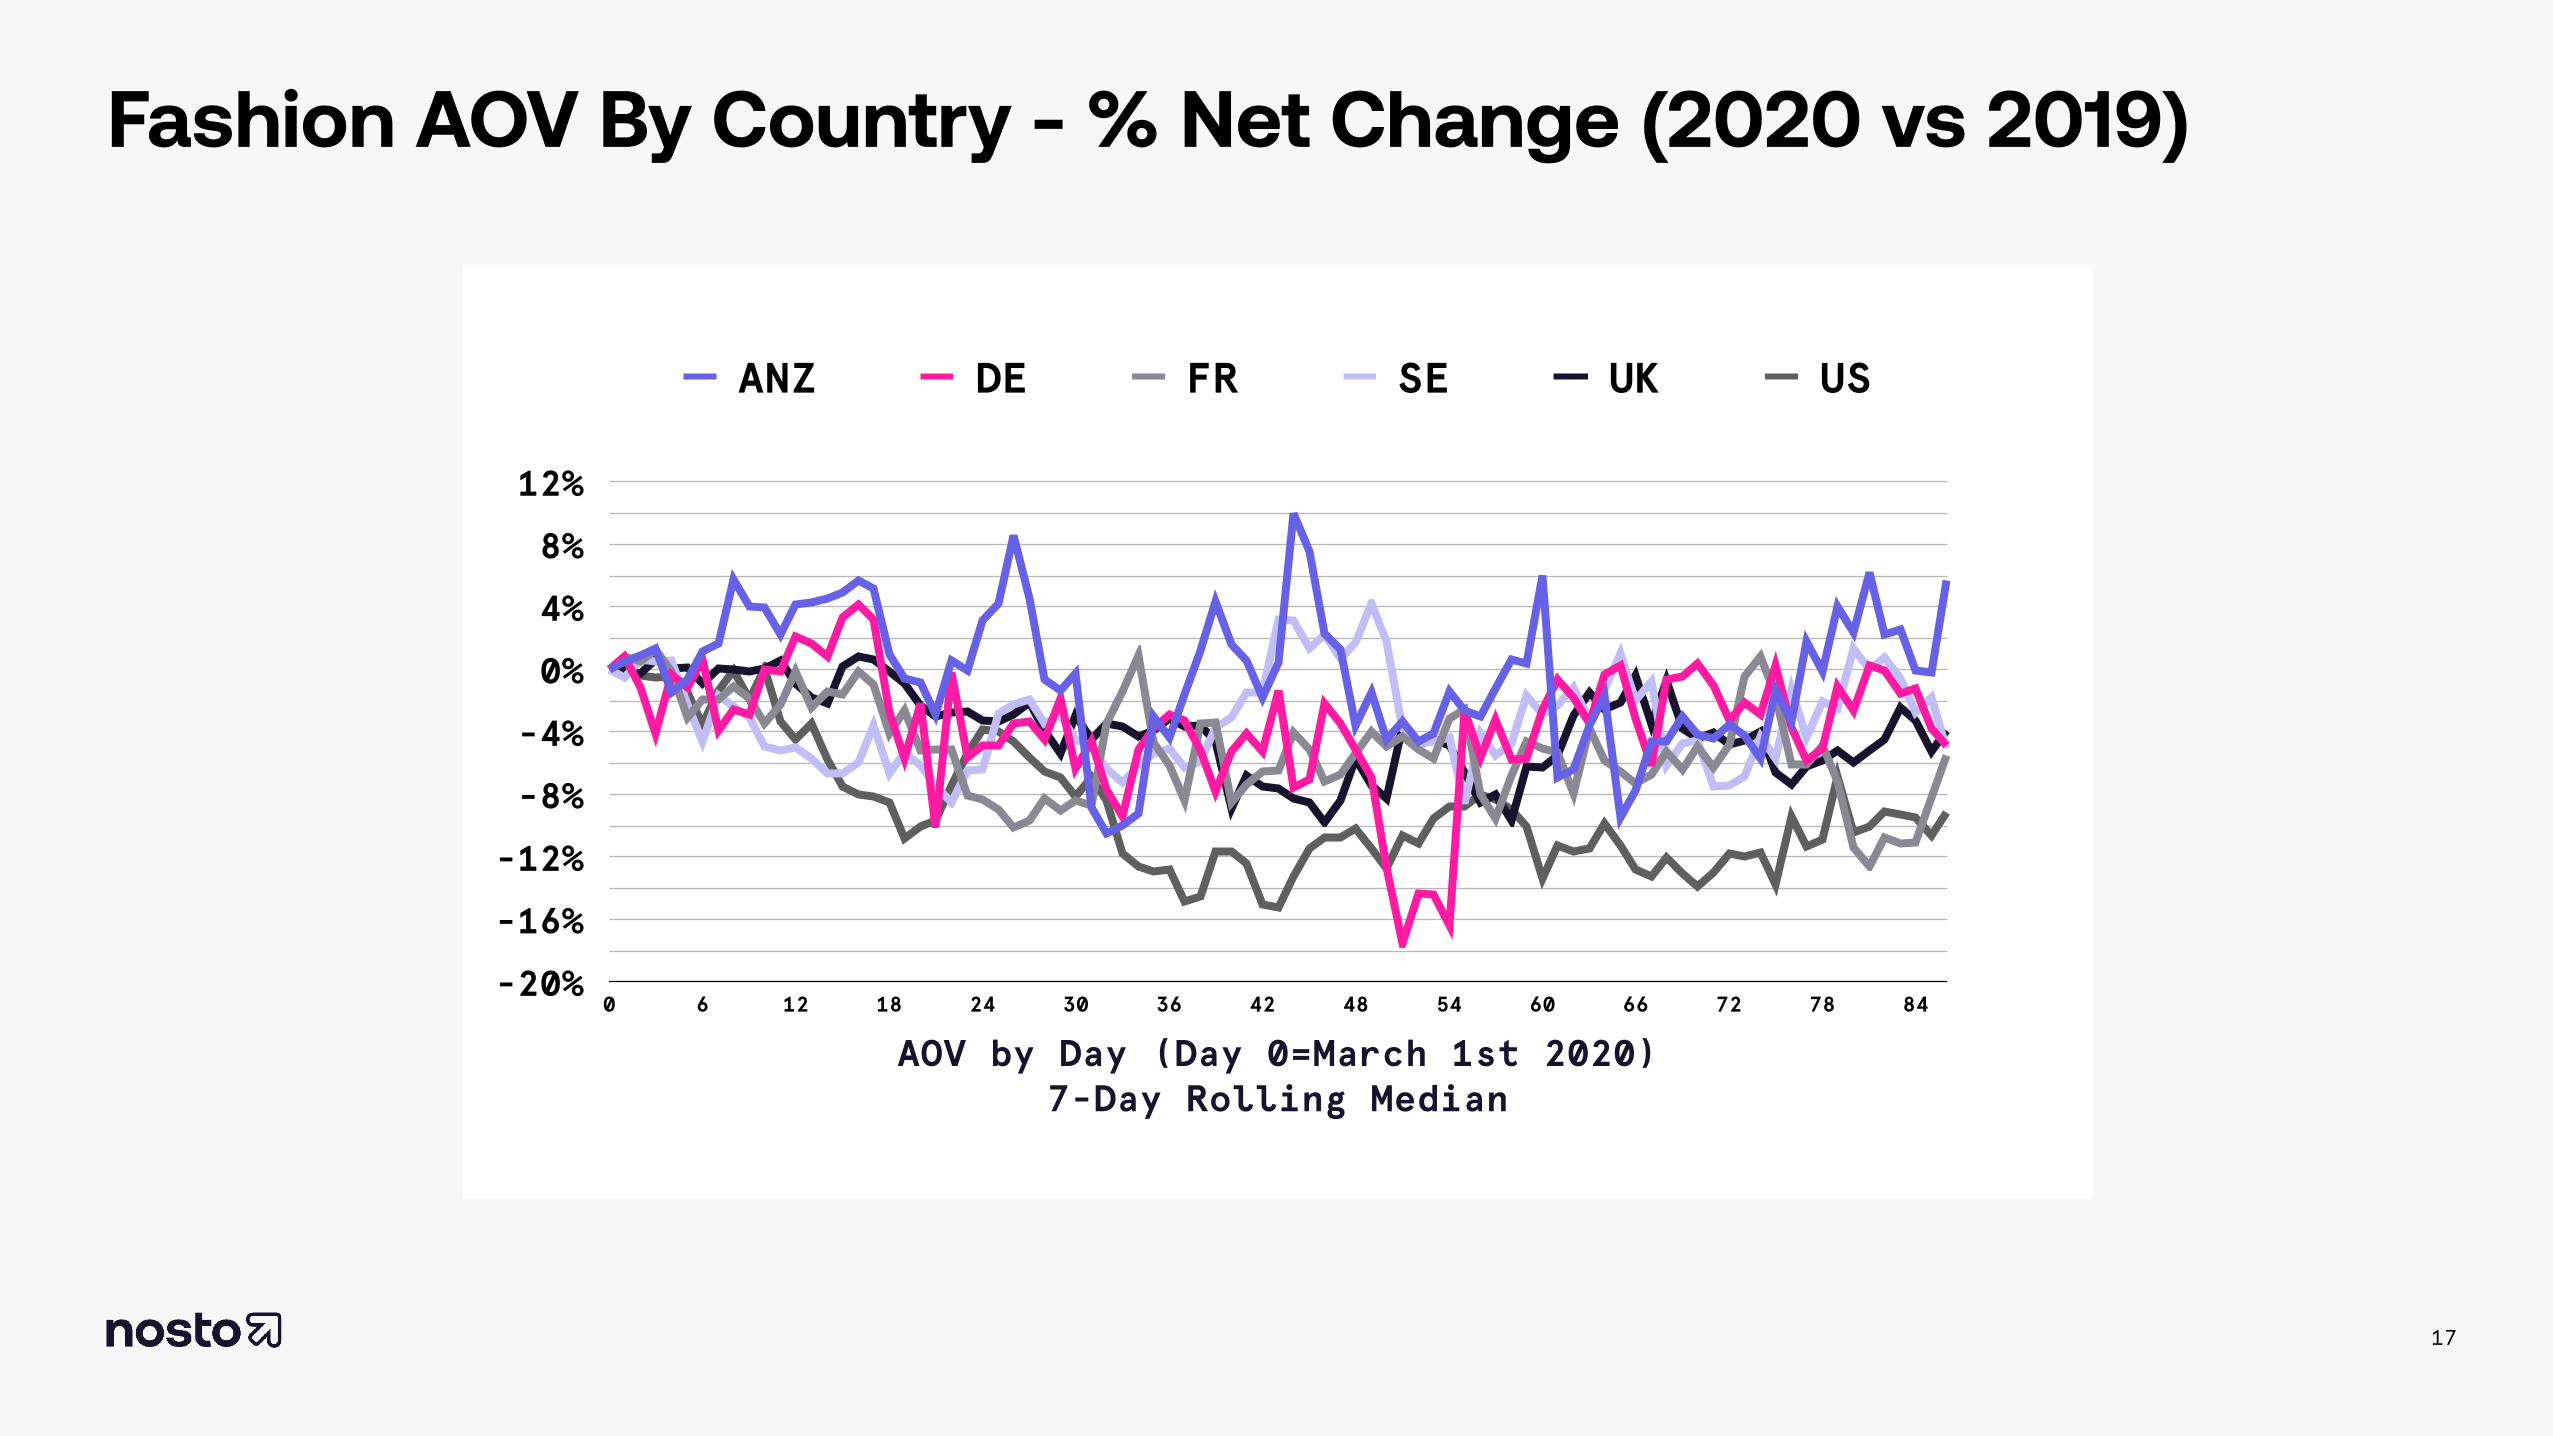
Fashion AOV By Country - % Net Change (2020 vs 2019)
17
-20%
-16%
-12%
-8%
-4%
0%
4%
8%
12%
AOV by Day (Day 0=March 1st 2020) 7-Day Rolling Median
0 6 12 18 24 30 36 42 48 54 60 66 72 78 84
ANZ DE FR SE UK US

Fashion Conversion Rate By Country - % Net Change (2020 vs 2019)
18
-60%
-40%
-20%
0%
20%
40%
60%
80%
100%
120%
Conversion Rate by Day (Day 0=March 1st 2020) 7-Day Rolling Median
0 6 12 18 24 30 36 42 48 54 60 66 72 78 84
ANZ DE FR SE UK US