Embed Size (px)
Citation preview
1
REPORT
VERIFICATION - III
REPUBLIC OF UGANDA
MINISTRY OF EDUCATION AND SPORTS
INDEPENDENT VERIFICATION OF TEACHER PRESENCE IN PUBLIC
PRIMARY SCHOOLS UNDER THE UGANDA TEACHER AND SCHOOL
EFFECTIVENESS PROJECT
( UTSEP )
MAY 2019
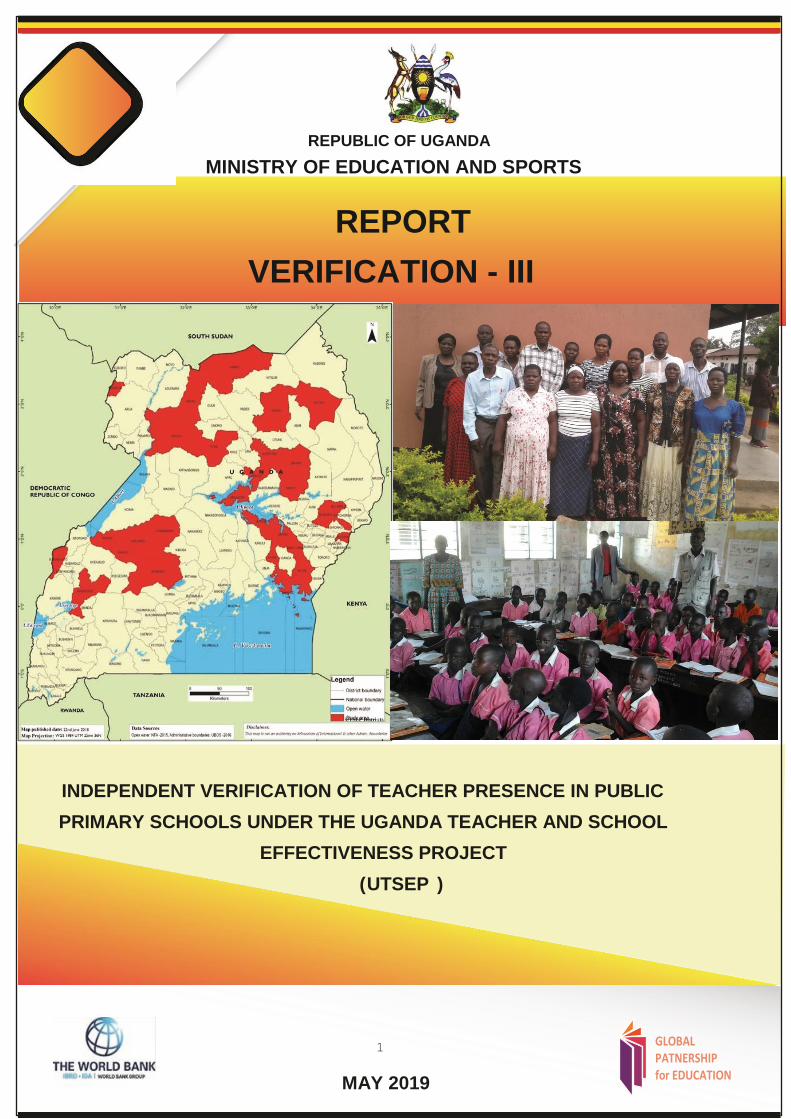
UTSEP Distri cts
2
Map of UTSEP Districts
3
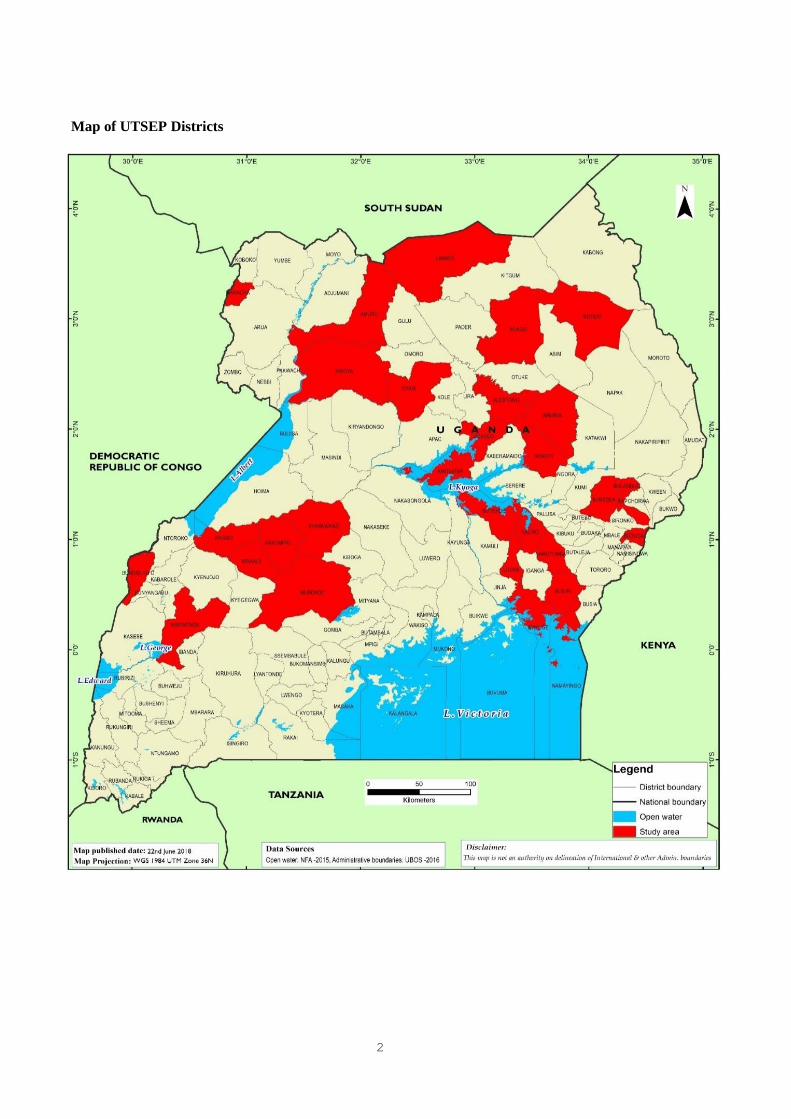
Table of Contents
Contents ACRONYMS: ........................................................................................................................................................... 5 LIST OF FIGURES ................................................................................................................................................... 6 LIST OF TABLES ..................................................................................................................................................... 7
EXECUTIVE SUMMARY .................................................................................................................................... 8
1.0 INTRODUCTION AND BACKGROUND .................................................................................................... 11
A. OBJECTIVES OF THE VERIFICATIONS ............................................................................................................... 12 B. DEFINITION OF KEY CONCEPTS ....................................................................................................................... 13
2.0 APPROACH AND METHODOLOGY ...................................................................................................... 15
2.1 METHODOLOGY .............................................................................................................................................. 15 2.1.1 Study Population ................................................................................................................................... 15 2.1.2 Sampling Design ................................................................................................................................... 15 2.1.3 Sample Size and Power Calculation ..................................................................................................... 15 2.1.4 Sampling of schools by Language and District .................................................................................... 17 2.1.5 Source of data for teacher Verification ................................................................................................ 17
2.2 APPROACH TO DATA COLLECTION .................................................................................................................. 18 2.3 ENUMERATOR DEPLOYMENT .......................................................................................................................... 18
2.3.1 Training of District Supervisors and Enumerators............................................................................... 18 2.3.2 Data collection in the sampled schools ................................................................................................ 19 2.3.3 Use of GPS ........................................................................................................................................... 20 2.3.4 Photography ......................................................................................................................................... 20 2.3.5 Data analysis ........................................................................................................................................ 20
2.4 ETHICAL CONSIDERATIONS AND DATA QUALITY ASSURANCE ......................................................................... 20 2.5 LIMITATIONS ................................................................................................................................................... 21
3.0 FINDINGS .................................................................................................................................................. 22
3.1 GENERAL CHARACTERISTICS .......................................................................................................................... 22 3.2 TEACHER PRESENCE GENERAL ....................................................................................................................... 24
3.2.1 Teacher Presence by region ................................................................................................................. 26 3.2.2 Teacher Presence by Gender and Age Category .................................................................................. 27 3.2.3 Teacher Presence by Assigned Class .................................................................................................... 27 3.2.4 Teacher Presence by District ................................................................................................................ 29 3.2.3 Accountability of Teacher Presence by Region, District and School level ................................................ 32
3.3 P2 TEACHER - TIME ON TASK .......................................................................................................................... 35 3.3.1 P2-teacher Physically Present at the time of the Verification .............................................................. 35 3.3.2 Teacher rightly assigned to P2 class .................................................................................................... 36 3.3.3 P2-teacher teaching EGR timetabled lessons ....................................................................................... 38 3.3.4 Teacher Teaching According to Scheme of work and Lesson Plan ...................................................... 40 3.3.5 EGR Textbooks in hands of learners .................................................................................................... 43 3.4.6 Pupil-EGR Textbook Ratio ......................................................................................................................... 45 3.4.7 P2 Teachers trained in EGR ................................................................................................................. 46
3.4 GENDER IMBALANCE IN TEACHING STAFF DEPLOYMENT .................................................................................... 47 3.5 TEACHER DEPLOYMENT AT SCHOOL LEVEL ....................................................................................................... 48 3.6 TEACHER UTILISATION .................................................................................................................................... 52 3.7 DISTRICT SPECIFIC PECULIARITIES ..................................................................................................................... 55
4.0 DLI PERFORMANCE AND ELIGIBLE PAYMENT .............................................................................. 61
4.1 DLI PERFORMANCE ........................................................................................................................................ 61
5.0 CONCLUSIONS ......................................................................................................................................... 62
6.0 RECOMMENDATIONS ............................................................................................................................ 63
ANNEX 1: DETAILED RESULTS -SAMPLED SCHOOLS BY REGION AND DISTRICT .............................. 66
4
ANNEX 2: TEACHER DEPLOYMENT BY SCHOOL ...................................................................................................... 90
4 ANNEX 3 TEACHER WORKLOAD BY SCHOOL ............................................................................................... 115
ANNEX 4: DATA COLLECTION TOOL FOR VERIFICATION 3..................................................................... 133 ANNEX 4: HEADTEACHER DEBRIEFING/EXIT FORM –VERIFICATION III ............................................. 139 139 ANNEX 5: PHOTO GALLERY ............................................................................................................................ 143

5
ACRONYMS:
AA Authorized Absence
ADE Absent Due to Emergency
CAPE Creative and Performing Arts Education
DEO District Education Officer
DFA Development Financing Agreement
DLG District Local Government
DLI Disbursement Linked Indicator
DSC District Service Commission
EDC Electronic Data Collection
EGR
EMIS
Early Grade Reading
Education Management Information System
GPE Global Partnership for Education
GPS Global Positioning System
HT Head Teacher
M&E Monitoring and Evaluation
MoES Ministry of Education and Sports
NGOs
NST
SMC
SWT
Non-Governmental Organizations
National Study Team
School Management Committee
Senior Woman Teacher
TIET Teacher/Tutor, Instructor Education and Training
UA Un Authorized Absence
UTSEP Uganda Teacher and School Effectiveness Project
6
LIST OF FIGURES
Figure 1: Percentage of Occurrence of Sampled Schools through the four Verification Surveys . 16
Figure 2: Comparison of School level respondents between Verification I, II and III by
designation(percent) ....................................................................................................................... 22 Figure 3: Comparison of Background Characteristics of teachers Baseline - VIII ........................ 23 Figure 4: Teacher Presence in UTSEP Districts ............................................................................ 24 Figure 5: Teacher Presence Across the Surveys (Percent) ............................................................. 25 Figure 6: Teacher Presence by Region (Baseline – Verification I, II & III) .................................. 26
Figure 7: Teacher Presence by District from Baseline to Verification III (percent) ...................... 29 Figure 8: Average number of schools with all teachers fully accounted for .................................. 32 Figure 9: Teacher rightly assigned at time of verification III by District ...................................... 37 Figure 10: P2 Teacher on Task ....................................................................................................... 40
Figure 11: EGR text books in the hands of learners....................................................................... 43 Figure 12: Percent of Female Teachers by District ........................................................................ 47 Figure 13 Teacher deployment at School Level (n=6,103) ............................................................ 48
Figure 14: Distribution of teachers by qualifications ..................................................................... 49
Figure 15: Distribution of teachers by class by Sex ....................................................................... 49 Figure 16 : Workload distribution for primary teachers................................................................ 52 Figure 17: Learners of Akakat P/S attending class under a tree .................................................... 56
Figure 18: Lolwe Ps with a collapsed classroom wall ................................................................... 60 Figure 19: Teacher Presence during Verification III for payment under DLI 7: ........................... 61
7
LIST OF TABLES
Table 1: Guideline on DLI Disbursement ...................................................................................... 11 Table 2: Objective and Activity Matrix ......................................................................................... 12 Table 3: Sampling of Schools by Language and District ............................................................... 17 Table 4: Enumerators by Region .................................................................................................... 18
Table 5: Chronology of events for enumerator during Verification .............................................. 19 Table 6: Background Characteristics of Teachers Verified ........................................................... 23 Table 7: Status of teacher Presence in the Sampled Schools ......................................................... 25 Table 8: Verified number of P1-P7 Teachers Physically Present and Reasons for Absence ......... 26 Table 9: Teachers Presence by selected Background Characteristics ............................................ 28
Table 10: Teacher Presence by Sampled District ........................................................................... 30 Table 11: Accountability of Teacher Presence by Region, District and School. ........................... 33 Table 12: P2 Teacher Presence by District .................................................................................... 36 Table 13: P2 teachers rightly assigned at the time of the Verification by district ......................... 37 Table 14: P2 - Teacher teaching EGR Timetabled Lesson by Sampled District ........................... 39
Table 15: Teacher teaching according to the Scheme of Work by the Sampled District ............... 42 Table 16: Textbooks in the hands of learners in line with EGR by the Sampled Districts ............ 44 Table 17: Pupil: EGR Textbook Ratio ........................................................................................... 45
Table 18: Class teacher distribution by District ............................................................................. 50 Table 19: Teacher deployment per School ..................................................................................... 51 Table 20: Average Teaching Periods by Region and District ........................................................ 53 Table 21: Workload Distribution across different parameters (%) ................................................ 54
Table 22: Class-Assigned by Qualification ............................................................................... 54
8
EXECUTIVE SUMMARY
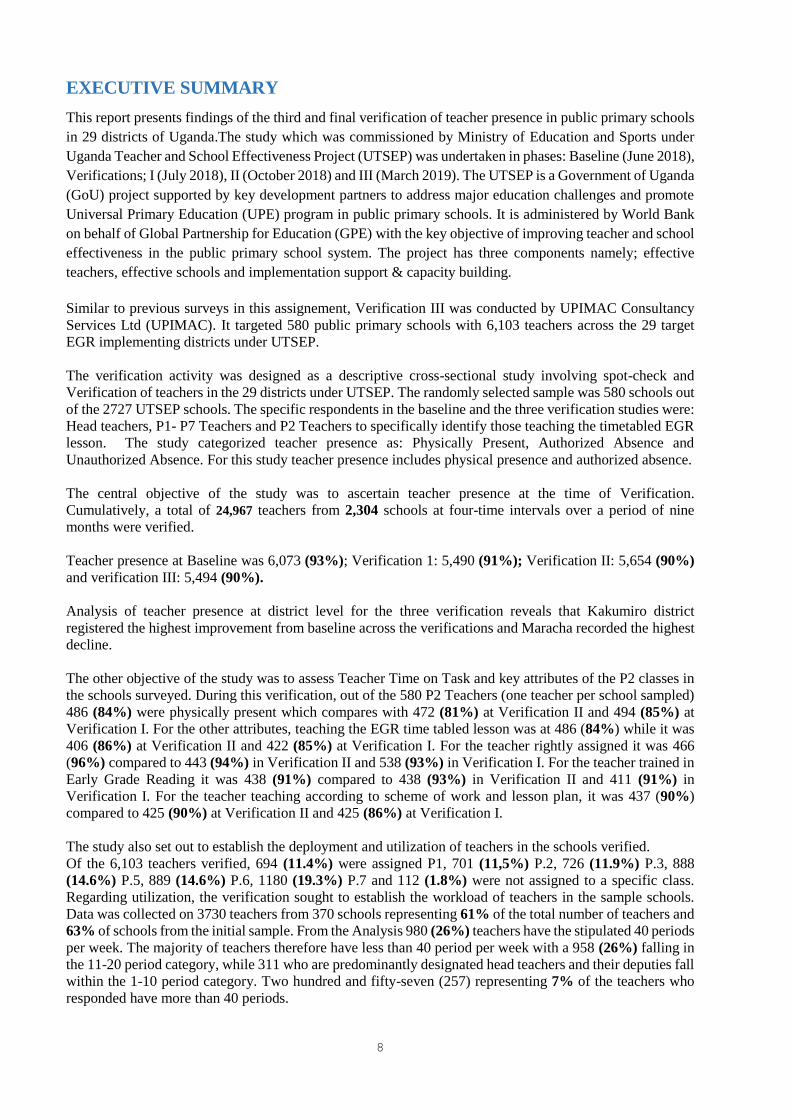
This report presents findings of the third and final verification of teacher presence in public primary schools
in 29 districts of Uganda.The study which was commissioned by Ministry of Education and Sports under
Uganda Teacher and School Effectiveness Project (UTSEP) was undertaken in phases: Baseline (June 2018),
Verifications; I (July 2018), II (October 2018) and III (March 2019). The UTSEP is a Government of Uganda
(GoU) project supported by key development partners to address major education challenges and promote
Universal Primary Education (UPE) program in public primary schools. It is administered by World Bank
on behalf of Global Partnership for Education (GPE) with the key objective of improving teacher and school
effectiveness in the public primary school system. The project has three components namely; effective
teachers, effective schools and implementation support & capacity building.
Similar to previous surveys in this assignement, Verification III was conducted by UPIMAC Consultancy
Services Ltd (UPIMAC). It targeted 580 public primary schools with 6,103 teachers across the 29 target
EGR implementing districts under UTSEP.
The verification activity was designed as a descriptive cross-sectional study involving spot-check and
Verification of teachers in the 29 districts under UTSEP. The randomly selected sample was 580 schools out
of the 2727 UTSEP schools. The specific respondents in the baseline and the three verification studies were:
Head teachers, P1- P7 Teachers and P2 Teachers to specifically identify those teaching the timetabled EGR
lesson. The study categorized teacher presence as: Physically Present, Authorized Absence and
Unauthorized Absence. For this study teacher presence includes physical presence and authorized absence.
The central objective of the study was to ascertain teacher presence at the time of Verification.
Cumulatively, a total of 24,967 teachers from 2,304 schools at four-time intervals over a period of nine
months were verified.
Teacher presence at Baseline was 6,073 (93%); Verification 1: 5,490 (91%); Verification II: 5,654 (90%)
and verification III: 5,494 (90%).
Analysis of teacher presence at district level for the three verification reveals that Kakumiro district
registered the highest improvement from baseline across the verifications and Maracha recorded the highest
decline.
The other objective of the study was to assess Teacher Time on Task and key attributes of the P2 classes in
the schools surveyed. During this verification, out of the 580 P2 Teachers (one teacher per school sampled)
486 (84%) were physically present which compares with 472 (81%) at Verification II and 494 (85%) at
Verification I. For the other attributes, teaching the EGR time tabled lesson was at 486 (84%) while it was
406 (86%) at Verification II and 422 (85%) at Verification I. For the teacher rightly assigned it was 466
(96%) compared to 443 (94%) in Verification II and 538 (93%) in Verification I. For the teacher trained in
Early Grade Reading it was 438 (91%) compared to 438 (93%) in Verification II and 411 (91%) in
Verification I. For the teacher teaching according to scheme of work and lesson plan, it was 437 (90%)
compared to 425 (90%) at Verification II and 425 (86%) at Verification I.
The study also set out to establish the deployment and utilization of teachers in the schools verified.
Of the 6,103 teachers verified, 694 (11.4%) were assigned P1, 701 (11,5%) P.2, 726 (11.9%) P.3, 888
(14.6%) P.5, 889 (14.6%) P.6, 1180 (19.3%) P.7 and 112 (1.8%) were not assigned to a specific class.
Regarding utilization, the verification sought to establish the workload of teachers in the sample schools.
Data was collected on 3730 teachers from 370 schools representing 61% of the total number of teachers and
63% of schools from the initial sample. From the Analysis 980 (26%) teachers have the stipulated 40 periods
per week. The majority of teachers therefore have less than 40 period per week with a 958 (26%) falling in
the 11-20 period category, while 311 who are predominantly designated head teachers and their deputies fall
within the 1-10 period category. Two hundred and fifty-seven (257) representing 7% of the teachers who
responded have more than 40 periods.

9
The central strategy for improvement of teacher presence under UTSEP is Disbursement Linked Indicator
(DLI) where rewards are tagged on level of teacher presence in schools with different amounts earned
according to achievement visavis agreed target. The Verification III study has registered a 90% score
which attracts a payment of USD 5 Million by the funding Agency to the Ministry of Education and
Sports based on the DLI. This compares with 91% at Verification II that attracted USD 5 Million and 91%
which attracted USD 4 Million.
The exercise from baseline to verification III has made several recommendations for improvement with some
having policy implications while others are targeted at improving the practices that affect both school
management and teaching.
,
Headteachers need to do more effective management, supervision and reporting on their teachers to ensure
regular teacher presence and those found to be failing in this task be severely reprimanded. Effort should be
made to ensure that each teacher has sufficient workload (not below 25 teaching periods a week) to
effectively utilize them at school.
The District Service Commission should ensure that Headteachers and teachers are regularly appraised to
reprimand those with persistent poor learner performance and reward those with excellent performance.
A teacher presence monitoring book be established at school level to be filled in by all key stakeholders that
conduct supervision and monitoring of schools. A summary report be made termly by a headteacher to the
DEO who should consequently prepare and submit a summary report to MOES.
There is need for Sub-county Chief to make teacher presence key on the school supervision agenda and
support the headteacher to be more effective.
There is need for enhanced community vigilance on teachers’ presence in schools for instance reporting to
the relevant authorities on teachers’ misconduct.
Head teachers and school supervisors should ensure that lesson plans are available and being used for
reference by all teachers in the school.
There is need to ensure that each school has at least a teacher trained in EGR to manage lower classes and
refresher training be arranged for those who were trained in the past.
There is need for periodic review of the content of EGR training materials incorporating feedback from the
teachers and users/learners. It is important to effectively map local languages against the EGR materials to
be used.
Further study be made on teacher utilization covering all teachers in Uganda with the objective of
rationalizing deployment and fostering effective teacher utilization.
As gender balance is not yet attained with males outnumbering females, there is need to attract more females
for training and posting to public primary schools.
There is need for immediate transfer of female teachers to those schools with no single female teacher so
that at least every school has a female teacher to handle unique needs of female learners.
For sparsely located schools in the remote areas there is need to explore the possibility of use of virtual
technology where a good teacher located far away can teach the learners in distant location.
Accommodation for teachers in hard to reach areas needs to be prioritized to minimize late attendance, or
the time frames of the teaching in those schools is flexible to accommodate the time taken to and from
school.
There is need to address the gaps in infrastructure especially classroom blocks and teachers’ houses
provision to Public primary schools in Uganda.
There is need to address the high pupil teacher ratios especially in northern region where the pupil teacher
ratios are very high.

10
Increase supervision and quality assurance especially in the remote areas to curtail arbitrary closure of
entire school under flimsy and unjustifiable reasons. For a headteacher to close a school, express
permission be sought from the DEO.
There is need for coordination by the MOES of programmes that affect school teaching to avoid undue
interruptions to the school activities.
Independent verification activities should be fully integrated in the Education Management System including
planning and implementation.
A similar country wide verification exercise would greatly facilitate both the update of teacher lists and the
establishment of teacher presence nation-wide.
The Ministry should provide clear policy guidelines on what constitutes Authorized Absence and
Unauthorized for observance by key stakeholders in supervision and monitoring of schools.
Reinforced mechanisms that require headteachers to sign performance agreements based on clear assessment
indicators as a prerequisite for appointment.
There is need for a specific study to harmonize teacher lists between the Ministry of Education and Sports
and the CAO posted ones.
There is need for DLGs to strengthen supervision of schools and submit regular reports to relevant authorities
to take necessary action.
There is need for SMC to make teacher presence key on their school supervision agenda and generally
support the headteacher and teachers to be more effective.
There is need for synthetization of the findings from various researches done on the Education sector to
enhance shared knowledge and develop appropriate policy and implementation framework.
11
1.0 INTRODUCTION AND BACKGROUND
This Verification Report marks the final in a series of three verification studies following the
baseline undertaken in June 2018. The field activity for Verification III was undertaken from 11-
12 March 2019. The report provides an overview of the independent Verification of the status of
teacher presence in public primary schools in all the 29 Districts under the Uganda Teacher and
School Effectiveness Project (UTSEP). It provides a trend analysis of teacher presence from the
baseline undertaken in June 2018, the first verification undertaken in July 2018 and the second
verification undertaken in October 2018. The Project is implemented by the Ministry of Education
and Sports with US$100m support from the Global Partnership for Education (GPE). It aims at
improving teacher and school effectiveness in public primary schools in Uganda.
Arising from the Mid Term Review of the project, a new innovation of a Disbursement Linked
Indicator (DLI) was introduced with the main purpose of improving teacher attendance in schools
benefiting under the Early Grade Reading. This was after the Service Delivery Indicators (SDI)
survey conducted in 2013 found an average teacher absenteeism rate of 27% nationwide.
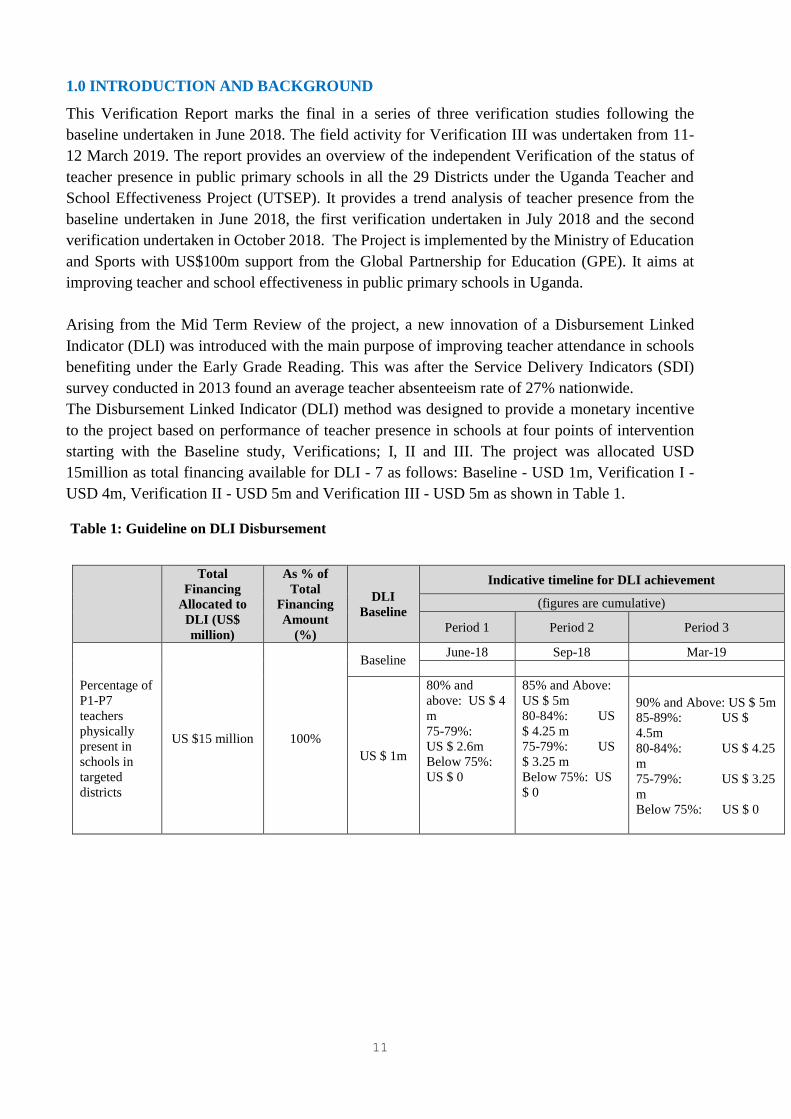
The Disbursement Linked Indicator (DLI) method was designed to provide a monetary incentive
to the project based on performance of teacher presence in schools at four points of intervention
starting with the Baseline study, Verifications; I, II and III. The project was allocated USD
15million as total financing available for DLI - 7 as follows: Baseline - USD 1m, Verification I -
USD 4m, Verification II - USD 5m and Verification III - USD 5m as shown in Table 1.
Total
Financing
Allocated to
DLI (US$
million)
As % of
Total
Financing
Amount
(%)
DLI
Baseline
Indicative timeline for DLI achievement
(figures are cumulative)
Period 1 Period 2 Period 3
Percentage of
P1-P7
teachers
physically
present in
schools in
targeted
districts
US $15 million 100%
Baseline June-18 Sep-18 Mar-19
US $ 1m
80% and
above: US $ 4
m
75-79%:
US $ 2.6m
Below 75%:
US $ 0
85% and Above:
US $ 5m
80-84%: US
$ 4.25 m
75-79%: US
$ 3.25 m
Below 75%: US
$ 0
90% and Above: US $ 5m
85-89%: US $
4.5m
80-84%: US $ 4.25
m
75-79%: US $ 3.25
m
Below 75%: US $ 0
Table 1: Guideline on DLI Disbursement
12
a. Objectives of the Verifications
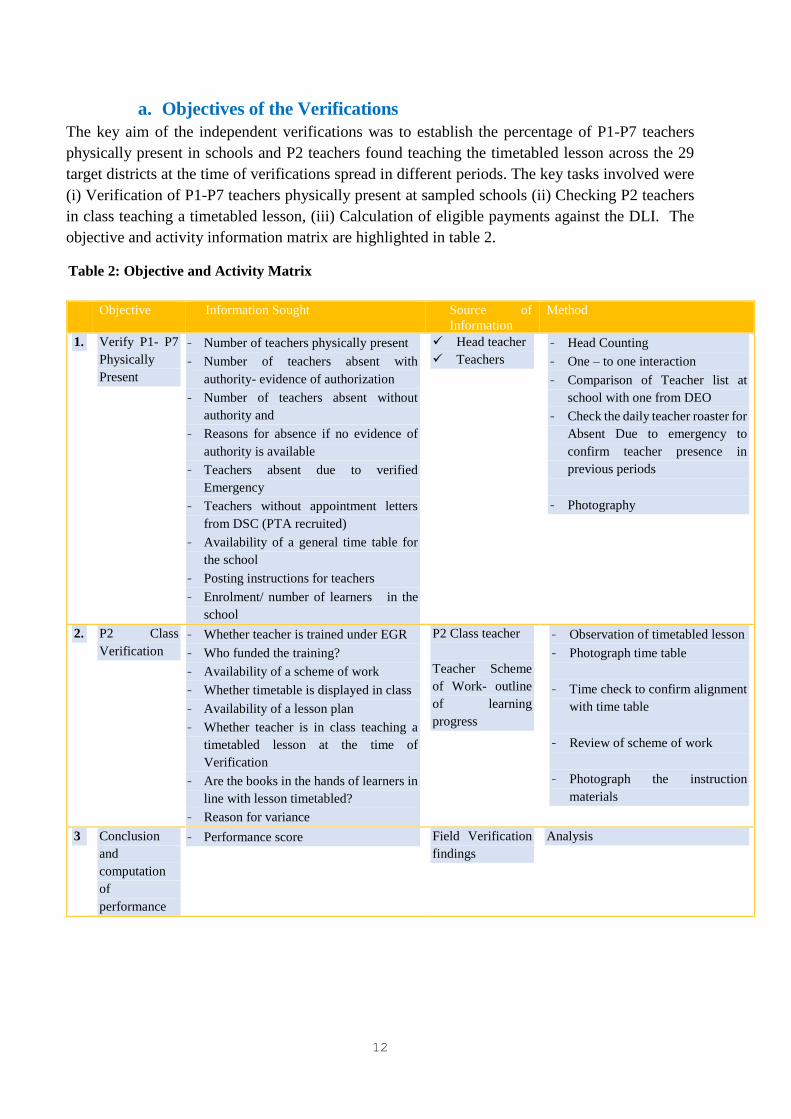
The key aim of the independent verifications was to establish the percentage of P1-P7 teachers
physically present in schools and P2 teachers found teaching the timetabled lesson across the 29
target districts at the time of verifications spread in different periods. The key tasks involved were
(i) Verification of P1-P7 teachers physically present at sampled schools (ii) Checking P2 teachers
in class teaching a timetabled lesson, (iii) Calculation of eligible payments against the DLI. The
objective and activity information matrix are highlighted in table 2.
Objective Information Sought Source of
Information
Method
1. Verify P1- P7
Physically
Present
- Number of teachers physically present
- Number of teachers absent with
authority- evidence of authorization
- Number of teachers absent without
authority and
- Reasons for absence if no evidence of
authority is available
- Teachers absent due to verified
Emergency
- Teachers without appointment letters
from DSC (PTA recruited)
- Availability of a general time table for
the school
- Posting instructions for teachers
- Enrolment/ number of learners in the
school
✓ Head teacher
✓ Teachers
- Head Counting
- One – to one interaction
- Comparison of Teacher list at
school with one from DEO
- Check the daily teacher roaster for
Absent Due to emergency to
confirm teacher presence in
previous periods
- Photography
2. P2 Class
Verification
- Whether teacher is trained under EGR
- Who funded the training?
- Availability of a scheme of work
- Whether timetable is displayed in class
- Availability of a lesson plan
- Whether teacher is in class teaching a
timetabled lesson at the time of
Verification
- Are the books in the hands of learners in
line with lesson timetabled?
- Reason for variance
P2 Class teacher
Teacher Scheme
of Work- outline
of learning
progress
- Observation of timetabled lesson
- Photograph time table
- Time check to confirm alignment
with time table
- Review of scheme of work
- Photograph the instruction
materials
3 Conclusion
and
computation
of
performance
- Performance score Field Verification
findings
Analysis
Table 2: Objective and Activity Matrix
13
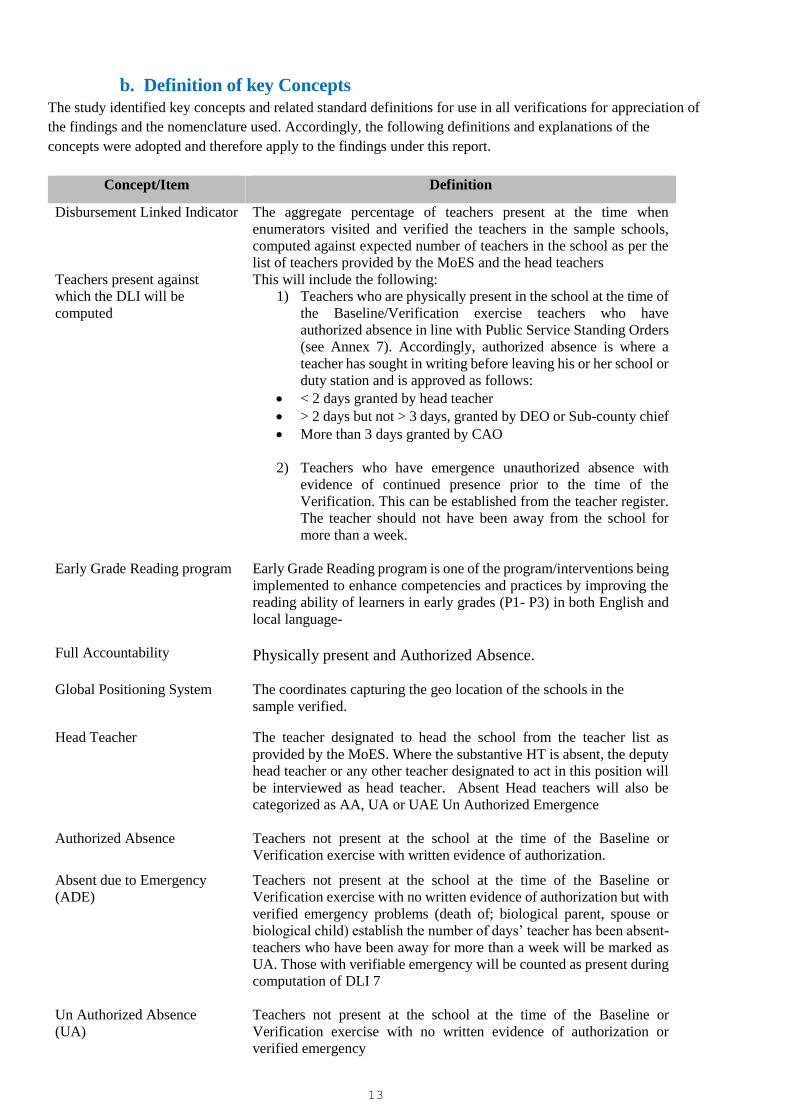
b. Definition of key Concepts
The study identified key concepts and related standard definitions for use in all verifications for appreciation of
the findings and the nomenclature used. Accordingly, the following definitions and explanations of the
concepts were adopted and therefore apply to the findings under this report.
Concept/Item Definition
Disbursement Linked Indicator The aggregate percentage of teachers present at the time when
enumerators visited and verified the teachers in the sample schools,
computed against expected number of teachers in the school as per the
list of teachers provided by the MoES and the head teachers
Teachers present against
which the DLI will be
computed
This will include the following:
1) Teachers who are physically present in the school at the time of
the Baseline/Verification exercise teachers who have
authorized absence in line with Public Service Standing Orders
(see Annex 7). Accordingly, authorized absence is where a
teacher has sought in writing before leaving his or her school or
duty station and is approved as follows:
• < 2 days granted by head teacher
• > 2 days but not > 3 days, granted by DEO or Sub-county chief
• More than 3 days granted by CAO
2) Teachers who have emergence unauthorized absence with
evidence of continued presence prior to the time of the
Verification. This can be established from the teacher register.
The teacher should not have been away from the school for
more than a week.
Early Grade Reading program
Full Accountability
Early Grade Reading program is one of the program/interventions being
implemented to enhance competencies and practices by improving the
reading ability of learners in early grades (P1- P3) in both English and
local language-
Physically present and Authorized Absence.
Global Positioning System The coordinates capturing the geo location of the schools in the
sample verified.
Head Teacher The teacher designated to head the school from the teacher list as
provided by the MoES. Where the substantive HT is absent, the deputy
head teacher or any other teacher designated to act in this position will
be interviewed as head teacher. Absent Head teachers will also be
categorized as AA, UA or UAE Un Authorized Emergence
Authorized Absence Teachers not present at the school at the time of the Baseline or
Verification exercise with written evidence of authorization.
Absent due to Emergency
(ADE)
Teachers not present at the school at the time of the Baseline or
Verification exercise with no written evidence of authorization but with
verified emergency problems (death of; biological parent, spouse or
biological child) establish the number of days’ teacher has been absent-
teachers who have been away for more than a week will be marked as
UA. Those with verifiable emergency will be counted as present during
computation of DLI 7
Un Authorized Absence
(UA)
Teachers not present at the school at the time of the Baseline or
Verification exercise with no written evidence of authorization or
verified emergency

14
Concept/Item Definition
Enumerator The person recruited and trained by UPIMAC to participate in (i) the
counting of teachers present and ii) the assessment of the P2 teaching
as per the EGR time tabled lesson. All Enumerators will have
introduction letters. Two enumerators are expected per school in the
sample
District Supervisor The person recruited and trained by UPIMAC to participate in the
teacher presence Verification exercise- the District Supervisor is the
field coordinator and will be responsible for all the enumerators in a
particular UTSEP district.
Valid identification For teachers in the school valid identification will be either
− National Identity Card,
− Driving License,
− Passport,
− School Identity Card or
− Any other identification paper that is recognized at national level.
− Teacher appointment/posting letter
Baseline The first field exercise to establish teacher presence that was undertaken
in the UTSEP schools
Verification Establishing the number of teachers present in a school at the time of
field Verification and P2 teachers teaching the time tabled lesson
P2 Time table The time table pinned on the class notice board
Scheme of Work
Teacher Utilization
Teaching Period
A scheme of work is the teachers own plan outlining what they will teach
during an academic term or period based on the curriculum. It is the
teachers’ interpretation of the curriculum and plan on how to implement
it in the period available
Number of teaching periods per teacher per week from school timetable
Appearance of a teacher on a time table to deliver a given lesson
Teacher Verification list
List of teachers expected in the UTSEP Schools as provided by
MOES
15
2.0 APPROACH AND METHODOLOGY
A scientific and vigourous methodological design was utilized to meet the objectives of the Verifications.
Similar to earlier exercises (Baseline Verification I and II), the Verification III was designed as a
descriptive cross-sectional study involving spot-check and verification of teachers in all public primary
schools in the 29 UTSEP implementing districts with the school as the unit of analysis. To effectively
manage the operational and logistical requirements of the verification exercise, the district was identified
as the point of of field coordination covering all the 29 UTSEP focussed Districts.
2.1 Methodology
The quantitative data collection method involving enumeration of teachers in selected schools through
unannounced Verifications was applied.
2.1.1 Study Population
The respondents identified as critical for inclusion in this study were: Head teachers, P1- P7 Teachers. The
P2 Teachers were used to address the study objective of Teacher on Task.
2.1.2 Sampling Design
The target school population for UTSEP is 2727 public primary schools. These constituted the sampling
frame for schools in the specified districts. The study population was stratified by districts with the
Coordinating Centres as the second stratification. The national sample of schools was allocated to each
district proportional to the number of schools in the district. Within each district a random sample of schools
was selected proportional to the number of schools in the Coordinating Centres from which teacher
presence was verified. By implication, all the 11 local languages targeted under UTSEP are covered in the
sample (see table 3). For the purpose of observing a P2 reading lesson, a stream was selected at random
where the school had more than one P2 streams. Random selection was employed to minimize selection
bias. The sampling design as adopted in the Baseline was continued in subsequent Verifications and applied
to Verification III.
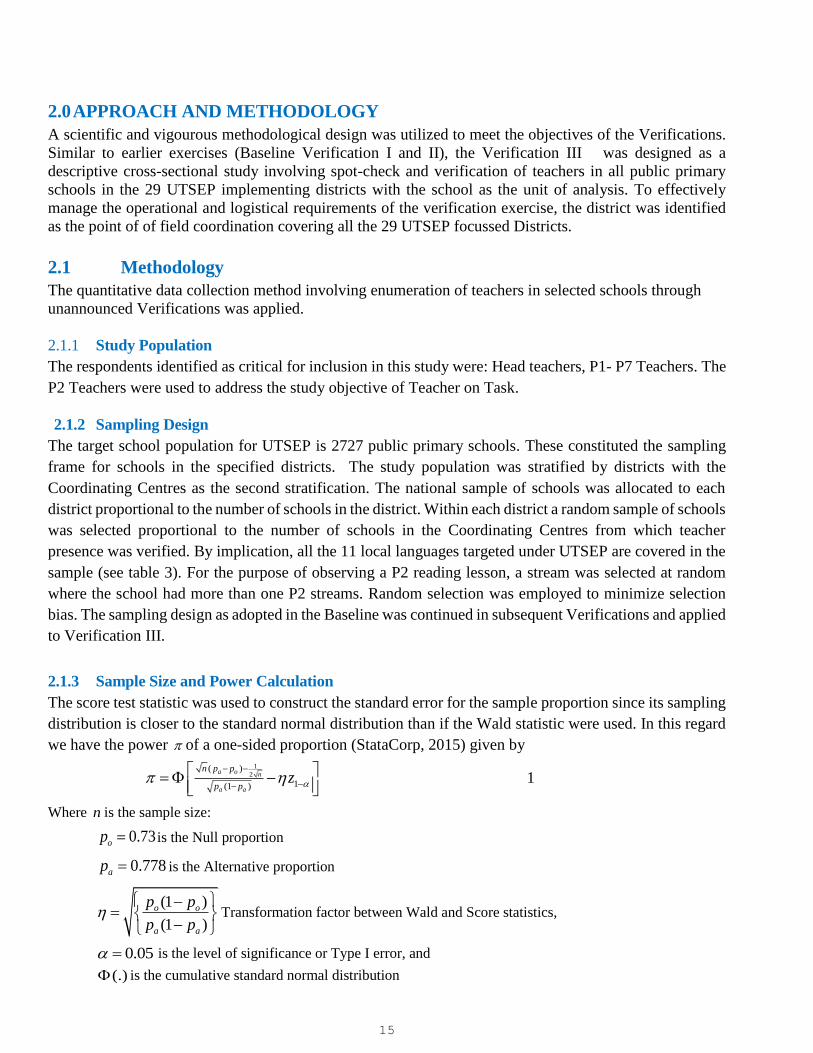
2.1.3 Sample Size and Power Calculation
The score test statistic was used to construct the standard error for the sample proportion since its sampling
distribution is closer to the standard normal distribution than if the Wald statistic were used. In this regard
we have the power of a one-sided proportion (StataCorp, 2015) given by
1
2( )
1(1 )
a o n
a a
n p p
p pz
− −
−−
= −
1
Where n is the sample size:
0.73op = is the Null proportion
0.778ap = is the Alternative proportion
(1 )
(1 )
o o
a a
p p
p p
−=
− Transformation factor between Wald and Score statistics,
0.05 = is the level of significance or Type I error, and
(.) is the cumulative standard normal distribution
16
Re-arranging Equation 1, we get that the sample size for the one sample proportion test for an effect size a op p = −
is given by
2
1 1(1 ) (1 )o o a az p p z p pn
− − − + −
=
Where is the Type II error, for which the power of the test is 1 = − .
Using Equation 2, we get:
2
21.64485 (0.73 0.27) 0.84735012 (0.778 0.222)22.54949 508.48
0.048n
+ = = =
Assuming a design effect of 1.14 owing to loss of precision by way of stratification we have a sample of
508.48 1.14 579.6672 580n = = schools. Hence, sample size of 580 schools for a positive minimum
detectable effect size of 4.8% on teacher attendance in primary schools (Kremer, Miguel, and Thornton1,
2009) would provide a power of 88.7% for a one-sided proportion test at 5% level of significance at every
Verification stage. The power calculation was made in Stata 13.1.
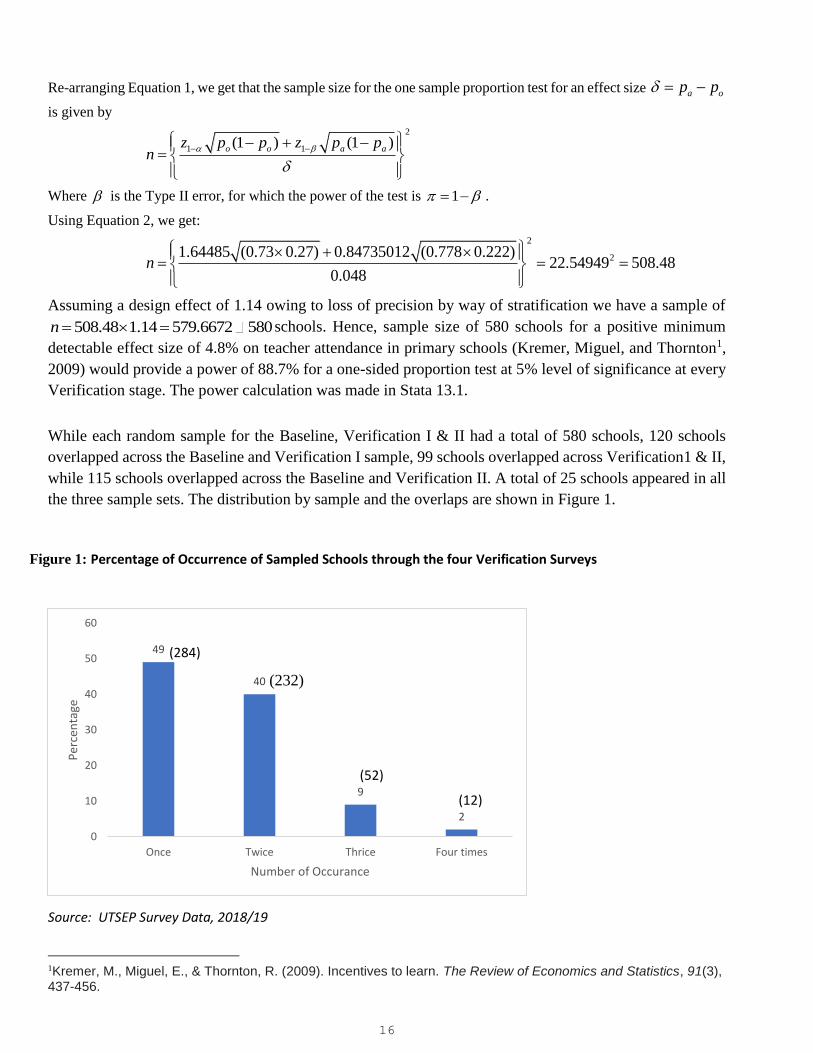
While each random sample for the Baseline, Verification I & II had a total of 580 schools, 120 schools
overlapped across the Baseline and Verification I sample, 99 schools overlapped across Verification1 & II,
while 115 schools overlapped across the Baseline and Verification II. A total of 25 schools appeared in all
the three sample sets. The distribution by sample and the overlaps are shown in Figure 1.
Source: UTSEP Survey Data, 2018/19
1Kremer, M., Miguel, E., & Thornton, R. (2009). Incentives to learn. The Review of Economics and Statistics, 91(3), 437-456.
49
40
9
2
0
10
20
30
40
50
60
Once Twice Thrice Four times
Per
cen
tage
Number of Occurance
(284)
(52)
(12)
Figure 1: Percentage of Occurrence of Sampled Schools through the four Verification Surveys
(232)
17
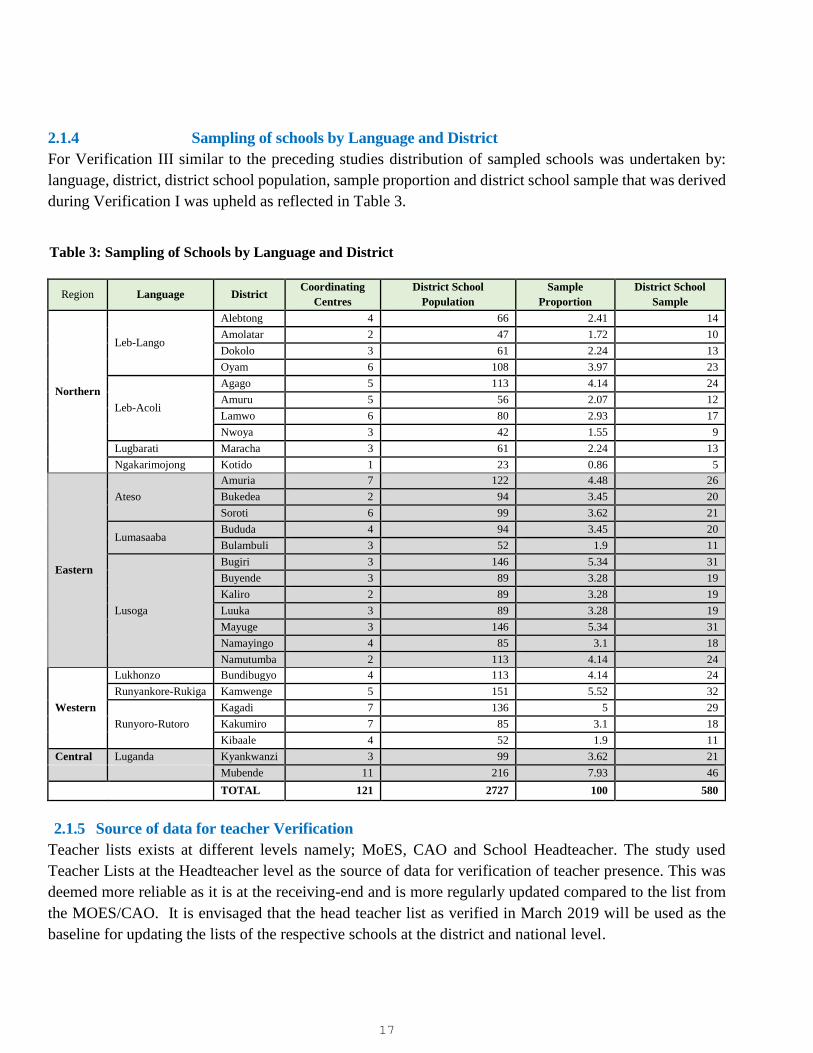
2.1.4 Sampling of schools by Language and District
For Verification III similar to the preceding studies distribution of sampled schools was undertaken by:
language, district, district school population, sample proportion and district school sample that was derived
during Verification I was upheld as reflected in Table 3.
Region Language District Coordinating
Centres
District School
Population
Sample
Proportion
District School
Sample
Northern
Leb-Lango
Alebtong 4 66 2.41 14
Amolatar 2 47 1.72 10
Dokolo 3 61 2.24 13
Oyam 6 108 3.97 23
Leb-Acoli
Agago 5 113 4.14 24
Amuru 5 56 2.07 12
Lamwo 6 80 2.93 17
Nwoya 3 42 1.55 9
Lugbarati Maracha 3 61 2.24 13
Ngakarimojong Kotido 1 23 0.86 5
Eastern
Ateso
Amuria 7 122 4.48 26
Bukedea 2 94 3.45 20
Soroti 6 99 3.62 21
Lumasaaba Bududa 4 94 3.45 20
Bulambuli 3 52 1.9 11
Lusoga
Bugiri 3 146 5.34 31
Buyende 3 89 3.28 19
Kaliro 2 89 3.28 19
Luuka 3 89 3.28 19
Mayuge 3 146 5.34 31
Namayingo 4 85 3.1 18
Namutumba 2 113 4.14 24
Western
Lukhonzo Bundibugyo 4 113 4.14 24
Runyankore-Rukiga Kamwenge 5 151 5.52 32
Runyoro-Rutoro
Kagadi 7 136 5 29
Kakumiro 7 85 3.1 18
Kibaale 4 52 1.9 11
Central Luganda Kyankwanzi 3 99 3.62 21
Mubende 11 216 7.93 46
TOTAL 121 2727 100 580
2.1.5 Source of data for teacher Verification
Teacher lists exists at different levels namely; MoES, CAO and School Headteacher. The study used
Teacher Lists at the Headteacher level as the source of data for verification of teacher presence. This was
deemed more reliable as it is at the receiving-end and is more regularly updated compared to the list from
the MOES/CAO. It is envisaged that the head teacher list as verified in March 2019 will be used as the
baseline for updating the lists of the respective schools at the district and national level.
Table 3: Sampling of Schools by Language and District
18
2.2 Approach to Data collection
Similar to previous verifications, this study employed modern techniques for data collection with a mobile
electronic data collection platform using palmtops and the survey tool SurveyCTO. This comes with speed
and reliability in data collection and real time transmission to the main server. The platform for electronic
data-collection was optimized for ease-of-use and data-security. Electronic Data Collection (EDC) enabled
real-time data flow which facilitated quick turnaround data cleaning, remote monitoring of data quality,
crosschecking of all entries for internal consistency and flagging of outliers.
Enumerators were further requested to identify those unique attributes at the respective schools. The District
supervisor compiled these extra-ordinary findings into a district report that was submitted together with the
data collection tools.
Additional data collection was made through phone interviews with the respective head teachers to
ascertain the workload/ number of periods taught by each teacher in the sample schools. Using the initial
teacher list as a guide, head teachers were requested to provide a detail of the weekly load.
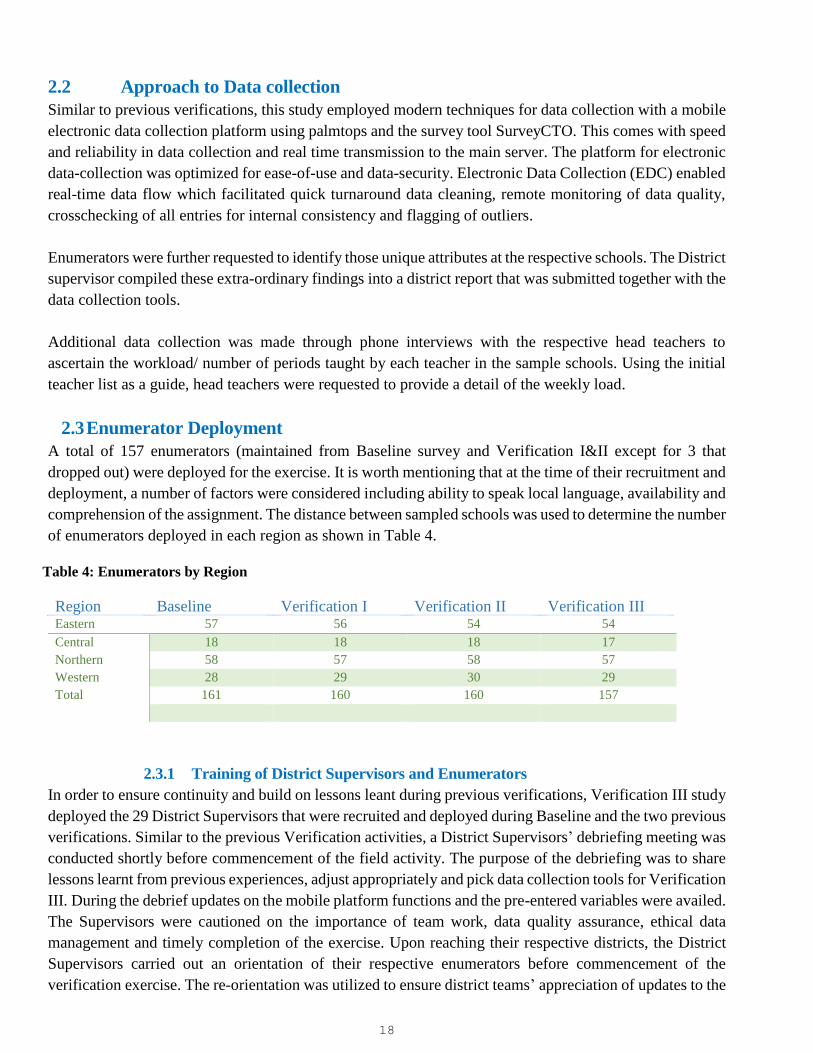
2.3 Enumerator Deployment
A total of 157 enumerators (maintained from Baseline survey and Verification I&II except for 3 that
dropped out) were deployed for the exercise. It is worth mentioning that at the time of their recruitment and
deployment, a number of factors were considered including ability to speak local language, availability and
comprehension of the assignment. The distance between sampled schools was used to determine the number
of enumerators deployed in each region as shown in Table 4.
Region Baseline Verification I Verification II Verification III Eastern 57 56 54 54
Central 18 18 18 17
Northern 58 57 58 57
Western 28 29 30 29
Total 161 160 160 157
2.3.1 Training of District Supervisors and Enumerators
In order to ensure continuity and build on lessons leant during previous verifications, Verification III study
deployed the 29 District Supervisors that were recruited and deployed during Baseline and the two previous
verifications. Similar to the previous Verification activities, a District Supervisors’ debriefing meeting was
conducted shortly before commencement of the field activity. The purpose of the debriefing was to share
lessons learnt from previous experiences, adjust appropriately and pick data collection tools for Verification
III. During the debrief updates on the mobile platform functions and the pre-entered variables were availed.
The Supervisors were cautioned on the importance of team work, data quality assurance, ethical data
management and timely completion of the exercise. Upon reaching their respective districts, the District
Supervisors carried out an orientation of their respective enumerators before commencement of the
verification exercise. The re-orientation was utilized to ensure district teams’ appreciation of updates to the
Table 4: Enumerators by Region
19
data collection tool, strategize for effective data collection, distribution and test running of the palmtops.
Other points priotitized were: decent dress codes, friendly approaches, time management and safety of
person, data and equipment and a coutersy call on district officials by district supervisors.
2.3.2 Data collection in the sampled schools
As in previous verifications, data was collected in two days from all the 580 sampled schools making a
response rate of 100%. The second time a 100% rate was registered after Verification II. This compares to
578 (99.6%) at Verification I and 566 (97.5 %) at Baseline. This exceptional performance is attributed to;
Cooperation of District officials, maintainace of same pool of Supervisors and Enumerators who had
garnered experience in the activity, adequate advance preparations including District Supervisor Debrief
meeting, motivation and commitment of field team, proficient use of palmtops, continuous contact with
District Supervisors and Enumerators through their respective Whatsapp groups and quick and timely
backup support from Secretariat, specifically during field work. The enumerators were paired and allocated
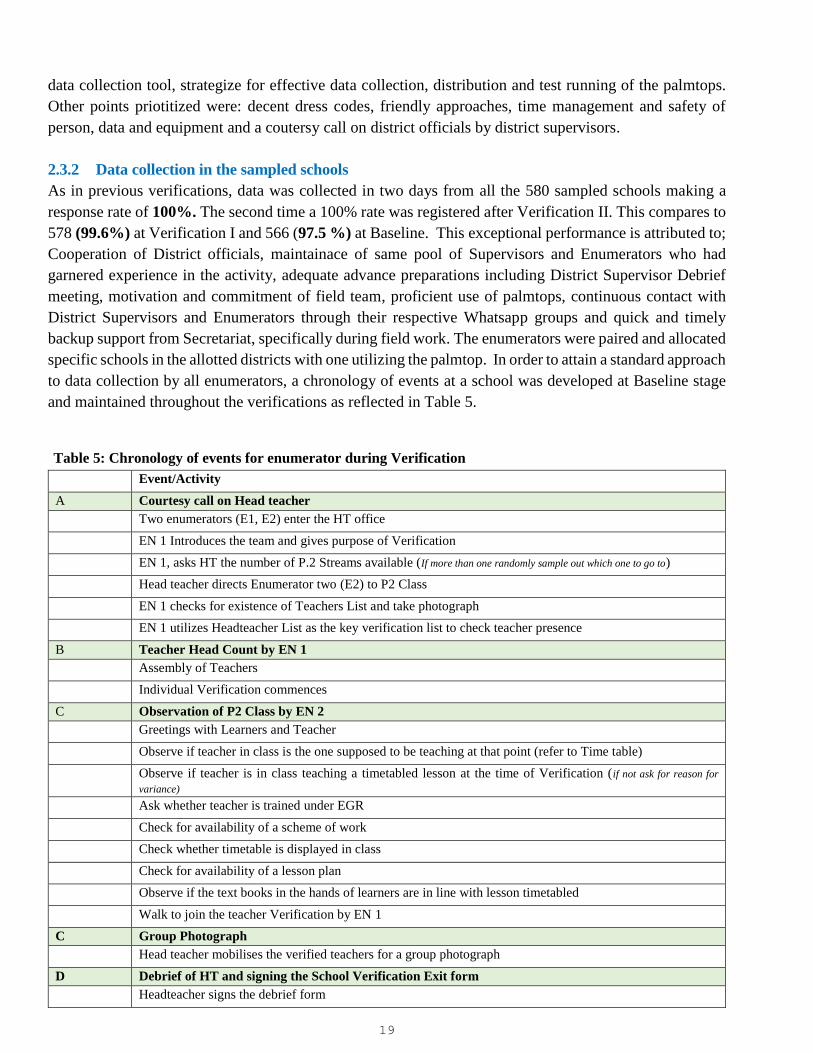
specific schools in the allotted districts with one utilizing the palmtop. In order to attain a standard approach
to data collection by all enumerators, a chronology of events at a school was developed at Baseline stage
and maintained throughout the verifications as reflected in Table 5.
Event/Activity
A Courtesy call on Head teacher
Two enumerators (E1, E2) enter the HT office
EN 1 Introduces the team and gives purpose of Verification
EN 1, asks HT the number of P.2 Streams available (If more than one randomly sample out which one to go to)
Head teacher directs Enumerator two (E2) to P2 Class
EN 1 checks for existence of Teachers List and take photograph
EN 1 utilizes Headteacher List as the key verification list to check teacher presence
B Teacher Head Count by EN 1
Assembly of Teachers
Individual Verification commences
C Observation of P2 Class by EN 2
Greetings with Learners and Teacher
Observe if teacher in class is the one supposed to be teaching at that point (refer to Time table)
Observe if teacher is in class teaching a timetabled lesson at the time of Verification (if not ask for reason for
variance)
Ask whether teacher is trained under EGR
Check for availability of a scheme of work
Check whether timetable is displayed in class
Check for availability of a lesson plan
Observe if the text books in the hands of learners are in line with lesson timetabled
Walk to join the teacher Verification by EN 1
C Group Photograph
Head teacher mobilises the verified teachers for a group photograph
D Debrief of HT and signing the School Verification Exit form
Headteacher signs the debrief form
Table 5: Chronology of events for enumerator during Verification
20
Total Time at a School
Shuttling from one school to another (average)
Available time for exercise (start time 8:30am)
The enumerators’ entry point at the school (similar to the Baseline and all verifications) was the head
teacher, except in cases where the head teacher was absent, the deputy head teacher or the teacher on duty
was substituted as the initial point of contact. As a data control mechanism for teacher presence, the
permissible point of entry at each school was 8:30 a.m.
During the teacher presence verification, the following identification documents were acceptable: National
Identity Card, school identity card, daily attendance record and appointment letters with any two of the
identification documents permissible since the Verification was impromptu.
The last stage of school visit was for the head teacher or his/her representative to sign on the hard copy of
the Head Teacher Debriefing form (see annex 3).
2.3.3 Use of GPS
The GPS capture was used as a quality control mechanism for confirmation of enumerator arrival at the
designated schools. It was also deemed useful in locating the schools in future. The SurveyCTO application
programmed in palmtops was utilized for the purpose. The derived GPS coordinates for the sampled schools
is shown in Annex 4.
2.3.4 Photography
Another quality control mechanism utilized was a group photograph which is evidence of actual teacher
presence in the school. It also helped to minimize the possibility of a head teacher compromising the
independence of an enumerator. Each teacher signed on the Verification attendance sheet as evidence of
presence in the school at the time of the Verification.
2.3.5 Data analysis
Data was analysed in due consideration of the study objectives which were mainly teacher presence and P2
teacher time on task. Descriptive analysis of the key variables such as presence and teacher time on task
early grade reading are presented in tables, charts and graphs in chapter 3 of the report. The analysis further
used bivariate approaches to establish association between key outcome variables textbooks in hands of
learners with and location (district) to establish areas where UTSEP may need to attach more effort.
2.4 Ethical Considerations and data quality assurance
To ensure that human rights and ethical concerns were observed, informed consent from teachers was
sought during the collection of direct information and indirect personal identifiers used during data
collection. The survey tool had a provision for outlining the purpose of the survey and each enumerator had
a copy of the letter of introduction from UPIMAC detailing the expectations for the Verification exercise.
Similar in the previous Verification activities, a Secretariat was maintained at UPIMAC office as a central
coordination point to provide technical and administrative back up support during the field data collection
exercise. After a day of field work, group data editing under the supervision of the District Supervisor was
conducted and data transmitted to the central server.
21
2.5 Limitations
Generally, the Verification III activity was a success with less significant limitations as reflected below:
a) Respondents for the P2 Teacher Time on Task
Similar to previous verification exercises, some Schools did not have P2 teachers assigned to the class
which limited the response rate and real time observations related to time on task.
b) Weather:
The exercise was undertaken during the rainy season and as such there were cases of late coming and
absence of teachers attributed to heavy rains.
c) Access Denial
A few head teachers especially from schools that had not been visited during previous verifications
denied the enumerators access until phone calls would be made advising them to allow the exercise to
go on which delayed the onset of the exercise in some schools.
d) Alcohol abuse
A few headteachers and teachers were found to be under high influence of alcohol such as that the
headteacher of Kakwa PS and a P2 teacher for Kamaka PS both in Maracha District.
22
3.0 FINDINGS
The main task of the verification was to establish the status of teacher presence and P2 teacher Time– on-
task in the schools sampled. This chapter accordingly presents findings on status of teacher presence and
P2 teacher Time– on- task in the schools sampled. It begins with general characteristics, portraying
geographical location and the demographics of the teachers in the 580 schools enumerated. The main
respondent for the status of teacher presence was the head teacher or the designated responsible officer at
the time of the visit.
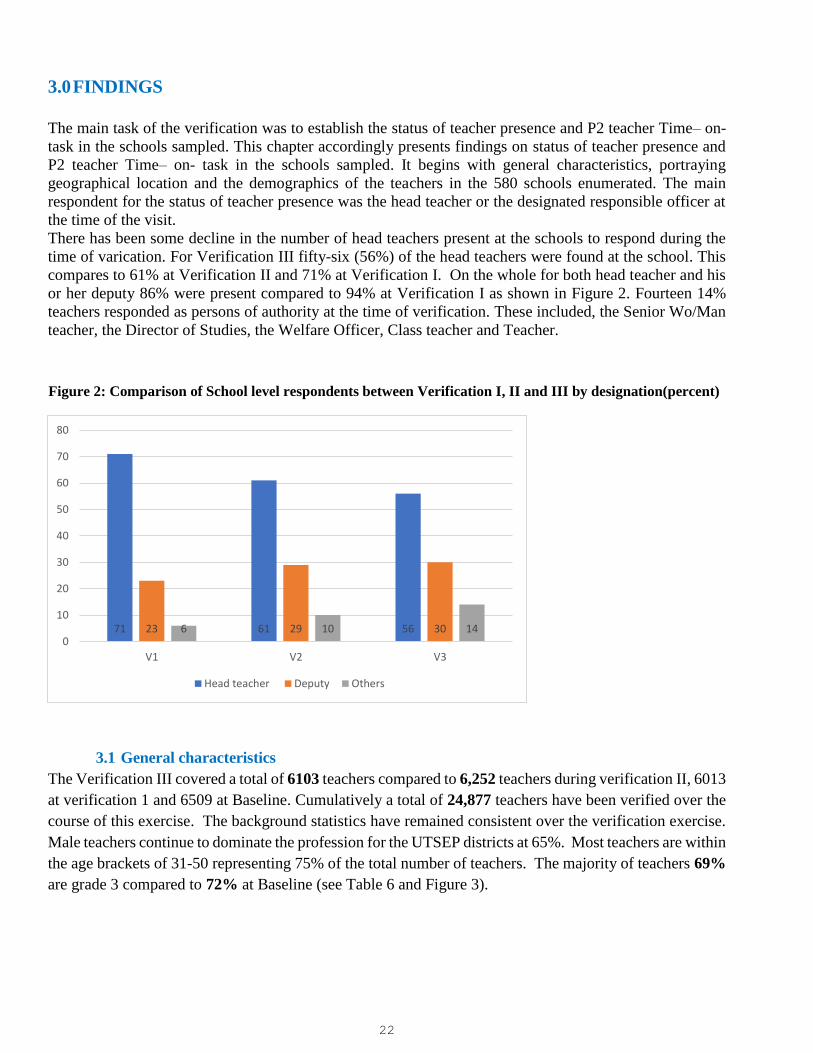
There has been some decline in the number of head teachers present at the schools to respond during the
time of varication. For Verification III fifty-six (56%) of the head teachers were found at the school. This
compares to 61% at Verification II and 71% at Verification I. On the whole for both head teacher and his
or her deputy 86% were present compared to 94% at Verification I as shown in Figure 2. Fourteen 14%
teachers responded as persons of authority at the time of verification. These included, the Senior Wo/Man
teacher, the Director of Studies, the Welfare Officer, Class teacher and Teacher.
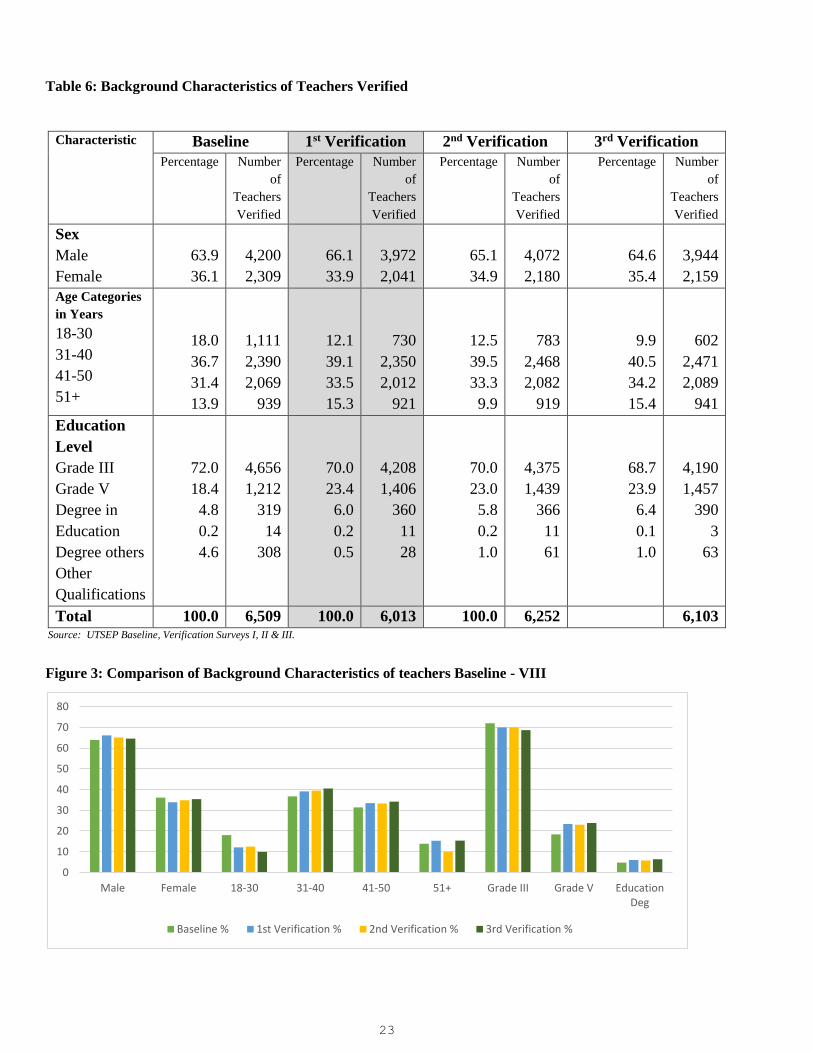
3.1 General characteristics
The Verification III covered a total of 6103 teachers compared to 6,252 teachers during verification II, 6013
at verification 1 and 6509 at Baseline. Cumulatively a total of 24,877 teachers have been verified over the
course of this exercise. The background statistics have remained consistent over the verification exercise.
Male teachers continue to dominate the profession for the UTSEP districts at 65%. Most teachers are within
the age brackets of 31-50 representing 75% of the total number of teachers. The majority of teachers 69%
are grade 3 compared to 72% at Baseline (see Table 6 and Figure 3).
71 61 5623 29 306 10 140
10
20
30
40
50
60
70
80
V1 V2 V3
Head teacher Deputy Others
Figure 2: Comparison of School level respondents between Verification I, II and III by designation(percent)
23
Characteristic Baseline 1st Verification 2nd Verification 3rd Verification
Percentage Number
of
Teachers
Verified
Percentage Number
of
Teachers
Verified
Percentage Number
of
Teachers
Verified
Percentage Number
of
Teachers
Verified
Sex
Male
Female
63.9
36.1
4,200
2,309
66.1
33.9
3,972
2,041
65.1
34.9
4,072
2,180
64.6
35.4
3,944
2,159
Age Categories
in Years
18-30
31-40
41-50
51+
18.0
36.7
31.4
13.9
1,111
2,390
2,069
939
12.1
39.1
33.5
15.3
730
2,350
2,012
921
12.5
39.5
33.3
9.9
783
2,468
2,082
919
9.9
40.5
34.2
15.4
602
2,471
2,089
941
Education
Level
Grade III
Grade V
Degree in
Education
Degree others
Other
Qualifications
72.0
18.4
4.8
0.2
4.6
4,656
1,212
319
14
308
70.0
23.4
6.0
0.2
0.5
4,208
1,406
360
11
28
70.0
23.0
5.8
0.2
1.0
4,375
1,439
366
11
61
68.7
23.9
6.4
0.1
1.0
4,190
1,457
390
3
63
Total 100.0 6,509 100.0 6,013 100.0 6,252 6,103 Source: UTSEP Baseline, Verification Surveys I, II & III.
0
10
20
30
40
50
60
70
80
Male Female 18-30 31-40 41-50 51+ Grade III Grade V EducationDeg
Baseline % 1st Verification % 2nd Verification % 3rd Verification %
Table 6: Background Characteristics of Teachers Verified
Figure 3: Comparison of Background Characteristics of teachers Baseline - VIII
24
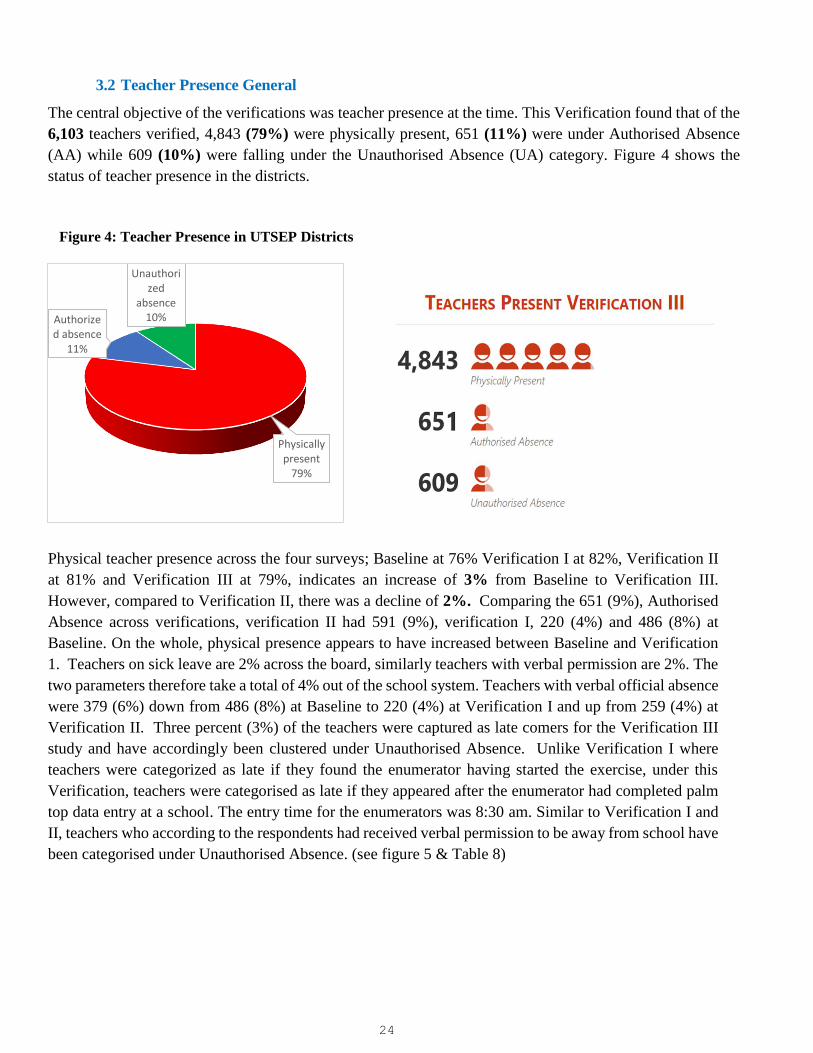
3.2 Teacher Presence General
The central objective of the verifications was teacher presence at the time. This Verification found that of the
6,103 teachers verified, 4,843 (79%) were physically present, 651 (11%) were under Authorised Absence
(AA) while 609 (10%) were falling under the Unauthorised Absence (UA) category. Figure 4 shows the
status of teacher presence in the districts.
Physical teacher presence across the four surveys; Baseline at 76% Verification I at 82%, Verification II
at 81% and Verification III at 79%, indicates an increase of 3% from Baseline to Verification III.
However, compared to Verification II, there was a decline of 2%. Comparing the 651 (9%), Authorised
Absence across verifications, verification II had 591 (9%), verification I, 220 (4%) and 486 (8%) at
Baseline. On the whole, physical presence appears to have increased between Baseline and Verification
1. Teachers on sick leave are 2% across the board, similarly teachers with verbal permission are 2%. The
two parameters therefore take a total of 4% out of the school system. Teachers with verbal official absence
were 379 (6%) down from 486 (8%) at Baseline to 220 (4%) at Verification I and up from 259 (4%) at
Verification II. Three percent (3%) of the teachers were captured as late comers for the Verification III
study and have accordingly been clustered under Unauthorised Absence. Unlike Verification I where
teachers were categorized as late if they found the enumerator having started the exercise, under this
Verification, teachers were categorised as late if they appeared after the enumerator had completed palm
top data entry at a school. The entry time for the enumerators was 8:30 am. Similar to Verification I and
II, teachers who according to the respondents had received verbal permission to be away from school have
been categorised under Unauthorised Absence. (see figure 5 & Table 8)
Physically present
79%
Authorized absence
11%
Unauthorized
absence10%
Figure 4: Teacher Presence in UTSEP Districts

25
#
Teacher Status
Baseline Verification I
Varia
nce Verification
II
Verification
III
%age
variance
between
V3 &
Baseline
Num
ber %
Num
ber % %
Num
ber %
Num
ber %
%
A Physically Present 4,598 76% 4,946 82% 6% 5,063 81% 4,843 79% 3%
B Sick 123 2% 150 3% 1% 149 2% 131 2% 0%
C Annual Leave 3 0% 6 0% 0% 6 0% 3 0% 0%
D Study Leave 39 1% 20 0% -1% 38 1% 33 1% 0%
E Maternity/Paternity 40 1% 66 1% 0% 68 1% 34 1% 0%
F Official absence e.g.
attending workshop 486 8% 220 4%
-4% 259 4% 379 6% -2%
G Emergency 70 1% 82 1% 0% 71 1% 71 1% 0%
H Authorized absence
[H=B+C+D+E+F+G] 761 13% 544 9%
-4% 591 9% 651 11% -2%
I Total teacher present
[I=A+H] 5,359 89% 5,490 91%
2% 5,654 90% 5,494 90% 1%
J Late Attendance 91 2% 69 1% -1% 138 2% 152 3% 1%
K Verbal Permission 201 3% 91 2% -1% 150 2% 136 2% -1%
L Absent with no reason 394 7% 363 6% -1% 310 5% 321 5% -2%
M Unauthorized absence
[M=J+K+L] 686 11% 523 9%
-2% 598 10% 609 10% -1%
N Verified and Posted
Teachers by CAO 6,045 6,013
6,252 6,103
0
10
20
30
40
50
60
70
80
90
100
Baseline Verification I Verification II Verification III
76 82 81 79
139 9 11
11 9 10 10
Physically present Authorized absence Unauthorized absence
Figure 5: Teacher Presence Across the Surveys (Percent)
Table 7: Status of teacher Presence in the Sampled Schools
26
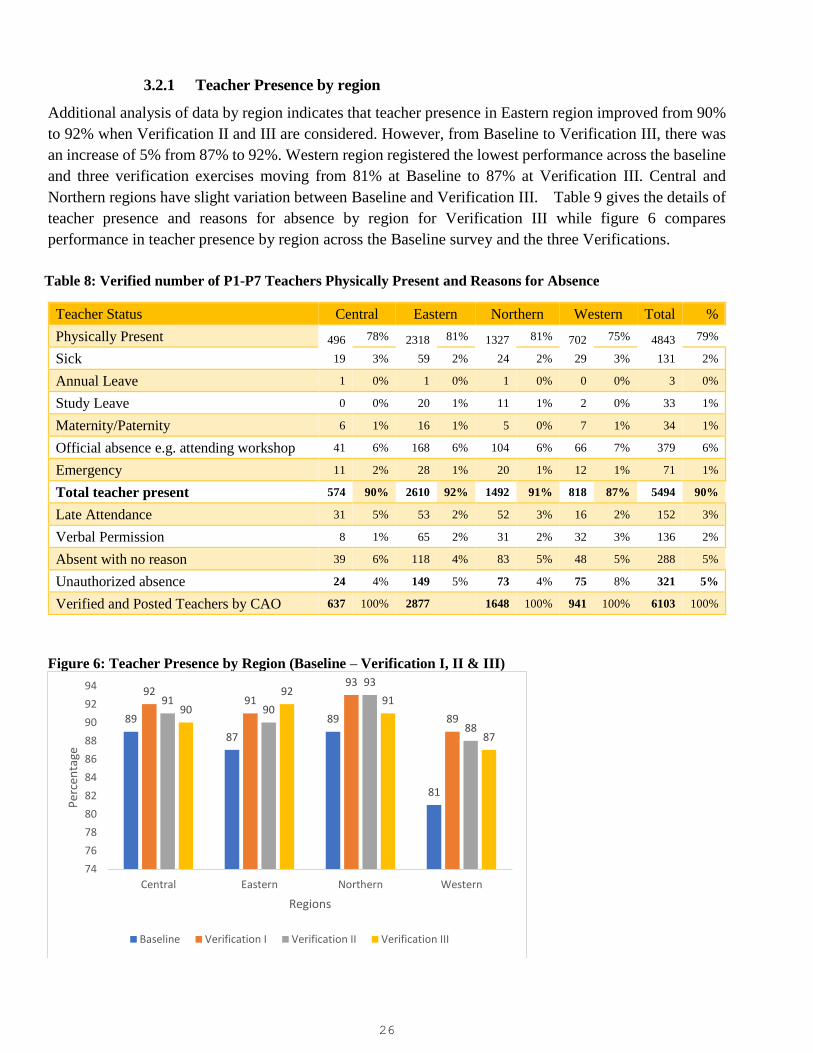
3.2.1 Teacher Presence by region
Additional analysis of data by region indicates that teacher presence in Eastern region improved from 90%
to 92% when Verification II and III are considered. However, from Baseline to Verification III, there was
an increase of 5% from 87% to 92%. Western region registered the lowest performance across the baseline
and three verification exercises moving from 81% at Baseline to 87% at Verification III. Central and
Northern regions have slight variation between Baseline and Verification III. Table 9 gives the details of
teacher presence and reasons for absence by region for Verification III while figure 6 compares
performance in teacher presence by region across the Baseline survey and the three Verifications.
Teacher Status Central Eastern Northern Western Total %
Physically Present 496 78% 2318 81% 1327 81% 702 75% 4843 79%
Sick 19 3% 59 2% 24 2% 29 3% 131 2%
Annual Leave 1 0% 1 0% 1 0% 0 0% 3 0%
Study Leave 0 0% 20 1% 11 1% 2 0% 33 1%
Maternity/Paternity 6 1% 16 1% 5 0% 7 1% 34 1%
Official absence e.g. attending workshop 41 6% 168 6% 104 6% 66 7% 379 6%
Emergency 11 2% 28 1% 20 1% 12 1% 71 1%
Total teacher present 574 90% 2610 92% 1492 91% 818 87% 5494 90%
Late Attendance 31 5% 53 2% 52 3% 16 2% 152 3%
Verbal Permission 8 1% 65 2% 31 2% 32 3% 136 2%
Absent with no reason 39 6% 118 4% 83 5% 48 5% 288 5%
Unauthorized absence 24 4% 149 5% 73 4% 75 8% 321 5%
Verified and Posted Teachers by CAO 637 100% 2877 1648 100% 941 100% 6103 100%
Figure 6: Teacher Presence by Region (Baseline – Verification I, II & III)
89
87
89
81
9291
93
89
9190
93
88
90
9291
87
74
76
78
80
82
84
86
88
90
92
94
Central Eastern Northern Western
Per
cen
tage
Regions
Baseline Verification I Verification II Verification III
Table 8: Verified number of P1-P7 Teachers Physically Present and Reasons for Absence
27
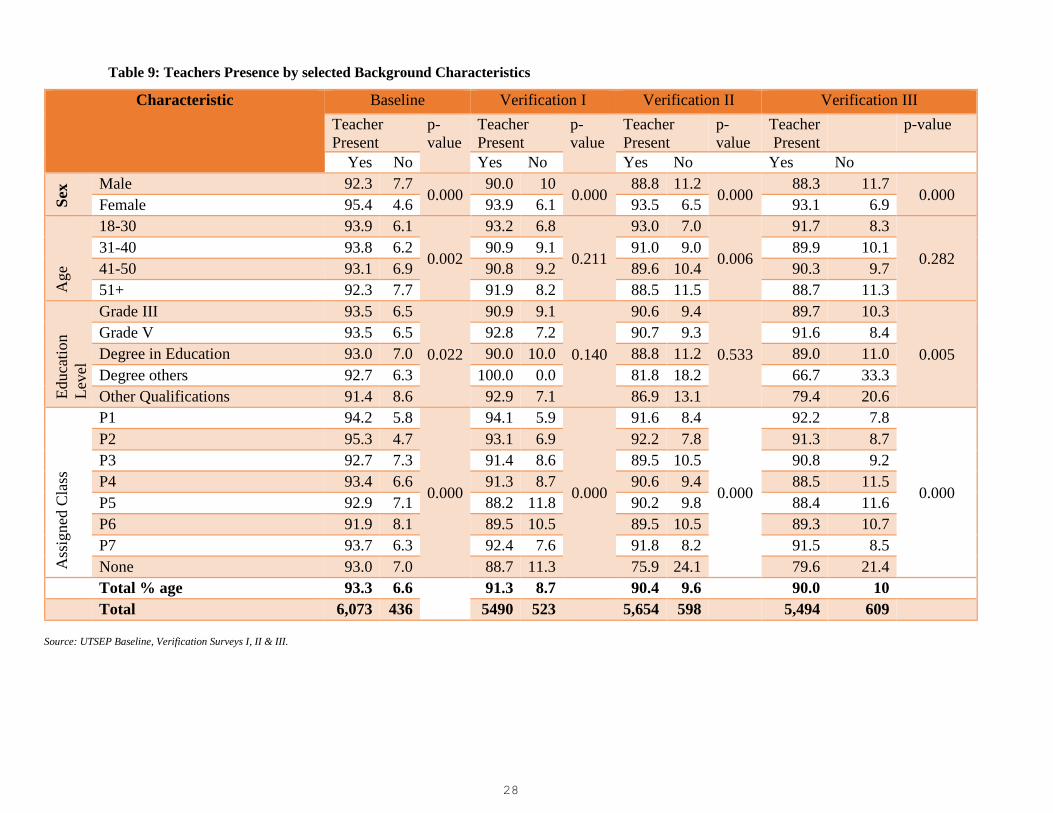
3.2.2 Teacher Presence by Gender and Age Category
The study disaggregated data by Gender to show who among the females and males was likely to be
present and by Age Category to show which age category was more likely to be present. Female teachers
have consistently been more physically present than their male counterparts, that is, 95% at Baseline, 94%
at Verification I & II, and 93% at Verification III. For the male counterparts, the percentage of teachers
present at Baseline was 92%, 90% at Verification I, 89% at Verification II and 88% at Verification III.
The 18-30 age category were found more physically present across all the Verifications compared to the
51+ age group.
3.2.3 Teacher Presence by Assigned Class
The study found that Teachers with no class assigned to them were less physically present during
Verification III at 80% compared to 76% at verification II, while for those assigned, P1, P2 and P7 teachers
were more physically present. Overall, the variations between Baseline and Verification I - III are not
significant as depicted in Table 10.
28
Characteristic Baseline Verification I Verification II Verification III
Teacher
Present
p-
value
Teacher
Present
p-
value
Teacher
Present
p-
value
Teacher
Present
p-value
Yes No Yes No Yes No Yes No
Sex
Male 92.3 7.7 0.000
90.0 10 0.000
88.8 11.2 0.000
88.3 11.7 0.000
Female 95.4 4.6 93.9 6.1 93.5 6.5 93.1 6.9
Age
18-30 93.9 6.1
0.002
93.2 6.8
0.211
93.0 7.0
0.006
91.7 8.3
0.282 31-40 93.8 6.2 90.9 9.1 91.0 9.0 89.9 10.1
41-50 93.1 6.9 90.8 9.2 89.6 10.4 90.3 9.7
51+ 92.3 7.7 91.9 8.2 88.5 11.5 88.7 11.3
Educa
tion
Lev
el
Grade III 93.5 6.5
0.022
90.9 9.1
0.140
90.6 9.4
0.533
89.7 10.3
0.005
Grade V 93.5 6.5 92.8 7.2 90.7 9.3 91.6 8.4
Degree in Education 93.0 7.0 90.0 10.0 88.8 11.2 89.0 11.0
Degree others 92.7 6.3 100.0 0.0 81.8 18.2 66.7 33.3
Other Qualifications 91.4 8.6 92.9 7.1 86.9 13.1 79.4 20.6
Ass
igned
Cla
ss
P1 94.2 5.8
0.000
94.1 5.9
0.000
91.6 8.4
0.000
92.2 7.8
0.000
P2 95.3 4.7 93.1 6.9 92.2 7.8 91.3 8.7
P3 92.7 7.3 91.4 8.6 89.5 10.5 90.8 9.2
P4 93.4 6.6 91.3 8.7 90.6 9.4 88.5 11.5
P5 92.9 7.1 88.2 11.8 90.2 9.8 88.4 11.6
P6 91.9 8.1 89.5 10.5 89.5 10.5 89.3 10.7
P7 93.7 6.3 92.4 7.6 91.8 8.2 91.5 8.5
None 93.0 7.0 88.7 11.3 75.9 24.1 79.6 21.4
Total % age 93.3 6.6 91.3 8.7 90.4 9.6 90.0 10
Total 6,073 436 5490 523 5,654 598 5,494 609
Source: UTSEP Baseline, Verification Surveys I, II & III.
Table 9: Teachers Presence by selected Background Characteristics
29
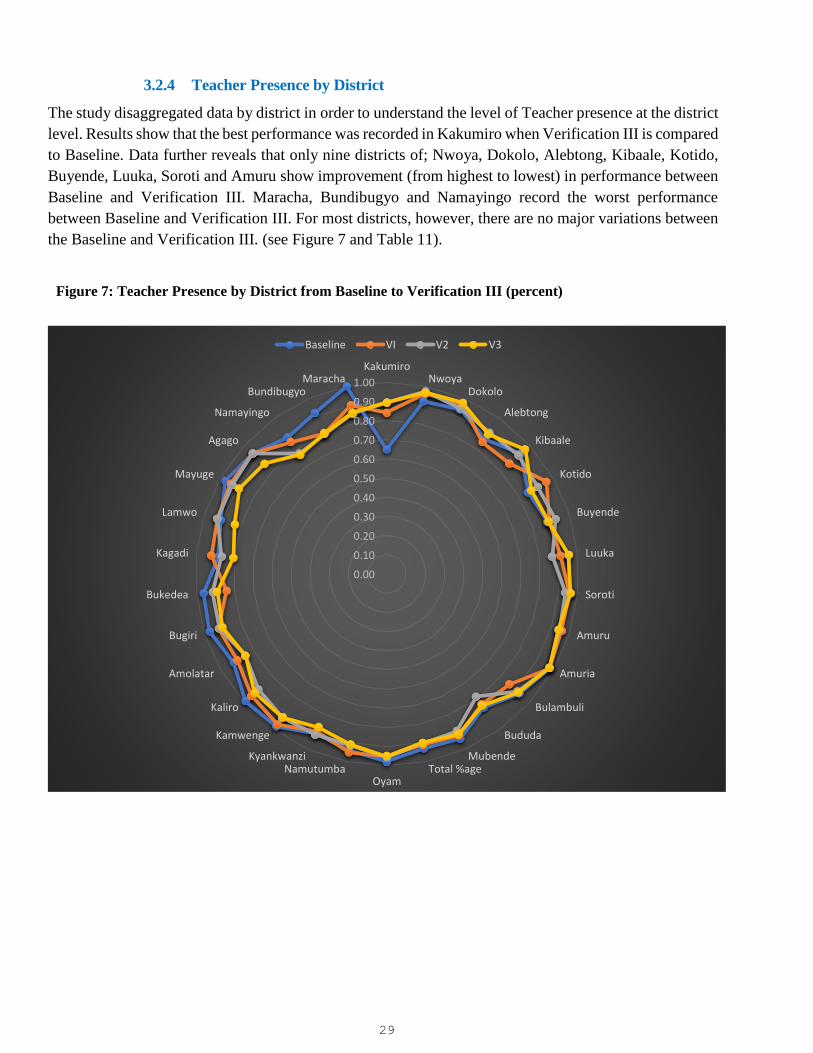
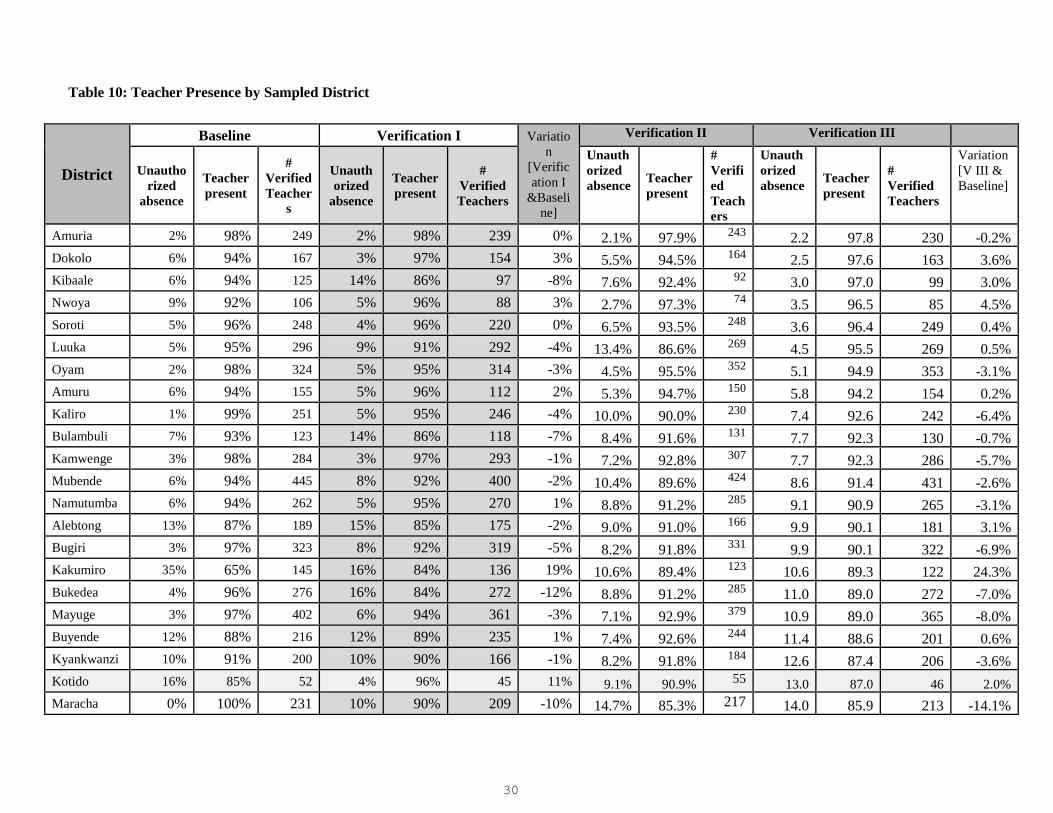
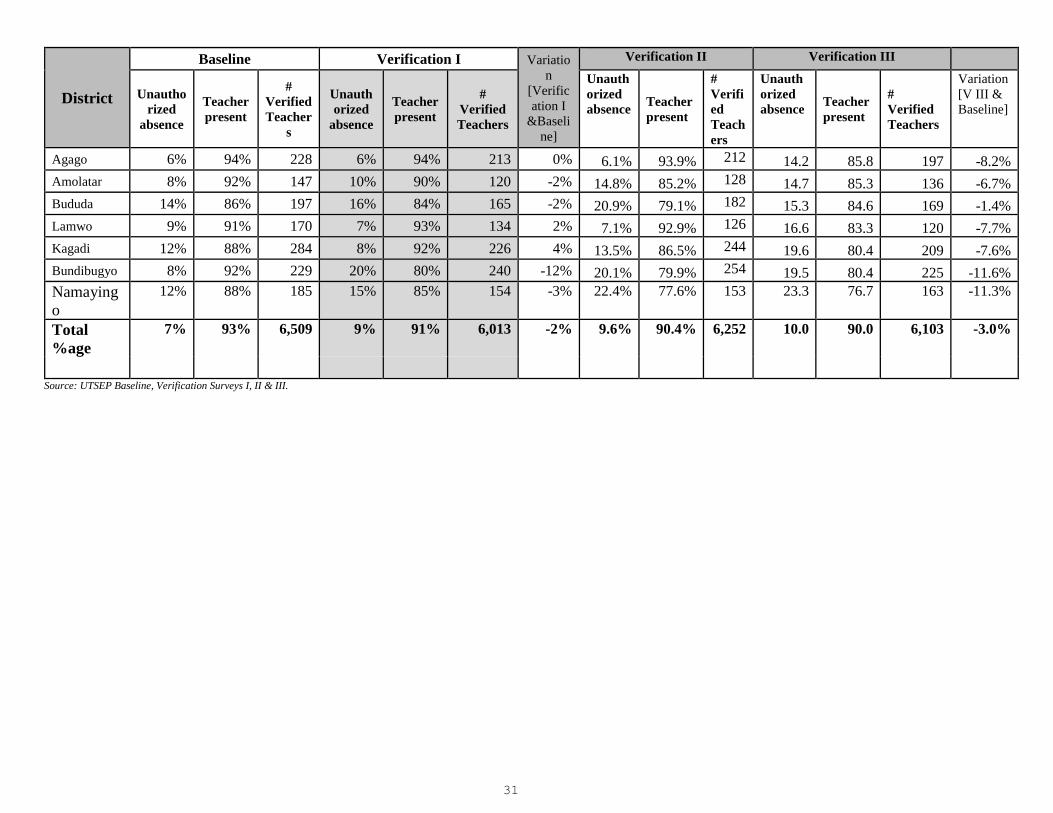
3.2.4 Teacher Presence by District
The study disaggregated data by district in order to understand the level of Teacher presence at the district
level. Results show that the best performance was recorded in Kakumiro when Verification III is compared
to Baseline. Data further reveals that only nine districts of; Nwoya, Dokolo, Alebtong, Kibaale, Kotido,
Buyende, Luuka, Soroti and Amuru show improvement (from highest to lowest) in performance between
Baseline and Verification III. Maracha, Bundibugyo and Namayingo record the worst performance
between Baseline and Verification III. For most districts, however, there are no major variations between
the Baseline and Verification III. (see Figure 7 and Table 11).
0.00
0.10
0.20
0.30
0.40
0.50
0.60
0.70
0.80
0.90
1.00
KakumiroNwoya
Dokolo
Alebtong
Kibaale
Kotido
Buyende
Luuka
Soroti
Amuru
Amuria
Bulambuli
Bududa
MubendeTotal %age
OyamNamutumba
Kyankwanzi
Kamwenge
Kaliro
Amolatar
Bugiri
Bukedea
Kagadi
Lamwo
Mayuge
Agago
Namayingo
BundibugyoMaracha
Baseline VI V2 V3
Figure 7: Teacher Presence by District from Baseline to Verification III (percent)
30
District
Baseline Verification I Variatio
n
[Verific
ation I
&Baseli
ne]
Verification II Verification III
Unautho
rized
absence
Teacher
present
#
Verified
Teacher
s
Unauth
orized
absence
Teacher
present
#
Verified
Teachers
Unauth
orized
absence Teacher
present
#
Verifi
ed
Teach
ers
Unauth
orized
absence Teacher
present
#
Verified
Teachers
Variation
[V III &
Baseline]
Amuria 2% 98% 249 2% 98% 239 0% 2.1% 97.9% 243 2.2 97.8 230 -0.2%
Dokolo 6% 94% 167 3% 97% 154 3% 5.5% 94.5% 164 2.5 97.6 163 3.6%
Kibaale 6% 94% 125 14% 86% 97 -8% 7.6% 92.4% 92 3.0 97.0 99 3.0%
Nwoya 9% 92% 106 5% 96% 88 3% 2.7% 97.3% 74 3.5 96.5 85 4.5%
Soroti 5% 96% 248 4% 96% 220 0% 6.5% 93.5% 248 3.6 96.4 249 0.4%
Luuka 5% 95% 296 9% 91% 292 -4% 13.4% 86.6% 269 4.5 95.5 269 0.5%
Oyam 2% 98% 324 5% 95% 314 -3% 4.5% 95.5% 352 5.1 94.9 353 -3.1%
Amuru 6% 94% 155 5% 96% 112 2% 5.3% 94.7% 150 5.8 94.2 154 0.2%
Kaliro 1% 99% 251 5% 95% 246 -4% 10.0% 90.0% 230 7.4 92.6 242 -6.4%
Bulambuli 7% 93% 123 14% 86% 118 -7% 8.4% 91.6% 131 7.7 92.3 130 -0.7%
Kamwenge 3% 98% 284 3% 97% 293 -1% 7.2% 92.8% 307 7.7 92.3 286 -5.7%
Mubende 6% 94% 445 8% 92% 400 -2% 10.4% 89.6% 424 8.6 91.4 431 -2.6%
Namutumba 6% 94% 262 5% 95% 270 1% 8.8% 91.2% 285 9.1 90.9 265 -3.1%
Alebtong 13% 87% 189 15% 85% 175 -2% 9.0% 91.0% 166 9.9 90.1 181 3.1%
Bugiri 3% 97% 323 8% 92% 319 -5% 8.2% 91.8% 331 9.9 90.1 322 -6.9%
Kakumiro 35% 65% 145 16% 84% 136 19% 10.6% 89.4% 123 10.6 89.3 122 24.3%
Bukedea 4% 96% 276 16% 84% 272 -12% 8.8% 91.2% 285 11.0 89.0 272 -7.0%
Mayuge 3% 97% 402 6% 94% 361 -3% 7.1% 92.9% 379 10.9 89.0 365 -8.0%
Buyende 12% 88% 216 12% 89% 235 1% 7.4% 92.6% 244 11.4 88.6 201 0.6%
Kyankwanzi 10% 91% 200 10% 90% 166 -1% 8.2% 91.8% 184 12.6 87.4 206 -3.6%
Kotido 16% 85% 52 4% 96% 45 11% 9.1% 90.9% 55 13.0 87.0 46 2.0%
Maracha 0% 100% 231 10% 90% 209 -10% 14.7% 85.3% 217 14.0 85.9 213 -14.1%
Table 10: Teacher Presence by Sampled District
31
District
Baseline Verification I Variatio
n
[Verific
ation I
&Baseli
ne]
Verification II Verification III
Unautho
rized
absence
Teacher
present
#
Verified
Teacher
s
Unauth
orized
absence
Teacher
present
#
Verified
Teachers
Unauth
orized
absence Teacher
present
#
Verifi
ed
Teach
ers
Unauth
orized
absence Teacher
present
#
Verified
Teachers
Variation
[V III &
Baseline]
Agago 6% 94% 228 6% 94% 213 0% 6.1% 93.9% 212 14.2 85.8 197 -8.2%
Amolatar 8% 92% 147 10% 90% 120 -2% 14.8% 85.2% 128 14.7 85.3 136 -6.7%
Bududa 14% 86% 197 16% 84% 165 -2% 20.9% 79.1% 182 15.3 84.6 169 -1.4%
Lamwo 9% 91% 170 7% 93% 134 2% 7.1% 92.9% 126 16.6 83.3 120 -7.7%
Kagadi 12% 88% 284 8% 92% 226 4% 13.5% 86.5% 244 19.6 80.4 209 -7.6%
Bundibugyo 8% 92% 229 20% 80% 240 -12% 20.1% 79.9% 254 19.5 80.4 225 -11.6%
Namaying
o
12% 88% 185 15% 85% 154 -3% 22.4% 77.6% 153 23.3 76.7 163 -11.3%
Total
%age
7% 93% 6,509 9% 91% 6,013 -2% 9.6% 90.4% 6,252 10.0 90.0 6,103 -3.0%
Source: UTSEP Baseline, Verification Surveys I, II & III.
32
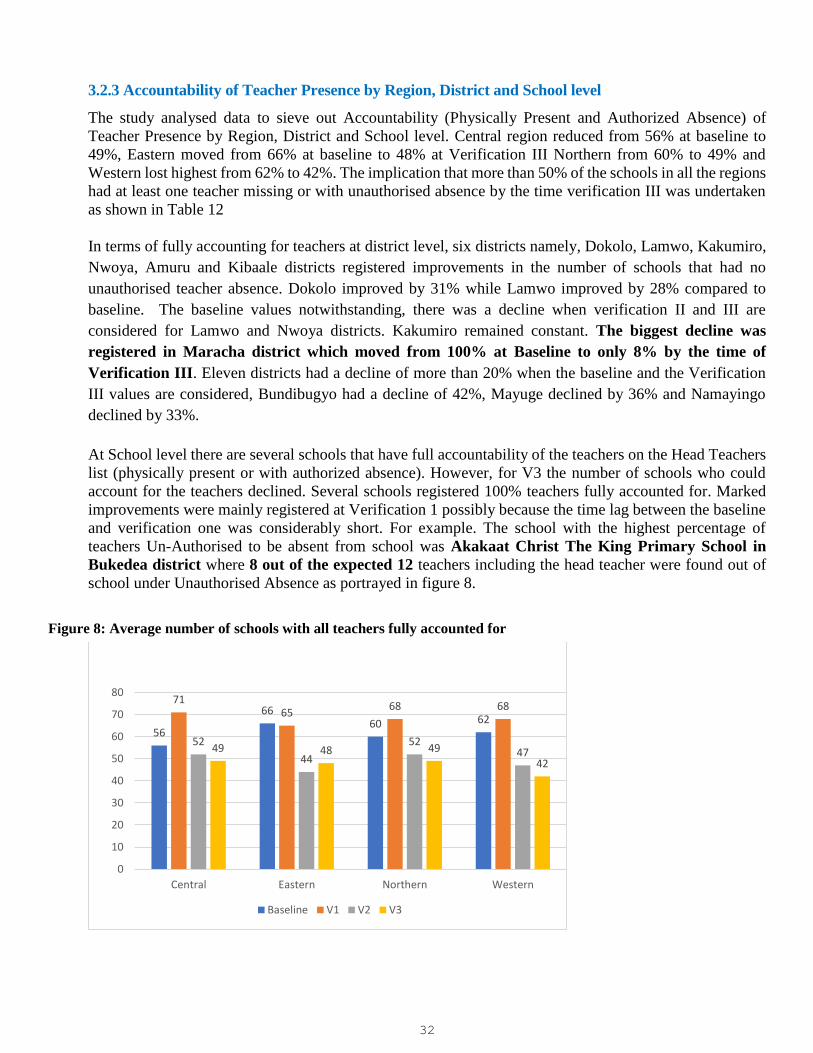
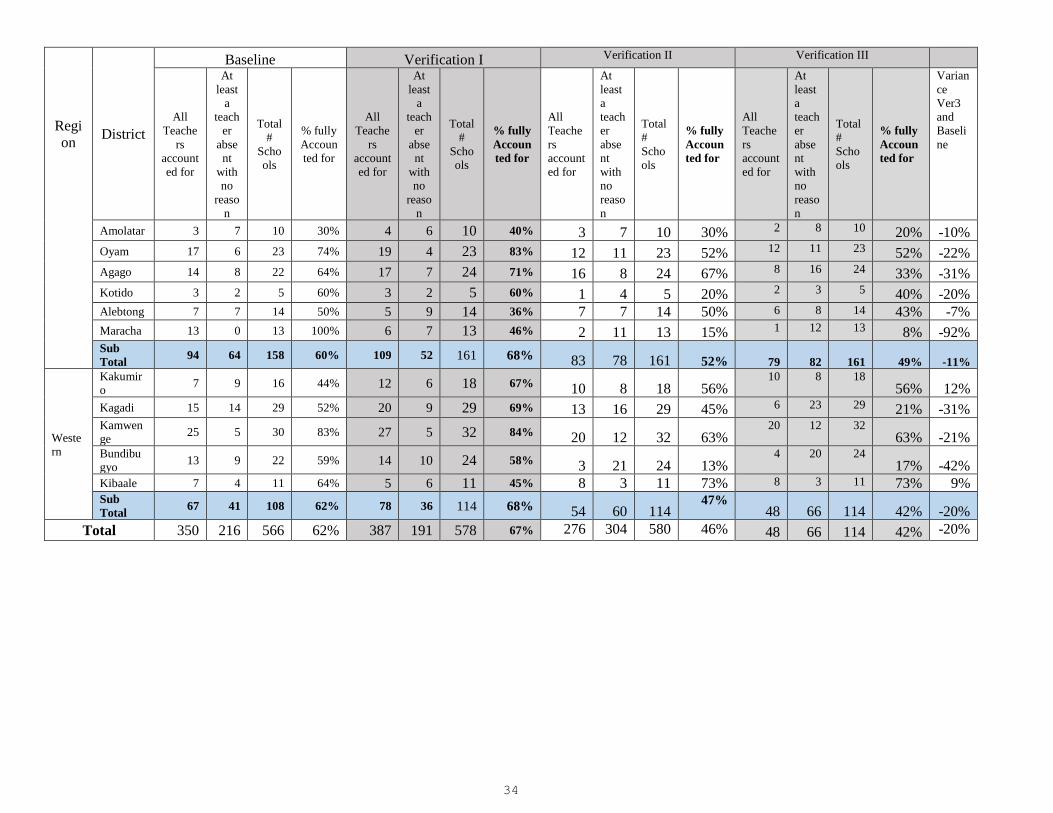
3.2.3 Accountability of Teacher Presence by Region, District and School level
The study analysed data to sieve out Accountability (Physically Present and Authorized Absence) of
Teacher Presence by Region, District and School level. Central region reduced from 56% at baseline to
49%, Eastern moved from 66% at baseline to 48% at Verification III Northern from 60% to 49% and
Western lost highest from 62% to 42%. The implication that more than 50% of the schools in all the regions
had at least one teacher missing or with unauthorised absence by the time verification III was undertaken
as shown in Table 12
In terms of fully accounting for teachers at district level, six districts namely, Dokolo, Lamwo, Kakumiro,
Nwoya, Amuru and Kibaale districts registered improvements in the number of schools that had no
unauthorised teacher absence. Dokolo improved by 31% while Lamwo improved by 28% compared to
baseline. The baseline values notwithstanding, there was a decline when verification II and III are
considered for Lamwo and Nwoya districts. Kakumiro remained constant. The biggest decline was
registered in Maracha district which moved from 100% at Baseline to only 8% by the time of
Verification III. Eleven districts had a decline of more than 20% when the baseline and the Verification
III values are considered, Bundibugyo had a decline of 42%, Mayuge declined by 36% and Namayingo
declined by 33%.
At School level there are several schools that have full accountability of the teachers on the Head Teachers
list (physically present or with authorized absence). However, for V3 the number of schools who could
account for the teachers declined. Several schools registered 100% teachers fully accounted for. Marked
improvements were mainly registered at Verification 1 possibly because the time lag between the baseline
and verification one was considerably short. For example. The school with the highest percentage of
teachers Un-Authorised to be absent from school was Akakaat Christ The King Primary School in
Bukedea district where 8 out of the expected 12 teachers including the head teacher were found out of
school under Unauthorised Absence as portrayed in figure 8.
56
6660 62
7165
68 68
52
44
524749 48 49
42
0
10
20
30
40
50
60
70
80
Central Eastern Northern Western
Baseline V1 V2 V3
Figure 8: Average number of schools with all teachers fully accounted for
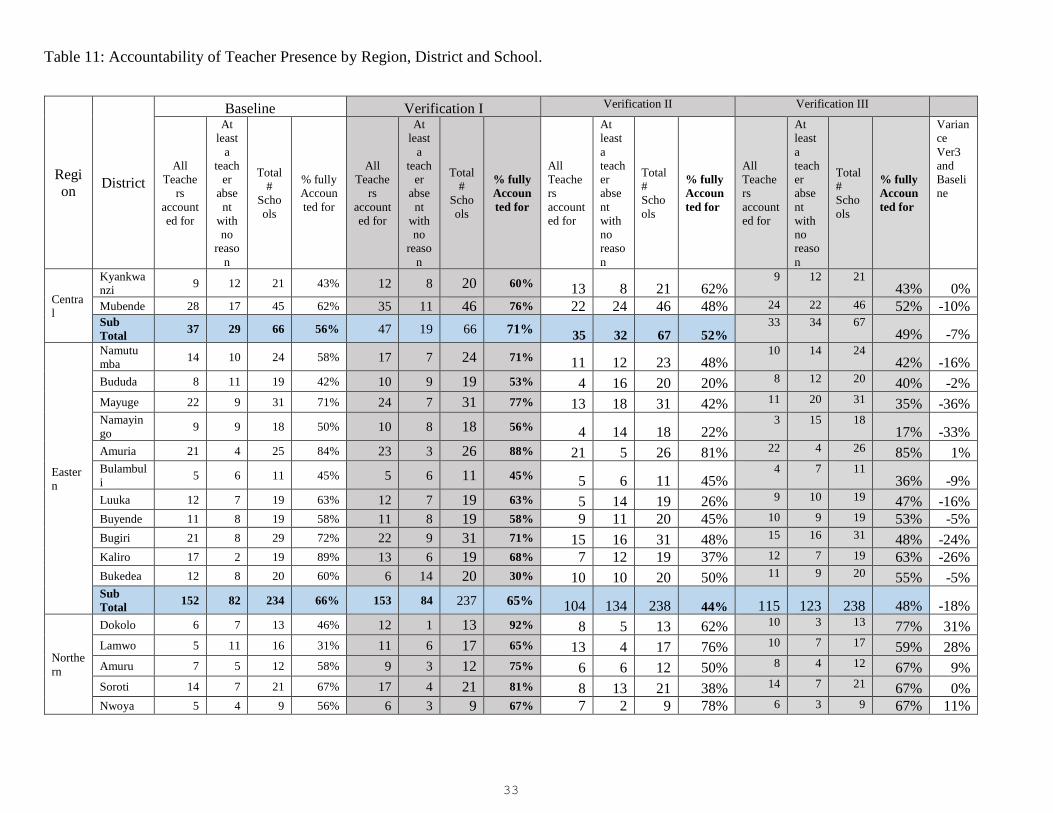
33
Table 11: Accountability of Teacher Presence by Region, District and School.
Regi
on District
Baseline Verification I Verification II Verification III
All
Teache
rs
account
ed for
At
least
a
teach
er
abse
nt
with
no
reaso
n
Total
#
Scho
ols
% fully
Accoun
ted for
All
Teache
rs
account
ed for
At
least
a
teach
er
abse
nt
with
no
reaso
n
Total
#
Scho
ols
% fully
Accoun
ted for
All
Teache
rs
account
ed for
At
least
a
teach
er
abse
nt
with
no
reaso
n
Total
#
Scho
ols
% fully
Accoun
ted for
All
Teache
rs
account
ed for
At
least
a
teach
er
abse
nt
with
no
reaso
n
Total
#
Scho
ols
% fully
Accoun
ted for
Varian
ce
Ver3
and
Baseli
ne
Centra
l
Kyankwa
nzi 9 12 21 43% 12 8 20 60% 13 8 21 62%
9 12 21 43% 0%
Mubende 28 17 45 62% 35 11 46 76% 22 24 46 48% 24 22 46 52% -10% Sub
Total 37 29 66 56% 47 19 66 71%
35 32 67 52% 33 34 67
49% -7%
Easter
n
Namutu
mba 14 10 24 58% 17 7 24 71% 11 12 23 48%
10 14 24 42% -16%
Bududa 8 11 19 42% 10 9 19 53% 4 16 20 20% 8 12 20 40% -2%
Mayuge 22 9 31 71% 24 7 31 77% 13 18 31 42% 11 20 31 35% -36% Namayin
go 9 9 18 50% 10 8 18 56% 4 14 18 22%
3 15 18 17% -33%
Amuria 21 4 25 84% 23 3 26 88% 21 5 26 81% 22 4 26 85% 1% Bulambul
i 5 6 11 45% 5 6 11 45% 5 6 11 45%
4 7 11 36% -9%
Luuka 12 7 19 63% 12 7 19 63% 5 14 19 26% 9 10 19 47% -16% Buyende 11 8 19 58% 11 8 19 58% 9 11 20 45% 10 9 19 53% -5%
Bugiri 21 8 29 72% 22 9 31 71% 15 16 31 48% 15 16 31 48% -24% Kaliro 17 2 19 89% 13 6 19 68% 7 12 19 37% 12 7 19 63% -26%
Bukedea 12 8 20 60% 6 14 20 30% 10 10 20 50% 11 9 20 55% -5% Sub
Total 152 82 234 66% 153 84 237 65% 104 134 238 44% 115 123 238 48% -18%
Northe
rn
Dokolo 6 7 13 46% 12 1 13 92% 8 5 13 62% 10 3 13 77% 31%
Lamwo 5 11 16 31% 11 6 17 65% 13 4 17 76% 10 7 17 59% 28%
Amuru 7 5 12 58% 9 3 12 75% 6 6 12 50% 8 4 12 67% 9%
Soroti 14 7 21 67% 17 4 21 81% 8 13 21 38% 14 7 21 67% 0% Nwoya 5 4 9 56% 6 3 9 67% 7 2 9 78% 6 3 9 67% 11%
34
Regi
on District
Baseline Verification I Verification II Verification III
All
Teache
rs
account
ed for
At
least
a
teach
er
abse
nt
with
no
reaso
n
Total
#
Scho
ols
% fully
Accoun
ted for
All
Teache
rs
account
ed for
At
least
a
teach
er
abse
nt
with
no
reaso
n
Total
#
Scho
ols
% fully
Accoun
ted for
All
Teache
rs
account
ed for
At
least
a
teach
er
abse
nt
with
no
reaso
n
Total
#
Scho
ols
% fully
Accoun
ted for
All
Teache
rs
account
ed for
At
least
a
teach
er
abse
nt
with
no
reaso
n
Total
#
Scho
ols
% fully
Accoun
ted for
Varian
ce
Ver3
and
Baseli
ne
Amolatar 3 7 10 30% 4 6 10 40% 3 7 10 30% 2 8 10 20% -10%
Oyam 17 6 23 74% 19 4 23 83% 12 11 23 52% 12 11 23 52% -22%
Agago 14 8 22 64% 17 7 24 71% 16 8 24 67% 8 16 24 33% -31%
Kotido 3 2 5 60% 3 2 5 60% 1 4 5 20% 2 3 5 40% -20% Alebtong 7 7 14 50% 5 9 14 36% 7 7 14 50% 6 8 14 43% -7%
Maracha 13 0 13 100% 6 7 13 46% 2 11 13 15% 1 12 13 8% -92% Sub
Total 94 64 158 60% 109 52 161 68% 83 78 161 52% 79 82 161 49% -11%
Weste
rn
Kakumir
o 7 9 16 44% 12 6 18 67% 10 8 18 56%
10 8 18 56% 12%
Kagadi 15 14 29 52% 20 9 29 69% 13 16 29 45% 6 23 29 21% -31% Kamwen
ge 25 5 30 83% 27 5 32 84% 20 12 32 63%
20 12 32 63% -21%
Bundibu
gyo 13 9 22 59% 14 10 24 58% 3 21 24 13%
4 20 24 17% -42%
Kibaale 7 4 11 64% 5 6 11 45% 8 3 11 73% 8 3 11 73% 9% Sub
Total 67 41 108 62% 78 36 114 68% 54 60 114
47% 48 66 114 42% -20%
Total 350 216 566 62% 387 191 578 67% 276 304 580 46% 48 66 114 42% -20%
35
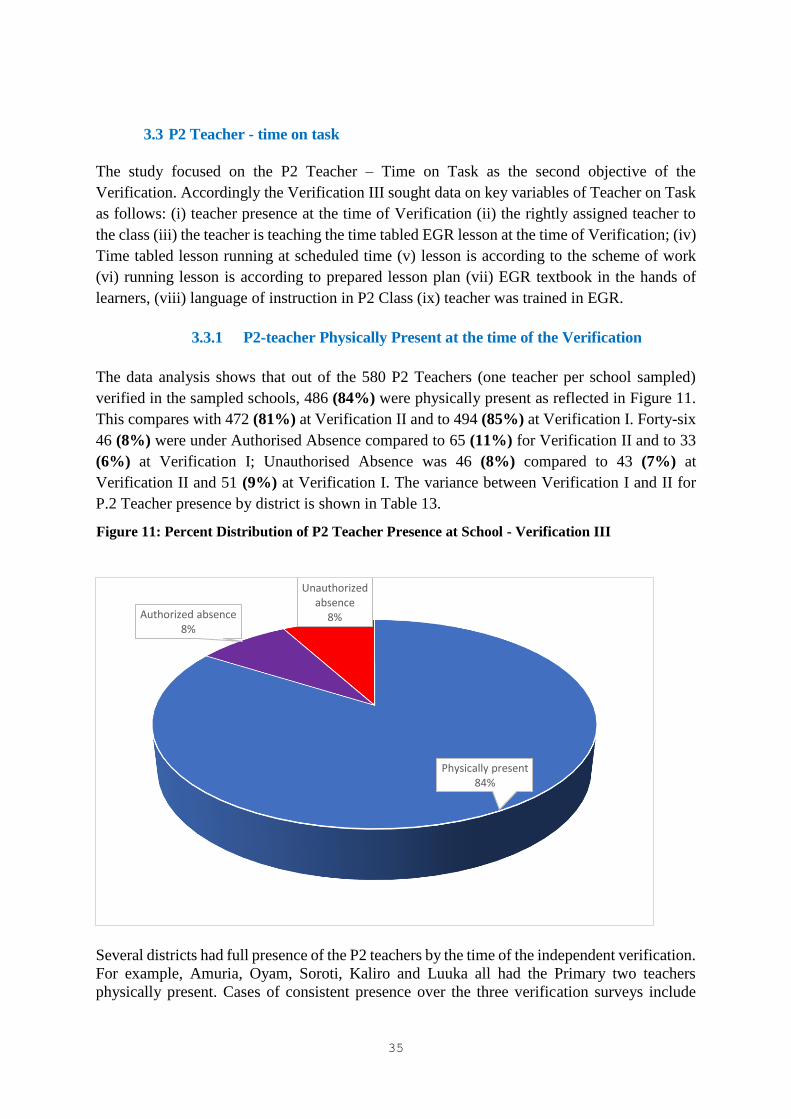
3.3 P2 Teacher - time on task
The study focused on the P2 Teacher – Time on Task as the second objective of the
Verification. Accordingly the Verification III sought data on key variables of Teacher on Task
as follows: (i) teacher presence at the time of Verification (ii) the rightly assigned teacher to
the class (iii) the teacher is teaching the time tabled EGR lesson at the time of Verification; (iv)
Time tabled lesson running at scheduled time (v) lesson is according to the scheme of work
(vi) running lesson is according to prepared lesson plan (vii) EGR textbook in the hands of
learners, (viii) language of instruction in P2 Class (ix) teacher was trained in EGR.
3.3.1 P2-teacher Physically Present at the time of the Verification
The data analysis shows that out of the 580 P2 Teachers (one teacher per school sampled)
verified in the sampled schools, 486 (84%) were physically present as reflected in Figure 11.
This compares with 472 (81%) at Verification II and to 494 (85%) at Verification I. Forty-six
46 (8%) were under Authorised Absence compared to 65 (11%) for Verification II and to 33
(6%) at Verification I; Unauthorised Absence was 46 (8%) compared to 43 (7%) at
Verification II and 51 (9%) at Verification I. The variance between Verification I and II for
P.2 Teacher presence by district is shown in Table 13.
Several districts had full presence of the P2 teachers by the time of the independent verification.
For example, Amuria, Oyam, Soroti, Kaliro and Luuka all had the Primary two teachers
physically present. Cases of consistent presence over the three verification surveys include
Physically present84%
Authorized absence8%
Unauthorized absence
8%
Figure 11: Percent Distribution of P2 Teacher Presence at School - Verification III
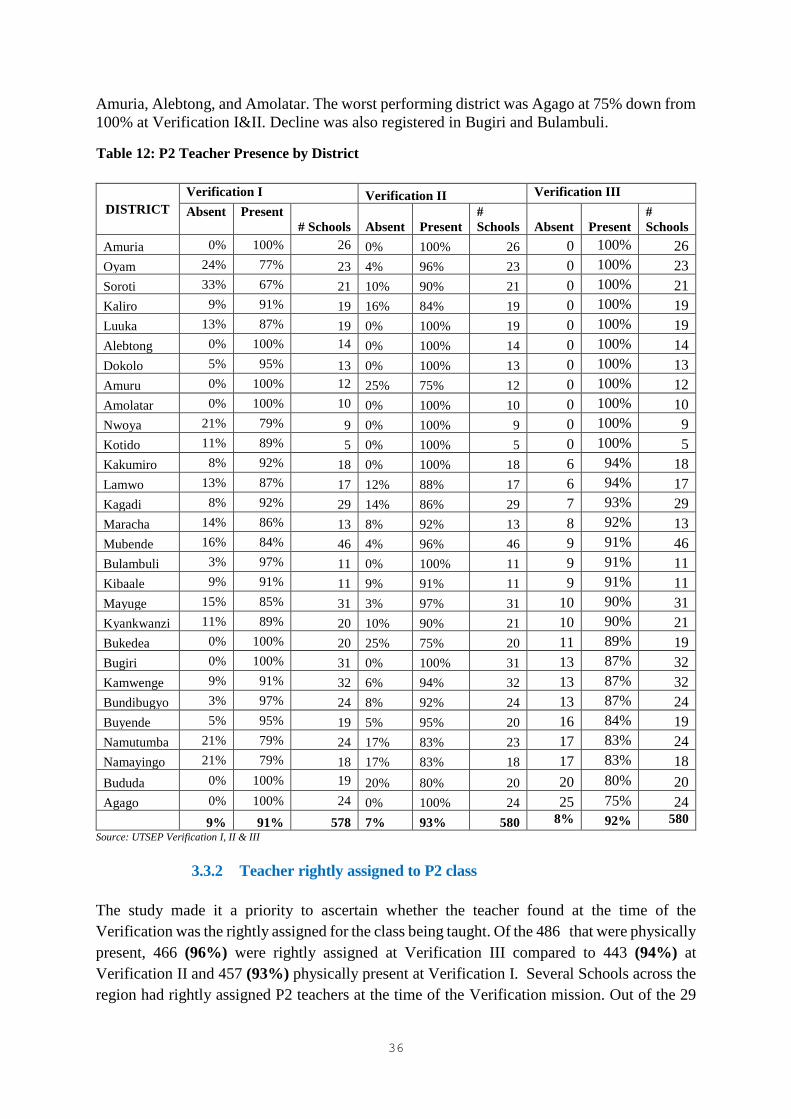
36
Amuria, Alebtong, and Amolatar. The worst performing district was Agago at 75% down from
100% at Verification I&II. Decline was also registered in Bugiri and Bulambuli.
DISTRICT
Verification I Verification II Verification III
Absent Present
# Schools Absent Present
#
Schools Absent Present
#
Schools
Amuria 0% 100% 26 0% 100% 26 0 100% 26
Oyam 24% 77% 23 4% 96% 23 0 100% 23
Soroti 33% 67% 21 10% 90% 21 0 100% 21
Kaliro 9% 91% 19 16% 84% 19 0 100% 19
Luuka 13% 87% 19 0% 100% 19 0 100% 19
Alebtong 0% 100% 14 0% 100% 14 0 100% 14
Dokolo 5% 95% 13 0% 100% 13 0 100% 13
Amuru 0% 100% 12 25% 75% 12 0 100% 12
Amolatar 0% 100% 10 0% 100% 10 0 100% 10
Nwoya 21% 79% 9 0% 100% 9 0 100% 9
Kotido 11% 89% 5 0% 100% 5 0 100% 5
Kakumiro 8% 92% 18 0% 100% 18 6 94% 18
Lamwo 13% 87% 17 12% 88% 17 6 94% 17
Kagadi 8% 92% 29 14% 86% 29 7 93% 29
Maracha 14% 86% 13 8% 92% 13 8 92% 13
Mubende 16% 84% 46 4% 96% 46 9 91% 46
Bulambuli 3% 97% 11 0% 100% 11 9 91% 11
Kibaale 9% 91% 11 9% 91% 11 9 91% 11
Mayuge 15% 85% 31 3% 97% 31 10 90% 31
Kyankwanzi 11% 89% 20 10% 90% 21 10 90% 21
Bukedea 0% 100% 20 25% 75% 20 11 89% 19
Bugiri 0% 100% 31 0% 100% 31 13 87% 32
Kamwenge 9% 91% 32 6% 94% 32 13 87% 32
Bundibugyo 3% 97% 24 8% 92% 24 13 87% 24
Buyende 5% 95% 19 5% 95% 20 16 84% 19
Namutumba 21% 79% 24 17% 83% 23 17 83% 24
Namayingo 21% 79% 18 17% 83% 18 17 83% 18
Bududa 0% 100% 19 20% 80% 20 20 80% 20
Agago 0% 100% 24 0% 100% 24 25 75% 24
9% 91% 578 7% 93% 580 8% 92% 580
Source: UTSEP Verification I, II & III
3.3.2 Teacher rightly assigned to P2 class
The study made it a priority to ascertain whether the teacher found at the time of the
Verification was the rightly assigned for the class being taught. Of the 486 that were physically
present, 466 (96%) were rightly assigned at Verification III compared to 443 (94%) at
Verification II and 457 (93%) physically present at Verification I. Several Schools across the
region had rightly assigned P2 teachers at the time of the Verification mission. Out of the 29
Table 12: P2 Teacher Presence by District
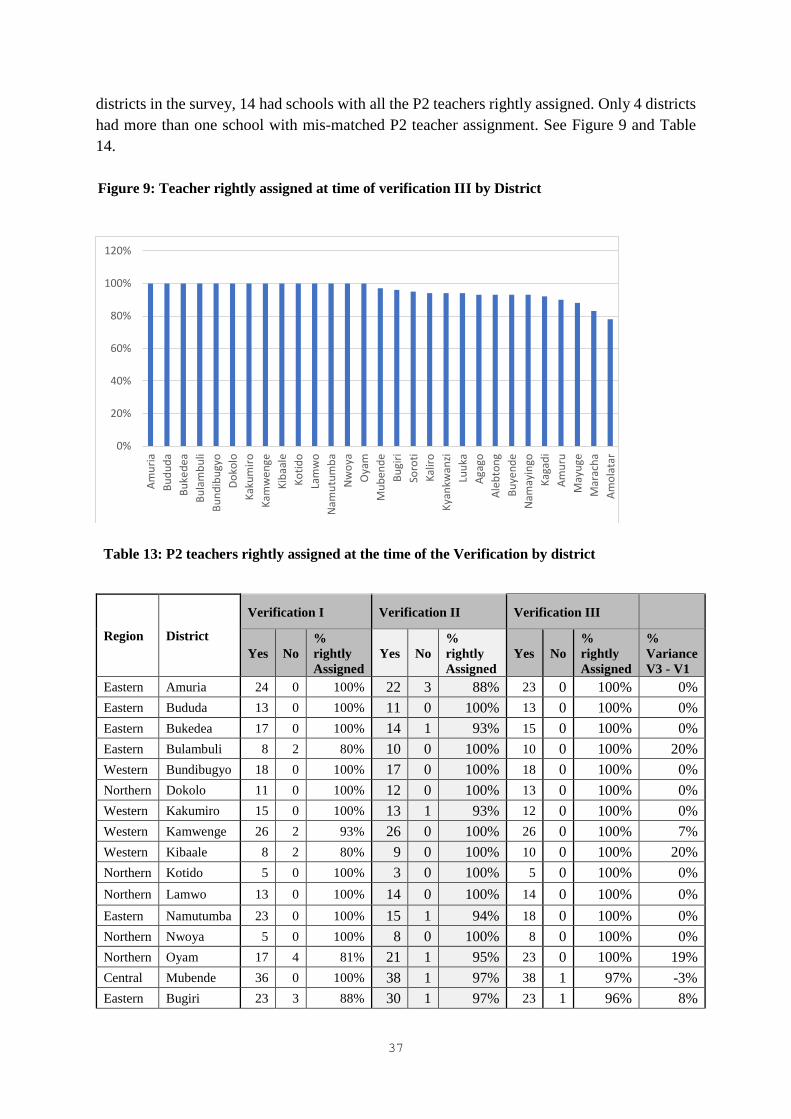
37
districts in the survey, 14 had schools with all the P2 teachers rightly assigned. Only 4 districts
had more than one school with mis-matched P2 teacher assignment. See Figure 9 and Table
14.
Region District
Verification I Verification II Verification III
Yes No
%
rightly
Assigned
Yes No
%
rightly
Assigned
Yes No
%
rightly
Assigned
%
Variance
V3 - V1
Eastern Amuria 24 0 100% 22 3 88% 23 0 100% 0%
Eastern Bududa 13 0 100% 11 0 100% 13 0 100% 0%
Eastern Bukedea 17 0 100% 14 1 93% 15 0 100% 0%
Eastern Bulambuli 8 2 80% 10 0 100% 10 0 100% 20%
Western Bundibugyo 18 0 100% 17 0 100% 18 0 100% 0%
Northern Dokolo 11 0 100% 12 0 100% 13 0 100% 0%
Western Kakumiro 15 0 100% 13 1 93% 12 0 100% 0%
Western Kamwenge 26 2 93% 26 0 100% 26 0 100% 7%
Western Kibaale 8 2 80% 9 0 100% 10 0 100% 20%
Northern Kotido 5 0 100% 3 0 100% 5 0 100% 0%
Northern Lamwo 13 0 100% 14 0 100% 14 0 100% 0%
Eastern Namutumba 23 0 100% 15 1 94% 18 0 100% 0%
Northern Nwoya 5 0 100% 8 0 100% 8 0 100% 0%
Northern Oyam 17 4 81% 21 1 95% 23 0 100% 19%
Central Mubende 36 0 100% 38 1 97% 38 1 97% -3%
Eastern Bugiri 23 3 88% 30 1 97% 23 1 96% 8%
0%
20%
40%
60%
80%
100%
120%
Am
uri
a
Bu
du
da
Bu
ked
ea
Bu
lam
bu
li
Bu
nd
ibu
gyo
Do
kolo
Kak
um
iro
Kam
we
nge
Kib
aale
Ko
tid
o
Lam
wo
Nam
utu
mb
a
Nw
oya
Oya
m
Mu
ben
de
Bu
giri
Soro
ti
Kal
iro
Kya
nkw
anzi
Luu
ka
Aga
go
Ale
bto
ng
Bu
yen
de
Nam
ayin
go
Kag
adi
Am
uru
May
uge
Mar
ach
a
Am
ola
tar
Figure 9: Teacher rightly assigned at time of verification III by District
Table 13: P2 teachers rightly assigned at the time of the Verification by district
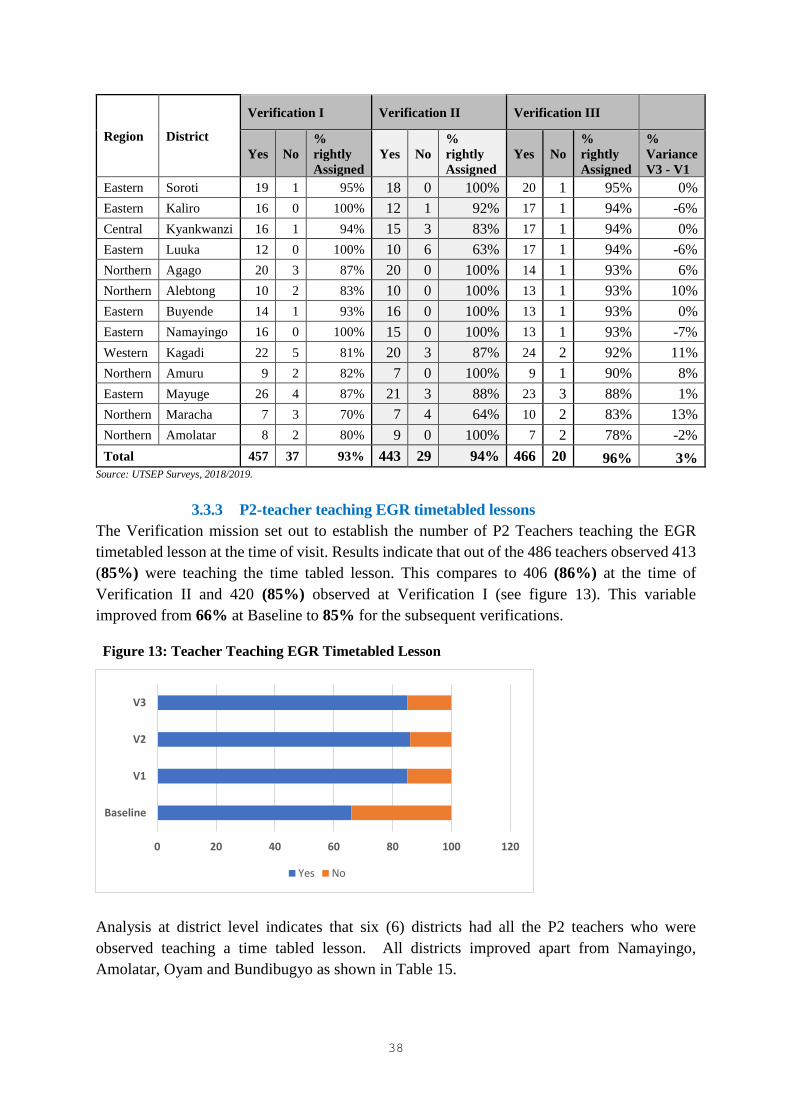
38
Region District
Verification I Verification II Verification III
Yes No
%
rightly
Assigned
Yes No
%
rightly
Assigned
Yes No
%
rightly
Assigned
%
Variance
V3 - V1
Eastern Soroti 19 1 95% 18 0 100% 20 1 95% 0%
Eastern Kaliro 16 0 100% 12 1 92% 17 1 94% -6%
Central Kyankwanzi 16 1 94% 15 3 83% 17 1 94% 0%
Eastern Luuka 12 0 100% 10 6 63% 17 1 94% -6%
Northern Agago 20 3 87% 20 0 100% 14 1 93% 6%
Northern Alebtong 10 2 83% 10 0 100% 13 1 93% 10%
Eastern Buyende 14 1 93% 16 0 100% 13 1 93% 0%
Eastern Namayingo 16 0 100% 15 0 100% 13 1 93% -7%
Western Kagadi 22 5 81% 20 3 87% 24 2 92% 11%
Northern Amuru 9 2 82% 7 0 100% 9 1 90% 8%
Eastern Mayuge 26 4 87% 21 3 88% 23 3 88% 1%
Northern Maracha 7 3 70% 7 4 64% 10 2 83% 13%
Northern Amolatar 8 2 80% 9 0 100% 7 2 78% -2%
Total 457 37 93% 443 29 94% 466 20 96% 3% Source: UTSEP Surveys, 2018/2019.
3.3.3 P2-teacher teaching EGR timetabled lessons
The Verification mission set out to establish the number of P2 Teachers teaching the EGR
timetabled lesson at the time of visit. Results indicate that out of the 486 teachers observed 413
(85%) were teaching the time tabled lesson. This compares to 406 (86%) at the time of
Verification II and 420 (85%) observed at Verification I (see figure 13). This variable
improved from 66% at Baseline to 85% for the subsequent verifications.
Analysis at district level indicates that six (6) districts had all the P2 teachers who were
observed teaching a time tabled lesson. All districts improved apart from Namayingo,
Amolatar, Oyam and Bundibugyo as shown in Table 15.
0 20 40 60 80 100 120
Baseline
V1
V2
V3
Yes No
Figure 13: Teacher Teaching EGR Timetabled Lesson
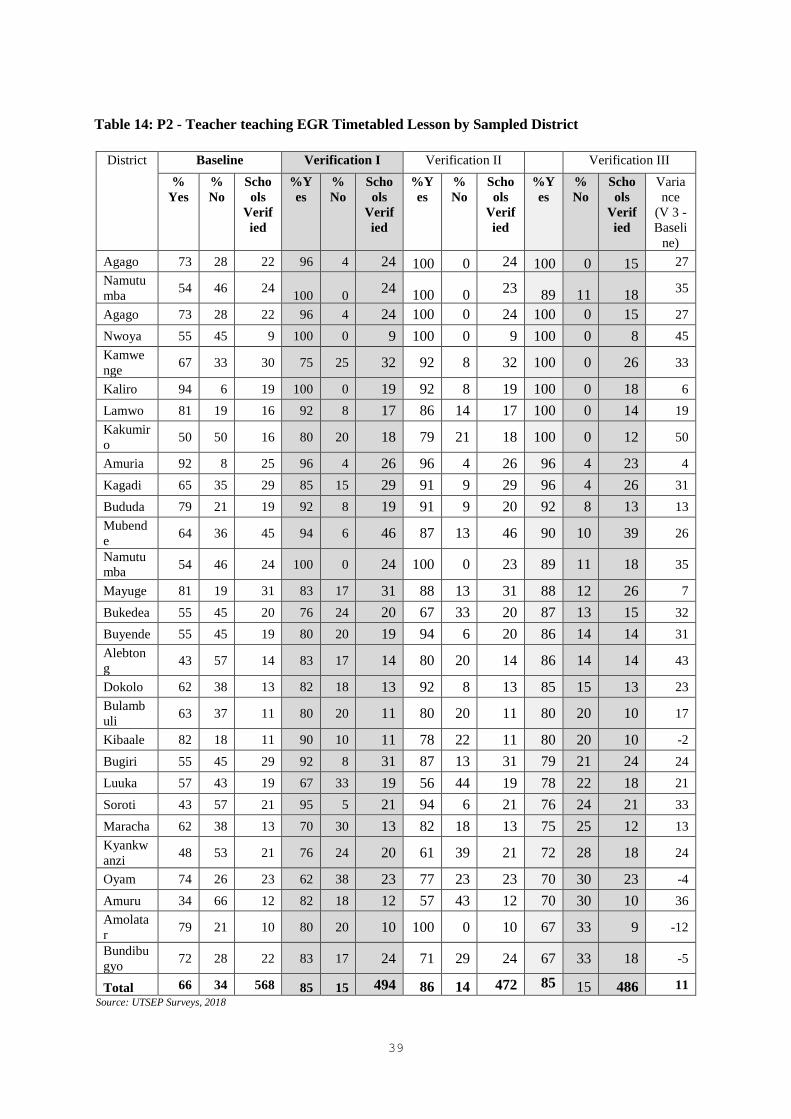
39
District Baseline Verification I Verification II Verification III
%
Yes
%
No
Scho
ols
Verif
ied
%Y
es %
No Scho
ols
Verif
ied
%Y
es
%
No
Scho
ols
Verif
ied
%Y
es
%
No
Scho
ols
Verif
ied
Varia
nce
(V 3 -
Baseli
ne)
Agago 73 28 22 96 4 24 100 0 24 100 0 15 27
Namutu
mba 54 46 24
100 0 24
100 0 23
89 11 18 35
Agago 73 28 22 96 4 24 100 0 24 100 0 15 27
Nwoya 55 45 9 100 0 9 100 0 9 100 0 8 45
Kamwe
nge 67 33 30 75 25 32 92 8 32 100 0 26 33
Kaliro 94 6 19 100 0 19 92 8 19 100 0 18 6
Lamwo 81 19 16 92 8 17 86 14 17 100 0 14 19
Kakumir
o 50 50 16 80 20 18 79 21 18 100 0 12 50
Amuria 92 8 25 96 4 26 96 4 26 96 4 23 4
Kagadi 65 35 29 85 15 29 91 9 29 96 4 26 31
Bududa 79 21 19 92 8 19 91 9 20 92 8 13 13
Mubend
e 64 36 45 94 6 46 87 13 46 90 10 39 26
Namutu
mba 54 46 24 100 0 24 100 0 23 89 11 18 35
Mayuge 81 19 31 83 17 31 88 13 31 88 12 26 7
Bukedea 55 45 20 76 24 20 67 33 20 87 13 15 32
Buyende 55 45 19 80 20 19 94 6 20 86 14 14 31
Alebton
g 43 57 14 83 17 14 80 20 14 86 14 14 43
Dokolo 62 38 13 82 18 13 92 8 13 85 15 13 23
Bulamb
uli 63 37 11 80 20 11 80 20 11 80 20 10 17
Kibaale 82 18 11 90 10 11 78 22 11 80 20 10 -2
Bugiri 55 45 29 92 8 31 87 13 31 79 21 24 24
Luuka 57 43 19 67 33 19 56 44 19 78 22 18 21
Soroti 43 57 21 95 5 21 94 6 21 76 24 21 33
Maracha 62 38 13 70 30 13 82 18 13 75 25 12 13
Kyankw
anzi 48 53 21 76 24 20 61 39 21 72 28 18 24
Oyam 74 26 23 62 38 23 77 23 23 70 30 23 -4
Amuru 34 66 12 82 18 12 57 43 12 70 30 10 36
Amolata
r 79 21 10 80 20 10 100 0 10 67 33 9 -12
Bundibu
gyo 72 28 22 83 17 24 71 29 24 67 33 18 -5
Total 66 34 568 85 15 494 86 14 472 85 15 486 11
Source: UTSEP Surveys, 2018
Table 14: P2 - Teacher teaching EGR Timetabled Lesson by Sampled District
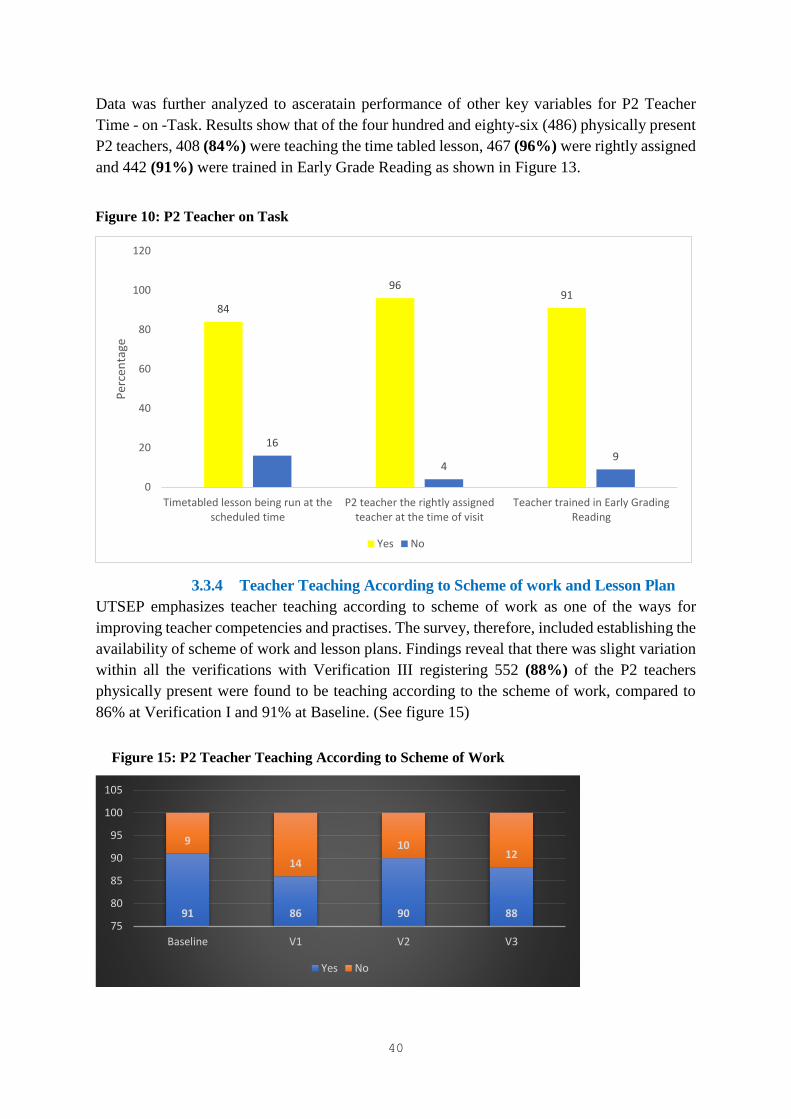
40
Data was further analyzed to asceratain performance of other key variables for P2 Teacher
Time - on -Task. Results show that of the four hundred and eighty-six (486) physically present
P2 teachers, 408 (84%) were teaching the time tabled lesson, 467 (96%) were rightly assigned
and 442 (91%) were trained in Early Grade Reading as shown in Figure 13.
3.3.4 Teacher Teaching According to Scheme of work and Lesson Plan
UTSEP emphasizes teacher teaching according to scheme of work as one of the ways for
improving teacher competencies and practises. The survey, therefore, included establishing the
availability of scheme of work and lesson plans. Findings reveal that there was slight variation
within all the verifications with Verification III registering 552 (88%) of the P2 teachers
physically present were found to be teaching according to the scheme of work, compared to
86% at Verification I and 91% at Baseline. (See figure 15)
84
9691
16
49
0
20
40
60
80
100
120
Timetabled lesson being run at thescheduled time
P2 teacher the rightly assignedteacher at the time of visit
Teacher trained in Early GradingReading
Per
cen
tage
Yes No
91 86 90 88
9
14
1012
75
80
85
90
95
100
105
Baseline V1 V2 V3
Yes No
Figure 10: P2 Teacher on Task
Figure 15: P2 Teacher Teaching According to Scheme of Work

41
Results show variances in district performance regarding P2 teacher teaching according to the
Scheme of work. While there are improvements in districts such as Kotido and Amuru, several
districts have registered a decline in the number of P2 teachers teaching according to the
Scheme of Work. Districts such as Namayingo, Maracha, Kagadi and Amolatar considerably
declined. A total of 59 schools were not teaching according to the scheme of work. see Table
16.
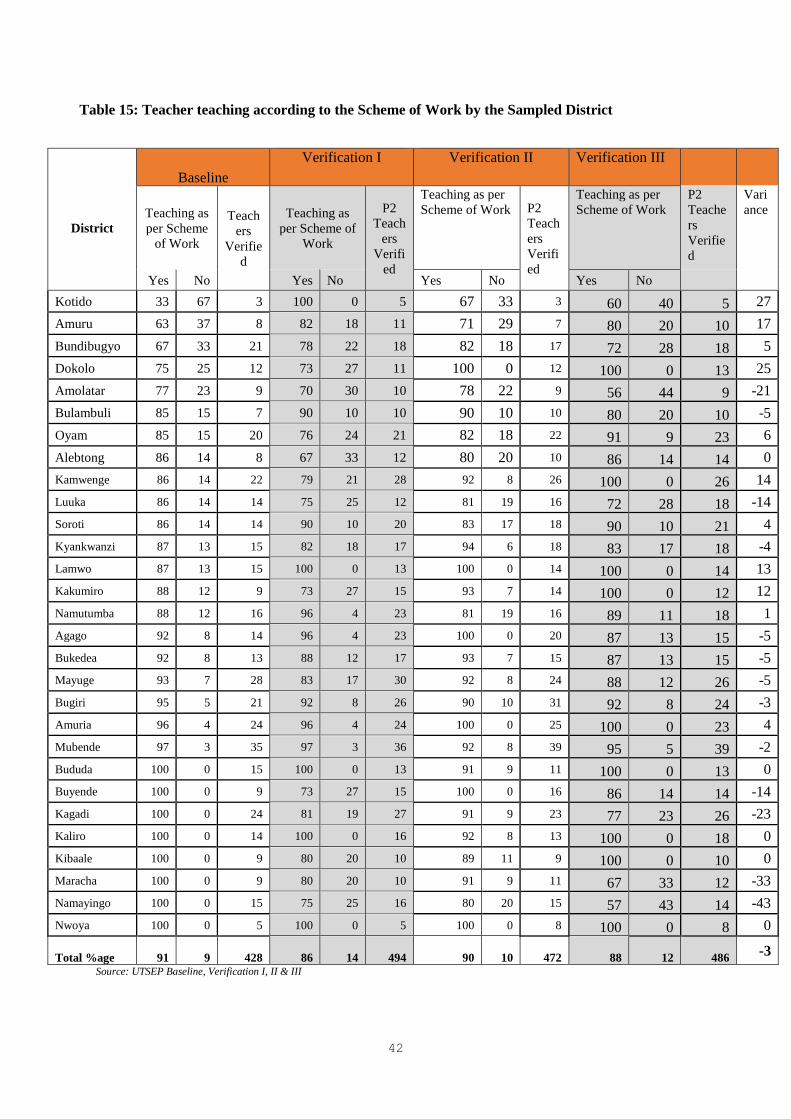
42
District
Baseline
Verification I Verification II Verification III
Teaching as
per Scheme
of Work
Teach
ers
Verifie
d
Teaching as
per Scheme of
Work
P2
Teach
ers
Verifi
ed
Teaching as per
Scheme of Work P2
Teach
ers
Verifi
ed
Teaching as per
Scheme of Work
P2
Teache
rs
Verifie
d
Vari
ance
Yes No Yes No Yes No Yes No
Kotido 33 67 3 100 0 5 67 33 3 60 40 5 27
Amuru 63 37 8 82 18 11 71 29 7 80 20 10 17
Bundibugyo 67 33 21 78 22 18 82 18 17 72 28 18 5
Dokolo 75 25 12 73 27 11 100 0 12 100 0 13 25
Amolatar 77 23 9 70 30 10 78 22 9 56 44 9 -21
Bulambuli 85 15 7 90 10 10 90 10 10 80 20 10 -5
Oyam 85 15 20 76 24 21 82 18 22 91 9 23 6
Alebtong 86 14 8 67 33 12 80 20 10 86 14 14 0
Kamwenge 86 14 22 79 21 28 92 8 26 100 0 26 14
Luuka 86 14 14 75 25 12 81 19 16 72 28 18 -14
Soroti 86 14 14 90 10 20 83 17 18 90 10 21 4
Kyankwanzi 87 13 15 82 18 17 94 6 18 83 17 18 -4
Lamwo 87 13 15 100 0 13 100 0 14 100 0 14 13
Kakumiro 88 12 9 73 27 15 93 7 14 100 0 12 12
Namutumba 88 12 16 96 4 23 81 19 16 89 11 18 1
Agago 92 8 14 96 4 23 100 0 20 87 13 15 -5
Bukedea 92 8 13 88 12 17 93 7 15 87 13 15 -5
Mayuge 93 7 28 83 17 30 92 8 24 88 12 26 -5
Bugiri 95 5 21 92 8 26 90 10 31 92 8 24 -3
Amuria 96 4 24 96 4 24 100 0 25 100 0 23 4
Mubende 97 3 35 97 3 36 92 8 39 95 5 39 -2
Bududa 100 0 15 100 0 13 91 9 11 100 0 13 0
Buyende 100 0 9 73 27 15 100 0 16 86 14 14 -14
Kagadi 100 0 24 81 19 27 91 9 23 77 23 26 -23
Kaliro 100 0 14 100 0 16 92 8 13 100 0 18 0
Kibaale 100 0 9 80 20 10 89 11 9 100 0 10 0
Maracha 100 0 9 80 20 10 91 9 11 67 33 12 -33
Namayingo 100 0 15 75 25 16 80 20 15 57 43 14 -43
Nwoya 100 0 5 100 0 5 100 0 8 100 0 8 0
Total %age 91 9 428 86 14
494 90 10
472
88
12
486 -3
Source: UTSEP Baseline, Verification I, II & III
Table 15: Teacher teaching according to the Scheme of Work by the Sampled District
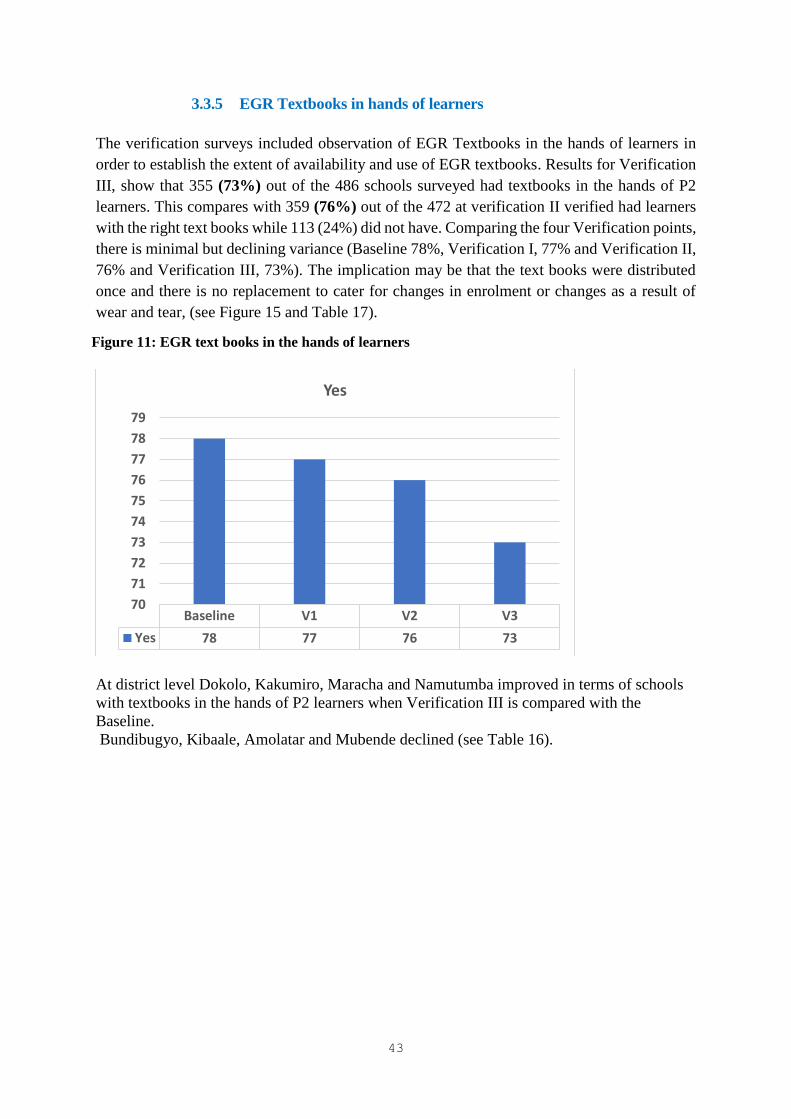
43
3.3.5 EGR Textbooks in hands of learners
The verification surveys included observation of EGR Textbooks in the hands of learners in
order to establish the extent of availability and use of EGR textbooks. Results for Verification
III, show that 355 (73%) out of the 486 schools surveyed had textbooks in the hands of P2
learners. This compares with 359 (76%) out of the 472 at verification II verified had learners
with the right text books while 113 (24%) did not have. Comparing the four Verification points,
there is minimal but declining variance (Baseline 78%, Verification I, 77% and Verification II,
76% and Verification III, 73%). The implication may be that the text books were distributed
once and there is no replacement to cater for changes in enrolment or changes as a result of
wear and tear, (see Figure 15 and Table 17).
At district level Dokolo, Kakumiro, Maracha and Namutumba improved in terms of schools
with textbooks in the hands of P2 learners when Verification III is compared with the
Baseline.
Bundibugyo, Kibaale, Amolatar and Mubende declined (see Table 16).
Baseline V1 V2 V3
Yes 78 77 76 73
70
71
72
73
74
75
76
77
78
79
Yes
Figure 11: EGR text books in the hands of learners
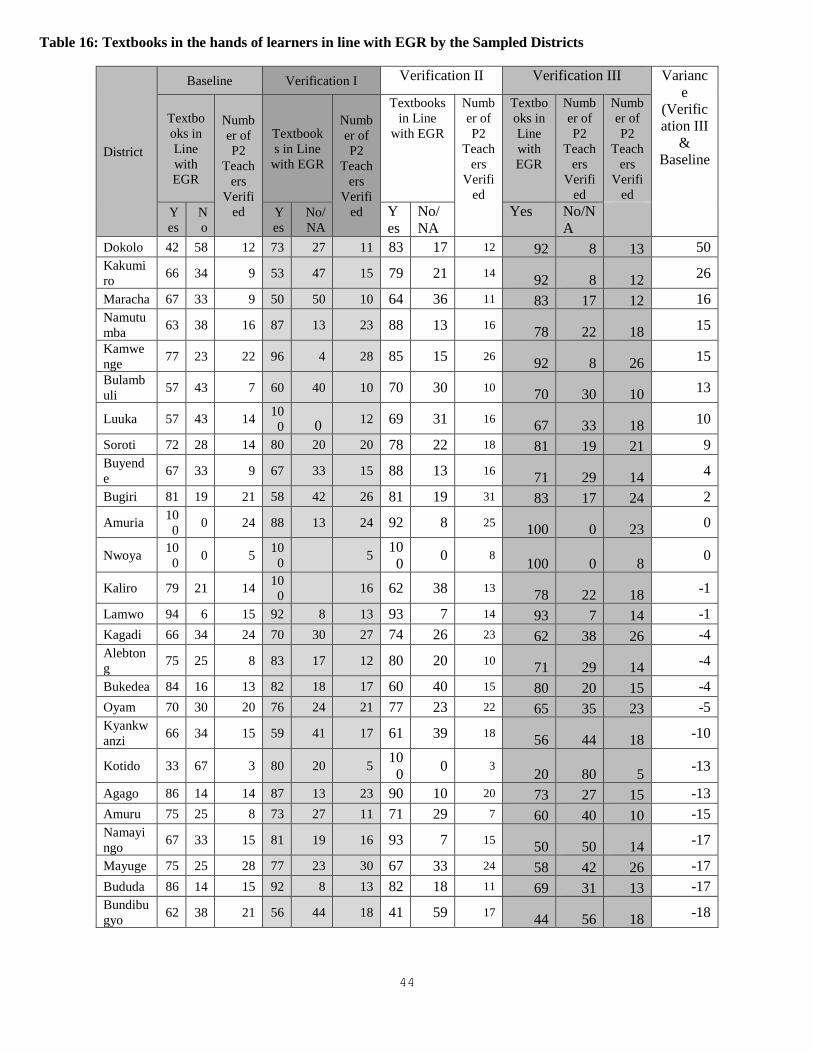
44
District
Baseline Verification I Verification II Verification III Varianc
e
(Verific
ation III
&
Baseline
Textbo
oks in
Line
with
EGR
Numb
er of
P2
Teach
ers
Verifi
ed
Textbook
s in Line
with EGR
Numb
er of
P2
Teach
ers
Verifi
ed
Textbooks
in Line
with EGR
Numb
er of
P2
Teach
ers
Verifi
ed
Textbo
oks in
Line
with
EGR
Numb
er of
P2
Teach
ers
Verifi
ed
Numb
er of
P2
Teach
ers
Verifi
ed
Y
es
N
o
Y
es
No/
NA
Y
es
No/
NA
Yes No/N
A
Dokolo 42 58 12 73 27 11 83 17 12 92 8 13 50
Kakumi
ro 66 34 9 53 47 15 79 21 14
92 8 12 26
Maracha 67 33 9 50 50 10 64 36 11 83 17 12 16
Namutu
mba 63 38 16 87 13 23 88 13 16
78 22 18 15
Kamwe
nge 77 23 22 96 4 28 85 15 26
92 8 26 15
Bulamb
uli 57 43 7 60 40 10 70 30 10
70 30 10 13
Luuka 57 43 14 10
0 0 12 69 31 16
67 33 18 10
Soroti 72 28 14 80 20 20 78 22 18 81 19 21 9
Buyend
e 67 33 9 67 33 15 88 13 16
71 29 14 4
Bugiri 81 19 21 58 42 26 81 19 31 83 17 24 2
Amuria 10
0 0 24 88 13 24 92 8 25
100 0 23 0
Nwoya 10
0 0 5
10
0 5
10
0 0 8
100 0 8 0
Kaliro 79 21 14 10
0 16 62 38 13
78 22 18 -1
Lamwo 94 6 15 92 8 13 93 7 14 93 7 14 -1
Kagadi 66 34 24 70 30 27 74 26 23 62 38 26 -4
Alebton
g 75 25 8 83 17 12 80 20 10
71 29 14 -4
Bukedea 84 16 13 82 18 17 60 40 15 80 20 15 -4
Oyam 70 30 20 76 24 21 77 23 22 65 35 23 -5
Kyankw
anzi 66 34 15 59 41 17 61 39 18
56 44 18 -10
Kotido 33 67 3 80 20 5 10
0 0 3
20 80 5 -13
Agago 86 14 14 87 13 23 90 10 20 73 27 15 -13
Amuru 75 25 8 73 27 11 71 29 7 60 40 10 -15
Namayi
ngo 67 33 15 81 19 16 93 7 15
50 50 14 -17
Mayuge 75 25 28 77 23 30 67 33 24 58 42 26 -17
Bududa 86 14 15 92 8 13 82 18 11 69 31 13 -17
Bundibu
gyo 62 38 21 56 44 18 41 59 17
44 56 18 -18
Table 16: Textbooks in the hands of learners in line with EGR by the Sampled Districts
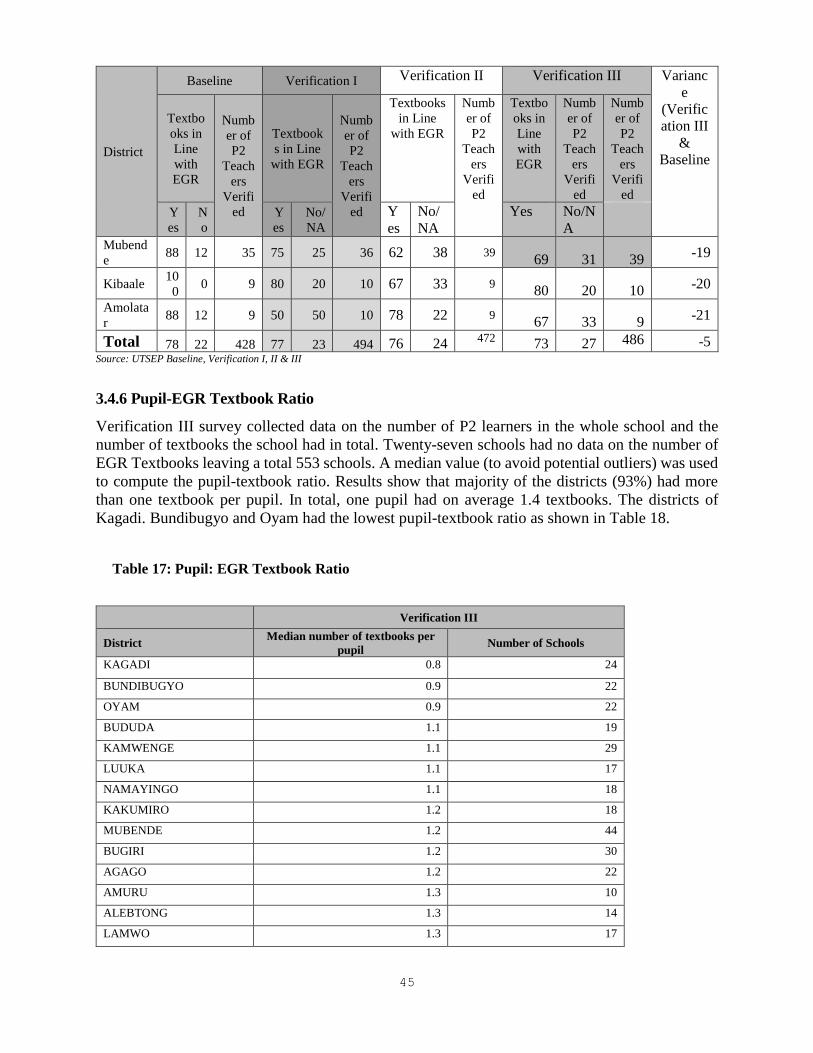
45
District
Baseline Verification I Verification II Verification III Varianc
e
(Verific
ation III
&
Baseline
Textbo
oks in
Line
with
EGR
Numb
er of
P2
Teach
ers
Verifi
ed
Textbook
s in Line
with EGR
Numb
er of
P2
Teach
ers
Verifi
ed
Textbooks
in Line
with EGR
Numb
er of
P2
Teach
ers
Verifi
ed
Textbo
oks in
Line
with
EGR
Numb
er of
P2
Teach
ers
Verifi
ed
Numb
er of
P2
Teach
ers
Verifi
ed
Y
es
N
o
Y
es
No/
NA
Y
es
No/
NA
Yes No/N
A
Mubend
e 88 12 35 75 25 36 62 38 39
69 31 39 -19
Kibaale 10
0 0 9 80 20 10 67 33 9
80 20 10 -20
Amolata
r 88 12 9 50 50 10 78 22 9
67 33 9 -21
Total 78 22 428 77 23 494 76 24 472 73 27 486 -5 Source: UTSEP Baseline, Verification I, II & III
3.4.6 Pupil-EGR Textbook Ratio
Verification III survey collected data on the number of P2 learners in the whole school and the
number of textbooks the school had in total. Twenty-seven schools had no data on the number of
EGR Textbooks leaving a total 553 schools. A median value (to avoid potential outliers) was used
to compute the pupil-textbook ratio. Results show that majority of the districts (93%) had more
than one textbook per pupil. In total, one pupil had on average 1.4 textbooks. The districts of
Kagadi. Bundibugyo and Oyam had the lowest pupil-textbook ratio as shown in Table 18.
Verification III
District Median number of textbooks per
pupil Number of Schools
KAGADI 0.8 24
BUNDIBUGYO 0.9 22
OYAM 0.9 22
BUDUDA 1.1 19
KAMWENGE 1.1 29
LUUKA 1.1 17
NAMAYINGO 1.1 18
KAKUMIRO 1.2 18
MUBENDE 1.2 44
BUGIRI 1.2 30
AGAGO 1.2 22
AMURU 1.3 10
ALEBTONG 1.3 14
LAMWO 1.3 17
Table 17: Pupil: EGR Textbook Ratio
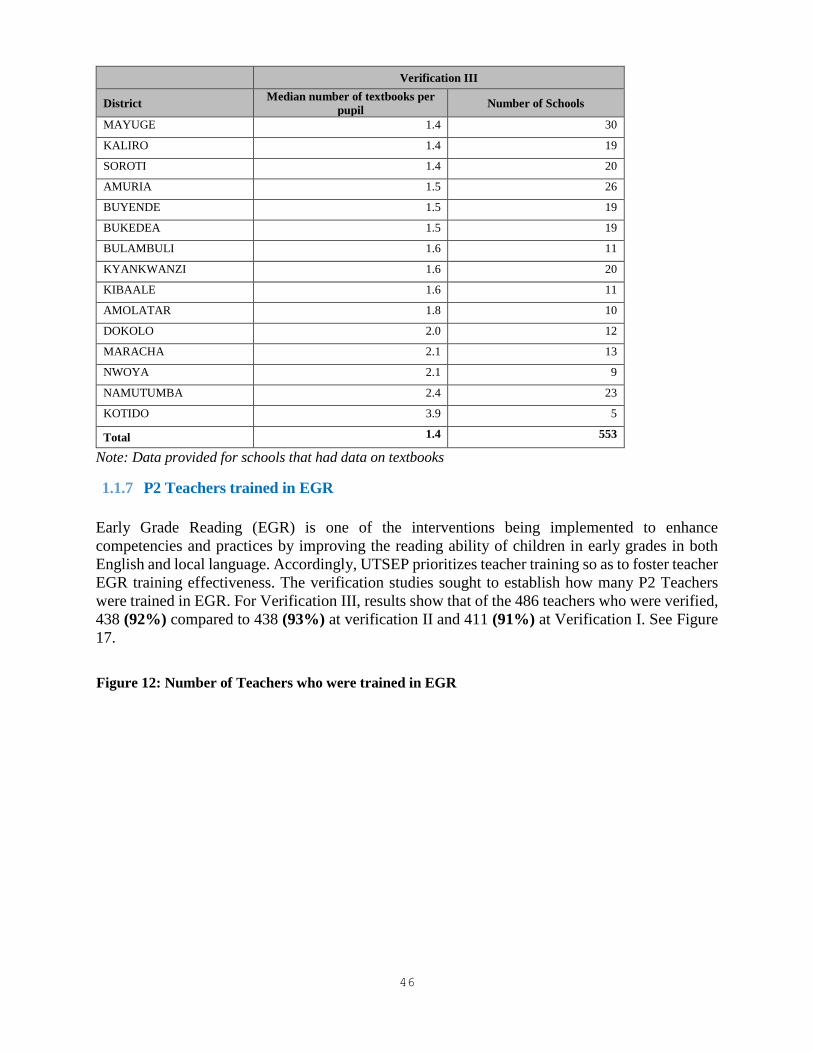
46
Verification III
District Median number of textbooks per
pupil Number of Schools
MAYUGE 1.4 30
KALIRO 1.4 19
SOROTI 1.4 20
AMURIA 1.5 26
BUYENDE 1.5 19
BUKEDEA 1.5 19
BULAMBULI 1.6 11
KYANKWANZI 1.6 20
KIBAALE 1.6 11
AMOLATAR 1.8 10
DOKOLO 2.0 12
MARACHA 2.1 13
NWOYA 2.1 9
NAMUTUMBA 2.4 23
KOTIDO 3.9 5
Total 1.4 553
Note: Data provided for schools that had data on textbooks
1.1.7 P2 Teachers trained in EGR
Early Grade Reading (EGR) is one of the interventions being implemented to enhance
competencies and practices by improving the reading ability of children in early grades in both
English and local language. Accordingly, UTSEP prioritizes teacher training so as to foster teacher
EGR training effectiveness. The verification studies sought to establish how many P2 Teachers
were trained in EGR. For Verification III, results show that of the 486 teachers who were verified,
438 (92%) compared to 438 (93%) at verification II and 411 (91%) at Verification I. See Figure
17.
Figure 12: Number of Teachers who were trained in EGR
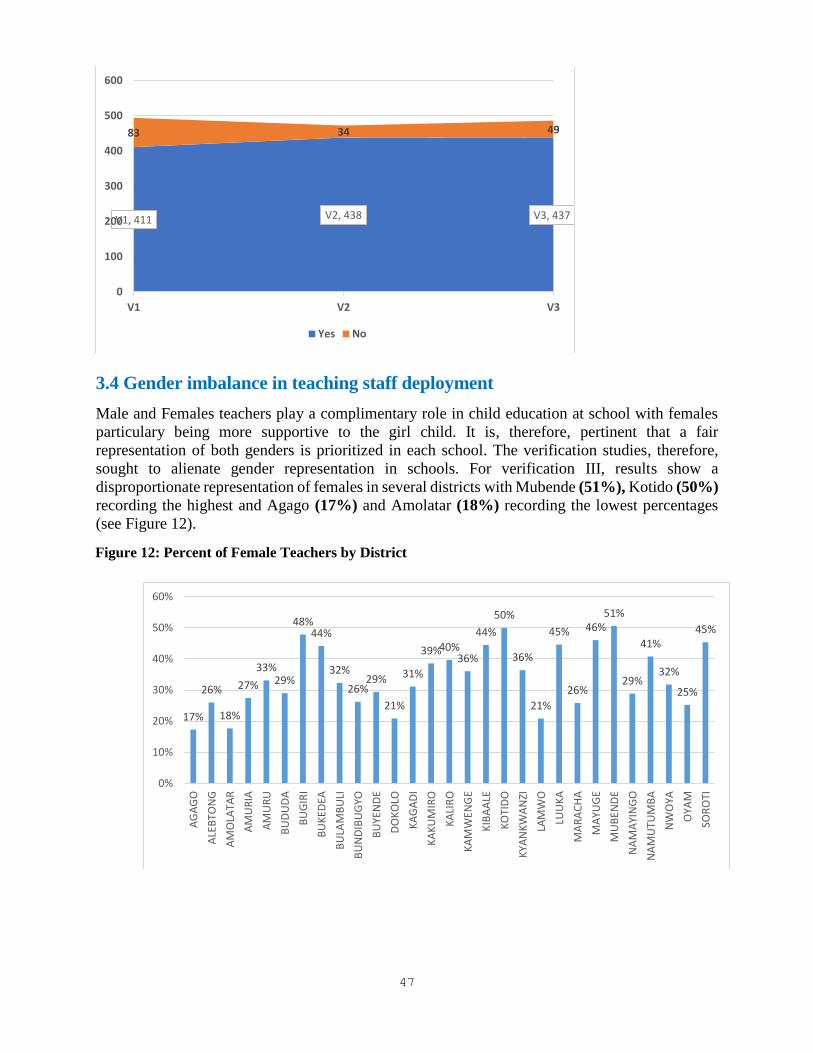
47
3.4 Gender imbalance in teaching staff deployment
Male and Females teachers play a complimentary role in child education at school with females
particulary being more supportive to the girl child. It is, therefore, pertinent that a fair
representation of both genders is prioritized in each school. The verification studies, therefore,
sought to alienate gender representation in schools. For verification III, results show a
disproportionate representation of females in several districts with Mubende (51%), Kotido (50%)
recording the highest and Agago (17%) and Amolatar (18%) recording the lowest percentages
(see Figure 12).
V1, 411 V2, 438 V3, 437
83 34 49
0
100
200
300
400
500
600
V1 V2 V3
Yes No
17%
26%
18%
27%
33%29%
48%44%
32%
26%29%
21%
31%
39%40%36%
44%
50%
36%
21%
45%
26%
46%51%
29%
41%
32%
25%
45%
0%
10%
20%
30%
40%
50%
60%
AG
AG
O
ALE
BTO
NG
AM
OLA
TAR
AM
UR
IA
AM
UR
U
BU
DU
DA
BU
GIR
I
BU
KED
EA
BU
LAM
BU
LI
BU
ND
IBU
GYO
BU
YEN
DE
DO
KO
LO
KA
GA
DI
KA
KU
MIR
O
KA
LIR
O
KA
MW
ENG
E
KIB
AA
LE
KO
TID
O
KYA
NK
WA
NZI
LAM
WO
LUU
KA
MA
RA
CH
A
MA
YUG
E
MU
BEN
DE
NA
MA
YIN
GO
NA
MU
TUM
BA
NW
OYA
OYA
M
SOR
OTI
Figure 12: Percent of Female Teachers by District
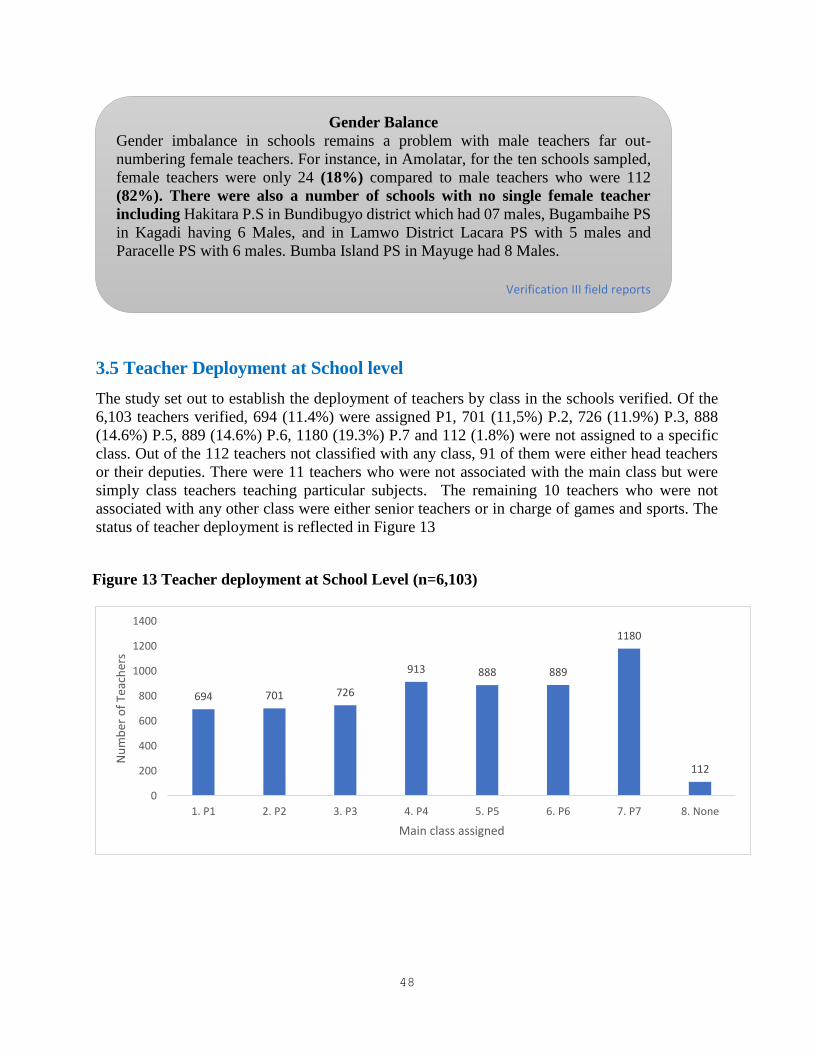
48
3.5 Teacher Deployment at School level
The study set out to establish the deployment of teachers by class in the schools verified. Of the
6,103 teachers verified, 694 (11.4%) were assigned P1, 701 (11,5%) P.2, 726 (11.9%) P.3, 888
(14.6%) P.5, 889 (14.6%) P.6, 1180 (19.3%) P.7 and 112 (1.8%) were not assigned to a specific
class. Out of the 112 teachers not classified with any class, 91 of them were either head teachers
or their deputies. There were 11 teachers who were not associated with the main class but were
simply class teachers teaching particular subjects. The remaining 10 teachers who were not
associated with any other class were either senior teachers or in charge of games and sports. The
status of teacher deployment is reflected in Figure 13
694 701 726
913 888 889
1180
112
0
200
400
600
800
1000
1200
1400
1. P1 2. P2 3. P3 4. P4 5. P5 6. P6 7. P7 8. None
Nu
mb
er o
f Te
ach
ers
Main class assigned
Figure 13 Teacher deployment at School Level (n=6,103)
Gender Balance
Gender imbalance in schools remains a problem with male teachers far out-
numbering female teachers. For instance, in Amolatar, for the ten schools sampled,
female teachers were only 24 (18%) compared to male teachers who were 112
(82%). There were also a number of schools with no single female teacher
including Hakitara P.S in Bundibugyo district which had 07 males, Bugambaihe PS
in Kagadi having 6 Males, and in Lamwo District Lacara PS with 5 males and
Paracelle PS with 6 males. Bumba Island PS in Mayuge had 8 Males.
Verification III field reports
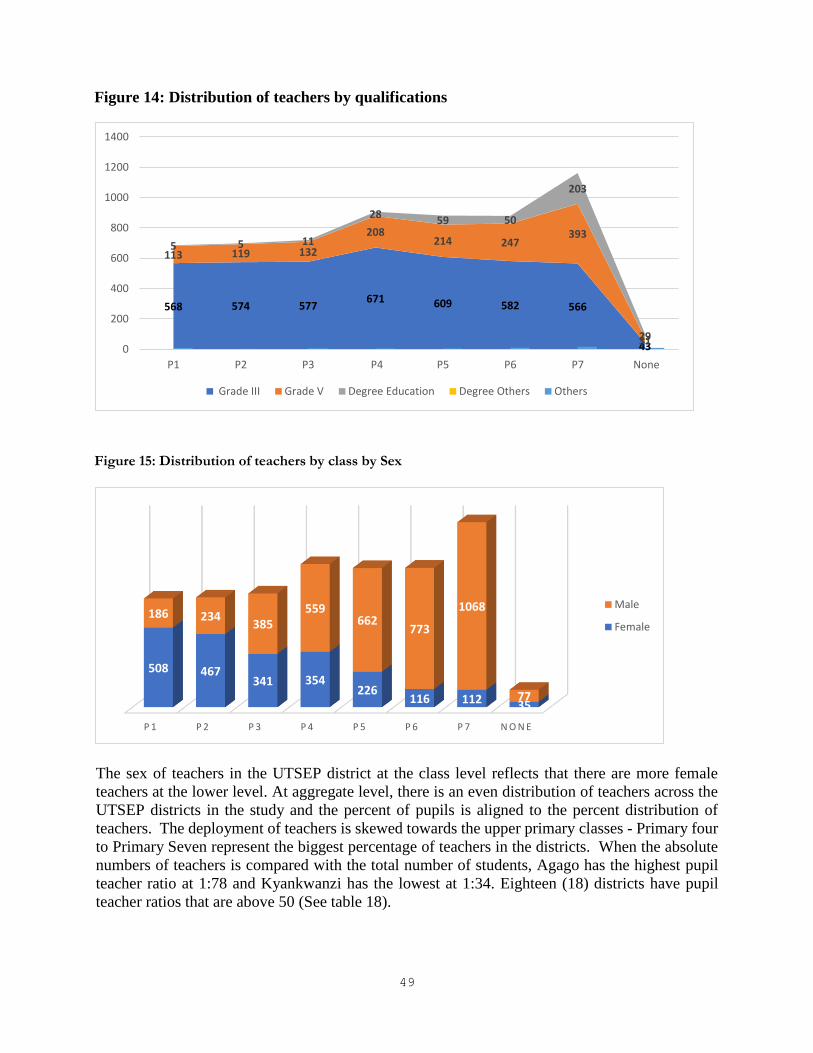
49
The sex of teachers in the UTSEP district at the class level reflects that there are more female
teachers at the lower level. At aggregate level, there is an even distribution of teachers across the
UTSEP districts in the study and the percent of pupils is aligned to the percent distribution of
teachers. The deployment of teachers is skewed towards the upper primary classes - Primary four
to Primary Seven represent the biggest percentage of teachers in the districts. When the absolute
numbers of teachers is compared with the total number of students, Agago has the highest pupil
teacher ratio at 1:78 and Kyankwanzi has the lowest at 1:34. Eighteen (18) districts have pupil
teacher ratios that are above 50 (See table 18).
568 574 577671 609 582 566
43
113 119 132
208214 247
393
31
5 5 11
2859 50
203
290
200
400
600
800
1000
1200
1400
P1 P2 P3 P4 P5 P6 P7 None
Grade III Grade V Degree Education Degree Others Others
P 1 P 2 P 3 P 4 P 5 P 6 P 7 N O N E
508 467341 354
226116 112 35
186 234385
559662
773
1068
77
Male
Female
Figure 14: Distribution of teachers by qualifications
Figure 15: Distribution of teachers by class by Sex
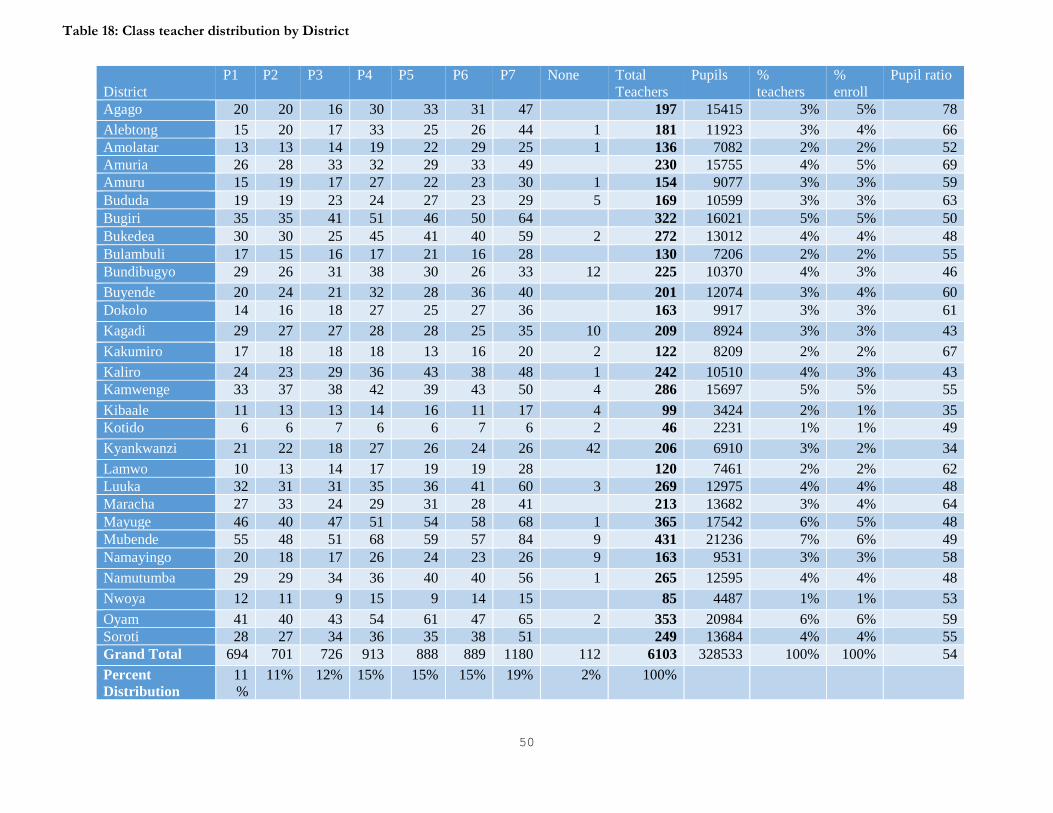
50
District
P1 P2 P3 P4 P5 P6 P7 None Total
Teachers
Pupils %
teachers
%
enroll
Pupil ratio
Agago 20 20 16 30 33 31 47 197 15415 3% 5% 78
Alebtong 15 20 17 33 25 26 44 1 181 11923 3% 4% 66
Amolatar 13 13 14 19 22 29 25 1 136 7082 2% 2% 52
Amuria 26 28 33 32 29 33 49 230 15755 4% 5% 69
Amuru 15 19 17 27 22 23 30 1 154 9077 3% 3% 59
Bududa 19 19 23 24 27 23 29 5 169 10599 3% 3% 63
Bugiri 35 35 41 51 46 50 64
322 16021 5% 5% 50
Bukedea 30 30 25 45 41 40 59 2 272 13012 4% 4% 48
Bulambuli 17 15 16 17 21 16 28
130 7206 2% 2% 55
Bundibugyo 29 26 31 38 30 26 33 12 225 10370 4% 3% 46
Buyende 20 24 21 32 28 36 40
201 12074 3% 4% 60
Dokolo 14 16 18 27 25 27 36 163 9917 3% 3% 61
Kagadi 29 27 27 28 28 25 35 10 209 8924 3% 3% 43
Kakumiro 17 18 18 18 13 16 20 2 122 8209 2% 2% 67
Kaliro 24 23 29 36 43 38 48 1 242 10510 4% 3% 43
Kamwenge 33 37 38 42 39 43 50 4 286 15697 5% 5% 55
Kibaale 11 13 13 14 16 11 17 4 99 3424 2% 1% 35
Kotido 6 6 7 6 6 7 6 2 46 2231 1% 1% 49
Kyankwanzi 21 22 18 27 26 24 26 42 206 6910 3% 2% 34
Lamwo 10 13 14 17 19 19 28
120 7461 2% 2% 62
Luuka 32 31 31 35 36 41 60 3 269 12975 4% 4% 48
Maracha 27 33 24 29 31 28 41
213 13682 3% 4% 64
Mayuge 46 40 47 51 54 58 68 1 365 17542 6% 5% 48
Mubende 55 48 51 68 59 57 84 9 431 21236 7% 6% 49
Namayingo 20 18 17 26 24 23 26 9 163 9531 3% 3% 58
Namutumba 29 29 34 36 40 40 56 1 265 12595 4% 4% 48
Nwoya 12 11 9 15 9 14 15
85 4487 1% 1% 53
Oyam 41 40 43 54 61 47 65 2 353 20984 6% 6% 59
Soroti 28 27 34 36 35 38 51
249 13684 4% 4% 55
Grand Total 694 701 726 913 888 889 1180 112 6103 328533 100% 100% 54
Percent
Distribution
11
%
11% 12% 15% 15% 15% 19% 2% 100%
Table 18: Class teacher distribution by District
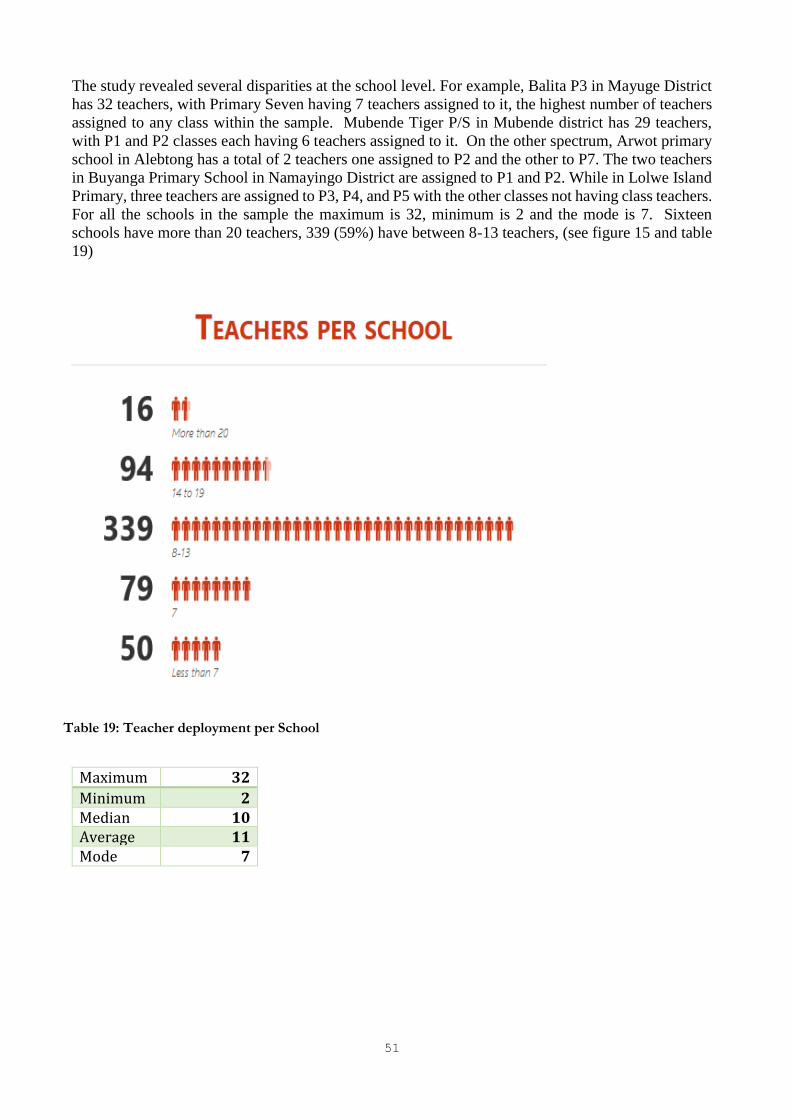
51
The study revealed several disparities at the school level. For example, Balita P3 in Mayuge District
has 32 teachers, with Primary Seven having 7 teachers assigned to it, the highest number of teachers
assigned to any class within the sample. Mubende Tiger P/S in Mubende district has 29 teachers,
with P1 and P2 classes each having 6 teachers assigned to it. On the other spectrum, Arwot primary
school in Alebtong has a total of 2 teachers one assigned to P2 and the other to P7. The two teachers
in Buyanga Primary School in Namayingo District are assigned to P1 and P2. While in Lolwe Island
Primary, three teachers are assigned to P3, P4, and P5 with the other classes not having class teachers.
For all the schools in the sample the maximum is 32, minimum is 2 and the mode is 7. Sixteen
schools have more than 20 teachers, 339 (59%) have between 8-13 teachers, (see figure 15 and table
19)
Maximum 32
Minimum 2 Median 10 Average 11 Mode 7
Table 19: Teacher deployment per School
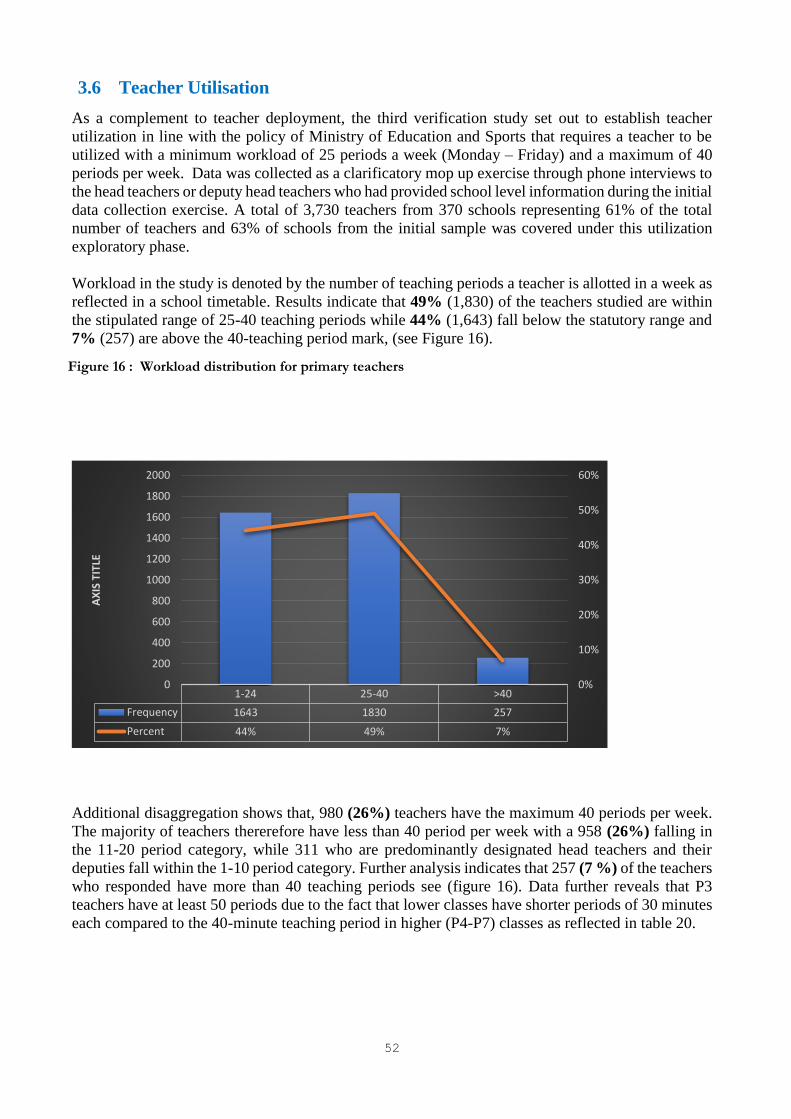
52
3.6 Teacher Utilisation
As a complement to teacher deployment, the third verification study set out to establish teacher
utilization in line with the policy of Ministry of Education and Sports that requires a teacher to be
utilized with a minimum workload of 25 periods a week (Monday – Friday) and a maximum of 40
periods per week. Data was collected as a clarificatory mop up exercise through phone interviews to
the head teachers or deputy head teachers who had provided school level information during the initial
data collection exercise. A total of 3,730 teachers from 370 schools representing 61% of the total
number of teachers and 63% of schools from the initial sample was covered under this utilization
exploratory phase.
Workload in the study is denoted by the number of teaching periods a teacher is allotted in a week as
reflected in a school timetable. Results indicate that 49% (1,830) of the teachers studied are within
the stipulated range of 25-40 teaching periods while 44% (1,643) fall below the statutory range and
7% (257) are above the 40-teaching period mark, (see Figure 16).
Additional disaggregation shows that, 980 (26%) teachers have the maximum 40 periods per week.
The majority of teachers thererefore have less than 40 period per week with a 958 (26%) falling in
the 11-20 period category, while 311 who are predominantly designated head teachers and their
deputies fall within the 1-10 period category. Further analysis indicates that 257 (7 %) of the teachers
who responded have more than 40 teaching periods see (figure 16). Data further reveals that P3
teachers have at least 50 periods due to the fact that lower classes have shorter periods of 30 minutes
each compared to the 40-minute teaching period in higher (P4-P7) classes as reflected in table 20.
1-24 25-40 >40
Frequency 1643 1830 257
Percent 44% 49% 7%
0%
10%
20%
30%
40%
50%
60%
0
200
400
600
800
1000
1200
1400
1600
1800
2000
AX
IS T
ITLE
Figure 16 : Workload distribution for primary teachers
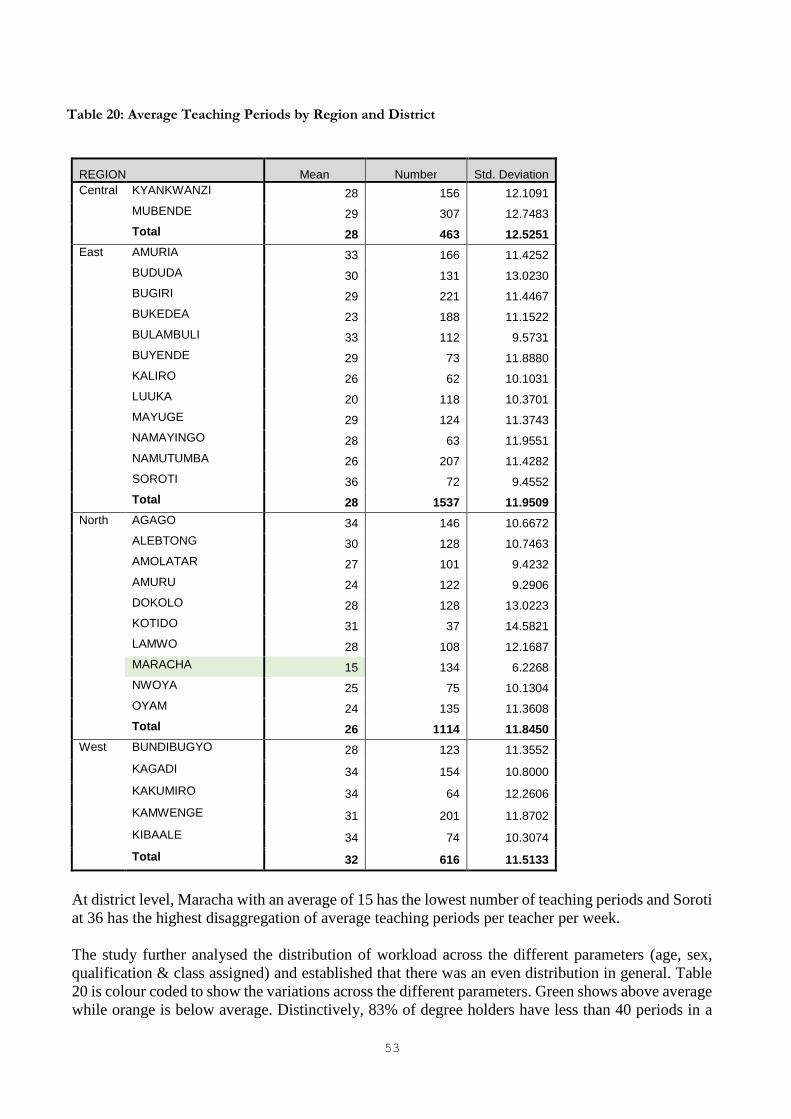
53
REGION Mean Number Std. Deviation
Central KYANKWANZI 28 156 12.1091
MUBENDE 29 307 12.7483
Total 28 463 12.5251
East AMURIA 33 166 11.4252
BUDUDA 30 131 13.0230
BUGIRI 29 221 11.4467
BUKEDEA 23 188 11.1522
BULAMBULI 33 112 9.5731
BUYENDE 29 73 11.8880
KALIRO 26 62 10.1031
LUUKA 20 118 10.3701
MAYUGE 29 124 11.3743
NAMAYINGO 28 63 11.9551
NAMUTUMBA 26 207 11.4282
SOROTI 36 72 9.4552
Total 28 1537 11.9509
North AGAGO 34 146 10.6672
ALEBTONG 30 128 10.7463
AMOLATAR 27 101 9.4232
AMURU 24 122 9.2906
DOKOLO 28 128 13.0223
KOTIDO 31 37 14.5821
LAMWO 28 108 12.1687
MARACHA 15 134 6.2268
NWOYA 25 75 10.1304
OYAM 24 135 11.3608
Total 26 1114 11.8450
West BUNDIBUGYO 28 123 11.3552
KAGADI 34 154 10.8000
KAKUMIRO 34 64 12.2606
KAMWENGE 31 201 11.8702
KIBAALE 34 74 10.3074
Total 32 616 11.5133
At district level, Maracha with an average of 15 has the lowest number of teaching periods and Soroti
at 36 has the highest disaggregation of average teaching periods per teacher per week.
The study further analysed the distribution of workload across the different parameters (age, sex,
qualification & class assigned) and established that there was an even distribution in general. Table
20 is colour coded to show the variations across the different parameters. Green shows above average
while orange is below average. Distinctively, 83% of degree holders have less than 40 periods in a
Table 20: Average Teaching Periods by Region and District
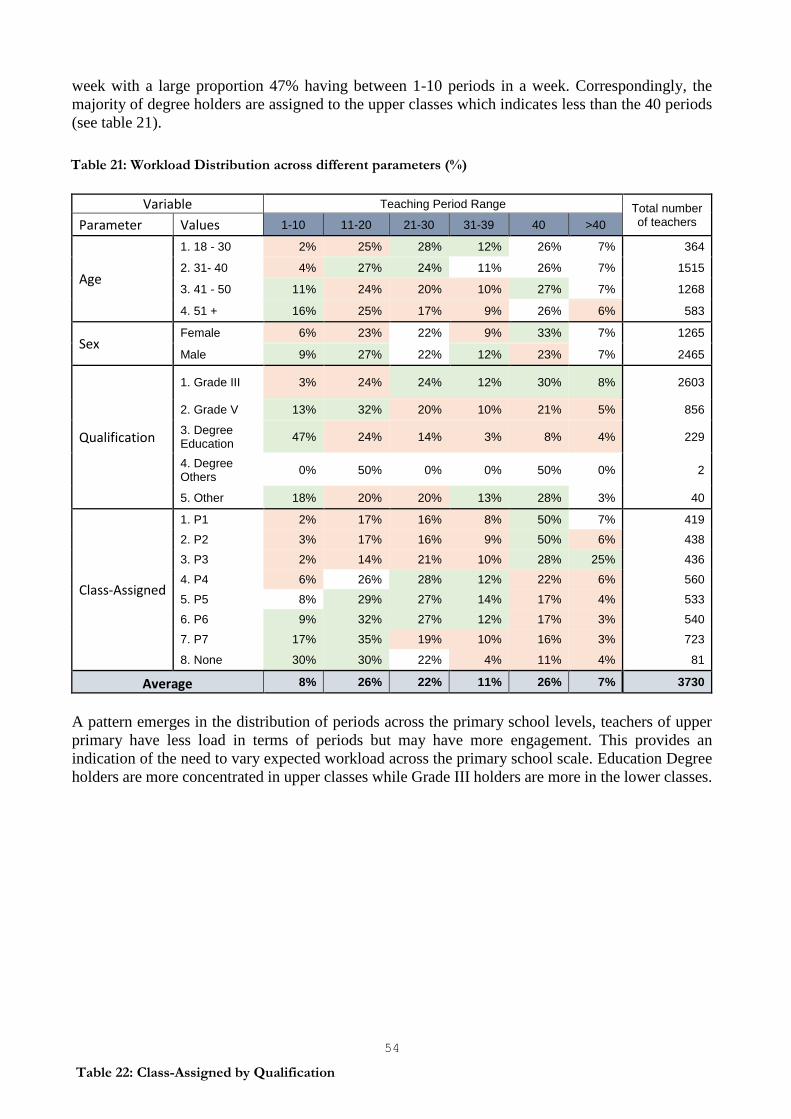
54
week with a large proportion 47% having between 1-10 periods in a week. Correspondingly, the
majority of degree holders are assigned to the upper classes which indicates less than the 40 periods
(see table 21).
Variable Teaching Period Range Total number of teachers Parameter Values 1-10 11-20 21-30 31-39 40 >40
Age
1. 18 - 30 2% 25% 28% 12% 26% 7% 364
2. 31- 40 4% 27% 24% 11% 26% 7% 1515
3. 41 - 50 11% 24% 20% 10% 27% 7% 1268
4. 51 + 16% 25% 17% 9% 26% 6% 583
Sex Female 6% 23% 22% 9% 33% 7% 1265
Male 9% 27% 22% 12% 23% 7% 2465
Qualification
1. Grade III 3% 24% 24% 12% 30% 8% 2603
2. Grade V 13% 32% 20% 10% 21% 5% 856
3. Degree Education
47% 24% 14% 3% 8% 4% 229
4. Degree Others
0% 50% 0% 0% 50% 0% 2
5. Other 18% 20% 20% 13% 28% 3% 40
Class-Assigned
1. P1 2% 17% 16% 8% 50% 7% 419
2. P2 3% 17% 16% 9% 50% 6% 438
3. P3 2% 14% 21% 10% 28% 25% 436
4. P4 6% 26% 28% 12% 22% 6% 560
5. P5 8% 29% 27% 14% 17% 4% 533
6. P6 9% 32% 27% 12% 17% 3% 540
7. P7 17% 35% 19% 10% 16% 3% 723
8. None 30% 30% 22% 4% 11% 4% 81
Average 8% 26% 22% 11% 26% 7% 3730
A pattern emerges in the distribution of periods across the primary school levels, teachers of upper
primary have less load in terms of periods but may have more engagement. This provides an
indication of the need to vary expected workload across the primary school scale. Education Degree
holders are more concentrated in upper classes while Grade III holders are more in the lower classes.
Table 21: Workload Distribution across different parameters (%)
Table 22: Class-Assigned by Qualification
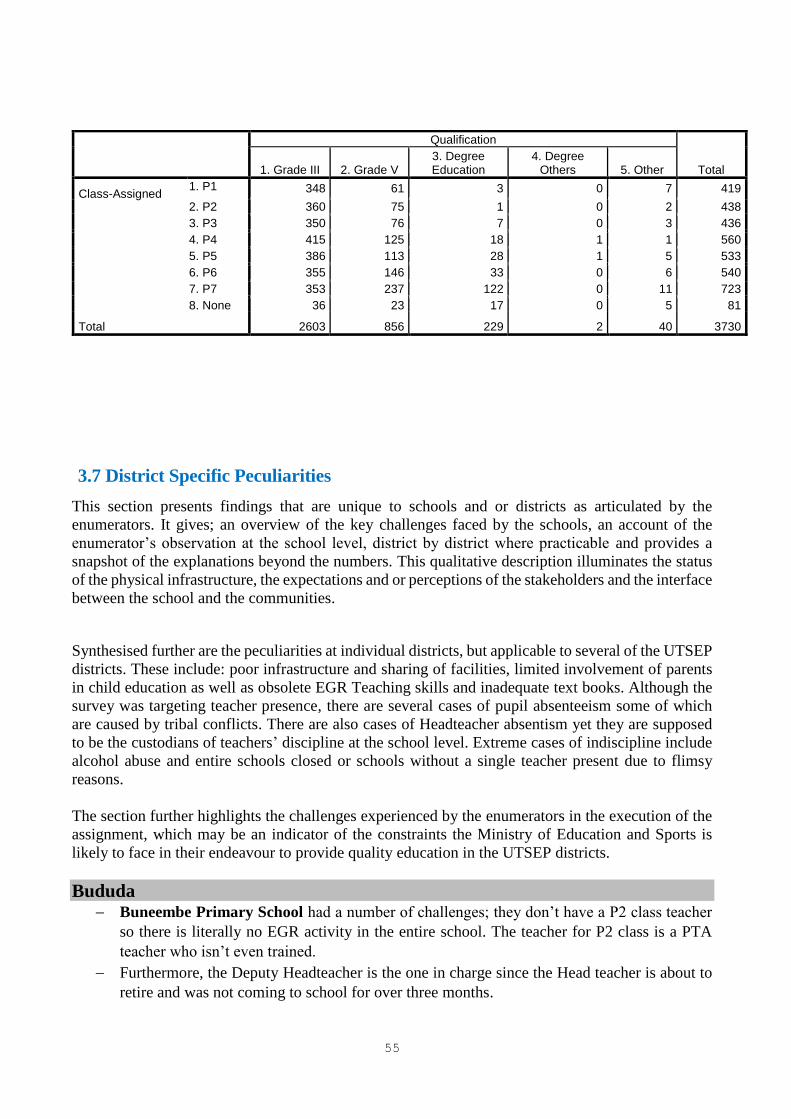
55
3.7 District Specific Peculiarities
This section presents findings that are unique to schools and or districts as articulated by the
enumerators. It gives; an overview of the key challenges faced by the schools, an account of the
enumerator’s observation at the school level, district by district where practicable and provides a
snapshot of the explanations beyond the numbers. This qualitative description illuminates the status
of the physical infrastructure, the expectations and or perceptions of the stakeholders and the interface
between the school and the communities.
Synthesised further are the peculiarities at individual districts, but applicable to several of the UTSEP
districts. These include: poor infrastructure and sharing of facilities, limited involvement of parents
in child education as well as obsolete EGR Teaching skills and inadequate text books. Although the
survey was targeting teacher presence, there are several cases of pupil absenteeism some of which
are caused by tribal conflicts. There are also cases of Headteacher absentism yet they are supposed
to be the custodians of teachers’ discipline at the school level. Extreme cases of indiscipline include
alcohol abuse and entire schools closed or schools without a single teacher present due to flimsy
reasons.
The section further highlights the challenges experienced by the enumerators in the execution of the
assignment, which may be an indicator of the constraints the Ministry of Education and Sports is
likely to face in their endeavour to provide quality education in the UTSEP districts.
Bududa − Buneembe Primary School had a number of challenges; they don’t have a P2 class teacher
so there is literally no EGR activity in the entire school. The teacher for P2 class is a PTA
teacher who isn’t even trained.
− Furthermore, the Deputy Headteacher is the one in charge since the Head teacher is about to
retire and was not coming to school for over three months.
Qualification
Total 1. Grade III 2. Grade V 3. Degree Education
4. Degree Others 5. Other
Class-Assigned 1. P1 348 61 3 0 7 419
2. P2 360 75 1 0 2 438
3. P3 350 76 7 0 3 436
4. P4 415 125 18 1 1 560
5. P5 386 113 28 1 5 533
6. P6 355 146 33 0 6 540
7. P7 353 237 122 0 11 723
8. None 36 23 17 0 5 81
Total 2603 856 229 2 40 3730
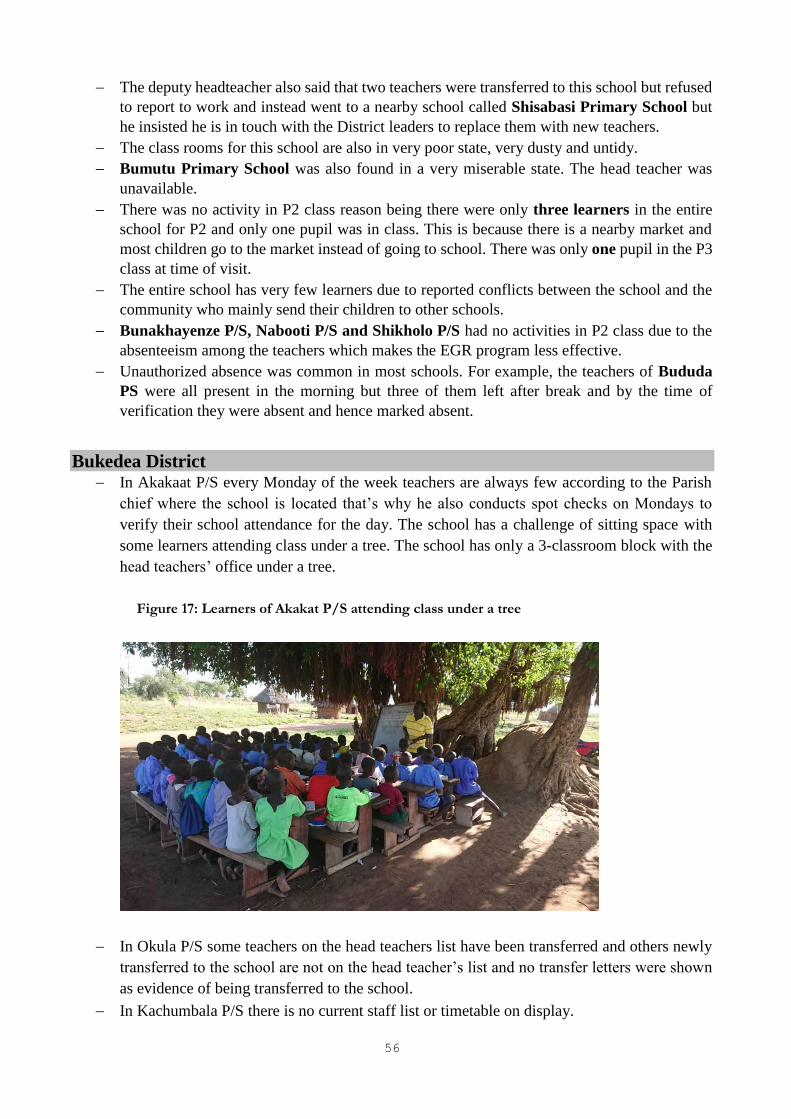
56
− The deputy headteacher also said that two teachers were transferred to this school but refused
to report to work and instead went to a nearby school called Shisabasi Primary School but
he insisted he is in touch with the District leaders to replace them with new teachers.
− The class rooms for this school are also in very poor state, very dusty and untidy.
− Bumutu Primary School was also found in a very miserable state. The head teacher was
unavailable.
− There was no activity in P2 class reason being there were only three learners in the entire
school for P2 and only one pupil was in class. This is because there is a nearby market and
most children go to the market instead of going to school. There was only one pupil in the P3
class at time of visit.
− The entire school has very few learners due to reported conflicts between the school and the
community who mainly send their children to other schools.
− Bunakhayenze P/S, Nabooti P/S and Shikholo P/S had no activities in P2 class due to the
absenteeism among the teachers which makes the EGR program less effective.
− Unauthorized absence was common in most schools. For example, the teachers of Bududa
PS were all present in the morning but three of them left after break and by the time of
verification they were absent and hence marked absent.
Bukedea District − In Akakaat P/S every Monday of the week teachers are always few according to the Parish
chief where the school is located that’s why he also conducts spot checks on Mondays to
verify their school attendance for the day. The school has a challenge of sitting space with
some learners attending class under a tree. The school has only a 3-classroom block with the
head teachers’ office under a tree.
− In Okula P/S some teachers on the head teachers list have been transferred and others newly
transferred to the school are not on the head teacher’s list and no transfer letters were shown
as evidence of being transferred to the school.
− In Kachumbala P/S there is no current staff list or timetable on display.
Figure 17: Learners of Akakat P/S attending class under a tree

57
Bundibugyo General comments
- The DEO and CAO appreciated the exercise and they were so delighted and assured the team
that these sudden visits will improve teacher presence in schools. However, the DEO pointed
out that the delays in salary payments for primary teachers greatly increase teacher absence in
schools. That some teachers had gone for 3-4 months without salaries.
- Most EGR books are written in Lhukonzo and when it comes to lesson preparation, teachers
struggle to translate to Lubwiisi for the Bamba learners to understand what is being taught.
School Specifics
a. Butholya Primary School: At the time of arrival there was no single teacher at school.
However, the verification team met Mr. Mibiri Isaya chairperson of School Management
Committee who said the school has no quarters to house teachers and they come from very
far. ‘Most of the appointed teachers come from Bundibugyo town, I have forwarded names
of qualified teachers who are residents of the area to the District administration but they have
ignored and they have never bothered to consider them. This explains why the school is
always closed or you will find learners playing around the school but with no teacher at
school’
b. Bundiwerume Primary School: The H/Teacher and the rest of the teachers were not in school.
c. Bundibugyo public Primary School: The enumerators reached at school by 8am and the
school was still locked. However, they managed to meet some teachers around who explained
why the school is not functional. That they do not have learners due to the recent conflict
between the Bakonzo and Bamba. That since this term started, they registered 09 learners in
primary one as new learners but the number kept on decreasing until when it came to zero.
That this followed the transfer of the H/Teacher who is a Mubwisi and replaced with a
Mukonzo.
d. Bundiwerume Primary School: The H/Teacher and the rest of the teachers were not in
school at the time of visit but the enumerators managed to meet one PTA committee member
who availed the information. The PTA committee member also told the enumerators that the
teachers abandoned the school to teach in the neighboring school called Bundibukeke primary
school and left the H/Teacher to operate the school alone. Much as he was not at school by
the time of verification.
The PTA committee member moved the enumerators around the school. The school is
dilapidated with no latrine and the road to access the school is bushy and narrow.
e. Bundibubgyo parents’ Primary school: Rev. Mugambe Monday Geoffrey was appointed by
the church as head teacher since it is affiliated to the church. However, it was noted that the
Headteacher did not have any posting letter from either the Ministry or the District. His
appointment was done by the church.
f. Bunguha Primary School: The school has poor shelter, no water, some teachers are not on
the payroll, teachers walk long distances to get to school

58
g. The remaining schools, the problems are more less the same for example; Kanamabale
Primary School in Bundibugyo district; through observation and according to the H/Teacher
Mr. Abigabha Tomson
- It has no latrine
- “our children get married at an early age”
- Most books are written in Lhukonzo yet most learners are Bamba
- The books are few to cater for the number of learners
- Parents involvement in school activities is minimal
Buyende District
− The conditions under which some learners study is still unfavourable, especially if some
learners still sit on the ground while writing. (Such as Kamugoya P/S P.2 Class and St. Kizito
P/S).
Kaliro District
− Nakaboko primary school in Kisinda parish only had two teachers present in the whole school,
the rest including head teacher were absent without permission.
− Under staffing of teachers where by one teacher covers all subjects in a class was observed in
Bupyana primary school in Bupyana parish especially in P1, P2, P3 and P4 classes.
− Some classes are conducted under trees and lessons don’t go on during rainy season for
example in Budehe primary and Nakaboko primary schools.
− Learners sit on the floor due to inadequate seats for example Lugonyola and Bupyana primary
schools.
Kamwenge District − Nyabbani Moslem School: Absence of head teacher, deputy head teacher and P.2 teacher who
were key targets for the verification constrained the exercise.
− Teacher pupil ratio in some schools was high for example in Rutooma primary school the ratio
is 1:133 learners and in Nyarurambi primary school was 1:90 learners, Rwamwanja is around
1:100 learners because P.2 class has over 500 learners.
− Factors which lead to school dropout and poor performance of learners include; sickness,
poverty and hugger as most parents don’t pack food for their children.
− Lack of school‐staff quarters, work as an excuse for late coming in most of the schools,
because it was found out that at 80% of the schools covered did not have staff quarters.
− Some schools still need to be beefed up with more text books, for example in Mirambi
primary school which had less than 50 text books with over seventy learners in P.2.
Kyankwanzi
− Observation indicated that most teachers didn’t have morale of doing their job. A case in point
was Kiryanongo P/S where some teachers seemed unmindful about the time of arrival to
school and also relaxed during class time.
Maracha

59
− Pupil enrolment delayed because of the Ministry of Education policy of demanding national
identity cards from the parents before enrolling their learners. This policy has made so many
school going children to remain at home since the parents don’t have the national identity cards
and some lost theirs. This was a strong concern from the head teachers in most schools.
− The team on reaching Kakwa PS the head teacher was not in office and the deputy said he had
gone to have some breakfast only for him to return under heavy influence of alcohol
− The verification team found the P2 teacher teaching literacy other than CAPE 2 that appeared on
the timetable. His reason for altering the timetable was that, the learners get lazy towards
afternoon. In a related incidence the P2 teacher for Kimaka PS was found under influence of
alcohol at a time he was supposed to be teaching.
− In Ambekua PS all the teachers and the head teacher arrived earlier than 8:30 am, we applauded
them for the time management but after the team was done with information capture, they left
for their personal business making them miss the group photo which was one of the most
important components of the verification exercise.
− In Buramali PS the P2 teacher didn’t have both scheme of work and the lesson plan though he
was found teaching English language.
Mubende
At Kabaale primary school, Kigando parish, Kasambya subcounty, the substantive headteacher was
reported to have been convicted in courts of law for four years and had been out of the school for
now one year yet is considered the substantive head teacher of the school.
Namayingo
− Most head teachers were not found in schools at the various times of verification exercise. There
was always a claim that they are out for a meeting at the district. For instance, summaries for
Bugoma Academy P/S on Sigulu Island could not be stamped because the head teacher had moved
with the keys to the locker where the stamp is kept.
− Five (5) schools out of 18 visited had their offices shared with a classroom. The interaction of the
team with the heads of schools inevitably interrupted the concentration of learners in those class
rooms. This implies that each time there is visitor classes are interrupted.
− Buyanga P/S. Access to the school was through the bush. It was a partly deserted camp once
occupied by the fishermen. The school has only P.1 and P.2 with an enrollment of 7 learners
in P.1 and 3 learners in P.2. There are two teachers in the school. By the time of the exericise
there was one teacher, Ochieng Daniel. The entire P.2 class was absent and only 4 learners of P.1
were present. Both classes are taught in one room although there are 4 classrooms. Two
rooms have been abandoned to the Island sheep and goats while one room serves as the office.
Unfortunately, the one used as a class room has its roof partly swept off. The teacher explained
that fishermen migrated from the Island after illegal fishing was curbed by government. This has
left the school without learners.
− Lolwe Island P/S registered 15 learners for PLE in 2018 and out of that 5 passed in DIV 3.
However no single pupil was able to cross to a post primary institution. They are all now
fishermen on the Islands. The same school has 7 classes with only 4 classrooms and 3 teachers.
Two classes study under trees and P3 is in a dilapidated structure which is halfway collapsed.
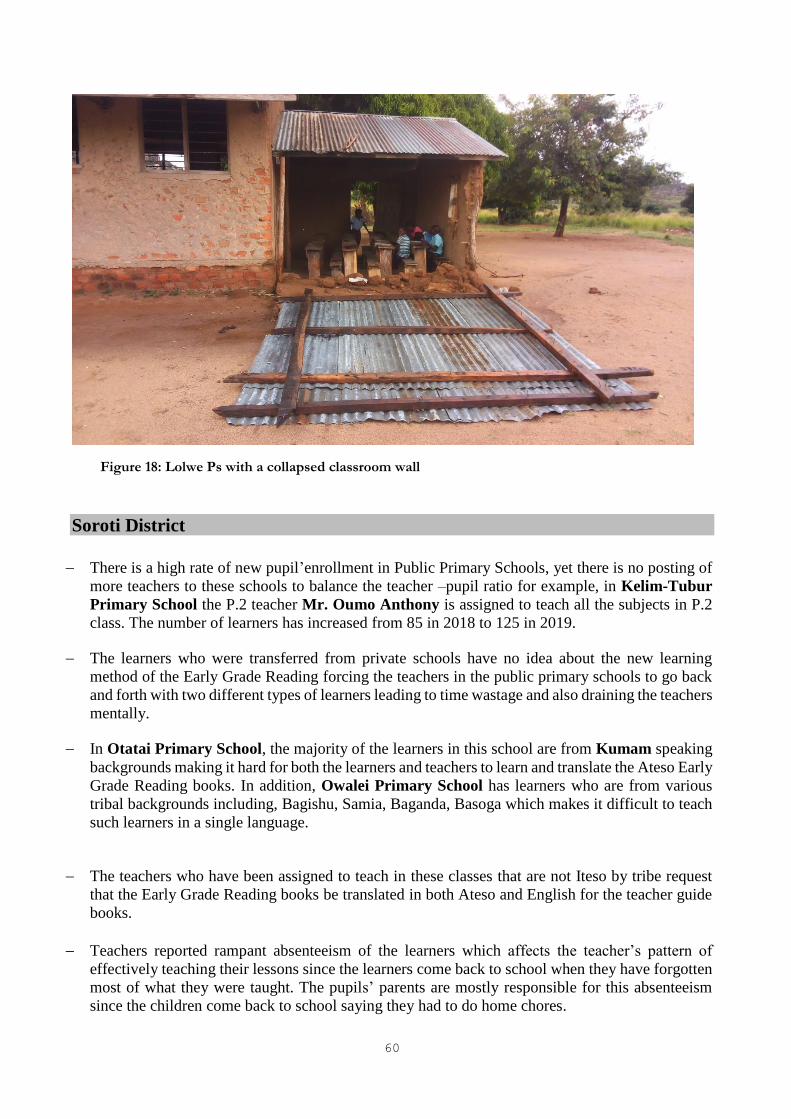
60
Soroti District
− There is a high rate of new pupil’enrollment in Public Primary Schools, yet there is no posting of
more teachers to these schools to balance the teacher –pupil ratio for example, in Kelim-Tubur
Primary School the P.2 teacher Mr. Oumo Anthony is assigned to teach all the subjects in P.2
class. The number of learners has increased from 85 in 2018 to 125 in 2019.
− The learners who were transferred from private schools have no idea about the new learning
method of the Early Grade Reading forcing the teachers in the public primary schools to go back
and forth with two different types of learners leading to time wastage and also draining the teachers
mentally.
− In Otatai Primary School, the majority of the learners in this school are from Kumam speaking
backgrounds making it hard for both the learners and teachers to learn and translate the Ateso Early
Grade Reading books. In addition, Owalei Primary School has learners who are from various
tribal backgrounds including, Bagishu, Samia, Baganda, Basoga which makes it difficult to teach
such learners in a single language.
− The teachers who have been assigned to teach in these classes that are not Iteso by tribe request
that the Early Grade Reading books be translated in both Ateso and English for the teacher guide
books.
− Teachers reported rampant absenteeism of the learners which affects the teacher’s pattern of
effectively teaching their lessons since the learners come back to school when they have forgotten
most of what they were taught. The pupils’ parents are mostly responsible for this absenteeism
since the children come back to school saying they had to do home chores.
Figure 18: Lolwe Ps with a collapsed classroom wall
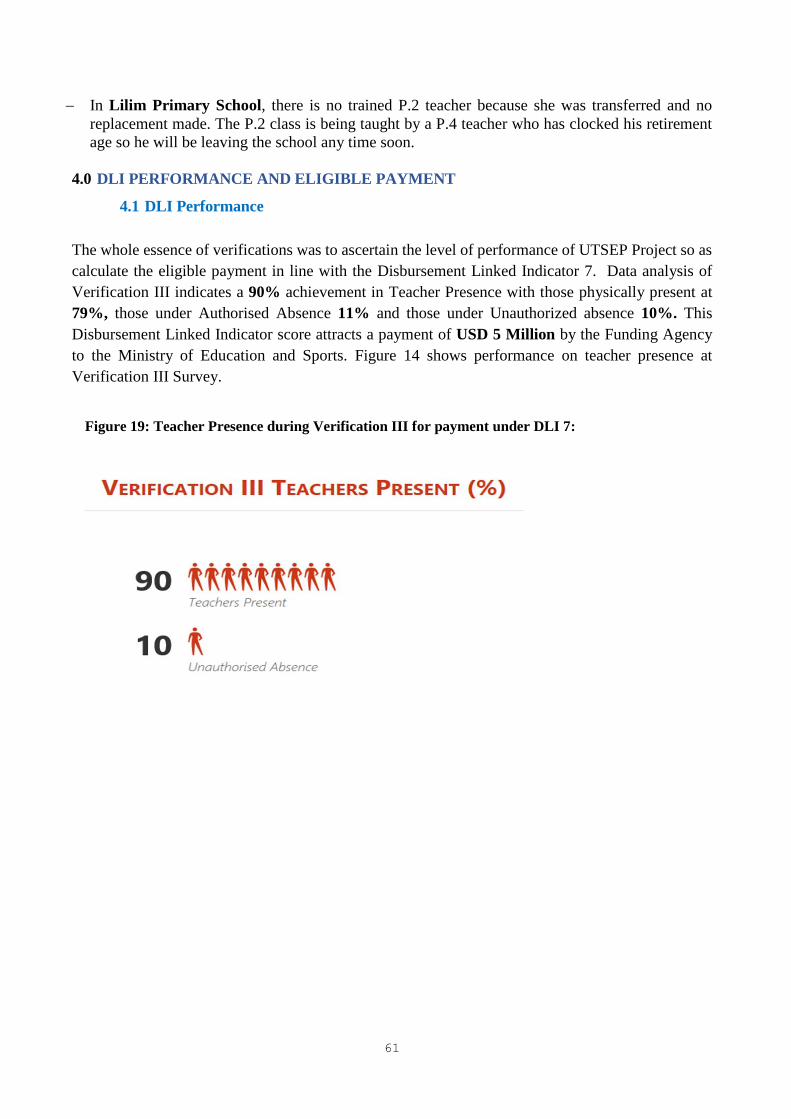
61
− In Lilim Primary School, there is no trained P.2 teacher because she was transferred and no
replacement made. The P.2 class is being taught by a P.4 teacher who has clocked his retirement
age so he will be leaving the school any time soon.
4.0 DLI PERFORMANCE AND ELIGIBLE PAYMENT
4.1 DLI Performance
The whole essence of verifications was to ascertain the level of performance of UTSEP Project so as
calculate the eligible payment in line with the Disbursement Linked Indicator 7. Data analysis of
Verification III indicates a 90% achievement in Teacher Presence with those physically present at
79%, those under Authorised Absence 11% and those under Unauthorized absence 10%. This
Disbursement Linked Indicator score attracts a payment of USD 5 Million by the Funding Agency
to the Ministry of Education and Sports. Figure 14 shows performance on teacher presence at
Verification III Survey.
Figure 19: Teacher Presence during Verification III for payment under DLI 7:
62
5.0 CONCLUSIONS
Verification III marks the final in a series of independent verifications undertaken as one of the measures
to establish the effectiveness of Early Grade Reading and Teacher Presence in the 29 UTSEP districts.
The study sought to establish the percentage of P1-P7 teachers physically present in public primary
schools, P2 Teachers Time on Task and compute eligible payments against the DLI 7 Targets.
Based on the agreed sample of 580 schools, data was collected from 580 sampled schools making a
response rate of 100% similar to Verification II, up from 578 (99.6%) at Verification I and the
Baseline response rate of 566 (97.5 %). While there are no significant variations in the general
performance across the three Verification studies, the general decline of teacher presence continued to
manifest in districts of Maracha, Namayingo, Agago, Kagadi, Lamwo, Bundibugyo and Mayuge when
Verification III is compared to the Baseline. Significant improvement is noted in some districts including
Dokolo, Kotido and Kakumiro.
Analysis of physical teacher presence across the four surveys reveals that the variations between Baseline,
Verification I, II and III are not significant. Performance was: Baseline 76%, Verification I, 82%,
Verification II at 81% and verification III 79%. Female teachers have consistently been more physically
present than their male counterparts although there remains a disproportionate distribution with less
female teachers especially in Northern Uganda.
Review of the performance across the four surveys reveals that 15 districts were persistently above
average with Amuria and Dokolo being the best performers. However, Kakumiro district showed the best
improvement moving from 65% at baseline to 89% by the time of Verification III. Kotido moved from
85% at baseline to 96% at verification III.
The final verification found improvements in the P2- Teacher -Time on Task parameters. The verifications
recorded minimal variation in the persistently high performance in teacher presence of: 91% at
Verification I, 93% at Verification II and 92% at Verification III. For P2 teacher rightly assigned at
Verification I, 93%, Verification II at 94% and Verification III at 96%, P2 teacher teaching a timetabled
lesson at Verification I, 85%, Verification II, 86% and Verification III at 85%. Teacher teaching
according to Scheme of work during Verification I at 86%, Verification II at 90% and Verification III at
88%.
There is high disparity among schools regarding numbers of teachers. There are more female teachers
at the lower and deployment of teachers is skewed towards the upper primary classes - Primary four
to Primary Seven.
There is marked underutilization of teachers in UTSEP covered public primary schools with 44%
falling below the minimum 25 teaching periods a week.
There are district specific peculiarities that impact negatively on teacher presence, teacher on task
and teacher utilization including weak headteacher supervision, marked teacher absence, teacher
indiscipline, gross absence of pupils and inadequate school infrastructure.

63
6.0 RECOMMENDATIONS
The recommendations below fit within the general framework of improving the performance of the
education sector. While focus has been made on the Uganda Teacher and School Effectiveness
Project, they have implications for the overall education sector in Uganda. Some of the
recommendations have implications for policy while others are targeted at improving the practices
that affect both school management and teaching.
1. Teacher Presence
According to the National Teacher Policy (2017) teachers are the single most important school-
related factor affecting student learning outcomes—more than anything else, as such the quality of
education is to a large extent correlated and dependent on the quality of teachers. Headteachers,
therefore, need to do more effective management, supervision and reporting on their teachers to
ensure regular teacher presence and those found to be failing in this task be severely reprimanded.
Effort should be made to ensure that each teacher has sufficient workload (not below 25 teaching
periods a week) to effectively utilize them at school.
The District Service Commission should ensure that Headteachers and teachers are regularly
appraised to reprimand those with persistent poor learner performance, indisciplined and inefficient
resource personnel in line with Education (Pre-Primary, Primary and Post Primary) Act 2008 and
reward those with excellent performance in line with the National Teacher Policy (2017). As such
sanctions and rewards mechanisms should revitalized.
A teacher presence monitoring book be established at school level to be filled in by all key
stakeholders that conduct supervision and monitoring of schools especially the subcounty chiefs,
Chairpersons of SMC’s, District Inspectors of Schools and a summary report made termly by a
headteacher to the DEO who should consequently prepare and submit a summary report to MOES.
There is need for Sub-county Chief to make teacher presence key on the school supervision agenda
and support the headteacher to be more effective.
There is need for enhanced community vigilance on teachers’ presence in schools for instance
reporting to the relevant authorities on teachers’ misconduct.
2. Teacher Time on Task
Lesson plans are part and parcel of the teacher effectiveness and head teachers and school supervisors
should ensure that these are available and being used for reference by all teachers in the school.
There is need to ensure that each school has at least a teacher trained in EGR to manage lower classes
and refresher training be arranged for those who were trained in the past.
There is need for periodic review of the content of EGR training materials incorporating feedback
from the teachers and users/learners.
It is important to effectively map local languages against the EGR materials to be used.

64
3. Teacher Deployment and Utilization
Further study be made on teacher utilization covering all teachers in Uganda with the objective of
rationalizing deployment and fostering effective teacher utilization.
Head teachers be sensitized to harmonize distribution of workload among staff for optimum
utilization of teaching resource and garnering staff motivation.
4. Gender Balancing
As gender balance is not yet attained with males outnumbering females, there is need to attract more
females for training and posting to public primary schools.
There is need for immediate transfer of female teachers to those schools with no single female teacher
so that at least every school has a female teacher to handle unique needs of female learners.
5. Rural urban Disparities
For sparsely located schools in the remote areas there is need to explore the possibility of use of
virtual technology where a good teacher located far away can teach the learners in distant location.
Accommodation for teachers in hard to reach areas needs to be prioritized to minimize late
attendance, or the time frames of the teaching in those schools is flexible to accommodate the time
taken to and from school. Where teachers reach for instance at 10:00 a.m, the time at the school
should be extended to compensate for the missed lessons with the same day.
6. School Infrastructure
There is need to address the gaps in infrastructure especially classroom blocks and teachers’ houses
provision to Public primary schools in Uganda.
7. Teacher Pupil Ratio
There is need to address the high pupil teacher ratios especially in northern region where the pupil teacher
ratios are very high.
8. Monitoring Coordination and Supervision
Increase supervision and quality assurance especially in the remote areas to curtail arbitrary closure
of entire school under flimsy and unjustifiable reasons. For a headteacher to close a school, express
permission be sought from the DEO.
As uncoordinated activities of the different government players exert pressure on completion of
school teaching calendars, there is need for coordination by the MOES of programmes that affect
school teaching. Undue interruptions to the school activities should be minimised.
Independent verification activities should be fully integrated in the Education Management System
including planning and implementation. Verification missions be extended in scope to cover:
pedagogy, school practices, teacher utilization, status of facilities, and resources with special
emphasis on rural and hard to reach areas. A similar country wide verification exercise would greatly
facilitate both the update of teacher lists and the establishment of teacher presence nation-wide.
The Ministry should provide clear policy guidelines on what constitutes Authorized Absence and
Unauthorized for observance by key stakeholders in supervision and monitoring of schools.

65
The innovation of the Ministry of Education and Sports as contained in the National Teacher Policy,
whereby headteachers are required to sign performance agreements based on clear assessment
indicators as a prerequisite for appointment as Headteacher need to be reinforced.
There is need for a specific study to harmonize teacher lists between the Ministry of Education and
Sports and the CAO posted ones. The Ministry may also utilize modern technology where by an
appropriate ‘APP’ that can update the teachers’ payroll instantly in case of transfers or deaths.
There is need for DLGs to strengthen supervision of schools and submit regular reports to relevant
authorities to take necessary action.
There is need for SMC to make teacher presence key on their school supervision agenda and generally
support the headteacher and teachers to be more effective.
9. Use of research findings on Education sector
There is need for synthetization of the findings from various researches done on the Education sector
to enhance shared knowledge and develop appropriate policy and implementation framework.
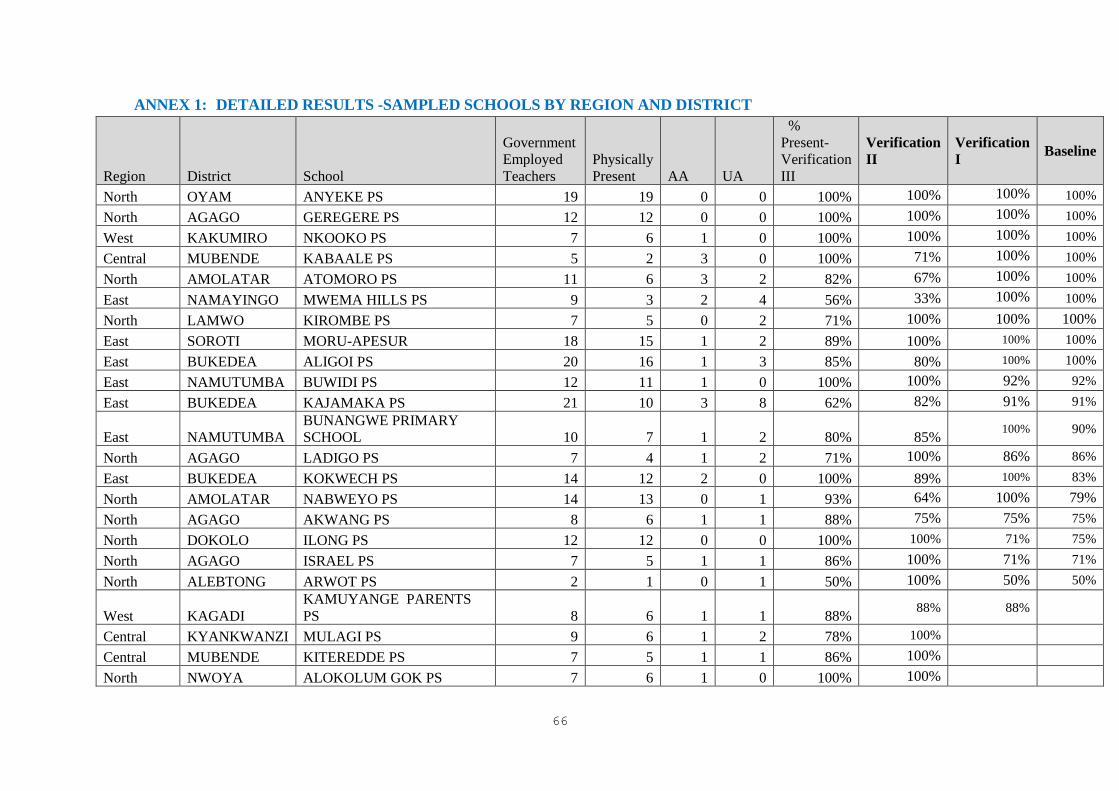
66
ANNEX 1: DETAILED RESULTS -SAMPLED SCHOOLS BY REGION AND DISTRICT
Region District School
Government
Employed
Teachers
Physically
Present AA UA
%
Present-
Verification
III
Verification
II
Verification
I Baseline
North OYAM ANYEKE PS 19 19 0 0 100% 100% 100% 100%
North AGAGO GEREGERE PS 12 12 0 0 100% 100% 100% 100%
West KAKUMIRO NKOOKO PS 7 6 1 0 100% 100% 100% 100%
Central MUBENDE KABAALE PS 5 2 3 0 100% 71% 100% 100%
North AMOLATAR ATOMORO PS 11 6 3 2 82% 67% 100% 100%
East NAMAYINGO MWEMA HILLS PS 9 3 2 4 56% 33% 100% 100%
North LAMWO KIROMBE PS 7 5 0 2 71% 100% 100% 100%
East SOROTI MORU-APESUR 18 15 1 2 89% 100% 100% 100%
East BUKEDEA ALIGOI PS 20 16 1 3 85% 80% 100% 100%
East NAMUTUMBA BUWIDI PS 12 11 1 0 100% 100% 92% 92%
East BUKEDEA KAJAMAKA PS 21 10 3 8 62% 82% 91% 91%
East NAMUTUMBA
BUNANGWE PRIMARY
SCHOOL 10 7 1 2 80% 85% 100% 90%
North AGAGO LADIGO PS 7 4 1 2 71% 100% 86% 86%
East BUKEDEA KOKWECH PS 14 12 2 0 100% 89% 100% 83%
North AMOLATAR NABWEYO PS 14 13 0 1 93% 64% 100% 79%
North AGAGO AKWANG PS 8 6 1 1 88% 75% 75% 75%
North DOKOLO ILONG PS 12 12 0 0 100% 100% 71% 75%
North AGAGO ISRAEL PS 7 5 1 1 86% 100% 71% 71%
North ALEBTONG ARWOT PS 2 1 0 1 50% 100% 50% 50%
West KAGADI
KAMUYANGE PARENTS
PS 8 6 1 1 88% 88% 88%
Central KYANKWANZI MULAGI PS 9 6 1 2 78% 100%
Central MUBENDE KITEREDDE PS 7 5 1 1 86% 100%
North NWOYA ALOKOLUM GOK PS 7 6 1 0 100% 100%
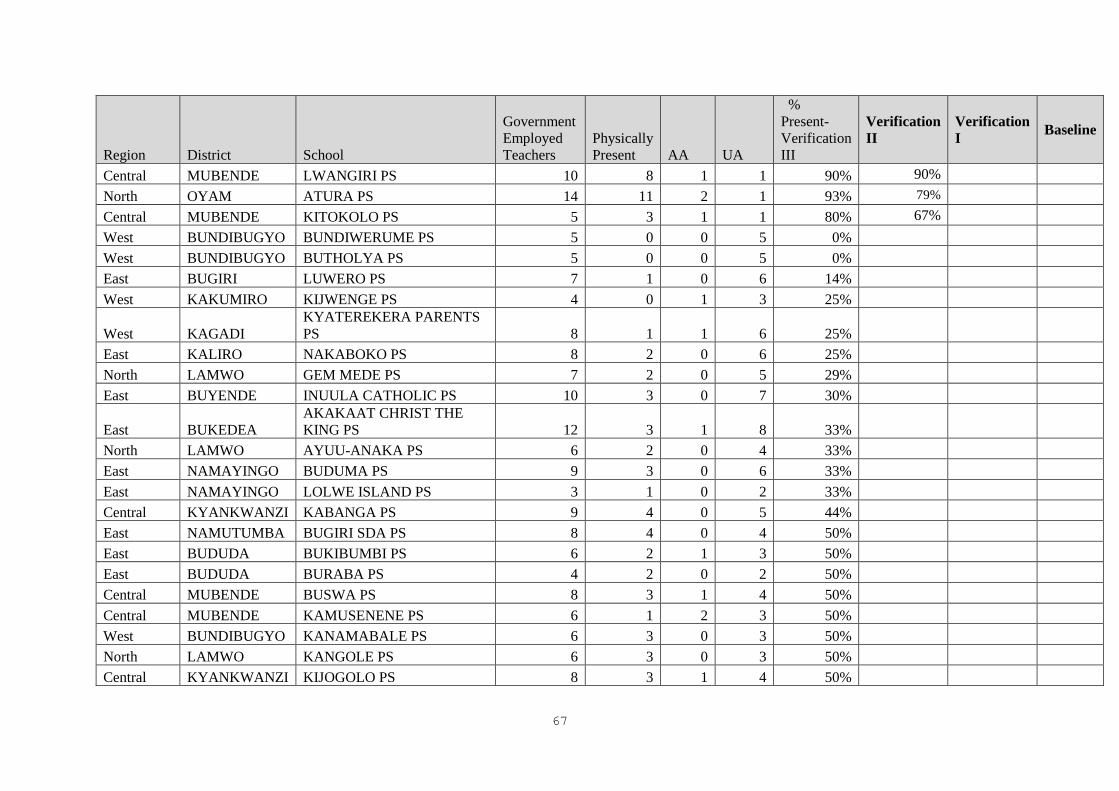
67
Region District School
Government
Employed
Teachers
Physically
Present AA UA
%
Present-
Verification
III
Verification
II
Verification
I Baseline
Central MUBENDE LWANGIRI PS 10 8 1 1 90% 90%
North OYAM ATURA PS 14 11 2 1 93% 79%
Central MUBENDE KITOKOLO PS 5 3 1 1 80% 67%
West BUNDIBUGYO BUNDIWERUME PS 5 0 0 5 0%
West BUNDIBUGYO BUTHOLYA PS 5 0 0 5 0%
East BUGIRI LUWERO PS 7 1 0 6 14%
West KAKUMIRO KIJWENGE PS 4 0 1 3 25%
West KAGADI
KYATEREKERA PARENTS
PS 8 1 1 6 25%
East KALIRO NAKABOKO PS 8 2 0 6 25%
North LAMWO GEM MEDE PS 7 2 0 5 29%
East BUYENDE INUULA CATHOLIC PS 10 3 0 7 30%
East BUKEDEA
AKAKAAT CHRIST THE
KING PS 12 3 1 8 33%
North LAMWO AYUU-ANAKA PS 6 2 0 4 33%
East NAMAYINGO BUDUMA PS 9 3 0 6 33%
East NAMAYINGO LOLWE ISLAND PS 3 1 0 2 33%
Central KYANKWANZI KABANGA PS 9 4 0 5 44%
East NAMUTUMBA BUGIRI SDA PS 8 4 0 4 50%
East BUDUDA BUKIBUMBI PS 6 2 1 3 50%
East BUDUDA BURABA PS 4 2 0 2 50%
Central MUBENDE BUSWA PS 8 3 1 4 50%
Central MUBENDE KAMUSENENE PS 6 1 2 3 50%
West BUNDIBUGYO KANAMABALE PS 6 3 0 3 50%
North LAMWO KANGOLE PS 6 3 0 3 50%
Central KYANKWANZI KIJOGOLO PS 8 3 1 4 50%
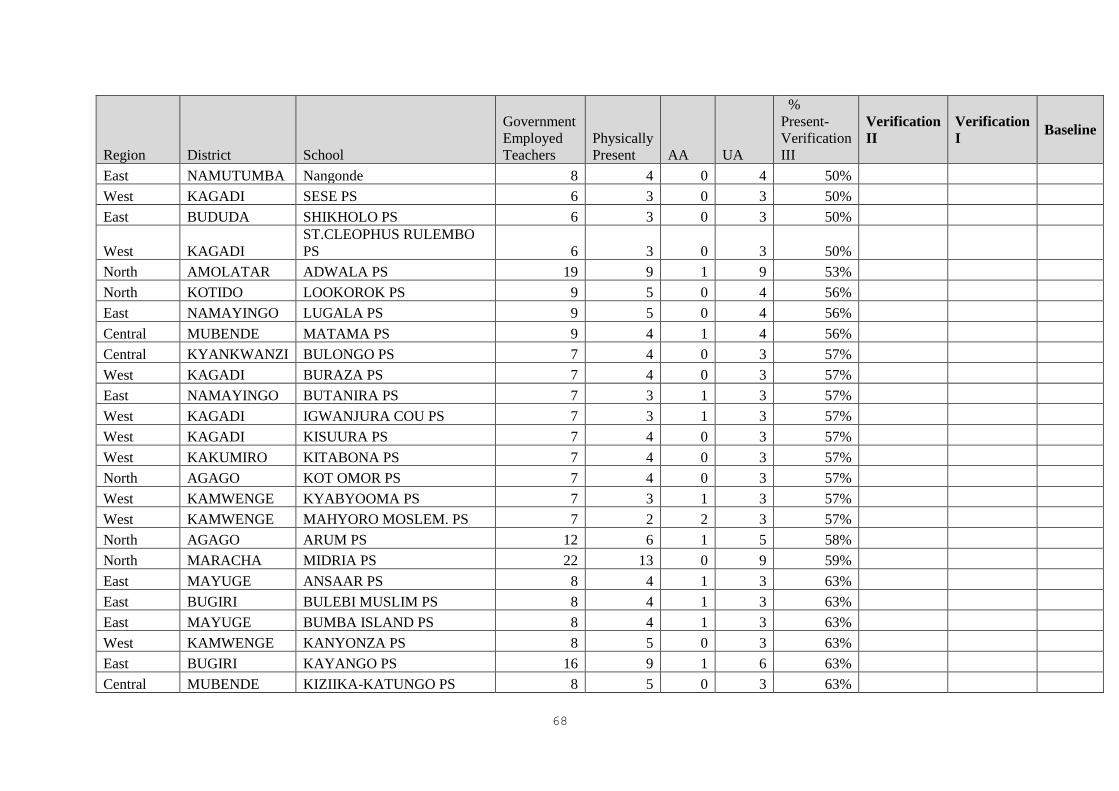
68
Region District School
Government
Employed
Teachers
Physically
Present AA UA
%
Present-
Verification
III
Verification
II
Verification
I Baseline
East NAMUTUMBA Nangonde 8 4 0 4 50%
West KAGADI SESE PS 6 3 0 3 50%
East BUDUDA SHIKHOLO PS 6 3 0 3 50%
West KAGADI
ST.CLEOPHUS RULEMBO
PS 6 3 0 3 50%
North AMOLATAR ADWALA PS 19 9 1 9 53%
North KOTIDO LOOKOROK PS 9 5 0 4 56%
East NAMAYINGO LUGALA PS 9 5 0 4 56%
Central MUBENDE MATAMA PS 9 4 1 4 56%
Central KYANKWANZI BULONGO PS 7 4 0 3 57%
West KAGADI BURAZA PS 7 4 0 3 57%
East NAMAYINGO BUTANIRA PS 7 3 1 3 57%
West KAGADI IGWANJURA COU PS 7 3 1 3 57%
West KAGADI KISUURA PS 7 4 0 3 57%
West KAKUMIRO KITABONA PS 7 4 0 3 57%
North AGAGO KOT OMOR PS 7 4 0 3 57%
West KAMWENGE KYABYOOMA PS 7 3 1 3 57%
West KAMWENGE MAHYORO MOSLEM. PS 7 2 2 3 57%
North AGAGO ARUM PS 12 6 1 5 58%
North MARACHA MIDRIA PS 22 13 0 9 59%
East MAYUGE ANSAAR PS 8 4 1 3 63%
East BUGIRI BULEBI MUSLIM PS 8 4 1 3 63%
East MAYUGE BUMBA ISLAND PS 8 4 1 3 63%
West KAMWENGE KANYONZA PS 8 5 0 3 63%
East BUGIRI KAYANGO PS 16 9 1 6 63%
Central MUBENDE KIZIIKA-KATUNGO PS 8 5 0 3 63%
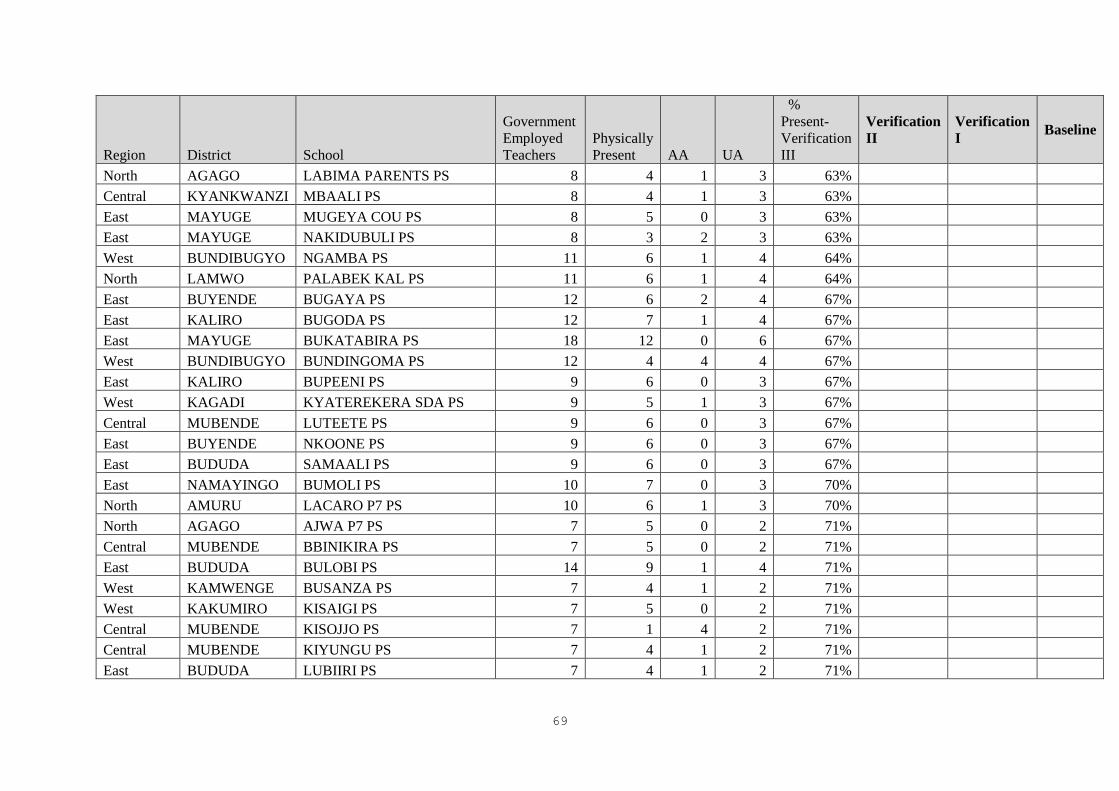
69
Region District School
Government
Employed
Teachers
Physically
Present AA UA
%
Present-
Verification
III
Verification
II
Verification
I Baseline
North AGAGO LABIMA PARENTS PS 8 4 1 3 63%
Central KYANKWANZI MBAALI PS 8 4 1 3 63%
East MAYUGE MUGEYA COU PS 8 5 0 3 63%
East MAYUGE NAKIDUBULI PS 8 3 2 3 63%
West BUNDIBUGYO NGAMBA PS 11 6 1 4 64%
North LAMWO PALABEK KAL PS 11 6 1 4 64%
East BUYENDE BUGAYA PS 12 6 2 4 67%
East KALIRO BUGODA PS 12 7 1 4 67%
East MAYUGE BUKATABIRA PS 18 12 0 6 67%
West BUNDIBUGYO BUNDINGOMA PS 12 4 4 4 67%
East KALIRO BUPEENI PS 9 6 0 3 67%
West KAGADI KYATEREKERA SDA PS 9 5 1 3 67%
Central MUBENDE LUTEETE PS 9 6 0 3 67%
East BUYENDE NKOONE PS 9 6 0 3 67%
East BUDUDA SAMAALI PS 9 6 0 3 67%
East NAMAYINGO BUMOLI PS 10 7 0 3 70%
North AMURU LACARO P7 PS 10 6 1 3 70%
North AGAGO AJWA P7 PS 7 5 0 2 71%
Central MUBENDE BBINIKIRA PS 7 5 0 2 71%
East BUDUDA BULOBI PS 14 9 1 4 71%
West KAMWENGE BUSANZA PS 7 4 1 2 71%
West KAKUMIRO KISAIGI PS 7 5 0 2 71%
Central MUBENDE KISOJJO PS 7 1 4 2 71%
Central MUBENDE KIYUNGU PS 7 4 1 2 71%
East BUDUDA LUBIIRI PS 7 4 1 2 71%
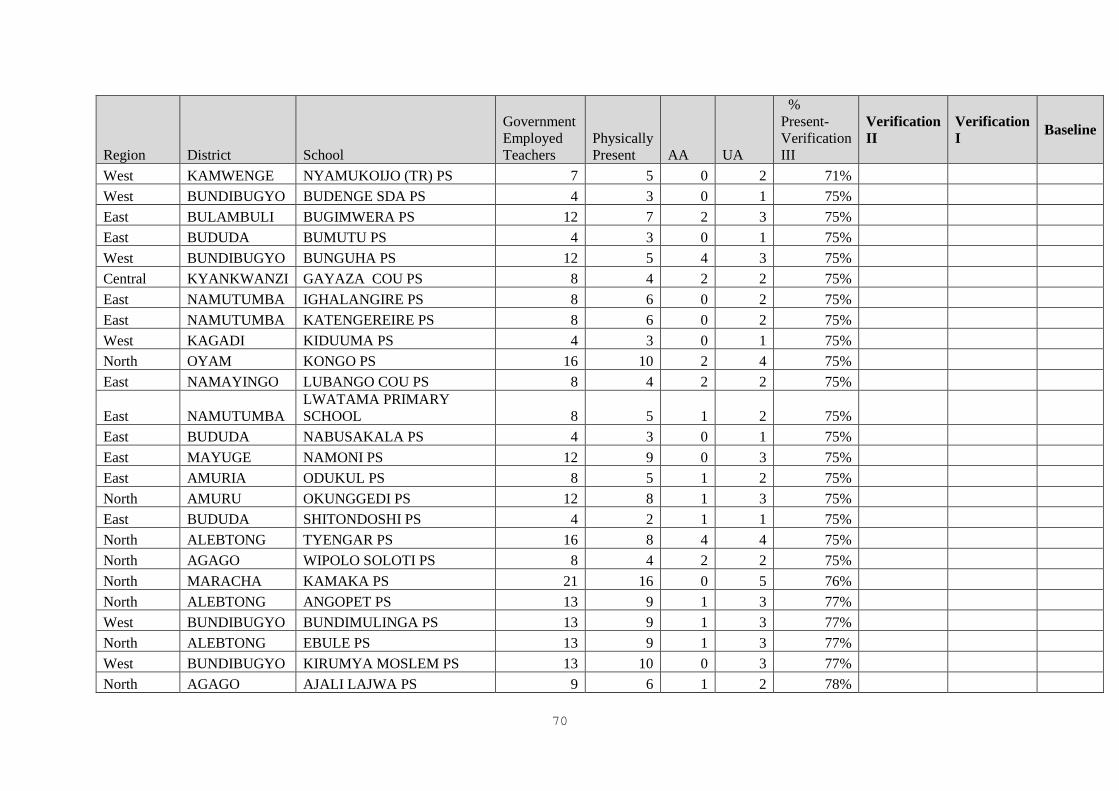
70
Region District School
Government
Employed
Teachers
Physically
Present AA UA
%
Present-
Verification
III
Verification
II
Verification
I Baseline
West KAMWENGE NYAMUKOIJO (TR) PS 7 5 0 2 71%
West BUNDIBUGYO BUDENGE SDA PS 4 3 0 1 75%
East BULAMBULI BUGIMWERA PS 12 7 2 3 75%
East BUDUDA BUMUTU PS 4 3 0 1 75%
West BUNDIBUGYO BUNGUHA PS 12 5 4 3 75%
Central KYANKWANZI GAYAZA COU PS 8 4 2 2 75%
East NAMUTUMBA IGHALANGIRE PS 8 6 0 2 75%
East NAMUTUMBA KATENGEREIRE PS 8 6 0 2 75%
West KAGADI KIDUUMA PS 4 3 0 1 75%
North OYAM KONGO PS 16 10 2 4 75%
East NAMAYINGO LUBANGO COU PS 8 4 2 2 75%
East NAMUTUMBA
LWATAMA PRIMARY
SCHOOL 8 5 1 2 75%
East BUDUDA NABUSAKALA PS 4 3 0 1 75%
East MAYUGE NAMONI PS 12 9 0 3 75%
East AMURIA ODUKUL PS 8 5 1 2 75%
North AMURU OKUNGGEDI PS 12 8 1 3 75%
East BUDUDA SHITONDOSHI PS 4 2 1 1 75%
North ALEBTONG TYENGAR PS 16 8 4 4 75%
North AGAGO WIPOLO SOLOTI PS 8 4 2 2 75%
North MARACHA KAMAKA PS 21 16 0 5 76%
North ALEBTONG ANGOPET PS 13 9 1 3 77%
West BUNDIBUGYO BUNDIMULINGA PS 13 9 1 3 77%
North ALEBTONG EBULE PS 13 9 1 3 77%
West BUNDIBUGYO KIRUMYA MOSLEM PS 13 10 0 3 77%
North AGAGO AJALI LAJWA PS 9 6 1 2 78%
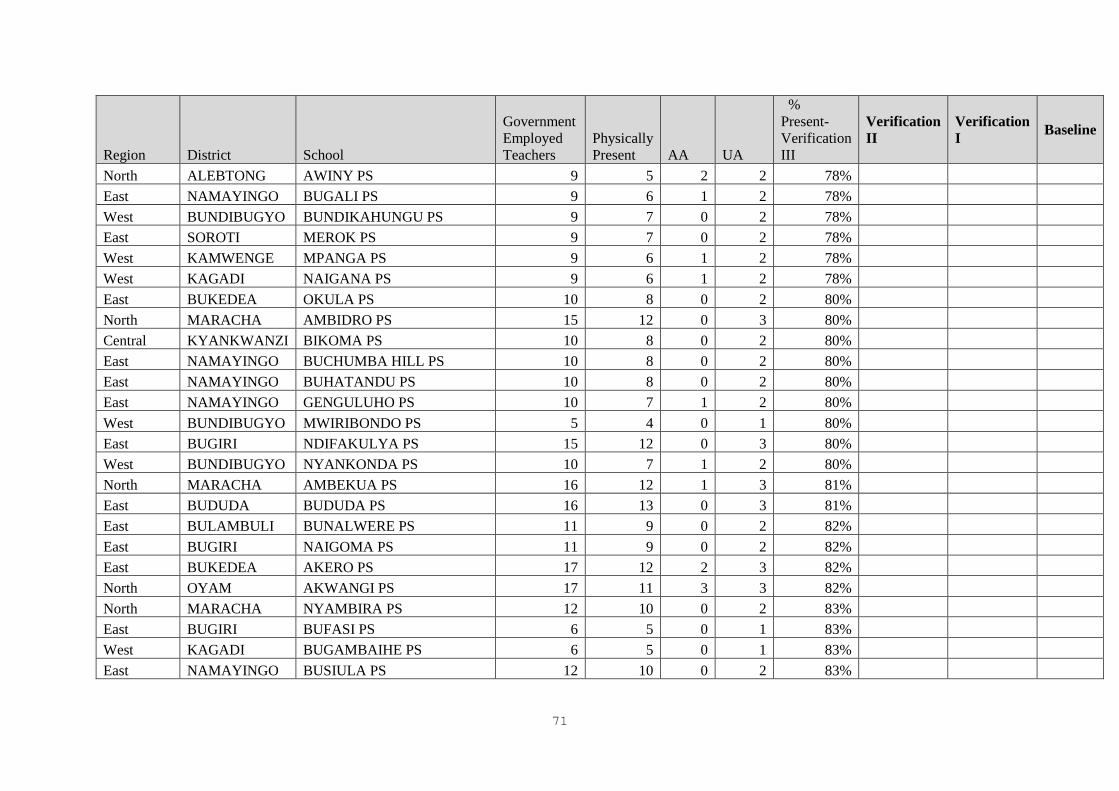
71
Region District School
Government
Employed
Teachers
Physically
Present AA UA
%
Present-
Verification
III
Verification
II
Verification
I Baseline
North ALEBTONG AWINY PS 9 5 2 2 78%
East NAMAYINGO BUGALI PS 9 6 1 2 78%
West BUNDIBUGYO BUNDIKAHUNGU PS 9 7 0 2 78%
East SOROTI MEROK PS 9 7 0 2 78%
West KAMWENGE MPANGA PS 9 6 1 2 78%
West KAGADI NAIGANA PS 9 6 1 2 78%
East BUKEDEA OKULA PS 10 8 0 2 80%
North MARACHA AMBIDRO PS 15 12 0 3 80%
Central KYANKWANZI BIKOMA PS 10 8 0 2 80%
East NAMAYINGO BUCHUMBA HILL PS 10 8 0 2 80%
East NAMAYINGO BUHATANDU PS 10 8 0 2 80%
East NAMAYINGO GENGULUHO PS 10 7 1 2 80%
West BUNDIBUGYO MWIRIBONDO PS 5 4 0 1 80%
East BUGIRI NDIFAKULYA PS 15 12 0 3 80%
West BUNDIBUGYO NYANKONDA PS 10 7 1 2 80%
North MARACHA AMBEKUA PS 16 12 1 3 81%
East BUDUDA BUDUDA PS 16 13 0 3 81%
East BULAMBULI BUNALWERE PS 11 9 0 2 82%
East BUGIRI NAIGOMA PS 11 9 0 2 82%
East BUKEDEA AKERO PS 17 12 2 3 82%
North OYAM AKWANGI PS 17 11 3 3 82%
North MARACHA NYAMBIRA PS 12 10 0 2 83%
East BUGIRI BUFASI PS 6 5 0 1 83%
West KAGADI BUGAMBAIHE PS 6 5 0 1 83%
East NAMAYINGO BUSIULA PS 12 10 0 2 83%
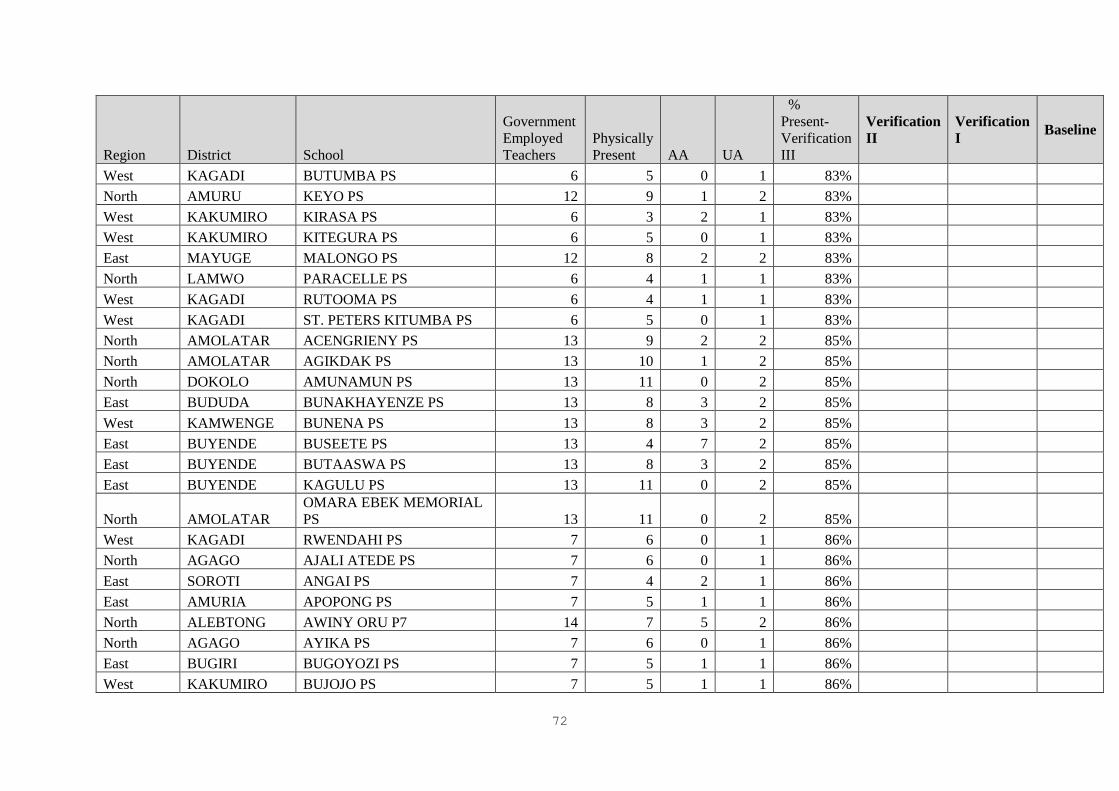
72
Region District School
Government
Employed
Teachers
Physically
Present AA UA
%
Present-
Verification
III
Verification
II
Verification
I Baseline
West KAGADI BUTUMBA PS 6 5 0 1 83%
North AMURU KEYO PS 12 9 1 2 83%
West KAKUMIRO KIRASA PS 6 3 2 1 83%
West KAKUMIRO KITEGURA PS 6 5 0 1 83%
East MAYUGE MALONGO PS 12 8 2 2 83%
North LAMWO PARACELLE PS 6 4 1 1 83%
West KAGADI RUTOOMA PS 6 4 1 1 83%
West KAGADI ST. PETERS KITUMBA PS 6 5 0 1 83%
North AMOLATAR ACENGRIENY PS 13 9 2 2 85%
North AMOLATAR AGIKDAK PS 13 10 1 2 85%
North DOKOLO AMUNAMUN PS 13 11 0 2 85%
East BUDUDA BUNAKHAYENZE PS 13 8 3 2 85%
West KAMWENGE BUNENA PS 13 8 3 2 85%
East BUYENDE BUSEETE PS 13 4 7 2 85%
East BUYENDE BUTAASWA PS 13 8 3 2 85%
East BUYENDE KAGULU PS 13 11 0 2 85%
North AMOLATAR
OMARA EBEK MEMORIAL
PS 13 11 0 2 85%
West KAGADI RWENDAHI PS 7 6 0 1 86%
North AGAGO AJALI ATEDE PS 7 6 0 1 86%
East SOROTI ANGAI PS 7 4 2 1 86%
East AMURIA APOPONG PS 7 5 1 1 86%
North ALEBTONG AWINY ORU P7 14 7 5 2 86%
North AGAGO AYIKA PS 7 6 0 1 86%
East BUGIRI BUGOYOZI PS 7 5 1 1 86%
West KAKUMIRO BUJOJO PS 7 5 1 1 86%
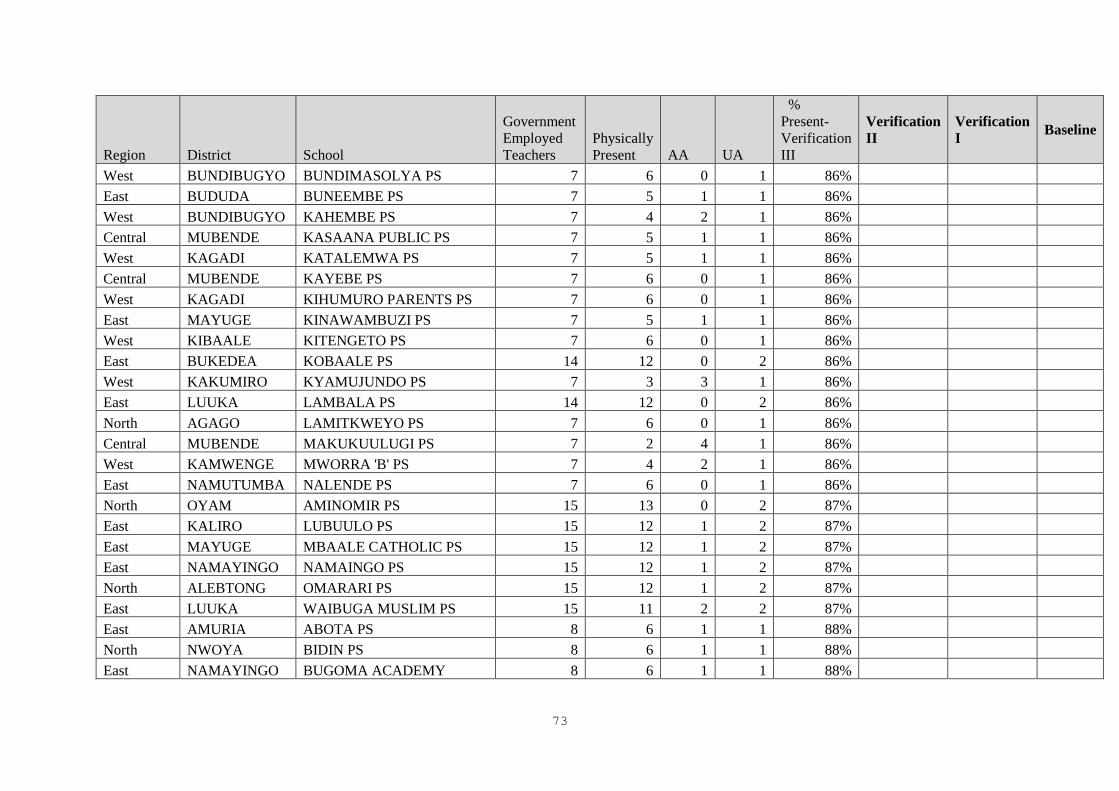
73
Region District School
Government
Employed
Teachers
Physically
Present AA UA
%
Present-
Verification
III
Verification
II
Verification
I Baseline
West BUNDIBUGYO BUNDIMASOLYA PS 7 6 0 1 86%
East BUDUDA BUNEEMBE PS 7 5 1 1 86%
West BUNDIBUGYO KAHEMBE PS 7 4 2 1 86%
Central MUBENDE KASAANA PUBLIC PS 7 5 1 1 86%
West KAGADI KATALEMWA PS 7 5 1 1 86%
Central MUBENDE KAYEBE PS 7 6 0 1 86%
West KAGADI KIHUMURO PARENTS PS 7 6 0 1 86%
East MAYUGE KINAWAMBUZI PS 7 5 1 1 86%
West KIBAALE KITENGETO PS 7 6 0 1 86%
East BUKEDEA KOBAALE PS 14 12 0 2 86%
West KAKUMIRO KYAMUJUNDO PS 7 3 3 1 86%
East LUUKA LAMBALA PS 14 12 0 2 86%
North AGAGO LAMITKWEYO PS 7 6 0 1 86%
Central MUBENDE MAKUKUULUGI PS 7 2 4 1 86%
West KAMWENGE MWORRA 'B' PS 7 4 2 1 86%
East NAMUTUMBA NALENDE PS 7 6 0 1 86%
North OYAM AMINOMIR PS 15 13 0 2 87%
East KALIRO LUBUULO PS 15 12 1 2 87%
East MAYUGE MBAALE CATHOLIC PS 15 12 1 2 87%
East NAMAYINGO NAMAINGO PS 15 12 1 2 87%
North ALEBTONG OMARARI PS 15 12 1 2 87%
East LUUKA WAIBUGA MUSLIM PS 15 11 2 2 87%
East AMURIA ABOTA PS 8 6 1 1 88%
North NWOYA BIDIN PS 8 6 1 1 88%
East NAMAYINGO BUGOMA ACADEMY 8 6 1 1 88%
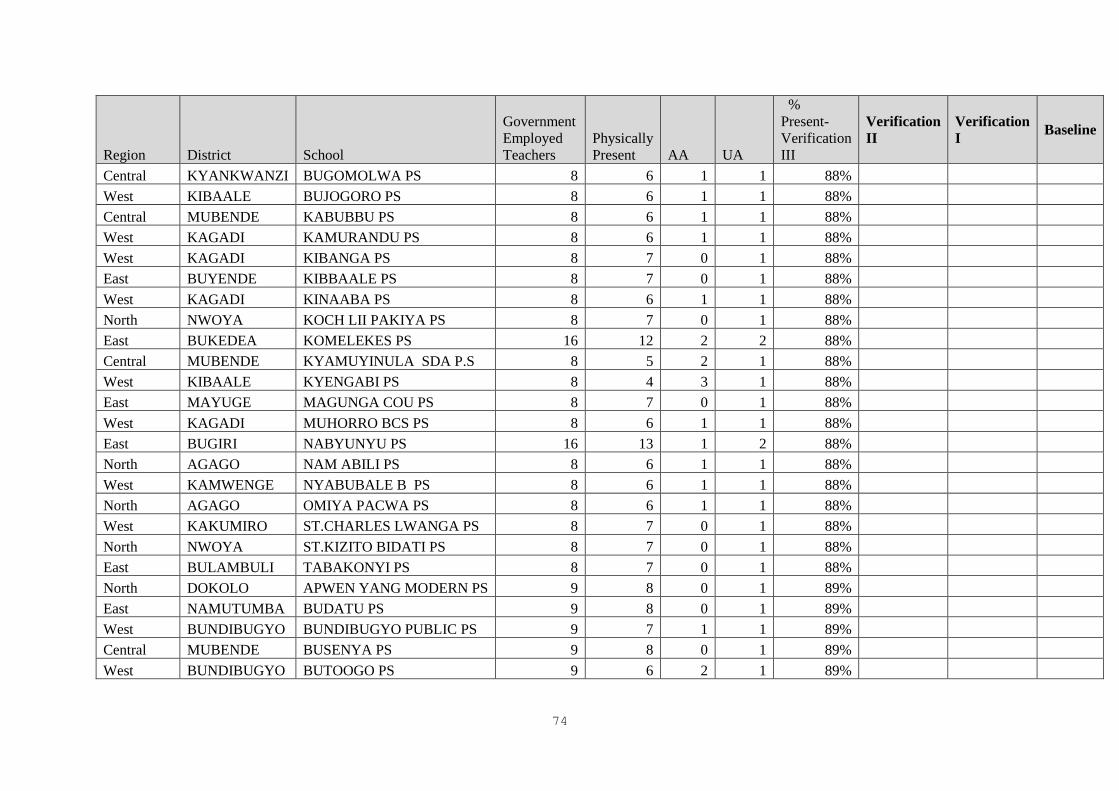
74
Region District School
Government
Employed
Teachers
Physically
Present AA UA
%
Present-
Verification
III
Verification
II
Verification
I Baseline
Central KYANKWANZI BUGOMOLWA PS 8 6 1 1 88%
West KIBAALE BUJOGORO PS 8 6 1 1 88%
Central MUBENDE KABUBBU PS 8 6 1 1 88%
West KAGADI KAMURANDU PS 8 6 1 1 88%
West KAGADI KIBANGA PS 8 7 0 1 88%
East BUYENDE KIBBAALE PS 8 7 0 1 88%
West KAGADI KINAABA PS 8 6 1 1 88%
North NWOYA KOCH LII PAKIYA PS 8 7 0 1 88%
East BUKEDEA KOMELEKES PS 16 12 2 2 88%
Central MUBENDE KYAMUYINULA SDA P.S 8 5 2 1 88%
West KIBAALE KYENGABI PS 8 4 3 1 88%
East MAYUGE MAGUNGA COU PS 8 7 0 1 88%
West KAGADI MUHORRO BCS PS 8 6 1 1 88%
East BUGIRI NABYUNYU PS 16 13 1 2 88%
North AGAGO NAM ABILI PS 8 6 1 1 88%
West KAMWENGE NYABUBALE B PS 8 6 1 1 88%
North AGAGO OMIYA PACWA PS 8 6 1 1 88%
West KAKUMIRO ST.CHARLES LWANGA PS 8 7 0 1 88%
North NWOYA ST.KIZITO BIDATI PS 8 7 0 1 88%
East BULAMBULI TABAKONYI PS 8 7 0 1 88%
North DOKOLO APWEN YANG MODERN PS 9 8 0 1 89%
East NAMUTUMBA BUDATU PS 9 8 0 1 89%
West BUNDIBUGYO BUNDIBUGYO PUBLIC PS 9 7 1 1 89%
Central MUBENDE BUSENYA PS 9 8 0 1 89%
West BUNDIBUGYO BUTOOGO PS 9 6 2 1 89%
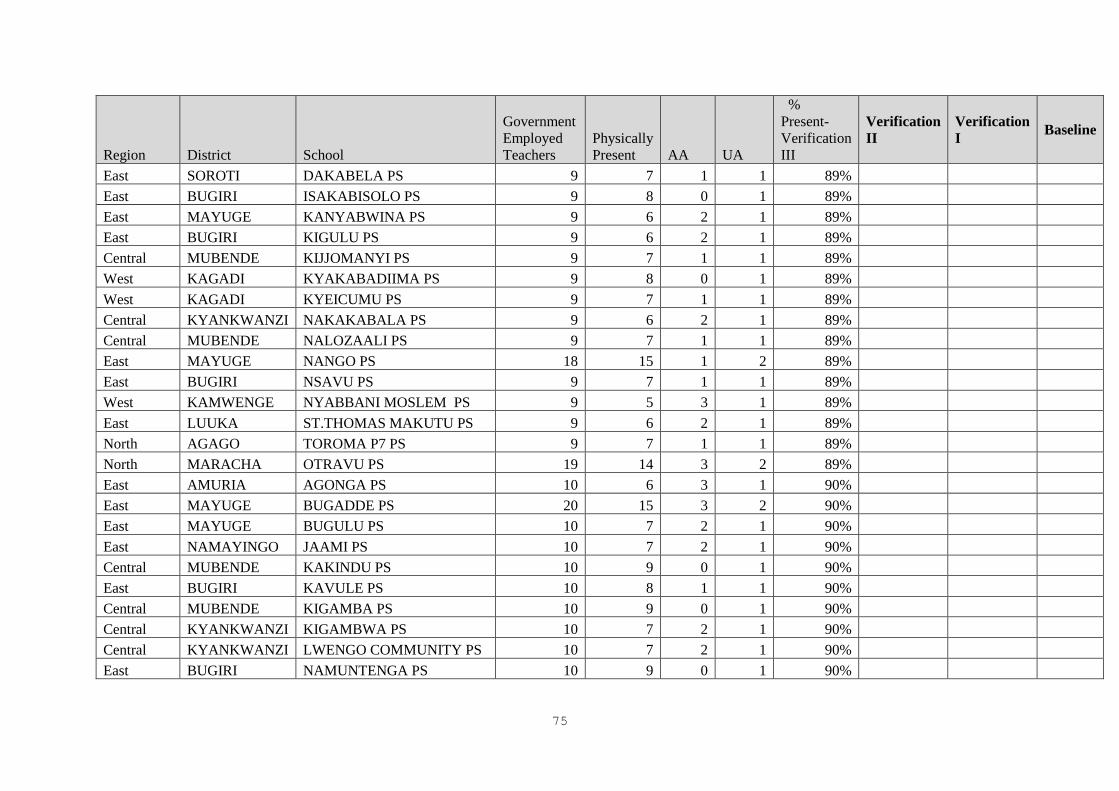
75
Region District School
Government
Employed
Teachers
Physically
Present AA UA
%
Present-
Verification
III
Verification
II
Verification
I Baseline
East SOROTI DAKABELA PS 9 7 1 1 89%
East BUGIRI ISAKABISOLO PS 9 8 0 1 89%
East MAYUGE KANYABWINA PS 9 6 2 1 89%
East BUGIRI KIGULU PS 9 6 2 1 89%
Central MUBENDE KIJJOMANYI PS 9 7 1 1 89%
West KAGADI KYAKABADIIMA PS 9 8 0 1 89%
West KAGADI KYEICUMU PS 9 7 1 1 89%
Central KYANKWANZI NAKAKABALA PS 9 6 2 1 89%
Central MUBENDE NALOZAALI PS 9 7 1 1 89%
East MAYUGE NANGO PS 18 15 1 2 89%
East BUGIRI NSAVU PS 9 7 1 1 89%
West KAMWENGE NYABBANI MOSLEM PS 9 5 3 1 89%
East LUUKA ST.THOMAS MAKUTU PS 9 6 2 1 89%
North AGAGO TOROMA P7 PS 9 7 1 1 89%
North MARACHA OTRAVU PS 19 14 3 2 89%
East AMURIA AGONGA PS 10 6 3 1 90%
East MAYUGE BUGADDE PS 20 15 3 2 90%
East MAYUGE BUGULU PS 10 7 2 1 90%
East NAMAYINGO JAAMI PS 10 7 2 1 90%
Central MUBENDE KAKINDU PS 10 9 0 1 90%
East BUGIRI KAVULE PS 10 8 1 1 90%
Central MUBENDE KIGAMBA PS 10 9 0 1 90%
Central KYANKWANZI KIGAMBWA PS 10 7 2 1 90%
Central KYANKWANZI LWENGO COMMUNITY PS 10 7 2 1 90%
East BUGIRI NAMUNTENGA PS 10 9 0 1 90%
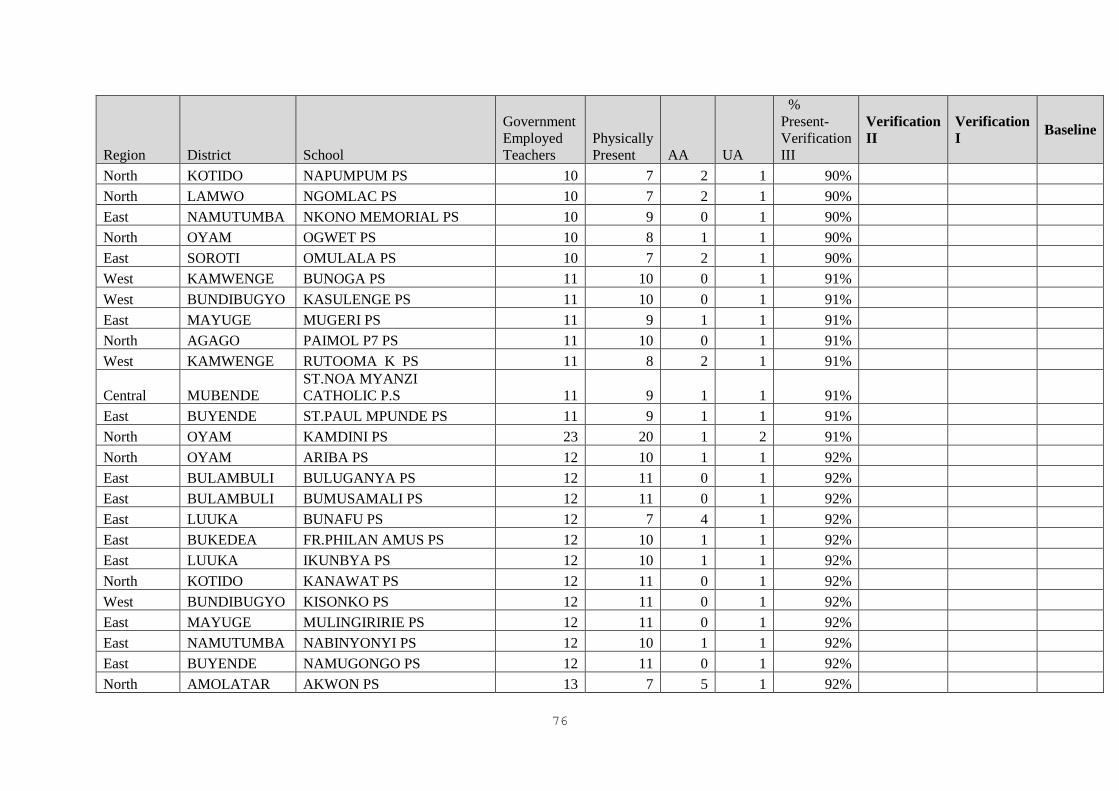
76
Region District School
Government
Employed
Teachers
Physically
Present AA UA
%
Present-
Verification
III
Verification
II
Verification
I Baseline
North KOTIDO NAPUMPUM PS 10 7 2 1 90%
North LAMWO NGOMLAC PS 10 7 2 1 90%
East NAMUTUMBA NKONO MEMORIAL PS 10 9 0 1 90%
North OYAM OGWET PS 10 8 1 1 90%
East SOROTI OMULALA PS 10 7 2 1 90%
West KAMWENGE BUNOGA PS 11 10 0 1 91%
West BUNDIBUGYO KASULENGE PS 11 10 0 1 91%
East MAYUGE MUGERI PS 11 9 1 1 91%
North AGAGO PAIMOL P7 PS 11 10 0 1 91%
West KAMWENGE RUTOOMA K PS 11 8 2 1 91%
Central MUBENDE
ST.NOA MYANZI
CATHOLIC P.S 11 9 1 1 91%
East BUYENDE ST.PAUL MPUNDE PS 11 9 1 1 91%
North OYAM KAMDINI PS 23 20 1 2 91%
North OYAM ARIBA PS 12 10 1 1 92%
East BULAMBULI BULUGANYA PS 12 11 0 1 92%
East BULAMBULI BUMUSAMALI PS 12 11 0 1 92%
East LUUKA BUNAFU PS 12 7 4 1 92%
East BUKEDEA FR.PHILAN AMUS PS 12 10 1 1 92%
East LUUKA IKUNBYA PS 12 10 1 1 92%
North KOTIDO KANAWAT PS 12 11 0 1 92%
West BUNDIBUGYO KISONKO PS 12 11 0 1 92%
East MAYUGE MULINGIRIRIE PS 12 11 0 1 92%
East NAMUTUMBA NABINYONYI PS 12 10 1 1 92%
East BUYENDE NAMUGONGO PS 12 11 0 1 92%
North AMOLATAR AKWON PS 13 7 5 1 92%
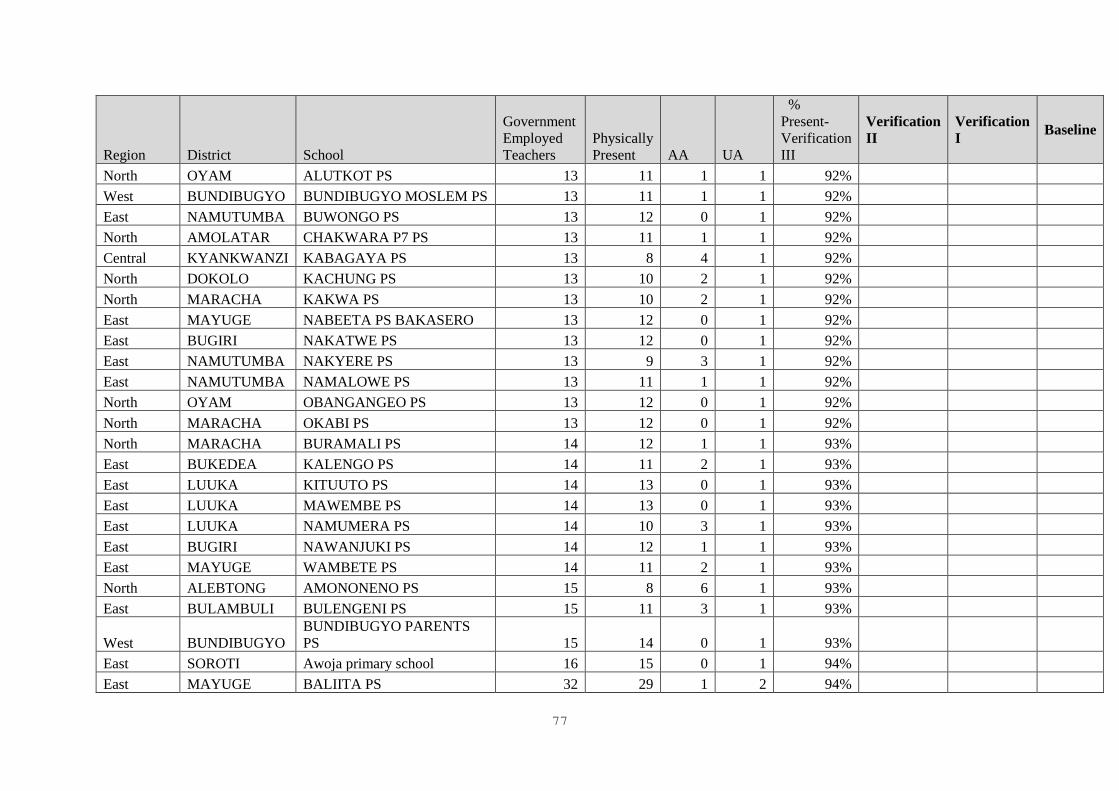
77
Region District School
Government
Employed
Teachers
Physically
Present AA UA
%
Present-
Verification
III
Verification
II
Verification
I Baseline
North OYAM ALUTKOT PS 13 11 1 1 92%
West BUNDIBUGYO BUNDIBUGYO MOSLEM PS 13 11 1 1 92%
East NAMUTUMBA BUWONGO PS 13 12 0 1 92%
North AMOLATAR CHAKWARA P7 PS 13 11 1 1 92%
Central KYANKWANZI KABAGAYA PS 13 8 4 1 92%
North DOKOLO KACHUNG PS 13 10 2 1 92%
North MARACHA KAKWA PS 13 10 2 1 92%
East MAYUGE NABEETA PS BAKASERO 13 12 0 1 92%
East BUGIRI NAKATWE PS 13 12 0 1 92%
East NAMUTUMBA NAKYERE PS 13 9 3 1 92%
East NAMUTUMBA NAMALOWE PS 13 11 1 1 92%
North OYAM OBANGANGEO PS 13 12 0 1 92%
North MARACHA OKABI PS 13 12 0 1 92%
North MARACHA BURAMALI PS 14 12 1 1 93%
East BUKEDEA KALENGO PS 14 11 2 1 93%
East LUUKA KITUUTO PS 14 13 0 1 93%
East LUUKA MAWEMBE PS 14 13 0 1 93%
East LUUKA NAMUMERA PS 14 10 3 1 93%
East BUGIRI NAWANJUKI PS 14 12 1 1 93%
East MAYUGE WAMBETE PS 14 11 2 1 93%
North ALEBTONG AMONONENO PS 15 8 6 1 93%
East BULAMBULI BULENGENI PS 15 11 3 1 93%
West BUNDIBUGYO
BUNDIBUGYO PARENTS
PS 15 14 0 1 93%
East SOROTI Awoja primary school 16 15 0 1 94%
East MAYUGE BALIITA PS 32 29 1 2 94%
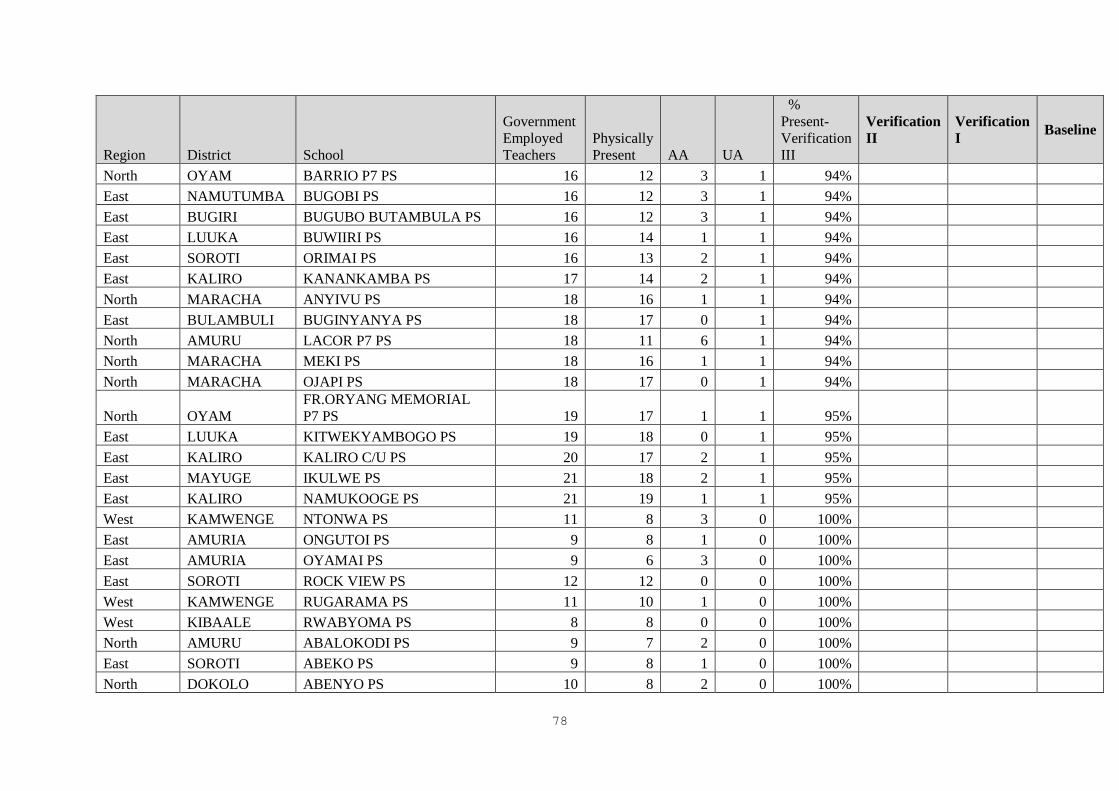
78
Region District School
Government
Employed
Teachers
Physically
Present AA UA
%
Present-
Verification
III
Verification
II
Verification
I Baseline
North OYAM BARRIO P7 PS 16 12 3 1 94%
East NAMUTUMBA BUGOBI PS 16 12 3 1 94%
East BUGIRI BUGUBO BUTAMBULA PS 16 12 3 1 94%
East LUUKA BUWIIRI PS 16 14 1 1 94%
East SOROTI ORIMAI PS 16 13 2 1 94%
East KALIRO KANANKAMBA PS 17 14 2 1 94%
North MARACHA ANYIVU PS 18 16 1 1 94%
East BULAMBULI BUGINYANYA PS 18 17 0 1 94%
North AMURU LACOR P7 PS 18 11 6 1 94%
North MARACHA MEKI PS 18 16 1 1 94%
North MARACHA OJAPI PS 18 17 0 1 94%
North OYAM
FR.ORYANG MEMORIAL
P7 PS 19 17 1 1 95%
East LUUKA KITWEKYAMBOGO PS 19 18 0 1 95%
East KALIRO KALIRO C/U PS 20 17 2 1 95%
East MAYUGE IKULWE PS 21 18 2 1 95%
East KALIRO NAMUKOOGE PS 21 19 1 1 95%
West KAMWENGE NTONWA PS 11 8 3 0 100%
East AMURIA ONGUTOI PS 9 8 1 0 100%
East AMURIA OYAMAI PS 9 6 3 0 100%
East SOROTI ROCK VIEW PS 12 12 0 0 100%
West KAMWENGE RUGARAMA PS 11 10 1 0 100%
West KIBAALE RWABYOMA PS 8 8 0 0 100%
North AMURU ABALOKODI PS 9 7 2 0 100%
East SOROTI ABEKO PS 9 8 1 0 100%
North DOKOLO ABENYO PS 10 8 2 0 100%
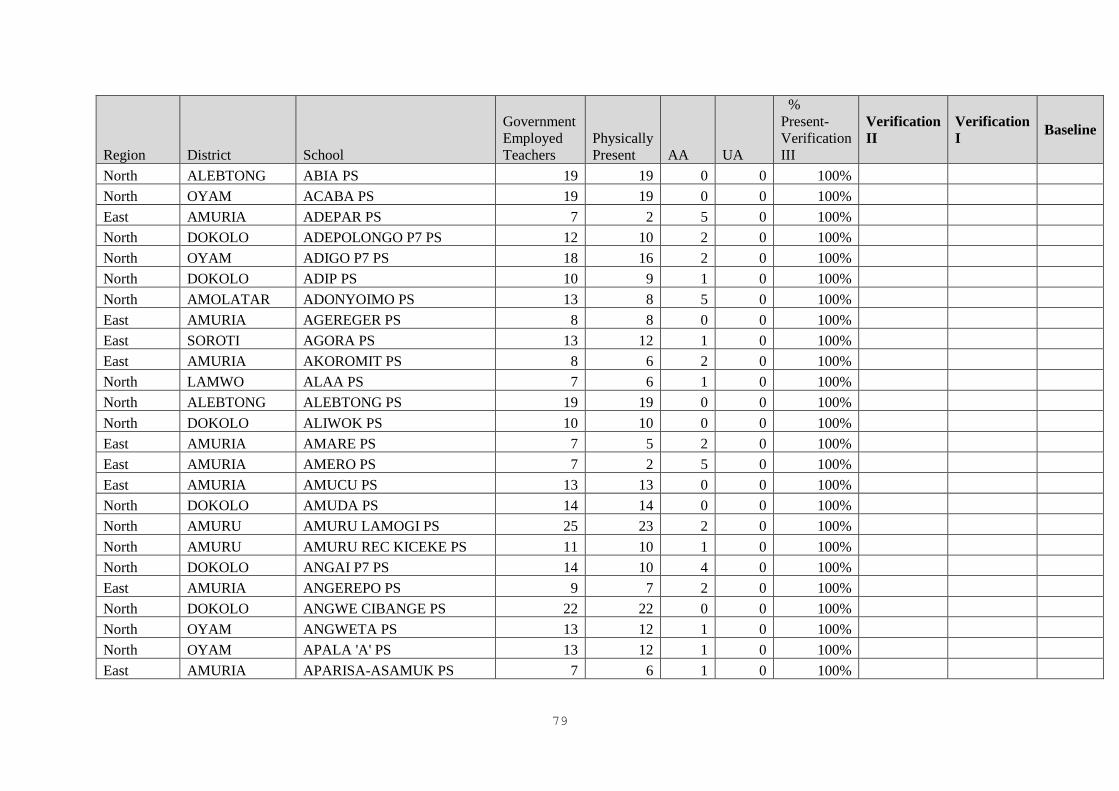
79
Region District School
Government
Employed
Teachers
Physically
Present AA UA
%
Present-
Verification
III
Verification
II
Verification
I Baseline
North ALEBTONG ABIA PS 19 19 0 0 100%
North OYAM ACABA PS 19 19 0 0 100%
East AMURIA ADEPAR PS 7 2 5 0 100%
North DOKOLO ADEPOLONGO P7 PS 12 10 2 0 100%
North OYAM ADIGO P7 PS 18 16 2 0 100%
North DOKOLO ADIP PS 10 9 1 0 100%
North AMOLATAR ADONYOIMO PS 13 8 5 0 100%
East AMURIA AGEREGER PS 8 8 0 0 100%
East SOROTI AGORA PS 13 12 1 0 100%
East AMURIA AKOROMIT PS 8 6 2 0 100%
North LAMWO ALAA PS 7 6 1 0 100%
North ALEBTONG ALEBTONG PS 19 19 0 0 100%
North DOKOLO ALIWOK PS 10 10 0 0 100%
East AMURIA AMARE PS 7 5 2 0 100%
East AMURIA AMERO PS 7 2 5 0 100%
East AMURIA AMUCU PS 13 13 0 0 100%
North DOKOLO AMUDA PS 14 14 0 0 100%
North AMURU AMURU LAMOGI PS 25 23 2 0 100%
North AMURU AMURU REC KICEKE PS 11 10 1 0 100%
North DOKOLO ANGAI P7 PS 14 10 4 0 100%
East AMURIA ANGEREPO PS 9 7 2 0 100%
North DOKOLO ANGWE CIBANGE PS 22 22 0 0 100%
North OYAM ANGWETA PS 13 12 1 0 100%
North OYAM APALA 'A' PS 13 12 1 0 100%
East AMURIA APARISA-ASAMUK PS 7 6 1 0 100%
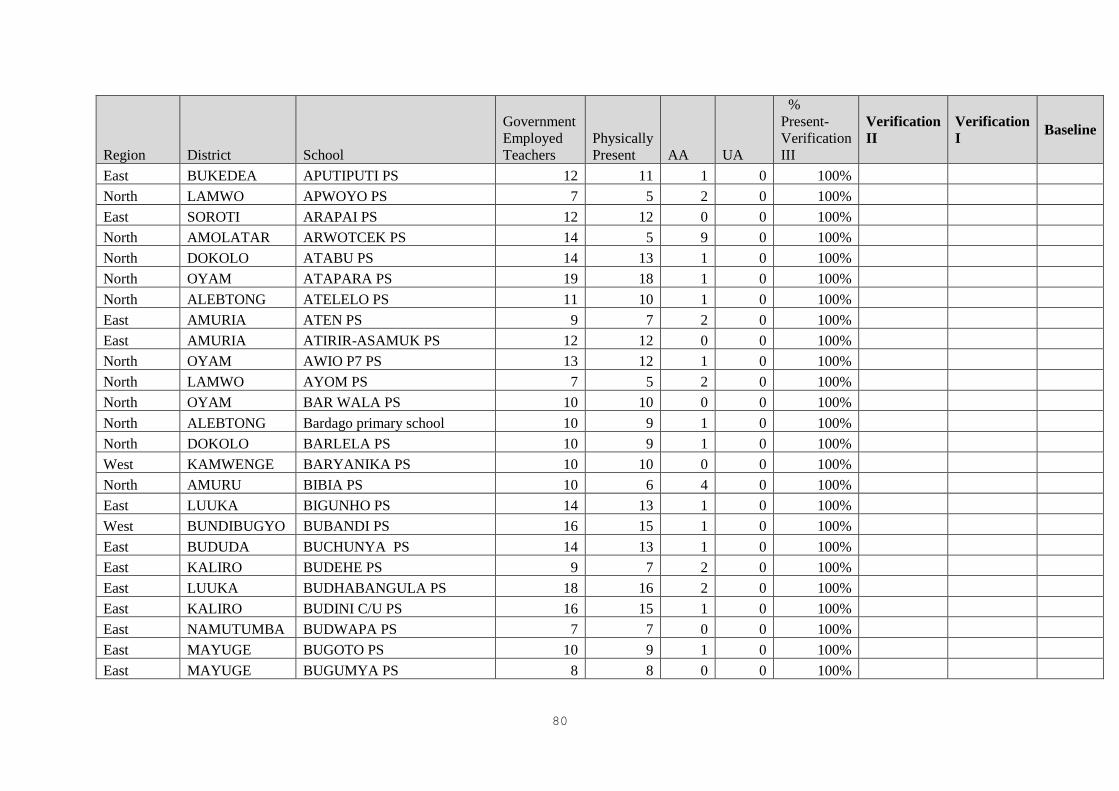
80
Region District School
Government
Employed
Teachers
Physically
Present AA UA
%
Present-
Verification
III
Verification
II
Verification
I Baseline
East BUKEDEA APUTIPUTI PS 12 11 1 0 100%
North LAMWO APWOYO PS 7 5 2 0 100%
East SOROTI ARAPAI PS 12 12 0 0 100%
North AMOLATAR ARWOTCEK PS 14 5 9 0 100%
North DOKOLO ATABU PS 14 13 1 0 100%
North OYAM ATAPARA PS 19 18 1 0 100%
North ALEBTONG ATELELO PS 11 10 1 0 100%
East AMURIA ATEN PS 9 7 2 0 100%
East AMURIA ATIRIR-ASAMUK PS 12 12 0 0 100%
North OYAM AWIO P7 PS 13 12 1 0 100%
North LAMWO AYOM PS 7 5 2 0 100%
North OYAM BAR WALA PS 10 10 0 0 100%
North ALEBTONG Bardago primary school 10 9 1 0 100%
North DOKOLO BARLELA PS 10 9 1 0 100%
West KAMWENGE BARYANIKA PS 10 10 0 0 100%
North AMURU BIBIA PS 10 6 4 0 100%
East LUUKA BIGUNHO PS 14 13 1 0 100%
West BUNDIBUGYO BUBANDI PS 16 15 1 0 100%
East BUDUDA BUCHUNYA PS 14 13 1 0 100%
East KALIRO BUDEHE PS 9 7 2 0 100%
East LUUKA BUDHABANGULA PS 18 16 2 0 100%
East KALIRO BUDINI C/U PS 16 15 1 0 100%
East NAMUTUMBA BUDWAPA PS 7 7 0 0 100%
East MAYUGE BUGOTO PS 10 9 1 0 100%
East MAYUGE BUGUMYA PS 8 8 0 0 100%
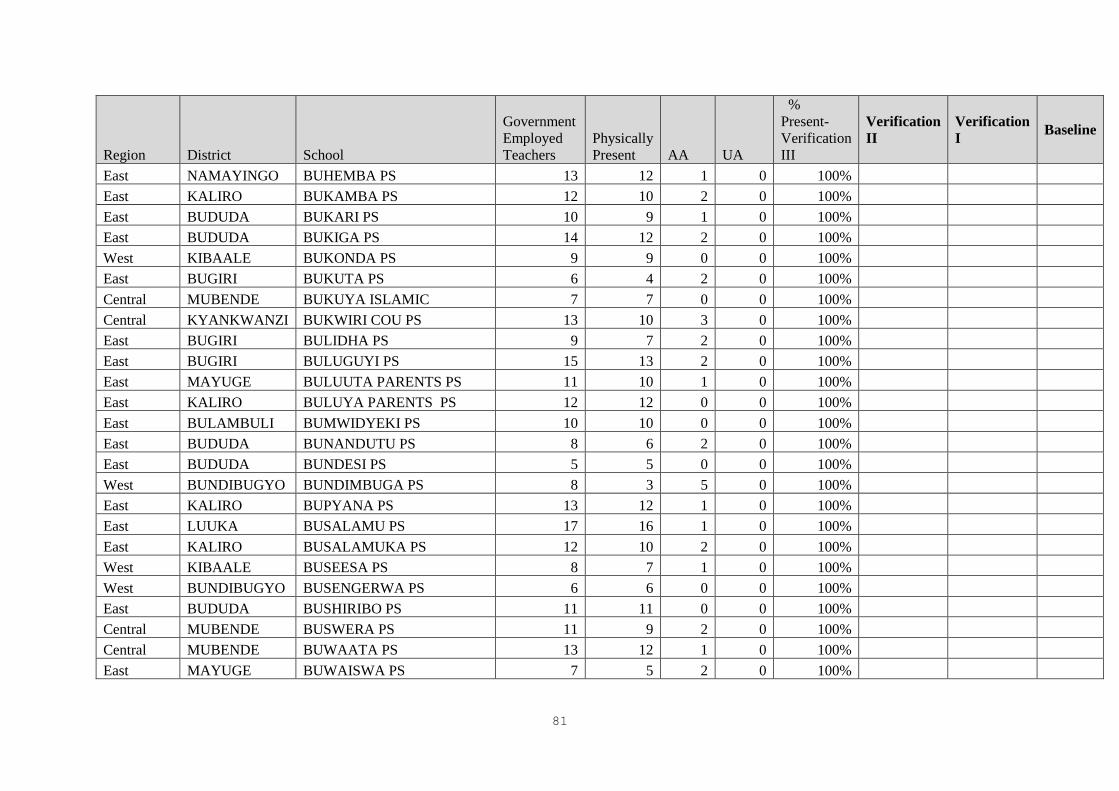
81
Region District School
Government
Employed
Teachers
Physically
Present AA UA
%
Present-
Verification
III
Verification
II
Verification
I Baseline
East NAMAYINGO BUHEMBA PS 13 12 1 0 100%
East KALIRO BUKAMBA PS 12 10 2 0 100%
East BUDUDA BUKARI PS 10 9 1 0 100%
East BUDUDA BUKIGA PS 14 12 2 0 100%
West KIBAALE BUKONDA PS 9 9 0 0 100%
East BUGIRI BUKUTA PS 6 4 2 0 100%
Central MUBENDE BUKUYA ISLAMIC 7 7 0 0 100%
Central KYANKWANZI BUKWIRI COU PS 13 10 3 0 100%
East BUGIRI BULIDHA PS 9 7 2 0 100%
East BUGIRI BULUGUYI PS 15 13 2 0 100%
East MAYUGE BULUUTA PARENTS PS 11 10 1 0 100%
East KALIRO BULUYA PARENTS PS 12 12 0 0 100%
East BULAMBULI BUMWIDYEKI PS 10 10 0 0 100%
East BUDUDA BUNANDUTU PS 8 6 2 0 100%
East BUDUDA BUNDESI PS 5 5 0 0 100%
West BUNDIBUGYO BUNDIMBUGA PS 8 3 5 0 100%
East KALIRO BUPYANA PS 13 12 1 0 100%
East LUUKA BUSALAMU PS 17 16 1 0 100%
East KALIRO BUSALAMUKA PS 12 10 2 0 100%
West KIBAALE BUSEESA PS 8 7 1 0 100%
West BUNDIBUGYO BUSENGERWA PS 6 6 0 0 100%
East BUDUDA BUSHIRIBO PS 11 11 0 0 100%
Central MUBENDE BUSWERA PS 11 9 2 0 100%
Central MUBENDE BUWAATA PS 13 12 1 0 100%
East MAYUGE BUWAISWA PS 7 5 2 0 100%
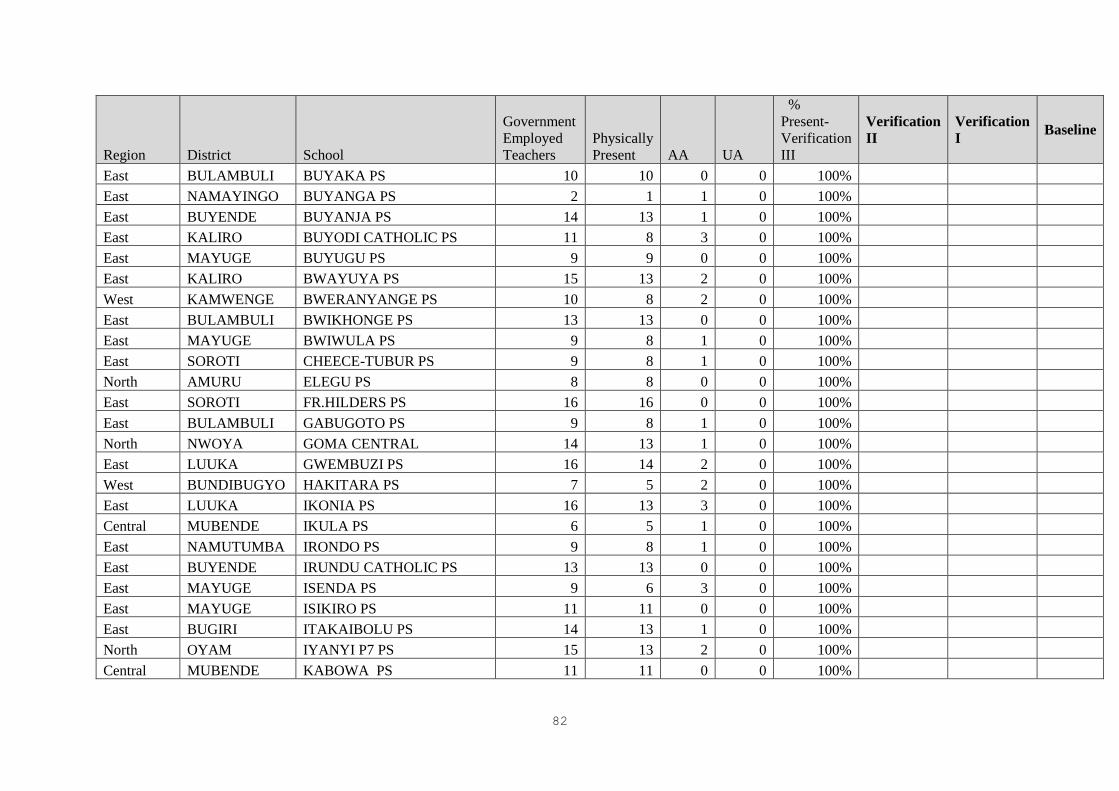
82
Region District School
Government
Employed
Teachers
Physically
Present AA UA
%
Present-
Verification
III
Verification
II
Verification
I Baseline
East BULAMBULI BUYAKA PS 10 10 0 0 100%
East NAMAYINGO BUYANGA PS 2 1 1 0 100%
East BUYENDE BUYANJA PS 14 13 1 0 100%
East KALIRO BUYODI CATHOLIC PS 11 8 3 0 100%
East MAYUGE BUYUGU PS 9 9 0 0 100%
East KALIRO BWAYUYA PS 15 13 2 0 100%
West KAMWENGE BWERANYANGE PS 10 8 2 0 100%
East BULAMBULI BWIKHONGE PS 13 13 0 0 100%
East MAYUGE BWIWULA PS 9 8 1 0 100%
East SOROTI CHEECE-TUBUR PS 9 8 1 0 100%
North AMURU ELEGU PS 8 8 0 0 100%
East SOROTI FR.HILDERS PS 16 16 0 0 100%
East BULAMBULI GABUGOTO PS 9 8 1 0 100%
North NWOYA GOMA CENTRAL 14 13 1 0 100%
East LUUKA GWEMBUZI PS 16 14 2 0 100%
West BUNDIBUGYO HAKITARA PS 7 5 2 0 100%
East LUUKA IKONIA PS 16 13 3 0 100%
Central MUBENDE IKULA PS 6 5 1 0 100%
East NAMUTUMBA IRONDO PS 9 8 1 0 100%
East BUYENDE IRUNDU CATHOLIC PS 13 13 0 0 100%
East MAYUGE ISENDA PS 9 6 3 0 100%
East MAYUGE ISIKIRO PS 11 11 0 0 100%
East BUGIRI ITAKAIBOLU PS 14 13 1 0 100%
North OYAM IYANYI P7 PS 15 13 2 0 100%
Central MUBENDE KABOWA PS 11 11 0 0 100%
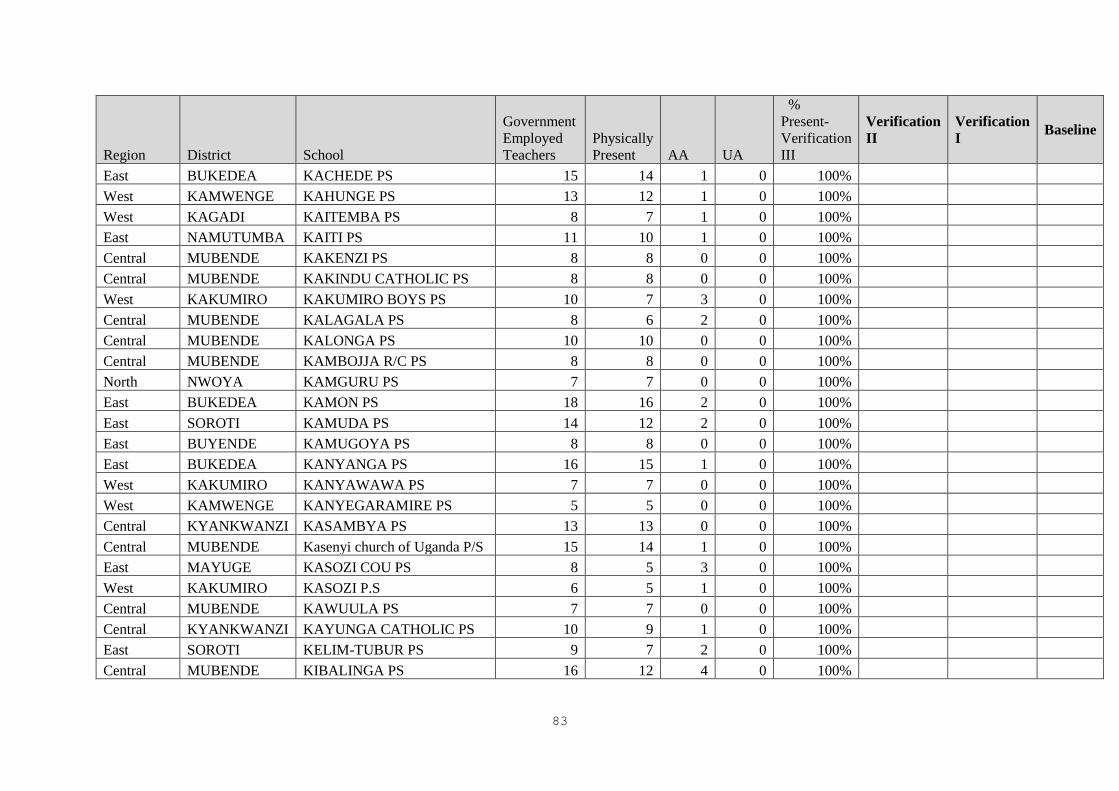
83
Region District School
Government
Employed
Teachers
Physically
Present AA UA
%
Present-
Verification
III
Verification
II
Verification
I Baseline
East BUKEDEA KACHEDE PS 15 14 1 0 100%
West KAMWENGE KAHUNGE PS 13 12 1 0 100%
West KAGADI KAITEMBA PS 8 7 1 0 100%
East NAMUTUMBA KAITI PS 11 10 1 0 100%
Central MUBENDE KAKENZI PS 8 8 0 0 100%
Central MUBENDE KAKINDU CATHOLIC PS 8 8 0 0 100%
West KAKUMIRO KAKUMIRO BOYS PS 10 7 3 0 100%
Central MUBENDE KALAGALA PS 8 6 2 0 100%
Central MUBENDE KALONGA PS 10 10 0 0 100%
Central MUBENDE KAMBOJJA R/C PS 8 8 0 0 100%
North NWOYA KAMGURU PS 7 7 0 0 100%
East BUKEDEA KAMON PS 18 16 2 0 100%
East SOROTI KAMUDA PS 14 12 2 0 100%
East BUYENDE KAMUGOYA PS 8 8 0 0 100%
East BUKEDEA KANYANGA PS 16 15 1 0 100%
West KAKUMIRO KANYAWAWA PS 7 7 0 0 100%
West KAMWENGE KANYEGARAMIRE PS 5 5 0 0 100%
Central KYANKWANZI KASAMBYA PS 13 13 0 0 100%
Central MUBENDE Kasenyi church of Uganda P/S 15 14 1 0 100%
East MAYUGE KASOZI COU PS 8 5 3 0 100%
West KAKUMIRO KASOZI P.S 6 5 1 0 100%
Central MUBENDE KAWUULA PS 7 7 0 0 100%
Central KYANKWANZI KAYUNGA CATHOLIC PS 10 9 1 0 100%
East SOROTI KELIM-TUBUR PS 9 7 2 0 100%
Central MUBENDE KIBALINGA PS 16 12 4 0 100%
84
Region District School
Government
Employed
Teachers
Physically
Present AA UA
%
Present-
Verification
III
Verification
II
Verification
I Baseline
Central MUBENDE KIBYAMIRIZI PS 8 8 0 0 100%
Central KYANKWANZI KIGANGAZI PARENTS PS 9 5 4 0 100%
West KAKUMIRO KIGOMBA PS 5 1 4 0 100%
West KAMWENGE KIGOTO PS 10 10 0 0 100%
East BUGIRI KIMIRA PS 9 6 3 0 100%
East BUYENDE KIRIMWA CATHOLIC PS 8 8 0 0 100%
East LUUKA KIRIMWA PS 13 13 0 0 100%
East BUGIRI KIRONGERO PS 12 10 2 0 100%
Central KYANKWANZI KIRYANONGO COU PS 10 7 3 0 100%
West KAGADI KISARRA PS 5 3 2 0 100%
West KAKUMIRO KITANDA PS 5 5 0 0 100%
West KIBAALE KIYANJA MODERN PS 7 7 0 0 100%
Central KYANKWANZI KIYOMBYA PS 12 12 0 0 100%
East BUKEDEA KOMUGE PS 11 5 6 0 100%
East NAMUTUMBA Korongo Primary school 11 10 1 0 100%
North KOTIDO KOTIDO GIRLS PS 7 7 0 0 100%
East BUKEDEA Kotiokot primary school 11 11 0 0 100%
Central MUBENDE KUKANGA PS 7 4 3 0 100%
West KAKUMIRO KYAKUTEREKERA PS 7 6 1 0 100%
Central MUBENDE KYANAMUGERA C/U P.S 13 12 1 0 100%
East BUYENDE KYANKOOLE PS 9 9 0 0 100%
Central MUBENDE KYATO PS 6 6 0 0 100%
West KAGADI KYENZIGE PS 9 9 0 0 100%
North AMURU LABALA P7 PS 9 9 0 0 100%
North LAMWO LABAYANGO PS 7 7 0 0 100%
85
Region District School
Government
Employed
Teachers
Physically
Present AA UA
%
Present-
Verification
III
Verification
II
Verification
I Baseline
North LAMWO LACARA PS 5 5 0 0 100%
North LAMWO LAROBI PS 7 6 1 0 100%
North OYAM LELAPALA PS 17 17 0 0 100%
East SOROTI LILIM PS 8 8 0 0 100%
North LAMWO LOROMIBENGE PS 6 3 3 0 100%
North KOTIDO LOSAKUCA PS 8 8 0 0 100%
East KALIRO LUGONYOLA P.S 9 9 0 0 100%
North LAMWO LUGWAR PS 7 5 2 0 100%
East BUGIRI LWANGOSA PS 6 5 1 0 100%
Central MUBENDE LWENYANGE PS 7 7 0 0 100%
West KAMWENGE LYAKAHUNGA PS 8 8 0 0 100%
West KAMWENGE MABAALE PS 8 7 1 0 100%
West KAMWENGE MACHIRO PS 7 6 1 0 100%
East NAMUTUMBA MAGADA PS 11 10 1 0 100%
West KAMWENGE MAHYORO PS 9 8 1 0 100%
Central MUBENDE MANYOGASEKA PS 9 8 1 0 100%
West KAKUMIRO MARANATHA PS 9 5 4 0 100%
North AMURU MARO-AWOBI PS 8 5 3 0 100%
East BUGIRI MAWANGA PS 9 7 2 0 100%
East MAYUGE MBIRIZI PS 10 9 1 0 100%
West KAMWENGE MIRAMBI PS 9 6 3 0 100%
East BUKEDEA MIROI ROCK PS 11 11 0 0 100%
Central MUBENDE Mubende Tiger P/S 29 26 3 0 100%
East MAYUGE MUKUTA PS 9 7 2 0 100%
East BUGIRI NABIRERE PS 6 6 0 0 100%
86
Region District School
Government
Employed
Teachers
Physically
Present AA UA
%
Present-
Verification
III
Verification
II
Verification
I Baseline
East BUDUDA NABOOTI PS 6 6 0 0 100%
East BUGIRI NAKAVULE PS 22 21 1 0 100%
East LUUKA NAKAVUMA PS 11 11 0 0 100%
East BUGIRI NAKAWA PS 11 10 1 0 100%
East BUKEDEA NALUGAI PS 15 11 4 0 100%
East LUUKA NAMADOPE PS 13 11 2 0 100%
East NAMAYINGO NAMAVUNDU PS 9 8 1 0 100%
East BUGIRI NAMBO PS 11 10 1 0 100%
East KALIRO NAMULUNGU PARENTS PS 10 8 2 0 100%
East BUGIRI
Nansaga Muslim Primary
School 7 6 1 0 100%
East NAMUTUMBA NAWAIKONIA PS 13 13 0 0 100%
East NAMUTUMBA NAWAMPANDU PS 20 19 1 0 100%
East KALIRO NAWAMPITI PS 12 11 1 0 100%
East NAMUTUMBA NAWANSAGWA PS 19 17 2 0 100%
East NAMUTUMBA NAWANSEKESE PS 9 8 1 0 100%
East BUYENDE NGOLE PS 8 8 0 0 100%
West KAMWENGE NGOMA PS 8 7 1 0 100%
West KAMWENGE NKARAKARA PS 7 6 1 0 100%
West KAMWENGE NKOMA PS 9 8 1 0 100%
East BUYENDE NKONDO PS 12 9 3 0 100%
Central KYANKWANZI NSAMBYA PS 10 9 1 0 100%
East BUGIRI NSANGO PS 9 7 2 0 100%
West KAMWENGE NTARA PS 13 12 1 0 100%
East KALIRO NUHIRA PS 9 8 1 0 100%
West KAKUMIRO NYABIRUNGI PS 6 6 0 0 100%
87
Region District School
Government
Employed
Teachers
Physically
Present AA UA
%
Present-
Verification
III
Verification
II
Verification
I Baseline
East AMURIA NYADA PS 8 7 1 0 100%
West KAMWENGE NYAKAHAMA PS 10 8 2 0 100%
West KIBAALE NYAMUGURA PS 9 8 1 0 100%
West KAMWENGE NYANGA PS 8 7 1 0 100%
West KAMWENGE
NYARURAMBI PARENTS
PS 9 8 1 0 100%
East AMURIA OBALANGA PS 8 5 3 0 100%
North ALEBTONG Ocabu primary school 13 11 2 0 100%
East AMURIA OCAL PS 10 9 1 0 100%
East AMURIA ODEKERE PS 10 6 4 0 100%
East AMURIA OGOLAI PS 9 9 0 0 100%
East AMURIA OGWARAT PS 9 7 2 0 100%
East AMURIA OJOTA PS 7 7 0 0 100%
North AGAGO OKOL PS 7 4 3 0 100%
North LAMWO OKORA PS 6 4 2 0 100%
East AMURIA OKUDE PS 14 13 1 0 100%
East BUKEDEA OKUNGURO PS 13 10 3 0 100%
North AGAGO OKWENY PS 7 6 1 0 100%
East AMURIA OLIANAI PS 9 9 0 0 100%
North ALEBTONG OLORO HIGH PS 12 12 0 0 100%
East SOROTI OMODOI PS 12 11 1 0 100%
East SOROTI OMUGENYA-ODELA PS 11 10 1 0 100%
East SOROTI OPUCET PS 12 6 6 0 100%
North OYAM OPUK PS 12 12 0 0 100%
North AGAGO OPYELO P7 PS 7 6 1 0 100%
North OYAM OTWAL PS 17 17 0 0 100%
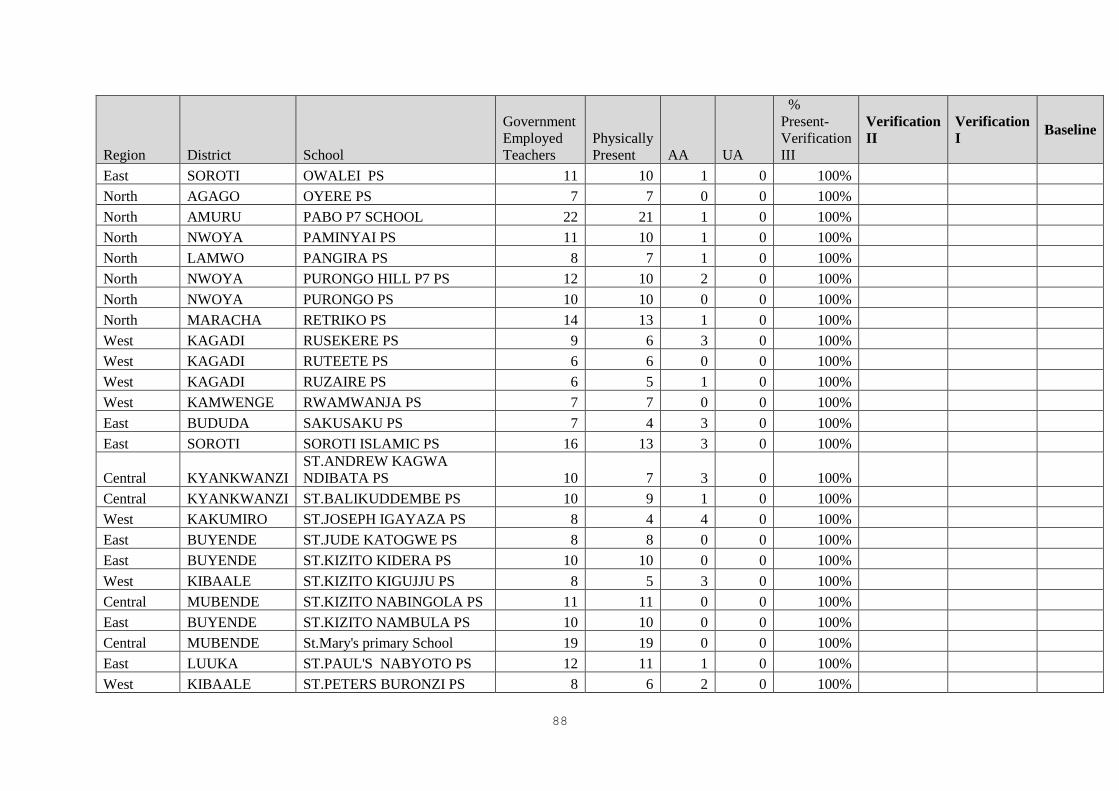
88
Region District School
Government
Employed
Teachers
Physically
Present AA UA
%
Present-
Verification
III
Verification
II
Verification
I Baseline
East SOROTI OWALEI PS 11 10 1 0 100%
North AGAGO OYERE PS 7 7 0 0 100%
North AMURU PABO P7 SCHOOL 22 21 1 0 100%
North NWOYA PAMINYAI PS 11 10 1 0 100%
North LAMWO PANGIRA PS 8 7 1 0 100%
North NWOYA PURONGO HILL P7 PS 12 10 2 0 100%
North NWOYA PURONGO PS 10 10 0 0 100%
North MARACHA RETRIKO PS 14 13 1 0 100%
West KAGADI RUSEKERE PS 9 6 3 0 100%
West KAGADI RUTEETE PS 6 6 0 0 100%
West KAGADI RUZAIRE PS 6 5 1 0 100%
West KAMWENGE RWAMWANJA PS 7 7 0 0 100%
East BUDUDA SAKUSAKU PS 7 4 3 0 100%
East SOROTI SOROTI ISLAMIC PS 16 13 3 0 100%
Central KYANKWANZI
ST.ANDREW KAGWA
NDIBATA PS 10 7 3 0 100%
Central KYANKWANZI ST.BALIKUDDEMBE PS 10 9 1 0 100%
West KAKUMIRO ST.JOSEPH IGAYAZA PS 8 4 4 0 100%
East BUYENDE ST.JUDE KATOGWE PS 8 8 0 0 100%
East BUYENDE ST.KIZITO KIDERA PS 10 10 0 0 100%
West KIBAALE ST.KIZITO KIGUJJU PS 8 5 3 0 100%
Central MUBENDE ST.KIZITO NABINGOLA PS 11 11 0 0 100%
East BUYENDE ST.KIZITO NAMBULA PS 10 10 0 0 100%
Central MUBENDE St.Mary's primary School 19 19 0 0 100%
East LUUKA ST.PAUL'S NABYOTO PS 12 11 1 0 100%
West KIBAALE ST.PETERS BURONZI PS 8 6 2 0 100%
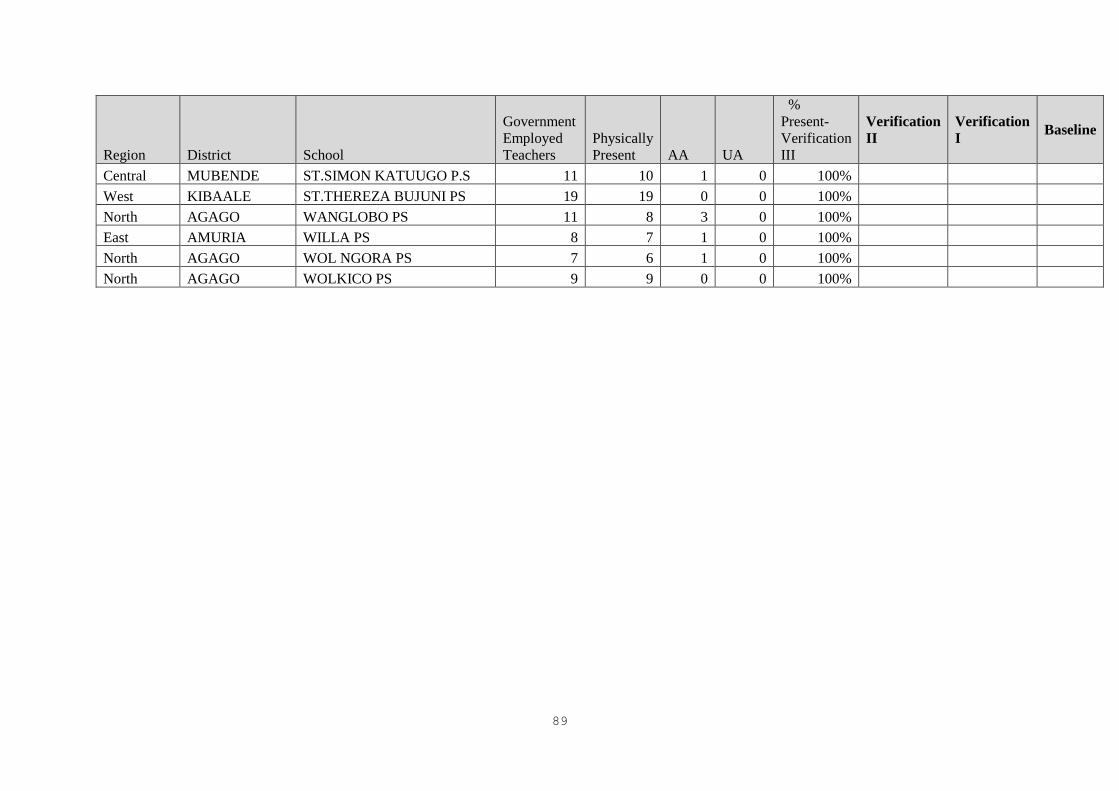
89
Region District School
Government
Employed
Teachers
Physically
Present AA UA
%
Present-
Verification
III
Verification
II
Verification
I Baseline
Central MUBENDE ST.SIMON KATUUGO P.S 11 10 1 0 100%
West KIBAALE ST.THEREZA BUJUNI PS 19 19 0 0 100%
North AGAGO WANGLOBO PS 11 8 3 0 100%
East AMURIA WILLA PS 8 7 1 0 100%
North AGAGO WOL NGORA PS 7 6 1 0 100%
North AGAGO WOLKICO PS 9 9 0 0 100%
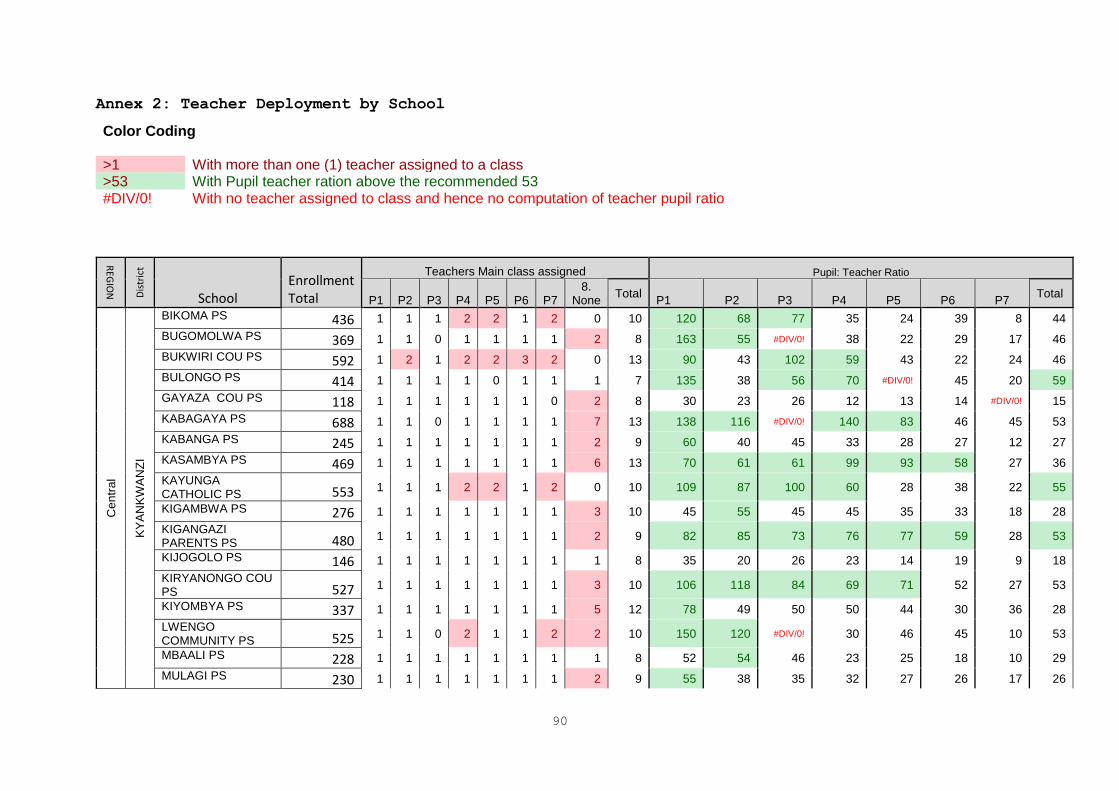
90
Annex 2: Teacher Deployment by School
Color Coding >1 With more than one (1) teacher assigned to a class >53 With Pupil teacher ration above the recommended 53 #DIV/0! With no teacher assigned to class and hence no computation of teacher pupil ratio
REG
ION
Dis
tric
t
School Enrollment Total
Teachers Main class assigned Pupil: Teacher Ratio
P1 P2
P3
P4 P5
P6 P7
8. None
Total P1 P2 P3 P4 P5 P6 P7
Total
Cen
tra
l
KY
AN
KW
AN
ZI
BIKOMA PS 436 1 1 1 2 2 1 2 0 10 120 68 77 35 24 39 8 44
BUGOMOLWA PS 369 1 1 0 1 1 1 1 2 8 163 55 #DIV/0! 38 22 29 17 46
BUKWIRI COU PS 592 1 2 1 2 2 3 2 0 13 90 43 102 59 43 22 24 46
BULONGO PS 414 1 1 1 1 0 1 1 1 7 135 38 56 70 #DIV/0! 45 20 59
GAYAZA COU PS 118 1 1 1 1 1 1 0 2 8 30 23 26 12 13 14 #DIV/0! 15
KABAGAYA PS 688 1 1 0 1 1 1 1 7 13 138 116 #DIV/0! 140 83 46 45 53
KABANGA PS 245 1 1 1 1 1 1 1 2 9 60 40 45 33 28 27 12 27
KASAMBYA PS 469 1 1 1 1 1 1 1 6 13 70 61 61 99 93 58 27 36
KAYUNGA CATHOLIC PS 553 1 1 1 2 2 1 2 0 10 109 87 100 60 28 38 22 55
KIGAMBWA PS 276 1 1 1 1 1 1 1 3 10 45 55 45 45 35 33 18 28
KIGANGAZI PARENTS PS 480 1 1 1 1 1 1 1 2 9 82 85 73 76 77 59 28 53
KIJOGOLO PS 146 1 1 1 1 1 1 1 1 8 35 20 26 23 14 19 9 18
KIRYANONGO COU PS 527 1 1 1 1 1 1 1 3 10 106 118 84 69 71 52 27 53
KIYOMBYA PS 337 1 1 1 1 1 1 1 5 12 78 49 50 50 44 30 36 28
LWENGO COMMUNITY PS 525 1 1 0 2 1 1 2 2 10 150 120 #DIV/0! 30 46 45 10 53
MBAALI PS 228 1 1 1 1 1 1 1 1 8 52 54 46 23 25 18 10 29
MULAGI PS 230 1 1 1 1 1 1 1 2 9 55 38 35 32 27 26 17 26
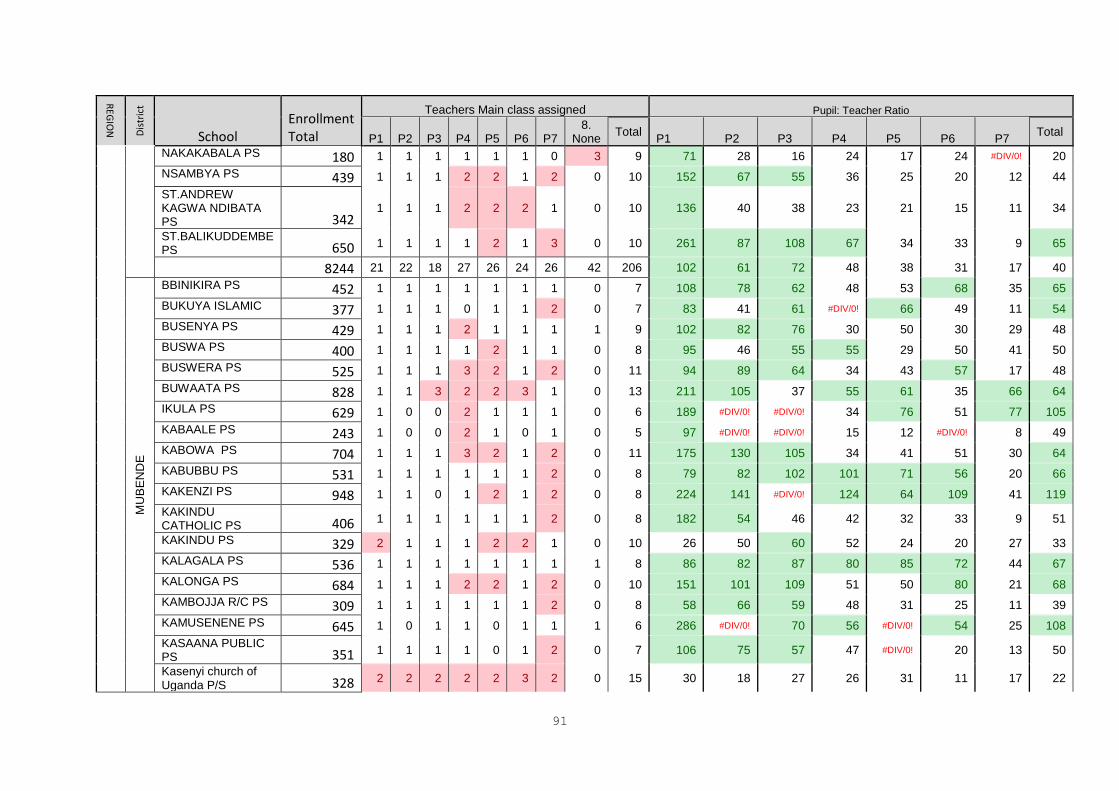
91
REG
ION
Dis
tric
t School
Enrollment Total
Teachers Main class assigned Pupil: Teacher Ratio
P1 P2
P3
P4 P5
P6 P7
8. None
Total P1 P2 P3 P4 P5 P6 P7
Total
NAKAKABALA PS 180 1 1 1 1 1 1 0 3 9 71 28 16 24 17 24 #DIV/0! 20
NSAMBYA PS 439 1 1 1 2 2 1 2 0 10 152 67 55 36 25 20 12 44
ST.ANDREW KAGWA NDIBATA PS 342
1 1 1 2 2 2 1 0 10 136 40 38 23 21 15 11 34
ST.BALIKUDDEMBE PS 650 1 1 1 1 2 1 3 0 10 261 87 108 67 34 33 9 65
8244 21 22 18 27 26 24 26 42 206 102 61 72 48 38 31 17 40
MU
BE
ND
E
BBINIKIRA PS 452 1 1 1 1 1 1 1 0 7 108 78 62 48 53 68 35 65
BUKUYA ISLAMIC 377 1 1 1 0 1 1 2 0 7 83 41 61 #DIV/0! 66 49 11 54
BUSENYA PS 429 1 1 1 2 1 1 1 1 9 102 82 76 30 50 30 29 48
BUSWA PS 400 1 1 1 1 2 1 1 0 8 95 46 55 55 29 50 41 50
BUSWERA PS 525 1 1 1 3 2 1 2 0 11 94 89 64 34 43 57 17 48
BUWAATA PS 828 1 1 3 2 2 3 1 0 13 211 105 37 55 61 35 66 64
IKULA PS 629 1 0 0 2 1 1 1 0 6 189 #DIV/0! #DIV/0! 34 76 51 77 105
KABAALE PS 243 1 0 0 2 1 0 1 0 5 97 #DIV/0! #DIV/0! 15 12 #DIV/0! 8 49
KABOWA PS 704 1 1 1 3 2 1 2 0 11 175 130 105 34 41 51 30 64
KABUBBU PS 531 1 1 1 1 1 1 2 0 8 79 82 102 101 71 56 20 66
KAKENZI PS 948 1 1 0 1 2 1 2 0 8 224 141 #DIV/0! 124 64 109 41 119
KAKINDU CATHOLIC PS 406 1 1 1 1 1 1 2 0 8 182 54 46 42 32 33 9 51
KAKINDU PS 329 2 1 1 1 2 2 1 0 10 26 50 60 52 24 20 27 33
KALAGALA PS 536 1 1 1 1 1 1 1 1 8 86 82 87 80 85 72 44 67
KALONGA PS 684 1 1 1 2 2 1 2 0 10 151 101 109 51 50 80 21 68
KAMBOJJA R/C PS 309 1 1 1 1 1 1 2 0 8 58 66 59 48 31 25 11 39
KAMUSENENE PS 645 1 0 1 1 0 1 1 1 6 286 #DIV/0! 70 56 #DIV/0! 54 25 108
KASAANA PUBLIC PS 351 1 1 1 1 0 1 2 0 7 106 75 57 47 #DIV/0! 20 13 50
Kasenyi church of Uganda P/S 328 2 2 2 2 2 3 2 0 15 30 18 27 26 31 11 17 22
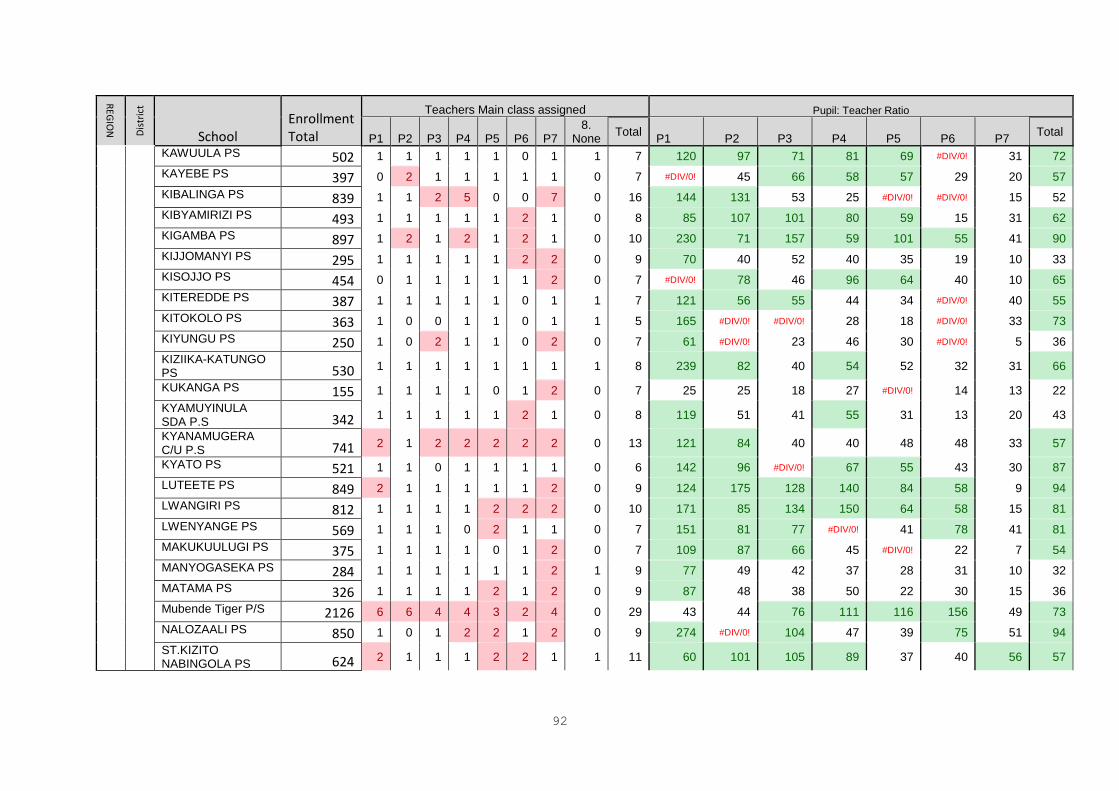
92
REG
ION
Dis
tric
t School
Enrollment Total
Teachers Main class assigned Pupil: Teacher Ratio
P1 P2
P3
P4 P5
P6 P7
8. None
Total P1 P2 P3 P4 P5 P6 P7
Total
KAWUULA PS 502 1 1 1 1 1 0 1 1 7 120 97 71 81 69 #DIV/0! 31 72
KAYEBE PS 397 0 2 1 1 1 1 1 0 7 #DIV/0! 45 66 58 57 29 20 57
KIBALINGA PS 839 1 1 2 5 0 0 7 0 16 144 131 53 25 #DIV/0! #DIV/0! 15 52
KIBYAMIRIZI PS 493 1 1 1 1 1 2 1 0 8 85 107 101 80 59 15 31 62
KIGAMBA PS 897 1 2 1 2 1 2 1 0 10 230 71 157 59 101 55 41 90
KIJJOMANYI PS 295 1 1 1 1 1 2 2 0 9 70 40 52 40 35 19 10 33
KISOJJO PS 454 0 1 1 1 1 1 2 0 7 #DIV/0! 78 46 96 64 40 10 65
KITEREDDE PS 387 1 1 1 1 1 0 1 1 7 121 56 55 44 34 #DIV/0! 40 55
KITOKOLO PS 363 1 0 0 1 1 0 1 1 5 165 #DIV/0! #DIV/0! 28 18 #DIV/0! 33 73
KIYUNGU PS 250 1 0 2 1 1 0 2 0 7 61 #DIV/0! 23 46 30 #DIV/0! 5 36
KIZIIKA-KATUNGO PS 530 1 1 1 1 1 1 1 1 8 239 82 40 54 52 32 31 66
KUKANGA PS 155 1 1 1 1 0 1 2 0 7 25 25 18 27 #DIV/0! 14 13 22
KYAMUYINULA SDA P.S 342 1 1 1 1 1 2 1 0 8 119 51 41 55 31 13 20 43
KYANAMUGERA C/U P.S 741 2 1 2 2 2 2 2 0 13 121 84 40 40 48 48 33 57
KYATO PS 521 1 1 0 1 1 1 1 0 6 142 96 #DIV/0! 67 55 43 30 87
LUTEETE PS 849 2 1 1 1 1 1 2 0 9 124 175 128 140 84 58 9 94
LWANGIRI PS 812 1 1 1 1 2 2 2 0 10 171 85 134 150 64 58 15 81
LWENYANGE PS 569 1 1 1 0 2 1 1 0 7 151 81 77 #DIV/0! 41 78 41 81
MAKUKUULUGI PS 375 1 1 1 1 0 1 2 0 7 109 87 66 45 #DIV/0! 22 7 54
MANYOGASEKA PS 284 1 1 1 1 1 1 2 1 9 77 49 42 37 28 31 10 32
MATAMA PS 326 1 1 1 1 2 1 2 0 9 87 48 38 50 22 30 15 36
Mubende Tiger P/S 2126 6 6 4 4 3 2 4 0 29 43 44 76 111 116 156 49 73
NALOZAALI PS 850 1 0 1 2 2 1 2 0 9 274 #DIV/0! 104 47 39 75 51 94
ST.KIZITO NABINGOLA PS 624 2 1 1 1 2 2 1 1 11 60 101 105 89 37 40 56 57
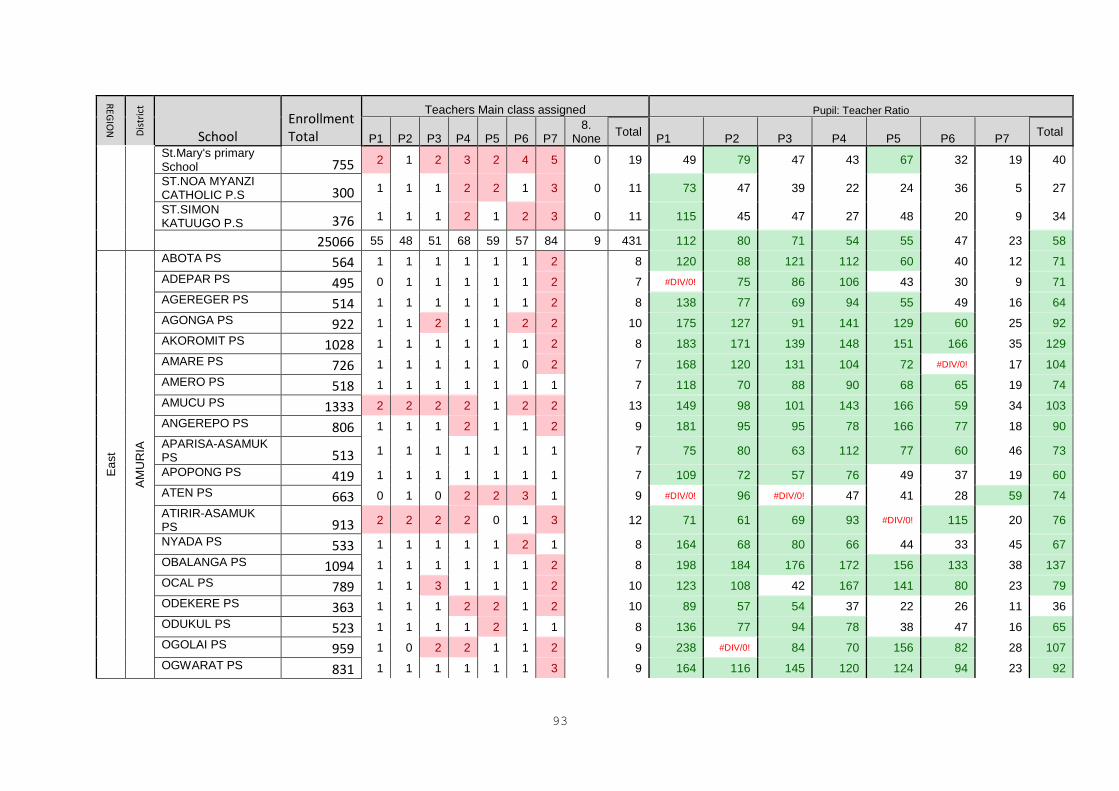
93
REG
ION
Dis
tric
t School
Enrollment Total
Teachers Main class assigned Pupil: Teacher Ratio
P1 P2
P3
P4 P5
P6 P7
8. None
Total P1 P2 P3 P4 P5 P6 P7
Total
St.Mary's primary School 755 2 1 2 3 2 4 5 0 19 49 79 47 43 67 32 19 40
ST.NOA MYANZI CATHOLIC P.S 300 1 1 1 2 2 1 3 0 11 73 47 39 22 24 36 5 27
ST.SIMON KATUUGO P.S 376 1 1 1 2 1 2 3 0 11 115 45 47 27 48 20 9 34
25066 55 48 51 68 59 57 84 9 431 112 80 71 54 55 47 23 58
Ea
st
AM
UR
IA
ABOTA PS 564 1 1 1 1 1 1 2 8 120 88 121 112 60 40 12 71
ADEPAR PS 495 0 1 1 1 1 1 2 7 #DIV/0! 75 86 106 43 30 9 71
AGEREGER PS 514 1 1 1 1 1 1 2 8 138 77 69 94 55 49 16 64
AGONGA PS 922 1 1 2 1 1 2 2 10 175 127 91 141 129 60 25 92
AKOROMIT PS 1028 1 1 1 1 1 1 2 8 183 171 139 148 151 166 35 129
AMARE PS 726 1 1 1 1 1 0 2 7 168 120 131 104 72 #DIV/0! 17 104
AMERO PS 518 1 1 1 1 1 1 1 7 118 70 88 90 68 65 19 74
AMUCU PS 1333 2 2 2 2 1 2 2 13 149 98 101 143 166 59 34 103
ANGEREPO PS 806 1 1 1 2 1 1 2 9 181 95 95 78 166 77 18 90
APARISA-ASAMUK PS 513 1 1 1 1 1 1 1 7 75 80 63 112 77 60 46 73
APOPONG PS 419 1 1 1 1 1 1 1 7 109 72 57 76 49 37 19 60
ATEN PS 663 0 1 0 2 2 3 1 9 #DIV/0! 96 #DIV/0! 47 41 28 59 74
ATIRIR-ASAMUK PS 913 2 2 2 2 0 1 3 12 71 61 69 93 #DIV/0! 115 20 76
NYADA PS 533 1 1 1 1 1 2 1 8 164 68 80 66 44 33 45 67
OBALANGA PS 1094 1 1 1 1 1 1 2 8 198 184 176 172 156 133 38 137
OCAL PS 789 1 1 3 1 1 1 2 10 123 108 42 167 141 80 23 79
ODEKERE PS 363 1 1 1 2 2 1 2 10 89 57 54 37 22 26 11 36
ODUKUL PS 523 1 1 1 1 2 1 1 8 136 77 94 78 38 47 16 65
OGOLAI PS 959 1 0 2 2 1 1 2 9 238 #DIV/0! 84 70 156 82 28 107
OGWARAT PS 831 1 1 1 1 1 1 3 9 164 116 145 120 124 94 23 92
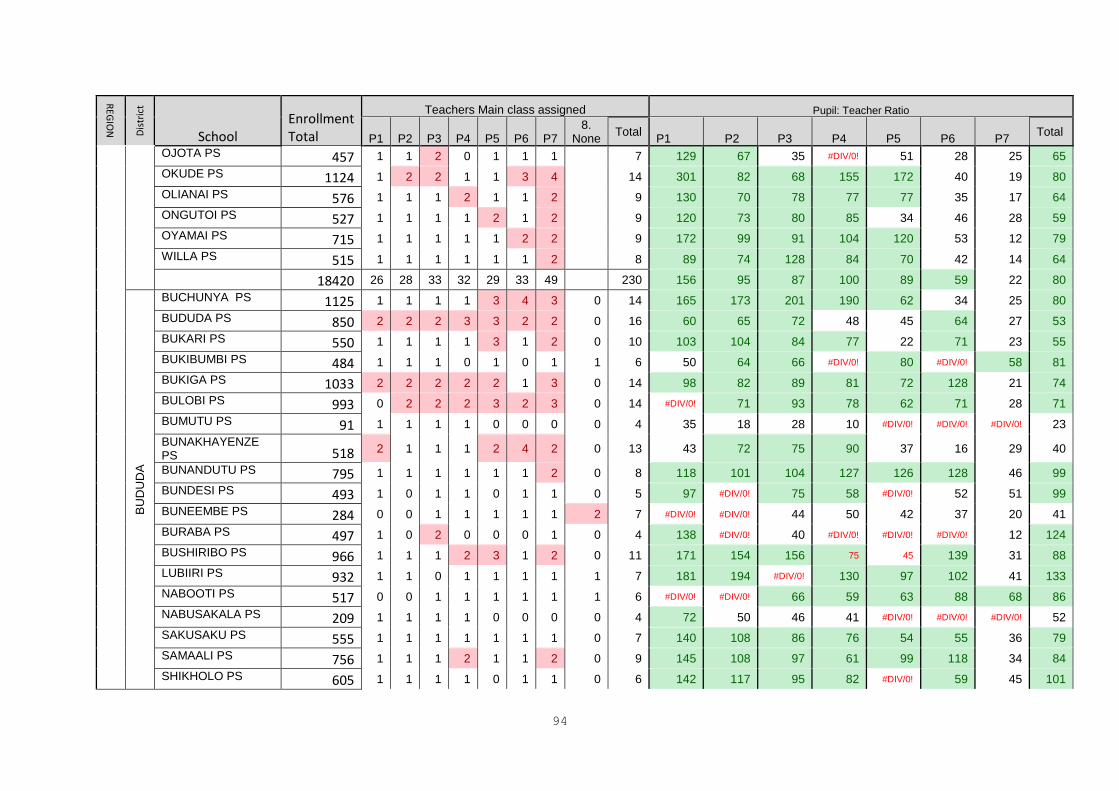
94
REG
ION
Dis
tric
t School
Enrollment Total
Teachers Main class assigned Pupil: Teacher Ratio
P1 P2
P3
P4 P5
P6 P7
8. None
Total P1 P2 P3 P4 P5 P6 P7
Total
OJOTA PS 457 1 1 2 0 1 1 1 7 129 67 35 #DIV/0! 51 28 25 65
OKUDE PS 1124 1 2 2 1 1 3 4 14 301 82 68 155 172 40 19 80
OLIANAI PS 576 1 1 1 2 1 1 2 9 130 70 78 77 77 35 17 64
ONGUTOI PS 527 1 1 1 1 2 1 2 9 120 73 80 85 34 46 28 59
OYAMAI PS 715 1 1 1 1 1 2 2 9 172 99 91 104 120 53 12 79
WILLA PS 515 1 1 1 1 1 1 2 8 89 74 128 84 70 42 14 64
18420 26 28 33 32 29 33 49 230 156 95 87 100 89 59 22 80
BU
DU
DA
BUCHUNYA PS 1125 1 1 1 1 3 4 3 0 14 165 173 201 190 62 34 25 80
BUDUDA PS 850 2 2 2 3 3 2 2 0 16 60 65 72 48 45 64 27 53
BUKARI PS 550 1 1 1 1 3 1 2 0 10 103 104 84 77 22 71 23 55
BUKIBUMBI PS 484 1 1 1 0 1 0 1 1 6 50 64 66 #DIV/0! 80 #DIV/0! 58 81
BUKIGA PS 1033 2 2 2 2 2 1 3 0 14 98 82 89 81 72 128 21 74
BULOBI PS 993 0 2 2 2 3 2 3 0 14 #DIV/0! 71 93 78 62 71 28 71
BUMUTU PS 91 1 1 1 1 0 0 0 0 4 35 18 28 10 #DIV/0! #DIV/0! #DIV/0! 23
BUNAKHAYENZE PS 518 2 1 1 1 2 4 2 0 13 43 72 75 90 37 16 29 40
BUNANDUTU PS 795 1 1 1 1 1 1 2 0 8 118 101 104 127 126 128 46 99
BUNDESI PS 493 1 0 1 1 0 1 1 0 5 97 #DIV/0! 75 58 #DIV/0! 52 51 99
BUNEEMBE PS 284 0 0 1 1 1 1 1 2 7 #DIV/0! #DIV/0! 44 50 42 37 20 41
BURABA PS 497 1 0 2 0 0 0 1 0 4 138 #DIV/0! 40 #DIV/0! #DIV/0! #DIV/0! 12 124
BUSHIRIBO PS 966 1 1 1 2 3 1 2 0 11 171 154 156 75 45 139 31 88
LUBIIRI PS 932 1 1 0 1 1 1 1 1 7 181 194 #DIV/0! 130 97 102 41 133
NABOOTI PS 517 0 0 1 1 1 1 1 1 6 #DIV/0! #DIV/0! 66 59 63 88 68 86
NABUSAKALA PS 209 1 1 1 1 0 0 0 0 4 72 50 46 41 #DIV/0! #DIV/0! #DIV/0! 52
SAKUSAKU PS 555 1 1 1 1 1 1 1 0 7 140 108 86 76 54 55 36 79
SAMAALI PS 756 1 1 1 2 1 1 2 0 9 145 108 97 61 99 118 34 84
SHIKHOLO PS 605 1 1 1 1 0 1 1 0 6 142 117 95 82 #DIV/0! 59 45 101
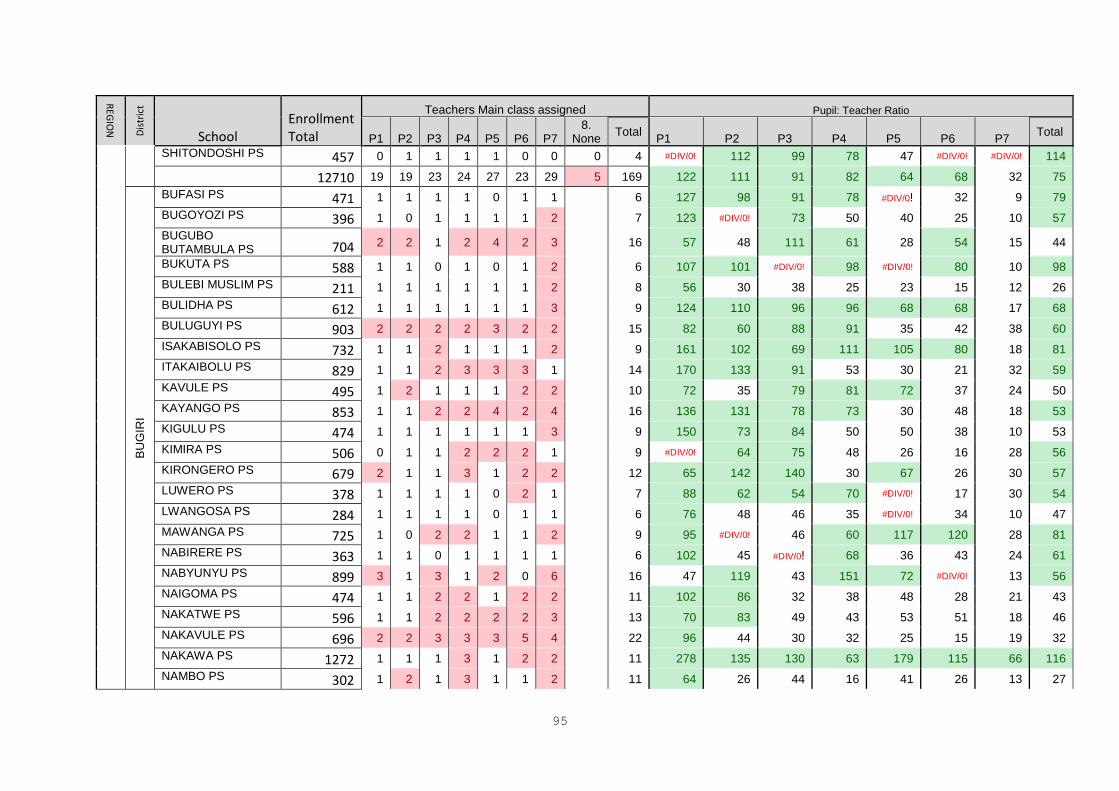
95
REG
ION
Dis
tric
t School
Enrollment Total
Teachers Main class assigned Pupil: Teacher Ratio
P1 P2
P3
P4 P5
P6 P7
8. None
Total P1 P2 P3 P4 P5 P6 P7
Total
SHITONDOSHI PS 457 0 1 1 1 1 0 0 0 4 #DIV/0! 112 99 78 47 #DIV/0! #DIV/0! 114
12710 19 19 23 24 27 23 29 5 169 122 111 91 82 64 68 32 75
BU
GIR
I
BUFASI PS 471 1 1 1 1 0 1 1 6 127 98 91 78 #DIV/0! 32 9 79
BUGOYOZI PS 396 1 0 1 1 1 1 2 7 123 #DIV/0! 73 50 40 25 10 57
BUGUBO BUTAMBULA PS 704 2 2 1 2 4 2 3 16 57 48 111 61 28 54 15 44
BUKUTA PS 588 1 1 0 1 0 1 2 6 107 101 #DIV/0! 98 #DIV/0! 80 10 98
BULEBI MUSLIM PS 211 1 1 1 1 1 1 2 8 56 30 38 25 23 15 12 26
BULIDHA PS 612 1 1 1 1 1 1 3 9 124 110 96 96 68 68 17 68
BULUGUYI PS 903 2 2 2 2 3 2 2 15 82 60 88 91 35 42 38 60
ISAKABISOLO PS 732 1 1 2 1 1 1 2 9 161 102 69 111 105 80 18 81
ITAKAIBOLU PS 829 1 1 2 3 3 3 1 14 170 133 91 53 30 21 32 59
KAVULE PS 495 1 2 1 1 1 2 2 10 72 35 79 81 72 37 24 50
KAYANGO PS 853 1 1 2 2 4 2 4 16 136 131 78 73 30 48 18 53
KIGULU PS 474 1 1 1 1 1 1 3 9 150 73 84 50 50 38 10 53
KIMIRA PS 506 0 1 1 2 2 2 1 9 #DIV/0! 64 75 48 26 16 28 56
KIRONGERO PS 679 2 1 1 3 1 2 2 12 65 142 140 30 67 26 30 57
LUWERO PS 378 1 1 1 1 0 2 1 7 88 62 54 70 #DIV/0! 17 30 54
LWANGOSA PS 284 1 1 1 1 0 1 1 6 76 48 46 35 #DIV/0! 34 10 47
MAWANGA PS 725 1 0 2 2 1 1 2 9 95 #DIV/0! 46 60 117 120 28 81
NABIRERE PS 363 1 1 0 1 1 1 1 6 102 45 #DIV/0! 68 36 43 24 61
NABYUNYU PS 899 3 1 3 1 2 0 6 16 47 119 43 151 72 #DIV/0! 13 56
NAIGOMA PS 474 1 1 2 2 1 2 2 11 102 86 32 38 48 28 21 43
NAKATWE PS 596 1 1 2 2 2 2 3 13 70 83 49 43 53 51 18 46
NAKAVULE PS 696 2 2 3 3 3 5 4 22 96 44 30 32 25 15 19 32
NAKAWA PS 1272 1 1 1 3 1 2 2 11 278 135 130 63 179 115 66 116
NAMBO PS 302 1 2 1 3 1 1 2 11 64 26 44 16 41 26 13 27
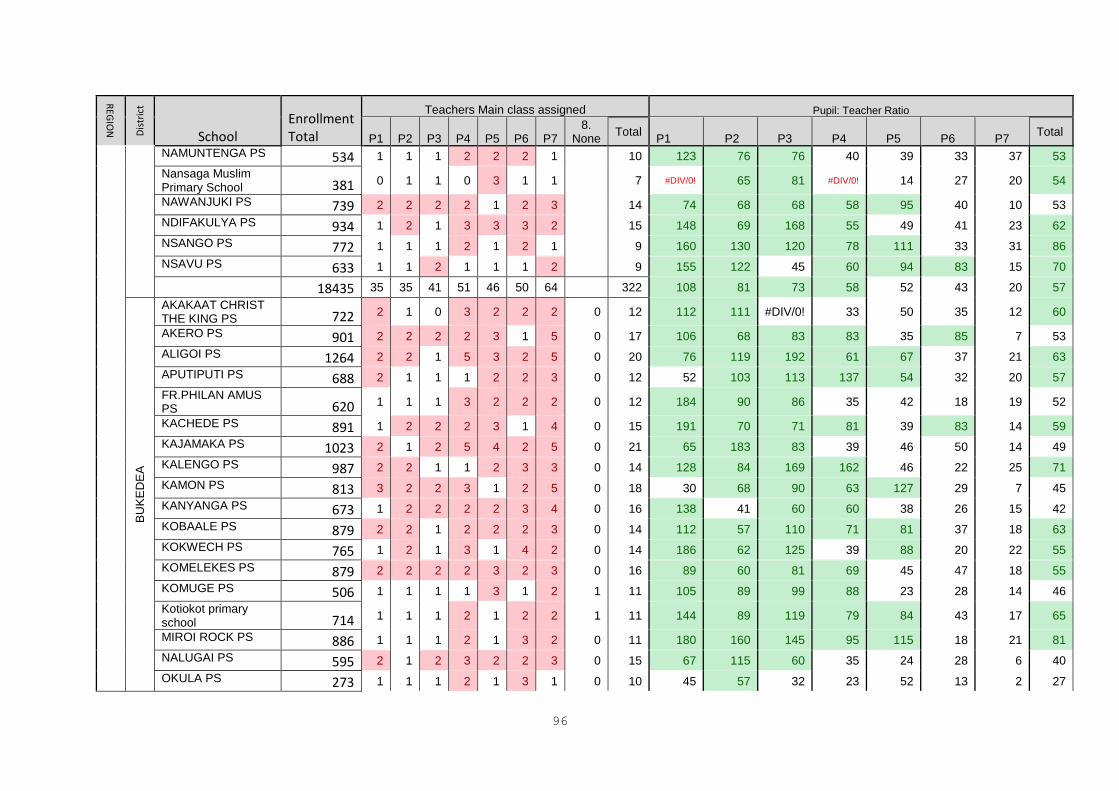
96
REG
ION
Dis
tric
t School
Enrollment Total
Teachers Main class assigned Pupil: Teacher Ratio
P1 P2
P3
P4 P5
P6 P7
8. None
Total P1 P2 P3 P4 P5 P6 P7
Total
NAMUNTENGA PS 534 1 1 1 2 2 2 1 10 123 76 76 40 39 33 37 53
Nansaga Muslim Primary School 381 0 1 1 0 3 1 1 7 #DIV/0! 65 81 #DIV/0! 14 27 20 54
NAWANJUKI PS 739 2 2 2 2 1 2 3 14 74 68 68 58 95 40 10 53
NDIFAKULYA PS 934 1 2 1 3 3 3 2 15 148 69 168 55 49 41 23 62
NSANGO PS 772 1 1 1 2 1 2 1 9 160 130 120 78 111 33 31 86
NSAVU PS 633 1 1 2 1 1 1 2 9 155 122 45 60 94 83 15 70
18435 35 35 41 51 46 50 64 322 108 81 73 58 52 43 20 57
BU
KE
DE
A
AKAKAAT CHRIST THE KING PS 722 2 1 0 3 2 2 2 0 12 112 111 #DIV/0! 33 50 35 12 60
AKERO PS 901 2 2 2 2 3 1 5 0 17 106 68 83 83 35 85 7 53
ALIGOI PS 1264 2 2 1 5 3 2 5 0 20 76 119 192 61 67 37 21 63
APUTIPUTI PS 688 2 1 1 1 2 2 3 0 12 52 103 113 137 54 32 20 57
FR.PHILAN AMUS PS 620 1 1 1 3 2 2 2 0 12 184 90 86 35 42 18 19 52
KACHEDE PS 891 1 2 2 2 3 1 4 0 15 191 70 71 81 39 83 14 59
KAJAMAKA PS 1023 2 1 2 5 4 2 5 0 21 65 183 83 39 46 50 14 49
KALENGO PS 987 2 2 1 1 2 3 3 0 14 128 84 169 162 46 22 25 71
KAMON PS 813 3 2 2 3 1 2 5 0 18 30 68 90 63 127 29 7 45
KANYANGA PS 673 1 2 2 2 2 3 4 0 16 138 41 60 60 38 26 15 42
KOBAALE PS 879 2 2 1 2 2 2 3 0 14 112 57 110 71 81 37 18 63
KOKWECH PS 765 1 2 1 3 1 4 2 0 14 186 62 125 39 88 20 22 55
KOMELEKES PS 879 2 2 2 2 3 2 3 0 16 89 60 81 69 45 47 18 55
KOMUGE PS 506 1 1 1 1 3 1 2 1 11 105 89 99 88 23 28 14 46
Kotiokot primary school 714 1 1 1 2 1 2 2 1 11 144 89 119 79 84 43 17 65
MIROI ROCK PS 886 1 1 1 2 1 3 2 0 11 180 160 145 95 115 18 21 81
NALUGAI PS 595 2 1 2 3 2 2 3 0 15 67 115 60 35 24 28 6 40
OKULA PS 273 1 1 1 2 1 3 1 0 10 45 57 32 23 52 13 2 27
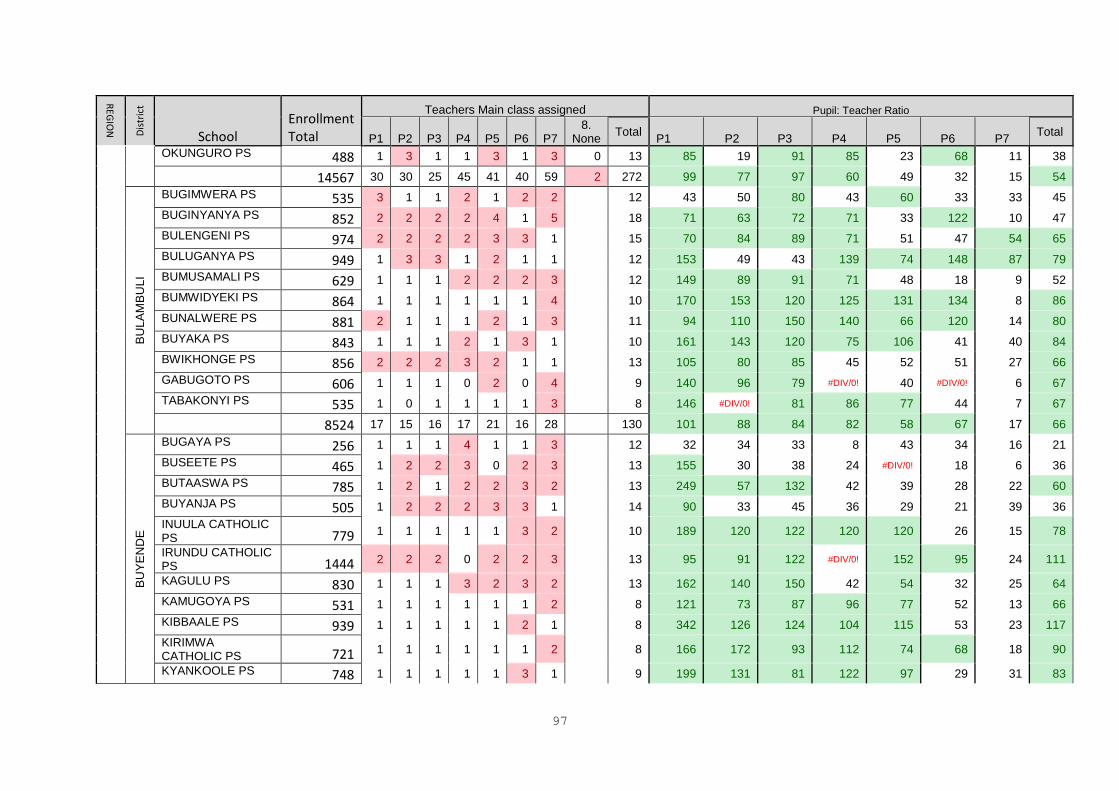
97
REG
ION
Dis
tric
t School
Enrollment Total
Teachers Main class assigned Pupil: Teacher Ratio
P1 P2
P3
P4 P5
P6 P7
8. None
Total P1 P2 P3 P4 P5 P6 P7
Total
OKUNGURO PS 488 1 3 1 1 3 1 3 0 13 85 19 91 85 23 68 11 38
14567 30 30 25 45 41 40 59 2 272 99 77 97 60 49 32 15 54
BU
LA
MB
ULI
BUGIMWERA PS 535 3 1 1 2 1 2 2 12 43 50 80 43 60 33 33 45
BUGINYANYA PS 852 2 2 2 2 4 1 5 18 71 63 72 71 33 122 10 47
BULENGENI PS 974 2 2 2 2 3 3 1 15 70 84 89 71 51 47 54 65
BULUGANYA PS 949 1 3 3 1 2 1 1 12 153 49 43 139 74 148 87 79
BUMUSAMALI PS 629 1 1 1 2 2 2 3 12 149 89 91 71 48 18 9 52
BUMWIDYEKI PS 864 1 1 1 1 1 1 4 10 170 153 120 125 131 134 8 86
BUNALWERE PS 881 2 1 1 1 2 1 3 11 94 110 150 140 66 120 14 80
BUYAKA PS 843 1 1 1 2 1 3 1 10 161 143 120 75 106 41 40 84
BWIKHONGE PS 856 2 2 2 3 2 1 1 13 105 80 85 45 52 51 27 66
GABUGOTO PS 606 1 1 1 0 2 0 4 9 140 96 79 #DIV/0! 40 #DIV/0! 6 67
TABAKONYI PS 535 1 0 1 1 1 1 3 8 146 #DIV/0! 81 86 77 44 7 67
8524 17 15 16 17 21 16 28 130 101 88 84 82 58 67 17 66
BU
YE
ND
E
BUGAYA PS 256 1 1 1 4 1 1 3 12 32 34 33 8 43 34 16 21
BUSEETE PS 465 1 2 2 3 0 2 3 13 155 30 38 24 #DIV/0! 18 6 36
BUTAASWA PS 785 1 2 1 2 2 3 2 13 249 57 132 42 39 28 22 60
BUYANJA PS 505 1 2 2 2 3 3 1 14 90 33 45 36 29 21 39 36
INUULA CATHOLIC PS 779 1 1 1 1 1 3 2 10 189 120 122 120 120 26 15 78
IRUNDU CATHOLIC PS 1444 2 2 2 0 2 2 3 13 95 91 122 #DIV/0! 152 95 24 111
KAGULU PS 830 1 1 1 3 2 3 2 13 162 140 150 42 54 32 25 64
KAMUGOYA PS 531 1 1 1 1 1 1 2 8 121 73 87 96 77 52 13 66
KIBBAALE PS 939 1 1 1 1 1 2 1 8 342 126 124 104 115 53 23 117
KIRIMWA CATHOLIC PS 721 1 1 1 1 1 1 2 8 166 172 93 112 74 68 18 90
KYANKOOLE PS 748 1 1 1 1 1 3 1 9 199 131 81 122 97 29 31 83
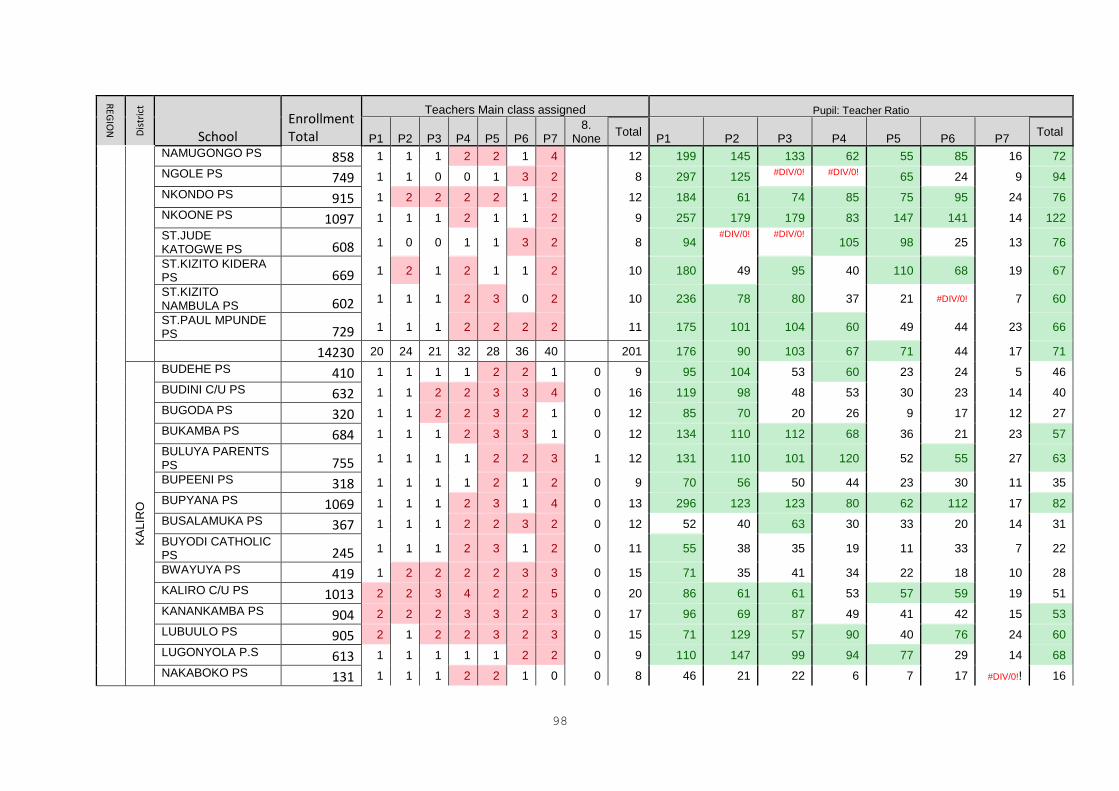
98
REG
ION
Dis
tric
t School
Enrollment Total
Teachers Main class assigned Pupil: Teacher Ratio
P1 P2
P3
P4 P5
P6 P7
8. None
Total P1 P2 P3 P4 P5 P6 P7
Total
NAMUGONGO PS 858 1 1 1 2 2 1 4 12 199 145 133 62 55 85 16 72
NGOLE PS 749 1 1 0 0 1 3 2 8 297 125 #DIV/0! #DIV/0! 65 24 9 94
NKONDO PS 915 1 2 2 2 2 1 2 12 184 61 74 85 75 95 24 76
NKOONE PS 1097 1 1 1 2 1 1 2 9 257 179 179 83 147 141 14 122
ST.JUDE KATOGWE PS 608 1 0 0 1 1 3 2 8 94
#DIV/0! #DIV/0! 105 98 25 13 76
ST.KIZITO KIDERA PS 669 1 2 1 2 1 1 2 10 180 49 95 40 110 68 19 67
ST.KIZITO NAMBULA PS 602 1 1 1 2 3 0 2 10 236 78 80 37 21 #DIV/0! 7 60
ST.PAUL MPUNDE PS 729 1 1 1 2 2 2 2 11 175 101 104 60 49 44 23 66
14230 20 24 21 32 28 36 40 201 176 90 103 67 71 44 17 71
KA
LIR
O
BUDEHE PS 410 1 1 1 1 2 2 1 0 9 95 104 53 60 23 24 5 46
BUDINI C/U PS 632 1 1 2 2 3 3 4 0 16 119 98 48 53 30 23 14 40
BUGODA PS 320 1 1 2 2 3 2 1 0 12 85 70 20 26 9 17 12 27
BUKAMBA PS 684 1 1 1 2 3 3 1 0 12 134 110 112 68 36 21 23 57
BULUYA PARENTS PS 755 1 1 1 1 2 2 3 1 12 131 110 101 120 52 55 27 63
BUPEENI PS 318 1 1 1 1 2 1 2 0 9 70 56 50 44 23 30 11 35
BUPYANA PS 1069 1 1 1 2 3 1 4 0 13 296 123 123 80 62 112 17 82
BUSALAMUKA PS 367 1 1 1 2 2 3 2 0 12 52 40 63 30 33 20 14 31
BUYODI CATHOLIC PS 245 1 1 1 2 3 1 2 0 11 55 38 35 19 11 33 7 22
BWAYUYA PS 419 1 2 2 2 2 3 3 0 15 71 35 41 34 22 18 10 28
KALIRO C/U PS 1013 2 2 3 4 2 2 5 0 20 86 61 61 53 57 59 19 51
KANANKAMBA PS 904 2 2 2 3 3 2 3 0 17 96 69 87 49 41 42 15 53
LUBUULO PS 905 2 1 2 2 3 2 3 0 15 71 129 57 90 40 76 24 60
LUGONYOLA P.S 613 1 1 1 1 1 2 2 0 9 110 147 99 94 77 29 14 68
NAKABOKO PS 131 1 1 1 2 2 1 0 0 8 46 21 22 6 7 17 #DIV/0!! 16
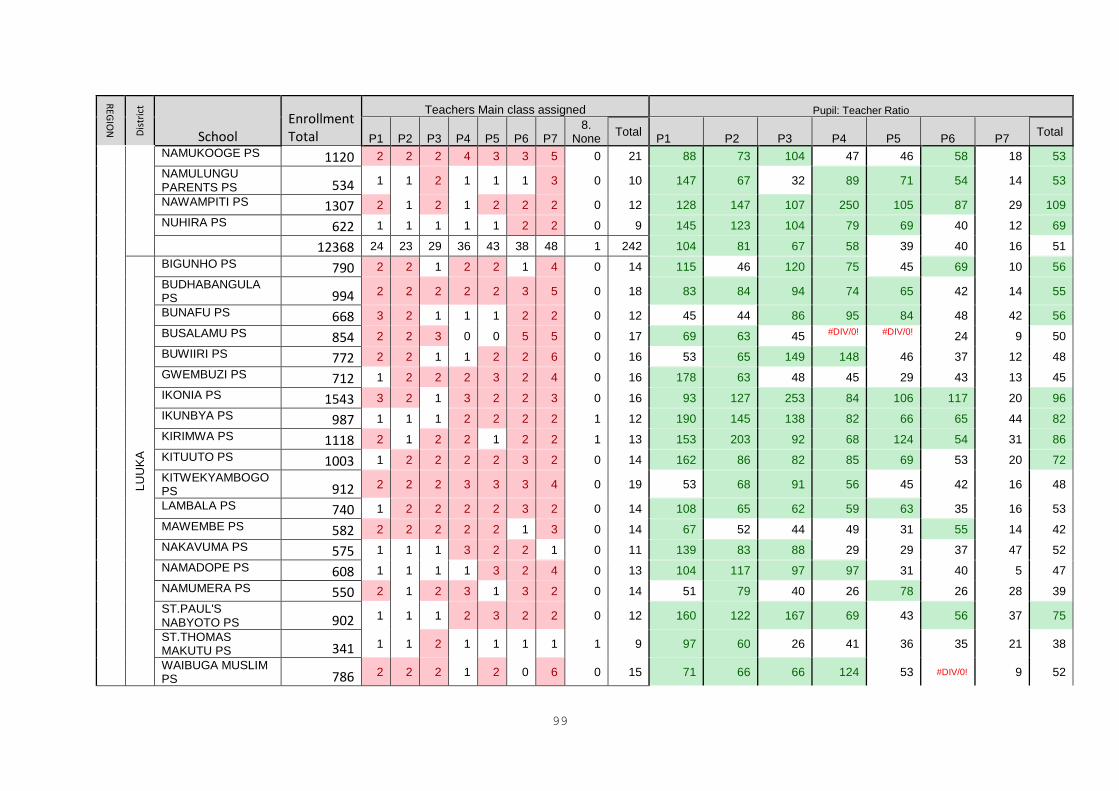
99
REG
ION
Dis
tric
t School
Enrollment Total
Teachers Main class assigned Pupil: Teacher Ratio
P1 P2
P3
P4 P5
P6 P7
8. None
Total P1 P2 P3 P4 P5 P6 P7
Total
NAMUKOOGE PS 1120 2 2 2 4 3 3 5 0 21 88 73 104 47 46 58 18 53
NAMULUNGU PARENTS PS 534 1 1 2 1 1 1 3 0 10 147 67 32 89 71 54 14 53
NAWAMPITI PS 1307 2 1 2 1 2 2 2 0 12 128 147 107 250 105 87 29 109
NUHIRA PS 622 1 1 1 1 1 2 2 0 9 145 123 104 79 69 40 12 69
12368 24 23 29 36 43 38 48 1 242 104 81 67 58 39 40 16 51
LU
UK
A
BIGUNHO PS 790 2 2 1 2 2 1 4 0 14 115 46 120 75 45 69 10 56
BUDHABANGULA PS 994 2 2 2 2 2 3 5 0 18 83 84 94 74 65 42 14 55
BUNAFU PS 668 3 2 1 1 1 2 2 0 12 45 44 86 95 84 48 42 56
BUSALAMU PS 854 2 2 3 0 0 5 5 0 17 69 63 45 #DIV/0! #DIV/0! 24 9 50
BUWIIRI PS 772 2 2 1 1 2 2 6 0 16 53 65 149 148 46 37 12 48
GWEMBUZI PS 712 1 2 2 2 3 2 4 0 16 178 63 48 45 29 43 13 45
IKONIA PS 1543 3 2 1 3 2 2 3 0 16 93 127 253 84 106 117 20 96
IKUNBYA PS 987 1 1 1 2 2 2 2 1 12 190 145 138 82 66 65 44 82
KIRIMWA PS 1118 2 1 2 2 1 2 2 1 13 153 203 92 68 124 54 31 86
KITUUTO PS 1003 1 2 2 2 2 3 2 0 14 162 86 82 85 69 53 20 72
KITWEKYAMBOGO PS 912 2 2 2 3 3 3 4 0 19 53 68 91 56 45 42 16 48
LAMBALA PS 740 1 2 2 2 2 3 2 0 14 108 65 62 59 63 35 16 53
MAWEMBE PS 582 2 2 2 2 2 1 3 0 14 67 52 44 49 31 55 14 42
NAKAVUMA PS 575 1 1 1 3 2 2 1 0 11 139 83 88 29 29 37 47 52
NAMADOPE PS 608 1 1 1 1 3 2 4 0 13 104 117 97 97 31 40 5 47
NAMUMERA PS 550 2 1 2 3 1 3 2 0 14 51 79 40 26 78 26 28 39
ST.PAUL'S NABYOTO PS 902 1 1 1 2 3 2 2 0 12 160 122 167 69 43 56 37 75
ST.THOMAS MAKUTU PS 341 1 1 2 1 1 1 1 1 9 97 60 26 41 36 35 21 38
WAIBUGA MUSLIM PS 786 2 2 2 1 2 0 6 0 15 71 66 66 124 53 #DIV/0! 9 52
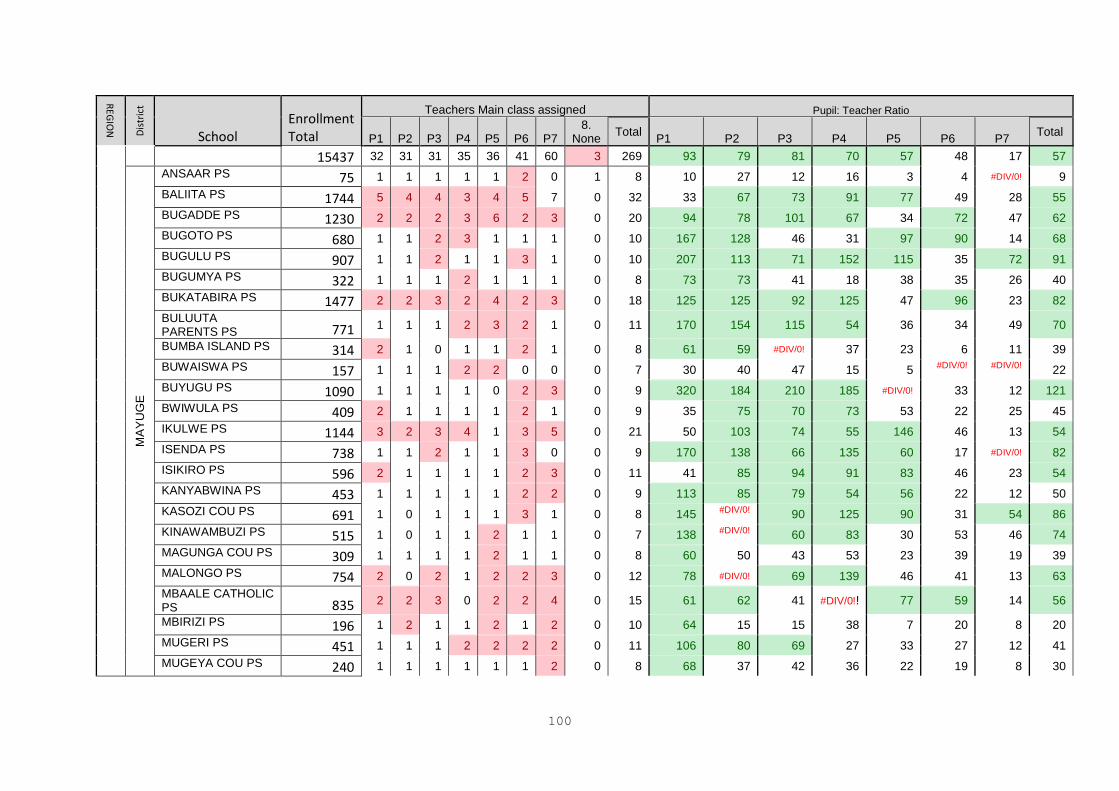
100
REG
ION
Dis
tric
t School
Enrollment Total
Teachers Main class assigned Pupil: Teacher Ratio
P1 P2
P3
P4 P5
P6 P7
8. None
Total P1 P2 P3 P4 P5 P6 P7
Total
15437 32 31 31 35 36 41 60 3 269 93 79 81 70 57 48 17 57
MA
YU
GE
ANSAAR PS 75 1 1 1 1 1 2 0 1 8 10 27 12 16 3 4 #DIV/0! 9
BALIITA PS 1744 5 4 4 3 4 5 7 0 32 33 67 73 91 77 49 28 55
BUGADDE PS 1230 2 2 2 3 6 2 3 0 20 94 78 101 67 34 72 47 62
BUGOTO PS 680 1 1 2 3 1 1 1 0 10 167 128 46 31 97 90 14 68
BUGULU PS 907 1 1 2 1 1 3 1 0 10 207 113 71 152 115 35 72 91
BUGUMYA PS 322 1 1 1 2 1 1 1 0 8 73 73 41 18 38 35 26 40
BUKATABIRA PS 1477 2 2 3 2 4 2 3 0 18 125 125 92 125 47 96 23 82
BULUUTA PARENTS PS 771 1 1 1 2 3 2 1 0 11 170 154 115 54 36 34 49 70
BUMBA ISLAND PS 314 2 1 0 1 1 2 1 0 8 61 59 #DIV/0! 37 23 6 11 39
BUWAISWA PS 157 1 1 1 2 2 0 0 0 7 30 40 47 15 5 #DIV/0! #DIV/0! 22
BUYUGU PS 1090 1 1 1 1 0 2 3 0 9 320 184 210 185 #DIV/0! 33 12 121
BWIWULA PS 409 2 1 1 1 1 2 1 0 9 35 75 70 73 53 22 25 45
IKULWE PS 1144 3 2 3 4 1 3 5 0 21 50 103 74 55 146 46 13 54
ISENDA PS 738 1 1 2 1 1 3 0 0 9 170 138 66 135 60 17 #DIV/0! 82
ISIKIRO PS 596 2 1 1 1 1 2 3 0 11 41 85 94 91 83 46 23 54
KANYABWINA PS 453 1 1 1 1 1 2 2 0 9 113 85 79 54 56 22 12 50
KASOZI COU PS 691 1 0 1 1 1 3 1 0 8 145 #DIV/0! 90 125 90 31 54 86
KINAWAMBUZI PS 515 1 0 1 1 2 1 1 0 7 138 #DIV/0! 60 83 30 53 46 74
MAGUNGA COU PS 309 1 1 1 1 2 1 1 0 8 60 50 43 53 23 39 19 39
MALONGO PS 754 2 0 2 1 2 2 3 0 12 78 #DIV/0! 69 139 46 41 13 63
MBAALE CATHOLIC PS 835 2 2 3 0 2 2 4 0 15 61 62 41 #DIV/0!! 77 59 14 56
MBIRIZI PS 196 1 2 1 1 2 1 2 0 10 64 15 15 38 7 20 8 20
MUGERI PS 451 1 1 1 2 2 2 2 0 11 106 80 69 27 33 27 12 41
MUGEYA COU PS 240 1 1 1 1 1 1 2 0 8 68 37 42 36 22 19 8 30
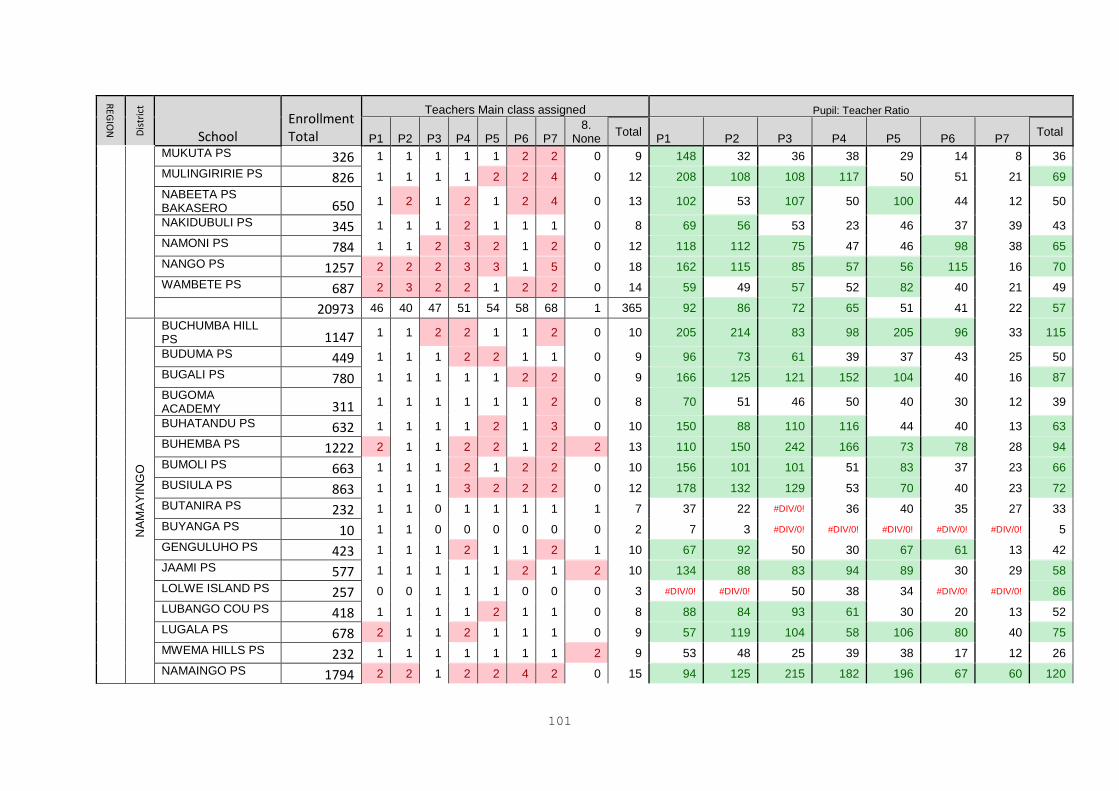
101
REG
ION
Dis
tric
t School
Enrollment Total
Teachers Main class assigned Pupil: Teacher Ratio
P1 P2
P3
P4 P5
P6 P7
8. None
Total P1 P2 P3 P4 P5 P6 P7
Total
MUKUTA PS 326 1 1 1 1 1 2 2 0 9 148 32 36 38 29 14 8 36
MULINGIRIRIE PS 826 1 1 1 1 2 2 4 0 12 208 108 108 117 50 51 21 69
NABEETA PS BAKASERO 650 1 2 1 2 1 2 4 0 13 102 53 107 50 100 44 12 50
NAKIDUBULI PS 345 1 1 1 2 1 1 1 0 8 69 56 53 23 46 37 39 43
NAMONI PS 784 1 1 2 3 2 1 2 0 12 118 112 75 47 46 98 38 65
NANGO PS 1257 2 2 2 3 3 1 5 0 18 162 115 85 57 56 115 16 70
WAMBETE PS 687 2 3 2 2 1 2 2 0 14 59 49 57 52 82 40 21 49
20973 46 40 47 51 54 58 68 1 365 92 86 72 65 51 41 22 57
NA
MA
YIN
GO
BUCHUMBA HILL PS 1147 1 1 2 2 1 1 2 0 10 205 214 83 98 205 96 33 115
BUDUMA PS 449 1 1 1 2 2 1 1 0 9 96 73 61 39 37 43 25 50
BUGALI PS 780 1 1 1 1 1 2 2 0 9 166 125 121 152 104 40 16 87
BUGOMA ACADEMY 311 1 1 1 1 1 1 2 0 8 70 51 46 50 40 30 12 39
BUHATANDU PS 632 1 1 1 1 2 1 3 0 10 150 88 110 116 44 40 13 63
BUHEMBA PS 1222 2 1 1 2 2 1 2 2 13 110 150 242 166 73 78 28 94
BUMOLI PS 663 1 1 1 2 1 2 2 0 10 156 101 101 51 83 37 23 66
BUSIULA PS 863 1 1 1 3 2 2 2 0 12 178 132 129 53 70 40 23 72
BUTANIRA PS 232 1 1 0 1 1 1 1 1 7 37 22 #DIV/0! 36 40 35 27 33
BUYANGA PS 10 1 1 0 0 0 0 0 0 2 7 3 #DIV/0! #DIV/0! #DIV/0! #DIV/0! #DIV/0! 5
GENGULUHO PS 423 1 1 1 2 1 1 2 1 10 67 92 50 30 67 61 13 42
JAAMI PS 577 1 1 1 1 1 2 1 2 10 134 88 83 94 89 30 29 58
LOLWE ISLAND PS 257 0 0 1 1 1 0 0 0 3 #DIV/0! #DIV/0! 50 38 34 #DIV/0! #DIV/0! 86
LUBANGO COU PS 418 1 1 1 1 2 1 1 0 8 88 84 93 61 30 20 13 52
LUGALA PS 678 2 1 1 2 1 1 1 0 9 57 119 104 58 106 80 40 75
MWEMA HILLS PS 232 1 1 1 1 1 1 1 2 9 53 48 25 39 38 17 12 26
NAMAINGO PS 1794 2 2 1 2 2 4 2 0 15 94 125 215 182 196 67 60 120
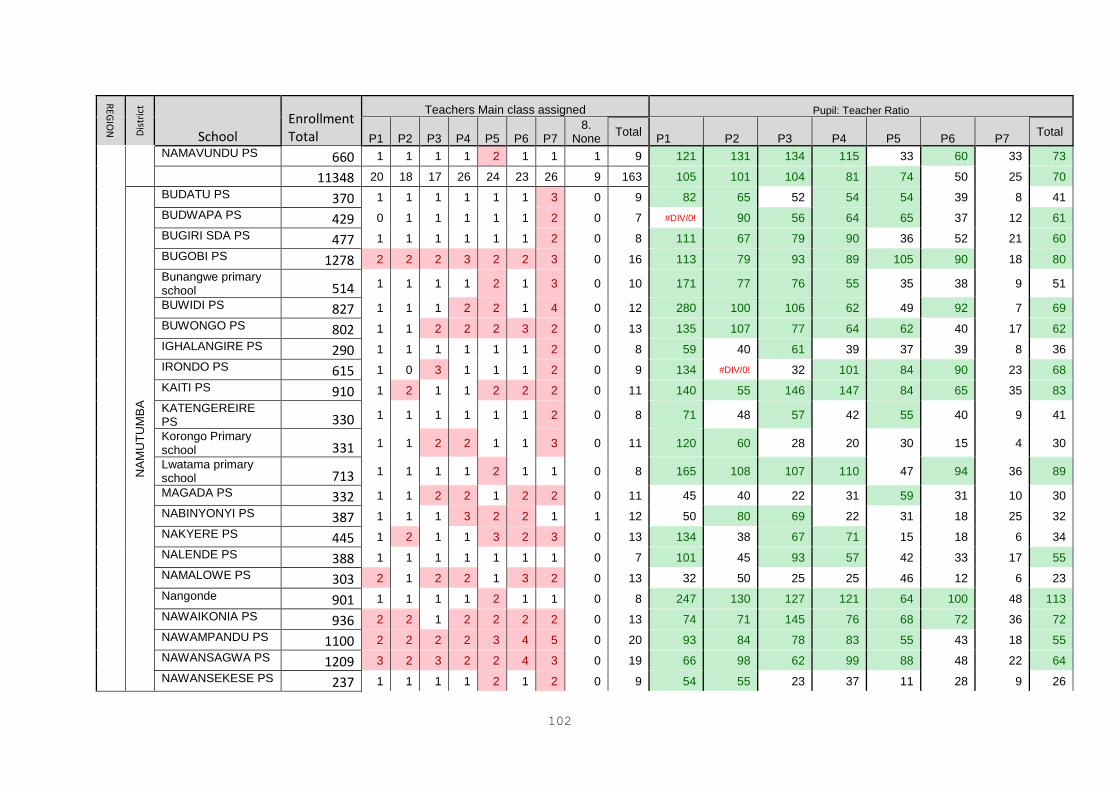
102
REG
ION
Dis
tric
t School
Enrollment Total
Teachers Main class assigned Pupil: Teacher Ratio
P1 P2
P3
P4 P5
P6 P7
8. None
Total P1 P2 P3 P4 P5 P6 P7
Total
NAMAVUNDU PS 660 1 1 1 1 2 1 1 1 9 121 131 134 115 33 60 33 73
11348 20 18 17 26 24 23 26 9 163 105 101 104 81 74 50 25 70
NA
MU
TU
MB
A
BUDATU PS 370 1 1 1 1 1 1 3 0 9 82 65 52 54 54 39 8 41
BUDWAPA PS 429 0 1 1 1 1 1 2 0 7 #DIV/0! 90 56 64 65 37 12 61
BUGIRI SDA PS 477 1 1 1 1 1 1 2 0 8 111 67 79 90 36 52 21 60
BUGOBI PS 1278 2 2 2 3 2 2 3 0 16 113 79 93 89 105 90 18 80
Bunangwe primary school 514 1 1 1 1 2 1 3 0 10 171 77 76 55 35 38 9 51
BUWIDI PS 827 1 1 1 2 2 1 4 0 12 280 100 106 62 49 92 7 69
BUWONGO PS 802 1 1 2 2 2 3 2 0 13 135 107 77 64 62 40 17 62
IGHALANGIRE PS 290 1 1 1 1 1 1 2 0 8 59 40 61 39 37 39 8 36
IRONDO PS 615 1 0 3 1 1 1 2 0 9 134 #DIV/0! 32 101 84 90 23 68
KAITI PS 910 1 2 1 1 2 2 2 0 11 140 55 146 147 84 65 35 83
KATENGEREIRE PS 330 1 1 1 1 1 1 2 0 8 71 48 57 42 55 40 9 41
Korongo Primary school 331 1 1 2 2 1 1 3 0 11 120 60 28 20 30 15 4 30
Lwatama primary school 713 1 1 1 1 2 1 1 0 8 165 108 107 110 47 94 36 89
MAGADA PS 332 1 1 2 2 1 2 2 0 11 45 40 22 31 59 31 10 30
NABINYONYI PS 387 1 1 1 3 2 2 1 1 12 50 80 69 22 31 18 25 32
NAKYERE PS 445 1 2 1 1 3 2 3 0 13 134 38 67 71 15 18 6 34
NALENDE PS 388 1 1 1 1 1 1 1 0 7 101 45 93 57 42 33 17 55
NAMALOWE PS 303 2 1 2 2 1 3 2 0 13 32 50 25 25 46 12 6 23
Nangonde 901 1 1 1 1 2 1 1 0 8 247 130 127 121 64 100 48 113
NAWAIKONIA PS 936 2 2 1 2 2 2 2 0 13 74 71 145 76 68 72 36 72
NAWAMPANDU PS 1100 2 2 2 2 3 4 5 0 20 93 84 78 83 55 43 18 55
NAWANSAGWA PS 1209 3 2 3 2 2 4 3 0 19 66 98 62 99 88 48 22 64
NAWANSEKESE PS 237 1 1 1 1 2 1 2 0 9 54 55 23 37 11 28 9 26
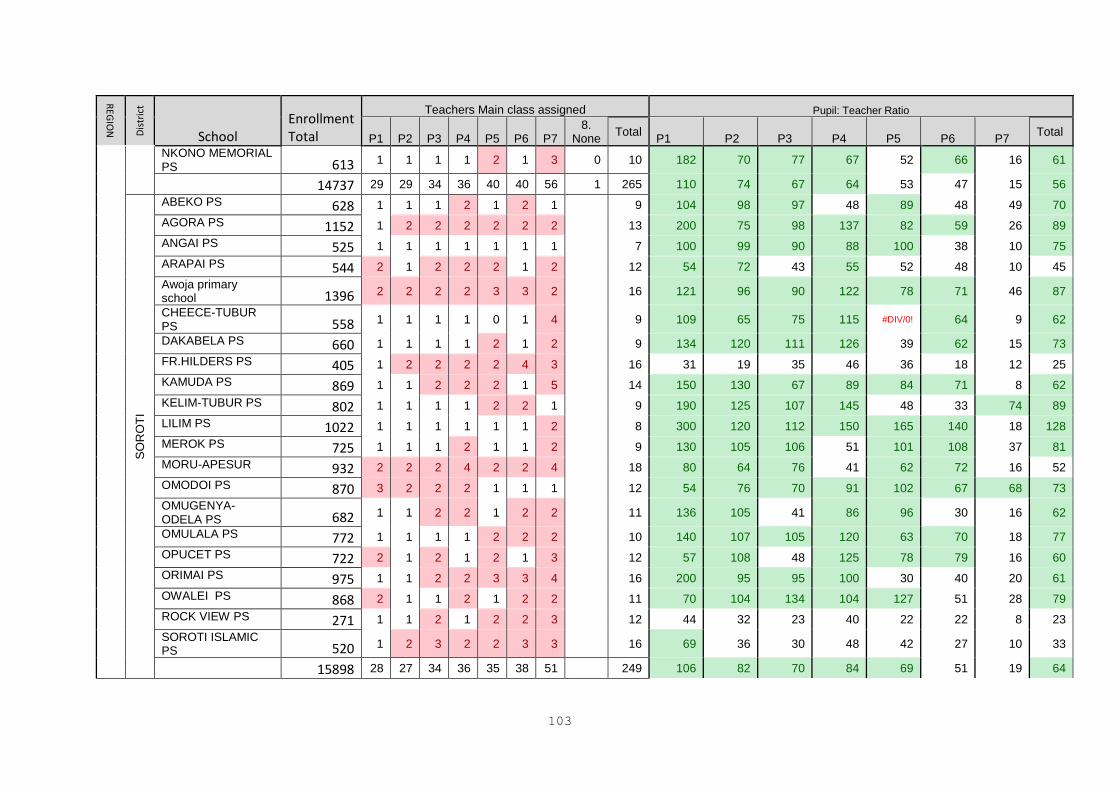
103
REG
ION
Dis
tric
t School
Enrollment Total
Teachers Main class assigned Pupil: Teacher Ratio
P1 P2
P3
P4 P5
P6 P7
8. None
Total P1 P2 P3 P4 P5 P6 P7
Total
NKONO MEMORIAL PS 613 1 1 1 1 2 1 3 0 10 182 70 77 67 52 66 16 61
14737 29 29 34 36 40 40 56 1 265 110 74 67 64 53 47 15 56
SO
RO
TI
ABEKO PS 628 1 1 1 2 1 2 1 9 104 98 97 48 89 48 49 70
AGORA PS 1152 1 2 2 2 2 2 2 13 200 75 98 137 82 59 26 89
ANGAI PS 525 1 1 1 1 1 1 1 7 100 99 90 88 100 38 10 75
ARAPAI PS 544 2 1 2 2 2 1 2 12 54 72 43 55 52 48 10 45
Awoja primary school 1396 2 2 2 2 3 3 2 16 121 96 90 122 78 71 46 87
CHEECE-TUBUR PS 558 1 1 1 1 0 1 4 9 109 65 75 115 #DIV/0! 64 9 62
DAKABELA PS 660 1 1 1 1 2 1 2 9 134 120 111 126 39 62 15 73
FR.HILDERS PS 405 1 2 2 2 2 4 3 16 31 19 35 46 36 18 12 25
KAMUDA PS 869 1 1 2 2 2 1 5 14 150 130 67 89 84 71 8 62
KELIM-TUBUR PS 802 1 1 1 1 2 2 1 9 190 125 107 145 48 33 74 89
LILIM PS 1022 1 1 1 1 1 1 2 8 300 120 112 150 165 140 18 128
MEROK PS 725 1 1 1 2 1 1 2 9 130 105 106 51 101 108 37 81
MORU-APESUR 932 2 2 2 4 2 2 4 18 80 64 76 41 62 72 16 52
OMODOI PS 870 3 2 2 2 1 1 1 12 54 76 70 91 102 67 68 73
OMUGENYA-ODELA PS 682 1 1 2 2 1 2 2 11 136 105 41 86 96 30 16 62
OMULALA PS 772 1 1 1 1 2 2 2 10 140 107 105 120 63 70 18 77
OPUCET PS 722 2 1 2 1 2 1 3 12 57 108 48 125 78 79 16 60
ORIMAI PS 975 1 1 2 2 3 3 4 16 200 95 95 100 30 40 20 61
OWALEI PS 868 2 1 1 2 1 2 2 11 70 104 134 104 127 51 28 79
ROCK VIEW PS 271 1 1 2 1 2 2 3 12 44 32 23 40 22 22 8 23
SOROTI ISLAMIC PS 520 1 2 3 2 2 3 3 16 69 36 30 48 42 27 10 33
15898 28 27 34 36 35 38 51 249 106 82 70 84 69 51 19 64
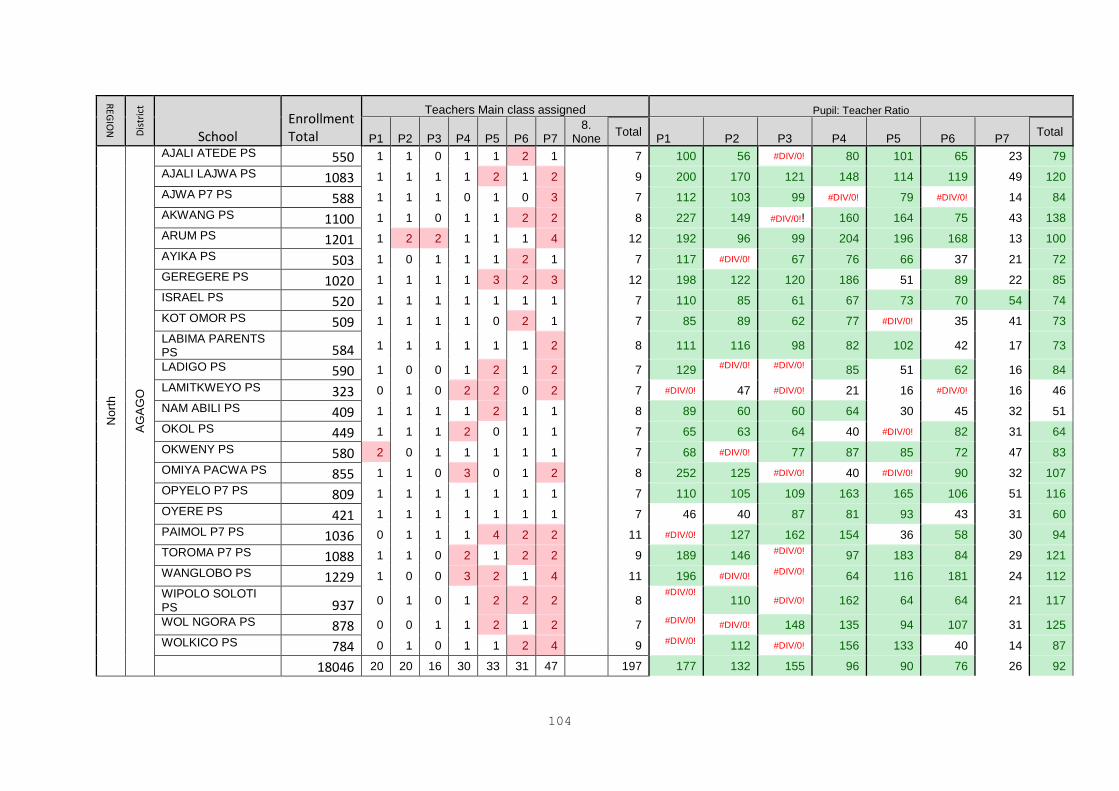
104
REG
ION
Dis
tric
t School
Enrollment Total
Teachers Main class assigned Pupil: Teacher Ratio
P1 P2
P3
P4 P5
P6 P7
8. None
Total P1 P2 P3 P4 P5 P6 P7
Total
Nort
h
AG
AG
O
AJALI ATEDE PS 550 1 1 0 1 1 2 1 7 100 56 #DIV/0! 80 101 65 23 79
AJALI LAJWA PS 1083 1 1 1 1 2 1 2 9 200 170 121 148 114 119 49 120
AJWA P7 PS 588 1 1 1 0 1 0 3 7 112 103 99 #DIV/0! 79 #DIV/0! 14 84
AKWANG PS 1100 1 1 0 1 1 2 2 8 227 149 #DIV/0!! 160 164 75 43 138
ARUM PS 1201 1 2 2 1 1 1 4 12 192 96 99 204 196 168 13 100
AYIKA PS 503 1 0 1 1 1 2 1 7 117 #DIV/0! 67 76 66 37 21 72
GEREGERE PS 1020 1 1 1 1 3 2 3 12 198 122 120 186 51 89 22 85
ISRAEL PS 520 1 1 1 1 1 1 1 7 110 85 61 67 73 70 54 74
KOT OMOR PS 509 1 1 1 1 0 2 1 7 85 89 62 77 #DIV/0! 35 41 73
LABIMA PARENTS PS 584 1 1 1 1 1 1 2 8 111 116 98 82 102 42 17 73
LADIGO PS 590 1 0 0 1 2 1 2 7 129 #DIV/0! #DIV/0! 85 51 62 16 84
LAMITKWEYO PS 323 0 1 0 2 2 0 2 7 #DIV/0! 47 #DIV/0! 21 16 #DIV/0! 16 46
NAM ABILI PS 409 1 1 1 1 2 1 1 8 89 60 60 64 30 45 32 51
OKOL PS 449 1 1 1 2 0 1 1 7 65 63 64 40 #DIV/0! 82 31 64
OKWENY PS 580 2 0 1 1 1 1 1 7 68 #DIV/0! 77 87 85 72 47 83
OMIYA PACWA PS 855 1 1 0 3 0 1 2 8 252 125 #DIV/0! 40 #DIV/0! 90 32 107
OPYELO P7 PS 809 1 1 1 1 1 1 1 7 110 105 109 163 165 106 51 116
OYERE PS 421 1 1 1 1 1 1 1 7 46 40 87 81 93 43 31 60
PAIMOL P7 PS 1036 0 1 1 1 4 2 2 11 #DIV/0! 127 162 154 36 58 30 94
TOROMA P7 PS 1088 1 1 0 2 1 2 2 9 189 146 #DIV/0! 97 183 84 29 121
WANGLOBO PS 1229 1 0 0 3 2 1 4 11 196 #DIV/0! #DIV/0! 64 116 181 24 112
WIPOLO SOLOTI PS 937 0 1 0 1 2 2 2 8
#DIV/0! 110 #DIV/0! 162 64 64 21 117
WOL NGORA PS 878 0 0 1 1 2 1 2 7 #DIV/0! #DIV/0! 148 135 94 107 31 125
WOLKICO PS 784 0 1 0 1 1 2 4 9 #DIV/0! 112 #DIV/0! 156 133 40 14 87
18046 20 20 16 30 33 31 47 197 177 132 155 96 90 76 26 92
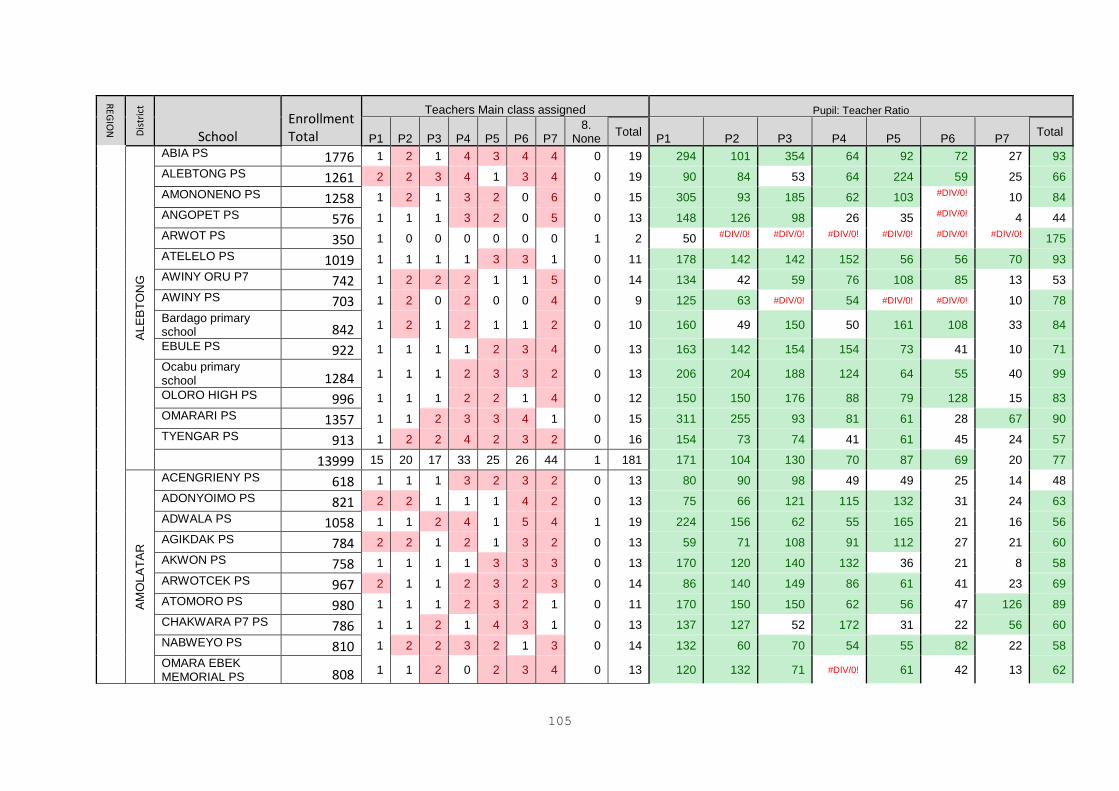
105
REG
ION
Dis
tric
t School
Enrollment Total
Teachers Main class assigned Pupil: Teacher Ratio
P1 P2
P3
P4 P5
P6 P7
8. None
Total P1 P2 P3 P4 P5 P6 P7
Total A
LE
BT
ON
G
ABIA PS 1776 1 2 1 4 3 4 4 0 19 294 101 354 64 92 72 27 93
ALEBTONG PS 1261 2 2 3 4 1 3 4 0 19 90 84 53 64 224 59 25 66
AMONONENO PS 1258 1 2 1 3 2 0 6 0 15 305 93 185 62 103 #DIV/0! 10 84
ANGOPET PS 576 1 1 1 3 2 0 5 0 13 148 126 98 26 35 #DIV/0! 4 44
ARWOT PS 350 1 0 0 0 0 0 0 1 2 50 #DIV/0! #DIV/0! #DIV/0! #DIV/0! #DIV/0! #DIV/0! 175
ATELELO PS 1019 1 1 1 1 3 3 1 0 11 178 142 142 152 56 56 70 93
AWINY ORU P7 742 1 2 2 2 1 1 5 0 14 134 42 59 76 108 85 13 53
AWINY PS 703 1 2 0 2 0 0 4 0 9 125 63 #DIV/0! 54 #DIV/0! #DIV/0! 10 78
Bardago primary school 842 1 2 1 2 1 1 2 0 10 160 49 150 50 161 108 33 84
EBULE PS 922 1 1 1 1 2 3 4 0 13 163 142 154 154 73 41 10 71
Ocabu primary school 1284 1 1 1 2 3 3 2 0 13 206 204 188 124 64 55 40 99
OLORO HIGH PS 996 1 1 1 2 2 1 4 0 12 150 150 176 88 79 128 15 83
OMARARI PS 1357 1 1 2 3 3 4 1 0 15 311 255 93 81 61 28 67 90
TYENGAR PS 913 1 2 2 4 2 3 2 0 16 154 73 74 41 61 45 24 57
13999 15 20 17 33 25 26 44 1 181 171 104 130 70 87 69 20 77
AM
OL
AT
AR
ACENGRIENY PS 618 1 1 1 3 2 3 2 0 13 80 90 98 49 49 25 14 48
ADONYOIMO PS 821 2 2 1 1 1 4 2 0 13 75 66 121 115 132 31 24 63
ADWALA PS 1058 1 1 2 4 1 5 4 1 19 224 156 62 55 165 21 16 56
AGIKDAK PS 784 2 2 1 2 1 3 2 0 13 59 71 108 91 112 27 21 60
AKWON PS 758 1 1 1 1 3 3 3 0 13 170 120 140 132 36 21 8 58
ARWOTCEK PS 967 2 1 1 2 3 2 3 0 14 86 140 149 86 61 41 23 69
ATOMORO PS 980 1 1 1 2 3 2 1 0 11 170 150 150 62 56 47 126 89
CHAKWARA P7 PS 786 1 1 2 1 4 3 1 0 13 137 127 52 172 31 22 56 60
NABWEYO PS 810 1 2 2 3 2 1 3 0 14 132 60 70 54 55 82 22 58
OMARA EBEK MEMORIAL PS 808 1 1 2 0 2 3 4 0 13 120 132 71 #DIV/0! 61 42 13 62
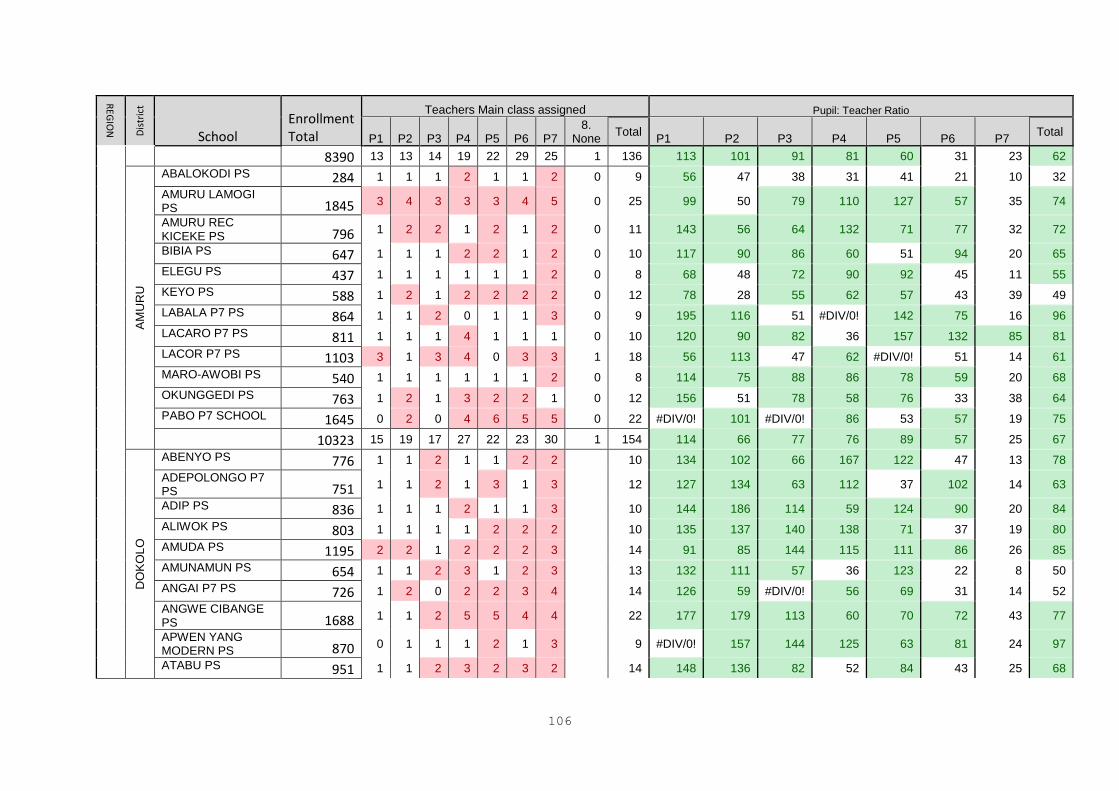
106
REG
ION
Dis
tric
t School
Enrollment Total
Teachers Main class assigned Pupil: Teacher Ratio
P1 P2
P3
P4 P5
P6 P7
8. None
Total P1 P2 P3 P4 P5 P6 P7
Total
8390 13 13 14 19 22 29 25 1 136 113 101 91 81 60 31 23 62
AM
UR
U
ABALOKODI PS 284 1 1 1 2 1 1 2 0 9 56 47 38 31 41 21 10 32
AMURU LAMOGI PS 1845 3 4 3 3 3 4 5 0 25 99 50 79 110 127 57 35 74
AMURU REC KICEKE PS 796 1 2 2 1 2 1 2 0 11 143 56 64 132 71 77 32 72
BIBIA PS 647 1 1 1 2 2 1 2 0 10 117 90 86 60 51 94 20 65
ELEGU PS 437 1 1 1 1 1 1 2 0 8 68 48 72 90 92 45 11 55
KEYO PS 588 1 2 1 2 2 2 2 0 12 78 28 55 62 57 43 39 49
LABALA P7 PS 864 1 1 2 0 1 1 3 0 9 195 116 51 #DIV/0! 142 75 16 96
LACARO P7 PS 811 1 1 1 4 1 1 1 0 10 120 90 82 36 157 132 85 81
LACOR P7 PS 1103 3 1 3 4 0 3 3 1 18 56 113 47 62 #DIV/0! 51 14 61
MARO-AWOBI PS 540 1 1 1 1 1 1 2 0 8 114 75 88 86 78 59 20 68
OKUNGGEDI PS 763 1 2 1 3 2 2 1 0 12 156 51 78 58 76 33 38 64
PABO P7 SCHOOL 1645 0 2 0 4 6 5 5 0 22 #DIV/0! 101 #DIV/0! 86 53 57 19 75
10323 15 19 17 27 22 23 30 1 154 114 66 77 76 89 57 25 67
DO
KO
LO
ABENYO PS 776 1 1 2 1 1 2 2 10 134 102 66 167 122 47 13 78
ADEPOLONGO P7 PS 751 1 1 2 1 3 1 3 12 127 134 63 112 37 102 14 63
ADIP PS 836 1 1 1 2 1 1 3 10 144 186 114 59 124 90 20 84
ALIWOK PS 803 1 1 1 1 2 2 2 10 135 137 140 138 71 37 19 80
AMUDA PS 1195 2 2 1 2 2 2 3 14 91 85 144 115 111 86 26 85
AMUNAMUN PS 654 1 1 2 3 1 2 3 13 132 111 57 36 123 22 8 50
ANGAI P7 PS 726 1 2 0 2 2 3 4 14 126 59 #DIV/0! 56 69 31 14 52
ANGWE CIBANGE PS 1688 1 1 2 5 5 4 4 22 177 179 113 60 70 72 43 77
APWEN YANG MODERN PS 870 0 1 1 1 2 1 3 9 #DIV/0! 157 144 125 63 81 24 97
ATABU PS 951 1 1 2 3 2 3 2 14 148 136 82 52 84 43 25 68
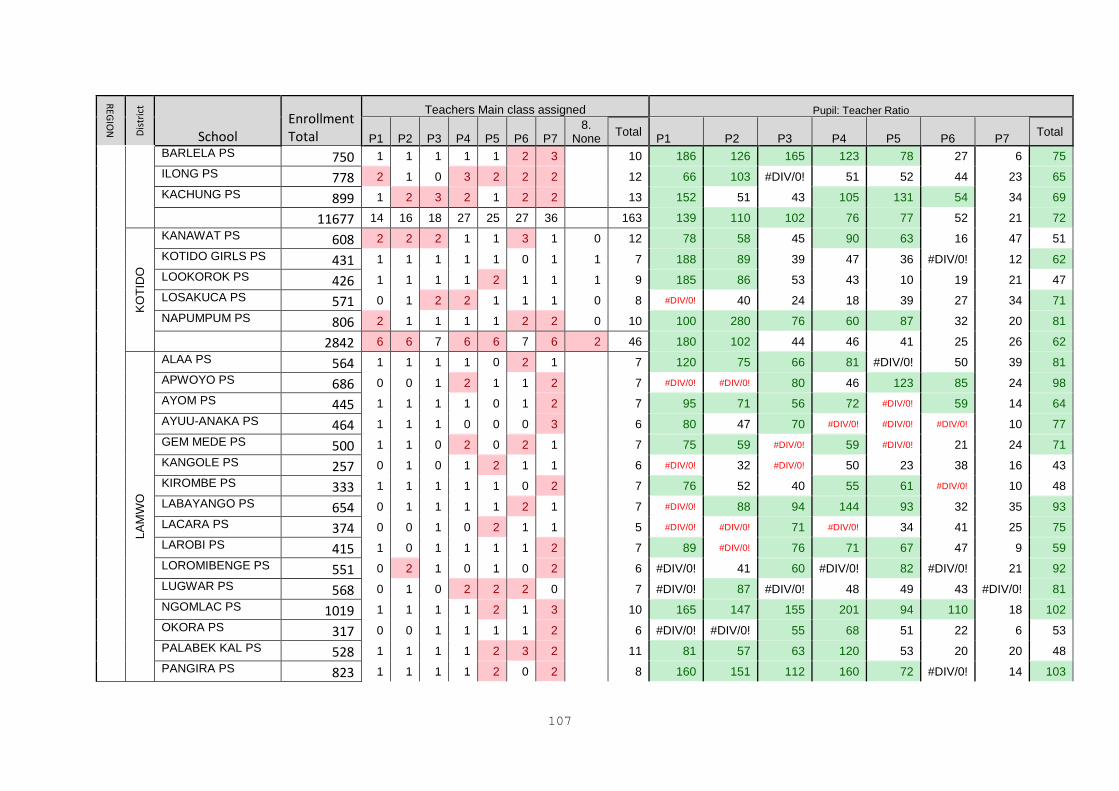
107
REG
ION
Dis
tric
t School
Enrollment Total
Teachers Main class assigned Pupil: Teacher Ratio
P1 P2
P3
P4 P5
P6 P7
8. None
Total P1 P2 P3 P4 P5 P6 P7
Total
BARLELA PS 750 1 1 1 1 1 2 3 10 186 126 165 123 78 27 6 75
ILONG PS 778 2 1 0 3 2 2 2 12 66 103 #DIV/0! 51 52 44 23 65
KACHUNG PS 899 1 2 3 2 1 2 2 13 152 51 43 105 131 54 34 69
11677 14 16 18 27 25 27 36 163 139 110 102 76 77 52 21 72
KO
TID
O
KANAWAT PS 608 2 2 2 1 1 3 1 0 12 78 58 45 90 63 16 47 51
KOTIDO GIRLS PS 431 1 1 1 1 1 0 1 1 7 188 89 39 47 36 #DIV/0! 12 62
LOOKOROK PS 426 1 1 1 1 2 1 1 1 9 185 86 53 43 10 19 21 47
LOSAKUCA PS 571 0 1 2 2 1 1 1 0 8 #DIV/0! 40 24 18 39 27 34 71
NAPUMPUM PS 806 2 1 1 1 1 2 2 0 10 100 280 76 60 87 32 20 81
2842 6 6 7 6 6 7 6 2 46 180 102 44 46 41 25 26 62
LA
MW
O
ALAA PS 564 1 1 1 1 0 2 1 7 120 75 66 81 #DIV/0! 50 39 81
APWOYO PS 686 0 0 1 2 1 1 2 7 #DIV/0! #DIV/0! 80 46 123 85 24 98
AYOM PS 445 1 1 1 1 0 1 2 7 95 71 56 72 #DIV/0! 59 14 64
AYUU-ANAKA PS 464 1 1 1 0 0 0 3 6 80 47 70 #DIV/0! #DIV/0! #DIV/0! 10 77
GEM MEDE PS 500 1 1 0 2 0 2 1 7 75 59 #DIV/0! 59 #DIV/0! 21 24 71
KANGOLE PS 257 0 1 0 1 2 1 1 6 #DIV/0! 32 #DIV/0! 50 23 38 16 43
KIROMBE PS 333 1 1 1 1 1 0 2 7 76 52 40 55 61 #DIV/0! 10 48
LABAYANGO PS 654 0 1 1 1 1 2 1 7 #DIV/0! 88 94 144 93 32 35 93
LACARA PS 374 0 0 1 0 2 1 1 5 #DIV/0! #DIV/0! 71 #DIV/0! 34 41 25 75
LAROBI PS 415 1 0 1 1 1 1 2 7 89 #DIV/0! 76 71 67 47 9 59
LOROMIBENGE PS 551 0 2 1 0 1 0 2 6 #DIV/0! 41 60 #DIV/0! 82 #DIV/0! 21 92
LUGWAR PS 568 0 1 0 2 2 2 0 7 #DIV/0! 87 #DIV/0! 48 49 43 #DIV/0! 81
NGOMLAC PS 1019 1 1 1 1 2 1 3 10 165 147 155 201 94 110 18 102
OKORA PS 317 0 0 1 1 1 1 2 6 #DIV/0! #DIV/0! 55 68 51 22 6 53
PALABEK KAL PS 528 1 1 1 1 2 3 2 11 81 57 63 120 53 20 20 48
PANGIRA PS 823 1 1 1 1 2 0 2 8 160 151 112 160 72 #DIV/0! 14 103
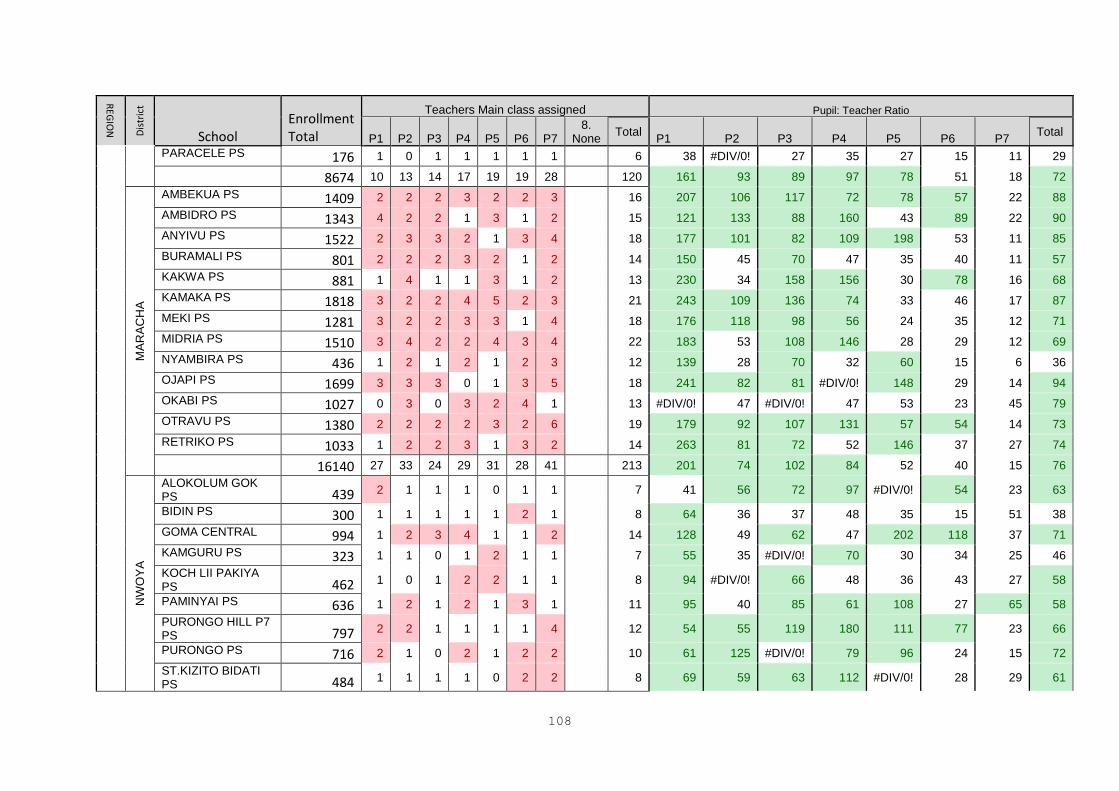
108
REG
ION
Dis
tric
t School
Enrollment Total
Teachers Main class assigned Pupil: Teacher Ratio
P1 P2
P3
P4 P5
P6 P7
8. None
Total P1 P2 P3 P4 P5 P6 P7
Total
PARACELE PS 176 1 0 1 1 1 1 1 6 38 #DIV/0! 27 35 27 15 11 29
8674 10 13 14 17 19 19 28 120 161 93 89 97 78 51 18 72
MA
RA
CH
A
AMBEKUA PS 1409 2 2 2 3 2 2 3 16 207 106 117 72 78 57 22 88
AMBIDRO PS 1343 4 2 2 1 3 1 2 15 121 133 88 160 43 89 22 90
ANYIVU PS 1522 2 3 3 2 1 3 4 18 177 101 82 109 198 53 11 85
BURAMALI PS 801 2 2 2 3 2 1 2 14 150 45 70 47 35 40 11 57
KAKWA PS 881 1 4 1 1 3 1 2 13 230 34 158 156 30 78 16 68
KAMAKA PS 1818 3 2 2 4 5 2 3 21 243 109 136 74 33 46 17 87
MEKI PS 1281 3 2 2 3 3 1 4 18 176 118 98 56 24 35 12 71
MIDRIA PS 1510 3 4 2 2 4 3 4 22 183 53 108 146 28 29 12 69
NYAMBIRA PS 436 1 2 1 2 1 2 3 12 139 28 70 32 60 15 6 36
OJAPI PS 1699 3 3 3 0 1 3 5 18 241 82 81 #DIV/0! 148 29 14 94
OKABI PS 1027 0 3 0 3 2 4 1 13 #DIV/0! 47 #DIV/0! 47 53 23 45 79
OTRAVU PS 1380 2 2 2 2 3 2 6 19 179 92 107 131 57 54 14 73
RETRIKO PS 1033 1 2 2 3 1 3 2 14 263 81 72 52 146 37 27 74
16140 27 33 24 29 31 28 41 213 201 74 102 84 52 40 15 76
NW
OY
A
ALOKOLUM GOK PS 439 2 1 1 1 0 1 1 7 41 56 72 97 #DIV/0! 54 23 63
BIDIN PS 300 1 1 1 1 1 2 1 8 64 36 37 48 35 15 51 38
GOMA CENTRAL 994 1 2 3 4 1 1 2 14 128 49 62 47 202 118 37 71
KAMGURU PS 323 1 1 0 1 2 1 1 7 55 35 #DIV/0! 70 30 34 25 46
KOCH LII PAKIYA PS 462 1 0 1 2 2 1 1 8 94 #DIV/0! 66 48 36 43 27 58
PAMINYAI PS 636 1 2 1 2 1 3 1 11 95 40 85 61 108 27 65 58
PURONGO HILL P7 PS 797 2 2 1 1 1 1 4 12 54 55 119 180 111 77 23 66
PURONGO PS 716 2 1 0 2 1 2 2 10 61 125 #DIV/0! 79 96 24 15 72
ST.KIZITO BIDATI PS 484 1 1 1 1 0 2 2 8 69 59 63 112 #DIV/0! 28 29 61
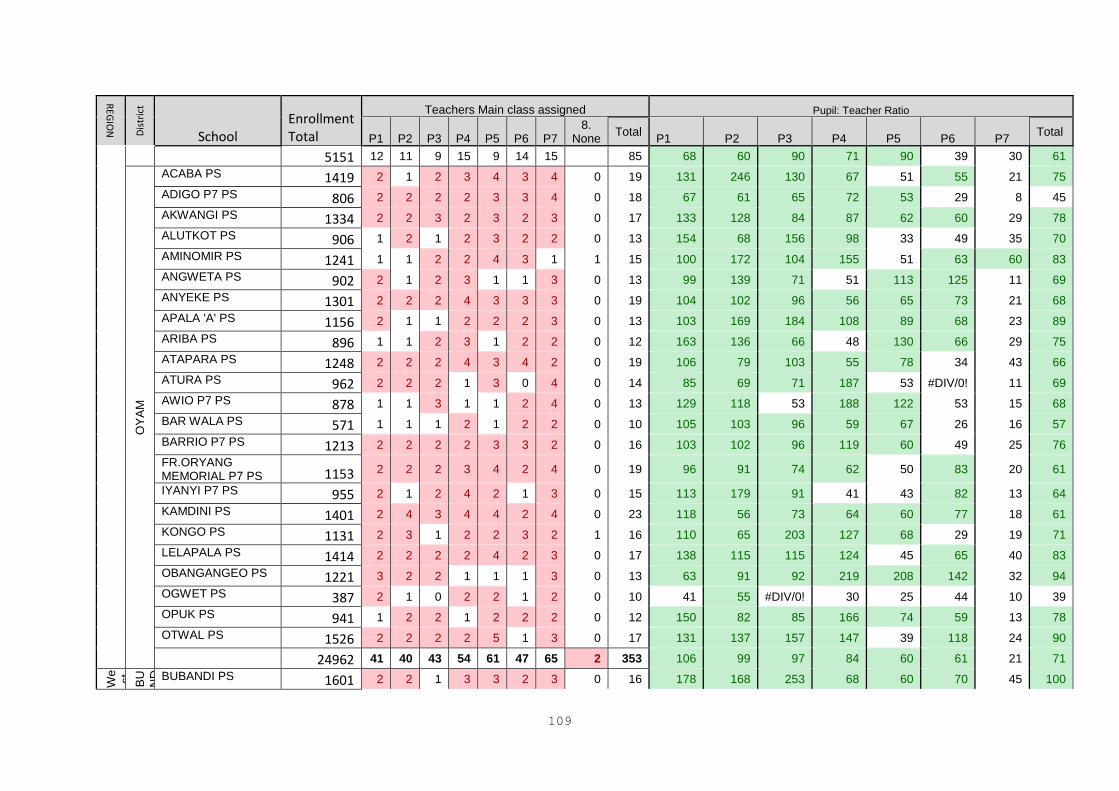
109
REG
ION
Dis
tric
t School
Enrollment Total
Teachers Main class assigned Pupil: Teacher Ratio
P1 P2
P3
P4 P5
P6 P7
8. None
Total P1 P2 P3 P4 P5 P6 P7
Total
5151 12 11 9 15 9 14 15 85 68 60 90 71 90 39 30 61
OY
AM
ACABA PS 1419 2 1 2 3 4 3 4 0 19 131 246 130 67 51 55 21 75
ADIGO P7 PS 806 2 2 2 2 3 3 4 0 18 67 61 65 72 53 29 8 45
AKWANGI PS 1334 2 2 3 2 3 2 3 0 17 133 128 84 87 62 60 29 78
ALUTKOT PS 906 1 2 1 2 3 2 2 0 13 154 68 156 98 33 49 35 70
AMINOMIR PS 1241 1 1 2 2 4 3 1 1 15 100 172 104 155 51 63 60 83
ANGWETA PS 902 2 1 2 3 1 1 3 0 13 99 139 71 51 113 125 11 69
ANYEKE PS 1301 2 2 2 4 3 3 3 0 19 104 102 96 56 65 73 21 68
APALA 'A' PS 1156 2 1 1 2 2 2 3 0 13 103 169 184 108 89 68 23 89
ARIBA PS 896 1 1 2 3 1 2 2 0 12 163 136 66 48 130 66 29 75
ATAPARA PS 1248 2 2 2 4 3 4 2 0 19 106 79 103 55 78 34 43 66
ATURA PS 962 2 2 2 1 3 0 4 0 14 85 69 71 187 53 #DIV/0! 11 69
AWIO P7 PS 878 1 1 3 1 1 2 4 0 13 129 118 53 188 122 53 15 68
BAR WALA PS 571 1 1 1 2 1 2 2 0 10 105 103 96 59 67 26 16 57
BARRIO P7 PS 1213 2 2 2 2 3 3 2 0 16 103 102 96 119 60 49 25 76
FR.ORYANG MEMORIAL P7 PS 1153 2 2 2 3 4 2 4 0 19 96 91 74 62 50 83 20 61
IYANYI P7 PS 955 2 1 2 4 2 1 3 0 15 113 179 91 41 43 82 13 64
KAMDINI PS 1401 2 4 3 4 4 2 4 0 23 118 56 73 64 60 77 18 61
KONGO PS 1131 2 3 1 2 2 3 2 1 16 110 65 203 127 68 29 19 71
LELAPALA PS 1414 2 2 2 2 4 2 3 0 17 138 115 115 124 45 65 40 83
OBANGANGEO PS 1221 3 2 2 1 1 1 3 0 13 63 91 92 219 208 142 32 94
OGWET PS 387 2 1 0 2 2 1 2 0 10 41 55 #DIV/0! 30 25 44 10 39
OPUK PS 941 1 2 2 1 2 2 2 0 12 150 82 85 166 74 59 13 78
OTWAL PS 1526 2 2 2 2 5 1 3 0 17 131 137 157 147 39 118 24 90
24962 41 40 43 54 61 47 65 2 353 106 99 97 84 60 61 21 71
We
st
BU
ND IB UG
YO
BUBANDI PS 1601 2 2 1 3 3 2 3 0 16 178 168 253 68 60 70 45 100
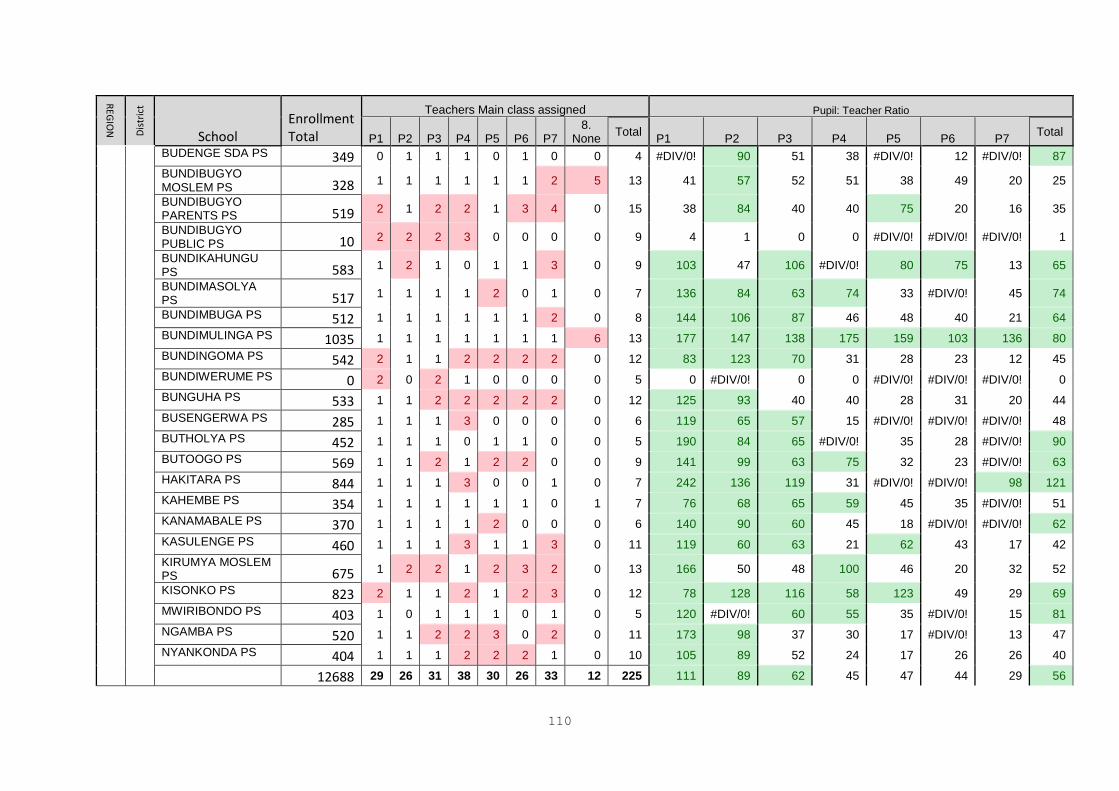
110
REG
ION
Dis
tric
t School
Enrollment Total
Teachers Main class assigned Pupil: Teacher Ratio
P1 P2
P3
P4 P5
P6 P7
8. None
Total P1 P2 P3 P4 P5 P6 P7
Total
BUDENGE SDA PS 349 0 1 1 1 0 1 0 0 4 #DIV/0! 90 51 38 #DIV/0! 12 #DIV/0! 87
BUNDIBUGYO MOSLEM PS 328 1 1 1 1 1 1 2 5 13 41 57 52 51 38 49 20 25
BUNDIBUGYO PARENTS PS 519 2 1 2 2 1 3 4 0 15 38 84 40 40 75 20 16 35
BUNDIBUGYO PUBLIC PS 10 2 2 2 3 0 0 0 0 9 4 1 0 0 #DIV/0! #DIV/0! #DIV/0! 1
BUNDIKAHUNGU PS 583 1 2 1 0 1 1 3 0 9 103 47 106 #DIV/0! 80 75 13 65
BUNDIMASOLYA PS 517 1 1 1 1 2 0 1 0 7 136 84 63 74 33 #DIV/0! 45 74
BUNDIMBUGA PS 512 1 1 1 1 1 1 2 0 8 144 106 87 46 48 40 21 64
BUNDIMULINGA PS 1035 1 1 1 1 1 1 1 6 13 177 147 138 175 159 103 136 80
BUNDINGOMA PS 542 2 1 1 2 2 2 2 0 12 83 123 70 31 28 23 12 45
BUNDIWERUME PS 0 2 0 2 1 0 0 0 0 5 0 #DIV/0! 0 0 #DIV/0! #DIV/0! #DIV/0! 0
BUNGUHA PS 533 1 1 2 2 2 2 2 0 12 125 93 40 40 28 31 20 44
BUSENGERWA PS 285 1 1 1 3 0 0 0 0 6 119 65 57 15 #DIV/0! #DIV/0! #DIV/0! 48
BUTHOLYA PS 452 1 1 1 0 1 1 0 0 5 190 84 65 #DIV/0! 35 28 #DIV/0! 90
BUTOOGO PS 569 1 1 2 1 2 2 0 0 9 141 99 63 75 32 23 #DIV/0! 63
HAKITARA PS 844 1 1 1 3 0 0 1 0 7 242 136 119 31 #DIV/0! #DIV/0! 98 121
KAHEMBE PS 354 1 1 1 1 1 1 0 1 7 76 68 65 59 45 35 #DIV/0! 51
KANAMABALE PS 370 1 1 1 1 2 0 0 0 6 140 90 60 45 18 #DIV/0! #DIV/0! 62
KASULENGE PS 460 1 1 1 3 1 1 3 0 11 119 60 63 21 62 43 17 42
KIRUMYA MOSLEM PS 675 1 2 2 1 2 3 2 0 13 166 50 48 100 46 20 32 52
KISONKO PS 823 2 1 1 2 1 2 3 0 12 78 128 116 58 123 49 29 69
MWIRIBONDO PS 403 1 0 1 1 1 0 1 0 5 120 #DIV/0! 60 55 35 #DIV/0! 15 81
NGAMBA PS 520 1 1 2 2 3 0 2 0 11 173 98 37 30 17 #DIV/0! 13 47
NYANKONDA PS 404 1 1 1 2 2 2 1 0 10 105 89 52 24 17 26 26 40
12688 29 26 31 38 30 26 33 12 225 111 89 62 45 47 44 29 56
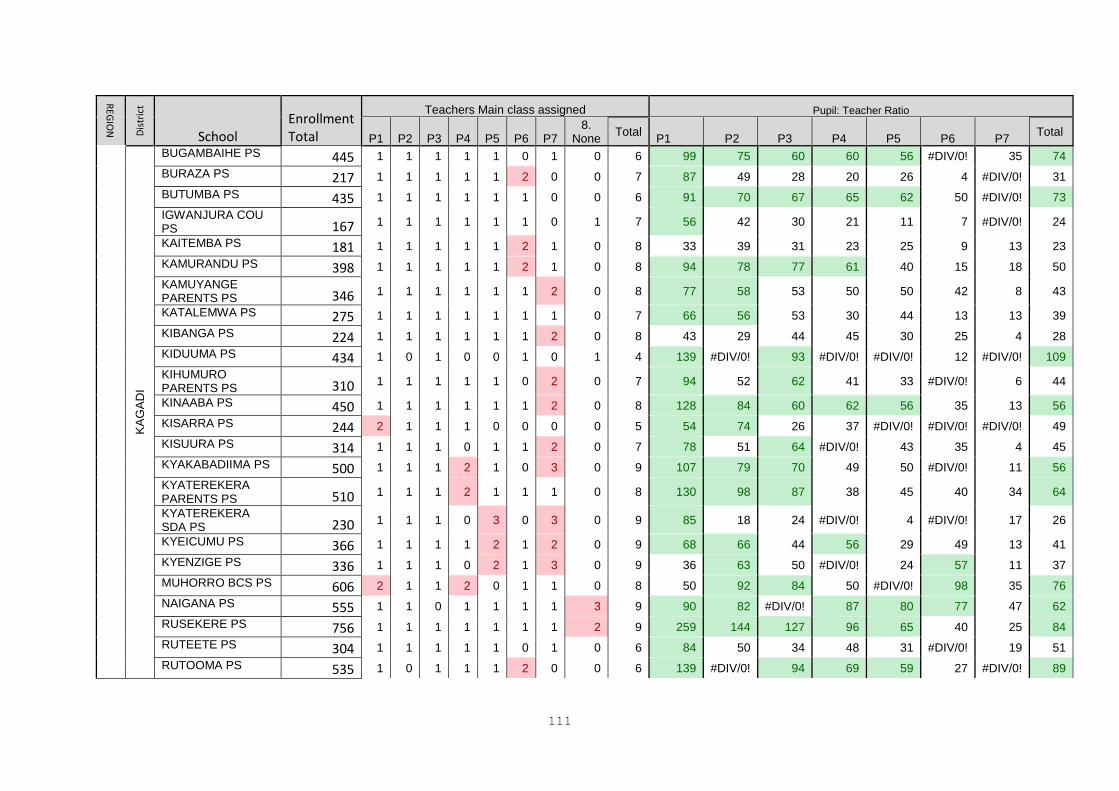
111
REG
ION
Dis
tric
t School
Enrollment Total
Teachers Main class assigned Pupil: Teacher Ratio
P1 P2
P3
P4 P5
P6 P7
8. None
Total P1 P2 P3 P4 P5 P6 P7
Total K
AG
AD
I BUGAMBAIHE PS 445 1 1 1 1 1 0 1 0 6 99 75 60 60 56 #DIV/0! 35 74
BURAZA PS 217 1 1 1 1 1 2 0 0 7 87 49 28 20 26 4 #DIV/0! 31
BUTUMBA PS 435 1 1 1 1 1 1 0 0 6 91 70 67 65 62 50 #DIV/0! 73
IGWANJURA COU PS 167 1 1 1 1 1 1 0 1 7 56 42 30 21 11 7 #DIV/0! 24
KAITEMBA PS 181 1 1 1 1 1 2 1 0 8 33 39 31 23 25 9 13 23
KAMURANDU PS 398 1 1 1 1 1 2 1 0 8 94 78 77 61 40 15 18 50
KAMUYANGE PARENTS PS 346 1 1 1 1 1 1 2 0 8 77 58 53 50 50 42 8 43
KATALEMWA PS 275 1 1 1 1 1 1 1 0 7 66 56 53 30 44 13 13 39
KIBANGA PS 224 1 1 1 1 1 1 2 0 8 43 29 44 45 30 25 4 28
KIDUUMA PS 434 1 0 1 0 0 1 0 1 4 139 #DIV/0! 93 #DIV/0! #DIV/0! 12 #DIV/0! 109
KIHUMURO PARENTS PS 310 1 1 1 1 1 0 2 0 7 94 52 62 41 33 #DIV/0! 6 44
KINAABA PS 450 1 1 1 1 1 1 2 0 8 128 84 60 62 56 35 13 56
KISARRA PS 244 2 1 1 1 0 0 0 0 5 54 74 26 37 #DIV/0! #DIV/0! #DIV/0! 49
KISUURA PS 314 1 1 1 0 1 1 2 0 7 78 51 64 #DIV/0! 43 35 4 45
KYAKABADIIMA PS 500 1 1 1 2 1 0 3 0 9 107 79 70 49 50 #DIV/0! 11 56
KYATEREKERA PARENTS PS 510 1 1 1 2 1 1 1 0 8 130 98 87 38 45 40 34 64
KYATEREKERA SDA PS 230 1 1 1 0 3 0 3 0 9 85 18 24 #DIV/0! 4 #DIV/0! 17 26
KYEICUMU PS 366 1 1 1 1 2 1 2 0 9 68 66 44 56 29 49 13 41
KYENZIGE PS 336 1 1 1 0 2 1 3 0 9 36 63 50 #DIV/0! 24 57 11 37
MUHORRO BCS PS 606 2 1 1 2 0 1 1 0 8 50 92 84 50 #DIV/0! 98 35 76
NAIGANA PS 555 1 1 0 1 1 1 1 3 9 90 82 #DIV/0! 87 80 77 47 62
RUSEKERE PS 756 1 1 1 1 1 1 1 2 9 259 144 127 96 65 40 25 84
RUTEETE PS 304 1 1 1 1 1 0 1 0 6 84 50 34 48 31 #DIV/0! 19 51
RUTOOMA PS 535 1 0 1 1 1 2 0 0 6 139 #DIV/0! 94 69 59 27 #DIV/0! 89
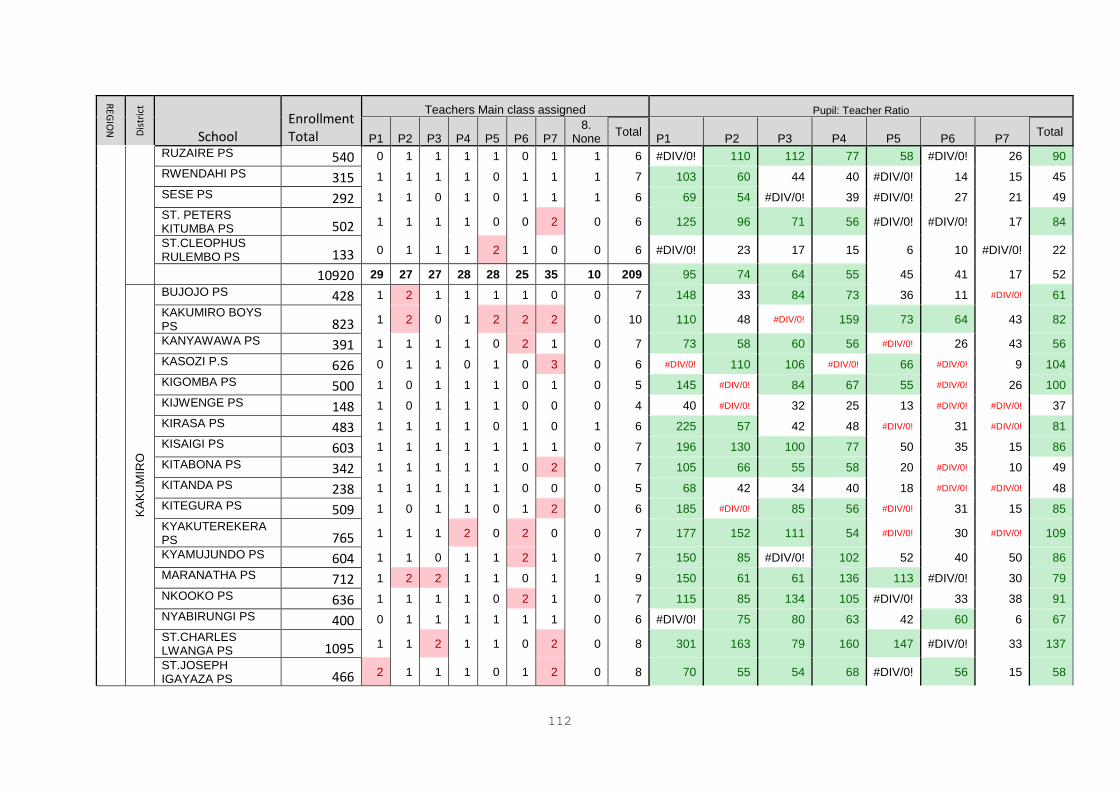
112
REG
ION
Dis
tric
t School
Enrollment Total
Teachers Main class assigned Pupil: Teacher Ratio
P1 P2
P3
P4 P5
P6 P7
8. None
Total P1 P2 P3 P4 P5 P6 P7
Total
RUZAIRE PS 540 0 1 1 1 1 0 1 1 6 #DIV/0! 110 112 77 58 #DIV/0! 26 90
RWENDAHI PS 315 1 1 1 1 0 1 1 1 7 103 60 44 40 #DIV/0! 14 15 45
SESE PS 292 1 1 0 1 0 1 1 1 6 69 54 #DIV/0! 39 #DIV/0! 27 21 49
ST. PETERS KITUMBA PS 502 1 1 1 1 0 0 2 0 6 125 96 71 56 #DIV/0! #DIV/0! 17 84
ST.CLEOPHUS RULEMBO PS 133 0 1 1 1 2 1 0 0 6 #DIV/0! 23 17 15 6 10 #DIV/0! 22
10920 29 27 27 28 28 25 35 10 209 95 74 64 55 45 41 17 52
KA
KU
MIR
O
BUJOJO PS 428 1 2 1 1 1 1 0 0 7 148 33 84 73 36 11 #DIV/0! 61
KAKUMIRO BOYS PS 823 1 2 0 1 2 2 2 0 10 110 48 #DIV/0! 159 73 64 43 82
KANYAWAWA PS 391 1 1 1 1 0 2 1 0 7 73 58 60 56 #DIV/0! 26 43 56
KASOZI P.S 626 0 1 1 0 1 0 3 0 6 #DIV/0! 110 106 #DIV/0! 66 #DIV/0! 9 104
KIGOMBA PS 500 1 0 1 1 1 0 1 0 5 145 #DIV/0! 84 67 55 #DIV/0! 26 100
KIJWENGE PS 148 1 0 1 1 1 0 0 0 4 40 #DIV/0! 32 25 13 #DIV/0! #DIV/0! 37
KIRASA PS 483 1 1 1 1 0 1 0 1 6 225 57 42 48 #DIV/0! 31 #DIV/0! 81
KISAIGI PS 603 1 1 1 1 1 1 1 0 7 196 130 100 77 50 35 15 86
KITABONA PS 342 1 1 1 1 1 0 2 0 7 105 66 55 58 20 #DIV/0! 10 49
KITANDA PS 238 1 1 1 1 1 0 0 0 5 68 42 34 40 18 #DIV/0! #DIV/0! 48
KITEGURA PS 509 1 0 1 1 0 1 2 0 6 185 #DIV/0! 85 56 #DIV/0! 31 15 85
KYAKUTEREKERA PS 765 1 1 1 2 0 2 0 0 7 177 152 111 54 #DIV/0! 30 #DIV/0! 109
KYAMUJUNDO PS 604 1 1 0 1 1 2 1 0 7 150 85 #DIV/0! 102 52 40 50 86
MARANATHA PS 712 1 2 2 1 1 0 1 1 9 150 61 61 136 113 #DIV/0! 30 79
NKOOKO PS 636 1 1 1 1 0 2 1 0 7 115 85 134 105 #DIV/0! 33 38 91
NYABIRUNGI PS 400 0 1 1 1 1 1 1 0 6 #DIV/0! 75 80 63 42 60 6 67
ST.CHARLES LWANGA PS 1095 1 1 2 1 1 0 2 0 8 301 163 79 160 147 #DIV/0! 33 137
ST.JOSEPH IGAYAZA PS 466 2 1 1 1 0 1 2 0 8 70 55 54 68 #DIV/0! 56 15 58
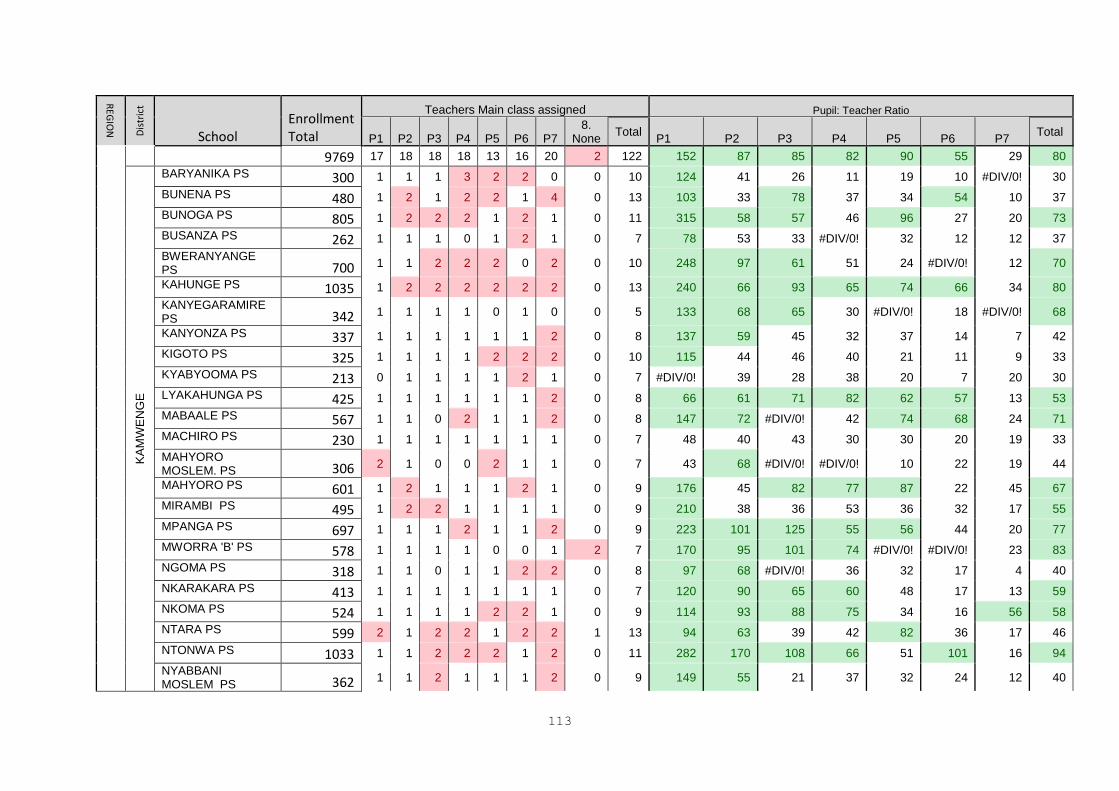
113
REG
ION
Dis
tric
t School
Enrollment Total
Teachers Main class assigned Pupil: Teacher Ratio
P1 P2
P3
P4 P5
P6 P7
8. None
Total P1 P2 P3 P4 P5 P6 P7
Total
9769 17 18 18 18 13 16 20 2 122 152 87 85 82 90 55 29 80
KA
MW
EN
GE
BARYANIKA PS 300 1 1 1 3 2 2 0 0 10 124 41 26 11 19 10 #DIV/0! 30
BUNENA PS 480 1 2 1 2 2 1 4 0 13 103 33 78 37 34 54 10 37
BUNOGA PS 805 1 2 2 2 1 2 1 0 11 315 58 57 46 96 27 20 73
BUSANZA PS 262 1 1 1 0 1 2 1 0 7 78 53 33 #DIV/0! 32 12 12 37
BWERANYANGE PS 700 1 1 2 2 2 0 2 0 10 248 97 61 51 24 #DIV/0! 12 70
KAHUNGE PS 1035 1 2 2 2 2 2 2 0 13 240 66 93 65 74 66 34 80
KANYEGARAMIRE PS 342 1 1 1 1 0 1 0 0 5 133 68 65 30 #DIV/0! 18 #DIV/0! 68
KANYONZA PS 337 1 1 1 1 1 1 2 0 8 137 59 45 32 37 14 7 42
KIGOTO PS 325 1 1 1 1 2 2 2 0 10 115 44 46 40 21 11 9 33
KYABYOOMA PS 213 0 1 1 1 1 2 1 0 7 #DIV/0! 39 28 38 20 7 20 30
LYAKAHUNGA PS 425 1 1 1 1 1 1 2 0 8 66 61 71 82 62 57 13 53
MABAALE PS 567 1 1 0 2 1 1 2 0 8 147 72 #DIV/0! 42 74 68 24 71
MACHIRO PS 230 1 1 1 1 1 1 1 0 7 48 40 43 30 30 20 19 33
MAHYORO MOSLEM. PS 306 2 1 0 0 2 1 1 0 7 43 68 #DIV/0! #DIV/0! 10 22 19 44
MAHYORO PS 601 1 2 1 1 1 2 1 0 9 176 45 82 77 87 22 45 67
MIRAMBI PS 495 1 2 2 1 1 1 1 0 9 210 38 36 53 36 32 17 55
MPANGA PS 697 1 1 1 2 1 1 2 0 9 223 101 125 55 56 44 20 77
MWORRA 'B' PS 578 1 1 1 1 0 0 1 2 7 170 95 101 74 #DIV/0! #DIV/0! 23 83
NGOMA PS 318 1 1 0 1 1 2 2 0 8 97 68 #DIV/0! 36 32 17 4 40
NKARAKARA PS 413 1 1 1 1 1 1 1 0 7 120 90 65 60 48 17 13 59
NKOMA PS 524 1 1 1 1 2 2 1 0 9 114 93 88 75 34 16 56 58
NTARA PS 599 2 1 2 2 1 2 2 1 13 94 63 39 42 82 36 17 46
NTONWA PS 1033 1 1 2 2 2 1 2 0 11 282 170 108 66 51 101 16 94
NYABBANI MOSLEM PS 362 1 1 2 1 1 1 2 0 9 149 55 21 37 32 24 12 40
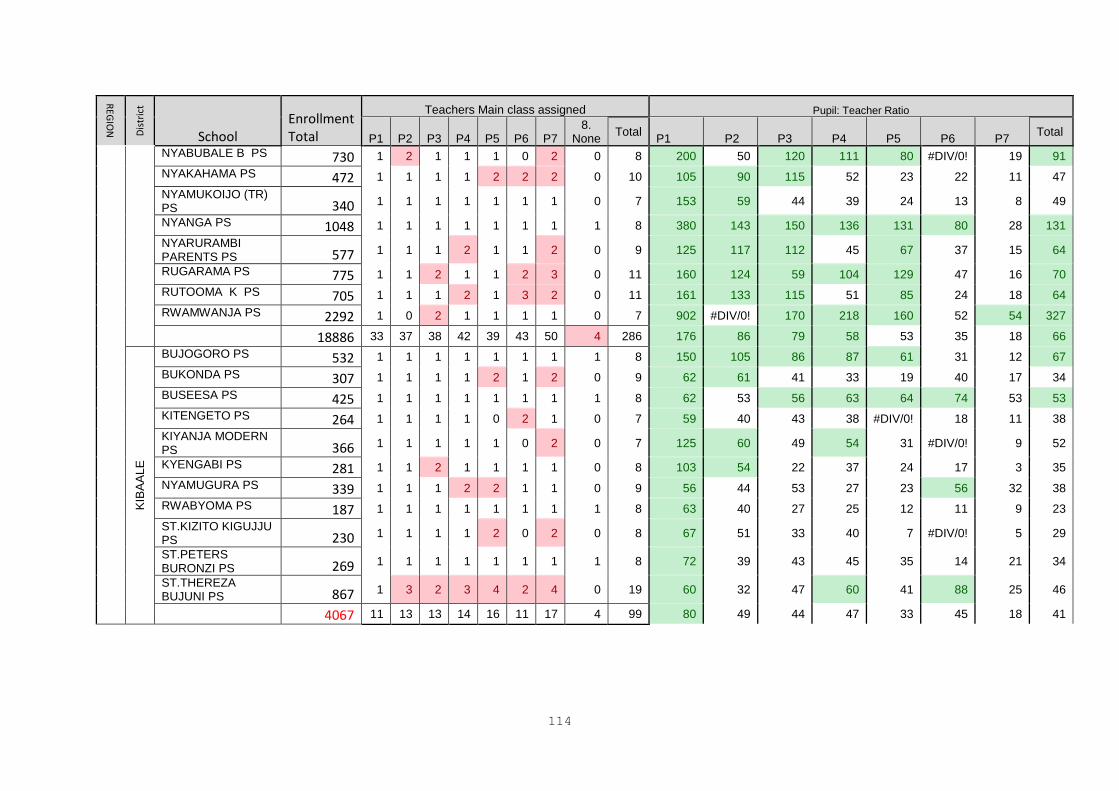
114
REG
ION
Dis
tric
t School
Enrollment Total
Teachers Main class assigned Pupil: Teacher Ratio
P1 P2
P3
P4 P5
P6 P7
8. None
Total P1 P2 P3 P4 P5 P6 P7
Total
NYABUBALE B PS 730 1 2 1 1 1 0 2 0 8 200 50 120 111 80 #DIV/0! 19 91
NYAKAHAMA PS 472 1 1 1 1 2 2 2 0 10 105 90 115 52 23 22 11 47
NYAMUKOIJO (TR) PS 340 1 1 1 1 1 1 1 0 7 153 59 44 39 24 13 8 49
NYANGA PS 1048 1 1 1 1 1 1 1 1 8 380 143 150 136 131 80 28 131
NYARURAMBI PARENTS PS 577 1 1 1 2 1 1 2 0 9 125 117 112 45 67 37 15 64
RUGARAMA PS 775 1 1 2 1 1 2 3 0 11 160 124 59 104 129 47 16 70
RUTOOMA K PS 705 1 1 1 2 1 3 2 0 11 161 133 115 51 85 24 18 64
RWAMWANJA PS 2292 1 0 2 1 1 1 1 0 7 902 #DIV/0! 170 218 160 52 54 327
18886 33 37 38 42 39 43 50 4 286 176 86 79 58 53 35 18 66
KIB
AA
LE
BUJOGORO PS 532 1 1 1 1 1 1 1 1 8 150 105 86 87 61 31 12 67
BUKONDA PS 307 1 1 1 1 2 1 2 0 9 62 61 41 33 19 40 17 34
BUSEESA PS 425 1 1 1 1 1 1 1 1 8 62 53 56 63 64 74 53 53
KITENGETO PS 264 1 1 1 1 0 2 1 0 7 59 40 43 38 #DIV/0! 18 11 38
KIYANJA MODERN PS 366 1 1 1 1 1 0 2 0 7 125 60 49 54 31 #DIV/0! 9 52
KYENGABI PS 281 1 1 2 1 1 1 1 0 8 103 54 22 37 24 17 3 35
NYAMUGURA PS 339 1 1 1 2 2 1 1 0 9 56 44 53 27 23 56 32 38
RWABYOMA PS 187 1 1 1 1 1 1 1 1 8 63 40 27 25 12 11 9 23
ST.KIZITO KIGUJJU PS 230 1 1 1 1 2 0 2 0 8 67 51 33 40 7 #DIV/0! 5 29
ST.PETERS BURONZI PS 269 1 1 1 1 1 1 1 1 8 72 39 43 45 35 14 21 34
ST.THEREZA BUJUNI PS 867 1 3 2 3 4 2 4 0 19 60 32 47 60 41 88 25 46
4067 11 13 13 14 16 11 17 4 99 80 49 44 47 33 45 18 41
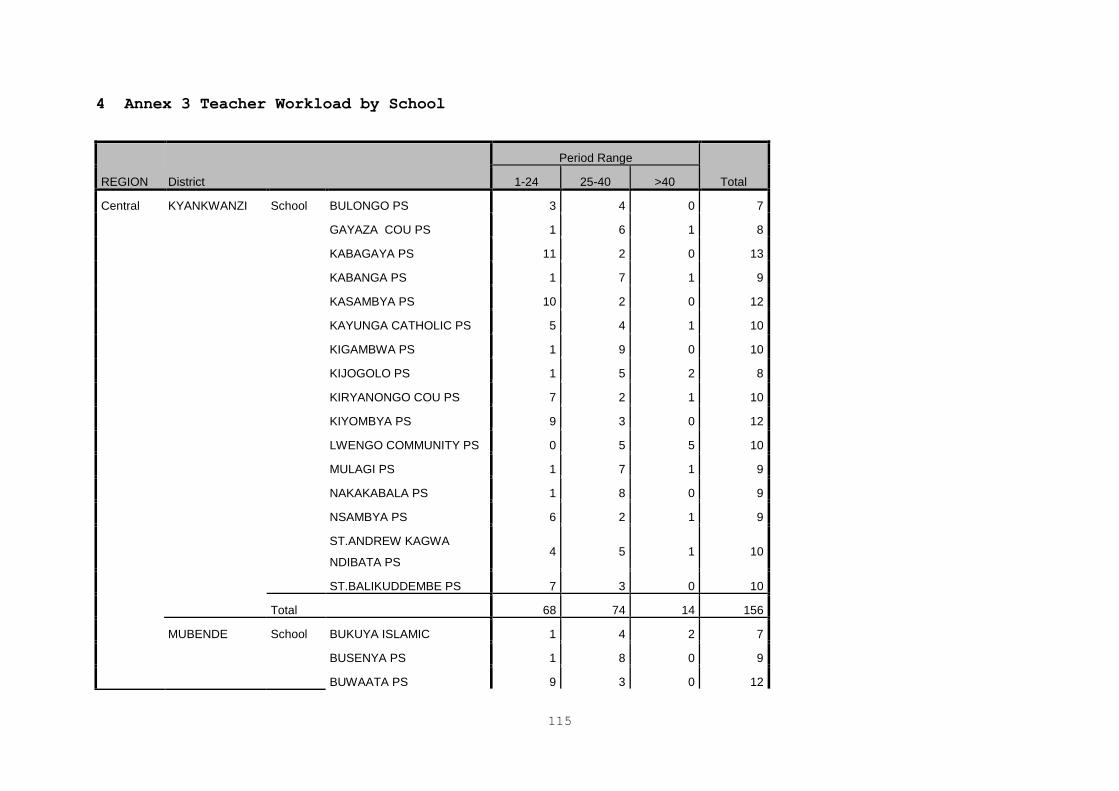
115
4 Annex 3 Teacher Workload by School
REGION District
Period Range
Total 1-24 25-40 >40
Central KYANKWANZI School BULONGO PS 3 4 0 7
GAYAZA COU PS 1 6 1 8
KABAGAYA PS 11 2 0 13
KABANGA PS 1 7 1 9
KASAMBYA PS 10 2 0 12
KAYUNGA CATHOLIC PS 5 4 1 10
KIGAMBWA PS 1 9 0 10
KIJOGOLO PS 1 5 2 8
KIRYANONGO COU PS 7 2 1 10
KIYOMBYA PS 9 3 0 12
LWENGO COMMUNITY PS 0 5 5 10
MULAGI PS 1 7 1 9
NAKAKABALA PS 1 8 0 9
NSAMBYA PS 6 2 1 9
ST.ANDREW KAGWA
NDIBATA PS 4 5 1 10
ST.BALIKUDDEMBE PS 7 3 0 10
Total 68 74 14 156
MUBENDE School BUKUYA ISLAMIC 1 4 2 7
BUSENYA PS 1 8 0 9
BUWAATA PS 9 3 0 12
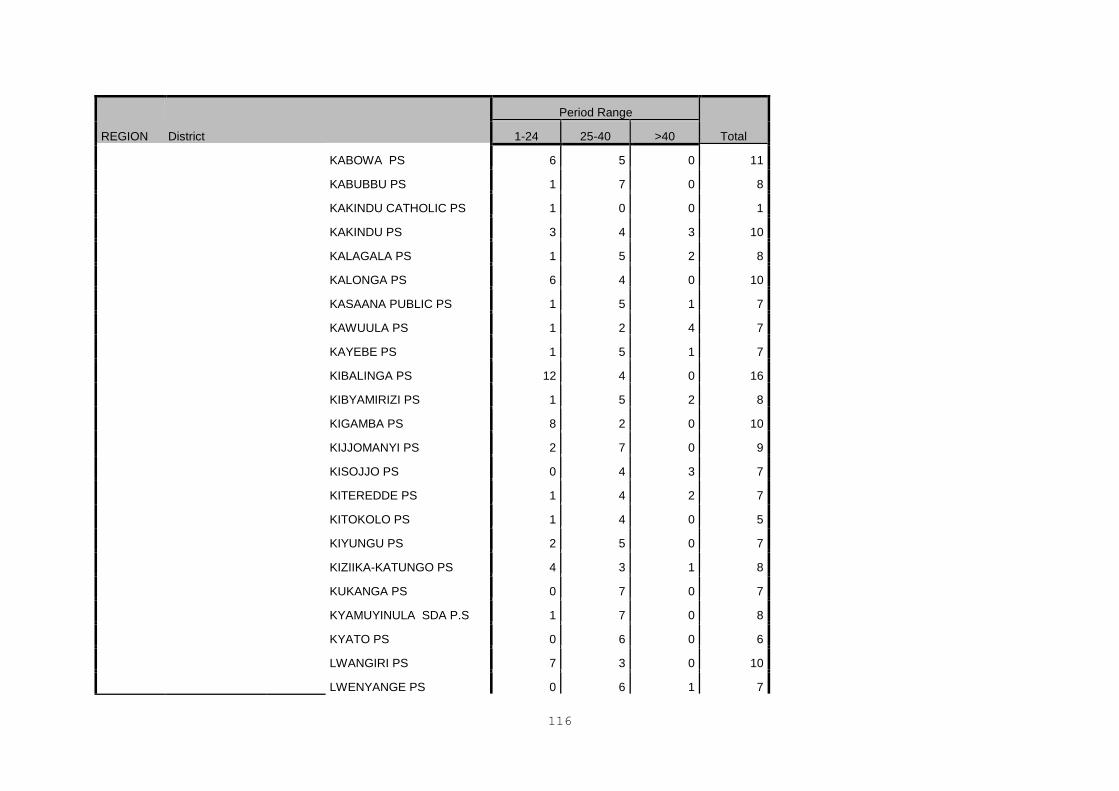
116
REGION District
Period Range
Total 1-24 25-40 >40
KABOWA PS 6 5 0 11
KABUBBU PS 1 7 0 8
KAKINDU CATHOLIC PS 1 0 0 1
KAKINDU PS 3 4 3 10
KALAGALA PS 1 5 2 8
KALONGA PS 6 4 0 10
KASAANA PUBLIC PS 1 5 1 7
KAWUULA PS 1 2 4 7
KAYEBE PS 1 5 1 7
KIBALINGA PS 12 4 0 16
KIBYAMIRIZI PS 1 5 2 8
KIGAMBA PS 8 2 0 10
KIJJOMANYI PS 2 7 0 9
KISOJJO PS 0 4 3 7
KITEREDDE PS 1 4 2 7
KITOKOLO PS 1 4 0 5
KIYUNGU PS 2 5 0 7
KIZIIKA-KATUNGO PS 4 3 1 8
KUKANGA PS 0 7 0 7
KYAMUYINULA SDA P.S 1 7 0 8
KYATO PS 0 6 0 6
LWANGIRI PS 7 3 0 10
LWENYANGE PS 0 6 1 7
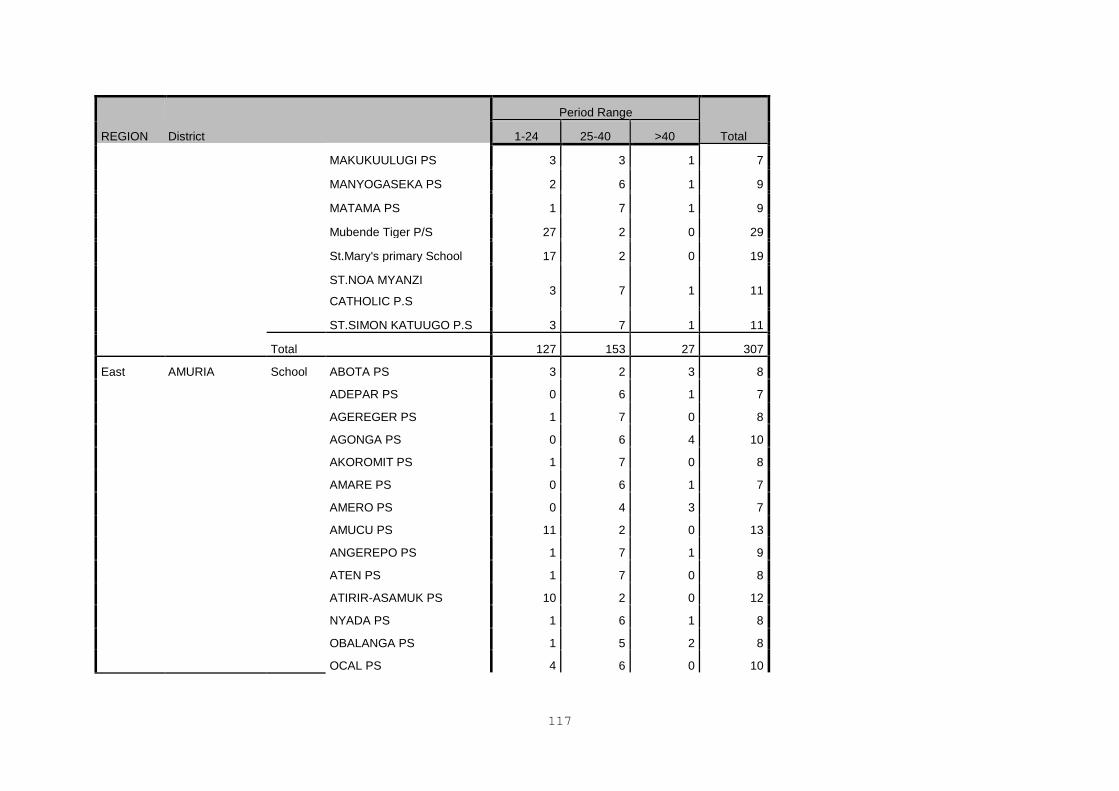
117
REGION District
Period Range
Total 1-24 25-40 >40
MAKUKUULUGI PS 3 3 1 7
MANYOGASEKA PS 2 6 1 9
MATAMA PS 1 7 1 9
Mubende Tiger P/S 27 2 0 29
St.Mary's primary School 17 2 0 19
ST.NOA MYANZI
CATHOLIC P.S 3 7 1 11
ST.SIMON KATUUGO P.S 3 7 1 11
Total 127 153 27 307
East AMURIA School ABOTA PS 3 2 3 8
ADEPAR PS 0 6 1 7
AGEREGER PS 1 7 0 8
AGONGA PS 0 6 4 10
AKOROMIT PS 1 7 0 8
AMARE PS 0 6 1 7
AMERO PS 0 4 3 7
AMUCU PS 11 2 0 13
ANGEREPO PS 1 7 1 9
ATEN PS 1 7 0 8
ATIRIR-ASAMUK PS 10 2 0 12
NYADA PS 1 6 1 8
OBALANGA PS 1 5 2 8
OCAL PS 4 6 0 10
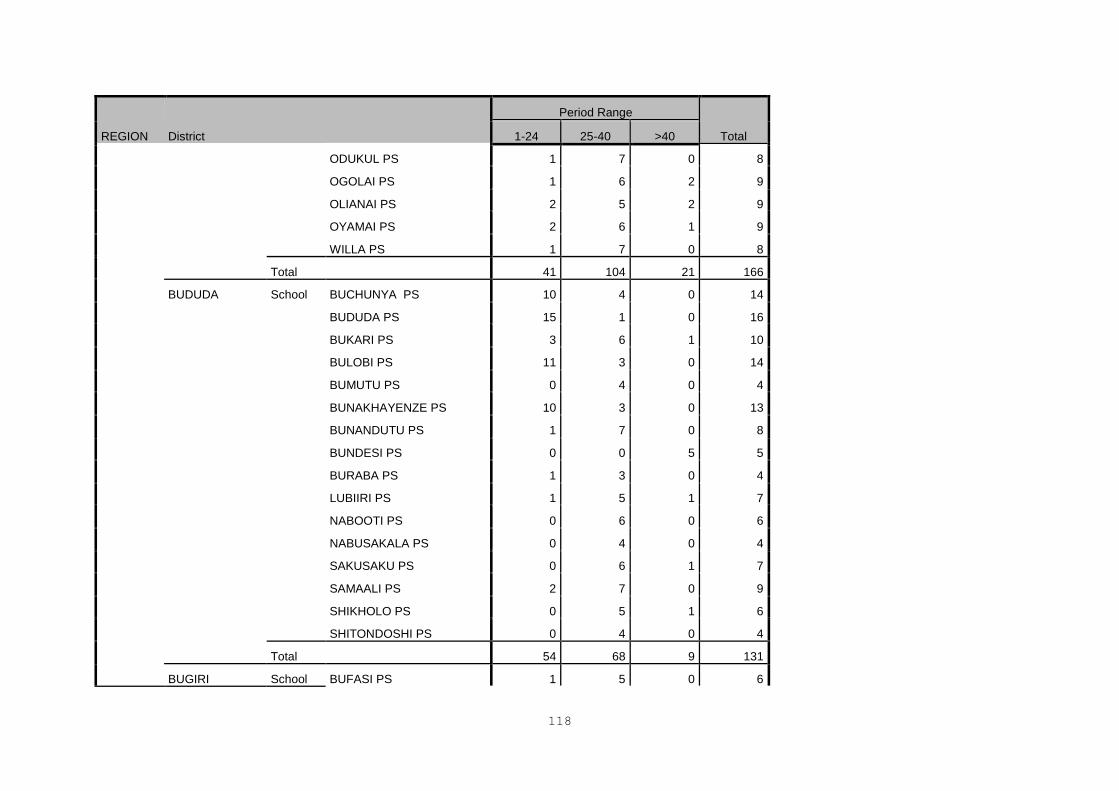
118
REGION District
Period Range
Total 1-24 25-40 >40
ODUKUL PS 1 7 0 8
OGOLAI PS 1 6 2 9
OLIANAI PS 2 5 2 9
OYAMAI PS 2 6 1 9
WILLA PS 1 7 0 8
Total 41 104 21 166
BUDUDA School BUCHUNYA PS 10 4 0 14
BUDUDA PS 15 1 0 16
BUKARI PS 3 6 1 10
BULOBI PS 11 3 0 14
BUMUTU PS 0 4 0 4
BUNAKHAYENZE PS 10 3 0 13
BUNANDUTU PS 1 7 0 8
BUNDESI PS 0 0 5 5
BURABA PS 1 3 0 4
LUBIIRI PS 1 5 1 7
NABOOTI PS 0 6 0 6
NABUSAKALA PS 0 4 0 4
SAKUSAKU PS 0 6 1 7
SAMAALI PS 2 7 0 9
SHIKHOLO PS 0 5 1 6
SHITONDOSHI PS 0 4 0 4
Total 54 68 9 131
BUGIRI School BUFASI PS 1 5 0 6
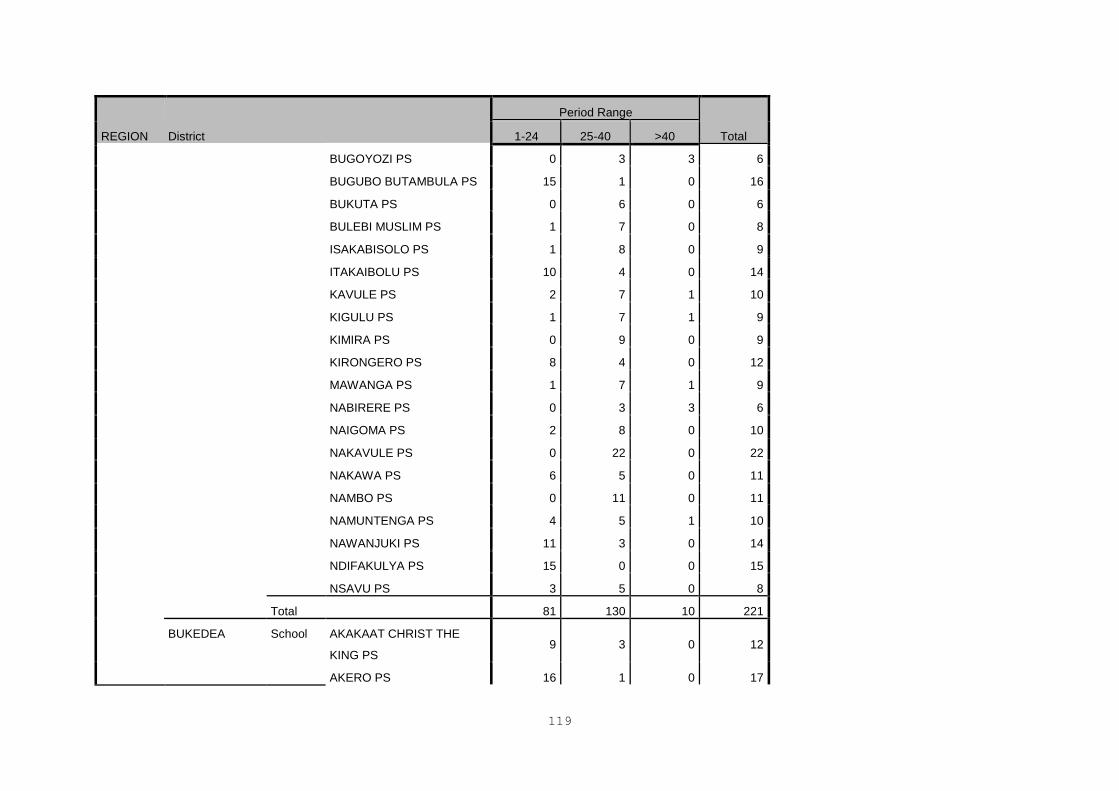
119
REGION District
Period Range
Total 1-24 25-40 >40
BUGOYOZI PS 0 3 3 6
BUGUBO BUTAMBULA PS 15 1 0 16
BUKUTA PS 0 6 0 6
BULEBI MUSLIM PS 1 7 0 8
ISAKABISOLO PS 1 8 0 9
ITAKAIBOLU PS 10 4 0 14
KAVULE PS 2 7 1 10
KIGULU PS 1 7 1 9
KIMIRA PS 0 9 0 9
KIRONGERO PS 8 4 0 12
MAWANGA PS 1 7 1 9
NABIRERE PS 0 3 3 6
NAIGOMA PS 2 8 0 10
NAKAVULE PS 0 22 0 22
NAKAWA PS 6 5 0 11
NAMBO PS 0 11 0 11
NAMUNTENGA PS 4 5 1 10
NAWANJUKI PS 11 3 0 14
NDIFAKULYA PS 15 0 0 15
NSAVU PS 3 5 0 8
Total 81 130 10 221
BUKEDEA School AKAKAAT CHRIST THE
KING PS 9 3 0 12
AKERO PS 16 1 0 17
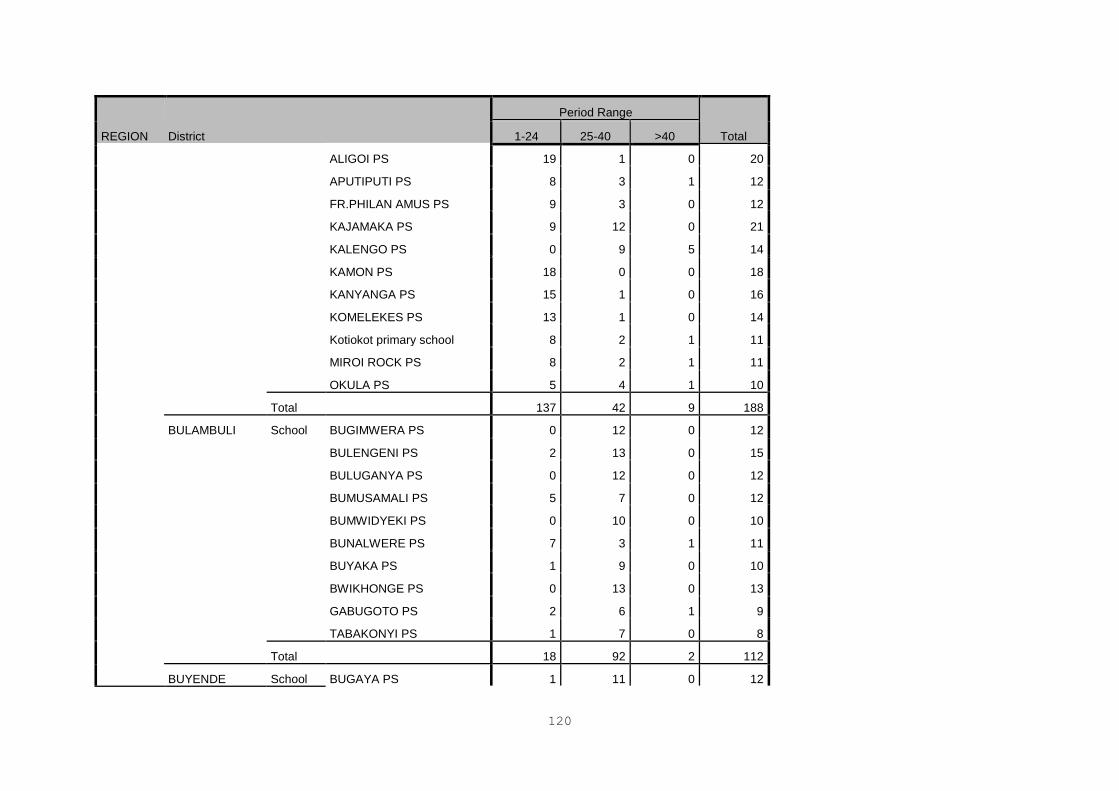
120
REGION District
Period Range
Total 1-24 25-40 >40
ALIGOI PS 19 1 0 20
APUTIPUTI PS 8 3 1 12
FR.PHILAN AMUS PS 9 3 0 12
KAJAMAKA PS 9 12 0 21
KALENGO PS 0 9 5 14
KAMON PS 18 0 0 18
KANYANGA PS 15 1 0 16
KOMELEKES PS 13 1 0 14
Kotiokot primary school 8 2 1 11
MIROI ROCK PS 8 2 1 11
OKULA PS 5 4 1 10
Total 137 42 9 188
BULAMBULI School BUGIMWERA PS 0 12 0 12
BULENGENI PS 2 13 0 15
BULUGANYA PS 0 12 0 12
BUMUSAMALI PS 5 7 0 12
BUMWIDYEKI PS 0 10 0 10
BUNALWERE PS 7 3 1 11
BUYAKA PS 1 9 0 10
BWIKHONGE PS 0 13 0 13
GABUGOTO PS 2 6 1 9
TABAKONYI PS 1 7 0 8
Total 18 92 2 112
BUYENDE School BUGAYA PS 1 11 0 12
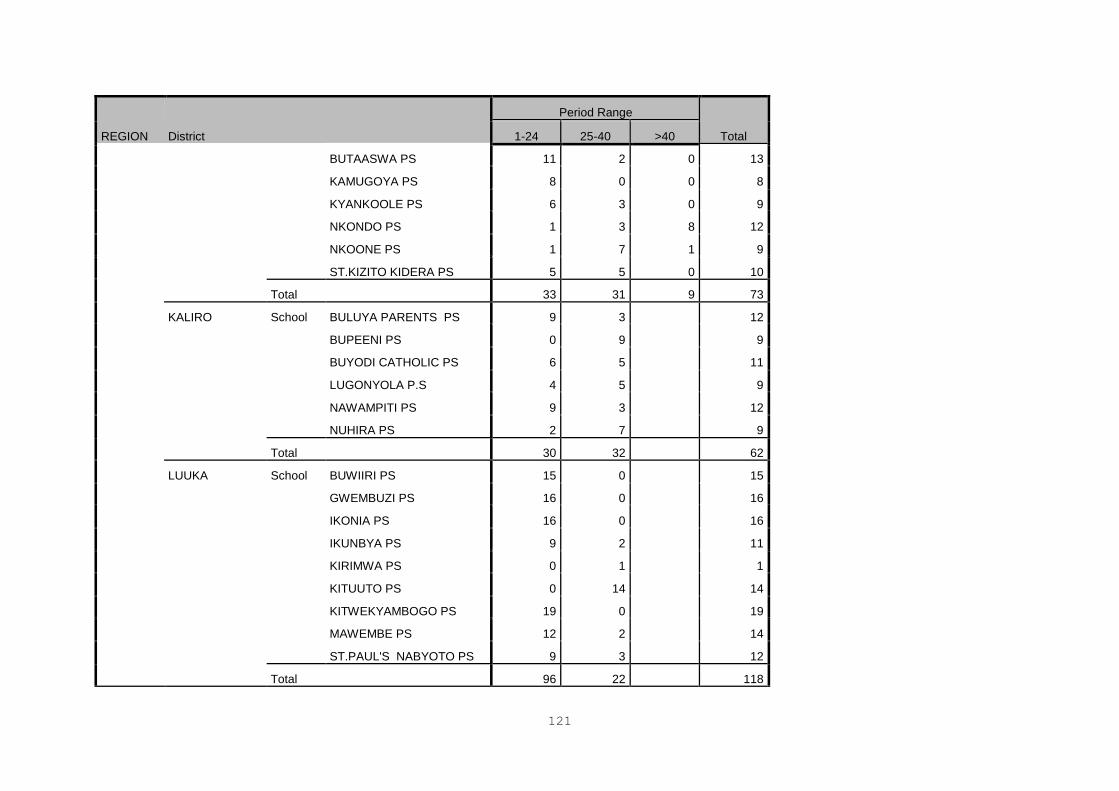
121
REGION District
Period Range
Total 1-24 25-40 >40
BUTAASWA PS 11 2 0 13
KAMUGOYA PS 8 0 0 8
KYANKOOLE PS 6 3 0 9
NKONDO PS 1 3 8 12
NKOONE PS 1 7 1 9
ST.KIZITO KIDERA PS 5 5 0 10
Total 33 31 9 73
KALIRO School BULUYA PARENTS PS 9 3 12
BUPEENI PS 0 9 9
BUYODI CATHOLIC PS 6 5 11
LUGONYOLA P.S 4 5 9
NAWAMPITI PS 9 3 12
NUHIRA PS 2 7 9
Total 30 32 62
LUUKA School BUWIIRI PS 15 0 15
GWEMBUZI PS 16 0 16
IKONIA PS 16 0 16
IKUNBYA PS 9 2 11
KIRIMWA PS 0 1 1
KITUUTO PS 0 14 14
KITWEKYAMBOGO PS 19 0 19
MAWEMBE PS 12 2 14
ST.PAUL'S NABYOTO PS 9 3 12
Total 96 22 118
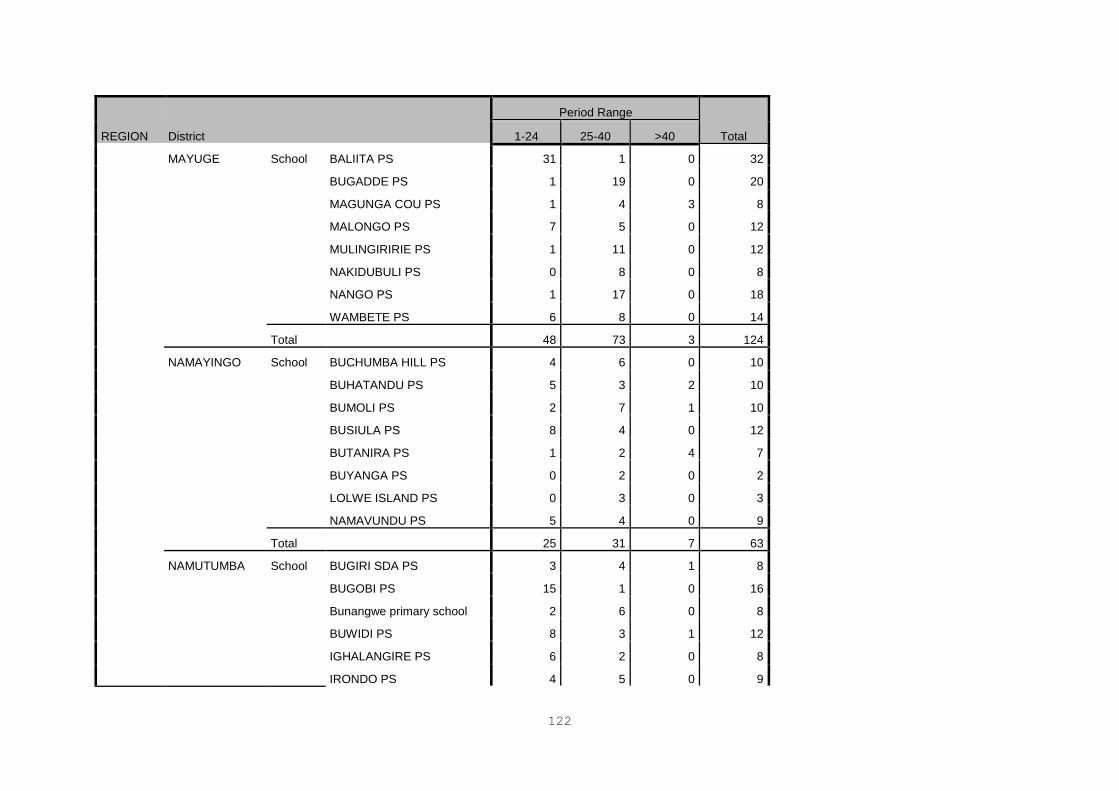
122
REGION District
Period Range
Total 1-24 25-40 >40
MAYUGE School BALIITA PS 31 1 0 32
BUGADDE PS 1 19 0 20
MAGUNGA COU PS 1 4 3 8
MALONGO PS 7 5 0 12
MULINGIRIRIE PS 1 11 0 12
NAKIDUBULI PS 0 8 0 8
NANGO PS 1 17 0 18
WAMBETE PS 6 8 0 14
Total 48 73 3 124
NAMAYINGO School BUCHUMBA HILL PS 4 6 0 10
BUHATANDU PS 5 3 2 10
BUMOLI PS 2 7 1 10
BUSIULA PS 8 4 0 12
BUTANIRA PS 1 2 4 7
BUYANGA PS 0 2 0 2
LOLWE ISLAND PS 0 3 0 3
NAMAVUNDU PS 5 4 0 9
Total 25 31 7 63
NAMUTUMBA School BUGIRI SDA PS 3 4 1 8
BUGOBI PS 15 1 0 16
Bunangwe primary school 2 6 0 8
BUWIDI PS 8 3 1 12
IGHALANGIRE PS 6 2 0 8
IRONDO PS 4 5 0 9
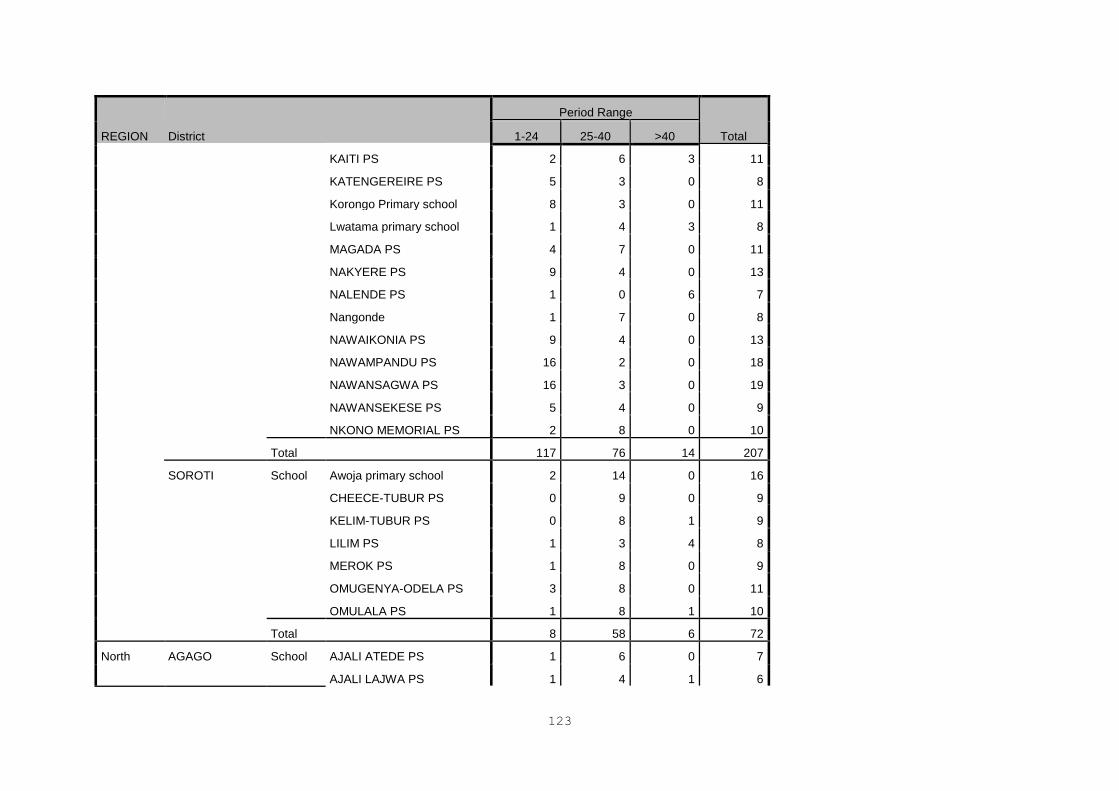
123
REGION District
Period Range
Total 1-24 25-40 >40
KAITI PS 2 6 3 11
KATENGEREIRE PS 5 3 0 8
Korongo Primary school 8 3 0 11
Lwatama primary school 1 4 3 8
MAGADA PS 4 7 0 11
NAKYERE PS 9 4 0 13
NALENDE PS 1 0 6 7
Nangonde 1 7 0 8
NAWAIKONIA PS 9 4 0 13
NAWAMPANDU PS 16 2 0 18
NAWANSAGWA PS 16 3 0 19
NAWANSEKESE PS 5 4 0 9
NKONO MEMORIAL PS 2 8 0 10
Total 117 76 14 207
SOROTI School Awoja primary school 2 14 0 16
CHEECE-TUBUR PS 0 9 0 9
KELIM-TUBUR PS 0 8 1 9
LILIM PS 1 3 4 8
MEROK PS 1 8 0 9
OMUGENYA-ODELA PS 3 8 0 11
OMULALA PS 1 8 1 10
Total 8 58 6 72
North AGAGO School AJALI ATEDE PS 1 6 0 7
AJALI LAJWA PS 1 4 1 6
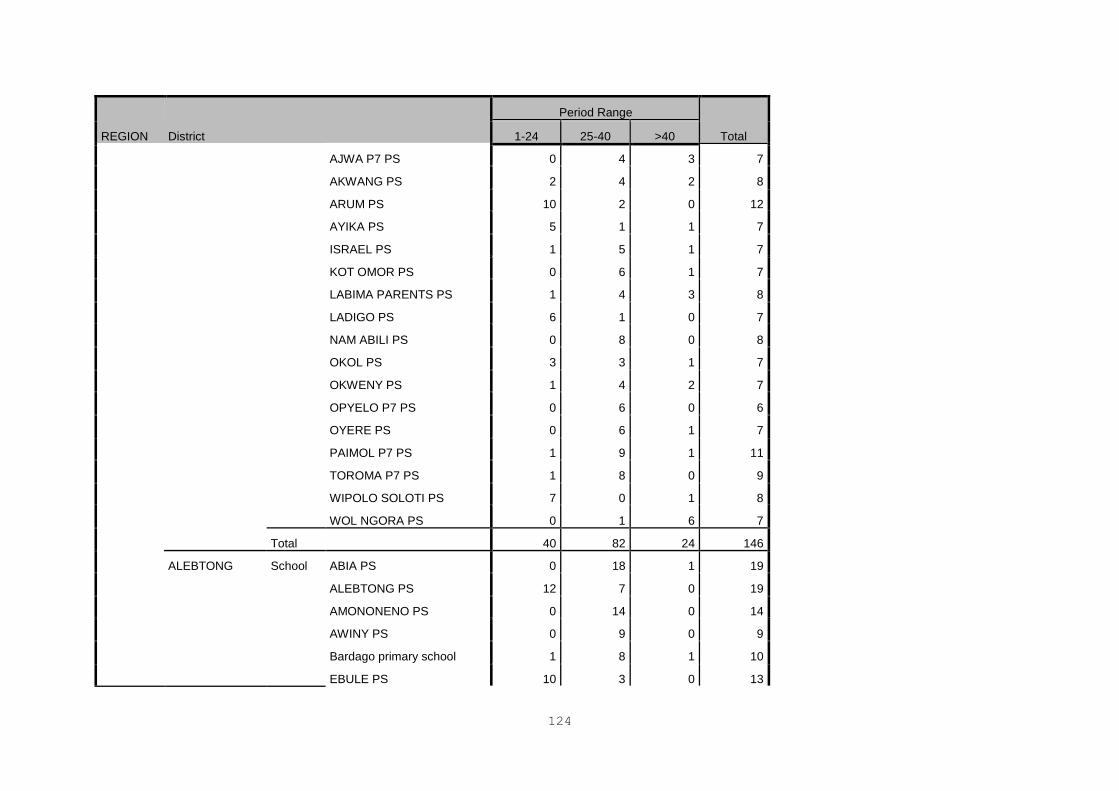
124
REGION District
Period Range
Total 1-24 25-40 >40
AJWA P7 PS 0 4 3 7
AKWANG PS 2 4 2 8
ARUM PS 10 2 0 12
AYIKA PS 5 1 1 7
ISRAEL PS 1 5 1 7
KOT OMOR PS 0 6 1 7
LABIMA PARENTS PS 1 4 3 8
LADIGO PS 6 1 0 7
NAM ABILI PS 0 8 0 8
OKOL PS 3 3 1 7
OKWENY PS 1 4 2 7
OPYELO P7 PS 0 6 0 6
OYERE PS 0 6 1 7
PAIMOL P7 PS 1 9 1 11
TOROMA P7 PS 1 8 0 9
WIPOLO SOLOTI PS 7 0 1 8
WOL NGORA PS 0 1 6 7
Total 40 82 24 146
ALEBTONG School ABIA PS 0 18 1 19
ALEBTONG PS 12 7 0 19
AMONONENO PS 0 14 0 14
AWINY PS 0 9 0 9
Bardago primary school 1 8 1 10
EBULE PS 10 3 0 13
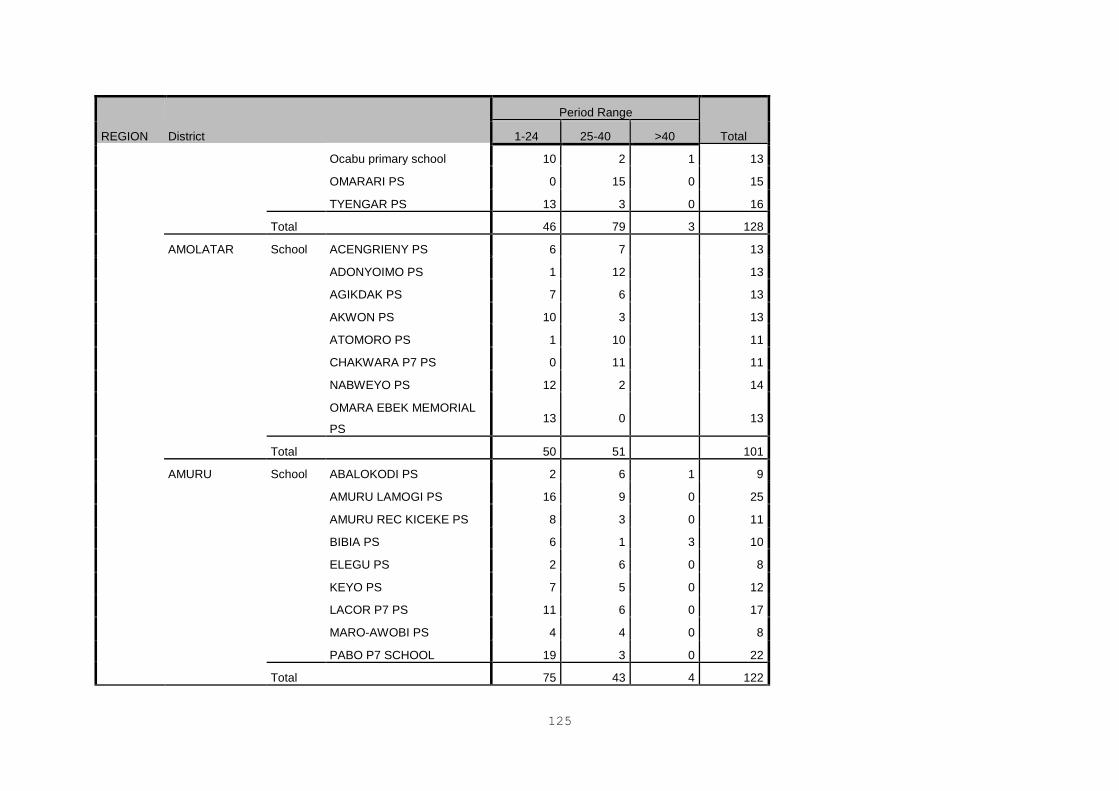
125
REGION District
Period Range
Total 1-24 25-40 >40
Ocabu primary school 10 2 1 13
OMARARI PS 0 15 0 15
TYENGAR PS 13 3 0 16
Total 46 79 3 128
AMOLATAR School ACENGRIENY PS 6 7 13
ADONYOIMO PS 1 12 13
AGIKDAK PS 7 6 13
AKWON PS 10 3 13
ATOMORO PS 1 10 11
CHAKWARA P7 PS 0 11 11
NABWEYO PS 12 2 14
OMARA EBEK MEMORIAL
PS 13 0 13
Total 50 51 101
AMURU School ABALOKODI PS 2 6 1 9
AMURU LAMOGI PS 16 9 0 25
AMURU REC KICEKE PS 8 3 0 11
BIBIA PS 6 1 3 10
ELEGU PS 2 6 0 8
KEYO PS 7 5 0 12
LACOR P7 PS 11 6 0 17
MARO-AWOBI PS 4 4 0 8
PABO P7 SCHOOL 19 3 0 22
Total 75 43 4 122
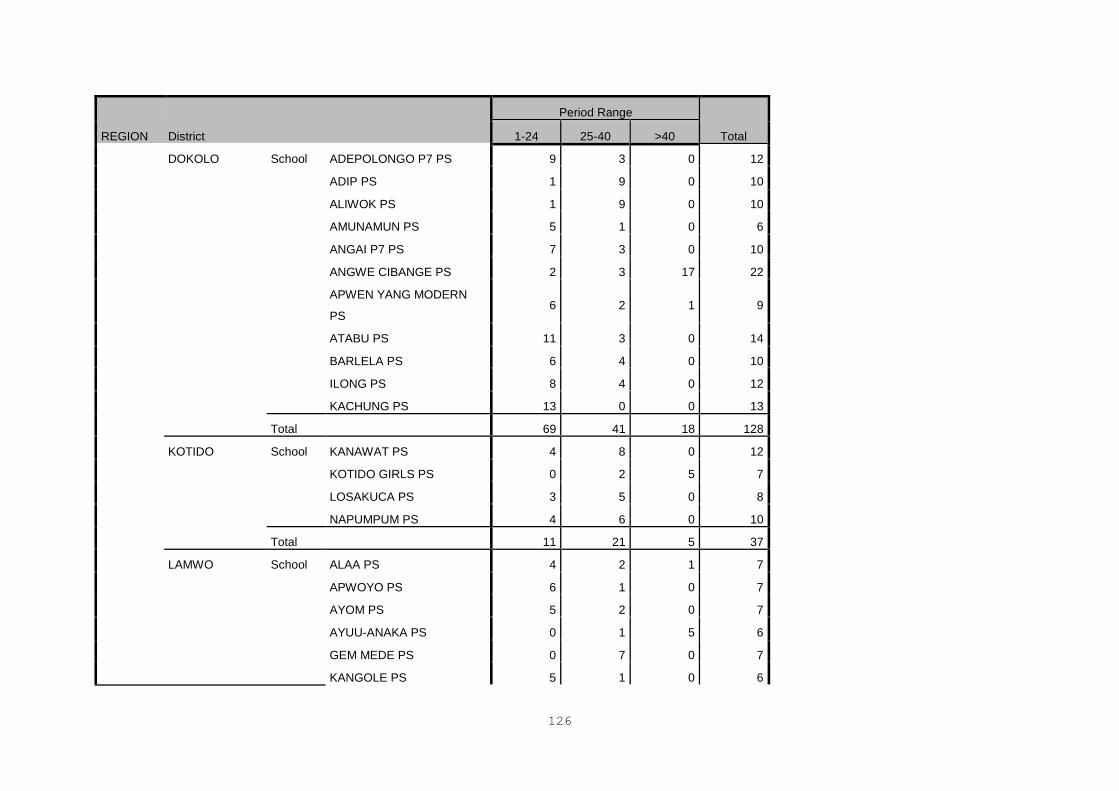
126
REGION District
Period Range
Total 1-24 25-40 >40
DOKOLO School ADEPOLONGO P7 PS 9 3 0 12
ADIP PS 1 9 0 10
ALIWOK PS 1 9 0 10
AMUNAMUN PS 5 1 0 6
ANGAI P7 PS 7 3 0 10
ANGWE CIBANGE PS 2 3 17 22
APWEN YANG MODERN
PS 6 2 1 9
ATABU PS 11 3 0 14
BARLELA PS 6 4 0 10
ILONG PS 8 4 0 12
KACHUNG PS 13 0 0 13
Total 69 41 18 128
KOTIDO School KANAWAT PS 4 8 0 12
KOTIDO GIRLS PS 0 2 5 7
LOSAKUCA PS 3 5 0 8
NAPUMPUM PS 4 6 0 10
Total 11 21 5 37
LAMWO School ALAA PS 4 2 1 7
APWOYO PS 6 1 0 7
AYOM PS 5 2 0 7
AYUU-ANAKA PS 0 1 5 6
GEM MEDE PS 0 7 0 7
KANGOLE PS 5 1 0 6
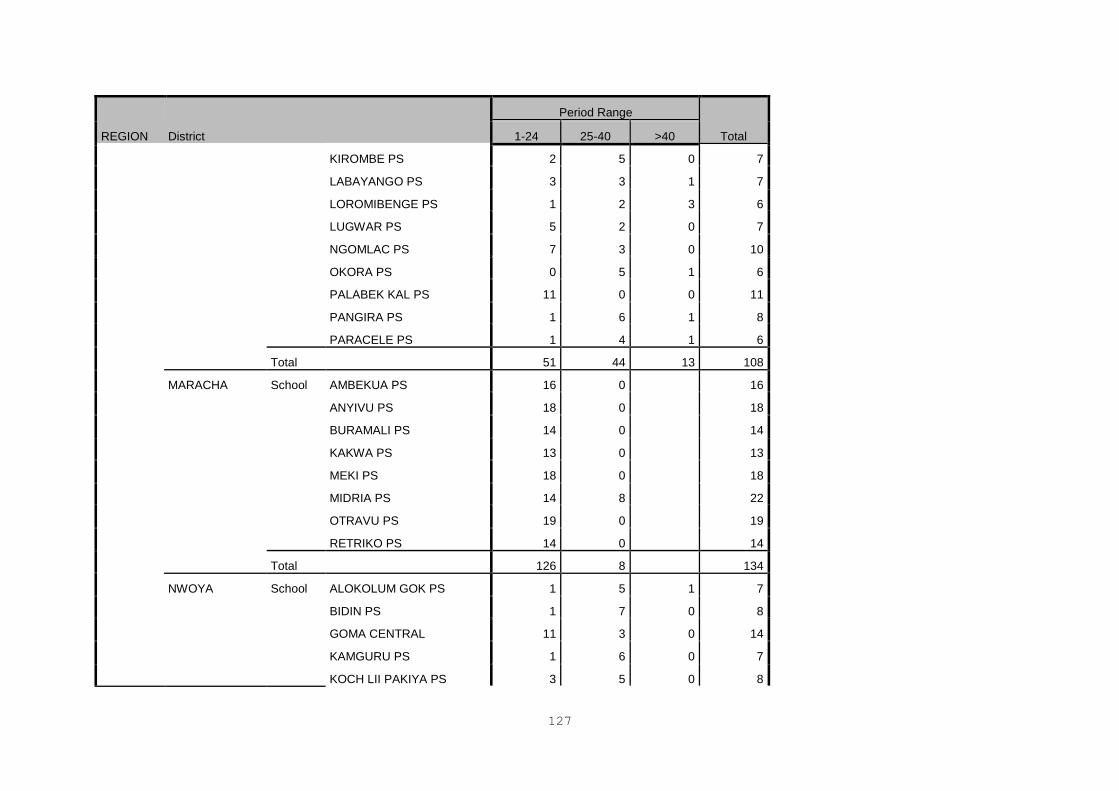
127
REGION District
Period Range
Total 1-24 25-40 >40
KIROMBE PS 2 5 0 7
LABAYANGO PS 3 3 1 7
LOROMIBENGE PS 1 2 3 6
LUGWAR PS 5 2 0 7
NGOMLAC PS 7 3 0 10
OKORA PS 0 5 1 6
PALABEK KAL PS 11 0 0 11
PANGIRA PS 1 6 1 8
PARACELE PS 1 4 1 6
Total 51 44 13 108
MARACHA School AMBEKUA PS 16 0 16
ANYIVU PS 18 0 18
BURAMALI PS 14 0 14
KAKWA PS 13 0 13
MEKI PS 18 0 18
MIDRIA PS 14 8 22
OTRAVU PS 19 0 19
RETRIKO PS 14 0 14
Total 126 8 134
NWOYA School ALOKOLUM GOK PS 1 5 1 7
BIDIN PS 1 7 0 8
GOMA CENTRAL 11 3 0 14
KAMGURU PS 1 6 0 7
KOCH LII PAKIYA PS 3 5 0 8
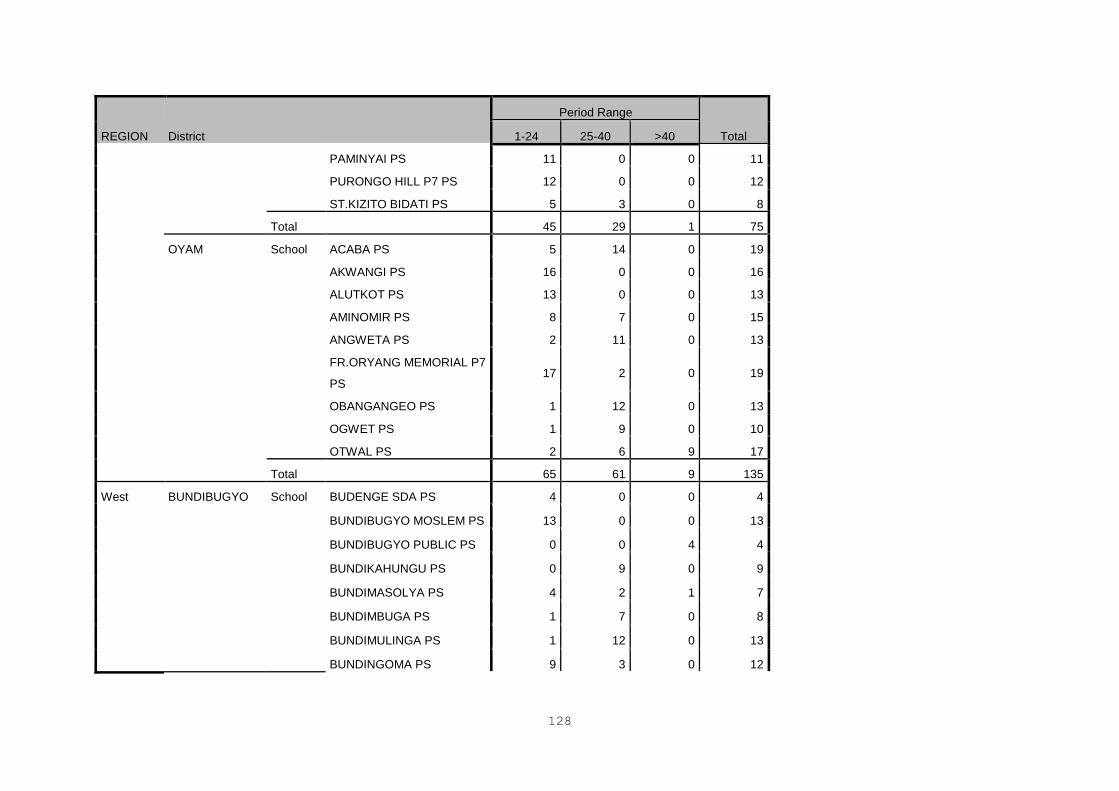
128
REGION District
Period Range
Total 1-24 25-40 >40
PAMINYAI PS 11 0 0 11
PURONGO HILL P7 PS 12 0 0 12
ST.KIZITO BIDATI PS 5 3 0 8
Total 45 29 1 75
OYAM School ACABA PS 5 14 0 19
AKWANGI PS 16 0 0 16
ALUTKOT PS 13 0 0 13
AMINOMIR PS 8 7 0 15
ANGWETA PS 2 11 0 13
FR.ORYANG MEMORIAL P7
PS 17 2 0 19
OBANGANGEO PS 1 12 0 13
OGWET PS 1 9 0 10
OTWAL PS 2 6 9 17
Total 65 61 9 135
West BUNDIBUGYO School BUDENGE SDA PS 4 0 0 4
BUNDIBUGYO MOSLEM PS 13 0 0 13
BUNDIBUGYO PUBLIC PS 0 0 4 4
BUNDIKAHUNGU PS 0 9 0 9
BUNDIMASOLYA PS 4 2 1 7
BUNDIMBUGA PS 1 7 0 8
BUNDIMULINGA PS 1 12 0 13
BUNDINGOMA PS 9 3 0 12
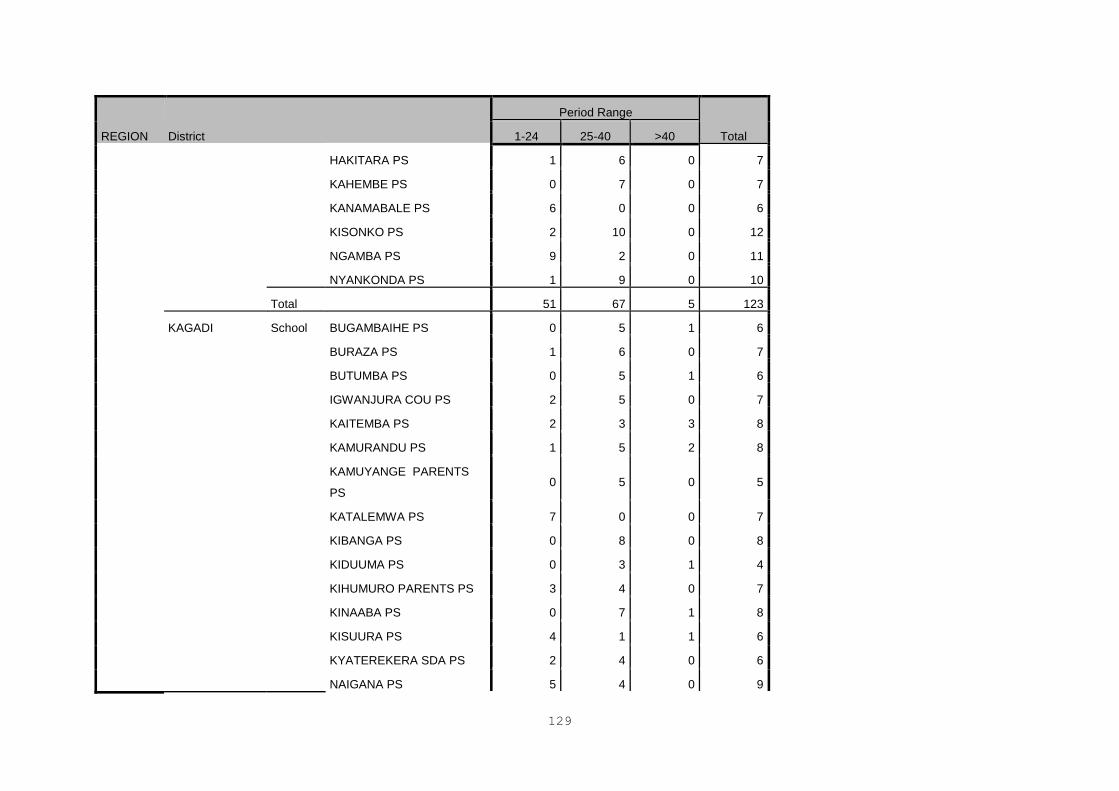
129
REGION District
Period Range
Total 1-24 25-40 >40
HAKITARA PS 1 6 0 7
KAHEMBE PS 0 7 0 7
KANAMABALE PS 6 0 0 6
KISONKO PS 2 10 0 12
NGAMBA PS 9 2 0 11
NYANKONDA PS 1 9 0 10
Total 51 67 5 123
KAGADI School BUGAMBAIHE PS 0 5 1 6
BURAZA PS 1 6 0 7
BUTUMBA PS 0 5 1 6
IGWANJURA COU PS 2 5 0 7
KAITEMBA PS 2 3 3 8
KAMURANDU PS 1 5 2 8
KAMUYANGE PARENTS
PS 0 5 0 5
KATALEMWA PS 7 0 0 7
KIBANGA PS 0 8 0 8
KIDUUMA PS 0 3 1 4
KIHUMURO PARENTS PS 3 4 0 7
KINAABA PS 0 7 1 8
KISUURA PS 4 1 1 6
KYATEREKERA SDA PS 2 4 0 6
NAIGANA PS 5 4 0 9
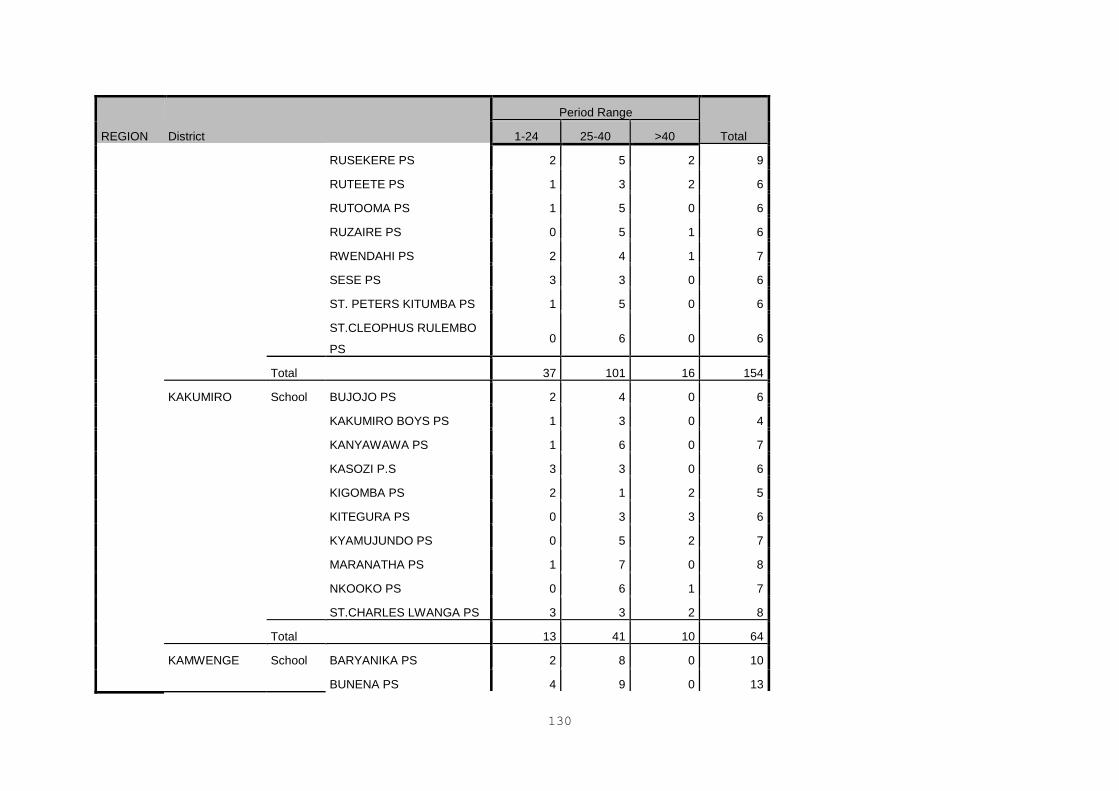
130
REGION District
Period Range
Total 1-24 25-40 >40
RUSEKERE PS 2 5 2 9
RUTEETE PS 1 3 2 6
RUTOOMA PS 1 5 0 6
RUZAIRE PS 0 5 1 6
RWENDAHI PS 2 4 1 7
SESE PS 3 3 0 6
ST. PETERS KITUMBA PS 1 5 0 6
ST.CLEOPHUS RULEMBO
PS 0 6 0 6
Total 37 101 16 154
KAKUMIRO School BUJOJO PS 2 4 0 6
KAKUMIRO BOYS PS 1 3 0 4
KANYAWAWA PS 1 6 0 7
KASOZI P.S 3 3 0 6
KIGOMBA PS 2 1 2 5
KITEGURA PS 0 3 3 6
KYAMUJUNDO PS 0 5 2 7
MARANATHA PS 1 7 0 8
NKOOKO PS 0 6 1 7
ST.CHARLES LWANGA PS 3 3 2 8
Total 13 41 10 64
KAMWENGE School BARYANIKA PS 2 8 0 10
BUNENA PS 4 9 0 13
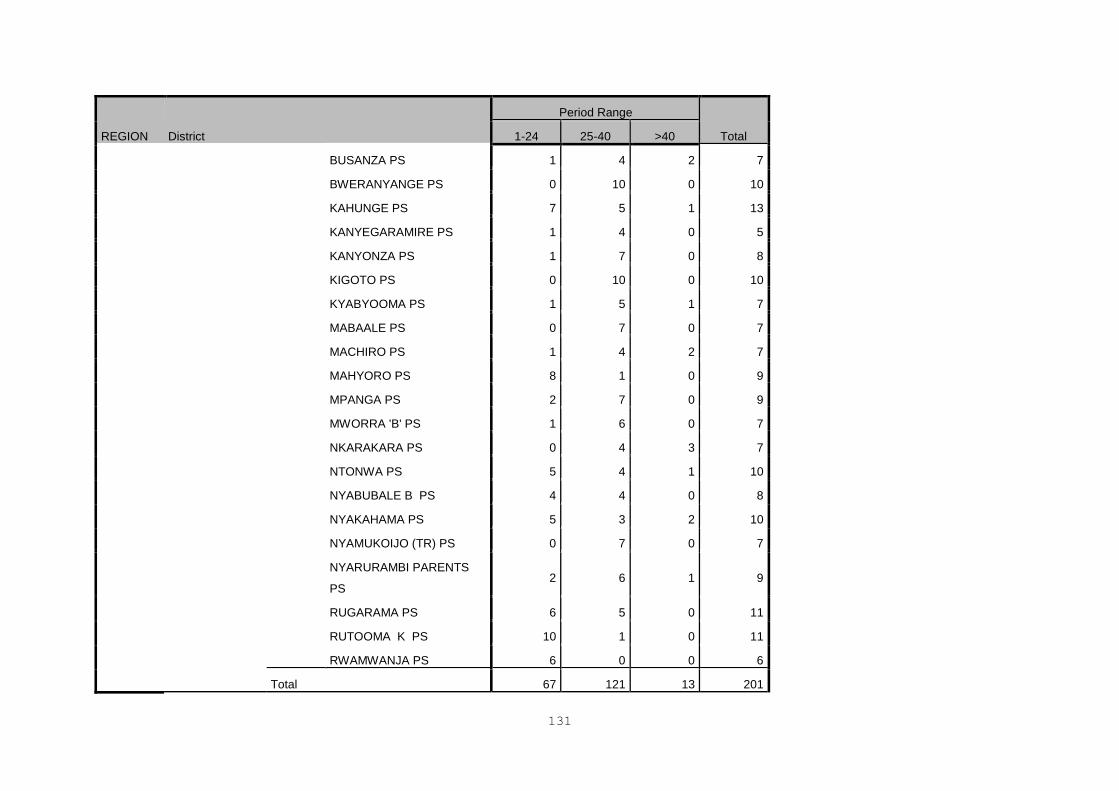
131
REGION District
Period Range
Total 1-24 25-40 >40
BUSANZA PS 1 4 2 7
BWERANYANGE PS 0 10 0 10
KAHUNGE PS 7 5 1 13
KANYEGARAMIRE PS 1 4 0 5
KANYONZA PS 1 7 0 8
KIGOTO PS 0 10 0 10
KYABYOOMA PS 1 5 1 7
MABAALE PS 0 7 0 7
MACHIRO PS 1 4 2 7
MAHYORO PS 8 1 0 9
MPANGA PS 2 7 0 9
MWORRA 'B' PS 1 6 0 7
NKARAKARA PS 0 4 3 7
NTONWA PS 5 4 1 10
NYABUBALE B PS 4 4 0 8
NYAKAHAMA PS 5 3 2 10
NYAMUKOIJO (TR) PS 0 7 0 7
NYARURAMBI PARENTS
PS 2 6 1 9
RUGARAMA PS 6 5 0 11
RUTOOMA K PS 10 1 0 11
RWAMWANJA PS 6 0 0 6
Total 67 121 13 201
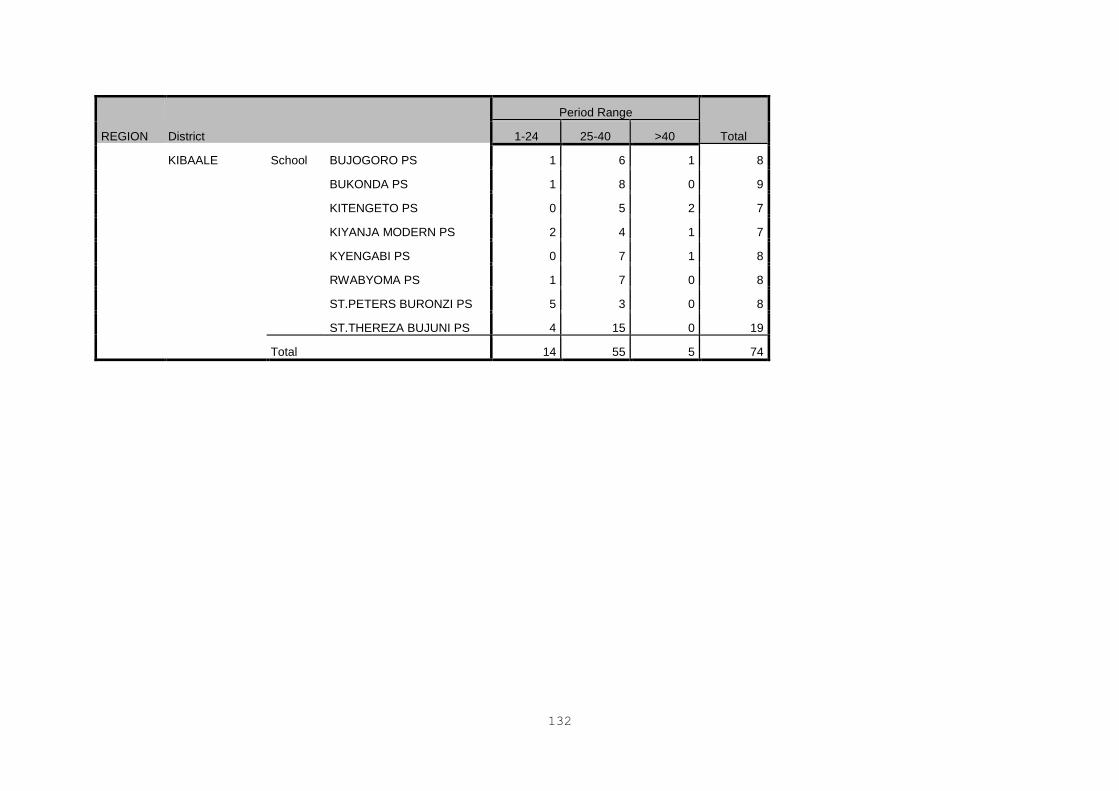
132
REGION District
Period Range
Total 1-24 25-40 >40
KIBAALE School BUJOGORO PS 1 6 1 8
BUKONDA PS 1 8 0 9
KITENGETO PS 0 5 2 7
KIYANJA MODERN PS 2 4 1 7
KYENGABI PS 0 7 1 8
RWABYOMA PS 1 7 0 8
ST.PETERS BURONZI PS 5 3 0 8
ST.THEREZA BUJUNI PS 4 15 0 19
Total 14 55 5 74
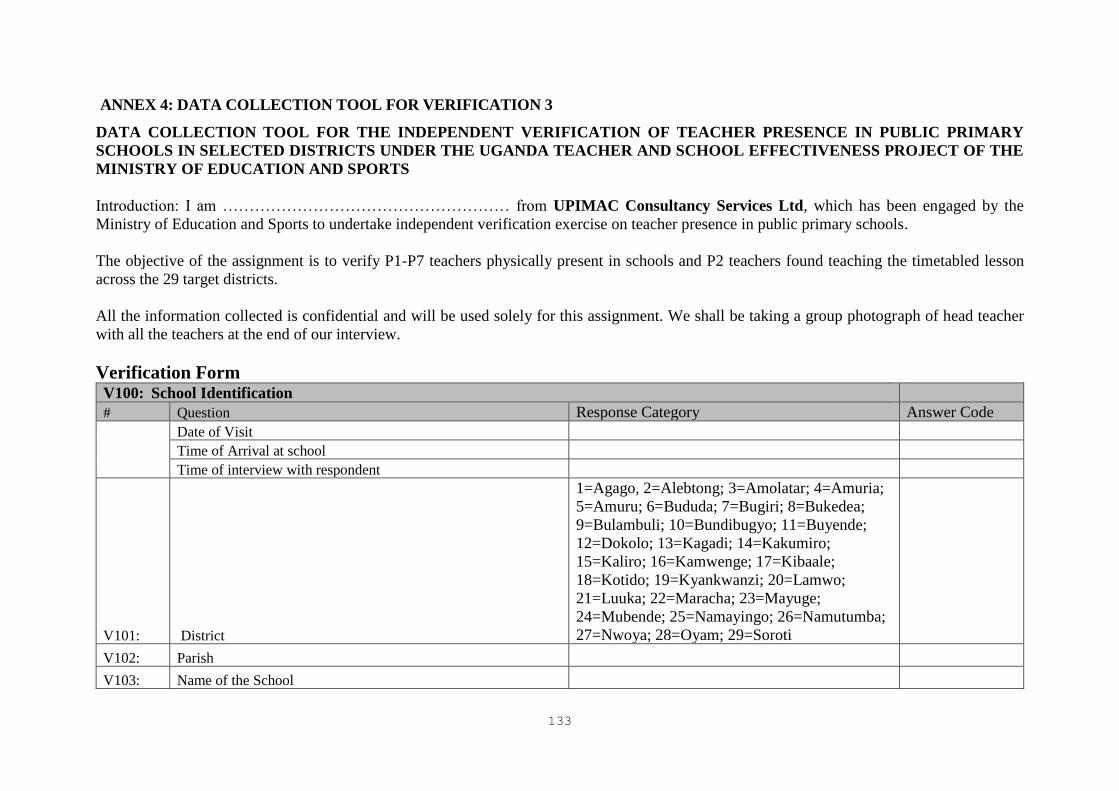
133
ANNEX 4: DATA COLLECTION TOOL FOR VERIFICATION 3
DATA COLLECTION TOOL FOR THE INDEPENDENT VERIFICATION OF TEACHER PRESENCE IN PUBLIC PRIMARY
SCHOOLS IN SELECTED DISTRICTS UNDER THE UGANDA TEACHER AND SCHOOL EFFECTIVENESS PROJECT OF THE
MINISTRY OF EDUCATION AND SPORTS
Introduction: I am ……………………………………………… from UPIMAC Consultancy Services Ltd, which has been engaged by the
Ministry of Education and Sports to undertake independent verification exercise on teacher presence in public primary schools.
The objective of the assignment is to verify P1-P7 teachers physically present in schools and P2 teachers found teaching the timetabled lesson
across the 29 target districts.
All the information collected is confidential and will be used solely for this assignment. We shall be taking a group photograph of head teacher
with all the teachers at the end of our interview.
Verification Form
V100: School Identification
# Question Response Category Answer Code
Date of Visit
Time of Arrival at school
Time of interview with respondent
V101: District
1=Agago, 2=Alebtong; 3=Amolatar; 4=Amuria;
5=Amuru; 6=Bududa; 7=Bugiri; 8=Bukedea;
9=Bulambuli; 10=Bundibugyo; 11=Buyende;
12=Dokolo; 13=Kagadi; 14=Kakumiro;
15=Kaliro; 16=Kamwenge; 17=Kibaale;
18=Kotido; 19=Kyankwanzi; 20=Lamwo;
21=Luuka; 22=Maracha; 23=Mayuge;
24=Mubende; 25=Namayingo; 26=Namutumba;
27=Nwoya; 28=Oyam; 29=Soroti
V102: Parish
V103: Name of the School
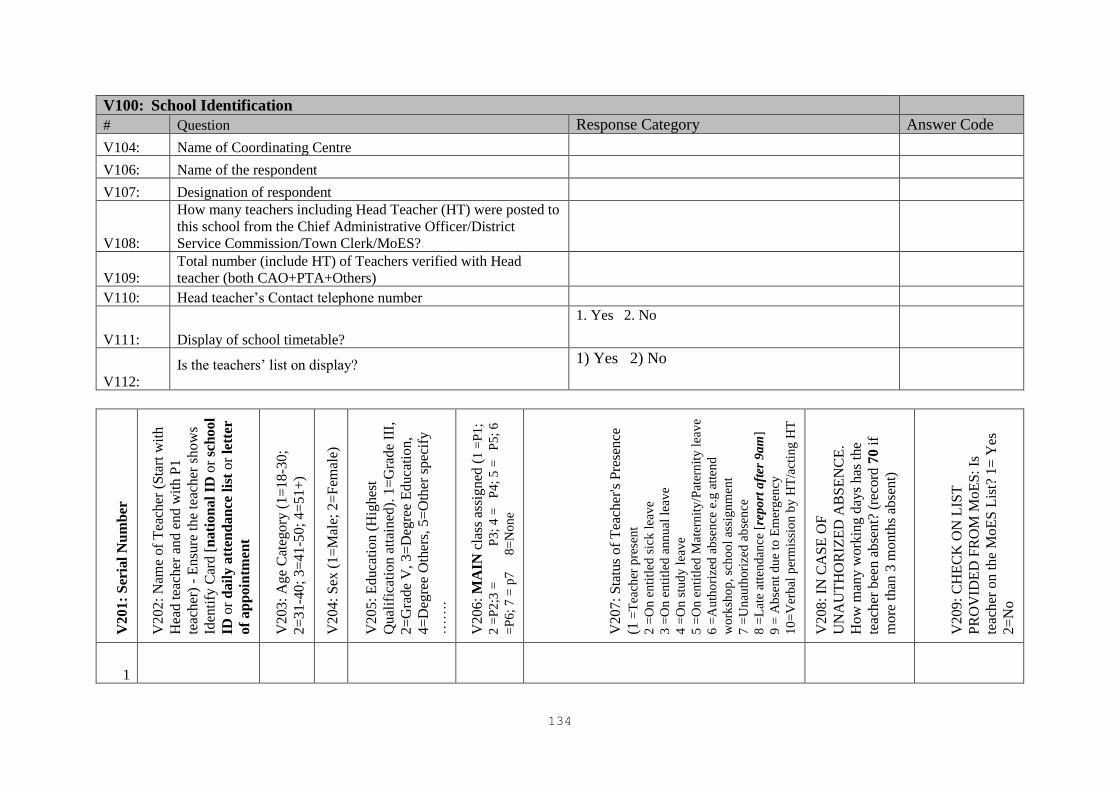
134
V100: School Identification
# Question Response Category Answer Code
V104: Name of Coordinating Centre
V106: Name of the respondent
V107: Designation of respondent
V108:
How many teachers including Head Teacher (HT) were posted to
this school from the Chief Administrative Officer/District
Service Commission/Town Clerk/MoES?
V109: Total number (include HT) of Teachers verified with Head
teacher (both CAO+PTA+Others)
V110: Head teacher’s Contact telephone number
V111: Display of school timetable?
1. Yes 2. No
V112:
Is the teachers’ list on display?
1) Yes 2) No
V20
1:
Ser
ial
Nu
mb
er
V20
2:
Nam
e of
Tea
cher
(S
tart
wit
h
Hea
d t
each
er a
nd
end
wit
h P
1
teac
her
) -
En
sure
th
e te
ach
er s
how
s
Iden
tify
Car
d [
nati
on
al
ID o
r sc
hool
ID o
r d
ail
y a
tten
da
nce
lis
t o
r le
tter
of
ap
poin
tmen
t
V20
3:
Ag
e C
ateg
ory
(1
=18-3
0;
2=
31
-40
; 3=
41
-50
; 4
=5
1+
)
V20
4:
Sex
(1
=M
ale;
2=
Fem
ale)
V20
5:
Ed
uca
tio
n (
Hig
hes
t
Qual
ific
atio
n a
ttai
ned
). 1
=G
rad
e II
I,
2=
Gra
de
V, 3
=D
egre
e E
duca
tio
n,
4=
Deg
ree
Oth
ers,
5=
Oth
er s
pec
ify
……
.
V20
6:
MA
IN c
lass
ass
ign
ed (
1 =
P1
;
2 =
P2
;3 =
P
3;
4 =
P
4;
5 =
P
5;
6
=P
6;
7 =
p7
8=
No
ne
V20
7:
Sta
tus
of
Tea
cher
's P
rese
nce
(1 =
Tea
cher
pre
sen
t
2 =
On
en
titl
ed s
ick
lea
ve
3 =
On
en
titl
ed a
nn
ual
lea
ve
4 =
On
stu
dy
lea
ve
5 =
On
en
titl
ed M
ater
nit
y/P
ater
nit
y l
eav
e
6 =
Au
tho
rize
d a
bse
nce
e.g
att
end
wo
rksh
op
, sc
ho
ol
assi
gn
men
t
7 =
Un
auth
ori
zed
ab
sen
ce
8 =
Lat
e at
ten
dan
ce [
rep
ort
aft
er 9
am
]
9 =
Ab
sen
t d
ue
to E
mer
gen
cy
10
=V
erb
al p
erm
issi
on
by
HT
/act
ing
HT
V20
8:
IN C
AS
E O
F
UN
AU
TH
OR
IZE
D A
BS
EN
CE
.
How
man
y w
ork
ing
day
s has
the
teac
her
bee
n a
bse
nt?
(re
cord
70
if
mo
re t
han
3 m
onth
s ab
sen
t)
V20
9:
CH
EC
K O
N L
IST
PR
OV
IDE
D F
RO
M M
oE
S:
Is
teac
her
on
th
e M
oE
S L
ist?
1=
Yes
2=
No
1
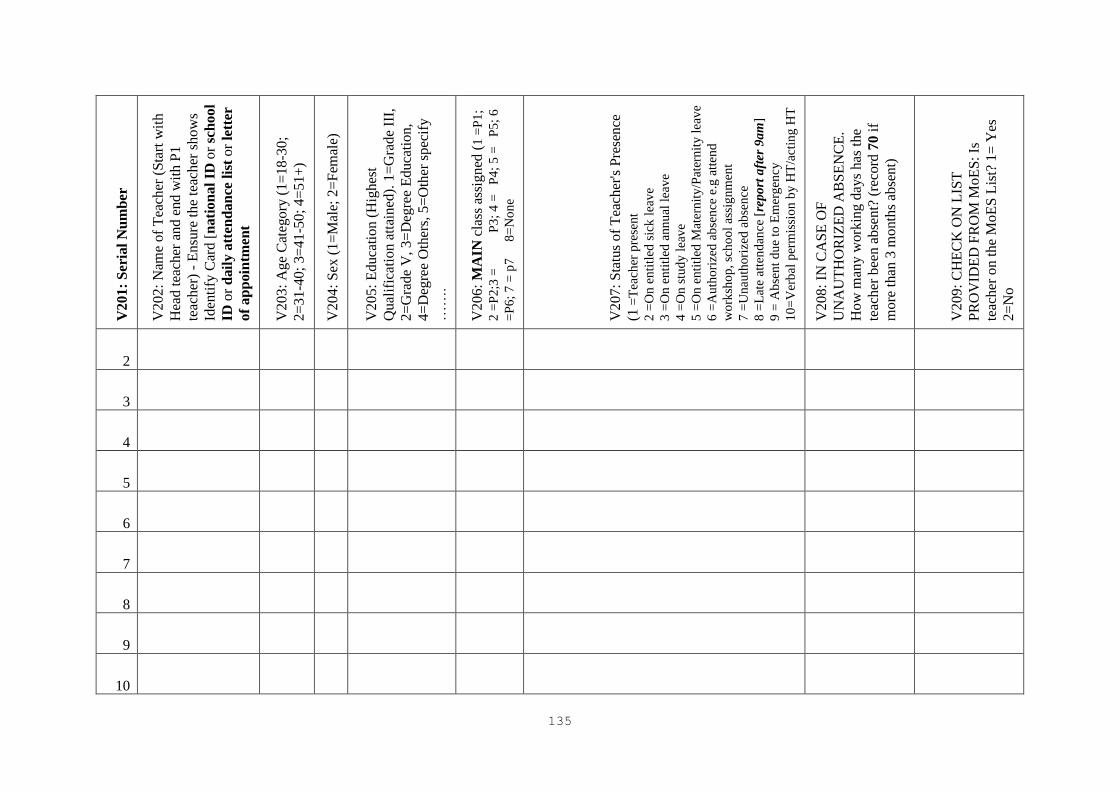
135
V201:
Ser
ial
Nu
mb
er
V202:
Nam
e of
Tea
cher
(S
tart
wit
h
Hea
d t
each
er a
nd e
nd w
ith P
1
teac
her
) -
Ensu
re t
he
teac
her
show
s
Iden
tify
Car
d [
nati
on
al
ID o
r sc
hoo
l
ID o
r d
ail
y a
tten
dan
ce l
ist
or
lett
er
of
ap
poin
tmen
t
V203:
Age
Cat
egory
(1=
18-3
0;
2=
31
-40;
3=
41
-50;
4=
51+
)
V204:
Sex
(1=
Mal
e; 2
=F
emal
e)
V205:
Educa
tion (
Hig
hes
t
Qual
ific
atio
n a
ttai
ned
). 1
=G
rade
III,
2=
Gra
de
V,
3=
Deg
ree
Educa
tion,
4=
Deg
ree
Oth
ers,
5=
Oth
er s
pec
ify
……
.
V206:
MA
IN c
lass
ass
igned
(1
=P
1;
2 =
P2
;3 =
P
3;
4 =
P
4;
5 =
P
5;
6
=P
6;
7 =
p7
8=
No
ne
V207:
Sta
tus
of
Tea
cher
's P
rese
nce
(1 =
Tea
cher
pre
sen
t
2 =
On
en
titl
ed s
ick
lea
ve
3 =
On
en
titl
ed a
nn
ual
lea
ve
4 =
On
stu
dy
lea
ve
5 =
On
en
titl
ed M
ater
nit
y/P
ater
nit
y l
eav
e
6 =
Au
tho
rize
d a
bse
nce
e.g
att
end
wo
rksh
op
, sc
ho
ol
assi
gn
men
t
7 =
Un
auth
ori
zed
ab
sen
ce
8 =
Lat
e at
ten
dan
ce [
rep
ort
aft
er 9
am
]
9 =
Ab
sen
t d
ue
to E
mer
gen
cy
10
=V
erb
al p
erm
issi
on
by
HT
/act
ing
HT
V208:
IN C
AS
E O
F
UN
AU
TH
OR
IZE
D A
BS
EN
CE
.
How
man
y w
ork
ing d
ays
has
the
teac
her
bee
n a
bse
nt?
(re
cord
70
if
more
than
3 m
onth
s ab
sent)
V209:
CH
EC
K O
N L
IST
PR
OV
IDE
D F
RO
M M
oE
S:
Is
teac
her
on t
he
MoE
S L
ist?
1=
Yes
2=
No
2
3
4
5
6
7
8
9
10
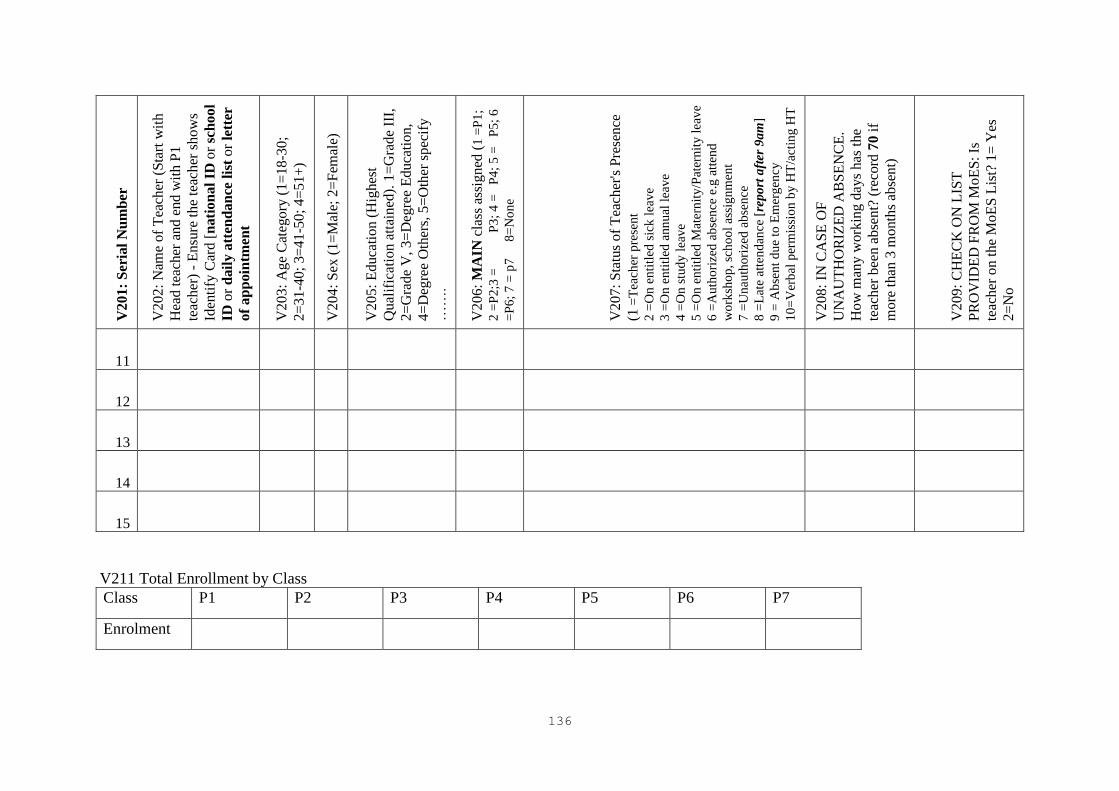
136
V201:
Ser
ial
Nu
mb
er
V202:
Nam
e of
Tea
cher
(S
tart
wit
h
Hea
d t
each
er a
nd e
nd w
ith P
1
teac
her
) -
Ensu
re t
he
teac
her
show
s
Iden
tify
Car
d [
nati
on
al
ID o
r sc
hoo
l
ID o
r d
ail
y a
tten
dan
ce l
ist
or
lett
er
of
ap
poin
tmen
t
V203:
Age
Cat
egory
(1=
18-3
0;
2=
31
-40;
3=
41
-50;
4=
51+
)
V204:
Sex
(1=
Mal
e; 2
=F
emal
e)
V205:
Educa
tion (
Hig
hes
t
Qual
ific
atio
n a
ttai
ned
). 1
=G
rade
III,
2=
Gra
de
V,
3=
Deg
ree
Educa
tion,
4=
Deg
ree
Oth
ers,
5=
Oth
er s
pec
ify
……
.
V206:
MA
IN c
lass
ass
igned
(1
=P
1;
2 =
P2
;3 =
P
3;
4 =
P
4;
5 =
P
5;
6
=P
6;
7 =
p7
8=
No
ne
V207:
Sta
tus
of
Tea
cher
's P
rese
nce
(1 =
Tea
cher
pre
sen
t
2 =
On
en
titl
ed s
ick
lea
ve
3 =
On
en
titl
ed a
nn
ual
lea
ve
4 =
On
stu
dy
lea
ve
5 =
On
en
titl
ed M
ater
nit
y/P
ater
nit
y l
eav
e
6 =
Au
tho
rize
d a
bse
nce
e.g
att
end
wo
rksh
op
, sc
ho
ol
assi
gn
men
t
7 =
Un
auth
ori
zed
ab
sen
ce
8 =
Lat
e at
ten
dan
ce [
rep
ort
aft
er 9
am
]
9 =
Ab
sen
t d
ue
to E
mer
gen
cy
10
=V
erb
al p
erm
issi
on
by
HT
/act
ing
HT
V208:
IN C
AS
E O
F
UN
AU
TH
OR
IZE
D A
BS
EN
CE
.
How
man
y w
ork
ing d
ays
has
the
teac
her
bee
n a
bse
nt?
(re
cord
70
if
more
than
3 m
onth
s ab
sent)
V209:
CH
EC
K O
N L
IST
PR
OV
IDE
D F
RO
M M
oE
S:
Is
teac
her
on t
he
MoE
S L
ist?
1=
Yes
2=
No
11
12
13
14
15
V211 Total Enrollment by Class
Class P1 P2 P3 P4 P5 P6 P7
Enrolment
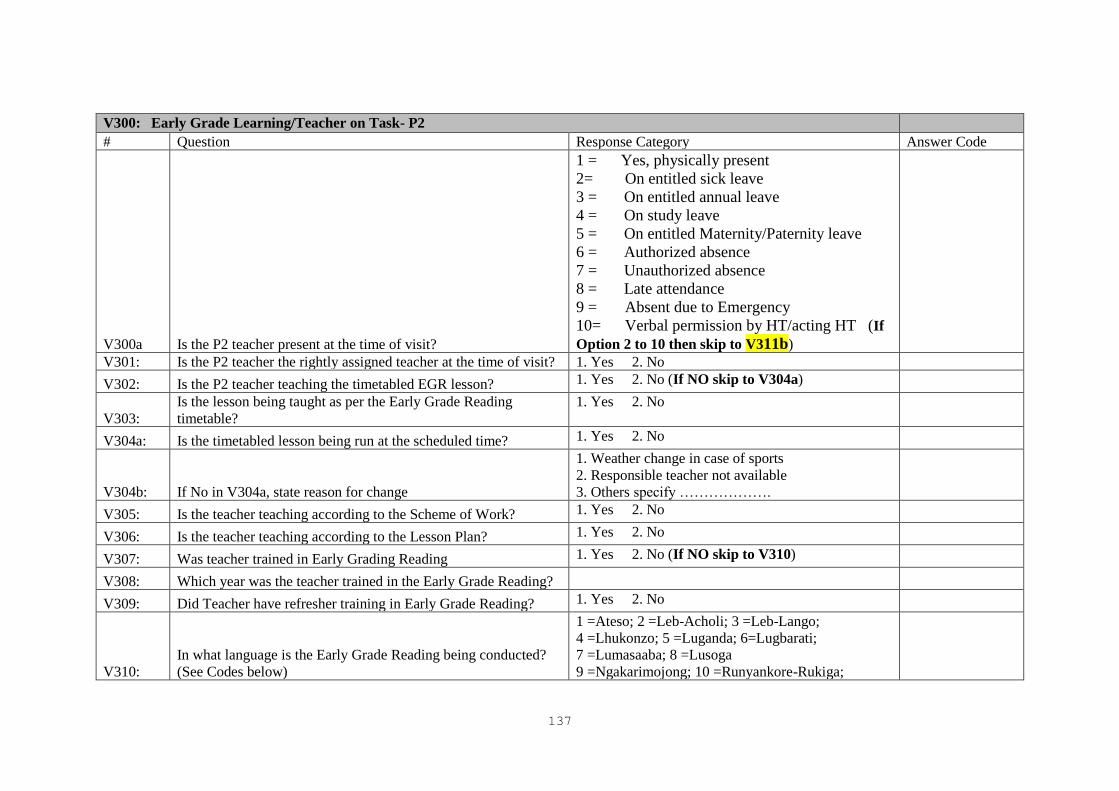
137
V300: Early Grade Learning/Teacher on Task- P2
# Question Response Category Answer Code
V300a Is the P2 teacher present at the time of visit?
1 = Yes, physically present
2= On entitled sick leave
3 = On entitled annual leave
4 = On study leave
5 = On entitled Maternity/Paternity leave
6 = Authorized absence
7 = Unauthorized absence
8 = Late attendance
9 = Absent due to Emergency
10= Verbal permission by HT/acting HT (If
Option 2 to 10 then skip to V311b)
V301: Is the P2 teacher the rightly assigned teacher at the time of visit? 1. Yes 2. No
V302: Is the P2 teacher teaching the timetabled EGR lesson? 1. Yes 2. No (If NO skip to V304a)
V303:
Is the lesson being taught as per the Early Grade Reading
timetable?
1. Yes 2. No
V304a: Is the timetabled lesson being run at the scheduled time? 1. Yes 2. No
V304b: If No in V304a, state reason for change
1. Weather change in case of sports
2. Responsible teacher not available
3. Others specify ……………….
V305: Is the teacher teaching according to the Scheme of Work? 1. Yes 2. No
V306: Is the teacher teaching according to the Lesson Plan? 1. Yes 2. No
V307: Was teacher trained in Early Grading Reading 1. Yes 2. No (If NO skip to V310)
V308: Which year was the teacher trained in the Early Grade Reading?
V309: Did Teacher have refresher training in Early Grade Reading? 1. Yes 2. No
V310:
In what language is the Early Grade Reading being conducted?
(See Codes below)
1 =Ateso; 2 =Leb-Acholi; 3 =Leb-Lango;
4 =Lhukonzo; 5 =Luganda; 6=Lugbarati;
7 =Lumasaaba; 8 =Lusoga
9 =Ngakarimojong; 10 =Runyankore-Rukiga;
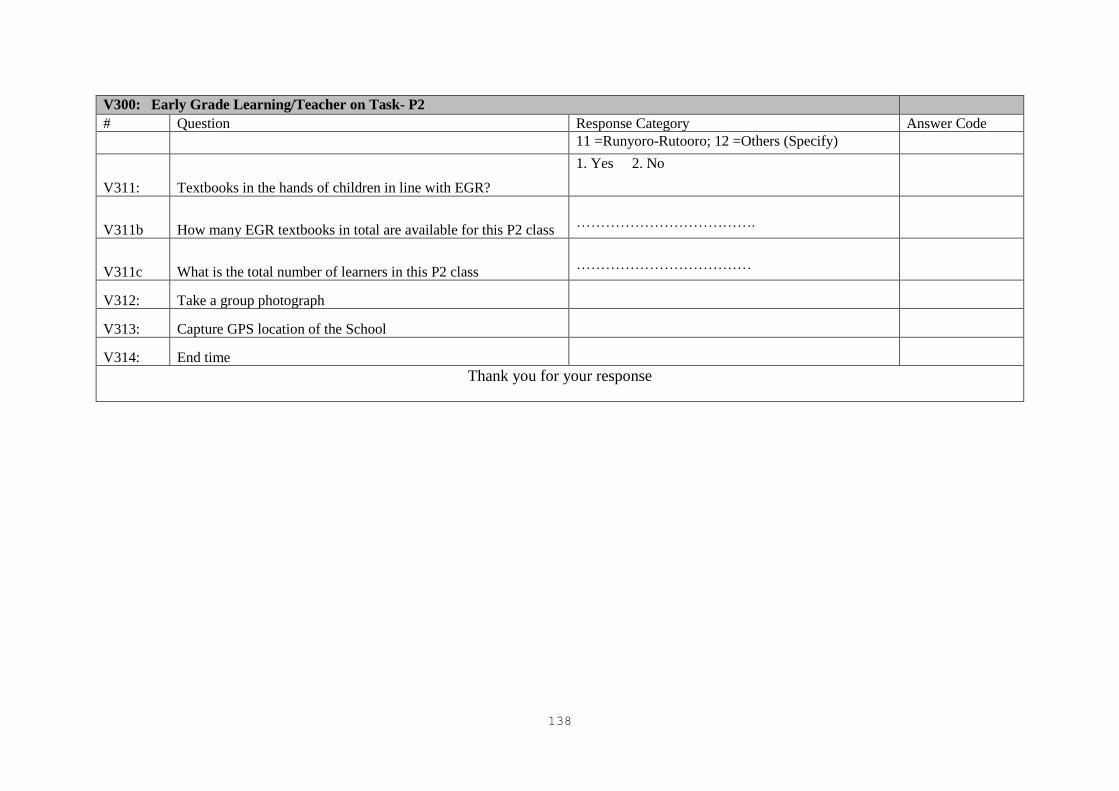
138
V300: Early Grade Learning/Teacher on Task- P2
# Question Response Category Answer Code
11 =Runyoro-Rutooro; 12 =Others (Specify)
V311: Textbooks in the hands of children in line with EGR?
1. Yes 2. No
V311b How many EGR textbooks in total are available for this P2 class
……………………………….
V311c What is the total number of learners in this P2 class
………………………………
V312: Take a group photograph
V313: Capture GPS location of the School
V314: End time
Thank you for your response
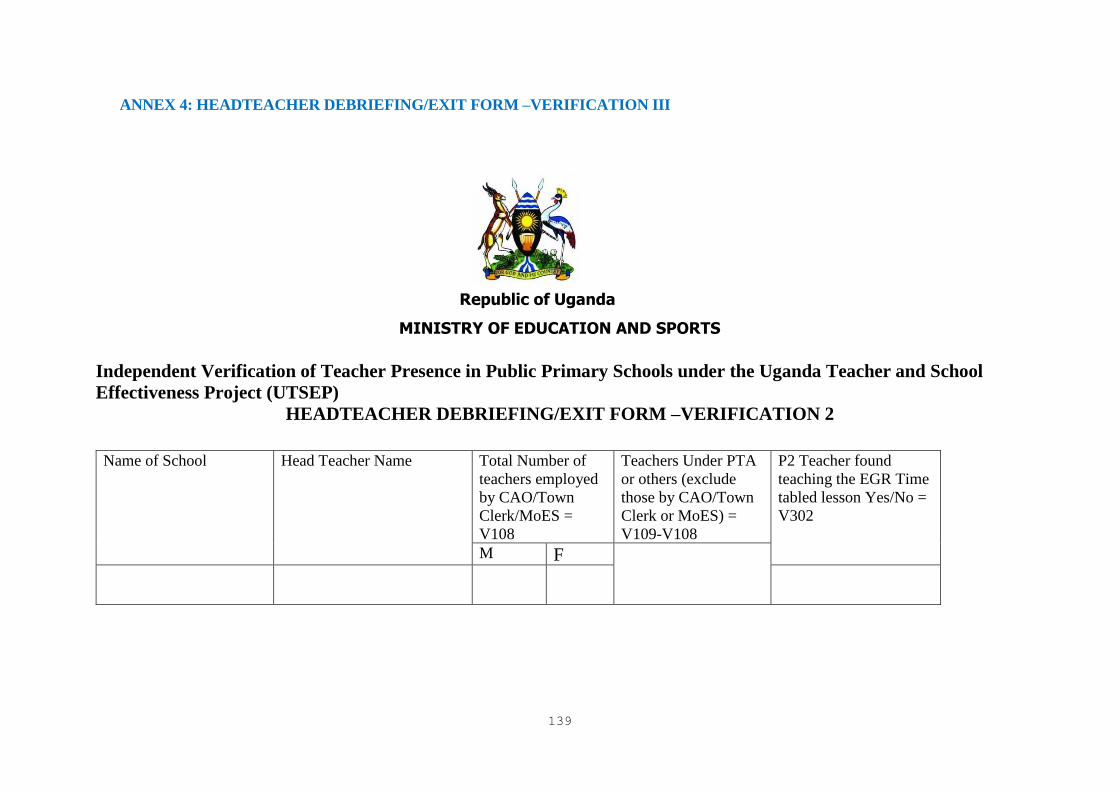
139
ANNEX 4: HEADTEACHER DEBRIEFING/EXIT FORM –VERIFICATION III
Independent Verification of Teacher Presence in Public Primary Schools under the Uganda Teacher and School
Effectiveness Project (UTSEP)
HEADTEACHER DEBRIEFING/EXIT FORM –VERIFICATION 2
Name of School Head Teacher Name Total Number of
teachers employed
by CAO/Town
Clerk/MoES =
V108
Teachers Under PTA
or others (exclude
those by CAO/Town
Clerk or MoES) =
V109-V108
P2 Teacher found
teaching the EGR Time
tabled lesson Yes/No =
V302
M F
MINISTRY OF EDUCATION AND SPORTS
Republic of Uganda
140
141

142

143
ANNEX 5: PHOTO GALLERY