Embed Size (px)
Citation preview

There were 1,730 reported road deaths in 2015, a decrease of 3% compared with 2014. This is the second lowest annual total on record after 2013. There were 45 per cent fewer fatalities in 2015 than a decade earlier in 2006.
RESPONSIBLE STATISTICIAN: Daryl Lloyd Email: [email protected]
FURTHER INFORMATION: Media: 020 7944 6898 Public: 020 7944 6595
Fatalities in reported road accidents: GB, 2005-2015
'05 '15'14
3,201
1,7303%
since ‘14
1,775
• The number of people seriously injured in reported road traffic accidents decreased by 3 per cent to 22,144 in 2015, compared with 2014.
• There was a total of 186,189 casualties of all severities in 2015. This is around 4 per cent lower than in 2014 and the second lowest level on record.
• Vehicle traffic levels increased by 1.6 per cent between 2014 and 2015.
About this articleThis article is an update to the Main Result release, published in June 2016. It reflects some revisions to the 2015 reported road casualties statistics and contains further contextual information.
In this publicationSummary figures ........ p2
Introduction ................ p2
Headline statistics ...... p3
Influencing factors ...... p3
Road user type .......... p5
Road type .................. p16
Explanation of trends p19
Data limitations .......... p27
Background ................ p29
Revisions to the 2015 figuresAll the figures contained in the Annual Report and associated tables include some minor revisions to the 2015 figures.
The majority of the revisions are for Kent (the removal of some accidents that were entered into both of the systems used during the year: the original Kent system and CRASH, resulting in double-counting) and Essex (the correction of some data that Essex Police completed validation on after the June release).
The table on page two highlights how the revisions have affected the 2015 figures. The key point to note is that the fatalities figure fell by two. This is from the removal of a death in each of Cheshire and Hampshire (suicides) and Essex (natural causes), and the addition of one in the West Midlands which had not been provided in time for the June release.
Reported road casualties Great Britain: 2015 annual report
Reported road casualties in Great Britain: main results 2015
Back Forward

The summary table below shows the number of reported road casualties in Great Britain in
2015 compared with previous years.
Definition
Casualty: A person killed or injured in an accident. Casualties are sub-divided into killed, seriously injured and slightly injured.
A full list of the definitions used in this release can be
This publication provides the number of personal-injury road traffic accidents in Great Britain that were reported to the police in 2015. It also includes the number of people killed or injured in these accidents and which road user group they were in.
The figures make up part of a long running series going back to 1926. The current set of definitions and detail of information goes back to 1979, providing a long period for comparison.
The information used to create these statistics are collected by police forces, either through officers attending the scene of accidents or from members of the public reporting the accident in police stations after the incident.
There is no obligation for people to report all personal-injury accidents to the police (although there is an obligation under certain conditions, as outlined in the Road Traffic Act). These figures, therefore, do not represent the full range of all accidents or casualties in the country. Please see the section on strengths and weaknesses of the data for further details.
All accidents that were reported to the police and that occurred on a public highway involving at least one motor vehicle, horse rider or pedal cyclist, and where at least one person was injured are included. Accidents that happened on private land (including private drives) or car parks are not included in the statistics.
Further Information
Information about the data collected, notes, definitions and guidance is available at www.gov.uk/government/collections/road-accidents-and-safety-statistics.
The raw data used to create the statistics (except for a few sensitive and personal variables) are available for reuse at data.gov.uk/dataset/road-accidents-safety-data.
Reported road casualties in Great Britain: main results 2015 - Page 2
Last year Five years ago 2010-2014 average
2014 2010Killed 1,732 1,730 3% 6% 4%Seriously injured 22,137 22,144 3% 2% 2%KSI1 23,869 23,874 3% 3% 2%Slightly injured 162,340 162,315 4% 12% 6%
All casualties 186,209 186,189 4% 11% 6%1 Killed or seriously injured.
Percentage change from:
2015(original)
2015(revised)
Summary
Introduction
ForwardBackHome

A total of 1,730 people were killed in reported road traffic accidents in Great Britain in 2015. Although this represents a decrease of 45 fatalities (or 2.5 per cent) from 2014, it is likely that natural variation in the figures explains the change. It is the second lowest year on record after 2013. However, in statistical terms the number of fatalities has remained unchanged since 2011. There were 45 per cent fewer fatalities in 2015 than a decade earlier in 2006 and 4 per cent fewer than the 2010-14 average.
There has been no clear trend in the number of fatalities since around 2011 (see front page chart). Prior to that, and particularly during 2006 to 2010, the general trend was for fatalities to fall. Since that point, though, most of the year on year changes are either explained by one-off effects (for instance, the snow in 2010) or natural variation. The evidence, points towards Britain being in a period when the fatality numbers are fairly stable and most of the changes relate random variation.
In 2015, there were 22,144 seriously injured casualties in reported road traffic accidents. This is the second lowest year behind 2013 and 2.9 per cent lower than the 22,807 serious injuries in 2014. This decrease is statistically significant, so it is more likely than not that the drop reflects genuine changes on British roads.
There was a total of 186,189 casualties of all severities in reported road traffic accidents during 2015. This is around 4 per cent lower than in 2014 and the second lowest level on record.
A total of 140,056 personal-injury road traffic accidents were reported to the police in 2015. Of these accidents, 1,616 resulted in at least one fatality.
There is no single underlying factor that drives road casualties. Instead, there are a number of influences. These include:
• The distance people travel (which is partly affected by economic externalities)
• The mix of transport modes used
• Behaviour of drivers, riders and pedestrians
• Mix of groups of people using the road (e.g. changes in the number of newly qualified or older drivers)
2010-2014 average
The 2010-14 average is used as a comparison time frame in both this publication and the accompanying statistical tables. This average has been updated from the 2005-09 average used recently to reflect the latest trends.
Reported road casualties in Great Britain: main results 2015 - Page 3
Headline statistics
Factors that affect road casualty numbers

• External effects such as the weather, which can influence behaviour (for instance, encouraging / discouraging travel, or closing roads) or change the risk on the roads (by making the road surface more slippery)
It is very hard to disentangle many of these factors between years. In particular, police-reported road casualty data only gives a limited amount of information about behaviour changes and it is very rare to be able to identify such changes between individual years.
A considerable amount of research has been carried out looking at the relationship between economic activity and road casualties. The OECD produced a comprehensive report on this topic in 20151. The simplest message from the research is that accidents and casualties increase as economic development increases in a country. The main reason for this increase is that as the economy grows, so do traffic volumes. Greater traffic volumes then result in more incidents. This continues until a critical threshold in economic development is reached. At that point, better training, vehicle standards, enforcement and engineering all start to dominate to counteract the effect from traffic increases. As a result, the number of incidents and resulting casualties start to decrease, even if traffic volumes continue to grow.
In times of economic stagnation or recession three key mechanisms come into play:
• Lower traffic growth rates (or even decreases in traffic volumes – as happened in Britain in the 2008-09 recession)
• Disproportionate reductions in the exposure of high-risk groups (for instance, younger drivers)
• Reductions in more risky behaviour (for instance, people might drive more slowly to save fuel, or drink and drive less)
Chart 1 shows the rolling five year average for the year on year change in gross domestic product (GDP) for the UK along with traffic volumes and the number of casualties who were killed or seriously injured (KSI) for Great Britain.
Although GDP and traffic is not perfectly aligned, since the mid-1970s there is a clear relationship in that they move broadly in the same direction. For example, GDP grew strongly between 1993 and 2007. During this period, traffic also grew each year (albeit, not as strongly). The downturn and recession around 2007 to 2012 resulted in very low levels of GDP growth (with economic contraction for some of the years). Traffic growth halted entirely during this period and actually decreased for most of the period.
The relationship with KSI casualties is far more complex. In general, KSI casualties have fallen in most years since the 1970s. However, the periods of greatest decreases have coincided with weaker GDP growth. This is particularly marked in the period 2007 to 2010 when KSIs dropped
1 www.itf-oecd.org/why-does-road-safety-improve-when-economic-times-are-hard
Reported road casualties in Great Britain: main results 2015 - Page 4

by between 4 and 9 per cent every year. By 2011, however, KSI casualties increased, and most subsequent decreases were of a much small magnitude than earlier.
Whilst not certain, all of this indicates that while Britain is in a period of stronger growth (in comparison with the recent recession) there is unlikely to be as large falls in casualties as there were earlier on without further significant interventions.
Chart 1: Five year rolling average of growth in traffic, GDP and KSIs
There are two key ways of looking at casualty numbers. The first is in terms of absolute counts. On this basis, car occupants tend to come out as the worst road user group as they account for the greatest number of casualties each year. However, this is unsurprising as cars account for around 80 per cent of the traffic on British roads.
The second approach is to look at casualty rates in terms of the number of casualties per mile travelled. In these terms, the road user groups are split into two clearly distinctive groups. The first, with much higher casualty rates, are typically referred to as vulnerable road users (usually defined as pedestrians, pedal cyclists, motorcyclists and, albeit with very low casualty numbers, horse riders). All of these groups have much higher casualty rates per mile travelled in comparison with the other road user groups, as shown in Chart 2.
-8%
-4%
0%
4%
8%
12%
1955 1965 1975 1985 1995 2005 2015
5-ye
ar m
ovin
g av
erag
e pe
rcen
tage
ann
ual c
hang
e
UK GDP
All motor vehicle traffic
KSI casualties
Further Information
ONS GDP data
Road traffic data
The chart shows periods of
recession shaded grey.
Reported road casualties in Great Britain: main results 2015 - Page 5
Casualties by road user type

Chart 2: Casualty and fatality rates per billion passenger miles by road user type: GB, 2014
1. Pedestrian and bus passenger based on 2014 mileage figures scaled up for population growth.
The pattern for pedal cycles is an interesting one: the overall casualty rate of around 5,800 casualties per billion miles cycled is close to the motorcycling casualty rate, whereas the fatality rate of around 31 per billion miles cycled is much closer to the pedestrian rate.
In 2015, car occupants accounted for 44 per cent of road deaths, pedestrians 24 per cent, motorcyclists 21 per cent and pedal cyclists 6 per cent.
Useful links
National Travel Survey, 2014: www.gov.uk/government/statistics/national-travel-survey-2014
Annual bus statistics: year ending March 2015: www.gov.uk/government/statistics/annual-bus-statistics-year-ending-march-2015
Tables
• Reported road casualties by road user type and severity, Great Britain, table RAS30001.
• Reported casualties by road user type, age and severity, Great Britain, table RAS30002.
• All reported casualties by road user type, Great Britain, table RAS30004.
• Reported killed or seriously injured casualties, by road user type, Great Britain, table RAS30005.
Fatalities by road user type (compared with 2014)
Fatalities % share
2,108 5,824 6,676273 188 76 72
35.8 30.9 122.31.8 0.2 0.5 1.9
0
20
40
60
80
100
120
140
0
1,000
2,000
3,000
4,000
5,000
6,000
7,000
Fata
lity
rate
per
bill
ion
pass
enge
r mile
s
Cas
ualty
rate
per
bill
ion
pass
enge
r mile
s
Vulnerable road user groups
1 1
% shareFatalities
44%
24%
21%
6%
Other 6%
4089%
7545%
3658%
10012%
10329%
Reported road casualties in Great Britain: main results 2015 - Page 6

Car occupants continue to account for the largest proportion of casualties of all severities. A total of 754 car occupants were killed in 2015, down just over 5 per cent (or 42 fatalities) from the 797 in 2014. All car occupant casualties of other severities also fell from 2014: seriously injured casualties were down by 2 per cent to 7,888 (KSI casualties therefore fell to 8,643), slightly injured casualties fell by 3 per cent to 103,065, and overall casualties fell by 3 per cent to 111,708.
Although this was the lowest number of car occupant fatalities on record, there were fewer seriously and slightly injured casualties in 2013 than in 2015.
Car occupant fatalities are now 8 per cent below the 2010-14 average, seriously injured casualties are 4 per cent below the average, and slightly injured casualties are also 8 per cent below the average.
Car occupants
754fatalities
7,888seriously injured
103,065slightly injured
247.7billion vehicle miles
(motor vehicle traffic)
5%
2%
3%
1%
% change since ‘14
% change from ‘10 - ‘14 avg
8%
4%
8%
3%
44% of road deaths
1,675
2005 2010 2015
75455%
since ‘05
Car occupant fatalities: 2005 - 2015
A total of 754 car occupants were killed in 2015, down just over 5 per cent (or 43 fatalities) from the 797 in 2014. All car occupant casualties of other severities also fell from the 2014 levels.
111,707 car occupant casualties of which
14% were drivers aged 17-24
32% were passengers
50%were male50%
were male
Reported road casualties in Great Britain: main results 2015 - Page 7

Car and taxi traffic in Great Britain increased by 1.1 per cent from 2014 to 2015, and is currently 2.7 per cent above the 2010-14 average. Although increases in car and taxi traffic can lead to an increase in accidents, this is not a given as other factors can have a stronger influence on road safety.
Chart 3: Number of killed and seriously injured car occupants compared with car and taxi traffic, GB:2005 - 2015
2015 figures are shown
in the circles with the
2014-2015 percentage
change represented by
the arrows. bvm - billion
vehicle miles.
0
50
100
150
200
250
2005
2006
2007
2008
2009
2010
2011
2012
2013
2014
2015
Inde
x: 2
010-
14 a
vera
ge =
100
14-15 % change
5.4%
1.8%
Seriously injured
Killed
Car & taxi traffic
1.1%
754
7,888
247.7bvm
2015 figure
Reported road casualties in Great Britain: main results 2015 - Page 8

After having the largest rise of any of the road user groups in 2014, pedestrian casualties have now fallen back down to around the 2013 level. A total of 408 pedestrians were killed in reported road traffic accidents in 2015, down from 446 in 2014, and just above the low of 398 in 2013.
The 2014 Main Results statistical release, published in June 2015, stated that the increase in pedestrian fatalities, although large in percentage terms, was unlikely to be statistically significant. The fact that the levels have dropped back in 2015 supports this hypothesis. It is most likely that 2014 was an unusual year and the rise noted was probably as a result of
Pedestrians
408fatalities
4,940seriously injured
18,713slightly injured
9%
2%
3%
% change since ‘14
% change from ‘10 - ‘14 avg
4%
6%
4%
24% of road deaths
671
2005 2010 2015
40839%
since ‘05
Pedestrian fatalities: 2005 - 2015
A total of 408 pedestrians were killed in 2015, down from 446 in 2014, and just above the low of 398 in 2013. All pedestrian casualties of other severities also fell from 2014.
24,061 pedestrian casualties of which
25% occurred between 4pm and 7pm
4% were aged 80 or over
11.4billion miles1
1% 0%
1. Estimated - see chart 4 below
Regression to the mean A statistical phenomenon in which a series of measurements will return to the average or normal level following an abnormally high or low outcome or reading. In terms of road casualties, any sudden step-change in casualty numbers without an explanatory mechanism (e.g. pedestrian fatalities suddenly increasing by 12 per cent in one year) will revert to roughly the previous level after a short period.
55%were male
Reported road casualties in Great Britain: main results 2015 - Page 9

chance rather than any underlying pattern. The return to the previous levels in 2015 will be part of a statistical phenomenon called regression to the mean.
The number of seriously injured pedestrians in 2015 is 2 per cent lower than in 2014. At 4,940 it is still the lowest year on record, just under the level set in 2013. Similarly the number of slightly injured casualties decreased by 3 per cent to 18,713, just above the 2013 figure, which was the previous low.
There is some suggestion that there is a general downward trend in the number of seriously injured pedestrians, with levels now 6 per cent below the 2010-14 average. However, the number of fatalities has remained much the same since 2010. Any changes since that point are most likely to be as a result of natural variation and cannot be attributed to underlying causes.
Chart 4: Number of killed and seriously injured pedestrians compared with the distance walked, GB: 2005 - 2015
Distance walked in 2015
estimated by using the
2014 National Travel
Survey average distance
multiplied by 2015
population. bm - billion
miles.
2015 figures are shown
in the circles with the
2014-2015 percentage
change represented by
the arrows.0
20
40
60
80
100
120
140
160
180
2005
2006
2007
2008
2009
2010
2011
2012
2013
2014
2015
Inde
x: 2
010-
14 a
vera
ge =
100
14-15 % change
8.5%
2.4%
Seriously injured
Killed
Distance walked
1%111.4bm
4,940
408
2015 figure
Reported road casualties in Great Britain: main results 2015 - Page 10

Although the number of pedal cyclists killed on the roads in 2015 was the lowest figure on record, the 100 fatalities is very similar to the figures for each year since 2008. Since that point, the number of deaths has been between 104 (2009) and 118 (2012), with 113 in 2014. In statistical terms, there has been no change in the number of fatalities over this period.
In contrast, the number of pedal cyclists seriously injured has generally been rising since the lowest point in 2004. Although there was a fall of 5 per cent to 3,239 serious injuries in 2015, this is still the second highest year since 1997.
Overall pedal cyclist casualties were lower in 2015 than any year since 2010. This pattern might be explained by an estimated 6 per cent fall in cycling traffic in 2015 in comparison with 2014.
Pedal cyclists
100fatalities
3,239seriously injured
15,505slightly injured
3.2billion vehicle
miles
12%
5%
13%
6%
% change since ‘14
% change from ‘10 - ‘14 avg
10%
4%
3%
3%
Although the number of pedal cyclists killed on the roads in 2015 was the lowest figure on record, the 100 fatalities is very similar to the level seen since 2008. All cyclist casualties of other severities also fell from 2014.
6% of road deaths
148
2005 2010 2015
10032%
since ‘05
18,844 pedal cyclist casualties of which
81%were male
Pedal cyclist fatalities: 2005 - 2015
10% were aged 0-15
80% occurred on a 30 mph road
Reported road casualties in Great Britain: main results 2015 - Page 11

Rather than the decrease in cyclist casualties in 2015 reflecting an improvement in road safety, it might relate more to exposure. Pedal cycling traffic rose by 10 per cent between 2013 and 2014 (although this is a revision to the original estimate of 4 per cent). As was noted in the Main Results 2014 report, 2014 was a very warm year, particularly during spring and autumn. As temperatures rise, more cyclists tend to use the roads. Therefore it is likely that good weather in 2014 led to a large spike in cycling and a related increase in casualties. As 2015 was not as warm (particularly during the periods of the year where cycling is more common), cycling traffic has reverted to a level that would be more expected and casualties have followed.
Chart 5: Number of killed and seriously injured pedal cyclist compared with pedal cycle traffic, GB: 2005 - 2015
2015 figures are shown
in the circles with the
2014-2015 percentage
change represented by
the arrows.
Tables
• Pedal cycle traffic (vehicle miles/kilometres) in Great Britain, annual from 1949, table TRA0401.
0
20
40
60
80
100
120
140
2005
2006
2007
2008
2009
2010
2011
2012
2013
2014
2015
Inde
x: 2
010-
14 a
vera
ge =
100
14-15 % change
11.5%
4.8%
Seriously injured
Killed
Pedal cycle traffic
6.1%
3,239
100
3.2bvm
2015 figure
Reported road casualties in Great Britain: main results 2015 - Page 12

Motorcycling fatalities were the only significant road user group and severity to increase during 2015. In total, 365 motorcyclists were killed during the year, up 8 per cent from 339 in 2014. This figure is roughly as in 2011, but still at a historically low level. It will only become clearer next year whether this is a step-change from the roughly 330 killed over each of the previous three years.
The number of seriously injured motorcyclists seem to be more stable, with relatively little change since 2009. There were 5,042 serious injuries in 2015, down 5 per cent from 2014, but up on the 4,866 in 2013. These changes appear to be related to natural variation in the accident numbers.
The pattern for slightly injured motorcyclist casualties has followed serious injuries. There has been a 1 per cent fall to 14,511 from the 2014 levels. Even with the decrease, though, 2015 was still above the 2010-14 average for overall motorcycling casualties.
Motorcyclists
365fatalities
5,042seriously injured
14,511slightly injured
2.8
8%
5%
2%
% change since ‘14
% change from ‘10 - ‘14 avg
4%
0%
3%
1%
In total, 365 motorcyclists were killed during 2015, up 8 per cent from 339 in 2014. Motorcyclist casualties of other severities fell from 2014.
billion vehicle miles (motor vehicle traffic)
0%
21% of road deaths
569
2005 2010 2015
36536%
since ‘05
Motorcyclist fatalities: 2005 - 2015
19,918 motorcyclist casualties of which
32% were aged 17-24
44% occurred in London and the South East
91%were male
Reported road casualties in Great Britain: main results 2015 - Page 13

Motorcycle traffic remained virtually unchanged from 2014 at 2.8 billion vehicle miles. The relatively small change in motorcycle traffic on British roads over the last few years probably explains why motorcycling casualties are fluctuating year on year at the moment.
Chart 6: Number of killed and seriously injured motorcycle users compared with motorcycle traffic, GB: 2005 - 2015
2015 figures are shown
in the circles with the
2014-2015 percentage
change represented by
the arrows.
Children (aged 15 or under)
54fatalities
1,910seriously injured
14,139slightly injured
11.9mpopulation
2%
6%
3%
1%
% change since ‘14
% change from ‘10 - ‘14 avg
3%
13%
9%
2%
There was one additional child death in 2015 over 2014, resulting in a total of 54 fatalities. Child casualties of other severities fell from 2014.
3% of road deaths
141
2005 2010 2015
5462%
since ‘05
Child fatalities: 2005 - 2015
0
20
40
60
80
100
120
140
160
180
2005
2006
2007
2008
2009
2010
2011
2012
2013
2014
2015
Inde
x: 2
010-
14 a
vera
ge =
100
14-15 % change
7.7%
4.8%
Seriously injured
Killed
Motorcycle traffic
5,042
2.8bvm
365
2015 figure
0%
Reported road casualties in Great Britain: main results 2015 - Page 14
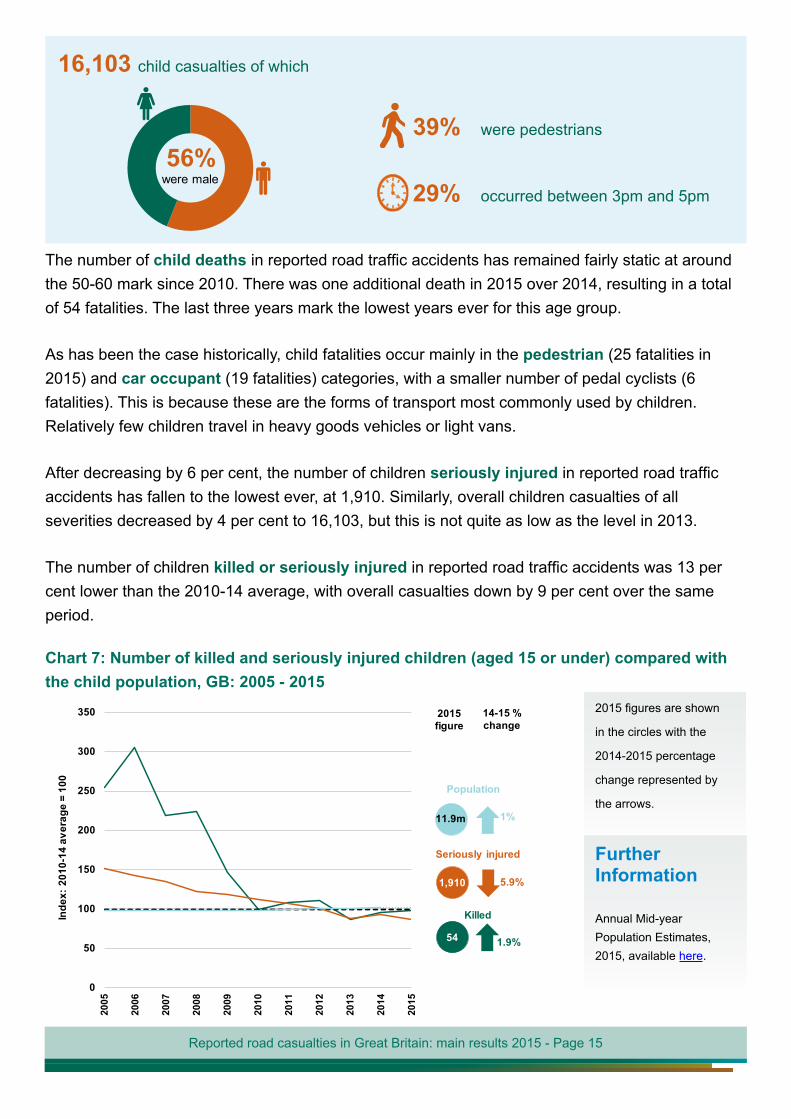
The number of child deaths in reported road traffic accidents has remained fairly static at around the 50-60 mark since 2010. There was one additional death in 2015 over 2014, resulting in a total of 54 fatalities. The last three years mark the lowest years ever for this age group.
As has been the case historically, child fatalities occur mainly in the pedestrian (25 fatalities in 2015) and car occupant (19 fatalities) categories, with a smaller number of pedal cyclists (6 fatalities). This is because these are the forms of transport most commonly used by children. Relatively few children travel in heavy goods vehicles or light vans.
After decreasing by 6 per cent, the number of children seriously injured in reported road traffic accidents has fallen to the lowest ever, at 1,910. Similarly, overall children casualties of all severities decreased by 4 per cent to 16,103, but this is not quite as low as the level in 2013.
The number of children killed or seriously injured in reported road traffic accidents was 13 per cent lower than the 2010-14 average, with overall casualties down by 9 per cent over the same period.
Chart 7: Number of killed and seriously injured children (aged 15 or under) compared with the child population, GB: 2005 - 2015
16,103 child casualties of which
2015 figures are shown
in the circles with the
2014-2015 percentage
change represented by
the arrows.
39% were pedestrians
29% occurred between 3pm and 5pm
Further Information
Annual Mid-year Population Estimates, 2015, available here.
0
50
100
150
200
250
300
350
2005
2006
2007
2008
2009
2010
2011
2012
2013
2014
2015
Inde
x: 2
010-
14 a
vera
ge =
100
14-15 % change
1.9%
5.9%
Seriously injured
Killed
Population
54
1,910
11.9m
2015 figure
1%
56%were male
Reported road casualties in Great Britain: main results 2015 - Page 15

As was noted in the publications relating to the 2014 statistics, much of the increase in fatalities that year were of people aged 60 years old or older. We suggested at the time that the large increase was likely to relate partly to an increase in population for this group, but mostly as a result of natural variation in the figures.
The number of deaths in this age group in 2015 fell by 8 per cent to 492, and the number of serious injuries fell by 2 per cent to 3,945. Although these levels are above the 2013 figures, the number of people killed is almost the same as in 2012 and considerably lower than most of the previous years. In contrast, though, 2014 and 2015 represent the two highest years in terms of seriously injured casualties for over a decade.
In particular, the road user groups that had the largest increases in 2014 (pedestrians, car occupants and pedal cyclists) all fell back to around (or a little above) the 2013 levels. The exception to this was seriously injured motorcyclists, which rose by 34 casualties (10 per cent).
This evidence suggests that the theories outlined last year are probably correct. There is some signs of increases in older casualties, probably relating to a relatively rapidly growing population in that age group, but the large changes observed were as a result of chance rather than any specific mechanism.
As has been the pattern over recent years, the greatest change in casualty and accident numbers is on 20 mph roads. Although the number of people killed on 20 mph roads fell by 50 per cent in 2015, the fall was from 28 to 14 and therefore is highly unlikely to be meaningful. Overall the number of casualties on 20 mph roads rose by 27 per cent from 2014 to 2015.
In the past we have noted that local highway authorities have probably been implementing more 20 mph speed limits and zones. Unfortunately the Department does not have any comprehensive data to look at this evidence. We have run a voluntary survey with local highways authorities in England. Although only a quarter of authorities responded with data, the survey indicates that the number of miles of road with 20 mph speed limits increased by about a quarter between 2014 and 2015. This is roughly the same level of increase as the number of accidents and casualties on these roads. This supports the hypothesis that the increases in
Casualties by road type
Definitions
Built-up roads: Accidents on “built-up roads” are those which occur on roads with speed limits (ignoring temporary limits) of 40 mph or less.
Non built-up roads refer to speed limits over 40 mph.
Motorway accidents are shown separately and are excluded from the totals for built-up and non built-up roads.
Older casualties (aged 60 and over)
2010-2014 average
Older (aged 60 and over) casualties compared with the 2010-2014 average:
Killed 0%
Serious Ý 6%
KSI Þ 2%
All casualties Þ 1%
60+
Reported road casualties in Great Britain: main results 2015 - Page 16
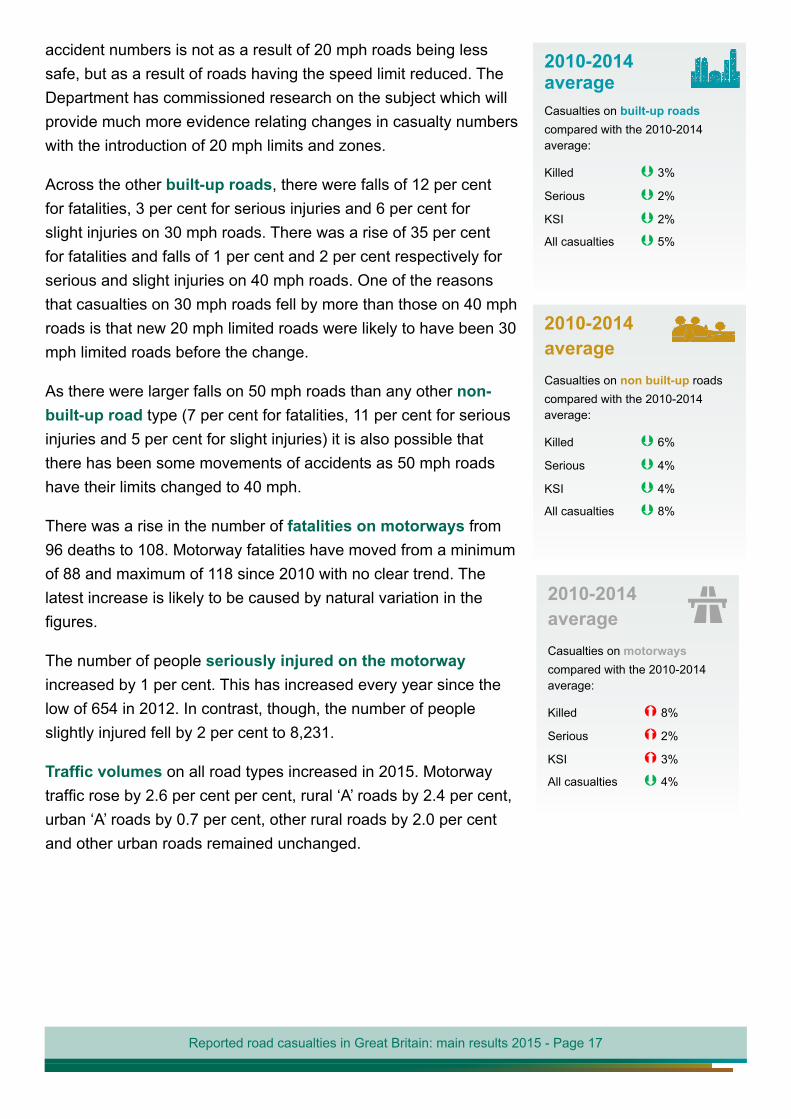
accident numbers is not as a result of 20 mph roads being less safe, but as a result of roads having the speed limit reduced. The Department has commissioned research on the subject which will provide much more evidence relating changes in casualty numbers with the introduction of 20 mph limits and zones.
Across the other built-up roads, there were falls of 12 per cent for fatalities, 3 per cent for serious injuries and 6 per cent for slight injuries on 30 mph roads. There was a rise of 35 per cent for fatalities and falls of 1 per cent and 2 per cent respectively for serious and slight injuries on 40 mph roads. One of the reasons that casualties on 30 mph roads fell by more than those on 40 mph roads is that new 20 mph limited roads were likely to have been 30 mph limited roads before the change.
As there were larger falls on 50 mph roads than any other non-built-up road type (7 per cent for fatalities, 11 per cent for serious injuries and 5 per cent for slight injuries) it is also possible that there has been some movements of accidents as 50 mph roads have their limits changed to 40 mph.
There was a rise in the number of fatalities on motorways from 96 deaths to 108. Motorway fatalities have moved from a minimum of 88 and maximum of 118 since 2010 with no clear trend. The latest increase is likely to be caused by natural variation in the figures.
The number of people seriously injured on the motorway increased by 1 per cent. This has increased every year since the low of 654 in 2012. In contrast, though, the number of people slightly injured fell by 2 per cent to 8,231.
Traffic volumes on all road types increased in 2015. Motorway traffic rose by 2.6 per cent per cent, rural ‘A’ roads by 2.4 per cent, urban ‘A’ roads by 0.7 per cent, other rural roads by 2.0 per cent and other urban roads remained unchanged.
2010-2014 averageCasualties on built-up roads compared with the 2010-2014 average:
Killed Þ 3%
Serious Þ 2%
KSI Þ 2%
All casualties Þ 5%
2010-2014 averageCasualties on motorways compared with the 2010-2014 average:
Killed Ý 8%
Serious Ý 2%
KSI Ý 3%
All casualties Þ 4%
2010-2014 averageCasualties on non built-up roads compared with the 2010-2014 average:
Killed Þ 6%
Serious Þ 4%
KSI Þ 4%
All casualties Þ 8%
Reported road casualties in Great Britain: main results 2015 - Page 17

Chart 8: Number of fatalities by road type, GB 2005 - 2015
The majority of injured casualties occurred on built-up roads (72 per cent of total casualties in 2015). However, the majority of fatalities occurred on non-built-up roads (just over a half). The reason for this is that non-built-up roads have higher average speeds which more frequently result in more serious collisions. Although motorways carry around 21 per cent of traffic, they only account for 6 per cent of fatalities and 5 per cent of injured casualties.
Chart 9: Casualties by severity and road type, GB: 2015
2015 figures are shown
in the circles with the
2014-2015 percentage
change represented by
the arrows.
All
Slight
Serious
Fatal 43% 51%
67% 30%
73% 22%
72% 23%
MotorwayBuilt-up Non built-up
6%
3%
5%
5%
0
50
100
150
200
250
2005
2006
2007
2008
2009
2010
2011
2012
2013
2014
2015
Inde
x: 2
010-
14 a
vera
ge =
100
2.6%
Built-up roads
Non built-up roads
747
6.3%
Motorways
108
875
14-15 % change
2015 figure
6.0%
Reported road casualties in Great Britain: main results 2015 - Page 18

As has already been discussed, there is now reasonable evidence to conclude that the number of fatalities on British roads is remaining fairly static. The year on year changes since 2010 have been relatively small (especially from 2012 onwards) and do not follow any pattern.
Although all accidents have a cause and that cause is often someone making a mistake or exhibiting dangerous or thoughtless road behaviour, when and where fatalities occur is essentially random. Deaths occur where there is a bad combination of factors and the margins between someone dying and someone surviving (or even a collision happening at all, rather than just a near miss) can be extremely fine. We would therefore expect that even if everything in Britain stayed exactly the same between two years: identical people doing identical journeys in identical vehicles with identical weather, the number of incidents, fatalities and casualties would not be the same. So although individual accidents may not be random, the final total for the year is at least partly related to chance and randomness.
The changes in total road deaths over recent years show the characteristics of chance. The number itself is very small (given the size of the population, number of miles driven, and number of vehicle interactions); there is no clear upwards or downwards pattern between the years; the changes themselves are relatively small (moving by just 2 per cent or so) and are not statistically significant; and, finally, there are no clear underlying factors that could explain the changes.
The only logical conclusion for this is that there is no net change in road safety specifically relating to road deaths in Britain at the moment. This does not mean that nothing at all is changing. It is possible that interventions and improvements (e.g. in vehicle technology or medical care) are saving more lives, yet these savings are being offset elsewhere – for instance, in the increase in traffic volumes, or in more vulnerable road users.
Although serious and slight casualty numbers are also subject to a certain amount of randomness, the fact that they are considerably larger in number than fatalities mean that any apparent trend is more likely to be real. If we model the current trend for both severities they still seem to be moving in a downward direction. This suggests that improvements are still being delivered to reduce the number of collisions that do not result in a fatality.
The effect of weather on casualty numbers
The Department published a number of articles outlining the relationship of the weather with road casualties during 2015. These articles should be used as a main reference to why the weather affects casualty numbers and how we model these effects.
Background to casualty trends
Weather impact on casualty numbers
good weather tends to increase
casualties:
bad weather tends to decrease
casualties:
Reported road casualties in Great Britain: main results 2015 - Page 19

Most months in 2015 were fairly close to the long term average temperature. The main exceptions were December and November. The average UK temperature in December 2015 was 7.9°C – this was 1 degree warmer than any other December on record and 4 degrees above the long term average. November 2015 was the third warmest November on record at 8.2°C, 2 degrees above the long term average. All other months were within 1 degree of the long term average.
December and November 2015 also stood out in terms of precipitation. Both months had considerably more precipitation than the long term average (LTA), with almost 50 per cent more rain than the LTA in November and over 80 per cent more in December. Some other months were particularly wetter than average (January, May and July) whilst others were a lot drier than average (September and October).
Chart 10: UK rainfall and temperature in 2015 compared with the long term average
The weather model we have developed generally predicts that periods of good weather (higher temperatures and lower precipitation) would have more casualties. Specifically, though, application of the model so far suggests that temperature has a greater effect on casualties than precipitation. For 2015, the model indicates that for most months of the year the weather had little net effect (or, more precisely, months balanced out throughout the year). December, though, was the exception. As the temperatures were so much higher than the long term average the model indicates that there were an additional 17 fatalities and 1,290 injured casualties in that month alone above what would have happened if the weather had been typical.
Long term average (LTA)
The Met Office use 30 year averages for UK temperature and rainfall to assess changes in the latest temperature and rainfall data. Currently the 1981-2010 average is used for comparison: www.metoffice.gov.uk/climate/uk/summaries/2014/annual.
Weather data
Weather data is available from the Met Office here.
-2
-1
0
1
2
3
4
5
Jan Feb Mar Apr May Jun Jul Aug Sep Oct Nov Dec
tem
pera
ture
dev
iatio
n (°
C)
Temperature
-60
-40
-20
0
20
40
60
80
100
120
Jan Feb Mar Apr May Jun Jul Aug Sep Oct Nov Dec
rain
fall
devi
atio
n (m
m)
Precipitation
Tables
• Reported weather-adjusted road casualties by road user type, Great Britain, annual from 1991 RAS30080.
Reported road casualties in Great Britain: main results 2015 - Page 20

If true, this would give a weather-adjusted fatality figure to 1,710, very close to the final published (as well as the weather-adjusted) total in 2013, the best year on record.
However, December 2015 was marked by very heavy rainfall from storms Desmond, Eva and Frank. These three storms brought considerable flooding to large parts of the north of England and southern Scotland. The volumes of rain were extreme, with 341 mm of rain falling at Honister Pass in Cumbria on the 5th December. This set a new UK 24-hour rainfall record, beating the 316 mm of rain set in 2009. The flooding and risk of flooding led to roads being closed across a number of counties.
All statistical models work within reasonable operating parameters. The model used here is based on long-term trends in temperature and precipitation. It does not take into account events that are considerably more extreme than have been recorded before, and similarly it cannot take into account consequences such as flooding and road closures. As a result we do not believe that the model produces a reliable adjustment of the casualty figures for December 2015. It is impossible to say what the outcome would have been had the weather in December been closer to the long term average. Therefore we do not feel that it is appropriate to produce weather-adjusted casualty figures for December. As a result, the weather-adjusted figures for 2015 differ little from the actual reported figures.
Road user groups and age bands
The increases in fatalities in 2014 came from mainly a single road user type and age group: pedestrians aged 60 years or older. This group alone increased by 45 fatalities in 2014 out of an overall increase of 62 fatalities throughout all groups.
As was suggested in publications relating to 2014, these very large rises have proved to be one-off events and the groups that increased by large amounts have come back towards their previous levels. Specifically, pedestrian fatalities fell by 38, with a drop of 18 in the number of people aged 60 or over.
Motorcycle user fatalities had the largest increase in 2015. Fatalities in this group rose by 26 in comparison with 2014, 17 of whom where aged between 18 and 59.
The number of overall older people killed on British roads in 2015 dropped by 43 to 492. This is still above the 2013 level but is very close to the figures recorded in 2011 and 2012.
Further information
Information on how the weather affects road casualties can be found here.
Information on the weather adjustment model can be found here with further information here.
The article on the modelling for RSS significance magazine can be found here.
The Department is part of a small working group looking at the effect of weather on different statistical series. A guide to analysing the effect of weather and climate on official statistics is available here.
Reported road casualties in Great Britain: main results 2015 - Page 21

Table 1: Absolute change in the number of GB road fatalities from 2014 to 2015 by age group
and road user group
1. Buses and coaches, light vans, and heavy goods vehicles.
2. Including other road users, such as tractors, horse riders, mobility scooters, etc
In terms of serious injuries, the largest changes in 2014 were a 9 per cent increase in motorcycle users (up by 423 casualties), an 8 per cent increase in pedal cyclists (up by 258 casualties) and a 5 per cent increase in car occupants (up by 394 casualties). Most of these increases were of 18 to 59 year-olds, though the number of pedestrians seriously injured aged 60 or over increased by 15 per cent (160 casualties).
Table 2: Change in the number of GB seriously injured casualties from 2014 to 2015 by age group and road user group
1. Buses and coaches, light vans, and heavy goods vehicles. 2. Including other road users, such as tractors, horse riders, mobility scooters, etc
Absolute change Pedestrians Pedal cyclistsCar
occupantsMotorcycle
usersOther1 vehicle
occupantsAll road users2
Children: 0-15 years -92 -1 -4 0 -119
Young people: 0-17 years -93 -34 -19 +5 -162
Adults: 18-59 years +29 -120 -98 -281 -456
60 and over -75 -4 -57 +34 -76
All casualties -123 -162 -147 -247 +16 -663
Percentage changeChildren: 0-15 years -6.8% -0.4% -1.3% +0.0% -5.9%
Young people: 0-17 years -6.2% -8.9% -3.3% +1.4% -5.6%
Adults: 18-59 years +1.3% -4.5% -1.8% -6.2% -2.9%
60 and over -6.0% -1.2% -3.1% +9.9% -1.9%
All casualties -2.4% -4.8% -1.8% -4.7% +1.9% -2.9%
Pedestrians Pedal cyclistsCar
occupantsMotorcycle
users
Other1
vehicle occupants
All road users2
Children: 0-15 years -4 0 +1 0 +1
Young people: 0-17 years -8 0 +9 +4 +10
Adults: 18-59 years -12 -6 -28 +17 -12
60 and over -18 -7 -24 +5 -43
All casualties -38 -13 -43 +26 +23 -45
Reported road casualties in Great Britain: main results 2015 - Page 22

All of these groups fell back in 2015, though by less than they increased in 2014. The exception that stands out is another rise in the number of motorcyclists aged 60 or over seriously injured. The lowest years on record for this group was around the turn of the Millennium, when the number of casualties was around 140 to 160 most years. The number rose above 200 in 2007 and passed 300 in 2011. The 377 seriously injured 60+ motorcyclists in 2015 is the highest since 1984. The total number of casualties of all severities in this group also passed 1,000 for the first time since 1986. This, perhaps, marks a specific group of road users that could carry on increasing as the number of people in the population aged 60 or over continues to rise.
International context in 2015
A first indication of figures across Europe and surrounding countries is that fatalities rose in the majority of countries covered in the European Transport Safety Council’s PIN report (see here). Of the 32 countries covered, 21 had an increase in the number of fatalities in 20151, ten had a decrease, and one remained unchanged. The original report includes the UK as having an increase in fatalities, but this was based on provisional figures for the year ending September 2015.
Overall, the total number of road deaths in the 28 members of the European Union during 2015 was around 26,300. This marked the first increase in the annual total fatalities since the PIN Programme started in 2001.
Chart 11: Number of road deaths per million inhabitants, PIN Programme countries
*Countries with provisional fatality figures.Countries marked with an orange outline have fewer than 150 deaths per year and therefore the fatality rate can vary significantly between years.
1 Four countries, Estonia, Cyprus, Malta and Luxembourg have so few fatalities that any change would have been random
0
10
20
30
40
50
60
70
80
90
100
NO
*
MT
SE GB
UK CH
DK
IE*
ES*
NL IL
DE* FI SK EE FR AT
*
IT* SI
PT*
LU BE*
CY
RS* CZ
EL*
PL LT*
HR LV RO
BG
Road
dea
ths
per m
illio
n in
hab
itant
s
Reported road casualties in Great Britain: main results 2015 - Page 23

As countries do not use the same definition of serious injury, the key international comparison is based on road deaths per million inhabitants, as shown in Chart 11. There were 27.4 deaths per million inhabitants in Great Britain in 2015, a small improvement from 27.9 in 2014. The United Kingdom as a whole had 27.7 deaths per million inhabitants in 2015. The only European countries with a better rate than this in 2015 were Sweden, with 26.6, Malta, with 25.6, and Norway, with 22.6. Both Malta and Norway have very low numbers of deaths each year (with 11 in Malta and 117 in Norway in 2015) so these rates are likely to vary significantly between years. The UK and Sweden have been consistently at the head of this table for a number of years.
Statistical significance
Since 2015 we have been including information about whether changes in casualty and accident numbers are statistically significant. This should not be confused with the significance of accidents for casualties, other people involved in the incident, friends and families. Every casualty is a tragedy and any increase in people killed or injured in road traffic accidents has clear social significance.
The purpose of testing for statistical significance is to separate out true trends in the figures from changes that have come about through chance. A large combination of factors influence whether accidents happen at all and, when they do occur, how many people are affected and how serious the outcomes are. Very small differences can make the difference between a damage-only accident and one in which people are killed.
Owing to the influence of chance, two years with the same risk of accidents will result in different number of fatalities and injuries. The Department has tested the change in the number of fatalities, serious injuries and slight injuries between 2014 and 2015 to see which are statistically significant at the 95% confidence level.
Two tests have been carried out on the casualty figures. The first is a test to see whether the absolute changes between 2014 and 2015 is statistically significant. If the findings are that the change between years is within the 95% confidence intervals, then the changes are likely to have arisen from natural variation between the years.
The second test is to compare the number of casualties in 2015 with what we would have expected if and only if the casualty trend has continued in the same way as it did between 2000 and 2014. Rather than testing to see if the actual change between the two years is statistically significant, or not, this tests to see if the trend direction or pattern has undergone a statistically significant change. Table 3 provides the outcomes from both of these tests.
Definition The 95% confidence level is the standard against which statistics are typically tested. It means that in 100 years with the same risk of fatalities (or injury), 95 of those years will result in a number of fatalities (or injuries) between a given range. If the actual change falls outside of this range then we can be 95% confident that the change is as a result of a genuine trend rather than a product of chance.
Reported road casualties in Great Britain: main results 2015 - Page 24

The first test – marked (a) – simply tests whether the change between years are large enough to be not as a result of natural variation or chance. For 2015, the decreases in both seriously and slightly injured casualties are large enough to be unlikely to have come about by chance. However, the decrease in fatalities is not large enough so it is not statistically significant.
The second test – marked (b) – is the test against whether the final 2015 figures deviate significantly from the longer term trend. In this case, casualties of all severity types fall close enough to the central forecast to suggest that there has not been any significant change from the trend.
One interesting point in this table is in the trend forecast itself. The fatalities central forecast is very close to the 2014 fatalities figure, representing that the model thinks that the trend is more or less flat. The central forecast for the other two severities, though, are lower than the 2014 figure, so the model thinks that there is still an ongoing decreasing trend for serious and slight injuries.
Table 3: 2015 final GB road casualties statistical significance and comparison with forecasts
Conclusions
The outcomes from the latest full year provides a much better indicator of the trend and current position than in 2014. There were a number of unusual changes in 2014 (e.g. the spike in pedestrian fatalities) which have either gone away completely in 2015 or at least moved back towards the 2013 level.
It now appears that fatality numbers are fluctuating around the 1,700 to 1,800 mark and only one of the last five years has had a statistically significant change. The most likely conclusion to this is that there is no trend in road fatalities on British roads at the moment and things are getting neither better nor worse.
Further Information
Further information on the methodology used to test for statistically significant changes can be found at: www.gov.uk/government/publications/road-accidents-and-safety-statistics-guidance
Fatalities Seriously injured
Slightly injured
All casualties
2014 actual 1,775 22,807 169,895 194,4772015 actual 1,730 22,144 162,315 186,189Statistically significant change for the absolute difference? (a) No Yes Yes Yes
Changes from forecast of trend
2015 central forecast 1,771 22,252 164,302 188,3252015 95% upper forecast 2,113 24,946 179,284 206,3432015 95% lower forecast 1,484 19,558 149,321 170,363Statistically significant change from the forecast trend? (b) No No No No
Reported road casualties in Great Britain: main results 2015 - Page 25

In contrast, there is still some evidence that the number of serious and slight injuries are decreasing. There have been decreases in the number of serious injuries in eight years out of the last ten, and 2014 is the only year since 2000 that had an increase in the number of slightly injured casualties.
There are a number of possible explanations for this difference, which can be summarised under two main options (and it is possible for both options to be true):
• General road safety is still improving. This means that fewer people are having collisions or fewer collisions result in injuries. Fatalities may not be falling any more for other reasons, such as there still being a core of drivers who continue to demonstrate poor or reckless driving behaviours despite other improvements.
• There is increasing under reporting of non-fatal accidents. This could be as a result of police officers attending fewer accidents, or fewer people going to police stations to report accidents (or both). There is currently no definitive evidence to suggest that this is happening, but the possibility cannot be discounted. This is something that we will look into as part of working with hospital records over the latter part of 2016.
As always with statistical series, certainty about what is happening grows as more evidence becomes available. The provisional figures for 2016 will shed more light on what trends, if any, still exist. Provisional data for quarter 1 2016 will be published in August and quarter 2 in November.
Differences between provisional quarterly data and final data
The Department for Transport publish rolling annual totals for quarters 1, 2 and 3 of each year. The data released in the quarterly releases are provisional as the records used are incomplete at the time of publication. Some forces supply no, or limited, data in some of the quarters, and some records change between the provisional publication and the database being finalised.
The results from each quarter changed slightly between the original release and table RAS30003. Overall, for the first three quarters of the year (provisional results for quarter 4 are not produced), there were eight fewer deaths, 125 more seriously injured casualties (up by 0.8 per cent) and 323 more slightly injured casualties (up by 0.3 per cent) in the final data in comparison with the provisional results. These comparisons refer to the final figures for quarter 1 and quarter 2 data as revised with the release of quarter 3 estimates.What we can conclude: There has been statistically significant decreases in the number of people seriously and slightly injured (but not killed) in road traffic accidents between 2014 and 2015. This indicates that there are a number of factors that have combined together to improve some aspects of safety on Britain’s roads. However, it is not definitive evidence of a continued improvement in road deaths.
What we cannot conclude: Although the number of people killed in road traffic accidents has decreased between 2014 and 2015, this change is small enough that it can be explained by the natural variation in deaths over time. There is no evidence that the number of fatalities has changed over recent years.
Reported road casualties in Great Britain: main results 2015 - Page 26
Underreporting of casualties and accidents, and other sources of information
Comparisons of road accident reports with death registrations show that very few, if any, road accident fatalities are not reported to the police. However, it has long been known that a considerable proportion of non-fatal casualties are not known to the police, as hospital, survey and compensation claims data all indicate a higher number of casualties than police accident data would suggest.
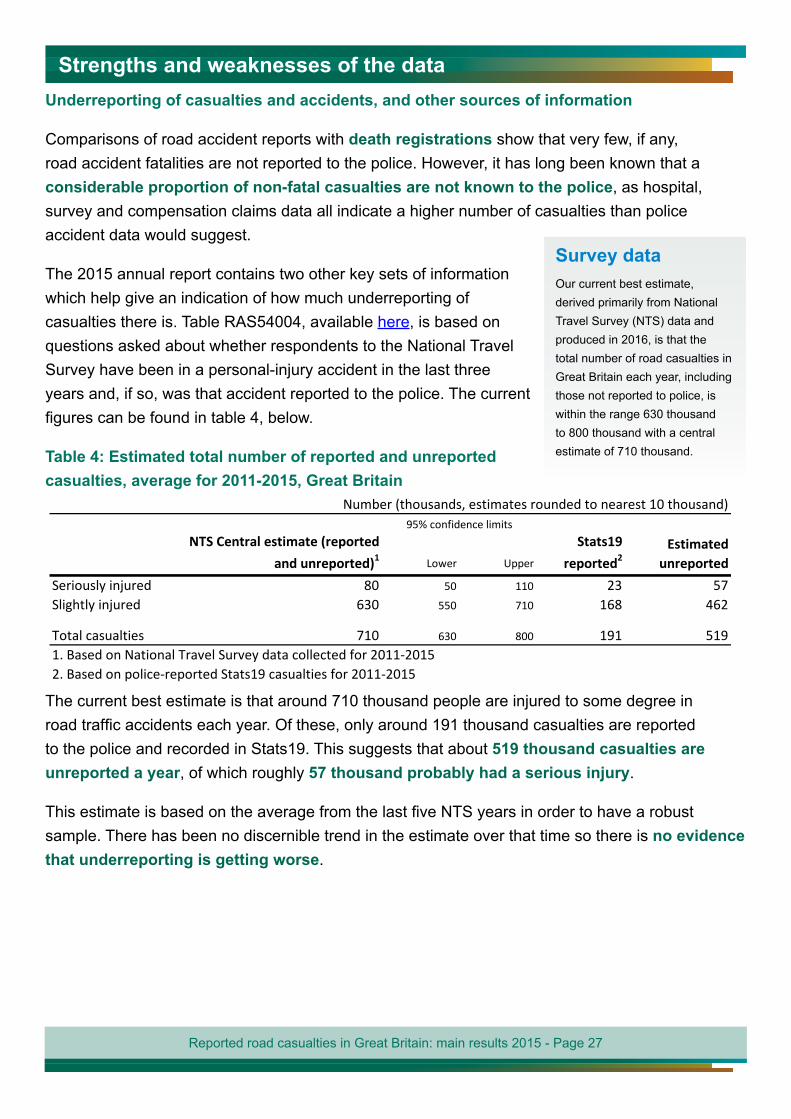
The 2015 annual report contains two other key sets of information which help give an indication of how much underreporting of casualties there is. Table RAS54004, available here, is based on questions asked about whether respondents to the National Travel Survey have been in a personal-injury accident in the last three years and, if so, was that accident reported to the police. The current figures can be found in table 4, below.
Table 4: Estimated total number of reported and unreported casualties, average for 2011-2015, Great Britain
The current best estimate is that around 710 thousand people are injured to some degree in road traffic accidents each year. Of these, only around 191 thousand casualties are reported to the police and recorded in Stats19. This suggests that about 519 thousand casualties are unreported a year, of which roughly 57 thousand probably had a serious injury.
This estimate is based on the average from the last five NTS years in order to have a robust sample. There has been no discernible trend in the estimate over that time so there is no evidence that underreporting is getting worse.
Strengths and weaknesses of the data
Survey data Our current best estimate, derived primarily from National Travel Survey (NTS) data and produced in 2016, is that the total number of road casualties in Great Britain each year, including those not reported to police, is within the range 630 thousand to 800 thousand with a central estimate of 710 thousand.
Number (thousands, estimates rounded to nearest 10 thousand)
NTS Central estimate (reported and unreported)1 Lower Upper
Stats19 reported2
Estimated unreported
Seriously injured 80 50 110 23 57Slightly injured 630 550 710 168 462
Total casualties 710 630 800 191 5191. Based on National Travel Survey data collected for 2011-20152. Based on police-reported Stats19 casualties for 2011-2015
95% confidence limits
Reported road casualties in Great Britain: main results 2015 - Page 27

Value of prevention of accidents
For the first time these unreported injuries have been included in the ‘value of prevention of accidents’, which can be found here. We estimate that the total value of prevention of the unreported casualties is around £20bn a year, almost twice the value of the reported injury accidents. The raises the total estimate for all reported and unreported accidents to around £35.5bn per year.
The data used as the basis for these statistics are therefore not a complete record of all personal injury road accidents, and this should be borne in mind when using and analysing the figures. However, police data on road accidents, whilst not perfect, remain the most detailed, complete and reliable single source of information on road casualties covering the whole of Great Britain, in particular for monitoring trends over time.
Hospital data
The second alternative source about people injured in road traffic accidents comes from hospital admissions data. The 2015 annual report includes an article discussing the first estimates for the total number of people admitted to hospital in the United Kingdom with a clinically defined serious injury following a road traffic accident. This formal name for these figures is casualties with MAIS3+, which means that it includes all casualties with a maximum score on the abbreviated injury scale of three or higher. More detail about the source of the data, the abbreviated injury scale and the correction factors used can be found in the article. Table RAS55050 provides MAIS3+ figures for 1999 to 2011.
CRASH system
A new data recording tool for police forces has been rolled out over 2015 and 2016. Surrey Police started using the new system, called CRASH (Collision Reporting and SHaring) in 2012 and Staffordshire Police joined in May 2015. A number other forces adopted it during November and December 2015 and further forces in 2016. Although not apparent in the data for Surrey and Staffordshire, there is some evidence that casualty records coming from CRASH have had a 2 percentage point swing from slight injuries to serious injuries. Given the very small amount of CRASH-derived data for 2015 this is unlikely to have had much effect on the figures published here. We will provide more detail and analysis in the 2016 statistics.
Reported road casualties in Great Britain: main results 2015 - Page 28

Tables providing more details of accidents and casualties are available at: https://www.gov.uk/government/collections/road-accidents-and-safety-statistics.
Provisional quarterly reported road casualty statistics are published throughout the year. The provisional estimates for quarter 1 2016 were published in August 2016. Quarterly statistical releases can be found at: www.gov.uk/government/organisations/ department-for-transport/series/road-accidents-and-safety-statistics
National Statistics are produced to high professional standards as set out in the Code of Practice for Official Statistics. They undergo quality assurance reviews to ensure that they meet customer needs. The first assessment report (report number 4) and letter confirming that the statistics have been designated as National Statistics are available at: www.statisticsauthority.gov.uk/assessment/assessment/assessment-reports/index.html. The statistics were reassessed during 2013 and the report, number 258, was published at the link above on the 25th July 2013.
Details of Ministers and officials who receive pre-release access to these statistics up to 24 hours before release can be found here: www.gov.uk/government/publications/road-accident-and-safety-statistics-pre-release-access-list.
Background information
Further information A full list of the definitions used in this publication can be found here: www.gov.uk/government/uploads/system/uploads/attachment_data/file/462818/reported-road-casualties-gb-notes-definitions.pdf.
Further information on Reported Road Casualties Great Britain, including information about the variables collected on the STATS19 form, historical publications and factsheets, can be found at: www.gov.uk/government/publications/road-accidents-and-safety-statistics-guidance.
Feedback We welcome further feedback on any aspects of the Department’s road safety statistics including content, timing, and format via email to [email protected]
Reported road casualties in Great Britain: main results 2015 - Page 29