Embed Size (px)
Citation preview

1
Title: Reporting and Analysis Plan for an Exploratory Study to
Evaluate the Use of Topical Emollient Therapy in the
Management of Severe Acute Malnutrition: A Randomised
Controlled Clinical Trial in Bangladesh
Description: This document provides the reporting and analysis plan for this exploratory
randomised controlled open-label clinical trial investigating topical emollient therapy in
the management of severe acute malnutrition in children aged 2 – 24 months in
Bangladesh

2
ABBREVIATIONS
ANCOVA Analysis of Covariance
ASOM Acute Suppurative Otitis Media
CI Confidence Interval
CRF Case Report Form
CRP C-Reactive Protein
CSOM Chronic Suppurative Otitis Media
FA Fatty acid
GSK GlaxoSmithKline
icddr,b International Centre for Diarrhoeal Disease Research,
Bangladesh
ITT Intent-to-Treat
MMRM Mixed Model Repeated Measures
R&D Research and Development
RAP Reporting and Analysis Plan
SAM Severe Acute Malnutrition
SAS Statistical Analysis Software
SD Standard Deviation
SPSS Statistical Package for the Social Sciences
SSO Sunflower Seed Oil
TEWL Transepidermal Water Loss
UTI Urinary Tract Infection
3
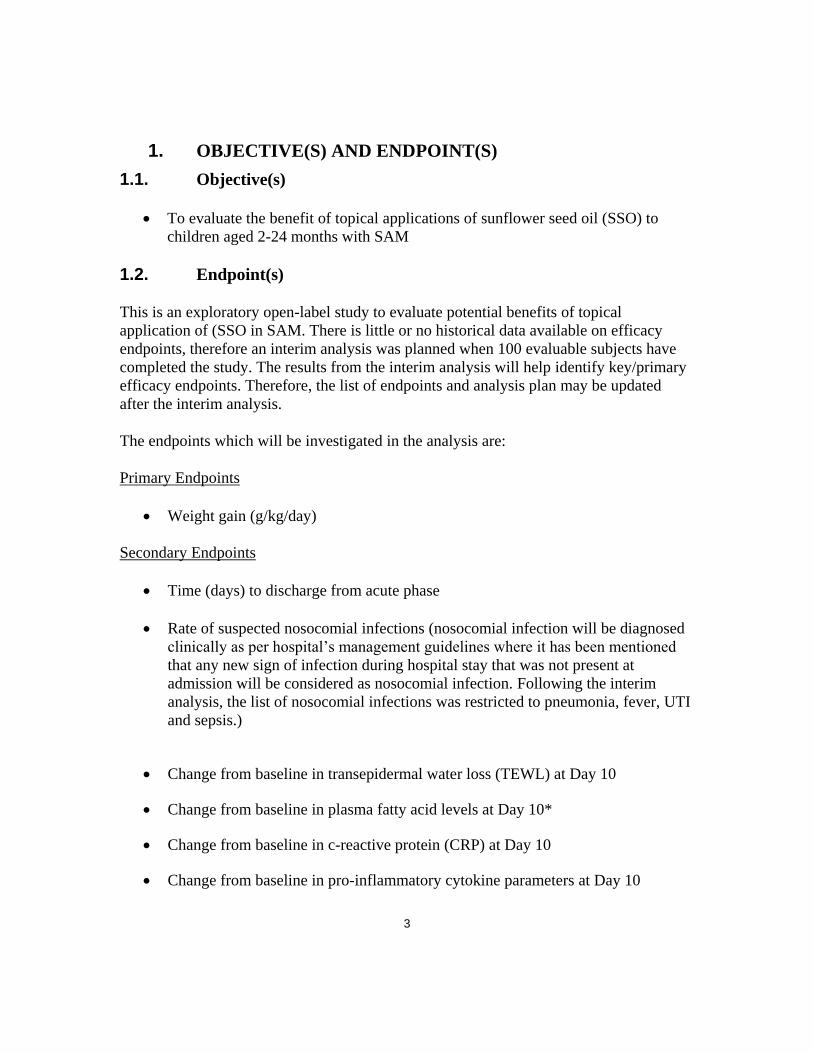
1. OBJECTIVE(S) AND ENDPOINT(S)
1.1. Objective(s)
To evaluate the benefit of topical applications of sunflower seed oil (SSO) to
children aged 2-24 months with SAM
1.2. Endpoint(s)
This is an exploratory open-label study to evaluate potential benefits of topical
application of (SSO in SAM. There is little or no historical data available on efficacy
endpoints, therefore an interim analysis was planned when 100 evaluable subjects have
completed the study. The results from the interim analysis will help identify key/primary
efficacy endpoints. Therefore, the list of endpoints and analysis plan may be updated
after the interim analysis.
The endpoints which will be investigated in the analysis are:
Primary Endpoints
Weight gain (g/kg/day)
Secondary Endpoints
Time (days) to discharge from acute phase
Rate of suspected nosocomial infections (nosocomial infection will be diagnosed
clinically as per hospital’s management guidelines where it has been mentioned
that any new sign of infection during hospital stay that was not present at
admission will be considered as nosocomial infection. Following the interim
analysis, the list of nosocomial infections was restricted to pneumonia, fever, UTI
and sepsis.)
Change from baseline in transepidermal water loss (TEWL) at Day 10
Change from baseline in plasma fatty acid levels at Day 10*
Change from baseline in c-reactive protein (CRP) at Day 10
Change from baseline in pro-inflammatory cytokine parameters at Day 10
4
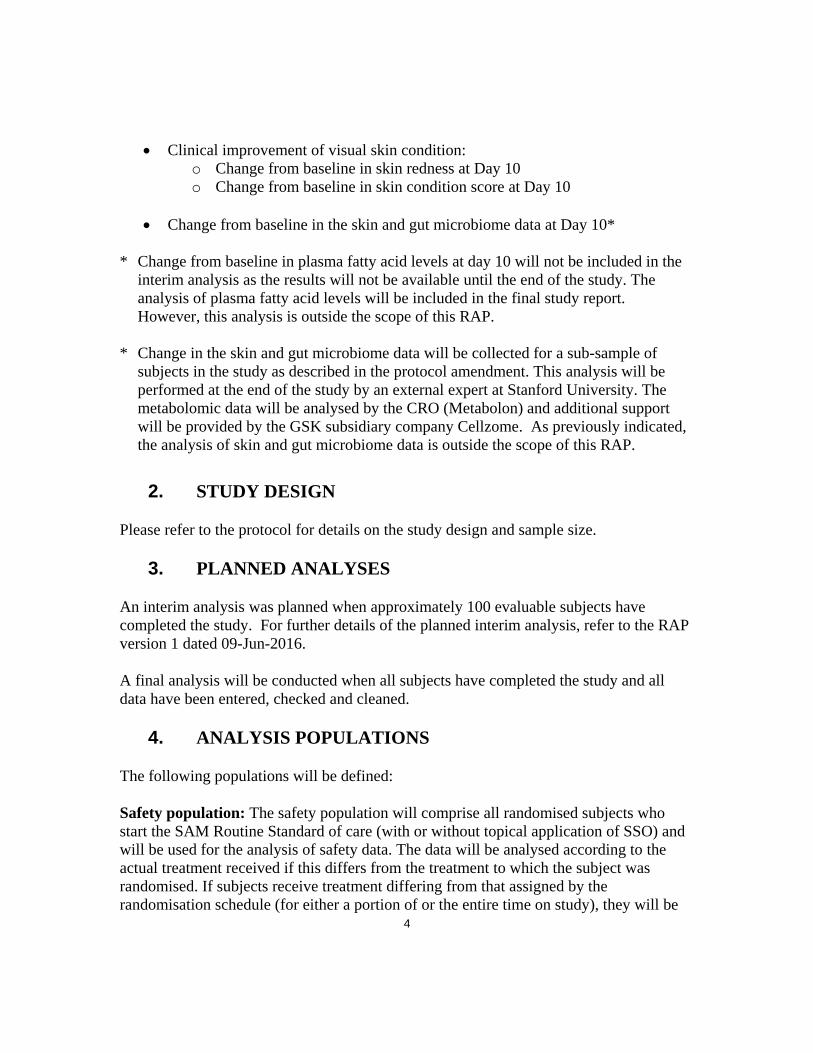
Clinical improvement of visual skin condition:
o Change from baseline in skin redness at Day 10
o Change from baseline in skin condition score at Day 10
Change from baseline in the skin and gut microbiome data at Day 10*
* Change from baseline in plasma fatty acid levels at day 10 will not be included in the
interim analysis as the results will not be available until the end of the study. The
analysis of plasma fatty acid levels will be included in the final study report.
However, this analysis is outside the scope of this RAP.
* Change in the skin and gut microbiome data will be collected for a sub-sample of
subjects in the study as described in the protocol amendment. This analysis will be
performed at the end of the study by an external expert at Stanford University. The
metabolomic data will be analysed by the CRO (Metabolon) and additional support
will be provided by the GSK subsidiary company Cellzome. As previously indicated,
the analysis of skin and gut microbiome data is outside the scope of this RAP.
2. STUDY DESIGN
Please refer to the protocol for details on the study design and sample size.
3. PLANNED ANALYSES
An interim analysis was planned when approximately 100 evaluable subjects have
completed the study. For further details of the planned interim analysis, refer to the RAP
version 1 dated 09-Jun-2016.
A final analysis will be conducted when all subjects have completed the study and all
data have been entered, checked and cleaned.
4. ANALYSIS POPULATIONS
The following populations will be defined:
Safety population: The safety population will comprise all randomised subjects who
start the SAM Routine Standard of care (with or without topical application of SSO) and
will be used for the analysis of safety data. The data will be analysed according to the
actual treatment received if this differs from the treatment to which the subject was
randomised. If subjects receive treatment differing from that assigned by the
randomisation schedule (for either a portion of or the entire time on study), they will be

5
analysed based on the treatment taken for the majority (>50%) of their time on study
treatment.
Intent-to-Treat (ITT) population: This will consist of all randomised subjects from
whom at least baseline and at least one post baseline measure have been obtained and
will be used for the analysis of efficacy data. The data will be analysed according to the
treatment to which the subject was randomised.
5. TREATMENT COMPARISONS
5.1. Data Display Treatment and Other Sub-group Descriptors
The descriptors as detailed below will be used to denote the study treatment and will be
used in the data displays:
Emollient Therapy
No Emollient
6. GENERAL CONSIDERATIONS FOR DATA ANALYSES
All programming will be performed using - SAS (version 9.4 or later), SPSS or STATA.
The analysis will be carried out in collaboration with icddr,b, and Stanford University.
Further analysis of the SCORDoK score may be carried out by the Denmark SCORDoK
team. The metabolomic data will be analyzed by the CRO assaying the samples
(Metabolon) with input from representatives from the R&D Platform Technology &
Science group within the GSK subsidiary company Cellzome All analyses will be
deemed exploratory.
6.1. Strata and Covariates
Randomisation was planned to be stratified by age at baseline in two strata: 2-<6 months
and 6-24 months in a 1:2 ratio. However, as noted in the amended protocol, additional
subjects may be enrolled in the older subgroup.
The two age group strata (2-<6 months and 6-24 months) will be the categories used in
all tables, figures and listings split by age group unless stated otherwise.
The statistical analysis will be adjusted for age at baseline (as a continuous covariate),
sex and a measure of the parameter or severity at baseline as specified in the table below.
In addition, the analysis of weight gain will include average calorie intake divided by
baseline weight (calorie intake per day per kg).

6
Patients will be categorised as “Oedematous” if they are recorded on the CRF as having
oedema at any time during the study. Otherwise they will be categorised as “Non-
oedematous”. For each patient, the daily calorie intake (total energy per day) is collected
on the CRF. The average of these values divided by baseline weight will be used as the
calorie intake covariate.
If an inadequate number of subjects is observed in one of the categories for sex or
oedematous status then the covariates may be removed from the models.
In addition to the above, differences between the two treatment groups (emollient therapy
versus no emollient) will be examined with respect to baseline characteristics prior to
performing statistical analysis of the efficacy endpoints. If any differences are considered
to be clinically important, exploratory subgroup analysis may be presented for the
relevant endpoints.
Depending on the method of statistical analysis, covariates/factors specified below will
be fitted in each model. If any terms are not significant then they may be dropped from
the final analysis.
Table 1: Covariates/Factors to be included in statistical analyses
Method of
analysis
Endpoints Fixed effects terms Random
effects terms
Continuous
Covariates
Factors Interactions Covariates
ANCOVA Fatty Acids Baseline of
parameter,
age
Treatment,
sex
MMRM Weight
TEWL
Skin
redness
Skin
Appearance
Baseline of
parameter,
age, calorie
intake per
day per
kg[2]
, mean
breast
feeding
frequency[2]
Treatment,
day, sex,
oedematous
status
Baseline of
parameter
*day,
treatment*day,
treatment*age
category,
treatment*age
category*day [3]
Subject (in
the subject
option of the
repeated
statement in
proc mixed)
Cox
proportional
hazard
model
Discharge
from acute
phase
Baseline
weight-for-
length Z
score, age
Treatment,
sex
7
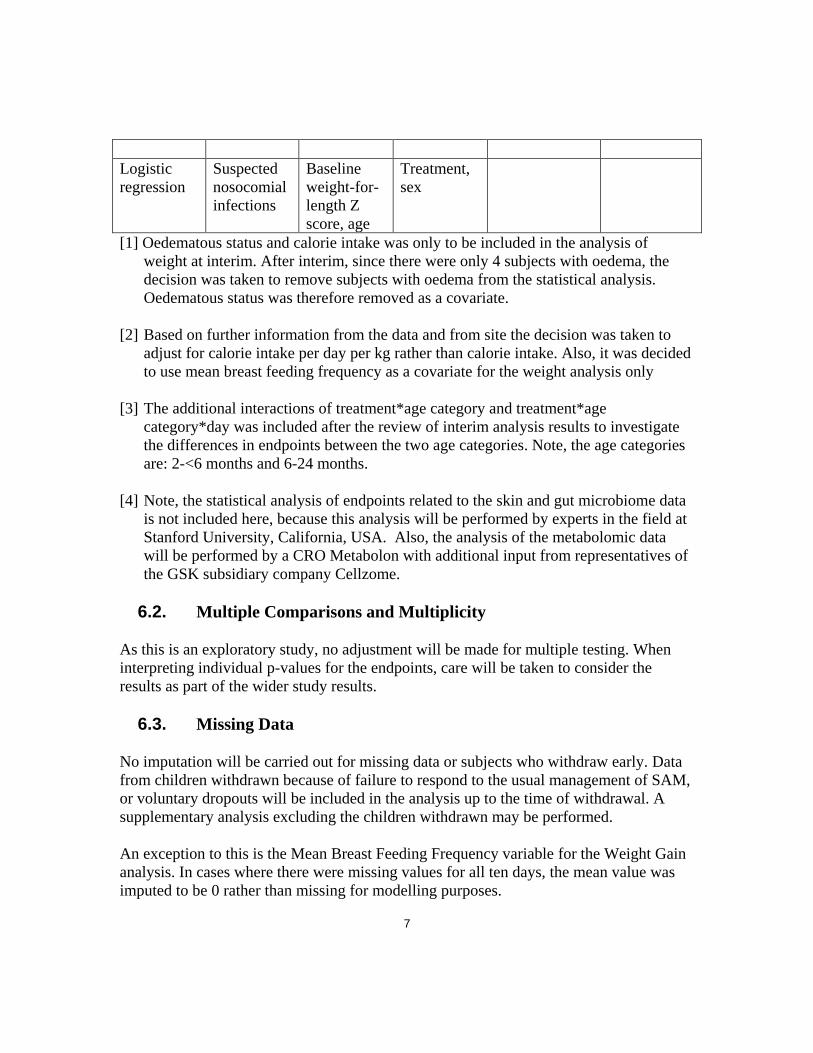
Logistic
regression
Suspected
nosocomial
infections
Baseline
weight-for-
length Z
score, age
Treatment,
sex
[1] Oedematous status and calorie intake was only to be included in the analysis of
weight at interim. After interim, since there were only 4 subjects with oedema, the
decision was taken to remove subjects with oedema from the statistical analysis.
Oedematous status was therefore removed as a covariate.
[2] Based on further information from the data and from site the decision was taken to
adjust for calorie intake per day per kg rather than calorie intake. Also, it was decided
to use mean breast feeding frequency as a covariate for the weight analysis only
[3] The additional interactions of treatment*age category and treatment*age
category*day was included after the review of interim analysis results to investigate
the differences in endpoints between the two age categories. Note, the age categories
are: 2-<6 months and 6-24 months.
[4] Note, the statistical analysis of endpoints related to the skin and gut microbiome data
is not included here, because this analysis will be performed by experts in the field at
Stanford University, California, USA. Also, the analysis of the metabolomic data
will be performed by a CRO Metabolon with additional input from representatives of
the GSK subsidiary company Cellzome.
6.2. Multiple Comparisons and Multiplicity
As this is an exploratory study, no adjustment will be made for multiple testing. When
interpreting individual p-values for the endpoints, care will be taken to consider the
results as part of the wider study results.
6.3. Missing Data
No imputation will be carried out for missing data or subjects who withdraw early. Data
from children withdrawn because of failure to respond to the usual management of SAM,
or voluntary dropouts will be included in the analysis up to the time of withdrawal. A
supplementary analysis excluding the children withdrawn may be performed.
An exception to this is the Mean Breast Feeding Frequency variable for the Weight Gain
analysis. In cases where there were missing values for all ten days, the mean value was
imputed to be 0 rather than missing for modelling purposes.
8
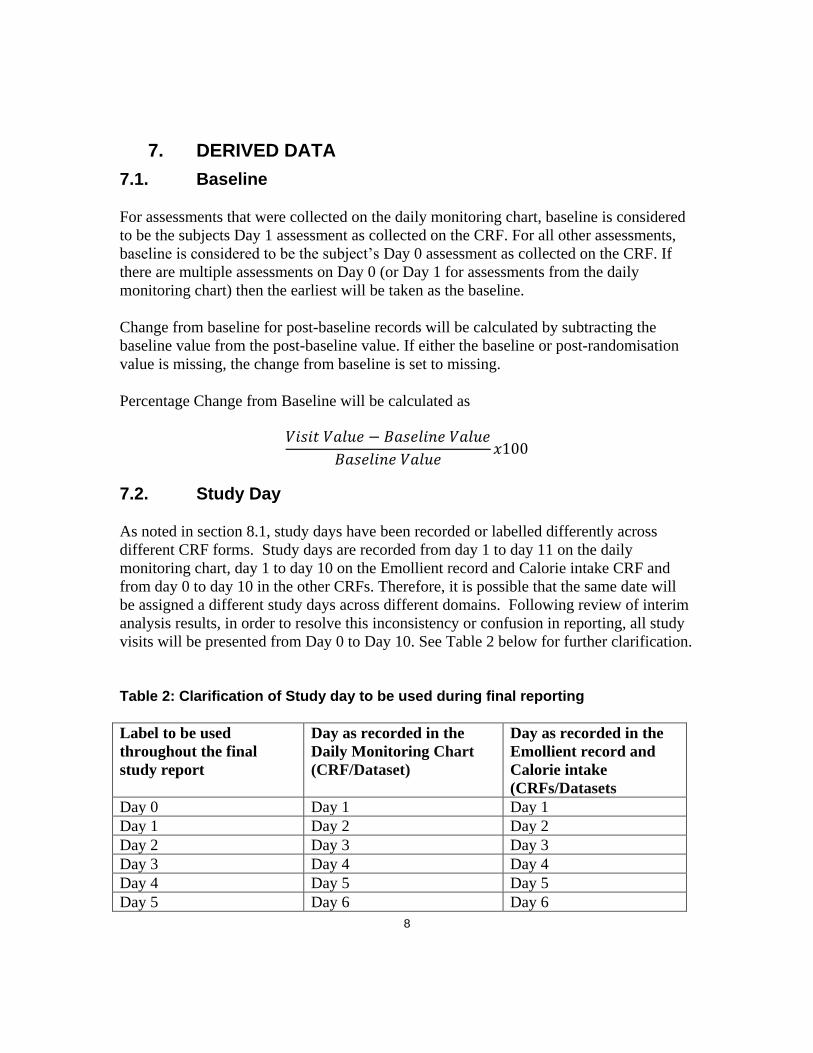
7. DERIVED DATA
7.1. Baseline
For assessments that were collected on the daily monitoring chart, baseline is considered
to be the subjects Day 1 assessment as collected on the CRF. For all other assessments,
baseline is considered to be the subject’s Day 0 assessment as collected on the CRF. If
there are multiple assessments on Day 0 (or Day 1 for assessments from the daily
monitoring chart) then the earliest will be taken as the baseline.
Change from baseline for post-baseline records will be calculated by subtracting the
baseline value from the post-baseline value. If either the baseline or post-randomisation
value is missing, the change from baseline is set to missing.
Percentage Change from Baseline will be calculated as
7.2. Study Day
As noted in section 8.1, study days have been recorded or labelled differently across
different CRF forms. Study days are recorded from day 1 to day 11 on the daily
monitoring chart, day 1 to day 10 on the Emollient record and Calorie intake CRF and
from day 0 to day 10 in the other CRFs. Therefore, it is possible that the same date will
be assigned a different study days across different domains. Following review of interim
analysis results, in order to resolve this inconsistency or confusion in reporting, all study
visits will be presented from Day 0 to Day 10. See Table 2 below for further clarification.
Table 2: Clarification of Study day to be used during final reporting
Label to be used
throughout the final
study report
Day as recorded in the
Daily Monitoring Chart
(CRF/Dataset)
Day as recorded in the
Emollient record and
Calorie intake
(CRFs/Datasets
Day 0 Day 1 Day 1
Day 1 Day 2 Day 2
Day 2 Day 3 Day 3
Day 3 Day 4 Day 4
Day 4 Day 5 Day 5
Day 5 Day 6 Day 6
9
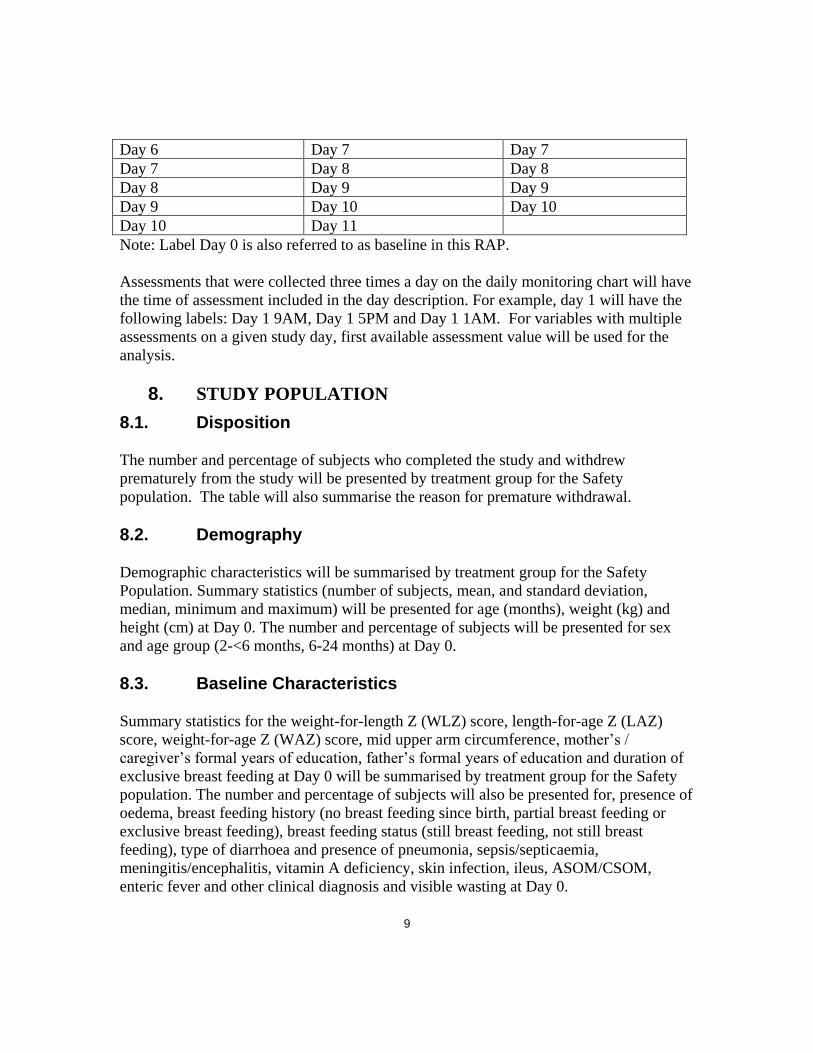
Day 6 Day 7 Day 7
Day 7 Day 8 Day 8
Day 8 Day 9 Day 9
Day 9 Day 10 Day 10
Day 10 Day 11
Note: Label Day 0 is also referred to as baseline in this RAP.
Assessments that were collected three times a day on the daily monitoring chart will have
the time of assessment included in the day description. For example, day 1 will have the
following labels: Day 1 9AM, Day 1 5PM and Day 1 1AM. For variables with multiple
assessments on a given study day, first available assessment value will be used for the
analysis.
8. STUDY POPULATION
8.1. Disposition
The number and percentage of subjects who completed the study and withdrew
prematurely from the study will be presented by treatment group for the Safety
population. The table will also summarise the reason for premature withdrawal.
8.2. Demography
Demographic characteristics will be summarised by treatment group for the Safety
Population. Summary statistics (number of subjects, mean, and standard deviation,
median, minimum and maximum) will be presented for age (months), weight (kg) and
height (cm) at Day 0. The number and percentage of subjects will be presented for sex
and age group (2-<6 months, 6-24 months) at Day 0.
8.3. Baseline Characteristics
Summary statistics for the weight-for-length Z (WLZ) score, length-for-age Z (LAZ)
score, weight-for-age Z (WAZ) score, mid upper arm circumference, mother’s /
caregiver’s formal years of education, father’s formal years of education and duration of
exclusive breast feeding at Day 0 will be summarised by treatment group for the Safety
population. The number and percentage of subjects will also be presented for, presence of
oedema, breast feeding history (no breast feeding since birth, partial breast feeding or
exclusive breast feeding), breast feeding status (still breast feeding, not still breast
feeding), type of diarrhoea and presence of pneumonia, sepsis/septicaemia,
meningitis/encephalitis, vitamin A deficiency, skin infection, ileus, ASOM/CSOM,
enteric fever and other clinical diagnosis and visible wasting at Day 0.
10
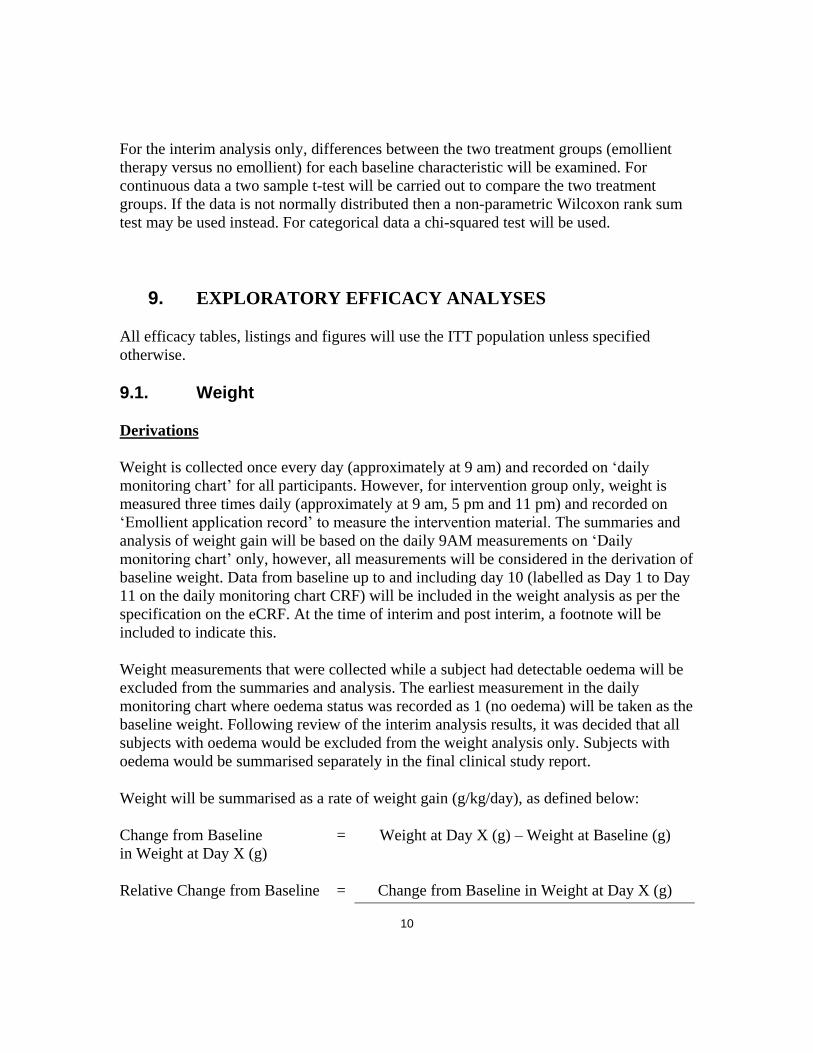
For the interim analysis only, differences between the two treatment groups (emollient
therapy versus no emollient) for each baseline characteristic will be examined. For
continuous data a two sample t-test will be carried out to compare the two treatment
groups. If the data is not normally distributed then a non-parametric Wilcoxon rank sum
test may be used instead. For categorical data a chi-squared test will be used.
9. EXPLORATORY EFFICACY ANALYSES
All efficacy tables, listings and figures will use the ITT population unless specified
otherwise.
9.1. Weight
Derivations
Weight is collected once every day (approximately at 9 am) and recorded on ‘daily
monitoring chart’ for all participants. However, for intervention group only, weight is
measured three times daily (approximately at 9 am, 5 pm and 11 pm) and recorded on
‘Emollient application record’ to measure the intervention material. The summaries and
analysis of weight gain will be based on the daily 9AM measurements on ‘Daily
monitoring chart’ only, however, all measurements will be considered in the derivation of
baseline weight. Data from baseline up to and including day 10 (labelled as Day 1 to Day
11 on the daily monitoring chart CRF) will be included in the weight analysis as per the
specification on the eCRF. At the time of interim and post interim, a footnote will be
included to indicate this.
Weight measurements that were collected while a subject had detectable oedema will be
excluded from the summaries and analysis. The earliest measurement in the daily
monitoring chart where oedema status was recorded as 1 (no oedema) will be taken as the
baseline weight. Following review of the interim analysis results, it was decided that all
subjects with oedema would be excluded from the weight analysis only. Subjects with
oedema would be summarised separately in the final clinical study report.
Weight will be summarised as a rate of weight gain (g/kg/day), as defined below:
Change from Baseline
in Weight at Day X (g)
= Weight at Day X (g) – Weight at Baseline (g)
Relative Change from Baseline = Change from Baseline in Weight at Day X (g)

11
in Weight at Day X (g/kg) Weight at Baseline (kg)
Rate of Weight Gain = Relative Change in Weight at Day X (g/kg)
at Day X (g/kg/day) X
Note: ‘X’ refers to the study day label (see Table 2, page 10) and not the day reported on
the daily monitoring chart
Summary Statistics
The following endpoints will be summarised by day (day 0 – day 10), presenting the
number of subjects, mean (with standard deviation) and median, minimum and maximum
for each treatment group. The summaries for change from baseline, relative change from
baseline and rate of weight gain will also present summary statistics for the last day the
subject was in the study.
Weight (kg)
Weight (kg) by oedematous status
Change from baseline in weight (g)
Change from baseline in weight (g) by oedematous status
Relative change from baseline in weight (g/kg)
Relative change from baseline in weight (g/kg) by oedematous status
Rate of weight gain (g/kg/day)
Rate of weight gain (g/kg/day) by oedematous status
Relative change from baseline will also be plotted over time. Day will be presented on
the x-axis and the relative change from baseline will be presented on the y-axis. The
mean at each day will be presented with an associated 95% confidence interval (CI). The
plot will be repeated for the rate of weight gain.
Additionally, the WAZ, WLZ and LAZ scores will be presented over time using simple
descriptive statistics tables and graphical plots. Further exploratory statistical analyses
may be performed for one or more Z scores if the review of data warrants so.
Mixed model repeated measures analysis
Rate of weight gain (g/kg/day) will be analysed using a mixed model repeated measures
(MMRM) analysis with restricted maximum likelihood estimation and an unstructured
variance-covariance matrix. Covariates/ factors will be included in the model as

12
described in Section 7.1Error! Reference source not found.. In the circumstance that
there are convergence problems with the MMRM analysis, this will be explored. For
example the SCORING=4 option could be used in the MIXED statement, which makes
SAS use Fisher scoring for the first 4 iterations. If the convergence problem cannot be
resolved then alternative covariance structures will be investigated.
The estimate of treatment differences for “Emollient Therapy – No Emollient” at each
day will be displayed in the summary of statistical analysis together with the 95% CI and
the associated p-value. Least Squares Means for each day will also be presented with the
standard error and the number of subjects contributing to the Least Squares Means.
The least squares mean at each day will be plotted by treatment group. Day will be
presented on the x-axis and the rate of weight gain will be presented on the y-axis. The
mean at each day will be presented with an associated 95% CI.
If any of the covariates are statistically significant then post-hoc analyses may be
conducted to investigate further.
The normality assumptions will be assessed by inspection of the following plots:
Histogram of marginal studentised residuals derived from the MMRM model
Normal probability plot
Bayesian analysis
At the interim analysis stage, Bayesian methods of analysis will be used to estimate the
posterior distribution for the treatment difference in rate of weight gain between
emollient therapy and no emollient at day 10 for the ITT population.
The Bayesian analysis will be based on a non-informative prior, using the prior statement
within the mixed procedure in SAS (with the default Jeffreys prior option). The posterior
distribution will be obtained from 10,000 simulations however if the Monte Carlo
standard error is less than 0.015 then the number of simulations may be increased.
A table showing the posterior probabilities of the difference in rate of weight gain
between emollient therapy and no emollient at day 10 being greater than 0, 1, 2 and 4,
and the 95% credible interval, will be produced. A figure of the posterior distribution will
also be produced.
No further Bayesian analysis of the data at the end of the study is planned.
13
Further analysis
Non-linear modelling and/or non-parametric analysis may be considered if deemed
appropriate.
Post interim analysis changes
After the interim analysis further investigation led to the inclusion of mean breast feeding
frequency as an additional covariate. This was calculated as the mean value of available
breast feeding frequency information and if all of this data was missing, the mean breast
feeding frequency was imputed as missing.
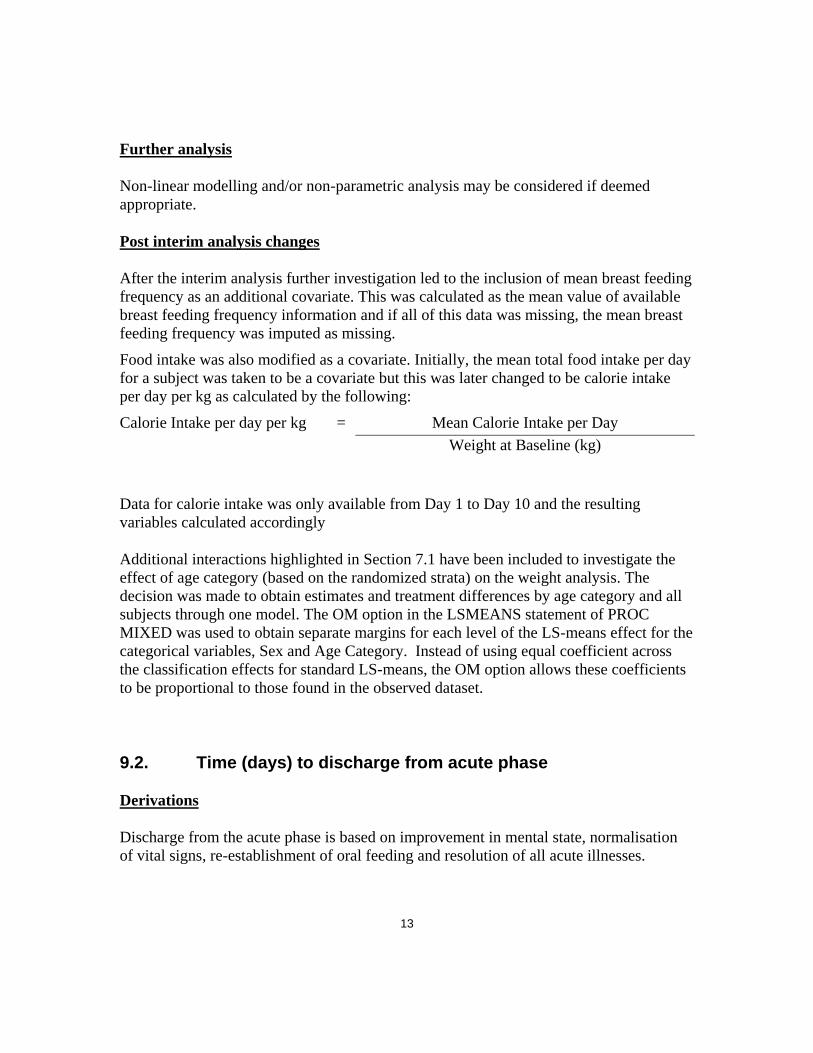
Food intake was also modified as a covariate. Initially, the mean total food intake per day
for a subject was taken to be a covariate but this was later changed to be calorie intake
per day per kg as calculated by the following:
Calorie Intake per day per kg = Mean Calorie Intake per Day
Weight at Baseline (kg)
Data for calorie intake was only available from Day 1 to Day 10 and the resulting
variables calculated accordingly
Additional interactions highlighted in Section 7.1 have been included to investigate the
effect of age category (based on the randomized strata) on the weight analysis. The
decision was made to obtain estimates and treatment differences by age category and all
subjects through one model. The OM option in the LSMEANS statement of PROC
MIXED was used to obtain separate margins for each level of the LS-means effect for the
categorical variables, Sex and Age Category. Instead of using equal coefficient across
the classification effects for standard LS-means, the OM option allows these coefficients
to be proportional to those found in the observed dataset.
9.2. Time (days) to discharge from acute phase
Derivations
Discharge from the acute phase is based on improvement in mental state, normalisation
of vital signs, re-establishment of oral feeding and resolution of all acute illnesses.

14
The CRF collects information on whether a patient is ready for discharge from the acute
phase (Y/N) daily. Time (days) will be derived as the number of days between baseline
and the first occurrence where ‘Ready for discharge from acute phase’ was recorded as
Yes. Baseline will be taken as the earliest measurement recorded in the daily monitoring
chart. Day will be derived relative to the baseline.
If a subject withdrew or died before being ready for discharge from the acute phase then
they will be censored at the time they left the study. Patients who completed Day 10
before being ready for discharge will be followed up by the site until they withdraw or
are ready for discharge.
Kaplan Meier
A Kaplan-Meier plot including 95% CIs and the number of subjects at risk at each day
will be presented.
Cox Proportional Hazards
The time to discharge from acute phase will be compared between treatment groups using
a Cox’s Proportional Hazards model adjusting for the covariates specified in Section 7.1.
The time to discharge from acute phase will be presented in quartiles for each group. The
hazard ratio, 95% CI and associated p-value will also be presented.
Residual plots from the Cox proportional hazard model and the Kaplan-Meier plot will be
used to visually check the assumption of proportional hazards is fair. If the proportional
hazard assumption is invalid, then other methods of analysis may be considered which do
not make this assumption, for example a Weibull model may be fitted to the data.
9.3. Rate of suspected nosocomial infections
Derivations
Any new sign of infection during hospital stay that was not present at admission or not
present for last 48 hours of hospital stay will be considered as nosocomial infection.
Occurrence of the following four suspected nosocomial infections, pneumonia, fever,
UTI and sepsis, is collected on the CRF. Subjects will be considered as having had a
suspected nosocomial infection if they have at least one of these four infections where
symptoms started during the 10-day treatment period. Pneumonia, fever, UTI and sepsis
were identified during the interim results meeting as the key nosocomial infections of
interest.
Summary Statistics

15
The number and percentage of subjects who have at least one suspected nosocomial
infection during the 10 day treatment period will be summarised by treatment group. In
addition the total number of infections (1, 2, 3, >3) and the type of infection will be
summarised as frequency counts and percentages.
Following the interim analysis, nosocomial infections will also be summarised by age
category.
Logistic Regression
The proportion of subjects who have at least one suspected nosocomial infection in each
treatment group will be compared using a logistic regression. Covariates/ factors will be
included in the model as described in Section 7.1Error! Reference source not found..
The odds ratio with associated 95% CI will be presented.
This analysis may not be performed if there are a low number of suspected nosocomial
infections.
9.4. Transepidermal water loss (TEWL)
TEWL (as measured by a tewameter) readings were taken on Day 0, 2, 4, 6, 8 and 10. At
each time point two readings were taken. The average of the two readings will be
determined and used for the analysis described below.
TEWL and change in TEWL will be summarised by day, presenting the number of
subjects, mean (with standard deviation) and median, minimum and maximum for each
treatment group. Change from baseline (mean and 95% CI) in TEWL will also be plotted
over time. Day will be presented on the x-axis and the change from baseline will be
presented on the y-axis.
Change in TEWL will also be analysed using a MMRM following the methods specified
in Section 9.1.
Following the interim analysis, investigation will also be conducted into the effect of age
category on TEWL. A similar approach to that of the weight endpoint will be considered
for the statistical analysis except all subjects will be included in the analysis rather than
only subjects without oedema.
9.5. Skin redness
Skin redness (as assessed by the colorimeter) readings for L, a and b were taken on Day
0, 2, 4, 6, 8 and 10. At each timepoint two readings of L, a and b were taken. The average
16
of the two readings will be determined and used for the analysis described below. L, a
and b will be summarised separately.
Skin redness and change in skin redness will be summarised by day, presenting the
number of subjects, mean (with standard deviation) and median, minimum and maximum
for each treatment group. Change from baseline (mean and 95% CI) in skin redness will
also be plotted over time. Day will be presented on the x-axis and the change from
baseline will be presented on the y-axis.
Change in skin redness will also be analysed using a MMRM following the methods
specified in Section 9.1.
Following the interim analysis, investigation will also be conducted into the effect of age
category on skin redness. A similar approach to that of the weight endpoint will be
considered for the statistical analysis except all subjects will be included in the analysis
rather than only subjects without oedema.
9.6. Skin Appearance Score
Derivations
Skin appearance score is collected on Days 0, 2, 4, 6, 8 and 10. The total score will be
summarised as described below, the individual components which make up the total
score will not be summarised.
Summary Statistics
The absolute and change from baseline values for skin appearance score will be
summarised by day, presenting the number of subjects, mean (with standard deviation)
and median, minimum and maximum for each treatment group. The summaries will also
present summary statistics of the endpoint on the last day the subject was in the study.
Change from baseline (mean and 95% CI) for skin appearance score will also be plotted
over time. Day will be presented on the x-axis and the change from baseline will be
presented on the y-axis. The mean at each day will be presented with an associated 95%
CI.
Mixed model repeated measures analysis
17
Change from baseline in skin appearance score will be analysed using a MMRM
following the methods specified in Section 9.1.
Following the interim analysis, investigation will also be conducted into the effect of age
category on skin appearance score. A similar approach to that of the weight endpoint will
be considered for the statistical analysis except all subjects will be included in the
analysis rather than only subjects without oedema.
Further analysis
Non-linear modelling and latent growth curves may be considered if deemed appropriate.
9.7. SCORDoK Score
Skin condition as measured by the modified SCORDoK score is collected on Days 0, 2,
4, 6, 8 and 10.
SCORDoK scores will be provided by icddr,b, GSK and the Denmark SCORDoK team
but only scores from iccdr,b will be included in the outputs specified in this RAP.
A summary table showing the number and percent of subjects with each type of skin
manifestation will be produced by day and treatment group. The table will also show the
grade for ichtyosiform skin changes, lichenoid skin changes and bullae-erosions-
desquamations.
Further analysis of the SCORDoK score may be carried out by the Denmark SCORDoK
team but this work is out of score for this RAP.
Following the interim analysis, SCORDoK will also be summarised by age category.
9.8. Plasma Fatty Acids
Fatty acid (FA) data will not be included in the interim analysis as the results will not be
available until the end of the study. The fatty acid data will be analysed as part of the
final analysis.
Fatty acids at Day 0 and Day 10 will be summarised along with the change in FA and
percentage change in FA at Day 10. The data displays and exploratory analysis of the FA
data will be performed by Metabolon Inc, and further analyses may be performed by the
18
Statistics group of the GSK subsidiary Cellzome. GSK Statistics and Programming team
will assist in these analyses as needed including providing any datasets or covariates for
statistical analyses.
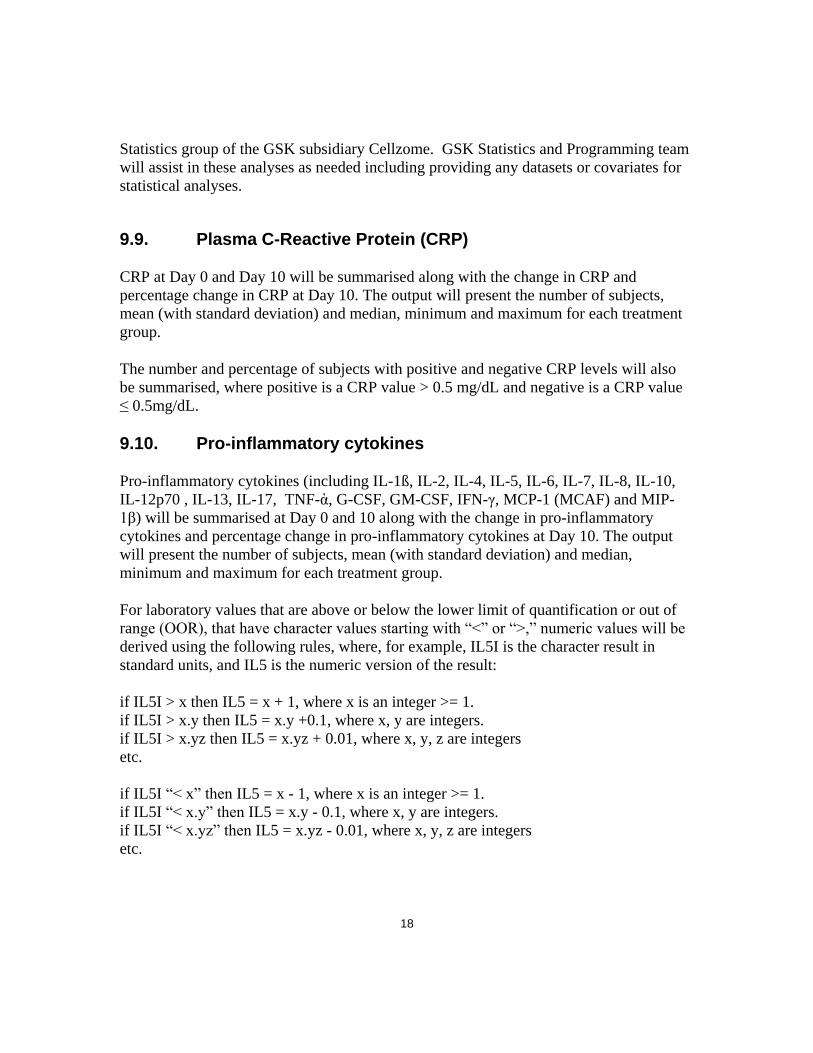
9.9. Plasma C-Reactive Protein (CRP)
CRP at Day 0 and Day 10 will be summarised along with the change in CRP and
percentage change in CRP at Day 10. The output will present the number of subjects,
mean (with standard deviation) and median, minimum and maximum for each treatment
group.
The number and percentage of subjects with positive and negative CRP levels will also
be summarised, where positive is a CRP value > 0.5 mg/dL and negative is a CRP value
≤ 0.5mg/dL.
9.10. Pro-inflammatory cytokines
Pro-inflammatory cytokines (including IL-1ß, IL-2, IL-4, IL-5, IL-6, IL-7, IL-8, IL-10,
IL-12p70 , IL-13, IL-17, TNF-ἀ, G-CSF, GM-CSF, IFN-γ, MCP-1 (MCAF) and MIP-
1β) will be summarised at Day 0 and 10 along with the change in pro-inflammatory
cytokines and percentage change in pro-inflammatory cytokines at Day 10. The output
will present the number of subjects, mean (with standard deviation) and median,
minimum and maximum for each treatment group.
For laboratory values that are above or below the lower limit of quantification or out of
range (OOR), that have character values starting with “<” or “>,” numeric values will be
derived using the following rules, where, for example, IL5I is the character result in
standard units, and IL5 is the numeric version of the result:
if IL5I > x then IL5 = x + 1, where x is an integer >= 1.
if IL5I > x.y then IL5 = x.y +0.1, where x, y are integers.
if IL5I > x.yz then IL5 = x.yz + 0.01, where x, y, z are integers
etc.
if IL5I “< x” then IL5 = x - 1, where x is an integer >= 1.
if IL5I “< x.y” then IL5 = x.y - 0.1, where x, y are integers.
if IL5I “< x.yz” then IL5 = x.yz - 0.01, where x, y, z are integers
etc.

19
10. SAFETY ANALYSES
All safety tables, listings and figures will use the Safety population unless specified
otherwise.
10.1. Adverse Events
A listing of all new problems during the hospital stay, including nosocomial infections,
will be produced.
In addition, any ongoing illnesses, as collected on the daily monitoring chart, will be
listed.
10.2. Concomitant Medications
A listing of all antibiotics given during the study will be produced. Antibiotics that were
taken prior to the start of the study will not be included.
The listing will also include the duration of the concomitant medication prescription. This
will be reported as the total number of days prescribed. Following the interim analysis
discussions, a separate listing will be provided restricting the duration to the number of
days that the concomitant medication taken during the study. For example, if a child on
day 8 was prescribed 14-days’ worth of concomitant medication then the first listing
would record this as ‘14’ and the second would record this as ‘3’ i.e. the concomitant
medication was taken on study day 8, 9 and 10.
10.3. Laboratory Measurements
A listing of the complete blood count and other biochemical / serological investigations
laboratory data collected during the study will be produced.
10.4. Vitals Signs
Pulse, temperature, respiratory rate and mental status (Normal / irritable / lethargic) were
collected three times a day. This data will be listed.
P a g e | 1
1 | P a g e
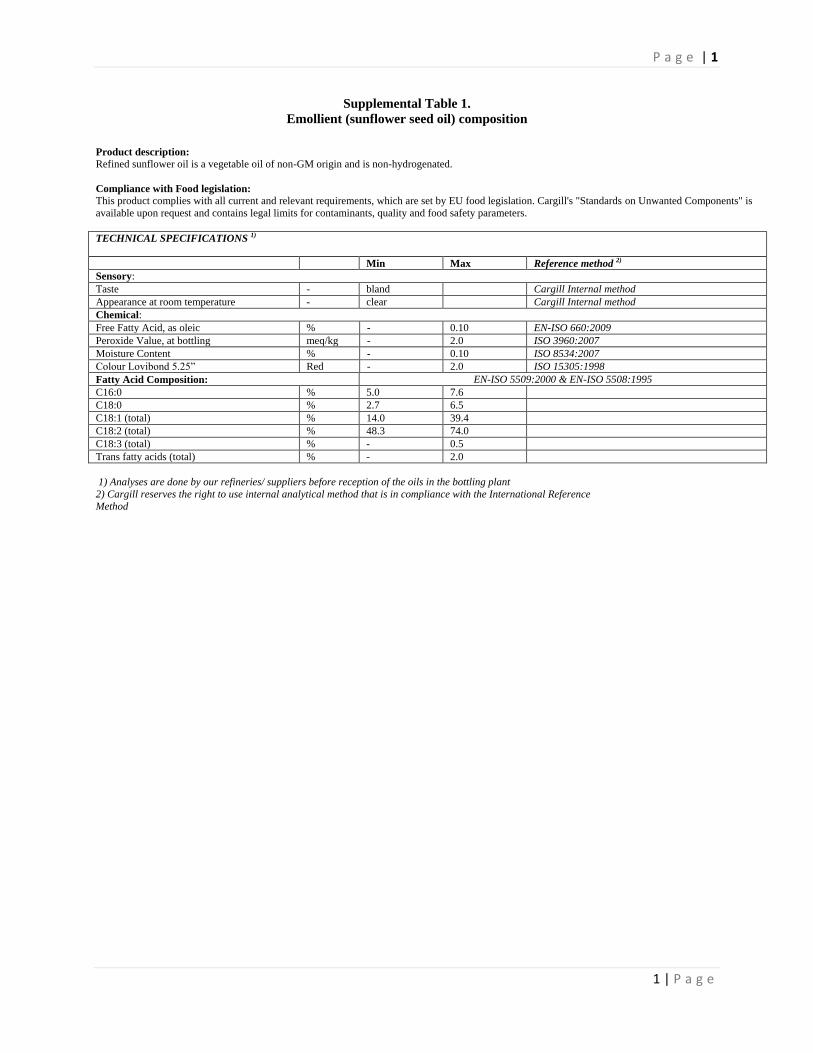
Supplemental Table 1.
Emollient (sunflower seed oil) composition
Product description: Refined sunflower oil is a vegetable oil of non-GM origin and is non-hydrogenated.
Compliance with Food legislation: This product complies with all current and relevant requirements, which are set by EU food legislation. Cargill's "Standards on Unwanted Components" is
available upon request and contains legal limits for contaminants, quality and food safety parameters.
TECHNICAL SPECIFICATIONS 1)
Min Max Reference method 2)
Sensory:
Taste - bland Cargill Internal method
Appearance at room temperature - clear Cargill Internal method
Chemical:
Free Fatty Acid, as oleic % - 0.10 EN-ISO 660:2009
Peroxide Value, at bottling meq/kg - 2.0 ISO 3960:2007
Moisture Content % - 0.10 ISO 8534:2007
Colour Lovibond 5.25” Red - 2.0 ISO 15305:1998
Fatty Acid Composition: EN-ISO 5509:2000 & EN-ISO 5508:1995
C16:0 % 5.0 7.6
C18:0 % 2.7 6.5
C18:1 (total) % 14.0 39.4
C18:2 (total) % 48.3 74.0
C18:3 (total) % - 0.5
Trans fatty acids (total) % - 2.0
1) Analyses are done by our refineries/ suppliers before reception of the oils in the bottling plant
2) Cargill reserves the right to use internal analytical method that is in compliance with the International Reference
Method
1 | P a g e
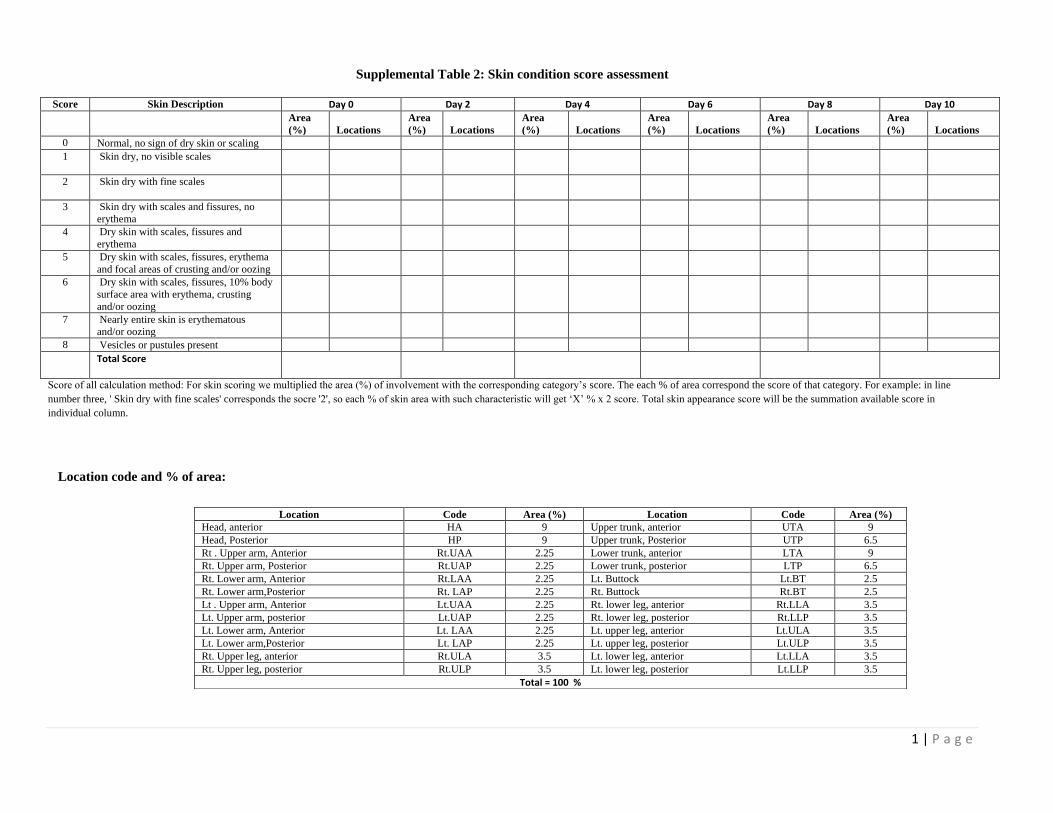
Supplemental Table 2: Skin condition score assessment
Score Skin Description Day 0 Day 2 Day 4 Day 6 Day 8 Day 10
Area
(%) Locations
Area
(%) Locations
Area
(%) Locations
Area
(%) Locations
Area
(%) Locations
Area
(%) Locations
0 Normal, no sign of dry skin or scaling
1 Skin dry, no visible scales
2 Skin dry with fine scales
3 Skin dry with scales and fissures, no
erythema
4 Dry skin with scales, fissures and
erythema
5 Dry skin with scales, fissures, erythema
and focal areas of crusting and/or oozing
6 Dry skin with scales, fissures, 10% body
surface area with erythema, crusting
and/or oozing
7 Nearly entire skin is erythematous
and/or oozing
8 Vesicles or pustules present
Total Score
Score of all calculation method: For skin scoring we multiplied the area (%) of involvement with the corresponding category’s score. The each % of area correspond the score of that category. For example: in line
number three, ' Skin dry with fine scales' corresponds the socre '2', so each % of skin area with such characteristic will get ‘X’ % x 2 score. Total skin appearance score will be the summation available score in
individual column.
Location code and % of area:
Location Code Area (%) Location Code Area (%)
Head, anterior HA 9 Upper trunk, anterior UTA 9
Head, Posterior HP 9 Upper trunk, Posterior UTP 6.5
Rt . Upper arm, Anterior Rt.UAA 2.25 Lower trunk, anterior LTA 9
Rt. Upper arm, Posterior Rt.UAP 2.25 Lower trunk, posterior LTP 6.5
Rt. Lower arm, Anterior Rt.LAA 2.25 Lt. Buttock Lt.BT 2.5
Rt. Lower arm,Posterior Rt. LAP 2.25 Rt. Buttock Rt.BT 2.5
Lt . Upper arm, Anterior Lt.UAA 2.25 Rt. lower leg, anterior Rt.LLA 3.5
Lt. Upper arm, posterior Lt.UAP 2.25 Rt. lower leg, posterior Rt.LLP 3.5
Lt. Lower arm, Anterior Lt. LAA 2.25 Lt. upper leg, anterior Lt.ULA 3.5
Lt. Lower arm,Posterior Lt. LAP 2.25 Lt. upper leg, posterior Lt.ULP 3.5
Rt. Upper leg, anterior Rt.ULA 3.5 Lt. lower leg, anterior Lt.LLA 3.5
Rt. Upper leg, posterior Rt.ULP 3.5 Lt. lower leg, posterior Lt.LLP 3.5
Total = 100 %