Embed Size (px)
Citation preview

Title of Document:
Reporting Data with “Over-the-Counter” Data Analysis Supports
Improves Educators’ Data Analyses
Author Name:
Jenny Grant Rankin, Ph.D.
Date of Publication:
March, 2014
Conference Organization:
Society for Information Technology & Teacher Education (SITE)
Conference Title:
Society for Information Technology & Teacher Education (SITE) International Conference
Conference Location: Jacksonville, Florida
Conference Dates: March 17-21, 2014
The subsequent pages comprise the complete presentation paper
as it was submitted, accepted, and presented.
Reporting Data with “Over-the-Counter” Data Analysis Supports
Improves Educators’ Data Analyses
Abstract: The benefits of making data-informed decisions to improve learning rely on educators
correctly interpreting given data. Many educators routinely misinterpret data, even at districts with
proactive support for data use. The tool most educators use for data analyses, which is an
information technology data system or its reports, typically reports data without guidance
concerning the data’s proper analysis. A solution to data misinterpretation lies in applying medical
labeling conventions to information technology to essentially offer educators over-the-counter data,
meaning reports are paired with straightforward verbiage on the proper interpretation of contents.
Findings from a quantitative study involving 211 educators of varied backgrounds and roles at nine
schools throughout California included improvements to respondents’ data analysis accuracy by
205%-436% when one of varied forms of data analysis guidance was embedded within the
information technology reporting environment. Findings were significant and can be used to
improve data systems and data use.
Introduction and Theoretical Framework
Over-the-counter medication is deemed negligent if not accompanied by textual guidance proven to
improve its use (DeWalt 2010). No or poor medication labels have resulted in many errors and tragedy, as people
are left with no way to know how to use the contents wisely (Brown-Brumfield & DeLeon 2010). Labeling
conventions such as those used for over-the-counter medication can translate to improved understanding and use of
non-medication products, as well (Hampton 2007; Qin et al. 2011).
Thus, in the way over-the-counter medicine’s proper use is communicated with a thorough label and added
documentation, an information technology system used to generate student data can include components to help
users better comprehend the data it contains. Yet such data systems currently display data for educators without
sufficient support to use their contents – data – wisely (Coburn, Honig, & Stein 2009; Data Quality Campaign
[DQC] 2009, 2011; Goodman & Hambleton 2004; National Forum on Education Statistics 2011).
A data system is a computer system meant to provide educators with student data to help solve educational
problems (Wayman, 2005). Examples of data systems include student information systems (SISs), assessment
systems, instructional management systems (IMSs), and data-warehousing systems, but distinctions between
different types of data systems are blurring as these separate information technology systems begin to serve more of
the same functions (Bill and Melinda Gates Foundation, 2007).
Labeling and tools within data systems to assist analyses are uncommon, even though most educators
analyze data while unaccompanied by someone who can help them use the data appropriately (U.S. Department of
Education Office of Planning, Evaluation and Policy Development [USDEOPEPD] 2009). Essentially, data systems
do not commonly present data in an “over-the-counter” format that offers educators guidance in the report contents’
use. For educators, whose primary purpose for using data is to treat students, using data without embedded support
is akin to using medicine from an unmarked or marginally marked container. This study considered the impact on
educators’ data analyses if data systems provided data in an over-the-counter format, meaning data usage guidance
was embedded within the reporting environment.
Problem
Educators make data analysis errors impacting students, yet data systems do not include analysis help, and
it was undecided whether adding supports to data systems can reduce the number of analysis errors. Data-informed
decisions can lead to improved learning (Sabbah 2011; Underwood, Zapata-Rivera, & VanWinkle 2010;
Wohlstetter, Datnow, & Park 2008). Most educators have access to data systems to generate and analyze score
reports (Aarons 2009; Herbert 2011). Educators worldwide are expected to use these reports to make decisions that
impact student learning (Hattie & Brown 2008).

Unfortunately, educators do not use this data correctly, and there is evidence many users of data system
reports have trouble understanding the data (Hattie 2010; National Research Council 2001; Wayman, Snodgrass
Rangel, Jimerson, & Cho 2010; Zwick et al. 2008). For example, in two national studies of districts known for
strong data use, teachers’ accuracy when interpreting data was only 48% correct and it is unlikely other school
districts would perform any better (USDEOPEPD, 2009, 2011).
Few teacher preparation programs cover topics like assessment data literacy (Halpin & Cauthen 2011),
most people analyzing data received no training to do so (DQC 2009; Few 2008), and human biases compromise
judgment and complicate decision-making processes (Kahneman 2011). Even when professional development and
added staffing are employed to improve data use, these supports require added resources and – though generally
beneficial – are not foolproof. For example, in a study where teachers received PD in measurement, all teachers
struggled afterwards with statistical terms and measurement concepts (Zapata-Rivera & VanWinkle, 2010). Also,
knowledge management research indicated knowledge is hard to share with others, even when the intention to share
it is there, especially when power or status is involved (Cho & Wayman, 2009).
Data use impacts students, and misunderstandings when using data systems can cripple data use in school
districts (Wayman, Cho, & Shaw 2009). Yet labeling and tools within data systems to assist analysis are uncommon,
even though most educators analyze data alone (USDEOPEPD 2009). There is a clear need for research identifying
how reports can better facilitate correct interpretations by its users (Goodman & Hambleton 2004; Hattie 2010). The
power of data systems that generate these reports will not be realized until researchers contribute to improving data
system design to improve analysis (DQC 2011).
Methods and Purpose
The purpose of the experimental, quantitative study was to facilitate causal inferences concerning the
degree to which including different forms of data usage guidance within a data system reporting environment can
improve educators’ understanding of the data contents, much like including different forms of usage guidance with
over-the-counter medication is needed to improve use of contents. The study’s primary independent variables
included the following types of data analysis guidance, each of which was framed in two different formats and was
used with two reports per study participant to answer four data analysis-based questions of varied complexity:
Footer: A report footer is a brief set of text at the bottom of a report that communicates information an
educator would need to know to correctly understand and analyze that particular report’s data. The
study’s footers ranged from 34-58 words, 156-269 characters without spaces, and 224-324 characters
with spaces. Footers were either monochromatic or contained minimal color used purposefully; for
example, “Warning” was featured in red and “What to Do” was featured in green.
Reference Sheet: A report-specific reference sheets, also called an abstract, is a single page that
accompanies a report to help the educator more easily understand the report and analyze its data. The
study’s reference sheets contained the report’s title, description, image, focus (content reported), and
warning (vital, cautionary information an educator would need to avoid the most common analysis
errors made when analyzing the particular data being displayed). Half of the study’s sheets also
communicated the report’s purpose (key questions the report will help answer) and additional focus
information (intended audience, and format in which data is reported).
Reference Guide: A reference guide, also called an interpretation guide, is a 2- or 3-page reference
guide that accompanies a report to help the educator more easily use the report and analyze its data.
The study’s guides adhered to either of two formats: (a) the report’s reference sheet (as described
above) functioned as the guide’s 1st page, and pages followed containing the report’s instructions (how
to read the report), essential questions (showing the user where to look on this report – and what to
look for – to answer each question listed in the purpose area of the guide’s 1st page), and a “more info”
section (offering where to get additional information on related topics); or (b) the guide contained the

report’s title, description, warning, essential questions, and a “more info” section (details for these
sections was provided earlier in article).
The dependent variable was accuracy of data analysis-based responses, measured by a survey containing data
analysis questions. 211 elementary and secondary educators throughout California answered these questions while
viewing one of seven report sets of student data (Fig. 1-7).
Figure 1: Scenario 1 Participant (Control Group) Handouts; No Supports Were Received
Figure 2: Scenario 2 (Footer A) Participant Handouts; Note Footer/Support at Bottom of Page
Figure 3: Scenario 3 (Footer B) Participant Handouts; Note Footer/Support at Bottom of Page

Figure 4: Scenario 4 Participant (Reference Sheet A) Handouts; Participants Also Received Figure 1 Handouts
Figure 5: Scenario 5 Participant (Reference Sheet B) Handouts; Participants Also Received Figure 1 Handouts
Figure 6: Scenario 6 Participant (Reference Guide A) Handouts; Participants Also Received Figure 1 Handouts
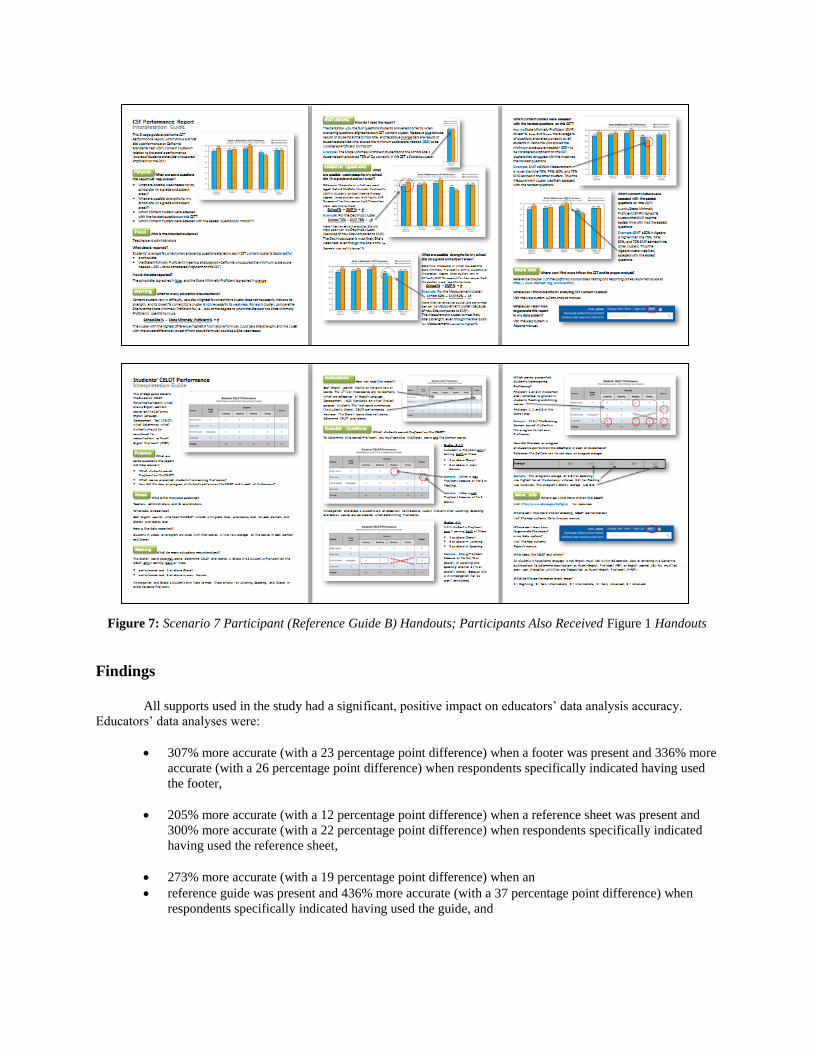
Figure 7: Scenario 7 Participant (Reference Guide B) Handouts; Participants Also Received Figure 1 Handouts
Findings
All supports used in the study had a significant, positive impact on educators’ data analysis accuracy.
Educators’ data analyses were:
307% more accurate (with a 23 percentage point difference) when a footer was present and 336% more
accurate (with a 26 percentage point difference) when respondents specifically indicated having used
the footer,
205% more accurate (with a 12 percentage point difference) when a reference sheet was present and
300% more accurate (with a 22 percentage point difference) when respondents specifically indicated
having used the reference sheet,
273% more accurate (with a 19 percentage point difference) when an
reference guide was present and 436% more accurate (with a 37 percentage point difference) when
respondents specifically indicated having used the guide, and

264% more accurate (with an 18 percentage point difference) when any one of the three supports was
present and 355% more accurate (with a 28 percentage point difference) when respondents specifically
indicated having used the support.
On average, the 211 study participants indicated they used supports 58% of the time:
Respondents receiving footers indicated they used them 73% of the time, on average.
Respondents receiving reference sheets indicated they used them 50% of the time, on average.
Respondents receiving reference sheets indicated they used them 52% of the time, on average.
87% of participants who receive no supports indicated they would have used footers, reference sheets, or reference
guides if the supports had been available.
When no supports were used, data analysis accuracy was 11%. All 211 participants, regardless of support
use, averaged a data analysis accuracy of 26%. In cases where respondents indicated they used an available support,
data analysis accuracy was 39%. See Fig. 8 for visual representation.
Figure 8: Impact of Supports in Terms of Relative Difference

Significance
The findings of this study filled a gap in education field literature by containing evidence that can be used
to identify how data systems can help increase educators’ data analysis accuracy by providing analysis support
directly within the information technology and its reports. The study also rendered examples and templates for real-
world implementation, which are available for free, open access, on the researcher’s website. Improvements data
system and report providers make in light of this study have potential to improve the accuracy with which educators
analyze the data generated by their data systems. This improvement will likely benefit students impacted by
educators’ data-informed decision-making.
References
Aarons, D. (2009). Report finds states on course to build pupil-data systems. Education Week, 29(13), 6. Retrieved from
http://search.proquest.com/docview/202710770?accountid=28180
Bill and Melinda Gates Foundation (2007). Landscape review: Education data. Retrieved from
http://www.gatesfoundation.org/learning/Documents/landscape-review-education-data.pdf
Brown-Brumfield, D., & DeLeon, A. (2010). Adherence to a medication safety protocol: Current practice for labeling
medications and solutions on the sterile field. Association of Operating Room Nurses. AORN Journal, 91(5), 610-610-
7. doi:10.1016/j.aorn.2010.03.002
Cho, V., & Wayman, J. C. (2009, April). Knowledge management and educational data use. Paper presented at the 2009 Annual
Meeting of the American Educational Research Association, San Diego, CA.
Coburn, C. E., Honig, M. I., & Stein, M. K. (2009). What’s the evidence on districts’ use of evidence? In J. Bransford, D. J.
Stipek, N. J. Vye, L. Gomez, & D. Lam (Eds.), The role of research in educational improvement, 67-88. Cambridge,
MA: Harvard Education Press.
Data Quality Campaign (2009). The next step: Using longitudinal data systems to improve student success. Retrieved from
http://www.dataqualitycampaign.org/find-resources/the-next-step/
Data Quality Campaign (2011). Leveraging the power of state longitudinal data systems: Building capacity to turn data into
useful information. Retrieved from http://www.dataqualitycampaign.org/files/DQC-
Research%20capacity%20May17.pdf
DeWalt, D. A. (2010). Ensuring safe and effective use of medication and health care: perfecting the dismount. The Journal of the
American Medical Association (JAMA), 304(23), 2641-2642. doi: 10.1001/jama.2010.1844
Few, S. (2008, November 14). Telling compelling stories with numbers: Data visualization for enlightening communication.
Statewide Longitudinal Data Systems (SLDS) Grant Program Third Annual Fall Grantee Meeting. Presentation
conducted from SLDS, Arlington, VA. Retrieved from http://nces.ed.gov/programs/slds/pdf/08_F_06.pdf
Goodman, D. P., & Hambleton, R. K. (2004). Student test score reports and interpretive guides: Review of current practices and
suggestions for future research. Applied Measurement in Education, 17(2), 145–220.
Halpin, J., & Cauthen, L. (July 31, 2011). The education dashboard. Center for Digital Education’s Converge Special Report
2(3), 2-36.
Hampton, T. (2007). Groups urge warning label for medical devices containing toxic chemical. The Journal of the American
Medical Association (JAMA), 298(11), 1267. doi: 10.1001/jama.298.11.1267
Hattie, J. (2010). Visibly learning from reports: The validity of score reports. Online Educational Research Journal. Also: Paper
presented at the annual meeting of the National Council for Measurement in Education (NCME), San Diego, CA.
Retrieved from http://www.oerj.org/View?action=viewPaper&paper=6
Hattie, J. A. C., & Brown, G. T. L. (2008). Technology for school-based assessment and assessment for learning: Development
principals from New Zealand. Journal of Educational Technology Systems 36(2), 189-201.
Herbert, M. (2011). States on track to have top-notch data systems. District Administration, 47(4), 12. Norwalk, CT: Professional
Media Group LLC.
Kahneman, D. (2011). Thinking, fast and slow. New York, NY: Farrar, Straus and Giroux.
National Forum on Education Statistics. (2011). Traveling through time: The forum guide to longitudinal data systems. Book
Four of Four: Advanced LDS Usage (NFES 2011–802). Washington, DC: National Center for Education Statistics,
Institute of Education Sciences, U.S. Department of Education.
National Research Council (2001). NAEP reporting practices: Investigating district-level and market-basket reporting.
Committee on NAEP Reporting Practices, Board on Testing and Assessment, Center for Education. Washington, DC:
National Academy Press.
Qin, Y., Wu, M., Pan, X., Xiang, Q., Huang, J., Gu, Z., & ... Zhou, M. (2011, February 25). Reactions of Chinese adults to
warning labels on cigarette packages: a survey in Jiangsu Province. BMC Public Health, 11(133). doi: 10.1186/1471-
2458-11-133
Sabbah, F. M. (2011). Designing more effective accountability report cards. ProQuest Dissertations and Theses, AAT 3469488,
Retrieved from http://search.proquest.com/docview/893068662?accountid=28180

Underwood, J. S., Zapata-Rivera, D., & VanWinkle, W. (2010). An evidence-centered approach to using assessment data for
policymakers (ETS Research Rep. No. RR-10-03). Princeton, NJ: ETS.
U.S. Department of Education Office of Planning, Evaluation and Policy Development (2009). Implementing data-informed
decision making in schools: Teacher access, supports and use. United States Department of Education (ERIC
Document Reproduction Service No. ED504191)
U.S. Department of Education Office of Planning, Evaluation and Policy Development (2011). Teachers' ability to use data to
inform instruction: Challenges and supports. United States Department of Education (ERIC Document Reproduction
Service No. ED516494)
Wayman, J. C. (2005). Involving teachers in data-driven decision making: Using computer data systems to support teacher
inquiry and reflection. Journal of Education for Students Placed At Risk, 10, no. 3: 295–308.
Wayman, J. C., Cho, V., & Shaw, S. M. (2009, December). First-year results from an efficacy study of the Acuity data system.
Paper presented at the Twenty-fourth Annual Texas Assessment Conference, Austin, TX.
Wayman, J. C., Snodgrass Rangel, V. W., Jimerson, J. B., & Cho, V. (2010). Improving data use in NISD: Becoming a data-
informed district. Austin, TX: The University of Texas at Austin.
Wohlstetter, P., Datnow, A., & Park, V. (2008). Creating a system for data-driven decision-making: Applying the principal-agent
framework. School Effectiveness and School Improvement, 19(3), 239–259.
Zapata-Rivera, D., & VanWinkle, W. (2010). A research-based approach to designing and evaluating score reports for teachers
(ETS Research Memorandum No. RM-10-01). Princeton, NJ: ETS.
Zwick, R., Sklar, J., Wakefield, G., Hamilton, C., Norman, A., & Folsom, D. (2008). Instructional tools in educational
measurement and statistics (ITEMS) for school personnel: Evaluation of three web-based training modules.
Educational Measurement: Issues and Practice, 27, 14–27.
Acknowledgements
Sincere thanks and respect go to the 211 educators who participated in this study, as well as to all who graciously
helped to make the necessary arrangements. Since this study’s findings are intended to be used to improve the manner in which
information technology communicates data to educators so as to better assist them in helping students, this generous gift of time
constitutes yet one more way in which participants give selflessly for kids. Our future is a bright vision when such champions for
students are in our schools.


![3.3 Designing Data Types - Florida Institute of Technologyryan/cse1002/sedgewick/33design.pdf · Counter Data Type. Counter. Data type ... [Y2K] Two digit years: ... Advantages and](https://img.pdfslide.net/doc/110x75/5aafd7717f8b9a6b308dd300/33-designing-data-types-florida-institute-of-technology-ryancse1002sedgewick.jpg)