Embed Size (px)
Citation preview
Creating Reports
Library Trend: 2 Ranking Report: 3
Managing Reports 3
Create a New Report 4
Report Options 5
Results Filtering 6 Locations Filter 6
Report Types 7 Table Report 8 PI Report 10 Graph/PI 11 Summary 12 Summary Graphs 12 Trend/PI 13 Trend Reports 14 Period Comparison 16 PI Gap 18 Cross Tab 18 To create a Cross Tab Report 19 Custom Format 20 Published Reports 21
Creating Reports
Counting Opinions (SQUIRE) Ltd. 2
Reports
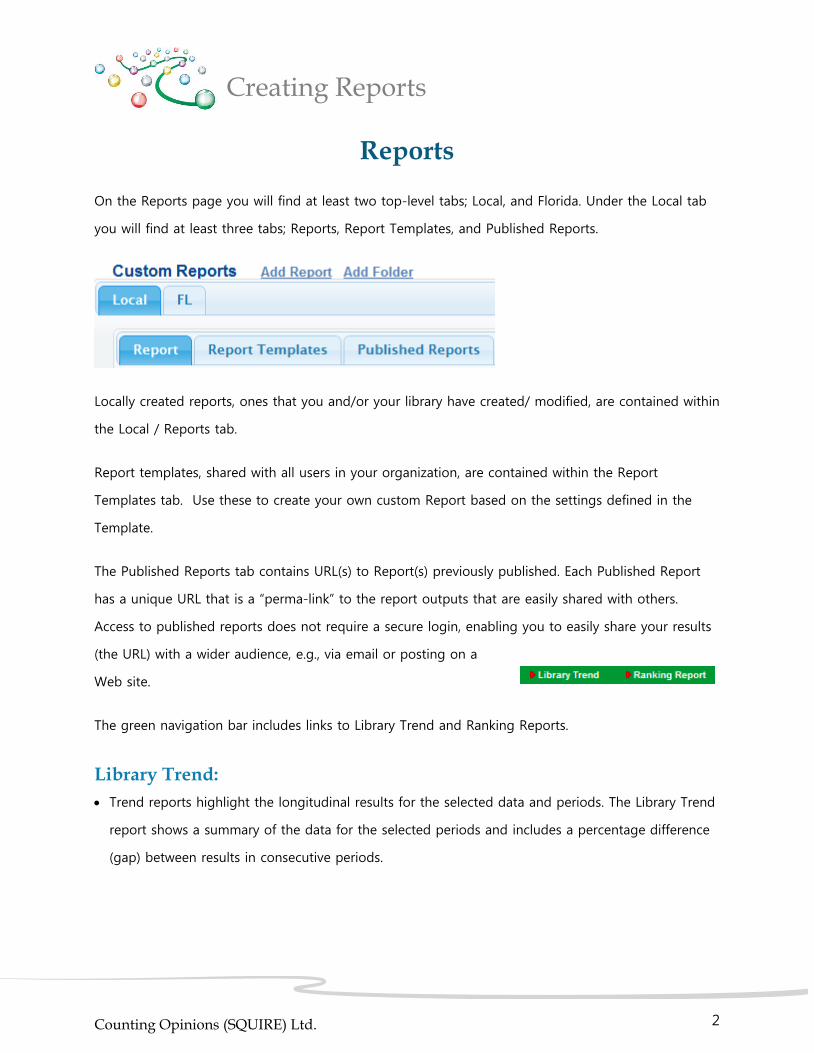
On the Reports page you will find at least two top-level tabs; Local, and Florida. Under the Local tab
you will find at least three tabs; Reports, Report Templates, and Published Reports.
Locally created reports, ones that you and/or your library have created/ modified, are contained within
the Local / Reports tab.
Report templates, shared with all users in your organization, are contained within the Report
Templates tab. Use these to create your own custom Report based on the settings defined in the
Template.
The Published Reports tab contains URL(s) to Report(s) previously published. Each Published Report
has a unique URL that is a “perma-link” to the report outputs that are easily shared with others.
Access to published reports does not require a secure login, enabling you to easily share your results
(the URL) with a wider audience, e.g., via email or posting on a
Web site.
The green navigation bar includes links to Library Trend and Ranking Reports.
Library Trend:
Trend reports highlight the longitudinal results for the selected data and periods. The Library Trend
report shows a summary of the data for the selected periods and includes a percentage difference
(gap) between results in consecutive periods.
Creating Reports
Counting Opinions (SQUIRE) Ltd. 3
Ranking Report:
Ranking Reports summarize the results for your organization and/or location versus other
organizations/locations. The Ranking Report includes Minimum, Maximum, and Average values for
all reporting institutions/locations for ease of comparing your results.
Managing Reports
The Report Management Screen is an on-line filing cabinet with folder tabs for organizing reports. By
default, you have access to the folders as shown above. With sufficient permissions, Reports can be
created using the "Add Report” link or by selecting an existing Report (or Report Template) and then
saving as a New Report.
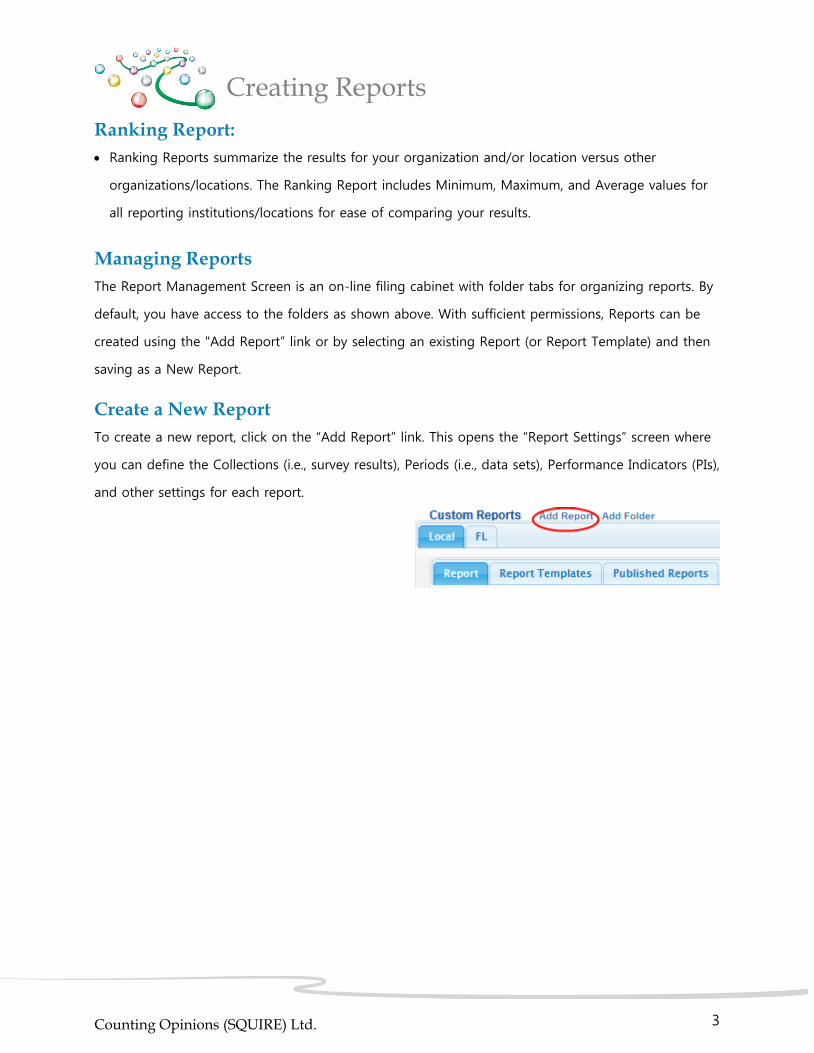
Create a New Report
To create a new report, click on the “Add Report” link. This opens the “Report Settings” screen where
you can define the Collections (i.e., survey results), Periods (i.e., data sets), Performance Indicators (PIs),
and other settings for each report.
Creating Reports
Counting Opinions (SQUIRE) Ltd. 4
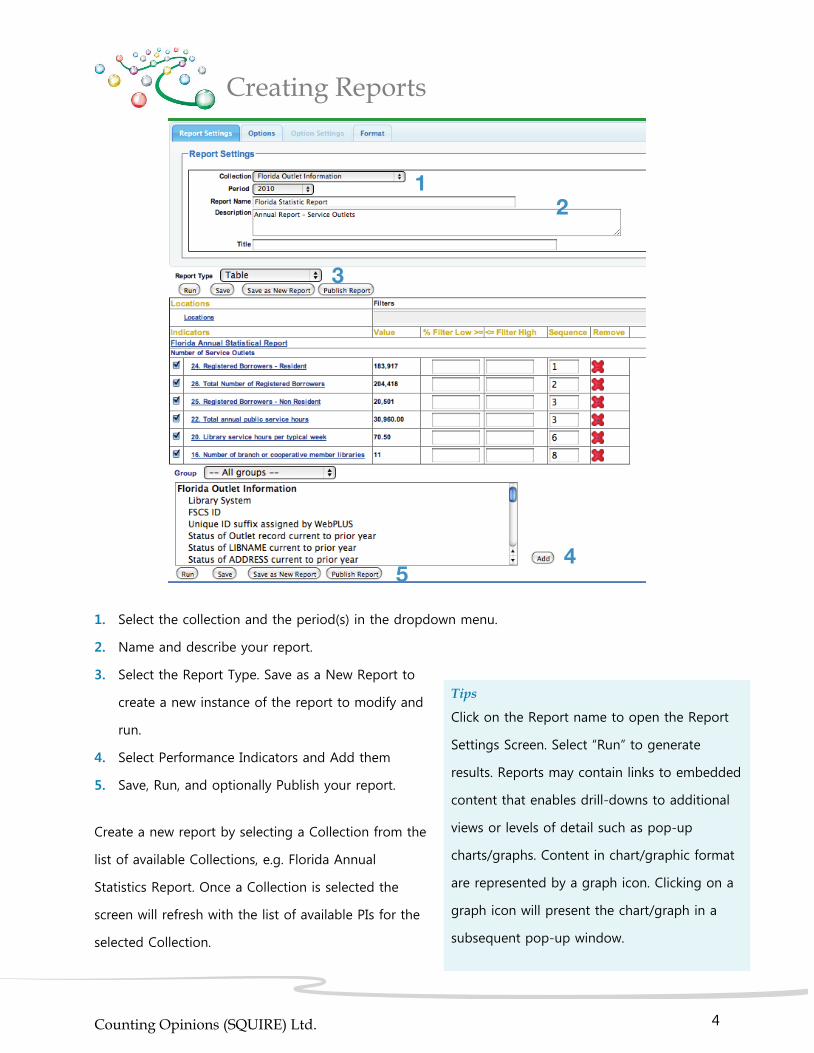
1. Select the collection and the period(s) in the dropdown menu.
2. Name and describe your report.
3. Select the Report Type. Save as a New Report to
create a new instance of the report to modify and
run.
4. Select Performance Indicators and Add them
5. Save, Run, and optionally Publish your report.
Create a new report by selecting a Collection from the
list of available Collections, e.g. Florida Annual
Statistics Report. Once a Collection is selected the
screen will refresh with the list of available PIs for the
selected Collection.
Tips
Click on the Report name to open the Report
Settings Screen. Select “Run” to generate
results. Reports may contain links to embedded
content that enables drill-downs to additional
views or levels of detail such as pop-up
charts/graphs. Content in chart/graphic format
are represented by a graph icon. Clicking on a
graph icon will present the chart/graph in a
subsequent pop-up window.
Export/download icons indicate the file format
Creating Reports
Counting Opinions (SQUIRE) Ltd. 5
To expedite the selection of specific PIs to include in the Report, you can specify a Group/Section
name from the available list. Select one or more PIs (click the PI name to highlight) then click “Add”.
You can also multi-select PIs by holding down the control key (or command key for Apple users)
when selecting PIs.
You can also add PIs from more than one Collection. To do so, simply select a different Collection
from the available list and then Add the PIs as appropriate.
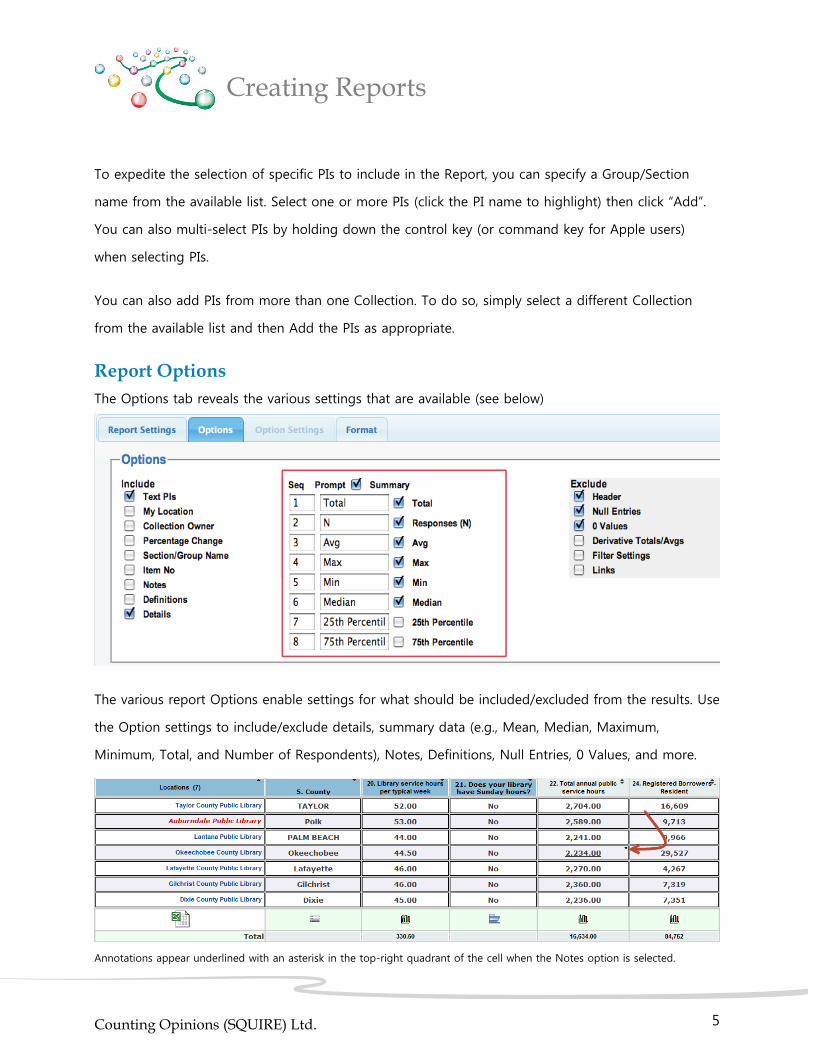
Report Options
The Options tab reveals the various settings that are available (see below)
The various report Options enable settings for what should be included/excluded from the results. Use
the Option settings to include/exclude details, summary data (e.g., Mean, Median, Maximum,
Minimum, Total, and Number of Respondents), Notes, Definitions, Null Entries, 0 Values, and more.
Annotations appear underlined with an asterisk in the top-right quadrant of the cell when the Notes option is selected.
Creating Reports
Counting Opinions (SQUIRE) Ltd. 6
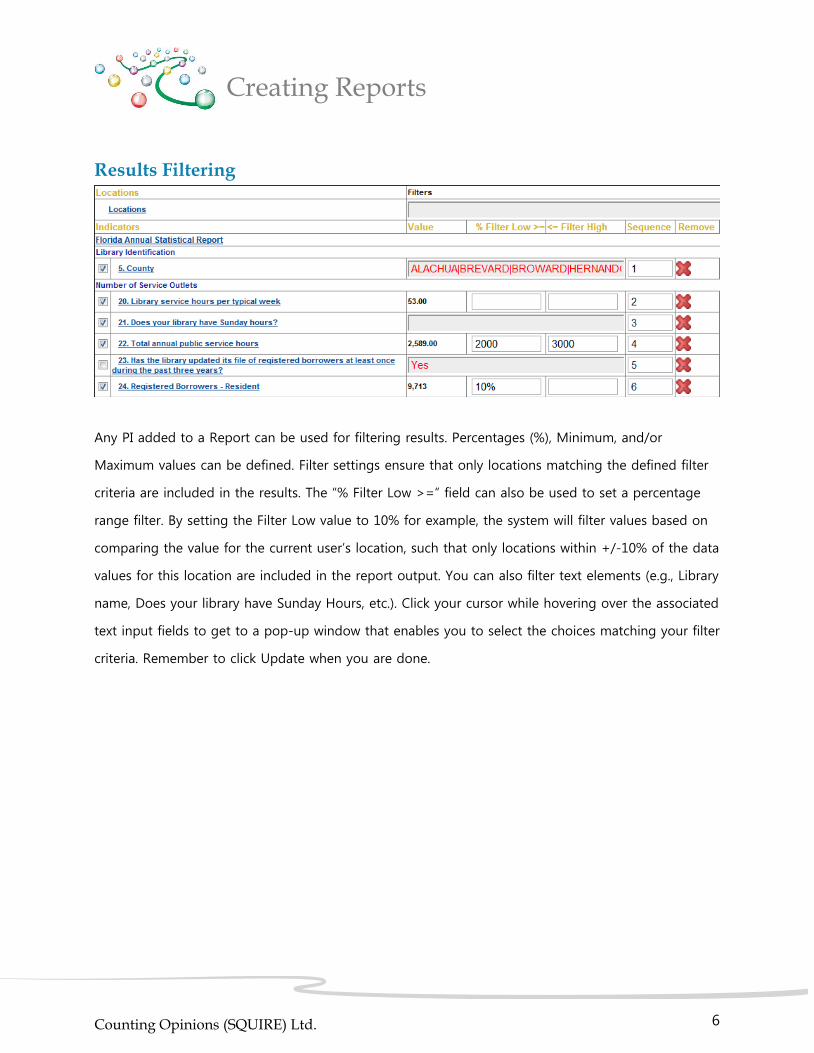
Results Filtering
Any PI added to a Report can be used for filtering results. Percentages (%), Minimum, and/or
Maximum values can be defined. Filter settings ensure that only locations matching the defined filter
criteria are included in the results. The “% Filter Low >=” field can also be used to set a percentage
range filter. By setting the Filter Low value to 10% for example, the system will filter values based on
comparing the value for the current user’s location, such that only locations within +/-10% of the data
values for this location are included in the report output. You can also filter text elements (e.g., Library
name, Does your library have Sunday Hours, etc.). Click your cursor while hovering over the associated
text input fields to get to a pop-up window that enables you to select the choices matching your filter
criteria. Remember to click Update when you are done.
Creating Reports
Counting Opinions (SQUIRE) Ltd. 7
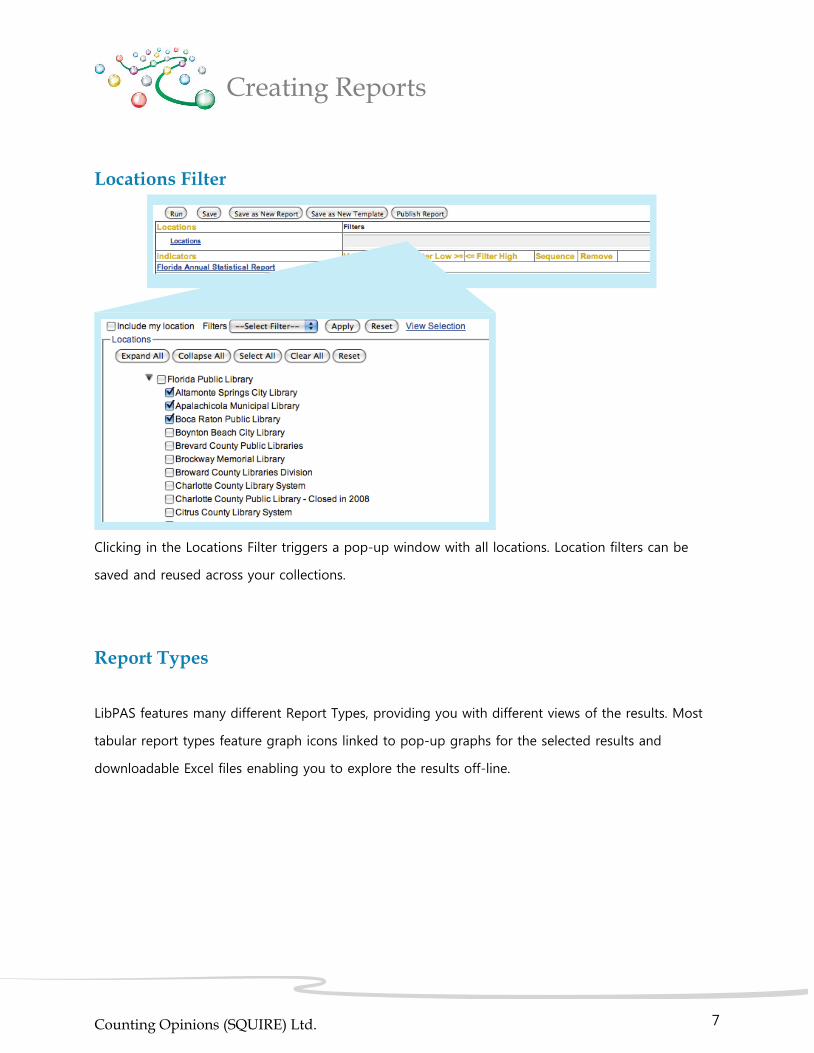
Locations Filter
Clicking in the Locations Filter triggers a pop-up window with all locations. Location filters can be
saved and reused across your collections.
Report Types
LibPAS features many different Report Types, providing you with different views of the results. Most
tabular report types feature graph icons linked to pop-up graphs for the selected results and
downloadable Excel files enabling you to explore the results off-line.
Creating Reports
Counting Opinions (SQUIRE) Ltd. 8
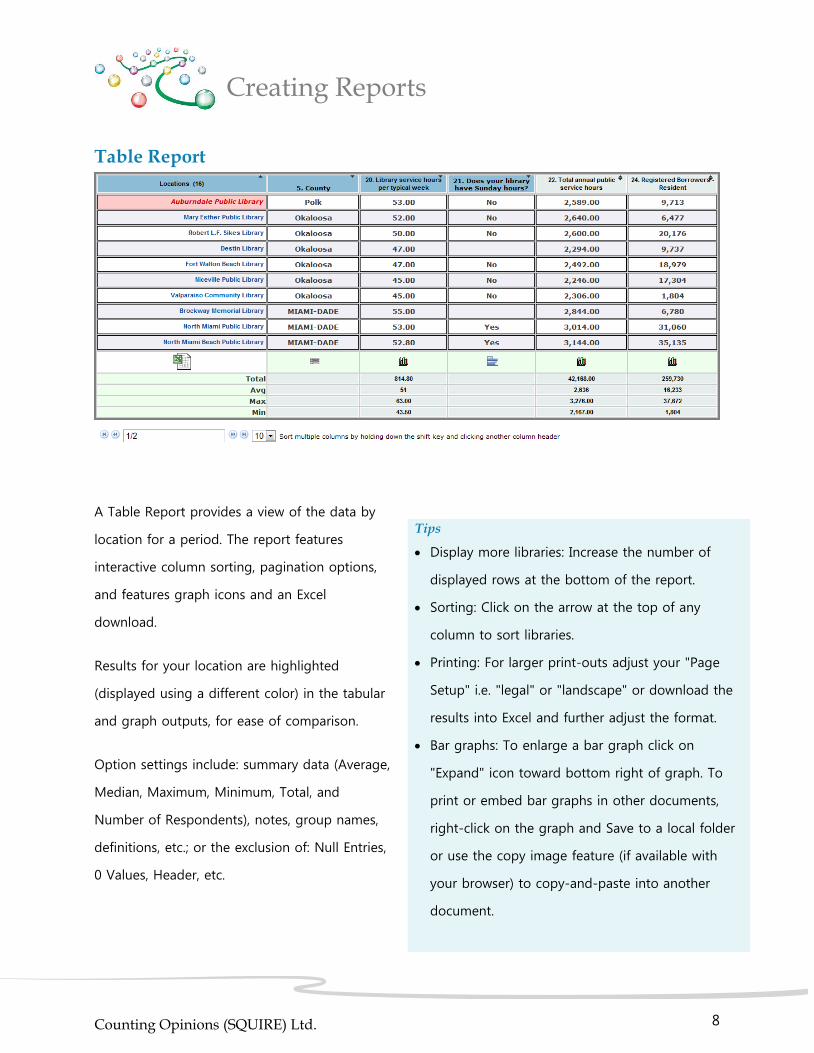
Table Report
A Table Report provides a view of the data by
location for a period. The report features
interactive column sorting, pagination options,
and features graph icons and an Excel
download.
Results for your location are highlighted
(displayed using a different color) in the tabular
and graph outputs, for ease of comparison.
Option settings include: summary data (Average,
Median, Maximum, Minimum, Total, and
Number of Respondents), notes, group names,
definitions, etc.; or the exclusion of: Null Entries,
0 Values, Header, etc.
Tips
Display more libraries: Increase the number of
displayed rows at the bottom of the report.
Sorting: Click on the arrow at the top of any
column to sort libraries.
Printing: For larger print-outs adjust your "Page
Setup" i.e. "legal" or "landscape" or download the
results into Excel and further adjust the format.
Bar graphs: To enlarge a bar graph click on
"Expand" icon toward bottom right of graph. To
print or embed bar graphs in other documents,
right-click on the graph and Save to a local folder
or use the copy image feature (if available with
your browser) to copy-and-paste into another
document.
Creating Reports
Counting Opinions (SQUIRE) Ltd. 9
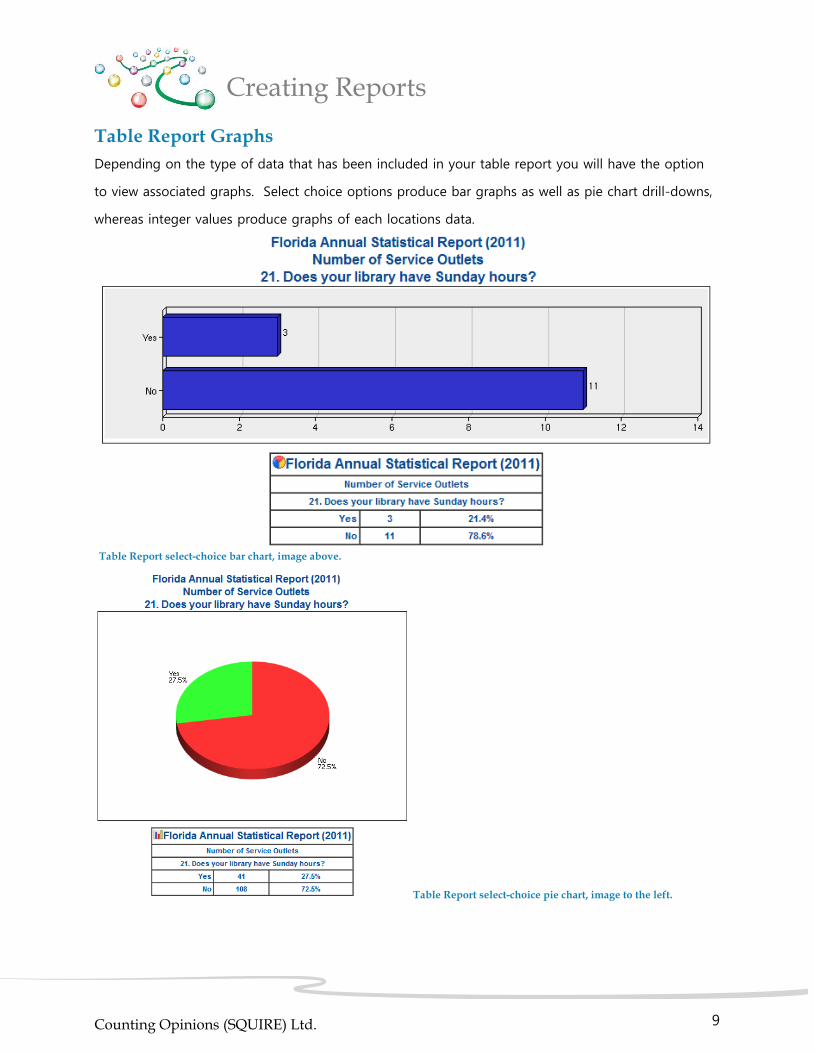
Table Report Graphs
Depending on the type of data that has been included in your table report you will have the option
to view associated graphs. Select choice options produce bar graphs as well as pie chart drill-downs,
whereas integer values produce graphs of each locations data.
Table Report select-choice bar chart, image above.
Table Report select-choice pie chart, image to the left.
Creating Reports
Counting Opinions (SQUIRE) Ltd. 10
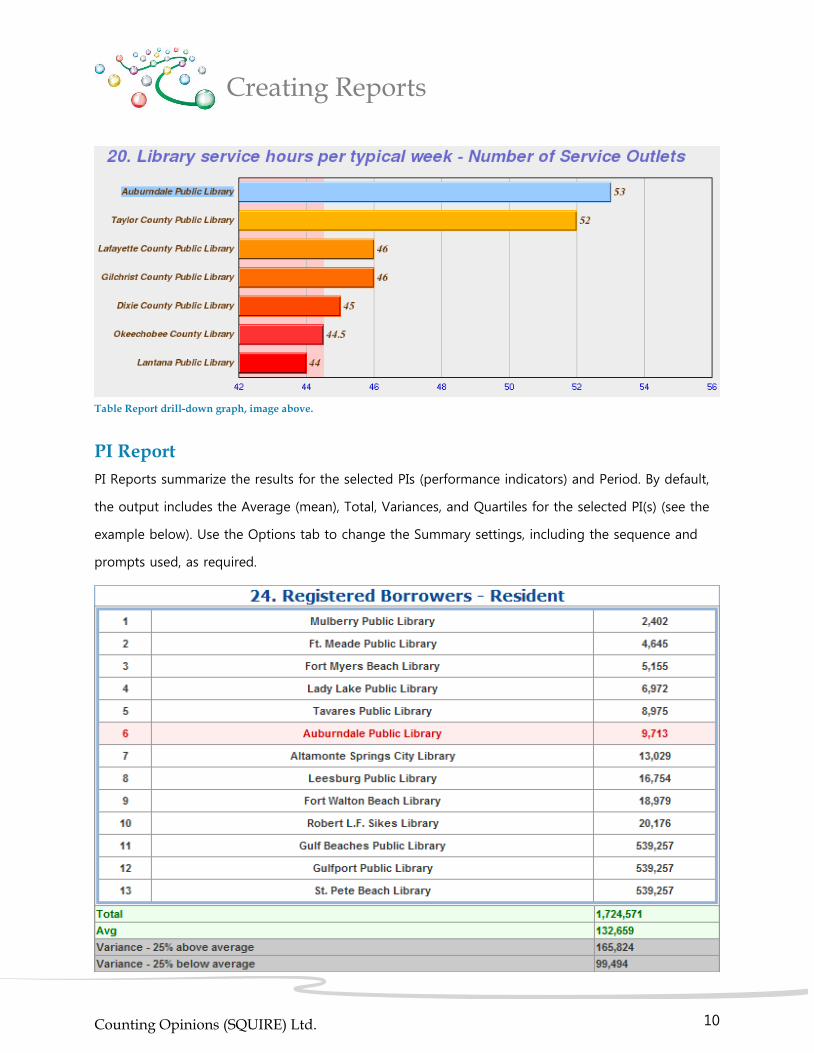
Table Report drill-down graph, image above.
PI Report
PI Reports summarize the results for the selected PIs (performance indicators) and Period. By default,
the output includes the Average (mean), Total, Variances, and Quartiles for the selected PI(s) (see the
example below). Use the Options tab to change the Summary settings, including the sequence and
prompts used, as required.
Creating Reports
Counting Opinions (SQUIRE) Ltd. 11
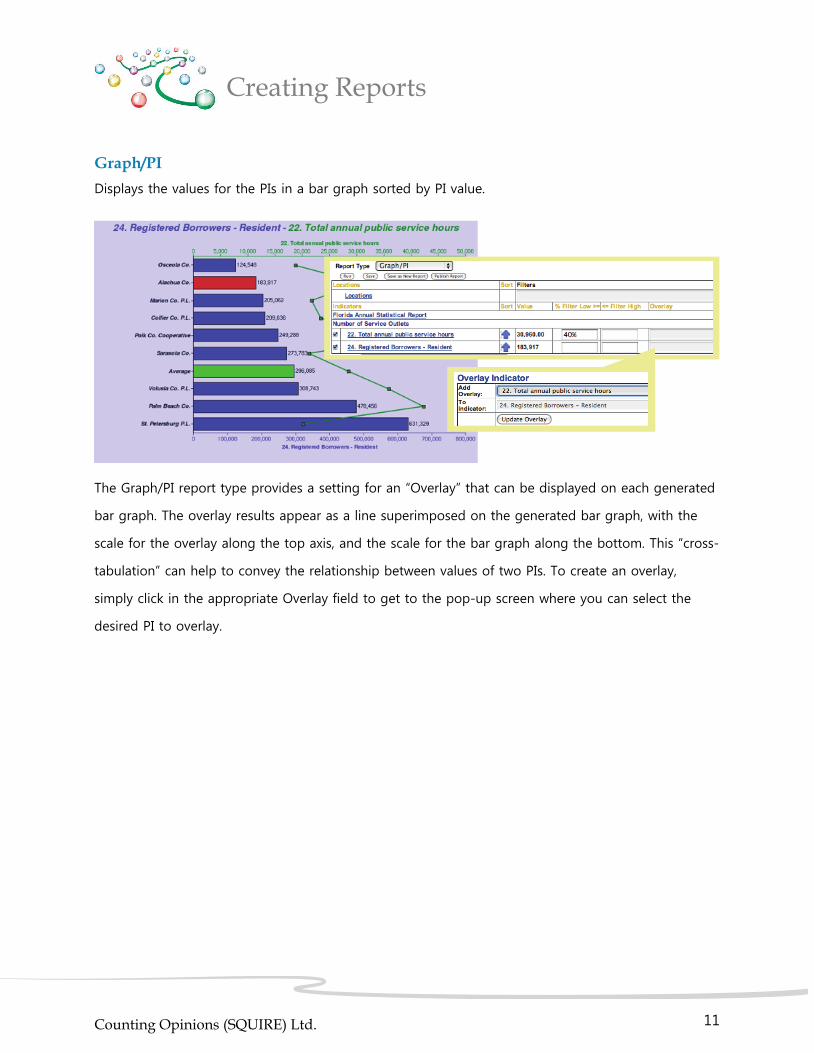
Graph/PI
Displays the values for the PIs in a bar graph sorted by PI value.
The Graph/PI report type provides a setting for an “Overlay” that can be displayed on each generated
bar graph. The overlay results appear as a line superimposed on the generated bar graph, with the
scale for the overlay along the top axis, and the scale for the bar graph along the bottom. This “cross-
tabulation” can help to convey the relationship between values of two PIs. To create an overlay,
simply click in the appropriate Overlay field to get to the pop-up screen where you can select the
desired PI to overlay.
Creating Reports
Counting Opinions (SQUIRE) Ltd. 12
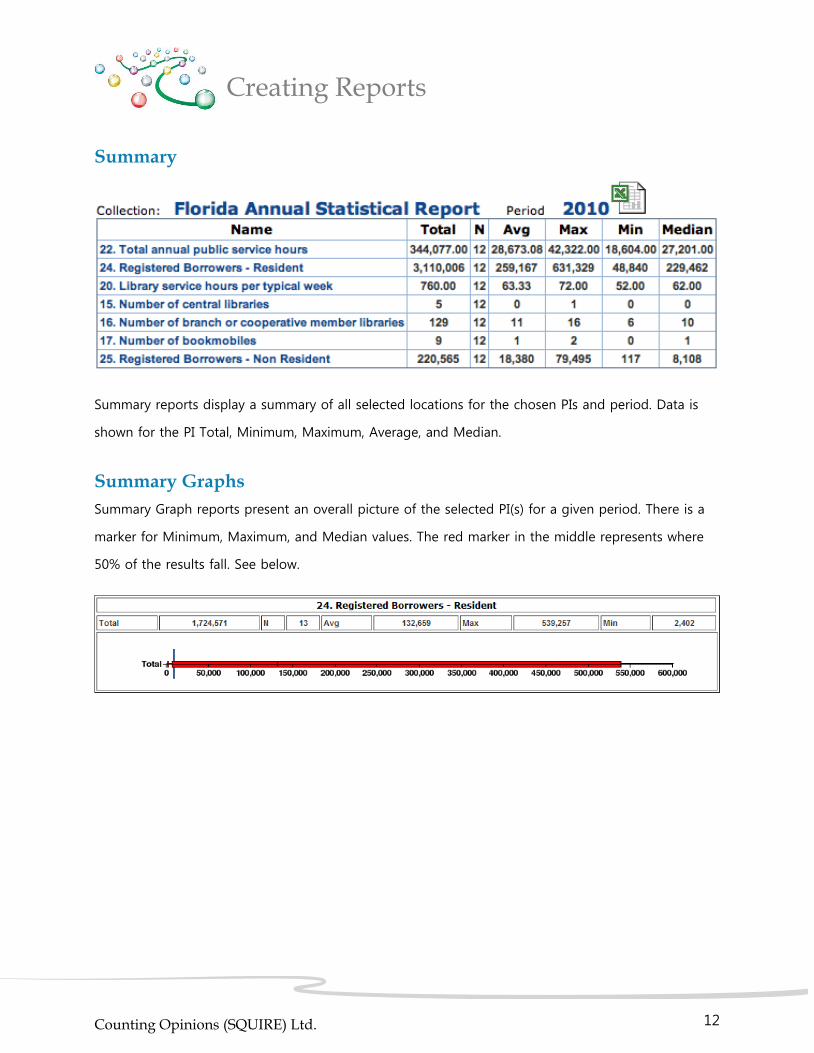
Summary
Summary reports display a summary of all selected locations for the chosen PIs and period. Data is
shown for the PI Total, Minimum, Maximum, Average, and Median.
Summary Graphs
Summary Graph reports present an overall picture of the selected PI(s) for a given period. There is a
marker for Minimum, Maximum, and Median values. The red marker in the middle represents where
50% of the results fall. See below.
Creating Reports
Counting Opinions (SQUIRE) Ltd. 13
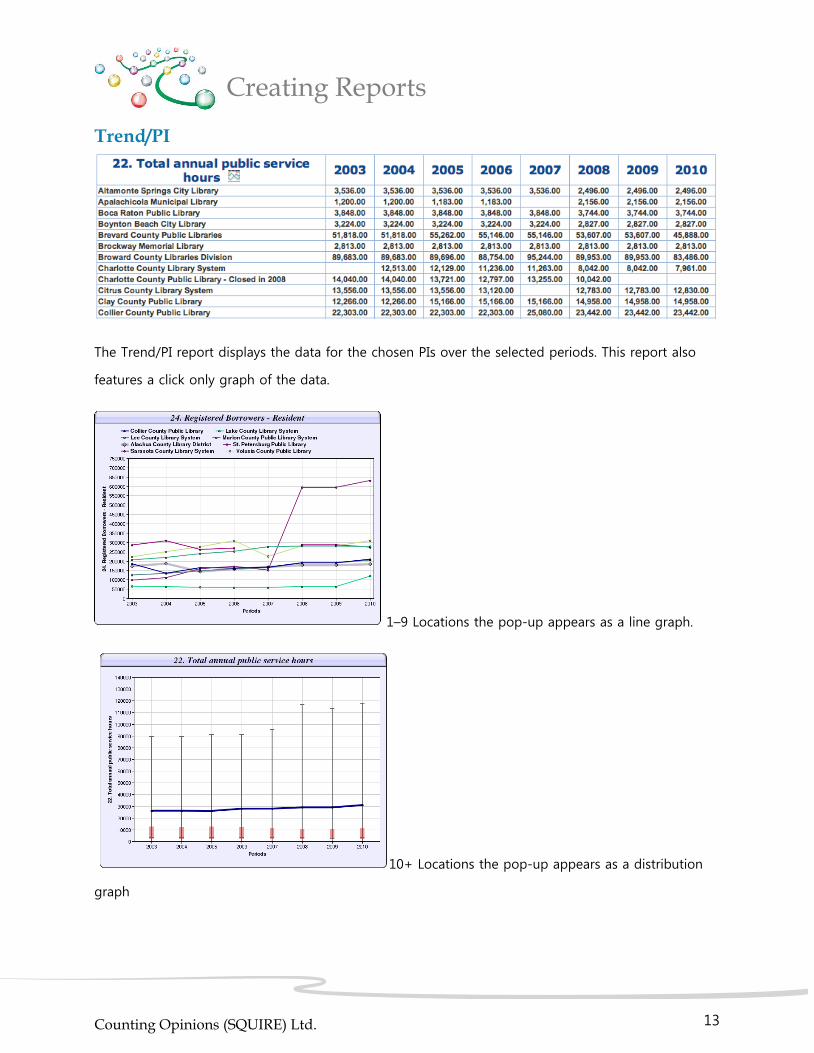
Trend/PI
The Trend/PI report displays the data for the chosen PIs over the selected periods. This report also
features a click only graph of the data.
1–9 Locations the pop-up appears as a line graph.
10+ Locations the pop-up appears as a distribution
graph
Creating Reports
Counting Opinions (SQUIRE) Ltd. 14
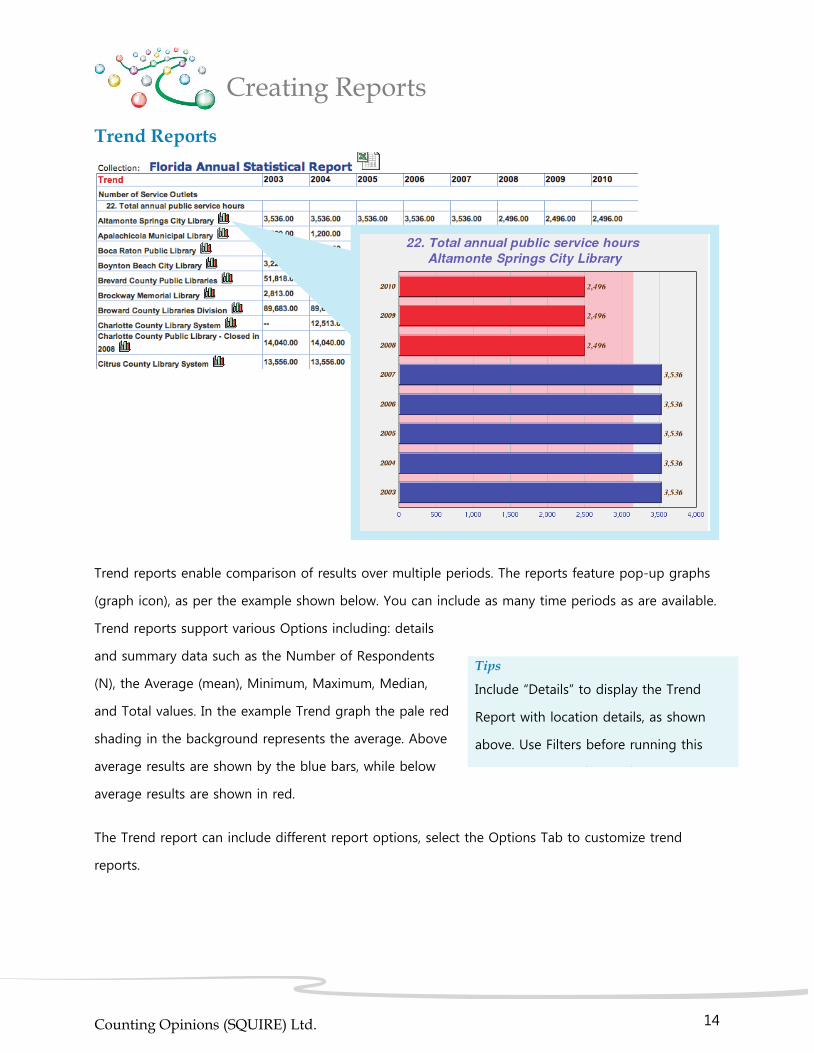
Trend Reports
Trend reports enable comparison of results over multiple periods. The reports feature pop-up graphs
(graph icon), as per the example shown below. You can include as many time periods as are available.
Trend reports support various Options including: details
and summary data such as the Number of Respondents
(N), the Average (mean), Minimum, Maximum, Median,
and Total values. In the example Trend graph the pale red
shading in the background represents the average. Above
average results are shown by the blue bars, while below
average results are shown in red.
The Trend report can include different report options, select the Options Tab to customize trend
reports.
Tips
Include “Details” to display the Trend
Report with location details, as shown
above. Use Filters before running this
report to narrow the results.
Creating Reports
Counting Opinions (SQUIRE) Ltd. 15
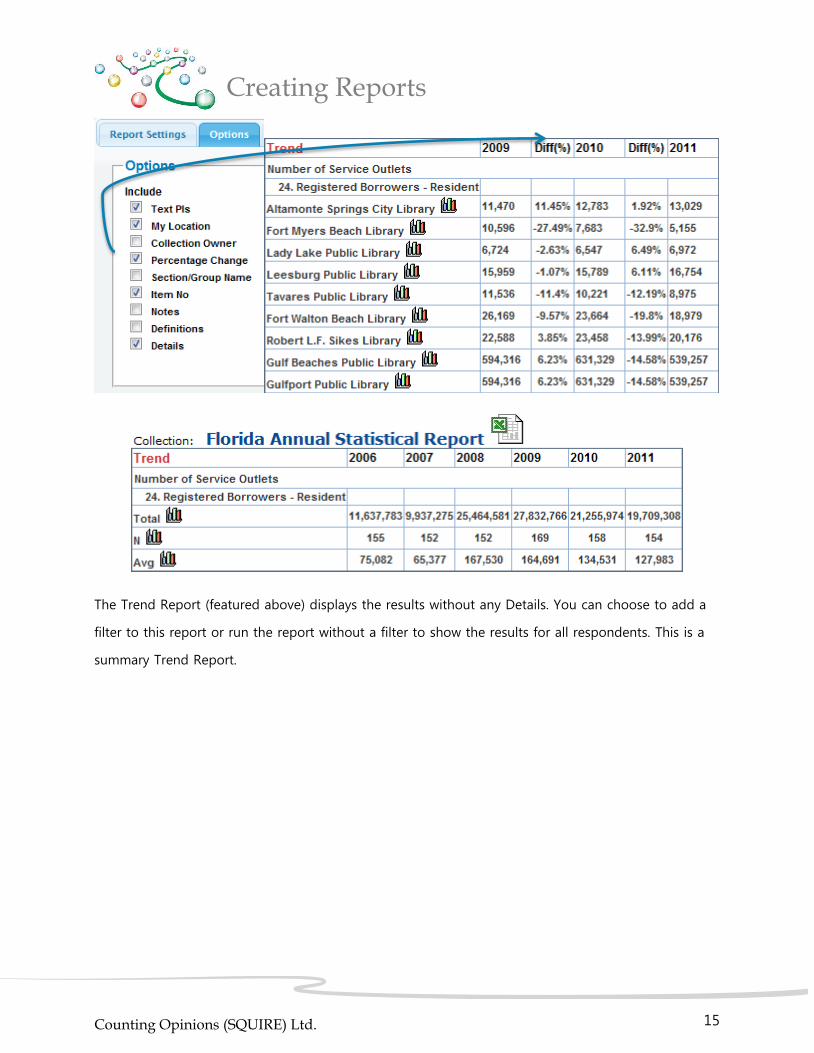
The Trend Report (featured above) displays the results without any Details. You can choose to add a
filter to this report or run the report without a filter to show the results for all respondents. This is a
summary Trend Report.
Creating Reports
Counting Opinions (SQUIRE) Ltd. 16
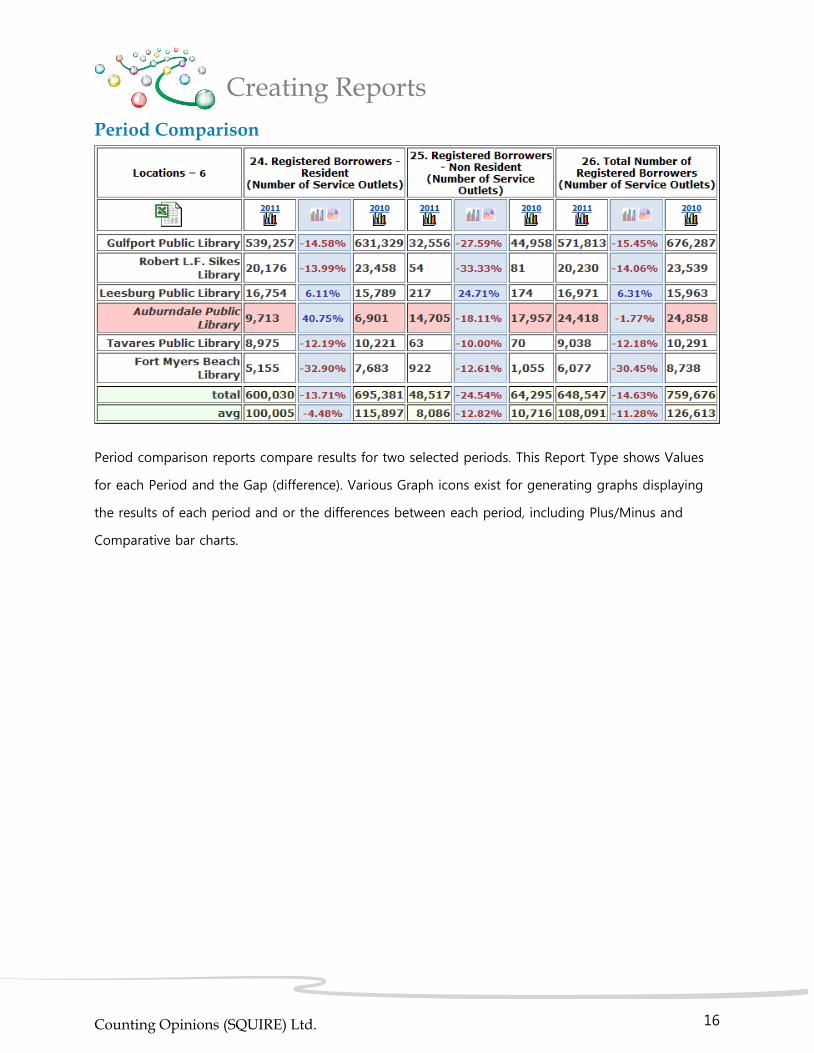
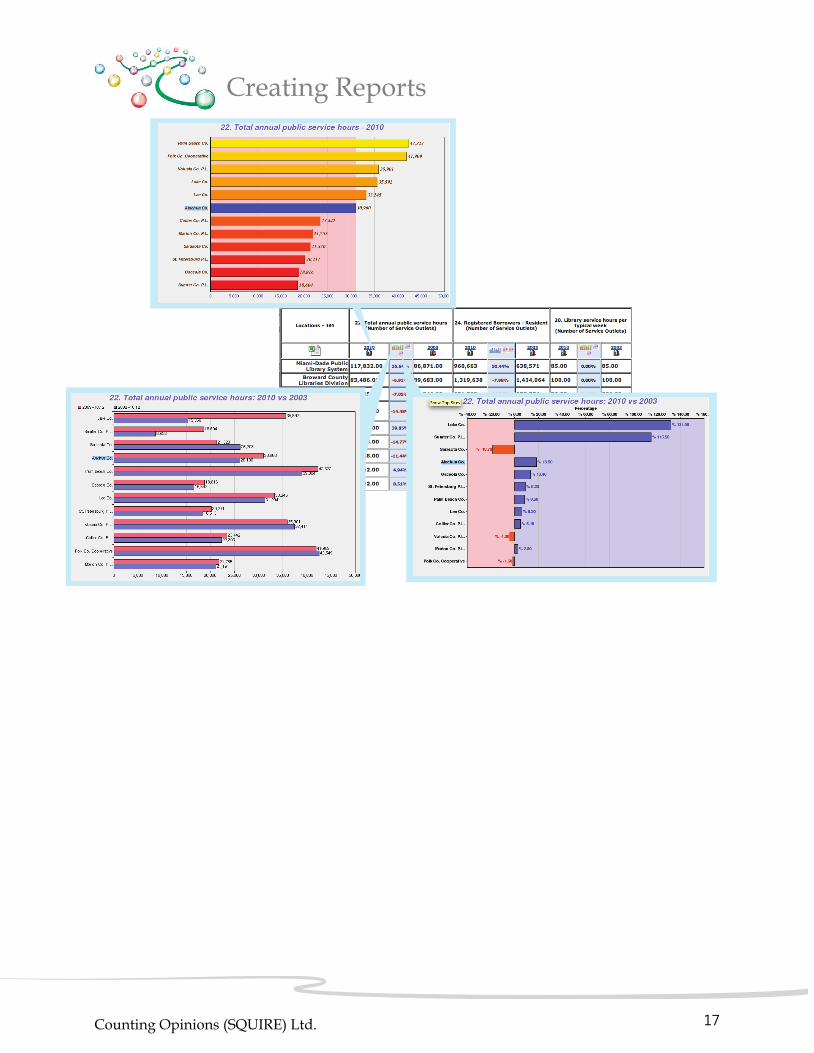
Period Comparison
Period comparison reports compare results for two selected periods. This Report Type shows Values
for each Period and the Gap (difference). Various Graph icons exist for generating graphs displaying
the results of each period and or the differences between each period, including Plus/Minus and
Comparative bar charts.
Creating Reports
Counting Opinions (SQUIRE) Ltd. 17
Creating Reports
Counting Opinions (SQUIRE) Ltd. 18
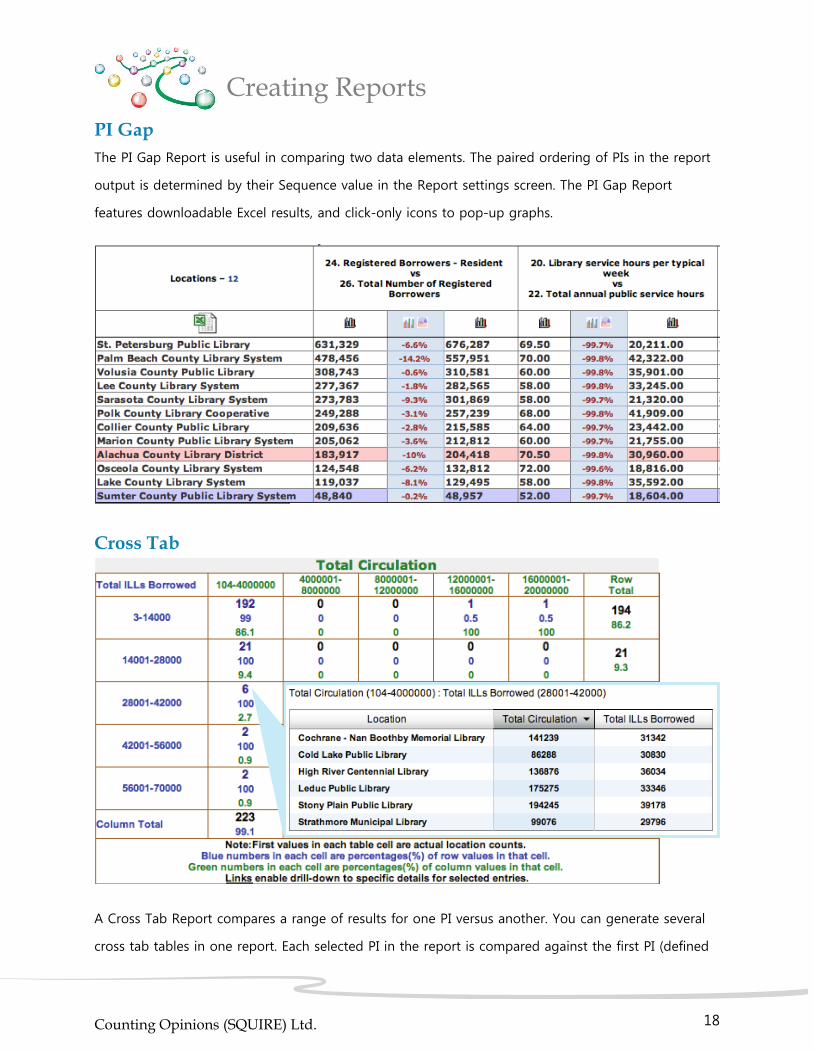
PI Gap
The PI Gap Report is useful in comparing two data elements. The paired ordering of PIs in the report
output is determined by their Sequence value in the Report settings screen. The PI Gap Report
features downloadable Excel results, and click-only icons to pop-up graphs.
Cross Tab
A Cross Tab Report compares a range of results for one PI versus another. You can generate several
cross tab tables in one report. Each selected PI in the report is compared against the first PI (defined
Creating Reports
Counting Opinions (SQUIRE) Ltd. 19
by Sequence.) The Cross Tab Report provides counts and percentage values of row and column totals
in each cell of the report. Cross Tab Reports also feature links, from the counts, that enable a drill-
down to a listing of the corresponding locations and their values for the PIs in the Cross Tab Report.
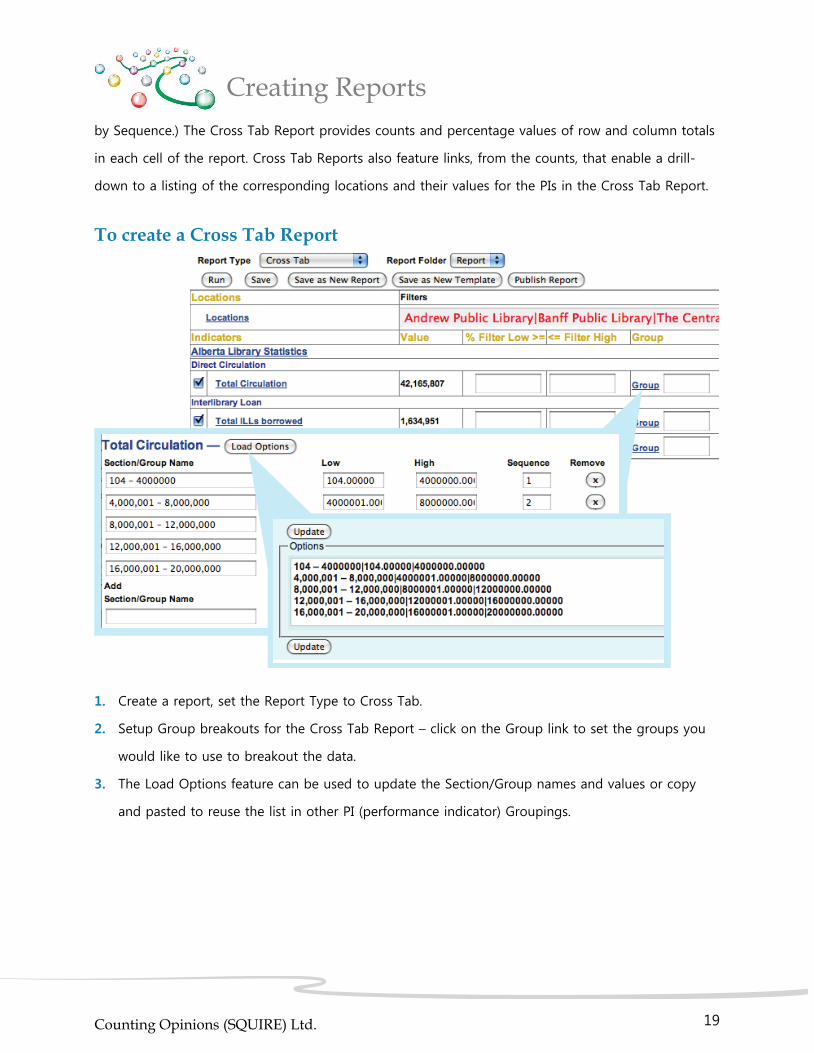
To create a Cross Tab Report
1. Create a report, set the Report Type to Cross Tab.
2. Setup Group breakouts for the Cross Tab Report – click on the Group link to set the groups you
would like to use to breakout the data.
3. The Load Options feature can be used to update the Section/Group names and values or copy
and pasted to reuse the list in other PI (performance indicator) Groupings.
Creating Reports
Counting Opinions (SQUIRE) Ltd. 20
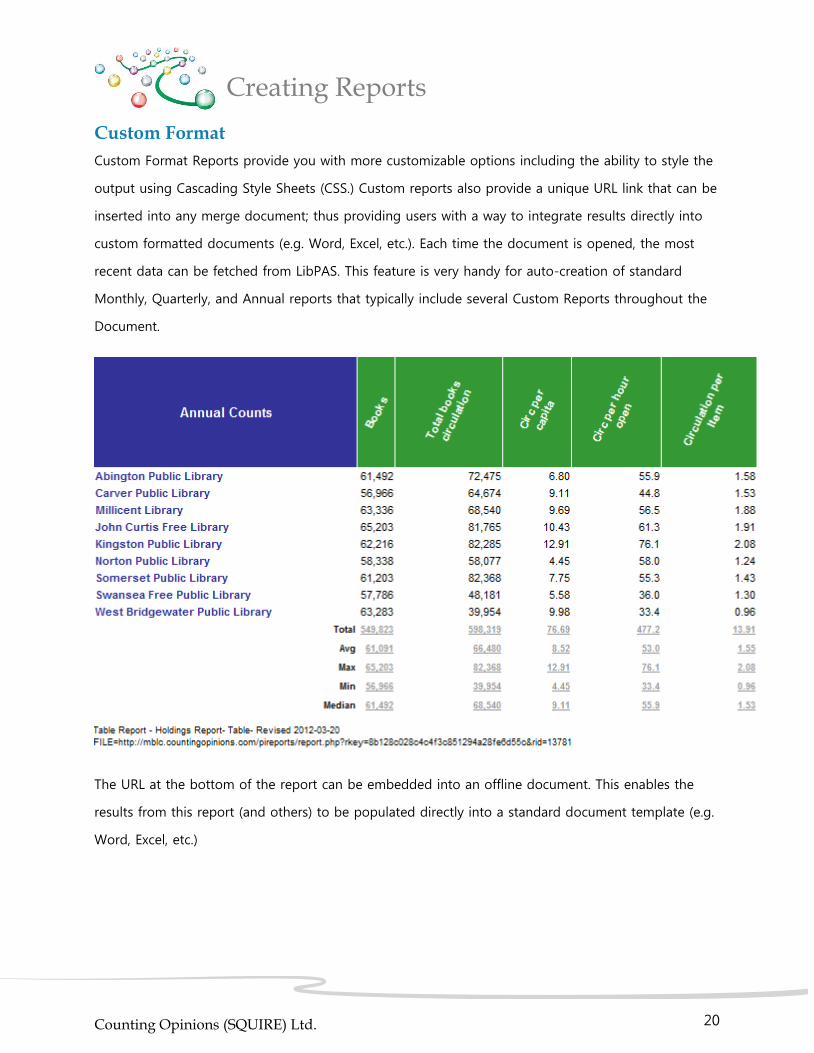
Custom Format
Custom Format Reports provide you with more customizable options including the ability to style the
output using Cascading Style Sheets (CSS.) Custom reports also provide a unique URL link that can be
inserted into any merge document; thus providing users with a way to integrate results directly into
custom formatted documents (e.g. Word, Excel, etc.). Each time the document is opened, the most
recent data can be fetched from LibPAS. This feature is very handy for auto-creation of standard
Monthly, Quarterly, and Annual reports that typically include several Custom Reports throughout the
Document.
The URL at the bottom of the report can be embedded into an offline document. This enables the
results from this report (and others) to be populated directly into a standard document template (e.g.
Word, Excel, etc.)
Creating Reports
Counting Opinions (SQUIRE) Ltd. 21
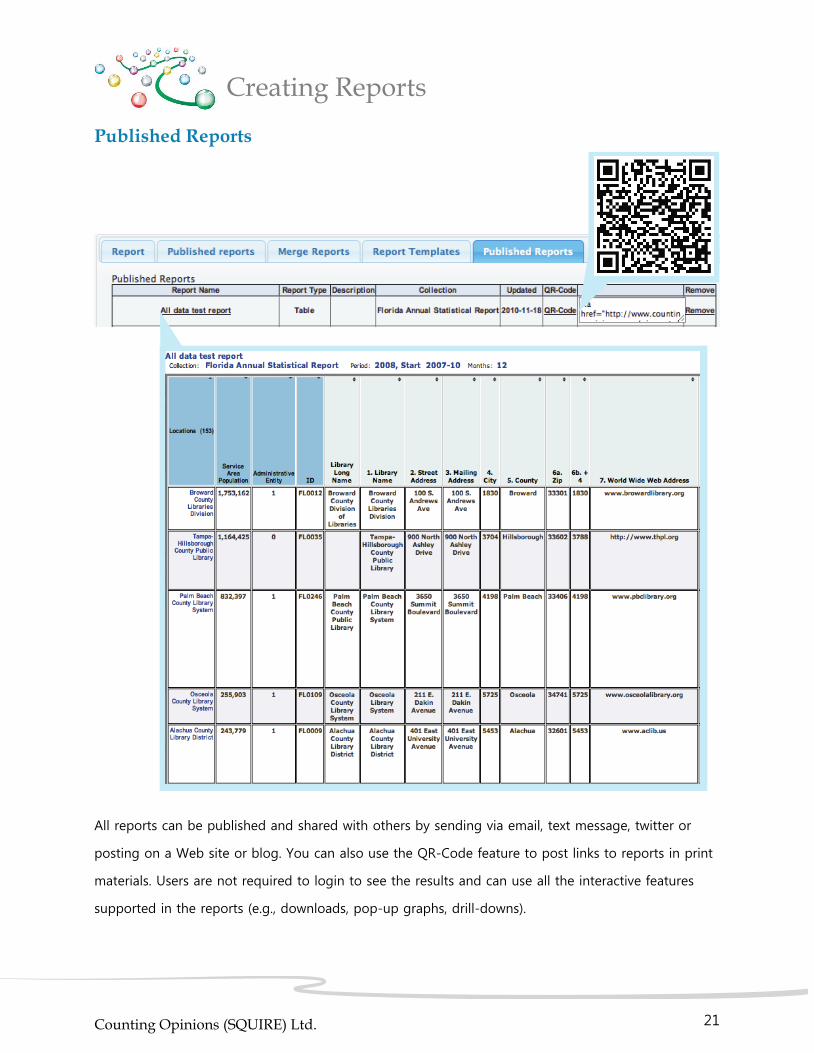
Published Reports
All reports can be published and shared with others by sending via email, text message, twitter or
posting on a Web site or blog. You can also use the QR-Code feature to post links to reports in print
materials. Users are not required to login to see the results and can use all the interactive features
supported in the reports (e.g., downloads, pop-up graphs, drill-downs).