Embed Size (px)
Citation preview

2011
www.pwc.com/pl
Reports on major Polish cities
Warsaw

The results presented are based on the assumption that the information obtained from sources other than PwC is complete and accurate in all respects. PwC assumes that the data and the responses are truthful and, therefore, the data received was not reviewed or otherwise verified.
This analysis is a certain interpretation of the data received and cannot be treated as a final recommendation, or advice on the choice of methods of operation or as a suggestion regarding the application of specific solutions. This document should not be treated as a substitute for consultation with professional advisers. Accordingly, PwC does not accept liability to any entity,which will use the information contained in this analysis without consulting a professional adviser.

Witold Orłowski
PwC’s Chief Economic Advisor
Despite many difficult years of transition in Poland, sound market-based economic,democratic and socio-political institutionshave been built, enabling civic activity to flourish. Cities have taken more and moreresponsibility for their own strategic decision-making, and for delivering ever greateraffluence and quality of life for their residents.The European Union’s “Leipzig Charter” setsout urban development principles, stating thatdevelopment should strive to be sustainable, to satisfy economic prosperity, social equilibrium, environmental, cultural and healthgoals, and to deliver effective democratic institutions. Poland’s membership of the European Union has meant that Polish citieshave had unprecedented access to developmentfunds to help them to reach these goals.
In the previous version of this report publishedin 2006, we principally tried to estimate where cities were at in terms of their access to \ development capital at the point wheretheir growth was just taking off. In accordancewith a methodology developed by PwC (formerly PricewaterhouseCoopers) we identified “seven capitals”, each of whichrelates to a crucial area of development, and then estimated each from number of selected indicators.
We have now repeated this process, with a number of key enhancements. We increasedthe number of cities analyzed from 7 to 11,added a number of indicators that were not available in 2006, and have also been ableto assess the rate of change evident between2006 and 2010 on the basis of the differencesbetween the two reports.
The level of development capital in Polish citiestoday is a legacy of past events in the region.Polish cities suffered many years of slow growth,followed by a transformation during which a great deal of painful economic restructuringwas necessary. It experienced rapid, sustainablegrowth between 2005 and 2008, only to find itself hit by the global financial crisis. The accompanying radical increase in fundsfrom the European Union budget for regionaldevelopment offered Polish cities the opportunity to markedly improve development capital in the seven key areas.However, the accumulation of developmentcapital is necessarily a long-term process, and it is often only after years that the payoffsfor residents, in terms of increased income,economic activity and quality of life, are evident.
Warsaw
After a number of difficult decades, Polish cities have now setthemselves on a path of rapid development that offers them the opportunity to catch up with other Western European cities and greatly enhance the quality of life of their residents. It is doubtful whether Polish cities have ever before had such a tremendous opportunity.
1Reports on major Polish cities Warsaw

2
Table of contents
Methodology 3
Study results 6General observations
Warsaw 9Key conclusions and recommendations
People 12
Quality of Life 16
Image 21
Institutions 25
Infrastructure 29
Finance 34
Investments 40

The seven types of capital of Polishcities
Over the past few years, Polish cities have substantially increased their capital. Howeverin many ways, they still find themselves laggingbehind the cities of western Europe that theyseek to compete with and be compared to.
There are likely to be large amounts of development funds available to Polish citiesin the coming years. The purpose of this reportis to evaluate the level of development capitalof Polish cities now. In doing so, it offers a perspective on the major strengths and weaknesses of Polish cities that will support the development of clear strategies and priorities to enable Polish cities to makethe best use of those funds to achieve theirgoal: to transform themselves into modern,flourishing vibrant population centres.
The measurement of the growth potential of Polish cities is based on a methodology developed by PwC (formerly PricewaterhouseCoopers). It is based on theprinciple that solid development requires a number of different resources, termed thecity’s “capitals”, to be present at the same time.
We mostly commonly think of the term “capital” in a financial sense. However, moderneconomics uses and understands the termmuch more extensively, as applying not only to money but also to resources like the qualifications, knowledge and experienceof a population (human capital), the numberand quality of their interactions (social capital),and even the value attributable to the way a city is perceived (image capital). These eachrepresent necessary resources for development,and only with skilful investment over years will they mature.
3Reports on major Polish cities Warsaw
Methodology
Every city must have a certain amount of development capital in order to develop. Over the past few years, Polish cities havemanaged to clearly increase this capital.
Capital
Finance
Investments
Image
Institutions
Infrastructure
Quality of l
ife
People

A city with high development potential is a citywith all 7 capitals well and evenly developed.If one of the capitals is less developed, this suggests weakness – and indicates a directionfor strategic remedial action.
All of the indicators are defined and calculatedin such a way that a higher value indicates that the capital is of a higher quality. It is always measured relative to the averagefor the 11 cities surveyed, which is 100.
The report’s authors have made every effort to source comparable data, and have used the most recent available data (generally from 2009-2010).
Apart from measuring the level of developmentof the 7 individual capitals in the 11 cities in 2010, the study also tries to measure the change in the capitals that took place between the last and present editions of the report, i.e. 2006-2010 (noting that the previousedition covered only seven Polish cities.)
Due to methodological differences, a directcomparison of the changes between 2006 and 2010 cannot be made; therefore, capitalchange is measured using a simplified methodology. As such this results in an estimate,and caution should be exercised in its use.
It should also be noted that, where growthrates are concerned, a lower starting point offers greater scope for growth than does a higher starting point. This should be factoredin when considering the estimates of growthprovided here.
4 Warsaw Reports on major Polish cities
Methodology
A city with high development potential is a city with all 7 capitalswell and evenly developed.
Seven development capitals
In analysing the development potential of Polish cities, we use the concept of 7 capitals, each of which is important for the city’s development:
• Human and Social Capital (HSC) definesthe quality of human resources at a city’sdisposal. This includes the knowledge and qualifications of its workers, the demographic structure (cities with an ageing population are less dynamic than‘young’ cities) and the social activity of theinhabitants.
• Culture and Image Capital (CIC) relates to how a city is perceived: as an interestingand attractive place, or a cultural desert, for example. The better the image, the easier it is to attract investors to the cityand boost the economic and social activityof its residents.
• Quality of Life Capital (QLC) reflects theliving and working conditions the city offers.It consists of such ingredients as the state of the natural environment, level of healthcare, quality of educational institutions and people’s sense of security
• Technical and Infrastructure Capital (TIC)relates to the infrastructure, as broadly defined, of a city: its housing stock, roads,transport systems, as well as shopping centres, ATMs and internet access.
• Institutional and Democratic Capital (IDC)reflects the efficiency of the municipal institutions (government and administration)and the level of civil society activity.
• Investment Attractiveness Capital (IAC)tells us how strong a magnet the city is forinvestors, both foreign and domestic.
• Sources of Finance Capital (SFC) specifiesthe extent to which the city is able to obtaincash to finance development.

5Reports on major Polish cities Warsaw
Warsaw: Population in thousands
1 714
How to read the radar charts in the report?
A radar chart allows us to analyse the city’scapital in several areas at the same time: themore indicators being considered, the greaterthe number of axes on which we place values.
When connected, the points on the axes form a shape (triangle, square, pentagon) where the number of vertices is equal to the number of axes. These diagrams depict a given city’scapital development (in red) against the averagefor the 11 major cities surveyed (in grey).
When analysing the chart, attentionshould be paid to:
• The size of the image area – the larger the area, the greater the capital.
• The shape of the figure – the more proportional it is, the more balanced is the development of the individual capitals.“Pulling” of the shape in any direction suggests that the capital in that area is moredeveloped than the average, while “recession”along any of the vertices indicates relativeunderdevelopment.
Data on the population from the end of 2009, GDP from 2008 (the latest available CSO data).Source: CSO, PwC
SzczecinPopulation: 406 k
GDP per capita: 129(Poland=100)
PoznańPopulation: 554 k
GDP per capita: 200(Poland=100)
WroclawPopulation: 632 k
GDP per capita: 154(Poland=100)
KatowicePopulation: 309 k
GDP per capita: 197(Poland=100)
Krakow Population: 755 k
GDP per capita: 155(Poland=100)
Tri-CityPopulation: 734 k
GDP per capita: 135 (Poland=100)
BiałystokPopulation: 295 k
GDP per capita: 102(Poland=100)
BydgoszczPopulation: 358 k
GDP per capita: 124(Poland=100)
WarsawPopulation: 1 714 kGDP per capita: 295
(Poland=100)
ŁódźPopulation: 742 k
GDP per capita: 124(Poland=100) Lublin
Population: 349 kGDP per capita: 111
(Poland=100)
General data on the cities included in the study

A good five years
The past five years (2006–2010) have provenvery positive for Polish cities. The country’s development accelerated after Poland’s accession to the European Union, partly due to the enormous opportunities created by unprecedented increases in regional development funds. Importantly, this has shownclear results in terms of increases in incomeand quality of life, improved infrastructure,and more efficient public institutions. The index of economic development* measuredfor the 11 Polish cities covered by the surveyshows a marked improvement in all the cities – its value has increased on average by 27%.
The fastest economic development over the period 2006-2010 was recorded by Wrocławand Warsaw, followed closely by Poznań,Krakow, Katowice and Łódź. A slightly slowerthan average rate of development was observed in Szczecin, the Tri-City area and Bydgoszcz. However, the main regionalmetropolitan centres of the “eastern wall”,Lublin and Białystok, developed somewhatmore slowly, despite additional special development resources being targeted at these regions from European Union funds.This suggests that serious structural problemscontinue to hamper market-driven economicgrowth efforts there.
6 Warsaw Reports on major Polish cities
Study resultsGeneral observations
Wrocław
Warsaw
Szczecin
Poznań
Łódź
Lublin
Krakow
Katowice
Tri-City
Bydgoszcz
Białystok
0 10 20 30 40
Average growth in 11 cites
Growth index of the economic development of Polish cities, 2006-2010
Source: PwC
* representing the weighted average of GDP growth per capita (real) from 2005–2007, growth in real incomes 2006–2010, and reduced unemployment.

Development capital increasedeverywhere
Polish cities took advantage of good development conditions in 2006-2010 to significantly increase their developmentcapital. We estimate this growth to be 16% on average, meaning that each type of capitalincreased, on average, by this amount in eachof the cities studied.
However, development has not been uniform.The greatest successes were achieved in theareas of Investment Attractiveness Capital and Culture and Image Capital, whereas the slowest progress was made in the areas of Technical and Infrastructure Capital and Quality of Life Capital. This is not surprising,as infrastructure is built up over many years while quality of life only increases as a consequence of sustained successes in other areas.
Of the cities studied, the fastest averagegrowth of the 7 capitals was recorded in Lublin, Białystok and the Tri-City area. To a large extent, this is the result of the largeamounts of development funding, mainly from the EU, that have been directed to Poland’seastern cities. However, this increase has not yet translated into accelerated economicgrowth among other “eastern wall” cities.
Capital grew at a rate that was slightly aboveaverage in Kraków and Katowice, and slightlybelow in Bydgoszcz, Łódź, Wrocław and Warsaw. However, the development capital of Poznań and Szczecin increased noticeably more slowly. It is worth re-stating,at this point, that a lower initial level offersgreater scope for growth than does a higherstarting point, and that this factor may be influencing these results.
7Reports on major Polish cities Warsaw
Study results Growth of 7 capitals
Wroclaw
Warsaw
Szczecin
Poznań
Łódź
Lublin
Krakow
Katowice
Tri-Cites
Bydgoszcz
Białystok
0 5 10 15 20
Average growth in 11 cites
Estimated growth of the average value of 7 capitals of Polish cities, 2006-2010
Source: PwC

Disparities are slowly declining
Generally speaking, over the period 2006-2010,the lower the starting level in a given city, the faster was its average increase in capital,leading to reduced inter-city disparities. This trend is so far relatively weak, but it shouldstrengthen with the adoption of appropriatestrategies for city development and the effectiveutilisation of development resources. However, we note that in the case of Szczecinand to a lesser extent Poznań, the estimated average capital growth was markedly slowerthan might have been expected.
Relationship between economic development and the capitals
A high level of development of all 7 capitals indicates favourable economic developmentconditions, and consequently better quality of life for a population. An analysis of the dataon the average level of the 7 capitals recordedin the 11 cities studied, paired with economicdevelopment index data for the period 2006-2010, does indeed suggest a close relationship between the 7 capitals and economic growth. In the case of Wrocław,the results on economic growth are slightlybetter than would be expected given its 7 capital resources.
8 Warsaw Reports on major Polish cities
Study results Comparison of capital growth
50 75 100 125 150
25%
20%
15%
10%
5%
ŁódźBydgoszcz
Poznań
LublinBiałystok Tri-City
Katowice
Szczecin
Wroclaw
Krakow
Warsaw
Estim
ated
gro
wth
in th
e av
erag
e va
lues
of 7
cap
itals
in 2
006-
10 in
per
cen
t
Average level of development of the city’s 7 capitals, 2010 (the average is 100)
The level and growth of 7 capitals of Polish cities
Level of 7 capitals and economic success of Polish cities
Source: PwC
Source: PwC
50 75 100 125 150
30%
25%
20%
10%
5%
Łódź
Bydgoszcz
Poznań
Lublin
BiałystokTri-City
Katowice
Szczecin
Wroclaw
Krakow
Warsaw
Incr
ease
in th
e ec
onom
ic g
row
th
inde
x 20
06-1
0 in
per
cen
tAverage level of development of the city’s7 capitals, 2010 (the average is 100)
15%
35%
40%
9
WarsawKey conclusions and recommendations
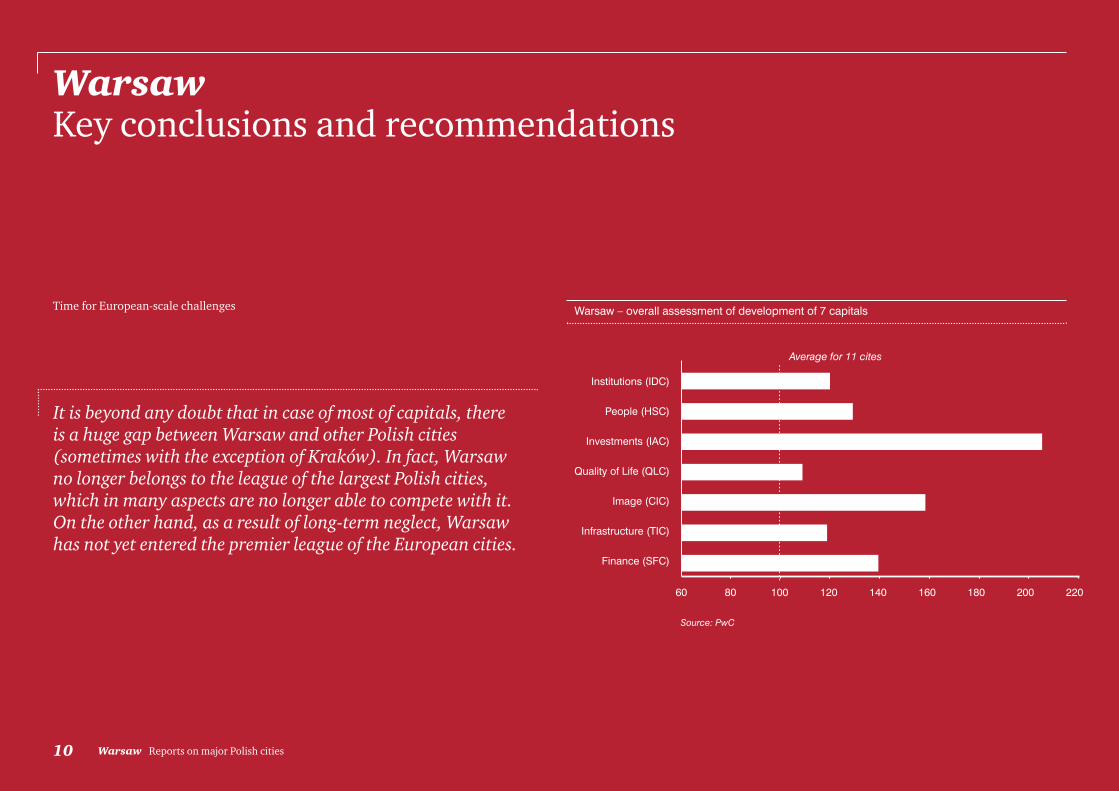
Time for European-scale challenges
10 Warsaw Reports on major Polish cities
Warsaw Key conclusions and recommendations
Institutions (IDC)
People (HSC)
Investments (IAC)
Quality of Life (QLC)
Image (CIC)
Infrastructure (TIC)
Finance (SFC)
60 80 100 120 140
Average for 11 cites
160 180 200 220
Warsaw – overall assessment of development of 7 capitals
It is beyond any doubt that in case of most of capitals, there is a huge gap between Warsaw and other Polish cities (sometimes with the exception of Kraków). In fact, Warsaw no longer belongs to the league of the largest Polish cities,which in many aspects are no longer able to compete with it.On the other hand, as a result of long-term neglect, Warsawhas not yet entered the premier league of the European cities.
Source: PwC

For Warsaw, the role of the leading Polish cityis not enough. Today, Warsaw's fast developmentdepends primarily on whether it is able to assume the role of a regional economic centre which is able to successfully competewith Budapest or Prague. This requires furthersubstantial increase of capital expenditures for investments and considerable improvementof condition of infrastructure, human capitaland quality of life - including in particular the improvement of condition of environment,daily life culture, and quality of educationalservices and healthcare.
This task may be made easier through utilization of tremendous chances created by public-private financing, as well as increaseof efficiency of municipal institutions. In orderto succeed, the city needs actions (startingwith development of the city centre area), so that the rate of changes corresponds to the city's ambitions. This is particularly truedue to the fact that the competitors in Europe and in Poland are not sleeping.
11Reports on major Polish cities Warsaw
Warsaw Key conclusions and recommendations
City’s biggest strengths:
• Excellent image and high investment attractiveness
• High human capital
• High cultural, educational and social potential
• High sense of security
Major challenges:
• Limited funds for financing development, small degree of usage of public-private partnerships (PPP) in financing the projects
• Need to improve functioning of municipal institutions
• Improvement of quality of life, especially with regard to transportation and natural environment

Why do we measure Human and Social Capital?
People are the most important and the mostvaluable resource determining a city’s chancesfor development. In the modern world, it ispossible to buy almost anything. You can rentan advertising agency to promote a city, findinvestors to provide funds for infrastructuredevelopment, and build efficient administrationand online systems for providing services to inhabitants. But there is no substitute for people’s skills, their willingness to work,and the business and social activity they engage in. In the longer term, it is the people – the Human and Social Capital, being a set of characteristics describing the human resources – that determine a city’s economicdevelopment and its success. Human Capital is typically associated with intellectual resources while Social Capital describes thequality of the civil society. It is easy to imaginethat the level of Human Capital – people’s intellectual capabilities and skills – translatedirectly into economic development.
However the reality is a little more complicated.Human Capital influences the community’seconomic development and improves its quality of life in less obvious ways, such as reducing corruption, fostering long-term investment and disseminating knowledge, preventing abuse of common goods, speedingthe investment process (by reducing the probability that administrative decisions willbe appealed). In addition, through developmentof the third sector, it is conducive to greater social control over actions taken by authorities.(Source: Social Diagnosis 2009.)
The value of Human and Social Capital dependson many factors. Some of them can be influenced only to a relatively small degree(e.g. demographic structure). It is also not possible to force people to conduct business or social activity – although attempts may bemade to encourage them to do so and facilitateany initiatives to that effect. However, in certain areas e.g. in education or on the labourmarket, the potential for action on the part of municipal authorities is quite high.
Measuring Human and Social Capital (HSC)
The Human and Social Capital score constitutesan aggregate measurement of the value of a city's human resources, taking into account the following five characteristics: demographics, education, and citizen’s attitudes towards the free market, labour market activity and civil society engagement.
HSC: demographics
The demographic make-up of a city is one of the most important determinants of itsHuman and Social Capital and is, in the firstinstance, defined by its age structure and the number of very young children. The basic demographic criteria used to measure HSC include the demographic burden ratio, the share of elderly in the city’spopulation, and the number of births per 1000 inhabitants.
12 Warsaw Reports on major Polish cities
People
People are the most important and the most valuable resource determining a city’s chances for development. There is no substitute for people’s skills, their willingness to work, and the business and social activity they engage in.
In Warsaw, the demographic burdenratio (0.55) is one of the highest in the analysed cities. In similar fashion, the share of persons in post-employment age is one of thehighest (20.8% - only Łódź has higherrate). On the other hand, the childbirthrate is relatively high and it is close to the maximum level recorded in the 11 cities (10.8 children per 1000 inhabitants).
With the average level of HSC of 100 in terms of demographics for the 11 compared cities, the valueof HSC in Warsaw to that effect is at the level of 98.4.

HSC: education
In a modern economy, the quality of the humanresources of a population is determined largely by its skills. Measuring this thereforeinvolves measuring the average education of the inhabitants: the better their education, the higher the city’s attractiveness in terms of investing and conducting business activity.
With the importance of the information societyand the knowledge-based economy, it is impossible to ignore such aspects of educationas knowledge of information and communicationtechnologies, knowledge of foreign languages,and access to education and training in theseareas when discussing Human Capital attainment. However, in order to avoid the repetition of similar indicators for the individual Capitals, these aspects have been taken into consideration in the Investment Attractiveness Capital and Technical and Infrastructural Capital.
Here, HSC is measured in terms of share of persons with university and high school educations, the number of high school and university students per 1000 inhabitants,and newspaper readership (the percentage of people who regularly read one of the threemain national dailies). These last two were introduced in this year’s survey, which reduces the direct comparability of HSC with earlier reports.
13Reports on major Polish cities Warsaw
People
Warsaw’s situation in terms of education of the generalpublic is the best among the analysed cities. The share of people with university education is 25.3% and it is the highest among the cities studied.Same holds true for the share of people with highschool education. It is true that the ratio of the numberof students to the number of inhabitants is lower than average, but the share of young people attendinghigh schools is the highest among the analysed cities(97.8%). Also, the newspaper readership ratio is the highest in Poland.
With the average level of 100 for the 11 cities, the value of HSC for Warsaw in terms of educationis at the level of 126.8 and it is the highest amongthe analysed cities.
In a modern economy, the quality of the human resources of a population is determined largely by its skills.

The situation to that effect in Warsaw is the best amongst the analysed cities – the share of persons conducting businessactivity is 19.2%.
With the average level of 100 for the 11 cities, the value of HSC in Warsawin terms of pro-market attitudes is at thelevel of 136.4, which is the highestamong the analysed cities.
The unemployment rate in Warsaw, like inPoznań, is the lowest among the analysedcities (2.4%). Also the unemployment rateamong young people is on the lowest levelamongst the analysed metropolitan areasand amounts to 9%.
Overall assessment of HSC with regardto labour market is favourable for Warsaw. With the average level of 100for the 11 cities, the value of HSC in Warsaw is at the level of 157.7.
HSC: attitudes towards the free marketeconomy
Development is also affected by the attitude of citizens towards the market. In locationswhere people are more pro-market, they adaptmore easily to the demands of the market and are more economically active and successful.
HSC in this area is measured by the proportionof persons engaged in business activity.
HSC: labour market
The labour market conditions, from a HumanCapital perspective, principally relates to theavailability of employees with skills sought byemployers. In a city with high Human Capital,there should be low unemployment.
As such, the HSC indicator regarding the labourmarket is measured by the unemployment rate,both overall and that specifically for youth.
HSC: civil society engagement
A high level of engagement in civil society indicates high Social Capital – people are involved in common interest activities .
HSC with regard to civil society engagement is measured by access to Internet resourcesand average voter turnout (parliamentary elections in 2007, presidential and local government elections in 2010).
14 Warsaw Reports on major Polish cities
The engagement of the civil society in Warsaw is the highest among theanalysed cities. The average voter turnoutduring the elections was 70% (while the average value for all cities was 56%). On the other hand, as regards the activismof non-governmental organizations, Warsaw ranks second after Katowice.
With the average level of 100 for the 11cities, the value of HSC in Warsaw to thateffect is at the level of 123.4.
People

Warsaw’s Human and Social Capital
Warsaw has the most developed and the mostversatile Human and Social Capital in Poland.Despite the fact that the demographic situationis not great (which, however, is offset by constant inflow of people from other areasof Poland), the city's inhabitants are well educated, they display pro-market attitudesand they are active.
15Reports on major Polish cities Warsaw
0
20
40
60
80
100
120
140
160
Demographics
Market orientationLabour market
Social activity
Qualifications
min. in 11 citiescitymax. in 11 cities
People – Warsaw
With the average level of 100 for the 11 cities, the value of Warsaw's total Human and Social Capital is at the level of 128.5. It is the highest figure amongst analysed cities.
PeopleSummary

Why do we measure Quality of Life Capital?
If a city wants to succeed economically in the long term, it must provide good livingconditions for its inhabitants. A high quality of life in a city will cause people to decide to liveand work there, including those who will rejectoffers to move to different domestic or foreigncities, and investors will be more inclined to relocate business activities. A high quality of life also leads to pride and satisfaction withone’s own city, while a low quality of life yieldsdisillusionment and frustration.
The quality of life in the city is made up ofmany factors. The condition of the natural environment is one important aspect, as areaccess to good quality medical and educationalservices. A sense of security is of tremendousimportance. The best entertainment centresand services cannot guarantee that inhabitantsand guests will feel comfortable in the city if a sense of security is lacking.
Measuring Quality of Life Capital(QLC)
Quality of Life Capital largely determines theextent to which the city is considered a goodplace to live and work. It is the most debatablecapital (besides Culture and Image Capital). It is also the most difficult to present as a singleratio. In the Polish market there are several indicators that pertain to various aspects of thefunction of a metropolitan area. These include for example the number of cultural events orhotels of a given standard.
In our reports, these are covered in the Cultureand Image Capital or the Investment Attractiveness Capital.
However, considering the importance of healthcare and sense of security to the overall quality of life, we decided to stay with the definition that was adopted four yearsago, which is also consistent with PwC’s global methodology. This also allows direct comparability with the previous edition of these reports.
16 Warsaw Reports on major Polish cities
Hence, when measuring QLC, we take into account four aspects of quality of life: the condition of the natural environment, level of medical services, level of educational services and sense of security.
Quality of Life

QLC: condition of natural environment
Cities with a good natural environment givetheir inhabitants a much greater sense of comfort and satisfaction with life. It should be remembered that in the field of environmental protection – as in many otherfields – commonplace opinions are difficult to overcome, and spectacular failures or successes (such as appearance of fish or bird species which have not been seen for many years) very frequently have greaterimpact than technical measurements of environmental pollution.
The selected indicators that we use to measureQLC in terms of the condition of the naturalenvironment include air pollution measurements(emission indices for various types of gaseousand dust pollutants), number of cars per km2
in the city limits, capital expenditures on environmental protection and percentageof treated sewage.
17Reports on major Polish cities Warsaw
Quality of Life
From the standpoint of condition of natural environment, Warsaw has plenty of roomfor changes in comparison with other analysed cities. As regards air pollution, Warsaw’sposition in the ranking is one of the lowest. It is true that in Kraków and Katowice the emissions of dusts and gases per km2 are almost twice as large. However, it is Warsaw – which does not have any large industrial installations – that is ranked thirdfrom the bottom in this respect. This is attributable to the highest car traffic densityratio, which is significantly different from values in other analysed cities and whichamounts to 2126 cars/km2. For comparison, the average value for other cities is 1199 cars/km2.
Warsaw treats only approx. 77% of sewage (which ranks it ahead of only Katowice and Szczecin). However, it should be noted that the water and sewage company, which is owned by the city, has been effectively carrying out an extensive investmentprogram with the aim of changing this state of affairs – eventually, in 2012, 100% of sewage from the city will be treated. Despite this fact, Warsaw's capital expenditures for environmental protection are the lowest per one inhabitant. This, however, is alsopartially attributable to the number of the city's inhabitants.
With the average level of QLC in terms of the condition of the natural environmentof 100 for the 11 cities, QLC in Warsaw is at the level of 55.5. This value is the lowestamong the analysed cities, which constitutes a considerable challenge for the city’sauthorities as well as inhabitants.
Cities with a good natural environment give their inhabitants a much greater sense of comfort and satisfaction with life.

QLC: healthcare quality
The availability of medical services of adequatequality is one of the factors that exerts considerable influence on the assessment of living conditions in the city. While certain problems in this area are common to all Polish cities, individual cities also farevery differently.
The basic ratios selected for measurement of QLC in the area of medical services includethe number of physicians per 1000 inhabitants,infant mortality rates, and the ranking of healthcare centres (by the Centre for Monitoring Quality in Healthcare and “Rzeczpospolita”), as well as the averagewaiting time for an appointment with a givenspecialist physician. The last two ratios werenot available when the previous edition of this survey was carried out.
18 Warsaw Reports on major Polish cities
Quality of Life
The assessment of availability of adequate qualitymedical services in Warsaw may be difficult. On the one hand, the number of physicians per oneinhabitant is relatively high and the infant mortalityrate is relatively low (4.9 per 1000 live births as compared to the average value of 6). On the otherhand, the scores recorded by Warsaw's hospitals in the hospital rankings are below average. Also, thewaiting time for an appointment with the specialistphysician is one of the longest among the analysedcities. Such a situation takes place despite large number of physicians per one inhabitant and the factthat the city is the capital city (there are many medicalfacilities and the city is an important academic centrefor medical sciences).
For the foregoing reasons, the value of QLC for Warsaw in terms of healthcare is not the best – with the average level of 100 for the 11 cities, the value of QLC in Warsaw in terms of healthcare is at the level of 91.2.

QLC: education quality
The quality of educational services is usuallyone of the first issues considered when assessingthe overall quality of life in a city. Good schoolsand highly ranked universities attract new inhabitants and are important when makingthe decision to move, either temporarily or permanently (which results in greater availability of highly skilled employees).
Good education also facilitates the city’s socialand economic progress due to the fact that it positively influences its developmentprospects. Active innovation and educationpolicy is one of the main priorities for sustainable development specified by theEU document referred to as the Leipzig Charter.According to this document, cities are centresfor the creation and transfer of knowledge, andthe sustainable development of metropolitanareas should take into account the need to continuously increase the level of education.The indicators used for measuring QLC includescores recorded by the city’s most importantuniversities in the university rankings (in “Perspektywy” magazine), the success rate
of high school-leavers in 2009, and resultsrecorded on 6th grade exams and junior highschool-leaving exams in 2008. This indicator is new in this edition of the survey.
QLC: sense of security
Sense of security encompasses many dimensions: physical security of the inhabitants(the crime rate and road traffic safety), protection from natural disasters and accidents,and a sense of security in terms of access to healthcare and job opportunities are allequally important.
While measuring QLC for sense of security we limited ourselves to the area of physical security and used the following indicators:number of recorded crimes and number of traffic accidents per inhabitant.
19Reports on major Polish cities Warsaw
Quality of Life
In the rankings of universities, Warsawclearly occupies the top spot. In total, the city's universities earned the largestnumber of points in the rankings (thisnumber is by approx. 70% higher than for Kraków, which ranks second in this category). The passing rate of the highschool-leaving exams is one of the highestin the country (after Wrocław, Lublin and Kraków) (85.5%). The results of juniorhigh school-leaving exams are the highest.The passing rate of the elementary school-leaving exams is second-best after Kraków.
With the average level of 100 for the 11cities, the value of QLC in Warsaw withregard to quality of education is at thelevel of 162.3 and it is the highest figureamong the analysed cities.
In terms of sense of security, Warsaw is the leader among the analysed cities.The number of crimes per one inhabitantis low as compared to the average level,and the number of traffic collisions andaccidents is moderate as compared to traffic intensity.
With the average level of 100 for the 11 cities, the value of QLC in Warsawin terms of security is at the level of
125.2.

Warsaw’s Quality of Life Capital
With respect to Quality of Life Capital, the biggest challenges for Warsaw include environmental protection and healthcare.Without considerable improvement in theseareas it will be difficult to compare the qualityof life in the capital city with large Europeanmetropolitan areas. Insofar as clear and seriousinvestment activities are undertaken with respect to environmental protection, the situation in the area of healthcare is much morecomplicated because the city does not have influence over the key decisions affecting thisarea. Although in the remaining areas Warsawis the clear leader among the Polish cities, the gap between Warsaw and Western European cities is still large.
20 Warsaw Reports on major Polish cities
Quality of LifeSummary
0
20
60
80
100
120
140
160
180
min. in 11 citiescitymax. in 11 cities
40
Environment
Health ServicesSecurity
Education
Quality of Life – Warszawa
With the average level of 100 for the 11 cities, the value of Quality of Life Capital in Warsaw is at the level of 108.5.

21Reports on major Polish cities Warsaw
Image
Why do we measure Culture and Image Capital?
In the modern world and in the modern economy, decisions to purchase goods and services are made not only on the basis of actual values, but also on the basis of ouropinions about a product. A product’s brand is an important aspect of this: its prestige, qualityand the trust we have in it. A similar principleholds true for cities. In addition to the thingsthat a city offers its inhabitants and companies,our opinion of it, i.e. its image, is very important.A city that enjoys the image of a robust, friendlyand interesting place with a good standard of living will attract both tourists and investors.
The image of the city depends on many factors.Since the previous edition of “Reports on majorPolish cities”, we have seen tremendously positive changes in Culture and Image Capitalat the strategic and qualitative level. In most of the cities, image is no longer shaped by accident but is, to much greater extent, the result of more or less consistently executedpromotional strategies. Positive results for citiesthat started regular promotional activities
early can be clearly seen throughout Polandand Europe. For the others, changing the image among inhabitants, investors andtourists will necessarily involve long-term efforts. In this report we decided to avoid a detailed analysis of the quality, effectivenessand consistency of activities conducted by individual cities in the image-building area, assuch processes are to great extent evaluatedsubjectively. For the purposes of this publication,we limit ourselves to indicators which are objective and measurable.
As this report is being prepared, some of thecities being analyzed are facing tremendousopportunities to shape their image in Europe.
Firstly, Poland will have the presidency of theEuropean Union in the second half of 2011,and subsequently host Euro 2012. In addition,these reports were being compiled, it becomeknown that five Polish cities have qualified to compete further for the title of EuropeanCapital of Culture. For Gdańsk, Katowice,Lublin, Warsaw and Wrocław this means very intensive activities in the area of Cultureand Image Capital.
However, we see participation in the qualifyinground itself as important – it has the potentialto start a debate on the how the candidate citiesshould promote their cultural attributes and may result in several new initiatives and a comprehensive approach to developmentin this area.
As part of city strategies for development andpromotion, Polish cities have been increasinglyconsidering the sustainability of their development strategies. This is of key importance to the cities’ development, theirimage, and the quality of life they will be ableto offer in the longer term. Polish cities are increasingly beginning to consider sustainabledevelopment issues in a comprehensive andlong term manner; this applies to both largercities and smaller townships. The tasks relatedto implementation of principles and strategiesfor sustainable development are also increasingly frequently reflected in lists of dutiesand tasks for the individual departments of local government bodies.
In sustainability terms, Polish cities are also active internationally: 10 cities signed themayors’ agreement declaring limits on CO2emissions, and 12 cities (all those covered by this analysis plus Rzeszów) belong to theEuroCity network which includes the largestEuropean cities and focuses on challenges facing the European Union, including climatechange and social exclusion.

Measurement of Culture and ImageCapital (CIC)
Culture and Image Capital is a measure of howthe city is perceived – by its inhabitants as wellas outsiders. Like many of the capitals, it cangive rise to lively debates and strong emotions,and the range of potential indicators that canbe used to attain it is very broad.
What is important is the fact that even a broadselection of available indicators does not always mean a the value obtained is precise,making the analysis extra difficult. We preservethe methodology adopted four years ago and, in measuring CIC, take into account threecharacteristics: general opinions of the city,high culture, and the culture of daily life.
CIC: general image of the city
General image consists of the city’s overallrecognisability, its generally recognized attractiveness, as well as the perception of its values by its inhabitants (e.g. traditionsof honesty and hard work).
The basic indicators we have used to measureCIC as regards general image are: the numberof “good associations” with the city on the Internet (e.g. number of websites with thecity’s name and the word “culture” in them),number of tourists visiting the city, the numberof words a city warrants in a typical touristguide to Poland and tourist opinions expressedon online travel sites, and the observed rate of entrepreneurship (a new indicator for this edition of the survey).
22 Warsaw Reports on major Polish cities
Image
Culture and Image Capital is a measure of how the city is perceived – by its inhabitants as well as outsiders.
In terms of overall image, Warsaw is the leader among the analysedcities. This is demonstrated by thelargest – after Kraków – number of tourists per one inhabitant. The cityis very well positioned on the Internetand foreign tourist guides dedicaterelatively plenty of space to Warsaw.The city’s overall image is also positively influenced by the numberof persons conducting business activity per one inhabitant.
With the average level of CIC of 100in terms of overall image for the 11cities, the value of CIC in Warsaw is at the level of 207.9, which ranksWarsaw second after Kraków.

CIC: high culture
A city’s image largely consists of its activity in the area of so-called high culture. Althougha relatively small percentage of inhabitantsand guests use such services, these are significant cultural events that are morelikely to be publicized in the opinion-makingmedia and shape the city’s image as an interesting, attractive and appealing place.
The basic indicators selected for measuringCIC with regard to high culture include thecity's culture budget, the number of concerts,film festivals, theatre festivals and classicalmusic festivals, as well as concert attendances(all per number of inhabitants).
CIC: daily cultural life
A city’s inhabitants and guests form an impression of a city on the basis of the dailycultural life: the selection of restaurants, hotels, number of cinemas, number and qualityof parks, and number of popular mass events.
The indicators used to measure this aspect of CIC include: the number of cinema seats,number of restaurants, number of sport stadiumseats (including those under construction, including planned Euro 2012 facilities) andthe green areas within the city's administrativeboundaries (all per number of inhabitants).
23Reports on major Polish cities Warsaw
Image
In terms of high culture, Warsaw is theundisputed leader among the analysedcities. On the one hand, this is related to the fact that Warsaw is the capital city.However, on the other hand, this resultsfrom the conscious activities undertakenby Warsaw's authorities.
The city earmarks the highest – among the analysed metropolitan areas – amountsfrom the budget for culture and it has thehighest number of theatre and classicalmusic festivals and the largest concertsper one inhabitant.
With the average level of 100 for the 11cities, the value of CIC in Warsaw in termsof high culture is at the level of
182.5.
Increasing the city's capital in the area of daily life culture remains a challengefor Warsaw. As compared to other cities,Warsaw ranks lower in the aspects such as number of cinema seats, restaurants,green areas and stadium seats per one inhabitant. It should be noted that in thisregard, Warsaw ranks in the bottom halfof the analysed cities.
With the average level of 100 for the 11 cities, the value of CIC in Warsaw in terms of daily life culture is at thelevel of 86.8 - which is quite low result as for the capital city.

Warsaw’s Culture and Image Capital
On the one hand, Warsaw is well recognized in the world and it occupies a significant spoton the European cultural map. On the otherhand, the city has relatively low ratio describingthe level of daily life culture. This means that although the city's Culture and ImageCapital is well developed, it is possible that its inhabitants do not see the clear benefits which they could obtain from this.
Investments in improvement of quality of municipal space and transportation infrastructure will certainly cause that it will beeasier to fall in love with Warsaw. This is evenmore true due to the fact that the city is slowlyfinding the compromise between its difficultpast and its aspirations to become a moderncity. A good example is the revitalization of part of Praga district, which has become a climatic place for many inhabitants, as wellas skilful utilization of historic heritage in theWarsaw Rising Museum.
24 Warsaw Reports on major Polish cities
50
150
250
0 min. in 11 citiescitymax. in 11 cites
100
200
General image
Everyday culture High culture
Image – Warsaw
With the average value of 100 for the 11 cities, the value of Warsaw’s Culture and Image Capital is 159.1, which gives the city the second place right after Kraków.
ImageSummary

Why do we measure Institutionaland Democratic Capital?
Institutional and Democratic capital determinesthe degree to which institutions which managethe city function effectively, e.g. city authorities,public administration and maintenance services.It also reflects the level of civic activity of inhabitants and effectiveness of democraticmechanisms, as well as the level and effectiveness of communication between the authorities and the society.
In cities with high Institutional and DemocraticCapital, it is easier to develop and exercise a consistent development strategy. Authoritieswhich are controlled democratically can perform their duties more effectively and havea stronger social mandate for managing the city, while the activities of the citizens supports them on the road to achieving common goals. This facilitates the achievementof success in terms of economic and social development.
Measuring Institutional and Democratic Capital (IDC)
The Institutional and Democratic Capital of a city is made up of the quality of the authorities’ actions, the activities of the inhabitants, and communication between the authorities and the people.
25Reports on major Polish cities Warsaw
IDC is measured in three areas: the effectiveness of municipal institutions (authorities and public administration), their performance of the basic function of ensuring public safety, and non-governmental organization activity.
Institutions

DC: administrative effectiveness
Opinions regarding the city’s authorities andadministration are based on the experiences of inhabitants and visitors. These judgmentsare influenced by the way the authorities communicate with the society: whether citizensare included in strategy development, and whether explanations of the problems and goals of various activities is provided. A constructive dialog with inhabitants contributes to both a streamlined process of strategy development as well enhanced performance, since a document developed in a such a manner will better take into consideration the problems facing inhabitantsand offer solutions.
The primary indicators used to measure IDC in terms of the effectiveness of municipal institutions are: administration expenses(compared to the population), indicators of the effectiveness and availability of offices indicated by waiting times for entry in the economic activity register, office opening hours that reflect citizens’ needs, and opportunities to use online office services(new in this edition), and the percentage of votes received by the incumbent president in the local government elections of 2010 (also new in this edition).
26 Warsaw Reports on major Polish cities
Institutions
With high expenses on administration per capita, Warsaw is in the middle and bottom rows of the list with respect to the waiting time for the entry in theeconomic activity register, office openinghours or the offered possibility of usingweb-based office services. The situationlooks differently depending on the district,but high percentage of votes given to the incumbent president in the localgovernment elections of 2010 suggeststhat the people accept effectiveness of municipal institutions.
With the average level of 100 for the 11 cities, Warsaw’s IDC in terms of effectiveness of administration is estimated at 102.0.

IDC: public safety expenditure
Assessment of municipal institutions is largelybased on their actions in the crucial area of safety: expenditure on law and order services, and the extent to which people trustthese services. It is worth noting that citizens’assessments of authorities’ efforts in this areacan be separate from their actual perception of security (taken into consideration in theQuality of Life Capital) – in other words, there are cities with a high crime-rate despite the considerable efforts of the authorities, as well as cities where both expenditure on safety and crime-rates are low.
In measuring IDC in terms of public safety, the following indicators were used: the city’sexpenditure on safety, the number of policeand city guards (all per 1,000 inhabitants) and the crime detection rate.
IDC: non-government organization activity
A high level of non-government organizationactivity contributes to the better operation of democratic mechanisms, increased scrutinyof authorities’ actions on the part of citizens,fostering of partnerships between the city’s inhabitants and its authorities, as well as theincreased involvement of citizens in workingout and implementing a city’s developmentstrategy.
IDC in terms of non-government organizationactivity is measured by analysing Internetsources to ascertain the number and level of activity of non-government organizationsregistered in the city.
27Reports on major Polish cities Warsaw
Institutions
Warsaw is distinguished by the highestlevel of expenses on public safety percapita, which translates into the highestnumber of police officers and guards percapita. The crime detection rate, however,is the lowest behind Kraków and Lublin.
With the average level of 100 for the 11cities, IDC in terms of expenses on safetyfor Warsaw is at the level of 131.9, which is the highest score among theanalysed cities.
Activity of non-governmental organizationsin Warsaw is at the highest level amongthe analysed cities – there are 6.6 organizations registered per 1,000 inhabitants, while the average in the remaining largest Polish cities is almost 5.The activity of Warsaw organizations as observed on the web is also at a higherlevel than in the other cities.
With the average level of 100 for the 11cities, Warsaw’s score with regard to activity of non-governmental organizations is at the level of 127.4.This is the highest level among theanalysed cities.

Warsaw’s Institutional and Democratic Capital
Warsaw’s Institutional and Democratic Capitalis the highest among the analysed cities but stillneeds to be developed. A challenge that remainsto be met is to improve further effectiveness of municipal institutions, especially in terms of actions directed toward the citizens.
With regard to expenses on safety, Warsaw is the leader among the analysed cities. A certaindiscrepancy should be, however, noticed, in the form of a low crime detection rate.
The city is also a leader, behind Katowice, in the area of activity of non-governmental organizations.
28 Warsaw Reports on major Polish cities
140
120
40
20
0min. in 11 citiescitymax. in 11 cities
100
80
60
Efficiency of the administration
Security NGO activity
Institutions – Warsaw
With the average level of 100 for the 11 cities, Warsaw’s Institutional and Democratic Capital is 120.4.
InstitutionsSummary

Why do we measure Technical and Infrastructural Capital?
Effective infrastructure – including efficienttransport, housing resources, services infrastructure, media and utilities (both moretraditional such as power and water, and modern such as telecommunication and the Internet) is a prerequisite for creatingan efficiently functioning metropolis wherepeople can live and do business. The advantagesthat flow from well-developed Technical and Infrastructural Capital directly influencethe other Capitals, in particular Quality of Life,Human and Social, and Investment Attractiveness. Without sufficient, or sufficientlydeveloped, Technical and Infrastructural Capital, progress in the other areas will be considerably slower than in cities with well developed infrastructure, and people’s qualityof life deteriorates, the city’s image worsens,and its attractiveness as a place for locating investments diminishes.
For these reasons, we regard Technical and Infrastructural Capital as warranting special attention.
It is important to remember that to have effective infrastructure in place requires notonly the presence of concrete resources such as transport systems, buildings, equipment andinstallations, but also a level of organizationalefficiency in management and administrationthat allows these to be fully utilized. The actual Technical and Infrastructural Capitallevel often depends also on the efficient operation of the markets for services, mediaand utilities and housing. Renting or buyingappropriate housing is as difficult as in a citywith no housing resources available as it is in a city with extensive housing resources but an inefficient market .
Measuring Technical and Infrastructural Capital (TIC)
The city’s Technical and Infrastructural Capitalhas a strong impact on the city’s attractivenessas a place to live and do business. The TIC assessment is usually based on the experiencesand observations of the city’s inhabitants and visitors. Negative opinions that gain traction can destroy a city’s image, even it doeswell in other areas.
29Reports on major Polish cities Warsaw
In our opinion, there are four kinds of infrastructure crucial for successful development: transport infrastructure, energy and IT infrastructure, housing infrastructure, and trade and services infrastructure.
Infrastructure

TIC: transport
A general assessment of the efficiency of thetransport network in the city needs several factors to be taken into consideration: road infrastructure, alternative forms of transport,the quality of public transport and the qualityof the city’s connections to the outside world.
The indicators used to measure TIC for transport are: density of the road network,number of bicycle lanes, number of publictransport seats in relation to the population, as well as the number and quality of the city’sconnections to the outside world: the numberof direct flights (airports within a 100 km radius), time taken (by train) to reach the fivelargest Polish cities (a new indicator in thisedition of the survey), access to the Europeanmotorway network (a new indicator in thisedition of the survey). In combination, theseindicators give us a general idea of the qualityand development of the city’s transport infrastructure.
30 Warsaw Reports on major Polish cities
Infrastructure
In the area of road infrastructure (the number of roads per km2), Warsaw is at a levelclose to the average, but in the upper half of the list of the analysed cities. Two citiesare clearly better in this respect – Łódź and Katowice.
Warsaw is distinguished, after Wrocław and Katowice, by the highest density of bicyclelanes and the greatest number of seats in public transport per capita among theanalysed cities. It should be underlined that these features of the city’s infrastructureare systematically strengthened by investment programs performed by the city and companies belonging to it (construction of the second line of the underground, a new tramway line, a system of metropolitan railway) and complemented by an increase in the quality of urban transport (replacement of tramway cars, the metropolitan railway, gradual replacement of buses).
Due to the international airport located in the city, Warsaw has the greatest number of direct flights. The journey time to the other largest cities in Poland is also the shortest.Warsaw’s position against the other large cities – those located in the west and in the south-west and north-west of Poland – is weakened by the issue of access to the European network of highways. The situation should change after a section of the A2 highway connecting Warsaw with the German border is opened to traffic.
With the average level of 100 for the 11 cities, the total TIC in terms of transport for Warsaw is at the level of 152.3. This is the highest level among the analysed cities.

TIC: apartments
The availability of low-priced apartments or houses in the city depends both on the number and quality of housing resourcesin the city and on the efficiency of the real estate market. A more efficient market will facilitate the attraction and retention of highly-qualified workers in the city, and draw new investors to the city.
The primary indicators used to measure TIC in terms of housing are: number of housingunits per 1,000 inhabitants, quality of thehousing resources (measured as percentage of units with bathrooms), the growth rate of housing resources and average rents on the secondary market.
31Reports on major Polish cities Warsaw
Infrastructure
The availability of low-priced apartments or houses in the city depends both on the number and quality of housing resources in the city and on the efficiency of the real estate market.
In Warsaw, there are approximately466 apartments per 1,000 inhabitantsand this is the highest value amongthe analysed cities, definitely abovethe average (413). Quality of Warsaw’shousing resources is also at the highest level against the other cities.
The rate of increase in the number of new apartments in the years 2004-2008 was the highest amongthe analysed metropolises and reached8.2%, which is significantly above the average (5.1%). Apartment priceson the secondary market are, however,clearly higher than in the otheranalysed cities.
With the average level of 100 for the11 cities, the value of TIC in terms of housing resources for Warsaw is at the level of 110.8 and this is the highest score among theanalysed cities.

TIC: media and utilities
Without efficiently and reliably supplied mediaand utilities, it is difficult for a city to establishan image as a good place to live, and above all,a good place to do business. This is true bothfor the traditional utilities (power, gas, water)as well as modern media mechanisms(telecommunication, internet), which affordinnovative growth opportunities and make it possible for citizens to make full use of theirknowledge and skills.
The following indicators were used to measureTIC in this respect: the percentage of peopleusing the water supply and sewage networks,power consumption by households (which is associated with the number of durable goods in a household), the estimated number of Internet users (per 1,000 inhabitants), and the percentage of the city area covered by free access to wireless Internet (the last twoindicators are new in this edition of the survey).
TIC: trade and services
Market services, especially trade, financial,hotel and catering services, create the marketinfrastructure necessary for ensuring a well functioning economy. These services are usually highly correlated: cities which offer e.g. large, modern shopping spaces also typically offer other services of high quality.
When measuring TIC for trades and services,we used the following indicators: area of modern shopping space, number of ATMs,and number of shops, hotels and restaurantsper 1,000 inhabitants.
32 Warsaw Reports on major Polish cities
The situation in Warsaw in the area of media and utilities varies considerably.If we look at power consumption and thenumber of Internet users, the city is abovethe average for the analysed cities, whilewith regard to the percentage of peopleusing the water supply and sewage networks, the city is at an average level.
The percentage of the city’s space with access to free wireless Internet is amongthe lowest.
With the average level of 100 for the 11cities, the value of TIC in terms of mediaand utilities for Warsaw is at the level of 95.6. This score (considering high values in terms of power consumption,the number of Internet users or the number of inhabitants using water supplyand sewage systems) results from the lowlevel of accessibility, as compared to theother cities, of free Internet.
With regard to shopping space per capita,Warsaw comes third, with the indicatorvalue considerably above the average(800 m2 against 657 m2).
The number of shops, hotels and restaurants per capita is relatively low(1.3 against the average of 1.7), which canbe explained, however, by the greater concentration of trade.
With the average level of 100 for the 11cities, Warsaw’s IDC in terms of tradeand services is at a relatively high levelof 114.5.
Infrastructure

Warsaw’s Technical and Infrastructural Capital
As compared to other Polish cities, Warsaw’sTechnical and Infrastructural Capital is at a highlevel, close behind Kraków. Certain weaknessesof the city can be observed in the area of media(this concerns in particular, access to the Internet). The road infrastructure, althoughthe most strongly expanded among theanalysed cities, is additionally burdened with heavy transit traffic.
33Reports on major Polish cities Warsaw
InfrastructureSummary
20
40
60
80
100
120
160
0
min. in 11 citiescitymax. in 11 cities
140
HousingRetailing and services
Transport
Utilities
Infrastructure – Warsaw
Warsaw, close behind Kraków, is a leader among the analysedcities with regard to Technical and Infrastructural Capital. With the average level of 100 for the 11 cities, Warsaw’s Technical and Infrastructural Capital is at the level of 118.3.

Why do we measure Sources of Finance Capital?
Sources of Finance Capital refers to the abilityof a city to access the funds necessary for financing its own development. Such fundscan come from various sources: tax revenues,government subsidies, EU funding, revenuesfrom issuing securities or contracting loans.They may also include private sector funds thatare used for financing undertakings necessaryfor the city’s development.
To develop successfully, present-day cities needto make investments that deliver efficient infrastructure, desired quality of life, and effective operation of public institutions. A good development strategy is not enough – sufficient funding is required to achieve the goals. This second edition of the “Reports on major Polish cities” is being published at a time when the world economy is still in crisis, and as Poland is struggling with aneconomic slow-down resulting in decreasedbudget revenue.
While investment is a desirable goal, it’s also a particularly difficult one to achieve nowadays.Admittedly, we do have access to considerablefinancial resources from the European Unionbudget. However, to be able to take full advantage of these, we need to find considerablefunding of our own for co-financing. Taking a long-term view, city development requires us to urgently modernise infrastructure and improve public services, despite the currenteconomic downturn. At the same time, however,increased risk aversion among financial institutions has caused them to view large investment projects with a new caution and distrust. Such a complex economic situationmakes acquiring the necessary funding for cityinvestment difficult. Costs are also increasing,as a result of the imposition of higher marginsby financing institutions, as well requirementsfor additional guarantees. A limited budgetand continuously rising costs will mean thatthere simply might not be sufficient funds for some investments.
Cities with high SFC value are those that are able to source the necessary amounts of funding, drawing on various sources, so asto achieve the best results with as low fundingacquisition costs as possible. In an environmentas complex as the current one, Sources of FinanceCapital becomes particularly important; maintaining it at a high level is decidedly more challenging than during the boom times. That is why in this edition of the reports we decided to focus on this Capital, and paymore attention to the methods of finance acquisition that are less onerous to the localgovernment budget.
Measurement of the Sources of Finance Capital (SFC).
SFC should be understood as the ability of cities to finance projects essential to theirgrowth. Well developed SFC shows that a cityis able to acquire sufficient funds for such purposes, from diverse sources.
The following four aspects are analysed for the SFC assessment: tax base (the city’s GDP),budget financing, funds from the financialmarket (loans), and EU funds. We would liketo emphasize that, in the long term, Polish citiesshould aim at engaging more private sectorfunds, mainly in the form of public-privatepartnerships.
34 Warsaw Reports on major Polish cities
Finances

SFC: revenue base
The principal revenue base of a city consists of the income obtained by its residents. Localtaxes may be levied on such income in varyingdegrees, depending on the policies adopted. In general, the higher the economic activity of the city, the higher the current and futurerevenue of the city’s budget, which allows for financing various investment projects.
SFC assessment in terms of the revenue base is done based on GDP per capita.
SFC: budget financing
Budget financing comprises the funds that a city has in its own budget (the sum of its ownfunds, and the subsidies and funding receivedby the city from the central budget). The mainbenefit of financing development from thebudget is that it does not involve any increasein the city’s debt. There are, however, also certain drawbacks resulting from such financing.Budget funds are always limited to some extent. Moreover, in the long run, providingextensive funding from the city’s own budgetcan only be done through applying high localcharges and taxes. This in turn may negativelyinfluence the economic climate of the city.
The SFC for budget financing comprises the total revenue of the city’s budget (includingsubsidies from the central budget), its own revenue (in both cases per capita) and the shareof capital expenditures in the city’s budget.
35Reports on major Polish cities Warsaw
Finances
In 2008 (most recent data available fromthe Central Office of Statistics), Warsaw’sGDP per capita was the highest in the groupof the 11 cities and was equal to almosttwo times the average of the analysed cites.
With the average level of 100 for the 11 cities, the value of SFC in terms of revenue base for Warsaw is 188.2. This is the highest level among the analysed cities.
In 2009, total budget revenue of Warsawamounted to over PLN 10 billion. Both the total revenue and own revenuecalculated per capita were at the highestlevel among the analysed cities. Despite the wide-ranging investment projects carried out by the city, the shareof capital expenditures in the total spending was lower than the average forthe other cities and amounted to 17.8%.
With the average level of 100 for the 11cities, the value of SFC in terms of budgetfinancing for Warsaw is 135.9. This is the highest index among all the cities.

SFC: market financing
Funds originating from the financial marketmay be acquired by contracting loans frombanks or issuing municipal bonds. Financingdevelopment with funds from the financialmarket is beneficial, as it provides the opportunity for investments that could not becovered from budget funds to be carried out.The negative to this is increasing city debt.However, when analysing Polish city debt levels, it should be noted that debt and investment are usually correlated. This means that low debt levels may reflect a low level of investment.
High debt levels are negative if the funds acquired through loans are for current expenditure or investment projects with noeconomic justification. Using loans to financeprojects that help economic development maybe correct in the long-term; however, in theinitial analysis phase, cities should consider all the forms of financing available.
SFC measurement in terms of market financingincludes: the city’s debt to revenue ratio for 2009, i.e. the latest audited data available(pursuant to the Public Finance Law, the proportion should not be higher than 60%)and the city’s credit rating.
36 Warsaw Reports on major Polish cities
Warsaw is very active in acquiring funds on the financial market (it uses Eurobond issue for financing,which is not a widespread practice on the Polish market). In 2009, debt to revenue ratio in Warsawamounted to 40%, and in 2010, according to forecasts,will reach 50.9%. Such high increase in debt level is due to both wide-range of investment projects in the city and significant decrease in own revenue of local government units. If such situation persists,the city will have to focus on financial optimisation,including intensification of non-budgetary financingsources, in the subsequent years. Nevertheless, it should be stressed that Warsaw’s rating is still onone of the highest levels among the analysed cities (A2).
With the average level of 100 for the 11 cities, the value of SFC in terms of the market financingfor Warsaw is 106.5, which places it in the middle
of the list.
Finances
Financing development with funds from the financial market is beneficial, as it provides the opportunity for investments that could not be covered from budget funds to be carried out.

SFC: EU funds
Cities can use development funds as structuralresources thanks to Poland’s membership ofthe European Union. These are non-refundablegrants covering the major part of project costsserving the goals of regional development and quality of life improvement. Access to suchfunds is very beneficial for the city (althoughfinding the city’s own share for co-financingmay pose a problem). Acquisition of EU fundsis, however, a fairly complex process and theprocedures related to correct use of such fundstend to be burdensome.
The SFC related to EU funds is based on thetotal amount of money from EU funds used for co-financing current and planned projects(in the budgets of 2007-2013, on the basis of data from the Ministry of Regional Development, correct as of June 2010, including projects for which contracts havebeen signed with the Municipal Offices andmunicipal companies), on a per capita basis.
37Reports on major Polish cities Warsaw
Finances
Cities can use development funds as structural resources thanks to Poland’s membership of the European Union.
Thanks to many wide-range investments, Warsaw is one of themajor beneficiaries of the structuralfunds among the analysed cities. EU funds allocated to co-financing of the projects carried out during theyears 2007-2013, calculated on a percapita basis, place Warsaw above the average for the 11 cities.
With the average level of 100 for the11 cities, the value of SFC in terms of EU funds for Warsaw is 128.7.

SFC: public-private financing
Public-private funds are those that the citygains through contracts with private investorswith, as a result, projects important for the city’sdevelopment being financed by the private sector. The use of public-private financingshould be treated as the reflection of skilfulnessof a city in acquiring funds for development.
When preparing our reports four years ago, we hoped that this index would be included in the SFC assessment in this next edition.However, despite high hopes and the potentialof PPP development in Poland, public procurement where a private partner is selectedon the basis of principles set out in the Public-Private Partnership Act is still not carriedout in numbers sufficient for making such an assessment. A high number of tender announcements for private partner selection(PPP or concessions) published recently (on average 40 announcements per year werepublished in 2009-2010) constitute proof thatthis form of project execution is more oftenbeing considered.
A significant increase in the interest shown byprivate entities in projects in the form of PPPor concessions has also been noticeable in thelast two years. Regrettably, in only a few caseswas the public contract award procedure and selection of the private partner successful (e.g. construction of underground car park in Wrocław and Kraków, construction of indoorswimming pool in Oława, development of thelakefront in Chełm). The majority of tenderprocedures are cancelled due to lack of interestamong private partners. This lack of interestresults from poor project preparation and a tendency of the public sector to transfer most of the risk to the private partners. In practice, it is hard to talk about the PPPprojects that are already underway, and we decided not to include public-privatefinancing in the SFC assessment.
38 Warsaw Reports on major Polish cities
At the same time, we would like to emphasise the importance of the future development potential of Polish cities and in the appropriate parts of the reportswe indicate how individual cities are approaching forms of infrastructure project financing that are stillfairly new to our market.
Finances

Warsaw’s Sources of Finance Capital
The city has the largest revenue base and thehighest budget revenues in the country. Nevertheless, since the budget is heavily burdened with a compensatory subsidy for thepoorest regions in the country, the rate of totalexpenditure is smaller. Moreover, wide accessto the private capital market, confirmed by a high rating, should be also noted. Warsawhas demonstrated a significant activity with regard to diversification of its financing sources,as well as precautions against and avoidance of excessive debt increase. At the same time,Warsaw has proven to be effective in acquiringEU grants.
Warsaw plans to launch new investment undertakings based on the PPP/concession formula. The future projects cover, i.e. a hospital, underground car parks, sport facilities, communal flats.
The city is currently on the last stage of selectinga licensee to be responsible for the constructionand maintenance of approx. 1,500 of new bus shelters.
39Reports on major Polish cities Warsaw
50
100
150
200
0
min. in 11 citiescitymax. in 11 cities
BudgetEuropean Union
GDP
Financing
Finances – Warsaw
With the average level of 100 for the 11 cities, the value of SFC for Warsaw is 139.8.
FinancesSummary
Why do we measure Investment Attractiveness Capital?
Investment Attractiveness Capital reflects a given city’s attractiveness as a location for business activity, and thus its capacity to attract investors. Perception is crucial; thiscapital is not always directly connected withthe city’s actual strengths and weaknesses.Cities providing very good investment conditions sometimes are regularly ignored by investors, while other cities actually offering worse conditions are popular.
Very often investors do not act rationally. They tend to make new investments wherethey have invested in the past, even if the conditions offered by other cities may be better.Subjective and secondary factors may also influence decisions about where to launch investment: the city’s accessibility for travellingbusinessmen, the goodwill of local administrative bodies and the first impressionsfrom the visit. A city that is not perceived as a good investment location should strive to change this by any means possible. Investment Attractiveness Capital is essentialfor future development.
Measuring Investment Attractiveness Capital
Investment Attractiveness Capital has a stronginfluence on a city’s development opportunities.As evaluation of investment attractiveness is not always entirely rational, cities can onlypatiently strive to promote a positive image.Awareness of the business potential of a city,and identifying the sectors that the city is best suited to meeting the needs of, are pre-conditions. Therefore, drawing up a clear and transparent planning policy and strategies for its effective implementationis critically important.
Investment Attractiveness Capital is measuredabove all by analysing a given city’s success in attracting investors, both foreign and domestic. We also take into account investment conditions, that is those factors thatmay enhance the image of the city as a goodbusiness location.
40 Warsaw Reports on major Polish cities
Investments
Investment Attractiveness Capital is essential for the city’s future development.

IAC: attractiveness to foreign investors
To evaluate a city’s level of perceived investment attractiveness to foreign companies,we analysed the level of existing investmentand data concerning the availability of skilledemployees.
The indicators used to measure IAC for attractiveness to foreign investors include:number of foreign companies that have invested in the city in the last three years, and the number of graduates from technicaland scientific universities located in the city or in its vicinity (distance of up to 50 km) who completed their education in the lastthree years.
41Reports on major Polish cities Warsaw
Investments
Number of foreign investors operatingin the city compared to the number of Warsaw’s residents is the highestamong the cities examined and is three times higher than the averagevalue. Also, in terms of the number of graduates from technical and scientific faculties, the city’s rankingis exceptionally high (32,400 – the highest number of graduates,excluding Kraków).
With the average level of 100 for the11 cities, the value of IAC in terms of attractiveness for foreign investorsfor Warsaw is 245.4, and has beendetermined as definitely the highestvalue in this index among the citiesanalysed.

IAC: attractiveness for domestic investors
Domestic companies are usually more awarethan foreign companies of the strengths and weaknesses of given cities as investmentlocations, and their decision-making can therefore be more rational. This is true particularly for large domestic companies,which very often have significant freedom in choosing the most suitable investment location for the long term.
The basic indicators used to measure IAC for domestic investors in this respect are: the total value of the companies’ capital expenditures per capita (demonstrating theirinvestment in a given location), relationshipbetween capital expenditures and fixed assets(indicating growth of or reduction in businessengagement in a given location), number of innovative companies operating in the city(as per the INE PAN, BRE Bank and GazetaPrawna ranking) and wage levels (as relativelylow wage levels should attract investors).
42 Warsaw Reports on major Polish cities
In the segment of local investors, Warsaw demonstrates thehighest level of capital expenditures per capita among the citiesanalysed – only Gdańsk shows the similar value. Relationshipbetween capital expenditures and fixed assets is on the averagelevel. Considering the number of companies included in the innovativeness rankings per capita, Warsaw placed third – behind Kraków and Katowice.
Wage level in Warsaw is the highest among the analysed cities,which may have a negative impact on the investors’ willingnessto undertake new ventures in the capital city of Poland.
With the average level of 100 for the 11 cities, the value of IAC in terms of attractiveness for domestic companies for Warsaw is 128.3, which places the city on the first positionamong all the analysed cities.
Investments

IAC: investment conditions
When considering, for instance, the level of human capital or infrastructure in a city,subjective assessments of its suitability for investment and business activity may hold more sway than its actual advantages. This analysis takes into account factors thatmay encourage or discourage companies, especially foreign ones, from investing.
The indicators used to measure IAC for investment conditions include: the percentage of a city’s area covered by spatialdevelopment plans, the number of languageand international schools, and the number of beds in 4- or 5-star hotels (compared to the city’s population).
43Reports on major Polish cities Warsaw
It should be emphasized that in terms of investment conditions,the need to create new plans of spatial development to coverlarger areas of Warsaw, remains quite a challenge. At present,20% of the city’s area is covered by such plans, which placesWarsaw in the bottom part of the analysis. This negatively influences the construction process and the fact that the city is insignificantly covered by plans of spatial development, considerably reduces this ratio.
In terms of services which are important from the investors’ pointof view, especially foreign ones, Warsaw is now indisputablyahead of other cities and retains significant competitive advantage. Both with regard to the number of available places in high-standard hotels per capita and educational services (language and international schools), Warsaw has hugely outdistanced the remaining cities. Obviously, it is due to the specific nature of the Warsaw’s market, which has to handle political and administrative centre of the country.
With the average level of 100 for the 11 cities, the value of IACin terms of investment conditions for Warsaw is 202.5.
Investments
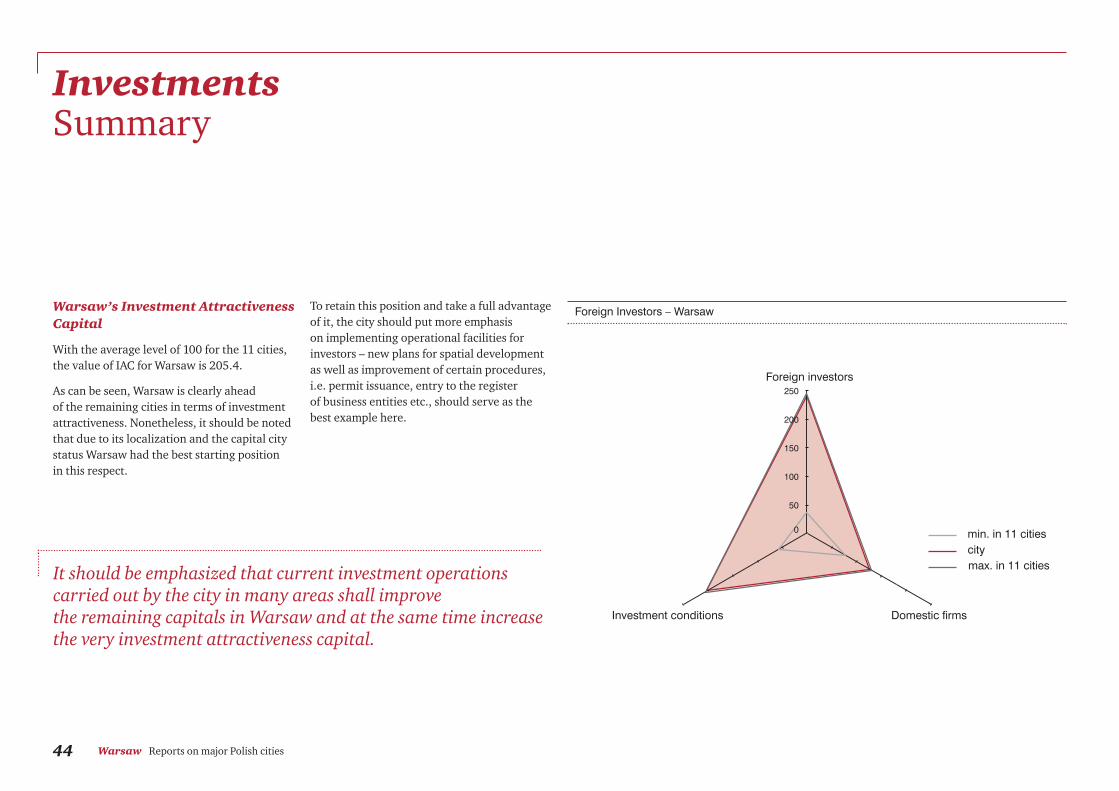
Warsaw’s Investment AttractivenessCapital
With the average level of 100 for the 11 cities,the value of IAC for Warsaw is 205.4.
As can be seen, Warsaw is clearly ahead of the remaining cities in terms of investmentattractiveness. Nonetheless, it should be notedthat due to its localization and the capital citystatus Warsaw had the best starting position in this respect.
To retain this position and take a full advantageof it, the city should put more emphasis on implementing operational facilities for investors – new plans for spatial developmentas well as improvement of certain procedures,i.e. permit issuance, entry to the register of business entities etc., should serve as thebest example here.
44 Warsaw Reports on major Polish cities
Investments Summary
50
150
250
min. in 11 citiescitymax. in 11 cities
100
200
Foreign investors
Investment conditions Domestic firms
0
Foreign Investors – Warsaw
It should be emphasized that current investment operations carried out by the city in many areas shall improve the remaining capitals in Warsaw and at the same time increasethe very investment attractiveness capital.

45Reports on major Polish cities Warsaw
Contact Details
Drafted by:
Witold Orłowski
Chief Economic Advisor
+48 22 523 4394
Team for Public Sector Services
Michał Mastalerz
Partner
+48 12 433 3510
Marzena Rytel
Director
+48 22 523 4685
Pawel Szaciłło
Vice-director
+48 22 523 4667
Sebastian Gościniarek
Vice-director
+48 22 523 4664
Adam Żołnowski
Director
+48 22 523 4282
Maciej Czura
Senior Consultant
+48 22 523 4226
Lilianna Bogusz
Senior Consultant
+48 22 523 4124

2011 PwC. All rights reserved. PwC refers to the companies associated in the PricewaterhouseCoopers International Limited (PwCIL ), each member of which is a separate legal entity and does not act on behalf of PwCIL or other member firms.
Design: Projekt kropki
www.pwc.com/plMedia Partner
Warsaw
Al. Armii Ludowej 14 00-638 Warsaw [email protected]: +48 (0) 22 523 4000Fax: +48 (0) 22 508 4040
Gdańsk
Ul. Piastowska 1180-332 GdańskTel: +48 (0) 58 5529000Fax: +48 (0) 58 5529090
Katowice
Ul. Ściegiennego 3 40-001 Katowice Tel: +48 (0) 32 604 0200Fax: +48 (0) 32 604 0300
Kraków
Centrum Biurowe Lubicz Ul. Lubicz 23a31-503 KrakówTel: +48 (0) 12 433 3500 Fax: +48 (0) 12 433 3501
Poznań
Plac Andersa 561-894 PoznańTel: +48 (0) 61 850 5100 Fax: +48 (0) 61 850 5109
Wrocław
Renaissance Business Centre Ul. Świętego Mikołaja 7 50-125 WrocławTel: +48 (0) 71 356 1170 Fax: +48 (0) 71 356 1174
Offices in Poland


![First steps in Warsaw your personal guidebook · 1. Study in Poland. Warsaw . Warsaw (Polish: Warszawa [varˈʂava] is the capital and largest city of Poland. It is located on the](https://img.pdfslide.net/doc/110x75/5fe0883f71394432a7504fe7/first-steps-in-warsaw-your-personal-guidebook-1-study-in-poland-warsaw-warsaw.jpg)