Embed Size (px)
Citation preview

The protective role of transcription factor NRF2 against liver injury in human and mouse models of Hereditary Hemochromatosis
Andreia dos Santos Gonçalves Mestrado em Biologia Celular e Molecular Departamento de Biologia 2015
Orientador Doutor Tiago Duarte, Investigador no Grupo Basic and Clinical Research on Iron Biology, Instituto de Biologia Molecular e Celular, Universidade do Porto
Co-orientadora
Doutora Maria da Graça Beça Gonçalves Porto, Professora Catedrática no Instituto de Ciências Biomédicas Abel Salazar, Universidade do Porto

Todas as correções determinadas
pelo júri, e só essas, foram efetuadas.
O Presidente do Júri,
Porto, ______/______/_________


FCUP
NRF2 protection against liver injury in human and mouse models of HH I
Agradecimentos
Antes de mais gostaria de agradecer ao Doutor Tiago Duarte e à Doutora Graça Porto
a oportunidade que me proporcionaram em trabalhar no grupo Basic and Clinical
Research on Iron Biology. Ao Doutor Tiago Duarte agradeço ainda a orientação prestada
ao longo de todo o trabalho, principalmente na parte animal, e toda a paciência e apoio
que foram essenciais para a realização desta tese. À Doutora Graça Porto agradeço
toda a ajuda prestada na parte humana, uma vez que seria impossível realizar esta
componente sem a sua orientação.
Agradeço ao staff do Corelab do Centro Hospitalar do Porto - Hospital Geral de Santo
António, pela análise de soro e sangue de ratinhos, à Professora Maria João Martins a
ajuda indispensável na realização do ensaio de TBARS e quantificação da glutationa e
ao Engenheiro Paulo Limão a assistência prestada na quantificação dos níveis de
"cytokines/chemokines" no soro de ratinho.
Gostaria ainda de agradecer à Ana Santos, Mónica Costa e Sílvia Chambel, que mais
do que colegas de grupo, foram verdadeiras amigas que me proporcionaram momentos
muito felizes no laboratório. À Ana agradeço a dissecção dos ratinhos, a ajuda
indispensável que me prestou em todas as técnicas laboratoriais e o apoio que sempre
me deu. À Mónica agradeço a ajuda que me deu na análise das sequenciações e as
respostas a todas as dúvidas que lhe coloquei. À Sílvia gostaria de agradecer também
toda a ajuda que nunca hesitou prestar, mesmo tendo uma tese para escrever, e toda a
amizade que já vem desde o 1º ano de licenciatura. Sem elas e sem a Gina não haveria
tanta boa disposição e tantas gargalhadas no laboratório. Agradeço também aos
restantes membros do BCRIB, III e MP, que permitiram que este ano fosse tão
agradável.
Agradeço ainda a todos os meus coleguinhas de Mestrado, que fizeram com que
estes dois anos passassem a voar. Um agradecimento especial ao Steeve, ao Rui, à
Ana e à Patrícia, que entre momentos de brincadeira e amizade, sempre me apoiaram.
Obrigada ainda aos meus “amigos da Maia”, por toda a amizade e carinho.
Finalmente, gostaria de fazer um agradecimento muito especial aos meus pais, avós
e padrinhos, à Raquel e ao Francisco, por todo o apoio que me deram e pela paciência
que tiveram comigo. Sem vocês nada disto teria sido possível.
II
FCUP
NRF2 protection against liver injury in human and mouse models of HH
This work was funded by FEDER funds through the Operational Competitiveness
Programme – COMPETE and by National Funds through FCT – Fundação para a
Ciência e a Tecnologia under the project FCOMP-01-0124-FEDER-028447 (PTDC/BIM-
MET/0739/2012).
PTDC/SAU-FCF/101177/2008

FCUP
NRF2 protection against liver injury in human and mouse models of HH III
Abstract
Hereditary hemochromatosis (HH) is a group of primary genetic disorders of iron
homeostasis. HFE-HH, the most common form of HH in populations of northern
European ancestry, is mainly caused by a C282Y mutation in the HFE gene. HH is
characterized by hyperabsorption of dietary iron, which is delivered to plasma leading to
increased transferrin saturation and tissue iron accumulation. The liver accumulates
large amounts of iron and the excess free iron is capable of generating reactive oxygen
species, which damage the tissue. NRF2 is the key transcription factor involved in the
antioxidant response, so we hypothesized that it can act as a modifier of the clinical
expression of HH. In this study, we aimed to: i) determine the effect of Nrf2 suppression
in a model of chronic iron overload that mimics HH, the Hfe-/- mouse; ii) identify
polymorphisms/genotypes in the human NRF2 gene promoter that may influence HH
penetrance in HFE C282Y+/+ patients. Female WT, Nrf2-/-, Hfe-/- and Nrf2/Hfe-/- mice on
a C57BL/6J background at 24 months of age were fasted overnight for blood and organ
collection. Aged Nrf2/Hfe-/- mice presented lower body weight, mild anemia and
hypoglycemia at starvation. Mild liver inflammation was detected in mice of the four
genotypes, possibly as a consequence of aging. NRF2 proved to be essential in the
antioxidant defense, as Nrf2-/- and Nrf2/Hfe-/- mice presented decreased levels of Nqo1
transcript and the GSH/GSSG ratio was significantly decreased in Nrf2-/- livers. Despite
the similar amount of non-heme iron in Hfe-/- and Nrf2/Hfe-/- livers, we observed a shift in
the local deposition of iron from the liver parenchyma (in Hfe-/- mice) to sinusoidal cells
(in Nrf2/Hfe-/- mice). Necrosis, fibrosis and the number of TUNEL-positive cells were
augmented in Nrf2/Hfe-/- livers. Overall, we conclude that the suppression of NRF2 leads
to spontaneous liver damage in Hfe-/- mice, the mouse model of HH. In the human study,
DNAs of patients HFE C282Y+/+ were genotyped for Rs35652124, Rs670664,
Rs150648896 and Rs6721961 SNPs in the NRF2 promoter region. Our results indicate
that none of the SNPs alone prompts the patients to develop a specific clinical
manifestation, but patients carrying the allele C in Rs35652124 SNP are somehow
protected from clinical manifestations of HH. In conclusion, the current study shows that
NRF2 has an important hepatoprotective role in the animal model of HH and suggests
that gene variants may be also implicated in the clinical course of the human disease.
Keywords: Aging, Iron, Hereditary Hemochromatosis, Hfe, Nrf2.


FCUP
NRF2 protection against liver injury in human and mouse models of HH V
Resumo
A hemocromatose hereditária (HH) é um grupo de doenças genéticas primárias de
homeostasia do ferro. Na população originária do norte da Europa, a HFE-HH é a forma
mais comum de HH, sendo principalmente causada pela mutação C282Y no gene HFE.
A HH é caracterizada por hiperabsorção de ferro da dieta, que entra na corrente
sanguínea e leva ao aumento da saturação da transferrina e da acumulação de ferro
nos tecidos. O fígado acumula grandes quantidades de ferro, capaz de gerar espécies
reactivas de oxigénio que danificam o tecido. Como o NRF2 é o fator de transcrição
chave da resposta antioxidante, pensámos que este pode ser um modificador da
expressão clínica da HH. Os objetivos do nosso estudo foram: i) determinar o efeito da
supressão do Nrf2 num modelo de sobrecarga de ferro crónica que imita a HH, o
murganho Hfe-/-; ii) identificar polimorfismos/genótipos no promotor do gene NRF2
humano, que possam influenciar a penetrância da HH em pacientes C282Y+/+. Foram
recolhidos órgãos e sangue de murganhos fêmea WT, Nrf2-/-, Hfe-/- and Nrf2/Hfe-/- com
24 meses de idade. Os murganhos Nrf2/Hfe-/- velhos tinham baixo peso corporal, anemia
ligeira e hipoglicemia em jejum. Nos murganhos dos quatro genótipos observou-se
inflamação hepática ligeira, possivelmente devida ao envelhecimento. O NRF2 provou
ser essencial na defesa antioxidante, uma vez que os murganhos Nrf2-/- e Nrf2/Hfe-/-
apresentaram níveis diminuídos de transcrito do gene Nqo1 e que a razão GSH/GSSG
se encontrou significativamente diminuída nos fígados Nrf2-/-. Apesar da semelhante
quantidade de ferro não-heme em fígados Hfe-/- e Nrf2/Hfe-/-, observámos uma alteração
no local de deposição do ferro do parênquima do fígado (em murganhos Hfe-/-) para as
células sinusoidais (em murganhos Nrf2/Hfe-/-). A necrose, a fibrose e o número de
células TUNEL-positivas estavam aumentados nos fígados Nrf2/Hfe-/-. Concluímos que
a supressão do NRF2 leva a um dano hepático espontâneo no murganho Hfe-/-, o
modelo animal da HH. No estudo humano, DNAs de pacientes HFE C282Y+/+ foram
genotipados para os SNPs Rs35652124, Rs670664, Rs150648896 e Rs6721961 na
região promotora do NRF2. Os nossos resultados indicam que nenhum SNP, por si só,
leva ao desenvolvimento de uma manifestação clínica, mas pacientes portadores do
alelo C no SNP Rs35652124 estão de alguma forma protegidos das manifestações da
HH. Concluindo, o presente estudo mostra que o NRF2 tem um papel hepatoprotetor
importante no modelo animal da HH e que as variantes genéticas podem estar
implicadas no curso clínico da doença humana.
Palavras-chave: Envelhecimento, Ferro, Hemocromatose Hereditária, Hfe, Nrf2.


FCUP
NRF2 protection against liver injury in human and mouse models of HH VII
Table of contents
Agradecimentos ............................................................................................................. I
Abstract ....................................................................................................................... III
Resumo ........................................................................................................................ V
Table of contents ........................................................................................................ VII
List of figures ............................................................................................................... XI
List of tables .............................................................................................................. XIII
List of abbreviations ................................................................................................... XV
Introduction ................................................................................................................... 1
1. Iron metabolism .................................................................................................. 1
1.1. Body iron distribution ....................................................................................... 1
1.2. Intestinal iron absorption ................................................................................. 1
1.3. Iron storage ..................................................................................................... 3
1.4. Iron export ....................................................................................................... 4
1.5. Iron transport and uptake ................................................................................ 5
1.5.1. Transferrin-dependent mechanisms ..................................................... 5
1.5.2. Transferrin-independent mechanisms .................................................. 6
1.6. Iron consumption: erythropoiesis ..................................................................... 6
1.7. Iron recycling: macrophages ........................................................................... 7
1.8. Control of cellular iron homeostasis................................................................. 7
1.9. Control of systemic iron homeostasis .............................................................. 8
1.9.1. Hepcidin regulation .............................................................................. 9
2. Iron metabolism disorders ................................................................................ 11
2.1. Hereditary Hemochromatosis ........................................................................ 11
2.1.1. HFE-related HH ................................................................................. 12
2.1.2. Non-HFE hereditary hemochromatosis .............................................. 12
3. Oxidative stress ................................................................................................ 13
3.1. Antioxidant defense ....................................................................................... 14
3.2. NRF2 pathway .............................................................................................. 15
3.2.1. NRF2 target genes ............................................................................. 16
3.2.2. NRF2, a key protector against liver iron toxicity .................................. 17
3.2.3. Nrf2 polymorfisms .............................................................................. 17
4. Aims ................................................................................................................. 18
VIII
FCUP
NRF2 protection against liver injury in human and mouse models of HH
Material and Methods ................................................................................................. 19
1. Animal study .................................................................................................... 19
1.1. Animals ......................................................................................................... 19
1.2. Hematological measurements ....................................................................... 19
1.3. Serum analysis ............................................................................................. 19
1.4. RNA extraction and cDNA synthesis ............................................................. 20
1.5. Real-time reverse-transcription (RT)-PCR ..................................................... 21
1.6. Quantification of non-heme iron .................................................................... 21
1.7. Histological analysis ...................................................................................... 22
1.7.1. Hematoxylin and eosin staining .......................................................... 23
1.7.2. Sirius red staining............................................................................... 23
1.7.3. Perls’ Prussian Blue staining .............................................................. 24
1.7.4. TUNEL assay ..................................................................................... 24
1.8. Evaluation of oxidative stress ........................................................................ 25
1.8.1. Thiobarbituric Acid Reactive Substances (TBARS) assay .................. 25
1.8.2. Quantification of the GSH/GSSG ratio ................................................ 25
1.8.2.1. Quantification of the total gluthatione .............................................. 25
1.8.2.2. Quantification of GSSG .................................................................. 26
1.9. Hydroxyproline Assay ................................................................................... 26
2. Human study .................................................................................................... 26
2.1. Patients ................................................................................................. 26
2.2. NRF2 genotyping .......................................................................................... 27
2.3. Datafile collection .......................................................................................... 28
3. Statistical analysis ............................................................................................ 28
3.1. Animal study ................................................................................................. 28
3.2. Human study ................................................................................................. 28
Results ....................................................................................................................... 31
Animal study............................................................................................................ 31
1. Body, liver and spleen weights ...................................................................... 31
2. Hematological parameters ............................................................................ 31
3. Characterization of the anemia of Nrf2/Hfe-/- mice ......................................... 32
4. Serum analysis ............................................................................................. 35
5. Expression of glucogenesis genes ................................................................ 36
6. Iron metabolism............................................................................................. 36
7. Oxidative stress............................................................................................. 41
8. Liver fibrosis .................................................................................................. 43

FCUP
NRF2 protection against liver injury in human and mouse models of HH IX
9. Hepatic inflammation and steatosis ............................................................... 45
10. Liver damage ................................................................................................ 46
Human study ........................................................................................................... 49
Discussion .................................................................................................................. 55
Animal study............................................................................................................ 55
1. Hfe and Nrf2 genes in erythropoiesis ............................................................ 55
2. Hfe and Nrf2 genes in gluconeogenesis ........................................................ 57
3. Hfe and Nrf2 genes in iron metabolism ......................................................... 58
4. Hfe and Nrf2 genes and oxidative stress ....................................................... 60
5. Hfe and Nrf2 genes in liver fibrosis ................................................................ 60
6. Hfe and Nrf2 genes in liver inflammation and steatosis ................................. 61
7. Hfe and Nrf2 genes and liver damage ........................................................... 62
Human study ........................................................................................................... 62
Study limitations ...................................................................................................... 64
Conclusions ................................................................................................................ 65
Future perspectives .................................................................................................... 66
Publications ................................................................................................................ 67
References ................................................................................................................. 69

FCUP
NRF2 protection against liver injury in human and mouse models of HH XI
List of figures
Figure 1. Iron distribution in the human body. ............................................................... 3
Figure 2. Heme and non-heme iron uptake, utilization and export by enterocytes. ....... 4
Figure 3. The Transferrin Cycle. ................................................................................... 6
Figure 4. Iron recycling in macrophages. ...................................................................... 8
Figure 5. Regulation of hepcidin transcription.. ........................................................... 10
Figure 6. Structural and functional zonation of the liver. ............................................. 14
Figure 7. Activation of the KEAP1-NRF2-ARE pathway by oxidants/electrophiles. ..... 16
Figure 8. Body weight and percentage of relative liver and spleen weights of WT, Nrf2-/-
, Hfe-/- and Nrf2/Hfe-/- mice. ..................................................................................... 31
Figure 9. EPO levels and LDH activity in WT, Nrf2-/-, Hfe-/- and Nrf2/Hfe-/- mice. ......... 33
Figure 10. Expression of macrophages-associated genes in liver and spleen of WT, Nrf2-
/-, Hfe-/- and Nrf2/Hfe-/- mice. ................................................................................... 34
Figure 11. Expression of gluconeogenesis genes in the liver of WT, Nrf2-/-, Hfe-/- and
Nrf2/Hfe-/- mice. ...................................................................................................... 36
Figure 12. Iron levels and percentage of transferrin saturation in the serum of WT, Nrf2-
/-, Hfe-/- and Nrf2/Hfe-/- mice. ................................................................................... 36
Figure 13. Tissue non-heme iron content and Hamp gene expression in the liver of WT,
Nrf2-/-, Hfe-/- and Nrf2/Hfe-/- mice. ............................................................................ 38
Figure 14. Representative images of H&E and Perls’ Prussian Blue staining of spleen,
kidney, heart and pancreas sections of WT, Nrf2-/-, Hfe-/- and Nrf2/Hfe-/- mice.. ...... 39
Figure 15. H&E, Perls’ Prussian Blue and Sirius Red stained liver sections of WT, Nrf2-
/-, Hfe-/- and Nrf2/Hfe-/- mice.. .................................................................................. 40
Figure 16. Histological grades of iron storage in WT, Nrf2-/-, Hfe-/- and Nrf2/Hfe-/- livers..
............................................................................................................................... 41
Figure 17. MDA concentration and Nqo1 gene expression in the livers of WT, Nrf2-/-, Hfe-
/- and Nrf2/Hfe-/- mice. ............................................................................................. 42
Figure 18. Hepatic fibrosis and expression of fibrogenic genes in the livers of WT, Nrf2-
/-, Hfe-/- and Nrf2/Hfe-/- mice. ................................................................................... 44
Figure 19. Fibrosis degree of WT, Nrf2-/-, Hfe-/- and Nrf2/Hfe-/- livers. .......................... 44
Figure 20. Expression of proinflammatory genes in the liver of WT, Nrf2-/-, Hfe-/- and
Nrf2/Hfe-/- mice. ...................................................................................................... 45
Figure 21. H&E grading of lobular inflammation and steatosis in WT, Nrf2-/-, Hfe-/- and
Nrf2/Hfe-/- liver sections. ......................................................................................... 46

XII
FCUP
NRF2 protection against liver injury in human and mouse models of HH
Figure 22. Levels of serum ALT and TUNEL-positive cells in the liver of WT, Nrf2-/-, Hfe-
/- and Nrf2/Hfe-/- mice. ............................................................................................. 46
Figure 23. TUNEL assay. .......................................................................................... 47
Figure 24. Representative H&E stained liver sections of Nrf2/Hfe-/- mice .................... 48
Figure 25. PCR amplification of a 284 bp fragment of the NRF2 promoter region. ..... 49
Figure 26. Representative elecropherogram.. ............................................................. 50
FCUP
NRF2 protection against liver injury in human and mouse models of HH XIII
List of tables
Table 1. Sequences of the oligonucleotide primers used in qRT-PCR and the respective
annealing temperatures. ......................................................................................... 22
Table 2. Patients’ general characteristics and frequency of clinical manifestations. .... 27
Table 3. Hematological parameters of WT, Nrf2-/-, Hfe-/- and Nrf2/Hfe-/- mice. ............. 32
Table 4. Levels of cytokines and chemokines in the serum of WT, Nrf2-/-, Hfe-/- and
Nrf2/Hfe-/- mice. ...................................................................................................... 35
Table 5. Levels of glucose, triglycerides and insulin in the serum of WT, Nrf2-/-, Hfe-/- and
Nrf2/Hfe-/- mice. ...................................................................................................... 35
Table 6. Levels of GSX, GSSG and GSH and GSH/GSSG ratio, in the serum of WT,
Nrf2-/-, Hfe-/- and Nrf2/Hfe-/- mice. ............................................................................ 42
Table 7. Actual sample and reference allele frequencies. ........................................... 50
Table 8. Allele frequencies in patients stratified according to the clinical manifestations
of disease. .............................................................................................................. 50
Table 9. Frequencies of the several genotypes in 97 patients. .................................... 51
Table 10. Genotype frequencies in patients with or without cirrhosis, arthropathy and
symptoms. .............................................................................................................. 52
Table 11. Clinical characterization of the genotypes groups. ...................................... 52


FCUP
NRF2 protection against liver injury in human and mouse models of HH XV
List of abbreviations
ALT alanine aminotransferase
Acta2 alpha-smooth muscle actin gene
AI anemia of inflammation
Apo-Tf apo-transferrin
ARE antioxidant response elements
AST aspartate aminotransferase
BMP bone morphogenic protein
BMPR bone morphogenic protein receptor
BMP-RE bone morphogenic protein responsive element
BTB tramtrack and bric-à-brac domain
C/EBPα CCAAT/enhancer-binding protein alpha
CAT catalase
cDNA complementary deoxyribonucleic acid
CGPP ’Centro de Genética Preditiva e Preventiva’
CHP ’Centro Hospitalar do Porto’
Col1a1 type I collagen gene
Cul3 cullin 3
Cys cysteine
DAPI 4',6-diamidino-2-phenylindole
DCYTB duodenal cytochrome b
DEPC diethylpyrocarbonate
DGR double glycine repeats
DMT1 divalent metal transporter 1
DNA deoxyribonucleic acid
dNTP deoxyribonucleotide triphosphate
DTT dithiothreitol
ECM extracellular matrix
EDTA ethylenediaminetetraacetic acid
ELISA enzyme-linked immunosorbent assay
EPO erythropoietin
FA fatty acid
FAC ferric ammonium citrate
Fe iron
Fe2+ ferrous iron

XVI
FCUP
NRF2 protection against liver injury in human and mouse models of HH
Fe2-Tf diferric transferrin
Fe3+ ferric iron
FLVCR feline leukemia virus, subgroup C, receptor
FPN1 ferroportin
G6Pc glucose-6- phosphatase
GCL glutamate-cysteine ligase
GPx glutathione peroxidase
GR glutathione reductase
GSH reduced glutathione
GSSG oxidized glutathione
GSTs glutathione-S-transferases
GSX total glutathione
H&E standard hematoxylin and eosin staining
H+ hydrogen
H2O2 hydrogen peroxide
HAMP hepcidin
Hb hemoglobin
HCl hydrochloride
HCP1 heme carrier protein 1
HCT hematocrit
HCV hepatitis C virus
HH hereditary hemochromatosis
HIC hepatic iron content
HIFs hypoxia inducing factors
HIV human immunodeficiency virus
HJV hemojuvelin
Hmox1 heme oxygenase-1 gene
HO• hydroxyl radical
HO-1 heme oxygenase-1
Holo-Tf holo-transferrin
Hprt hypoxanthine phosphoribosyltransferase gene
HREs hypoxia-response elements
HRG1 heme responsive gene 1
HSC hepatic stellate cells
IDA iron deficiency anemia
IFN-γ interferon-γ
FCUP
NRF2 protection against liver injury in human and mouse models of HH XVII
IL interleukin
IRE iron responsive element
IRP iron regulatory protein
JH juvenile hemochromatosis
K3EDTA K3-ethylenediamine tetraacetic acid
KEAP1 kelch ECH associating protein 1
LDH lactate dehydrogenase
M&M materials and methods
MAF small musculoaponeurotic fibrosarcoma
MAPK mithogen-activated protein kinase
MCH mean corpuscular hemoglobin
MCV mean corpuscular volume
MDA malondialdehyde
MgCl2 magnesium chloride
MMPs matrix metalloproteinases
mRNA messenger ribonucleic acid
MZF1 myeloid zink finger 1
Na+ sodium
NFE2L2/NRF2 nuclear factor-erythroid 2-related factor 2
NQO1 NAD(P)H:quinone oxireductase 1
NTBI non-transferrin bound iron
O2 oxygen
O2•- superoxide
PBS phosphate buffered saline
PCA perchloric acid
PCBP1 poly(rC)-binding protein
PCFT proton coupled folate transporter
PCR polymerase chain reaction
PEPCK-C phosphoenolpyruvate carboxykinase
qPCR real-time polymerase chain reaction
RBC red blood cell
RNA ribonucleic acid
ROS reactive oxygen species
RT room temperature
RT-PCR reverse transcription polymerase chain reaction

XVIII
FCUP
NRF2 protection against liver injury in human and mouse models of HH
SNP single nucleotide polymorphism
SOD superoxide dismutase
STAT3 signal transducer and activator of transcription 3
STEAP six transmembrane epithelial antigen of the prostate
TBARS thiobarbituric acid reactive substances
TBI transferrin-bound iron
TBIS total body iron stores
TCA trichloroacetic acid
Tf transferrin
TfR transferrin receptor
TGF-β transforming growth factor-β
TIBC total iron-binding capacity
Timp1 tissue inhibitor of matrix metalloproteinase-1 gene
TIMPs tissue inhibitors of metalloproteinases
TNFα tumor necrosis factor alpha
Trx thioredoxin
TUNEL terminal deoxynucleotidyl transferase (TdT) dUTP Nick-End Labeling
Ub ubiquitination
UTR untranslated region
WT wild-type
ZIP14 zinc transporter Zrt-Irt-like protein 14
α-SMA α-smooth muscle actin
FCUP
NRF2 protection against liver injury in human and mouse models of HH 1
Introduction
1. Iron metabolism
Iron is essential for nearly all living organisms and plays an important role in several
biochemical activities, such as oxygen sensing and transport, electron transfer, catalysis,
energy production and DNA synthesis (Evstatiev and Gasche, 2012; Ganz, 2013;
Papanikolaou and Pantopoulos, 2005). Iron is capable of accepting or donating
electrons, switching between ferrous (Fe2+) and ferric (Fe3+) forms (Andrews, 1999;
Evstatiev and Gasche, 2012; Papanikolaou and Pantopoulos, 2005). The redox potential
of free iron can trigger the Fenton or Haber-Weiss reactions, which catalyze the
production of toxic reactive oxygen species (ROS) (Evstatiev and Gasche, 2012; Lane
et al., 2015; Papanikolaou and Pantopoulos, 2005). As ROS may damage DNA, proteins
and lipid membranes (Andrews, 1999; Evstatiev and Gasche, 2012), iron is usually
incorporated into proteins and prosthetic groups (Evstatiev and Gasche, 2012; Silva and
Faustino, 2015). The intracellular iron content is thus tightly controlled through the
regulation of iron import, storage and efflux (Evstatiev and Gasche, 2012; Lane et al.,
2015; Yun and Vincelette, 2015).
1.1. Body iron distribution
The average adult human has 3-5 g of iron in the body, depending on gender and age
(Evstatiev and Gasche, 2012; Ganz, 2013; Gkouvatsos et al., 2012). Over 2 g of iron are
incorporated in the hemoglobin and the remaining iron is either stored in hepatocytes
(~1000 mg) or circulates in a transit pool in reticuloendothelial macrophages (~600 mg).
Iron can also be found in myoglobin (~300 mg), in iron-containing proteins (~8 mg) or
circulating in the plasma bound to transferrin (~3 mg) (Andrews, 1999; Gkouvatsos et
al., 2012; Papanikolaou and Pantopoulos, 2005) (Figure 1).
1.2. Intestinal iron absorption
The regulation of iron absorption is a key element in iron homeostasis since there is no
pathway for its excretion (Andrews, 1999; Gkouvatsos et al., 2012). Iron absorption (1-2
mg per day) takes place in the enterocytes of the duodenum and in the upper jejunum
(Andrews, 1999; Evstatiev and Gasche, 2012). This serves to compensate for the daily
loss of iron (1-2 mg per day) through sweating, desquamation of epithelial surfaces and
bleeding, thus contributing modestly to the total iron demand in the body (Ganz, 2013;
Gkouvatsos et al., 2012) (Figure 1). However iron absorption can be enhanced, when

2
FCUP
NRF2 protection against liver injury in human and mouse models of HH
the body has higher needs of iron, or suppressed in cases of iron overload (Hentze et
al., 2010).
Iron is essentially absorbed from food. There are two distinct forms of dietary iron that
appear to be absorbed by separate mechanisms: heme iron and inorganic iron (non-
heme iron) (Sharp, 2010; Wyllie and Kaufman, 1982). Heme, a protoporphyrin ring that
binds iron (Dunn et al., 2007), is very abundant in meat products (Silva and Faustino,
2015) and is more bioavailable than the non-heme form (Gkouvatsos et al., 2012). Heme
is released from hemoproteins in the stomach due to the low pH and to proteolytic
enzymes (Silva and Faustino, 2015). Although the mechanism of heme uptake is not yet
well characterized, it is known to occur via direct transport (Gkouvatsos et al., 2012) or
via receptor-mediated endocytosis (Ganz, 2013; Silva and Faustino, 2015). A putative
candidate for heme transporter in the enterocyte is heme carrier protein 1 (HCP1)
(Shayeghi et al., 2005). HCP1, together with the proton coupled folate transporter
(PCFT) (Silva and Faustino, 2015), is capable of internalizing heme. However, HCP1
affinity to heme is low (Laftah et al., 2009) and its nonredundant fuction is folate uptake
in the duodenum (Ganz, 2013), revealing that HCP1 is not essential for duodenal heme
uptake. Once inside the enterocyte, heme can migrate to the endoplasmatic reticulum
(Dunn et al., 2007), where heme oxygenase-1 (HO-1) localized in the reticulum surface
liberates ferrous iron, carbon monoxide and biliverdin from heme (Gkouvatsos et al.,
2012; Silva and Faustino, 2015). Fe2+ can then follow the fate of inorganic iron. Heme
can also be exported as an intact molecule via the putative heme exporter feline
leukemia virus, subgroup C, receptor (FLVCR) (Khan and Quigley, 2011).
Non-heme iron, including iron-sulfur clusters, is present in the intestinal lumen in its
insoluble oxidized Fe3+ form (Gkouvatsos et al., 2012). In order to be absorbed by the
enterocyte, Fe3+ is reduced in the apical membrane by brush border reductases (Silva
and Faustino, 2015). Duodenal cytochrome b (DCYTB) (McKie et al., 2001) was the first
ferrireductase discovered and it uses ascorbate for the reduction reaction (Andrews and
Schmidt, 2007). However, DCYTB proved not to be essential for the reduction of Fe3+ to
Fe2+ (Gunshin et al., 2005). This suggests the existence of other ferrireductases, like six
transmembrane epithelial antigen of the prostate 2 (STEAP2) (McKie et al., 2001;
Ohgami et al., 2006). The reduced Fe2+ iron is transported across the apical membrane
by the proton-coupled divalent metal transporter 1 (DMT1, SLC11A2, NRAMP2 or
DCT1). DMT1 is a 12-transmembrane-segment protein that uses the proton gradient,
generated by the intestinal Na+/H+ exchanger (Mackenzie et al., 2011), between the gut
lumen and the enterocyte cytoplasma to perform the symport of Fe2+ coupled with H+
(Gunshin et al., 1997), but it is not specific to iron (Andrews, 1999).
FCUP
NRF2 protection against liver injury in human and mouse models of HH 3
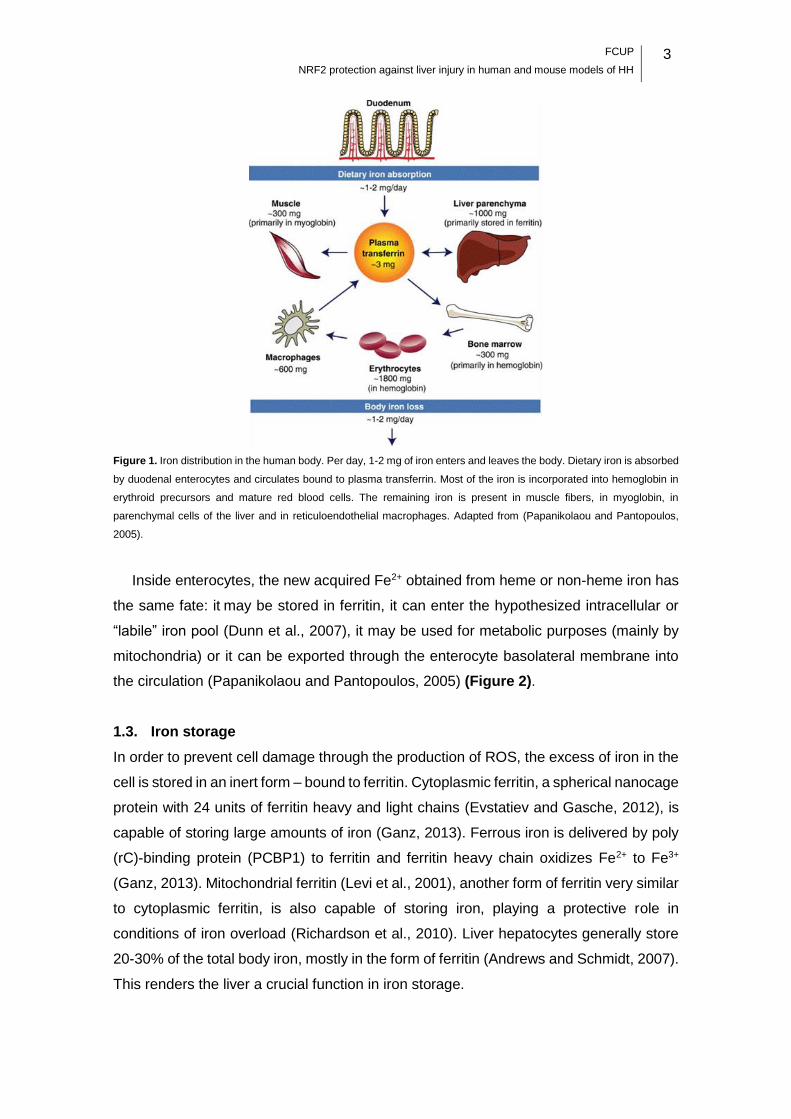
Figure 1. Iron distribution in the human body. Per day, 1-2 mg of iron enters and leaves the body. Dietary iron is absorbed
by duodenal enterocytes and circulates bound to plasma transferrin. Most of the iron is incorporated into hemoglobin in
erythroid precursors and mature red blood cells. The remaining iron is present in muscle fibers, in myoglobin, in
parenchymal cells of the liver and in reticuloendothelial macrophages. Adapted from (Papanikolaou and Pantopoulos,
2005).
Inside enterocytes, the new acquired Fe2+ obtained from heme or non-heme iron has
the same fate: it may be stored in ferritin, it can enter the hypothesized intracellular or
“labile” iron pool (Dunn et al., 2007), it may be used for metabolic purposes (mainly by
mitochondria) or it can be exported through the enterocyte basolateral membrane into
the circulation (Papanikolaou and Pantopoulos, 2005) (Figure 2).
1.3. Iron storage
In order to prevent cell damage through the production of ROS, the excess of iron in the
cell is stored in an inert form – bound to ferritin. Cytoplasmic ferritin, a spherical nanocage
protein with 24 units of ferritin heavy and light chains (Evstatiev and Gasche, 2012), is
capable of storing large amounts of iron (Ganz, 2013). Ferrous iron is delivered by poly
(rC)-binding protein (PCBP1) to ferritin and ferritin heavy chain oxidizes Fe2+ to Fe3+
(Ganz, 2013). Mitochondrial ferritin (Levi et al., 2001), another form of ferritin very similar
to cytoplasmic ferritin, is also capable of storing iron, playing a protective role in
conditions of iron overload (Richardson et al., 2010). Liver hepatocytes generally store
20-30% of the total body iron, mostly in the form of ferritin (Andrews and Schmidt, 2007).
This renders the liver a crucial function in iron storage.

4
FCUP
NRF2 protection against liver injury in human and mouse models of HH
Figure 2. Heme and non-heme iron uptake, utilization and export by enterocytes. Heme iron enters the enterocyte via
heme carrier protein 1 (HCP1) and Fe2+ is released after the breakup of heme by hemoxygenase (HO-1). Non-heme iron
enters via divalent metal transporter 1 (DMT1), after a reduction step by duodenal cytochrome B (DCYTB). Ferrous iron
can enter the labile iron pool, can be stored in ferritin, can be used by mitochondria or can be exported via ferroportin.
Exported Fe2+ is oxidized by hephaestin and bound to transferrin (Tf). Adapted from (Evstatiev and Gasche, 2012).
Plasma ferritin, a soluble but iron-poor form of ferritin, contains mostly light chains and
is derived primarily from macrophages (Cohen et al., 2010). Serum concentrations of
ferritin correlate to body iron stores, and are thus considered an important clinical
parameter. While it is still unknown how ferritin enters the circulation and what is its exact
function, it is speculated that plasma ferritin acts like an iron scavenger, reducing
oxidative stress (Evstatiev and Gasche, 2012).
1.4. Iron export
A crucial step for the entrance of iron in the body is the export of cytosolic iron into the
circulation by ferroportin (FPN1 (Donovan et al., 2000), SLC40A1, IREG1 (McKie et al.,
2000), MTP1 (Abboud and Haile, 2000)) (Gkouvatsos et al., 2012). Ferroportin, a 12-
transmembrane domain protein, is the only known mammalian iron exporter (Ganz,
2013). It is expressed in the basolateral membranes of duodenal enterocytes, in the
membranes of macrophages (Canonne-Hergaux et al., 2006) and in the sinusoidal
surfaces of hepatocytes (Ramey et al., 2010). The export of iron requires ferroxidases,
such as plasma ceruloplasmin, present in macrophages and hepatocytes membranes,
(Healy and Tipton, 2007) and enterocyte membrane-bound hephaestin (Vulpe et al.,
1999), that use oxygen to re-oxidize Fe2+ to Fe3+ (Ganz, 2013). Fe3+ can then be loaded

FCUP
NRF2 protection against liver injury in human and mouse models of HH 5
into the circulatory transferrin (Tf) to be delivered to cells or can circulate as non-
transferrin bound iron (NTBI).
1.5. Iron transport and uptake
1.5.1. Transferrin-dependent mechanisms
Transferrin, a 75 to 80-kDa glycosylated protein, is an extracellular iron carrier (Ganz,
2013). Tf has two high-affinity binding sites for Fe3+ (Hentze et al., 2010) and circulates
in the plasma in three states: apo-transferrin (apo-Tf), when no iron is bound; monoferric
transferrin, bound to one Fe3+; diferric transferrin, also known as holo-transferrin (holo-
Tf), bound to two Fe3+ (Young and Bomford, 1984). Transferrin saturation is used as a
clinical parameter: <16% indicates iron deficiency and >45% indicates iron overload;
30% is the normal saturation. When transferrin saturation exceeds 60%, NTBI starts to
accumulate in the circulation, which can damage parenchymal cells (Hentze et al., 2010).
When bound to Tf, iron is nonreactive but very difficult to extract, so the entire iron-
protein complex is internalized (Hentze et al., 2004). The cellular uptake of transferrin-
bound iron (TBI) is mostly mediated by the transferrin receptor 1 (TfR1), at the cell
membrane (Brown and Johnson, 1981). TfR1 is a transmembrane glycoprotein
ubiquitously expressed (Hentze et al., 2004) and can bind one Tf molecule at each
subunit (Aisen, 2004). The TBI/TfR1 complex undergoes endocytosis via clathrin-coated
pits (Gkouvatsos et al., 2012). The entry of H+ mediated by an ATP-dependent proton
pump decreases the endosome pH, causing a conformational change in Tf and the
release of Fe3+ (Gkouvatsos et al., 2012; Silva and Faustino, 2015). Apo-Tf remains
bound to TfR1, while free Fe3+ is reduced by six transmembrane epithelial antigen of the
prostate 3 (STEAP3) and exported to the cytoplasm by DMT1 (Silva and Faustino, 2015).
Apo-Tf and TfR1 return to the cell surface (Hentze et al., 2004), in a process involving
the trafficking protein SEC15L1 (Lim et al., 2005). Apo-Tf is then recycled to the
bloodstream, where it can capture more iron (Gkouvatsos et al., 2012) (Figure 3).
TBI/Tf uptake is also known to occur via TfR1-independent mechanisms. Transferrin
receptor 2 (TfR2) (Kawabata et al., 1999), a protein homologous to TfR1, is believed to
be one of them (Gkouvatsos et al., 2012). TfR2 is mainly expressed in hepatocytes and
binds holo-Tf with 25-fold lower affinity than TfR1 (Robb et al., 2004). Mutations in TfR2
cause hereditary hemochromatosis (HH) (Camaschella et al., 2000; Fleming et al.,
2002), a systemic iron overload disease, revealing that this protein is more important for
the regulation of systemic iron homeostasis rather than for cellular iron uptake
(Gkouvatsos et al., 2012).

6
FCUP
NRF2 protection against liver injury in human and mouse models of HH
Regardless of the existence of several pathways for the uptake of TBI, TfR1-mediated
endocytosis is crucial for the organism, since it is indispensable for the delivery of iron to
developing erythroid cells (Gkouvatsos et al., 2012).
Figure 3. The Transferrin Cycle. Diferric transferrin (Fe2-Tf) binds to transferrin receptors (TfR) on the cell surface. The
Tf/TfR complex undergoes endocytosis via clathrin-coated pits, forming a specialized endosome. A proton pump
decreases the pH within endosomes, what causes conformational changes in Tf and, consequently, the release of Fe3+.
The iron transporter DMT1 moves iron across the endosomal membrane, to enter the cytoplasm, after a reduction step
by STEAP3. Apo-Tf and TfR are recycled back to the cell surface, and Apo-Tf is released from TfR to plasma for another
uptake cycle. Adapted from (Andrews, 1999).
1.5.2. Transferrin-independent mechanisms
In iron overload conditions, such as HH, transferrin iron binding sites become
supersaturated and circulating “free” iron increases (Hentze et al., 2004). NTBI is thought
to circulate in the plasma bound to albumin or small organic acids, like citrate (Hider,
2002). The exact mechanism of NTBI uptake is still unclear, but it has been suggested
that one or more cell surface ferrireductases are involved in the process (McKie et al.,
2001). These enzymes reduce Fe3+ NTBI to Fe2+ NTBI, so it can be imported (Lane et
al., 2015). DMT1 transporter seems to import NTBI (Lane et al., 2015), but the zinc
transporter Zrt-Irt-like protein 14 (ZIP14) is the most probable NTBI transporter (Liuzzi et
al., 2006).
1.6. Iron consumption: erythropoiesis
Two-thirds of the body iron is used by the erythroid bone marrow for erythropoiesis
(Andrews and Schmidt, 2007). Erythroid precursors highly express transferrin receptors
at the cell surface, promoting iron uptake via TfR-mediated endocytosis (Hentze et al.,
2004). Once inside the cytoplasm, iron is driven to the mitochondrion via a cytosolic iron

FCUP
NRF2 protection against liver injury in human and mouse models of HH 7
chaperon, the PCBP1 (Shi et al., 2008), or directly from the endosome through a “kiss-
and-run” mechanism (Silva and Faustino, 2015). Iron is then transported through the
inner membrane by mitoferrins 1 and 2 (Paradkar et al., 2009; Shaw et al., 2006) for
heme synthesis. Ferrous iron is incorporated into protoporphyrin IX by ferrochelatase
(Evstatiev and Gasche, 2012). Most of the heme is used for hemoglobin production, but
it can also be exported by FLVCR (Andrews and Schmidt, 2007).
1.7. Iron recycling: macrophages
Every day, a total of 25 mg of iron are needed for erythropoiesis. However, only 1-2 mg
of iron enter the body through the enterocytes. Thus, macrophages play a crucial role in
iron recycling (Hentze et al., 2004), providing nearly all of the available iron. Splenic and
hepatic macrophages scavenge the senescent erythrocytes (Silva and Faustino, 2015).
Once inside the phagolysosome, the action of hydrolytic enzymes and ROS releases
hemoglobin or free heme from the erythrocyte to the vacuolar fluid (Silva and Faustino,
2015). HO-1, in the presence of O2, cleaves heme to iron, carbon monoxide and biliverdin
(Poss and Tonegawa, 1997).
Besides capturing TBI, macrophages are also capable of capturing free hemoglobin
and free heme from the serum. Free hemoglobin is captured by haptoglobin (Kristiansen
et al., 2001), a liver derived plasma protein. CD163 receptor recognizes this complex
and promotes its endocytosis in the macrophage (Van Gorp et al., 2010). Free heme, in
turn, is scavenged by hemopexin (Tolosano et al., 2010) and suffers endocytosis via the
CD91 receptor (Hvidberg et al., 2005), which is not only present in the surface of
macrophages but also in hepatocytes and other cell types (Gkouvatsos et al., 2012).
There is a putative candidate for heme transport in macrophages, the heme responsive
gene 1 (HRG1) (Rajagopal et al., 2008). HRG1, described in Caenorhabditis elegans,
seems to be involved in the uptake of heme released by senescent erythrocytes (Ganz,
2013), in the phagolysosomes of macrophages (Delaby et al., 2012). Both free heme
and free hemoglobin endocytosed by the macrophages are hydrolyzed and contribute to
the iron pool (Caza and Kronstad, 2013) (Figure 4).
1.8. Control of cellular iron homeostasis
Cellular iron homeostasis is regulated by a post-transcriptional mechanism that controls
the synthesis of proteins involved in iron uptake, storage and release (Muckenthaler et
al., 2008). This mechanism depends on two iron regulatory proteins (IRP): IRP1 and IRP
2, which post-transcriptionally control the expression of iron responsive element (IRE)
containing mRNAs (Muckenthaler et al., 2008). IREs are located in the 5’ untranslated
8
FCUP
NRF2 protection against liver injury in human and mouse models of HH
region (UTR) of the mRNAs enconding TfR1, DMT1 and in the 3’ UTR of ferritin and
ferroportin mRNAs. In iron-depleted cells, IRPs either bind to 5’ IRE, suppressing the
translation of FPN1 and ferritin mRNAs, or to 3’ IRE, enhancing TfR1 and DMT1 mRNA
stability and thus preventing its degradation. On the other hand, in iron-replete cells,
IRP1 and IRP2 are inactivated. TfR1 and DMT1 mRNAs suffer degradation and FPN1
and ferritin mRNAs undergo translation. This response promotes the detoxification of
excess intracellular iron, by iron storage, and inhibits further iron uptake (Papanikolaou
and Pantopoulos, 2005).
1.9. Control of systemic iron homeostasis
Systemic iron has to be tightly regulated, so cells have enough iron to suppress their
needs but also avoid the toxicity associated with iron excess (Andrews and Schmidt,
2007). Hepcidin, a 25 amino acid peptide encoded by the HAMP gene, seems to regulate
the major flows of iron and is in turn regulated by iron (Ganz, 2013). This hormone, which
circulates in the blood plasma, is primarily produced and secreted by hepatocytes and is
filtered by the kidneys (Park et al., 2001). Hepcidin post-transcriptionally controls the
membrane concentration of ferroportin (Nemeth et al., 2004). When iron levels are high,
hepcidin binds directly to ferroportin, leading to its internalization and degradation within
lysosomes. As ferroportin is the only mammalian known iron exporter, this mechanism
blocks the release of dietary, stored and recycled iron from the enterocytes, hepatocytes
and macrophages, respectively (Nemeth et al., 2004).
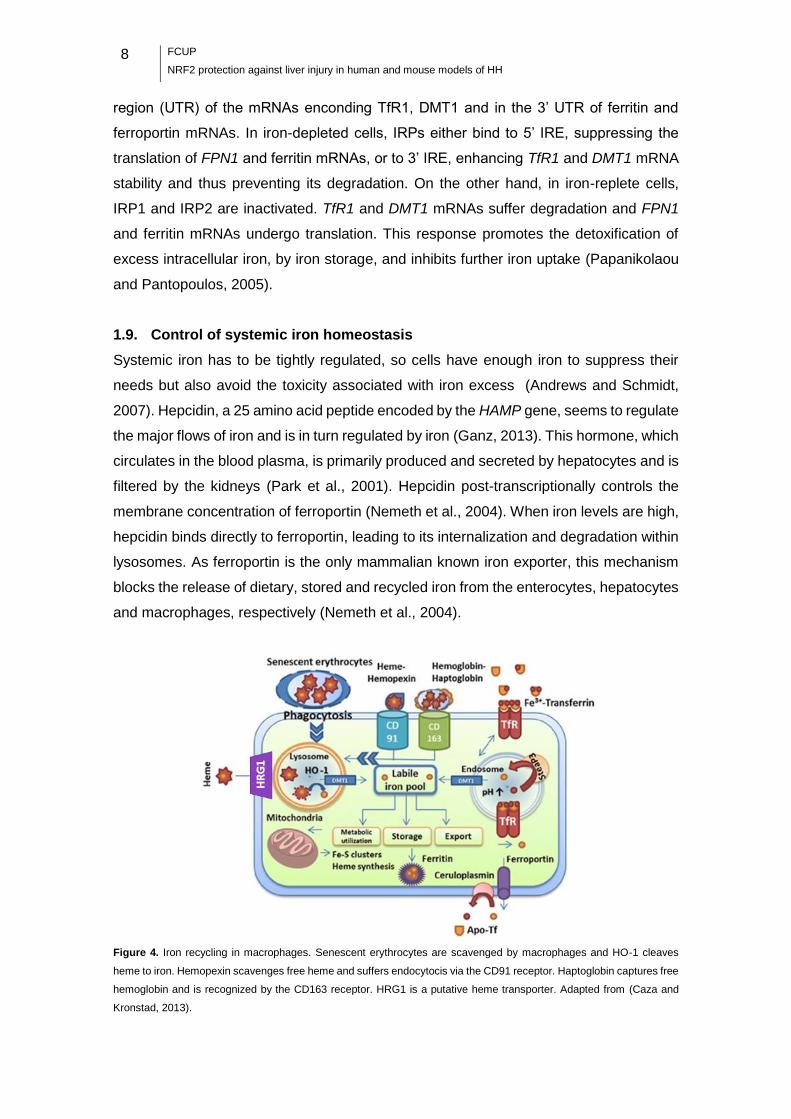
Figure 4. Iron recycling in macrophages. Senescent erythrocytes are scavenged by macrophages and HO-1 cleaves
heme to iron. Hemopexin scavenges free heme and suffers endocytocis via the CD91 receptor. Haptoglobin captures free
hemoglobin and is recognized by the CD163 receptor. HRG1 is a putative heme transporter. Adapted from (Caza and
Kronstad, 2013).
FCUP
NRF2 protection against liver injury in human and mouse models of HH 9
1.9.1. Hepcidin regulation
Hepcidin is feedback-regulated by iron and this process involves intracellular and
extracellular iron sensors. Iron sensors are coupled to transduction pathways that
regulate hepcidin synthesis and secretion by hepatocytes (Ganz and Nemeth, 2012).
Four of these iron sensors are proteins located at the cell surface: hemojuvelin (HJV),
hemochromatosis-related membrane protein HFE, TfR1 and TfR2 (Silva and Faustino,
2015). Thus, hepcidin expression is inhibited in iron deficiency or when high amounts of
iron are required for erythropoiesis (for example, in anemia or hypoxia) and is enhanced
when iron stores are replenished or during inflammatory response, when erythropoiesis
is restrained (Papanikolaou and Pantopoulos, 2005).
Hepcidin transcription in the liver is regulated by iron levels through two different
pathways. The first one involves the hemochromatosis-related membrane protein HFE.
This protein requires interaction with β2-microglobulin for normal presentation on the cell
surface (Bacon, 1997), where it interacts with TfR1 and TfR2 and functions as a holo-Tf
sensor (Ganz and Nemeth, 2012). The binding of HFE to TfR1 is competitively inhibited
by holo-Tf. When transferrin-iron saturation increases, HFE is displaced from TfR1 and
interacts with TfR2, which can bind both HFE and Fe2-Tf simultaneously (Gao et al.,
2009). The FeTf/HFE/TfR2 complex stimulates hepcidin expression through a mitogen-
activated protein kinases (MAPK) and/or a bone morphogenetic protein (BMP) pathway
signaling (Ganz and Nemeth, 2012). Conversely, when transferrin-iron saturation is low,
HFE binds to TfR1 (Muckenthaler, 2014) and hepcidin expression is repressed. A second
mechanism is the BMP signaling pathway, which is capable of integrating signals from
the “Tf-Fe-sensing complex” and from hepatocytic iron stores (Hentze et al., 2010). HJV
is a co-receptor of BMPs (in mice, BMP6) and binds to BMP type 1 and BMP type 2
receptors on the cell surface. The HJV-BMP6-BMP-receptor complex induces an
intracellular BMP signaling cascade that activates the SMAD cascade. BMP6 activates,
by phosphorylation, SMAD1, SMAD5 and SMAD8 proteins (Gkouvatsos et al., 2012).
Activated p-SMAD1/5/8 interacts with SMAD4 and the whole complex translocates to the
nucleus. In the nucleus, the complex binds to two BMP responsive elements (BMP-RE1
and BMP-RE2) at proximal and distal sites of hepcidin promoter, activating its
transcription (Casanovas et al., 2009) (Figure 5). It is suggested that BMP6
concentration can reflect the intracellular iron levels, since BMP6 mRNA increases in the
liver of mice subjected to iron loading (Kautz et al., 2008).
Hepcidin transcriptional regulation can also occur in inflammatory conditions.
Interleukin-6 (IL-6), and possibly other inflammatory cytokines, induces the activation of
the signal transducer and activator of transcription 3 (STAT3). STAT3 binds to a

10
FCUP
NRF2 protection against liver injury in human and mouse models of HH
regulatory element in the hepcidin promoter and enhances hepcidin transcription
(Wrighting and Andrews, 2006). The increase of hepcidin causes hypoferremia, typical
of the early stages of inflammation and infection, to limit the multiplication of iron-
dependent extracellular microbes (Ganz and Nemeth, 2012). However, iron
sequestration and hypoferremia may limit the iron available for erythropoiesis, leading to
anemia of inflammation (anemia of chronic disease) (Ganz and Nemeth, 2012).
Erythropoietic precursors are the main iron consumers and the expansion of a
precursor population suppresses hepcidin, allowing the mobilization of iron. The
existence of an “erythroid regulator” that stimulates iron absorption in response to
anemia and ineffective erythropoiesis has recently been demonstrated (Kautz et al.,
2014). Erythropoietin (EPO), a glycoprotein hormone synthesized by the kidney,
prevents the apoptosis of the erythropoietic precursors that have not begun the synthesis
of hemoglobin (Silva and Faustino, 2015). EPO can directly suppress hepcidin
expression, by attenuating the binding of the CCAAT/enhancer-binding protein alpha
(C/EBPα) to the hepcidin promoter (Pinto et al., 2008). Hepcidin is also down-regulated
by hypoxia. During hypoxia, erythropoiesis increases, in order to overcome the low levels
of oxygen in the body. The hypoxia inducing factors (HIFs) are suggested to be involved
in this process through a hypoxia-response elements (HREs)-mediated mechanism
(Silva and Faustino, 2015).
Figure 5. Regulation of hepcidin transcription. In iron deficient state, HFE binds to TfR1 and hepcidin isn’t expressed. In
iron replete state, HFE is displaced from TfR1 and interacts with TfR2. This interaction stimulates hepcidin expression
trough MAPK and/or BMP pathway. In iron replete cells, binding of BMP6 to the BMP receptor (BMPR) and to the
coreceptor HJV also stimulates hepcidin expression. The HJV-BMP6-BMPR complex induces the phosphorylation of
SMAD 1, 5 and 8. Phospho-SMAD 1, 5, 8 interacts with SMAD 4 and the whole complex translocates to the nucleus and
binds to BMP-REs, activating hepcidin transcription. Adapted from (Evstatiev and Gasche, 2012).

FCUP
NRF2 protection against liver injury in human and mouse models of HH 11
2. Iron metabolism disorders
Although the body iron homeostasis is tightly controlled, several factors, either genetic
or environmental, may lead to the development of iron overload or deficiency conditions.
The iron overload disorders are classified as genetic or acquired. The genetic disorders
are originated by mutations in iron metabolism genes, while the acquired ones
correspond to secondary iron overload (Silva and Faustino, 2015).
2.1. Hereditary Hemochromatosis
Hereditary hemochromatosis (HH) is a group of primary genetic disorders of iron
homeostasis. The primary cause of HH is often the insufficient production of hepcidin by
hepatocytes, despite the high amounts of iron present in the body (Silva and Faustino,
2015). This leads to hyperabsorption of dietary iron, which is delivered to plasma
resulting in increased Tf saturation and tissue iron accumulation (Pietrangelo, 2010). If
phlebotomy, the most common treatment for HH, is not applied, iron can cause injury
and organ dysfunction. The liver, in particular, accumulates large amounts of iron.
Excess free iron is a potent deleterious hepatotoxic as well as a potential pro-fibrogenetic
cofactor, since it is capable of generating ROS (Parola and Robino, 2001). In liver
fibrosis, Kupffer cells (resident liver macrophages) give stimuli for the progression of the
fibrogenetic process. Hepatic stellate cells (HSC) become “activated” and synthesize
most of the extracellular matrix (ECM) proteins (Poli and Parola, 1997). The process is
also accompanied by increased release of cytokines, such as IL-1 and IL-6 (Barbero-
Becerra et al., 2015). The ECM components include collagen, mostly in the form of
collagen-1, matrix metalloproteinases (MMPs) and tissue inhibitors of
metalloproteinases (TIMPs) (Barbero-Becerra et al., 2015). TIMP1 is considered an
important promoter of liver fibrosis (Fowell et al., 2011) and an inhibitor of activated HSC-
apoptosis (Murphy et al., 2002). Fibrosis, the accumulation of extracellular matrix or scar
tissue, represents a wound healing response to injury and ultimately can evolve to
cirrhosis. Patients with cirrhosis, in turn, have increased risk of developing hepatocellular
carcinoma. Other common clinical manifestations of HH are hypogonadism,
cardiomyopathy, arthropathy and diabetes (Ganz and Nemeth, 2012; Pietrangelo, 2010).
According to the clinical outcomes and the genes affected in the disease, HH can be
divided into HFE-related HH, juvenile hemochromatosis, TfR2-associated
hemochromatosis and ferroportin-related HH. The molecular mechanism affected in the
four types is the iron sensing-hepcidin axis (Silva and Faustino, 2015).

12
FCUP
NRF2 protection against liver injury in human and mouse models of HH
2.1.1. HFE-related HH
HFE-HH, also known as classic HH or HH-type I (Silva and Faustino, 2015), is the most
common genetic disorder in populations of northern European ancestry, with a
prevalence of 0.5% (Yun and Vincelette, 2015). This mildest form of HH is characterized
by a gradual deposition of iron in organs with major clinical manifestation in males aged
40-50 years old and in post-menopausal women (Pietrangelo, 2010). Women are less
frequently and less severely affected than men, probably because of menstruation
(Pietrangelo, 2010), which allows the excretion of iron. HFE-HH is an autosomal
recessive disease that is most frequently associated with the HFE C282Y mutation in
homozigosity or, more rarely, in heterozigosity with the H63D gene mutation. (Yun and
Vincelette, 2015). The H63D mutation results in the substitution of aspartic acid for
histidine at amino acid 63 of the HFE gene. This mutation only causes HH if combined
with the C282Y mutation (Ayonrinde et al., 2008). The C282Y mutation in HFE, a
missense mutation, disrupts a disulfide bond that is essential for the β2-microglobulin
binding. Thus, HFE is not carried to the cell surface and does not interact with TfR1,
deregulating hepcidin expression (Pietrangelo, 2010). The majority of genetically
affected individuals are identified because of laboratory abnormalities or family history
rather than overt disease (Ganz and Nemeth, 2012), since only a small percentage of
C282Y homozygotes develop HH symptoms (Pietrangelo, 2010; Wood et al., 2012). The
incomplete penetrance of the disease suggests the existence of modifiers of clinical
expression, which remain mostly unidentified. While alcohol abuse and male gender are
known to favor clinical expression, genetic polymorphisms in genes associated with
fibrogenesis, antioxidant activity and inflammation are also suspected to have a
significant contribution (Bahram et al., 1999; Pietrangelo, 2010; Wood et al., 2012).
2.1.2. Non-HFE hereditary hemochromatosis
The remaining forms of HH are clinically more severe than HFE-HH. Juvenile
Hemochromatosis (JH), also known as HH-type II, is an autosomal recessive disorder
characterized by mutations in the HJV and HAMP genes (Ayonrinde et al., 2008; Roetto
et al., 2003). JH presents an early onset of manifestations of iron overload, including
cardiomyopathies and reproductive defects (Silva and Faustino, 2015), usually by the
second and third decades of life (Ayonrinde et al., 2008).
TfR2-associated hemochromatosis (or HH-type III) is an autosomal recessive
disorder that, as for HFE-HH, manifests from the third or fourth decade of life
(Pietrangelo, 2010). However, HH-type III is characterized by mutations in the TfR2 gene
FCUP
NRF2 protection against liver injury in human and mouse models of HH 13
and patients exhibit even greater variation in the severity of symptoms (Ayonrinde et al.,
2008).
Ferroportin-related HH, also known as HH-type IV, is an autosomal dominant disease.
It is associated with mutations in the FPN gene (Silva and Faustino, 2015) and the age
of clinical onset is in the fourth to fifth decade of life (Pietrangelo, 2005). There are two
forms of the disease: ferroportin loss of function and ferroportin gain of function. In the
first case, mutants are unable to export iron from cells, which leads to cellular iron
overload and low transferrin saturation. On the other hand, in the ferroportin gain of
function form, cells are able to export iron but are insensible to down-regulation by
hepcidin. This results in the constant absorption of iron by enterocytes and its constant
release from cells, resulting in increased Tf saturation and parenchymal iron overload
(Pietrangelo, 2010; Silva and Faustino, 2015).
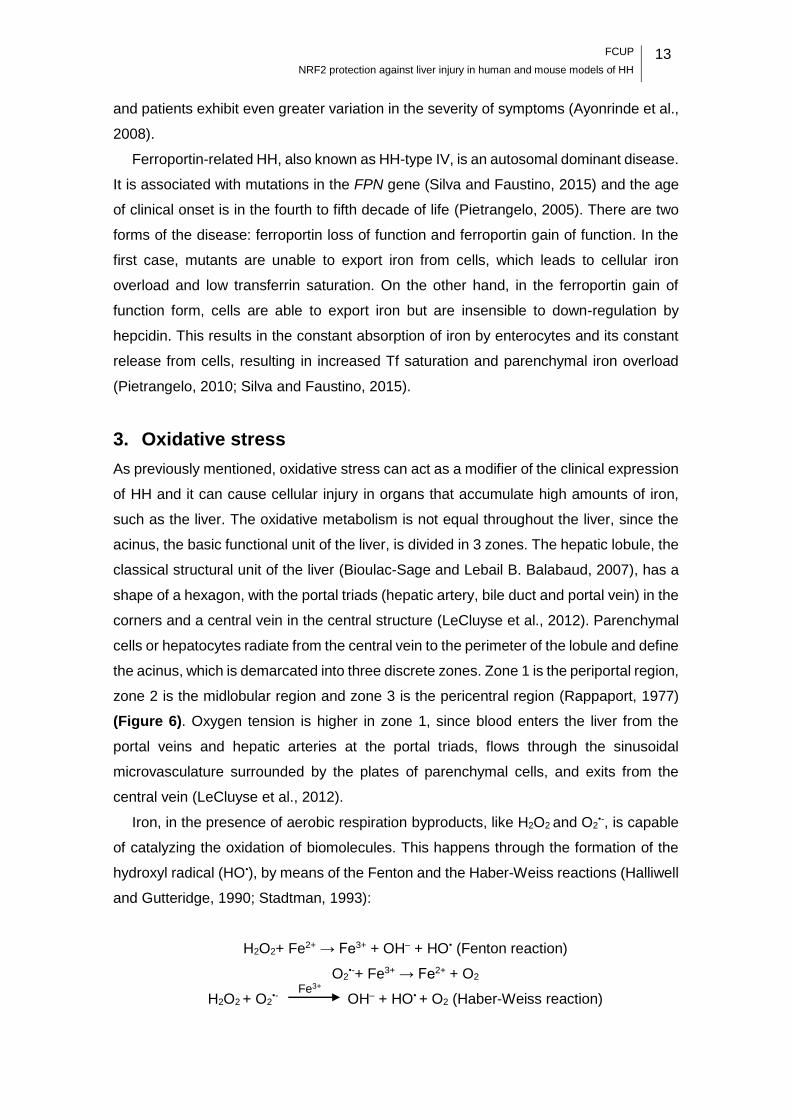
3. Oxidative stress
As previously mentioned, oxidative stress can act as a modifier of the clinical expression
of HH and it can cause cellular injury in organs that accumulate high amounts of iron,
such as the liver. The oxidative metabolism is not equal throughout the liver, since the
acinus, the basic functional unit of the liver, is divided in 3 zones. The hepatic lobule, the
classical structural unit of the liver (Bioulac-Sage and Lebail B. Balabaud, 2007), has a
shape of a hexagon, with the portal triads (hepatic artery, bile duct and portal vein) in the
corners and a central vein in the central structure (LeCluyse et al., 2012). Parenchymal
cells or hepatocytes radiate from the central vein to the perimeter of the lobule and define
the acinus, which is demarcated into three discrete zones. Zone 1 is the periportal region,
zone 2 is the midlobular region and zone 3 is the pericentral region (Rappaport, 1977)
(Figure 6). Oxygen tension is higher in zone 1, since blood enters the liver from the
portal veins and hepatic arteries at the portal triads, flows through the sinusoidal
microvasculature surrounded by the plates of parenchymal cells, and exits from the
central vein (LeCluyse et al., 2012).
Iron, in the presence of aerobic respiration byproducts, like H2O2 and O2•-, is capable
of catalyzing the oxidation of biomolecules. This happens through the formation of the
hydroxyl radical (HO•), by means of the Fenton and the Haber-Weiss reactions (Halliwell
and Gutteridge, 1990; Stadtman, 1993):
H2O2+ Fe2+ → Fe3+ + OH– + HO• (Fenton reaction)
O2•-+ Fe3+ → Fe2+ + O2
H2O2 + O2•- OH– + HO• + O2 (Haber-Weiss reaction)
Fe3+
14
FCUP
NRF2 protection against liver injury in human and mouse models of HH
Figure 6. Structural and functional zonation of the liver. Adapted from (LeCluyse et al., 2012)
When the cellular concentration of ROS exceeds the capacity of the cell to eliminate
them, oxidative damage occurs in DNA, RNA, proteins and lipids (Cabiscol et al., 2000;
Tamarit et al., 1998). Free radicals attack directly polyunsaturated fatty acids in
membranes and initiate lipid peroxidation, which decreases membrane fluidity and leads
to the formation of more radicals and other lipid peroxidation byproducts, such as
malondialdehyde (MDA) (Cabiscol et al., 2000). The modifications caused by ROS are
deleterious to the cell, since they lead to a loss of function of membranes and proteins
and block DNA replication or cause mutations (Cabiscol et al., 2000). Hence, organisms
have developed a set of defense systems to mitigate the damaging effects of ROS
(Tamarit et al., 1998).
3.1. Antioxidant defense
Chemically reactive oxygen has to be scavenged, in order to maintain an intracellular
reducing environment (Cabiscol et al., 2000). Cellular antioxidant system can be divided
into non-enzymatic and enzymatic. Non-enzymatic antioxidants include NADPH and
NADH pools, β-carotene, ascorbic acid, α-tocopherol and glutathione (Cabiscol et al.,
2000). As glutathione only contributes to the antioxidant defense in its reduced form
(GSH), the enzyme glutathione reductase (GR) reduces the oxidized form (GSSG) using
NADPH as a source of reducing power (Cabiscol et al., 2000). GR is constitutively active
and inducible upon oxidative stress, so glutathione exists mostly in its reduced form
(Zitka et al., 2012). The ratio of reduced to oxidized glutathione is a marker of cellular
toxicity. Under normal conditions, GSH is present in mammalian cells in the
concentration range of 1-10 mM. In a resting cell, the molar GSH:GSSG ratio exceeds
100:1, while in various models of oxidative stress, this ratio can decrease to values of
10:1 and even 1:1 (Chai et al., 1994). Several enzymes are capable of scavenging ROS,
including: superoxide dismutase (SOD), catalase (CAT) and glutathione peroxidase
(GPx). SOD, the first genuine ROS-metabolizing enzyme discovered (McCord and
FCUP
NRF2 protection against liver injury in human and mouse models of HH 15
Fridovich, 1969), dismutates superoxide (O2
•-) to hydrogen peroxyde (H2O2) (Nordberg
and Arner, 2001):
2O2•- + 2H+ → H2O2 + O2
CAT, an heme-containing enzyme, catalyses the dismutation of H2O2 formed by SOD
and other enzymes to water and molecular oxygen (Nordberg and Arner, 2001):
2 H2O2 → O2 + 2H2O
GPx is also capable of reducing H2O2, using glutathione as substrate, which liberates
GSSG (Nordberg and Arner, 2001):
2GSH + H2O2 → GSSG + 2H2O
GR is then needed to complete the cycle, reducing GSSG to GSH.
Peroxiredoxins are enzymes capable of directly reducing peroxides, such as
hydrogen peroxide and different alkylhydroperoxides, with the use of electrons provided
by a physiological thiol like thioredoxin (Nordberg and Arner, 2001; Rhee et al., 2005).
Thioredoxin reductase, homologous to GR, catalyzes the reduction of the redox-active
disulfide in Trx (oxidized Trx) by NADPH (Zhong et al., 2000).
3.2. NRF2 pathway
Cells have programs to counteract the stress imposed by oxidants, as mentioned above.
Under normal circumstances, enzymes involved in the antioxidant response are not
expressed at their maximal capacity. However, in response to oxidative stress, the
transcription of these enzymes is enhanced (Kensler et al., 2007). Nuclear factor-
erythroid 2-related factor 2 (NFE2L2/NRF2) is the key transcription factor involved in this
mechanism.
Many of the cytoprotective enzymes that take part in the antioxidant response are
encoded by genes containing antioxidant response elements (ARE). The ARE is a cis-
acting enhancer sequence located in the gene promoter region (Nguyen et al., 2003).
NRF2 is a basic leucine zipper transcription factor that regulates transcriptional induction
of ARE-containing genes in response to changes in the cellular redox status, such as
during increased production of free radical species (Kensler et al., 2007; Lee et al.,
2003). Under normal conditions, NRF2 is mainly localized in the cytoplasm through an
interaction with Kelch ECH associating protein 1 (KEAP1) and the actin cytoskeleton
(Kensler et al., 2007). Despite the fact that NRF2 mRNA is constitutively expressed,
KEAP1 targets NRF2 for polyubiquitination and degradation, resulting in a short protein
half-life and, consequently, in the low basal expression of the cytoprotective enzymes
and proteins in quiescent cells under normal physiological conditions (Kensler et al.,
2007). During exposure to electrophiles or oxidative stress, KEAP1 becomes oxidized at
16
FCUP
NRF2 protection against liver injury in human and mouse models of HH
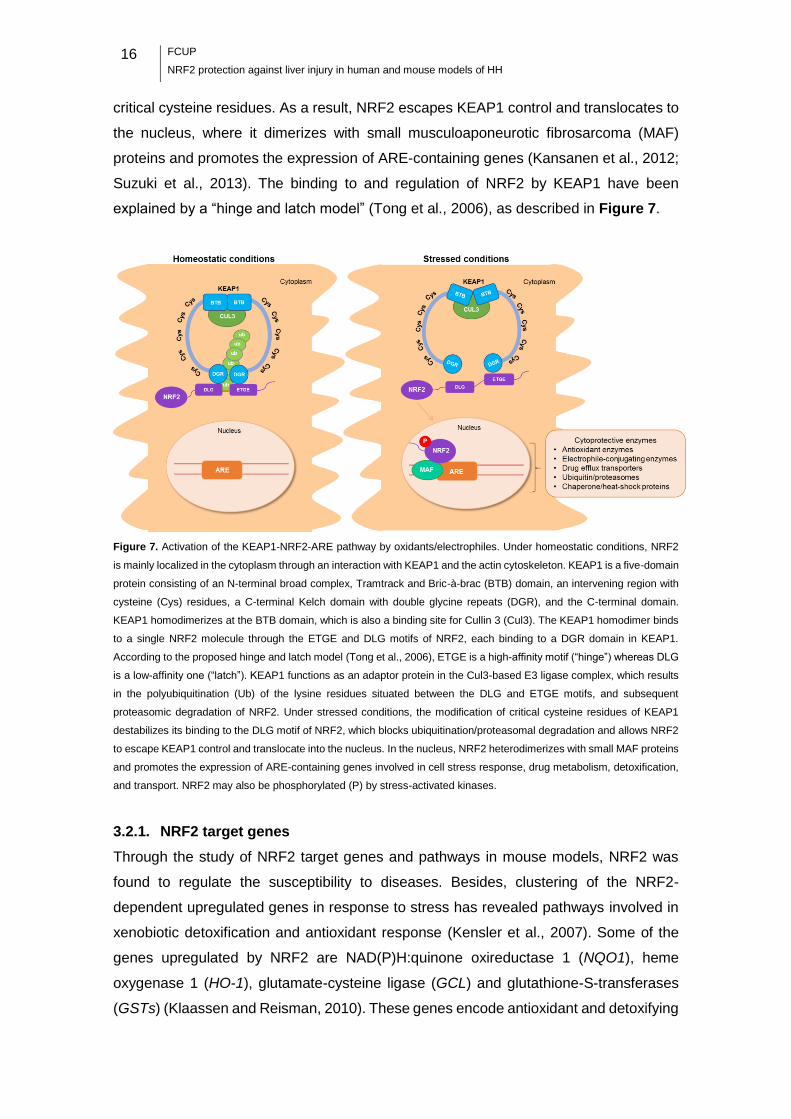
critical cysteine residues. As a result, NRF2 escapes KEAP1 control and translocates to
the nucleus, where it dimerizes with small musculoaponeurotic fibrosarcoma (MAF)
proteins and promotes the expression of ARE-containing genes (Kansanen et al., 2012;
Suzuki et al., 2013). The binding to and regulation of NRF2 by KEAP1 have been
explained by a “hinge and latch model” (Tong et al., 2006), as described in Figure 7.
Figure 7. Activation of the KEAP1-NRF2-ARE pathway by oxidants/electrophiles. Under homeostatic conditions, NRF2
is mainly localized in the cytoplasm through an interaction with KEAP1 and the actin cytoskeleton. KEAP1 is a five-domain
protein consisting of an N-terminal broad complex, Tramtrack and Bric-à-brac (BTB) domain, an intervening region with
cysteine (Cys) residues, a C-terminal Kelch domain with double glycine repeats (DGR), and the C-terminal domain.
KEAP1 homodimerizes at the BTB domain, which is also a binding site for Cullin 3 (Cul3). The KEAP1 homodimer binds
to a single NRF2 molecule through the ETGE and DLG motifs of NRF2, each binding to a DGR domain in KEAP1.
According to the proposed hinge and latch model (Tong et al., 2006), ETGE is a high-affinity motif (“hinge”) whereas DLG
is a low-affinity one (“latch”). KEAP1 functions as an adaptor protein in the Cul3-based E3 ligase complex, which results
in the polyubiquitination (Ub) of the lysine residues situated between the DLG and ETGE motifs, and subsequent
proteasomic degradation of NRF2. Under stressed conditions, the modification of critical cysteine residues of KEAP1
destabilizes its binding to the DLG motif of NRF2, which blocks ubiquitination/proteasomal degradation and allows NRF2
to escape KEAP1 control and translocate into the nucleus. In the nucleus, NRF2 heterodimerizes with small MAF proteins
and promotes the expression of ARE-containing genes involved in cell stress response, drug metabolism, detoxification,
and transport. NRF2 may also be phosphorylated (P) by stress-activated kinases.
3.2.1. NRF2 target genes
Through the study of NRF2 target genes and pathways in mouse models, NRF2 was
found to regulate the susceptibility to diseases. Besides, clustering of the NRF2-
dependent upregulated genes in response to stress has revealed pathways involved in
xenobiotic detoxification and antioxidant response (Kensler et al., 2007). Some of the
genes upregulated by NRF2 are NAD(P)H:quinone oxireductase 1 (NQO1), heme
oxygenase 1 (HO-1), glutamate-cysteine ligase (GCL) and glutathione-S-transferases
(GSTs) (Klaassen and Reisman, 2010). These genes encode antioxidant and detoxifying
FCUP
NRF2 protection against liver injury in human and mouse models of HH 17
enzymes that are involved in ROS scavenging and in xenobiotics detoxification, in order
to diminish cell damage. NRF2 also regulates the expression of transporters involved in
the drug efflux (Klaassen and Reisman, 2010).
3.2.2. NRF2, a key protector against liver iron toxicity
NRF2 was recently shown to protect liver cells against iron toxicity in vitro and in vivo.
Primary hepatocyte cultures from wild-type (WT) mice supplemented with ferric
ammonium citrate (FAC, a source of inorganic iron that mimics NTBI found in the plasma
of HH patients) showed increased levels of NRF2 in the nuclei, which was associated
with the induction of cytoprotective genes (Nqo1, Gclc and Gsta1) in an NRF2-dependent
manner. Moreover, FAC lead to a dose-dependent reduction in the activity of
mitochondrial dehydrogenases in Nrf2-/- but not in WT hepatocytes. Authors suggested
that Nrf2-/- cells are more susceptible to iron-induced oxidative stress than their WT
counterparts, since iron increased 8-hydroxyguanine DNA glycosylase 1-sensitive sites
(a marker of oxidatively damaged DNA) exclusively in Nrf2-/- hepatocytes. Likewise, an
iron-rich diet caused a significant increase in the expression of cytoprotective genes in
mouse liver in an NRF2-dependent manner. In this model of acute iron overload, Nrf2-/-
mice displayed elevated activity of the serum transaminases alanine aminotransferase
(ALT) and aspartate aminotransferase (AST) (enzymes released by injured
hepatocytes), mitochondrial injury and oxidatively damaged DNA. The authors have also
demonstrated that mito-TEMPOL, an antioxidant targeted to the mitochondria, abrogates
the hepatotoxicity of dietary iron towards Nrf2-/- animals (Silva-Gomes et al., 2014).
3.2.3. Nrf2 polymorfisms
The use of Nrf2-/- mouse in model systems has provided insights into the role of NRF2 in
the pathogenesis of various human disorders. Furthermore, studies have revealed
strong associations between NRF2 sequence variations and disease risks. Most of the
phenotype-associated variants are in the promoter region and presumed to be involved
in NRF2 gene regulation (Cho, 2013). For example, the single nucleotide polymorphisms
(SNPs) Rs6721961 (C→A) and Rs35652124 (A→G) were found to reduce the
transcription activity of NRF2 (Cho, 2013), decreasing NRF2-dependent gene
transcription (Shimoyama et al., 2014). These SNPs are also known to be associated
with Parkinson’s disease and chronic obstructive pulmonary disease, among others
(Cho, 2013).
18
FCUP
NRF2 protection against liver injury in human and mouse models of HH
4. Aims
The importance of NRF2 in the protection against hepatic iron toxicity in a model of acute
iron overload (Nrf2-/- mouse fed an iron-rich diet) was recently demonstrated by the host
laboratory (Silva-Gomes et al. 2014). This prompted us to study the effect of Nrf2
suppression in a model of chronic iron overload that mimics human HH, the Hfe-/- mouse.
The group has generated a double knock-out mouse for Hfe and Nrf2 genes and
investigated the potential occurrence of spontaneous liver injury in mice of 6-18 months
of age, when comparing with wild-type and single knock-out animals. Previous results
from the group revealed that, in the absence of NRF2, the mild hepatic iron overload
observed in Hfe-/- mouse associated with increased necroinflammation, macrophage iron
deposits and fibrosis along with ageing. This suggested that the pathology is age-
dependent, which is compatible with the late onset of HH. The main aim of this work is
to determine whether NRF2 acts as a modifier of the clinical expression of HH.
By studying 24 months old Hfe/Nrf2-/- mice, we expect to determine if the lack of
functional NRF2 signaling prompts the mouse model of HH to develop
spontaneous fibrosis in aged individuals.
We also expect to identify polymorphisms/genotypes in the human NRF2 gene
promoter that may influence disease penetrance in C282Y+/+ patients.
This could increase current understanding of the role of NRF2 in the protection against
hepatic iron toxicity, and help determine the risk of an HH patient developing iron
overload-related liver disease.
FCUP
NRF2 protection against liver injury in human and mouse models of HH 19
Material and Methods
1. Animal study
1.1. Animals
Female wild-type (WT) (n=6), Nrf2-/- (Itoh et al., 1997) (n=8) and Hfe-/- mice (Bahram et
al., 1999) (n=6) on a C57BL/6J background, and Nrf2/Hfe-/- mice generated by the group
(n=7) were housed and bred at the ’Instituto de Biologia Molecular e Celular’ animal
facility until the age of 24 months. Mice were fed standard rodent chow (Mucedola
4RF21-GLP containing 480 mg/kg iron) ad libitum and were overnight fasted before
sacrifice. Animals were anesthetized with isofluorane (B. Braun, Portugal) and blood was
collected by retro-orbital bleeding. After performing cervical dislocation, mice were
dissected for organ collection: tail, liver, spleen, pancreas and kidneys. Tissues were
snap-frozen in liquid nitrogen and stored at -80 °C for subsequent RNA extraction and
quantification of non-heme iron. Body, spleen and liver weight were determined.
The entire experiment was carried out in compliance with the recommendations of the
European Convention for the Protection of Vertebrate Animals used for Experimental
and Other Scientific Purposes (ETS 123) and 86/609/EEC Directive and Portuguese
rules (DL 129/92). The animal experimental protocol was approved by ’Direçao Geral de
Alimentação Veterinaria‘ and by the Institute’s ethical committee. All researchers
involved in animal processing attended a FELASA B course and the work was overseen
by a researcher with FELASA C accreditation.
1.2. Hematological measurements
Blood was diluted 1:1 with 1,5% (v/v) K3-ethylenediamine tetraacetic acid (K3EDTA).
Hemoglobin, red blood cell counts, hematocrit, mean corpuscular volume, mean
corpuscular hemoglobin and the percentage of reticulocytes were assessed on a
Coulter-S counter (Coulter Electronics, Fullerton, CA) , at a certified laboratory (Corelab,
’Centro Hospitalar do Porto’, CHP, Portugal).
1.3. Serum analysis
Blood was allowed to sit for 30 min at room temperature (RT) and centrifuged at 10 000
×g, for 10 min for serum collection. Alanine aminotransferase (ALT) activity, glucose,
triglycerides and iron concentration, and the total iron-binding capacity (TIBC) were
assessed on a Cobas C8000 analyzer (Roche Diagnostics, Mannheim, Germany) at the
CHP Corelab. Transferrin saturation was calculated by dividing serum iron concentration
20
FCUP
NRF2 protection against liver injury in human and mouse models of HH
by TIBC. Serum insulin and erythropoietin (EPO) concentrations were measured using
a mouse enzyme-linked immunosorbent assay (ELISA) kit (Mercodia, Sweden) and a
commercially available rodent Quantikine Epo Immunoassay Kit (R&D Systems, USA),
respectively. The lactate dehydrogenase activity in the serum was determined using a
LDH colorimetric assay kit (Sigma-Aldrich, Germany) according to the manufacturer's
protocol. The serum levels of a panel of cytokines/chemokines (GM-CSF, IFNγ, IL-1B,
IL-6, IL-10, MCP-1 and TNFα) were determined with a multi-analyte detection system
(Milliplex Map Kit – Mouse Cytokine/Chemokine Magnetic Bead Panel, Millipore,
Germany), according to the manufacturer’s instructions. Detection was performed with
the xPonent software in the Luminex 200 (Luminex Corporation, USA), and data were
analyzed through the MILLIPLEX Analyst software.
1.4. RNA extraction and cDNA synthesis
To isolate the total RNA from liver, spleen and kidneys, 1 mL of TRI Reagent® (Sigma-
Aldrich, Germany) was added to 50-100 mg of tissue. Samples were homogenized and
left at RT for 5 min. Samples were then centrifuged at 12 000 ×g for 10 min at 4°C and
the cleared supernatant was transferred to a new tube. After an incubation of 5 min at
RT, 200 μL of chloroform were added to the supernatant. The tubes were vigorously
shaken by hand for 15 s, incubated at RT for 2-3 min and centrifuged at 12 000 ×g for
15 min at 4°C. The aqueous phase was transferred to a new tube and 500 μL of 100%
(v/v) isopropanol were added. Tubes were homogenized by inversion and incubated at
RT for 10 min. After a centrifugation at 12 000 ×g for 10 min at 4ºC, the supernatant was
removed. The pellet was washed with 1 mL of 75% (v/v) ethanol and the tubes were
vortexed and centrifuged at 7 500 ×g for 5 min at 4°C. The supernatant was removed
and the pellet was air dried for 5-10 min. The RNA pellet was ressuspended in RNase-
free water (Sigma-Aldrich, Germany) and incubated in a heat block at 55-60ºC for 10-15
min. RNA concentration was measured at 260 nm by a NanoDrop spectrophotometer
(ThermoScientific, USA) and RNA integrity was assessed by capillary electrophoresis in
Experion (Bio-Rad Laboratories, USA).
Extracted RNA was treated with DNase (Turbo DNA-free™ kit, Ambion, Life
Technologies, USA), in order to remove contaminating genomic DNA. To a final quantity
of 4 μg of RNA, 2.5 μL of 10× TURBO DNase Buffer and 1 μL of TURBO DNase were
added. RNase free water was added up to a final volume of 25 μL. Samples were
incubated at 37°C for 30 min and 2.5 μL of DNase Inactivation Reagent were added.
After an incubation of 2 min at RT, samples were centrifuged at 10 000 ×g for 1.5 min
and the RNA was transferred to a new tube.

FCUP
NRF2 protection against liver injury in human and mouse models of HH 21
First-strand cDNA was synthesized with the ThermoScript RT-PCR system
(Invitrogen, Life Technologies, USA). 1 μL of Primer Oligo (dT) and 2 μL of dNTP mix
were added to 9 μL of DNAse treated RNA. Samples were incubated at 65°C for 5 min
and were posteriorly placed on ice. 4 μL of 5× cDNA Synthesis Buffer, 1 μL of
dithiothreitol (DTT) 0,1 M, 1 μL of RNaseOUT, 1 μL of diethylpyrocarbonate (DEPC)-
treated water and 1 μL of ThermoScript RT were added. Samples were incubated at
55°C for 60 min and then at 85°C for 5 min. 1 μL of RNase H was added and samples
were incubated at 37°C for 20 min. Samples were diluted (1:2) with DEPC-treated water.
1.5. Real-time reverse-transcription (RT)-PCR
The relative transcription levels of selected genes in a target cDNA sample were
determined by real-time polymerase chain reaction (qPCR) with the primers (STABvida,
Portugal) listed in Table 1. PCR reactions were performed in duplicate and in a total
volume of 20 μl. To each reaction, 10 μL of iQ SYBR Green Supermix (Bio-Rad
Laboratories, USA), 0.08 μL of each primer from a stock solution at 50 μM, 8.84 μL of
RNase free water and 1 μL of cDNA were added. PCR was performed in the iQ5 Real-
Time PCR system (Bio-Rad) with the following amplification conditions: denaturation at
95°C for 4 min and 40 cycles of 94°C for 30 s, annealing at 59-61°C for 45 s, and
extension at 72°C for 30 s. A standard curve, based on a serial dilution (1, 1:10 and
1:100) of a previously prepared liver cDNA pool, was performed for each gene. The
quantity of each transcript was estimated against the respective standard curve and
normalized against the quantity of the endogenous control gene hypoxanthine
phosphoribosyltransferase (Hprt). The specificity of the PCR reaction and the absence
of primer dimers were confirmed by melting curve analysis.
1.6. Quantification of non-heme iron
Non-heme iron in liver, spleen and kidney tissues stored at -80°C was measured by the
bathophenanthroline method (Torrence and Bothwell, 1980). Tissue samples weighting
approximately 100 mg were dried in a microwave oven (MDS 2000, CEM), in iron-free
Teflon vessels (ACV-Advanced Composite Vessel; CEM, Mathews, NC). After
determining dry tissue weights, samples were digested in 1 mL of acidic mixture [0.1
g/mL hydrochloric acid and 822 μL/mL trichloroacetic acid 37% (v/v)] for 20 h at 65°C.
1mL of chromogen reagent [5 volumes of deionized water, 5 volumes of saturated
sodium acetate and 1 volume of 0.1% (w/v) bathophenanthroline sulfonate and 1% (v/v)
thioglycolic acid] and 275 or 250 μL of deonised water were added to 25 (liver) or 50 μL
(spleen and kidney) of the supernatant obtained in the digestion reaction. The standard
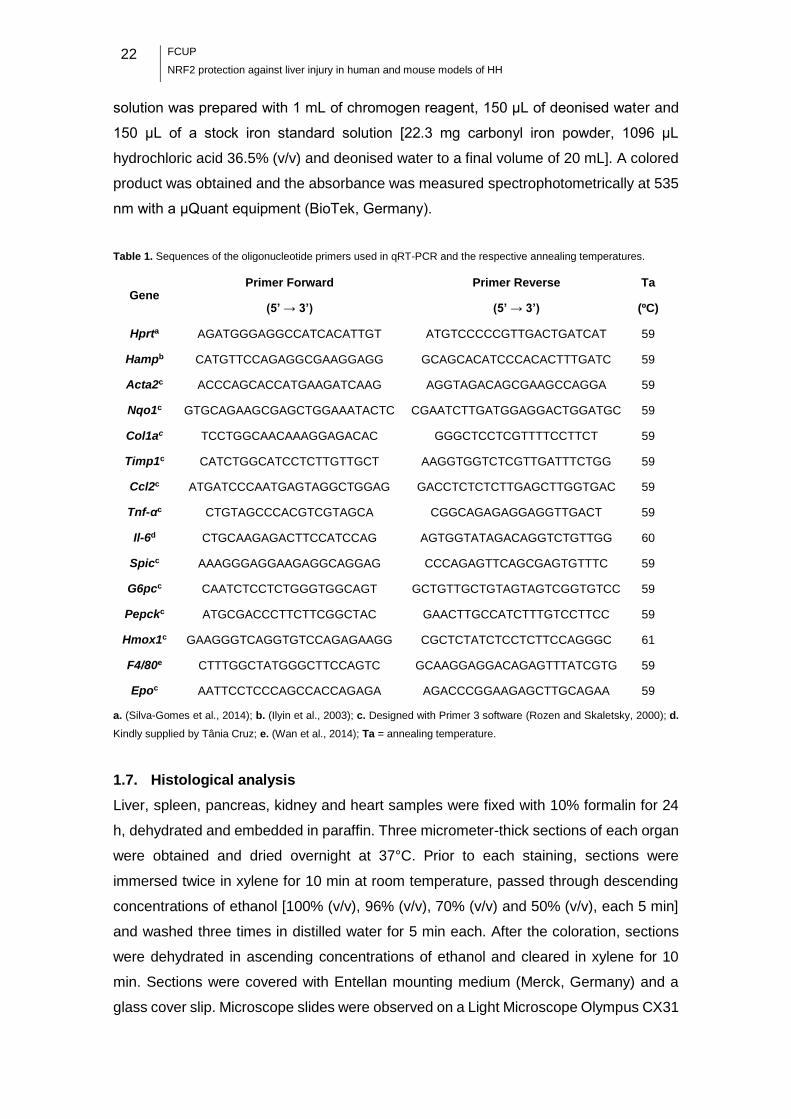
22
FCUP
NRF2 protection against liver injury in human and mouse models of HH
solution was prepared with 1 mL of chromogen reagent, 150 μL of deonised water and
150 μL of a stock iron standard solution [22.3 mg carbonyl iron powder, 1096 μL
hydrochloric acid 36.5% (v/v) and deonised water to a final volume of 20 mL]. A colored
product was obtained and the absorbance was measured spectrophotometrically at 535
nm with a μQuant equipment (BioTek, Germany).
Table 1. Sequences of the oligonucleotide primers used in qRT-PCR and the respective annealing temperatures.
Gene Primer Forward
(5’ → 3’)
Primer Reverse
(5’ → 3’)
Ta
(ºC)
Hprta AGATGGGAGGCCATCACATTGT ATGTCCCCCGTTGACTGATCAT 59
Hampb CATGTTCCAGAGGCGAAGGAGG GCAGCACATCCCACACTTTGATC 59
Acta2c ACCCAGCACCATGAAGATCAAG AGGTAGACAGCGAAGCCAGGA 59
Nqo1c GTGCAGAAGCGAGCTGGAAATACTC CGAATCTTGATGGAGGACTGGATGC 59
Col1ac TCCTGGCAACAAAGGAGACAC GGGCTCCTCGTTTTCCTTCT 59
Timp1c CATCTGGCATCCTCTTGTTGCT AAGGTGGTCTCGTTGATTTCTGG 59
Ccl2c ATGATCCCAATGAGTAGGCTGGAG GACCTCTCTCTTGAGCTTGGTGAC 59
Tnf-αc CTGTAGCCCACGTCGTAGCA CGGCAGAGAGGAGGTTGACT 59
Il-6d CTGCAAGAGACTTCCATCCAG AGTGGTATAGACAGGTCTGTTGG 60
Spicc AAAGGGAGGAAGAGGCAGGAG CCCAGAGTTCAGCGAGTGTTTC 59
G6pcc CAATCTCCTCTGGGTGGCAGT GCTGTTGCTGTAGTAGTCGGTGTCC 59
Pepckc ATGCGACCCTTCTTCGGCTAC GAACTTGCCATCTTTGTCCTTCC 59
Hmox1c GAAGGGTCAGGTGTCCAGAGAAGG CGCTCTATCTCCTCTTCCAGGGC 61
F4/80e CTTTGGCTATGGGCTTCCAGTC GCAAGGAGGACAGAGTTTATCGTG 59
Epoc AATTCCTCCCAGCCACCAGAGA AGACCCGGAAGAGCTTGCAGAA 59
a. (Silva-Gomes et al., 2014); b. (Ilyin et al., 2003); c. Designed with Primer 3 software (Rozen and Skaletsky, 2000); d.
Kindly supplied by Tânia Cruz; e. (Wan et al., 2014); Ta = annealing temperature.
1.7. Histological analysis
Liver, spleen, pancreas, kidney and heart samples were fixed with 10% formalin for 24
h, dehydrated and embedded in paraffin. Three micrometer-thick sections of each organ
were obtained and dried overnight at 37°C. Prior to each staining, sections were
immersed twice in xylene for 10 min at room temperature, passed through descending
concentrations of ethanol [100% (v/v), 96% (v/v), 70% (v/v) and 50% (v/v), each 5 min]
and washed three times in distilled water for 5 min each. After the coloration, sections
were dehydrated in ascending concentrations of ethanol and cleared in xylene for 10
min. Sections were covered with Entellan mounting medium (Merck, Germany) and a
glass cover slip. Microscope slides were observed on a Light Microscope Olympus CX31

FCUP
NRF2 protection against liver injury in human and mouse models of HH 23
and photos were captured with a DP-25 Camera (Imaging Software Cell^B). All slides
were examined by the same observer, in a blind manner (i.e. with no previous knowledge
of the animals' genotypes).
1.7.1. Hematoxylin and eosin staining
Standard hematoxylin and eosin staining (H&E) was applied to all tissues to make a
histopathological assessment of the preparations. Hydrated sections were immersed in
Gill’s Hematoxylin (Merck, Germany), rinsed in tap water and immersed in eosin (Merck,
Germany) for 5 min each. Finally, sections were rinsed in tap water for 30 s. Liver
sections were graded according to steatosis, inflammation and necrosis. Steatosis was
graded as absent (<5%), light (5%–33%), moderate (>33%–66%), or severe (>66%)
according to the amount of parenchyma affected. The assessment of steatosis grading
was made at low magnification (4× and 10× objectives) and it considered only the portion
of the liver section occupied by the hepatocytes (ignoring large bands of fibrosis, portal
areas, vein profiles, etc.). The zonal distribution of steatosis was categorized into four
patterns: zone 3 predominant, zone 1 predominant, pan-acinar or azonal (Chalasani et
al., 2008). Lobular inflammation was divided into four categories, according to the
number of visible foci at 10× objective: no foci, <4 foci, 4-8 foci, >8 per 100× field (Kleiner
et al., 2005). Necrosis was graded as absent, spotty necrosis (one or a few necrotic
hepatocytes), confluent necrosis and bridging necrosis.
1.7.2. Sirius red staining
Sirius red staining was applied to the liver sections, in order to evaluate the fibrotic area.
Nuclei were stained with Mayer’s hematoxylin (Sigma-Aldrich, Germany) for 8 min and
sections were washed under running tap water for 5 min. Sections were then stained
with a 0.1% (v/v) solution of Sirius red F3BA [Direct Red 80 (Sigma-Aldrich, Germany)
in saturated aqueous solution of picric acid] for one hour at RT and rinsed two times in a
0.5% (v/v) HCl solution.
Fibrosis was graded as none (0), mild/moderate in zone 3, portal/periportal only (1),
portal/periportal and perisinusoidal (2) bridging fibrosis (3) and cirrhosis (4) (Kleiner et
al., 2005). The fibrotic area was then evaluated with a light microscope fitted with a
polarisation filter, which renders the staining specific for type I collagen. Three random
microscope fields of the liver, excluding regions of the capsule and the large portal tracts,
were captured at 100× magnification and saved as .TIF files. Images were then analyzed
using ImageJ software. Red Green Blue (RGB) stack type was selected and upper and
24
FCUP
NRF2 protection against liver injury in human and mouse models of HH
lower thresholds were defined to avoid pixel saturation. These remained unaltered during
the measurement of the percentage of fibrotic area in a whole batch of images.
1.7.3. Perls’ Prussian Blue staining
The presence of iron deposits in the different organs was assessed by Perls’ Prussian
Blue staining. Sections were stained with Perls solution [equal parts of 2% (w/v)
potassium ferrocyanide and 2% (v/v) hydrochloric acid 37% (v/v)] for 30 min and washed
in several changes of distilled water for 5 min. The sections were counterstained with
Neutral Red [1 g Neutral Red (Sigma-Aldrich, Germany), 100 mL distilled water and 1
mL glacial acetic acid] for 1 min and rinsed in distilled water. Siderosis was graded
according to the size of iron deposits, as well as their cellular and lobular location.
Grading consisted in three scores: hepatocytic (ranging 0-36), sinusoidal (ranging 0-12)
and portal (ranging 0-12). Hepatocytic iron was graded as 0 (absence of iron), 3 (faint
staining), 6 (nonconfluent granules), 9 (confluent deposits) or 12 (large masses)
according to granules size in each Rappaport area. Sinusoidal iron was graded as 0
(absence of iron), 1 (faint staining), 2 (small granules), 3 (large deposits) or 4 (clusters
of overload cells) according to granules size in each Rappaport area. Portal iron was
graded as 0 (absence of iron), 1 (deposits in < 1/3 of the portal tracts), 2 (deposits in 1/3
of the portal tracts), 3 (deposits in 2/3 of the portal tracts) or 4 (deposits in all portal tracts)
according to the percentage of iron overloaded macrophages, biliary cells and vascular
walls (Deugnier et al., 1993).
1.7.4. TUNEL assay
DNA fragmentation resulting from apoptotic cell death was determined by Terminal
deoxynucleotidyl transferase (TdT) dUTP Nick-End Labeling (TUNEL) assay. Following
dehydration, liver sections were washed in phosphate buffered saline (PBS) for 5 min.
Sections were then incubated with proteinase K (20 μg/mL) in Tris-HCl 10mM for 20 min
at 37ºC and for 10 min at RT and washed 2 times in PBS 1×. Microscope slides were
incubated with the TUNEL reagents (50 μL Enzyme Solution and 450 μL Label solution)
of the In Situ Death Detection Kit, Fluorescein (Roche Diagnostics, Germany) for 1 h at
37ºC. Sections were then washed 3 times in PBS 1×. Finally, sections were incubated
with 0,2 μg/mL 4',6-diamidino-2-phenylindole (DAPI) in the dark for 15 min at RT. The
microscope slides were mounted with Vectacshield (Vector Laboratories, USA) and
sealed with nail polish. Ten random microscope fields of each liver were obtained with a
40× objective and the number of TUNEL-positive cells was counted. As a positive
control, liver sections were treated with DNase.

FCUP
NRF2 protection against liver injury in human and mouse models of HH 25
1.8. Evaluation of oxidative stress
To evaluate oxidative stress parameters in the liver, a small portion of this organ was
homogenized in a homogenizing solution [0.85 g KH2PO4 25 mM, 2.67 g Na2HPO4.2H2O
30 mM, 0.25 mL Triton X-100 0,1% (v/v) to a final volume of 250 mL, pH 7,0] in the
proportion of 2 mL of solution per gram of fresh weight. Total protein was quantified with
the DCTM Protein Assay (Bio-Rad, USA) as per the manufacturer’s instructions and the
homogenate was used for the following assays.
1.8.1. Thiobarbituric Acid Reactive Substances (TBARS) assay
100 μL of the homogenate were diluted with 200 μL of 10% (v/v) trichloroacetic acid
(TCA). The dilution was vortexed and centrifuged at 6 000 rpm for 1 min at 4ºC. 200 μL
of the diluted homogenate were incubated with 200 μL of 1% (w/v) thiobarbituric acid in
a water bath at 95ºC for 40 min. After cooling down, the absorbance at 535 nm was
measured in a spectrophotometer. The malondialdehyde (MDA) standard curve was
calculated against previously determined values (Professor Maria João Martins,
personal communication).
1.8.2. Quantification of the GSH/GSSG ratio
The homogenate obtained in 1.8. was centrifuged at 13 000 rpm for 10 min at 4ºC. The
supernatant was diluted with an equal part of 10% (v/v) perchloric acid (PCA) and
centrifuged at 13 000 rpm for 2 min at 4ºC. 20 μL of the supernatant were utilized to
quantify the total glutathione (GSX) and 200 μL to quantify the oxidized form (GSSG).
The reduced form (GSH) was calculated as follows:
GSH = GSX – 2 × GSSG
1.8.2.1. Quantification of the total gluthatione
20 μL of the supernatant obtained in 1.8.2. were diluted 10 times with 5% (v/v) PCA in
phosphate solution (10.2 g of Na2HPO4.2H2O 57.3 mM, 11.2 g of NaH2PO4.H2O 81.2
mM and 0.23 g dissodic EDTA 0.62 mM to a final volume of 1 L, pH 7,5). 200 μL of
KHCO3 0.076 M were added and the tubes were vortexed and centrifuged at 13 000 rpm
for 1 min at 4ºC. 100 μL of the supernatant were transferred into a 96-well plate in
triplicate and 65 μL of the reagent solution (3.42 mg of NADPH 3.36 mM, 4.68 mg of
DTNB 20 mM to a final volume of 3 mL in phosphate solution) were added. The plate
was incubated for 15 min at 30ºC, protected from light. 40 μL of the glutathione reductase
solution (10 units per mL of phosphate solution) were added and the absorbance at 405
nm was measured for 3 min. The trendline equation was defined.
26
FCUP
NRF2 protection against liver injury in human and mouse models of HH
1.8.2.2. Quantification of GSSG
200 μL of the supernatant obtained in 1.8.2. were incubated with 10 μL of 2-vinylpyridine
for 1 h at 4ºC with agitation. After adding 200 μL of 0.076 M KHCO3, samples were
vortexed and centrifuged at 13 000 rpm for 1 min at 4ºC. 100 μL of the supernatant were
added into a 96-well plate and 65 μL of the reagent solution were added. The plate was
incubated for 15 min at 30ºC, protected from light. 40 μL of the glutathione reductase
solution were added and the absorbance at 405 nm was measured for 3 min. The
trendline equation was defined.
1.9. Hydroxyproline Assay
Liver tissue (10 mg) was homogenized in 100 μL of distilled water. Protein quantification
was performed with the DCTM Protein Assay Kit (Bio-Rad, USA). The quantity of
hydroxyproline was determined with the Hydroxyproline Assay Kit (Sigma-Aldrich,
Germany) following the manufacturer’s instructions.
2. Human study
2.1. Patients
The human study was performed with stored DNA samples from Hereditary
Hemochromatosis (HH) patients who had been referred to the CGPP laboratory Biobank
for diagnosis. Samples were selected by the following criteria: 1) confirmed
homozygosity for the HFE C282Y mutation; 2) a written informed consent from the
patients allowing the use of their DNA samples for research purposes; 3) available stored
DNA in good quality and sufficient quantity for the purpose of the study. From the 106
samples fulfilling these criteria, 67 were from patients referred from the HH clinics at the
Hematology Service, Centro Hospitalar do Porto (CHP), and regularly followed up by Dr.
Graça Porto, the clinician in charge at the HH clinic, and co-supervisor of this project.
The availability of complete clinical information from this group of patients allowed us to
use it for the clinical correlations study, after excluding putative confounding variables
(see below in statistical analysis). The remaining 39 DNA samples were from patients
referred for diagnosis by other external services and no complete clinical information was
available, reason why they were not included in the clinical correlations study. Retrieved
clinical data were anonymized and confidentiality was maintained during the whole
analytical process according to Helsinki Declaration and Portuguese Law. The study
received ethical approval by the CHP Ethics committee.
The general characteristics and the clinical manifestations of the 67 patients selected
for the clinical correlation study are presented in Table 2.
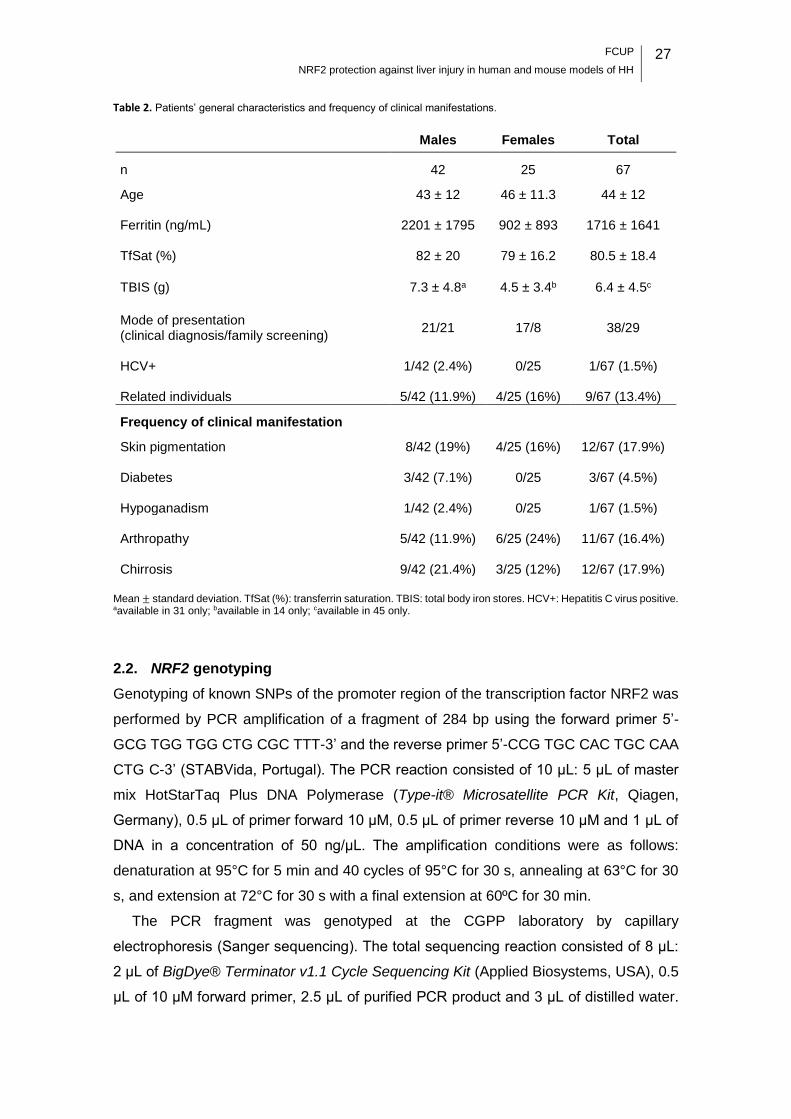
FCUP
NRF2 protection against liver injury in human and mouse models of HH 27
Table 2. Patients’ general characteristics and frequency of clinical manifestations.
Males Females Total
n 42 25 67
Age 43 ± 12 46 ± 11.3 44 ± 12 Ferritin (ng/mL) 2201 ± 1795 902 ± 893 1716 ± 1641 TfSat (%) 82 ± 20 79 ± 16.2 80.5 ± 18.4
TBIS (g) 7.3 ± 4.8a 4.5 ± 3.4b 6.4 ± 4.5c
Mode of presentation 21/21 17/8 38/29
(clinical diagnosis/family screening) HCV+ 1/42 (2.4%) 0/25 1/67 (1.5%) Related individuals 5/42 (11.9%) 4/25 (16%) 9/67 (13.4%)
Frequency of clinical manifestation
Skin pigmentation 8/42 (19%) 4/25 (16%) 12/67 (17.9%) Diabetes 3/42 (7.1%) 0/25 3/67 (4.5%) Hypoganadism 1/42 (2.4%) 0/25 1/67 (1.5%) Arthropathy 5/42 (11.9%) 6/25 (24%) 11/67 (16.4%) Chirrosis 9/42 (21.4%) 3/25 (12%) 12/67 (17.9%)
Mean ± standard deviation. TfSat (%): transferrin saturation. TBIS: total body iron stores. HCV+: Hepatitis C virus positive. aavailable in 31 only; bavailable in 14 only; cavailable in 45 only.
2.2. NRF2 genotyping
Genotyping of known SNPs of the promoter region of the transcription factor NRF2 was
performed by PCR amplification of a fragment of 284 bp using the forward primer 5’-
GCG TGG TGG CTG CGC TTT-3’ and the reverse primer 5’-CCG TGC CAC TGC CAA
CTG C-3’ (STABVida, Portugal). The PCR reaction consisted of 10 μL: 5 μL of master
mix HotStarTaq Plus DNA Polymerase (Type-it® Microsatellite PCR Kit, Qiagen,
Germany), 0.5 μL of primer forward 10 μM, 0.5 μL of primer reverse 10 μM and 1 μL of
DNA in a concentration of 50 ng/μL. The amplification conditions were as follows:
denaturation at 95°C for 5 min and 40 cycles of 95°C for 30 s, annealing at 63°C for 30
s, and extension at 72°C for 30 s with a final extension at 60ºC for 30 min.
The PCR fragment was genotyped at the CGPP laboratory by capillary
electrophoresis (Sanger sequencing). The total sequencing reaction consisted of 8 μL:
2 μL of BigDye® Terminator v1.1 Cycle Sequencing Kit (Applied Biosystems, USA), 0.5
μL of 10 μM forward primer, 2.5 μL of purified PCR product and 3 μL of distilled water.
28
FCUP
NRF2 protection against liver injury in human and mouse models of HH
The amplification conditions were as follows: denaturation at 95°C for 5 min and 35
cycles of 96°C for 10 s, annealing at 50°C for 5 s, and extension at 60°C for 4 min.
Samples were injected in the ABI 3130xl Genetic Analyzer (Applied Biosystems, USA)
and the final product was precipitated in DyeEx 96 well plates (Qiagen, Germany). After
sequencing the fragment, the Rs35652124, Rs670664, Rs150648896 and Rs6721961
SNPs in the NRF2 promoter region were determined using the ProSeq3 software.
2.3. Datafile collection
For the purpose of statistical analysis, a datafile was created including, besides the
genetic information obtained, the following patients’ clinical information: gender and age
at diagnosis, the systemic iron parameters serum ferritin, transferrin saturation;
hematological parameters including the numbers of CD8+ T lymphocytes; the total body
iron stores (TBIS) and/or hepatic iron concentration (HIC) assessed trough a liver biopsy
or magnetic resonance imaging. The severity of the iron overload was graded according
to the levels of TBIS (or HIC): >2 g (or >300µmol/g of HIC) corresponding to grade 1
(light overload), 2-4 g to grade 2 (moderate) and >4 g to grade 3 (severe). The presence
or absence of the other clinical manifestations, such as skin pigmentation, diabetes,
cirrhosis, hypogonadism and arthropathy was also registered.
3. Statistical analysis
3.1. Animal study
Results are presented as the mean and standard deviation. Unless stated otherwise,
differences among multiple groups were compared by one-way analysis of variance
(ANOVA) with Tukey's multiple comparison test using GraphPad Prism version 6.0 for
Windows (GraphPad Software, California USA). The results were considered statistically
significant when p<0.05.
3.2. Human study
Gene allele or genotype frequencies were estimated in unrelated individuals only (n =
97). For analyses of genotype/phenotype correlations we first selected the 67 patients
regularly followed up at HH clinics at CHP and in whom complete clinical information was
available. Further exclusion criteria included: viral infection, such as hepatitis and human
immunodeficiency virus (HIV), auto-immune disease and alcoholic liver disease (n = 57).
Given the small sample size, group analysis were restricted to some of the most frequent
clinical manifestations of HH, namely cirrhosis, arthropathy, or symptomatic patients,
who presented with clinical evidence of at least one of the following disease
FCUP
NRF2 protection against liver injury in human and mouse models of HH 29
manifestations: skin pigmentation, diabetes, hypogonadism, arthropathy, cirrhosis,
and/or documented severe iron overload (serum ferritin > 2000 and TBIS > 5 g). For the
purpose of analyzing the impact of particular genotypes on the clinical expression,
namely on the frequency of liver cirrhosis, more strict clinical criteria were used. Given
the low probability of clinical expression in asymptomatic, early diagnosed, females or
young males (<30 years of age), these subjects were excluded from analysis. In addition,
patients with severe iron overload but in whom a liver biopsy was not available (and thus
the presence of cirrhosis could not be excluded) were also excluded (n = 36).
Quantitative results are presented as the mean and standard deviation. In order to fit
into a normal distribution, serum ferritin values were logarithmic transformed. Differences
between groups were compared by the Student´s t-test. The Chi-square test was applied
to test the differences in allele and genotype frequencies. Data were analyzed using
GraphPad Prism version 6.0 for Windows (GraphPad Software, California USA) and
statistical significance accepted at p≤0.05.


FCUP
NRF2 protection against liver injury in human and mouse models of HH 31
Results
Animal study
1. Body, liver and spleen weights
The body weight of each animal was determined prior to sacrifice. Nrf2/Hfe-/- mice
presented significantly decreased body weight compared to WT (p<0.05) and Hfe-/-
(p<0.0001) mice (Figure 8.A). Spleen and liver weights were also registered and their
relative weights were calculated by dividing organ weight by body weight. No significant
differences in relative liver and spleen weights were found (Figure 8.B and 8.C).
Bo
dy
we
igh
t (g
)
WT
Nrf
2- /
-
Hfe- /
-
Nrf
2/H
fe- /
-
0
1 0
2 0
3 0
4 0
5 0
p < 0 .0 5
p < 0 .0 0 0 1
Re
lati
ve
liv
er w
eig
ht
(%)
WT
Nrf
2- /
-
Hfe- /
-
Nrf
2/H
fe- /
-
2
3
4
5
6
Re
lati
ve
sp
lee
n w
eig
ht
(%)
WT
Nrf
2- /
-
Hfe- /
-
Nrf
2/H
fe- /
-
0 .0
0 .5
1 .0
1 .5
2 .0
2 .5
Figure 8. (A) Body weight and (B) percentage of relative liver and (C) spleen weights of WT, Nrf2-/-, Hfe-/- and Nrf2/Hfe-/-
mice.
2. Hematological parameters
The number of red blood cells (RBC) was significantly lower in Nrf2/Hfe-/- mice when
compared to WT (p<0.001), Nrf2-/- (p<0.01) and Hfe-/- (p<0.0001) mice. Hemoglobin (Hb)
was also significantly lower in Nrf2/Hfe-/- mice when compared to WT, Nrf2-/- (p<0.05)
and Hfe-/- (p<0.0001) mice. Nrf2/Hfe-/- mice also presented a significantly decreased
hematocrit (HCT) when compared to Nrf2-/- (p<0.05) and Hfe-/- (p<0.0001) mice (Table
3). These data reveal that Nrf2/Hfe-/- mice were mildly anemic. This is in contrast with
A. B.
C.
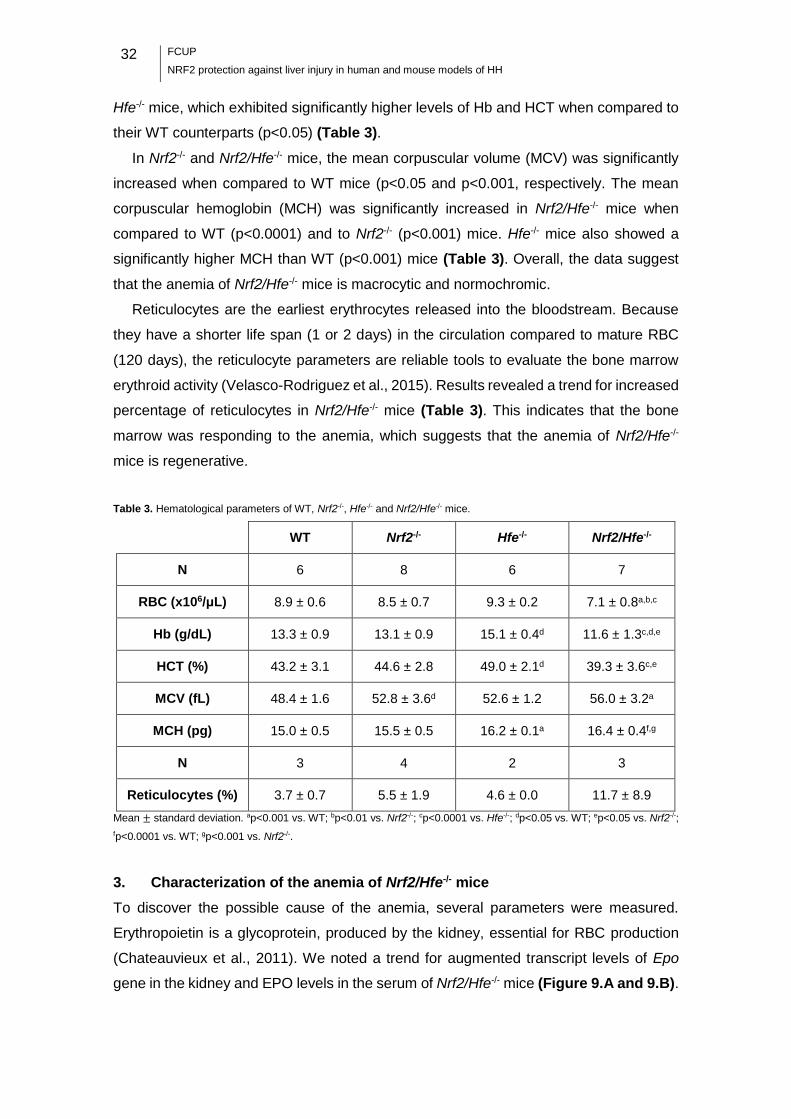
32
FCUP
NRF2 protection against liver injury in human and mouse models of HH
Hfe-/- mice, which exhibited significantly higher levels of Hb and HCT when compared to
their WT counterparts (p<0.05) (Table 3).
In Nrf2-/- and Nrf2/Hfe-/- mice, the mean corpuscular volume (MCV) was significantly
increased when compared to WT mice (p<0.05 and p<0.001, respectively. The mean
corpuscular hemoglobin (MCH) was significantly increased in Nrf2/Hfe-/- mice when
compared to WT (p<0.0001) and to Nrf2-/- (p<0.001) mice. Hfe-/- mice also showed a
significantly higher MCH than WT (p<0.001) mice (Table 3). Overall, the data suggest
that the anemia of Nrf2/Hfe-/- mice is macrocytic and normochromic.
Reticulocytes are the earliest erythrocytes released into the bloodstream. Because
they have a shorter life span (1 or 2 days) in the circulation compared to mature RBC
(120 days), the reticulocyte parameters are reliable tools to evaluate the bone marrow
erythroid activity (Velasco-Rodriguez et al., 2015). Results revealed a trend for increased
percentage of reticulocytes in Nrf2/Hfe-/- mice (Table 3). This indicates that the bone
marrow was responding to the anemia, which suggests that the anemia of Nrf2/Hfe-/-
mice is regenerative.
Table 3. Hematological parameters of WT, Nrf2-/-, Hfe-/- and Nrf2/Hfe-/- mice.
WT Nrf2-/- Hfe-/- Nrf2/Hfe-/-
N 6 8 6 7
RBC (x106/μL) 8.9 ± 0.6 8.5 ± 0.7 9.3 ± 0.2 7.1 ± 0.8a,b,c
Hb (g/dL) 13.3 ± 0.9 13.1 ± 0.9 15.1 ± 0.4d 11.6 ± 1.3c,d,e
HCT (%) 43.2 ± 3.1 44.6 ± 2.8 49.0 ± 2.1d 39.3 ± 3.6c,e
MCV (fL) 48.4 ± 1.6 52.8 ± 3.6d 52.6 ± 1.2 56.0 ± 3.2a
MCH (pg) 15.0 ± 0.5 15.5 ± 0.5 16.2 ± 0.1a 16.4 ± 0.4f,g
N 3 4 2 3
Reticulocytes (%) 3.7 ± 0.7 5.5 ± 1.9 4.6 ± 0.0 11.7 ± 8.9
Mean ± standard deviation. ap<0.001 vs. WT; bp<0.01 vs. Nrf2-/-; cp<0.0001 vs. Hfe-/-; dp<0.05 vs. WT; ep<0.05 vs. Nrf2-/-;
fp<0.0001 vs. WT; gp<0.001 vs. Nrf2-/-.
3. Characterization of the anemia of Nrf2/Hfe-/- mice
To discover the possible cause of the anemia, several parameters were measured.
Erythropoietin is a glycoprotein, produced by the kidney, essential for RBC production
(Chateauvieux et al., 2011). We noted a trend for augmented transcript levels of Epo
gene in the kidney and EPO levels in the serum of Nrf2/Hfe-/- mice (Figure 9.A and 9.B).
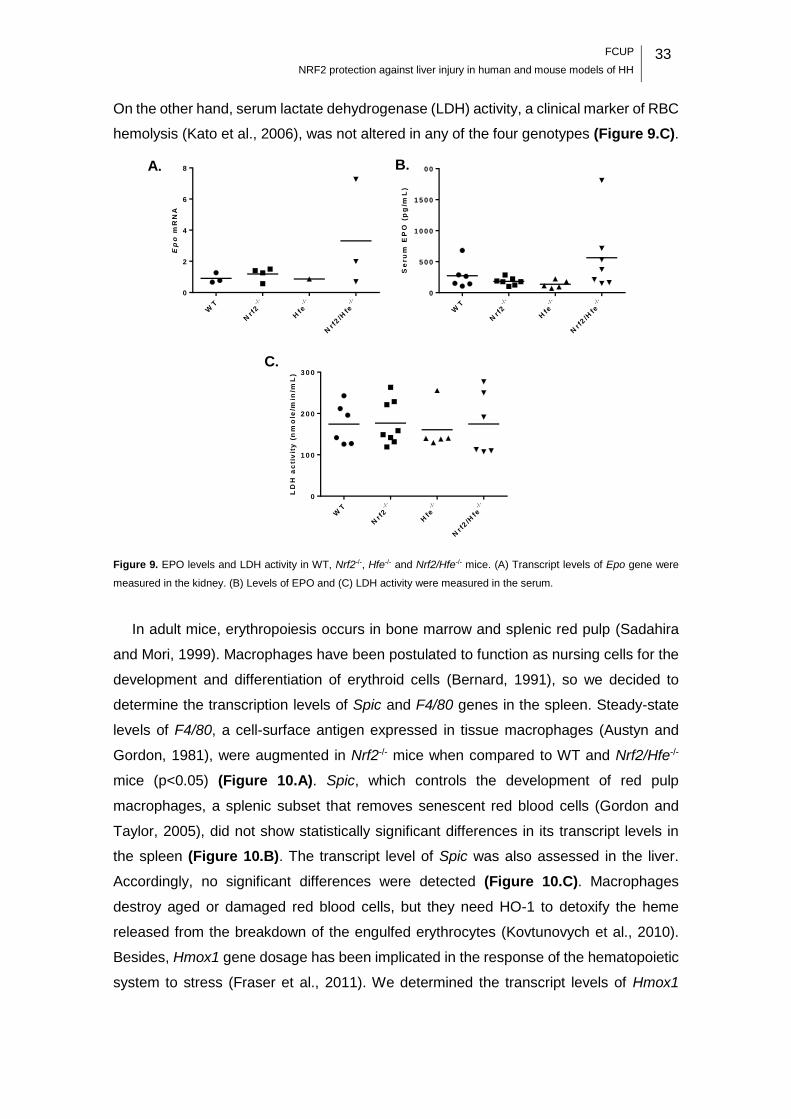
FCUP
NRF2 protection against liver injury in human and mouse models of HH 33
On the other hand, serum lactate dehydrogenase (LDH) activity, a clinical marker of RBC
hemolysis (Kato et al., 2006), was not altered in any of the four genotypes (Figure 9.C).
Ep
o m
RN
A
WT
Nr f
2- /
-
Hfe- /
-
Nrf
2/H
fe- /
-
0
2
4
6
8
Se
ru
m E
PO
(p
g/m
L)
WT
Nr f
2- /
-
Hfe- /
-
Nrf
2/H
fe- /
-
0
5 0 0
1 0 0 0
1 5 0 0
2 0 0 0
LD
H a
cti
vit
y (
nm
ole
/min
/mL
)
WT
Nr f
2- /
-
Hfe- /
-
Nrf
2/H
fe- /
-
0
1 0 0
2 0 0
3 0 0
Figure 9. EPO levels and LDH activity in WT, Nrf2-/-, Hfe-/- and Nrf2/Hfe-/- mice. (A) Transcript levels of Epo gene were
measured in the kidney. (B) Levels of EPO and (C) LDH activity were measured in the serum.
In adult mice, erythropoiesis occurs in bone marrow and splenic red pulp (Sadahira
and Mori, 1999). Macrophages have been postulated to function as nursing cells for the
development and differentiation of erythroid cells (Bernard, 1991), so we decided to
determine the transcription levels of Spic and F4/80 genes in the spleen. Steady-state
levels of F4/80, a cell-surface antigen expressed in tissue macrophages (Austyn and
Gordon, 1981), were augmented in Nrf2-/- mice when compared to WT and Nrf2/Hfe-/-
mice (p<0.05) (Figure 10.A). Spic, which controls the development of red pulp
macrophages, a splenic subset that removes senescent red blood cells (Gordon and
Taylor, 2005), did not show statistically significant differences in its transcript levels in
the spleen (Figure 10.B). The transcript level of Spic was also assessed in the liver.
Accordingly, no significant differences were detected (Figure 10.C). Macrophages
destroy aged or damaged red blood cells, but they need HO-1 to detoxify the heme
released from the breakdown of the engulfed erythrocytes (Kovtunovych et al., 2010).
Besides, Hmox1 gene dosage has been implicated in the response of the hematopoietic
system to stress (Fraser et al., 2011). We determined the transcript levels of Hmox1
A. B.
C.
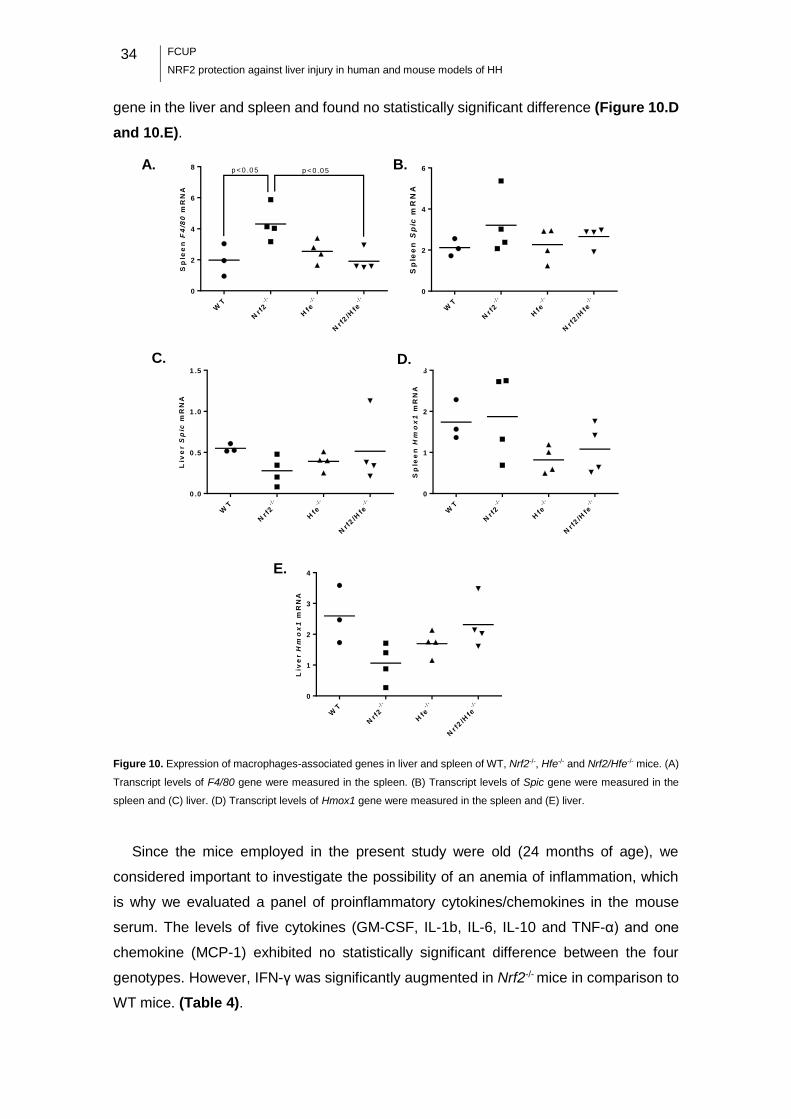
34
FCUP
NRF2 protection against liver injury in human and mouse models of HH
gene in the liver and spleen and found no statistically significant difference (Figure 10.D
and 10.E).
Sp
lee
nF
4/8
0 m
RN
A
WT
Nr f
2- /
-
Hfe- /
-
Nrf
2/H
fe- /
-
0
2
4
6
8p < 0 .0 5p < 0 .0 5
Sp
lee
nS
pic
mR
NA
WT
Nrf
2- /
-
Hfe- /
-
Nrf
2/H
fe- /
-
0
2
4
6
Liv
er
Sp
ic m
RN
A
WT
Nr f
2- /
-
Hfe- /
-
Nrf
2/H
fe- /
-
0 .0
0 .5
1 .0
1 .5
Sp
lee
nH
mo
x1
mR
NA
WT
Nr f
2- /
-
Hfe- /
-
Nrf
2/H
fe- /
-
0
1
2
3
Liv
er
Hm
ox
1m
RN
A
WT
Nr f
2- /
-
Hfe- /
-
Nrf
2/H
fe- /
-
0
1
2
3
4
Figure 10. Expression of macrophages-associated genes in liver and spleen of WT, Nrf2-/-, Hfe-/- and Nrf2/Hfe-/- mice. (A)
Transcript levels of F4/80 gene were measured in the spleen. (B) Transcript levels of Spic gene were measured in the
spleen and (C) liver. (D) Transcript levels of Hmox1 gene were measured in the spleen and (E) liver.
Since the mice employed in the present study were old (24 months of age), we
considered important to investigate the possibility of an anemia of inflammation, which
is why we evaluated a panel of proinflammatory cytokines/chemokines in the mouse
serum. The levels of five cytokines (GM-CSF, IL-1b, IL-6, IL-10 and TNF-α) and one
chemokine (MCP-1) exhibited no statistically significant difference between the four
genotypes. However, IFN-γ was significantly augmented in Nrf2-/- mice in comparison to
WT mice. (Table 4).
A. B.
E.
D. C.

FCUP
NRF2 protection against liver injury in human and mouse models of HH 35
Table 4. Levels of cytokines and chemokines in the serum of WT, Nrf2-/-, Hfe-/- and Nrf2/Hfe-/- mice.
WT Nrf2-/- Hfe-/- Nrf2/Hfe-/-
An
aly
te (
pg
/mL
)
N 6 8 5 7
GM-CSF 0 ± 0 164.0 ± 213.2 142.9 ± 198.6 137.9 ± 263.3
IFN-γ 0 ± 0 154.1 ± 252.4* 78.3 ± 108.1 69.19 ± 109.6
IL-1b 6.0 ± 12.2 429.0 ± 802.0 10.7 ± 12.9 130.7 ± 343.0
IL-6 23.4 ± 27.3 59.3 ± 68.9 15.2 ± 13.0 57.3 ± 55.4
IL-10 0.4 ± 0.6 94.0 ± 164.7 6.6 ± 10.5 25.5 ± 52.4
MCP-1 70.4 ± 46.0 396.5 ± 718.1 41.5 ± 38.9 200.5 ± 465.2
TNFα 4.7 ± 3.5 44.3 ± 86.4 2.6 ± 2.6 25.1 ± 56.7
Mean ± standard deviation. *p=0.0359 vs. WT (non-parametric Kruskal-Wallis test with Dunn’s multiple comparisons test)
4. Serum analysis
Serum analysis revealed that Nrf2/Hfe-/- mice were hypoglycemic, as they presented a
significantly lower quantity of glucose in the serum at starvation compared to Nrf2-/-
(p<0.05) and Hfe-/- (p<0.01) mice. The serum levels of triglycerides were not statistically
different between the four genotypes (Table 5).
Insulin, an anabolic pancreatic hormone, is secreted in response to increased blood
glucose. This hormone signals the cells to increase glucose uptake, promotes
glycogenesis in the liver and inhibits glucagon secretion from the pancreas, thus
signaling the liver to stop producing glucose via glycogenolysis and gluconeogenesis
(Aronoff et al., 2004). The serum levels of insulin were measured to determine if it could
be a possible cause of the hypoglycemia observed in Nrf2/Hfe-/- mice, however there
were no statistically significant differences between the four genotypes (Table 5).
Table 5. Levels of glucose, triglycerides and insulin in the serum of WT, Nrf2-/-, Hfe-/- and Nrf2/Hfe-/- mice.
WT Nrf2-/- Hfe-/- Nrf2/Hfe-/-
N 3 4 4 4
Glucose (mg/dL) 64.3 ± 8.3 75.8 ± 9.2 77.8 ± 16.9 42.8 ± 11.4a,b
Triglycerides (mg/dL) 67.3 ± 6.5 65.5 ± 21.3 66.0 ± 18.9 76.0 ± 11.8
Insulin (μg/mL) 879.2 ± 633.8 560.6 ± 241.7 705.5 ± 217.7 539.3 ± 167.0
Mean ± standard deviation. ap<0.05 vs. Nrf2-/-; bp<0.01 vs. Hfe-/-.

36
FCUP
NRF2 protection against liver injury in human and mouse models of HH
5. Expression of glucogenesis genes
The key gluconeogenic enzymes are phosphoenolpyruvate carboxykinase (PEPCK-C)
and glucose-6- phosphatase (G6Pc) (Samuel et al., 2009). The transcript levels of Pepck
and G6pc were assessed in the liver and no significant differences were found (Figure
11.A and 11.B).
G6
pc
mR
NA
WT
Nr f
2- /
-
Hfe- /
-
Nrf
2/H
fe- /
-
0 .0
0 .2
0 .4
0 .6
0 .8
1 .0
P
ep
ck
mR
NA
WT
Nr f
2- /
-
Hfe- /
-
Nrf
2/H
fe- /
-
0 .0
0 .5
1 .0
1 .5
Figure 11. Expression of gluconeogenesis genes in the liver of WT, Nrf2-/-, Hfe-/- and Nrf2/Hfe-/- mice. (A) Transcript levels
of G6pc and (B) Pepck genes.
6. Iron metabolism
Hfe-/- mice provide an established model of systemic iron overload that mimics human
HH (Bahram et al., 1999). Nrf2-/- mice are useful for studying oxidative stress responses,
since the activation of ARE-containing genes by the transcription factor NRF2 is
abrogated (Itoh et al., 1997). Hence, Nrf2/Hfe-/- mouse is a unique model for studying the
effect of the oxidative stress generated by excessive iron. As expected, Hfe-/- mice
presented significantly augmented serum iron compared to WT and Nrf2-/- mice
(p<0.0001) (Figure 12.A). Transferrin saturation was also significantly elevated when
compared to WT, Nrf2-/- (p<0.0001) and Nrf2/Hfe-/- mice (p<0.001) (Figure 12.B). It is
worth noting that Nrf2/Hfe-/- mice did not present hyperferremia (augmented levels of
serum iron), which would be expectable as the lack of the Hfe gene leads to systemic
iron overload.
Se
ru
m i
ro
n (
g/d
L)
WT
Nr f
2- /
-
Hfe- /
-
Nrf
2/H
fe- /
-
0
1 0 0
2 0 0
3 0 0
p < 0 .0 0 0 1
p < 0 .0 0 0 1
p < 0 .0 0 0 1
Tra
ns
ferrin
sa
tura
tio
n (
%)
WT
Nr f
2- /
-
Hfe- /
-
Nrf
2/H
fe- /
-
0
2 0
4 0
6 0
8 0
1 0 0p < 0 .0 0 0 1
p < 0 .0 0 0 1
p < 0 .0 1
Figure 12. (A) Iron levels and (B) percentage of transferrin saturation in the serum of WT, Nrf2-/-, Hfe-/- and Nrf2/Hfe-/-
mice.
A. B.
A. B.

FCUP
NRF2 protection against liver injury in human and mouse models of HH 37
The transcript levels of hepcidin and the quantity of non-heme iron were assessed in
the liver. Hamp mRNA levels in Nrf2-/-, Hfe-/- and Nrf2/Hfe-/- mice were significantly
decreased when compared to WT mice (p<0.05, p<0.05 and p<0.001, respectively)
(Figure 13.D), what was expectable for Hfe-/- and Nrf2/Hfe-/- mice since HFE is necessary
for hepcidin transcription (Ganz and Nemeth, 2012). The quantity of non-heme iron in
the liver was significantly increased in Hfe-/- and in Nrf2/Hfe-/- mice when compared to
WT and Nrf2-/- mice (p<0.001) (Figure 13.A). To evaluate whether the hepcidin
expression was consistent with the hepatic iron stores, we divided the Hamp mRNA
levels by the hepatic non-heme iron. This ratio was significantly decreased in Hfe-/- mice
when compared to their WT counterparts (p<0.001) and in Nrf2/Hfe-/- mice when
compared to WT (p<0.001) and Nrf2-/- (p<0.05) mice (Figure 13.E).
The quantity of non-heme iron was also assessed in the spleen and kidneys. Spleen
non-heme iron was not significantly different between the four genotypes (Figure 13.B).
We noted a trend for increased iron content in the kidney of Nrf2 -/- and Nrf2/Hfe-/- mice,
although this effect was not statistically significant (Figure 13.C).
Perls’ Prussian Blue staining was used to determine the presence of iron in the
spleen, kidney, heart and pancreas. As illustrated in Figure 14, the spleen of the four
genotypes presented high amounts of iron, which is expectable since splenic
macrophages are responsible for scavenging the senescent erythrocytes. However, iron
appeared to be present in higher quantities in the kidney, heart and pancreas of Nrf2/Hfe-
/- mice when compared to WT, Nrf2-/- and Hfe-/- mice. It is worth noting that Nrf2/Hfe-/-
pancreas accumulated iron in the exocrine pancreas (sparing the islets of Langherhans),
siderophages and connective tissue. These data suggest that Nrf2/Hfe-/- mice
accumulate more iron in the parenchyma of the different organs than the other
genotypes.
Perls’ Prussian Blue stained liver sections revealed the deposition of higher amounts
of iron in Hfe-/- and Nrf2/Hfe-/- mice compared to WT and Nrf2-/- mice (Figure 15). These
liver sections were graded according to the distribution of iron in hepatocytes, sinusoids
and portal veins. As expected, Hfe-/- and Nrf2/Hfe-/- livers presented significantly
increased amounts of iron in hepatocytes when compared to WT (p<0.0001 and p<0.05,
respectively) and to Nrf2-/- (p<0.0001 and p<0.01, respectively) livers. It is worth noting
that Hfe-/- hepatocytes presented significantly augmented iron levels than Nrf2/Hfe-/-
hepatocytes (p<0.05) (Figure 16.A). Nrf2/Hfe-/- mice also presented significantly
increased amounts of iron in the sinusoids when compared to WT (p<0.0001), Nrf2-/-
(p<0.0001) and Hfe-/- (p<0.001) mice (Figure 16.B). Although portal iron was not
statistically different between mice of the four genotypes, Hfe-/- and Nrf2/Hfe-/- livers

38
FCUP
NRF2 protection against liver injury in human and mouse models of HH
presented higher amounts of iron in macrophages, biliary cells and vascular walls in
comparison with WT and Nrf2-/- livers (Figure 16.C). The total iron score, calculated as
the sum of hepatic, sinusoidal and portal iron scores, was significantly augmented in Hfe-
/- and Nrf2/Hfe-/- livers when compared to WT (p<0.001 and p<0.0001, respectively) and
Nrf2-/- (p<0.0001) livers (Figure 16.D).
No
n-h
em
e F
e (
g/g
dry
liv
er)
WT
Nr f
2- /
-
Hfe- /
-
Nrf
2/H
fe- /
-
0
5 0 0
1 0 0 0
1 5 0 0
2 0 0 0
2 5 0 0
p < 0 .0 0 1
p < 0 .0 0 1
p < 0 .0 0 1
p < 0 .0 0 1
No
n-h
em
e F
e (
g/g
dry
sp
lee
n)
WT
Nr f
2- /
-
Hfe- /
-
Nrf
2/H
fe- /
-
0
1 0 0 0
2 0 0 0
3 0 0 0
4 0 0 0
5 0 0 0
No
n-h
em
e F
e (
g/g
dry
kid
ne
y)
WT
Nr f
2- /
-
Hfe- /
-
Nrf
2/H
fe- /
-
0
2 0 0
4 0 0
6 0 0
8 0 0
1 0 0 0
Ha
mp
mR
NA
WT
Nr f
2- /
-
Hfe- /
-
Nrf
2/H
fe- /
-
0 .0
0 .5
1 .0
1 .5
2 .0
2 .5
p < 0 .0 5
p < 0 .0 5
p < 0 .0 0 1
Ha
mp
mR
NA
/Liv
er n
on
-he
me
Fe
WT
Nr f
2- /
-
Hfe- /
-
Nrf
2/H
fe- /
-
0 .0 0 0
0 .0 0 1
0 .0 0 2
0 .0 0 3
0 .0 0 4
0 .0 0 5p < 0 .0 0 1
p < 0 .0 0 1
p < 0 .0 5
Figure 13. (A) Tissue non-heme iron content in the liver (B) spleen and (C) kidney of WT, Nrf2-/-, Hfe-/- and Nrf2/Hfe-/-
mice. (D) Transcript levels of Hamp gene and (E) Hamp mRNA/Liver non-heme iron ratio of WT, Nrf2-/-, Hfe-/- and Nrf2/Hfe-
/- livers.
A. B.
C. D.
E.
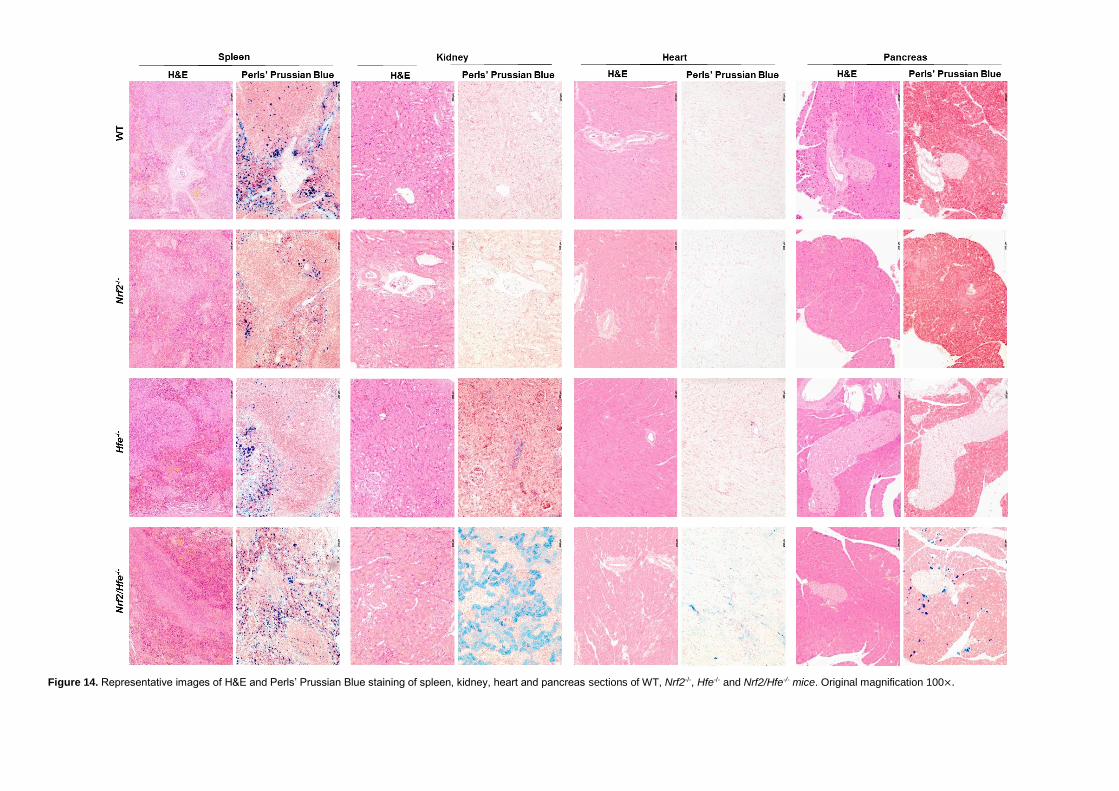
Figure 14. Representative images of H&E and Perls’ Prussian Blue staining of spleen, kidney, heart and pancreas sections of WT, Nrf2-/-, Hfe-/- and Nrf2/Hfe-/- mice. Original magnification 100×.

40
FCUP
NRF2 protection against liver injury in human and mouse models of HH
Figure 15. H&E, Perls’ Prussian Blue and Sirius Red stained liver sections of WT, Nrf2-/-, Hfe-/- and Nrf2/Hfe-/- mice. Bar
= 200 μm.

FCUP
NRF2 protection against liver injury in human and mouse models of HH 41
He
pa
toc
yti
c i
ro
n
WT
Nr f
2- /
-
Hfe- /
-
Nrf
2/H
fe- /
-
0
5
1 0
1 5
2 0
p < 0 .0 5
p < 0 .0 0 0 1
p < 0 .0 0 0 1
p < 0 .0 1
p < 0 .0 5
Sin
us
oid
al
iro
n
WT
Nr f
2- /
-
Hfe- /
-
Nrf
2/H
fe- /
-
0
5
1 0
1 5
p < 0 .0 0 0 1
p < 0 .0 0 0 1
p < 0 .0 0 1
Po
rta
l ir
on
WT
Nr f
2- /
-
Hfe- /
-
Nrf
2/H
fe- /
-
0
1
2
3
4
5
To
tal
iro
n
WT
Nr f
2- /
-
Hfe- /
-
Nrf
2/H
fe- /
-
0
1 0
2 0
3 0
4 0p < 0 .0 0 0 1
p < 0 .0 0 0 1
p < 0 .0 0 1
p < 0 .0 0 0 1
Figure 16. Histological grades of iron storage in WT, Nrf2-/-, Hfe-/- and Nrf2/Hfe-/- livers. (A) Hepatocytic iron score: 0-36.
(B) Sinusoidal iron score: 0-12. (C) Portal iron score: 0-12. (D) Total iron score: 0-60.
7. Oxidative stress
Iron is a potential biohazard since, under aerobic conditions, it can readily catalyze the
generation of ROS (Papanikolaou and Pantopoulos, 2005), which, in turn, can damage
DNA, proteins and lipid membranes (Andrews, 1999). As the cellular antioxidant defense
is essential to protect from oxidative damage, we decided to measure the quantity of total
(GSX), reduced (GSH) and oxidized (GSSG) glutathione in the liver. Even though the
quantity of GSX, GSH and GSSG was not statistically different between the four
genotypes, the GSH/GSSG ratio was significantly decreased in Nrf2-/- mice when
compared to Hfe-/- (p<0.05). A low GSH/GSSG ratio, even if not statistically significant,
was also observed in Nrf2/Hfe-/- mice (Table 6).
A. B.
C. D.

42
FCUP
NRF2 protection against liver injury in human and mouse models of HH
Table 6. Levels of GSX, GSSG and GSH and GSH/GSSG ratio, in the serum of WT, Nrf2-/-, Hfe-/- and Nrf2/Hfe-/- mice.
WT Nrf2-/- Hfe-/- Nrf2/Hfe-/-
N 6 8 5 7
GSX (nmol/mg protein) 405.1 ± 84.9 263.8 ± 39.2 410.7 ± 104.5 268.9 ± 78.8
GSSG (nmol/mg protein) 60.7 ± 2.6 52.7 ± 7.9 50.9 ± 7.2 50.6 ± 3.9
GSH (nmol/mg protein) 283.6 ± 80.3 158.4 ± 33.0 308.9 ± 90.9 167.7 ± 85.3
GSH/GSSG 4.6 ± 1.1 3.0 ± 0.7a 6.0 ± 1.0 3.4 ± 2.0
Mean ± standard deviation. ap<0.05 vs Hfe-/-.
Lipid peroxidation is one of the consequences of the oxidative stress caused by high
amounts of iron. A Thiobarbituric Acid Reactive Substances (TBARS) assay was
performed as an indirect measurement of malondialdehyde (MDA), a byproduct of lipid
peroxidation. We found no significant differences in the MDA concentration across the
four experimental groups (Figure 17.A).
NRF2 is a key transcription factor involved in the antioxidant defense (Kensler et al.,
2007), so we decided to investigate the transcript levels of NAD(P)H:quinone
oxireductase 1 (Nqo1), an antioxidant enzyme upregulated by NRF2 (Klaassen and
Reisman, 2010), in the liver. As expected, Nrf2-/- and Nrf2/Hfe-/- livers showed
significantly decreased levels of Nqo1 transcript when compared to WT and Hfe-/- livers
(p<0.0001) (Figure 17.B).
[MD
A]/
mg
pro
tein
WT
Nr f
2- /
-
Hfe- /
-
Nrf
2/H
fe- /
-
0 .0
0 .5
1 .0
1 .5
2 .0
Nq
o1
mR
NN
A
WT
Nr f
2- /
-
Hfe- /
-
Nrf
2/H
fe- /
-
0 .0
0 .5
1 .0
1 .5p < 0 .0 0 0 1 p < 0 .0 0 0 1
p < 0 .0 0 0 1
p < 0 .0 0 0 1
Figure 17. (A) MDA concentration and (B) Nqo1 gene expression in the livers of WT, Nrf2-/-, Hfe-/- and Nrf2/Hfe-/- mice.
A. B.

FCUP
NRF2 protection against liver injury in human and mouse models of HH 43
8. Liver fibrosis
Liver fibrosis is one of the major consequences of the excessive iron accumulation in HH
patients and is characterized by excessive deposition of extracellular matrix (ECM)
(Bataller and Brenner, 2005). Transforming growth factor (TGF)-β, the most prominent
profibrotic cytokine that contributes to the development of hepatic fibrosis, signals the
transcription of fibrogenic genes, such as collagen and fibronectin. In fibrotic liver,
augmented (TGF)-β signaling stimulates transdifferentiation of hepatic stellate cells
(HSCs) to α-smooth muscle actin (α-SMA)-positive myofibroblasts, the main producers
of excessive ECM proteins. TGF-β is also capable of suppressing the activity of ECM
degrading proteases, such as matrix metalloproteinases, via upregulation of their
inhibitors, including tissue inhibitor of matrix metalloproteinase (TIMP)-1, leading to
decreased ECM degradation (Oh et al., 2012). We evaluated the expression of genes
involved in liver fibrosis, including alpha-smooth muscle actin (Acta2), type I collagen
(Col1a1) and Timp1 genes. Levels of Acta2 and Timp1 genes were not statistically
different in the livers of mice of the four genotypes (Figure 18.A and 18.C). However,
the transcript levels of Col1a1 were significantly augmented in Nrf2/Hfe-/- mice when
compared to Nrf2-/- mice (p<0.05) (Figure 18.B). 4-Hydroxyproline is a major component
of collagen, comprising around 13.5% of its amino acid composition (Neuman and
Logan, 1950), which is why we also determined the quantity of hydroxyproline in the liver.
The quantity of hydroxyproline tended to augment in Nrf2/Hfe-/- mice in comparison to
WT, Nrf2-/- and Hfe-/- mice (Figure 18.D). The hepatic fibrotic area was evaluated through
a Sirius Red Staining. After analyzing three random microscope fields of the liver under
polarized light, obtained at 100× magnification, we observed that the percentage of
fibrotic area was significantly increased in Nrf2/Hfe-/- mice compared to WT (p<0.05),
Nrf2-/- and Hfe-/- mice (p<0.01) (Figure 18.E).
Sirius Red stained liver sections were also graded according to the level of fibrosis.
As illustrated in Figure 15, Nrf2/Hfe-/- mice presented a more exuberant phenotype of
fibrosis (bridging fibrosis) than WT, Nrf2-/- and Hfe-/- mice. Fibrosis degree was
significantly augmented in Nrf2/Hfe-/- livers in comparison to WT (p<0.01), Nrf2-/- (p<0.05)
and Hfe-/- (p<0.001) livers (Figure 19).
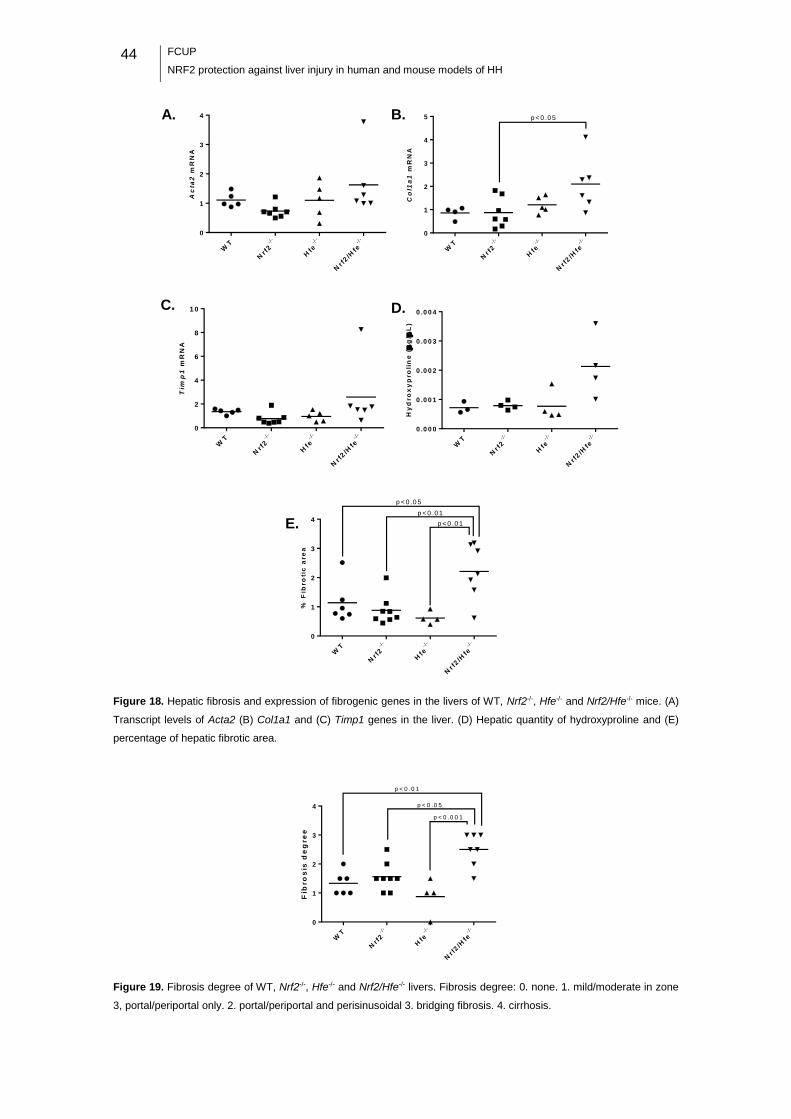
44
FCUP
NRF2 protection against liver injury in human and mouse models of HH
Ac
ta2
mR
NA
WT
Nr f
2- /
-
Hfe- /
-
Nrf
2/H
fe- /
-
0
1
2
3
4
Co
l1a
1 m
RN
A
WT
Nr f
2- /
-
Hfe- /
-
Nrf
2/H
fe- /
-
0
1
2
3
4
5 p < 0 .0 5
Tim
p1
mR
NA
WT
Nr f
2- /
-
Hfe- /
-
Nrf
2/H
fe- /
-
0
2
4
6
8
1 0
Hy
dro
xy
pro
lin
e (
g/
L)
WT
Nr f
2- /
-
Hfe- /
-
Nrf
2/H
fe- /
-
0 .0 0 0
0 .0 0 1
0 .0 0 2
0 .0 0 3
0 .0 0 4
% F
ibro
tic
are
a
WT
Nr f
2- /
-
Hfe- /
-
Nrf
2/H
fe- /
-
0
1
2
3
4
p < 0 .0 5
p < 0 .0 1
p < 0 .0 1
Figure 18. Hepatic fibrosis and expression of fibrogenic genes in the livers of WT, Nrf2-/-, Hfe-/- and Nrf2/Hfe-/- mice. (A)
Transcript levels of Acta2 (B) Col1a1 and (C) Timp1 genes in the liver. (D) Hepatic quantity of hydroxyproline and (E)
percentage of hepatic fibrotic area.
Fib
ro
sis
de
gre
e
WT
Nrf
2- /
-
Hfe- /
-
Nrf
2/H
fe- /
-
0
1
2
3
4
p < 0 .0 1
p < 0 .0 5
p < 0 .0 0 1
Figure 19. Fibrosis degree of WT, Nrf2-/-, Hfe-/- and Nrf2/Hfe-/- livers. Fibrosis degree: 0. none. 1. mild/moderate in zone
3, portal/periportal only. 2. portal/periportal and perisinusoidal 3. bridging fibrosis. 4. cirrhosis.
A. B.
C. D.
E.
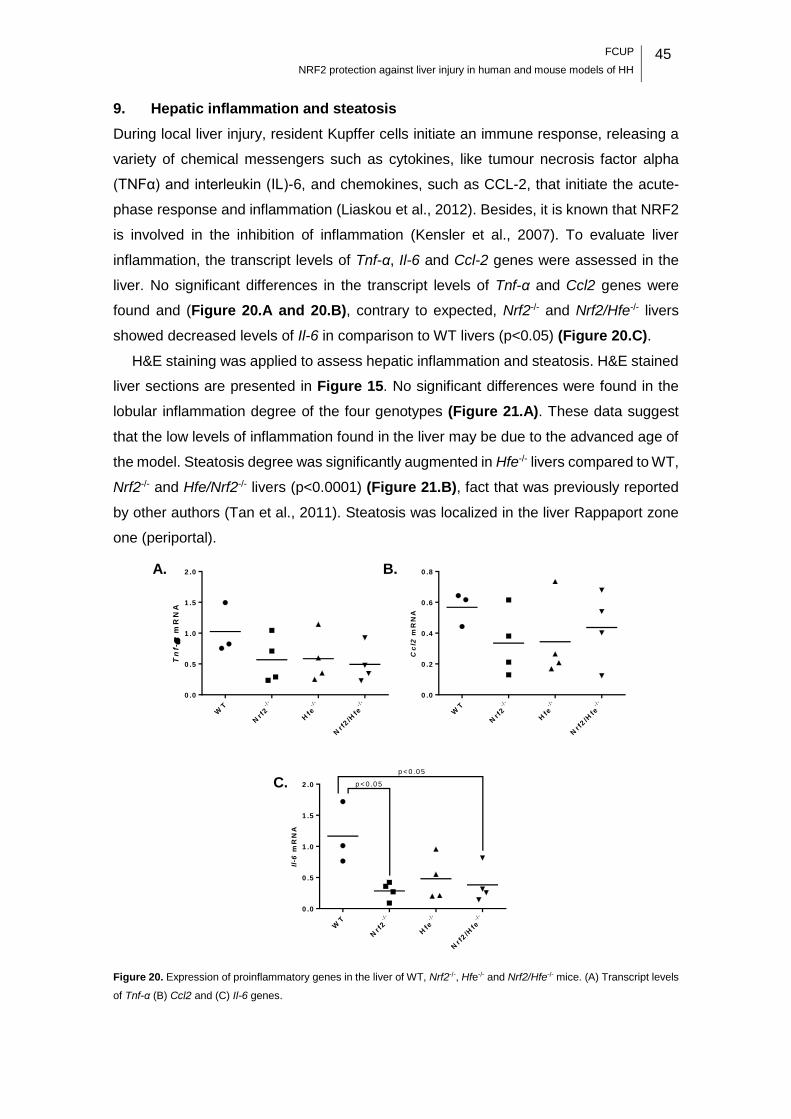
FCUP
NRF2 protection against liver injury in human and mouse models of HH 45
9. Hepatic inflammation and steatosis
During local liver injury, resident Kupffer cells initiate an immune response, releasing a
variety of chemical messengers such as cytokines, like tumour necrosis factor alpha
(TNFα) and interleukin (IL)-6, and chemokines, such as CCL-2, that initiate the acute-
phase response and inflammation (Liaskou et al., 2012). Besides, it is known that NRF2
is involved in the inhibition of inflammation (Kensler et al., 2007). To evaluate liver
inflammation, the transcript levels of Tnf-α, Il-6 and Ccl-2 genes were assessed in the
liver. No significant differences in the transcript levels of Tnf-α and Ccl2 genes were
found and (Figure 20.A and 20.B), contrary to expected, Nrf2-/- and Nrf2/Hfe-/- livers
showed decreased levels of Il-6 in comparison to WT livers (p<0.05) (Figure 20.C).
H&E staining was applied to assess hepatic inflammation and steatosis. H&E stained
liver sections are presented in Figure 15. No significant differences were found in the
lobular inflammation degree of the four genotypes (Figure 21.A). These data suggest
that the low levels of inflammation found in the liver may be due to the advanced age of
the model. Steatosis degree was significantly augmented in Hfe-/- livers compared to WT,
Nrf2-/- and Hfe/Nrf2-/- livers (p<0.0001) (Figure 21.B), fact that was previously reported
by other authors (Tan et al., 2011). Steatosis was localized in the liver Rappaport zone
one (periportal).
Tn
f-
mR
NA
WT
Nrf
2- /
-
Hfe- /
-
Nrf
2/H
fe- /
-
0 .0
0 .5
1 .0
1 .5
2 .0
Cc
l2m
RN
A
WT
Nr f
2- /
-
Hfe- /
-
Nrf
2/H
fe- /
-
0 .0
0 .2
0 .4
0 .6
0 .8
Il-6
mR
NA
WT
Nr f
2- /
-
Hfe- /
-
Nrf
2/H
fe- /
-
0 .0
0 .5
1 .0
1 .5
2 .0
p < 0 .0 5
p < 0 .0 5
Figure 20. Expression of proinflammatory genes in the liver of WT, Nrf2-/-, Hfe-/- and Nrf2/Hfe-/- mice. (A) Transcript levels
of Tnf-α (B) Ccl2 and (C) Il-6 genes.
A. B.
C.
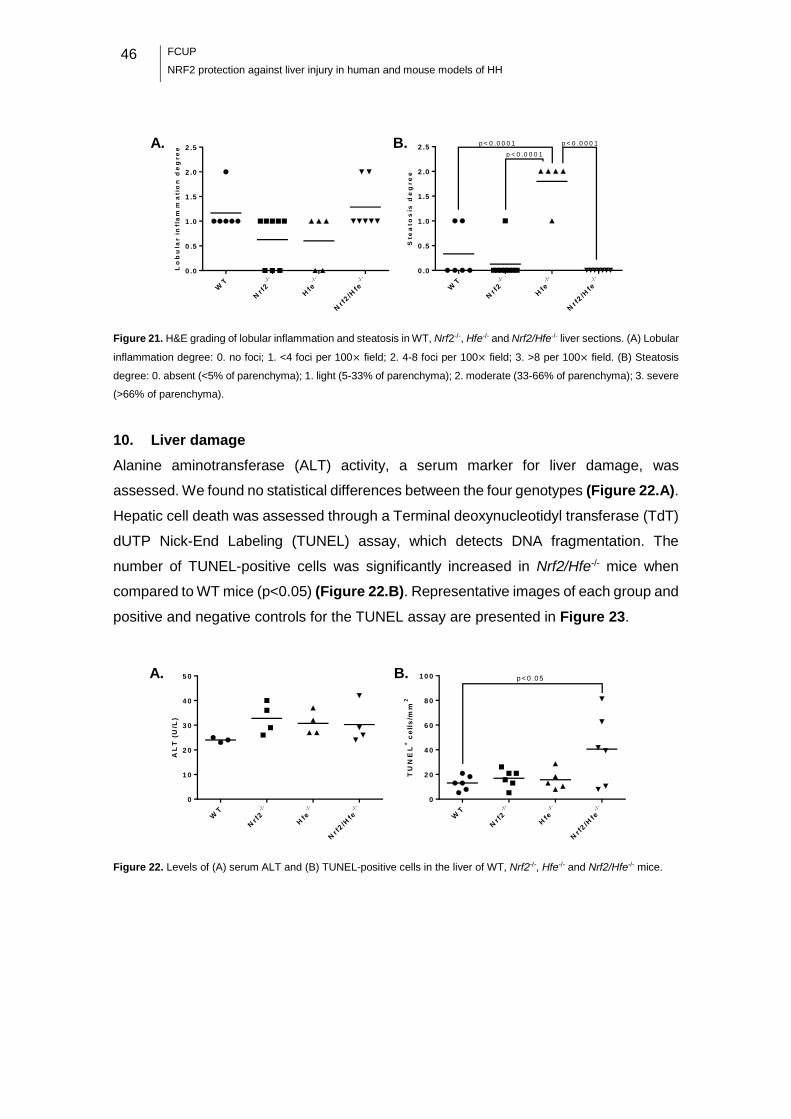
46
FCUP
NRF2 protection against liver injury in human and mouse models of HH
Lo
bu
lar
in
fla
mm
atio
n d
eg
re
e
WT
Nrf
2- /
-
Hfe- /
-
Nrf
2/H
fe- /
-
0 .0
0 .5
1 .0
1 .5
2 .0
2 .5
Ste
ato
sis
de
gr
ee
WT
Nrf
2- /
-
Hfe- /
-
Nrf
2/H
fe- /
-
0 .0
0 .5
1 .0
1 .5
2 .0
2 .5p < 0 .0 0 0 1
p < 0 .0 0 0 1
p < 0 .0 0 0 1
Figure 21. H&E grading of lobular inflammation and steatosis in WT, Nrf2-/-, Hfe-/- and Nrf2/Hfe-/- liver sections. (A) Lobular
inflammation degree: 0. no foci; 1. <4 foci per 100× field; 2. 4-8 foci per 100× field; 3. >8 per 100× field. (B) Steatosis
degree: 0. absent (<5% of parenchyma); 1. light (5-33% of parenchyma); 2. moderate (33-66% of parenchyma); 3. severe
(>66% of parenchyma).
10. Liver damage
Alanine aminotransferase (ALT) activity, a serum marker for liver damage, was
assessed. We found no statistical differences between the four genotypes (Figure 22.A).
Hepatic cell death was assessed through a Terminal deoxynucleotidyl transferase (TdT)
dUTP Nick-End Labeling (TUNEL) assay, which detects DNA fragmentation. The
number of TUNEL-positive cells was significantly increased in Nrf2/Hfe-/- mice when
compared to WT mice (p<0.05) (Figure 22.B). Representative images of each group and
positive and negative controls for the TUNEL assay are presented in Figure 23.
AL
T (
U/L
)
WT
Nr f
2- /
-
Hfe- /
-
Nrf
2/H
fe- /
-
0
1 0
2 0
3 0
4 0
5 0
TU
NE
L+ c
ell
s/m
m2
WT
Nrf
2- /
-
Hfe- /
-
Nrf
2/H
fe- /
-
0
2 0
4 0
6 0
8 0
1 0 0 p < 0 .0 5
Figure 22. Levels of (A) serum ALT and (B) TUNEL-positive cells in the liver of WT, Nrf2-/-, Hfe-/- and Nrf2/Hfe-/- mice.
A. B.
A. B.
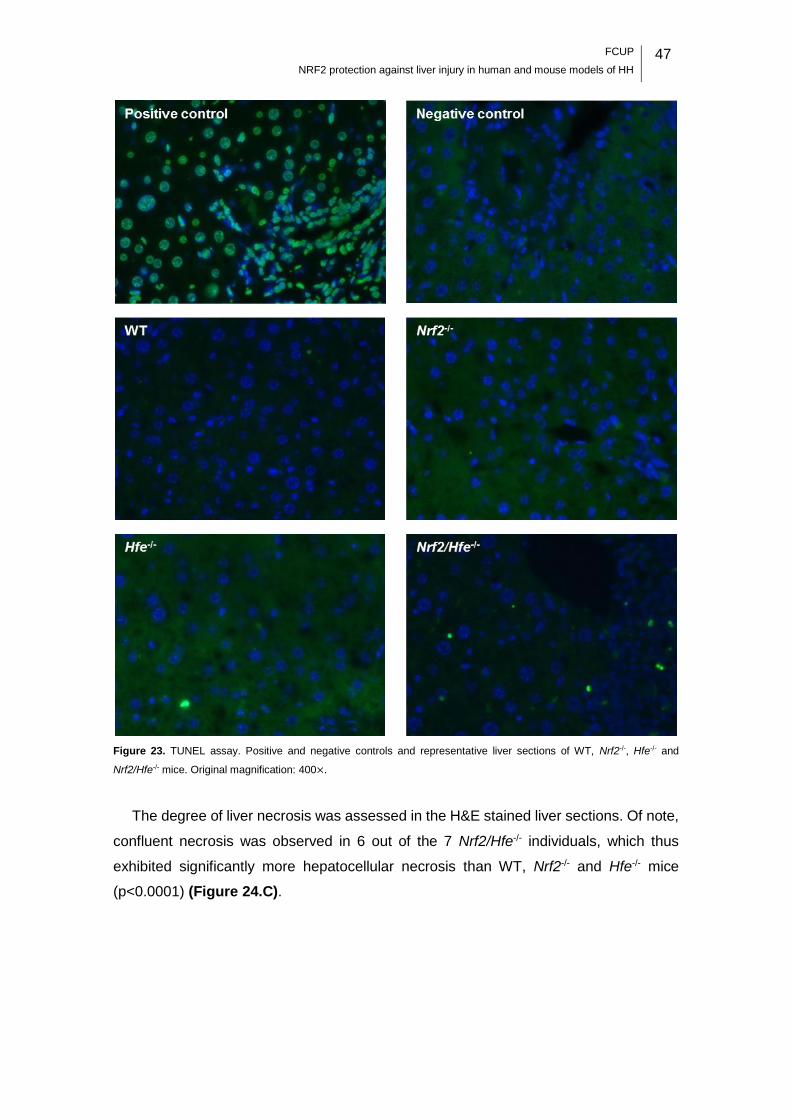
FCUP
NRF2 protection against liver injury in human and mouse models of HH 47
Figure 23. TUNEL assay. Positive and negative controls and representative liver sections of WT, Nrf2-/-, Hfe-/- and
Nrf2/Hfe-/- mice. Original magnification: 400×.
The degree of liver necrosis was assessed in the H&E stained liver sections. Of note,
confluent necrosis was observed in 6 out of the 7 Nrf2/Hfe-/- individuals, which thus
exhibited significantly more hepatocellular necrosis than WT, Nrf2-/- and Hfe-/- mice
(p<0.0001) (Figure 24.C).

48
FCUP
NRF2 protection against liver injury in human and mouse models of HH
Figure 24. Representative H&E stained liver sections of Nrf2/Hfe-/- mice showing (A) spotty necrosis and (B) confluent
necrosis. (C) H&E grading of necrosis in WT, Nrf2-/-, Hfe-/- and Nrf2/Hfe-/- liver sections. 0. absent. 1. spotty necrosis (one
or a few necrotic hepatocytes). 2. confluent necrosis. 3. bridging necrosis.

FCUP
NRF2 protection against liver injury in human and mouse models of HH 49
Human study
In order to properly perform the SNP genotyping of Rs35652124, Rs670664,
Rs150648896 and Rs6721961 of the NRF2 promoter region, the first approach was to
optimize the PCR protocol to avoid the appearance of non-specific bands in the
electrophoresis gel. Different enzymes (Taq DNA Polimerase from ThermoFisher
Scientific, Lithuania; Type-it® Microsatellite PCR Kit from Qiagen, Germany), annealing
temperatures (61-63 ºC), annealing and extension time (1 min and 30 s) and
concentrations of MgCl2 (1.5 and 2mM) and template DNA (10, 50 and 100 ng/μL) were
tested. A single PCR product was consistently obtained when using the Type-it®
Microsatellite PCR Kit, increasing the annealing temperature to 63ºC, decreasing the
annealing and extension time for 30 s and setting the template DNA at 50 ng/μL.
Representative agarose gel from the original protocol and from the optimized one are
presented in Figure 25.
Figure 25. PCR amplification of a 284 bp fragment of the NRF2 promoter region. PCR products were separated by gel
electrophoresis and visualized under UV after ethidium bromide staining. Representative images of the PCR products
obtained (A) prior to and (B) after optimization are depicted.
The PCR fragment was genotyped and the SNPs were determined with ProSeq3
software. An example of an electropherogram is presented in Figure 26. Allele
frequencies of Rs35652124 (T > C), Rs670664 (C > T), Rs150648896 (C > T) and
Rs6721961 (G > T) SNPs were calculated in unrelated patients, as described in Materials
and Methods (M&M). Frequencies of the actual sample and reference frequencies from
Ensembl are presented in Table 7. We concluded that there were no significant
differences between the frequencies of the actual sample and the frequencies reported
in Ensembl for the European population.
As a first approach to address the genotype/phenotype correlations, we estimated the
allele frequencies of the different SNPs in groups of patients divided according to the

50
FCUP
NRF2 protection against liver injury in human and mouse models of HH
expression of specific clinical manifestations of disease, as described in M&M. The
respective allele frequencies are presented in Table 8.
Figure 26. Representative elecropherogram. The R inside a square represents a heterozygote individual for Rs35652124
SNP.
Table 7. Actual sample and reference allele frequencies.
Table 8. Allele frequencies in patients stratified according to the clinical manifestations of disease.
Although, in general, no statistically significant differences were found among groups,
it is worth noting that the frequency of the allele T in Rs35652124 SNP was higher in
patients with cirrhosis (presence of cirrhosis +) and in symptomatic patients than in
patients without cirrhosis (presence of cirrhosis −) or asymptomatic patients (Table 8).
Actual sample Reference
Rs35652124 Rs6706649 Rs150648896 Rs6721961 Rs35652124 Rs6706649 Rs150648896 Rs6721961
freq (T) 0.680 (132) 0.103 (20) 0.000 (0) 0.098 (19) 0.694 (698) 0.111 (112) 0.000 (0) 0.125 (126)
freq (C) 0.320 (62) 0.897 (174) 1.000 (194) 0.306 (308) 0.889 (894) 1.000 (1006)
freq (G) 0.902 (175) 0.875 (880)
Frequency (number of alleles). The reference frequencies were obtained in Ensembl for the European population.
Presence of Cirrhosis Presence of Arthropathy Clinical Presentation
+ − + − Symptomatic Assymptomatic
n 11 46 11 46 24 33
Rs35652124 freq (T) 0.818 (18) 0.641 (59) 0.682 (15) 0.674 (62) 0.750 (36) 0.621 (41)
freq (C) 0.182 (4) 0.359 (33) 0.318 (7) 0.326 (30) 0.250 (12) 0.379 (25)
Rs6706649 freq (T) 0.182 (4) 0.141 (13) 0.091 (2) 0.163 (15) 0.146 (7) 0.152 (10)
freq (C) 0.818 (18) 0.859 (79) 0.909 (20) 0.837 (77) 0.854 (41) 0.848 (56)
Rs150648896 freq (T) 0.000 (0) 0.000 (0) 0.000 (0) 0.000 (0) 0.000 (0) 0.000 (0)
freq (C) 1.000 (22) 1.000 (92) 1.000 (22) 1.000 (92) 1.000 (48) 1.000 (66)
Rs6721961 freq (T) 0.045 (1) 0.065 (6) 0.136 (3) 0.043 (4) 0.104 (5) 0.030 (2)
freq (G) 0.955 (21) 0.935 (86) 0.864 (19) 0.957 (88) 0.896 (43) 0.907 (64)
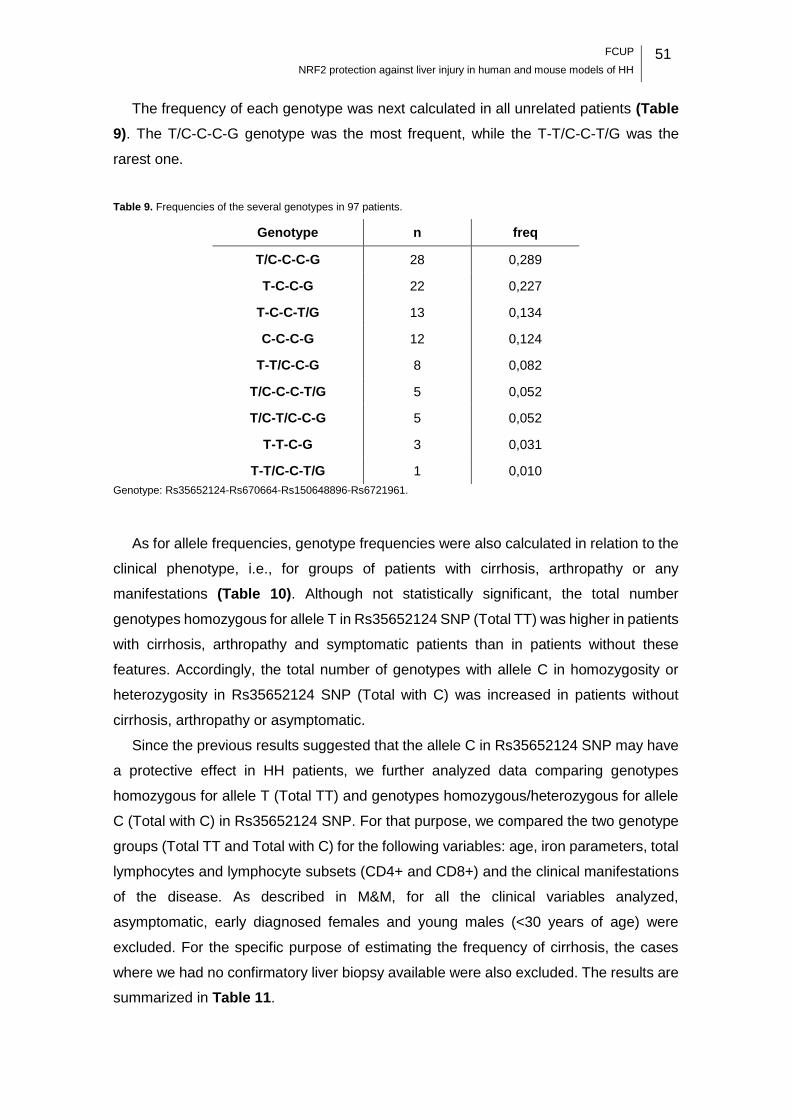
FCUP
NRF2 protection against liver injury in human and mouse models of HH 51
The frequency of each genotype was next calculated in all unrelated patients (Table
9). The T/C-C-C-G genotype was the most frequent, while the T-T/C-C-T/G was the
rarest one.
Table 9. Frequencies of the several genotypes in 97 patients.
Genotype n freq
T/C-C-C-G 28 0,289
T-C-C-G 22 0,227
T-C-C-T/G 13 0,134
C-C-C-G 12 0,124
T-T/C-C-G 8 0,082
T/C-C-C-T/G 5 0,052
T/C-T/C-C-G 5 0,052
T-T-C-G 3 0,031
T-T/C-C-T/G 1 0,010
Genotype: Rs35652124-Rs670664-Rs150648896-Rs6721961.
As for allele frequencies, genotype frequencies were also calculated in relation to the
clinical phenotype, i.e., for groups of patients with cirrhosis, arthropathy or any
manifestations (Table 10). Although not statistically significant, the total number
genotypes homozygous for allele T in Rs35652124 SNP (Total TT) was higher in patients
with cirrhosis, arthropathy and symptomatic patients than in patients without these
features. Accordingly, the total number of genotypes with allele C in homozygosity or
heterozygosity in Rs35652124 SNP (Total with C) was increased in patients without
cirrhosis, arthropathy or asymptomatic.
Since the previous results suggested that the allele C in Rs35652124 SNP may have
a protective effect in HH patients, we further analyzed data comparing genotypes
homozygous for allele T (Total TT) and genotypes homozygous/heterozygous for allele
C (Total with C) in Rs35652124 SNP. For that purpose, we compared the two genotype
groups (Total TT and Total with C) for the following variables: age, iron parameters, total
lymphocytes and lymphocyte subsets (CD4+ and CD8+) and the clinical manifestations
of the disease. As described in M&M, for all the clinical variables analyzed,
asymptomatic, early diagnosed females and young males (<30 years of age) were
excluded. For the specific purpose of estimating the frequency of cirrhosis, the cases
where we had no confirmatory liver biopsy available were also excluded. The results are
summarized in Table 11.
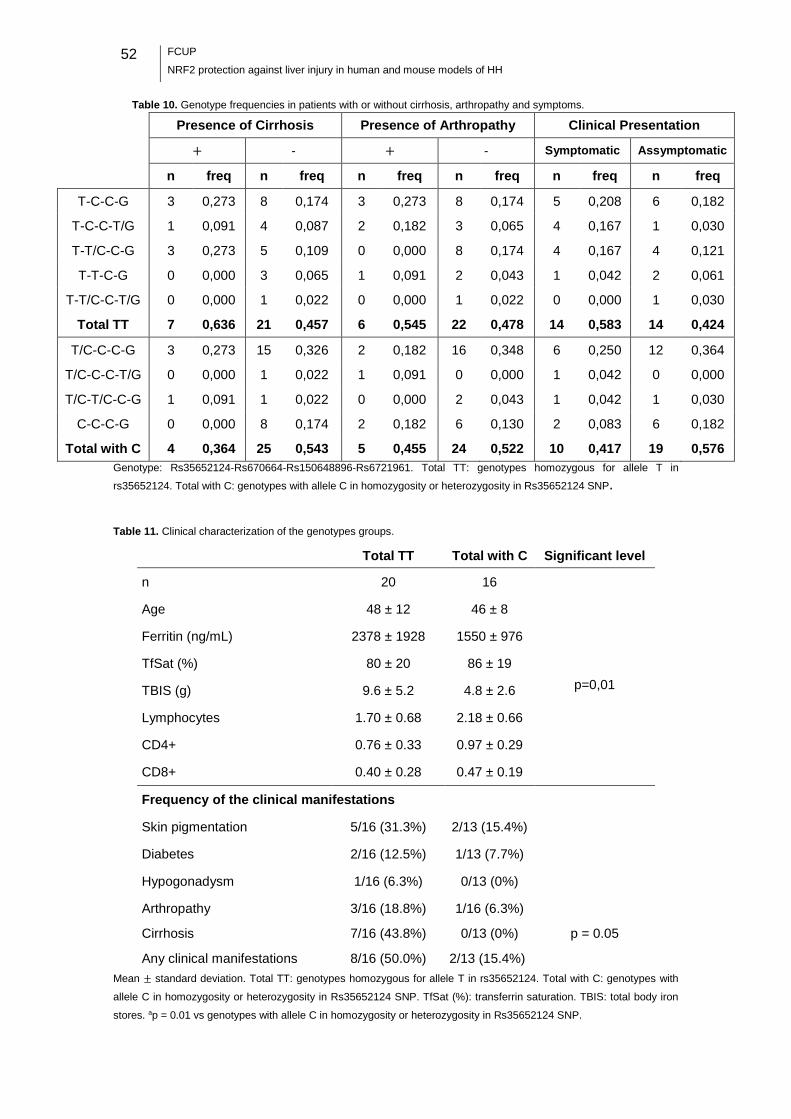
52
FCUP
NRF2 protection against liver injury in human and mouse models of HH
Table 10. Genotype frequencies in patients with or without cirrhosis, arthropathy and symptoms.
Presence of Cirrhosis Presence of Arthropathy Clinical Presentation
+ - + - Symptomatic Assymptomatic
n freq n freq n freq n freq n freq n freq
T-C-C-G 3 0,273 8 0,174 3 0,273 8 0,174 5 0,208 6 0,182
T-C-C-T/G 1 0,091 4 0,087 2 0,182 3 0,065 4 0,167 1 0,030
T-T/C-C-G 3 0,273 5 0,109 0 0,000 8 0,174 4 0,167 4 0,121
T-T-C-G 0 0,000 3 0,065 1 0,091 2 0,043 1 0,042 2 0,061
T-T/C-C-T/G 0 0,000 1 0,022 0 0,000 1 0,022 0 0,000 1 0,030
Total TT 7 0,636 21 0,457 6 0,545 22 0,478 14 0,583 14 0,424
T/C-C-C-G 3 0,273 15 0,326 2 0,182 16 0,348 6 0,250 12 0,364
T/C-C-C-T/G 0 0,000 1 0,022 1 0,091 0 0,000 1 0,042 0 0,000
T/C-T/C-C-G 1 0,091 1 0,022 0 0,000 2 0,043 1 0,042 1 0,030
C-C-C-G 0 0,000 8 0,174 2 0,182 6 0,130 2 0,083 6 0,182
Total with C 4 0,364 25 0,543 5 0,455 24 0,522 10 0,417 19 0,576
Genotype: Rs35652124-Rs670664-Rs150648896-Rs6721961. Total TT: genotypes homozygous for allele T in
rs35652124. Total with C: genotypes with allele C in homozygosity or heterozygosity in Rs35652124 SNP.
Table 11. Clinical characterization of the genotypes groups.
Total TT Total with C Significant level
n 20 16
Age 48 ± 12 46 ± 8
Ferritin (ng/mL) 2378 ± 1928 1550 ± 976
TfSat (%) 80 ± 20 86 ± 19
TBIS (g) 9.6 ± 5.2 4.8 ± 2.6 p=0,01
Lymphocytes 1.70 ± 0.68 2.18 ± 0.66
CD4+ 0.76 ± 0.33 0.97 ± 0.29
CD8+ 0.40 ± 0.28 0.47 ± 0.19
Frequency of the clinical manifestations
Skin pigmentation 5/16 (31.3%) 2/13 (15.4%)
Diabetes 2/16 (12.5%) 1/13 (7.7%)
Hypogonadysm 1/16 (6.3%) 0/13 (0%)
Arthropathy 3/16 (18.8%) 1/16 (6.3%)
Cirrhosis 7/16 (43.8%) 0/13 (0%) p = 0.05
Any clinical manifestations 8/16 (50.0%) 2/13 (15.4%) Mean ± standard deviation. Total TT: genotypes homozygous for allele T in rs35652124. Total with C: genotypes with
allele C in homozygosity or heterozygosity in Rs35652124 SNP. TfSat (%): transferrin saturation. TBIS: total body iron
stores. ap = 0.01 vs genotypes with allele C in homozygosity or heterozygosity in Rs35652124 SNP.

FCUP
NRF2 protection against liver injury in human and mouse models of HH 53
No significant differences were found between the two groups in terms of age,
biochemical and hematological parameters. However, TBIS was significantly increased
in genotypes homozygous for allele T in Rs35652124 SNP (Total TT) when compared
to genotypes homozygous/heterozygous for allele C in Rs35652124 SNP (Total with C)
(p = 0.01) (Table 11). Cirrhosis was significantly increased in genotypes homozygous
for allele T in Rs35652124 SNP (Total TT) when compared to genotypes
homozygous/heterozygous for allele C in Rs35652124 SNP (Total with C) (p = 0.5).
Although not statistically significant, symptomatic patients had more commonly
genotypes homozygous for allele T in Rs35652124 SNP (Total TT) (p = 0.10).


FCUP
NRF2 protection against liver injury in human and mouse models of HH 55
Discussion
Animal study
1. Hfe and Nrf2 genes in erythropoiesis
Hfe-/- mice exhibited significantly higher levels of Hb and HCT when compared to WT
mice. These data are in agreement with several reports that showed erythropoietic
alterations in HH patients, including increased Hb levels, reticulocyte counts, HCT, MCV,
MCH, and MCH concentration (Barton et al., 2000; Feeney et al., 2005; McLaren et al.,
2007). A study by Ramos et al., 2011 demonstrated that the Hfe gene influences
erythropoiesis by limiting hepcidin expression under conditions of simultaneous iron
overload and stress erythropoiesis, and by impairing transferrin-bound iron uptake by
erythroid cells. This dual role for Hfe avoids the toxicity associated with iron overload
under conditions of high iron availability and limits erythroid iron intake under conditions
of iron deficiency (Ramos et al., 2011).
In contrast with Hfe-/- mice, Nrf2/Hfe-/- mice presented low values of RBC, Hb and
HCT, which indicates that they were mildly anemic. Their MCV and MCH values were
increased, indicating that the anemia was macrocytic and normochromic. Macrocytic
anemia is characterized by the presence of abnormally large RBCs in the peripheral
blood and can be divided into two categories, megaloblastic and nonmegaloblastic,
based on the examination of the bone marrow. The etiologies associated with macrocytic
anemia include nutritional deficiencies (e.g., vitamin B12 and folate), drugs, primary bone
marrow disorders (e.g., myelodysplasia and leukemia) and other chronic illnesses (e.g.
alcoholism and hypothyroidism). Megaloblastic anemia is highly suspicious of a vitamin
B12 or folate deficiency and is characterized by large and oval shaped erythroblasts that
contain a characteristic immature, lacy nucleus (Aslinia et al., 2006). Nrf2/Hfe-/- mice had
the lowest body weight, so we suspected that the anemia could be due to low intestinal
absorption of nutrients, namely vitamin B12 and folate. This hypothesis was excluded
since megaloblasts were not observed in bone marrow smears (Tiago Duarte, personal
communication). The percentage of reticulocytes was increased in Nrf2/Hfe-/- mice,
indicative of a regenerative anemia. With regenerative anemia, the bone marrow
responds appropriately to the decreased red cell mass by increasing RBC production
and releasing reticulocytes. Typically, regenerative anemia is caused by hemorrhage or
hemolysis (Kahn, 2010). Serum LDH activity was not altered in Nrf2/Hfe-/- mice, which
indicates that the anemia did not result from RBC hemolysis.
56
FCUP
NRF2 protection against liver injury in human and mouse models of HH
Erythroid colony-forming units adhere to a resident macrophage and differentiate to
erythroblasts in the presence of EPO, resulting in the formation of an erythroblastic
island. So, resident macrophages play a supportive role in erythropoiesis, probably by
preventing apoptosis of the erythroid precursors (Sadahira and Mori, 1999), and EPO
stimulates the erythroid progenitors in the bone marrow to proliferate (Beguin et al.,
1993). Transcript levels of Epo gene in the kidney and EPO levels in the serum were
slightly augmented, even if not statistically significant, in Nrf2/Hfe-/- mice. This indicates
that the kidney was responding to the low levels of RBC and that erythropoiesis was not
compromised due to lack of EPO. Spic transcript levels were not altered in the liver and
spleen of Nrf2/Hfe-/- mice and F4/80 transcript levels were also not altered in the spleen
of Nrf2/Hfe-/- mice. These data indicate that the anemia was not caused by lack of
macrophages to nurse the development and differentiation of erythroid cells. HO-1 is
responsible for the disposal of the potentially toxic heme (Fraser et al., 2011). HO-1
deficiency in humans appears to be an extremely rare condition with only two live births
reported. Both patients presented severe anemia (Kartikasari et al., 2009; Yachie et al.,
1999). Nrf2/Hfe-/- mice did not present significant alterations in the levels of Hmox1 in the
liver and spleen, which indicates that the anemia did not result from lack of HO-1.
The pro-inflammatory state of aging may result in anemia (Roy, 2010). Since mice
employed in the study were 24 months of age, anemia of inflammation (AI) could be a
possible cause of the low RBC count in Nrf2/Hfe-/- mice. AI is typically normochromic and
normocytic and is characterized by low serum iron and reticulocyte count, decreased
transferrin saturation and bone marrow sideroblasts and increased reticuloendothelial
iron and hepcidin levels (Cartwright, 1966). In certain cases, EPO production is not
sufficiently increased relative to the severity of the anemia and erythrocyte life span is
decreased (Roy, 2010). These features of AI suggest that the immune response
promotes iron sequestration, but also inhibits the production and survival of erythrocytes
(Weiss and Goodnough, 2005). Cytokines, such as IL-6, TNFα and IL-1, are linked to AI.
IL-6 correlates with hemoglobin concentration and TNFα and IL-1 have been implicated
in the inhibition of multiple stages of erythroid development (Weiss and Goodnough,
2005). The hypothesis that Nrf2/Hfe-/- mice could have AI was excluded. Even though
they presented low levels of serum iron and decreased transferrin saturation when
compared to Hfe-/- mice (they should have presented higher values due to the lack of
HFE), reticulocyte count was not decreased, Hamp transcript levels in the liver were not
increased and the levels of GM-CSF, IFN-γ, IL-1b, IL-6, IL-10, MCP-1 and TNFα were
not significantly increased. These data lead us to discard the AI.
FCUP
NRF2 protection against liver injury in human and mouse models of HH 57
Iron deficiency anemia (IDA) is characterized by microcytosis and hypochromasia
with inadequate regeneration, and low serum iron, iron saturation and ferritin
(Naigamwalla et al., 2012). As Nrf2/Hfe-/- mice had low body weight and low serum iron
levels, the decreased iron intestinal absorption could be the source of the anemia.
However IDA was also excluded since the anemia was macrocytic, normochromic and
regenerative. The fact that the Nrf2/Hfe-/- mice anemia is regenerative is by itself an
exclusion factor for IDA, since there must exist available iron for the development of
reticulocytes.
Further investigation needs to be done to determine the origin of the anemia of
Nrf2/Hfe-/- mice. NRF2 has been proven to play a critical role in the survival of RBCs, by
regulating intracellular ROS levels when selenoproteins, enzymes with antioxidant
properties, are depleted (Kawatani et al., 2011). So, we can only speculate that the lack
of both Nrf2 and Hfe genes prompt the mice to the development of anemia, since Hfe is
essential to balance the iron uptake by RBC and Nrf2 is needed to increase RBC survival
in the presence of ROS.
2. Hfe and Nrf2 genes in gluconeogenesis
It has been demonstrated that the targeted inactivation of the Hfe gene in mice results
in decreased insulin secretory capacity (Cooksey et al., 2004). Iron overload is common
in type 2 diabetes (Fernandez-Real et al., 2002; Ford and Cogswell, 1999; Forouhi et al.,
2007) and the most commonly studied model for iron associated diabetes is HH (Huang
et al., 2011). Conversely, iron depletion seems to be protective against the development
of diabetes (Huang et al., 2011). In contrast to previous descriptions of diabetes in Hfe-/-
mice in the literature, in our study Hfe-/- mice were not diabetic and Nrf2/Hfe-/- mice were
hypoglycemic, as they presented significantly decreased serum glucose at starvation.
Moreover, Hfe-/- and Nrf2/Hfe-/- mice presented normal values of insulin when compared
to WT mice. As insulin is responsible for the reduction of plasma glucose levels, and no
significant differences were found in mice of the four genotypes, we can conclude that
insulin levels were not the cause of the hypoglycemia of Nrf2/Hfe-/- mice. To further
investigate the hypoglycemia in Nrf2/Hfe-/- mice, we aimed to determine if a defect in
gluconeogenesis was the origin of the low levels of glucose. Gluconeogenesis is de novo
synthesis of glucose from noncarbohydrate precursors, such as lactate, pyruvate,
glycerol and alanine. The rate of gluconeogenesis is controlled principally by the
activities of PEPCK, fructose-1,6-bisphosphatase and glucose-6-phosphatase (Yoon et
al., 2001). No significant differences were detected in G6pc and Pepck transcript levels
in Nrf2/Hfe-/- liver. Hence, we have no evidence that the hypoglycemia of Nrf2/Hfe-/- mice
58
FCUP
NRF2 protection against liver injury in human and mouse models of HH
was due to compromised gluconeogenesis. It is thus possible that the hypoglycemia at
starvation is simply the result of the worse body condition of Nrf2/Hfe-/- mice, which is
illustrated by the decreased body weight when compared to all the other genotypes.
Further investigation should be done to clarify the origin of the low levels of glucose in
Nrf2/Hfe-/- mice.
3. Hfe and Nrf2 genes in iron metabolism
The Hfe-/- mouse is a model of systemic iron overload and mimics human HH (Bahram
et al., 1999). As expected, Hfe-/- mice presented significantly augmented serum iron and
transferrin saturation when compared to other genotypes. However, Nrf2/Hfe-/- mice did
not present augmented levels of these parameters as would be expectable since the lack
of Hfe gene deregulates hepcidin expression and leads to systemic iron overload. The
surprisingly low levels of serum iron in Nrf2/Hfe-/- mice were not observed in younger
animals (Tiago Duarte, personal communication) and may be a consequence of the
anemia. The increased bone marrow iron demand (for erythrocyte production) may have
contributed to these low levels. Likewise, since there are less erythrocytes being recycled
by macrophages, consequently, less iron is expected to be released into the
bloodstream. The lack of Nrf2 gene seems to have no influence on serum iron and
transferrin saturation, as the values of Nrf2-/- mice were identical to the ones of WT mice.
Nrf2-/-, Hfe-/- and Nrf2/Hfe-/- livers presented significantly decreased Hamp mRNA
levels in comparison with WT livers. Low levels of Hamp transcript in Hfe-/- and Nrf2/Hfe-
/- livers were expected, since it was previously reported that the hepatic expression of
hepcidin is inappropriately low in the Hfe-/- mouse (Ahmad et al., 2002). However, lower
levels were not expected for Nrf2-/- mice. Further investigation needs to be done to
determine if the Nrf2 gene is involved in the regulation of Hamp transcription. The amount
of non-heme iron in the liver was significantly augmented in Hfe-/- and Nrf2/Hfe-/- mice
when compared to Nrf2-/- and WT mice. The increased hepatic non-heme iron, a feature
of Hfe-/- model (Bahram et al., 1999), was likely due to the decreased hepcidin
expression, which allows increased intestinal iron uptake and its delivery to plasma,
resulting in increased Tf saturation and tissue iron accumulation. The Hamp mRNA/Liver
non-heme Fe ratio is a measure of whether the hepcidin expression is adequate to the
hepatic iron stores. The ratio was significantly decreased in Hfe-/- and Nrf2/Hfe-/- mice
when compared to WT mice. These data indicate that the hepcidin expression is
insufficient to face the hepatic iron content of Hfe-/- and Nrf2/Hfe-/- mice, which is in
agreement with the lack of Hfe gene. It also indicates that, despite Nrf2-/- mice presenting
low levels of Hamp mRNA, the hepcidin expression is in agreement with the hepatic iron
FCUP
NRF2 protection against liver injury in human and mouse models of HH 59
content. A previous study by Ahmad et al., 2002 have already reported that the normal
relationship between iron stores and liver hepcidin expression is altered with the loss of
Hfe gene (Ahmad et al., 2002). The spleen and kidney non-heme iron contents were not
significantly different between the mice of the four genotypes, indicating that the non-
heme iron content of these organs is not influenced by the genotype.
Perls’ Prussian Blue staining revealed that the spleen of the mice of the four
genotypes accumulated high amounts of iron, whereas iron deposition was only detected
in the kidney, heart and pancreas of Nrf2/Hfe-/- mice. The spleen is an organ known to
accumulate large amounts of iron, as spleen macrophages are the main responsible for
erythrophagocitosis (Knutson and Wessling-Resnick, 2003). Our findings are surprising,
since Nrf2/Hfe-/- mice are mildly anemic, but also presented large amounts of iron in
Perls’ Prussian Blue staining. Nrf2/Hfe-/- mice seem to accumulate higher amounts of
iron in the parenchyma of the several organs than the other genotypes, in spite of the
anemia.
Liver sections stained with Perls’ Prussian Blue revealed higher amounts of iron
deposits (hemosiderin) in Hfe-/- and Nrf2/Hfe-/- mice than in Nrf2-/- and WT mice.
Hepatocytic iron was significantly increased in Hfe-/- and Nrf2/Hfe-/- mice when compared
to WT and Nrf2-/-, but the amount of iron in the hepatocytes of Hfe-/- mice was significantly
higher than the one in Nrf2/Hfe-/-. Hepatocytes are an important site of iron storage in the
form of ferritin, so it was already expected that Hfe-/- and Nrf2/Hfe-/- hepatocytes
presented high amounts of iron, since the lack of HFE leads to increased iron uptake.
What was an interesting finding was the fact that the Hfe-/- hepatocytes presented higher
levels of iron than Nrf2/Hfe-/- hepatocytes. These finding can be related to the anemia of
the Nrf2/Hfe-/- mice, since there was less iron in circulation and, consequently, less iron
to be stored in ferritin. On the other hand, sinusoidal iron was only augmented in Nrf2/Hfe-
/- mice. Sinusoidal iron corresponds to deposits of iron in Kupffer cells and endothelial
cells inside the liver sinusoids. A characteristic feature of mouse models of HH is the
iron-deficient phenotype of their macrophages, enterocytes and adipocytes in spite of
systemic iron overload (Fleming and Ponka, 2012). The presence of iron in Nrf2/Hfe-/-
sinusoids was unexpected, not only because of the iron-depletion phenotype expected,
but also because of the anemia. We can hypothesize that the lack of Nrf2 somehow
modulates iron metabolism in Hfe-/- mice, by shifting iron deposition from the liver
parenchyma to the sinusoidal cells. Possible explanations for this shift are the
phagocytosis of dead hepatocytes or increased erythrophagocytosis by sinusoidal cells.

60
FCUP
NRF2 protection against liver injury in human and mouse models of HH
4. Hfe and Nrf2 genes and oxidative stress
The liver is capable of accumulating high amounts of iron. The excess free iron leads to
liver damage due to ROS formation. NRF2 upregulates many cytoprotective enzymes
that take part in the antioxidant response and plays an important role in the hepatic aging
process. It has been demonstrated that age-related decrease in resistance to oxidative
stress results from the lower expression of antioxidant enzymes, including GPx, GR,
CAT, and NQO1 (Shih and Yen, 2007). Furthermore, with age, there is a substantial
reduction in glutathione (GSH) levels and in the expression and activity of glutamate
cysteine ligase, the rate controlling enzyme in GSH synthesis (Suh et al., 2004). These
events are accompanied by lower levels of NRF2 protein and a reduction in NRF2/ARE
binding, as well as increased markers of protein and lipid oxidation (Shih and Yen, 2007;
Suh et al., 2004). The reason why aging organisms gradually lose the ability to activate
NRF2 is currently not understood (Hayes and Dinkova-Kostova, 2014), but a decline in
NRF2 signaling is presumed to contribute to the age-related hepatic oxidative stress.
Transcript levels of Nqo1 showed a significant decrease in Nrf2 -/- and Nrf2/Hfe-/- livers
when compared to WT and Hfe-/- livers. This result was expected since the antioxidant
enzyme NQO1 is upregulated by NRF2. GSX, GSH and GSSG did not show significant
differences between the livers of the four genotypes. However, the GSH/GSSG ratio was
significantly decreased in Nrf2-/- livers when compared to Hfe-/- livers. This ratio
represents the balance between the reduced form of glutathione (GSH) and the oxidized
one (GSSG). A predominance of the oxidized form is suggestive of oxidative stress.
GSH/GSSG ratio was expected to be low in the absence of Nrf2 gene, so it is surprising
that Nrf2/Hfe-/- livers did not present an even lower ratio. MDA concentration, a marker
of lipid peroxidation, did not show significant differences between the livers of the four
genotypes. The lack of differences in MDA concentration may be possibly due to the late
age of the model, since, as mentioned before, the markers of lipid peroxidation tend to
augment with age.
5. Hfe and Nrf2 genes in liver fibrosis
One of the main consequences of HH is liver fibrosis, the accumulation of extracellular
matrix or scar tissue in the liver. Even if not statistically significant, the levels of Acta2
transcript were slightly augmented in Nrf2/Hfe-/- mice. This indicates that HSCs are being
transdifferentiated to α-SMA-positive myofibroblasts, the main producers of ECM.
Col1a1 gene, one of the genes involved in liver fibrosis, and the percentage of liver
fibrotic area were significantly augmented in Nrf2/Hfe-/- mice compared to Nrf2-/- mice
and to WT, Nrf2 -/- and Hfe-/- mice, respectively. Hydroxiproline, the major component of
FCUP
NRF2 protection against liver injury in human and mouse models of HH 61
collagen, and TIMP-1, an inhibitor of matrix metalloproteinases (responsible for ECM
degradation), were also slightly augmented in Nrf2/Hfe-/- mice. The degree of fibrosis
was further assessed in liver sections stained with Sirius Red. Fibrosis was more
exuberant in Nrf2/Hfe-/- mice. While in WT, Nrf2 -/- and Hfe-/- livers fibrosis was
mild/moderate and localized in zone 3 or in portal/periportal areas, Nrf2/Hfe-/- livers
presented bridging fibrosis, with collagen fibers linking portal and central veins. These
data are compatible with augmented production of ECM and decreased ECM
degradation in Nrf2/Hfe-/- mice. It is worth noting that the amount of non-heme Fe present
in the liver of Hfe-/- and Nrf2/Hfe-/- mice was very similar, but the former are protected
from fibrosis. Our findings thus indicate that Nrf2 gene is important in the progression of
HH.
6. Hfe and Nrf2 genes in liver inflammation and steatosis
Increased iron stores are correlated with markers of chronic inflammation and the
adaptation to iron deficiency confers resistance to infection and improves the
inflammatory condition. Hepcidin is upregulated by inflammatory stress response
pathways and triggers systemic iron withdrawal and sequestration due to ferroportin
down-regulation (Wessling-Resnick, 2010). Despite the large contribution of hepcidin,
other stress response pathways also participate in the inflammatory response, including
cytokine-mediated effects elicited by tumor necrosis factor-α (TNF-α) and interferon-γ
(IFN-γ) (Weiss, 2009). During inflammation, several cytokines, like IL-6, and
chemokines, such as CCL-2, are released (Liaskou et al., 2012). Although no significant
differences were detected in the levels of Tnf-α and Ccl2 genes in the livers of the mice
of the four genotypes, significantly decreased levels of Il-6 transcript were detected in
Nrf2-/- and Nrf2/Hfe-/- livers when compared to WT and Hfe-/- livers. These results were
not expected, since NRF2 is reported to have an anti-inflammatory role (Kensler et al.,
2007). We expected to see higher levels of markers of inflammation in Nrf2-/- and
Nrf2/Hfe-/- livers, since the antioxidant defense is compromised due to the lack of NRF2.
Nevertheless, despite of the low transcript levels of cytokines and chemokines in the liver
of Nrf2-/- and Nrf2/Hfe-/- mice, the levels of GM-CSF, IFN-γ, IL-1b, IL-6, IL-10, MCP-1 and
TNF-α were, although not significantly, augmented in Nrf2-/- serum. These data show us
that Nrf2-/- mice present slightly higher levels of pro-inflammatory cytokines and
chemokines than the mice of the other genotypes. Lobular inflammation was assessed
in H&E stained liver sections and no significant differences were found, which indicates
that the low levels of inflammation seen in the livers of the four genotypes must be a

62
FCUP
NRF2 protection against liver injury in human and mouse models of HH
consequence of the advanced age of the model rather than a consequence of the
genotype.
Steatosis is commonly observed in HFE-related iron-overload disorders, like HH, and
current evidence suggests a causal link between iron and steatosis (Tan et al., 2011).
Excessive iron causes oxidative stress that leads to mitochondrial dysfunction, impaired
fatty acid (FA) oxidation and subsequent development of steatosis (Rector et al., 2010).
In this study, steatosis was significantly augmented in Hfe-/- livers when compared to WT
and Nrf2-/- livers. Tan et al., 2011 have already reported an augment of steatosis degree
in Hfe-/- mice when compared to WT mice (Tan et al., 2011). Steatosis was not observed,
however, in Nrf2/Hfe-/- mice, possibly as a consequence of their low body
weight/condition.
7. Hfe and Nrf2 genes and liver damage
Oxidative stress affects liver function, induces hepatocyte cell death and disturbs the
regeneration process after injury (Fausto, 2000), so NRF2 is essential to protect the liver
against possible injuries caused by oxidative stress. It was reported that pharmacological
activation of Nrf2, for example, by synthetic triterpenoids or avicins, could be a promising
new strategy to improve regeneration in patients with acute or chronic liver damage
(Hanausek et al., 2001; Hyer et al., 2005; Liby et al., 2005). In the current study, ALT
activity in serum, a marker of liver damage, was not augmented in Nrf2-/- and Nrf2/Hfe-/-
mice. However, the number of TUNEL-positive cells and the degree of necrosis were
significantly increased in Nrf2/Hfe-/- livers, indicating that double knockout mice had more
hepatic cell death. This study showed that the suppression of NRF2 leads to
spontaneous liver damage in the mouse model of HH (Hfe-/-), which suggests that NRF2
may also play an important hepatoprotectant role in HH patients.
Human study
It is known that oxidative stress may aggravate the clinical expression of HH
(Pietrangelo, 2010). NRF2 is one key transcription factor involved in the antioxidant
defense and there are strong associations between NRF2 sequence variations and
disease risks (Cho, 2013). In this work we aimed to determine if SNPs in the promoter
region of NRF2 gene could influence the severity of HH. For that purpose we estimated
allele frequencies of known SNPs in the NRF2 promoter region in a large cohort of
clinically well characterized HH patients and analysed both allele and genotype
frequencies in relation to a set of clinical relevant variables.
FCUP
NRF2 protection against liver injury in human and mouse models of HH 63
Patients in our study presented elevated levels of ferritin and transferrin saturation,
typical features of HH patients (Beutler, 2006) that are indicative of systemic iron
overload. The severity of the iron overload ranged from moderate to severe. In terms of
clinical manifestations, skin pigmentation was the most common one (17.9%), followed
by cirrhosis (21.4%), arthropathy (16.4%), diabetes (4.5%) and hypogonadism (1.5%).
When comparing the frequencies of Rs35652124, Rs6706649, Rs150648896 and
Rs6721961 SNPs between the total 97 DNA samples from unrelated subjects and the
ones reported in Ensembl for the European population, no statistically significant
differences were observed. Moreover, when comparing the frequency of each SNP in
patients clinically well characterized (n = 57) according to the expression of the disease,
also no significant differences were found indicating that, in general, none of the studied
SNPs per se prompts the patients to develop a specific clinical manifestation.
Nevertheless, the frequency of the allele T in Rs35652124 SNP was increased in
patients with cirrhosis and in symptomatic patients in general, when compared to patients
without cirrhosis and without any clinical manifestations. To further clarify this question,
we compared genotypes homozygous for the allele T in Rs35652124 SNP (Total TT)
and genotypes homozygous/heterozygous for the allele C in Rs35652124 SNP (Total
with C) in a subgroup of patients (n = 36) more strictly selected in terms of clinical
variables. We then observed that frequency of cirrhosis was significantly increased in
Total TT when compared to Total with CC genotypes and, although not statistically
significant, symptomatic patients in general were also more common in Total TT
genotypes. One should note that TBIS were also significantly increased in Total TT
genotypes, therefore at this stage we cannot distinguish the relative impact of genotype
and/or iron overload in the frequency of cirrhosis. Further extended studies, with a larger
sample of patients, are needed to clarify that question. We can exclude, however, the
impact of CD8+ T lymphocyte numbers on the results observed. It is known that low
numbers of CD8+ T-lymphocytes are associated with a more severe iron overload and
clinical expression in HH patients (Cruz et al., 2006). Since no significant differences
were found in the CD8 phenotype between Total TT and Total with C genotypes, we can
exclude CD8+ T-lymphocytes as the origin of the different clinical manifestation between
the two groups.
It is worth noting that the Rs35652124 T allele, which was found here associated with
a more severe clinical expression, is the most frequent in the normal European
population. If natural selection favored this allele in normal populations, we would not
expect it have appeared as a particularly deleterious genotype in patients with HH, where
it is also naturally more common. On the contrary, we hypothesize that the rarer allele C
64
FCUP
NRF2 protection against liver injury in human and mouse models of HH
in Rs35652124 SNP may act as a putative protective allele in HH, since, in our cohort,
patients with this genotype had a less severe clinical picture. The Rs35652124 SNP has
been previously reported to be a functional SNP predicted to affect Nrf2 myeloid zinc
finger 1 (MZF1) promoter binding site. More specifically, the Rs35652124 C allele was
shown to reduce the transcription activity of Nrf2 in a Luciferase activity assay (Marzec
et al., 2007), presumably resulting in decreased Nrf2-dependent gene transcription.
Interestingly, a study by von Otter et al., 2014 implicated Rs35652124 SNP in the
progression of Parkinson’s disease showing that the Rs35652124 T allele was part of a
protective haplotype that was associated with decreased risk and later onset of
Parkinson’s disease (von Otter et al., 2014). How could differences in the transcription
activity of NRF2 affect iron metabolism and the clinical consequences of HH, this is
certainly a subject of great interest for future research in the iron biology field.
Study limitations
We acknowledge that the human study has two important limitations. One is the small
sample size. More patients must be recruited in future in order to gain statistical power
and hence augment the chances of finding significant associations between NRF2 SNPs
and the clinical manifestation of HH. We should stress, however, that the reduction in
the sample size from the original total number of patients genotyped was done with the
objective of maintaining highly rigorous and strict clinical criteria. The second limitation
of the study was the fact that we have only analyzed SNPs present in the promoter region
of the NRF2 gene. Even though there is evidence in the literature linking Rs35652124,
Rs6706649, Rs150648896 and Rs6721961 SNPs to phenotype-variants of certain
diseases, it would be interesting to also study polymorphisms in the coding region of the
NRF2 gene, by TaqMan Allelic Discrimination Assay, a multiplexed end-point assay that
detects variants of a single nucleic acid sequence, or by sequencing the exons and exon-
flanking regions.
FCUP
NRF2 protection against liver injury in human and mouse models of HH 65
Conclusions
In this study, Hfe-/- mice were used as a model of HH, mimicking what happens in patients
homozygous for the HFE C282Y mutation. It is known that the lack of the Hfe gene leads
to iron overload. The liver is capable of accumulating high amounts of iron and, in turn,
iron is capable of generating ROS, leading to oxidative stress. Oxidative stress, in the
absence of proper antioxidant defense, can lead to liver damage. NRF2 is the key
transcription factor that regulates the antioxidant defense. Nrf2/Hfe-/- mice thus represent
what happens to HH patients in the absence of an appropriate antioxidant defense.
In our study, Nrf2/Hfe-/- mice were mildly anemic. Even if we could not determine the
exact source of the anemia, we suppose that the lack of both Nrf2 and Hfe genes may
have contributed to this finding, as Hfe gene is essential to balance the iron uptake by
RBC and Nrf2 gene is necessary to increase RBC survival in the presence of ROS.
Nrf2/Hfe-/- mice were also hypoglycemic. We hypothesized that the hypoglycemia at
starvation could be a consequence of the worse body condition of Nrf2/Hfe-/- mice, as
they presented the lowest weight.
Nrf2/Hfe-/- mice presented lower levels of serum iron and transferrin saturation than
Hfe-/- mice. The lack of NRF2 seems to have no influence on these parameters, since
identical values were observed in Nrf2-/- and WT mice. The low serum iron and transferrin
saturation of Nrf2/Hfe-/- mice were possibly a consequence of the anemia, as a decrease
in erythrophagocytosis would be expected to decrease iron liberation into the
bloodstream. An increase in bone marrow iron demand would also be expected to
diminish the iron in circulation. In Nrf2/Hfe-/- mice, iron deposits were observed in the
sinusoidal cells, contrary to the exclusive iron deposition in the liver parenchyma in Hfe-
/- mice. NRF2 thus seems to modulate iron metabolism in Hfe-/- mice, by shifting iron
deposition from the liver parenchyma to the sinusoidal cells.
Nrf2 -/- and Nrf2/Hfe-/- livers presented significantly decreased transcript levels of Nqo1
when compared to WT and Hfe-/- mice, confirming that the NRF2 signaling pathway was
not being activated, due to the lack of functional NRF2 in these animals. Besides, the
GSH/GSSG ratio was significantly decreased in Nrf2-/- livers when compared to Hfe-/-
livers. These data indicate that Nrf2-/- mice are under more oxidative stress than Hfe-/-
mice, which reinforces the importance of NRF2 in the antioxidant defense. It is worth
noting that MDA concentration of the four genotypes was not statistically different,
suggesting that the occurrence of lipid peroxidation may be a consequence of the late
age of the model, as the markers of lipid peroxidation tend to augment with age.
Mild liver inflammation was detected in mice of the four genotypes, with no significant
differences between the experimental groups. The low levels of inflammation are thus

66
FCUP
NRF2 protection against liver injury in human and mouse models of HH
likely to be a consequence of the advanced age of the model rather than a consequence
of the genotype. On the other hand, steatosis was significantly augmented in Hfe-/- livers,
but not in Nrf2/Hfe-/- livers, when compared to WT and Nrf2-/- livers. We speculate that
the absence of steatosis in Nrf2/Hfe-/- mice may be a consequence of their low body
weight/condition.
The amount of non-heme Fe present in the livers of Hfe-/- and Nrf2/Hfe-/- mice was
very similar, but markers of liver fibrosis and the degree of liver fibrosis were augmented
only in Nrf2/Hfe-/- livers. Likewise, the number of TUNEL-positive cells and the degree of
necrosis were significantly increased only in Nrf2/Hfe-/- livers, indicating increased
hepatic cell death. Overall, we conclude that the suppression of NRF2 leads to
spontaneous liver damage in Hfe-/- mice, the mouse model of HH. Based on this
evidence, we hypothesize that NRF2 may also play an important role in HH patients,
protecting hepatic cells from the damage caused by excessive iron.
To address that hypothesis, we asked if some SNP variants in the NRF2 promoter
region could prompt HH patients to develop a more severe phenotype of the disease.
Our results indicate that none of the SNPs alone prompts the patients to develop a
specific clinical manifestation, but it showed that patients carrying the allele C in
Rs35652124 SNP are somehow protected from clinical manifestations of HH. Further
studies are required to overcome the present sample limitations and to determine if the
here observed effect is the result of a lower accumulation of iron in allele C carriers or
from an enhanced antioxidant response in these subjects.
In conclusion, the current study shows that NRF2 has an important hepatoprotective
role in the animal model of HH and suggests that gene variants may be also implicated
in the clinical course of the human disease. The possibility that SNPs in the NRF2 gene
may modify HH penetrance warrants further investigation.
Future perspectives
Concerning the animal study, the anemia and hypoglycemia at starvation of the Nrf2/Hfe-
/- mice need to be clarified. The low body weight/condition of Nrf2/Hfe-/- mice also needs
to be investigated, to determine if the lack of both Nrf2 and Hfe genes combined with the
advanced age of the model is by itself the origin of this poor condition. The role of NRF2
as a modulator of iron distribution in Hfe-/- mice and the mechanisms how NRF2 protects
these mice against liver damage also need to be clarified. In what concerns the human
study, more SNPs should be studied (including coding regions of the NRF2 gene) and
the sample size should be increased, in order to determine if there is an association
between NRF2 genetic variants and clinical manifestations of HH.

FCUP
NRF2 protection against liver injury in human and mouse models of HH 67
Publications
Chambel, S.S., Santos-Goncalves, A., and Duarte, T.L. (2015). The Dual Role of Nrf2 in
Nonalcoholic Fatty Liver Disease: Regulation of Antioxidant Defenses and Hepatic Lipid
Metabolism. BioMed research international 2015, 597134.


FCUP
NRF2 protection against liver injury in human and mouse models of HH 69
References
Abboud, S., and Haile, D.J. (2000). A novel mammalian iron-regulated protein involved in intracellular iron metabolism. The Journal of biological chemistry 275, 19906-19912. Ahmad, K.A., Ahmann, J.R., Migas, M.C., Waheed, A., Britton, R.S., Bacon, B.R., Sly, W.S., and Fleming, R.E. (2002). Decreased liver hepcidin expression in the Hfe knockout mouse. Blood cells, molecules & diseases 29, 361-366. Aisen, P. (2004). Transferrin receptor 1. The international journal of biochemistry & cell biology 36, 2137-2143. Andrews, N.C. (1999). Disorders of iron metabolism. The New England journal of medicine 341, 1986-1995. Andrews, N.C., and Schmidt, P.J. (2007). Iron homeostasis. Annual review of physiology 69, 69-85. Aronoff, S.L., Berkowitz, K., Shreiner, B., and Want, L. (2004). Glucose metabolism and regulation: beyond insulin and glucagon. Diabetes Spectrum 17, 183-190. Aslinia, F., Mazza, J.J., and Yale, S.H. (2006). Megaloblastic Anemia and Other Causes of Macrocytosis. Clinical Medicine and Research 4, 236-241. Austyn, J.M., and Gordon, S. (1981). F4/80, a monoclonal antibody directed specifically against the mouse macrophage. European journal of immunology 11, 805-815. Ayonrinde, O.T., Milward, E.A., Chua, A.C., Trinder, D., and Olynyk, J.K. (2008). Clinical perspectives on hereditary hemochromatosis. Critical reviews in clinical laboratory sciences 45, 451-484. Bacon, B.R. (1997). Diagnosis and management of hemochromatosis. Gastroenterology 113, 995-999. Bahram, S., Gilfillan, S., Kuhn, L.C., Moret, R., Schulze, J.B., Lebeau, A., and Schumann, K. (1999). Experimental hemochromatosis due to MHC class I HFE deficiency: immune status and iron metabolism. Proceedings of the National Academy of Sciences of the United States of America 96, 13312-13317. Barbero-Becerra, V.J., Giraudi, P.J., Chavez-Tapia, N.C., Uribe, M., Tiribelli, C., and Rosso, N. (2015). The interplay between hepatic stellate cells and hepatocytes in an in vitro model of NASH. Toxicology in vitro : an international journal published in association with BIBRA 29, 1753-1758. Barton, J.C., Bertoli, L.F., and Rothenberg, B.E. (2000). Peripheral blood erythrocyte parameters in hemochromatosis: evidence for increased erythrocyte hemoglobin content. The Journal of laboratory and clinical medicine 135, 96-104. Bataller, R., and Brenner, D.A. (2005). Liver fibrosis. The Journal of clinical investigation 115, 209-218. Beguin, Y., Clemons, G.K., Pootrakul, P., and Fillet, G. (1993). Quantitative assessment of erythropoiesis and functional classification of anemia based on measurements of serum transferrin receptor and erythropoietin. Blood 81, 1067-1076. Bernard, J. (1991). The erythroblastic island: past and future. Blood cells 17, 5-10; discussion 10-14. Beutler, E. (2006). Hemochromatosis: genetics and pathophysiology. Annual review of medicine 57, 331-347. Bioulac-Sage, P., and Lebail B. Balabaud, C. (2007). Liver and biliary tract histology. In Textbook of hepatology: from basic science to clinical practice (Malden: Wiley-Blackwell Publishing). Brown, P.J., and Johnson, P.M. (1981). Isolation of a transferrin receptor structure from sodium deoxycholate-solubilized human placental syncytiotrophoblast plasma membrane. Placenta 2, 1-10.
70
FCUP
NRF2 protection against liver injury in human and mouse models of HH
Cabiscol, E., Tamarit, J., and Ros, J. (2000). Oxidative stress in bacteria and protein damage by reactive oxygen species. International microbiology : the official journal of the Spanish Society for Microbiology 3, 3-8. Camaschella, C., Roetto, A., Cali, A., De Gobbi, M., Garozzo, G., Carella, M., Majorano, N., Totaro, A., and Gasparini, P. (2000). The gene TFR2 is mutated in a new type of haemochromatosis mapping to 7q22. Nature genetics 25, 14-15. Canonne-Hergaux, F., Donovan, A., Delaby, C., Wang, H.J., and Gros, P. (2006). Comparative studies of duodenal and macrophage ferroportin proteins. American journal of physiology Gastrointestinal and liver physiology 290, G156-163. Cartwright, G. (1966). The anemia of chronic disorders. Paper presented at: Seminars in hematology. Casanovas, G., Mleczko-Sanecka, K., Altamura, S., Hentze, M.W., and Muckenthaler, M.U. (2009). Bone morphogenetic protein (BMP)-responsive elements located in the proximal and distal hepcidin promoter are critical for its response to HJV/BMP/SMAD. Journal of molecular medicine (Berlin, Germany) 87, 471-480. Caza, M., and Kronstad, J.W. (2013). Shared and distinct mechanisms of iron acquisition by bacterial and fungal pathogens of humans. Frontiers in cellular and infection microbiology 3, 80. Chai, Y.C., Ashraf, S.S., Rokutan, K., Johnston, R.B., Jr., and Thomas, J.A. (1994). S-thiolation of individual human neutrophil proteins including actin by stimulation of the respiratory burst: evidence against a role for glutathione disulfide. Archives of biochemistry and biophysics 310, 273-281. Chalasani, N., Wilson, L., Kleiner, D.E., Cummings, O.W., Brunt, E.M., and Unalp, A. (2008). Relationship of steatosis grade and zonal location to histological features of steatohepatitis in adult patients with non-alcoholic fatty liver disease. Journal of hepatology 48, 829-834. Chateauvieux, S., Grigorakaki, C., Morceau, F., Dicato, M., and Diederich, M. (2011). Erythropoietin, erythropoiesis and beyond. Biochemical pharmacology 82, 1291-1303. Cho, H.Y. (2013). Genomic structure and variation of nuclear factor (erythroid-derived 2)-like 2. Oxidative medicine and cellular longevity 2013, 286524. Cohen, L.A., Gutierrez, L., Weiss, A., Leichtmann-Bardoogo, Y., Zhang, D.L., Crooks, D.R., Sougrat, R., Morgenstern, A., Galy, B., Hentze, M.W., et al. (2010). Serum ferritin is derived primarily from macrophages through a nonclassical secretory pathway. Blood 116, 1574-1584. Cooksey, R.C., Jouihan, H.A., Ajioka, R.S., Hazel, M.W., Jones, D.L., Kushner, J.P., and McClain, D.A. (2004). Oxidative stress, beta-cell apoptosis, and decreased insulin secretory capacity in mouse models of hemochromatosis. Endocrinology 145, 5305-5312. Cruz, E., Melo, G., Lacerda, R., Almeida, S., and Porto, G. (2006). The CD8+ T-lymphocyte profile as a modifier of iron overload in HFE hemochromatosis: an update of clinical and immunological data from 70 C282Y homozygous subjects. Blood cells, molecules & diseases 37, 33-39. Delaby, C., Rondeau, C., Pouzet, C., Willemetz, A., Pilard, N., Desjardins, M., and Canonne-Hergaux, F. (2012). Subcellular localization of iron and heme metabolism related proteins at early stages of erythrophagocytosis. PloS one 7, e42199. Deugnier, Y.M., Turlin, B., Powell, L.W., Summers, K.M., Moirand, R., Fletcher, L., Loreal, O., Brissot, P., and Halliday, J.W. (1993). Differentiation between heterozygotes and homozygotes in genetic hemochromatosis by means of a histological hepatic iron index: a study of 192 cases. Hepatology (Baltimore, Md) 17, 30-34. Donovan, A., Brownlie, A., Zhou, Y., Shepard, J., Pratt, S.J., Moynihan, J., Paw, B.H., Drejer, A., Barut, B., Zapata, A., et al. (2000). Positional cloning of zebrafish ferroportin1 identifies a conserved vertebrate iron exporter. Nature 403, 776-781. Dunn, L.L., Suryo Rahmanto, Y., and Richardson, D.R. (2007). Iron uptake and metabolism in the new millennium. Trends in cell biology 17, 93-100.

FCUP
NRF2 protection against liver injury in human and mouse models of HH 71
Evstatiev, R., and Gasche, C. (2012). Iron sensing and signalling. Gut 61, 933-952. Fausto, N. (2000). Liver regeneration. Journal of hepatology 32, 19-31. Feeney, G.P., Carter, K., Masters, G.S., Jackson, H.A., Cavil, I., and Worwood, M. (2005). Changes in erythropoiesis in hereditary hemochromatosis are not mediated by HFE expression in nucleated red cells. Haematologica 90, 180-187. Fernandez-Real, J.M., Lopez-Bermejo, A., and Ricart, W. (2002). Cross-talk between iron metabolism and diabetes. Diabetes 51, 2348-2354. Fleming, R.E., Ahmann, J.R., Migas, M.C., Waheed, A., Koeffler, H.P., Kawabata, H., Britton, R.S., Bacon, B.R., and Sly, W.S. (2002). Targeted mutagenesis of the murine transferrin receptor-2 gene produces hemochromatosis. Proceedings of the National Academy of Sciences of the United States of America 99, 10653-10658. Fleming, R.E., and Ponka, P. (2012). Iron overload in human disease. The New England journal of medicine 366, 348-359. Ford, E.S., and Cogswell, M.E. (1999). Diabetes and serum ferritin concentration among U.S. adults. Diabetes care 22, 1978-1983. Forouhi, N.G., Harding, A.H., Allison, M., Sandhu, M.S., Welch, A., Luben, R., Bingham, S., Khaw, K.T., and Wareham, N.J. (2007). Elevated serum ferritin levels predict new-onset type 2 diabetes: results from the EPIC-Norfolk prospective study. Diabetologia 50, 949-956. Fowell, A.J., Collins, J.E., Duncombe, D.R., Pickering, J.A., Rosenberg, W.M., and Benyon, R.C. (2011). Silencing tissue inhibitors of metalloproteinases (TIMPs) with short interfering RNA reveals a role for TIMP-1 in hepatic stellate cell proliferation. Biochemical and biophysical research communications 407, 277-282. Fraser, S.T., Midwinter, R.G., Berger, B.S., and Stocker, R. (2011). Heme Oxygenase-1: A Critical Link between Iron Metabolism, Erythropoiesis, and Development. Advances in hematology 2011, 473709. Ganz, T. (2013). Systemic iron homeostasis. Physiological reviews 93, 1721-1741. Ganz, T., and Nemeth, E. (2012). Hepcidin and iron homeostasis. Biochimica et biophysica acta 1823, 1434-1443. Gao, J., Chen, J., Kramer, M., Tsukamoto, H., Zhang, A.S., and Enns, C.A. (2009). Interaction of the hereditary hemochromatosis protein HFE with transferrin receptor 2 is required for transferrin-induced hepcidin expression. Cell metabolism 9, 217-227. Gkouvatsos, K., Papanikolaou, G., and Pantopoulos, K. (2012). Regulation of iron transport and the role of transferrin. Biochimica et biophysica acta 1820, 188-202. Gordon, S., and Taylor, P.R. (2005). Monocyte and macrophage heterogeneity. Nature reviews Immunology 5, 953-964. Gunshin, H., Mackenzie, B., Berger, U.V., Gunshin, Y., Romero, M.F., Boron, W.F., Nussberger, S., Gollan, J.L., and Hediger, M.A. (1997). Cloning and characterization of a mammalian proton-coupled metal-ion transporter. Nature 388, 482-488. Gunshin, H., Starr, C.N., Direnzo, C., Fleming, M.D., Jin, J., Greer, E.L., Sellers, V.M., Galica, S.M., and Andrews, N.C. (2005). Cybrd1 (duodenal cytochrome b) is not necessary for dietary iron absorption in mice. Blood 106, 2879-2883. Halliwell, B., and Gutteridge, J.M. (1990). Role of free radicals and catalytic metal ions in human disease: an overview. Methods in enzymology 186, 1-85. Hanausek, M., Ganesh, P., Walaszek, Z., Arntzen, C.J., Slaga, T.J., and Gutterman, J.U. (2001). Avicins, a family of triterpenoid saponins from Acacia victoriae (Bentham), suppress H-ras mutations and aneuploidy in a murine skin carcinogenesis model. Proceedings of the National Academy of Sciences of the United States of America 98, 11551-11556. Hayes, J.D., and Dinkova-Kostova, A.T. (2014). The Nrf2 regulatory network provides an interface between redox and intermediary metabolism. Trends in biochemical sciences 39, 199-218.
72
FCUP
NRF2 protection against liver injury in human and mouse models of HH
Healy, J., and Tipton, K. (2007). Ceruloplasmin and what it might do. Journal of neural transmission (Vienna, Austria : 1996) 114, 777-781. Hentze, M.W., Muckenthaler, M.U., and Andrews, N.C. (2004). Balancing acts: molecular control of mammalian iron metabolism. Cell 117, 285-297. Hentze, M.W., Muckenthaler, M.U., Galy, B., and Camaschella, C. (2010). Two to tango: regulation of Mammalian iron metabolism. Cell 142, 24-38. Hider, R.C. (2002). Nature of nontransferrin-bound iron. European journal of clinical investigation 32 Suppl 1, 50-54. Huang, J., Jones, D., Luo, B., Sanderson, M., Soto, J., Abel, E.D., Cooksey, R.C., and McClain, D.A. (2011). Iron overload and diabetes risk: a shift from glucose to Fatty Acid oxidation and increased hepatic glucose production in a mouse model of hereditary hemochromatosis. Diabetes 60, 80-87. Hvidberg, V., Maniecki, M.B., Jacobsen, C., Hojrup, P., Moller, H.J., and Moestrup, S.K. (2005). Identification of the receptor scavenging hemopexin-heme complexes. Blood 106, 2572-2579. Hyer, M.L., Croxton, R., Krajewska, M., Krajewski, S., Kress, C.L., Lu, M., Suh, N., Sporn, M.B., Cryns, V.L., Zapata, J.M., et al. (2005). Synthetic triterpenoids cooperate with tumor necrosis factor-related apoptosis-inducing ligand to induce apoptosis of breast cancer cells. Cancer research 65, 4799-4808. Ilyin, G., Courselaud, B., Troadec, M.B., Pigeon, C., Alizadeh, M., Leroyer, P., Brissot, P., and Loreal, O. (2003). Comparative analysis of mouse hepcidin 1 and 2 genes: evidence for different patterns of expression and co-inducibility during iron overload. FEBS letters 542, 22-26. Itoh, K., Chiba, T., Takahashi, S., Ishii, T., Igarashi, K., Katoh, Y., Oyake, T., Hayashi, N., Satoh, K., Hatayama, I., et al. (1997). An Nrf2/small Maf heterodimer mediates the induction of phase II detoxifying enzyme genes through antioxidant response elements. Biochemical and biophysical research communications 236, 313-322. Kahn, C.M. (2010). The Merck Veterinary Manual. In The Merck Veterinary Manual, C.M. Kahn, ed. (Merck & Co., Inc.). Kansanen, E., Jyrkkanen, H.K., and Levonen, A.L. (2012). Activation of stress signaling pathways by electrophilic oxidized and nitrated lipids. Free radical biology & medicine 52, 973-982. Kartikasari, A.E., Wagener, F.A., Yachie, A., Wiegerinck, E.T., Kemna, E.H., and Swinkels, D.W. (2009). Hepcidin suppression and defective iron recycling account for dysregulation of iron homeostasis in heme oxygenase-1 deficiency. Journal of cellular and molecular medicine 13, 3091-3102. Kato, G.J., McGowan, V., Machado, R.F., Little, J.A., Taylor, J.t., Morris, C.R., Nichols, J.S., Wang, X., Poljakovic, M., Morris, S.M., Jr., et al. (2006). Lactate dehydrogenase as a biomarker of hemolysis-associated nitric oxide resistance, priapism, leg ulceration, pulmonary hypertension, and death in patients with sickle cell disease. Blood 107, 2279-2285. Kautz, L., Jung, G., Valore, E.V., Rivella, S., Nemeth, E., and Ganz, T. (2014). Identification of erythroferrone as an erythroid regulator of iron metabolism. Nature genetics 46, 678-684. Kautz, L., Meynard, D., Monnier, A., Darnaud, V., Bouvet, R., Wang, R.H., Deng, C., Vaulont, S., Mosser, J., Coppin, H., et al. (2008). Iron regulates phosphorylation of Smad1/5/8 and gene expression of Bmp6, Smad7, Id1, and Atoh8 in the mouse liver. Blood 112, 1503-1509. Kawabata, H., Yang, R., Hirama, T., Vuong, P.T., Kawano, S., Gombart, A.F., and Koeffler, H.P. (1999). Molecular cloning of transferrin receptor 2. A new member of the transferrin receptor-like family. The Journal of biological chemistry 274, 20826-20832. Kawatani, Y., Suzuki, T., Shimizu, R., Kelly, V.P., and Yamamoto, M. (2011). Nrf2 and selenoproteins are essential for maintaining oxidative homeostasis in erythrocytes and protecting against hemolytic anemia. Blood 117, 986-996.
FCUP
NRF2 protection against liver injury in human and mouse models of HH 73
Kensler, T.W., Wakabayashi, N., and Biswal, S. (2007). Cell survival responses to environmental stresses via the Keap1-Nrf2-ARE pathway. Annual review of pharmacology and toxicology 47, 89-116. Khan, A.A., and Quigley, J.G. (2011). Control of intracellular heme levels: heme transporters and heme oxygenases. Biochimica et biophysica acta 1813, 668-682. Klaassen, C.D., and Reisman, S.A. (2010). Nrf2 the rescue: effects of the antioxidative/electrophilic response on the liver. Toxicology and applied pharmacology 244, 57-65. Kleiner, D.E., Brunt, E.M., Van Natta, M., Behling, C., Contos, M.J., Cummings, O.W., Ferrell, L.D., Liu, Y.C., Torbenson, M.S., Unalp-Arida, A., et al. (2005). Design and validation of a histological scoring system for nonalcoholic fatty liver disease. Hepatology (Baltimore, Md) 41, 1313-1321. Knutson, M., and Wessling-Resnick, M. (2003). Iron metabolism in the reticuloendothelial system. Critical reviews in biochemistry and molecular biology 38, 61-88. Kovtunovych, G., Eckhaus, M.A., Ghosh, M.C., Ollivierre-Wilson, H., and Rouault, T.A. (2010). Dysfunction of the heme recycling system in heme oxygenase 1-deficient mice: effects on macrophage viability and tissue iron distribution. Blood 116, 6054-6062. Kristiansen, M., Graversen, J.H., Jacobsen, C., Sonne, O., Hoffman, H.J., Law, S.K., and Moestrup, S.K. (2001). Identification of the haemoglobin scavenger receptor. Nature 409, 198-201. Laftah, A.H., Latunde-Dada, G.O., Fakih, S., Hider, R.C., Simpson, R.J., and McKie, A.T. (2009). Haem and folate transport by proton-coupled folate transporter/haem carrier protein 1 (SLC46A1). The British journal of nutrition 101, 1150-1156. Lane, D.J., Merlot, A.M., Huang, M.L., Bae, D.H., Jansson, P.J., Sahni, S., Kalinowski, D.S., and Richardson, D.R. (2015). Cellular iron uptake, trafficking and metabolism: Key molecules and mechanisms and their roles in disease. Biochimica et biophysica acta 1853, 1130-1144. LeCluyse, E.L., Witek, R.P., Andersen, M.E., and Powers, M.J. (2012). Organotypic liver culture models: meeting current challenges in toxicity testing. Critical reviews in toxicology 42, 501-548. Lee, J.M., Calkins, M.J., Chan, K., Kan, Y.W., and Johnson, J.A. (2003). Identification of the NF-E2-related factor-2-dependent genes conferring protection against oxidative stress in primary cortical astrocytes using oligonucleotide microarray analysis. The Journal of biological chemistry 278, 12029-12038. Levi, S., Corsi, B., Bosisio, M., Invernizzi, R., Volz, A., Sanford, D., Arosio, P., and Drysdale, J. (2001). A human mitochondrial ferritin encoded by an intronless gene. The Journal of biological chemistry 276, 24437-24440. Liaskou, E., Wilson, D.V., and Oo, Y.H. (2012). Innate immune cells in liver inflammation. Mediators of inflammation 2012, 949157. Liby, K., Hock, T., Yore, M.M., Suh, N., Place, A.E., Risingsong, R., Williams, C.R., Royce, D.B., Honda, T., Honda, Y., et al. (2005). The synthetic triterpenoids, CDDO and CDDO-imidazolide, are potent inducers of heme oxygenase-1 and Nrf2/ARE signaling. Cancer research 65, 4789-4798. Lim, J.E., Jin, O., Bennett, C., Morgan, K., Wang, F., Trenor, C.C., 3rd, Fleming, M.D., and Andrews, N.C. (2005). A mutation in Sec15l1 causes anemia in hemoglobin deficit (hbd) mice. Nature genetics 37, 1270-1273. Liuzzi, J.P., Aydemir, F., Nam, H., Knutson, M.D., and Cousins, R.J. (2006). Zip14 (Slc39a14) mediates non-transferrin-bound iron uptake into cells. Proceedings of the National Academy of Sciences of the United States of America 103, 13612-13617. Mackenzie, B., Shawki, A., Kim, R., Anthony, S.R., Knight, P.B., Bradford, E.M., and Shull, G.E. (2011). Intestinal brush-border Na+/H+ exchangers are required for iron homeostasis in the mouse. The FASEB Journal 25, 238.231.

74
FCUP
NRF2 protection against liver injury in human and mouse models of HH
Marzec, J.M., Christie, J.D., Reddy, S.P., Jedlicka, A.E., Vuong, H., Lanken, P.N., Aplenc, R., Yamamoto, T., Yamamoto, M., Cho, H.Y., et al. (2007). Functional polymorphisms in the transcription factor NRF2 in humans increase the risk of acute lung injury. FASEB journal : official publication of the Federation of American Societies for Experimental Biology 21, 2237-2246. McCord, J.M., and Fridovich, I. (1969). Superoxide dismutase. An enzymic function for erythrocuprein (hemocuprein). The Journal of biological chemistry 244, 6049-6055. McKie, A.T., Barrow, D., Latunde-Dada, G.O., Rolfs, A., Sager, G., Mudaly, E., Mudaly, M., Richardson, C., Barlow, D., Bomford, A., et al. (2001). An iron-regulated ferric reductase associated with the absorption of dietary iron. Science (New York, NY) 291, 1755-1759. McKie, A.T., Marciani, P., Rolfs, A., Brennan, K., Wehr, K., Barrow, D., Miret, S., Bomford, A., Peters, T.J., Farzaneh, F., et al. (2000). A novel duodenal iron-regulated transporter, IREG1, implicated in the basolateral transfer of iron to the circulation. Molecular cell 5, 299-309. McLaren, C.E., Barton, J.C., Gordeuk, V.R., Wu, L., Adams, P.C., Reboussin, D.M., Speechley, M., Chang, H., Acton, R.T., Harris, E.L., et al. (2007). Determinants and characteristics of mean corpuscular volume and hemoglobin concentration in white HFE C282Y homozygotes in the hemochromatosis and iron overload screening study. American journal of hematology 82, 898-905. Muckenthaler, M.U. (2014). How mutant HFE causes hereditary hemochromatosis. Blood 124, 1212-1213. Muckenthaler, M.U., Galy, B., and Hentze, M.W. (2008). Systemic iron homeostasis and the iron-responsive element/iron-regulatory protein (IRE/IRP) regulatory network. Annual review of nutrition 28, 197-213. Murphy, F.R., Issa, R., Zhou, X., Ratnarajah, S., Nagase, H., Arthur, M.J., Benyon, C., and Iredale, J.P. (2002). Inhibition of apoptosis of activated hepatic stellate cells by tissue inhibitor of metalloproteinase-1 is mediated via effects on matrix metalloproteinase inhibition: implications for reversibility of liver fibrosis. The Journal of biological chemistry 277, 11069-11076. Naigamwalla, D.Z., Webb, J.A., and Giger, U. (2012). Iron deficiency anemia. The Canadian Veterinary Journal 53, 250-256. Nemeth, E., Tuttle, M.S., Powelson, J., Vaughn, M.B., Donovan, A., Ward, D.M., Ganz, T., and Kaplan, J. (2004). Hepcidin regulates cellular iron efflux by binding to ferroportin and inducing its internalization. Science (New York, NY) 306, 2090-2093. Neuman, R.E., and Logan, M.A. (1950). The determination of hydroxyproline. The Journal of biological chemistry 184, 299-306. Nguyen, T., Sherratt, P.J., and Pickett, C.B. (2003). Regulatory mechanisms controlling gene expression mediated by the antioxidant response element. Annual review of pharmacology and toxicology 43, 233-260. Nordberg, J., and Arner, E.S. (2001). Reactive oxygen species, antioxidants, and the mammalian thioredoxin system. Free radical biology and medicine 31, 1287-1312. Oh, C.J., Kim, J.Y., Min, A.K., Park, K.G., Harris, R.A., Kim, H.J., and Lee, I.K. (2012). Sulforaphane attenuates hepatic fibrosis via NF-E2-related factor 2-mediated inhibition of transforming growth factor-beta/Smad signaling. Free radical biology & medicine 52, 671-682. Ohgami, R.S., Campagna, D.R., McDonald, A., and Fleming, M.D. (2006). The Steap proteins are metalloreductases. Blood 108, 1388-1394. Papanikolaou, G., and Pantopoulos, K. (2005). Iron metabolism and toxicity. Toxicology and applied pharmacology 202, 199-211. Paradkar, P.N., Zumbrennen, K.B., Paw, B.H., Ward, D.M., and Kaplan, J. (2009). Regulation of mitochondrial iron import through differential turnover of mitoferrin 1 and mitoferrin 2. Molecular and cellular biology 29, 1007-1016.
FCUP
NRF2 protection against liver injury in human and mouse models of HH 75
Park, C.H., Valore, E.V., Waring, A.J., and Ganz, T. (2001). Hepcidin, a urinary antimicrobial peptide synthesized in the liver. The Journal of biological chemistry 276, 7806-7810. Parola, M., and Robino, G. (2001). Oxidative stress-related molecules and liver fibrosis. Journal of hepatology 35, 297-306. Pietrangelo, A. (2005). Non-HFE hemochromatosis. Seminars in liver disease 25, 450-460. Pietrangelo, A. (2010). Hereditary hemochromatosis: pathogenesis, diagnosis, and treatment. Gastroenterology 139, 393-408, 408.e391-392. Pinto, J.P., Ribeiro, S., Pontes, H., Thowfeequ, S., Tosh, D., Carvalho, F., and Porto, G. (2008). Erythropoietin mediates hepcidin expression in hepatocytes through EPOR signaling and regulation of C/EBPalpha. Blood 111, 5727-5733. Poli, G., and Parola, M. (1997). Oxidative damage and fibrogenesis. Free radical biology & medicine 22, 287-305. Poss, K.D., and Tonegawa, S. (1997). Heme oxygenase 1 is required for mammalian iron reutilization. Proceedings of the National Academy of Sciences of the United States of America 94, 10919-10924. Rajagopal, A., Rao, A.U., Amigo, J., Tian, M., Upadhyay, S.K., Hall, C., Uhm, S., Mathew, M.K., Fleming, M.D., Paw, B.H., et al. (2008). Haem homeostasis is regulated by the conserved and concerted functions of HRG-1 proteins. Nature 453, 1127-1131. Ramey, G., Deschemin, J.C., Durel, B., Canonne-Hergaux, F., Nicolas, G., and Vaulont, S. (2010). Hepcidin targets ferroportin for degradation in hepatocytes. Haematologica 95, 501-504. Ramos, P., Guy, E., Chen, N., Proenca, C.C., Gardenghi, S., Casu, C., Follenzi, A., Van Rooijen, N., Grady, R.W., de Sousa, M., et al. (2011). Enhanced erythropoiesis in Hfe-KO mice indicates a role for Hfe in the modulation of erythroid iron homeostasis. Blood 117, 1379-1389. Rappaport, A.M. (1977). Microcirculatory units in the mammalian liver. Their arterial and portal components. Bibliotheca anatomica, 116-120. Rector, R.S., Thyfault, J.P., Uptergrove, G.M., Morris, E.M., Naples, S.P., Borengasser, S.J., Mikus, C.R., Laye, M.J., Laughlin, M.H., Booth, F.W., et al. (2010). Mitochondrial dysfunction precedes insulin resistance and hepatic steatosis and contributes to the natural history of non-alcoholic fatty liver disease in an obese rodent model. Journal of hepatology 52, 727-736. Rhee, S.G., Chae, H.Z., and Kim, K. (2005). Peroxiredoxins: a historical overview and speculative preview of novel mechanisms and emerging concepts in cell signaling. Free radical biology & medicine 38, 1543-1552. Richardson, D.R., Huang, M.L., Whitnall, M., Becker, E.M., Ponka, P., and Suryo Rahmanto, Y. (2010). The ins and outs of mitochondrial iron-loading: the metabolic defect in Friedreich's ataxia. Journal of molecular medicine (Berlin, Germany) 88, 323-329. Robb, A.D., Ericsson, M., and Wessling-Resnick, M. (2004). Transferrin receptor 2 mediates a biphasic pattern of transferrin uptake associated with ligand delivery to multivesicular bodies. American journal of physiology Cell physiology 287, C1769-1775. Roetto, A., Papanikolaou, G., Politou, M., Alberti, F., Girelli, D., Christakis, J., Loukopoulos, D., and Camaschella, C. (2003). Mutant antimicrobial peptide hepcidin is associated with severe juvenile hemochromatosis. Nature genetics 33, 21-22. Roy, C.N. (2010). Anemia of inflammation. Hematology / the Education Program of the American Society of Hematology American Society of Hematology Education Program 2010, 276-280. Rozen, S., and Skaletsky, H. (2000). Primer3 on the WWW for general users and for biologist programmers. Methods in molecular biology (Clifton, NJ) 132, 365-386. Sadahira, Y., and Mori, M. (1999). Role of the macrophage in erythropoiesis. Pathology international 49, 841-848. Samuel, V.T., Beddow, S.A., Iwasaki, T., Zhang, X.-M., Chu, X., Still, C.D., Gerhard, G.S., and Shulman, G.I. (2009). Fasting hyperglycemia is not associated with increased expression of

76
FCUP
NRF2 protection against liver injury in human and mouse models of HH
PEPCK or G6Pc in patients with Type 2 Diabetes. Proceedings of the National Academy of Sciences 106, 12121-12126. Sharp, P.A. (2010). Intestinal iron absorption: regulation by dietary & systemic factors. International journal for vitamin and nutrition research Internationale Zeitschrift fur Vitamin- und Ernahrungsforschung Journal international de vitaminologie et de nutrition 80, 231-242. Shaw, G.C., Cope, J.J., Li, L., Corson, K., Hersey, C., Ackermann, G.E., Gwynn, B., Lambert, A.J., Wingert, R.A., Traver, D., et al. (2006). Mitoferrin is essential for erythroid iron assimilation. Nature 440, 96-100. Shayeghi, M., Latunde-Dada, G.O., Oakhill, J.S., Laftah, A.H., Takeuchi, K., Halliday, N., Khan, Y., Warley, A., McCann, F.E., Hider, R.C., et al. (2005). Identification of an intestinal heme transporter. Cell 122, 789-801. Shi, H., Bencze, K.Z., Stemmler, T.L., and Philpott, C.C. (2008). A cytosolic iron chaperone that delivers iron to ferritin. Science (New York, NY) 320, 1207-1210. Shih, P.H., and Yen, G.C. (2007). Differential expressions of antioxidant status in aging rats: the role of transcriptional factor Nrf2 and MAPK signaling pathway. Biogerontology 8, 71-80. Shimoyama, Y., Mitsuda, Y., Hamajima, N., and Niwa, T. (2014). Polymorphisms of Nrf2, an antioxidative gene, are associated with blood pressure in Japanese. Nagoya journal of medical science 76, 113-120. Silva-Gomes, S., Santos, A.G., Caldas, C., Silva, C.M., Neves, J.V., Lopes, J., Carneiro, F., Rodrigues, P.N., and Duarte, T.L. (2014). Transcription factor NRF2 protects mice against dietary iron-induced liver injury by preventing hepatocytic cell death. Journal of hepatology 60, 354-361. Silva, B., and Faustino, P. (2015). An overview of molecular basis of iron metabolism regulation and the associated pathologies. Biochimica et biophysica acta 1852, 1347-1359. Stadtman, E.R. (1993). Oxidation of free amino acids and amino acid residues in proteins by radiolysis and by metal-catalyzed reactions. Annual review of biochemistry 62, 797-821. Suh, J.H., Shenvi, S.V., Dixon, B.M., Liu, H., Jaiswal, A.K., Liu, R.M., and Hagen, T.M. (2004). Decline in transcriptional activity of Nrf2 causes age-related loss of glutathione synthesis, which is reversible with lipoic acid. Proceedings of the National Academy of Sciences of the United States of America 101, 3381-3386. Suzuki, T., Motohashi, H., and Yamamoto, M. (2013). Toward clinical application of the Keap1-Nrf2 pathway. Trends in pharmacological sciences 34, 340-346. Tamarit, J., Cabiscol, E., and Ros, J. (1998). Identification of the major oxidatively damaged proteins inEscherichia coli cells exposed to oxidative stress. Journal of Biological Chemistry 273, 3027-3032. Tan, T.C., Crawford, D.H., Jaskowski, L.A., Murphy, T.M., Heritage, M.L., Subramaniam, V.N., Clouston, A.D., Anderson, G.J., and Fletcher, L.M. (2011). Altered lipid metabolism in Hfe-knockout mice promotes severe NAFLD and early fibrosis. American journal of physiology Gastrointestinal and liver physiology 301, G865-876. Tolosano, E., Fagoonee, S., Morello, N., Vinchi, F., and Fiorito, V. (2010). Heme scavenging and the other facets of hemopexin. Antioxidants & redox signaling 12, 305-320. Tong, K.I., Kobayashi, A., Katsuoka, F., and Yamamoto, M. (2006). Two-site substrate recognition model for the Keap1-Nrf2 system: a hinge and latch mechanism. Biological chemistry 387, 1311-1320. Torrence, J.D., and Bothwell, T.H. (1980). Tissue iron stores. In Methods of Haematology, C. JD, ed. (New York: Churchill Livingstone), pp. 104-109. Van Gorp, H., Delputte, P.L., and Nauwynck, H.J. (2010). Scavenger receptor CD163, a Jack-of-all-trades and potential target for cell-directed therapy. Molecular immunology 47, 1650-1660. Velasco-Rodriguez, D., Alonso-Dominguez, J.M., Gonzalez-Fernandez, F.A., Villarrubia, J., Sopena, M., Abalo, L., Ropero, P., Martinez-Nieto, J., de la Fuente Gonzalo, F., and Cava, F.

FCUP
NRF2 protection against liver injury in human and mouse models of HH 77
(2015). Reticulocyte parameters of delta beta thalassaemia trait, beta thalassaemia trait and iron deficiency anaemia. Journal of clinical pathology. von Otter, M., Bergstrom, P., Quattrone, A., De Marco, E.V., Annesi, G., Soderkvist, P., Wettinger, S.B., Drozdzik, M., Bialecka, M., Nissbrandt, H., et al. (2014). Genetic associations of Nrf2-encoding NFE2L2 variants with Parkinson's disease - a multicenter study. BMC medical genetics 15, 131. Vulpe, C.D., Kuo, Y.M., Murphy, T.L., Cowley, L., Askwith, C., Libina, N., Gitschier, J., and Anderson, G.J. (1999). Hephaestin, a ceruloplasmin homologue implicated in intestinal iron transport, is defective in the sla mouse. Nature genetics 21, 195-199. Wan, J., Benkdane, M., Teixeira-Clerc, F., Bonnafous, S., Louvet, A., Lafdil, F., Pecker, F., Tran, A., Gual, P., Mallat, A., et al. (2014). M2 Kupffer cells promote M1 Kupffer cell apoptosis: a protective mechanism against alcoholic and nonalcoholic fatty liver disease. Hepatology (Baltimore, Md) 59, 130-142. Weiss, G. (2009). Iron metabolism in the anemia of chronic disease. Biochimica et biophysica acta 1790, 682-693. Weiss, G., and Goodnough, L.T. (2005). Anemia of chronic disease. New England Journal of Medicine 352, 1011-1023. Wessling-Resnick, M. (2010). Iron homeostasis and the inflammatory response. Annual review of nutrition 30, 105-122. Wood, M.J., Powell, L.W., Dixon, J.L., and Ramm, G.A. (2012). Clinical cofactors and hepatic fibrosis in hereditary hemochromatosis: the role of diabetes mellitus. Hepatology (Baltimore, Md) 56, 904-911. Wrighting, D.M., and Andrews, N.C. (2006). Interleukin-6 induces hepcidin expression through STAT3. Blood 108, 3204-3209. Wyllie, J.C., and Kaufman, N. (1982). An electron microscopic study of heme uptake by rat duodenum. Laboratory investigation; a journal of technical methods and pathology 47, 471-476. Yachie, A., Niida, Y., Wada, T., Igarashi, N., Kaneda, H., Toma, T., Ohta, K., Kasahara, Y., and Koizumi, S. (1999). Oxidative stress causes enhanced endothelial cell injury in human heme oxygenase-1 deficiency. Journal of Clinical Investigation 103, 129. Yoon, J.C., Puigserver, P., Chen, G., Donovan, J., Wu, Z., Rhee, J., Adelmant, G., Stafford, J., Kahn, C.R., and Granner, D.K. (2001). Control of hepatic gluconeogenesis through the transcriptional coactivator PGC-1. Nature 413, 131-138. Young, S., and Bomford, A. (1984). Transferrin and cellular iron exchange. Clinical science (London, England : 1979) 67, 273-278. Yun, S., and Vincelette, N.D. (2015). Update on iron metabolism and molecular perspective of common genetic and acquired disorder, hemochromatosis. Critical reviews in oncology/hematology 95, 12-25. Zhong, L., Arner, E.S., and Holmgren, A. (2000). Structure and mechanism of mammalian thioredoxin reductase: the active site is a redox-active selenolthiol/selenenylsulfide formed from the conserved cysteine-selenocysteine sequence. Proceedings of the National Academy of Sciences of the United States of America 97, 5854-5859. Zitka, O., Skalickova, S., Gumulec, J., Masarik, M., Adam, V., Hubalek, J., Trnkova, L., Kruseova, J., Eckschlager, T., and Kizek, R. (2012). Redox status expressed as GSH:GSSG ratio as a marker for oxidative stress in paediatric tumour patients. Oncology letters 4, 1247-1253.