Embed Size (px)
Citation preview
Representation and local democracy: geographical variations in elector to councillor ratios
CCSR Working Paper 2005-09 Paul Norman, Kingsley Purdam, Abdelouahid Tajar and Ludi Simpson [email protected] A key principal of democracy is that for each political unit the number of electors per representative should be as equal as possible. Here we examine variations in elector to councillor ratios at local authority and ward levels in England and consider whether variati c minority population distributions.
www.ccsr.ac.uk ons relate to ethni
1
Representation and local democracy: geographical variations in elector to councillor ratios
Paul Norman*, Kingsley Purdam, Abdelouahid Tajar and Ludi Simpson
Cathie Marsh Centre for Census and Survey Research (CCSR)
Crawford House (2nd floor), Booth Street East
University of Manchester, Manchester, M13 9PL, UK
Tel: (+44) 161 275 7766
Fax: (+44) 161 275 4722
* Correspondence to: Paul Norman
2
Representation and local democracy: geographical variations in elector to councillor ratios
ABSTRACT In democracies, one person’s vote should count as much as another's. While a range of factors can affect
this, including the electoral system, party support bases, party campaigning and the effectiveness and
identity of representatives, a key principal is that for each political unit the number of electors per
representative should be as equal as possible. Only when equality in electorate to representative ratios is
established can equity in other demographic infrastructures be pursued. To achieve representation
equality in English local authorities the Electoral Commission’s Periodic Electoral Review process
considers for each electoral ward the number of councillors, current and forecasted electorates and
revisions to boundaries. Here, using 2005 boundaries, we examine variations in elector to councillor
ratios in England. Comparing these ratios with 2001 Census data, we consider whether variations relate to
ethnic minority population distributions.
We found considerable differences in representation ratios between four types of local authority.
Generally, County Districts have fewer electors per councillor and therefore better representation ratios.
There are progressively higher ratios for Unitary Authorities and London Boroughs; Metropolitan
Districts have most electors per councillor. Comparing each ward’s ratio with the representation of its
associated district we found most wards lie within what might be considered an acceptable range of
variation. Sub-district representation variability relates to urban-rural variations in ward extent and the
use of one-, two- and three-seat systems. There is no evidence that variations in ward ratios relate
systematically to distributions of ethnic minorities. Despite this, we advise utilising ethnic group
demographic characteristics when forecasting electorates.
Keywords: Democracy; Representation; Boundary change; Electorate; Periodic Electoral Reviews
3
Representation and local democracy: geographical variations in elector to councillor ratios
INTRODUCTION In a democracy, one person’s vote should count as much as another's. A fundamental principal of
democracy is that across each political unit the number of electors per representative should be as equal as
possible. Political representation is multidimensional, however. Pitkin (1967) argues that representation is
linked to the overall structure and functioning of the political system. Key issues are: the electoral system,
the location of power, the party system, the size of the representative body, the candidate selection
procedures; the identity, alignment, accessibility, activities, ability and accountability of representatives
and the political knowledge of the electorate. Many of these aspects have been widely debated in political
science including the effect of electoral systems on votes and seats won (Johnson et al., 2001; Farrell,
2001) and the impact of the cultural, ethnic or gender characteristics of a representative (Phillips, 1995;
Judge, 1999; Purdam, 2000).
Rallings et al. (2004) and Johnston (2002) have assessed the impact of boundary changes on electoral
outcomes, particularly the division of areas in relation to core party support and resulting electoral bias.
Rallings et al. (2004) argue that ensuring equality in councillor to electorate ratios does not guarantee
equality of representation and that too much weight can be given to electoral equality (see also ODPM,
2004). However, it is only when equality in electorate to representative ratios is established that the equity
of other infrastructures of democracy can be pursued.
In England, variation in electorate size is defended as acceptable to ensure that communities of interest
(local ties) and identifiable geographic boundaries are reflected. Previous legal decisions have made it
clear, however, that electoral equality does not solely relate to numerical equality; other criteria must also
be considered1.The aim is that boundaries do not cut across natural boundaries such as railway lines, main
roads, motorways or rivers (Electoral Commission, 2002). Some account is taken of the geography of
party support such that during boundary reviews the claims of political parties are balanced with the aim
for equity in elector to councillor ratios.
It is notable that there is a lack of a legislative requirement in England for electoral equality (Electoral
Commission, 2002). It is, however, part of the statutory framework and Section 13(4) of the Local
Government Act 1992 places a duty on the Electoral Commission to direct the Boundary Committee for
England to undertake electoral reviews of each local authority area in England at periodic intervals. The
number of electors represented by each councillor to be elected must be “as nearly as may be” the same in
1 Decision in the London Borough of Enfield v Local Government Boundary Commission for England (1979) 1 A11 ER 950,953 (upheld in the House of Lords [1979] 3 A11 ER 717)
4
every ward with variations from the electoral equality needing to be fully justified (Electoral
Commission, 2002). Gay (1999) notes that large discrepancies in equality can mean that some votes have
more weight than others for the same local election. Moreover, certain electors may have less access to a
representative than others in the same political structure. This is important in the context of reforms of
local councillor roles in the Local Government Act 2000 with the emphasis on reconnecting the electorate
to their representatives. The perception and reality of representation equality is vital to underpinning
public confidence in democracy and ensuring its future legitimacy.
In this paper, we use the terms ‘representation’ and ‘electoral equality’ in a restricted way to describe the
ratio between the size of the electorate and the number of councillors. We examine the extent to which
variations exist in the ratios of electors to councillors at both local authority district and ward levels in
England in 2005. We consider whether any variations relate to spatial concentrations of ethnic minority
populations. This is particularly important in relation to the engagement of such populations in the
democratic process (Purdam et al., 2002). We begin by looking at the structure of local government,
population change and the boundary review process.
PERIODIC ELECTORAL REVIEWS In terms of local government geography, the UK has experienced numerous administrative boundary
changes over time (ONS, 2003). In the 19th Century, the Local Government Act of 1888 created a
structure of sub-county local administration, consisting of County Boroughs, Municipal Boroughs, Urban
Districts and Rural Districts with the system of dividing local councils into wards dating back further to
1835. Although there were widespread detailed changes in the 1930s and local government units in
London were revised in 1965, the same basic system survived until Redcliffe-Maud’s major reforms were
implemented in 1974. In the late 1990s there were substantial revisions with the creation of Unitary
Authorities in some areas. Sub-district ward geography is particularly dynamic.
The Local Government Act 1992 requires that electoral arrangements in every local authority (LA) in
England are reviewed on a periodic basis (Electoral Commission, 2002). The primary objective of these
‘Periodic Electoral Reviews’ (PERs) is to ensure that for the wards within each local authority area the
number of electors represented by each councillor is as near as possible the same. PERs do not consider
variations between LAs. PERs are necessary because of changes in electorates over time; change which is
not evenly distributed across space (ONS, 2003). Electorates potentially increase in size when a cohort of
‘attainers’ become 18 and/or where there is net adult in-migration. Electorates potentially reduce through
deaths and/or where there is net adult out-migration. A population’s age structure will influence the
balance between those achieving their majority with those who are dying, paralleled by the distinct
migration patterns typical for different age-groups. In some locations the tendency is for people to age in
situ; other areas have more transient populations (Rees et al., 2004).
5
During the PER process the Electoral Commission and Boundary Committee for England work in
conjunction with LAs to take account of various circumstances including: (i.) the need for convenient and
effective local government; (ii.) reflecting the identities and interests of local communities2; and (iii.)
delimiting identifiable electoral boundaries. The onus is on LAs to submit review proposals and lead in
developing locally derived electoral schemes. The Electoral Commission can then recommend: (a.)
changes to the number of councillors in each ward; (b.) changes to the locations of ward boundaries; and
(c.) the creation of new wards.
The Electoral Commission considers the number of people currently represented by each councillor and
utilises forecasts of changes in electorates over the following 5 years. The PER process has successfully
equalised previous imbalances (Electoral Commission 2005c; Rallings et al., 2004). The last cycle of
PERs was completed in October 2004 and the Electoral Commission is currently assessing areas where
electoral equality was found to be worse than expected (Electoral Commission, 2002; 2005c). It is notable
that the Electoral Commission is presently consulting on the PER process and the value attached to
different criteria for balancing equality, effective and convenient local government and the interests and
identities of local communities (Electoral Commission, 2005c).
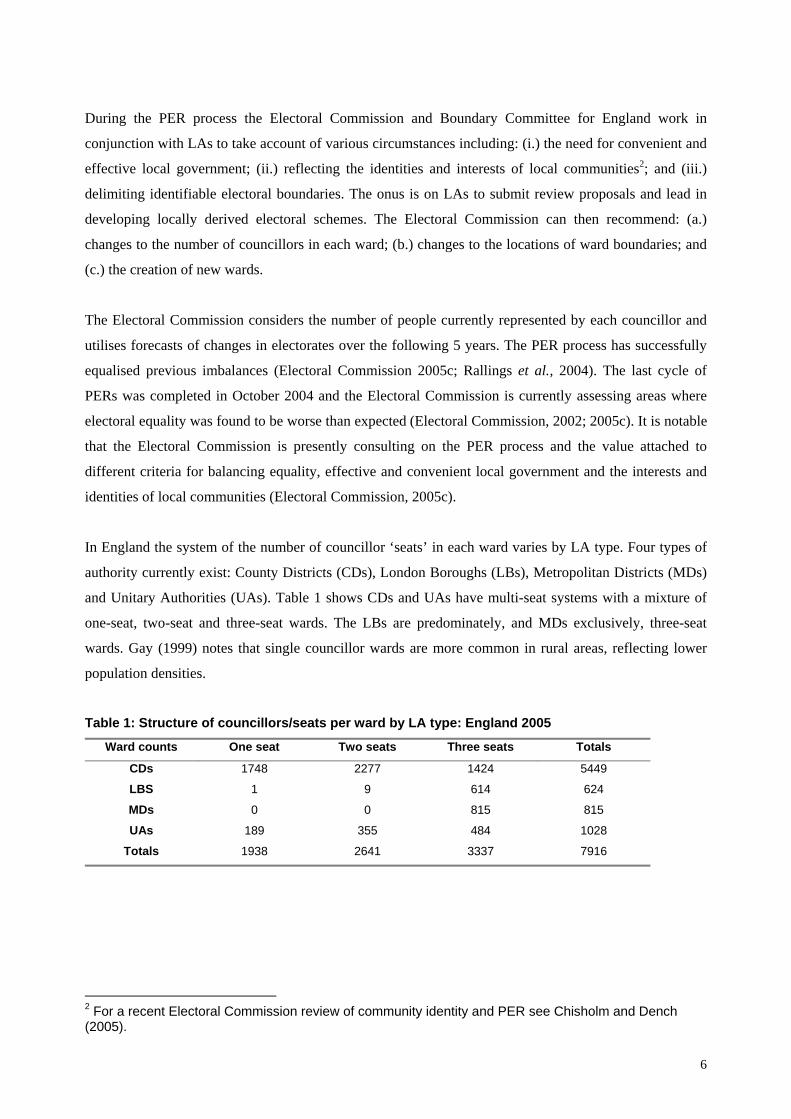
In England the system of the number of councillor ‘seats’ in each ward varies by LA type. Four types of
authority currently exist: County Districts (CDs), London Boroughs (LBs), Metropolitan Districts (MDs)
and Unitary Authorities (UAs). Table 1 shows CDs and UAs have multi-seat systems with a mixture of
one-seat, two-seat and three-seat wards. The LBs are predominately, and MDs exclusively, three-seat
wards. Gay (1999) notes that single councillor wards are more common in rural areas, reflecting lower
population densities.
Table 1: Structure of councillors/seats per ward by LA type: England 2005
Ward counts One seat Two seats Three seats Totals
CDs 1748 2277 1424 5449
LBS 1 9 614 624
MDs 0 0 815 815
UAs 189 355 484 1028
Totals 1938 2641 3337 7916
2 For a recent Electoral Commission review of community identity and PER see Chisholm and Dench (2005).
6
DATA AND METHODS We use the latest available elector and councillor data compatible with the boundary definitions in place
in December 2004 and released as the 2005 electorates. The counts of electors for 2005 are the adults
eligible to be on electoral registers and who registered to vote by 10th October 2004. The elector and
councillor data were supplied by the Electoral Commission. Since we wished to compare the distribution
of electors with the distribution of ethnic minority populations we obtained information for voting age
adults categorised as white and the sum of all other ethnic groups from the 2001 Census. The 2001
Census data were downloaded from the Census Dissemination Unit at the University of Manchester
(MIMAS, 2005). 2001 Census digital ward boundaries were downloaded from the UKBORDERS server
at the University of Edinburgh and the 2004 ward boundaries were supplied by Ordnance Survey (OS).
Three English LAs are omitted from this work since their electorate data were not supplied by the
Electoral Commission and March 2005 boundary changes in Stockton-on-Tees (UA) created unsolvable
geographical compatibility problems (see below). In our study then there were 352 LAs and their 7,916
constituent wards.
We calculated representation ratios (electors / councillors) for local authorities and wards in England. We
examined these ratios to determine whether any variations (percentage difference between each ward and
associated local authority ratio) relate to the distribution of ethnic minority adult populations. We devised
two categorisations relating to representation and ethnic diversity through which to present summary
findings. These were defined as follows:
1. Representation typology
To highlight substantial representation differences for wards the following categorisation was devised:
• Under-represented. Over 10% greater than the LA ratio (total electorate across all wards / total
number of councillors in an LA). i.e. There are more electors per councillor than the representation
ratio for the district as a whole.
• Average representation. Within ±10% of the LA ratio. The Electoral Commission has an aim
ideally to achieve variations of ±5% from the LA ratio but acknowledge this is stringent in reality
(Electoral Commission, 2005a).
• Over-represented. More than 10% lower than the LA ratio. i.e. There are fewer electors per
councillor than for the district as a whole.
Such a typology is a little crude but allows an insight into variations in representation ratios across
different wards and authority types. The published guidance allows for variations up to ±10% without
particular justification. However, the Electoral Commission state that they expect variations to be well
within this figure (Electoral Commission, 2002). We note that Johnston et al. (2004) cite the Electoral
7
Commission as having informed London Boroughs that inter-ward electoral variations of greater than 2-
3% would only be acceptable in exceptional circumstances.
2. Diversity Typology
To classify wards by their ethnic diversity we utilised a categorisation developed for the Department for
Work and Pensions in analyses of the labour market circumstances of UK ethnic minorities (Simpson et
al., 2005):
• Unmixed. Wards where the adult white ethnic group is 87% (the national average) of the ward adult
population or greater.
• Mixed. Wards where the white ethnic group comprises more than 50% but less than 87% of the
population.
• Diverse. Wards with an adult population comprising more than 50% persons in ethnic groups other
than white.
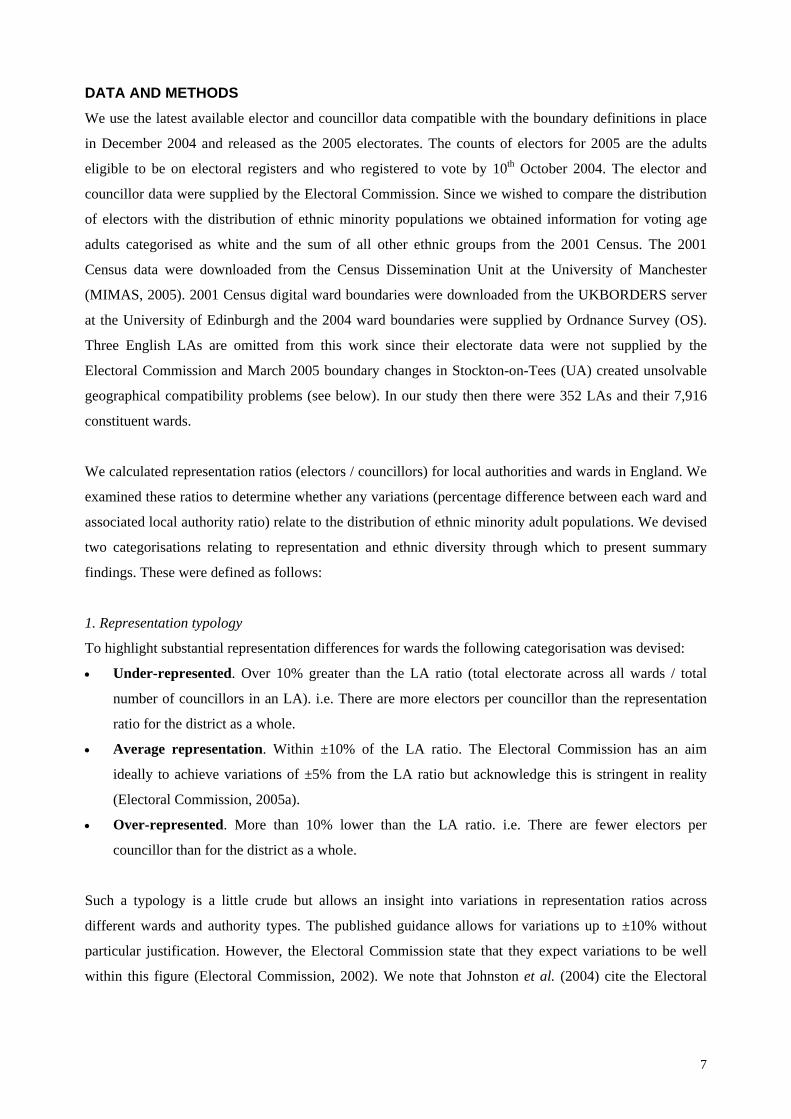
Boundary Changes
To compare variations in representation ratios and distributions of ethnic minority adults we needed to
make the 2001 Census and 2005 councillor and elector data geographically consistent. Many areas
experienced boundary changes between the 2001 Census (data were disseminated for the 2003 ward
boundary definitions) and the electoral wards existing in 2005 (released for the end of 2004 ward
definitions). Fig. 1 shows the extent of boundary changes in Bradford (MD) where only two wards
remained unchanged.
Figure 1: Ward boundary changes in Bradford (MD)
8
Simpson (2002b) and Norman et al. (2003) devised methods to convert between different geographical
systems and thereby ensure data are geographically consistent when ward boundaries change. Socio-
demographic data can be apportioned between boundary systems using counts of unit postcodes weighted
by population headcounts to allow for unequal population distributions across geographical areas. This
technique is well-established and has been used, for example, to ensure that population and health data
are adjusted to a consistent ward geography over time (see Rees et al., 2003; Rees et al., 2004; Norman
and Simpson, 2005). Thus the 2001 Census data on adults by whites and all other ethnic groups were
converted to be consistent with the geography of the 2005 electorates with the ward names and codes
checked against the Office for National Statistics (ONS) ‘Ward History file’ (ONS, 2005a). This stage of
our research revealed differences in area names and alphanumeric coding systems used by the Electoral
Commission, ONS and OS. This is despite the ONS led promotion since the late 1990s of a harmonised
cross-departmental approach to the geographic aspect of statistics including standard names and codes
(ONS, 2003). The digital boundaries supplied by OS were for late 2004 but in Stockton-on-Tees (UA)
boundary definition changes occurred in March 2005. In this LA, geographical data conversions were not
possible.
RESULTS First we present results for local authorities summarised by type and by the representation and ethnic
diversity typologies. Second, we describe results for wards. Finally, we use case studies to illustrate
examples of representation variation.
Variations in representation ratios for Local Authorities
The total number of electors and councillors in each LA type result in considerable differences in
representation ratios. Overall CDs have a ratio of 1,694 electors per councillor, UAs 2,564, LBs 2,745
and MDs the most electors per councillor at 3,307. There are wide differences within each type though:
ratios in CDs range from 628 electors per councillor in Teesdale to 3,192 in Northampton; UAs range
from 1,039 in Rutland to 4,049 in Bristol, LBs from 1,826 in Kensington to 3,760 in Bromley; and MDs
from 1,732 in Knowsley to 5,290 in Birmingham. LAs also vary considerably in size in terms of both
numbers of electors (in 2005 from 20,083 to 710,349) and councillors (from 24 to 120). The Electoral
Commission accept these differences as being the result of the historical development of political
structures in England and acknowledge such differences are largely beyond their control (Electoral
Commission, 2005a).
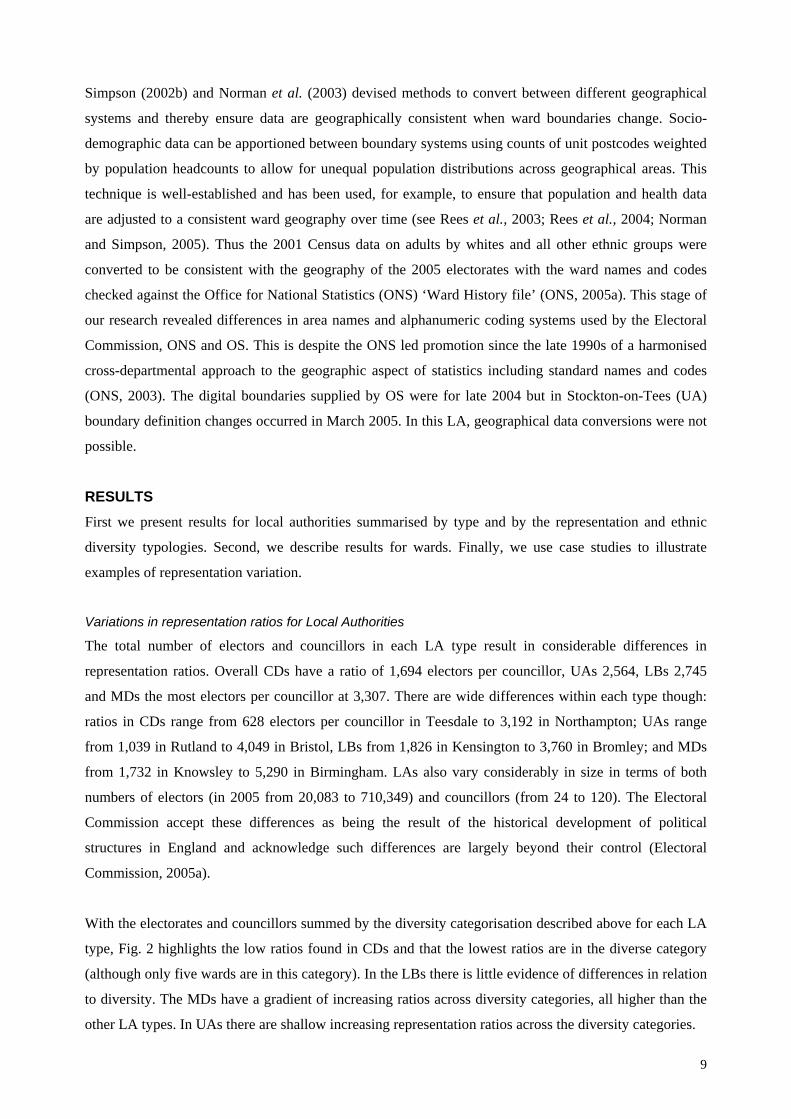
With the electorates and councillors summed by the diversity categorisation described above for each LA
type, Fig. 2 highlights the low ratios found in CDs and that the lowest ratios are in the diverse category
(although only five wards are in this category). In the LBs there is little evidence of differences in relation
to diversity. The MDs have a gradient of increasing ratios across diversity categories, all higher than the
other LA types. In UAs there are shallow increasing representation ratios across the diversity categories.
9
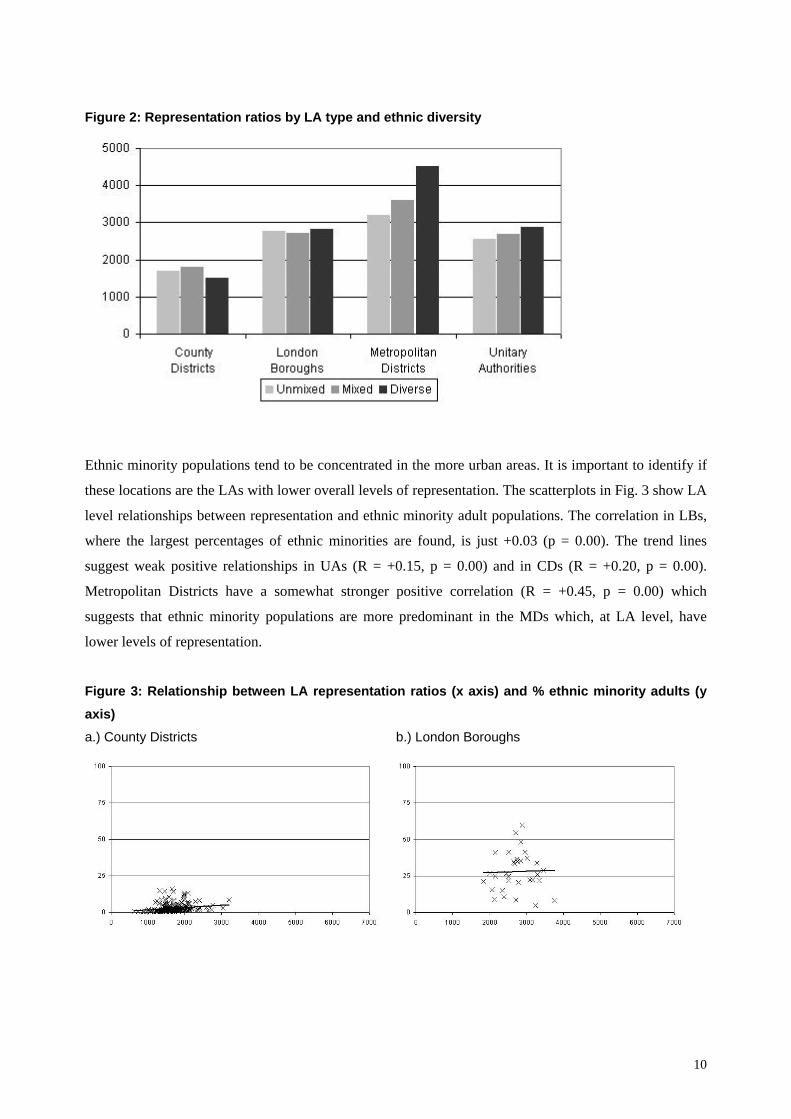
Figure 2: Representation ratios by LA type and ethnic diversity
Ethnic minority populations tend to be concentrated in the more urban areas. It is important to identify if
these locations are the LAs with lower overall levels of representation. The scatterplots in Fig. 3 show LA
level relationships between representation and ethnic minority adult populations. The correlation in LBs,
where the largest percentages of ethnic minorities are found, is just +0.03 (p = 0.00). The trend lines
suggest weak positive relationships in UAs (R = +0.15, p = 0.00) and in CDs (R = +0.20, p = 0.00).
Metropolitan Districts have a somewhat stronger positive correlation (R = +0.45, p = 0.00) which
suggests that ethnic minority populations are more predominant in the MDs which, at LA level, have
lower levels of representation.
Figure 3: Relationship between LA representation ratios (x axis) and % ethnic minority adults (y axis) a.) County Districts b.) London Boroughs
10
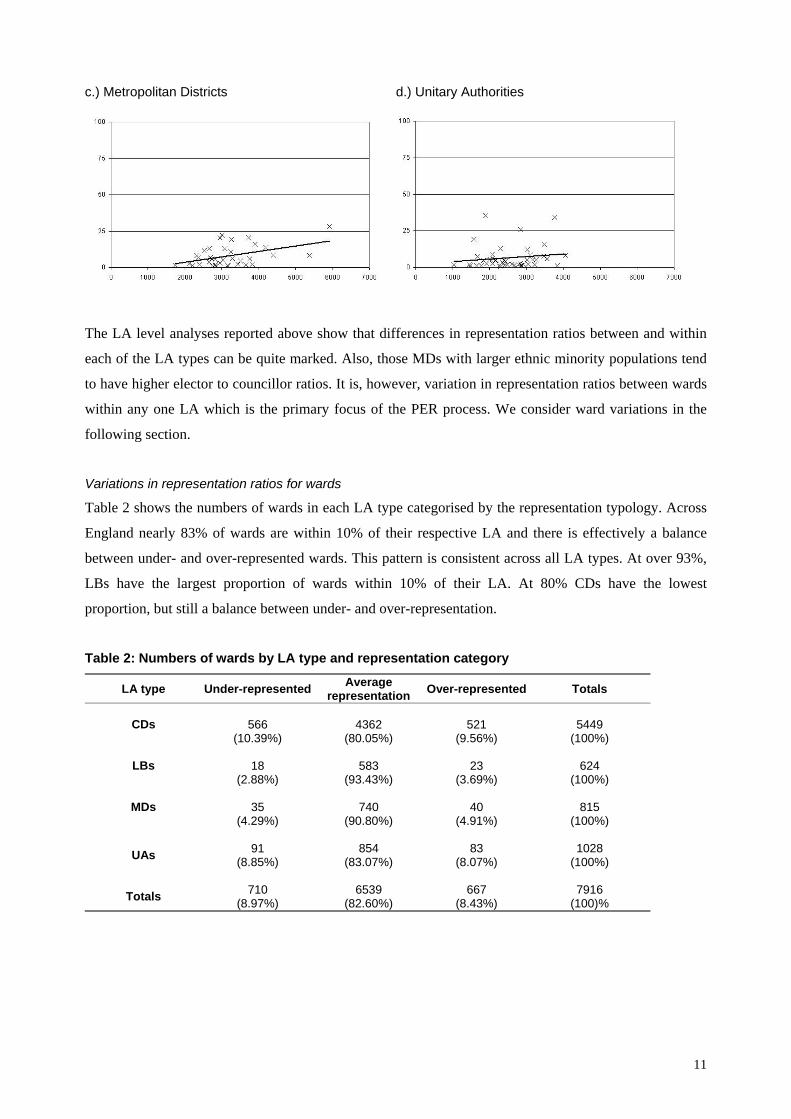
c.) Metropolitan Districts d.) Unitary Authorities
The LA level analyses reported above show that differences in representation ratios between and within
each of the LA types can be quite marked. Also, those MDs with larger ethnic minority populations tend
to have higher elector to councillor ratios. It is, however, variation in representation ratios between wards
within any one LA which is the primary focus of the PER process. We consider ward variations in the
following section.
Variations in representation ratios for wards
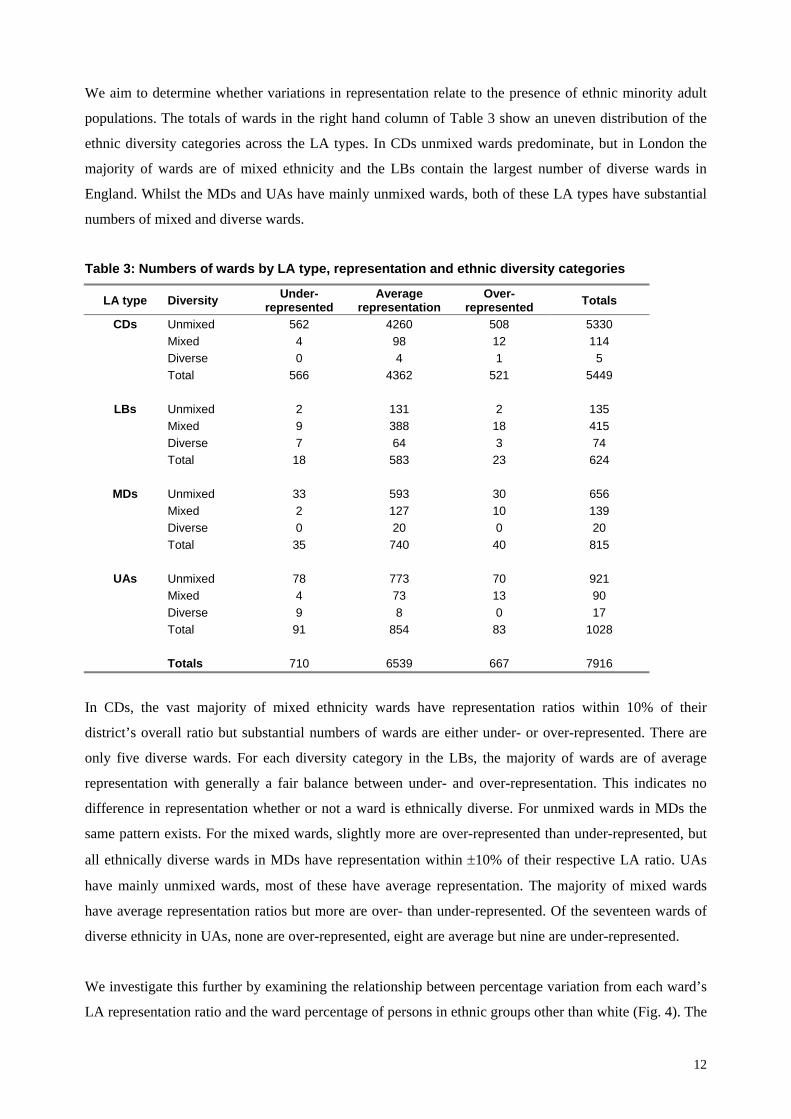
Table 2 shows the numbers of wards in each LA type categorised by the representation typology. Across
England nearly 83% of wards are within 10% of their respective LA and there is effectively a balance
between under- and over-represented wards. This pattern is consistent across all LA types. At over 93%,
LBs have the largest proportion of wards within 10% of their LA. At 80% CDs have the lowest
proportion, but still a balance between under- and over-representation.
Table 2: Numbers of wards by LA type and representation category
LA type Under-represented Average representation Over-represented Totals
CDs
566 (10.39%)
4362
(80.05%)
521
(9.56%)
5449
(100%)
LBs
18 (2.88%)
583
(93.43%)
23
(3.69%)
624
(100%)
MDs
35 (4.29%)
740
(90.80%)
40
(4.91%)
815
(100%)
UAs
91 (8.85%)
854 (83.07%)
83 (8.07%)
1028 (100%)
Totals 710 (8.97%)
6539 (82.60%)
667 (8.43%)
7916 (100)%
11
We aim to determine whether variations in representation relate to the presence of ethnic minority adult
populations. The totals of wards in the right hand column of Table 3 show an uneven distribution of the
ethnic diversity categories across the LA types. In CDs unmixed wards predominate, but in London the
majority of wards are of mixed ethnicity and the LBs contain the largest number of diverse wards in
England. Whilst the MDs and UAs have mainly unmixed wards, both of these LA types have substantial
numbers of mixed and diverse wards.
Table 3: Numbers of wards by LA type, representation and ethnic diversity categories
LA type Diversity Under-represented
Average representation
Over-represented Totals
CDs Unmixed 562 4260 508 5330 Mixed 4 98 12 114 Diverse 0 4 1 5 Total 566 4362 521 5449
LBs Unmixed 2 131 2 135 Mixed 9 388 18 415 Diverse 7 64 3 74 Total 18 583 23 624
MDs Unmixed 33 593 30 656 Mixed 2 127 10 139 Diverse 0 20 0 20 Total 35 740 40 815
UAs Unmixed 78 773 70 921 Mixed 4 73 13 90 Diverse 9 8 0 17 Total 91 854 83 1028 Totals 710 6539 667 7916
In CDs, the vast majority of mixed ethnicity wards have representation ratios within 10% of their
district’s overall ratio but substantial numbers of wards are either under- or over-represented. There are
only five diverse wards. For each diversity category in the LBs, the majority of wards are of average
representation with generally a fair balance between under- and over-representation. This indicates no
difference in representation whether or not a ward is ethnically diverse. For unmixed wards in MDs the
same pattern exists. For the mixed wards, slightly more are over-represented than under-represented, but
all ethnically diverse wards in MDs have representation within ±10% of their respective LA ratio. UAs
have mainly unmixed wards, most of these have average representation. The majority of mixed wards
have average representation ratios but more are over- than under-represented. Of the seventeen wards of
diverse ethnicity in UAs, none are over-represented, eight are average but nine are under-represented.
We investigate this further by examining the relationship between percentage variation from each ward’s
LA representation ratio and the ward percentage of persons in ethnic groups other than white (Fig. 4). The
12
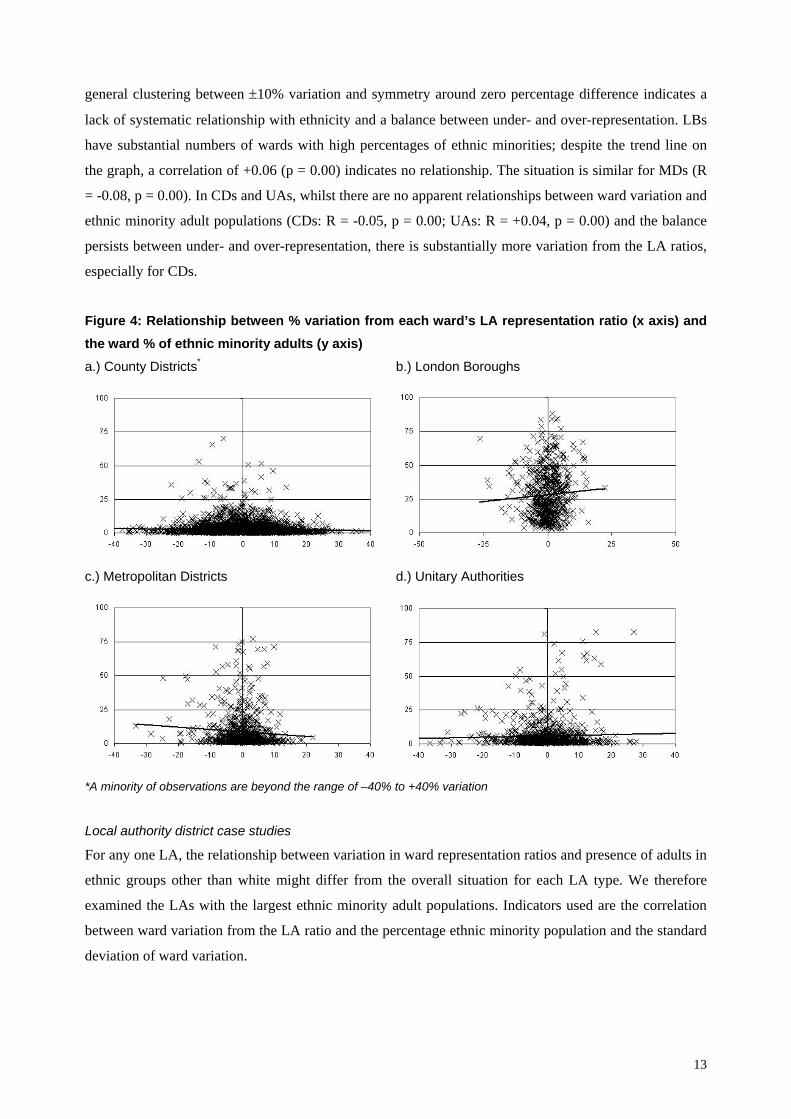
general clustering between ±10% variation and symmetry around zero percentage difference indicates a
lack of systematic relationship with ethnicity and a balance between under- and over-representation. LBs
have substantial numbers of wards with high percentages of ethnic minorities; despite the trend line on
the graph, a correlation of +0.06 (p = 0.00) indicates no relationship. The situation is similar for MDs (R
= -0.08, p = 0.00). In CDs and UAs, whilst there are no apparent relationships between ward variation and
ethnic minority adult populations (CDs: R = -0.05, p = 0.00; UAs: R = +0.04, p = 0.00) and the balance
persists between under- and over-representation, there is substantially more variation from the LA ratios,
especially for CDs.
Figure 4: Relationship between % variation from each ward’s LA representation ratio (x axis) and the ward % of ethnic minority adults (y axis) a.) County Districts* b.) London Boroughs
c.) Metropolitan Districts d.) Unitary Authorities
*A minority of observations are beyond the range of –40% to +40% variation Local authority district case studies
For any one LA, the relationship between variation in ward representation ratios and presence of adults in
ethnic groups other than white might differ from the overall situation for each LA type. We therefore
examined the LAs with the largest ethnic minority adult populations. Indicators used are the correlation
between ward variation from the LA ratio and the percentage ethnic minority population and the standard
deviation of ward variation.
13
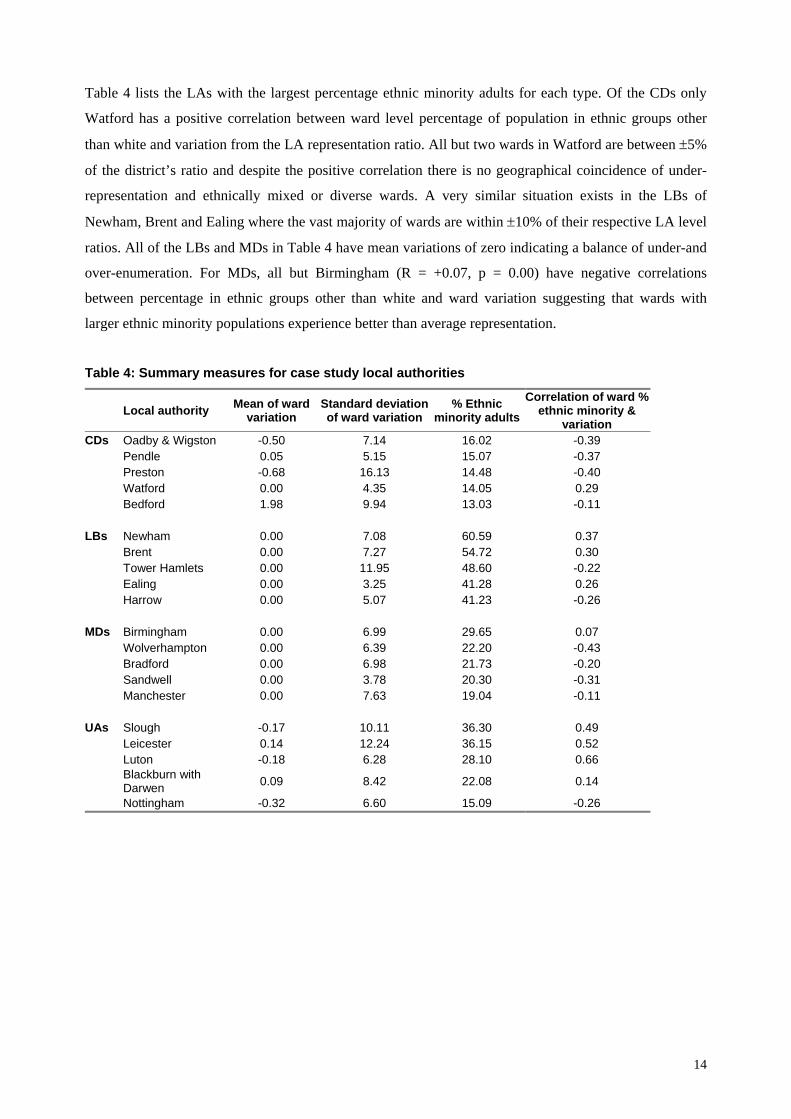
Table 4 lists the LAs with the largest percentage ethnic minority adults for each type. Of the CDs only
Watford has a positive correlation between ward level percentage of population in ethnic groups other
than white and variation from the LA representation ratio. All but two wards in Watford are between ±5%
of the district’s ratio and despite the positive correlation there is no geographical coincidence of under-
representation and ethnically mixed or diverse wards. A very similar situation exists in the LBs of
Newham, Brent and Ealing where the vast majority of wards are within ±10% of their respective LA level
ratios. All of the LBs and MDs in Table 4 have mean variations of zero indicating a balance of under-and
over-enumeration. For MDs, all but Birmingham (R = +0.07, p = 0.00) have negative correlations
between percentage in ethnic groups other than white and ward variation suggesting that wards with
larger ethnic minority populations experience better than average representation.
Table 4: Summary measures for case study local authorities
Local authority Mean of ward
variation Standard deviation of ward variation
% Ethnic minority adults
Correlation of ward % ethnic minority &
variation CDs Oadby & Wigston -0.50 7.14 16.02 -0.39 Pendle 0.05 5.15 15.07 -0.37 Preston -0.68 16.13 14.48 -0.40 Watford 0.00 4.35 14.05 0.29 Bedford 1.98 9.94 13.03 -0.11 LBs Newham 0.00 7.08 60.59 0.37 Brent 0.00 7.27 54.72 0.30 Tower Hamlets 0.00 11.95 48.60 -0.22 Ealing 0.00 3.25 41.28 0.26 Harrow 0.00 5.07 41.23 -0.26 MDs Birmingham 0.00 6.99 29.65 0.07 Wolverhampton 0.00 6.39 22.20 -0.43 Bradford 0.00 6.98 21.73 -0.20 Sandwell 0.00 3.78 20.30 -0.31 Manchester 0.00 7.63 19.04 -0.11 UAs Slough -0.17 10.11 36.30 0.49 Leicester 0.14 12.24 36.15 0.52 Luton -0.18 6.28 28.10 0.66
Blackburn with Darwen 0.09 8.42 22.08 0.14
Nottingham -0.32 6.60 15.09 -0.26
14
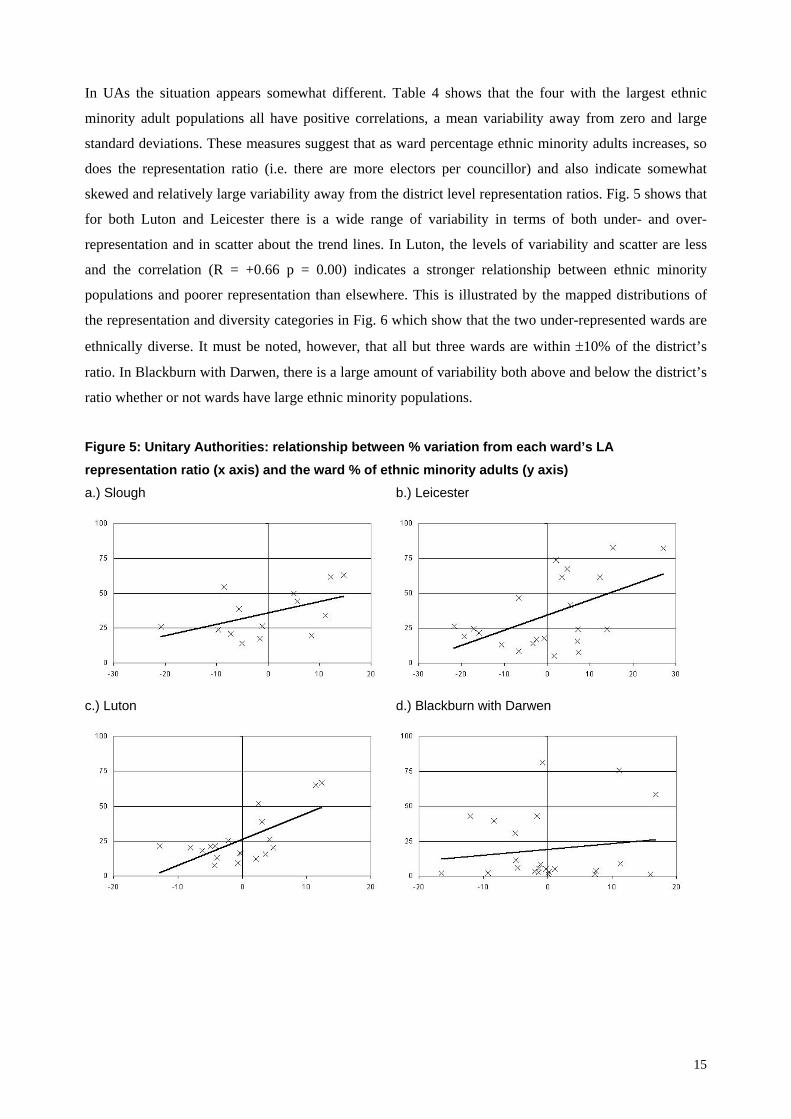
In UAs the situation appears somewhat different. Table 4 shows that the four with the largest ethnic
minority adult populations all have positive correlations, a mean variability away from zero and large
standard deviations. These measures suggest that as ward percentage ethnic minority adults increases, so
does the representation ratio (i.e. there are more electors per councillor) and also indicate somewhat
skewed and relatively large variability away from the district level representation ratios. Fig. 5 shows that
for both Luton and Leicester there is a wide range of variability in terms of both under- and over-
representation and in scatter about the trend lines. In Luton, the levels of variability and scatter are less
and the correlation (R = +0.66 p = 0.00) indicates a stronger relationship between ethnic minority
populations and poorer representation than elsewhere. This is illustrated by the mapped distributions of
the representation and diversity categories in Fig. 6 which show that the two under-represented wards are
ethnically diverse. It must be noted, however, that all but three wards are within ±10% of the district’s
ratio. In Blackburn with Darwen, there is a large amount of variability both above and below the district’s
ratio whether or not wards have large ethnic minority populations.
Figure 5: Unitary Authorities: relationship between % variation from each ward’s LA representation ratio (x axis) and the ward % of ethnic minority adults (y axis) a.) Slough b.) Leicester
c.) Luton d.) Blackburn with Darwen
15
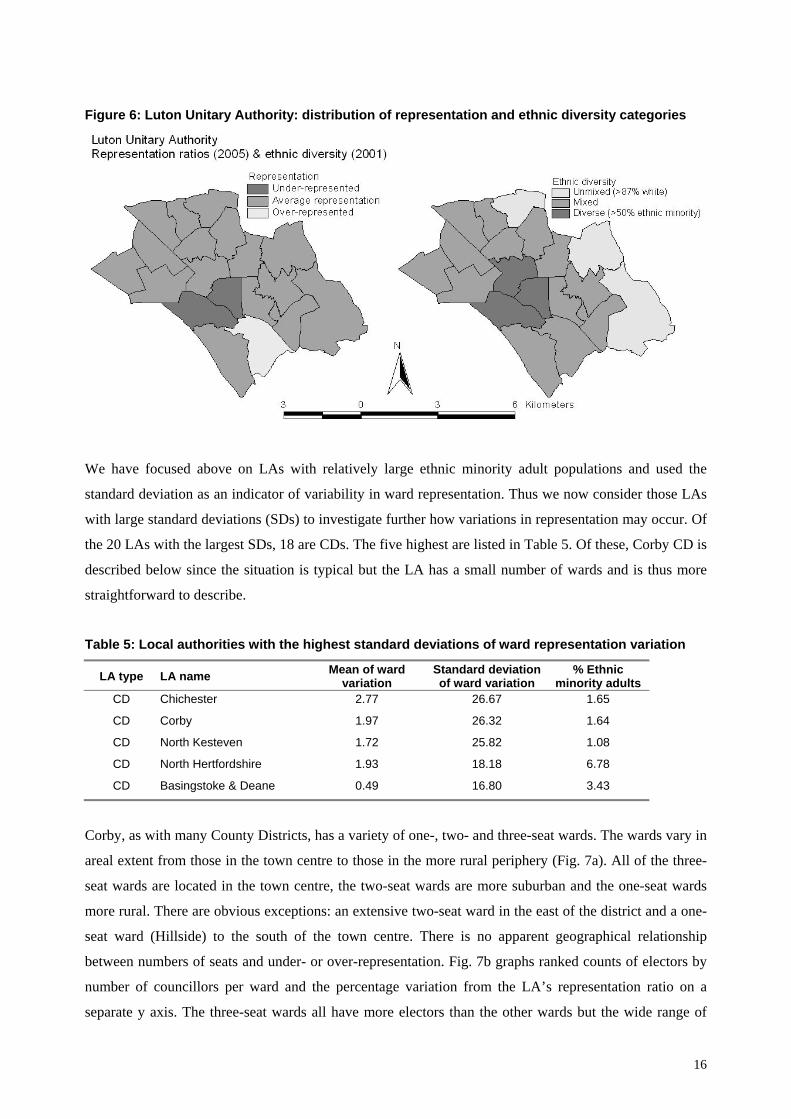
Figure 6: Luton Unitary Authority: distribution of representation and ethnic diversity categories
We have focused above on LAs with relatively large ethnic minority adult populations and used the
standard deviation as an indicator of variability in ward representation. Thus we now consider those LAs
with large standard deviations (SDs) to investigate further how variations in representation may occur. Of
the 20 LAs with the largest SDs, 18 are CDs. The five highest are listed in Table 5. Of these, Corby CD is
described below since the situation is typical but the LA has a small number of wards and is thus more
straightforward to describe.
Table 5: Local authorities with the highest standard deviations of ward representation variation
LA type LA name Mean of ward variation
Standard deviation of ward variation
% Ethnic minority adults
CD Chichester 2.77 26.67 1.65
CD Corby 1.97 26.32 1.64
CD North Kesteven 1.72 25.82 1.08
CD North Hertfordshire 1.93 18.18 6.78
CD Basingstoke & Deane 0.49 16.80 3.43
Corby, as with many County Districts, has a variety of one-, two- and three-seat wards. The wards vary in
areal extent from those in the town centre to those in the more rural periphery (Fig. 7a). All of the three-
seat wards are located in the town centre, the two-seat wards are more suburban and the one-seat wards
more rural. There are obvious exceptions: an extensive two-seat ward in the east of the district and a one-
seat ward (Hillside) to the south of the town centre. There is no apparent geographical relationship
between numbers of seats and under- or over-representation. Fig. 7b graphs ranked counts of electors by
number of councillors per ward and the percentage variation from the LA’s representation ratio on a
separate y axis. The three-seat wards all have more electors than the other wards but the wide range of
16
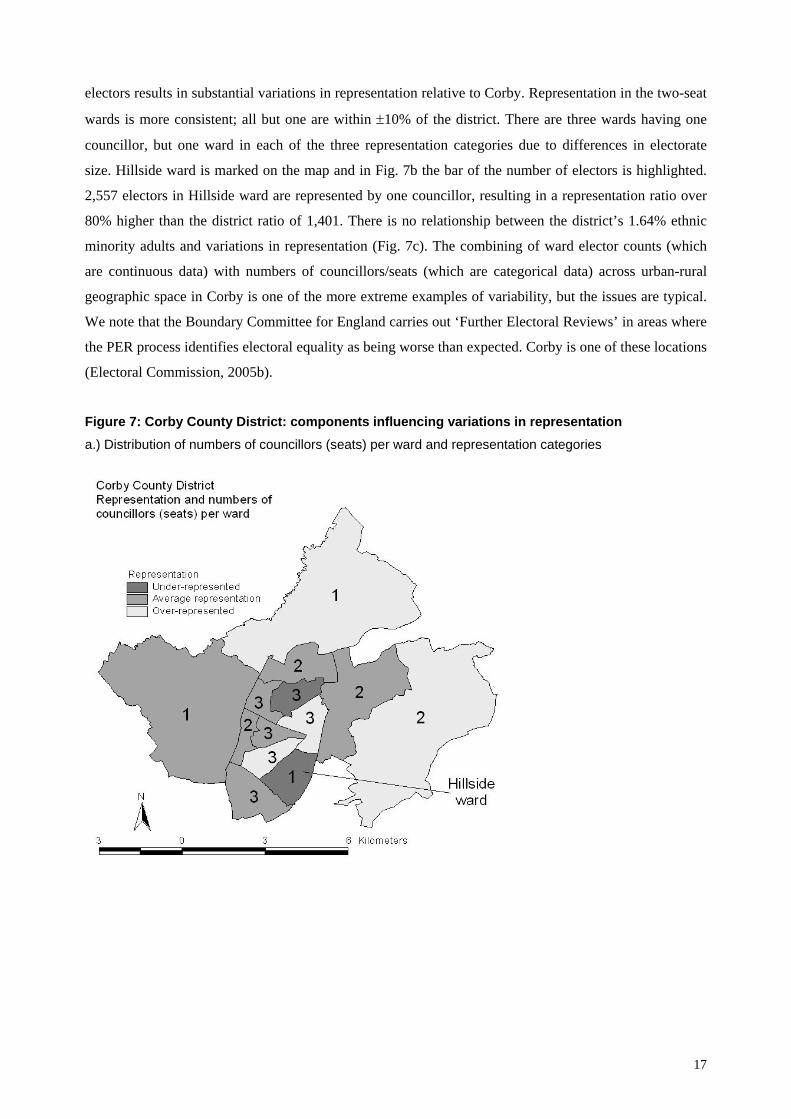
electors results in substantial variations in representation relative to Corby. Representation in the two-seat
wards is more consistent; all but one are within ±10% of the district. There are three wards having one
councillor, but one ward in each of the three representation categories due to differences in electorate
size. Hillside ward is marked on the map and in Fig. 7b the bar of the number of electors is highlighted.
2,557 electors in Hillside ward are represented by one councillor, resulting in a representation ratio over
80% higher than the district ratio of 1,401. There is no relationship between the district’s 1.64% ethnic
minority adults and variations in representation (Fig. 7c). The combining of ward elector counts (which
are continuous data) with numbers of councillors/seats (which are categorical data) across urban-rural
geographic space in Corby is one of the more extreme examples of variability, but the issues are typical.
We note that the Boundary Committee for England carries out ‘Further Electoral Reviews’ in areas where
the PER process identifies electoral equality as being worse than expected. Corby is one of these locations
(Electoral Commission, 2005b).
Figure 7: Corby County District: components influencing variations in representation a.) Distribution of numbers of councillors (seats) per ward and representation categories
17
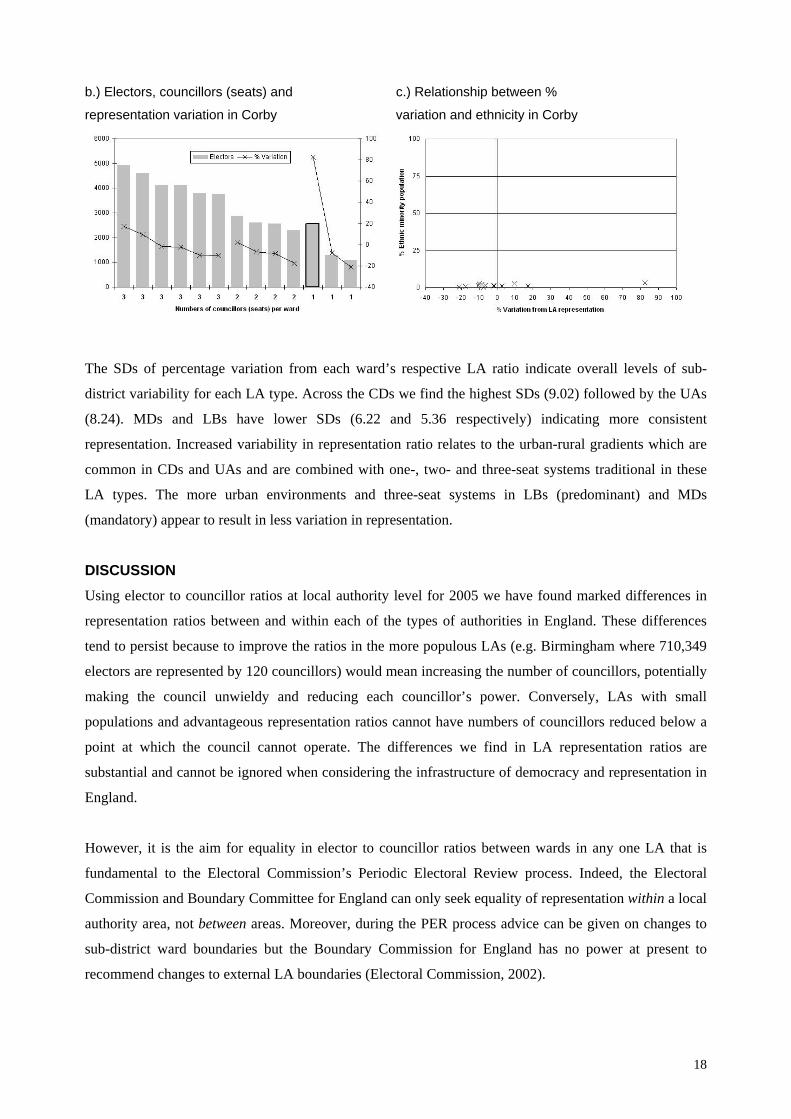
b.) Electors, councillors (seats) and c.) Relationship between %
representation variation in Corby variation and ethnicity in Corby
The SDs of percentage variation from each ward’s respective LA ratio indicate overall levels of sub-
district variability for each LA type. Across the CDs we find the highest SDs (9.02) followed by the UAs
(8.24). MDs and LBs have lower SDs (6.22 and 5.36 respectively) indicating more consistent
representation. Increased variability in representation ratio relates to the urban-rural gradients which are
common in CDs and UAs and are combined with one-, two- and three-seat systems traditional in these
LA types. The more urban environments and three-seat systems in LBs (predominant) and MDs
(mandatory) appear to result in less variation in representation.
DISCUSSION Using elector to councillor ratios at local authority level for 2005 we have found marked differences in
representation ratios between and within each of the types of authorities in England. These differences
tend to persist because to improve the ratios in the more populous LAs (e.g. Birmingham where 710,349
electors are represented by 120 councillors) would mean increasing the number of councillors, potentially
making the council unwieldy and reducing each councillor’s power. Conversely, LAs with small
populations and advantageous representation ratios cannot have numbers of councillors reduced below a
point at which the council cannot operate. The differences we find in LA representation ratios are
substantial and cannot be ignored when considering the infrastructure of democracy and representation in
England.
However, it is the aim for equality in elector to councillor ratios between wards in any one LA that is
fundamental to the Electoral Commission’s Periodic Electoral Review process. Indeed, the Electoral
Commission and Boundary Committee for England can only seek equality of representation within a local
authority area, not between areas. Moreover, during the PER process advice can be given on changes to
sub-district ward boundaries but the Boundary Commission for England has no power at present to
recommend changes to external LA boundaries (Electoral Commission, 2002).
18
When we investigated each ward’s ratio in comparison with the overall level of representation for its
associated district we found the majority of wards lie within ±10% variation. This range of variation is
considered acceptable by the Electoral Commission (2005a). Although ethnic minority populations tend
to live in the more populous LAs (mainly London Boroughs and Metropolitan Districts), we found no
evidence to indicate that poorer ward representation ratios relate systematically to distributions of ethnic
minority adult populations. The evidence is not strong, but in some Unitary Authorities there is a
tendency for wards with relatively large ethnic minority populations to have less favourable
representation ratios. Despite CDs and UAs generally having better representation ratios than LBs and
MDs, we found greater amounts of ward level variability in these LA types. On the whole, the Electoral
Commission’s PER process is successful in achieving ward level equality in representation ratios within
their stated parameters. However, some questions remain about the size of the differences that are
considered acceptable and about whether aspects could be improved in some CDs and UAs in terms of
the Boundary Committee for England’s consideration of the number of councillors, the location of
boundaries and the current and forecasted electorates in each ward.
In CDs and UAs, the tradition of having one-, two- and three-seat wards appears to offer greater
flexibility than the three-seat systems which dominate LB and MD councils, yet these LA types have less
within-district variability. The adoption of all three-seat wards in CDs and UAs is impractical since many
have rural wards with sparse populations. Wards in these types of locations invariably have large areal
extents, even with just one councillor. A multi-seat system allows, in theory, large gradients in urban-
rural population density to be accommodated. However, the categorical nature of multi-seat systems
results in discontinuities in ratios at the changeover points between numbers of councillors (as implied in
Fig. 7b for Corby). Wards with two or three seats are never likely to have their boundaries delimited with
electorates twice and three times as large as the electorates in one-seat wards.
A further consideration is the need for ward boundaries to “reflect the identities and interests of local
communities” (Electoral Commission, 2002: 5). In rural areas, the areal extent of villages are readily
identifiable and other geographies, particularly the traditional parishes, are known and often favoured by
local people. There may then be less flexibility in the location of ward boundaries than in urban
conurbations where communities are hard to delimit and therefore less of a constraint on boundary
reviews. Thus the adjustment of a shared boundary to equalise electorates in two wards each with three
councillors in the city centre of Bradford (MD) will be more readily achievable and perhaps less locally
contentious than in the contiguous multi-seat system County District of Craven which includes a number
of very rural wards in the Yorkshire Dales. Evidently, in any location there may be conceptual and
technical difficulties in creating a correspondence between communities of interest and territorially
bounded communities (Forest, 2004). To reflect identities, particularly in urban areas, it can be argued
19
that defining administrative boundaries which differentiate communities would be counter-productive to
social integration.
During the PER process the Boundary Committee for England considers each area’s current electorate
size as well as changes (proposed by the LA) in the number and distribution of electors likely to occur
over the next five years (Electoral Commission, 2002). Population forecasts are operationalised by ageing
on a base population and applying a range of plausible fertility, mortality and migration rates. Forecasts
can include location-specific drivers of population change such as planned new housing developments
(Simpson, 1998). Population forecasts are made more complex when exploring the impact of redefining
ward boundaries. Since a population’s structure largely predicts later demographic birth, death and
migration events, redefining boundaries also redefines population composition and has a knock-on affect
on the population’s subsequent size and characteristics. We would stereotypically anticipate, for example:
a youthful population to be more fertile and more migrant over longer distances; a more middle-aged
population to live in suburban locations and to age in situ; and a more elderly population to experience
higher levels of mortality and to migrate for care-related reasons. The PER process needs to take account
of what can be quite rapid changes in population in certain areas.
We have noted in some UAs a tendency for locations with relatively large ethnic minority populations to
be slightly less well represented. In relation to population forecasts, there are good reasons for including
information by ethnic group since some sub-groups often have population structures and fertility,
mortality and migration rates distinctive from the population as a whole (Haskey, 2002). It could be that
differential population change, not anticipated in electoral forecasts, has influenced representation
variability in UAs. This will be exacerbated by the urban-rural gradients and multi-seat systems discussed
above.
Changing a ward boundary not only directly affects the age-sex structure of the base population being
forecasted, but creates practical difficulties in carrying out a forecast since the composition of the newly
delimited population will be unknown. In the 2001 Census ‘Output Areas’ (OAs) nested within the 2003
wards and they were the most local geography used for Census data dissemination (Martin, 2002; ONS,
2003). ONS are consulting on geographies to be used for the 2011 Census including the proposal that
2001 OAs be held constant over time (ONS, 2005b). Where ward boundary changes have occurred since
the 2001 Census, OAs will no longer nest within those wards. During the post-censal period, if OAs were
used as building bricks of new wards during the PER process this would inform on the population age-sex
structure (as well as provide ethnic group information) and thereby aid the forecasting and analysis of
electorates. As well as the decennial census, other regularly released administrative data on, for example,
benefits claimants and Vital Statistics on births and deaths are also disseminated for wards. Boundary
changes create discontinuities in time-series data and difficulties in analysing change over time (see
20
Norman et al., 2003; Norman, 2004; Rees et al., 2004). If ward boundaries were changed by whole OAs,
the geographical harmonisation of other socio-demographic data would be simplified. Moreover, effective
dialogue between the Electoral Commission, the Office of National Statistics, the Ordnance Survey and
local authorities regarding area names, data codings and dates of changes together with accessible and
compatible file formats would underpin accurate and efficient electoral and social science analyses.
The stage in the PER process may also be influencing results. For example, if LBs and MDs have recently
had ward adjustments made, this may well explain the lack of correlation between under-representation
and ethnic group composition. Growing ethnic minority populations will over the next few years increase
the electorates in diverse and mixed wards and as a result may increase correlations with under-
representation. The Electoral Commission (2005c) report that for most councils it has been 20–25 years
from their previous electoral review to the latest round in 2004. Reviews themselves took eight years to
complete. More frequent reviews would clearly maintain a more even equality in relation to electorate
and councillor numbers.
In our study there are data quality issues to consider. The counts of electors for 2005 are adults eligible to
be on electoral registers and who registered to vote by 10th October 2004. Despite registration being
mandatory, non-registration occurs (Norman, 1997; Purdam et al., 2005). Only limited data on non-
registration exists but evidence suggests it is concentrated in certain population sub-groups (including
ethnic minorities, the unemployed, students, recent migrants and persons in private rented
accommodation) and types of location, particularly those which are more deprived (Pattie et al., 1996;
Smith, 1993; Todd and Butcher, 1982). Recent research by the Electoral Commission (2005d) using the
2001 Census and the Labour Force Survey suggests that non-registration in 2000 was around 9%. Non-
registration is thought to be as high as 25% amongst certain groups and in certain urban areas (Dorling et
al., 1996). Young people are more likely not to be registered than older people with, for example, a 2001
BBC Radio 1 first time voters poll revealing that 15% of respondents were not registered to vote
(Newsbeat, 2001). Among ethnic minority populations, those of black Caribbean and black African
heritage have the highest levels of non-registration (Anwar, 1998) and the recent research by the Electoral
Commission (2005d) found an estimated 37% of black African and 30% of Chinese people were not
registered to vote. However, many of these results are based on limited sample sizes and some non-
registered people may be ineligible to be on electoral registers due to their country of birth.
If electors are undercounted in some wards, these locations will artificially appear to have better
representation ratios. The range of variability found in this study may have been somewhat tempered,
particularly in Metropolitan Districts and London Boroughs where non-registration rates have been
shown to be high. A refinement would be to scale electorates using undercount evidence should this
become available. When representation variability is compared with 2001 Census adult distributions of all
21
ethnic minorities, undercount distortions should be minimal since Census data are affected by the same
factors as electoral registration (Rees et al., 2004; Simpson, 2002a). We have, of course, also compared
distributions obtained at different time points, April 2001 and October 2004.
CONCLUSIONS
A fundamental aspect of democracy is that one person’s vote should count as much as another's. A key
principal is that across each political unit the number of electors per representative should be as equal as
possible. It is only when equality in electorate to representative ratios is established that the equity of
other infrastructures of democracy such as the electoral system, the role of political parties and the elected
representatives themselves can effectively be pursued. To achieve this democratic equality in English
local authorities, the Electoral Commission’s Periodic Electoral Review process considers for each ward
the number of councillors, current and forecasted electorates and the location of the ward’s boundaries.
Using elector to councillor ratios at local authority level for 2005 we found marked differences in
representation ratios between and within each of four types of authority in England. These differences
have considerable implications for the equity of representation and democracy more generally in England.
It is the somewhat more limited aim of equality in elector to councillor ratios between wards in any one
local authority that is the primary objective of the PER process. We found that when each ward’s ratio is
compared with the overall level of representation for its associated district the majority of wards are
within a ±10% range of variation.
Comparing the ward representation ratios with Census data we found no evidence to indicate that
variations in ward representation for 2005 relate systematically to 2001 distributions of ethnic minority
adults in the London Boroughs and Metropolitan Districts; the local authority types with the largest ethnic
minority populations. We recognise that any results obtained here relate to the registered electorate and
that for any one local authority reflect the stage in the implementation of boundary reviews reached by
2005.
Whilst County Districts and Unitary Authorities generally have better representation ratios than the LBs
and MDs, these LA types tend to have higher levels of within district variability. This sub-district
variability relates most to urban-rural variations in electorate size and is compounded by the use of one-,
two- and three-seat systems for wards. In addition, some UAs have a tendency for locations with
relatively large ethnic minority populations to be less well represented. This may be a consequence of
youthful, growing populations and the stage in the boundary review cycle. Although there are resource
implications, in certain locations it may be advisable to allow for ethnic group demographic differences
when forecasting future electorates during the boundary review process. Certainly, the young age
structure of most inner urban areas should be explicitly modelled in the PER process as young age
22
structures imply a rapidly growing electorate. Many aspects of tracking and forecasting change over time
in electorates as well as analysing other social change over time would be simplified if known
geographical building bricks such as 2001 Census Output Areas were used in the boundary review
process.
ACKNOWLEDGEMENTS This research uses data provided by the Electoral Commission, Ordnance Survey and the Office for
National Statistics. The research includes 2001 Census and GIS boundary data obtained via MIMAS
CASWEB and EDINA UKBORDERS; both services are supported by ESRC and JISC. The authors are
grateful to the above organisations and to Dr Paul Williamson, University of Liverpool, who has provided
useful comments. All electoral, census, National Statistics and digital boundary data are copyright of the
Crown and are reproduced with permission of the Controller of HMSO.
23
REFERENCES Anwar, M. (1998) Ethnic Minorities and the British Electoral System, CRER and OBV University of
Warwick. Chisholm, M. and Dench, G. (2005) Community Identity: Literature Review and Analysis for Dorling, D., Pattie, C., Rossiter, D and Johnston, R. (1996) ‘Missing voters in Britain 1992-96’, in
Farrell, DM, Broughton, D., Denver, D., and Fisher, J. (eds) British Elections and Parties Yearbook 1996, London, Frank Cass.
Electoral Commission (2002) Periodic and further electoral reviews: guidance and procedural advice. Online: http://www.boundarycommittee.org.uk/our-work/pers.cfm
Electoral Commission (2005a) Discussion with authors, February 2005, London, Electoral Commission. Electoral Commission (2005b) Current Further Electoral Reviews. Online:
http://www.boundarycommittee.org.uk/our-work/currentreviews.cfm Electoral Commission (2005c) Periodic Electoral Reviews, Consultation Paper, September 2005,
London, Electoral Commission. Electoral Commission (2005d) Understanding electoral registration. The Extent and nature of non
registration in Britain, London, Electoral Commission. Farrell, D. (2001) Electoral Systems: a Comparative Introduction, London, Palgrave. Forest, B. (2004) Information sovereignty and GIS: the evolution of "communities of interest" in political
redistricting. Political Geography Vol. 23, Issue 4: 425-451. Gay, O. (1999) Local elections – proposals for reform. Research Paper 99/46. House of Commons.
Online: http://www.parliament.uk/commons/lib/research/rp99/rp99-046.pdf Haskey, J. (2002) Projection of the population by ethnic group: a sufficiently interesting or a definitely
necessary exercise to undertake? In Ethnic population projections: a feasibility study ed. John Haskey. The Stationery Office Online: http://www.statistics.gov.uk/statbase/Product.asp?vlnk=9263
Johnston, R.J. (2002) Manipulating maps and winning elections, Political Geography, 21, pp 1-32 Johnston, R.J. Pattie, C.J., Dorling, D. and Rossiter, D. (2001) From Votes to Seats: The Operation of the
UK Electoral System Since 1945, Manchester, Manchester University Press. Judge, D. (1999). Representation: Theory and Practice in Britain. London, Routledge. Manchester Information and Associated Services (MIMAS) (2005). Census Dissemination Unit Web
Interface to Census Aggregate Outputs and Digital Boundary Data: CASWEB. Online: http://census.ac.uk/casweb/
Martin, D. (2002). Output areas for 2001. Chapter 3 in Rees P, Martin D and Williamson P (ed.) (2002). The Census Data System, John Wiley & Sons, Chichester, pp 37-46.
Newsbeat (2001) First Time Voters Poll, May 2001. Norman, P. (1997) Small Area Population Updates, Research Section, City of Bradford Metropolitan
District Council, Bradford Norman, P. (2004) Constructing a sociodemographic data time-series: computational issues and solutions.
ESRC Research Methods Programme. Online: http://www.ccsr.ac.uk/methods/publications/ Norman, P. and Simpson, L. (2005) Custom geography conversion tables that enable area data
disseminated for the 1991 Census wards to be compatible with the 2001 Census ward definitions. CCSR Working Paper No. 2005-07. Online: http://www.ccsr.ac.uk/publications/working/
Norman, P., Rees, P. and Boyle, P. (2003) Achieving data compatibility over space and time: creating consistent geographical zones. International Journal of Population Geography. Vol 9, Issue 5, September-October 2003: 365-386
ODPM (2004) HC315 Ninth report of Session 2004–5, Select Committee’s report. See www.parliament.uk/parliamentary_committees/odpm.cfm.
24
ONS (2003) Geography and National Statistics. Office for National Statistics. Online: http://www.statistics.gov.uk/geography/changing_geog.asp
ONS (2005a) Ward History Database. Office for National Statistics. Online: http://www.statistics.gov.uk/geography/
ONS (2005b) 2011 Census Small Area Outputs Geography Policy. Advisory Group Paper AG (05) 09. Online: http://www.statistics.gov.uk/census2001/advgroups.asp
Pattie, C. J., Dorling, D. F. L., Johnston, R. J. and Rossiter, D. J. (1996) Electoral registration, population mobility and the democratic franchise: the geography of postal voters, overseas voters and missing voters in Great Britain. International Journal of Population Geography 2: 239-259
Periodic Electoral Review, London, Electoral Commission. Phillips, A. (1995) The Politics of Presence: the Political Representation of Gender, Ethnicity and Race.
Oxford: Clarendon Press. Pitkin, H. (1967) The Concept of Representation. London: University of California Press. Purdam, K. (2000) The Political Identities of Muslim Local Councillors, Local Government Studies, Vol
26 No 1, Spring 2000 pp 47-64 Purdam, K., and Fieldhouse, E., Kalra, V and Russell, A. (2002) Voter Engagement amongst ethnic
minority communities in the UK, London: Electoral Commission. Purdam, K., Cutts, D. and Fieldhouse, E. (2005) Measuring Voter Turnout - The Electoral Registers and
Marked Electoral Registers as a Data Source, CCSR Working Paper, University of Manchester. Rallings, C., Johnston, R., Thrasher, M. (2004) Equalising votes but enabling bias: the electoral impact of
the 1977 and 1999 ward boundary reviews in London. Urban Studies Vol. 41 No. 7: 1367-1393 Rees, P., Brown, D., Norman, P. and Dorling, D. (2003) Are socioeconomic inequalities in mortality
decreasing or increasing within some British regions? An observational study, 1990-98. Journal of Public Health Medicine. 25(3): 208-214
Rees, P., Norman, P. and Brown, D. (2004) A framework for progressively improving small area population estimates. Journal of the Royal Statistical Society A. Vol. 167 Part 1: 5-36
Simpson, L. (1998) Electoral ward boundary reviews: forecasting the size of the electorate five years ahead. V.12 in Making Local Population Statistics: a Guide for Practitioners. edited Simpson L. LARIA: Wokingham: 211-221
Simpson, L. (2002a) Dealing with Census undercount. In The Census Data System: resources, tools and developments eds Rees, P., Martin, D. and Williamson, P. John Wiley: Chichester; 171-199
Simpson, L. (2002b) Geography conversion tables: a framework for conversion of data between geographical units. International Journal of Population Geography 8: 69-82
Simpson, L., Purdam, K., Tajar, A., Fieldhouse, E., Tranmer, M., Gavalas, V., Pritchard, J. and Dorling, D. (2005) Ethnic Minority populations and the labour market: Analysis of the 2001 Census. CCSR report for the Department for Work and Pensions
Smith, S. (1993) Electoral Registration in 1991. OPCS series SS no 1301, HMSO: London Todd, J. and Butcher, B (1982) Electoral registration in 1981, London, OPCS.
25