Embed Size (px)
Citation preview
ORIGINAL ARTICLE
Representational disfluency in algebra: evidence from studentgestures and speech
Kristen N. Bieda Æ Mitchell J. Nathan
Accepted: 5 July 2009
� FIZ Karlsruhe 2009
Abstract In this investigation, we analyzed US middle
school students’ (grades 6–8) gestures and speech during
interviews to understand students’ reasoning while inter-
preting quantitative patterns represented by Cartesian
graphs. We studied students’ representational fluency,
defined as their abilities to work within and translate
among representations. While students translated across
representations to address task demands, they also trans-
lated to a different representation when reaching an
impasse, where the initial representation could not be used
to answer a task. During these impasse events, which we
call representational disfluencies, three categories of
behavior were observed. Some students perceived the
graph to be bounded by its physical and numerical limits,
and these students were categorized as physically groun-
ded. A second, related, disfluency was categorized as
spatially grounded. Students who were classified as spa-
tially grounded exhibited a bounded view of the graph that
limited their ability to make far predictions until they
physically altered the spatial configuration of the graph by
rescaling or extending the axes. Finally, students who
recovered from one or more of these disfluencies by
translating the quantitative information to alternative but
equivalent representations (i.e., exhibiting representational
fluency), while retaining the connection back to the linear
pattern as graphed, were categorized as interpretatively
grounded. Understanding the causes and varieties of rep-
resentational fluency and disfluency contributes directly to
our understanding of mathematics knowledge, learning and
adaptive forms of reasoning. These findings also provide
implications for mathematics instruction and assessment.
1 Introduction
Representational fluency, the ability to work within and
translate among representations, is central to the enterprise
of mathematical activity and knowledge construction. In
this investigation, we analyzed students’ gestures in rela-
tion to their speech, writing, and drawing during interviews
to understand the reasoning processes and strategies chil-
dren use while interpreting Cartesian graphs of quantitative
patterns. In framing our research, we draw on prior work
on reasoning with graphs, as well as the role of represen-
tational fluency more generally in shaping students’ rea-
soning processes. Central to our approach is how children
assign meaning to formal, mathematical representations—
how they attempt to ground them in terms of actions on
these representations and with reference to other mathe-
matical formalisms. When analyzing students’ responses to
pattern generalization tasks involving Cartesian graphs, we
found students exhibiting representational disfluencies,
events where perceived shortcomings in using representa-
tions to solve problems motivate students to modify or
translate among representations. Close analyses of stu-
dents’ speech, gestures, and writing revealed several new
insights into the ways mathematical representations are
perceived and interpreted by students, namely how boun-
ded students are to the physical limits of a given graph and
how such boundedness suggests ways that students ground
their understanding of the task demands in a given
K. N. Bieda (&)
Michigan State University, 312 Erickson Hall,
East Lansing, MI 48824, USA
e-mail: [email protected]
M. J. Nathan
School of Education, University of Wisconsin-Madison,
1025 West Johnson St, Madison, WI 53706, USA
e-mail: [email protected]
123
ZDM Mathematics Education
DOI 10.1007/s11858-009-0198-0
representation. These insights have direct implications for
theories of the nature of mathematical reasoning with for-
mal representations, as well as for the role that careful
observations of students can play for informing instruction.
1.1 Gesture research
The spontaneous hand gestures that a child produces during
problem solving often reveal the way the child represents
the task (Goldin-Meadow, 2003). In particular, students’
gestures, combined with their words, serve as semiotic
ways that students construct meaning of the representations
they encounter, as mediated by students’ knowledge and
perceptual processing (Radford, 2009). Roth (2001)
reviewed evidence that gestures reveal implicit or emergent
knowledge that may be expressed in speech only at some
later point (Church & Goldin-Meadow, 1986; Crowder,
1996). During explanations of problem solving, attending
to one’s gestures ‘‘can be used to make inferences about
precisely which features of the complex perceptual field …should be attended to’’ (Goodwin, 1994, p. 614).
The relationship between speech and gesture is signifi-
cant. McNeill (1992) argued that gesture and speech con-
stitute two components of ‘‘a single underlying mental
process’’ (p. 1) that mediates language production, even
though gestures do not necessarily reveal identical infor-
mation. By tracking gestures, one can learn not only what
someone is thinking about, but also the manner in which a
speaker conveys those thoughts. It is in the sense that
gestures provide ‘‘the imagery of language’’ (McNeill,
1992, p. 1). Gestures can also reveal how a speaker orients
to and incorporates objects (both physical and symbolic)
from her immediate environment into her discourse.
1.2 Grounding
One of the challenges of learning and using mathematical
representations is grasping their meaning by recognizing or
forging associations between them and other representa-
tions, or connecting them to objects and events in the world
(e.g., Pape & Tschoshanov, 2001). Grounding is commonly
used to describe the mapping that a person makes between
an unfamiliar or abstract representation, and a more con-
crete or familiar referent (Glenberg, De Vega & Graesser,
2008; Nathan, 2008). Grounding, as a process, facilitates
meaning making for something that would otherwise be
taken as abstract and non-denotative (e.g., Glenberg &
Robertson, 1999; Harnad, 1990; Lakoff & Nunez, 2000).
Grounded representations are desirable because, once
imbued with meaning, they depict relations in a succinct
way and potentially support the discovery of new relations.
Empirical work has shown grounding to be quite robust
for enhancing students’ understanding of mathematical
principles, procedures, and representations, leading to
learning gains in areas ranging from basic number and
early arithmetic (Griffin, Case & Siegler, 1994), fractions
(Saxe, Taylor, McIntosh & Gearhart, 2005), arithmetic and
algebra story problem solving (Glenberg, Jaworski,
Rischall, & Levin, 2009; Nathan, Kintsch & Young, 1992),
and complex adaptive systems (Goldstone & Son, 2005).
While grounding mathematical representations is a
highly desirable aim of instruction, there also appear to be
downsides. De Bock and colleagues (2003) showed that
authentic contexts and self-generated representations—
both highly grounded representations for learners—had a
negative effect on students’ performance in high school
geometry problems. Concrete exemplars of a concept also
convey superficial information that may distract learners
from the underlying mathematical structure, helping with
initial learning, but limiting its subsequent transfer
(Kaminski, Sloutsky & Heckler, 2008) unless concreteness
was reduced over time in favor of greater abstraction
(Goldstone & Son, 2005).
Negative effects of grounding have also been shown
specifically with Cartesian graphs. When graphs are seen as
grounded representations for the student, their shape can be
interpreted as depicting the physical movement of the
phenomenon being represented rather than as covariation
among measured quantities (Clement, 1985; Smith, di-
Sessa, & Roschelle, 1993). Some of the negative effects of
grounding to Cartesian graphs, particularly for novices,
may be attributed to their nature as an external represen-
tation (Zhang & Norman, 1994) where ‘‘the information …can be picked up, analyzed, and processed by perceptual
systems alone.’’ (Zhang, 1997, p. 180). Thus, it appears
that one’s perceptions and reasoning processes can be
inappropriately bound to the representations they are
grounded to, which can impose superfluous or incorrect
constraints on the representations themselves and the
strategies that draw upon them, thereby negatively affect-
ing problem-solving performance or transfer.
1.3 Prior work on reasoning with Cartesian graphs
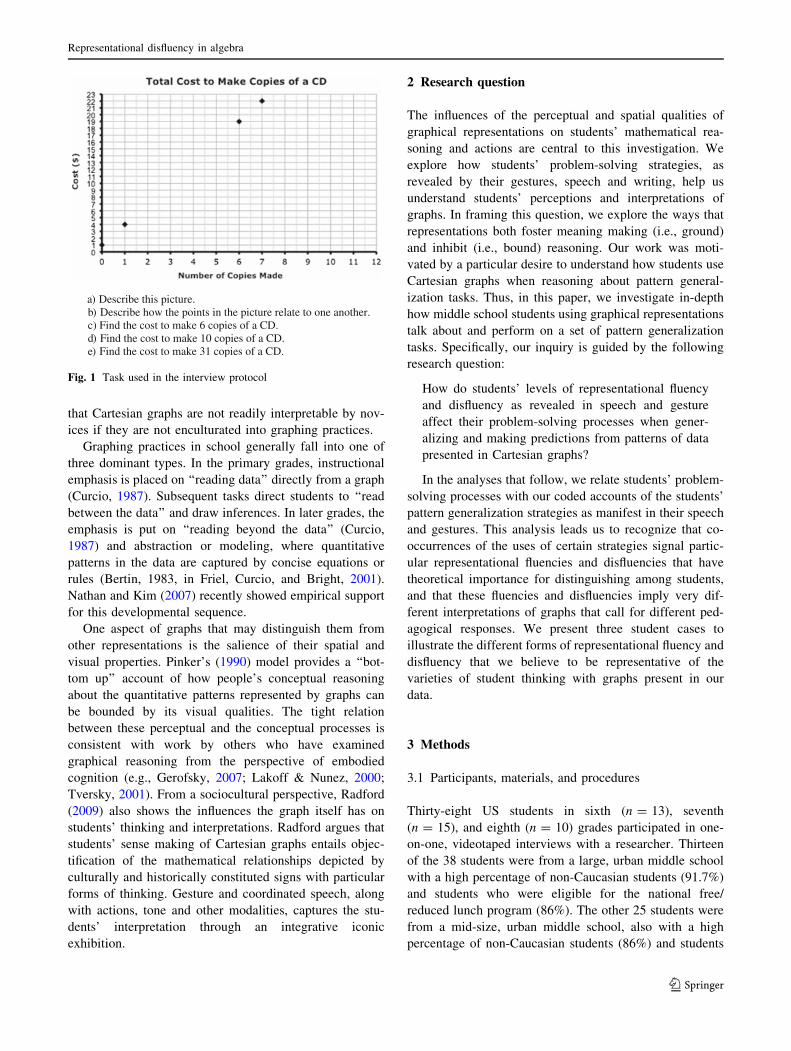
The Cartesian graph is the rectangular coordinate system
depicted by all of the points specified in a plane by the
orthogonal relations of the x- and y-axes (see Fig. 1 for an
example, where the x-axis shows the Number of Copies
Made, and the y-axis shows the Cost in Dollars). A review
of children’s experiences with these graphs shows many
areas of confusion, including an over-reliance on a literal
or iconic interpretation (Clement, 1985; Smith, et al..
1993), correlating height and slope (Leinhardt, Zaslavsky,
& Stein, 1990), and arbitrarily switching between inde-
pendent (x) and dependent (y) variables (Beichner, 1994).
An anthropological perspective (Roth et al., 1999) shows
K. N. Bieda, M. J. Nathan
123
that Cartesian graphs are not readily interpretable by nov-
ices if they are not enculturated into graphing practices.
Graphing practices in school generally fall into one of
three dominant types. In the primary grades, instructional
emphasis is placed on ‘‘reading data’’ directly from a graph
(Curcio, 1987). Subsequent tasks direct students to ‘‘read
between the data’’ and draw inferences. In later grades, the
emphasis is put on ‘‘reading beyond the data’’ (Curcio,
1987) and abstraction or modeling, where quantitative
patterns in the data are captured by concise equations or
rules (Bertin, 1983, in Friel, Curcio, and Bright, 2001).
Nathan and Kim (2007) recently showed empirical support
for this developmental sequence.
One aspect of graphs that may distinguish them from
other representations is the salience of their spatial and
visual properties. Pinker’s (1990) model provides a ‘‘bot-
tom up’’ account of how people’s conceptual reasoning
about the quantitative patterns represented by graphs can
be bounded by its visual qualities. The tight relation
between these perceptual and the conceptual processes is
consistent with work by others who have examined
graphical reasoning from the perspective of embodied
cognition (e.g., Gerofsky, 2007; Lakoff & Nunez, 2000;
Tversky, 2001). From a sociocultural perspective, Radford
(2009) also shows the influences the graph itself has on
students’ thinking and interpretations. Radford argues that
students’ sense making of Cartesian graphs entails objec-
tification of the mathematical relationships depicted by
culturally and historically constituted signs with particular
forms of thinking. Gesture and coordinated speech, along
with actions, tone and other modalities, captures the stu-
dents’ interpretation through an integrative iconic
exhibition.
2 Research question
The influences of the perceptual and spatial qualities of
graphical representations on students’ mathematical rea-
soning and actions are central to this investigation. We
explore how students’ problem-solving strategies, as
revealed by their gestures, speech and writing, help us
understand students’ perceptions and interpretations of
graphs. In framing this question, we explore the ways that
representations both foster meaning making (i.e., ground)
and inhibit (i.e., bound) reasoning. Our work was moti-
vated by a particular desire to understand how students use
Cartesian graphs when reasoning about pattern general-
ization tasks. Thus, in this paper, we investigate in-depth
how middle school students using graphical representations
talk about and perform on a set of pattern generalization
tasks. Specifically, our inquiry is guided by the following
research question:
How do students’ levels of representational fluency
and disfluency as revealed in speech and gesture
affect their problem-solving processes when gener-
alizing and making predictions from patterns of data
presented in Cartesian graphs?
In the analyses that follow, we relate students’ problem-
solving processes with our coded accounts of the students’
pattern generalization strategies as manifest in their speech
and gestures. This analysis leads us to recognize that co-
occurrences of the uses of certain strategies signal partic-
ular representational fluencies and disfluencies that have
theoretical importance for distinguishing among students,
and that these fluencies and disfluencies imply very dif-
ferent interpretations of graphs that call for different ped-
agogical responses. We present three student cases to
illustrate the different forms of representational fluency and
disfluency that we believe to be representative of the
varieties of student thinking with graphs present in our
data.
3 Methods
3.1 Participants, materials, and procedures
Thirty-eight US students in sixth (n = 13), seventh
(n = 15), and eighth (n = 10) grades participated in one-
on-one, videotaped interviews with a researcher. Thirteen
of the 38 students were from a large, urban middle school
with a high percentage of non-Caucasian students (91.7%)
and students who were eligible for the national free/
reduced lunch program (86%). The other 25 students were
from a mid-size, urban middle school, also with a high
percentage of non-Caucasian students (86%) and students
a) Describe this picture.b) Describe how the points in the picture relate to one another. c) Find the cost to make 6 copies of a CD. d) Find the cost to make 10 copies of a CD. e) Find the cost to make 31 copies of a CD.
Fig. 1 Task used in the interview protocol
Representational disfluency in algebra
123
who were eligible for free/reduced lunch (79.1%). All
students were enrolled in at least grade-appropriate math-
ematics classes, with both of the schools utilizing the
NCTM Standards-based Connected Mathematics Project
curriculum (Lappan et al., 1998) at each grade level. In this
study, we focus on students’ responses to a task that
assessed their abilities to extrapolate from a linear pattern
presented on a Cartesian coordinate graph.
As shown in Fig. 1, parts (a) and (b) of the task pro-
vided a baseline assessment of students’ abilities to iden-
tify a Cartesian graph in a general way and interpret the
meaning of the information presented. Part (c) assessed
students’ basic representational fluency with reading a
point on a graph. Both parts (d) and (e) were far predic-
tion (FP) tasks, because they asked students to come up
with a value that exceeded the pattern as it was graphically
presented. The answer for part (d) corresponded to a y-
value of 31, a value beyond the numerical limit of the y-
axis as drawn. Both coordinate values for part (e) (x = 31
and y = 94) were beyond the numerical limits of the x-
and y-axes as drawn.
Students were interviewed individually in the students’
regular school during the school day. Before viewing
the items, students were instructed to ‘‘think aloud’’
throughout the interview—to say as much as they could
about their thinking as they solved the problems. When
students were quiet for long periods (greater than several
seconds), they were reminded by the interviewer to
‘‘think aloud.’’ If a student’s response consisted solely of
an answer, the interviewer asked the student to explain
how he or she arrived at the answer. Students were
allowed to use the ruler and calculator provided, but were
asked to describe aloud their measurements and
calculations.
3.2 Coding
Transana, a software package for analyzing video data
(Woods and Fassnacht, 2007), was used to create and code
the video transcripts. Coding was completed over multiple
passes through the transcripts (cf. McNeill and Duncan,
N.D.); first, by segmenting the transcript into short utter-
ances determined by changes in speaker or linguistic cues,
indicating change in thought or purpose, and by annotating
pauses, breaths and any other non-speech sounds; second,
by signifying each gesture; third, by annotating each ges-
ture; fourth, by coding the speech and gestures analytically
(see below), rather than descriptively; and finally, by
revising codes as the data revealed more information about
the speech and gesture production.
For part (a), which asked to describe the picture shown,
student responses were coded as: (1) Graph, for responses
indicating that the picture showed a graph; (2) Features, for
responses that read the graph’s title and/or axis labels as
description of the picture; and (3) Interpretations, for
responses that interpreted the information presented in the
graph as a description, such as ‘‘The picture shows that you
can make 6 copies of a CD for $19.’’ Part (b) responses
were coded into categories based on the type of relation-
ship between the plotted points, such as: (1) covariate, for
responses that described a dependent relationship between
the x- and y-values; (2) x-axis or y-axis, for responses
which described only the change occurring in the x- or y-
values, respectively; and (3) no relationship, for responses
that explicitly indicated there was no relationship between
the plotted points. For part (c), students’ responses were
coded as correct or incorrect to provide baseline informa-
tion on fluency in reading Cartesian graphs. Because the
given x-value and its corresponding y-value were both
visible, most students answered this item using direct
inspection.
For parts (d) and (e), the far prediction tasks, students’
responses were scored as correct/incorrect, and coded for
their solution strategies (below), while gestures were coded
for boundedness (see below). While all five parts of the
interview reveal aspects of students’ reasoning with graphs,
the analyses presented below focus primarily on parts (d)
and (e) because these were the only tasks that invited
extensions beyond the patterns as presented, and gave us a
look at the nature and influences of students’ bounded and
unbounded views.
3.2.1 Strategy codes
The set of strategy codes used in this study were produced
using both top–down and bottom–up methods, and so do
not represent all of the possible correct and incorrect
strategies that could be employed to solve the tasks in
parts (d) and (e). The complete list, along with examples,
the relation of each to our notion of representational flu-
ency, and their frequencies of occurrence in the data can
be found in Appendix A. The Arithmetic code, with sub-
codes Recursive Arithmetic, Linear (the expected response
to the question), and Linear Combination, were obtained
from a review of the literature on strategies used to solve
algebraic problems (e.g., Lannin, Barker & Townsend,
2006, Nathan & Kim, 2007). Additional codes, namely
Pragmatic, Spatial Estimation, Graph Enlargement, were
developed using the constant comparative method (Glaser,
1978) of analyzing the speech and gestures in the
transcripts.
3.2.2 Codes for boundedness
Students’ responses on the FP tasks revealed two distinct
gesture patterns. Students sometimes used their hands to
K. N. Bieda, M. J. Nathan
123
indicate that their interpretations of the graph was inher-
ently limited by its physical and numerical boundaries;
that is, to the student, the information provided within the
graph was limited to what was displayed within the grid,
bounded by the least and greatest x- and y-values shown.
Gestures that remained within the physical boundaries of
the given Cartesian grid were coded as In Bounds or On
Bounds, and used as potential evidence of a bounded
view. In contrast, an alternative code was assigned when
gestures did not indicate any physical or numerical
restriction on the data presented in the Cartesian graph.
These gestures may have referred to values that were
beyond the numerical limits of the x- and y-axes, and
exhibited movements that extended beyond the physical
limits of the gridlines. Any gesturing that students pro-
duced while either solving or explaining their solution to
the FP task that referred explicitly to space beyond the
physical limits of the Cartesian graph (i.e., Outside
Bounds) was considered as evidence that a student had an
unbounded view of the graph.
If students supported their verbal explanations or their
work with gestures that were both bounded and unbounded
in nature, the overall classification of their gestured
responses was coded as unbounded. It was also the case
that a student’s gestures may have been coded as bounded
even though they may have an unbounded view; many
studies in other areas have shown that children indicate one
view with gestures and a different one with words (e.g.,
Alibali & Goldin-Meadow, 1993; Church & Goldin-Mea-
dow, 1986; Roth, 2001). We accounted for this possibility
when constructing our categorizations of grounding to the
graph presented in Table 2.
3.2.3 Categorizations of grounding to the graph
Analysis of the transcribed and gesture-annotated data
aimed to establish whether students indicated that the
pattern provided in the graph was bounded within the
graph’s axes, and whether there was a pattern in the
strategies students used to solve both the simpler and
more complex FP tasks. From these general patterns of
strategy use and gesture production, we sought to
understand more about the students who exhibited two
kinds of representational disfluencies. One form of disfl-
uency occurred when students who were bounded to a
given representation did not alter or translate the given
representation. We label students demonstrating this dis-
fluency as physically grounded, because they used the
graphs and the information presented within them in ways
that suggested the graph was fundamentally limited and
immutable, as though it were an invariant physical object
that can only be read from and referred to. A second form
of disfluency was observed when students who showed
evidence of a bounded view as determined by their ges-
tures, physically altered the graph using rescaling and
extending, but did not translate the information presented
in the graph to any type of generalized symbol structure
such as the number line, a rule, or an equation. Students
demonstrating the second kind of representational disflu-
ency employed a form of unbounded gesturing when
adapting the graph, but their gestures subsequently
remained within the spatial bounds of the newly altered
graph—thus exhibiting a hybrid form of bounded and
unbounded gesturing, which we refer to as spatially
grounded.
A third group of students demonstrated a different kind
of fluency with the graphical representation that supported
unbounded reasoning. They saw the graph as a portrayal
of some pattern that could be reinterpreted through
translation to generalized numerical structures such as
arithmetic or algebraic formalisms, but that still main-
tained its connection back to the original graphical
pattern. We refer to these students as interpretatively
grounded. Consequently, we argue that when considering
both students’ gestures and problem solving strategies, the
ways in which students use Cartesian graphs to ground
their understanding of the data presented in them fall into
three categories of classification, namely physically
grounded, spatially grounded, and interpretatively groun-
ded (see Table 1).
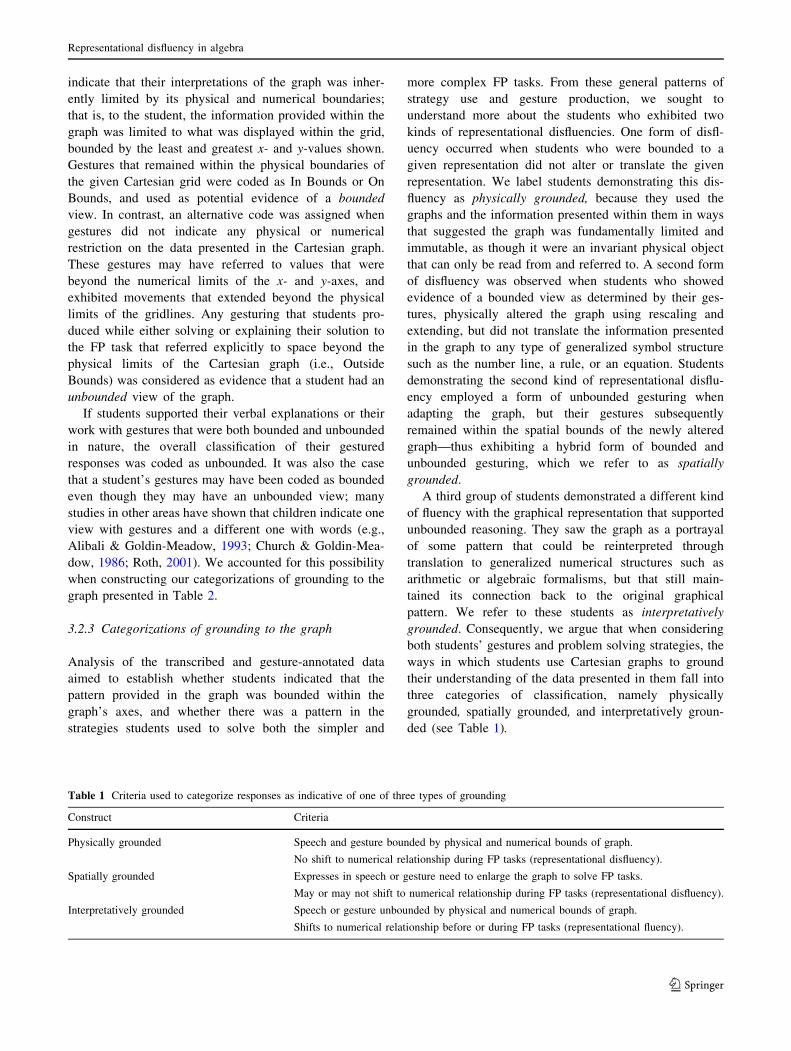
Table 1 Criteria used to categorize responses as indicative of one of three types of grounding
Construct Criteria
Physically grounded Speech and gesture bounded by physical and numerical bounds of graph.
No shift to numerical relationship during FP tasks (representational disfluency).
Spatially grounded Expresses in speech or gesture need to enlarge the graph to solve FP tasks.
May or may not shift to numerical relationship during FP tasks (representational disfluency).
Interpretatively grounded Speech or gesture unbounded by physical and numerical bounds of graph.
Shifts to numerical relationship before or during FP tasks (representational fluency).
Representational disfluency in algebra
123
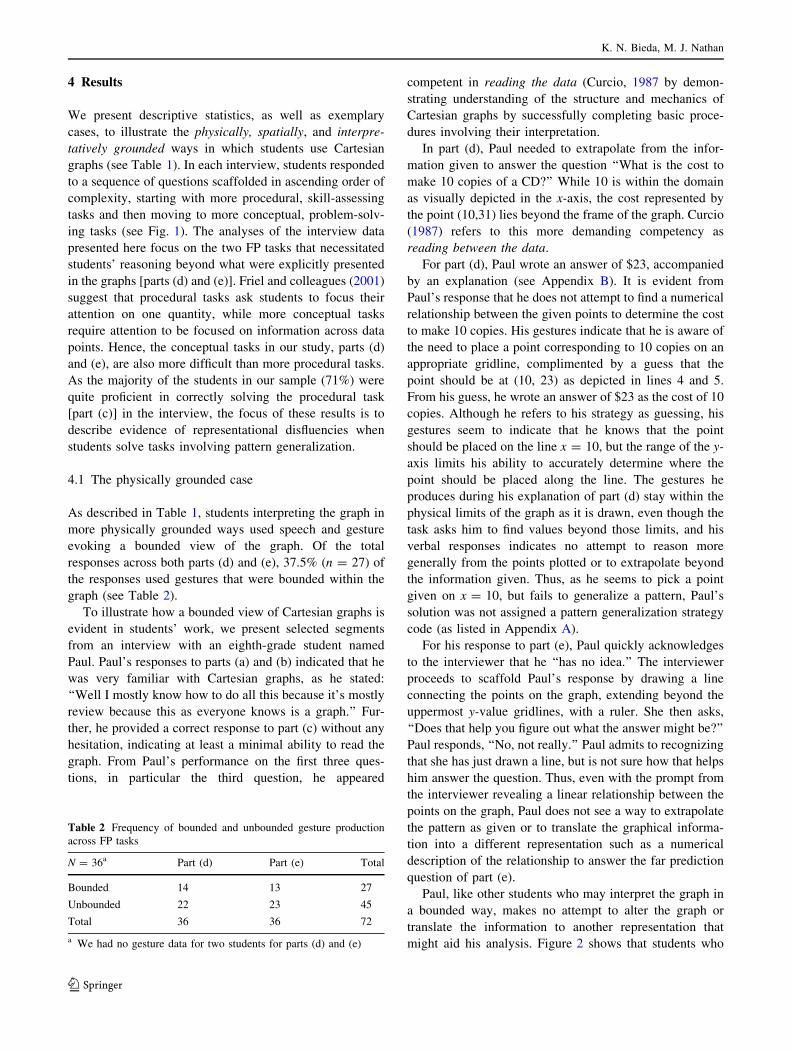
4 Results
We present descriptive statistics, as well as exemplary
cases, to illustrate the physically, spatially, and interpre-
tatively grounded ways in which students use Cartesian
graphs (see Table 1). In each interview, students responded
to a sequence of questions scaffolded in ascending order of
complexity, starting with more procedural, skill-assessing
tasks and then moving to more conceptual, problem-solv-
ing tasks (see Fig. 1). The analyses of the interview data
presented here focus on the two FP tasks that necessitated
students’ reasoning beyond what were explicitly presented
in the graphs [parts (d) and (e)]. Friel and colleagues (2001)
suggest that procedural tasks ask students to focus their
attention on one quantity, while more conceptual tasks
require attention to be focused on information across data
points. Hence, the conceptual tasks in our study, parts (d)
and (e), are also more difficult than more procedural tasks.
As the majority of the students in our sample (71%) were
quite proficient in correctly solving the procedural task
[part (c)] in the interview, the focus of these results is to
describe evidence of representational disfluencies when
students solve tasks involving pattern generalization.
4.1 The physically grounded case
As described in Table 1, students interpreting the graph in
more physically grounded ways used speech and gesture
evoking a bounded view of the graph. Of the total
responses across both parts (d) and (e), 37.5% (n = 27) of
the responses used gestures that were bounded within the
graph (see Table 2).
To illustrate how a bounded view of Cartesian graphs is
evident in students’ work, we present selected segments
from an interview with an eighth-grade student named
Paul. Paul’s responses to parts (a) and (b) indicated that he
was very familiar with Cartesian graphs, as he stated:
‘‘Well I mostly know how to do all this because it’s mostly
review because this as everyone knows is a graph.’’ Fur-
ther, he provided a correct response to part (c) without any
hesitation, indicating at least a minimal ability to read the
graph. From Paul’s performance on the first three ques-
tions, in particular the third question, he appeared
competent in reading the data (Curcio, 1987 by demon-
strating understanding of the structure and mechanics of
Cartesian graphs by successfully completing basic proce-
dures involving their interpretation.
In part (d), Paul needed to extrapolate from the infor-
mation given to answer the question ‘‘What is the cost to
make 10 copies of a CD?’’ While 10 is within the domain
as visually depicted in the x-axis, the cost represented by
the point (10,31) lies beyond the frame of the graph. Curcio
(1987) refers to this more demanding competency as
reading between the data.
For part (d), Paul wrote an answer of $23, accompanied
by an explanation (see Appendix B). It is evident from
Paul’s response that he does not attempt to find a numerical
relationship between the given points to determine the cost
to make 10 copies. His gestures indicate that he is aware of
the need to place a point corresponding to 10 copies on an
appropriate gridline, complimented by a guess that the
point should be at (10, 23) as depicted in lines 4 and 5.
From his guess, he wrote an answer of $23 as the cost of 10
copies. Although he refers to his strategy as guessing, his
gestures seem to indicate that he knows that the point
should be placed on the line x = 10, but the range of the y-
axis limits his ability to accurately determine where the
point should be placed along the line. The gestures he
produces during his explanation of part (d) stay within the
physical limits of the graph as it is drawn, even though the
task asks him to find values beyond those limits, and his
verbal responses indicates no attempt to reason more
generally from the points plotted or to extrapolate beyond
the information given. Thus, as he seems to pick a point
given on x = 10, but fails to generalize a pattern, Paul’s
solution was not assigned a pattern generalization strategy
code (as listed in Appendix A).
For his response to part (e), Paul quickly acknowledges
to the interviewer that he ‘‘has no idea.’’ The interviewer
proceeds to scaffold Paul’s response by drawing a line
connecting the points on the graph, extending beyond the
uppermost y-value gridlines, with a ruler. She then asks,
‘‘Does that help you figure out what the answer might be?’’
Paul responds, ‘‘No, not really.’’ Paul admits to recognizing
that she has just drawn a line, but is not sure how that helps
him answer the question. Thus, even with the prompt from
the interviewer revealing a linear relationship between the
points on the graph, Paul does not see a way to extrapolate
the pattern as given or to translate the graphical informa-
tion into a different representation such as a numerical
description of the relationship to answer the far prediction
question of part (e).
Paul, like other students who may interpret the graph in
a bounded way, makes no attempt to alter the graph or
translate the information to another representation that
might aid his analysis. Figure 2 shows that students who
Table 2 Frequency of bounded and unbounded gesture production
across FP tasks
N = 36a Part (d) Part (e) Total
Bounded 14 13 27
Unbounded 22 23 45
Total 36 36 72
a We had no gesture data for two students for parts (d) and (e)
K. N. Bieda, M. J. Nathan
123
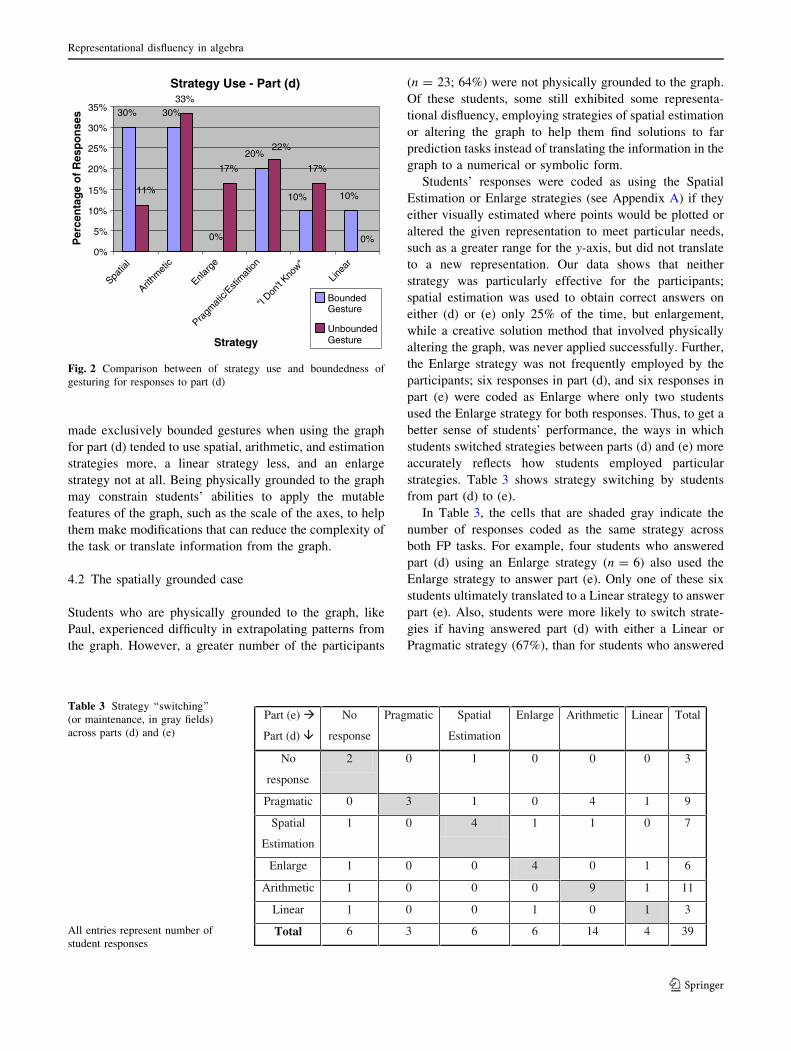
made exclusively bounded gestures when using the graph
for part (d) tended to use spatial, arithmetic, and estimation
strategies more, a linear strategy less, and an enlarge
strategy not at all. Being physically grounded to the graph
may constrain students’ abilities to apply the mutable
features of the graph, such as the scale of the axes, to help
them make modifications that can reduce the complexity of
the task or translate information from the graph.
4.2 The spatially grounded case
Students who are physically grounded to the graph, like
Paul, experienced difficulty in extrapolating patterns from
the graph. However, a greater number of the participants
(n = 23; 64%) were not physically grounded to the graph.
Of these students, some still exhibited some representa-
tional disfluency, employing strategies of spatial estimation
or altering the graph to help them find solutions to far
prediction tasks instead of translating the information in the
graph to a numerical or symbolic form.
Students’ responses were coded as using the Spatial
Estimation or Enlarge strategies (see Appendix A) if they
either visually estimated where points would be plotted or
altered the given representation to meet particular needs,
such as a greater range for the y-axis, but did not translate
to a new representation. Our data shows that neither
strategy was particularly effective for the participants;
spatial estimation was used to obtain correct answers on
either (d) or (e) only 25% of the time, but enlargement,
while a creative solution method that involved physically
altering the graph, was never applied successfully. Further,
the Enlarge strategy was not frequently employed by the
participants; six responses in part (d), and six responses in
part (e) were coded as Enlarge where only two students
used the Enlarge strategy for both responses. Thus, to get a
better sense of students’ performance, the ways in which
students switched strategies between parts (d) and (e) more
accurately reflects how students employed particular
strategies. Table 3 shows strategy switching by students
from part (d) to (e).
In Table 3, the cells that are shaded gray indicate the
number of responses coded as the same strategy across
both FP tasks. For example, four students who answered
part (d) using an Enlarge strategy (n = 6) also used the
Enlarge strategy to answer part (e). Only one of these six
students ultimately translated to a Linear strategy to answer
part (e). Also, students were more likely to switch strate-
gies if having answered part (d) with either a Linear or
Pragmatic strategy (67%), than for students who answered
Strategy Use - Part (d)
30% 30%
0%
10%
33%
17% 17%
10%
20%22%
11%
0%0%
5%
10%
15%
20%
25%
30%
35%
Spatia
l
Arithm
etic
Enlarg
e
Pragm
atic/
Estim
ation
"I Don
't Kno
w"
Linea
r
Strategy
Per
cen
tag
e o
f R
esp
on
ses
BoundedGesture
UnboundedGesture
Fig. 2 Comparison between of strategy use and boundedness of
gesturing for responses to part (d)
Table 3 Strategy ‘‘switching’’
(or maintenance, in gray fields)
across parts (d) and (e)
All entries represent number of
student responses
Part (e)
Part (d)
No
response
Pragmatic
Spatial
Estimation
Enlarge Arithmetic Linear Total
No
response
2 0 1 0 0 0 3
Pragmatic 0 3 1 0 4 1 9
Spatial
Estimation
1 0 4 1 1 0 7
Enlarge 1 0 0 4 0 1 6
Arithmetic 1 0 0 0 9 1 11
Linear 1 0 0 1 0 1 3
Total 6 3 6 6 14 4 39
Representational disfluency in algebra
123
part (d) with Spatial estimation (43%), Enlarge (33%) or
Arithmetic (18%) strategies.
To further elucidate the construct of spatially grounded
to the graph, we present a case featuring Sophia, a sixth-
grader attending the same school as Paul. Like Paul, Sophia
provided a correct answer to the point interpretation task in
part (c), hesitating only 5-s after the interviewer had posed
the question. The FP tasks in parts (d) and (e) posed more
of a challenge. Unlike her response to part (c), Sophia
exhibited some apprehension and uncertainty when
responding to part (d) (see Appendix B).
Sophia began her response to part (d) by pausing a
notable 11 s after the interviewer stated the question. It is
clear that Sophia realizes that the correct answer is greater
than $23.00, but she is unable to use the graph to—liter-
ally—find the answer. Throughout her verbal report, her
gestures remain within the boundaries of the grid formed
by the x- and y-axes. In Sophia’s case, finding the answer
corresponds to seeing the answer spatially on the graph.
This may explain why she indicates a desire to extend the
y-axis in lines 13–17.
Sophia’s response to part (d), a Graph Enlargement
strategy, shows a spatially grounded use of the graph as
we have defined this construct. There was indication
throughout her responses to the interview questions that
she could read points off the graph with facility, but
there was no indication that she had developed a math-
ematical rule linking the points placed on the graph.
While her verbal response was definitely beyond the
numerical limit of the y-axis, the bounded nature of her
gestures indicated a persistent need to be spatially
grounded to the graph. Further, Sophia’s need to extend
the graph to answer far prediction questions persists in
her response to part (e) in Appendix B. Although she
declines to provide an answer to the fifth question, she
again describes a method of extending the graph that
could help her to find a solution coded as the Enlarge-
ment strategy (see Appendix A).
Unlike Sophia, the majority of students employing an
Enlargement strategy actually performed the enlarge-
ment, usually by drawing extra columns to the right of
the maximum point shown along the x-axis and adding
extra rows beyond the maximum point shown along
the top of the y-axis. Another interesting aspect of the
interview is her use of the word ‘‘it’’ in line 9. One
interpretation of what she might be referring to as ‘‘it’’
would be the spatial pattern between the dots plotted.1
Nevertheless, this statement also indicates that she is at
the mercy of what she sees on the graph, rather than in
control of manipulating the information she extracts from
the graph.
4.3 The interpretatively grounded case
While spatially grounded students may be able to answer
FP tasks using Cartesian graphs to the extent that the
physical affordances of the size of the paper, or perhaps the
program of a graphing technology, will allow, it is neces-
sary for students to be able to generalize to more abstract,
symbolic representations to fully realize the power of
mathematics. As stated in the 2000 National Council for
Teachers of Mathematics Principles and Standards for
School Mathematics: ‘‘One of the powerful aspects of
mathematics is its use of abstraction—the stripping away
by symbolization of some features of a problem that are not
necessary for analysis, allowing the ‘naked symbols’ to be
operated on easily’’ (p. 69). Thus, as students progress in
their understanding of relationships between graphs and
symbolic equations, they will be more interpretatively
grounded to the graph. Students who exhibit this type of
grounding translate the graph into a more mathematically
abstract representation, such as an equation, and connect
the equation to the graph to make sense of the outputs that
result when manipulating data in the equation. In other
words, interpretative grounding capitalizes on the affor-
dances of representational fluency.
The most effective strategies were Linear (which led to
a correct answer 50% of the time) and Arithmetic (which
had a 35% success rate). Both strategies required students
to translate the quantitative information from the graphical
representation to a numeric or algebraic representation,
thereby exhibiting one form of representational fluency.
For part (d), as Fig. 2 shows, students who were coded as
giving unbounded gestures never used the most effective
and most general method, the Linear strategy. These stu-
dents tended to use arithmetic methods (33% of the time),
estimation methods (22%), and the enlargement strategy
(17%). Unbounded codes were also more closely associ-
ated with ‘‘I Don’t Know’’ responses (17%), indicating
that, while these students imagined the pattern continuing
beyond the graph as depicted, they did not have the ana-
lytic skills to determine how to proceed.
We found that part (e) was a more complex task than
part (d). Over half (53%) of the 38 students in our study
correctly solved the part (d) item, while only 26% were
successful with part (e). While boundedness in gesturing
did not seem to play a role in students’ strategy choice for
the simpler FP task [part (d)], a similar analysis of the more
complex FP task (Fig. 3) showed that those with bounded
gestures now used the Linear strategy in lower numbers
1 Another possible interpretation of Sophia’s use of the word ‘‘it’’ in
line 9 is that she is referring to the graph as a whole unit, and views
either the graph or the points plotted as malleable and organic.
K. N. Bieda, M. J. Nathan
123
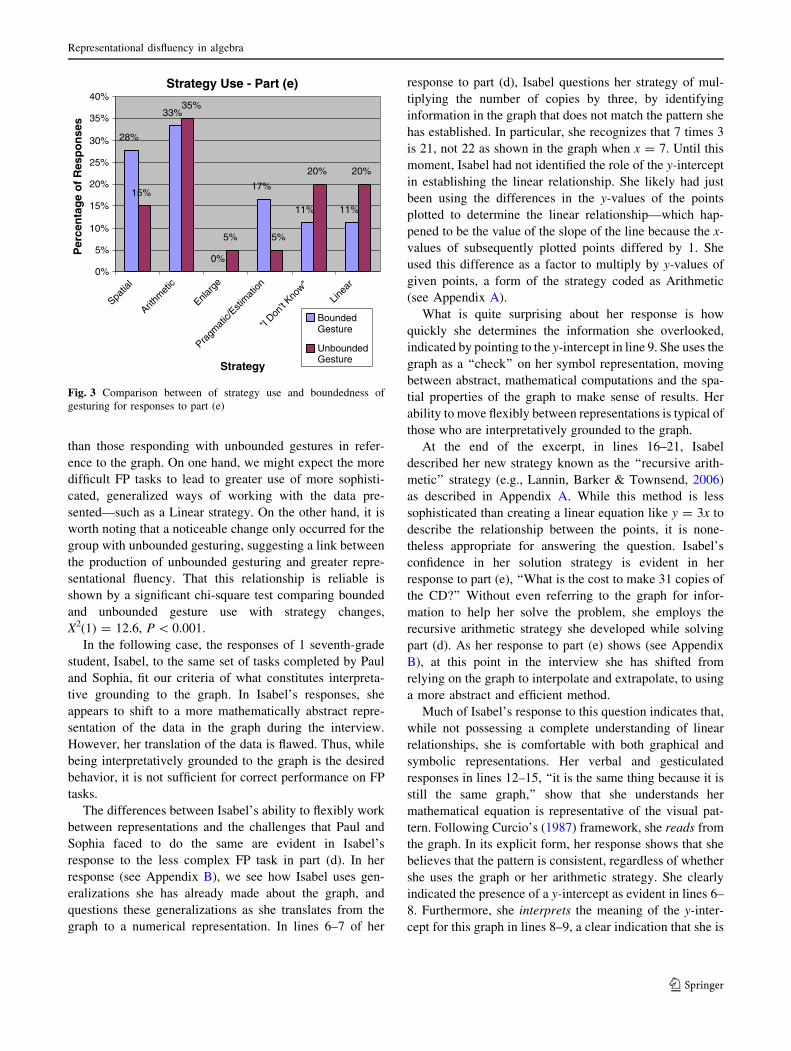
than those responding with unbounded gestures in refer-
ence to the graph. On one hand, we might expect the more
difficult FP tasks to lead to greater use of more sophisti-
cated, generalized ways of working with the data pre-
sented—such as a Linear strategy. On the other hand, it is
worth noting that a noticeable change only occurred for the
group with unbounded gesturing, suggesting a link between
the production of unbounded gesturing and greater repre-
sentational fluency. That this relationship is reliable is
shown by a significant chi-square test comparing bounded
and unbounded gesture use with strategy changes,
X2(1) = 12.6, P \ 0.001.
In the following case, the responses of 1 seventh-grade
student, Isabel, to the same set of tasks completed by Paul
and Sophia, fit our criteria of what constitutes interpreta-
tive grounding to the graph. In Isabel’s responses, she
appears to shift to a more mathematically abstract repre-
sentation of the data in the graph during the interview.
However, her translation of the data is flawed. Thus, while
being interpretatively grounded to the graph is the desired
behavior, it is not sufficient for correct performance on FP
tasks.
The differences between Isabel’s ability to flexibly work
between representations and the challenges that Paul and
Sophia faced to do the same are evident in Isabel’s
response to the less complex FP task in part (d). In her
response (see Appendix B), we see how Isabel uses gen-
eralizations she has already made about the graph, and
questions these generalizations as she translates from the
graph to a numerical representation. In lines 6–7 of her
response to part (d), Isabel questions her strategy of mul-
tiplying the number of copies by three, by identifying
information in the graph that does not match the pattern she
has established. In particular, she recognizes that 7 times 3
is 21, not 22 as shown in the graph when x = 7. Until this
moment, Isabel had not identified the role of the y-intercept
in establishing the linear relationship. She likely had just
been using the differences in the y-values of the points
plotted to determine the linear relationship—which hap-
pened to be the value of the slope of the line because the x-
values of subsequently plotted points differed by 1. She
used this difference as a factor to multiply by y-values of
given points, a form of the strategy coded as Arithmetic
(see Appendix A).
What is quite surprising about her response is how
quickly she determines the information she overlooked,
indicated by pointing to the y-intercept in line 9. She uses the
graph as a ‘‘check’’ on her symbol representation, moving
between abstract, mathematical computations and the spa-
tial properties of the graph to make sense of results. Her
ability to move flexibly between representations is typical of
those who are interpretatively grounded to the graph.
At the end of the excerpt, in lines 16–21, Isabel
described her new strategy known as the ‘‘recursive arith-
metic’’ strategy (e.g., Lannin, Barker & Townsend, 2006)
as described in Appendix A. While this method is less
sophisticated than creating a linear equation like y = 3x to
describe the relationship between the points, it is none-
theless appropriate for answering the question. Isabel’s
confidence in her solution strategy is evident in her
response to part (e), ‘‘What is the cost to make 31 copies of
the CD?’’ Without even referring to the graph for infor-
mation to help her solve the problem, she employs the
recursive arithmetic strategy she developed while solving
part (d). As her response to part (e) shows (see Appendix
B), at this point in the interview she has shifted from
relying on the graph to interpolate and extrapolate, to using
a more abstract and efficient method.
Much of Isabel’s response to this question indicates that,
while not possessing a complete understanding of linear
relationships, she is comfortable with both graphical and
symbolic representations. Her verbal and gesticulated
responses in lines 12–15, ‘‘it is the same thing because it is
still the same graph,’’ show that she understands her
mathematical equation is representative of the visual pat-
tern. Following Curcio’s (1987) framework, she reads from
the graph. In its explicit form, her response shows that she
believes that the pattern is consistent, regardless of whether
she uses the graph or her arithmetic strategy. She clearly
indicated the presence of a y-intercept as evident in lines 6–
8. Furthermore, she interprets the meaning of the y-inter-
cept for this graph in lines 8–9, a clear indication that she is
Strategy Use - Part (e)
28%
33%
0%
17%
11% 11%
15%
5%
20% 20%
5%
35%
0%
5%
10%
15%
20%
25%
30%
35%
40%
Spatia
l
Arithm
etic
Enlarg
e
Pragm
atic/
Estim
ation
"I Don
't Kno
w"
Linea
r
Strategy
Per
cen
tag
e o
f R
esp
on
ses
BoundedGesture
UnboundedGesture
Fig. 3 Comparison between of strategy use and boundedness of
gesturing for responses to part (e)
Representational disfluency in algebra
123
interpretatively grounded to the graph. However, her ver-
balized strategy in lines 3–4 makes it difficult to claim that
she has conceptualized these points as sharing a linear
relationship. She stated that the y-intercept ‘‘messed [her]
up’’ in lines 9–10, instead of recognizing the influence of
the y-intercept on all points plotted. Isabel seems to have an
emerging understanding of linear concepts because she
identifies the source of her confusion to be the y-intercept
before adjusting her calculations by adding 1 to make her
answers fit the data.
5 Conclusions and implications
One of the major goals of algebra instruction is to
develop students’ competencies with and across formal
representations (e.g., Nathan & Kim, 2007; National
Council for Teachers of Mathematics, 2000; RAND,
2003). Our study serves to illustrate the potential of visual
grounding that the Cartesian graph provides, and to shed
light upon how students negotiate the affordances and
constraints of the Cartesian graph when solving problems,
which require extrapolation from the information given in
the graph. Grounding provides learners with a way to map
the unfamiliar to the familiar, and thereby facilitates
meaning making. However, grounding to concrete
instances and interpretations can have a negative effect on
later problem solving (Goldstone & Son, 2005; Kaminski
et al., 2008). Pinker (1990) and Zhang (1997) argued that
one’s reasoning may be overly influenced by a represen-
tation’s visual qualities, rather than the conceptual rela-
tions that the spatial representation is meant to convey. In
the case of the physically grounded student, Paul, we see
that the ability to solve FP tasks is inextricably linked
with what information the Cartesian graph can visually
provide. Hence, the student falls victim to a key con-
straint of the Cartesian graph: a finite ‘‘frame’’ or ‘‘win-
dow’’ for depicting information. For Sophia, the spatially
grounded student, the ‘‘frame’’ of the Cartesian graph is
mutable. The graph’s axes can be extended, and if the
axes and labeling remain consistent, the extended region
can be used to see solutions to formerly FP-like tasks. For
spatially grounded students, the constraint of having a
finite ‘‘frame’’ can be manipulated with the assistance of
technology such as the graphing calculator to the point
where it becomes an affordance of Cartesian graphs,
namely that there is no theoretical limit to the viewing
window. However, the most sophisticated, and efficient,
use of Cartesian graphs is demonstrated by students like
Isabel who are interpretatively grounded to the graph.
Students like Isabel deal with the physical constraints of
the graph by translating the information provided into
representational forms that are not visually bounded, such
as algebraic equations, which can support patterns of
unlimited domains and ranges. For these students, graphs
are used to interpret patterns in the data, not as a primary
means for extrapolating from the data. In this sense,
graphs truly serve in the generalization of numerical
patterns.
The cases we present suggest many implications for
early algebra instruction. First, while grounding is often
the objective of mathematical instruction, there are neg-
ative effects that should not be overlooked. Second, our
data show that gestures along with speech provide rich
insights into how people encode and interpret represen-
tations. Specifically, gesturing limited to the physical
bounds of the graph may indicate that the student views
the graph as inherently limited by its physical form, and
may serve as a signal that instruction should emphasize
the theoretically unbounded nature of the functions por-
trayed in the graphs.
Our study certainly suggests that building competencies
in using Cartesian graphs as a tool for generalizing patterns
requires continual and consistent pedagogical effort. We
speculate that one way to assist students in recognizing the
limitations of Cartesian graphs and developing skill in
graphical pattern generalization is to include more oppor-
tunities for students to encounter far prediction tasks early
and frequently in their math education. While Cartesian
graphs are a useful tool for charting data and manipulating
geometrical forms, they are not the only tool for finding
relationships among data. Mathematical work that focuses
solely on having students graph equations of lines and/or
plot data points without eliciting an equation or generalized
rule to represent the relationship among the data plotted
may misrepresent the value and purpose of creating
Cartesian graphs.
Acknowledgments This research was funded in part by a grant
entitled ‘‘Understanding and Cultivating the Transition from Arith-
metic to Algebraic Reasoning,’’ awarded to the second author by the
Interagency Educational Research Initiative, an alliance of the
National Science Foundation, the US Department of Education’s
Institute of Educational Sciences, and the National Institute of Child
Health and Human Development within the National Institutes of
Health. We extend our appreciation to Andrew Garfield for his
technical knowledge and assistance.
K. N. Bieda, M. J. Nathan
123
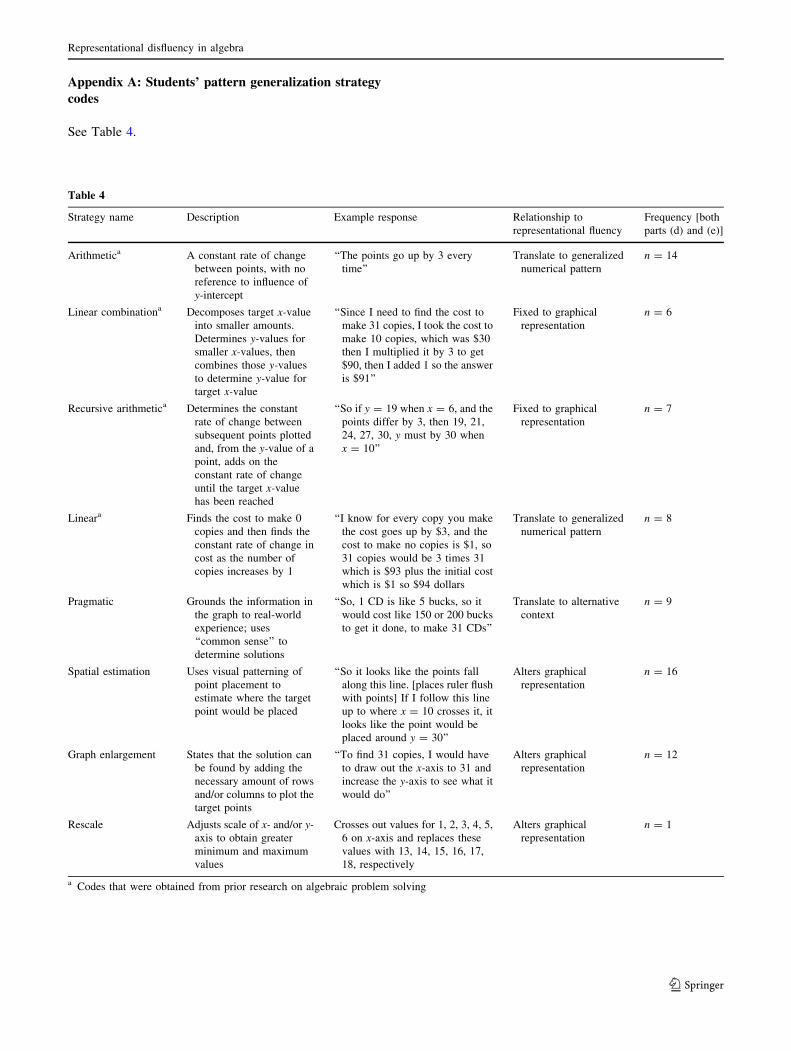
Appendix A: Students’ pattern generalization strategy
codes
See Table 4.
Table 4
Strategy name Description Example response Relationship to
representational fluency
Frequency [both
parts (d) and (e)]
Arithmetica A constant rate of change
between points, with no
reference to influence of
y-intercept
‘‘The points go up by 3 every
time’’
Translate to generalized
numerical pattern
n = 14
Linear combinationa Decomposes target x-value
into smaller amounts.
Determines y-values for
smaller x-values, then
combines those y-values
to determine y-value for
target x-value
‘‘Since I need to find the cost to
make 31 copies, I took the cost to
make 10 copies, which was $30
then I multiplied it by 3 to get
$90, then I added 1 so the answer
is $91’’
Fixed to graphical
representation
n = 6
Recursive arithmetica Determines the constant
rate of change between
subsequent points plotted
and, from the y-value of a
point, adds on the
constant rate of change
until the target x-value
has been reached
‘‘So if y = 19 when x = 6, and the
points differ by 3, then 19, 21,
24, 27, 30, y must by 30 when
x = 10’’
Fixed to graphical
representation
n = 7
Lineara Finds the cost to make 0
copies and then finds the
constant rate of change in
cost as the number of
copies increases by 1
‘‘I know for every copy you make
the cost goes up by $3, and the
cost to make no copies is $1, so
31 copies would be 3 times 31
which is $93 plus the initial cost
which is $1 so $94 dollars
Translate to generalized
numerical pattern
n = 8
Pragmatic Grounds the information in
the graph to real-world
experience; uses
‘‘common sense’’ to
determine solutions
‘‘So, 1 CD is like 5 bucks, so it
would cost like 150 or 200 bucks
to get it done, to make 31 CDs’’
Translate to alternative
context
n = 9
Spatial estimation Uses visual patterning of
point placement to
estimate where the target
point would be placed
‘‘So it looks like the points fall
along this line. [places ruler flush
with points] If I follow this line
up to where x = 10 crosses it, it
looks like the point would be
placed around y = 30’’
Alters graphical
representation
n = 16
Graph enlargement States that the solution can
be found by adding the
necessary amount of rows
and/or columns to plot the
target points
‘‘To find 31 copies, I would have
to draw out the x-axis to 31 and
increase the y-axis to see what it
would do’’
Alters graphical
representation
n = 12
Rescale Adjusts scale of x- and/or y-axis to obtain greater
minimum and maximum
values
Crosses out values for 1, 2, 3, 4, 5,
6 on x-axis and replaces these
values with 13, 14, 15, 16, 17,
18, respectively
Alters graphical
representation
n = 1
a Codes that were obtained from prior research on algebraic problem solving
Representational disfluency in algebra
123
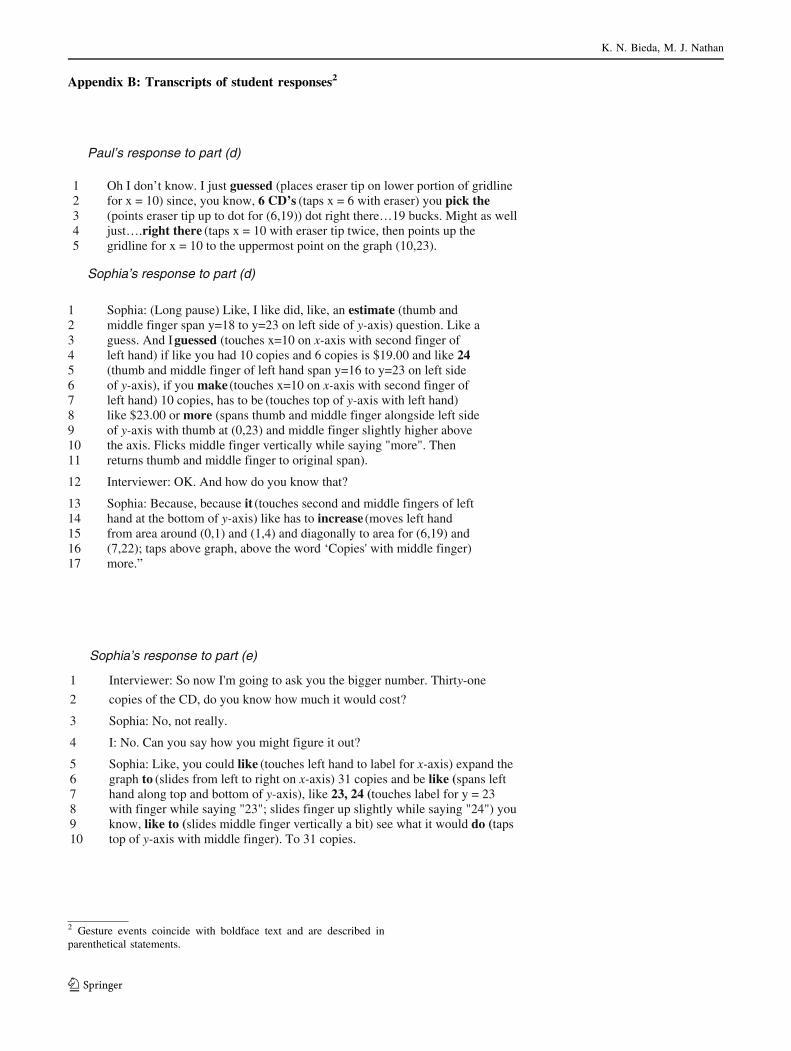
Appendix B: Transcripts of student responses2
Paul’s response to part (d)
1 Oh I don’t know. I just guessed (places eraser tip on lo wer portion of gridline 2 for x = 10) since, you know, 6 CD’s (taps x = 6 with eraser) you pick the 3 (points eraser tip up to dot for (6,19) ) dot right there…19 buc ks. Might as well4 just…. right there (taps x = 10 with eraser tip twice, then points up the 5 gridline for x = 10 to the upperm ost point on the graph (10,23).
Sophia’s response to part (d)
1 Sophia: (Long pause) Like, I like did, like, an estimate (thumb and 2 middle finger span y=18 to y=23 on left side of y- axis ) question. Like a 3 guess. And I guessed (touches x=10 on x- axis with second finger of 4 left hand) if like you had 10 copi es and 6 copies is $19.00 and like 24 5 (thumb and middle finger of left hand span y=16 to y=23 on left side 6 of y- axis), if you make (touches x=10 on x- axis with second finger of 7 left hand) 10 copies, has to be (touches top of y- axis with left hand) 8 like $23.00 or more (spans thumb and middle finger alongside left side 9 of y- axis with thumb at (0,23) and mi ddle finger slightly higher above 10 the axis. Flicks middle finger vertically while saying "more". Then 11 returns thumb and middle finger to original span).
12 Interviewer: OK. And how do you know that?
13 Sophia: Because, because it (touches second and middl e fingers of left 14 hand at the bottom of y- axis) like has to increase (moves left hand 15 from area around (0,1) and (1,4) and diagonally to area for (6,19) and 16 (7,22); taps above graph, above the wo rd ‘Copies' with middle finger) 17 more.”
Sophia’s response to part (e)
1 Interviewer: So now I'm going to ask you the bigger number. Thirt y- one
2 copies of the CD, do you know how much it would cost?
3 Sophia: No, not really.
4 I: No. Can you say how you might figure it out?
5 Sophia: Like, you could like (touches left hand to label for x- axis) expand the 6 graph to (slides from left to right on x- axis) 31 copies and be like ( spans left 7 hand along top and bottom of y- axis), like 23, 24 ( touches label for y = 23 8 with finger while saying " 23"; slides finger up slightly while saying "24") you 9 know, like to ( slides middle finger vertically a bit) see what it would do ( taps 10 top of y- axis with middle finger). To 31 copies.
2 Gesture events coincide with boldface text and are described in
parenthetical statements.
K. N. Bieda, M. J. Nathan
123
References
Alibali, M. W., & Goldin-Meadow, S. (1993). Gesture-speech
mismatch and mechanisms of learning: What the hands reveal
about a child’s state of mind. Cognitive Psychology, 25, 468–
523.
Beichner, R. (1994). Testing student interpretation of kinematics
graphs. American Journal of Physics, 62, 750–762.
Church, R. B., & Goldin-Meadow, S. (1986). The mismatch between
gesture and speech as an index of transitional knowledge.
Cognition, 23(1), 43–71.
Clement, J. (1985). Misconceptions in graphing. Proceedings of theninth conference of the International Group for the Psychologyof Mathematics Education, 1, 369–375.
Crowder, E. M. (1996). Gestures at work in sense-making science
talk. The Journal of the Learning Sciences, 5(3), 173–208.
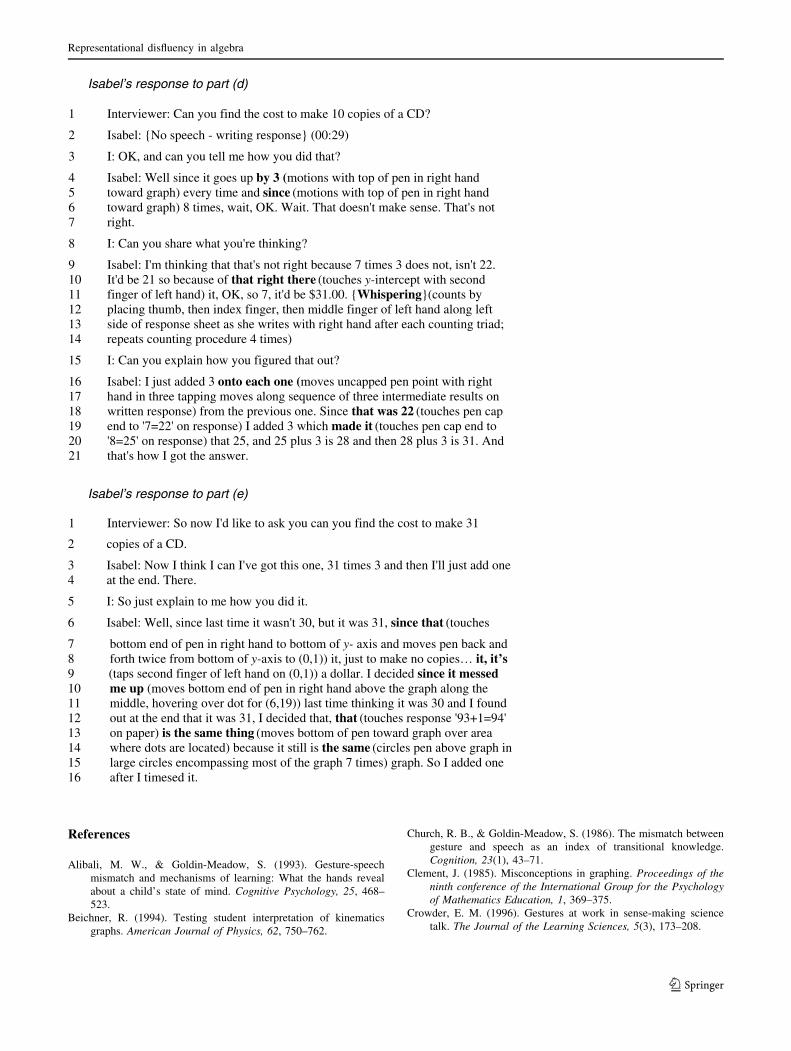
Isabel’s response to part (d)
1 Interviewer: Can you find the cost to make 10 copies of a CD?
2 Isabel: {No speech - writing response} (00:29)
3 I: OK, and can you tell me how you did that?
4 Isabel: Well since it goes up by 3 (motions with top of pen in right hand5 toward graph) every time and since (motions with top of pen in right hand6 toward graph) 8 times, wait, OK. Wait. That doesn't make sense. That's not 7 right.
8 I: Can you share what you're thinking?
9 Isabel: I'm thinking that that's not right because 7 times 3 does not, isn't 22. 10 It'd be 21 so because of that right there (touches y-intercept with second 11 finger of left hand) it, OK, so 7, it'd be $31.00. {Whispering}(counts by12 placing thumb, then index finger, then middle finger of left hand along left 13 side of response sheet as she writes with right hand after each counting triad; 14 repeats counting procedure 4 times)
15 I: Can you explain how you figured that out?
16 Isabel: I just added 3 onto each one (moves uncapped pen point with right17 hand in three tapping moves along sequence of three intermediate results on 18 written response) from the previous one. Since that was 22 (touches pen cap 19 end to '7=22' on response) I added 3 which made it (touches pen cap end to20 '8=25' on response) that 25, and 25 plus 3 is 28 and then 28 plus 3 is 31. And21 that's how I got the answer.
Isabel’s response to part (e)
1 Interviewer: So now I'd like to ask you can you find the cost to make 31
2 copies of a CD.
3 Isabel: Now I think I can I've got this one, 31 times 3 and then I'll just add one 4 at the end. There.
5 I: So just explain to me how you did it.
6 Isabel: Well, since last time it wasn't 30, but it was 31, since that (touches
7 bottom end of pen in right hand to bottom of y- axis and moves pen back and 8 forth twice from bottom of y-axis to (0,1)) it, just to make no copies… it, it’s9 (taps second finger of left hand on (0,1)) a dollar. I decided since it messed10 me up (moves bottom end of pen in right hand above the graph along the 11 middle, hovering over dot for (6,19)) last time thinking it was 30 and I found 12 out at the end that it was 31, I decided that, that (touches response '93+1=94' 13 on paper) is the same thing (moves bottom of pen toward graph over area 14 where dots are located) because it still is the same (circles pen above graph in15 large circles encompassing most of the graph 7 times) graph. So I added one 16 after I timesed it.
Representational disfluency in algebra
123
Curcio, F. R. (1987). Comprehension of mathematical relationships
expressed in graphs. Journal for Research in MathematicsEducation, 18(5), 382–393.
DeBok, D., Verschaffela, L., Janssensc, D., Van Doorena, W., &
Claesa, K. (2003). Do realistic contexts and graphical represen-
tations always have a beneficial impact on students’ perfor-
mance? Negative evidence from a study on modelling non-linear
geometry problems. Learning and instruction, 13(4), 441–463.
Friel, S. N., Curcio, F. R., & Bright, G. W. (2001). Making sense of
graphs: Critical factors influencing comprehension and instruc-
tional implications. Journal for Research in MathematicsEducation, 32(2), 124–158.
Gerofsky, S. (2007). Traces of the body: Gestures and graphing in
school mathematics. In L. Edwards, S. Gerofsky, & T. Noble
(Eds.), Panel presentation, Gestures for thinking in mathematicsand science. International Society for Gesture Studies Confer-ence, Northwestern University, Evanston, IL.
Glaser, B. G. (1978). Theoretical sensitivity: Advances in themethodology of grounded theory. Mill Valley: Sociology Press.
Glenberg, A. M., De Vega, M., & Graesser, A. C. (2008). Framing the
debate. In M. DeVega, A. M. Glenberg, & A. C. Graesser (Eds.),
Symbols, Embodiment and Meaning (pp. 1–10). Cambridge:
Oxford University Press.
Glenberg, A. M., Jaworski, B., Rischal, M, & Levin, J. R. (2009).
What brains are for: Action, meaning, and reading comprehen-
sion. In D. McNamara (Ed.), Reading Comprehension Strate-gies: Theories, Interventions, and Technologies. Mahwah:
Lawrence Erlbaum Publishers. (in press)
Glenberg, A. M., & Robertson, D. A. (1999). Indexical understanding
of instructions. Discourse Processes, 28, 1–26.
Goldin-Meadow, S. (2003). Hearing gesture: How our hands help usthink. Cambridge: Harvard University Press.
Goldstone, R. L., & Son, J. Y. (2005). The transfer of scientific
principles using concrete and idealized simulations. Journal ofthe Learning Sciences, 14, 69–110.
Goodwin, C. (1994). Professional vision. American Anthropologist,96(3), 606–633.
Griffin, S., Case, R., & Siegler, R. S. (1994). Rightstart: Providing the
central conceptual prerequisites for first formal learning of
arithmetic to students at risk for school failure. In K. McGilly
(Ed.), Classroom lessons: Integrating cognitive theory andclassroom practice (pp. 25–49). Cambridge: MIT Press/Bradford
Books.
Harnad, S. (1990). The symbol grounding problem. Physica D, 42,
335–346.
Kaminski, J. A., Sloutsky, V. M., & Heckler, A. F. (2008). The
advantage of abstract examples in learning math. Science, 320,
454–455.
Lakoff, G., & Nunez, R. (2000). Where mathematics comes from:How the Embodied Mind Brings Mathematics into Being. New
York, NY: Basic Books.
Lannon, J. K., Barker, D. D., & Townsend, B. E. (2006). Recursive
and explicit rules: how can we build student algebraic under-
standing? Journal of Mathematical Behavior, 25, 299–317.
Lappan, G., Fey, J. T., Fitzgerald, W. M., Friel, S. N., & Phillips, E.
D. (1998). Connected Mathematics Project. Upper Saddle River:
Prentice Hall.
Leinhardt, G., Zaslavsky, O., & Stein, M. K. (1990). Functions,
graphs, and graphing: Tasks, learning, and teaching. Review ofEducational Research, 60(1), 1–64.
McNeill, D. (1992). Hand and Mind: What Gestures Reveal aboutThought. Chicago: University of Chicago Press.
Nathan, M. J. (2008). An embodied cognition perspective on symbols,
gesture and grounding instruction. In M. DeVega, A. M.
Glenberg, & A. C. Graesser (Eds.), Symbols, embodiment andmeaning: a debate (pp. 375–396). Cambridge: Oxford Univer-
sity Press.
Nathan, M. J., & Kim, S. (2007). Pattern generalization with graphs
and words: A cross-sectional and longitudinal analysis of middle
school students’ representational fluency. Mathematical Think-ing and Learning, 9(3), 193–219.
Nathan, M. J., Kintsch, W., & Young, E. (1992). A theory of algebra
word problem comprehension and its implications for the design
of computer learning environments. Cognition and Instruction,9(4), 329–389.
National Council for Teachers of Mathematics. (2000). Principles andstandards for school mathematics. Reston, VA: Author.
Pape, S., & Tschoshanov, M. A. (2001). The role of representation(s)
in developing mathematical understanding. Theory Into Practice,40(2), 118–127.
Pinker, S. (1990). A theory of graph comprehension. In R.
Freedle (Ed.), Artificial Intelligence and the future of testing(pp. 73–126). Hillsdale: Erlbaum.
Radford, L. (2009). ‘‘No! He starts walking backwards!’’: interpret-
ing motion graphs and the question of space, place and distance.
ZDM. doi:10.1007/s11858-009-0173-9.
RAND Mathematics Study Panel. (2003). Mathematics proficiencyfor all students: Toward a strategic research and developmentprogram in mathematics education. Santa Monica: RAND.
Roth, W.-M. (2001). Gestures: Their role in teaching and learning.
Review of Educational Research, 71, 365–392.
Roth, W-M, G. Bowen, M., & McGinn, M. K. (1999). Differences in
graph-related practices between high school biology textbooks
and scientific ecology journals. Journal of Research in ScienceTeaching, 36(9), 977–1019.
Saxe, G. B., Taylor, E. V., McIntosh, C., & Gearhart, M. (2005).
Representing fractions with standard notation: a developmental
analysis. Journal for Research in Mathematics Education, 36(2),
137–157.
Smith, J. P., di Sessa, A. A., & Rochelle, J. (1993). Misconceptions
reconceived: a constructivist analysis of knowledge in transition.
Journal of the Learning Sciences, 3(2), 115–163.
Tversky, B. (2001). Spatial schemas in depictions. In M. Gattis (Ed.),
Spatial schemas and abstract thought (pp. 79–112). Boston: MIT
Press.
Woods, D., & Fassnacht, C. (2007). Transana version 2.2. [Computer
software]. Available from http://www.transana.org.
Zhang, J. (1997). The nature of external representations in problem
solving. Cognitive Science, 21(2), 179–217.
Zhang, J., & Norman, D. A. (1994). Representations in distributed
cognitive tasks. Cognitive Science, 18(1), 87–122.
K. N. Bieda, M. J. Nathan
123