Embed Size (px)
Citation preview

REPRESENTATIVIDAD DE LOS TIPOS DE VEGETACIÓN EN LAS ÁREAS NATURALES PROTEGIDAS DE DURANGO
REPRESENTATION OF THE VEGETATION TYPES IN THE NATURAL
PROTECTED AREAS OF DURANGO
Laura Rentería Arrieta 1, César Cantú Ayala 1, Eduardo Estrada Castillón 1, José Marmolejo Moncivais1 y Fernando González Saldívar1
RESUMEN
Se hizo una evaluación en el 2009 de la cobertura de los tipos de vegetación existentes en las Áreas Naturales Protegidas (ANP) en Durango y los hexágonos prioritarios generados por la CONABIO para identificar las prioridades de conservación. Se utilizó el programa de anális is de vacíos y omisiones de conservación (gap) de los Estados Unidos de Norteamérica y un análisis de componentes principales. En el estado se registran 38 tipos de vegetación natural con una extensión de 9’629,553 ha, que representan 78 % de la superficie; 19 fitocenosis son vacíos de conservación que se distribuyen principalmente en la región central de la entidad y 17 corresponden a omisiones de conservación. La vegetación halófila y el pastizal halófilo en condición primaria constituyen proporciones superiores a 12 % (media nacional protegida); sin embargo, sólo equivalen a 2.2 % del territorio, con una extensión de 208,341 ha y se localizan en la Reserva de la Biosfera Mapimí. Con la incorporación de los hexágonos de importancia extrema, cuya extensión es de 141,335 ha, el número de asociaciones vegetales consideradas vacíos de conservación disminuyen a 15. De igual manera, con la suma de los hexágonos prioritarios, que abarcan 2’952,521 ha se cubren 15 de las 19 fitocenosis. No obstante los resultados obtenidos en el presente estudio para determinar las prioridades de conservación del estado de Durango, es necesario realizar trabajos específicos sobre los patrones de distribución de las especies, de las endémicas y en riesgo de extinción, en particular.
Palabras clave: Análisis Gap, Áreas Naturales Protegidas, biodiversidad, conservación, Durango, fitodiversidad.
ABSTRACT
Effectiveness of current protected areas and conservation priority hexagons generated by CONABIO to represent vegetation types in the state of Durango was evaluated in the 2009, as a tool to identify conservation priorities. In the state of Durango exist 38 natural vegetation types covering 9’629,553 ha which represent 78 % of territory, 19 of them are conservation gaps, which are located mainly in the northeast central region of the state, 17 vegetation types are under-represented in nature reserves and two types: halophilous vegetation and halophilous grassland in primary condition are represented in nature reserves in higher proportions than 12 % (national protected average); however, they represent only 2.2 % of territory, covering 208,341 ha and are located in Mapimí Biosphere Reserve. The inclusion of extreme importance conservation hexagons of Durango whose surface represent 141,335 ha, the 19 vegetation types which are conservation gaps, would be reduced to 15. Moreover, all priority hexagons of covering 2’952,521 ha include 15 of 19 vegetation types. Although the results obtained to determine conservation priorities of the state of Durango, it is necessary to develop specific studies on the distribution patterns of species, especially endemic and endangered.
Key words: Gap analysis, protected areas, biodiversity, conservation, Durango, plant diversity.
Fecha de recepción: 4 de marzo de 2010.Fecha de aceptación: 25 de enero de 2011.
1 Facultad de Ciencias Forestales, Universidad Autónoma de Nuevo León. Correo-e: [email protected]

Rev. Mex. Cien. For. Vol. 2 Núm. 3
70
INTRODUCTION
Biodiversity is a concept that includes the diversity of each of the structural, taxonomic and functional levels of biota, which has traditionally been interpreted in three aspects of the biological hierarchy: genes, species and ecosystems (Margules and Sarkar, 2009). Austin and Margules (1986) used for the first time the surrogate term to denote some of its elements (taxa, types of vegetation, types of ecosystems, landscapes, etc.) that initially can be quantified and assessed in the field, in order to make this concept operational.
The heterogeneity of the physical environment of Mexico has favored the development of a huge biological richness made up by a great variety of ecosystems and types of vegetation (Espinosa and Ocegueda, 2008).
From the present environmental decay, as a consequence of the incorrect use of natural resources, conservation has taken a major place among the different nations of the world, in such a way that support the establishment of natural protected areas (NPA), which are acknowledged as one of its most important tools (Cantú et al., 2004).
In the world scene there are about 100,753 NPA over 18´382,225 km2, which make up 1.2% of the continental area of the planet. In a similar way, there are 4,254 marine NPA with 1´893,609 km2, that is, 0.5 % of all the oceans (Chape et al., 2005). There are 171 NPA in Mexico over 23´877,976 ha, which s ta n d s fo r 12 % of t h e n a t i o n a l t e r r i to r y ( CO N ANP , 2 0 0 9 ) .
However, the acknowledgement of the NPAs for their contribution to the conservation of species and environments has brought a dilemma in their planning, which is focused on the estimation of which per cent of a region or country is necessary to provide a protection that guarantees the viability of taxa in the long term (Brooks et al., 2004). During the 7th Conference of the Parties (COP 7) of the Convention of Biological Diversity (CBD), to which Mexico belongs, was emitted a resolution to establish the work programs in which the nations determine the effectiveness of their protection areas systems and perform void analysis and conservation omissions, named Gap Analysis. Also, strong technical criteria that serve as guides to increase the area with protection acts must be used (Dudley et al., 2005), as well as to carry on an assessment of the abilities to manage the NPAs and the financial resources for conservation (Koleff et al., 2009).
The background for this commitment is dated in 1982 with the 3rd World National Parks Congress (Bali, Indonesia) in which it was discussed that the NPAs should cover at least 10 per cent of each biome for 2000 (Miller, 1984) and was confirmed in 2005 (Dudley and Parish, 2006). However, in the
INTRODUCCIÓN
La biodiversidad es un concepto que incluye la diversidad en cada uno de los niveles estructurales, taxonómicos y funcionales de la biota, por lo que tradicionalmente es interpretada en tres aspectos de la jerarquía biológica: genes, especies y ecosistemas (Margules y Sarkar, 2009). Austin y Margules (1986) utilizaron por primera vez el término subrogado para denotar algunos de sus elementos (taxa, tipos de vegetación, tipos de ecosistemas, paisajes, etc.) que pueden, en principio, ser cuantificados y evaluados en el campo, a fin de hacer operativo dicho concepto.
La heterogeneidad del medio físico de México ha favorecido el desarrollo de una enorme riqueza biológica integrada en una gran variedad de ecosistemas y t ipos de vegetación (Espinosa y Ocegueda, 2008).
A causa del deterioro ambiental actual, como consecuencia del uso inadecuado de los recursos naturales, la conservación ha tomado un lugar primordial entre las distintas naciones del mundo, de tal manera se auspicia el establecimiento de áreas naturales protegidas (ANP), las cuales son reconocidas como uno de sus instrumentos más importantes (Cantú et al., 2004).
En el ámbito mundial existen aproximadamente 100,753 ANP que cubren una extensión de 18´382,225 km2, equivalentes a 12.2% de la porción continental del planeta. De igual forma, hay 4,254 ANP marinas, con una superficie de 1´893,609 km2, es decir, 0.5% de todos los océanos (Chape et al., 2005). En México existen 171 ANP, para un total de 23´877,976 ha, 12% del territorio nacional (CONANP, 2009).
No obstante, el reconocimiento de las ANP por su contribución en la conservación de especies y ambientes presenta un dilema en su planificación el cual se centra en estimar qué porcentaje de una región o país se requiere para brindar una protección que asegure la viabilidad de los taxa en el largo plazo (Brooks et al., 2004). Durante la Séptima Conferencia de las Partes (COP 7) del Convenio sobre la Diversidad Biológica (CDB), del que México forma parte, se emitió una resolución para establecer programas de trabajo enfocados a que las naciones determinen la efectividad de sus sistemas de áreas protegidas y realicen análisis de vacíos y omisiones de conservación, denominados Gap analysis . Además, se t ienen que emplear criterios técnicos sólidos que sirvan de guía para incrementar el área con decretos de protección (Dudley et al., 2005), así como llevar a cabo una evaluación de las capacidades para el manejo de las ANP y de los recursos financieros dedicados a la conservación (Koleff et al., 2009).

Rentería et al.,
71
El antecedente de este compromiso data de 1982 del III Congreso Mundial de Parques Nacionales (Bali, Indonesia), en el cual se propuso que las ANP deberían cubrir al menos 10 % de cada bioma para el año 2000 (Miller, 1984), y que se ratificó en el año 2005 (Dudley y Parish, 2006). Sin embargo, en los pocos estudios disponibles que definen el área requerida para sostener los procesos ecológicos o mantener poblaciones viables de especies nativas se establece con frecuencia una extensión de 2 a 6 veces mayor al 10 % de la superficie de cada bioma (Odum, 1970; Noss, 1993; Cox et al., 1994; Soulé y Sanjayan, 1998).
Los análisis de vacíos y omisiones de conservación (Gap analysis) (Jennings, 2000) son una herramienta para identificar vacíos de conservación o áreas de baja representación en el actual sistema de reservas, mediante la comparación de la distribución de las áreas protegidas con la de la biodiversidad.
Pe s e a l a u m e n to e n n ú m e ro d e l a s ANP d e l p a í s , persisten importantes vacíos y omisiones de conservación, cuyo examen es el primer paso para identificar las necesidades de protección de la riqueza biológica de una región determinada (Cantú et al . , 2007). Los análisis de los sistemas de reservas a escala mundial, regional o nacional evidencian una tendencia similar a la antes indicada (Rodrigues et al., 2004b).
El método de componentes principales se ha utilizado para identificar las necesidades de conservación de la vegetación (Pla, 1986). Con base en técnicas de análisis multivariado de las características ecológicas del territorio en Colombia, Van Wyngaarden y Fandiño-Lozano (2005) registraron 337 ecosistemas y 63 unidades corológicas. Así mismo, en Ecuador, Belice y Bolivia se han hecho análisis de vacíos y omisiones en el ámbito ecorregional (Arango et al., 2003; López y Zambrana-Torrelio, 2006; Terán et al., 2006).
El estado de Durango tiene una superficie de 123,451 km2, que representa 6.3 % del territorio nacional. Las características orográficas, tipos climáticos e influencia biogeográfica determinan la presencia de una diversidad de ecosistemas, en las que casi todos los tipos de vegetación de México están representados. De acuerdo a la clasificación desarrollada por González et al. (2007), la cual es una adaptación del trabajo de Rzedowski (1978) que combina criterios fisonómicos, ecológicos y florísticos. Los autores reconocen 14 tipos de vegetación: pastizal, matorral (de clima semiseco templado), chaparral, bosque bajo abierto, bosque de coníferas, bosque mixto (pino-encino), bosque de encino, bosque mesófilo de montaña, bosque tropical caducifolio y subcaducifolio, bosque espinoso, vegetación halófila, gipsófila, xerófila, acuática y subacuática. El único tipo de vegetación no representado es el bosque tropical perennifolio (Leopold, 1950; Miranda y Hernández, 1963; Rzedowski, 1978; COTECOCA-SARH, 1979; González-Elizondo et al., 2007).
few available years that define the demanded area to support the ecological processes or keep viable populations of native species, it is frequently established an extension of 2 to 6 more times than the 10 per cent of the surface of each biome (Odum, 1970; Noss, 1993; Cox et al., 1994; Soulé and Sanjayan, 1998).
Gap analysis (Jennings, 2000) is a tool to determine the conservation voids or areas with low representation in the present reserves system, through the comparison of the distribution of protected areas with biodiversity.
In spite of the increment of the number of NPAs of the country, important voids and conservation omissions prevail, whose assessment is the first step to identify the needs to protect the biological richness of a particular region (Cantú et al., 2007). The reserves system analysis at a world, regional or national scales shows a similar tendency to the formerly described (Rodrigues et al., 2004b).
The Principal Component Analysis has been used to identify the needs for vegetation conservation (Pla, 1986). Based upon the multivariate analysis techniques of the ecological land characteristics of Colombia, Van Wyngaarden and Fandiño-Lozano (2005) recorded 337 ecosystems and 63 corological units. Also, in Ecuador, Belize and Bolivia gap analysis have been made in an eco-regional scope (Arango et al . , 2003; López and Zambrana-Torrelio, 2006; Terán et al . , 2006) .
Durango State has 123,451 km2, which makes up for 6.3 per cent of the national territory. The orographic characteristics, climate types and bio-geographic influence determine the presence of a diversity of ecosystems, en which almost all of the vegetation types of Mexico are included. According to the classification by González et al. (2007), which is an adaptation of Rzedowski’s work (1978) that is a combination of physiognomic, ecologic and floristic criteria, the authors identified 14 vegetation types: grassland, shrubs (of mild semi-dry weather), chaparral, open-low forest, ever-green forest, mixed forest (oak-pine), oak forest, cloud forest, deciduous and sub-deciduous tropical forest, thorny forest, halophilous, gipsophilous, xerophytic, aquatic and sub-aquatic vegetation. The only absent vegetation type is the tropical rain forest (Leopold, 1950; Miranda and Hernández, 1963; Rzedowski, 1978; COTECOCA-SARH, 1979; González-Elizondo et al . , 2007).
At present, there are six official NPAs in Durango State, which include 353,229 ha and make up for 2.9 per cent of the territory (Figure 1); three are of the federal order and the other three belong to the state. Two have a management program (CONANP, 2006; Anónimo, 2003), with the surveillance of an expert forester; however, as the management plans have a five-year term, only that of Mapimí is present.

Rev. Mex. Cien. For. Vol. 2 Núm. 3
72
En Durango existen, actualmente, seis ANP oficiales que abarcan 353,229 ha y corresponden a 2.9 % del territorio (Figura 1); tres son de jurisdicción federal y tres estatal. Del total de ANP dos cuentan con un programa de manejo (CONANP, 2006; Biodesert, et al., 2003), bajo la supervisión de un experto forestal; sin embargo, como los planes de manejo tienen una vigencia de cinco años, sólo el de Mapimí está vigente.
El objetivo del presente estudio fue determinar el grado de representatividad de los diferentes tipos de vegetación dentro de los límites de las ANP y de los hexágonos prioritarios para la conservación propuestos por la CONABIO para el estado de Durango.
MATERIALES Y MÉTODOS
Para los propósitos de este trabajo se consideró que los tipos de vegetación ausentes en las ANP eran vacíos de conservación, mientras que los existentes en ANP por debajo del 12 % (media nacional protegida en el año 2009, fecha de realización de este estudio) eran omisiones de conservación (Cantú et al., 2003; Cantú, 2007; Koleff et al., 2009).
La identificación de los tipos de vegetación bien conservados que son omisiones y vacíos en el estado de Durango, se realizó con la metodología desarrollada por el programa de análisis de vacíos y omisiones de conservación (Gap) de los Estados Unidos de América (EE.UU), que consiste en
Figura 1. Áreas Naturales Protegidas del estado de Durango.Figure 1. Natural Protected Areas of Durango State.
The aim of this study was to determine the degree of representation of the different vegetation types within the limits of the NPAs and the priority hexagons for their conservation proposed by CONABIO for Durango State.
MATERIALS AND METHODS
For the aims of this work, the absent vegetation types in the NPAs were conservation voids, while the present ones under 12 per cent (natural protected average in 2009, year in which this study was made) were conservation omissions (Cantú et al., 2003; Cantú, 2007; Koleff et al., 2009).
The identification of the well-preserved vegetation types that are omissions and voids in Durango State was made with the aid of the methodology of void and omissions analysis (Gap) of the United States of America (USA), that consists in the measurement of the levels of the representation of biodiversity in conservation areas (species, ecosystems, eco-regions, types of vegetation, etc.). This methodology includes the following stages: a) cartography of the biodiversity elements that are expected to be conserved; b) NPAs cartography; c) identification of the degrees of representation of biodiversity of NPAs; d) identification of the neighboring areas for conservation and study of the different options (Scott et al . , 1993). The first three stages were analyzed here.

Rentería et al.,
73
identificar los niveles de representatividad de la biodiversidad (especies, ecosistemas, ecorregiones, tipos de vegetación, etc.) en áreas para la conservación. La metodología Gap comprende las siguientes etapas: a) cartografía de los elementos de biodiversidad que se pretenden conservar; b) cartografía de las ANP; c) identificación de los grados de representatividad de la biodiversidad en las ANP; d) identificación de las áreas aledañas para conservación y estudio de las diferentes alternativas (Scott et al., 1993). Aquí se abordaron las tres primeras etapas.
La información cartográfica digital se obtuvo de la Comisión Nacional de Uso y Conocimiento de la Biodiversidad (CONABIO), Comisión Nacional de Áreas Naturales Protegidas (CONANP) y del Instituto Nacional de Eco log ía , Secretar ía de Medio Ambiente y Recursos Naturales (INE, SEMARNAT). Para el análisis de las cubiertas digitales se usaron los programas ArcGisTM versión 9.1 y ArcViewTM versión 3.2. La variable vegetación y uso de l sue lo correspondió a la Ser ie III de INEGI (2005) , así como a un mapa digital de hexágonos de 256 km2, cada uno de ellos generado en la CONABIO, mediante el programa de optimización Marxan para identificar los sitios prioritarios de conservación a nivel nacional (CONABIO-CONANP-TNC-PRONATURA, 2007).
La clasificación de los vacíos y omisiones, con base en los hexágonos prioritarios, se hizo con el programa de estadística multivariada (MVSP 3.1, por sus siglas en inglés), a partir del método multivariado de componentes principales (ACP) para determinar la representatividad de los tipos de vegetación en las ANP. Dicho análisis es un método de ordenación que muestra la correlación entre las variables seleccionadas, en este caso, los porcentajes de cobertura de los tipos de vegetación, ANP y hexágonos más ANP. Los componentes principales son una técnica matemática que no requiere un modelo estadístico para explicar la estructura probabilística de los errores (Pla, 1986).
El método selecciona primero el factor que integre la mayor
proporción posible de la variabilidad original, el segundo factor debe conjuntar la máxima variabilidad posible no considerada por el primero, y así sucesivamente. Del total de factores se elegirán aquellos que contribuyan el porcentaje de variabilidad que se considere suficiente. A éstos se les denominará componentes principales. Una vez seleccionados, se incluyen en una matriz (Terrádez-Gurrea, s.f).
RESULTADOS
La cubierta digital de uso del suelo y vegetación Serie III (INEGI, 2005) para Durango presenta 41 categorías, de los cuales 38 son tipos de vegetación natural con una extensión de 9’629,553 ha, es decir 78 % del territorio estatal, el resto corresponde a usos antrópicos o vegetación inducida. En las
The digital cartographic information came from the National Commission for the Use and Knowledge of Biodiversity (CONABIO), the Natural Protected Areas National Commission (CONANP) and from the National Ecology Institute (INE) and the Ministry of Natural Resources and the Environment (SEMARNAT). For the analysis of the data layers the ArcGisTM 9.1 version and ArcViewTM 3.2.version programs. The vegetation and land use variables belonged to the III Series of INEGI (2005), as well as a digital map of hexagons of 256 km2, each of them produced by CONABIO, through the optimization Marxan program to find the priority conservation sites at a national level (CONABIO-CONANP-TNC-PRONATURA, 2007).
The classification of voids and omissions, based upon the priority hexagons, was made with multivariate statistics program (MVSP 3.1), through the multivariate methods of principal components analysis (PCA) to determine the representation of the types of vegetation in the NPAs. Such analysis is an ordination method that shows the correlation between the selected variables, in this case, the vegetation types cover per cent, the NPAs and hexagons plus NPAs. The principal components method is a mathematical technique that does not demand a statistical model to explain the probabilistic structure of errors (Pla, 1986).
The method selects, as a first step, the factor that integrates the best possible proportion of the original variability; the second factor must gather the greatest possible variability not considered by the first, and so forth. From all the factors those that contribute with the per cent of variability that is considered enough will be selected. Those will be named as Principal Components. Once selected, they are included in a matrix (Terrádez-Gurrea, s.f).
RESULTS
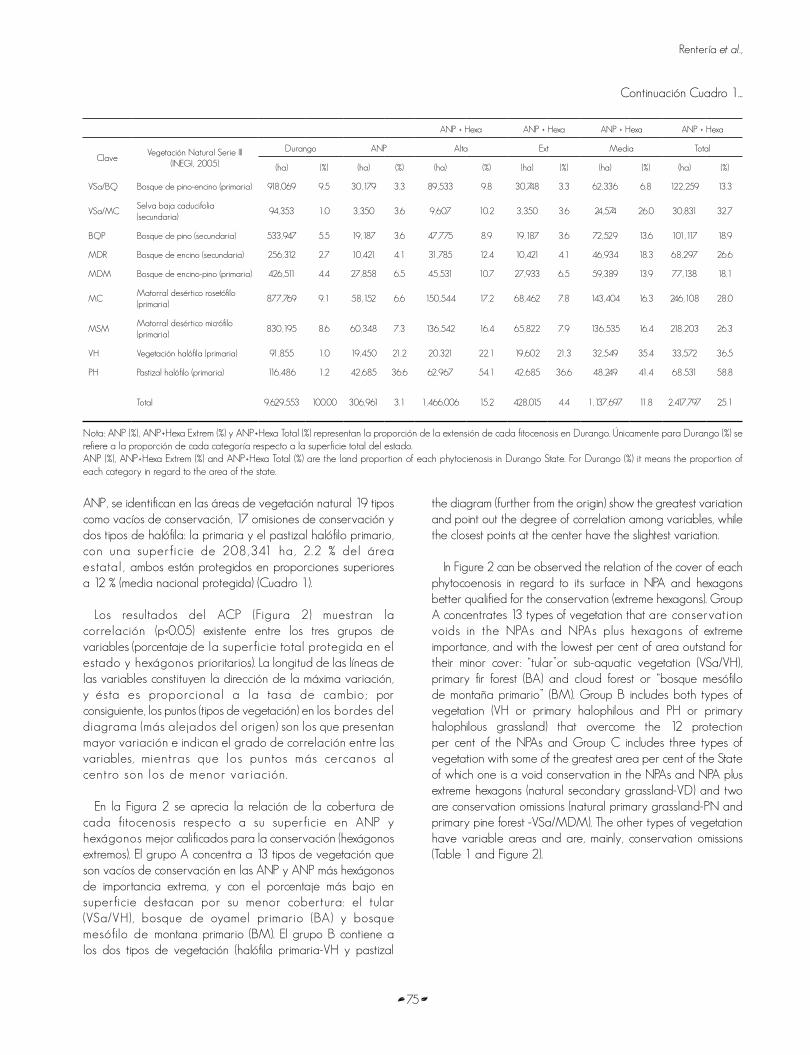
The digital layers of land use III Series (INEGI, 2005) for Durango State considers 41 categories, of which 38 are natural vegetation types with 9’629,553 ha, that is, 78 per cent of the state territory; the rest belongs to anthropic use or induced vegetation. In the NPAs are found 19 natural vegetation areas as conservation voids, 17 as conservation omissions and two kinds of halophilous: the original and the primary halophilous grassland with 208,341 ha, 2.2 % of the state area; both are protected in rates over 12 per cent (national protected average) (Table 1).
The results of the PCA (Figure 2) show the correlation (p<0.05) among the three groups of variables (per cent of the total protected area in the State and priority hexagons) . The length of the lines of the variables constitute the direction of the greatest variable and it is proportional to the change rate; thus, the dots (types of vegetation) in the borders of

Rev. Mex. Cien. For. Vol. 2 Núm. 3
74
Cuadro 1. Proporción de los tipos de vegetación natural en las áreas naturales protegidas (ANP) y los hexágonos prioritarios (Hexa)de Durango.
Table 1. Natural vegetation proportion in the natural protected areas (NPAs) and the priority hexagons (Hexa) of Durango.
ANP + Hexa ANP + Hexa ANP + Hexa ANP + Hexa
ClaveVegetación Natural Serie III
(INEGI, 2005)
Durango ANP Alta Ext Media Total
(ha) (%) (ha) (%) (ha) (%) (ha) (%) (ha) (%) (ha) (%)
BS Bosque ayarín (primaria) 8,503 0.1 0 0 8,212 96.6 0 0 267 3.1 8,479 99.7
VSA/BS Bosque ayarín (secundaria) 543 0.01 0 0 0 0 0 0 0 0 0 0
BA Bosque de oyamel (primaria) 228 0.0020
0 0 0 0 0 228 100.0 228 100.0
BJ Bosque de táscate (primaria) 5,921 0.1 0 0 5,181 87.5 0 0 726 12.3 5,907 99.8
VSa/BJ Bosque de táscate (secundaria) 1,284 0.01 0 0 248 19.3 0 0 241 18.8 490 38.1
BMBosque mesófilo de montaña (primaria)
393 0.004 0 0 0 0 0 0 382 97.3 382 97.3
VSa/MDR Matorral crasicaule (primaria) 229,391 2.4 0 0 190,776 83.2 26,341 11.5 9,455 4.1 226,571 98.8
VSa/MK Matorral crasicaule (secundaria) 25,177 0.3 0 0 16,934 67.3 1,025 4.1 957 3.8 18,915 75.1
SMSMatorral desértico rosetófilo (secundaria)
37,549 0.4 0 0 10,051 26.8 0 0 9,905 26.4 19,956 53.1
VSa/SMS Matorral submontano (priamaria) 25,349 0.3 0 0 2,311 9.1 5,077 20.0 4,427 17.5 11,816 46.6
VT Mezquital (secundaria) 5,375 0.1 0 0 0 0 0 0 0 0 0 0
VD Pastizal natural (secundaria) 907,461 9.4 0 0 116,306 12.8 7,847 0.9 87,028 9.6 211,181 23.3
VSa/VDSelva mediana subcaducifolia (primaria)
6,908 0.1 0 0 4,155 60.1 0 0 2,747 39.8 6,901 99.9
VYSelva mediana subcaducifolia
(secundaria)11,018 0.1 0 0 5,480 49.7 0 0 2,067 18.8 7,547 68.5
VSa/VH Tular ND 98 0.001 0 0 97 99.1 0 0 0 0 97 99.1
MLVegetación de desiertos arenosos (primaria)
16,658 0.2 0 0 0 0 0 0 0 0 0 0
MKVegetación de desiertos arenosos (secundaria)
1,253 0.01 0 0 0 0 0 0 0 0 0 0
VSa/PN Vegetación gipsófila (primaria) 699 0.01 0 0 693 99.2 0 0 0 0 693 99.2
BP Vegetación halófila (secundaria) 46,878 0.5 0 0 194 0.4 0 0 5,344 11.4 5,537 11.8
VSa/PH Chaparral ND 34,966 0.4 9 0.03 24,336 69.6 9 0.03 5,972 17.1 30,299 86.7
PN Pastizal natural (primaria) 866,120 9.0 681 0.1 222,645 25.7 21,908 2.5 68,183 7.9 311,375 36.0
VSa/MDM
Bosque de pino (primaria) 1,583,243 16.4 2,829 0.2 90,100 5.7 25,948 1.6 144,583 9.1 254,972 16.1
BQ Mezquital (primaria) 32,787 0.3 182 0.6 12,243 37.3 182 0.6 3,036 9.3 15,096 46.0
VSa/BQP Selva baja caducifolia (primaria) 404,606 4.2 2,289 0.6 36,107 8.9 15,923 3.9 43,407 10.7 90,858 22.5
VSa/BPQ Bosque de encino (primaria) 566,542 5.9 11,170 2.0 72,372 12.8 15,570 2.7 60,766 10.7 126,368 22.3
BPQ Pastizal halófilo (secundaria) 37,452 0.4 911 2.4 911 2.4 911 2.4 11,262 30.1 11,262 30.1
VSa/SBCMatorral desértico micrófilo (secundaria)
190,309 2.0 4,864 2.6 20,078 10.6 4,864 2.6 17,934 9.4 33,149 17.4
VSa/BPBosque de pino-encino (secundaria)
291,794 3.0 8,122 2.8 13,552 4.6 9,475 3.2 20,397 7.0 27,180 9.3
SBCBosque de encino-pino (secundaria)
145,552 1.5 4,273 2.9 18,420 12.7 4,724 3.2 11,866 8.2 26,484 18.2
Continúa Cuadro 1...
Rentería et al.,
75
ANP + Hexa ANP + Hexa ANP + Hexa ANP + Hexa
ClaveVegetación Natural Serie III
(INEGI, 2005)
Durango ANP Alta Ext Media Total
(ha) (%) (ha) (%) (ha) (%) (ha) (%) (ha) (%) (ha) (%)
VSa/BQ Bosque de pino-encino (primaria) 918,069 9.5 30,179 3.3 89,533 9.8 30,748 3.3 62,336 6.8 122,259 13.3
VSa/MCSelva baja caducifolia (secundaria)
94,353 1.0 3,350 3.6 9,607 10.2 3,350 3.6 24,574 26.0 30,831 32.7
BQP Bosque de pino (secundaria) 533,947 5.5 19,187 3.6 47,775 8.9 19,187 3.6 72,529 13.6 101,117 18.9
MDR Bosque de encino (secundaria) 256,312 2.7 10,421 4.1 31,785 12.4 10,421 4.1 46,934 18.3 68,297 26.6
MDM Bosque de encino-pino (primaria) 426,511 4.4 27,858 6.5 45,531 10.7 27,933 6.5 59,389 13.9 77,138 18.1
MCMatorral desértico rosetófilo (primaria)
877,769 9.1 58,152 6.6 150,544 17.2 68,462 7.8 143,404 16.3 246,108 28.0
MSMMatorral desértico micrófilo (primaria)
830,195 8.6 60,348 7.3 136,542 16.4 65,822 7.9 136,535 16.4 218,203 26.3
VH Vegetación halófila (primaria) 91,855 1.0 19,450 21.2 20,321 22.1 19,602 21.3 32,549 35.4 33,572 36.5
PH Pastizal halófilo (primaria) 116,486 1.2 42,685 36.6 62,967 54.1 42,685 36.6 48,249 41.4 68,531 58.8
Total 9,629,553 100.00 306,961 3.1 1,466,006 15.2 428,015 4.4 1,137,697 11.8 2,417,797 25.1
Nota: ANP (%), ANP+Hexa Extrem (%) y ANP+Hexa Total (%) representan la proporción de la extensión de cada fitocenosis en Durango. Únicamente para Durango (%) se refiere a la proporción de cada categoría respecto a la superficie total del estado. ANP (%), ANP+Hexa Extrem (%) and ANP+Hexa Total (%) are the land proportion of each phytocienosis in Durango State. For Durango (%) it means the proportion of each category in regard to the area of the state.
ANP, se identifican en las áreas de vegetación natural 19 tipos como vacíos de conservación, 17 omisiones de conservación y dos tipos de halófila: la primaria y el pastizal halófilo primario, con una superficie de 208,341 ha, 2.2 % del área estatal , ambos están protegidos en proporciones superiores a 12 % (media nacional protegida) (Cuadro 1).
Los resultados del ACP (Figura 2) muestran la correlación (p<0.05) existente entre los tres grupos de variables (porcentaje de la superficie total protegida en el estado y hexágonos prioritarios). La longitud de las líneas de las variables constituyen la dirección de la máxima variación, y ésta es proporcional a la tasa de cambio; por consiguiente, los puntos (tipos de vegetación) en los bordes del diagrama (más alejados del origen) son los que presentan mayor variación e indican el grado de correlación entre las variables, mientras que los puntos más cercanos al centro son los de menor variación.
En la Figura 2 se aprecia la relación de la cobertura de cada fitocenosis respecto a su superficie en ANP y hexágonos mejor calificados para la conservación (hexágonos extremos). El grupo A concentra a 13 tipos de vegetación que son vacíos de conservación en las ANP y ANP más hexágonos de importancia extrema, y con el porcentaje más bajo en superficie destacan por su menor cobertura: el tular (VSa/VH), bosque de oyamel primario (BA) y bosque mesófilo de montana primario (BM). El grupo B contiene a los dos tipos de vegetación (halófila primaria-VH y pastizal
the diagram (further from the origin) show the greatest variation and point out the degree of correlation among variables, while the closest points at the center have the slightest variation.
In Figure 2 can be observed the relation of the cover of each phytocoenosis in regard to its surface in NPA and hexagons better qualified for the conservation (extreme hexagons). Group A concentrates 13 types of vegetation that are conservation voids in the NPAs and NPAs plus hexagons of extreme importance, and with the lowest per cent of area outstand for their minor cover: “tular”or sub-aquatic vegetation (VSa/VH), primary fir forest (BA) and cloud forest or “bosque mesófilo de montaña primario” (BM). Group B includes both types of vegetation (VH or primary halophilous and PH or primary halophilous grassland) that overcome the 12 protection per cent of the NPAs and Group C includes three types of vegetation with some of the greatest area per cent of the State of which one is a void conservation in the NPAs and NPA plus extreme hexagons (natural secondary grassland-VD) and two are conservation omissions (natural primary grassland-PN and primary pine forest -VSa/MDM). The other types of vegetation have variable areas and are, mainly, conservation omissions (Table 1 and Figure 2).
Continuación Cuadro 1...

Rev. Mex. Cien. For. Vol. 2 Núm. 3
76
halófilo primario-PH) que superan 12 % de protección en las ANP, y el grupo C incluye tres tipos de vegetación con algunos de los mayores porcentajes en superficie del estado, de los cuales uno es vacío de conservación en las ANP y ANP más hexágonos extremos (pastizal natural secundario-VD) y dos son omisiones de conservación (pastizal natural primario-PN y bosque de pino primario-VSa/MDM). Los otros tipos de vegetación tienen superficies variables y son principalmente, omisiones de conservación (Cuadro 1 y Figura 2).
Con la suma del total de hexágonos prioritarios quedan concentrados en el grupo A los siguientes tipos de vegetación: bosque de ayarín secundario (VSA/BS), mezquital secundario (VT) , vegetación de desiertos arenosos primario (ML) y vegetación de desiertos arenosos secundario (MK) como vacíos de conservación en las ANP y ANP más el total de hexágonos. El grupo B contiene a dos tipos (matorral desértico rosetófilo primario-MC y matorral desértico micrófilo primario-MSM) que son omisiones de conservación en las ANP, pero con las superficies más grandes. Finalmente, el grupo C integra a la vegetación con mayores porcentajes de protección, de los cuales una cantidad que supera la mitad tienen de 90 a 100 % de cobertura, pero con menor superficie en el estado, ent re los que sobresa len por su poca ex tens ión es tán en el bosque mesófilo de
Figura 2. Diagrama Biplot basado en el análisis de componentes principales de la superficie total y protegida en Durango y la suma de los hexágonos extremos respecto a los tipos de vegetación natural Serie III (INEGI, 2005). Las claves representan los tipos de vegetación descritos en el Cuadro 1.
Figure 2. Biplot diagram based upon the Principal Component Analysis of the total and protected area in Durango are the sum of the extreme hexagons in regard to the types of natural vegetation III Series (INEGI, 2005). The keys are the types of vegetation described in Table 1.
With the total sum of the priority hexagons, in Group A the following types of vegetation came together: secondary “ayarín” (Pseudotsuga sp. and Picea sp.) forest (VSA/BS), secondary Prosopis vegetation (VT), primary sandy deserts vegetation (ML) and secondary sandy desert vegetation (MK) as conservation voids in the NPAs and NPAs plus the total number of hexagons. Group B includes two types (primary dessert succulent rosette scrub- MC and primary desert microphylla scrub-MSM) which are conservation omissions in the NPAs, but with greater territories. Finally, Group C gathers vegetation with the greatest protection per cent, some of which are over the middle, have from 90 to 100 cover per cent but with less territory in the State, from which the following types are notorious as they grow over a small area: primary cloud forest (BM), primary fir forest (BA) and sub-aquatic vegetation (VSa/VH). The rest of the types of vegetation cover variable areas and are, mainly conservation omissions (Table 1 and Figure 3).
In Figure 4 can be observed the distribution of the 19 types of vegetation considered conservation voids (0% cover in NPAs) that are located, mainly, in the central region of the State; the conservation omissions (<12 cover per cent in NPA) and the two types that are well protected (>12 cover per cent in NPA) are located, almost totally, in the Northeastern region of the State, as well as the distribution of the priority hexagons.

Rentería et al.,
77
Figura 3. Diagrama Biplot basado en el análisis de componentes principales de la superficie total y protegida en Durango y los hexágonos prioritarios sumados a los tipos de vegetación natural Serie III (INEGI, 2005). Las claves representan los tipos de vegetación descritos en el Cuadro 1.
Figure 3. Biplot diagram based on the Principal Component Analysis of the total and protected area in Durango and the priority hexagons added to the types of natural vegetation III Series (INEGI, 2005). The keys are the types of vegetation described in Table 1.
Nota: Los espacios en blanco corresponden a usos diversos del suelo, como agricultura, ganadería etc.
Note: The blank spaces belong to several types of land use, such as agriculture, livestock, etc.
Figura 4. Vacíos y omisiones de conservación de la vegetación natural serie III (INEGI, 2005) de Durango en función de la cobertura de las actuales ANP, media nacional protegida y hexágonos prioritarios.
Figure 4. Conservation voids and omissions of natural vegetation III Series (INEGI, 2005) of Durango in terms of cover of the present NPAs, national protection average and priority hexagons.

Rev. Mex. Cien. For. Vol. 2 Núm. 3
78
montaña primario (BM), bosque de oyamel primario (BA) y tular (VSa / VH). El resto de los tipos de vegetación cubren superficies variables y son, principalmente, omisiones de conservación (Cuadro 1 y Figura 3).
En la Figura 4 se observa la distribución de los 19 tipos de vegetación considerados vacíos de conservación (0 % de cobertura en ANP), que se ubican, sobre todo, en la región centro del estado, los que son omisiones de conservación (<12 % de cobertura en ANP), y los dos t ipos que están bien protegidos (>12 % de cobertura en ANP) se localizan, casi en su totalidad, en la región noreste de la entidad, así como, la distribución de los hexágonos prioritarios.
DISCUSIÓN
Rodrigues et al. (2004a) señalan que las estrategias mundiales empleadas para el crecimiento de las áreas protegidas no se han orientado a maximizar la cobertura de la biodiversidad. En el Ordenamiento Ecológico del estado de Durango (SEMARNAT, 2008), uno de los criterios para generar el Sistema Estatal de Áreas Naturales Protegidas fue proteger al menos una porción de todos los tipos de vegetación existentes en la entidad. Sin embargo, este no se cumple en la actual red de ANP, pues no obstante que su número aumentó al doble en menos de 10 años, su ubicación y poca superficie han sido determinantes para que la mitad de las fitocenosis naturales (19 de 38) cont inúen s iendo vacíos de conservación . Por o t ra par te , Pressey et a l . (2003) mencionan que el porcentaje de una región o país que debe ser conservado tiene que definirse con base en las condiciones de la biodiversidad (tipos de vegetación, especies, ecosistemas, etc.) que requiera protección y no por objetivos arbitrarios.
En Durango la vegetación natural, cubre 78% de su territorio, del cual los bosques templados, pastizales y matorrales constituyen los de mayor proporción territorial. Sin embargo, en la actualidad son vacíos y omisiones de conservación, sólo el pastizal halófilo primario y la vegetación halófila primaria están representados en proporciones superiores a 12 % en la reserva de la biosfera Mapimí, ANP de mayor extensión territorial en la entidad.
La vegetación primaria constituye 57 % de la superficie estatal, entre la que destaca tres tipos por su gran cobertura: matorral desértico rosetófilo, bosque de pino-encino y bosque de pino, a los cuales, en su conjunto, les corresponde 27 % del territorio y 48 % del total de vegetación primaria. No obstante, son omisiones de conservación en las ANP, sólo si se suma la totalidad de hexágonos prioritarios quedan protegidos en proporciones superiores a 12 %. Existen estudios enfocados a evaluar el grado de cobertura que los sistemas de ANP confieren a los diversos ecosistemas y grupos de especies
DISCUSSION
Rodrigues et al. (2004a) point out that the world strategies used for the extension of protected areas has not been bound to maximize the biodiversity cover. In the Ecological Ordering of Durango State (SEMARNAT, 2008), one of the criteria to build up the Natural Protected Areas State System was to protect at least one part of all the vegetation types present in the State. However, it has not been accomplished in the present NPA network, since, in spite of having doubled in less than 10 years, its location and small land have been crucial to keep half of the natural phytocoenosis (19 out of 38) as conservation years, its location and small land have been crucial to keep half of the natural phytocoenosis (19 out of 38) as conservation voids . On the other hand, Pressey et al . (2003) mention that the proportion of a region or country that must be conserved should be defined upon the biodiversity conditions (types of vegetation species, ecosystems, etc.) that demand protection and not by groundless purposes.
In Durango, natural vegetation cover 78 per cent of its territory, from which mild-weather forests, grasslands and scrubs have the greatest proportion. However, at present, the conservation voids and omissions are only the primary halophilous grassland and the primary halophilous vegetation, that are in rates over 12 per cent at the Mapimi Biosphere Reserve, which is the NPA with the greatest territory of the State.
Primary vegetation makes up for 57 per cent of the state land, from which three types have an outstanding cover: dessert succulent rosette scrub, pine-oak forest and pine forest, to which, as a whole, occupy 27 per cent of the territory and 48 per cent of primary vegetation. In spite of it, they are conservation omissions in the NPAs only if the total number or priority hexagons are protected in proportions over 12 per cent. There are studies focused upon the assessment of the cover degree that the NPA systems give to the diverse ecosystems and groups of flora and fauna species; thus is confirmed that the current NPA networks are non-satisfactory to protect biodiversity, since they are biased towards specific ecosystems, frequently to those of less economic value, and leave others unprotected or partially protected (Cantú et al., 2001, 2003, 2004; Rodrigues et al., 2004a).
The addition of the areas that belong to the extreme hexagons (141,335 ha) and to the NPAs of Durango State (353,229 ha) rise to 4 per cent those that have legal protection; thus, the 19 natural vegetation types that are conservation voids in the NPAs become reduced to 15 and from 14 per cent get to 1.5%. In a similar way, when the total number of priority hexagons (2’952,521 ha) are added to the NPAs, the land subjected to protection increases 27 per cent, with which the four types considered conservation voids diminish, with 2 per cent of the State.

Rentería et al.,
79
de flora y fauna; en ello se demuestra que las redes de ANP vigentes son insuficientes para proteger la biodiversidad, ya que están sesgadas hacia ciertos ecosistemas, frecuentemente hacia aquéllos de menor valor económico, y dejan a otros desprotegidos o protegidos de forma parcial (Cantú et al., 2001, 2003, 2004; Rodrigues et al., 2004a).
La suma de las áreas correspondientes a los hexágonos extremos (141,335 ha) y a la de las ANP de Durango (353,229 ha) eleva a 4% los que están bajo protección legal; por lo tanto, los 19 tipos de vegetación natural que son vacíos de conservación en las ANP disminuyen a 15 y pasan del 14 % del área estatal a 1.5 %. De igual manera, al adicionar el total de hexágonos prioritarios (2’952,521 ha) a las ANP, la superficie sujeta a protección aumenta a 27 %, con lo que se reducen a cuatro los tipos considerados vacíos de conservación, con 2 % del estado.
Una planificación eficiente de la conservación debe basarse en la estimación del grado de protección que provee el sistema de áreas protegidas existente; básicamente, se trata de un análisis de vacíos y omisiones de conservación. (Gap), seguido de una selección de sitios adicionales que complementen de manera eficiente la red de reservas actual, con base en objetivos de conservación establecidos a priori (Ramírez de Arellano et al., 2008).
La cantidad de ANP en México está cambiando continuamente. A la fecha se tienen 174 ANP (12.92%) que representan la media nacional protegida (CONANP, 2010). Por lo anterior, es necesario realizar periódicamente los análisis de vacíos y omisiones de conservación que permitan redefinir prioridades, lo que también es una exigencia del impacto del cambio climático en los patrones de distribución de las especies y ecosistemas (Loarie et al., 2009).
CONCLUSIONES
La actual red de ANP de Durango no protege de forma adecuada a los tipos de vegetación natural presentes en su territorio. La suma de la super ficie que abarcan los hexágonos prioritarios (2’952,521 ha) propuestos por la CONABIO para proteger la biodiversidad del país, contribuyen parcialmente a resolver este problema, al cubrir 32 de los 38 tipos de vegetación presentes en la entidad. Sin embargo, esta área equivale a ocho veces el territorio cubierto por las ANP en el estado, por lo que las necesidades financieras, técnicas y logísticas serían muy altas si se considerara su inclusión dentro de ellas. Por lo tanto, es muy importante realizar un estudio detallado que involucre la distr ibución de las especies , pr incipa lmente las endémicas y en riesgo de extinción, para determinar los requerimientos de protección, ya que los hexágonos prioritarios corresponden a necesidades de escala nacional, las cuales difieren de las estatales.
An efficient planning of conservation must be based upon the estimation of the degree of protection that provides the protected areas system at present; basically, it is about an void and omission conservation analysis (Gap), followed by a selection of additional sites that complete in an efficient way, the present reserve network, based upon the aims of conservation a priori established (Ramírez de Arellano et al., 2008).
The number of NPAs in Mexico is continuously changing. At present, there are 174 of them (12.92 per cent) that depict the nation protection average (CONANP, 2010) . Thus, i t is necessary to make frequent conservation void and omissions analysis that favors the re-definition of priorities, which is also a demand of the effects of climate change over the patterns of distributions of species and ecosystems (Loarie et al . , 2009).
CONCLUSIONS
The present NPA network of Durango State does not protect correctly the natural vegetation types that grow in its territory.The total amount of the areas that cover the priority hexagons (2’952,521 ha) proposed by CONABIO to protect national biodiversity, partially help to solve this problem, as they include 32 out of the 38 vegetation types of the State. However, this area is eight times the land covered by the NPAs of the State, which means that the financial, technical and logistic needs would be very high if it was considered to include them. Thus, it is very important to make a detailed study that involves the distribution of the species, mainly endemic and at risk of extinction, to determine the requirements of protection, since the priority hexagons refer to needs at a national level, which are different from those of the State.
End of the English version

Rev. Mex. Cien. For. Vol. 2 Núm. 3
80
REFERENCIAS
Biodesert-Universidad Juárez del Estado de Durango-Gobierno del Estado de Durango-Poder Ejecutivo del Gobierno del Estado de Durango-ProDeNazas 2003. Plan de Manejo del Parque Estatal “Cañón de Fernández”, en el Municipio de Lerdo, Estado de Durango. Durango, Dgo., México. 268 p.
Arango, N., D. Armenteras, M. Castro, T. Gottsmann, O. Hernández, C. Matallana, M. Morales, L. Naranjo, L. Renjifo, A. Trujillo y F. Villareal. 2003. Vacíos de conservación del sistema de parques nacionales naturales de Colombia desde una perspectiva ecorregional. WWF-Colombia e Instituto de Investigación de Recursos Biológicos Alexander von Humboldt, Cali, Colombia. 64 p.
Austin, M. P. and C. R. Margules, 1986. Assessing representativeness. In: M. B. Usher (Ed.). Wildlife Conservation Evlauation. Chapman and Hall, Londres. U K. pp. 47-52.
Brooks, T. G., G. Da Fonseca and A. Rodrigues. 2004. Species, data and conservation planning. Conservation Biology 18:1682-1688.
Cantú, C., J. M. Scott and R. G. Wright. 2001. The Gap analysis program on the assessment of nature reserves of Mexico. Gap Analysis Bullet in 10:8-11.
Cantú, C., R. G. Wright, J. M. Scott and E. Stand. 2003 Conservation assessment of current and proposed nature reserves of Tamaulipas State, México. Natural Areas Journal 23:220-228.
Cantú, C., R. G. Wright, J. M. Scott and E. Strand. 2004. Assessment of current and proposed nature reserves of Mexico based on their capacity to protect geophysical features and biodiversity. Biological Conservation 115:411-417.
Cantú, C., P. Koleff, M. Tambutti, A. Lira-Noriega, M. García, E. Estrada y R. Esquivel. 2007. Representatividad de las áreas protegidas en las ecorregiones terrestres de América. In: Halffter G., S. Guevara y A. Melic (Comps.). Hacia una cultura de conservación de la diversidad biológica. Vol. 6, Monografías 3er Milenio. Zaragoza, España. pp. 35-44.
Chape, S., J. Harrison, M. Spalding and I. Lysenko. 2005. Measuring the extent and effectiveness of protected areas as an indicator for meeting global biodiversity targets. Philosophical Transactions of the Royal Society B. 360:443-455.
Comisión Nacional para el Conocimiento y Uso de la Biodiversidad-Comisión Nacional de Áreas Naturales Protegidas-The Nature Conservancy-Protección a la naturaleza (CONABIO – CONANP – TNC - PRONATURA). 2007. Sitios Prioritarios Terrestres para la Conservación de la Biodiversidad, escala 1:1,000,000. CONABIO, CONANP, TNC-Programa México, Pronatura, México, D.F. México.
Comisión Nacional de Áreas Naturales Protegidas (CONANP). 2009. Áreas naturales protegidas. www.conanp.gob.mx. http://www.conanp.gob.mx/que_hacemos/. (10 de octubre de 2009).
Comisión Nacional de Áreas Naturales Protegidas (CONANP). 2010. Áreas naturales protegidas. www.conanp.gob.mx. http://www.conanp.gob.mx/que_hacemos/. (16 de julio de 2010).
Comisión Nacional de Áreas Naturales Protegidas CONANP. 2006. Programa de conservación y manejo, Reserva de la Biósfera de Mapimí Durango. Durango, Dgo. México. 179 p.
Comisión Técnico Consultiva de Copeficientes de Agostadero - Secretaría de Agricultura y Recursos Hidráulicos (COTECOCA – SARH)1979. Memoria de coeficientes de agostadero del estado de Durango. México, D.F. México. 200 p.
Cox, J., R. Kautz, M. MacLaughlin and T. Gilbert. 1994. Closing the gaps in Florida’s wildlife habitat conservation system. Office of Environmental Services. Florida Game and Fresh Water Fish Commission. Tallahassee, FL. USA. 239 p.
Dudley, N., K. J. Mulongoy, S. Cohen, S. Stolton and C. V. Barber. 2005. Towards effective protected area systems. An action guide to implement the convention on biological diversity programme of work on protected areas. Secretariat of the Convention on Biological Diversity, Montreal, Canadá, Technical Series No. 18. 95 p.
Dudley, N. and J. Parish. 2006. Closing the gap. Creating ecologically representative protected area systems: A guide to conducting the gap assessments of protected area systems for the convention on biological diversity. Secretariat of the Convention on Biological Diversity, Montreal, Canada. Technical Series No. 24. 108 p.
Espinosa, D. y S. Ocegueda. 2008. El conocimiento biogeográfico de las especies y su regionalización natural. In: Capital Natural de México, Vol. I: Conocimiento actual de la biodiversidad (CONABIO). México, D. F. México pp. 33-65.
González-Elizondo, S., M. González-Elizondo y M. Márquez-Linares. 2007. Vegetación y ecorregiones de Durango. CIIDIR-IPN. Durango, Dgo. México. 219 p.
Instituto Nacional de Estadística y Geografía (INEGI). 2005. Conjunto de datos vectoriales de uso de suelo y vegetación, Serie III (continuo nacional), escala 1:250 000. Instituto Nacional de Estadística, Geografía e Informática, Aguascalientes, Ags. México.
Jennings, M. D. 2000. Gap analysis: Concepts, methods and recent results. Landscape Ecology 15:5-20.
Koleff, P., M. Tambutti, I. J. March, R. Esquivel, C. Cantú y A. Lira-Noriega. 2009. Identificación de prioridades y análisis de vacíos y omisiones en la conservación de la biodiversidad de México. In: Capital Natural de México, Vol. II: Estado de conservación y tendencias de cambio. CONABIO. México, D. F. México. pp. 651-718.
Leopold, A. S. 1950. Vegetation zones of Mexico. Ecology 31:507-518.Loarie, S. R., P. B. Duffy, H. Hamilton, G. P. Asner, C. B. Field and D. Ackerly.
2009. The velocity of climate change. Nature 462:1052-1057.López, R. P. and C. Zambrana-Torrelio. 2006. Representation of andean dry
ecoregions in the protected areas of Bolivia: The situation in relation to the new phytogeographical findings. Biodiversity and Conservation 15:2163–2175.
Margules, C. y S. Sarkar. 2009. Planeación sistemática de la conservación. Comisión Nacional para el Conocimiento y Uso de la Biodiversidad, México, D. F. México. 304 p.
Miller, R. K. 1984. The Bali action plan: A framework for the future of protected areas. In: J. A. McNeely and K. R. Miller (Comps.). National Parks, Conservation and Development: The Role of Protected Areas in Sustaining Society. Smithsonian Institution Press, Washington DC. USA. pp. 756-764.
Miranda, F. y E. Hernández. 1963. Los tipos de vegetación de México y su clasificación. Boletín de la Sociedad Botánica de México 28:29-179.
Noss, R. F. 1993. Conservation plan for the Oregon Coastal Range: Some preliminary suggestions. Natural Areas Journal 13:276-290.
Odum, E. P. 1970. Optimum population and environment: A Georgia Microcosm. Current History. 58:355-359.
Pla, L. 1986. Análisis florístico de vegetación natural. In: E. V. Chesneau (Comp.). Análisis multivariado: Método de componentes principales. Programa Regional de Desarrollo Científico y Tecnológico. Secretaría General de la Organización de Estados Americanos. Washington D C. USA. pp. 49-78.
Pressey, R. L., R. M. Cowling and M. Rouget. 2003. Formulating conservation targets for biodiversity pattern and process in the cape floristic region, South Africa. Biological Conservation. 112:99-127.
Ramírez de Arellano, P. I., M. F. Tognelli, C. Garín y P. A. Marquet. 2008. Vacíos de conservación y sitios prioritarios para la conservación de los vertebrados nativos de la región de Atacama. In: Squeo, F. A., G. Arancio y J. R. Gutiérrez (Comps.). Libro rojo de la flora nativa y de los sitios prioritarios para su conservación: Región de Atacama. Universidad de la Serena, La Serena, Chile. pp. 251-266.
Rodrigues, A. S. L., H. R. Akákaya, S. J. Andelman, M. I. Bakarr, L. Boitani, T. M. Brooks, J. S. Chanson, L. D. C. Fishpool, G. A. B. Da Fonseca, K. J. Gaston, M. Hoffmann, P. A. Marquet, J. D. Pilgrim, R. L. Pressey, J. Schipper, W. Sechrest, S. N. Stuart, L. G. Underhill, R. W. Waller, M. E. J. Watts, and X. Yan. 2004a. Global gap analysis: Priority regions for expanding the global protected-area network. BioScience 54:1092-1100.

Rentería et al.,
81
Rodrigues, A. S. L., S. J. Andelman, M. I. Bakarr, L. Boitani, T. M. Brooks, R. M. Cowling, L. D. C. Fishpool, G. A. B. Da Fonseca, K. J. Gaston, M. Hoffmann, J. S. Long, P. A. Marquet, J. D. Pilgrim, R. L. Pressey, J. Schipper, W. Sechrest, S. N. Stuart, L. G. Underhill, R. W. Waller, M. E. J. Watts and X. Yan. 2004b. Effectiveness of the global protected area network in representing species diversity. Nature 428:640-643.
Rzedowski, J. 1978. Vegetación de México. Limusa, México, D. F. México 432 p.Scott, J. M., F. Davis, B. Csuti, R. Noss, B. Butterfield, C. Groves, H. Anderson,
S. Caicco, F. D’Erchia, T. C. Edwards, Jr., J. Uliman and R. G. Wright. 1993. Gap analysis: A geographic approach to the protection of biological diversity. Wildlife Monographs 123:1-41.
Secretaría del Medio Ambiente y Recursos Naturales (SEMARNAT) 2008. Ordenamiento ecológico del estado de Durango. Secretaría de Medio Ambiente y Recursos Naturales. Gobierno del Estado de Durango. Durango, Dgo. México 64 p.
Soulé, M. E. and M. A. Sanjayan. 1998. Conservation targets do they help? Science 279:2060-2061.
Terán, M. C., K. Clark, C. Suárez, F. Campos, J. Denkinger, D. Ruiz y P. Jiménez. 2006. Análisis de vacíos e identificación de áreas prioritarias para la conservación de la biodiversidad marino-costera en el Ecuador Continental. Resumen ejecutivo. Ministerio del Ambiente. Quito, Ecuador. 30 p.
Terrádez-Gurrea, M. (s.f.). Análisis de componentes principales. www.uoc.edu. http://www.uoc.edu/in3/emath/docs/Componentes_principales.pdf. (10 de octubre de 2009).
Van Wyngaarden, W. and M. Fandiño-Lozano. 2005. Mapping the actual and original distribution of the ecosystems and the chorological types for conservation planning in Colombia. Diversity and Distributions 11:461–473.

Rev. Mex. Cien. For. Vol. 2 Núm. 3
82
Cuenca Vaquerías en el ej ido Pueblo Nuevo, municipio de Pueblo Nuevo, Durango, con vegetación mezclada de Pinus cooperi C.E. Blanco, P. durangensis Martínez y Quercus spp. Juan Bautista Rentería Ánima (2003)


![EL CONCEPTO DE REPRESENTATIVIDAD EN LA ... … · el concepto de representatividad en la lingÜÍstica del corpus: aproximaciones teÓricas y metodolÓgicas [bff2003-04616 mcyt/ti-dt-2006-1]](https://img.pdfslide.net/doc/110x75/5bc2a06a09d3f291178c6b25/el-concepto-de-representatividad-en-la-el-concepto-de-representatividad.jpg)