Embed Size (px)
Citation preview
Representing Proportional Relationships
8.F.1
Essential Question?How can you identify & represent functions?
Common Core Standard:8.F.1 ─ Define, evaluate, and compare functions.Understand that a function is a rule that assigns to each input exactly one output. The graph of a function is the set of ordered pairs consisting of an input and the corresponding output
Objectives:
• Understand that a function is a rule that assigns to each input exactly one output.
• Identify whether a relationship is a function from a diagram, table of values, graph, or equation.
Curriculum Vocabulary
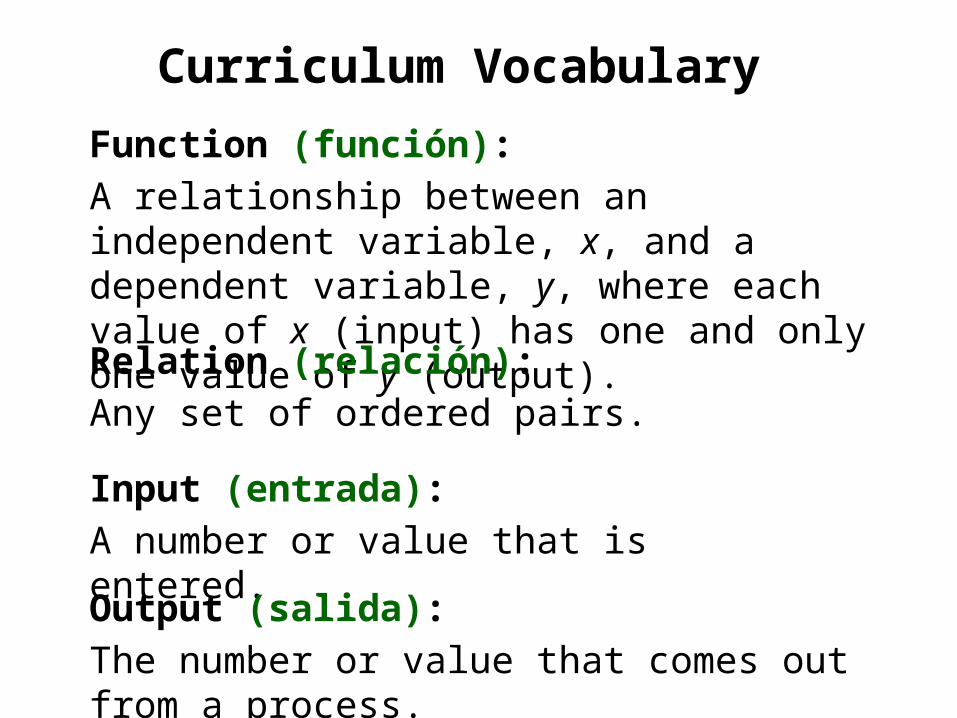
Function (función):A relationship between an independent variable, x, and a dependent variable, y, where each value of x (input) has one and only one value of y (output).
Relation (relación):Any set of ordered pairs.
Input (entrada):A number or value that is entered.
Output (salida):The number or value that comes out from a process.
REPRESENTING FUNCTIONS
There are 4 (FOUR) ways to represent a function that we will explore:
1. TABLE
2. MAPPING DIAGRAM
3. EQUATION
4. GRAPH
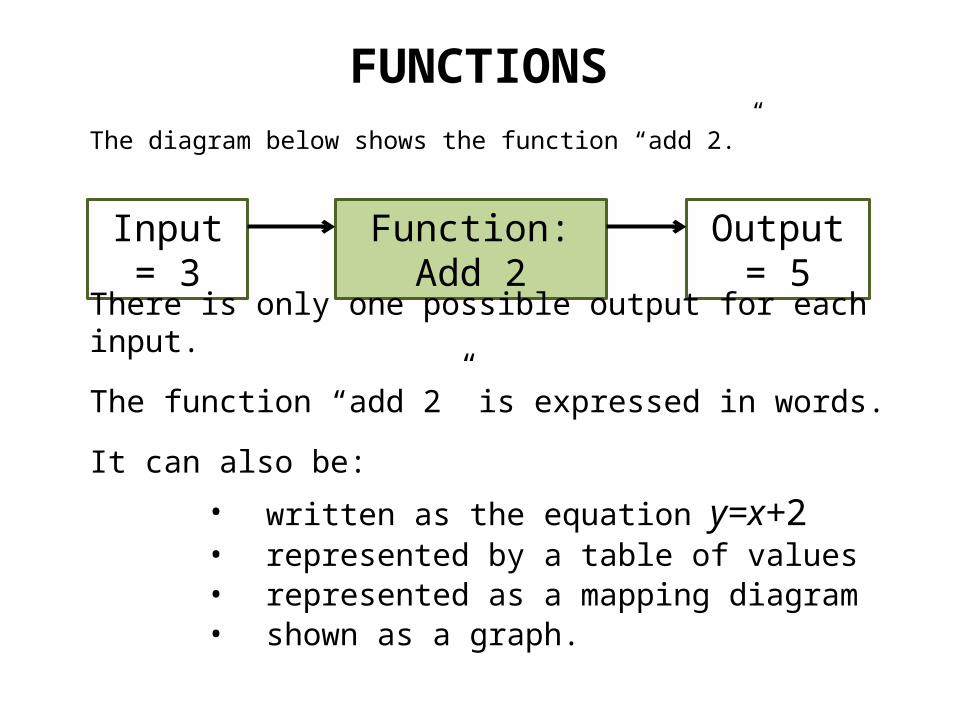
The diagram below shows the function “add 2.”
Input = 3 Function: Add 2 Output = 5
There is only one possible output for each input.
The function “add 2” is expressed in words.
It can also be:
• written as the equation y=x+2• represented by a table of values• represented as a mapping diagram• shown as a graph.
FUNCTIONS
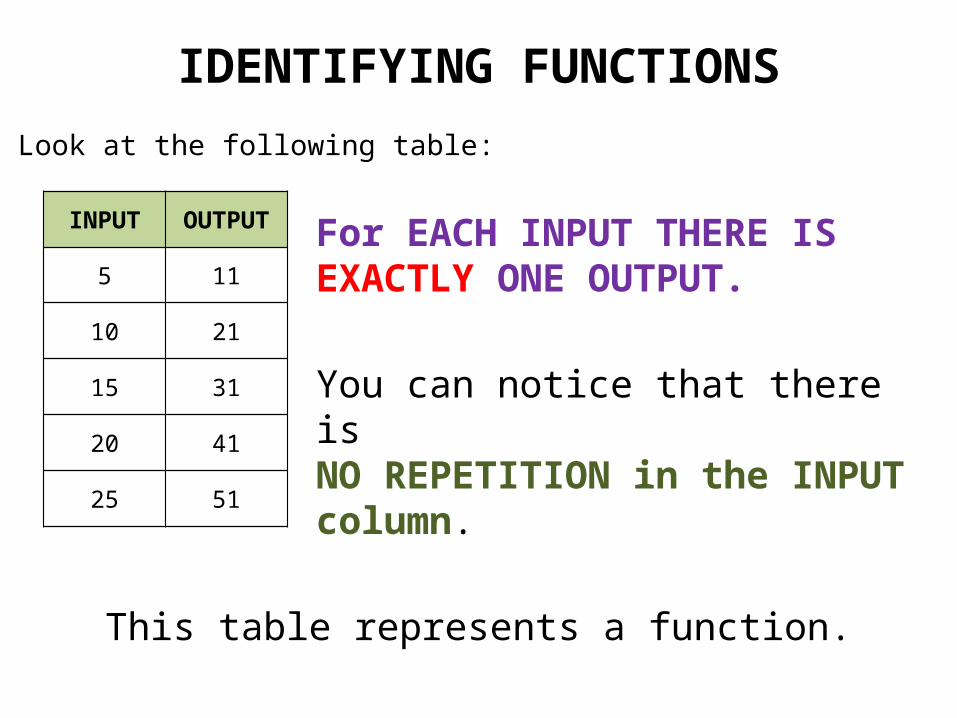
Look at the following table:
For EACH INPUT THERE IS EXACTLY ONE OUTPUT.
You can notice that there isNO REPETITION in the INPUT column.
This table represents a function.
IDENTIFYING FUNCTIONS
INPUT OUTPUT
5 11
10 21
15 31
20 41
25 51
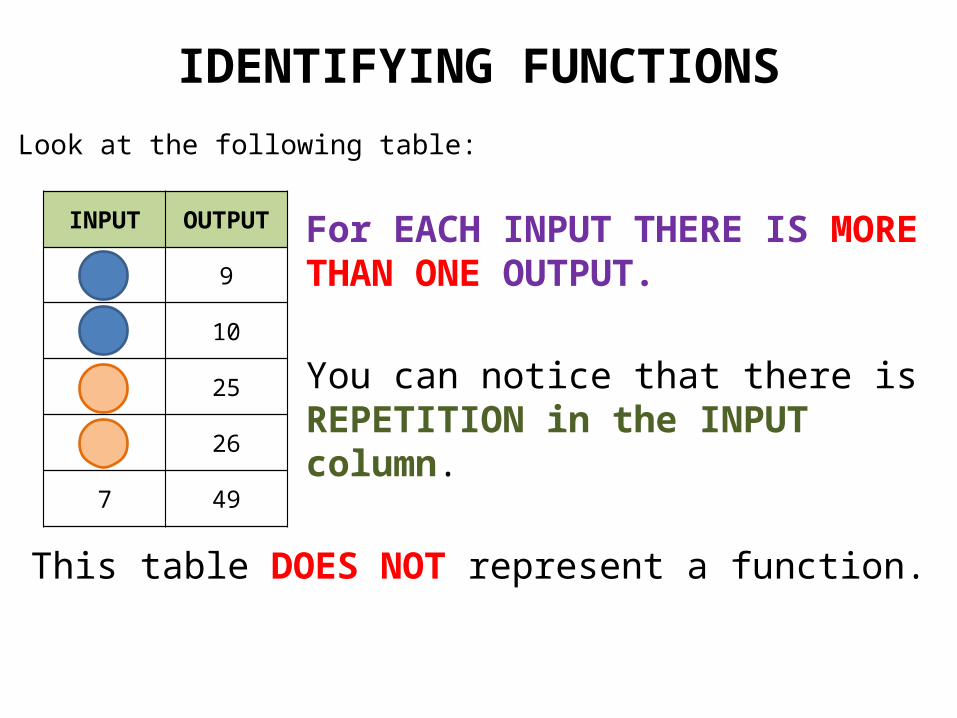
Look at the following table:
For EACH INPUT THERE IS MORE THAN ONE OUTPUT.
You can notice that there isREPETITION in the INPUT column.
This table DOES NOT represent a function.
IDENTIFYING FUNCTIONS
INPUT OUTPUT
3 9
3 10
5 25
5 26
7 49
IDENTIFYING FUNCTIONS
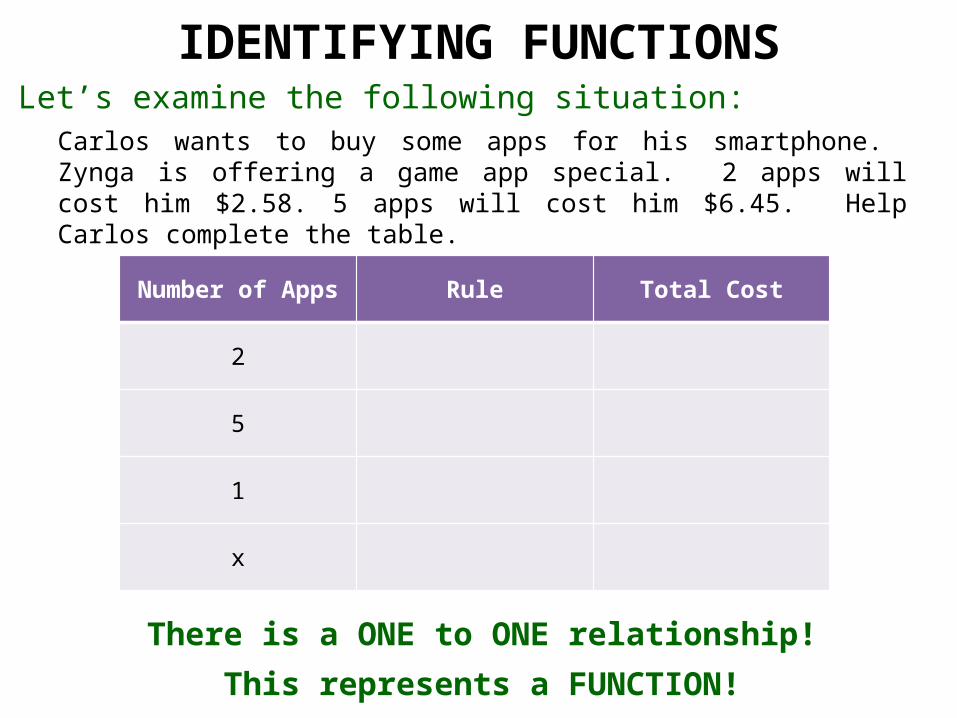
Carlos wants to buy some apps for his smartphone. Zynga is offering a game app special. 2 apps will cost him $2.58. 5 apps will cost him $6.45. Help Carlos complete the table.
Let’s examine the following situation:
Number of Apps Rule Total Cost
2
5
1
x
There is a ONE to ONE relationship!This represents a FUNCTION!
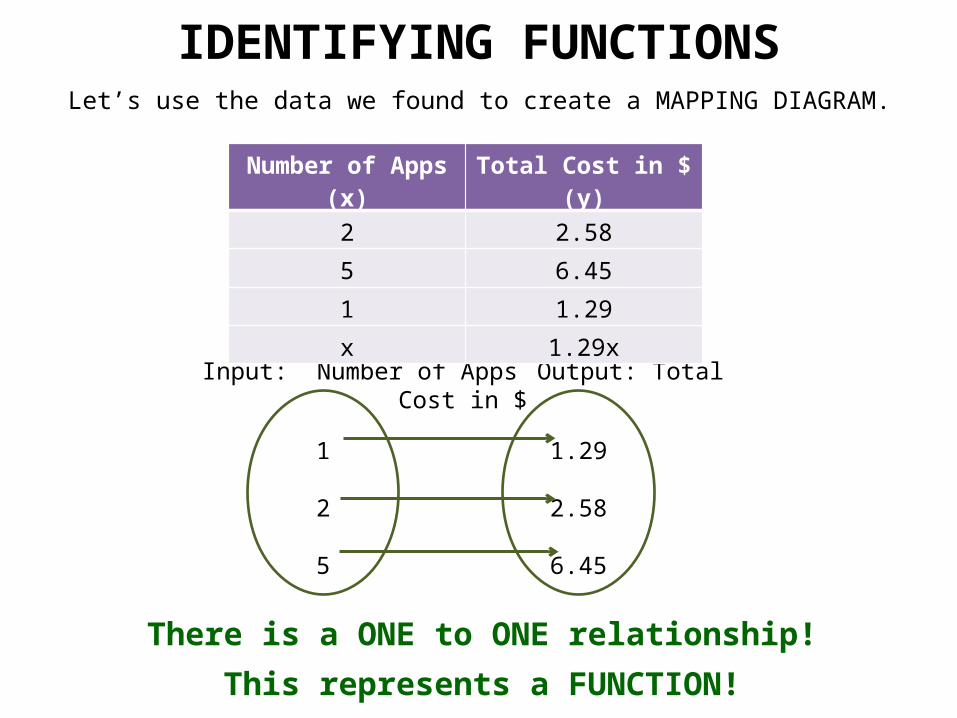
Let’s use the data we found to create a MAPPING DIAGRAM.
1.29
2.58
6.45
1
2
5
Input: Number of Apps Output: Total Cost in $
IDENTIFYING FUNCTIONS
Number of Apps (x) Total Cost in $ (y)
2 2.58
5 6.45
1 1.29
x 1.29x
There is a ONE to ONE relationship!This represents a FUNCTION!
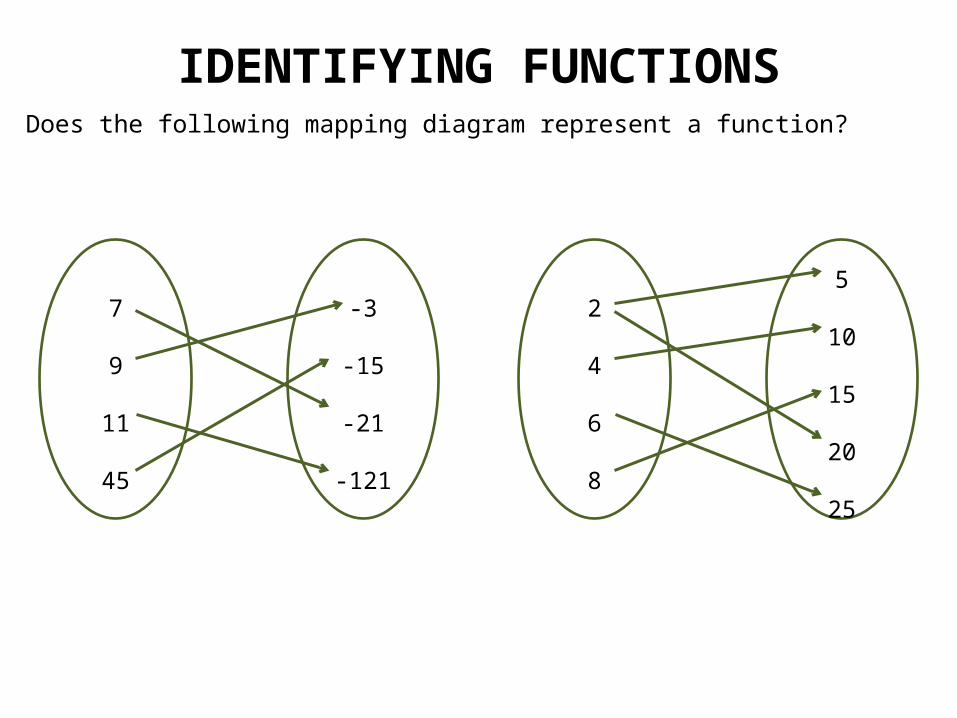
Does the following mapping diagram represent a function?
7
9
11
45
-3
-15
-21
-121
IDENTIFYING FUNCTIONS
2
4
6
8
5
10
15
20
25
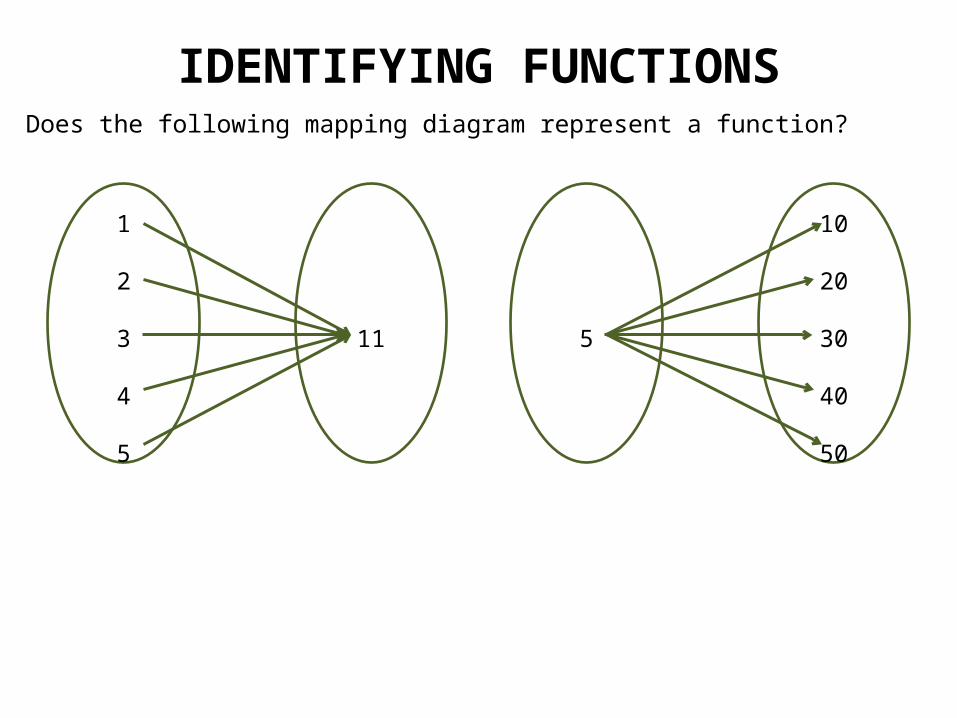
Does the following mapping diagram represent a function?
IDENTIFYING FUNCTIONS
1
2
3
4
5
11 5
10
20
30
40
50
IDENTIFYING FUNCTIONS
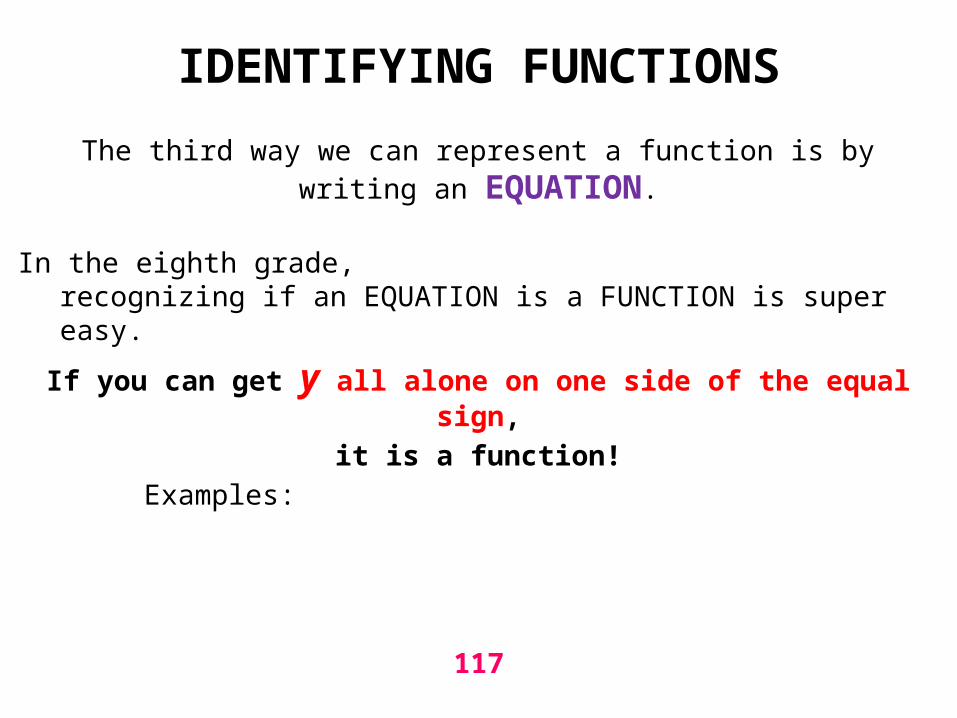
The third way we can represent a function is by writing an EQUATION.
In the eighth grade,recognizing if an EQUATION is a FUNCTION is super easy.
If you can get y all alone on one side of the equal sign,
it is a function!
Examples:
117
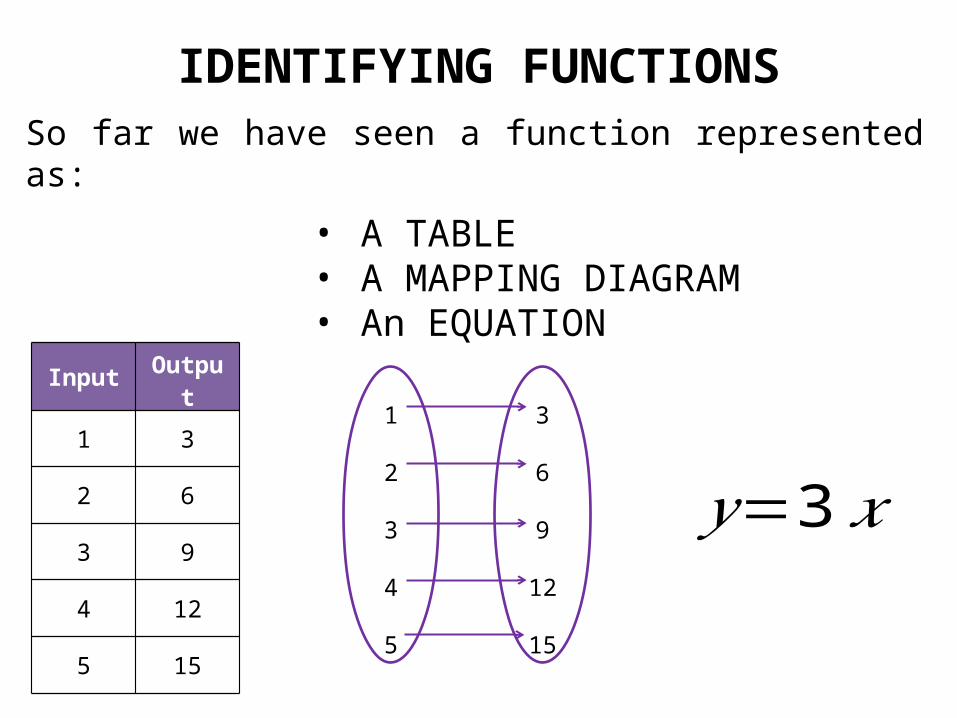
IDENTIFYING FUNCTIONSSo far we have seen a function represented as:
• A TABLE• A MAPPING DIAGRAM• An EQUATION
Input Output
1 3
2 6
3 9
4 12
5 15
1
2
3
4
5
3
6
9
12
15
𝑦=3 𝑥
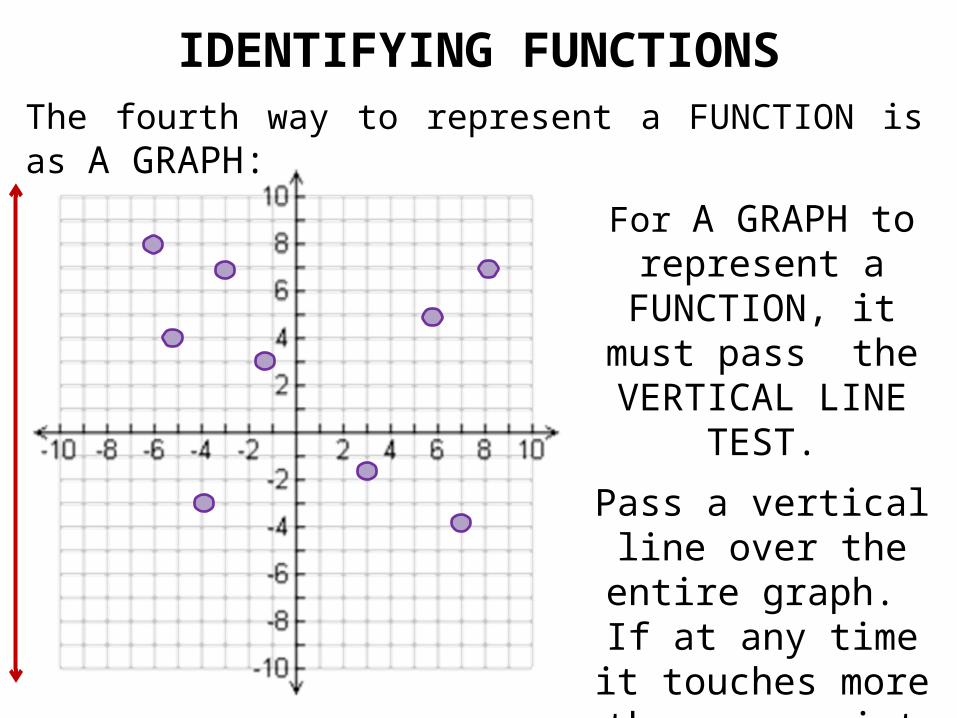
IDENTIFYING FUNCTIONSThe fourth way to represent a FUNCTION is as A GRAPH:
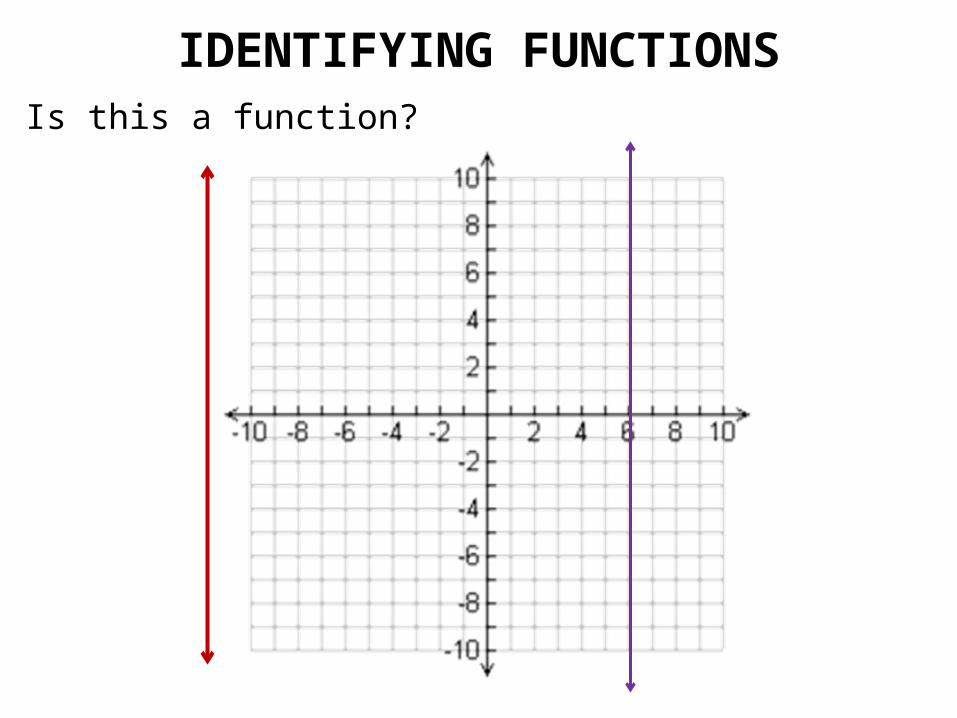
For A GRAPH to represent a FUNCTION,
it must pass the VERTICAL LINE TEST.
Pass a vertical line over the entire graph. If at
any time it touches more than one point at
the same, it is
NOT A FUNCTION
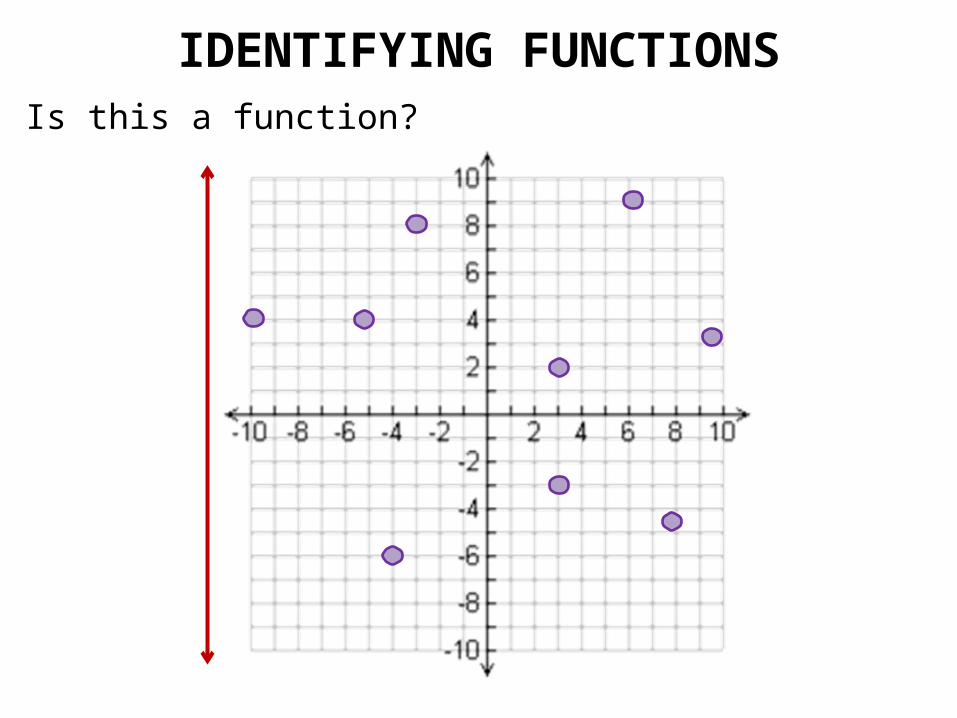
IDENTIFYING FUNCTIONSIs this a function?
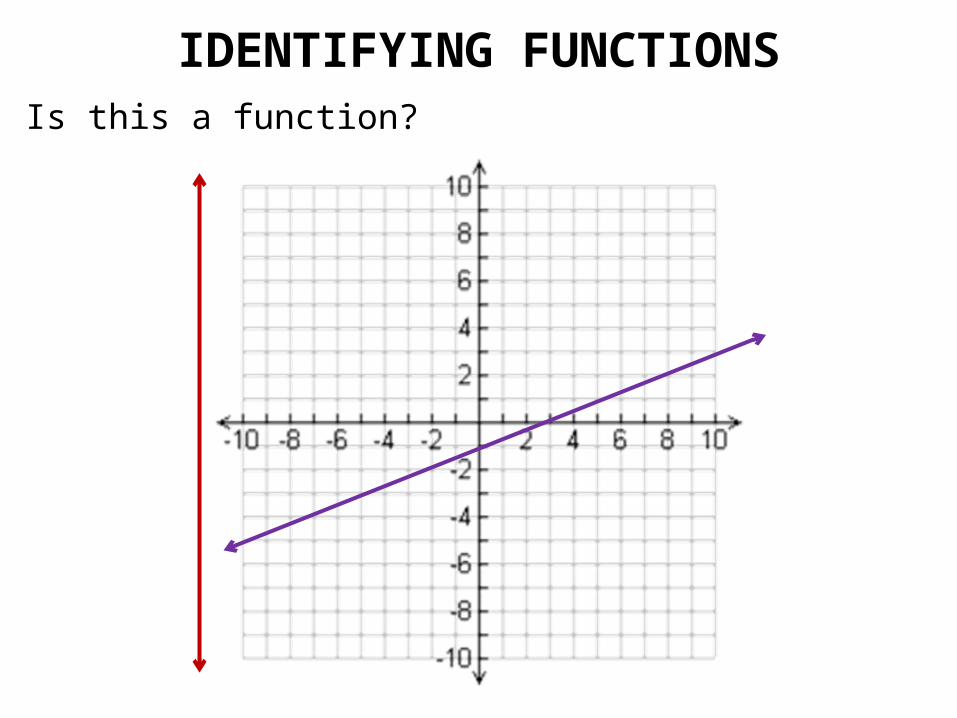
IDENTIFYING FUNCTIONSIs this a function?
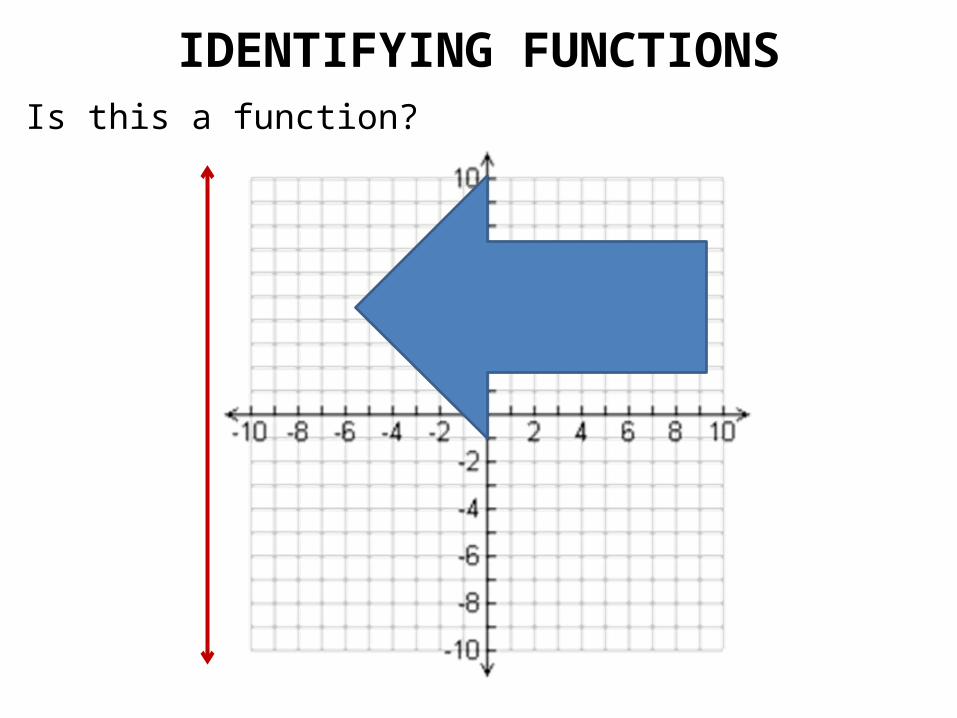
IDENTIFYING FUNCTIONSIs this a function?
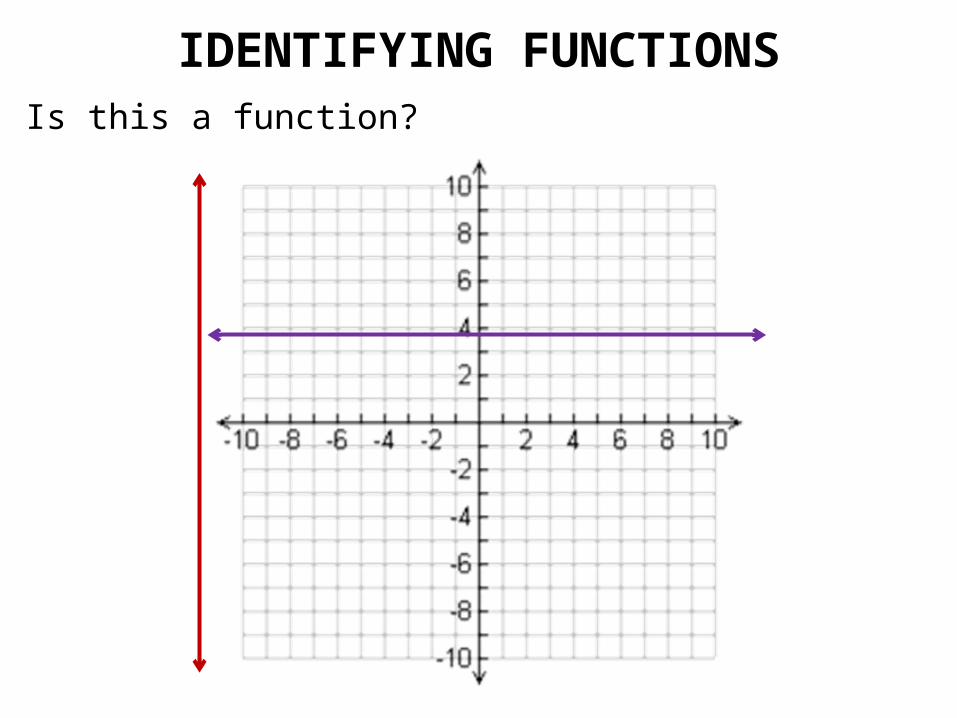
IDENTIFYING FUNCTIONSIs this a function?
IDENTIFYING FUNCTIONSIs this a function?
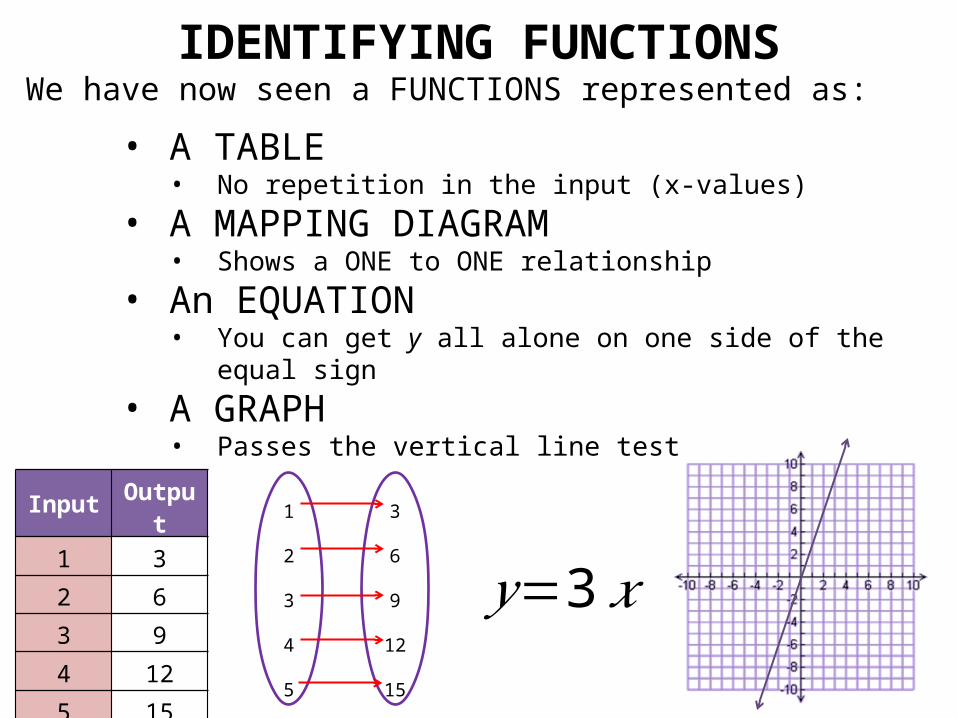
IDENTIFYING FUNCTIONSWe have now seen a FUNCTIONS represented as:
• A TABLE• No repetition in the input (x-values)
• A MAPPING DIAGRAM• Shows a ONE to ONE relationship
• An EQUATION• You can get y all alone on one side of the equal sign
• A GRAPH• Passes the vertical line test
Input Output
1 3
2 6
3 9
4 12
5 15
1
2
3
4
5
3
6
9
12
15
𝑦=3 𝑥
FUNCTIONS
For EACH INPUT THERE IS EXACTLY
(ONE AND ONLY)ONE OUTPUT.
For CP classes only
• Objective:– To identify the domain and range of a function
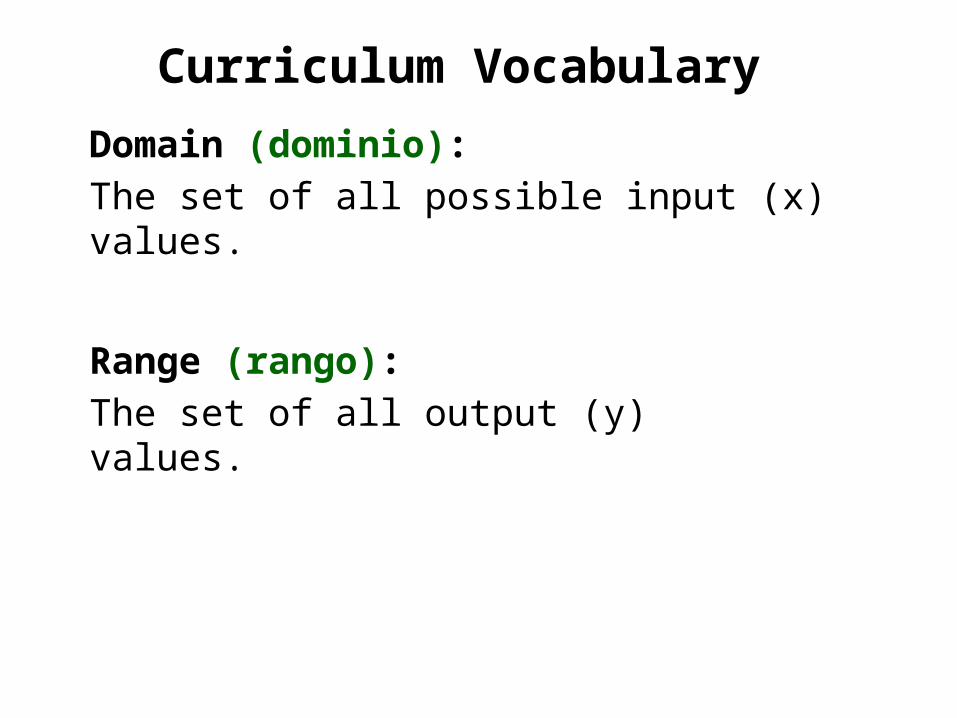
Curriculum Vocabulary
Domain (dominio):The set of all possible input (x) values.
Range (rango):The set of all output (y) values.
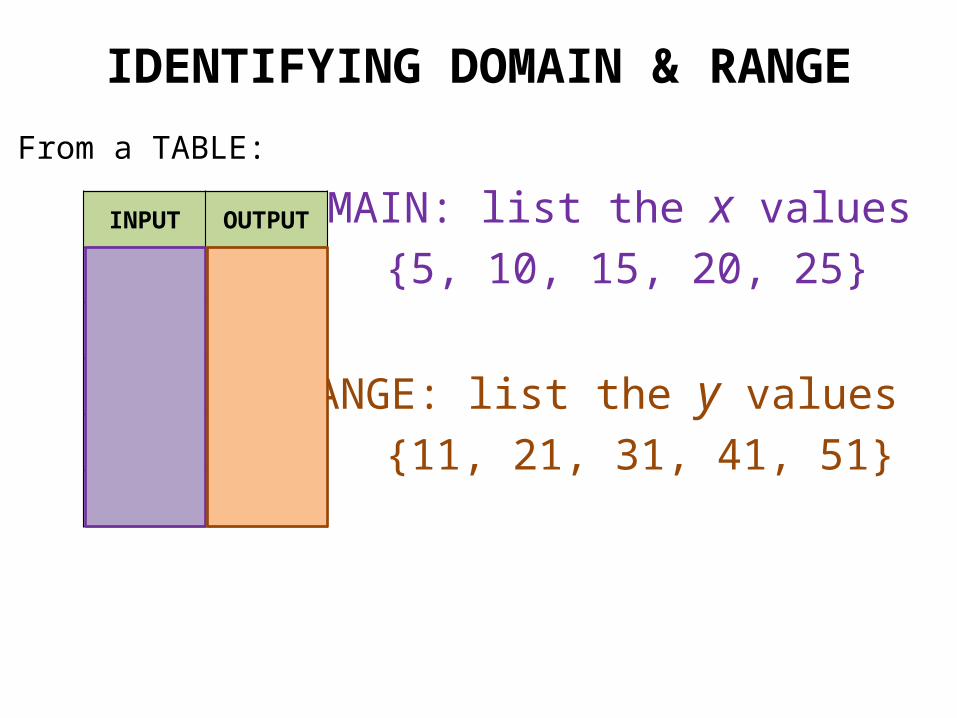
IDENTIFYING DOMAIN & RANGE
From a TABLE:
DOMAIN: list the x values
{5, 10, 15, 20, 25}
RANGE: list the y values
{11, 21, 31, 41, 51}
INPUT OUTPUT
5 11
10 21
15 31
20 41
25 51
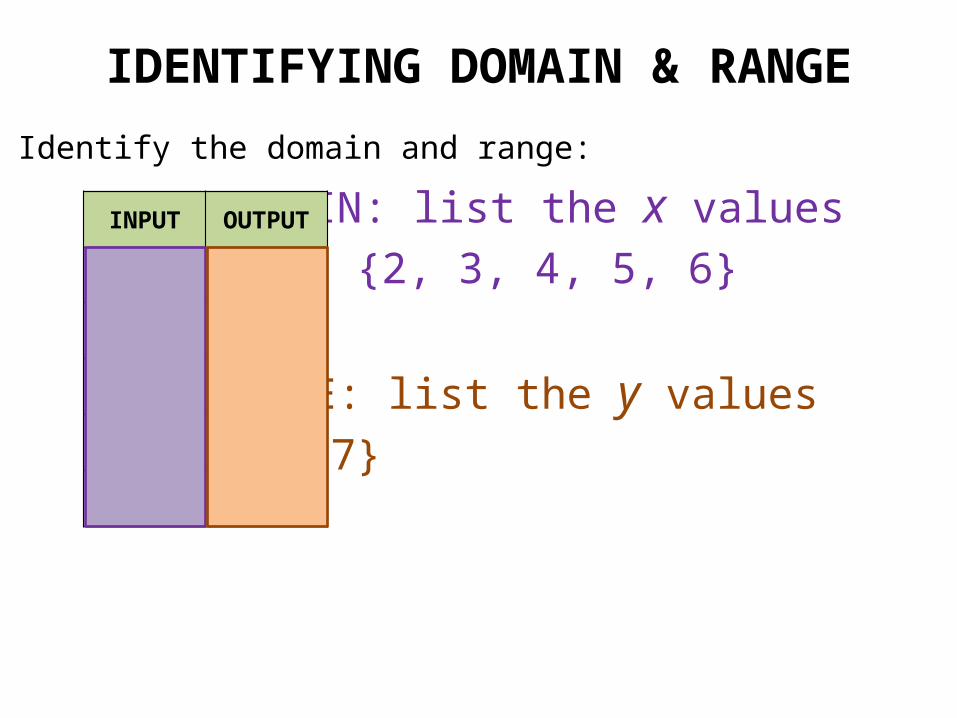
IDENTIFYING DOMAIN & RANGE
Identify the domain and range:
DOMAIN: list the x values
{2, 3, 4, 5, 6}
RANGE: list the y values
{7}
INPUT OUTPUT
2 7
3 7
4 7
5 7
6 7
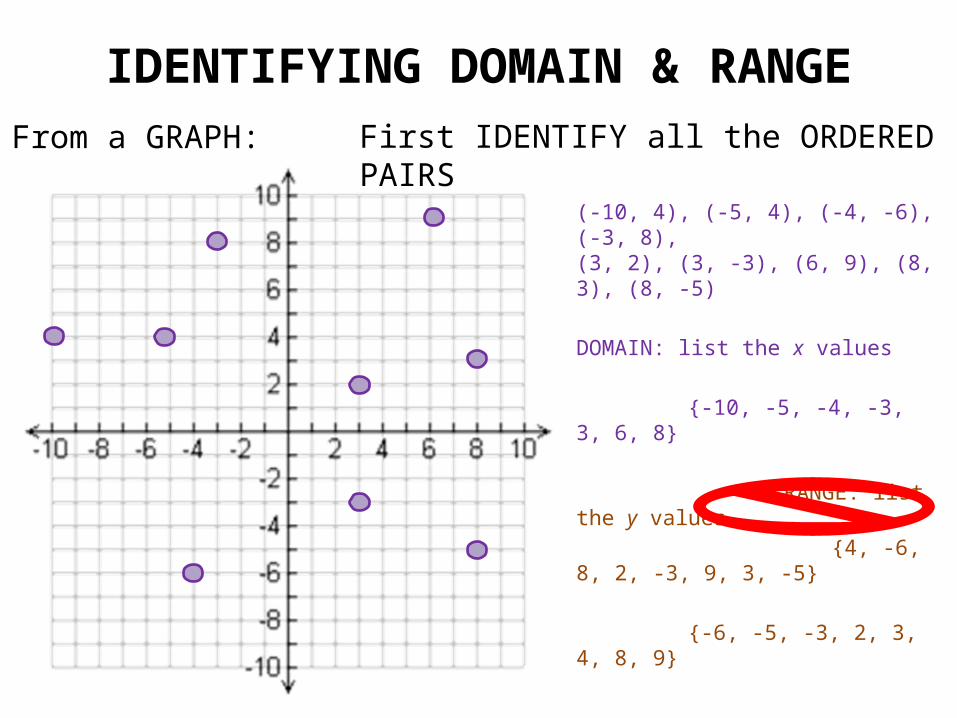
IDENTIFYING DOMAIN & RANGE
(-10, 4), (-5, 4), (-4, -6), (-3, 8),(3, 2), (3, -3), (6, 9), (8, 3), (8, -5)
DOMAIN: list the x values
{-10, -5, -4, -3, 3, 6, 8}
RANGE: list the y values
{4, -6, 8, 2, -3, 9, 3, -5}
{-6, -5, -3, 2, 3, 4, 8, 9}
From a GRAPH: First IDENTIFY all the ORDERED PAIRS
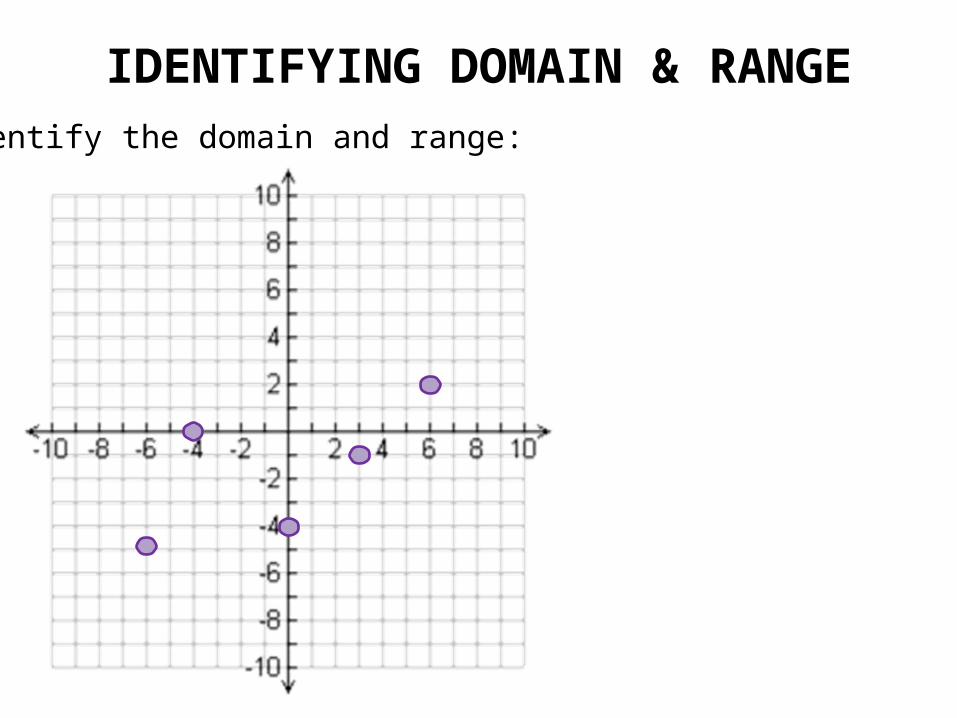
IDENTIFYING DOMAIN & RANGEIdentify the domain and range:
IDENTIFYING DOMAIN & RANGE
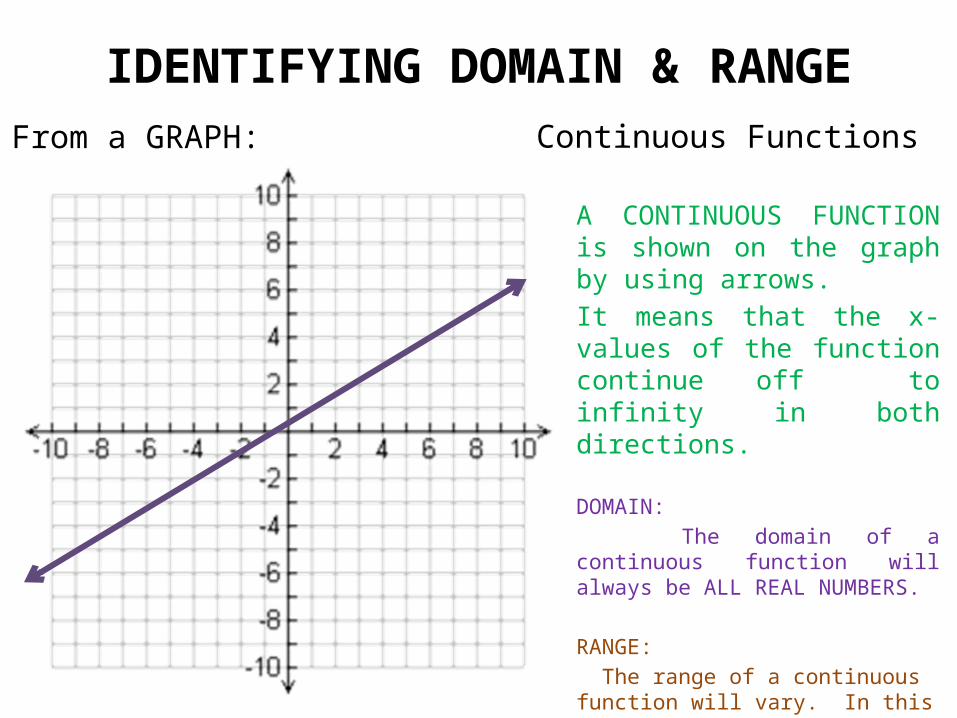
A CONTINUOUS FUNCTION is shown on the graph by using arrows.
It means that the x-values of the function continue off to infinity in both directions.
DOMAIN:
The domain of a continuous function will always be ALL REAL NUMBERS.
RANGE:
The range of a continuous function will vary. In this case the y-values also go off to infinity, so the domain is also ALL REAL NUMBERS.
From a GRAPH: Continuous Functions
IDENTIFYING DOMAIN & RANGE
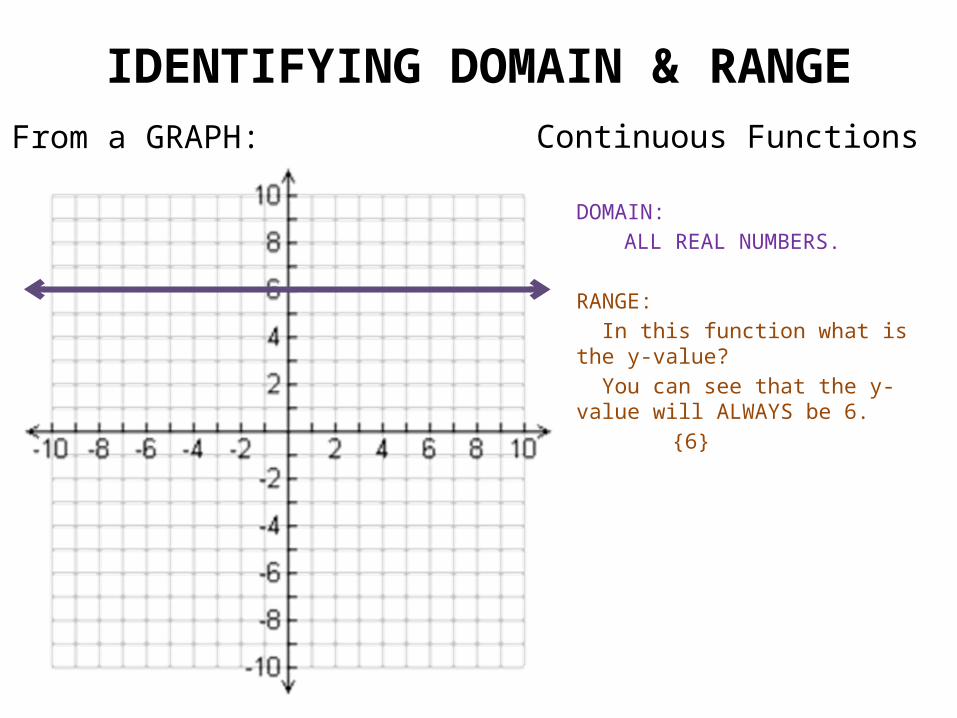
DOMAIN:
ALL REAL NUMBERS.
RANGE:
In this function what is the y-value?
You can see that the y-value will ALWAYS be 6.
{6}
From a GRAPH: Continuous Functions
IDENTIFYING DOMAIN & RANGE
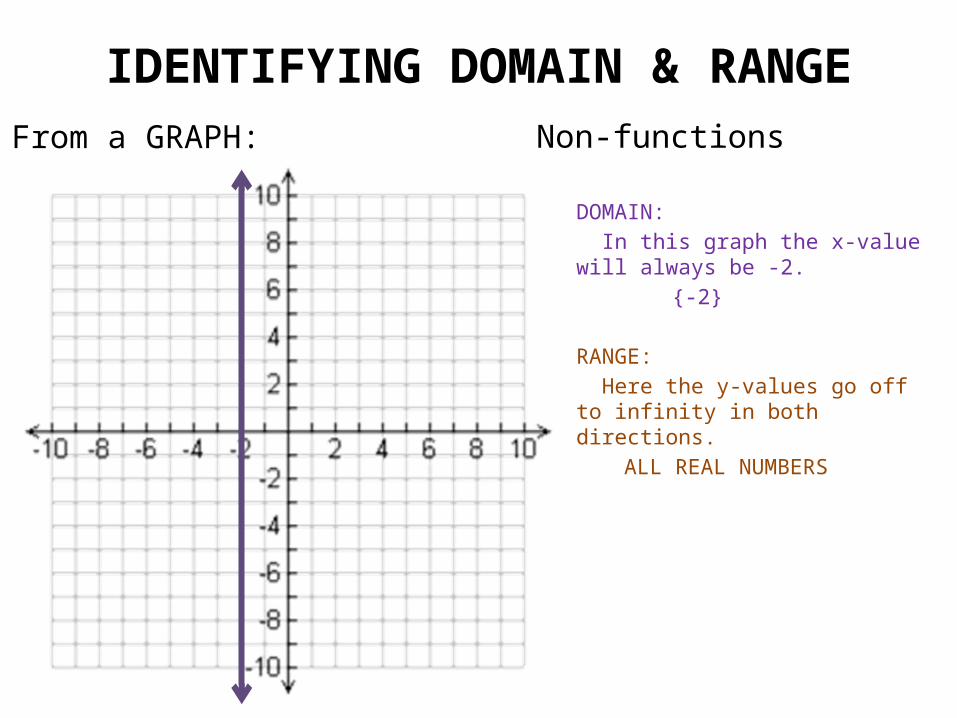
DOMAIN:
In this graph the x-value will always be -2.
{-2}
RANGE:
Here the y-values go off to infinity in both directions.
ALL REAL NUMBERS
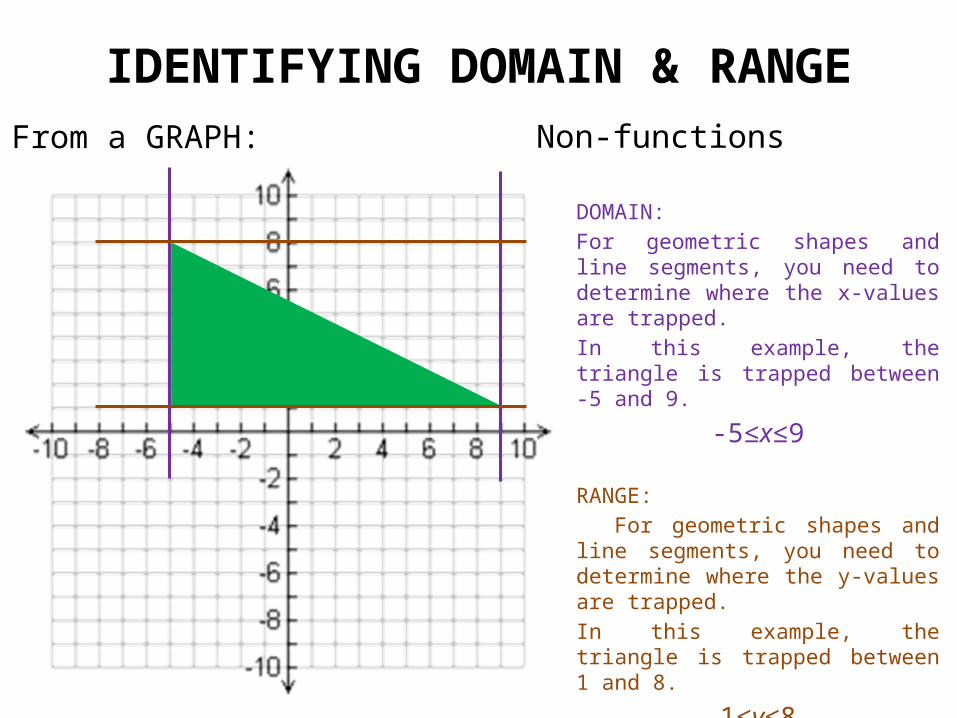
From a GRAPH: Non-functions
IDENTIFYING DOMAIN & RANGE
DOMAIN:
For geometric shapes and line segments, you need to determine where the x-values are trapped.
In this example, the triangle is trapped between -5 and 9.
-5≤x≤9
RANGE:
For geometric shapes and line segments, you need to determine where the y-values are trapped.
In this example, the triangle is trapped between 1 and 8.
1≤y≤8
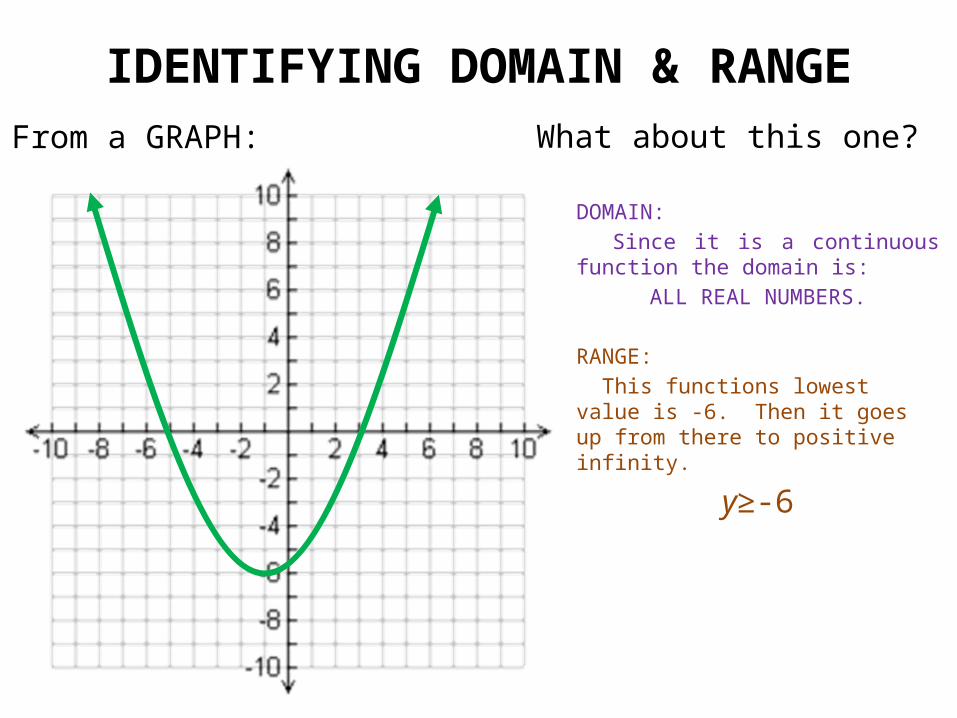
From a GRAPH: Non-functions
IDENTIFYING DOMAIN & RANGE
DOMAIN:
Since it is a continuous function the domain is:
ALL REAL NUMBERS.
RANGE:
This functions lowest value is -6. Then it goes up from there to positive infinity.
y≥-6
From a GRAPH: What about this one?
FUNCTION FORM
FUNCTION FORM means to get y all alone on one side of the equal sign.
stuffy
FUNCTION NOTATION
Function Notation is another name for the letter y.
The same way a person whose name is José, might be known as Pepe, function notation is another name for the same thing.
Function notation looks like this:
We say y equals f of x. This does NOT mean multiply!
)(xfy
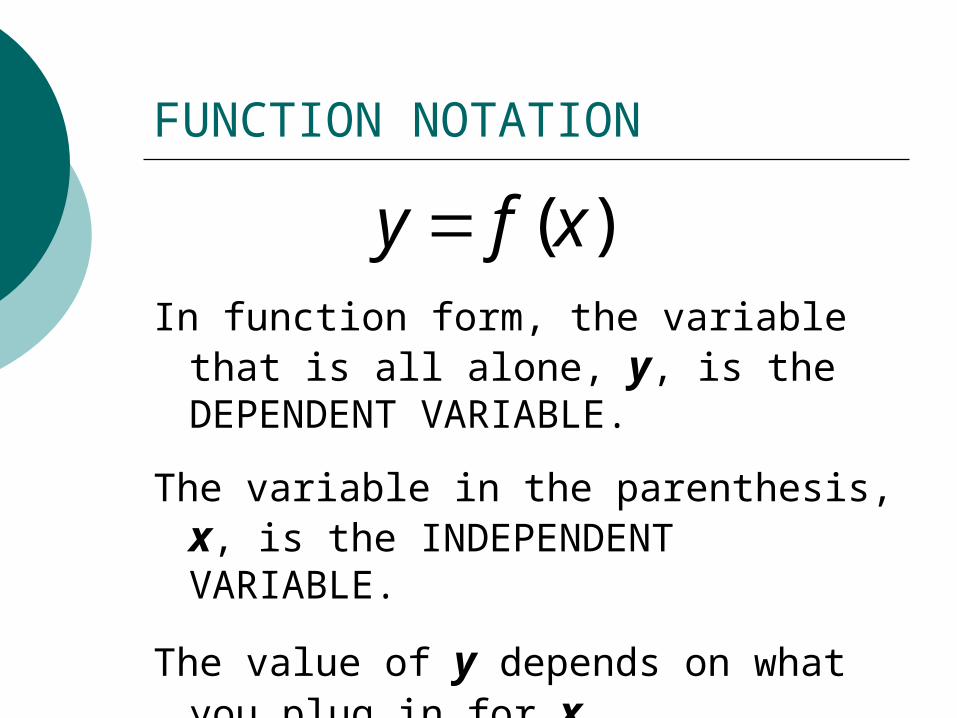
FUNCTION NOTATION
In function form, the variable that is all alone, y, is the DEPENDENT VARIABLE.
The variable in the parenthesis, x, is the INDEPENDENT VARIABLE.
The value of y depends on what you plug in for x.
)(xfy
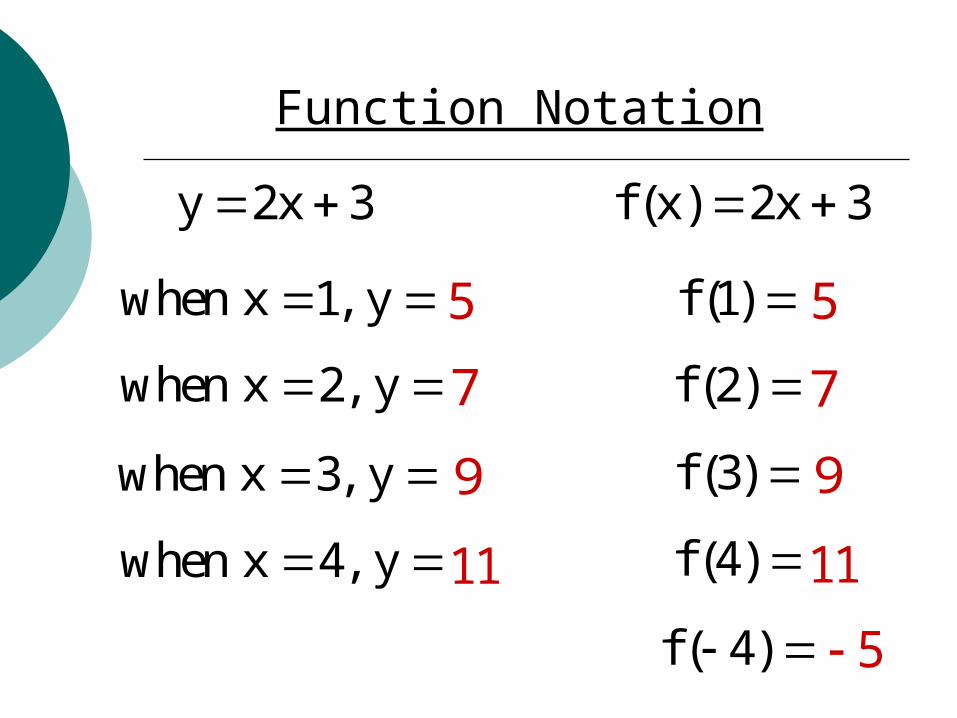
Function Notation
y 2x 3 f (x) 2x 3
when x 1, y 5
when x 2, y 7
when x 3, y 9
when x 4, y 11
f (1) 5
f (2) 7
f (3) 9
f (4) 11
f ( 4) 5
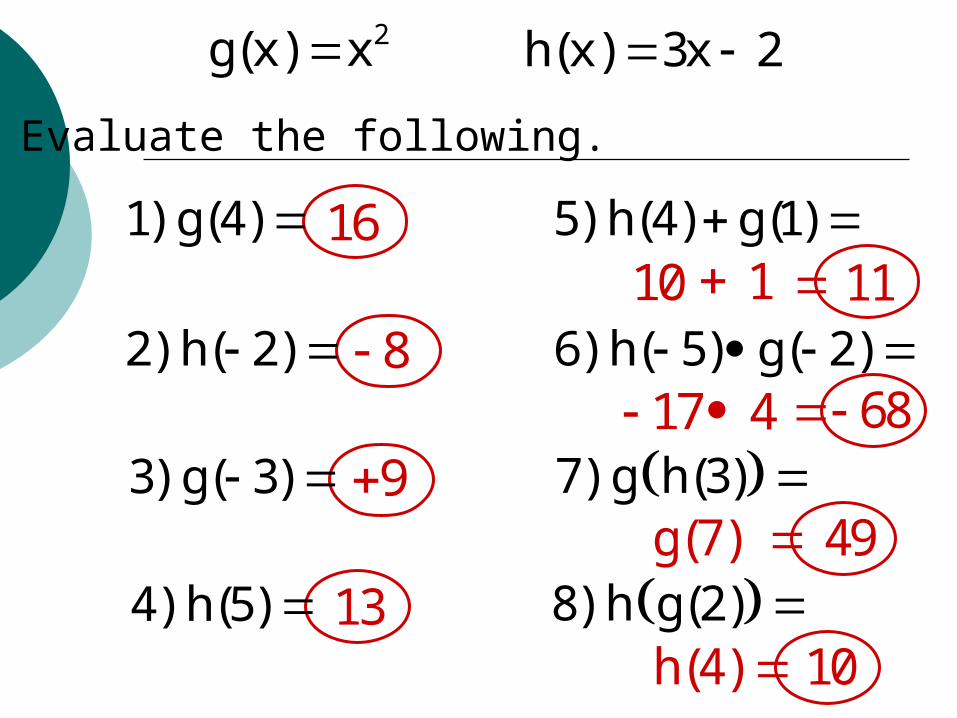
2g(x) x h(x) 3x 2
Evaluate the following.
1) g(4)
2) h( 2)
3) g( 3)
4) h(5)
5) h(4) g(1)
6) h( 5) g( 2)
7) g h(3)
8) h g(2)
16
8
9
13
10 1 11
17 4 68
g(7) 49
h(4) 10
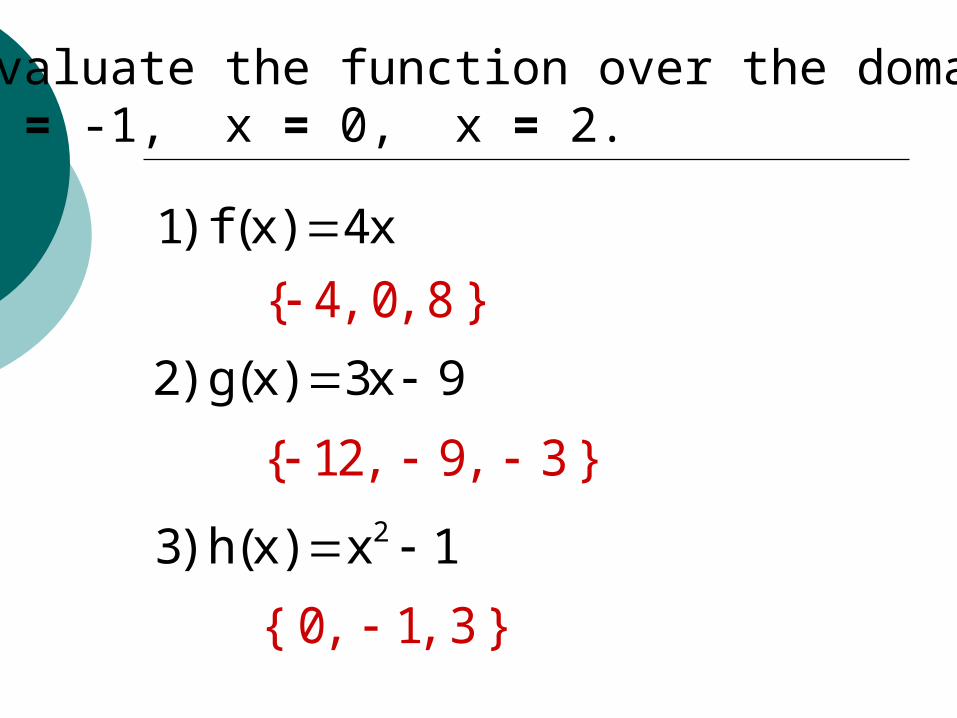
Evaluate the function over the domain,x = -1, x = 0, x = 2.
1) f (x) 4x
2) g(x) 3x 9
23) h(x) x 1
{ 4, 0, 8 }
{ 12, 9, 3 }
{ 0, 1, 3 }